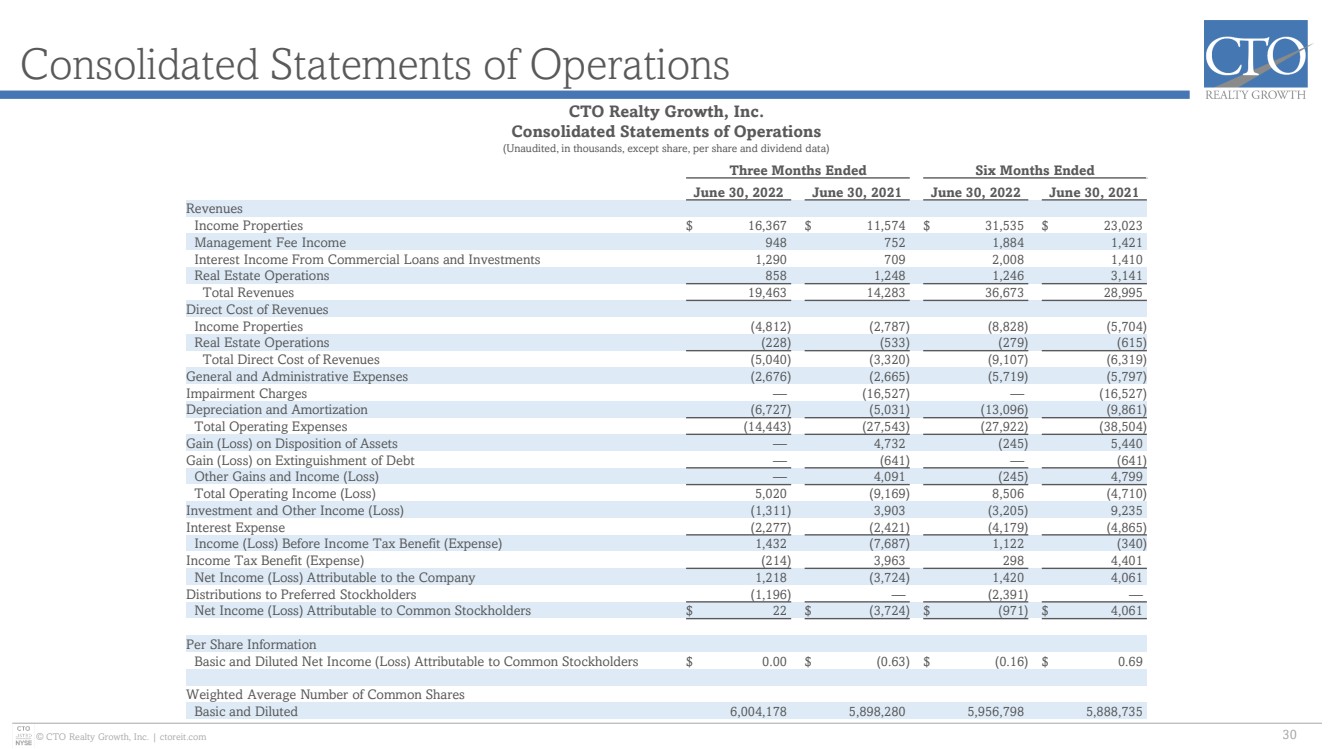
| © CTO Realty Growth, Inc. | ctoreit.com Consolidated Statements of Operations 30 CTO Realty Growth, Inc. Consolidated Statements of Operations (Unaudited, in thousands, except share, per share and dividend data) Three Months Ended Six Months Ended June 30, 2022 June 30, 2021 June 30, 2022 June 30, 2021 Revenues Income Properties $ 16,367 $ 11,574 $ 31,535 $ 23,023 Management Fee Income 948 752 1,884 1,421 Interest Income From Commercial Loans and Investments 1,290 709 2,008 1,410 Real Estate Operations 858 1,248 1,246 3,141 Total Revenues 19,463 14,283 36,673 28,995 Direct Cost of Revenues Income Properties (4,812) (2,787) (8,828) (5,704) Real Estate Operations (228) (533) (279) (615) Total Direct Cost of Revenues (5,040) (3,320) (9,107) (6,319) General and Administrative Expenses (2,676) (2,665) (5,719) (5,797) Impairment Charges — (16,527) — (16,527) Depreciation and Amortization (6,727) (5,031) (13,096) (9,861) Total Operating Expenses (14,443) (27,543) (27,922) (38,504) Gain (Loss) on Disposition of Assets — 4,732 (245) 5,440 Gain (Loss) on Extinguishment of Debt — (641) — (641) Other Gains and Income (Loss) — 4,091 (245) 4,799 Total Operating Income (Loss) 5,020 (9,169) 8,506 (4,710) Investment and Other Income (Loss) (1,311) 3,903 (3,205) 9,235 Interest Expense (2,277) (2,421) (4,179) (4,865) Income (Loss) Before Income Tax Benefit (Expense) 1,432 (7,687) 1,122 (340) Income Tax Benefit (Expense) (214) 3,963 298 4,401 Net Income (Loss) Attributable to the Company 1,218 (3,724) 1,420 4,061 Distributions to Preferred Stockholders (1,196) — (2,391) — Net Income (Loss) Attributable to Common Stockholders $ 22 $ (3,724) $ (971) $ 4,061 Per Share Information Basic and Diluted Net Income (Loss) Attributable to Common Stockholders $ 0.00 $ (0.63) $ (0.16) $ 0.69 Weighted Average Number of Common Shares Basic and Diluted 6,004,178 5,898,280 5,956,798 5,888,735 |