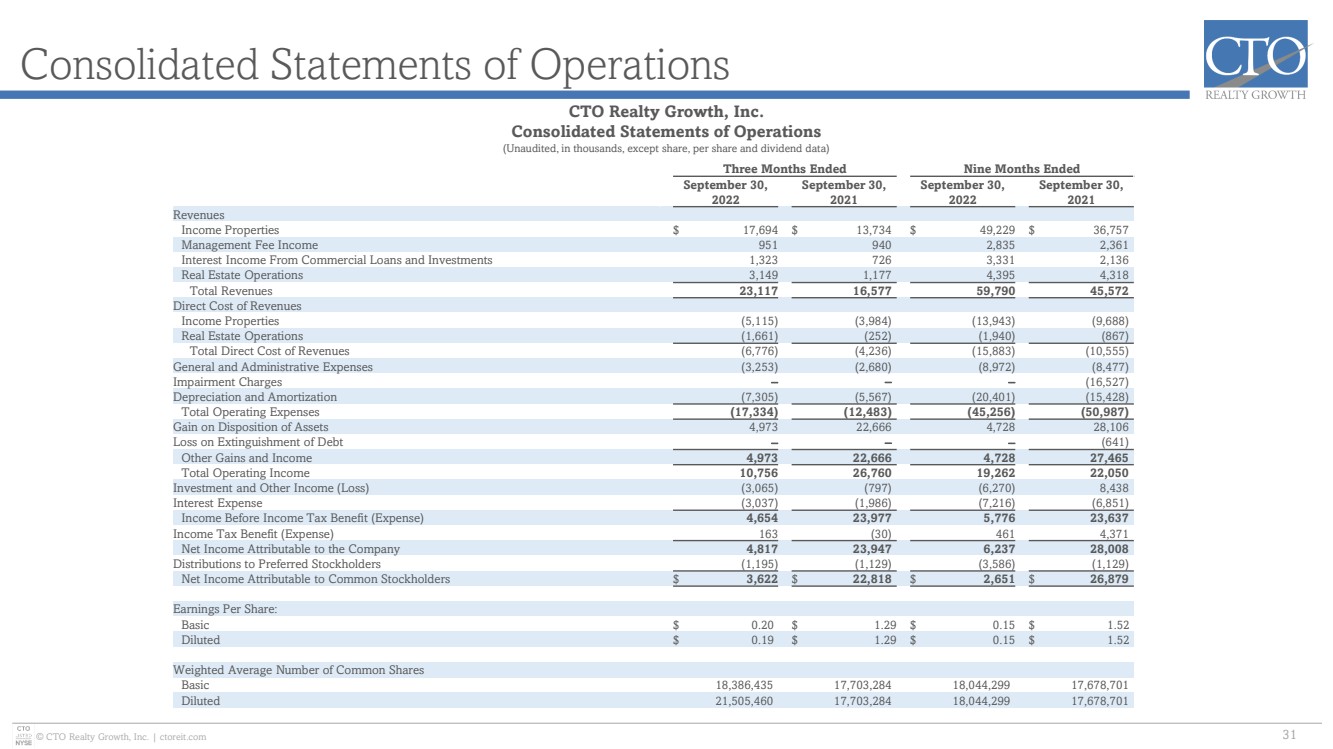
| © CTO Realty Growth, Inc. | ctoreit.com Consolidated Statements of Operations 31 CTO Realty Growth, Inc. Consolidated Statements of Operations (Unaudited, in thousands, except share, per share and dividend data) Three Months Ended Nine Months Ended September 30, 2022 September 30, 2021 September 30, 2022 September 30, 2021 Revenues Income Properties $ 17,694 $ 13,734 $ 49,229 $ 36,757 Management Fee Income 951 940 2,835 2,361 Interest Income From Commercial Loans and Investments 1,323 726 3,331 2,136 Real Estate Operations 3,149 1,177 4,395 4,318 Total Revenues 23,117 16,577 59,790 45,572 Direct Cost of Revenues Income Properties (5,115) (3,984) (13,943) (9,688) Real Estate Operations (1,661) (252) (1,940) (867) Total Direct Cost of Revenues (6,776) (4,236) (15,883) (10,555) General and Administrative Expenses (3,253) (2,680) (8,972) (8,477) Impairment Charges − − − (16,527) Depreciation and Amortization (7,305) (5,567) (20,401) (15,428) Total Operating Expenses (17,334) (12,483) (45,256) (50,987) Gain on Disposition of Assets 4,973 22,666 4,728 28,106 Loss on Extinguishment of Debt − − − (641) Other Gains and Income 4,973 22,666 4,728 27,465 Total Operating Income 10,756 26,760 19,262 22,050 Investment and Other Income (Loss) (3,065) (797) (6,270) 8,438 Interest Expense (3,037) (1,986) (7,216) (6,851) Income Before Income Tax Benefit (Expense) 4,654 23,977 5,776 23,637 Income Tax Benefit (Expense) 163 (30) 461 4,371 Net Income Attributable to the Company 4,817 23,947 6,237 28,008 Distributions to Preferred Stockholders (1,195) (1,129) (3,586) (1,129) Net Income Attributable to Common Stockholders $ 3,622 $ 22,818 $ 2,651 $ 26,879 Earnings Per Share: Basic $ 0.20 $ 1.29 $ 0.15 $ 1.52 Diluted $ 0.19 $ 1.29 $ 0.15 $ 1.52 Weighted Average Number of Common Shares Basic 18,386,435 17,703,284 18,044,299 17,678,701 Diluted 21,505,460 17,703,284 18,044,299 17,678,701 |