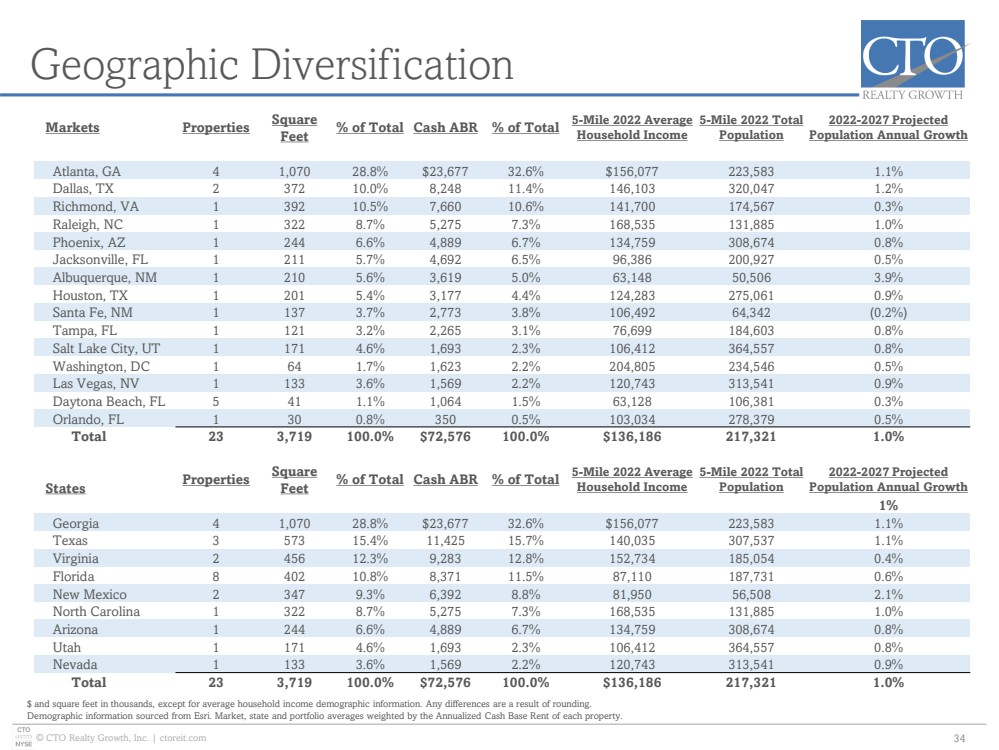
| © CTO Realty Growth, Inc. | ctoreit.com Geographic Diversification 34 Markets Properties Square Feet % of Total Cash ABR % of Total 5-Mile 2022 Average Household Income 5-Mile 2022 Total Population 2022-2027 Projected Population Annual Growth Atlanta, GA 4 1,070 28.8% $23,677 32.6% $156,077 223,583 1.1% Dallas, TX 2 372 10.0% 8,248 11.4% 146,103 320,047 1.2% Richmond, VA 1 392 10.5% 7,660 10.6% 141,700 174,567 0.3% Raleigh, NC 1 322 8.7% 5,275 7.3% 168,535 131,885 1.0% Phoenix, AZ 1 244 6.6% 4,889 6.7% 134,759 308,674 0.8% Jacksonville, FL 1 211 5.7% 4,692 6.5% 96,386 200,927 0.5% Albuquerque, NM 1 210 5.6% 3,619 5.0% 63,148 50,506 3.9% Houston, TX 1 201 5.4% 3,177 4.4% 124,283 275,061 0.9% Santa Fe, NM 1 137 3.7% 2,773 3.8% 106,492 64,342 (0.2%) Tampa, FL 1 121 3.2% 2,265 3.1% 76,699 184,603 0.8% Salt Lake City, UT 1 171 4.6% 1,693 2.3% 106,412 364,557 0.8% Washington, DC 1 64 1.7% 1,623 2.2% 204,805 234,546 0.5% Las Vegas, NV 1 133 3.6% 1,569 2.2% 120,743 313,541 0.9% Daytona Beach, FL 5 41 1.1% 1,064 1.5% 63,128 106,381 0.3% Orlando, FL 1 30 0.8% 350 0.5% 103,034 278,379 0.5% Total 23 3,719 100.0% $72,576 100.0% $136,186 217,321 1.0% States Properties Square Feet % of Total Cash ABR % of Total 5-Mile 2022 Average Household Income 5-Mile 2022 Total Population 2022-2027 Projected Population Annual Growth 1% Georgia 4 1,070 28.8% $23,677 32.6% $156,077 223,583 1.1% Texas 3 573 15.4% 11,425 15.7% 140,035 307,537 1.1% Virginia 2 456 12.3% 9,283 12.8% 152,734 185,054 0.4% Florida 8 402 10.8% 8,371 11.5% 87,110 187,731 0.6% New Mexico 2 347 9.3% 6,392 8.8% 81,950 56,508 2.1% North Carolina 1 322 8.7% 5,275 7.3% 168,535 131,885 1.0% Arizona 1 244 6.6% 4,889 6.7% 134,759 308,674 0.8% Utah 1 171 4.6% 1,693 2.3% 106,412 364,557 0.8% Nevada 1 133 3.6% 1,569 2.2% 120,743 313,541 0.9% Total 23 3,719 100.0% $72,576 100.0% $136,186 217,321 1.0% $ and square feet in thousands, except for average household income demographic information. Any differences are a result of rounding. Demographic information sourced from Esri. Market, state and portfolio averages weighted by the Annualized Cash Base Rent of each property. |