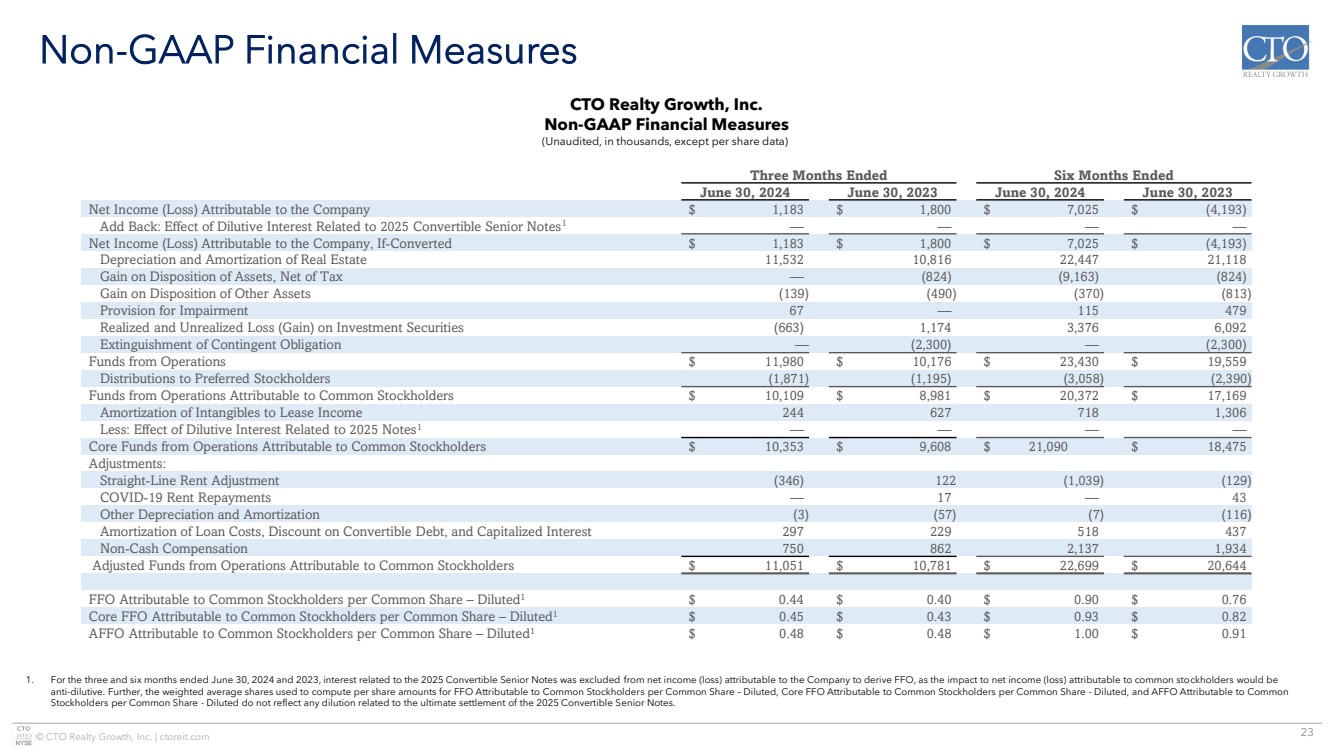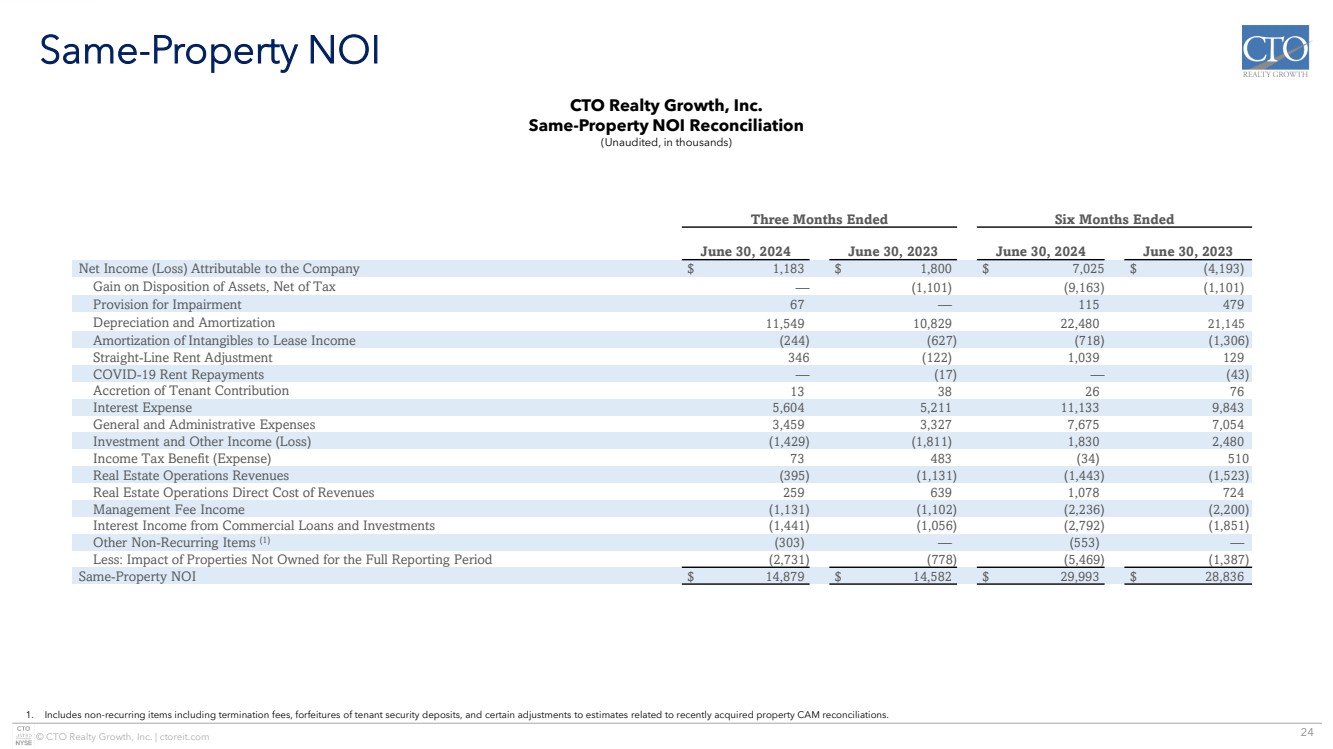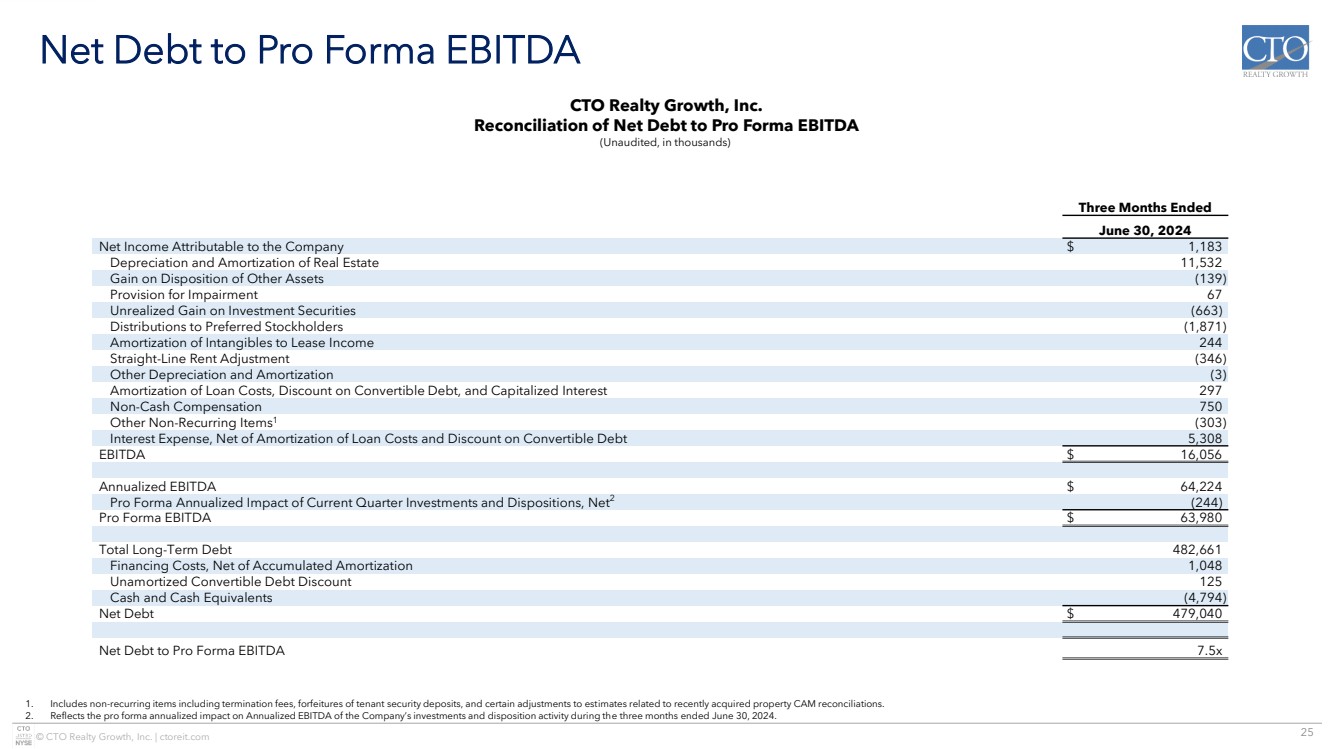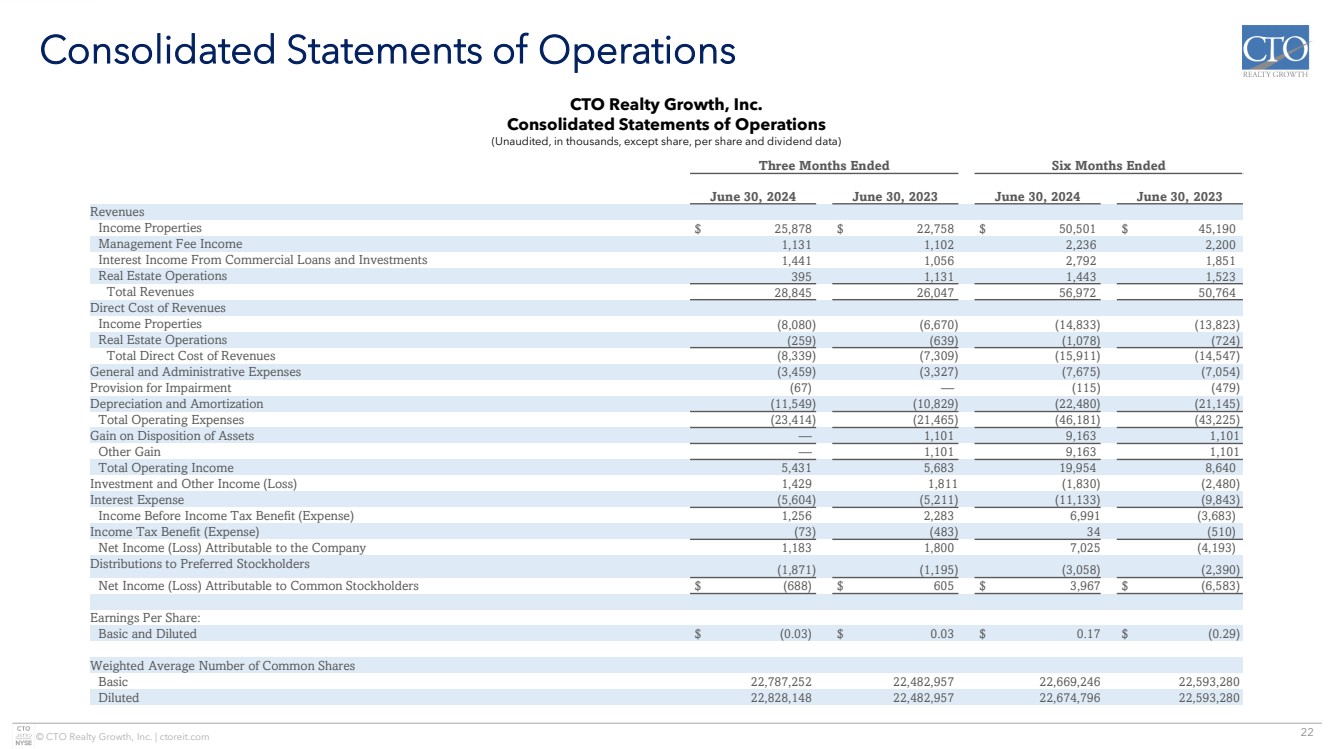
| 22 © CTO Realty Growth, Inc. | ctoreit.com Consolidated Statements of Operations CTO Realty Growth, Inc. Consolidated Statements of Operations (Unaudited, in thousands, except share, per share and dividend data) Three Months Ended Six Months Ended June 30, 2024 June 30, 2023 June 30, 2024 June 30, 2023 Revenues Income Properties $ 25,878 $ 22,758 $ 50,501 $ 45,190 Management Fee Income 1,131 1,102 2,236 2,200 Interest Income From Commercial Loans and Investments 1,441 1,056 2,792 1,851 Real Estate Operations 395 1,131 1,443 1,523 Total Revenues 28,845 26,047 56,972 50,764 Direct Cost of Revenues Income Properties (8,080) (6,670) (14,833) (13,823) Real Estate Operations (259) (639) (1,078) (724) Total Direct Cost of Revenues (8,339) (7,309) (15,911) (14,547) General and Administrative Expenses (3,459) (3,327) (7,675) (7,054) Provision for Impairment (67) — (115) (479) Depreciation and Amortization (11,549) (10,829) (22,480) (21,145) Total Operating Expenses (23,414) (21,465) (46,181) (43,225) Gain on Disposition of Assets — 1,101 9,163 1,101 Other Gain — 1,101 9,163 1,101 Total Operating Income 5,431 5,683 19,954 8,640 Investment and Other Income (Loss) 1,429 1,811 (1,830) (2,480) Interest Expense (5,604) (5,211) (11,133) (9,843) Income Before Income Tax Benefit (Expense) 1,256 2,283 6,991 (3,683) Income Tax Benefit (Expense) (73) (483) 34 (510) Net Income (Loss) Attributable to the Company 1,183 1,800 7,025 (4,193) Distributions to Preferred Stockholders (1,871) (1,195) (3,058) (2,390) Net Income (Loss) Attributable to Common Stockholders $ (688) $ 605 $ 3,967 $ (6,583) Earnings Per Share: Basic and Diluted $ (0.03) $ 0.03 $ 0.17 $ (0.29) Weighted Average Number of Common Shares Basic 22,787,252 22,482,957 22,669,246 22,593,280 Diluted 22,828,148 22,482,957 22,674,796 22,593,280 |