Exhibit 99.3
| © CTO Realty Growth, Inc. | ctoreit.com Collection at Forsyth Atlanta, GA Supplemental Reporting Information Q4 2024 |

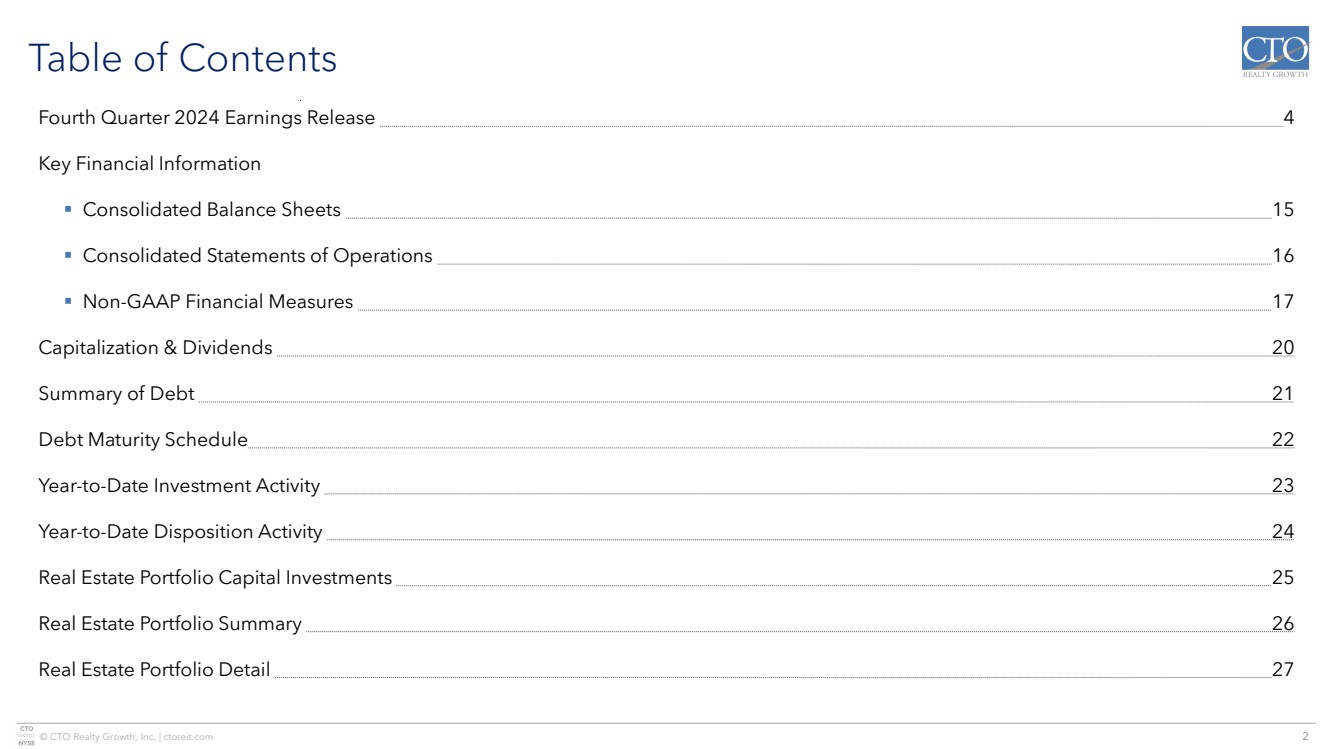
| © CTO Realty Growth, Inc. | ctoreit.com 2 Table of Contents Fourth Quarter 2024 Earnings Release 4 Key Financial Information ▪ Consolidated Balance Sheets 15 ▪ Consolidated Statements of Operations 16 ▪ Non-GAAP Financial Measures 17 Capitalization & Dividends 20 Summary of Debt 21 Debt Maturity Schedule 22 Year -to -Date Investment Activity 23 Year -to -Date Disposition Activity 24 Real Estate Portfolio Capital Investments 25 Real Estate Portfolio Summary 26 Real Estate Portfolio Detail 27 |
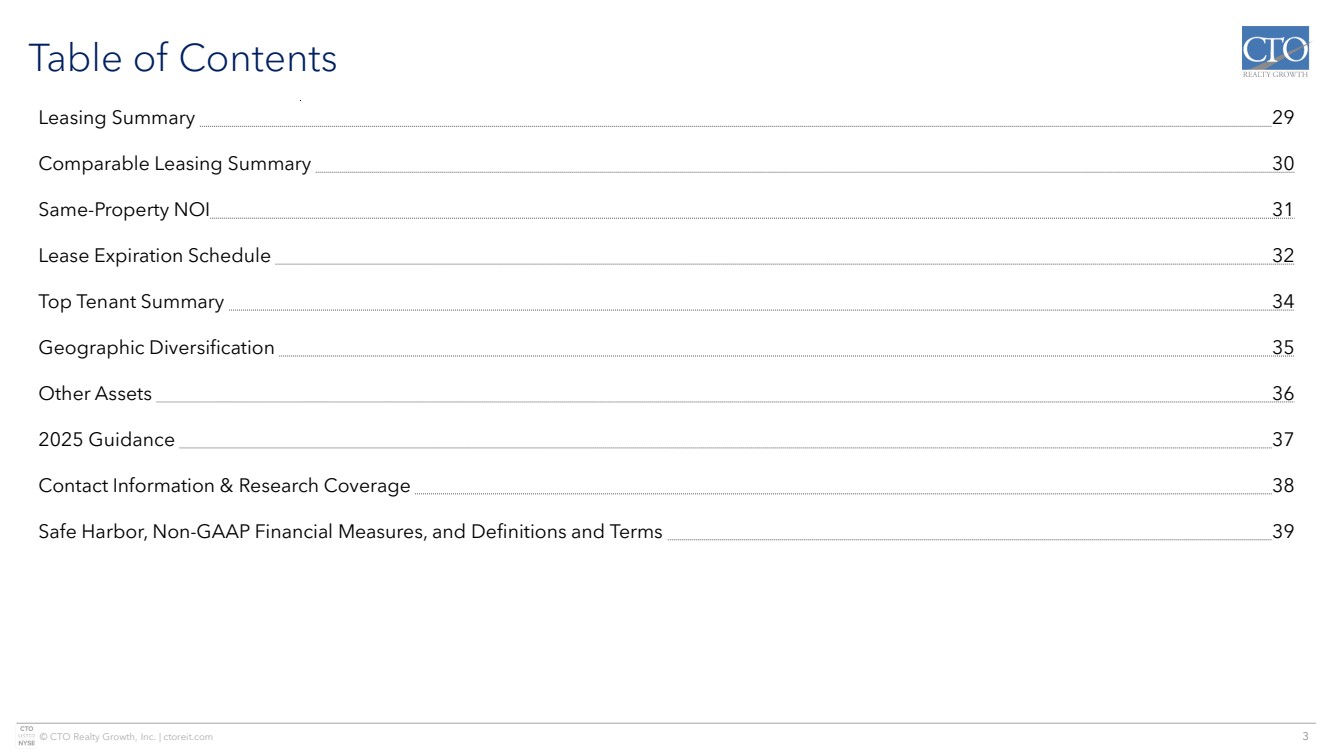
| © CTO Realty Growth, Inc. | ctoreit.com 3 Table of Contents Leasing Summary 29 Comparable Leasing Summary 30 Same-Property NOI 31 Lease Expiration Schedule 32 Top Tenant Summary 34 Geographic Diversification 35 Other Assets 36 2025 Guidance 37 Contact Information & Research Coverage 38 Safe Harbor, Non-GAAP Financial Measures, and Definitions and Terms 39 |
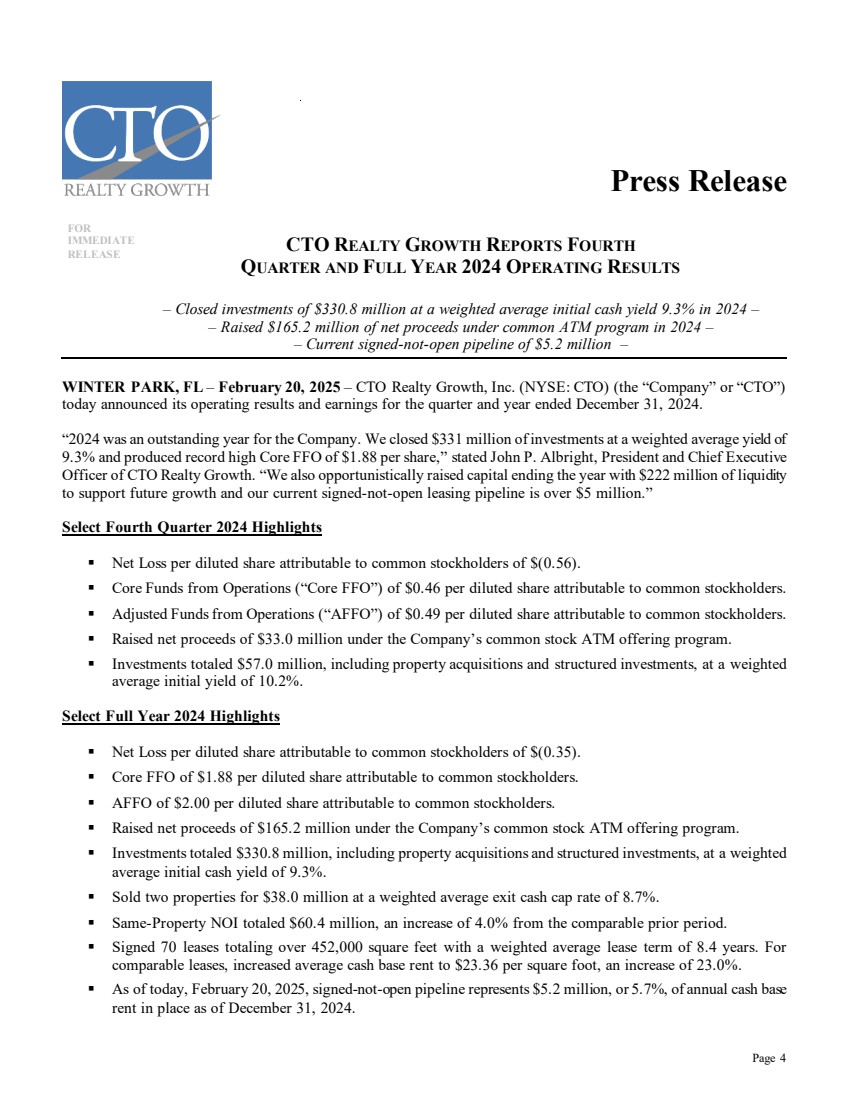
| Page 4 Press Release FOR IMMEDIATE RELEASE CTO REALTY GROWTH REPORTS FOURTH QUARTER AND FULL YEAR 2024 OPERATING RESULTS – Closed investments of $330.8 million at a weighted average initial cash yield 9.3% in 2024 – – Raised $165.2 million of net proceeds under common ATM program in 2024 – – Current signed-not-open pipeline of $5.2 million – WINTER PARK, FL – February 20, 2025 – CTO Realty Growth, Inc. (NYSE: CTO) (the “Company” or “CTO”) today announced its operating results and earnings for the quarter and year ended December 31, 2024. “2024 was an outstanding year for the Company. We closed $331 million of investments at a weighted average yield of 9.3% and produced record high Core FFO of $1.88 per share,” stated John P. Albright, President and Chief Executive Officer of CTO Realty Growth. “We also opportunistically raised capital ending the year with $222 million of liquidity to support future growth and our current signed-not-open leasing pipeline is over $5 million.” Select Fourth Quarter 2024 Highlights Net Loss per diluted share attributable to common stockholders of $(0.56). Core Funds from Operations (“Core FFO”) of $0.46 per diluted share attributable to common stockholders. Adjusted Funds from Operations (“AFFO”) of $0.49 per diluted share attributable to common stockholders. Raised net proceeds of $33.0 million under the Company’s common stock ATM offering program. Investments totaled $57.0 million, including property acquisitions and structured investments, at a weighted average initial yield of 10.2%. Select Full Year 2024 Highlights Net Loss per diluted share attributable to common stockholders of $(0.35). Core FFO of $1.88 per diluted share attributable to common stockholders. AFFO of $2.00 per diluted share attributable to common stockholders. Raised net proceeds of $165.2 million under the Company’s common stock ATM offering program. Investments totaled $330.8 million, including property acquisitions and structured investments, at a weighted average initial cash yield of 9.3%. Sold two properties for $38.0 million at a weighted average exit cash cap rate of 8.7%. Same-Property NOI totaled $60.4 million, an increase of 4.0% from the comparable prior period. Signed 70 leases totaling over 452,000 square feet with a weighted average lease term of 8.4 years. For comparable leases, increased average cash base rent to $23.36 per square foot, an increase of 23.0%. As of today, February 20, 2025, signed-not-open pipeline represents $5.2 million, or 5.7%, of annual cash base rent in place as of December 31, 2024. |
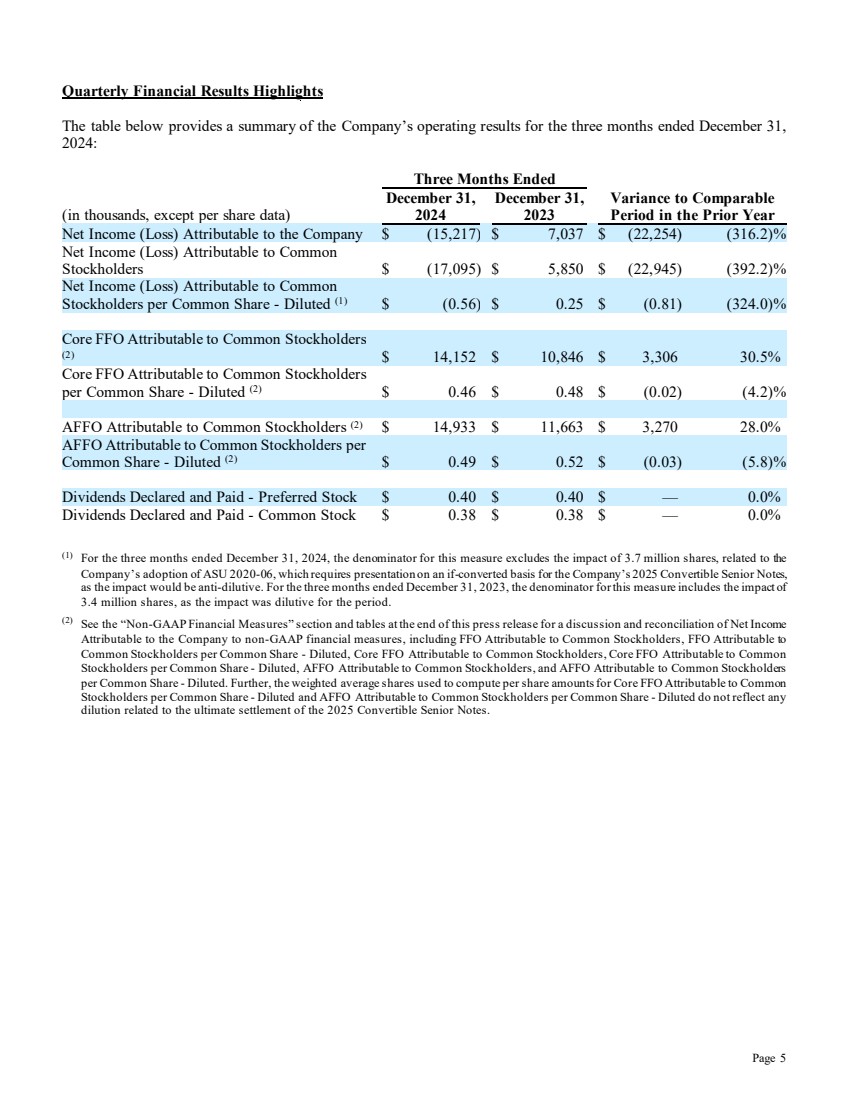
| Page 5 Quarterly Financial Results Highlights The table below provides a summary of the Company’s operating results for the three months ended December 31, 2024: Three Months Ended (in thousands, except per share data) December 31, 2024 December 31, 2023 Variance to Comparable Period in the Prior Year Net Income (Loss) Attributable to the Company $ (15,217) $ 7,037 $ (22,254) (316.2)% Net Income (Loss) Attributable to Common Stockholders $ (17,095) $ 5,850 $ (22,945) (392.2)% Net Income (Loss) Attributable to Common Stockholders per Common Share - Diluted (1) $ (0.56) $ 0.25 $ (0.81) (324.0)% Core FFO Attributable to Common Stockholders (2) $ 14,152 $ 10,846 $ 3,306 30.5% Core FFO Attributable to Common Stockholders per Common Share - Diluted (2) $ 0.46 $ 0.48 $ (0.02) (4.2)% AFFO Attributable to Common Stockholders (2) $ 14,933 $ 11,663 $ 3,270 28.0% AFFO Attributable to Common Stockholders per Common Share - Diluted (2) $ 0.49 $ 0.52 $ (0.03) (5.8)% Dividends Declared and Paid - Preferred Stock $ 0.40 $ 0.40 $ — 0.0% Dividends Declared and Paid - Common Stock $ 0.38 $ 0.38 $ — 0.0% (1) For the three months ended December 31, 2024, the denominator for this measure excludes the impact of 3.7 million shares, related to the Company’s adoption of ASU 2020-06, which requires presentation on an if-converted basis for the Company’s 2025 Convertible Senior Notes, as the impact would be anti-dilutive. For the three months ended December 31, 2023, the denominator for this measure includes the impact of 3.4 million shares, as the impact was dilutive for the period. (2) See the “Non-GAAP Financial Measures” section and tables at the end of this press release for a discussion and reconciliation of Net Income Attributable to the Company to non-GAAP financial measures, including FFO Attributable to Common Stockholders, FFO Attributable to Common Stockholders per Common Share - Diluted, Core FFO Attributable to Common Stockholders, Core FFO Attributable to Common Stockholders per Common Share - Diluted, AFFO Attributable to Common Stockholders, and AFFO Attributable to Common Stockholders per Common Share - Diluted. Further, the weighted average shares used to compute per share amounts for Core FFO Attributable to Common Stockholders per Common Share - Diluted and AFFO Attributable to Common Stockholders per Common Share - Diluted do not reflect any dilution related to the ultimate settlement of the 2025 Convertible Senior Notes. |
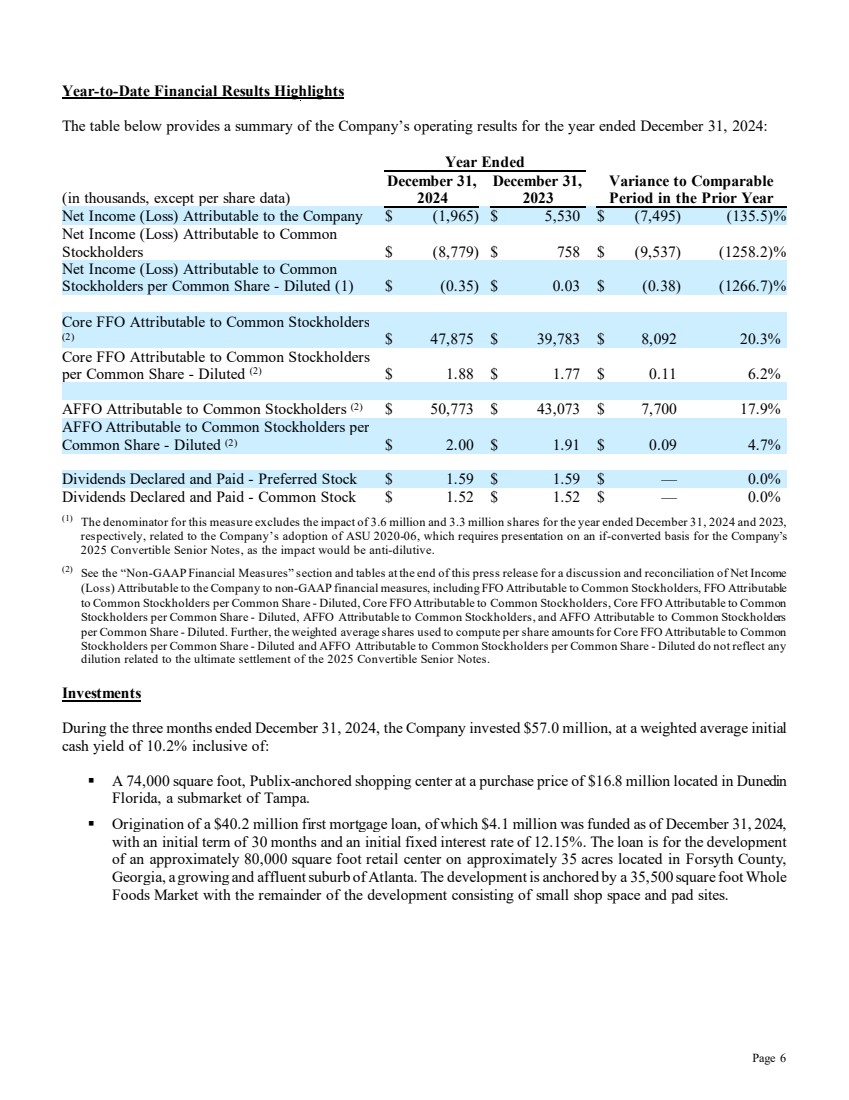
| Page 6 Year-to-Date Financial Results Highlights The table below provides a summary of the Company’s operating results for the year ended December 31, 2024: Year Ended (in thousands, except per share data) December 31, 2024 December 31, 2023 Variance to Comparable Period in the Prior Year Net Income (Loss) Attributable to the Company $ (1,965) $ 5,530 $ (7,495) (135.5)% Net Income (Loss) Attributable to Common Stockholders $ (8,779) $ 758 $ (9,537) (1258.2)% Net Income (Loss) Attributable to Common Stockholders per Common Share - Diluted (1) $ (0.35) $ 0.03 $ (0.38) (1266.7)% Core FFO Attributable to Common Stockholders (2) $ 47,875 $ 39,783 $ 8,092 20.3% Core FFO Attributable to Common Stockholders per Common Share - Diluted (2) $ 1.88 $ 1.77 $ 0.11 6.2% AFFO Attributable to Common Stockholders (2) $ 50,773 $ 43,073 $ 7,700 17.9% AFFO Attributable to Common Stockholders per Common Share - Diluted (2) $ 2.00 $ 1.91 $ 0.09 4.7% Dividends Declared and Paid - Preferred Stock $ 1.59 $ 1.59 $ — 0.0% Dividends Declared and Paid - Common Stock $ 1.52 $ 1.52 $ — 0.0% (1) The denominator for this measure excludes the impact of 3.6 million and 3.3 million shares for the year ended December 31, 2024 and 2023, respectively, related to the Company’s adoption of ASU 2020-06, which requires presentation on an if-converted basis for the Company’s 2025 Convertible Senior Notes, as the impact would be anti-dilutive. (2) See the “Non-GAAP Financial Measures” section and tables at the end of this press release for a discussion and reconciliation of Net Income (Loss) Attributable to the Company to non-GAAP financial measures, including FFO Attributable to Common Stockholders, FFO Attributable to Common Stockholders per Common Share - Diluted, Core FFO Attributable to Common Stockholders, Core FFO Attributable to Common Stockholders per Common Share - Diluted, AFFO Attributable to Common Stockholders, and AFFO Attributable to Common Stockholders per Common Share - Diluted. Further, the weighted average shares used to compute per share amounts for Core FFO Attributable to Common Stockholders per Common Share - Diluted and AFFO Attributable to Common Stockholders per Common Share - Diluted do not reflect any dilution related to the ultimate settlement of the 2025 Convertible Senior Notes. Investments During the three months ended December 31, 2024, the Company invested $57.0 million, at a weighted average initial cash yield of 10.2% inclusive of: A 74,000 square foot, Publix-anchored shopping center at a purchase price of $16.8 million located in Dunedin Florida, a submarket of Tampa. Origination of a $40.2 million first mortgage loan, of which $4.1 million was funded as of December 31, 2024, with an initial term of 30 months and an initial fixed interest rate of 12.15%. The loan is for the development of an approximately 80,000 square foot retail center on approximately 35 acres located in Forsyth County, Georgia, a growing and affluent suburb of Atlanta. The development is anchored by a 35,500 square foot Whole Foods Market with the remainder of the development consisting of small shop space and pad sites. |
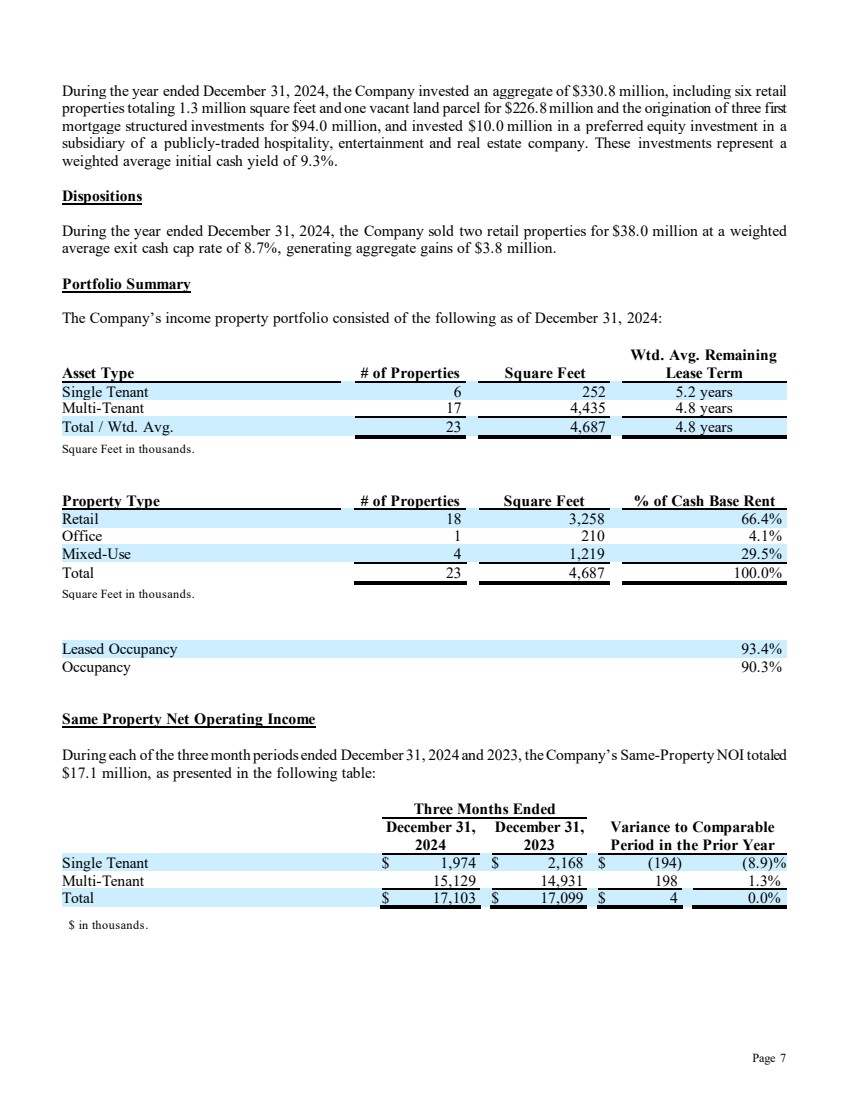
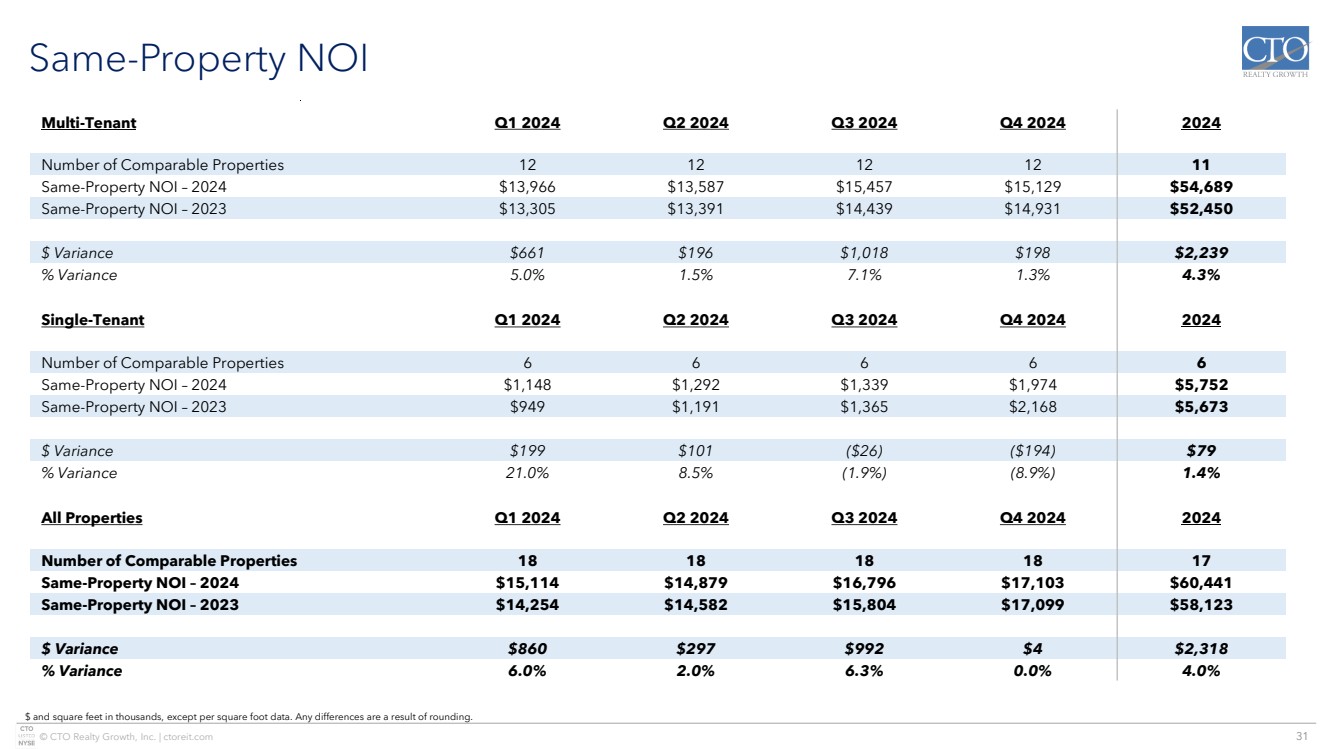
| Page 7 During the year ended December 31, 2024, the Company invested an aggregate of $330.8 million, including six retail properties totaling 1.3 million square feet and one vacant land parcel for $226.8 million and the origination of three first mortgage structured investments for $94.0 million, and invested $10.0 million in a preferred equity investment in a subsidiary of a publicly-traded hospitality, entertainment and real estate company. These investments represent a weighted average initial cash yield of 9.3%. Dispositions During the year ended December 31, 2024, the Company sold two retail properties for $38.0 million at a weighted average exit cash cap rate of 8.7%, generating aggregate gains of $3.8 million. Portfolio Summary The Company’s income property portfolio consisted of the following as of December 31, 2024: Wtd. Avg. Remaining Asset Type # of Properties Square Feet Lease Term Single Tenant 6 252 5.2 years Multi-Tenant 17 4,435 4.8 years Total / Wtd. Avg. 23 4,687 4.8 years Square Feet in thousands. Property Type # of Properties Square Feet % of Cash Base Rent Retail 18 3,258 66.4% Office 1 210 4.1% Mixed-Use 4 1,219 29.5% Total 23 4,687 100.0% Square Feet in thousands. Leased Occupancy 93.4% Occupancy 90.3% Same Property Net Operating Income During each of the three month periods ended December 31, 2024 and 2023, the Company’s Same-Property NOI totaled $17.1 million, as presented in the following table: Three Months Ended December 31, 2024 December 31, 2023 Variance to Comparable Period in the Prior Year Single Tenant $ 1,974 $ 2,168 $ (194) (8.9)% Multi-Tenant 15,129 14,931 198 1.3% Total $ 17,103 $ 17,099 $ 4 0.0% $ in thousands. |
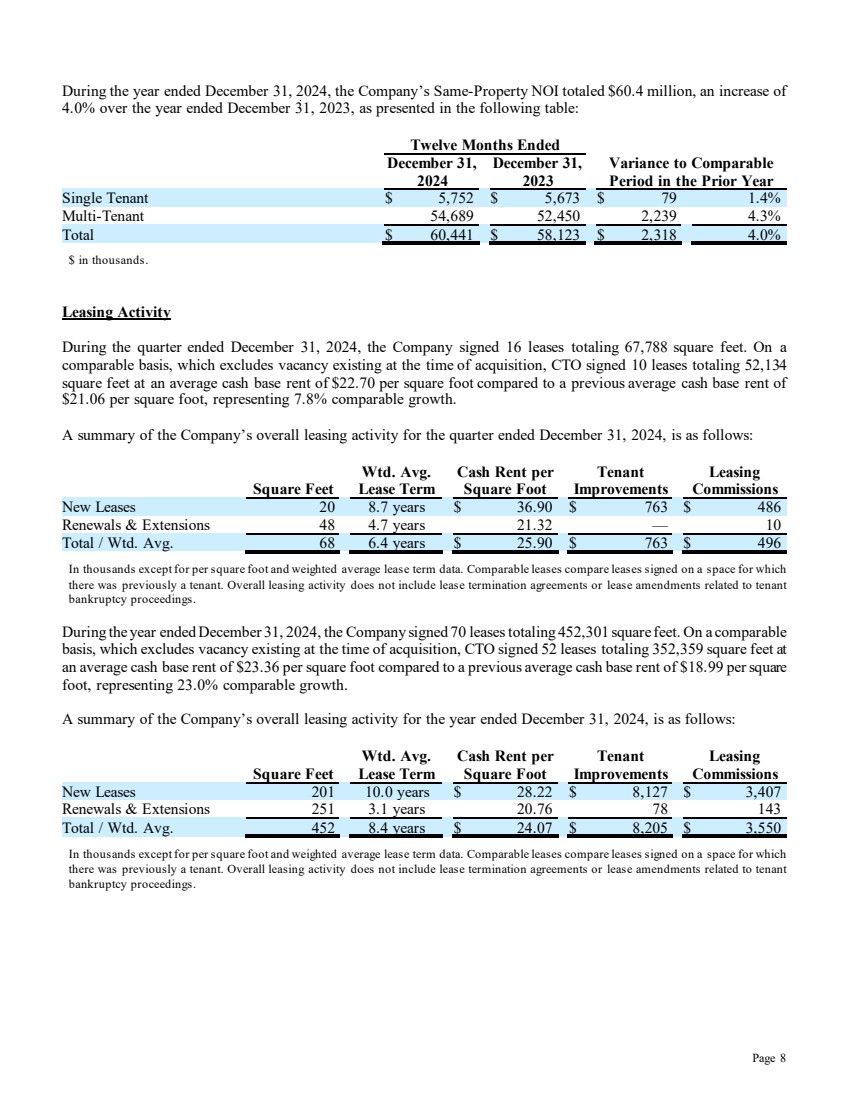
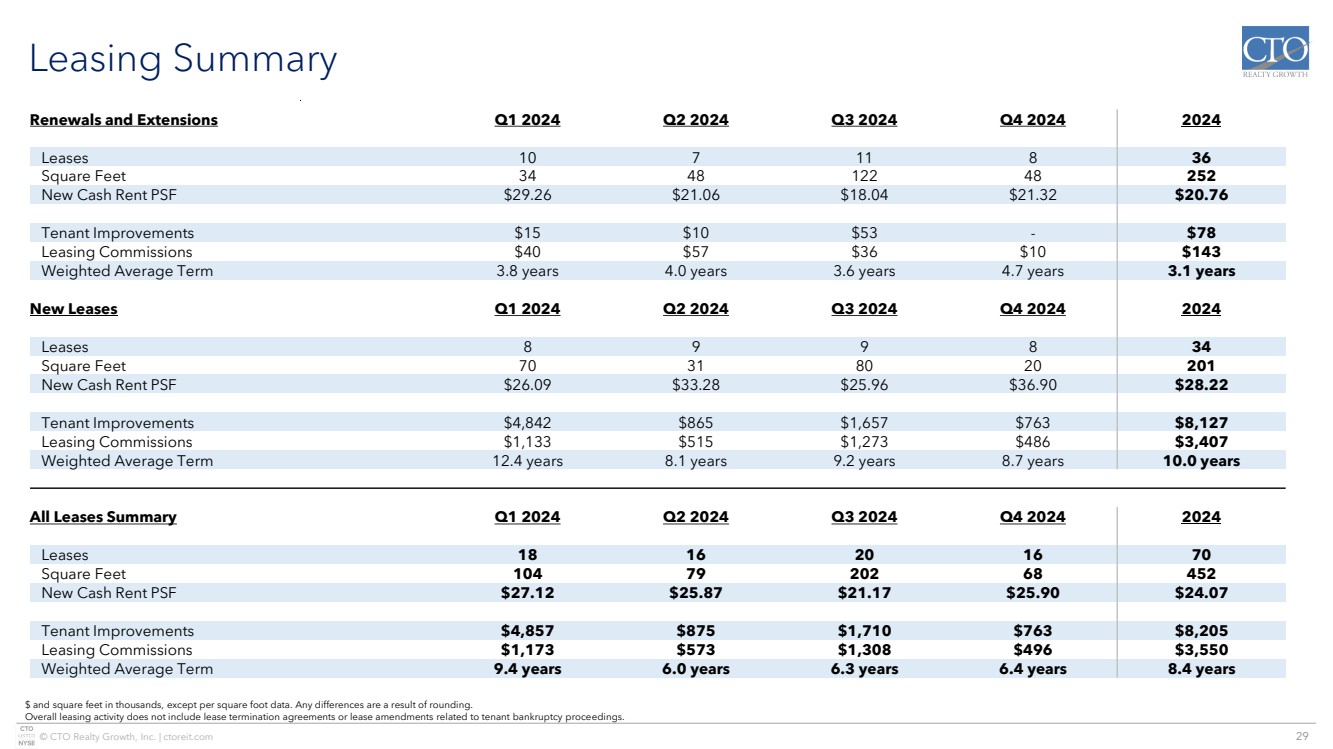
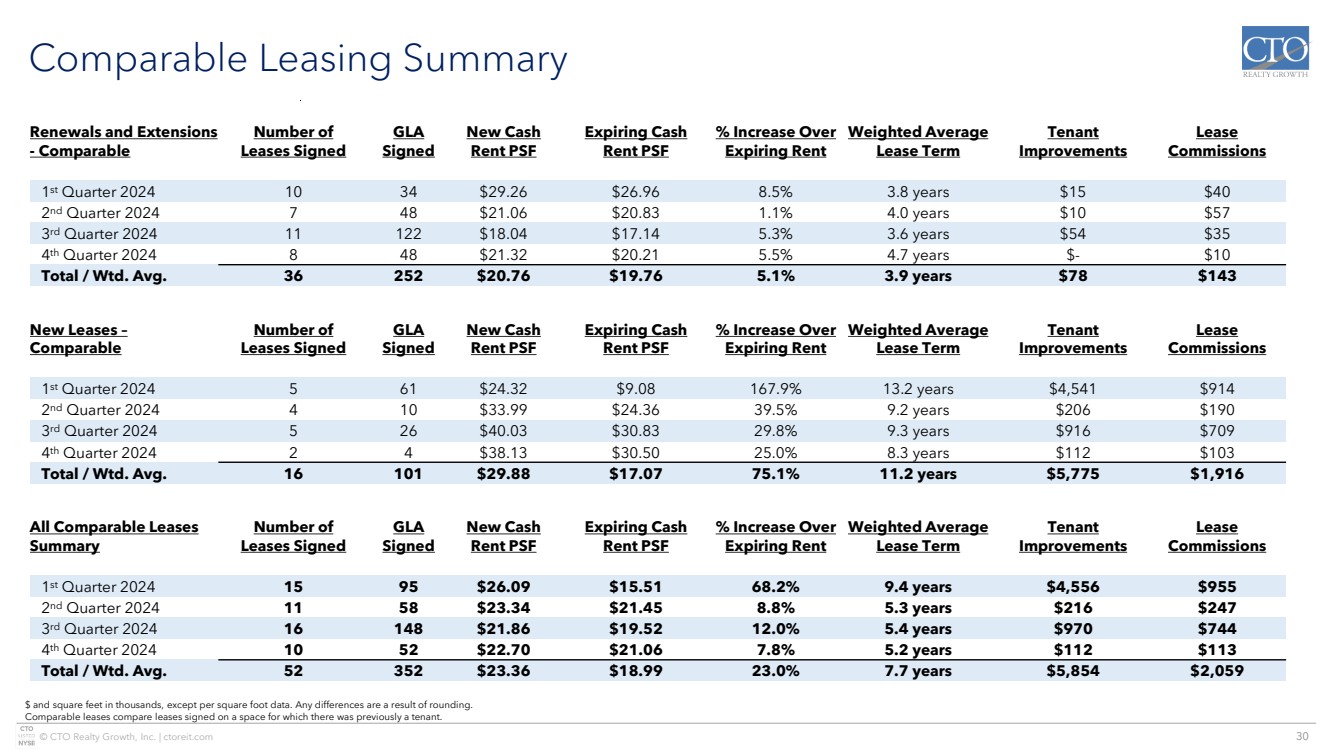
| Page 8 During the year ended December 31, 2024, the Company’s Same-Property NOI totaled $60.4 million, an increase of 4.0% over the year ended December 31, 2023, as presented in the following table: Twelve Months Ended December 31, 2024 December 31, 2023 Variance to Comparable Period in the Prior Year Single Tenant $ 5,752 $ 5,673 $ 79 1.4% Multi-Tenant 54,689 52,450 2,239 4.3% Total $ 60,441 $ 58,123 $ 2,318 4.0% $ in thousands. Leasing Activity During the quarter ended December 31, 2024, the Company signed 16 leases totaling 67,788 square feet. On a comparable basis, which excludes vacancy existing at the time of acquisition, CTO signed 10 leases totaling 52,134 square feet at an average cash base rent of $22.70 per square foot compared to a previous average cash base rent of $21.06 per square foot, representing 7.8% comparable growth. A summary of the Company’s overall leasing activity for the quarter ended December 31, 2024, is as follows: Wtd. Avg. Cash Rent per Tenant Leasing Square Feet Lease Term Square Foot Improvements Commissions New Leases 20 8.7 years $ 36.90 $ 763 $ 486 Renewals & Extensions 48 4.7 years 21.32 — 10 Total / Wtd. Avg. 68 6.4 years $ 25.90 $ 763 $ 496 In thousands except for per square foot and weighted average lease term data. Comparable leases compare leases signed on a space for which there was previously a tenant. Overall leasing activity does not include lease termination agreements or lease amendments related to tenant bankruptcy proceedings. During the year ended December 31, 2024, the Company signed 70 leases totaling 452,301 square feet. On a comparable basis, which excludes vacancy existing at the time of acquisition, CTO signed 52 leases totaling 352,359 square feet at an average cash base rent of $23.36 per square foot compared to a previous average cash base rent of $18.99 per square foot, representing 23.0% comparable growth. A summary of the Company’s overall leasing activity for the year ended December 31, 2024, is as follows: Wtd. Avg. Cash Rent per Tenant Leasing Square Feet Lease Term Square Foot Improvements Commissions New Leases 201 10.0 years $ 28.22 $ 8,127 $ 3,407 Renewals & Extensions 251 3.1 years 20.76 78 143 Total / Wtd. Avg. 452 8.4 years $ 24.07 $ 8,205 $ 3,550 In thousands except for per square foot and weighted average lease term data. Comparable leases compare leases signed on a space for which there was previously a tenant. Overall leasing activity does not include lease termination agreements or lease amendments related to tenant bankruptcy proceedings. |
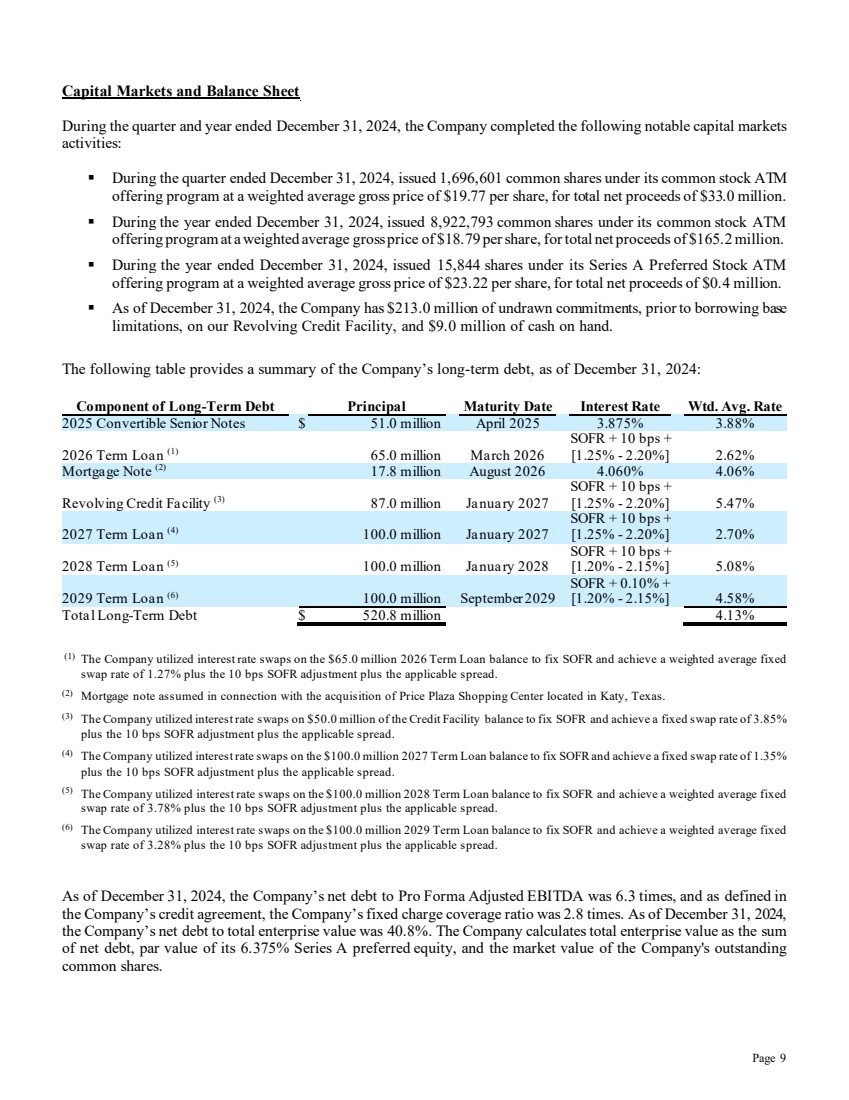
| Page 9 Capital Markets and Balance Sheet During the quarter and year ended December 31, 2024, the Company completed the following notable capital markets activities: During the quarter ended December 31, 2024, issued 1,696,601 common shares under its common stock ATM offering program at a weighted average gross price of $19.77 per share, for total net proceeds of $33.0 million. During the year ended December 31, 2024, issued 8,922,793 common shares under its common stock ATM offering program at a weighted average gross price of $18.79 per share, for total net proceeds of $165.2 million. During the year ended December 31, 2024, issued 15,844 shares under its Series A Preferred Stock ATM offering program at a weighted average gross price of $23.22 per share, for total net proceeds of $0.4 million. As of December 31, 2024, the Company has $213.0 million of undrawn commitments, prior to borrowing base limitations, on our Revolving Credit Facility, and $9.0 million of cash on hand. The following table provides a summary of the Company’s long-term debt, as of December 31, 2024: Component of Long-Term Debt Principal Maturity Date Interest Rate Wtd. Avg. Rate 2025 Convertible Senior Notes $ 51.0 million April 2025 3.875% 3.88% 2026 Term Loan (1) 65.0 million March 2026 SOFR + 10 bps + [1.25% - 2.20%] 2.62% Mortgage Note (2) 17.8 million August 2026 4.060% 4.06% Revolving Credit Facility (3) 87.0 million January 2027 SOFR + 10 bps + [1.25% - 2.20%] 5.47% 2027 Term Loan (4) 100.0 million January 2027 SOFR + 10 bps + [1.25% - 2.20%] 2.70% 2028 Term Loan (5) 100.0 million January 2028 SOFR + 10 bps + [1.20% - 2.15%] 5.08% 2029 Term Loan (6) 100.0 million September 2029 SOFR + 0.10% + [1.20% - 2.15%] 4.58% Total Long-Term Debt $ 520.8 million 4.13% (1) The Company utilized interest rate swaps on the $65.0 million 2026 Term Loan balance to fix SOFR and achieve a weighted average fixed swap rate of 1.27% plus the 10 bps SOFR adjustment plus the applicable spread. (2) Mortgage note assumed in connection with the acquisition of Price Plaza Shopping Center located in Katy, Texas. (3) The Company utilized interest rate swaps on $50.0 million of the Credit Facility balance to fix SOFR and achieve a fixed swap rate of 3.85% plus the 10 bps SOFR adjustment plus the applicable spread. (4) The Company utilized interest rate swaps on the $100.0 million 2027 Term Loan balance to fix SOFR and achieve a fixed swap rate of 1.35% plus the 10 bps SOFR adjustment plus the applicable spread. (5) The Company utilized interest rate swaps on the $100.0 million 2028 Term Loan balance to fix SOFR and achieve a weighted average fixed swap rate of 3.78% plus the 10 bps SOFR adjustment plus the applicable spread. (6) The Company utilized interest rate swaps on the $100.0 million 2029 Term Loan balance to fix SOFR and achieve a weighted average fixed swap rate of 3.28% plus the 10 bps SOFR adjustment plus the applicable spread. As of December 31, 2024, the Company’s net debt to Pro Forma Adjusted EBITDA was 6.3 times, and as defined in the Company’s credit agreement, the Company’s fixed charge coverage ratio was 2.8 times. As of December 31, 2024, the Company’s net debt to total enterprise value was 40.8%. The Company calculates total enterprise value as the sum of net debt, par value of its 6.375% Series A preferred equity, and the market value of the Company's outstanding common shares. |
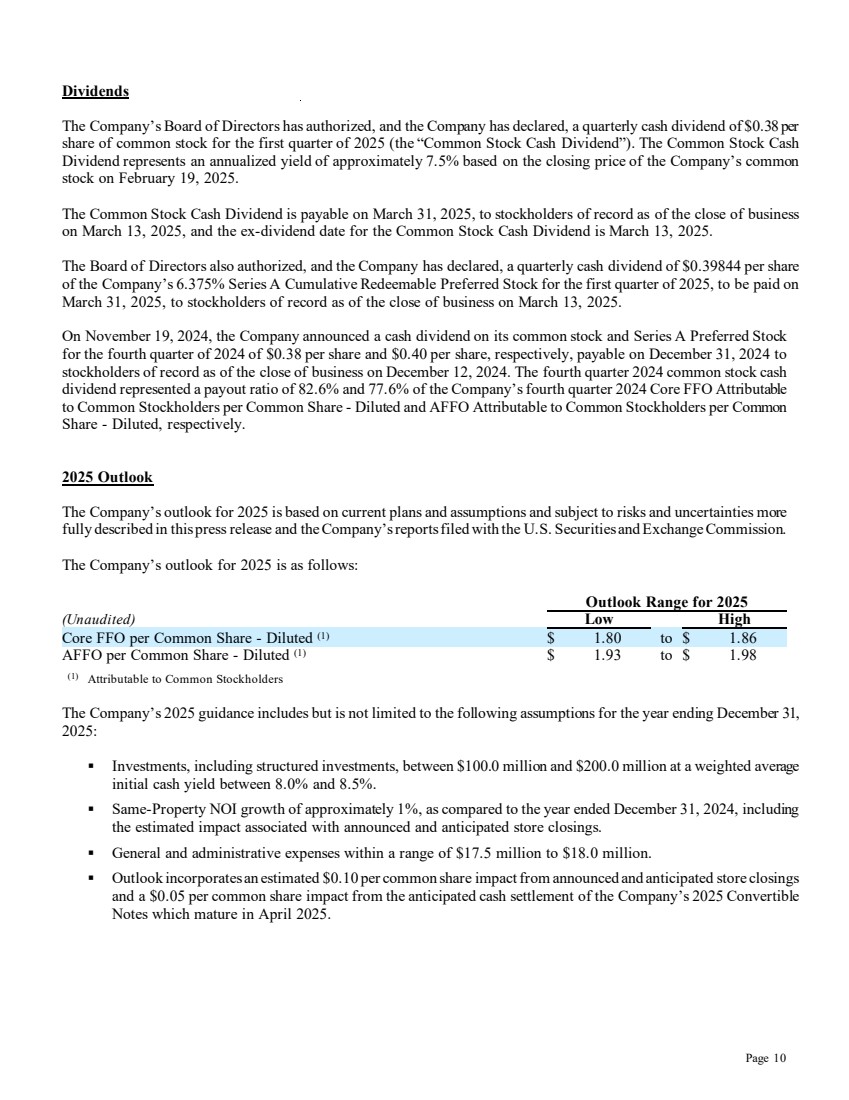
| Page 10 Dividends The Company’s Board of Directors has authorized, and the Company has declared, a quarterly cash dividend of $0.38 per share of common stock for the first quarter of 2025 (the “Common Stock Cash Dividend”). The Common Stock Cash Dividend represents an annualized yield of approximately 7.5% based on the closing price of the Company’s common stock on February 19, 2025. The Common Stock Cash Dividend is payable on March 31, 2025, to stockholders of record as of the close of business on March 13, 2025, and the ex-dividend date for the Common Stock Cash Dividend is March 13, 2025. The Board of Directors also authorized, and the Company has declared, a quarterly cash dividend of $0.39844 per share of the Company’s 6.375% Series A Cumulative Redeemable Preferred Stock for the first quarter of 2025, to be paid on March 31, 2025, to stockholders of record as of the close of business on March 13, 2025. On November 19, 2024, the Company announced a cash dividend on its common stock and Series A Preferred Stock for the fourth quarter of 2024 of $0.38 per share and $0.40 per share, respectively, payable on December 31, 2024 to stockholders of record as of the close of business on December 12, 2024. The fourth quarter 2024 common stock cash dividend represented a payout ratio of 82.6% and 77.6% of the Company’s fourth quarter 2024 Core FFO Attributable to Common Stockholders per Common Share - Diluted and AFFO Attributable to Common Stockholders per Common Share - Diluted, respectively. 2025 Outlook The Company’s outlook for 2025 is based on current plans and assumptions and subject to risks and uncertainties more fully described in this press release and the Company’s reports filed with the U.S. Securities and ExchangeCommission. The Company’s outlook for 2025 is as follows: Outlook Range for 2025 (Unaudited) Low High Core FFO per Common Share - Diluted (1) $ 1.80 to $ 1.86 AFFO per Common Share - Diluted (1) $ 1.93 to $ 1.98 (1) Attributable to Common Stockholders The Company’s 2025 guidance includes but is not limited to the following assumptionsfor the year ending December 31, 2025: Investments, including structured investments, between $100.0 million and $200.0 million at a weighted average initial cash yield between 8.0% and 8.5%. Same-Property NOI growth of approximately 1%, as compared to the year ended December 31, 2024, including the estimated impact associated with announced and anticipated store closings. General and administrative expenses within a range of $17.5 million to $18.0 million. Outlook incorporates an estimated $0.10 per common share impact from announced and anticipated store closings and a $0.05 per common share impact from the anticipated cash settlement of the Company’s 2025 Convertible Notes which mature in April 2025. |
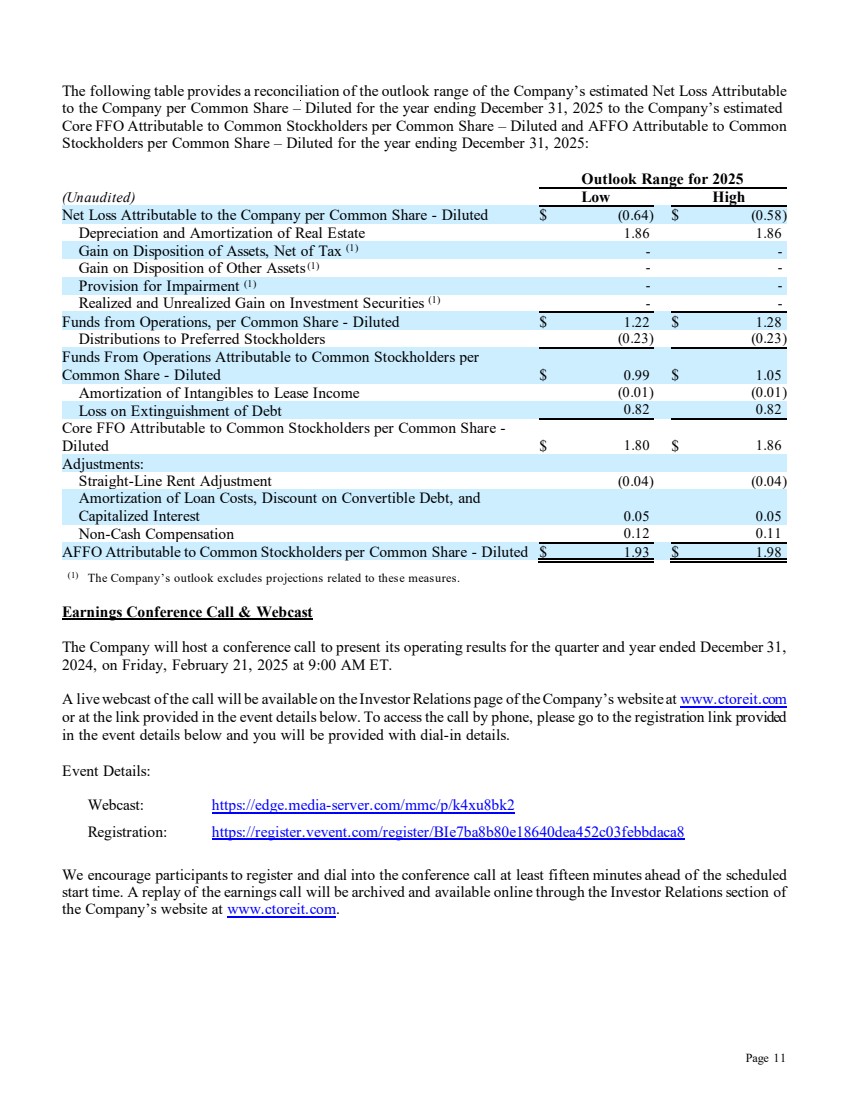
| Page 11 The following table provides a reconciliation of the outlook range of the Company’s estimated Net Loss Attributable to the Company per Common Share – Diluted for the year ending December 31, 2025 to the Company’s estimated Core FFO Attributable to Common Stockholders per Common Share – Diluted and AFFO Attributable to Common Stockholders per Common Share – Diluted for the year ending December 31, 2025: Outlook Range for 2025 (Unaudited) Low High Net Loss Attributable to the Company per Common Share - Diluted $ (0.64) $ (0.58) Depreciation and Amortization of Real Estate 1.86 1.86 Gain on Disposition of Assets, Net of Tax (1) - - Gain on Disposition of Other Assets(1) - - Provision for Impairment (1) - - Realized and Unrealized Gain on Investment Securities (1) - - Funds from Operations, per Common Share - Diluted $ 1.22 $ 1.28 Distributions to Preferred Stockholders (0.23) (0.23) Funds From Operations Attributable to Common Stockholders per Common Share - Diluted $ 0.99 $ 1.05 Amortization of Intangibles to Lease Income (0.01) (0.01) Loss on Extinguishment of Debt 0.82 0.82 Core FFO Attributable to Common Stockholders per Common Share - Diluted $ 1.80 $ 1.86 Adjustments: Straight-Line Rent Adjustment (0.04) (0.04) Amortization of Loan Costs, Discount on Convertible Debt, and Capitalized Interest 0.05 0.05 Non-Cash Compensation 0.12 0.11 AFFO Attributable to Common Stockholders per Common Share - Diluted $ 1.93 $ 1.98 (1) The Company’s outlook excludes projections related to these measures. Earnings Conference Call & Webcast The Company will host a conference call to present its operating results for the quarter and year ended December 31, 2024, on Friday, February 21, 2025 at 9:00 AM ET. A live webcast of the call will be available on the Investor Relations page of the Company’s website at www.ctoreit.com or at the link provided in the event details below. To access the call by phone, please go to the registration link provided in the event details below and you will be provided with dial-in details. Event Details: Webcast: https://edge.media-server.com/mmc/p/k4xu8bk2 Registration: https://register.vevent.com/register/BIe7ba8b80e18640dea452c03febbdaca8 We encourage participants to register and dial into the conference call at least fifteen minutes ahead of the scheduled start time. A replay of the earnings call will be archived and available online through the Investor Relations section of the Company’s website at www.ctoreit.com. |
| Page 12 About CTO Realty Growth, Inc. CTO Realty Growth, Inc. is a publicly traded real estate investment trust that owns and operates a portfolio of high-quality, retail-based properties located primarily in higher growth markets in the United States. CTO also externally manages and owns a meaningful interest in Alpine Income Property Trust, Inc. (NYSE: PINE), a publicly traded net lease REIT. We encourage you to review our most recent investor presentation and supplemental financial information, which is available on our website at www.ctoreit.com. Contact: Investor Relations ir@ctoreit.com Safe Harbor Certain statements contained in this press release (other than statements of historical fact) are forward-looking statements within the meaning of Section 27A of the Securities Act of 1933, as amended, and Section 21E of the Securities Exchange Act of 1934, as amended. Forward-looking statements can typically be identified by words such as “believe,” “estimate,” “expect,” “intend,” “anticipate,” “will,” “could,” “may,” “should,” “plan,” “potential,” “predict,” “forecast,” “project,” and similar expressions, as well as variations or negatives of these words. Although forward-looking statements are made based upon management’s present expectations and beliefs concerning future developments and their potential effect upon the Company, a number of factors could cause the Company’s actual results to differ materially from those set forth in the forward-looking statements. Such factors may include, but are not limited to: the Company’s ability to remain qualified as a REIT; the Company’s exposure to U.S. federal and state income tax law changes, including changes to the REIT requirements; general adverse economic and real estate conditions; macroeconomic and geopolitical factors, including but not limited to inflationary pressures, interest rate volatility, distress in the banking sector, global supply chain disruptions, and ongoing geopolitical war; credit risk associated with the Company investing in structured investments; the ultimate geographic spread, severity and duration of pandemics such as the COVID-19 Pandemic and its variants, actions that may be taken by governmental authorities to contain or address the impact of such pandemics, and the potential negative impacts of such pandemics on the global economy and the Company’s financial condition and results of operations; the inability of major tenants to continue paying their rent or obligations due to bankruptcy, insolvency or a general downturn in their business; the loss or failure, or decline in the business or assets of PINE; the completion of 1031 exchange transactions; the availability of investment properties that meet the Company’s investment goals and criteria; the uncertainties associated with obtaining required governmental permits and satisfying other closing conditions for planned acquisitions and sales; and the uncertainties and risk factors discussed in the Company’s Annual Report on Form 10-K for the fiscal year ended December 31, 2024 and other risks and uncertainties discussed from time to time in the Company’s filings with the U.S. Securities and Exchange Commission. There can be no assurance that future developments will be in accordance with management’s expectations or that the effect of future developments on the Company will be those anticipated by management. Readers are cautioned not to place undue reliance on these forward-looking statements, which speak only as of the date of this press release. The Company undertakes no obligation to update the information contained in this press release to reflect subsequently occurring events or circumstances. Non-GAAP Financial Measures Our reported results are presented in accordance with accounting principles generally accepted in the United States of America (“GAAP”). We also disclose Funds From Operations (“FFO”), Core Funds From Operations (“Core FFO”), Adjusted Funds From Operations (“AFFO”), Pro Forma Earnings Before Interest, Taxes, Depreciation and Amortization (“Pro Forma Adjusted EBITDA”), and Same-Property Net Operating Income (“Same-Property NOI”), |
| Page 13 each of which are non-GAAP financial measures. We believe these non-GAAP financial measures are useful to investors because they are widely accepted industry measures used by analysts and investors to compare the operating performance of REITs. FFO, Core FFO, AFFO, Pro Forma Adjusted EBITDA, and Same-Property NOI do not represent cash generated from operating activities and are not necessarily indicative of cash available to fund cash requirements; accordingly, they should not be considered alternatives to net income as a performance measure or cash flows from operating activities as reported on our statement of cash flows as a liquidity measure and should be considered in addition to, and not in lieu of, GAAP financial measures. We compute FFO in accordance with the definition adopted by the Board of Governors of the National Association of Real Estate Investment Trusts, or NAREIT. NAREIT defines FFO as GAAP net income or loss adjusted to exclude real estate related depreciation and amortization, as well as extraordinary items (as defined by GAAP) such as net gain or loss from sales of depreciable real estate assets, impairment write-downs associated with depreciable real estate assets and impairments associated with the implementation of current expected credit losses on commercial loans and investments at the time of origination, including the pro rata share of such adjustments of unconsolidated subsidiaries. The Company also excludes the gains or losses from sales of assets incidental to the primary business of the REIT which specifically include the sales of mitigation credits, subsurface sales, investment securities, and land sales, in addition to the mark-to-market of the Company’s investment securities and interest related to the 2025 Convertible Senior Notes, if the effect is dilutive. To derive Core FFO, we modify the NAREIT computation of FFO to include other adjustments to GAAP net income related to gains and losses recognized on the extinguishment of debt, amortization of above- and below-market lease related intangibles, and other unforecastable market- or transaction-driven non-cash items, as well as adding back the interest related to the 2025 Convertible Senior Notes, if the effect is dilutive. To derive AFFO, we further modify the NAREIT computation of FFO and Core FFO to include other adjustments to GAAP net income related to non-cash revenues and expenses such as straight-line rental revenue, non-cash compensation, and other non-cash amortization. Such items may cause short-term fluctuations in net income but have no impact on operating cash flows or long-term operating performance. We use AFFO as one measure of our performance when we formulate corporate goals. To derive Pro Forma Adjusted EBITDA, GAAP net income or loss attributable to the Company is adjusted to exclude real estate related depreciation and amortization, as well as extraordinary items (as defined by GAAP) such as net gain or loss from sales of depreciable real estate assets, impairment write-downs associated with depreciable real estate assets, impairments associated with the implementation of current expected credit losses on commercial loans and investments at the time of origination, including the pro rata share of such adjustments of unconsolidated subsidiaries, non-cash revenues and expenses such as straight-line rental revenue, amortization of deferred financing costs, above-and below-market lease related intangibles, non-cash compensation, other non-recurring items such as termination fees, forfeitures of tenant security deposits, and certain adjustments to reconciliation estimates related to reimbursable revenue for recently acquired properties, and other non-cash income or expense. The Company also excludes the gains or losses from sales of assets incidental to the primary business of the REIT which specifically include the sales of mitigation credits, subsurface sales, investment securities, and land sales, in addition to the mark-to-market of the Company’s investment securities. Cash interest expense is also excluded from Pro Forma Adjusted EBITDA, and GAAP net income or loss is adjusted for the annualized impact of acquisitions, dispositions and other similar activities. To derive Same-Property NOI, GAAP net income or loss attributable to the Company is adjusted to exclude real estate related depreciation and amortization, as well as extraordinary items (as defined by GAAP) such as net gain or loss from sales of depreciable real estate assets, impairment write-downs associated with depreciable real estate assets, impairments associated with the implementation of current expected credit losses on commercial loans and investments at the time of origination, including the pro rata share of such adjustments of unconsolidated subsidiaries, non-cash revenues and expenses such as straight-line rental revenue, amortization of deferred financing costs, above- and below-market lease related intangibles, non-cash compensation, other non-recurring items such as termination fees, forfeitures of tenant security deposits, and certain adjustments to reconciliation estimates related to reimbursable revenue for recently acquired properties, and other non-cash income or expense. Interest expense, general and administrative expenses, investment and other income or loss, income tax benefit or expense, real estate operations revenues and direct |
| Page 14 cost of revenues, management fee income, and interest income from commercial loans and investments are also excluded from Same-Property NOI. GAAP net income or loss is further adjusted to remove the impact of properties that were not owned for the full current and prior year reporting periods presented. Cash rental income received under the leases pertaining to the Company’s assets that are presented as commercial loans and investments in accordance with GAAP is also used in lieu of the interest income equivalent. FFO is used by management, investors and analysts to facilitate meaningful comparisons of operating performance between periods and among our peers primarily because it excludes the effect of real estate depreciation and amortization and net gains or losses on sales, which are based on historical costs and implicitly assume that the value of real estate diminishes predictably over time, rather than fluctuating based on existing market conditions. We believe that Core FFO and AFFO are additional useful supplemental measures for investors to consider because they will help them to better assess our operating performance without the distortions created by other non-cash revenues or expenses. We also believe that Pro Forma Adjusted EBITDA is an additional useful supplemental measure for investors to consider as it allows for a better assessment of our operating performance without the distortions created by other non-cash revenues, expenses or certain effects of the Company’s capital structure on our operating performance. We use Same-Property NOI to compare the operating performance of our assets between periods. It is an accepted and important measurement used by management, investors and analysts because it includes all property-level revenues from the Company’s properties, less operating and maintenance expenses, real estate taxes and other property-specific expenses (“Net Operating Income” or “NOI”) of properties that have been owned and stabilized for the entire current and prior year reporting periods. Same-Property NOI attempts to eliminate differences due to the acquisition or disposition of properties during the particular period presented, and therefore provides a more comparable and consistent performance measure for the comparison of the Company’s properties. FFO, Core FFO, AFFO, Pro Forma Adjusted EBITDA, and Same-Property NOI may not be comparable to similarly titled measures employed by other companies. |
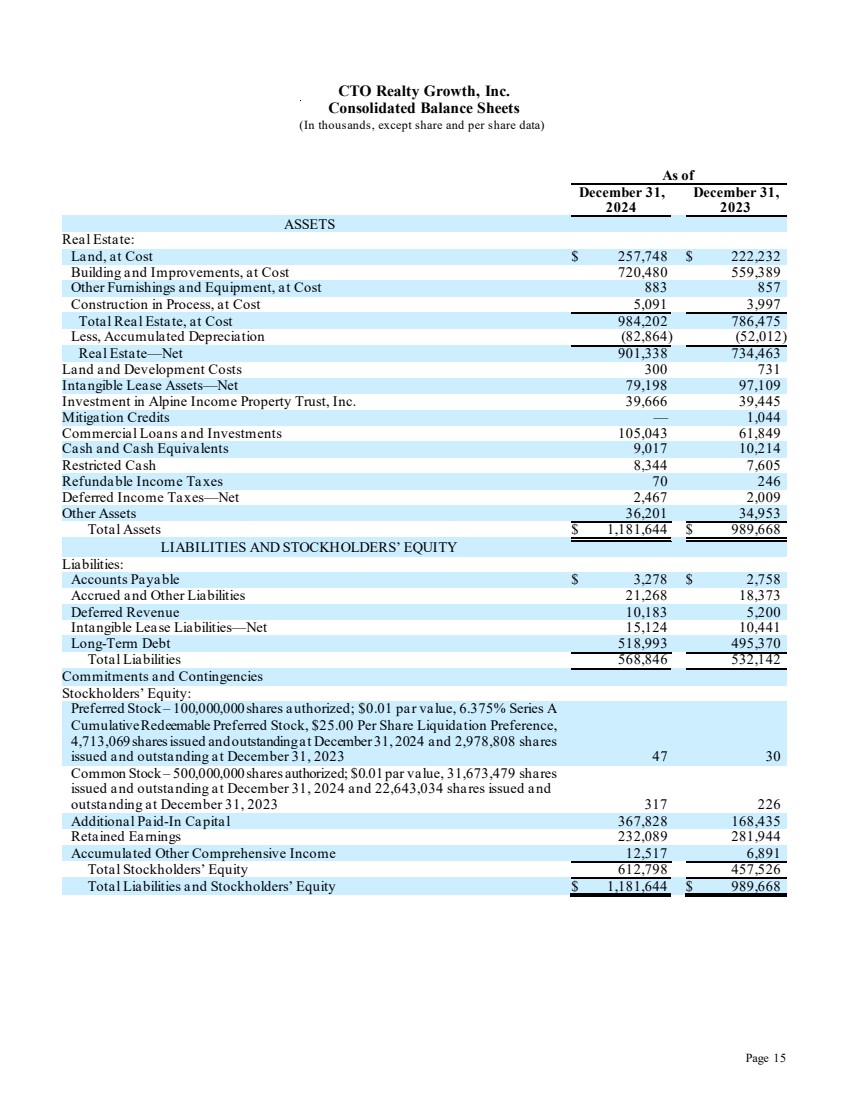
| Page 15 CTO Realty Growth, Inc. Consolidated Balance Sheets (In thousands, except share and per share data) As of December 31, 2024 December 31, 2023 ASSETS Real Estate: Land, at Cost $ 257,748 $ 222,232 Building and Improvements, at Cost 720,480 559,389 Other Furnishings and Equipment, at Cost 883 857 Construction in Process, at Cost 5,091 3,997 Total Real Estate, at Cost 984,202 786,475 Less, Accumulated Depreciation (82,864) (52,012) Real Estate—Net 901,338 734,463 Land and Development Costs 300 731 Intangible Lease Assets—Net 79,198 97,109 Investment in Alpine Income Property Trust, Inc. 39,666 39,445 Mitigation Credits — 1,044 Commercial Loans and Investments 105,043 61,849 Cash and Cash Equivalents 9,017 10,214 Restricted Cash 8,344 7,605 Refundable Income Taxes 70 246 Deferred Income Taxes—Net 2,467 2,009 Other Assets 36,201 34,953 Total Assets $ 1,181,644 $ 989,668 LIABILITIES AND STOCKHOLDERS’ EQUITY Liabilities: Accounts Payable $ 3,278 $ 2,758 Accrued and Other Liabilities 21,268 18,373 Deferred Revenue 10,183 5,200 Intangible Lease Liabilities—Net 15,124 10,441 Long-Term Debt 518,993 495,370 Total Liabilities 568,846 532,142 Commitments and Contingencies Stockholders’ Equity: Preferred Stock – 100,000,000 shares authorized; $0.01 par value, 6.375% Series A Cumulative Redeemable Preferred Stock, $25.00 Per Share Liquidation Preference, 4,713,069 shares issued and outstanding at December 31, 2024 and 2,978,808 shares issued and outstanding at December 31, 2023 47 30 Common Stock – 500,000,000 shares authorized; $0.01 par value, 31,673,479 shares issued and outstanding at December 31, 2024 and 22,643,034 shares issued and outstanding at December 31, 2023 317 226 Additional Paid-In Capital 367,828 168,435 Retained Earnings 232,089 281,944 Accumulated Other Comprehensive Income 12,517 6,891 Total Stockholders’ Equity 612,798 457,526 Total Liabilities and Stockholders’ Equity $ 1,181,644 $ 989,668 |
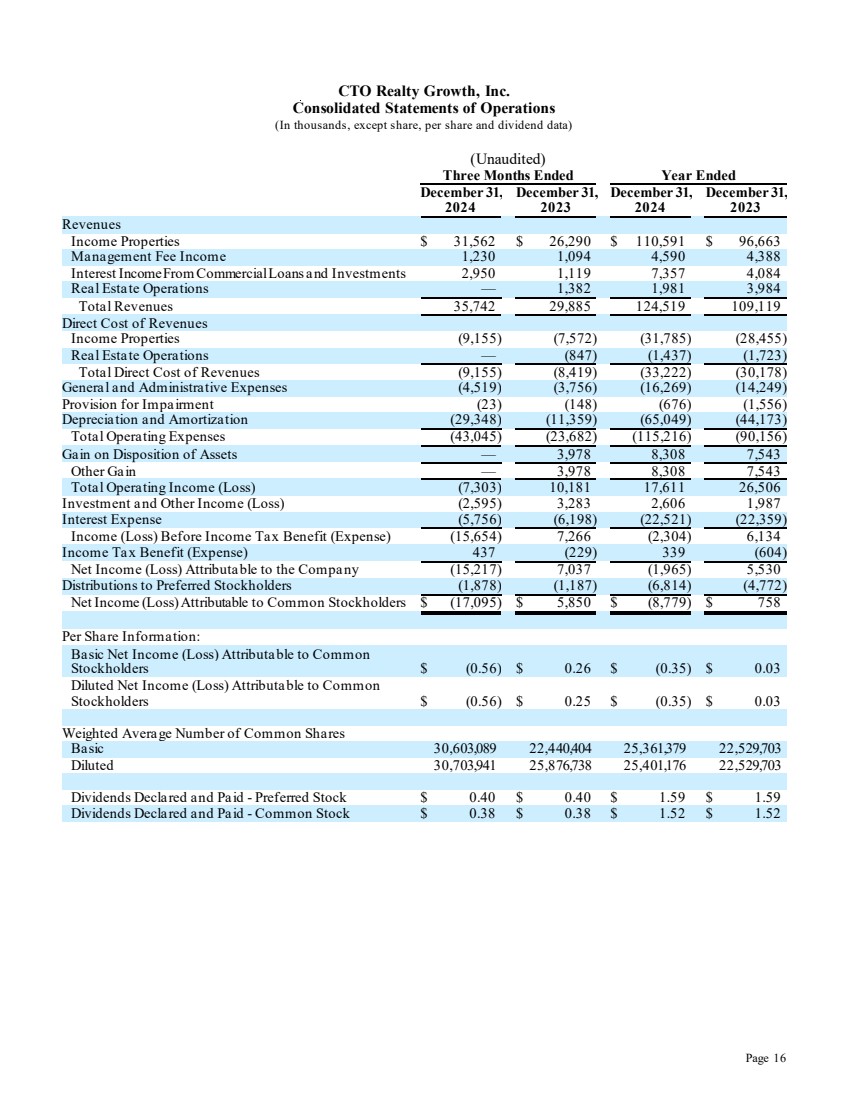
| Page 16 CTO Realty Growth, Inc. Consolidated Statements of Operations (In thousands, except share, per share and dividend data) (Unaudited) Three Months Ended Year Ended December 31, December 31, December 31, December 31, 2024 2023 2024 2023 Revenues Income Properties $ 31,562 $ 26,290 $ 110,591 $ 96,663 Management Fee Income 1,230 1,094 4,590 4,388 Interest Income From Commercial Loans and Investments 2,950 1,119 7,357 4,084 Real Estate Operations — 1,382 1,981 3,984 Total Revenues 35,742 29,885 124,519 109,119 Direct Cost of Revenues Income Properties (9,155) (7,572) (31,785) (28,455) Real Estate Operations — (847) (1,437) (1,723) Total Direct Cost of Revenues (9,155) (8,419) (33,222) (30,178) General and Administrative Expenses (4,519) (3,756) (16,269) (14,249) Provision for Impairment (23) (148) (676) (1,556) Depreciation and Amortization (29,348) (11,359) (65,049) (44,173) Total Operating Expenses (43,045) (23,682) (115,216) (90,156) Gain on Disposition of Assets — 3,978 8,308 7,543 Other Gain — 3,978 8,308 7,543 Total Operating Income (Loss) (7,303) 10,181 17,611 26,506 Investment and Other Income (Loss) (2,595) 3,283 2,606 1,987 Interest Expense (5,756) (6,198) (22,521) (22,359) Income (Loss) Before Income Tax Benefit (Expense) (15,654) 7,266 (2,304) 6,134 Income Tax Benefit (Expense) 437 (229) 339 (604) Net Income (Loss) Attributable to the Company (15,217) 7,037 (1,965) 5,530 Distributions to Preferred Stockholders (1,878) (1,187) (6,814) (4,772) Net Income (Loss) Attributable to Common Stockholders $ (17,095) $ 5,850 $ (8,779) $ 758 Per Share Information: Basic Net Income (Loss) Attributable to Common Stockholders $ (0.56) $ 0.26 $ (0.35) $ 0.03 Diluted Net Income (Loss) Attributable to Common Stockholders $ (0.56) $ 0.25 $ (0.35) $ 0.03 Weighted Average Number of Common Shares Basic 30,603,089 22,440,404 25,361,379 22,529,703 Diluted 30,703,941 25,876,738 25,401,176 22,529,703 Dividends Declared and Paid - Preferred Stock $ 0.40 $ 0.40 $ 1.59 $ 1.59 Dividends Declared and Paid - Common Stock $ 0.38 $ 0.38 $ 1.52 $ 1.52 |
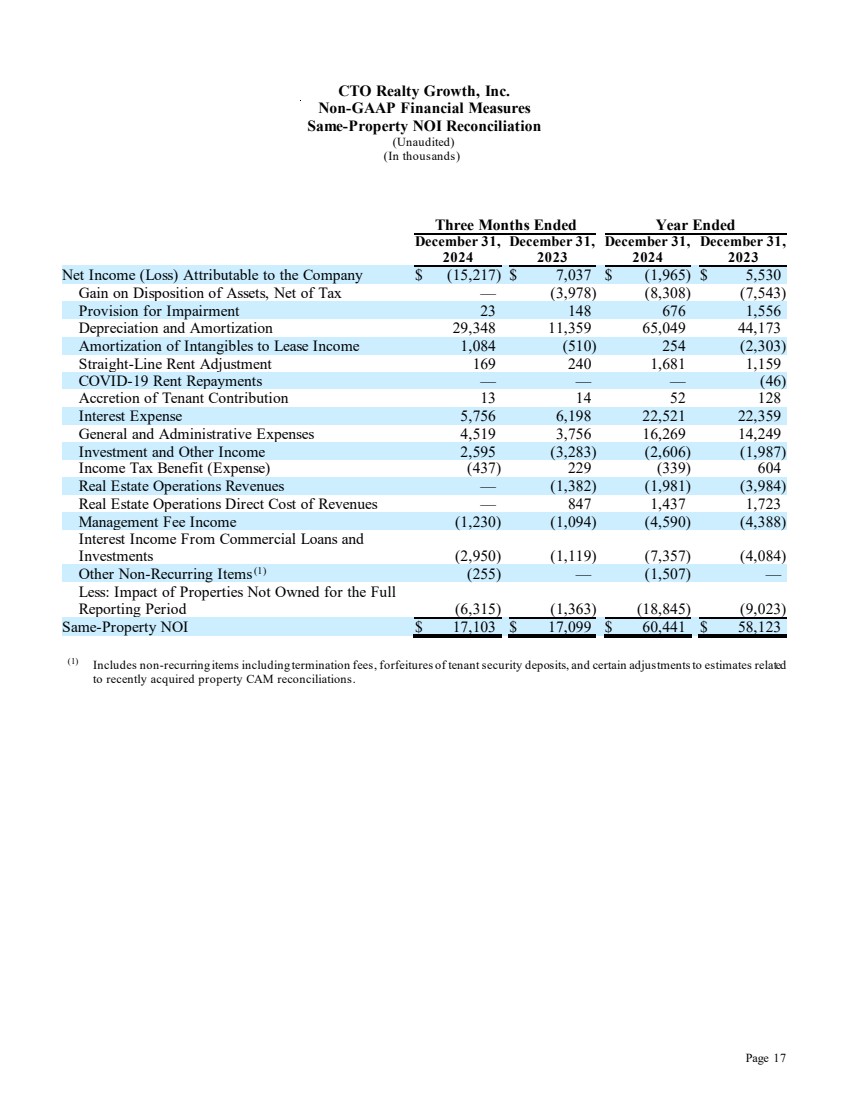
| Page 17 CTO Realty Growth, Inc. Non-GAAP Financial Measures Same-Property NOI Reconciliation (Unaudited) (In thousands) Three Months Ended Year Ended December 31, 2024 December 31, 2023 December 31, 2024 December 31, 2023 Net Income (Loss) Attributable to the Company $ (15,217) $ 7,037 $ (1,965) $ 5,530 Gain on Disposition of Assets, Net of Tax — (3,978) (8,308) (7,543) Provision for Impairment 23 148 676 1,556 Depreciation and Amortization 29,348 11,359 65,049 44,173 Amortization of Intangibles to Lease Income 1,084 (510) 254 (2,303) Straight-Line Rent Adjustment 169 240 1,681 1,159 COVID-19 Rent Repayments — — — (46) Accretion of Tenant Contribution 13 14 52 128 Interest Expense 5,756 6,198 22,521 22,359 General and Administrative Expenses 4,519 3,756 16,269 14,249 Investment and Other Income 2,595 (3,283) (2,606) (1,987) Income Tax Benefit (Expense) (437) 229 (339) 604 Real Estate Operations Revenues — (1,382) (1,981) (3,984) Real Estate Operations Direct Cost of Revenues — 847 1,437 1,723 Management Fee Income (1,230) (1,094) (4,590) (4,388) Interest Income From Commercial Loans and Investments (2,950) (1,119) (7,357) (4,084) Other Non-Recurring Items(1) (255) — (1,507) — Less: Impact of Properties Not Owned for the Full Reporting Period (6,315) (1,363) (18,845) (9,023) Same-Property NOI $ 17,103 $ 17,099 $ 60,441 $ 58,123 (1) Includes non-recurring items including termination fees, forfeitures of tenant security deposits, and certain adjustments to estimates related to recently acquired property CAM reconciliations. |
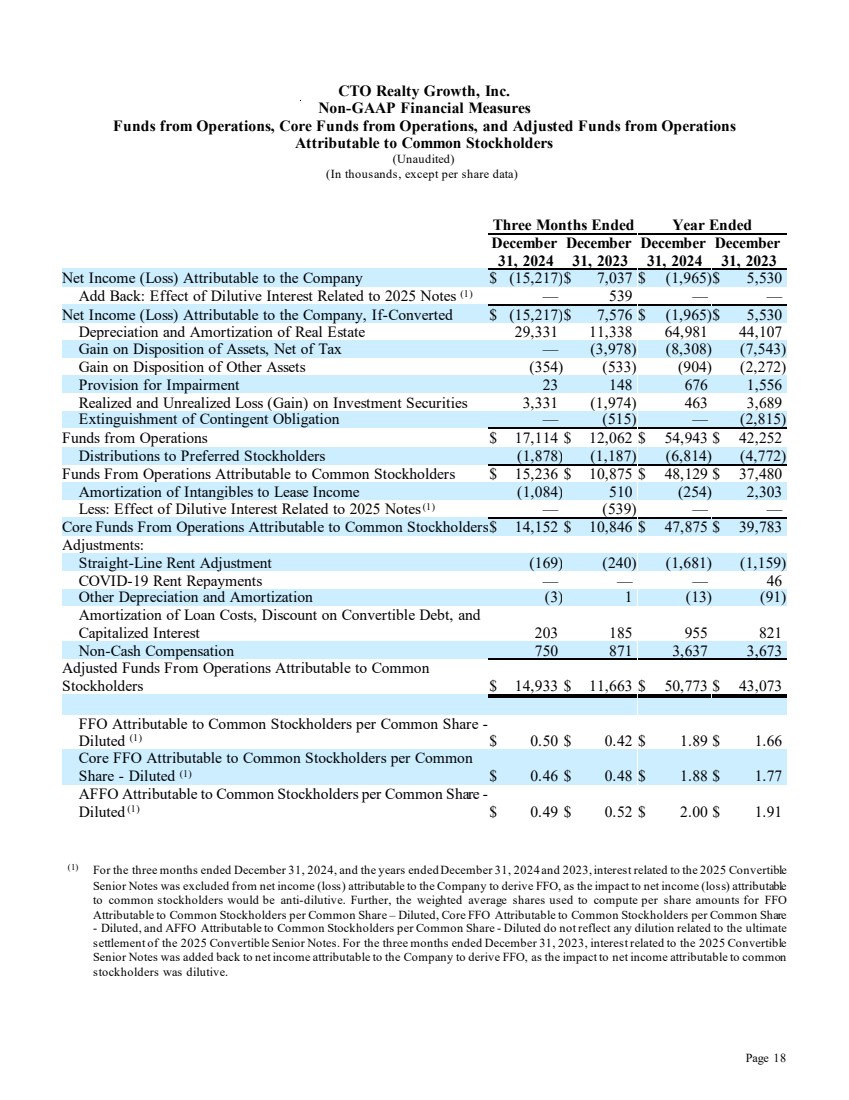
| Page 18 CTO Realty Growth, Inc. Non-GAAP Financial Measures Funds from Operations, Core Funds from Operations, and Adjusted Funds from Operations Attributable to Common Stockholders (Unaudited) (In thousands, except per share data) Three Months Ended Year Ended December 31, 2024 December 31, 2023 December 31, 2024 December 31, 2023 Net Income (Loss) Attributable to the Company $ (15,217)$ 7,037 $ (1,965)$ 5,530 Add Back: Effect of Dilutive Interest Related to 2025 Notes (1) — 539 — — Net Income (Loss) Attributable to the Company, If-Converted $ (15,217)$ 7,576 $ (1,965)$ 5,530 Depreciation and Amortization of Real Estate 29,331 11,338 64,981 44,107 Gain on Disposition of Assets, Net of Tax — (3,978) (8,308) (7,543) Gain on Disposition of Other Assets (354) (533) (904) (2,272) Provision for Impairment 23 148 676 1,556 Realized and Unrealized Loss (Gain) on Investment Securities 3,331 (1,974) 463 3,689 Extinguishment of Contingent Obligation — (515) — (2,815) Funds from Operations $ 17,114 $ 12,062 $ 54,943 $ 42,252 Distributions to Preferred Stockholders (1,878) (1,187) (6,814) (4,772) Funds From Operations Attributable to Common Stockholders $ 15,236 $ 10,875 $ 48,129 $ 37,480 Amortization of Intangibles to Lease Income (1,084) 510 (254) 2,303 Less: Effect of Dilutive Interest Related to 2025 Notes(1) — (539) — — Core Funds From Operations Attributable to Common Stockholders$ 14,152 $ 10,846 $ 47,875 $ 39,783 Adjustments: Straight-Line Rent Adjustment (169) (240) (1,681) (1,159) COVID-19 Rent Repayments — — — 46 Other Depreciation and Amortization (3) 1 (13) (91) Amortization of Loan Costs, Discount on Convertible Debt, and Capitalized Interest 203 185 955 821 Non-Cash Compensation 750 871 3,637 3,673 Adjusted Funds From Operations Attributable to Common Stockholders $ 14,933 $ 11,663 $ 50,773 $ 43,073 FFO Attributable to Common Stockholders per Common Share - Diluted (1) $ 0.50 $ 0.42 $ 1.89 $ 1.66 Core FFO Attributable to Common Stockholders per Common Share - Diluted (1) $ 0.46 $ 0.48 $ 1.88 $ 1.77 AFFO Attributable to Common Stockholders per Common Share - Diluted (1) $ 0.49 $ 0.52 $ 2.00 $ 1.91 (1) For the three months ended December 31, 2024, and the years ended December 31, 2024 and 2023, interest related to the 2025 Convertible Senior Notes was excluded from net income (loss) attributable to the Company to derive FFO, as the impact to net income (loss) attributable to common stockholders would be anti-dilutive. Further, the weighted average shares used to compute per share amounts for FFO Attributable to Common Stockholders per Common Share – Diluted, Core FFO Attributable to Common Stockholders per Common Share - Diluted, and AFFO Attributable to Common Stockholders per Common Share - Diluted do not reflect any dilution related to the ultimate settlement of the 2025 Convertible Senior Notes. For the three months ended December 31, 2023, interest related to the 2025 Convertible Senior Notes was added back to net income attributable to the Company to derive FFO, as the impact to net income attributable to common stockholders was dilutive. |
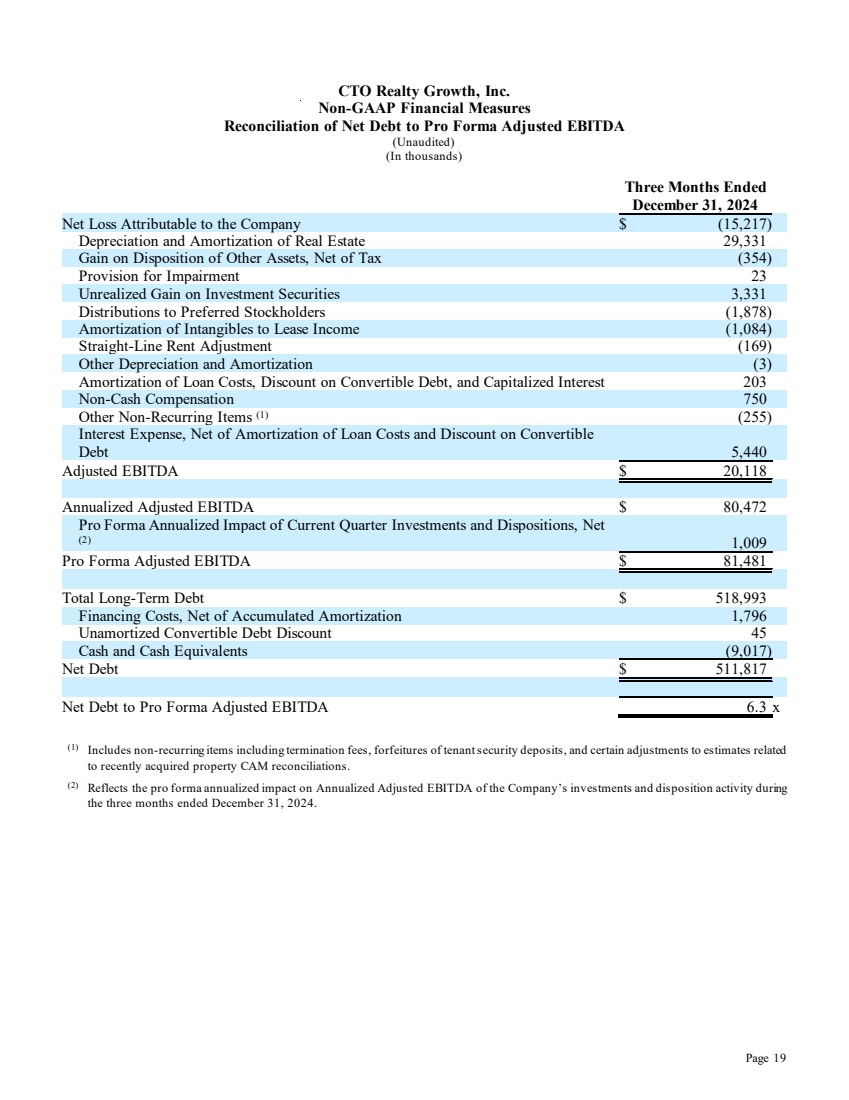
| Page 19 CTO Realty Growth, Inc. Non-GAAP Financial Measures Reconciliation of Net Debt to Pro Forma Adjusted EBITDA (Unaudited) (In thousands) Three Months Ended December 31, 2024 Net Loss Attributable to the Company $ (15,217) Depreciation and Amortization of Real Estate 29,331 Gain on Disposition of Other Assets, Net of Tax (354) Provision for Impairment 23 Unrealized Gain on Investment Securities 3,331 Distributions to Preferred Stockholders (1,878) Amortization of Intangibles to Lease Income (1,084) Straight-Line Rent Adjustment (169) Other Depreciation and Amortization (3) Amortization of Loan Costs, Discount on Convertible Debt, and Capitalized Interest 203 Non-Cash Compensation 750 Other Non-Recurring Items (1) (255) Interest Expense, Net of Amortization of Loan Costs and Discount on Convertible Debt 5,440 Adjusted EBITDA $ 20,118 Annualized Adjusted EBITDA $ 80,472 Pro Forma Annualized Impact of Current Quarter Investments and Dispositions, Net (2) 1,009 Pro Forma Adjusted EBITDA $ 81,481 Total Long-Term Debt $ 518,993 Financing Costs, Net of Accumulated Amortization 1,796 Unamortized Convertible Debt Discount 45 Cash and Cash Equivalents (9,017) Net Debt $ 511,817 Net Debt to Pro Forma Adjusted EBITDA 6.3 x (1) Includes non-recurring items including termination fees, forfeitures of tenant security deposits, and certain adjustments to estimates related to recently acquired property CAM reconciliations. (2) Reflects the pro forma annualized impact on Annualized Adjusted EBITDA of the Company’s investments and disposition activity during the three months ended December 31, 2024. |
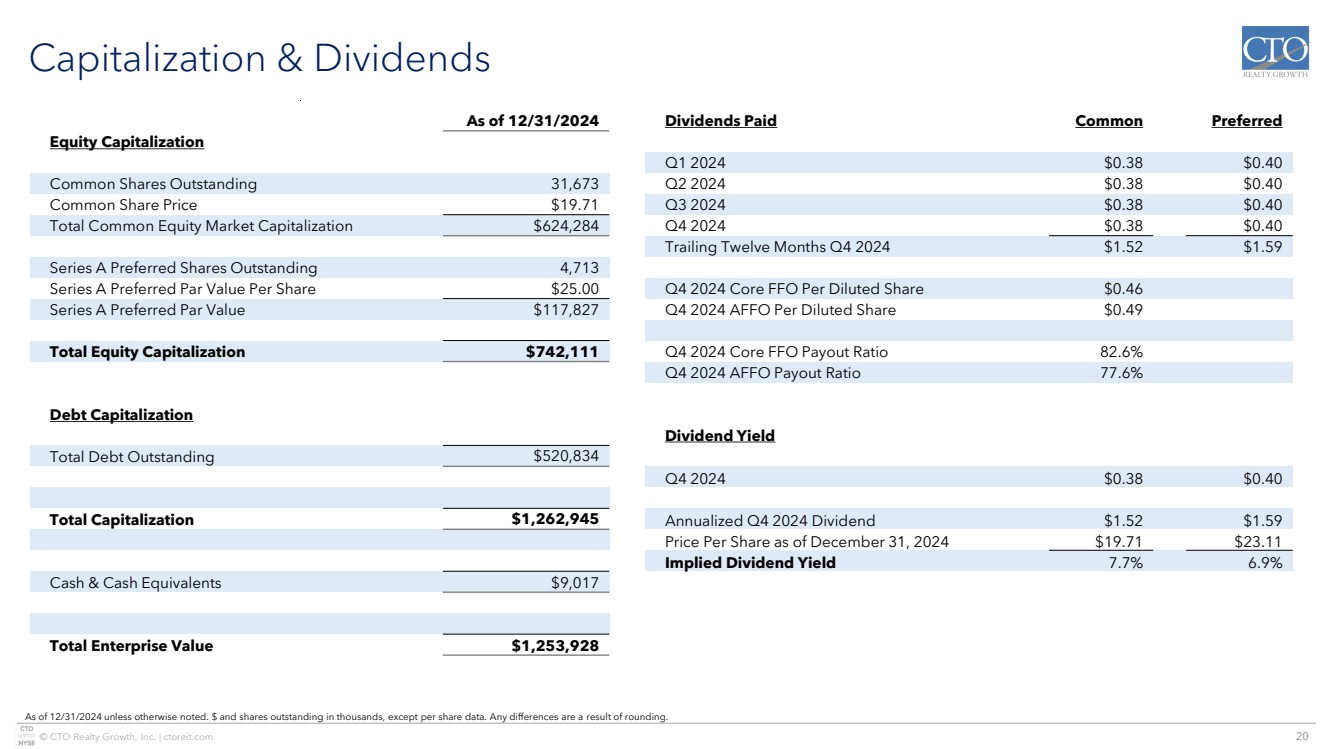
| © CTO Realty Growth, Inc. | ctoreit.com 20 Capitalization & Dividends As of 12/31/2024 Equity Capitalization Common Shares Outstanding 31,673 Common Share Price $19.71 Total Common Equity Market Capitalization $624,284 Series A Preferred Shares Outstanding 4,713 Series A Preferred Par Value Per Share $25.00 Series A Preferred Par Value $117,827 Total Equity Capitalization $742,111 Debt Capitalization Total Debt Outstanding $520,834 Total Capitalization $1,262,945 Cash & Cash Equivalents $9,017 Total Enterprise Value $1,253,928 Dividends Paid Common Preferred Q1 2024 $0.38 $0.40 Q2 2024 $0.38 $0.40 Q3 2024 $0.38 $0.40 Q4 2024 $0.38 $0.40 Trailing Twelve Months Q4 2024 $1.52 $1.59 Q4 2024 Core FFO Per Diluted Share $0.46 Q4 2024 AFFO Per Diluted Share $0.49 Q4 2024 Core FFO Payout Ratio 82.6% Q4 2024 AFFO Payout Ratio 77.6% Dividend Yield Q4 2024 $0.38 $0.40 Annualized Q4 2024 Dividend $1.52 $1.59 Price Per Share as of December 31, 2024 $19.71 $23.11 Implied Dividend Yield 7.7% 6.9% As of 12/31/2024 unless otherwise noted. $ and shares outstanding in thousands, except per share data. Any differences are a result of rounding. |
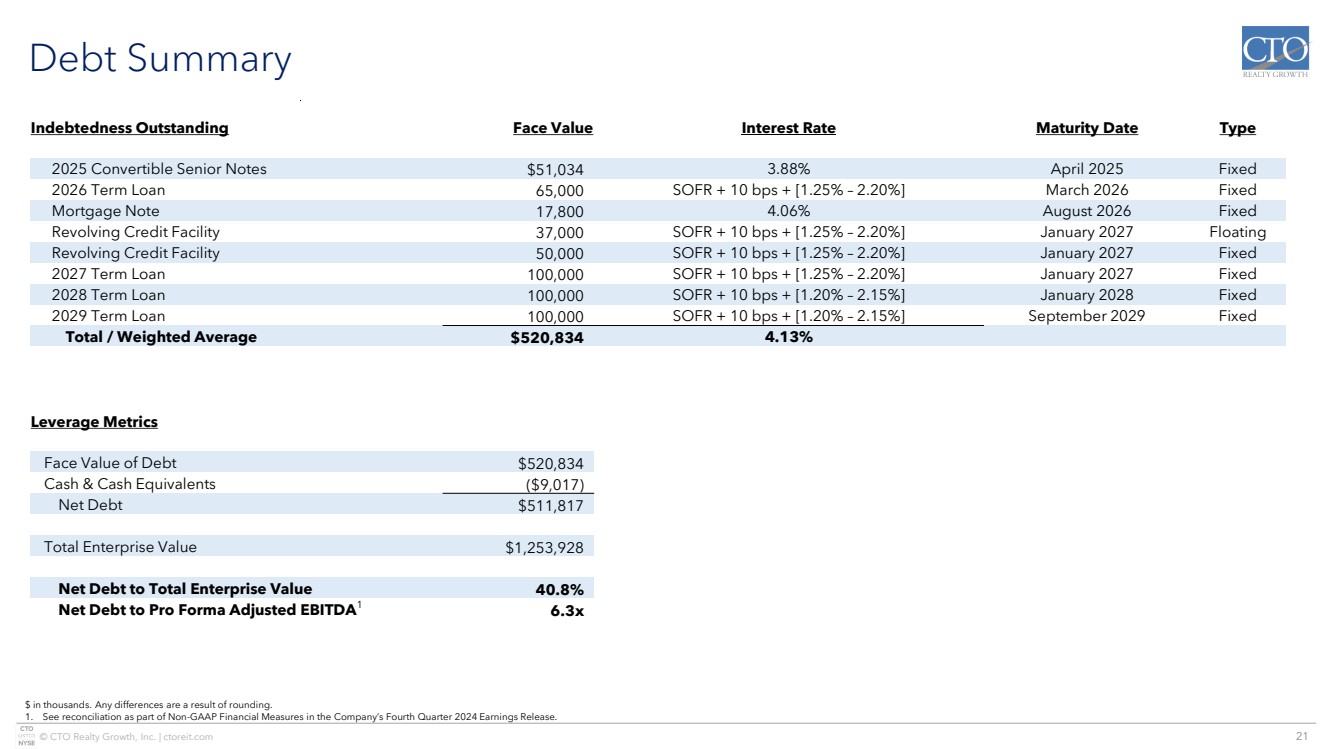
| © CTO Realty Growth, Inc. | ctoreit.com 21 Debt Summary $ in thousands. Any differences are a result of rounding. 1. See reconciliation as part of Non-GAAP Financial Measures in the Company’s Fourth Quarter 2024 Earnings Release. Indebtedness Outstanding Face Value Interest Rate Maturity Date Type 2025 Convertible Senior Notes $51,034 3.88% April 2025 Fixed 2026 Term Loan 65,000 SOFR + 10 bps + [1.25% – 2.20%] March 2026 Fixed Mortgage Note 17,800 4.06% August 2026 Fixed Revolving Credit Facility 37,000 SOFR + 10 bps + [1.25% – 2.20%] January 2027 Floating Revolving Credit Facility 50,000 SOFR + 10 bps + [1.25% – 2.20%] January 2027 Fixed 2027 Term Loan 100,000 SOFR + 10 bps + [1.25% – 2.20%] January 2027 Fixed 2028 Term Loan 100,000 SOFR + 10 bps + [1.20% – 2.15%] January 2028 Fixed 2029 Term Loan 100,000 SOFR + 10 bps + [1.20% – 2.15%] September 2029 Fixed Total / Weighted Average $520,834 4.13% Leverage Metrics Face Value of Debt $520,834 Cash & Cash Equivalents ($9,017) Net Debt $511,817 Total Enterprise Value $1,253,928 Net Debt to Total Enterprise Value 40.8% Net Debt to Pro Forma Adjusted EBITDA1 6.3x |
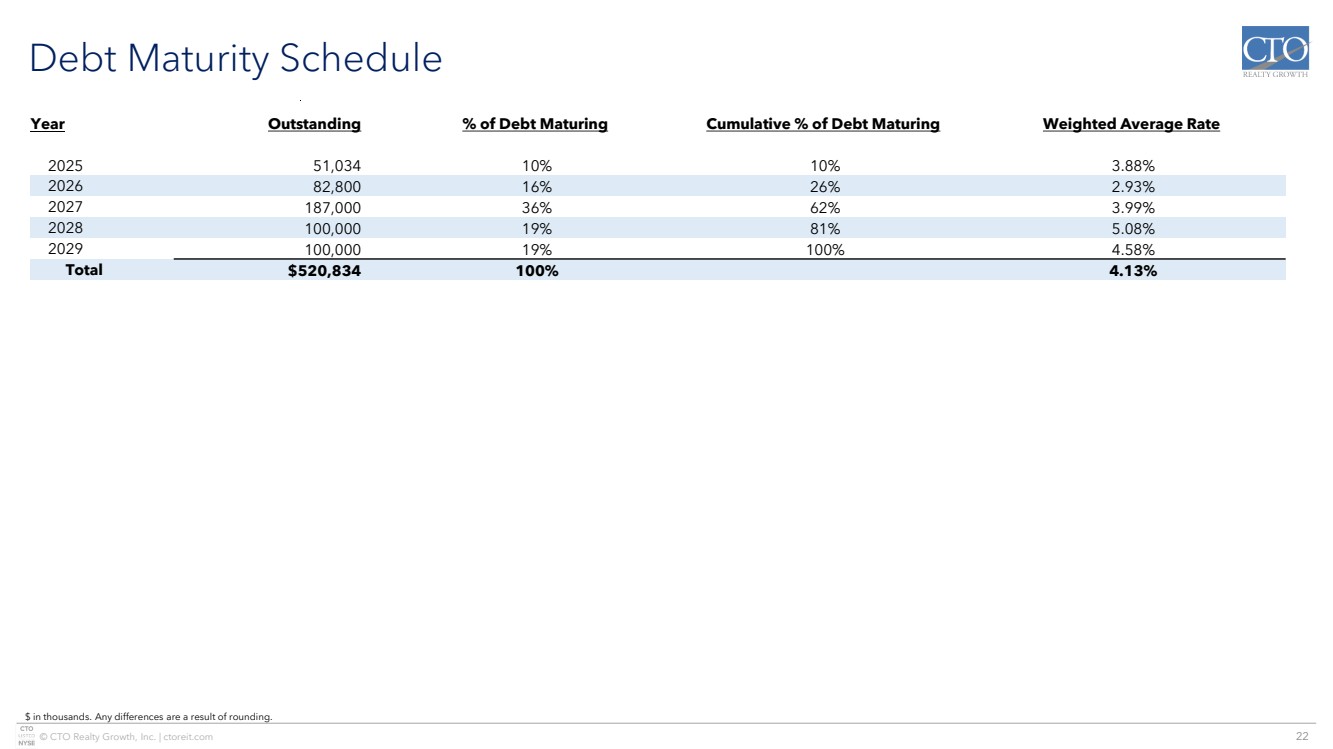
| © CTO Realty Growth, Inc. | ctoreit.com 22 Debt Maturity Schedule Year Outstanding % of Debt Maturing Cumulative % of Debt Maturing Weighted Average Rate 2025 51,034 10% 10% 3.88% 2026 82,800 16% 26% 2.93% 2027 187,000 36% 62% 3.99% 2028 100,000 19% 81% 5.08% 2029 100,000 19% 100% 4.58% Total $520,834 100% 4.13% $ in thousands. Any differences are a result of rounding. |
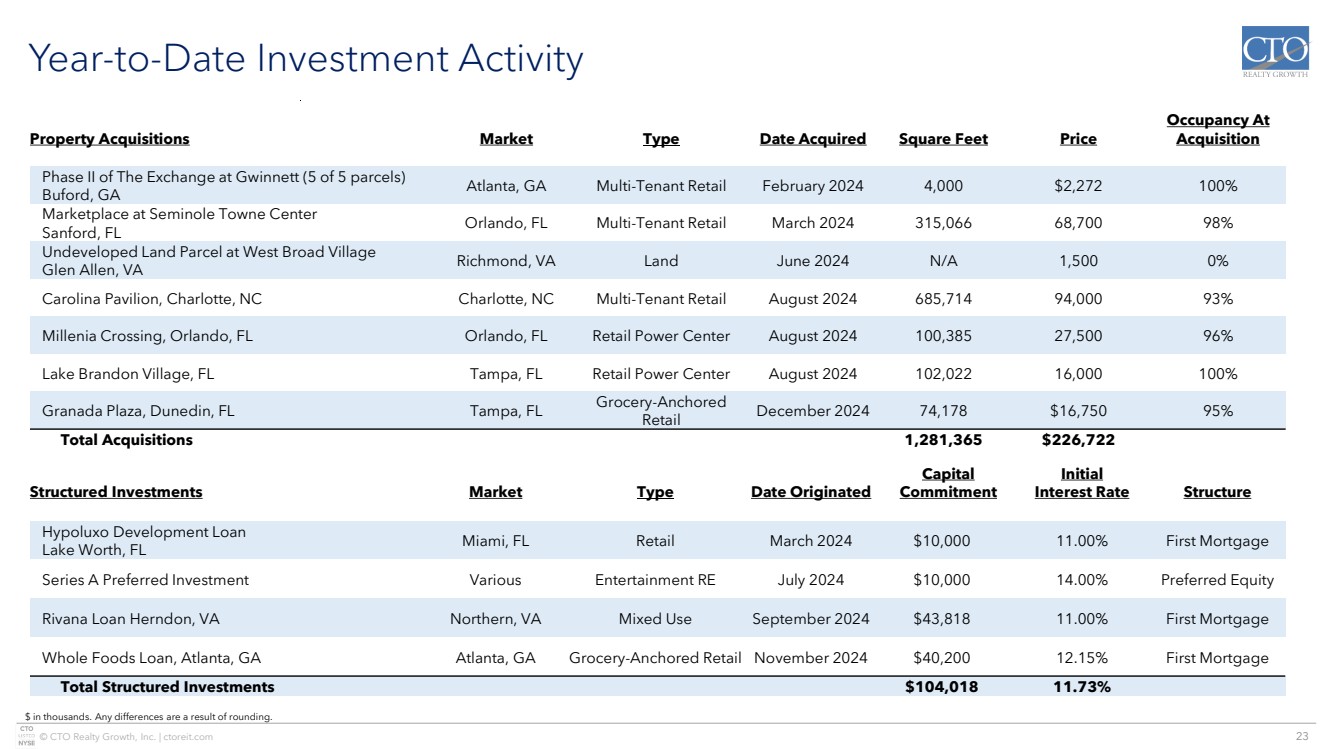
| © CTO Realty Growth, Inc. | ctoreit.com 23 Year-to-Date Investment Activity Property Acquisitions Market Type Date Acquired Square Feet Price Occupancy At Acquisition Phase II of The Exchange at Gwinnett (5 of 5 parcels) Buford, GA Atlanta, GA Multi-Tenant Retail February 2024 4,000 $2,272 100% Marketplace at Seminole Towne Center Sanford, FL Orlando, FL Multi-Tenant Retail March 2024 315,066 68,700 98% Undeveloped Land Parcel at West Broad Village Glen Allen, VA Richmond, VA Land June 2024 N/A 1,500 0% Carolina Pavilion, Charlotte, NC Charlotte, NC Multi-Tenant Retail August 2024 685,714 94,000 93% Millenia Crossing, Orlando, FL Orlando, FL Retail Power Center August 2024 100,385 27,500 96% Lake Brandon Village, FL Tampa, FL Retail Power Center August 2024 102,022 16,000 100% Granada Plaza, Dunedin, FL Tampa, FL Grocery-Anchored Retail December 2024 74,178 $16,750 95% Total Acquisitions 1,281,365 $226,722 Structured Investments Market Type Date Originated Capital Commitment Initial Interest Rate Structure Hypoluxo Development Loan Lake Worth, FL Miami, FL Retail March 2024 $10,000 11.00% First Mortgage Series A Preferred Investment Various Entertainment RE July 2024 $10,000 14.00% Preferred Equity Rivana Loan Herndon, VA Northern, VA Mixed Use September 2024 $43,818 11.00% First Mortgage Whole Foods Loan, Atlanta, GA Atlanta, GA Grocery-Anchored Retail November 2024 $40,200 12.15% First Mortgage Total Structured Investments $104,018 11.73% $ in thousands. Any differences are a result of rounding. |
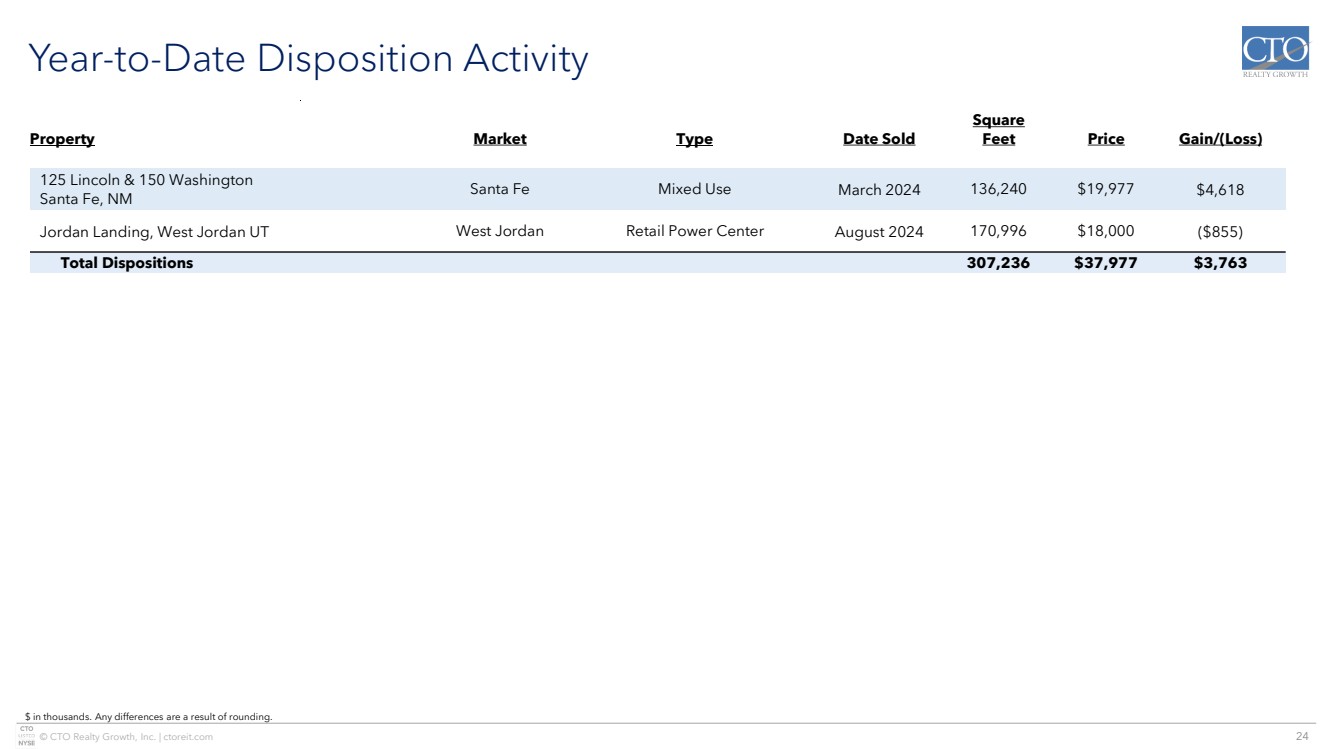
| © CTO Realty Growth, Inc. | ctoreit.com 24 Year-to-Date Disposition Activity Property Market Type Date Sold Square Feet Price Gain/(Loss) 125 Lincoln & 150 Washington Santa Fe, NM Santa Fe Mixed Use March 2024 136,240 $19,977 $4,618 Jordan Landing, West Jordan UT West Jordan Retail Power Center August 2024 170,996 $18,000 ($855) Total Dispositions 307,236 $37,977 $3,763 $ in thousands. Any differences are a result of rounding. |
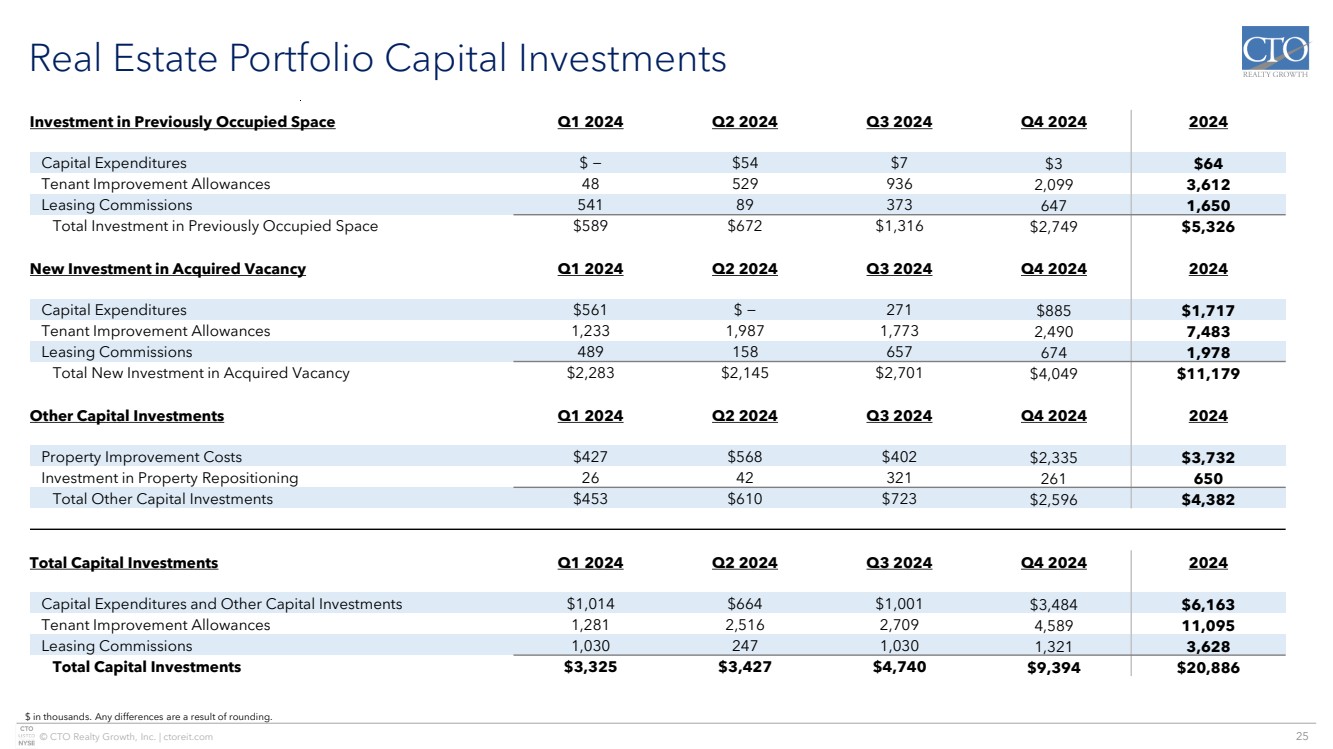
| © CTO Realty Growth, Inc. | ctoreit.com 25 Real Estate Portfolio Capital Investments Investment in Previously Occupied Space Q1 2024 Q2 2024 Q3 2024 Q4 2024 2024 Capital Expenditures $ − $54 $7 $3 $64 Tenant Improvement Allowances 48 529 936 2,099 3,612 Leasing Commissions 541 89 373 647 1,650 Total Investment in Previously Occupied Space $589 $672 $1,316 $2,749 $5,326 New Investment in Acquired Vacancy Q1 2024 Q2 2024 Q3 2024 Q4 2024 2024 Capital Expenditures $561 $ − 271 $885 $1,717 Tenant Improvement Allowances 1,233 1,987 1,773 2,490 7,483 Leasing Commissions 489 158 657 674 1,978 Total New Investment in Acquired Vacancy $2,283 $2,145 $2,701 $4,049 $11,179 Other Capital Investments Q1 2024 Q2 2024 Q3 2024 Q4 2024 2024 Property Improvement Costs $427 $568 $402 $2,335 $3,732 Investment in Property Repositioning 26 42 321 261 650 Total Other Capital Investments $453 $610 $723 $2,596 $4,382 Total Capital Investments Q1 2024 Q2 2024 Q3 2024 Q4 2024 2024 Capital Expenditures and Other Capital Investments $1,014 $664 $1,001 $3,484 $6,163 Tenant Improvement Allowances 1,281 2,516 2,709 4,589 11,095 Leasing Commissions 1,030 247 1,030 1,321 3,628 Total Capital Investments $3,325 $3,427 $4,740 $9,394 $20,886 $ in thousands. Any differences are a result of rounding. |
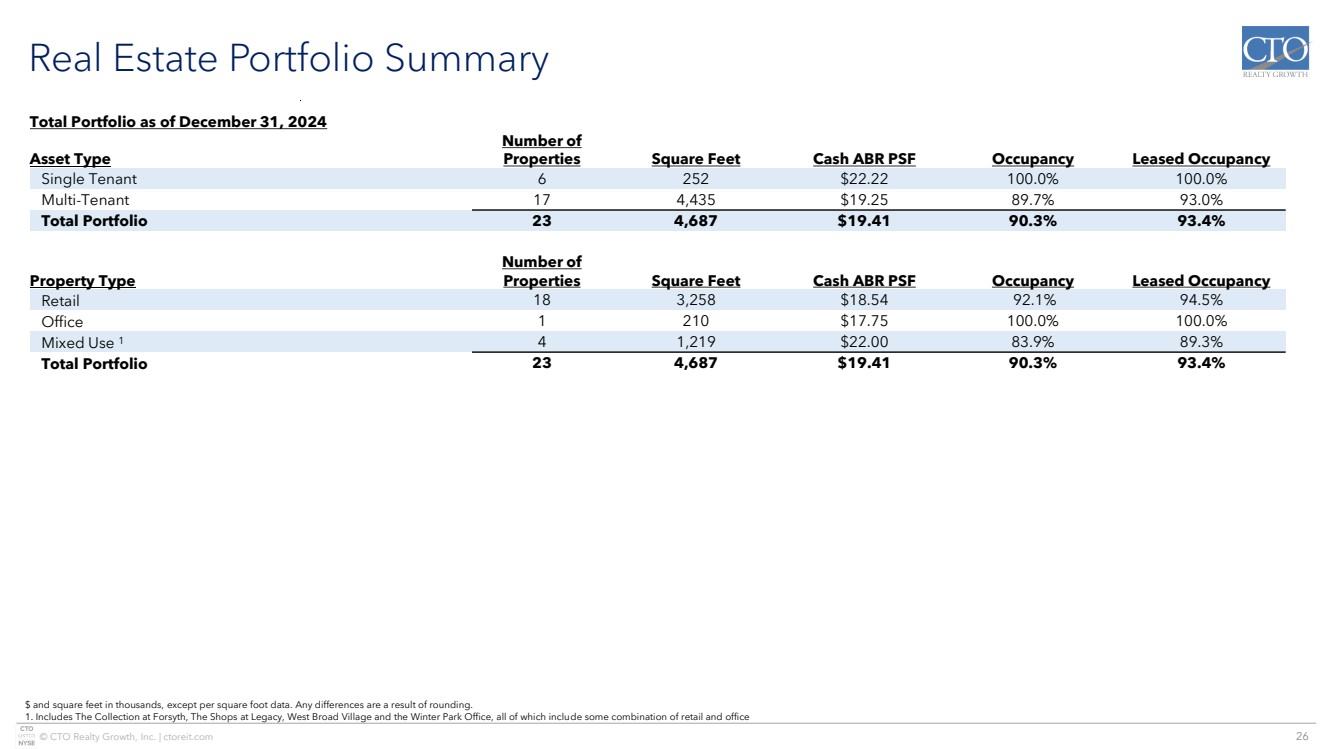
| © CTO Realty Growth, Inc. | ctoreit.com 26 Real Estate Portfolio Summary Total Portfolio as of December 31, 2024 Asset Type Number of Properties Square Feet Cash ABR PSF Occupancy Leased Occupancy Single Tenant 6 252 $22.22 100.0% 100.0% Multi-Tenant 17 4,435 $19.25 89.7% 93.0% Total Portfolio 23 4,687 $19.41 90.3% 93.4% Property Type Number of Properties Square Feet Cash ABR PSF Occupancy Leased Occupancy Retail 18 3,258 $18.54 92.1% 94.5% Office 1 210 $17.75 100.0% 100.0% Mixed Use 1 4 1,219 $22.00 83.9% 89.3% Total Portfolio 23 4,687 $19.41 90.3% 93.4% $ and square feet in thousands, except per square foot data. Any differences are a result of rounding. 1. Includes The Collection at Forsyth, The Shops at Legacy, West Broad Village and the Winter Park Office, all of which include some combination of retail and office |
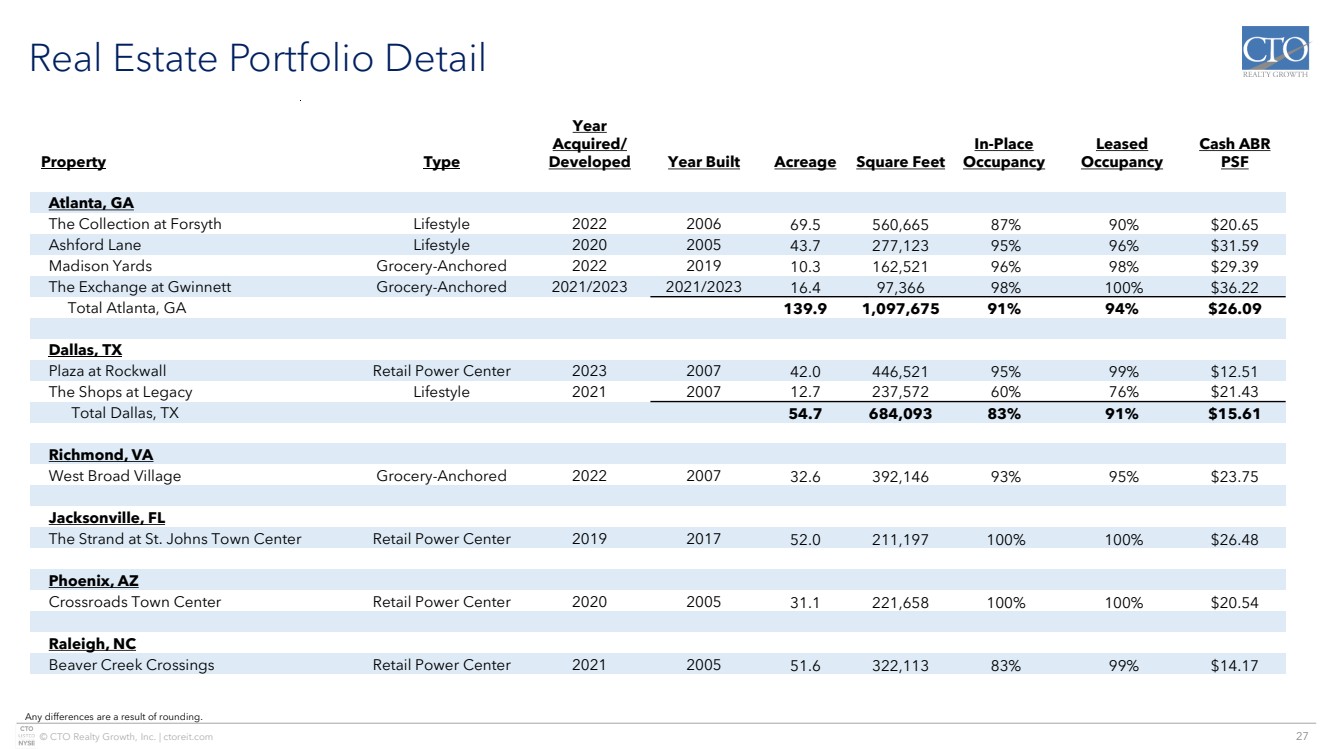
| © CTO Realty Growth, Inc. | ctoreit.com 27 Real Estate Portfolio Detail Property Type Year Acquired/ Developed Year Built Acreage Square Feet In-Place Occupancy Leased Occupancy Cash ABR PSF Atlanta, GA The Collection at Forsyth Lifestyle 2022 2006 69.5 560,665 87% 90% $20.65 Ashford Lane Lifestyle 2020 2005 43.7 277,123 95% 96% $31.59 Madison Yards Grocery-Anchored 2022 2019 10.3 162,521 96% 98% $29.39 The Exchange at Gwinnett Grocery-Anchored 2021/2023 2021/2023 16.4 97,366 98% 100% $36.22 Total Atlanta, GA 139.9 1,097,675 91% 94% $26.09 Dallas, TX Plaza at Rockwall Retail Power Center 2023 2007 42.0 446,521 95% 99% $12.51 The Shops at Legacy Lifestyle 2021 2007 12.7 237,572 60% 76% $21.43 Total Dallas, TX 54.7 684,093 83% 91% $15.61 Richmond, VA West Broad Village Grocery-Anchored 2022 2007 32.6 392,146 93% 95% $23.75 Jacksonville, FL The Strand at St. Johns Town Center Retail Power Center 2019 2017 52.0 211,197 100% 100% $26.48 Phoenix, AZ Crossroads Town Center Retail Power Center 2020 2005 31.1 221,658 100% 100% $20.54 Raleigh, NC Beaver Creek Crossings Retail Power Center 2021 2005 51.6 322,113 83% 99% $14.17 Any differences are a result of rounding. |
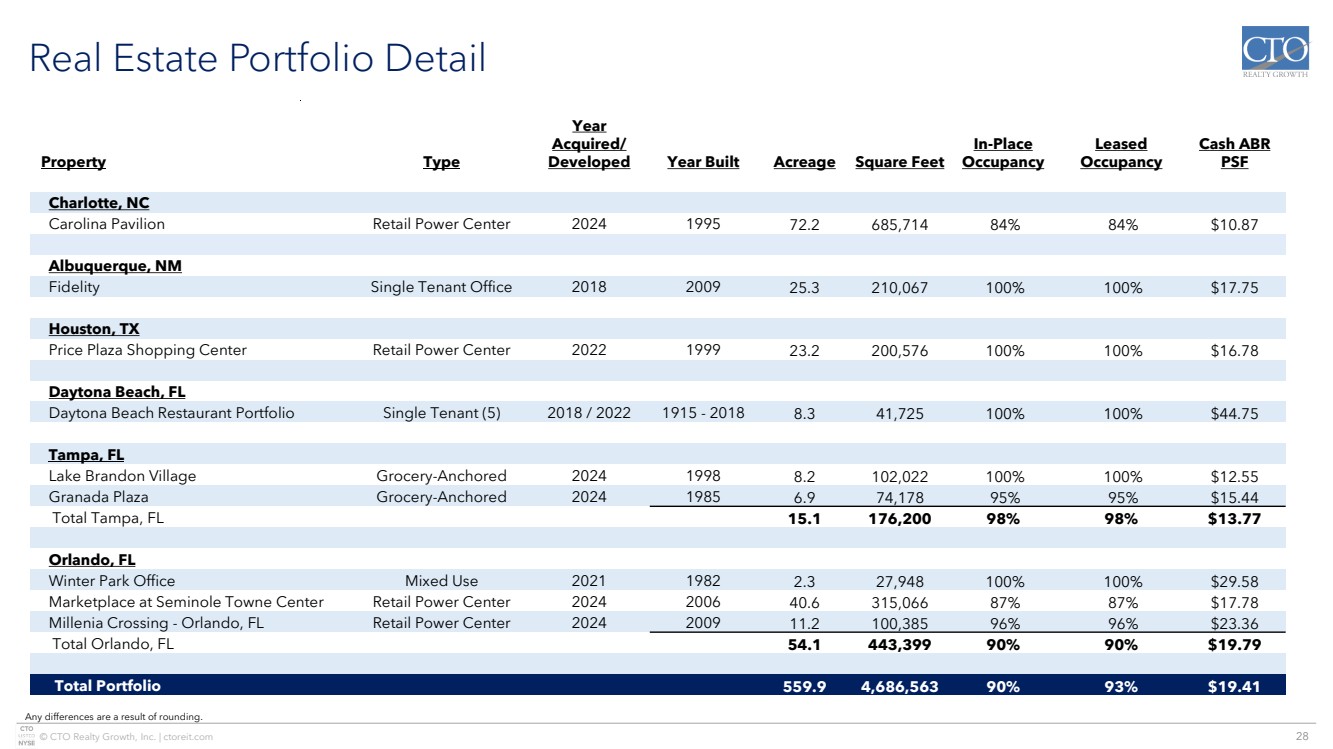
| © CTO Realty Growth, Inc. | ctoreit.com 28 Real Estate Portfolio Detail Property Type Year Acquired/ Developed Year Built Acreage Square Feet In-Place Occupancy Leased Occupancy Cash ABR PSF Charlotte, NC Carolina Pavilion Retail Power Center 2024 1995 72.2 685,714 84% 84% $10.87 Albuquerque, NM Fidelity Single Tenant Office 2018 2009 25.3 210,067 100% 100% $17.75 Houston, TX Price Plaza Shopping Center Retail Power Center 2022 1999 23.2 200,576 100% 100% $16.78 Daytona Beach, FL Daytona Beach Restaurant Portfolio Single Tenant (5) 2018 / 2022 1915 - 2018 8.3 41,725 100% 100% $44.75 Tampa, FL Lake Brandon Village Grocery-Anchored 2024 1998 8.2 102,022 100% 100% $12.55 Granada Plaza Grocery-Anchored 2024 1985 6.9 74,178 95% 95% $15.44 Total Tampa, FL 15.1 176,200 98% 98% $13.77 Orlando, FL Winter Park Office Mixed Use 2021 1982 2.3 27,948 100% 100% $29.58 Marketplace at Seminole Towne Center Retail Power Center 2024 2006 40.6 315,066 87% 87% $17.78 Millenia Crossing - Orlando, FL Retail Power Center 2024 2009 11.2 100,385 96% 96% $23.36 Total Orlando, FL 54.1 443,399 90% 90% $19.79 Total Portfolio 559.9 4,686,563 90% 93% $19.41 Any differences are a result of rounding. |
| © CTO Realty Growth, Inc. | ctoreit.com 29 Leasing Summary Renewals and Extensions Q1 2024 Q2 2024 Q3 2024 Q4 2024 2024 Leases 10 7 11 8 36 Square Feet 34 48 122 48 252 New Cash Rent PSF $29.26 $21.06 $18.04 $21.32 $20.76 Tenant Improvements $15 $10 $53 - $78 Leasing Commissions $40 $57 $36 $10 $143 Weighted Average Term 3.8 years 4.0 years 3.6 years 4.7 years 3.1 years New Leases Q1 2024 Q2 2024 Q3 2024 Q4 2024 2024 Leases 8 9 9 8 34 Square Feet 70 31 80 20 201 New Cash Rent PSF $26.09 $33.28 $25.96 $36.90 $28.22 Tenant Improvements $4,842 $865 $1,657 $763 $8,127 Leasing Commissions $1,133 $515 $1,273 $486 $3,407 Weighted Average Term 12.4 years 8.1 years 9.2 years 8.7 years 10.0 years All Leases Summary Q1 2024 Q2 2024 Q3 2024 Q4 2024 2024 Leases 18 16 20 16 70 Square Feet 104 79 202 68 452 New Cash Rent PSF $27.12 $25.87 $21.17 $25.90 $24.07 Tenant Improvements $4,857 $875 $1,710 $763 $8,205 Leasing Commissions $1,173 $573 $1,308 $496 $3,550 Weighted Average Term 9.4 years 6.0 years 6.3 years 6.4 years 8.4 years $ and square feet in thousands, except per square foot data. Any differences are a result of rounding. Overall leasing activity does not include lease termination agreements or lease amendments related to tenant bankruptcy proceedings. |
| © CTO Realty Growth, Inc. | ctoreit.com 30 Comparable Leasing Summary Renewals and Extensions - Comparable Number of Leases Signed GLA Signed New Cash Rent PSF Expiring Cash Rent PSF % Increase Over Expiring Rent Weighted Average Lease Term Tenant Improvements Lease Commissions 1st Quarter 2024 10 34 $29.26 $26.96 8.5% 3.8 years $15 $40 2nd Quarter 2024 7 48 $21.06 $20.83 1.1% 4.0 years $10 $57 3rd Quarter 2024 11 122 $18.04 $17.14 5.3% 3.6 years $54 $35 4th Quarter 2024 8 48 $21.32 $20.21 5.5% 4.7 years $- $10 Total / Wtd. Avg. 36 252 $20.76 $19.76 5.1% 3.9 years $78 $143 New Leases – Comparable Number of Leases Signed GLA Signed New Cash Rent PSF Expiring Cash Rent PSF % Increase Over Expiring Rent Weighted Average Lease Term Tenant Improvements Lease Commissions 1st Quarter 2024 5 61 $24.32 $9.08 167.9% 13.2 years $4,541 $914 2nd Quarter 2024 4 10 $33.99 $24.36 39.5% 9.2 years $206 $190 3rd Quarter 2024 5 26 $40.03 $30.83 29.8% 9.3 years $916 $709 4th Quarter 2024 2 4 $38.13 $30.50 25.0% 8.3 years $112 $103 Total / Wtd. Avg. 16 101 $29.88 $17.07 75.1% 11.2 years $5,775 $1,916 All Comparable Leases Summary Number of Leases Signed GLA Signed New Cash Rent PSF Expiring Cash Rent PSF % Increase Over Expiring Rent Weighted Average Lease Term Tenant Improvements Lease Commissions 1st Quarter 2024 15 95 $26.09 $15.51 68.2% 9.4 years $4,556 $955 2nd Quarter 2024 11 58 $23.34 $21.45 8.8% 5.3 years $216 $247 3rd Quarter 2024 16 148 $21.86 $19.52 12.0% 5.4 years $970 $744 4th Quarter 2024 10 52 $22.70 $21.06 7.8% 5.2 years $112 $113 Total / Wtd. Avg. 52 352 $23.36 $18.99 23.0% 7.7 years $5,854 $2,059 $ and square feet in thousands, except per square foot data. Any differences are a result of rounding. Comparable leases compare leases signed on a space for which there was previously a tenant. |
| © CTO Realty Growth, Inc. | ctoreit.com 31 Same-Property NOI Multi-Tenant Q1 2024 Q2 2024 Q3 2024 Q4 2024 2024 Number of Comparable Properties 12 12 12 12 11 Same-Property NOI – 2024 $13,966 $13,587 $15,457 $15,129 $54,689 Same-Property NOI – 2023 $13,305 $13,391 $14,439 $14,931 $52,450 $ Variance $661 $196 $1,018 $198 $2,239 % Variance 5.0% 1.5% 7.1% 1.3% 4.3% Single-Tenant Q1 2024 Q2 2024 Q3 2024 Q4 2024 2024 Number of Comparable Properties 6 6 6 6 6 Same-Property NOI – 2024 $1,148 $1,292 $1,339 $1,974 $5,752 Same-Property NOI – 2023 $949 $1,191 $1,365 $2,168 $5,673 $ Variance $199 $101 ($26) ($194) $79 % Variance 21.0% 8.5% (1.9%) (8.9%) 1.4% All Properties Q1 2024 Q2 2024 Q3 2024 Q4 2024 2024 Number of Comparable Properties 18 18 18 18 17 Same-Property NOI – 2024 $15,114 $14,879 $16,796 $17,103 $60,441 Same-Property NOI – 2023 $14,254 $14,582 $15,804 $17,099 $58,123 $ Variance $860 $297 $992 $4 $2,318 % Variance 6.0% 2.0% 6.3% 0.0% 4.0% $ and square feet in thousands, except per square foot data. Any differences are a result of rounding. |
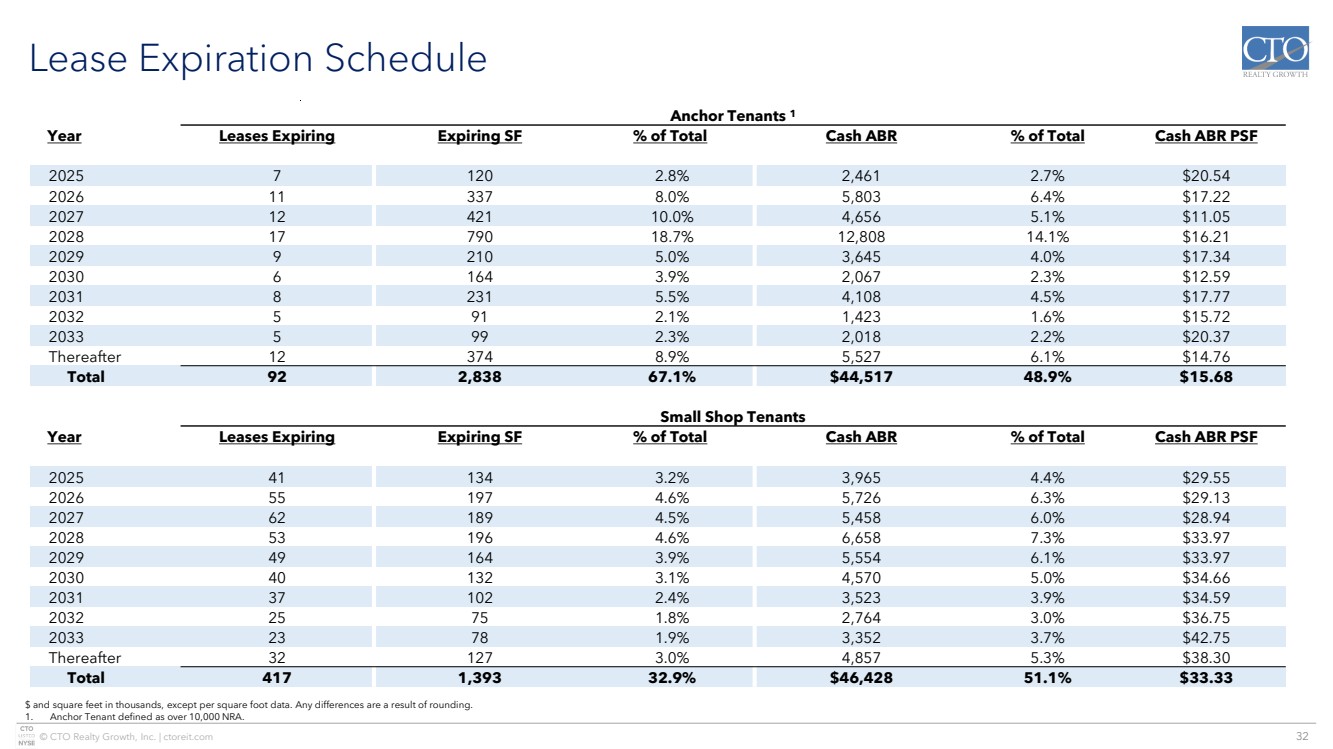
| © CTO Realty Growth, Inc. | ctoreit.com 32 Lease Expiration Schedule Anchor Tenants 1 Year Leases Expiring Expiring SF % of Total Cash ABR % of Total Cash ABR PSF 2025 7 120 2.8% 2,461 2.7% $20.54 2026 11 337 8.0% 5,803 6.4% $17.22 2027 12 421 10.0% 4,656 5.1% $11.05 2028 17 790 18.7% 12,808 14.1% $16.21 2029 9 210 5.0% 3,645 4.0% $17.34 2030 6 164 3.9% 2,067 2.3% $12.59 2031 8 231 5.5% 4,108 4.5% $17.77 2032 5 91 2.1% 1,423 1.6% $15.72 2033 5 99 2.3% 2,018 2.2% $20.37 Thereafter 12 374 8.9% 5,527 6.1% $14.76 Total 92 2,838 67.1% $44,517 48.9% $15.68 Small Shop Tenants Year Leases Expiring Expiring SF % of Total Cash ABR % of Total Cash ABR PSF 2025 41 134 3.2% 3,965 4.4% $29.55 2026 55 197 4.6% 5,726 6.3% $29.13 2027 62 189 4.5% 5,458 6.0% $28.94 2028 53 196 4.6% 6,658 7.3% $33.97 2029 49 164 3.9% 5,554 6.1% $33.97 2030 40 132 3.1% 4,570 5.0% $34.66 2031 37 102 2.4% 3,523 3.9% $34.59 2032 25 75 1.8% 2,764 3.0% $36.75 2033 23 78 1.9% 3,352 3.7% $42.75 Thereafter 32 127 3.0% 4,857 5.3% $38.30 Total 417 1,393 32.9% $46,428 51.1% $33.33 $ and square feet in thousands, except per square foot data. Any differences are a result of rounding. 1. Anchor Tenant defined as over 10,000 NRA. |
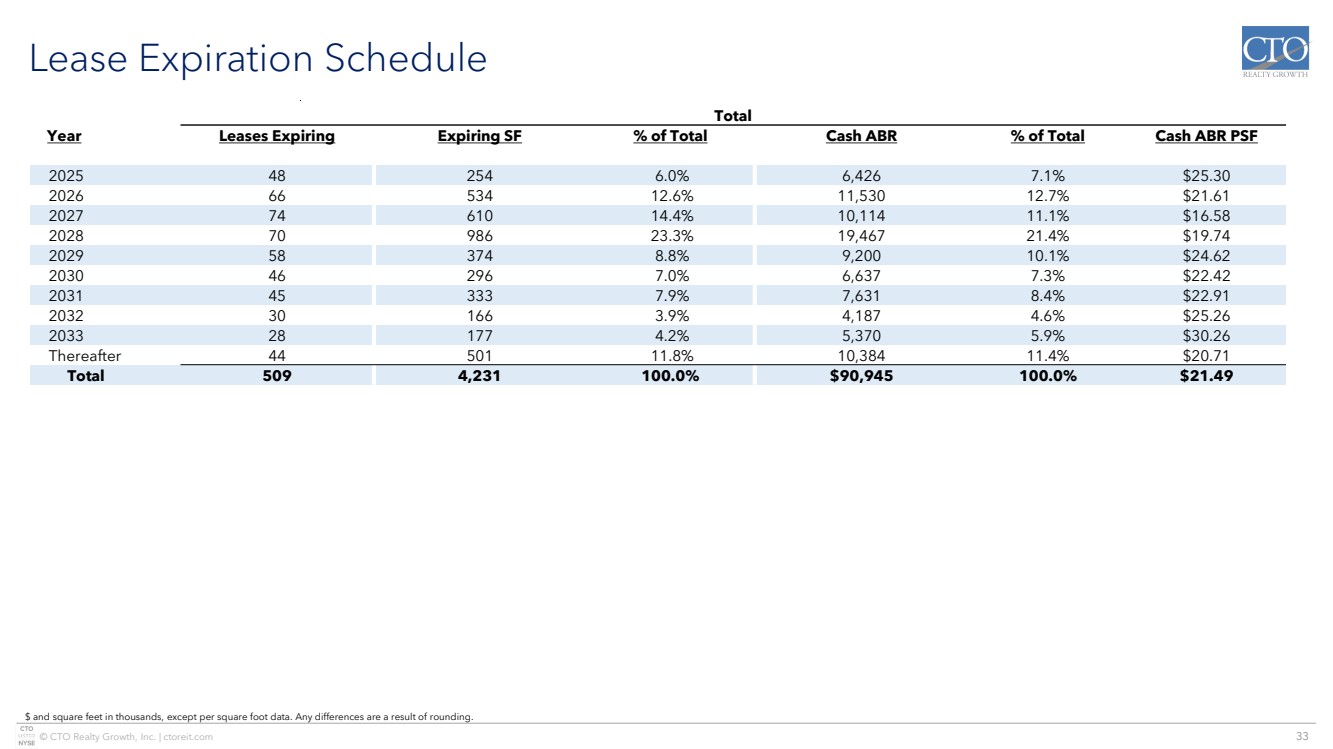
| © CTO Realty Growth, Inc. | ctoreit.com 33 Lease Expiration Schedule Total Year Leases Expiring Expiring SF % of Total Cash ABR % of Total Cash ABR PSF 2025 48 254 6.0% 6,426 7.1% $25.30 2026 66 534 12.6% 11,530 12.7% $21.61 2027 74 610 14.4% 10,114 11.1% $16.58 2028 70 986 23.3% 19,467 21.4% $19.74 2029 58 374 8.8% 9,200 10.1% $24.62 2030 46 296 7.0% 6,637 7.3% $22.42 2031 45 333 7.9% 7,631 8.4% $22.91 2032 30 166 3.9% 4,187 4.6% $25.26 2033 28 177 4.2% 5,370 5.9% $30.26 Thereafter 44 501 11.8% 10,384 11.4% $20.71 Total 509 4,231 100.0% $90,945 100.0% $21.49 $ and square feet in thousands, except per square foot data. Any differences are a result of rounding. |
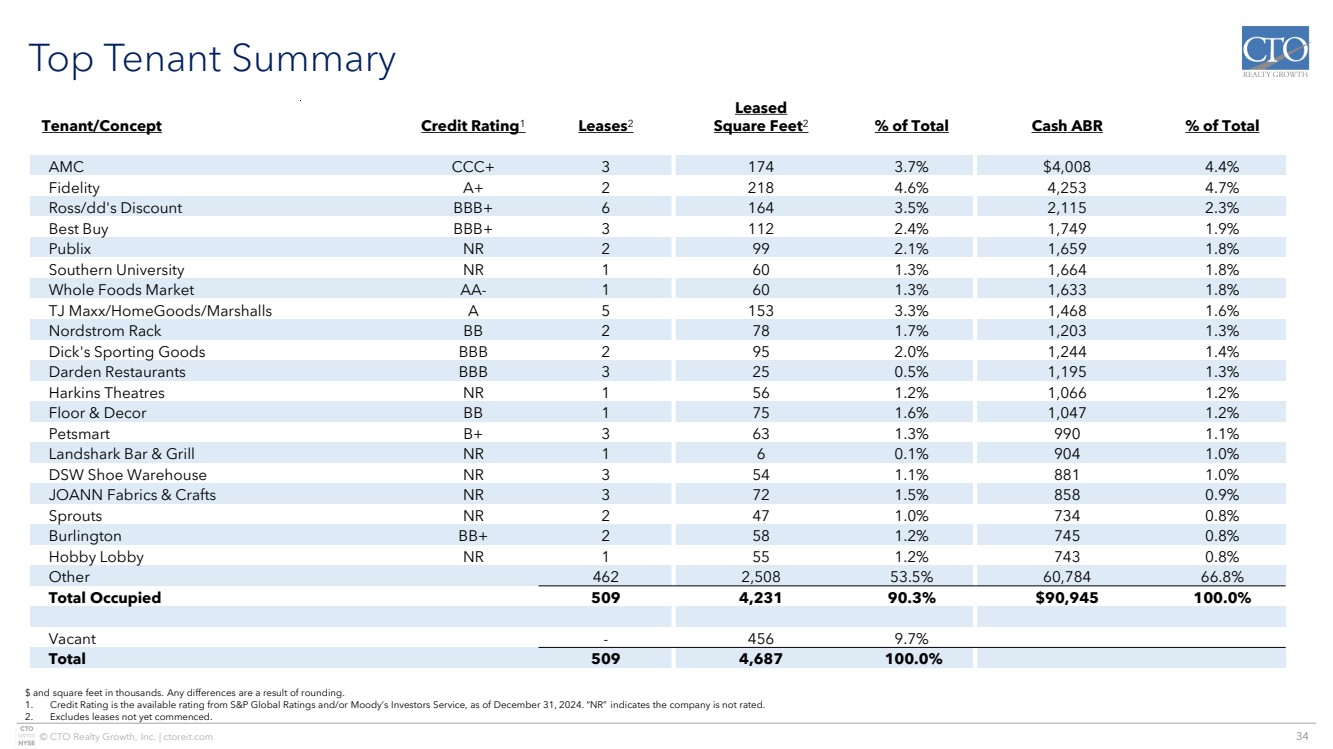
| © CTO Realty Growth, Inc. | ctoreit.com 34 Top Tenant Summary Tenant/Concept Credit Rating1 Leases2 Leased Square Feet2 % of Total Cash ABR % of Total AMC CCC+ 3 174 3.7% $4,008 4.4% Fidelity A+ 2 218 4.6% 4,253 4.7% Ross/dd's Discount BBB+ 6 164 3.5% 2,115 2.3% Best Buy BBB+ 3 112 2.4% 1,749 1.9% Publix NR 2 99 2.1% 1,659 1.8% Southern University NR 1 60 1.3% 1,664 1.8% Whole Foods Market AA- 1 60 1.3% 1,633 1.8% TJ Maxx/HomeGoods/Marshalls A 5 153 3.3% 1,468 1.6% Nordstrom Rack BB 2 78 1.7% 1,203 1.3% Dick's Sporting Goods BBB 2 95 2.0% 1,244 1.4% Darden Restaurants BBB 3 25 0.5% 1,195 1.3% Harkins Theatres NR 1 56 1.2% 1,066 1.2% Floor & Decor BB 1 75 1.6% 1,047 1.2% Petsmart B+ 3 63 1.3% 990 1.1% Landshark Bar & Grill NR 1 6 0.1% 904 1.0% DSW Shoe Warehouse NR 3 54 1.1% 881 1.0% JOANN Fabrics & Crafts NR 3 72 1.5% 858 0.9% Sprouts NR 2 47 1.0% 734 0.8% Burlington BB+ 2 58 1.2% 745 0.8% Hobby Lobby NR 1 55 1.2% 743 0.8% Other 462 2,508 53.5% 60,784 66.8% Total Occupied 509 4,231 90.3% $90,945 100.0% Vacant - 456 9.7% Total 509 4,687 100.0% $ and square feet in thousands. Any differences are a result of rounding. 1. Credit Rating is the available rating from S&P Global Ratings and/or Moody’s Investors Service, as of December 31, 2024. “NR” indicates the company is not rated. 2. Excludes leases not yet commenced. |
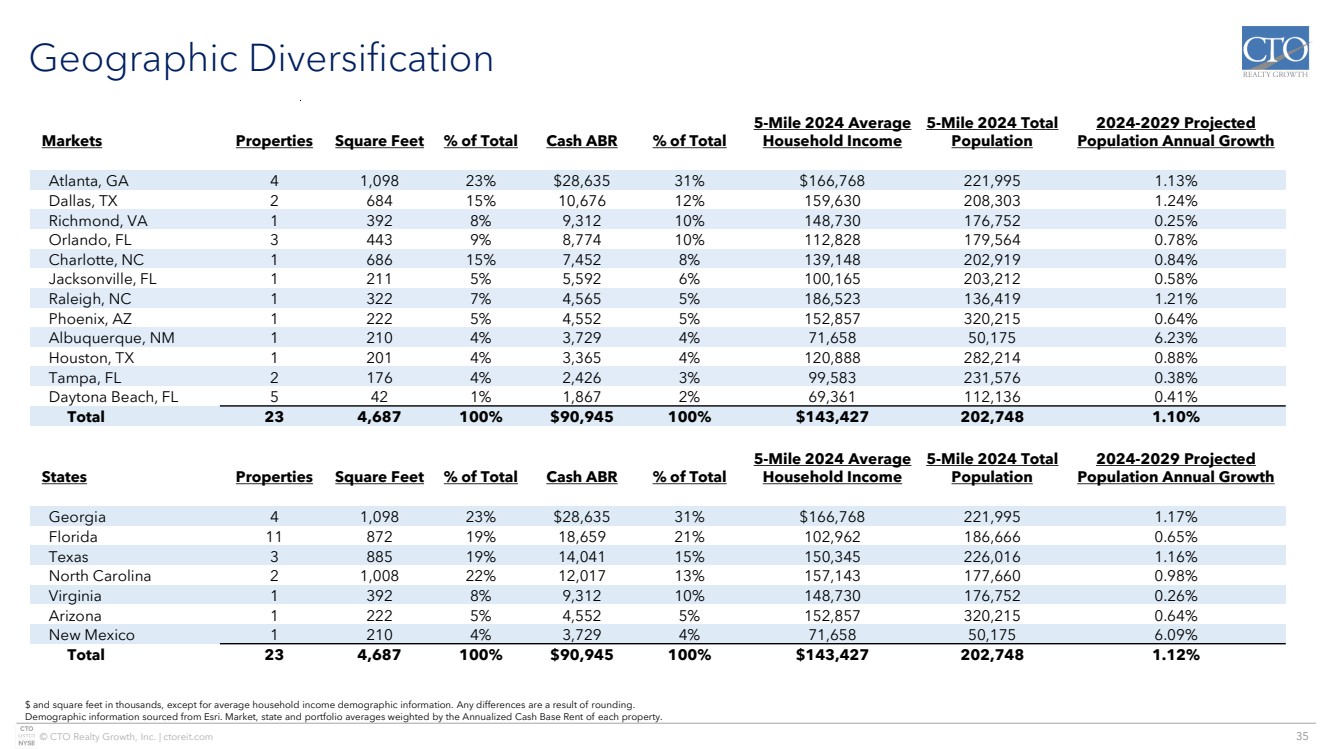
| © CTO Realty Growth, Inc. | ctoreit.com 35 Geographic Diversification Markets Properties Square Feet % of Total Cash ABR % of Total 5-Mile 2024 Average Household Income 5-Mile 2024 Total Population 2024-2029 Projected Population Annual Growth Atlanta, GA 4 1,098 23% $28,635 31% $166,768 221,995 1.13% Dallas, TX 2 684 15% 10,676 12% 159,630 208,303 1.24% Richmond, VA 1 392 8% 9,312 10% 148,730 176,752 0.25% Orlando, FL 3 443 9% 8,774 10% 112,828 179,564 0.78% Charlotte, NC 1 686 15% 7,452 8% 139,148 202,919 0.84% Jacksonville, FL 1 211 5% 5,592 6% 100,165 203,212 0.58% Raleigh, NC 1 322 7% 4,565 5% 186,523 136,419 1.21% Phoenix, AZ 1 222 5% 4,552 5% 152,857 320,215 0.64% Albuquerque, NM 1 210 4% 3,729 4% 71,658 50,175 6.23% Houston, TX 1 201 4% 3,365 4% 120,888 282,214 0.88% Tampa, FL 2 176 4% 2,426 3% 99,583 231,576 0.38% Daytona Beach, FL 5 42 1% 1,867 2% 69,361 112,136 0.41% Total 23 4,687 100% $90,945 100% $143,427 202,748 1.10% States Properties Square Feet % of Total Cash ABR % of Total 5-Mile 2024 Average Household Income 5-Mile 2024 Total Population 2024-2029 Projected Population Annual Growth Georgia 4 1,098 23% $28,635 31% $166,768 221,995 1.17% Florida 11 872 19% 18,659 21% 102,962 186,666 0.65% Texas 3 885 19% 14,041 15% 150,345 226,016 1.16% North Carolina 2 1,008 22% 12,017 13% 157,143 177,660 0.98% Virginia 1 392 8% 9,312 10% 148,730 176,752 0.26% Arizona 1 222 5% 4,552 5% 152,857 320,215 0.64% New Mexico 1 210 4% 3,729 4% 71,658 50,175 6.09% Total 23 4,687 100% $90,945 100% $143,427 202,748 1.12% $ and square feet in thousands, except for average household income demographic information. Any differences are a result of rounding. Demographic information sourced from Esri. Market, state and portfolio averages weighted by the Annualized Cash Base Rent of each property. |
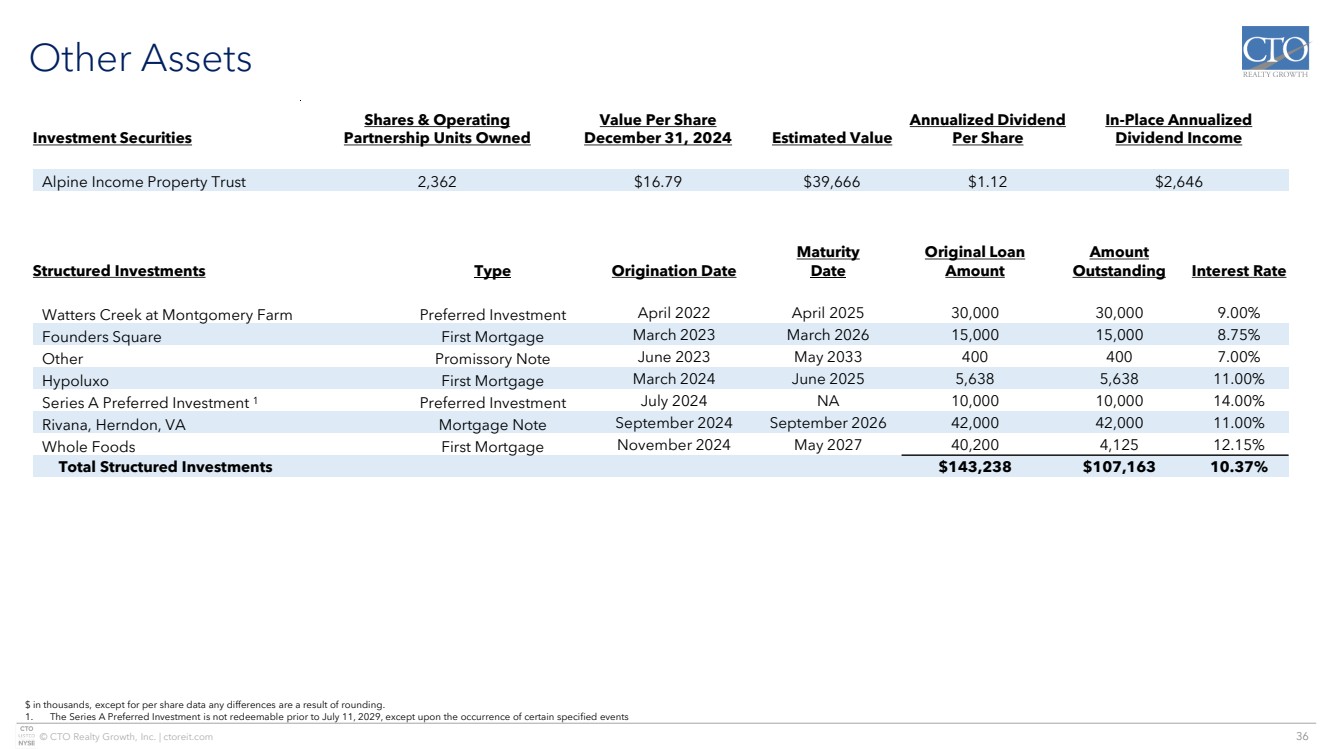
| © CTO Realty Growth, Inc. | ctoreit.com 36 Other Assets Investment Securities Shares & Operating Partnership Units Owned Value Per Share December 31, 2024 Estimated Value Annualized Dividend Per Share In-Place Annualized Dividend Income Alpine Income Property Trust 2,362 $16.79 $39,666 $1.12 $2,646 Structured Investments Type Origination Date Maturity Date Original Loan Amount Amount Outstanding Interest Rate Watters Creek at Montgomery Farm Preferred Investment April 2022 April 2025 30,000 30,000 9.00% Founders Square First Mortgage March 2023 March 2026 15,000 15,000 8.75% Other Promissory Note June 2023 May 2033 400 400 7.00% Hypoluxo First Mortgage March 2024 June 2025 5,638 5,638 11.00% Series A Preferred Investment 1 Preferred Investment July 2024 NA 10,000 10,000 14.00% Rivana, Herndon, VA Mortgage Note September 2024 September 2026 42,000 42,000 11.00% Whole Foods First Mortgage November 2024 May 2027 40,200 4,125 12.15% Total Structured Investments $143,238 $107,163 10.37% $ in thousands, except for per share data any differences are a result of rounding. 1. The Series A Preferred Investment is not redeemable prior to July 11, 2029, except upon the occurrence of certain specified events |
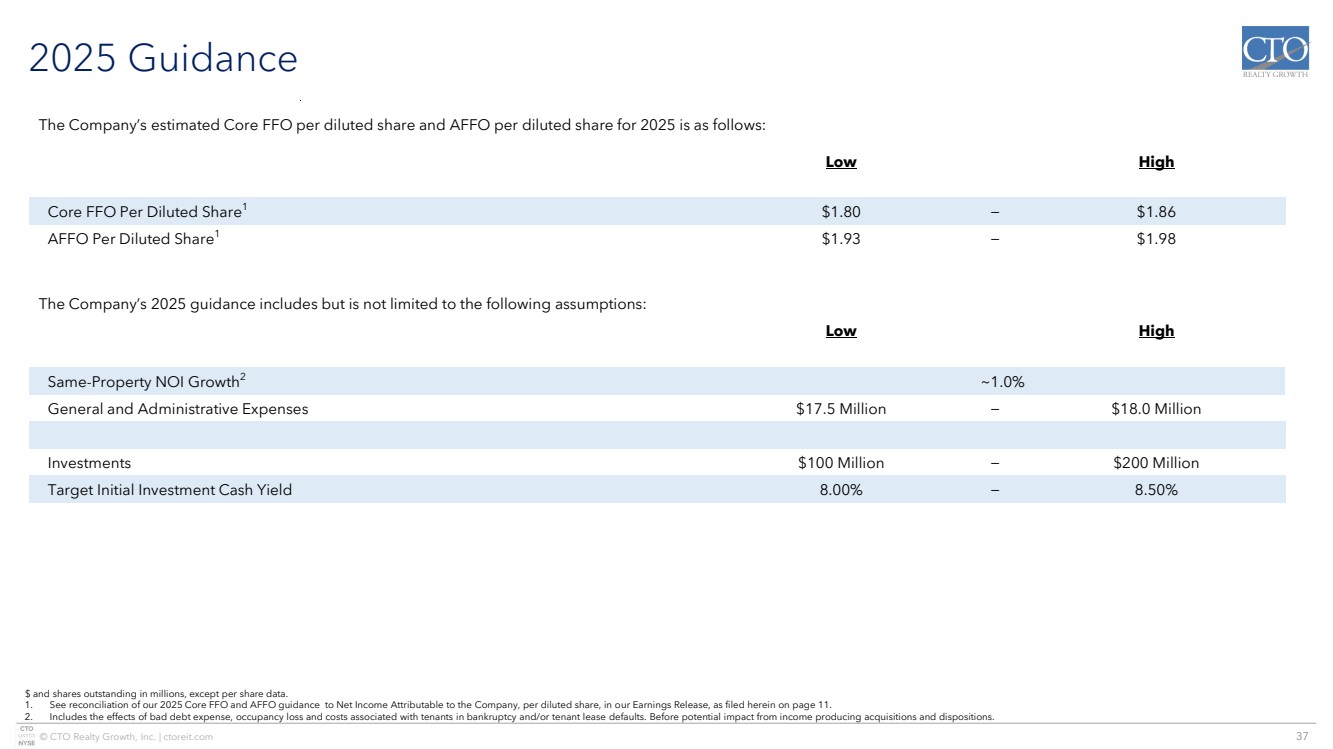
| © CTO Realty Growth, Inc. | ctoreit.com 37 2025 Guidance Low High Core FFO Per Diluted Share1 $1.80 − $1.86 AFFO Per Diluted Share1 $1.93 − $1.98 The Company’s estimated Core FFO per diluted share and AFFO per diluted share for 2025 is as follows: The Company’s 2025 guidance includes but is not limited to the following assumptions: Low High Same-Property NOI Growth2 ~1.0% General and Administrative Expenses $17.5 Million − $18.0 Million Investments $100 Million − $200 Million Target Initial Investment Cash Yield 8.00% − 8.50% $ and shares outstanding in millions, except per share data. 1. See reconciliation of our 2025 Core FFO and AFFO guidance to Net Income Attributable to the Company, per diluted share, in our Earnings Release, as filed herein on page 11. 2. Includes the effects of bad debt expense, occupancy loss and costs associated with tenants in bankruptcy and/or tenant lease defaults. Before potential impact from income producing acquisitions and dispositions. |
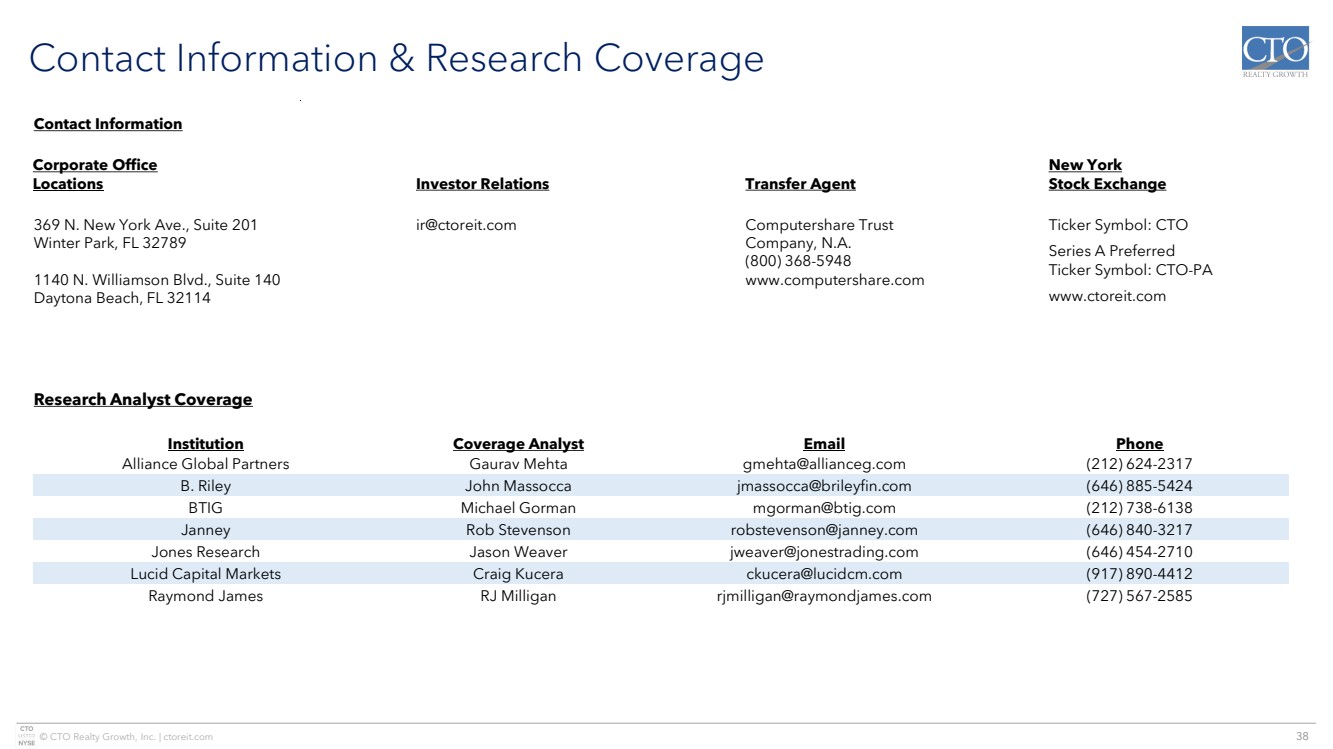
| © CTO Realty Growth, Inc. | ctoreit.com 38 Contact Information & Research Coverage Contact Information Corporate Office Locations Investor Relations Transfer Agent New York Stock Exchange 369 N. New York Ave., Suite 201 Winter Park, FL 32789 1140 N. Williamson Blvd., Suite 140 Daytona Beach, FL 32114 ir@ctoreit.com Computershare Trust Company, N.A. (800) 368-5948 www.computershare.com Ticker Symbol: CTO Series A Preferred Ticker Symbol: CTO-PA www.ctoreit.com Research Analyst Coverage Institution Coverage Analyst Email Phone Alliance Global Partners Gaurav Mehta gmehta@allianceg.com (212) 624-2317 B. Riley John Massocca jmassocca@brileyfin.com (646) 885-5424 BTIG Michael Gorman mgorman@btig.com (212) 738-6138 Janney Rob Stevenson robstevenson@janney.com (646) 840-3217 Jones Research Jason Weaver jweaver@jonestrading.com (646) 454-2710 Lucid Capital Markets Craig Kucera ckucera@lucidcm.com (917) 890-4412 Raymond James RJ Milligan rjmilligan@raymondjames.com (727) 567-2585 |
| © CTO Realty Growth, Inc. | ctoreit.com 39 Safe Harbor Certain statements contained in this presentation (other than statements of historical fact) are forward-looking statements within the meaning of Section 27A of the Securities Act of 1933, as amended, and Section 21E of the Securities Exchange Act of 1934, as amended. Forward-looking statements can typically be identified by words such as “believe,” “estimate,” “expect,” “intend,” “anticipate,” “will,” “could,” “may,” “should,” “plan,” “potential,” “predict,” “forecast,” “project,” and similar expressions, as well as variations or negatives of these words. Although forward-looking statements are made based upon management’s present expectations and beliefs concerning future developments and their potential effect upon the Company, a number of factors could cause the Company’s actual results to differ materially from those set forth in the forward-looking statements. Such factors may include, but are not limited to: the Company’s ability to remain qualified as a REIT; the Company’s exposure to U.S. federal and state income tax law changes, including changes to the REIT requirements; general adverse economic and real estate conditions; macroeconomic and geopolitical factors, including but not limited to inflationary pressures, interest rate volatility, distress in the banking sector, global supply chain disruptions, and ongoing geopolitical war; credit risk associated with the Company investing in structured investments; the ultimate geographic spread, severity and duration of pandemics such as the COVID-19 Pandemic and its variants, actions that may be taken by governmental authorities to contain or address the impact of such pandemics, and the potential negative impacts of such pandemics on the global economy and the Company’s financial condition and results of operations; the inability of major tenants to continue paying their rent or obligations due to bankruptcy, insolvency or a general downturn in their business; the loss or failure, or decline in the business or assets of PINE; the completion of 1031 exchange transactions; the availability of investment properties that meet the Company’s investment goals and criteria; the uncertainties associated with obtaining required governmental permits and satisfying other closing conditions for planned acquisitions and sales; and the uncertainties and risk factors discussed in the Company’s Annual Report on Form 10-K for the fiscal year ended December 31, 2024 and other risks and uncertainties discussed from time to time in the Company’s filings with the U.S. Securities and Exchange Commission. There can be no assurance that future developments will be in accordance with management’s expectations or that the effect of future developments on the Company will be those anticipated by management. Readers are cautioned not to place undue reliance on these forward-looking statements, which speak only as of the date of this presentation. The Company undertakes no obligation to update the information contained in this presentation to reflect subsequently occurring events or circumstances. |
| © CTO Realty Growth, Inc. | ctoreit.com 40 Non-GAAP Financial Measures Our reported results are presented in accordance with accounting principles generally accepted in the United States of America (“GAAP”). We also disclose Funds From Operations (“FFO”), Core Funds From Operations (“Core FFO”), Adjusted Funds From Operations (“AFFO”), Pro Forma Earnings Before Interest, Taxes, Depreciation and Amortization (“Pro Forma Adjusted EBITDA”), and Same-Property Net Operating Income (“Same-Property NOI”), each of which are non-GAAP financial measures. We believe these non-GAAP financial measures are useful to investors because they are widely accepted industry measures used by analysts and investors to compare the operating performance of REITs. FFO, Core FFO, AFFO, Pro Forma Adjusted EBITDA, and Same-Property NOI do not represent cash generated from operating activities and are not necessarily indicative of cash available to fund cash requirements; accordingly, they should not be considered alternatives to net income as a performance measure or cash flows from operating activities as reported on our statement of cash flows as a liquidity measure and should be considered in addition to, and not in lieu of, GAAP financial measures. We compute FFO in accordance with the definition adopted by the Board of Governors of the National Association of Real Estate Investment Trusts, or NAREIT. NAREIT defines FFO as GAAP net income or loss adjusted to exclude real estate related depreciation and amortization, as well as extraordinary items (as defined by GAAP) such as net gain or loss from sales of depreciable real estate assets, impairment write-downs associated with depreciable real estate assets and impairments associated with the implementation of current expected credit losses on commercial loans and investments at the time of origination, including the pro rata share of such adjustments of unconsolidated subsidiaries. The Company also excludes the gains or losses from sales of assets incidental to the primary business of the REIT which specifically include the sales of mitigation credits, subsurface sales, investment securities, and land sales, in addition to the mark-to-market of the Company’s investment securities and interest related to the 2025 Convertible Senior Notes, if the effect is dilutive. To derive Core FFO, we modify the NAREIT computation of FFO to include other adjustments to GAAP net income related to gains and losses recognized on the extinguishment of debt, amortization of above- and below-market lease related intangibles, and other unforecastable market- or transaction-driven non-cash items, as well as adding back the interest related to the 2025 Convertible Senior Notes, if the effect is dilutive. To derive AFFO, we further modify the NAREIT computation of FFO and Core FFO to include other adjustments to GAAP net income related to non-cash revenues and expenses such as straight-line rental revenue, non-cash compensation, and other non-cash amortization. Such items may cause short-term fluctuations in net income but have no impact on operating cash flows or long-term operating performance. We use AFFO as one measure of our performance when we formulate corporate goals. To derive Pro Forma Adjusted EBITDA, GAAP net income or loss attributable to the Company is adjusted to exclude real estate related depreciation and amortization, as well as extraordinary items (as defined by GAAP) such as net gain or loss from sales of depreciable real estate assets, impairment write-downs associated with depreciable real estate assets, impairments associated with the implementation of current expected credit losses on commercial loans and investments at the time of origination, including the pro rata share of such adjustments of unconsolidated subsidiaries, non-cash revenues and expenses such as straight-line rental revenue, amortization of deferred financing costs, above- and below-market lease related intangibles, non-cash compensation, other non-recurring items such as termination fees, forfeitures of tenant security deposits, and certain adjustments to reconciliation estimates related to reimbursable revenue for recently acquired properties, and other non-cash income or expense. The Company also excludes the gains or losses from sales of assets incidental to the primary business of the REIT which specifically include the sales of mitigation credits, subsurface sales, investment securities, and land sales, in addition to the mark-to-market of the Company’s investment securities. Cash interest expense is also excluded from Pro Forma Adjusted EBITDA, and GAAP net income or loss is adjusted for the annualized impact of acquisitions, dispositions and other similar activities. |
| © CTO Realty Growth, Inc. | ctoreit.com 41 Non-GAAP Financial Measures (Continued) To derive Same-Property NOI, GAAP net income or loss attributable to the Company is adjusted to exclude real estate related depreciation and amortization, as well as extraordinary items (as defined by GAAP) such as net gain or loss from sales of depreciable real estate assets, impairment write-downs associated with depreciable real estate assets, impairments associated with the implementation of current expected credit losses on commercial loans and investments at the time of origination, including the pro rata share of such adjustments of unconsolidated subsidiaries, non-cash revenues and expenses such as straight-line rental revenue, amortization of deferred financing costs, above- and below-market lease related intangibles, non-cash compensation, other non-recurring items such as termination fees, forfeitures of tenant security deposits, and certain adjustments to reconciliation estimates related to reimbursable revenue for recently acquired properties, and other non-cash income or expense. Interest expense, general and administrative expenses, investment and other income or loss, income tax benefit or expense, real estate operations revenues and direct cost of revenues, management fee income, and interest income from commercial loans and investments are also excluded from Same-Property NOI. GAAP net income or loss is further adjusted to remove the impact of properties that were not owned for the full current and prior year reporting periods presented. Cash rental income received under the leases pertaining to the Company’s assets that are presented as commercial loans and investments in accordance with GAAP is also used in lieu of the interest income equivalent. FFO is used by management, investors and analysts to facilitate meaningful comparisons of operating performance between periods and among our peers primarily because it excludes the effect of real estate depreciation and amortization and net gains or losses on sales, which are based on historical costs and implicitly assume that the value of real estate diminishes predictably over time, rather than fluctuating based on existing market conditions. We believe that Core FFO and AFFO are additional useful supplemental measures for investors to consider because they will help them to better assess our operating performance without the distortions created by other non-cash revenues or expenses. We also believe that Pro Forma Adjusted EBITDA is an additional useful supplemental measure for investors to consider as it allows for a better assessment of our operating performance without the distortions created by other non-cash revenues, expenses or certain effects of the Company’s capital structure on our operating performance. We use Same-Property NOI to compare the operating performance of our assets between periods. It is an accepted and important measurement used by management, investors and analysts because it includes all property-level revenues from the Company’s properties, less operating and maintenance expenses, real estate taxes and other property-specific expenses (“Net Operating Income” or “NOI”) of properties that have been owned and stabilized for the entire current and prior year reporting periods. Same-Property NOI attempts to eliminate differences due to the acquisition or disposition of properties during the particular period presented, and therefore provides a more comparable and consistent performance measure for the comparison of the Company’s properties. FFO, Core FFO, AFFO, Pro Forma Adjusted EBITDA, and Same-Property NOI may not be comparable to similarly titled measures employed by other companies. |
| © CTO Realty Growth, Inc. | ctoreit.com 42 Definitions & Terms References and terms used in this presentation that are in addition to terms defined in the Non-GAAP Financial Measures include: ▪ This presentation was published on February 20, 2025. ▪ All information is as of December 31, 2024, unless otherwise noted. ▪ Any calculation differences are assumed to be a result of rounding. ▪ “2025 Guidance” in this presentation is based on the 2025 Guidance provided in the Company’s Fourth Quarter 2024 Operating Results press release filed on February 20, 2025. ▪ “Alpine” or “PINE” refers to Alpine Income Property Trust, a publicly traded net lease REIT traded on the New York Stock Exchange under the ticker symbol PINE. ▪ “Annualized Base Rent”, “ABR” or “Rent” and the statistics based on ABR are calculated based on our current portfolio and represent straight-line rent calculated in accordance with GAAP. ▪ “Annualized Cash Base Rent”, “Cash ABR” and the statistics based on Cash ABR are calculated based on our current portfolio and represent the annualized cash base rent calculated in accordance with GAAP due from the tenants at a specific point in time. ▪ “Credit Rated” is a tenant or the parent of a tenant with a credit rating from S&P Global Ratings, Moody’s Investors Service, Fitch Ratings or the National Association of Insurance Commissioners (NAIC) (together, the “Major Rating Agencies”). The Company defines an Investment Grade Rated Tenant as a tenant or the parent of a tenant with a credit rating from S&P Global Ratings, Moody’s Investors Service, Fitch Ratings or the National Association of Insurance Commissioners of Baa3, BBB-, or NAIC-2 or higher. If applicable, in the event of a split rating between S&P Global Ratings and Moody’s Investors Services, the Company utilizes the higher of the two ratings as its reference point as to whether a tenant is defined as an Investment Grade Rated Tenant. ▪ “Dividend” or “Dividends”, subject to the required dividends to maintain our qualification as a REIT, are set by the Board of Directors and declared on a quarterly basis and there can be no assurances as to the likelihood or number of dividends in the future. ▪ “Investment in Alpine Income Property Trust” or “Alpine Investment” or “PINE Ownership” is calculated based on the 2,362,475 common shares and partnership units CTO owns in PINE and is based on PINE’s closing stock price as of the referenced period on the respective slide. ▪ “Leased Occupancy” refers to space that is currently leased but for which rent payments have not yet commenced. ▪ “MSA” or “Metropolitan Statistical Area” is a region that consists of a city and surrounding communities that are linked by social and economic factors, as established by the U.S. Office of Management and Budget. The names of the MSA have been shortened for ease of reference. ▪ “Net Debt” is calculated as our total long-term debt as presented on the face of our balance sheet; plus financing costs, net of accumulated amortization and unamortized convertible debt discount; less cash, restricted cash and cash equivalents. ▪ “Net Operating Income” or “NOI” is revenues from all income properties less operating expense, maintenance expense, real estate taxes and rent expense. ▪ “Total Enterprise Value” is calculated as the Company’s Total Common Shares Outstanding multiplied by the common stock price; plus the par value of the Series A perpetual preferred equity outstanding and Net Debt. |