UNITED STATES
SECURITIES AND EXCHANGE COMMISSION
WASHINGTON D.C. 20549
FORM 10-K
☒ ANNUAL REPORT PURSUANT TO SECTION 13 or 15(d) OF THE SECURITIES EXCHANGE ACT OF 1934
For the fiscal year ended December 31, 2023
or
☐ TRANSITION REPORT PURSUANT TO SECTION 13 or 15(d) OF THE SECURITIES EXCHANGE ACT OF 1934
COMMISSION FILE NUMBER: 000-16509
CITIZENS, INC.
(Exact name of registrant as specified in its charter)
| | | | | | | | |
| Colorado | | 84-0755371 |
| (State or other jurisdiction of incorporation or organization) | | (I.R.S. employer identification no.) |
11815 Alterra Pkwy, Suite 1500, Austin, TX 78758
(Address of principal executive offices) (Zip Code)
Registrant's telephone number, including area code (512) 837-7100
| | | | | | | | |
| Securities registered pursuant to Section 12(b) of the Act |
|
| Class A Common Stock | CIA | New York Stock Exchange |
| (Title of each class) | (Trading symbol(s)) | (Name of each exchange on which registered) |
Securities registered pursuant to Section 12(g) of the Act
None
(Title of class)
Indicate by check mark if the registrant is a well-known seasoned issuer, as defined in Rule 405 of the Securities Act. ☐ Yes ☒ No
Indicate by check mark if the registrant is not required to file reports pursuant to Section 13 or Section 15(d) of the Act. ☐ Yes ☒ No
Indicate by check mark whether the registrant (1) has filed all reports required to be filed by Section 13 or 15(d) of the Securities Exchange Act of 1934 during the preceding 12 months (or for such shorter period that the registrant was required to file such reports), and (2) has been subject to such filing requirements for the past 90 days. ☒ Yes ☐ No
Indicate by check mark whether the registrant has submitted electronically every Interactive Data File required to be submitted pursuant to Rule 405 of Regulation S-T (§232.405 of this chapter) during the preceding 12 months (or for such shorter period that the registrant was required to submit such files). ☒ Yes ☐ No
Indicate by check mark whether the registrant is a large accelerated filer, an accelerated filer, a non-accelerated filer, a smaller reporting company or an emerging growth company. See the definitions of "large accelerated filer," "accelerated filer," "smaller reporting company," and "emerging growth company" in Rule 12b-2 of the Exchange Act:
| | | | | | | | | | | | | | | | | | | | | | | | | | | | | | | | | | | | | | | | | | | | | | | |
| Large accelerated filer | ☐ | | Accelerated filer | ☒ | | Non-accelerated filer | ☐ | | Smaller reporting company | ☒ | | Emerging growth company | ☐ | |
If an emerging growth company, indicate by check mark if the registrant has elected not to use the extended transition period for complying with any new or revised financial accounting standards provided pursuant to Section 13(a) of the Exchange Act. ☐
Indicate by check mark whether the registrant has filed a report on and attestation to its management’s assessment of the effectiveness of its internal control over financial reporting under Section 404(b) of the Sarbanes-Oxley Act (15 U.S.C. 7262(b)) by the registered public accounting firm that prepared or issued its audit report. ☒
If securities are registered pursuant to Section 12(b) of the Act, indicate by check mark whether the financial statements of the registrant included in the filing reflect the correction of an error to previously issued financial statements. ☐
Indicate by check mark whether any of those error corrections are restatements that required a recovery analysis of incentive-based compensation received by any of the registrant’s executive officers during the relevant recovery period pursuant to §240.10D-1(b). ☐
Indicate by check mark whether the registrant is a shell company (as defined in Rule 12b-2 of the Act). ☐ Yes ☒ No
As of June 30, 2023, the aggregate market value of the Class A common stock held by non-affiliates of the registrant was approximately $115,859,350.
As of March 6, 2024, the Registrant had 49,572,398 shares of Class A common stock outstanding.
DOCUMENTS INCORPORATED BY REFERENCE
Part III of this Report incorporates by reference certain portions of the definitive proxy materials to be delivered to stockholders in connection with the 2024 Annual Meeting of Shareholders (the "2024 Proxy Statement"). The 2024 Proxy Statement will be filed with the Securities and Exchange Commission within 120 days after the end of the fiscal year to which this report relates.
TABLE OF CONTENTS
| | | | | | | | |
| | Page |
| PART I | | |
| Item 1. | | |
| Item 1A. | | |
| Item 1B. | | |
| Item 1C. | | |
| Item 2. | | |
| Item 3. | | |
| Item 4. | | |
| PART II | | |
| Item 5. | | |
| Item 6. | | |
| Item 7. | | |
| Item 7A. | | |
| Item 8. | | |
| Item 9. | | |
| Item 9A. | | |
| Item 9B. | | |
| Item 9C. | | |
| PART III | | |
| Item 10. | | |
| Item 11. | | |
| Item 12. | | |
| Item 13. | | |
| Item 14. | | |
| PART IV | | |
| Item 15. | | |
| Item 16. | | |
| | |
| | |
FORWARD-LOOKING STATEMENTS
This Annual Report on Form 10-K (“Form 10-K”) contains forward-looking statements, within the meaning of the Private Securities Litigation Reform Act of 1995. All statements contained in this Form 10-K other than statements of historical fact, including statements regarding our future results of operations and financial position, our business strategy and plans, our expected capital needs, and our objectives for future operations, are forward-looking statements. Forward-looking statements may be identified by words such as “future,” “anticipates,” “believes,” “estimates,” “expects,” “intends,” “plans,” “predicts,” “will,” “would,” “could,” “can,” “may,” and similar terms. We have based these forward-looking statements largely on our current expectations and projections about future events and trends that we believe may affect our financial condition, results of operations, business strategy, short-term and long-term business operations and objectives, and financial needs. These forward-looking statements are subject to a number of risks, uncertainties and assumptions, including those described in Part I, Item 1A, Risk Factors in this Form 10-K. Moreover, we operate in a very competitive and rapidly changing environment. New risks emerge from time to time. It is not possible for our management to predict all risks, nor can we assess the impact of all factors on our business or the extent to which any factor, or combination of factors, may cause actual results to differ materially from those contained in any forward-looking statements we may make. In light of these risks, uncertainties and assumptions, the future events and trends discussed in this Form 10-K may not occur and actual results could differ materially and adversely from those anticipated or implied in the forward-looking statements.
We assume no obligation to revise or update any forward-looking statements for any reason, except as required by law. You should be aware that factors not referred to above could affect the accuracy of our forward-looking statements and use caution and common sense when considering our forward-looking statements.
ACCESS TO INFORMATION
The U.S. Securities and Exchange Commission ("SEC") maintains a website that contains reports, proxy and information statements, and other information regarding issuers, including the Company, that file electronically with the SEC. The public can obtain any documents that the Company files with the SEC at http://www.sec.gov. We also make available, free of charge, through our Internet website (http://www.citizensinc.com), our Annual Reports on Form 10-K, Quarterly Reports on Form 10-Q, Current Reports on Form 8-K, Section 16 Reports filed by officers and directors, and, if applicable, amendments to those reports filed or furnished pursuant to Section 13(a) or 15(d) of the Securities Exchange Act of 1934, as soon as reasonably practicable after we electronically file such reports with, or furnish such reports to, the SEC. We are not including any of the information contained on our website as part of, or incorporating it by reference into, this Form 10-K.
December 31, 2023 | 10-K 1
PART I
Item 1. BUSINESS
OVERVIEW
Citizens, Inc. ("Citizens" or the "Company") is an insurance holding company incorporated in Colorado serving the life insurance needs of individuals in the United States since 1969 and internationally since 1975. Through our domestic insurance subsidiaries, we are licensed to provide insurance benefits to residents in 39 U.S. states and through our international subsidiaries, we provide insurance benefits to residents in over 75 different countries. We pursue a strategy of offering traditional insurance products in niche markets where we believe we are able to achieve competitive advantages. We had approximately $1.7 billion of assets and approximately $4.9 billion of direct insurance in force at December 31, 2023.
We operate in two business segments:
•Life Insurance - Internationally, we sell U.S. dollar-denominated ordinary whole life insurance, endowment and critical illness policies to non-U.S. residents, located principally in Latin America and the Pacific Rim. Domestically, we sell whole life insurance, life insurance with living benefits, critical illness, credit life and disability products throughout the U.S.
•Home Service Insurance - We sell final expense life insurance policies to middle- and lower-income households, as well as whole life products with higher allowable face values, in Louisiana, Mississippi and Arkansas.
Our Principal Brands
LIFE INSURANCE SEGMENT
| | | | | |
| Internationally, we conduct our Life Insurance segment business through CICA Life, A.I., a Puerto Rico company ("CICA International"). |
| Domestically, we conduct our Life Insurance segment business through CICA Life Insurance Company of America ("CICA Domestic"). |
HOME SERVICE INSURANCE SEGMENT
| | | | | |
| We conduct our Home Service Insurance segment through Security Plan Life Insurance Company ("SPLIC") and Magnolia Guaranty Life Insurance Company ("Magnolia"). |
As an insurance provider, we collect premiums on an ongoing basis from our policyholders and invest the majority of the premiums to pay future benefits, including claims, surrenders and policyholder dividends. Accordingly, the Company derives its revenues principally from: (1) life insurance premiums earned for insurance coverages provided to insureds in our two operating segments; and (2) net investment income. In addition to paying and reserving for insurance benefits that we pay to our policyholders, our expenses consist primarily of the costs of selling our insurance products (e.g., commissions, underwriting, marketing expenses), operating expenses and income taxes.
Because collection of premiums is the primary source of our revenues, our overall financial performance depends primarily upon the development and distribution of our products. A key to product development is the pricing of our insurance products and the accuracy of our pricing assumptions. We seek to price our insurance policies such that insurance premiums and future net investment income earned on premiums received will cover the ultimate cost of paying claims on our policies, our expenses and will also yield a profit margin. Pricing adequacy depends on a number of factors, including the ability to project future losses based on historical loss experience adjusted for
December 31, 2023 | 10-K 2
known trends, proper evaluation of underwriting risks, the Company’s response to competitors, commission payments for selling our products, expectations about interest rates and regulatory or legal developments, and expense levels.
In addition to insurance premiums, the investment return, or yield, on invested assets is an important element of the Company’s earnings since life insurance products are priced with the assumption that premiums received can be invested for a period of time before benefits are paid. Pursuant to regulatory guidelines, most of the Company’s invested assets are held in available-for-sale ("AFS") fixed maturity securities, primarily in asset classes of corporate bonds, municipal bonds, and government obligation bonds. The interest rate environment has a significant impact on the determination of insurance contract liabilities, our investment rates and yields, and our asset/liability management. The profitability of our "spread-based" product features depends largely on the Company’s ability to earn higher returns on invested assets than the interest we credit to policyholders.
The primary investment objective for the Company is to maximize economic value, consistent with acceptable risk parameters, including the management of credit risk and interest rate sensitivity of invested assets, while generating sufficient after-tax income to meet policyholder and corporate obligations. The Company maintains a prudent investment strategy that may vary based on a variety of factors including business needs, regulatory requirements and tax considerations.
IN 2021, WE BECAME A NON-CONTROLLED COMPANY
Throughout most of our history, the Company was led and controlled by our founder Harold E. Riley and his family members. Mr. Riley passed away in 2017 and in 2020, a change-in-control of our Company occurred when the shares held by the Harold E. Riley Trust were transferred to the Harold E. Riley Foundation (the “Foundation”). In February 2021, the Company entered into an agreement with the Foundation to purchase all of the outstanding shares of Class B common stock for a purchase price of $9.1 million (the “B Share Transaction”). After the completion of the B Share Transaction and the appointment of a new Chief Executive Officer, we believe the Company was positioned to offer stability to our management team, employees and independent sales force and was able to move forward with new business and strategic initiatives, as described below.
STRATEGIC INITIATIVES
Historically, our insurance companies have only issued a few products and had limited distribution channels. Since the change-in-control described above, our growth strategy shifted to focusing on first year sales growth through introduction of new products and new distribution channels, retaining renewal premiums through policy retention efforts, focused execution, and financial and expense discipline. We believe these factors will lead to growth and profitability.
We believe that our roadmap execution process is key to achieving our strategic goals as it helps us focus on three specific sales levers in each market - products, promotions and processes. Specifically, we implemented a five-quarter roadmap that lays out the following:
•Products. We have a robust product development process that focuses on our customer needs by developing new products tailored to our specific markets, working with partners to develop products tailored to their markets, and enhancing existing products. New products help our sales force, as they can sell additional products to existing customers and offer a broader portfolio of products to entice prospective customers. A broader product portfolio also helps attract new distributors. Our management team meets on a monthly basis to ensure we are bringing the right products to market at the right time.
•Promotions. We are focused on implementing sales promotions and campaigns in order to align our sales consultant compensation opportunities with our premium revenue goals and our growth and retention initiatives.
•Processes. We are implementing process improvements and new technologies in order to get products to our customers faster and improve the experience for both our policyholders and our agents. We also implemented new processes and technologies to help our employees work more effectively and efficiently.
December 31, 2023 | 10-K 3
Status of New and Enhanced Products; Trends in Market Demand
As mentioned above, offering new and enhanced products are key to achieving our strategic goals. In 2023 we:
•Introduced 3 new products in both English and Spanish under our CICA Domestic brand, leading to first year premium revenue growth of 13% in our Life Insurance segment.
•Obtained an A.M. Best rating for the first time ever in July 2023.
◦CICA Domestic is rated as a B++ with a "Very Strong" balance sheet. We believe this will help us expand our distribution networks and the appeal of our products to consumers.
•Completed the move of our international business from Bermuda to Puerto Rico, which we believe will drive greater demand for our international products.
As we seek to optimize value for the Company's shareholders, customers and distributors, we believe our efforts to develop and enhance our products, incentivize our sales force and make process and technology improvements will continue to put the Company on a stronger financial footing and drive sustainable growth.
LIFE INSURANCE SEGMENT
Until December 31, 2022, our Life Insurance segment primarily operated through CICA Life Ltd. ("CICA Bermuda"), a Bermuda company. Upon surveying the market demands and needs of our policyholders, in 2022 we formed a new subsidiary in Puerto Rico, CICA Life, A.I. ("CICA International"). CICA International received a license in September 2022 to issue business as a Puerto Rico international insurer for the Company’s international portion of its Life Insurance segment. Beginning January 1, 2023, all new international policies are issued by CICA International (CICA Life, A.I.) and on August 31, 2023, CICA Bermuda transferred all of its insurance in force business to CICA International and we voluntarily surrendered our insurance license in Bermuda. Because CICA International provides our non-U.S. policyholders the ability to purchase policies in a U.S. territory and in a jurisdiction where the primary language spoken is Spanish, which is the primary language of the majority of our international policyholders, we believe this change will drive sales and improve policy retention, leading to revenue growth.
INTERNATIONAL LIFE INSURANCE
Sales and Distribution
We focus our international sales to residents in Latin America and the Pacific Rim. As of December 31, 2023, we had insurance policies in force in over 75 foreign countries and receive the majority of our premiums from Colombia, Taiwan, Venezuela, Ecuador and Argentina. International direct premiums comprised approximately 97% of total direct premiums in the Life Insurance segment and 70% of our total consolidated direct premiums in 2023.
December 31, 2023 | 10-K 4
We believe positive attributes of our international insurance business typically include:
•larger face amount policies issued compared to our U.S. operations, which results in low underwriting and administrative costs per dollar of coverage;
•high persistency and low mortality charges due to our customer demographics; and
•premiums paid annually at the beginning of each policy year rather than monthly or quarterly, which reduces our administrative expenses, accelerates cash flow and results in lower policy lapse rates than premium payment options with more frequently scheduled payments.
We sell our products internationally through independent marketing agencies and consultants who specialize in life insurance products. We enter into contracts with the independent marketing agencies pursuant to which they recruit, train and supervise their managers and associates in the sales and service of our products. These agencies receive commissions for products they sell and service, as well as commission overrides on the business that their agents produce and, in return for the override, they guarantee any debt their agents owe to us. Their agents also contract directly with us as independent consultants and receive commission compensation directly from us. This allows us to develop a relationship with their associates so if an agency contract is terminated for any reason, we may seek to continue the existing independent consultant marketing arrangements with the associates of such agency. Our agreements typically provide that the agencies and their agents are independent consultants responsible for their own operational expenses and are the representative of the prospective insured. Our contracts require the independent marketing agencies and consultants to understand and comply with all laws applicable to sales of our products in their country.
Products
CICA International issues primarily ordinary whole life insurance and endowment products in U.S. dollar-denominated amounts to non-U.S. residents. The whole life insurance products are designed to provide a fixed amount of insurance coverage over the life of the insured and can include rider benefits to provide additional coverage and annuity benefits to enhance accumulations. Our endowment contracts are principally accumulation contracts that incorporate an element of life insurance protection. These products have premium rates that are competitive with most foreign local companies and have been structured to provide the policyowners with:
•U.S. dollar-denominated cash values that accumulate, beginning in the first policy year, throughout a policyholder’s lifetime;
•protection against devaluation of the policyowners' local currency and local hyper-inflation;
•capital investment in a more secure economic environment (i.e., the U.S.); and
•lifetime income guarantees for an insured or for surviving beneficiaries.
Our international products have both living and death benefit features. Most policies contain guaranteed cash values and are participating (i.e., provide for cash dividends as apportioned by CICA International's board of directors). Once a policyowner pays the annual premium and the policy is issued, the owner becomes entitled to policy cash dividends and may elect to receive annual premium benefits. The policyowner has several options with regards to the policy dividends and annual premium benefits, which include, among other things, electing to receive cash, crediting such amounts towards the payment of premiums on the policy, leaving such amounts on deposit with the Company to accumulate at a defined interest rate or assigning them to a third-party. Under the "assigned to a third-party" provision, the Company has historically allowed policyowners, after receiving a copy of the Citizens, Inc. Stock Investment Plan (the "SIP") prospectus and acknowledging their understanding of the risks of investing in Citizens' Class A common stock, the right to assign policy values outside of the policy to the SIP, which is administered in the United States by Computershare Trust Company, N.A., our third-party plan administrator and an affiliate of Computershare, Inc., our transfer agent. The SIP is a direct stock purchase plan available to policyowners, shareholders, our employees and directors, independent consultants, and other potential investors through the Computershare website. The Company has registered the shares of Class A common stock issuable to participants under the SIP on a registration statement under the Securities Act of 1933, as amended, (the "Securities Act") that is on file with the SEC. Computershare administers the SIP in accordance with the terms and conditions of the SIP, which is available on the Computershare website and as part of the Company’s registration statement on file with the SEC.
December 31, 2023 | 10-K 5
Competition
The life insurance business is highly competitive. Internationally, we compete with a number of life insurance companies, as well as with financial institutions that offer insurance products.
We face competition from other insurance companies that operate in the same markets and manner as we do. Additionally, some of our competitors are local companies formed and operated in the country in which an insured resides, and others are companies foreign to the countries in which their products are sold, but issue insurance policies denominated in the local currency of those countries or issue products approved by regulators of those countries. Some of these companies may have a competitive advantage over us due to their greater financial resources, histories of successful operations and brand recognition, local licensing, partnering with local insurance companies and larger marketing forces.
We believe that we have a competitive advantage over some of our competitors because premiums on our international policies are paid in U.S. dollars, cash value is accumulated in U.S. dollars, and we pay claims and benefits in U.S. dollars. We believe this provides security and stability to our insureds, who are generally individuals in the middle- to upper-middle class in their respective countries with significant net worth and earnings. Therefore, our products protect them from the inflationary risks and economic crises that have been common in many of our top-producing foreign countries.
DOMESTIC LIFE INSURANCE
Prior to July 1, 2023, our domestic life insurance business operated through CICA Domestic and Citizens National Life Insurance Company ("CNLIC"). CNLIC merged into CICA Domestic on July 1, 2023 in order to streamline and focus our domestic life insurance business in one entity. In 2023, domestic direct life insurance premiums comprised approximately 3% of total direct premiums in the Life Insurance segment and 2% of our consolidated total direct premiums. The majority of our domestic in force business results from renewal premiums from blocks of business of insurance companies we have acquired over the years. In late 2022, we began our "white label" program to expand our distribution, we began expanding CICA Domestic's state licenses, developing new final expense and living benefit products, and filing these new products in multiple states.
HOME SERVICE INSURANCE SEGMENT
We operate our domestic Home Service Insurance segment through SPLIC and Magnolia and prior to June 30, 2023, Security Plan Fire Insurance Company ("SPFIC"). SPLIC issues final expense life insurance and critical illness products to middle- and lower-income individuals, primarily through a home service distribution model based in Louisiana. Policies issued by Magnolia are primarily burial policies which are serviced through funeral homes, who are also typically the beneficiaries of the policies. SPFIC is a limited liability casualty company that prior to June 30, 2023, sold small face value property insurance policies covering dwelling and contents, primarily in Louisiana. We ceased operations on June 30, 2023 as explained in more detail in Part II, Item 7, Managements' Discussion and Analysis, Overview section. In 2023, our Home Service Insurance segment comprised 27% of our total consolidated direct premiums.
Products and Competition
Our Home Service Insurance products consist primarily of small face amount ordinary whole life and pre-need policies, which are designed to fund final expenses for the insured (e.g., funeral and burial costs). The average life insurance policy face amount issued in 2023 was approximately $12,900 per policy. Due to the lower risk associated with small face amount polices, the underwriting performed on these applications is limited. As part of the Home Service Insurance segment transformation mentioned above, in 2021 we introduced a new product, Security Plan Plus, which has a higher allowed face amount. In December 2021, we also introduced a critical illness product, which pays the insured a lump sum following the diagnosis of an illness covered under the plan. To a much lesser extent, our Home Service Insurance segment sold property insurance policies covering dwellings and content until it ceased operations on June 30, 2023. We provided $30,000 maximum coverage on any one dwelling and contents policy, while content-only coverage and dwelling-only coverage were both limited to $20,000.
We face competition in Louisiana, Mississippi and Arkansas from other companies specializing in final expense insurance. We seek to compete by delivering exceptional personal service to our customers, enhancing our
December 31, 2023 | 10-K 6
management team and upgrading our agent field force. We intend to continue premium growth within this segment by focusing on direct independent agent-to-consumer sales.
REINSURANCE
We follow the industry practice of reinsuring a portion of our insurance risks with unaffiliated reinsurers. In a reinsurance transaction, a reinsurer agrees to indemnify another insurer for part or all of its liability under a policy or policies it has issued for an agreed upon premium. We participate in reinsurance activities in order to minimize exposure to significant risks, limit losses, and provide additional capacity for future growth. We enter into various agreements with reinsurers that cover individual risks, group risks or defined blocks of business, primarily on a coinsurance and yearly renewable term basis.
For the majority of our life insurance business, we generally retain the first $100,000 of risk on any one life and reinsure the remainder of the risk. Therefore, under the terms of the reinsurance agreements, the reinsurers agree to reimburse us for the ceded amount (i.e., the death benefit amount less our retained risk) in the event a claim is paid. Cessions under reinsurance agreements do not discharge our obligations as the primary insurer. In the event reinsurers do not meet their obligations under the terms of the reinsurance agreements, reinsurance recoverable balances could become uncollectible.
Our amounts recoverable from reinsurers represent receivables from and/or reserves ceded to reinsurers. The amount recoverable from reinsurers was $4.0 million as of December 31, 2023.
We focus on obtaining reinsurance from a diverse group of well-established reinsurers. All of our reinsurers are rated A- (Excellent) or higher by A.M. Best. We regularly evaluate the financial condition of our reinsurers and monitor concentration risk with our reinsurers.
OTHER NON-INSURANCE ENTERPRISES
Other Non-Insurance Enterprises includes the results of our parent company, Citizens, Inc. and our non-insurance subsidiary, Computing Technology, Inc., which primarily provide the Company's corporate-support and information technology functions to the insurance operations.
OPERATIONS AND TECHNOLOGY
Most of our operations are based at our corporate headquarters in Austin, Texas. We also conduct operations for our Home Service Insurance segment from our district offices in Louisiana, Arkansas and Mississippi, as well as our service center in Donaldsonville, Louisiana. For the international portion of our Life Insurance segment, operations including underwriting, policy issuance, claims processing, accounting and reporting related to certain international policies were conducted in Bermuda until December 31, 2023 and are now conducted in Puerto Rico.
We have a proprietary single, centrally-controlled, mainframe-based policy administrative system ("PAS") that we use for all of our insurance companies. Our PAS performs various functions to effectively handle our insurance operations. These functions include policy set-up, administration, billing and collections, commission calculation, valuation, automated data edits, storage backup, image management and other related functions. Each company and block of business we have acquired has been converted onto our PAS. The Company is actively engaged in continued modernization of technology to invest and expand into new opportunities. This modernization allows us to bring new products to market rapidly and automate insurance interactions to enhance user experience. This investment is foundational to the Company's growth strategy as we pursue new product innovation and provides:
•our customers and agents with portals to be able to access account information 24/7;
•our policyholder service and claims representatives with a customer account-centric view of our policyholders and beneficiaries, reducing customer inquiry response time and claims processing time; and
•business-to-business solutions.
December 31, 2023 | 10-K 7
REGULATION
The insurance industry is heavily regulated and both Citizens and our insurance subsidiaries are subject to regulation and supervision by the U.S. states in which they do business, by U.S. federal laws, and for CICA International, by Puerto Rico.
REGULATION OF OUR INTERNATIONAL BUSINESS
Puerto Rico
CICA International, our Puerto Rico domiciled subsidiary, is regulated by the Puerto Rico Office of the Insurance Commissioner (“OIC”) and is licensed pursuant to the Puerto Rico Insurance Code (the "Insurance Code"). Although Puerto Rico is a U.S. territory, it has its own tax code and own insurance code, including a provision under its Insurance Code that allows CICA International to be established as an "international insurer" and thus export insurance to international markets. We may not insure risks of residents of Puerto Rico with this type of license and we do not issue policies to U.S. risks through CICA International.
The Insurance Code does not specifically set forth minimum capital and surplus standards, but rather requires that an insurer submit a business plan for approval to the OIC that includes proposed minimum capital and surplus. CICA International is required to maintain a minimum of $750,000 in capital and maintain a premium to surplus ratio of 7 to 1. The Insurance Code requires us to file annual U.S. GAAP financial statements with the OIC that include schedules providing information regarding premiums written and reinsurance assumed and ceded, as well as an annual actuarial certification.
In addition to compliance with the Insurance Code, CICA International must comply with other laws and regulations of Puerto Rico, most of which apply to our domestic subsidiaries as well, including the U.S. Bank Secrecy Act and other anti-money laundering laws and regulations of the United States.
Other International Regulation
Generally, all foreign countries in which we offer insurance products require a license or other authority to conduct insurance business in that country. Some of these countries also require that local regulatory authorities approve the terms of any insurance product sold to residents of that country. Other than formerly in Bermuda, we have never qualified to do business in any foreign country, and we have never submitted our international insurance policies for approval to any regulatory agency. As described above, we sell our policies to residents of foreign countries through independent marketing agencies and independent consultants located in those countries and we rely on our independent consultants to comply with laws applicable to them in marketing and servicing our insurance products in their respective countries.
We have undertaken a comprehensive compliance review of risks associated with the potential application of foreign laws to our sales of insurance policies in foreign countries. The application of foreign laws to our sales of insurance policies in foreign countries varies by country. There is a lack of uniform regulation, lack of clarity in certain regulations and lack of legal precedent in addressing circumstances similar to ours. Our compliance review has confirmed certain risks related to foreign insurance laws associated with our current business model, at least in certain jurisdictions, as described in detail in Item 1A. Risk Factors.
U.S. REGULATION
In the United States, insurance is primarily regulated at the state level. Our primary regulator in the U.S. is the Colorado Division of Insurance, as both Citizens and CICA Domestic are Colorado companies. We are also regulated by the departments of insurance in Louisiana (SPLIC and SPFIC) and Mississippi (Magnolia), as well as each of the 39 states and the District of Columbia in which we conduct insurance business. In supervising and regulating insurance companies, state insurance departments aim to protect policyholders and the public rather than investors, and enjoy broad authority and discretion in applying applicable insurance laws and regulation for that purpose. The extent of this regulation varies, but most U.S. jurisdictions have laws and regulations based upon the National Association of Insurance Commissioners ("NAIC") model rules governing the financial condition of insurers, including standards of solvency, types and concentration of investments, establishment and maintenance of reserves, credit for reinsurance and requirements of capital adequacy; and the business conduct of insurers,
December 31, 2023 | 10-K 8
including marketing and sales practices and claims handling. In addition, statutes and regulations require the licensing of insurers and agents, the approval of most types of policy forms and related materials (such as advertising) and the approval of rates for certain types of insurance products.
In order for insurance regulators to monitor solvency, insurance companies are subject to risk-based capital ("RBC") requirements. The RBC requirement is a statutory minimum level of capital that is based on two factors - (1) the insurance company's size, and (2) the inherent riskiness of its financial assets and operations, i.e. a company must hold capital in proportion to its risk. The RBC requirement thus determines a minimum level of capital required for an insurer to support its operations and write coverage. The purpose of the RBC requirements is to identify weakly capitalized companies, which facilitates regulatory actions to ensure that the policyholders will receive the benefits promised. Regulators have the legal authority to take preventive and corrective measures depending on the capital deficiency indicated by the RBC result. If a company's ratio of total adjusted statutory capital to control level risk-based capital is above 200%, no regulatory intervention is needed. If it falls below 200%, interventions range from submission of action plans to a regulatory takeover of the management of the company, which occurs if the ratio is below 70%. We have committed to the Colorado Division of Insurance that we will keep CICA Domestic's RBC ratio at or above 350%.
In addition to monitoring our financial condition, insurance regulatory authorities (including state law enforcement agencies and attorneys general) periodically make inquiries and regularly conduct examinations regarding compliance with insurance and other laws and regulations regarding the conduct of our insurance businesses. It is our practice to fully and consistently cooperate with such inquiries and examinations and take corrective action when warranted.
In order to sell products in any state, we first have to become licensed in that state. States have various rules for obtaining a license, including capital deposit requirements and seasoning requirements, among others. Once we are licensed in a state, most states require us to file our products for their approval before being able to sell the products. The application and product forms must comply with state insurance laws regarding policy requirements. Once an application or product is approved in that state, we must use the approved forms to sell our products. We have to file our domestic forms in both English and Spanish for separate approvals. We are also subject to laws related to our advertising and may have to file certain marketing documents with state regulators as well.
Because Citizens is a holding company that directly and indirectly owns insurance operating subsidiaries, we are also subject to regulation in our three domiciliary states that require us to furnish the respective insurance regulators with financial and other information concerning the operations of, and the interrelationships and transactions among, the companies within our holding company system that may materially affect the operations, management or financial condition of the insurers within the system. Generally, these laws and regulations require that all transactions within a holding company system between an insurer and its affiliates be fair and reasonable and that the insurer's statutory capital and surplus following any transaction with an affiliate be both reasonable in relation to its outstanding liabilities and adequate to its financial needs. For certain types of agreements and transactions between an insurer and its affiliates, these laws and regulations require prior notification to, and non-disapproval or approval by, the insurance regulatory authority of the insurer's jurisdiction of domicile. These laws also require that a controlling party obtain the approval of the insurance commissioner of the insurance company's jurisdiction of domicile prior to acquiring or divesting control of the insurer.
The payment of dividends or other distributions to Citizens by our insurance subsidiaries is also regulated by the insurance laws and regulations of their respective state or jurisdiction of domicile. The laws and regulations of some of these jurisdictions also prohibit an insurer from declaring or paying a dividend except out of its earned surplus or require the insurer to obtain regulatory approval before it may do so. In addition, insurance regulators may prohibit the payment of ordinary dividends or other payments by our insurance subsidiaries to us (such as a payment under a tax sharing agreement or for employee or other services) if they determine such payment could be adverse to policyholders or insurance contract holders of the subsidiary.
Because we maintain sensitive data regarding our customers, we are also subject to additional state regulations in states where we do business, such as data security and state privacy laws.
December 31, 2023 | 10-K 9
While primarily regulated at the state level, our domestic business is subject to various federal laws and regulations. Some of the primary federal laws include:
•USA Patriot Act and the Bank Secrecy Act, which require us to institute certain measures to detect and prevent money laundering;
•Foreign Corrupt Practices Act, which makes it unlawful to bribe foreign officials for the purpose of obtaining or retaining business;
•Gramm-Leach-Bliley Act, which requires us to explain our information-sharing practices to our customers and to safeguard sensitive data;
•Securities Act, Securities Exchange Act and Sarbanes-Oxley Act, which establish various requirements for Citizens, as a public company, to comply with, including registration of our Class A common stock, reporting and disclosure requirements, and public company audit and internal control requirements;
Our U.S.-based insurance products and thus our businesses also are affected by U.S. federal, state and local tax laws.
HUMAN CAPITAL RESOURCES
Composition and Demographics
Our human capital is a critical component to our success. Our employees implement and drive our strategic initiatives and contribute to the success of our products (development, underwriting, pricing adequacy, customer service), promotions and processes. Our employees in our claims department are ultimately tasked with "keeping our promise". Our independent consultants and agents also drive our key goals, as they sell our insurance products and provide local services to our global base of policyholders. We also believe that we derive a great deal of strength from our diverse workforce. Fostering an equitable and inclusive workplace with diverse teams produces more creative solutions, results in more innovative products and services and is crucial to our efforts to attract, develop and retain key talent.
December 31, 2023 | 10-K 10
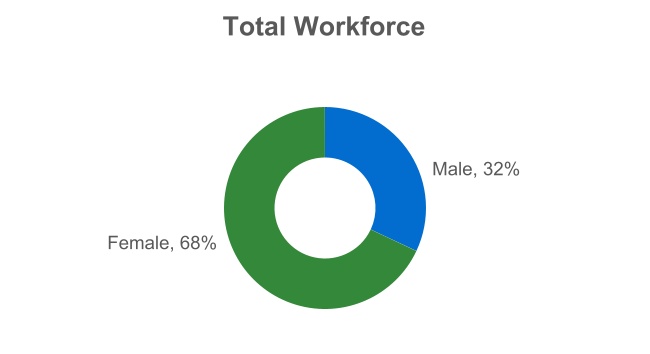
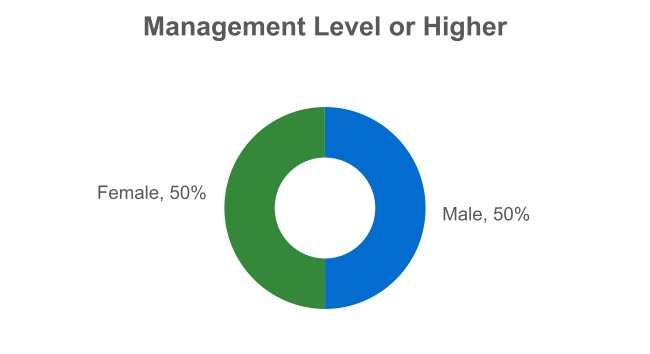
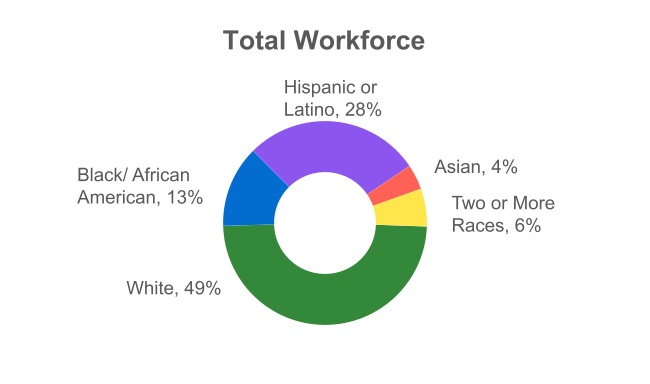
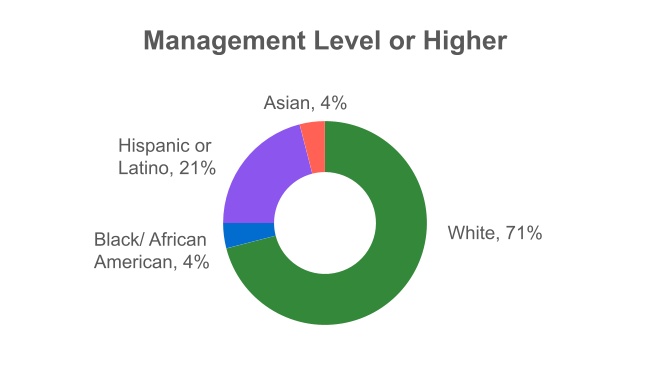
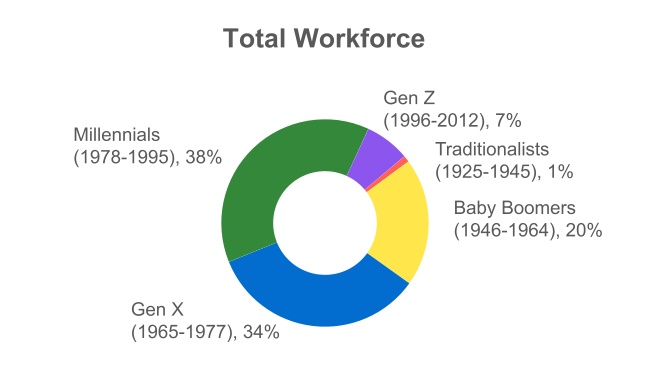
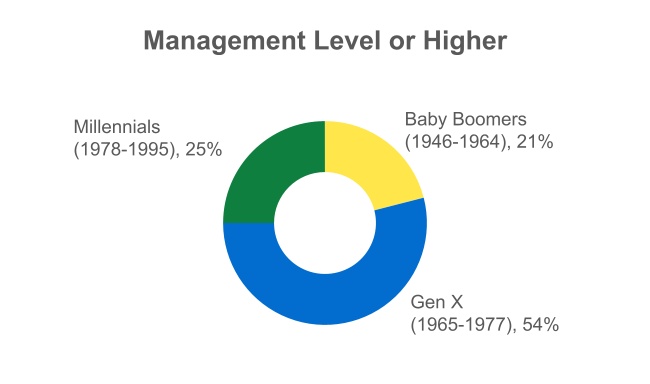
As of December 31, 2023, we had 232 employees. The pie charts below illustrate the gender, racial, ethnicity, and generational make-up of our total employee workforce as of such date.
Gender Composition
Racial/Ethnic Composition
Generational Composition
We determine race, ethnicity, gender, and generation based on our employees' self-identification or other information compiled to meet requirements of the U.S. government.
None of our employees are subject to a collective bargaining agreement.
We do not utilize captive employee agents to distribute our products and thus contract with over 1,000 actively producing independent consultants internationally and over 2,000 independent agencies and agents domestically to sell and service our insurance products. Our international independent consultants generally reflect the demographics of the areas in which they sell their products.
In order to continue to develop, sell and administer our products, it is crucial that we continue to attract and retain both experienced employees and independent agents.
December 31, 2023 | 10-K 11
Compensation and Benefits
Our compensation program is designed to attract and retain talented individuals who possess the skills necessary to support our business objectives, assist in the achievement of our strategic goals and create long-term value for our stockholders. We provide employees with compensation packages that include base salary and annual performance-based bonus opportunities that include cash, and for certain employees, long-term equity awards in the form of restricted stock units ("RSUs"). We believe that a compensation program with both short-term cash awards and long-term equity awards provides fair and competitive compensation and aligns employee and stockholder interests. In addition to cash and equity compensation, we also offer standard employee benefits such as life and health (medical, dental and vision) insurance, 401(k) and HSA contributions, life insurance, long-term and short-term disability, including paid parental leave, and a generous PTO plan.
Independent agents work for themselves and may sell insurance policies for a variety of insurers and make most of their money through sales commissions and bonuses. We attract and retain our independent agent sales force through the use of our commission structure and agent campaigns and promotions, including annual sales conventions. We believe that our commission structure is attractive and competitive in the markets in which we do business. In our Life Insurance segment, we believe our campaigns and promotions provide an extra incentive to agents that not only promote first year premium growth, but also create improvements within policyholder retention. In our Home Service Insurance segment, we believe our agent campaigns and promotions are critical in attracting and retaining our independent agent sales force. This business contains a large block of existing in force policies. To ensure we maintain this book of business, the agent campaigns and promotions provide an extra incentive to not only grow the business but to collect on the existing policies. We believe that creating agent campaigns and promotions with additional incentives provides long-term value for our shareholders.
Wellness
We are committed to the health and safety of our work force and compliance with applicable regulatory and legal requirements. In response to the COVID-19 pandemic, in 2021, we implemented operating changes that we determined were in the best interest of the health of our employees, including offering a hybrid work environment where our employees can work part- or full-time from home, depending on their position and circumstances. We have continued with the hybrid work environment as it offers employees flexibility and helps attract and retain talent. We also have implemented training programs to assist our independent agents with online sales efforts in order to minimize face-to-face interactions with potential customers and our policyholders when necessary.
Item 1A. RISK FACTORS
Because of the following factors, as well as other factors affecting the Company’s financial condition and operating results, past financial performance should not be considered to be a reliable indicator of future performance, and investors should not use historical trends to anticipate results or trends in future periods.
December 31, 2023 | 10-K 12
INTERNATIONAL BUSINESS RISKS
A SUBSTANTIAL PORTION OF OUR REVENUE IS GENERATED FROM INSURANCE PRODUCTS SOLD OUTSIDE OF THE UNITED STATES. WHILE OUR PRODUCTS ARE PRICED AND PAID FOR IN U.S. DOLLARS, OUR FOREIGN BUSINESS MAY SUBJECT US TO SEVERAL RISKS.
Our sales to residents of foreign countries expose us to unknown risks related to foreign regulation, foreign currency restrictions, and political instability. A significant loss of sales in these foreign markets would have a material adverse effect on our results of operations and financial condition.
International Regulatory Risks. A substantial majority of our direct insurance premiums, approximately 70% at December 31, 2023, are from policyholders in foreign countries, primarily those in Latin America and the Pacific Rim. As described in Part I, Item 1, Business, these policies are issued by our Puerto Rico subsidiary, CICA International, which is licensed as an international insurer in Puerto Rico. Our products are sold by independent consultants who are located in the foreign countries in which the policies are sold. Generally, the foreign countries in which we offer insurance products require either us and/or our independent consultants to obtain a license or register to conduct insurance business in that country. Some of these countries also require that local regulatory authorities approve the terms and rates of any insurance product sold to residents of that country. Some of these countries have laws that state that their residents may not purchase life insurance from us or a consultant may not sell life insurance on our behalf unless we become qualified to do business in that country or unless our policies receive prior approval from their insurance regulators. Others have a "consumption abroad" model where their residents may purchase unregistered products only if they are outside of their country when the purchase is made. Other than Puerto Rico and formerly Bermuda, we have never registered to do business in these countries or sought to have our international products approved by a governmental authority.
While we have undertaken a comprehensive compliance review of risks associated with the potential application of foreign laws to our sales of insurance policies in foreign countries, the laws vary by country and there is a lack of uniform regulation and lack of clarity in certain regulations and thus we face various risks associated with the application of foreign laws to these sales. There is a risk that foreign governments where we sell our products will become more aggressive in enforcing any perceived violations of their laws and seek to impose monetary fines or criminal penalties on us or our independent consultants, and/or order us to cease our sales in that jurisdiction. There is no assurance that, if a foreign country were to require that we qualify to do business in that country or submit our policies for approval by that country’s regulatory authorities, we would be able to, or would conclude that it is financially reasonable to comply with those requirements.
We have sought to mitigate the risks described above by, among other things, not locating any of our offices or assets in these foreign countries or jurisdictions, and selling policies only through independent consultants rather than our own employees. We rely on our independent consultants to comply with laws applicable to them in marketing and servicing our insurance products in their respective countries. There is no assurance that these precautionary measures, practices and policies will partially or entirely mitigate the risks associated with the potential application of foreign laws to our sales of insurance policies in our foreign markets. Although the Company believes that these foreign regulators do not have jurisdiction over the Company and that any actions, including fines, may be unenforceable against the Company, any regulatory action could otherwise absorb Company time and resources (including independent consultants) away from its business operations or the Company may choose to pay such fines in order to do business in a particular country. Alternatively, the Company may determine that the risks associated with a particular market and its regulatory environment outweigh the benefits of conducting further business in that market and discontinue doing business there.
Any actions by a foreign government to enforce these laws against us could cause disruption to the marketing and sale of our policies in that country or our withdrawal from doing business in that country, which could have a material adverse effect on our premium revenue, our costs and expenses and on our results of operations and financial condition.
International Currency Risks. While we only sell U.S. dollar denominated products, currency control laws or other currency exchange restrictions in foreign countries could materially adversely affect our revenues by limiting the ability of our policyholders in such countries to pay premiums in U.S. dollars or to receive U.S. dollar benefits. Difficulties in transferring funds from or converting currencies to U.S. dollars in certain countries could cause an increase in fees and costs associated with such payments or receipt of benefits and therefore make our products less attractive to such policyholders.
December 31, 2023 | 10-K 13
International Political Risks. Many of the countries in which we operate have a history of political instability, including regime changes, political uprisings, and anti-democratic or anti-U.S. policies. The ability of people living in these countries to purchase and continue to make premium payments on our insurance policies and our ability to sell our policies in those countries through our independent consultants or otherwise may be adversely affected by political instability. Given the nature of our products, in an economic environment characterized by higher unemployment, lower personal income and reduced consumer spending, new product sales may be adversely affected. During such periods, we may also experience higher claims, longer claims duration, increase in policy lapses and/or increase in surrenders, any of which could have a material adverse effect on our results of operations or financial condition. In addition, the imposition of U.S. sanctions against foreign countries where our policyholders reside could make it difficult for us to continue to issue new policies and receive premiums from policyholders in those countries.
We face significant competition in our international markets. If we are unable to compete effectively in these markets, our business, results of operations and profitability may be adversely affected.
We experience considerable competition for sales of our policies, primarily from the following sources, many of which have substantially greater financial, marketing and other resources than we have:
•Offshore companies with U.S. dollar-denominated policies. We face direct competition from companies that operate in the same manner as we do in our international markets;
•Foreign companies with locally operated subsidiaries that are registered in those countries and offer both local jurisdiction-regulated products in local currency and offshore U.S. dollar-denominated policies. This arrangement creates competition in that the U.S. dollar-denominated policies are cross-sold with high-need local insurance policies such as health insurance; and
•Locally operated companies with local currency policies. We compete with companies formed and operated in the country in which our foreign insureds reside.
In addition, from time to time, companies enter and exit the markets in which we operate, thereby increasing competition at times when there are new entrants. We may lose business to competitors offering competitive products at lower prices, or for other reasons.
Since we rely on independent consultants for distribution of our products in foreign markets, regulation and licensing requirements imposed upon our Company may impact our ability to attract and retain effective sales representatives, who may choose to distribute products of our competitors.
There can be no assurance that we will be able to compete effectively in any of our markets. If we do not, our business, results of operations and financial condition will be materially adversely affected.
We face a greater risk of money laundering activity associated with sales derived from residents of certain foreign countries.
The insurance industry is highly vulnerable to money laundering. Money laundering in the insurance industry typically involves the exploitation of various products and mechanisms to obscure the origins of illicit funds. One common method is through the purchase of insurance policies, such as life insurance, with the use of dirty money. Criminals may overpay premiums, surrender policies prematurely, or make fictitious claims to cycle the illicit funds back as legitimate payout. To combat global financial crime, governments and international authorities implement a range of anti-money laundering and countering of terrorist financing (AML/CFT) regulations that impact the insurance sector. Penalties for compliance failures can include heavy fines.
Some of our top international markets, such as Colombia and Venezuela, are countries that have been identified by the U.S. Department of the Treasury as jurisdictions of high risk for money laundering. Accordingly, as required by applicable U.S. laws and best business practices, we have developed and implemented an anti-money laundering, anti-terrorist financing and sanctions program that includes policies, procedures, controls, independent testing, reporting and recordkeeping requirements for deterring, preventing and detecting potential money laundering, terrorist financing, fraud and other criminal activity and have an officer of the Company responsible for managing this program. Despite our efforts to prevent money laundering through our companies, there can be no assurance that these enhanced controls will entirely mitigate money laundering risk associated with our insurance products, whether in these foreign countries or in the United States.
December 31, 2023 | 10-K 14
INSURANCE RISKS
BECAUSE MOST OF OUR REVENUE DERIVES FROM COLLECTION OF PREMIUMS ON OUR PRODUCTS, OUR OVERALL FINANCIAL PERFORMANCE DEPENDS UPON THE ACCURACY OF OUR PRODUCT PRICING AND ABILITY TO MANAGE PRICING ADEQUACY. DIFFERENCES IN ACTUAL EXPERIENCE, IMPROPER EVALUATION OF UNDERWRITING RISK, MISMANAGEMENT OF CLAIMS, OR OTHER UNFORESEEN EVENTS COULD CAUSE OUR ACTUAL RESULTS TO DIFFER FROM OUR ASSUMPTIONS, WHICH WOULD REDUCE OUR MARGINS AND THUS NEGATIVELY AFFECT OUR PROFITABILITY AND FINANCIAL CONDITION.
Pricing accuracy depends upon our ability to project future losses based on historical loss experience, adjusted for known trends.
In order to price products accurately, the Company must develop and apply appropriate morbidity and mortality estimates, closely monitor and timely recognize changes in trends, and project both severity and frequency of losses with reasonable accuracy to cover these risks. Pricing adequacy is necessary to generate sufficient premiums to cover our cost of sales, costs of operations (including payment of policy benefits) and to earn a profit. Pricing adequacy is subject to a number of risks and uncertainties, including, without limitation:
•availability of sufficient reliable data;
•incorrect or incomplete analysis of available data;
•uncertainties inherent in estimates and assumptions;
•selection and application of appropriate rating formulae or other pricing methodologies;
•adoption of successful pricing strategies;
•prediction of policyholder life expectancy and retention;
•unforeseen events that may cause our estimates to be wrong (such as the COVID-19 pandemic);
•unanticipated legislation, regulatory action or court decisions; or
•unexpected changes in interest rates or inflation.
Such risks may result in the Company’s pricing being based on outdated, inadequate, or inaccurate data, or inappropriate analyses, assumptions, or methodologies, and may cause the Company to estimate incorrectly future changes in the frequency or severity of claims. As a result, the Company could underprice risks, which would negatively affect the Company’s margins, or it could overprice risks, which could reduce the Company’s volume and competitiveness.
Pricing accuracy depends upon our ability to project future losses based on historical loss experience, including policyholder retention. Unanticipated increases in early policyholder withdrawals or surrenders or elections by policyholders to receive lump sum payouts at maturity could negatively impact liquidity.
A primary liquidity concern is the risk of unanticipated or extraordinary early policyholder withdrawals or surrenders. Some of our insurance policies include provisions, such as surrender charges, that help limit and discourage early withdrawals. However, early withdrawal and surrender levels may differ from anticipated levels for a variety of reasons, including changes in economic conditions, changes in policyholder behavior or financial needs, changes in relationships with our independent consultants, efforts by foreign governments to tax policyholders or increases in surrenders among policies that have been in force for more than fifteen years and are no longer subject to surrender charges. These changes in surrender activity may result in remeasurement gains or losses which could increase volatility in our results of operations.
In addition, we face potential liquidity risks if policyholders with mature policies elect to receive lump sum distributions at greater levels than anticipated. Our whole life and endowment products provide the policyholder with alternatives once the policy matures. The policyholder can choose to take a lump sum payout or leave the money on deposit at interest with the Company. The Company has a significant amount of aging endowment products that have begun reaching their maturities and policyholder election behavior is not known. It is uncertain how policyholders will react in response to these maturities. If a large number of policyholders elect lump sum distributions, the Company could be exposed to liquidity risk in years of high maturities.
If we experience unanticipated early withdrawal or surrender activity or greater than expected lump sum distributions of endowment maturities and we do not have sufficient cash flow from our insurance operations to support payment of these benefits, we may have to sell our investments in order to meet our cash needs or be
December 31, 2023 | 10-K 15
forced to obtain third-party financing. The availability of such financing will depend on a variety of factors, such as market conditions, the availability of credit in general or more specifically in the insurance industry, the strength or weakness of the capital markets, the volume of trading activities, our credit capacity, and the perception of our long- or short-term financial prospects if we incur large realized or unrealized investment losses or if the level of business activity declines due to a market downturn. Therefore, if we are forced to sell our investments on unfavorable terms or obtain financing with unfavorable terms, it could have an adverse effect on our liquidity, results of operations and financial condition.
The Company’s success depends on its ability to accurately underwrite risks in order to charge adequate premiums to policyholders.
The Company’s financial results largely depend on the Company’s ability to underwrite and set premiums accurately for the risks it faces. Failure to adequately underwrite health risks (i.e., to charge lower premiums than should be charged based on an individual’s health or to accept risks of extremely unhealthy individuals) or other types of risks (e.g., political risks) could negatively impact profitability as we could pay higher benefits than our products are priced for.
Historically, we have fully underwritten most of our products in order to properly evaluate risk. For many of our newer products, primarily in the U.S., we utilize a “simplified” underwriting process. Simplified issue life insurance uses a simple form of underwriting. Applicants must answer some health-related questions but do not have to take a life insurance medical exam. The underwriting decision is based on questions answered on the application and may be supplemented with additional medical claims history and lab data information.
Any shortcomings in the process used to evaluate and price our policies, or significant inaccuracies in the life expectancy estimates relating to those policies, could have a material and adverse effect on our results of operations and financial condition.
Policyholder claims is one of our largest expenses. Mismanagement of claims handling or increased fraudulent claims could negatively impact our costs and financial condition.
Proper claims handling is critical to managing our benefit expenses. Many factors can affect the Company’s ability to pay claims accurately, including the following:
•the training, experience, and skill of the Company’s claims representatives;
•the extent of fraudulent claims and the Company’s ability to recognize and respond to such claims; and
•the Company’s ability to develop or select and implement appropriate procedures, technologies, and systems to support claims functions.
The Company’s failure to pay claims fairly, accurately, and in a timely manner, or to deploy claims resources appropriately, could result in unanticipated costs, lead to material litigation, undermine customer goodwill and the Company’s reputation in the marketplace, impair its brand image and, as a result, materially and adversely affect its competitiveness, financial results, prospects, and liquidity.
Higher than expected policyholder claims related to unforeseen events may negatively impact our premium revenues, increase our benefits and expense costs and increase our reinsurance costs, thus negatively affecting our financial condition.
Our life and health insurance products are particularly exposed to risks of catastrophic mortality, such as a pandemic or other events that result in a large number of deaths. In addition, the occurrence of such an event in a concentrated geographic area could have a severe disruptive effect on our workforce and business operations. The likelihood and severity of such events cannot be predicted and are difficult to estimate. In such an event, the impact to our operations could have a material adverse impact on our ability to conduct business and on our results of operations and financial condition, particularly if those problems affect employees performing operational tasks and supporting computer-based data processing, or destroy the capability to transmit, store, and retrieve valuable data. In addition, in the event that a significant number of our management were unavailable following a disaster, the achievement of our strategic objectives could be negatively impacted.
December 31, 2023 | 10-K 16
Reinsurance may not be available or affordable, or reinsurers may be unwilling or unable to meet their obligations under our reinsurance contracts, which may adversely affect our results of operations or financial condition.
As part of our overall risk management and capital management strategies, we purchase reinsurance for certain risks underwritten by our various insurance subsidiaries. Market conditions beyond our control determine the availability and cost of reinsurance. Any decrease in the amount of reinsurance will increase our risk of loss and may impact the level of capital requirements for our insurance subsidiaries, and any increase in the cost of reinsurance will, absent a decrease in the amount of reinsurance, reduce our results of operations. Accordingly, we may be forced to incur additional expenses for reinsurance or may be unable to obtain sufficient reinsurance on acceptable terms, which may adversely affect our ability to write future business, result in the assumption of more risk with respect to the policies we issue, and increase our capital requirements. The collectability of our reinsurance recoverable is primarily a function of the solvency of the individual reinsurers. We cannot provide assurance that our reinsurers will pay the reinsurance recoverable owed to us or that they will pay these recoverables on a timely basis. The insolvency of a reinsurer or the inability or unwillingness of a reinsurer to comply with the terms of a reinsurance contract may have an adverse effect on our results of operations or financial condition.
Our actual claims losses may exceed our reserves for claims and we may be required to establish additional reserves, which in turn may adversely impact our results of operations and financial condition.
We maintain reserves to cover our estimated exposure for claims relating to our issued insurance policies. Reserves do not represent an exact calculation of exposure, but instead represent our best estimates using actuarial and statistical procedures. Reserve estimates are refined as experience develops, and adjustments to reserves are reflected in our consolidated statements of operations and comprehensive income (loss) for the period in which such estimates are updated. Because establishing reserves is an inherently uncertain process involving estimates of future losses, future developments may require us to increase policy benefit reserves, which restricts our use of cash to the extent of such increased reserves and increases expenses, negatively affecting our results of operations and financial condition in the periods in which such increases occur.
THE DISTRIBUTION OF OUR PRODUCTS THROUGH INDEPENDENT CONSULTANTS AND AGENCIES REDUCES OUR CONTROL OVER SALES AND DISTRIBUTION AND THUS SUBJECTS US TO CERTAIN RISKS THAT COULD NEGATIVELY IMPACT OUR REVENUES, OUR IN-FORCE BUSINESS, AND OUR BENEFITS AND EXPENSE COSTS.
Sales of our insurance products could decline if we are unable to establish and maintain relationships with independent marketing agencies, independent consultants and agents.
We depend almost exclusively on the services of a small number of independent consulting agencies in our international markets and on independent marketing organizations, general agencies and independent agents in our domestic markets for the distribution of our products. The loss of any of these producers could negatively affect our sales and policy retention.
Significant competition exists among insurers in attracting and maintaining marketers of demonstrated ability. Some of our competitors may offer better compensation packages or commissions or induce agents to sell their products due to their broader product offerings, more distribution resources, better brand recognition, more competitive pricing, lower cost structures or greater financial strength or claims paying ratings than we have. We compete with other insurers for marketing agencies, agents and independent consultants primarily on the basis of our compensation, products and support services. Any reduction in our ability to attract and retain effective sales representatives could materially adversely affect our revenues, results of operations and financial condition.
Additionally, we are subject to a risk of our independent consultants leaving our Company to sell products for a competitor and inducing our policyholders to lapse or surrender their policies, or otherwise terminate their relationship with us, in order to purchase products from the independent consultant with a competitor company.
Because we sell our products through independent agents, we have less control over the manner in which they sell our products.
As described above in Item 1, Business, Regulation, insurance regulators focus on market conduct, i.e., the way we sell our products. In the United States, there are several insurance regulations and federal laws that limit how we
December 31, 2023 | 10-K 17
sell our products, such as the Telephone Consumer Protection Act ("TCPA"), which governs how our agents can contact customers or potential customers via telephone and text. While we expect our agents to comply with their contractual obligations to us and laws such as the TCPA, we have limited control over how they conduct their business. If violations, such as TCPA violations, were attributed to us, we could incur significant fines and if attributed to our agents, may cause them to stop selling our products.
REGULATORY RISKS
INSURANCE IS A HIGHLY REGULATED BUSINESS. REGULATIONS VARY FROM JURISDICTION TO JURISDICTION AND MAY CHANGE FROM TIME TO TIME. THESE REGULATIONS AFFECT OUR OPERATIONS AND CHANGES COULD NEGATIVELY IMPACT OUR CASH FLOW, THE RESULTS OF OUR OPERATIONS, OUR LIQUIDITY AND OUR FINANCIAL CONDITION.
In addition to the legal risks related to our international operations discussed above in this Item 1A, Risk Factors, we are subject to risks related to the laws and regulations in the jurisdictions where we are domiciled and registered to do business, including Puerto Rico and various U.S. states. The material risks are described below.
Our insurance subsidiaries are subject to minimum capital and surplus requirements, and any failure to meet these requirements could subject us to regulatory action or other restrictions, including ceasing business.
The capacity for an insurance company's growth in premiums is partially a function of its required statutory surplus. Maintaining appropriate levels of statutory surplus, as measured by statutory accounting practices prescribed or permitted by a company's jurisdiction of domicile, is the most important solvency measure for insurance regulatory authorities. Failure to maintain required levels of statutory surplus could result in increased regulatory scrutiny and enforcement action by regulatory authorities.
Our insurance subsidiaries are subject to minimum capital and surplus requirements in the U.S. and Puerto Rico. If we fail to meet these standards and requirements, our various regulators may require specified actions to be taken, including without limitation:
•restricting distributions from our subsidiaries to Citizens; or
•requiring Citizens to contribute additional capital to a subsidiary; or
•requiring Citizens to enter into a guaranty or other agreement to contribute capital to such subsidiary under certain circumstances; or
•requiring the applicable insurance company to stop selling new business;
all of which could have a material and adverse impact on the Company’s competitiveness, operational flexibility, financial condition, and results of operations.
In our CICA Domestic business, we pay advance commissions on some of our insurance products, meaning we pay an agent their commission immediately upon sale of a policy, rather than "as earned", or when premiums are received by us. Because of this, another liquidity concern is the risk that rapid growth in first year sales of these products could create a significant increase in commission payments, which increases expenses and thus reduces our statutory capital until the commissions are recouped from premiums paid. CICA Domestic sales have increased significantly since the third quarter of 2023 and continue to grow rapidly. To mitigate this risk and strain on capital, we may seek options, such as reinsurance or loans at the holding company level (from the Credit Facility or otherwise) that would allow us to reduce the liquidity risk should CICA Domestic's required commission payments exceed current resources. If we are unable to purchase reinsurance protection in amounts that we consider sufficient or unable to borrow money to contribute capital to CICA Domestic, we could be exposed to cash flow strain. For CICA Domestic, commission advances are non-admitted assets, which increases required regulatory
December 31, 2023 | 10-K 18
capital and reduces the excess capital available. As discussed above, management is investigating various options in order to reduce both regulatory capital and liquidity risk should the capital required to support this growth exceed current resources. Citizens may have to contribute capital to CICA Domestic to maintain the required RBC ratio.
Citizens is a holding company that has minimal operations of its own and depends on the ability of our insurance subsidiaries to pay dividends or make service payments to us in sufficient amounts to fund our operations. If they cannot make such payments, Citizens may need to sell investments or seek external capital to cover its operational costs.
As a holding company, our assets consist of the capital stock of our subsidiaries, cash and investments. Accordingly, we rely primarily on statutorily permissible payments from our insurance subsidiaries, principally through dividends or service agreements we have with our subsidiaries, to meet our working capital needs. As discussed above, the ability of our insurance subsidiaries to make payments to us is subject to regulation by the states and jurisdictions in which they are domiciled, and in addition to maintaining minimum capital and surplus ratios, these payments depend primarily on regulatory approval of dividend payments and approved service agreements between us and these subsidiaries.
Except to the extent that we are a creditor with recognized claims against our subsidiaries, claims of our subsidiaries' creditors, including policyholders, have priority with respect to the assets and earnings of the subsidiaries over the claims of other creditors (including us) and shareholders. If any of our subsidiaries become insolvent, liquidates or otherwise reorganizes, our policyholders will have a priority to receive the assets of such subsidiary and Citizens may have no rights to receive cash or other assets of such subsidiaries.
If our internal sources of liquidity prove to be insufficient to cover our holding company operations, we may have to sell investments earlier than we want to sell them or in less than favorable market conditions, or we may have to seek external sources of capital. Out of an abundance of caution, in May 2021, we entered into a Credit Facility with Regions Bank. See Part IV, Item 15, Note 8, Commitments and Contingencies in the notes to our consolidated financial statements, herein, for a description of the Credit Facility. To date, we have not utilized the Credit Facility, but if internal sources of capital are not sufficient to meet our operating needs, we may need to utilize the Credit Facility or increase the borrowing availability under the Credit Facility. We may also need to raise capital through issuing our stock. Borrowing money, increasing our borrowing availability under the Credit Facility or obtaining financing for even a small amount of capital could be challenging or expensive in unfavorable market conditions and during periods of economic uncertainty. The availability of financing will depend on a variety of factors such as market conditions, the general availability of credit, the overall availability of credit to the financial services industry, and the possibility that customers or lenders could develop a negative perception of our financial prospects. Raising capital in unfavorable market conditions could increase our interest expense or negatively impact our shareholders through dilution of their common stock ownership of the Company.
Citizens and our insurance subsidiaries are subject to extensive governmental regulation in Puerto Rico and in the U.S. The rules and regulations to which we are subject may change and impose greater restrictions on our business, which could increase our costs of doing business, restrict the conduct of our business, increase capital requirements for our insurance subsidiaries and negatively impact our results of operations, liquidity and financial condition.
CICA International is registered in Puerto Rico and is subject to regulation by the Puerto Rico Office of the Insurance Commissioner ("OIC"). As a Puerto Rico International Insurer, CICA International is governed by Chapter 61 of the Puerto Rico Insurance Code. Additionally, CICA International must comply with other laws and regulations of Puerto Rico, most of which apply to our domestic subsidiaries as well, including U.S. federal laws such as the Bank Secrecy Act.
In the U.S., we are primarily subject to regulation at the state-level. Insurance company regulation is generally designed to protect the interests of policyholders, with substantially less protections to shareholders of the regulated insurance companies or their holding companies. To that end, all the U.S. states in which we do business have insurance regulatory agencies with broad legal powers with respect to licensing companies to transact business, mandating capital and surplus requirements, regulating claims practices, approving service agreements between a holding company and its operating subsidiary, restricting companies' ability to enter and exit markets, approving
December 31, 2023 | 10-K 19
product forms and to a lesser extent, rates, and restricting or prohibiting the payment of dividends by our subsidiaries to us.
The OIC and most U.S. insurance regulatory authorities have broad discretion to grant, renew, suspend and revoke licenses and approvals, and could preclude or temporarily suspend us from carrying on some or all of our activities, including acquisitions of other insurance companies, require us to add capital to our insurance subsidiaries, or fine us. If we are unable to maintain all required licenses and approvals, or if our insurance business is determined not to comply fully with the wide variety of applicable laws and regulations and their interpretations, our revenues, results of operations and financial condition and our reputation could be materially adversely affected.
Non-compliance with laws or regulations related to customer and consumer privacy and information security, including a failure to ensure that our business associates with access to sensitive customer and consumer information maintain its confidentiality, could materially adversely affect our reputation and business operations.
The collection, maintenance, use, disclosure and disposal of personally identifiable information by our insurance subsidiaries are highly regulated. Applicable laws and rules are subject to change by legislation or administrative or judicial interpretation. Various state laws address the use and disclosure of personally identifiable information to the extent they are more restrictive than those contained in the privacy and security provisions in the federal Gramm-Leach-Bliley Act. Noncompliance with any privacy laws, whether by us or by one of our business associates, could have a material adverse effect on our business, reputation and results of operations and could result in material fines and penalties, various forms of damages, consent orders regarding our privacy and security practices, adverse actions against our licenses to do business, and injunctive relief.
FINANCIAL RISKS
Changes in accounting standards may adversely affect our reported results of operations and financial condition.
Our consolidated financial statements are subject to the application of GAAP in the U.S., which is periodically revised and/or expanded. Accordingly, we are required to adopt new or revised accounting standards issued by recognized authoritative bodies, including the Financial Accounting Standards Board ("FASB") and the National Association of Insurance Commissioners ("NAIC"). Updates or revisions, including underlying assumptions, projections, estimates or judgments/interpretations by management, could have a material adverse effect on our business, financial condition and results of operations. In addition, the required adoption of new accounting standards may result in significant incremental costs associated with initial implementation and ongoing compliance. See Note 1. Summary of Significant Accounting Policies in the notes to our consolidated financial statements contained herein for additional information regarding accounting updates.
Unexpected losses in future reporting periods may require us to record a valuation allowance against our deferred tax assets.
Under U.S. GAAP, we are required to evaluate our deferred tax assets ("DTA") quarterly for recoverability based on available evidence. This process involves management's judgment about assumptions, which are subject to change from period to period due to tax rate changes or variances between our projected operating performance and our actual results. Ultimately, future adjustments to the DTA valuation allowance, if any, will be determined based upon changes in the expected realization of the net deferred tax assets. The realization of the deferred tax assets depends on the existence of sufficient taxable income in either the carry back or carry forward periods under applicable tax law. Due to significant estimates utilized in establishing the valuation allowance and the potential for changes in facts and circumstances, it is reasonably possible that we may be required to record a valuation allowance in future reporting periods. Such an adjustment could have a material adverse effect on our results of operation and financial condition.
A ratings downgrade or other negative action by a rating agency could materially affect our business, financial condition, and results of operations.
A.M.Best reviews CICA Domestic and publishes its financial strength rating as an indicator of our ability to fulfill our contractual obligations. This rating is important to maintaining public confidence in our insurance products. A downgrade or other negative action by A.M. Best with respect to the financial strength rating of CICA Domestic
December 31, 2023 | 10-K 20
could negatively affect us by limiting or restricting the ability of CICA Domestic to attract independent insurance agencies to distribute our products or reduce the attractiveness of our products to consumers.
ECONOMIC ENVIRONMENT RISKS
INVESTMENT INCOME IS A MATERIAL PORTION OF OUR TOTAL REVENUES. CHANGING FINANCIAL CONDITIONS SUCH AS MARKET VOLATILITY, CHANGES IN INTEREST RATES, OR INFLATION MAY ADVERSELY AFFECT OUR REVENUES, OUR RESULTS OF OPERATION AND OUR FINANCIAL CONDITION.
Global or regional changes in the financial markets or economic conditions could adversely affect our business in many ways, including the following:
•Inflation, a potential recession, as well as declines in consumer confidence or increase in unemployment rates, could lead to a conservation of cash and decline in the volume of new sales and renewal premiums, or increased surrenders and lapses, and therefore to a decline in our premium revenue or increase in benefit expenses paid out.
•Market volatility, specifically declining equity markets, negatively impact the fair market value of our equity securities, leading to investment-related losses that negatively affect our GAAP operating revenue and profitability.
•We are subject to credit risk in our investment portfolio. Defaults by third parties in the payment or performance of their obligations under these securities could reduce our investment income or result in the recognition of realized losses. Additionally, downgrades in the bonds in our portfolio may result in the recognition of credit related allowances and cause us to reduce the carrying value of our investment portfolio. This could negatively affect our stockholders' equity.
•Low or declining interest rates could negatively affect us for many reasons, including:
◦Our fixed maturity investment portfolio is primarily invested in callable securities. As interest rates have declined and remained ultra-low over the past decade, many of these securities were called and we have had to reinvest in lower interest rate bonds, leading to reduced net investment income and low yields.
◦Some of our products, principally endowment products and traditional whole life insurance with annuity riders, expose us to the risk that decreases in interest rates will reduce our "spread", or the difference between the amounts we are required to pay under our contracts to policyholders and the rate of return we are able to earn on our investments intended to support obligations under the contracts.
◦An interest or discount rate is used in calculating reserves for our insurance products. We set our reserve discount rate assumptions based on our current and expected future investment yield for assets supporting the reserves, considering current and expected future market conditions. If the discount rate assumed in our reserve calculations is higher than our future investment returns (due to lower interest rates), our invested assets will not earn enough investment income to support our future benefit payments. In that case, we may be required to record additional liabilities and/or increase our capital contributions to our insurance subsidiaries in the period this occurs.
•Rising interest rates may negatively affect us as follows:
◦Rising interest rates typically reduce the market values of fixed income assets, as the interest payments on such assets become less competitive relative to newer high rate fixed income instruments. This leads to material unrealized losses and negatively affects our stockholders' equity.
◦Policies may become less attractive to our policyholders in a rising interest rate environment. They may surrender their policies or make early withdrawals to increase their returns, requiring us to liquidate investments and realize an actual loss.
•Some of our investments, such as mortgage-backed and other asset-backed securities, carry prepayment risk. As interest rates increase, the likelihood of prepayment is lower, as the issuer will want to make payments based on the lower interest rates. If the repayment of principal occurs later than we expected, our cash flow could be negatively impacted. As interest rates decrease, issuers are more likely to pre-pay, which could cause us to have to re-invest the pre-paid cash at lower interest rates, reducing our yields and net investment income.
December 31, 2023 | 10-K 21
•The decision of whether to record a credit loss impairment is determined by our assessment of the financial condition and prospects of a particular issuer, projections of future cash flows and recoverability as well as our ability and intent to hold the securities to recovery or maturity. There can be no assurance that we have accurately assessed the level of impairments taken. Historical trends may not be indicative of future impairments and additional impairments may need to be taken in the future. Any event reducing the value of our securities on an other than temporary basis may have a material adverse effect on our business, results of operations, or financial condition.
CYBERSECURITY AND TECHNOLOGY RISKS
THE COMPANY RELIES ON OUR INFORMATION TECHNOLOGY SYSTEMS, AND THE DATA MAINTAINED WITHIN THOSE SYSTEMS, TO MANAGE MANY ASPECTS OF OUR BUSINESS. CYBERSECURITY RISKS, THE FAILURE OF OUR SYSTEMS TO OPERATE PROPERLY AND/OR THE FAILURE TO MAINTAIN THE CONFIDENTIALITY, INTEGRITY, AND AVAILABILITY OF POLICYHOLDER AND CLAIMS DATA, INCLUDING PERSONAL IDENTIFYING INFORMATION, COULD RESULT IN A MATERIALLY ADVERSE EFFECT ON OUR BUSINESS, REPUTATION, FINANCIAL CONDITION AND RESULTS OF OPERATIONS.
Our failure to maintain effective information systems could adversely affect our business.
We must maintain and enhance our existing information systems and develop and integrate new information systems to keep pace with continuing changes in information processing technology, evolving industry and regulatory standards and changing customer preferences in a cost-effective manner. If we do not maintain adequate systems, we could experience adverse consequences, including inadequate information on which to base pricing, underwriting and reserve decisions, regulatory problems, failure to meet prompt payment obligations, increases in administrative expenses and loss of customers. Our failure to maintain effective and efficient information systems, or our failure to consolidate our existing systems could have a material adverse effect on our results of operations and financial condition.
Some of our information technology systems and software are mainframe-based, legacy-type systems that require an ongoing commitment of resources to maintain current standards. Our systems utilize proprietary code requiring highly skilled personnel. Due to the unique nature of our proprietary operating environment, we could have difficulty finding personnel with the skills required to provide ongoing system maintenance and development as we seek to keep pace with changes in our products and business models, information processing technology, evolving industry and regulatory standards and policyholder needs.
We are continuously evaluating and enhancing systems and creating new systems and processes as our business depends on our ability to maintain and improve our technology. Due to the complexity and interconnectedness of our systems and processes, these changes, as well as changes designed to update and enhance our protective measures to address new threats, increase the risk of a system or process failure or the creation of a gap in our security measures. Any such failure or gap could adversely affect our business operations and results of operations.
A cyber attack or other security breach could disrupt our operations, result in the unauthorized disclosure or loss of confidential data, damage our reputation or relationships, and expose us to significant financial and legal liability, which may adversely affect our business, results of operations, or financial condition.
We store confidential information about our business and our policyholders, independent marketing firms, and independent agents, consultants and others on our information technology systems, including proprietary and personally identifiable information. As part of our normal business operations, we use this information and engage third-party providers, including outsourcing, cloud computing, and other business partners, that store, access, process, and transmit such information on our behalf. We devote significant resources and employ security measures to help protect our information technology systems and confidential information, and we have programs in place to detect, contain, and respond to information security incidents. However, because the techniques used to obtain unauthorized access, disable or degrade service, or sabotage systems change frequently and may be difficult to detect for long periods of time, we and our third-party providers may be unable to anticipate these techniques or implement adequate preventative measures. In addition, hardware, software, or applications we develop or procure from third parties or through open source solutions may contain defects in design or manufacture or other problems that could unexpectedly compromise our information security. Unauthorized parties, whether within or outside our company, may disrupt or gain access to our systems, or those of third parties with
December 31, 2023 | 10-K 22
whom we do business, through human error, misfeasance, fraud, trickery, or other forms of deceit, including break-ins, use of stolen credentials, social engineering, phishing, or other cyber attacks, computer viruses, malicious codes, and similar means of unauthorized and destructive tampering.
We and our third-party providers experience information security incidents from time to time. There is no assurance that our security systems and measures will be able to prevent, mitigate, or remediate future incidents. A successful penetration or circumvention of the security of our information technology systems, or those of third parties with whom we do business, could cause serious negative consequences for us, including significant disruption of our operations, unauthorized disclosure or loss of confidential information, harm to our brand or reputation, loss of customers and revenues, violations of privacy and other laws, and exposure to litigation, monetary damages, regulatory enforcement proceedings, fines, and potentially criminal proceedings and penalties. If we are unaware of the incident for some time after it occurs, our exposure could increase. In addition, the costs to address or remediate systems disruptions or security threats or vulnerabilities, whether before or after an incident, could be significant. As we continue to build our digital capabilities and focus on enhancing the customer experience, the amount of information that we retain and share with third parties is likely to grow, increasing the cost to prevent data security breaches and the cost and potential consequences of such breaches. An information technology systems failure could also interfere with our ability to comply with financial reporting and other regulatory requirements, exposing us to potential disciplinary action by regulators.
Although we have insurance against some cyber risks and attacks, we may be subject to litigation and financial losses that exceed our policy limits, are subject to deductibles or are not covered under any of our current insurance policies.
The failure of our business recovery and incident management processes to resume our business operations in the event of a catastrophe, an epidemic, a cyber attack, or other event could adversely affect our profitability, results of operations, or financial condition.
In the event of a disaster such as a catastrophe, an epidemic, a cyber attack, cyber security breach or other information technology systems failure, a terrorist attack, or war, unanticipated problems with our disaster recovery systems could have a material adverse impact on our ability to conduct business and on our results of operations and financial condition, particularly if those problems affect our information technology systems and destroy valuable data or result in a significant failure of our internal control environment. In addition, in the event that a significant number of our employees were unavailable in the event of a disaster, our ability to effectively conduct business could be severely compromised.
The failure of our information technology and/or disaster recovery systems for any reason could cause significant interruptions or malfunctions in our or our customers’ operations and result in the loss, theft, or failure to maintain the security, confidentiality or privacy of sensitive data, including personal information relating to our customers. Such a failure could harm our reputation, subject us to regulatory sanctions, legal claims, and increased expenses, and lead to a loss of customers and revenues.
RISKS RELATED TO HOLDING OUR SECURITIES
The number and location of our shareholders may make it difficult to obtain approval of certain corporate actions.
Because we allow our policyholders to use their policy dividends to purchase our Class A common stock through our SIP, we have over 84,000 shareholders and approximately 40% of our shareholders hold less than 100 shares each. Many of these shareholders are located in Latin America and the Pacific Rim, where most of our policies are sold, and English may not be their native language. We believe that because of this, we typically have low voter turn-out at our annual meetings and therefore any proposal, such as one related to a merger or an acquisition of our Company, or an amendment to our articles of incorporation, that may require the affirmative vote of a majority of the outstanding shares of our Class A common stock, may be difficult to approve.
Our Class A common stock is not registered in any foreign country.
As mentioned above, a significant portion of our Class A common stock has been purchased under the SIP by foreign holders of life insurance policies. The Class A common stock sold under the SIP is registered with the SEC
December 31, 2023 | 10-K 23
pursuant to a Form S-3 registration statement under the Securities Act of 1933 but is not registered under the laws of any foreign jurisdiction. If a foreign securities regulatory authority were to determine the offer and sale of our Class A common stock under the SIP was not allowed under applicable laws and regulations of its jurisdiction, such authority may issue or assert a fine, penalty or cease and desist order against our offer and sale of Class A common stock in that foreign jurisdiction. There is a risk our Class A common stock price could be negatively impacted by a decrease in participation in the SIP.
Applicable insurance laws in the jurisdictions where our insurance subsidiaries are domiciled may discourage takeovers and business combinations that our shareholders might consider to be in their best interests.
Insurance laws in the jurisdictions in which our insurance subsidiaries are domiciled require regulatory actions for certain transactions, such as a merger or acquisition of our Company, that our shareholders might consider in their best interests. To the extent the interests of our policyholders and stockholders conflict, the insurance regulators consider the best interests of policyholders over the best interests of our shareholders. As a result, our shareholders may be prevented from receiving the benefit from any premium to the market price of our Class A common stock that may be offered by a bidder in a takeover context or such regulatory approval requirement may delay, deter, render more difficult or prevent a takeover attempt or a change in control.
Item 1B. UNRESOLVED STAFF COMMENTS
None.
Item 1C. CYBERSECURITY
Like other firms in the financial services sector, insurers like us are particularly vulnerable to cybercrime due to our large amounts of customer data. Insurance-related data is particularly interesting to cybercriminals because of its inherent confidentiality. Often linked to policyholders, sensitive data helps insurers customize their policies, products, and prices for each client. The scope of personally identifiable information and sensitive data processed by insurers puts the industry at increased risk of cybercrime. Cyber attacks can lead to the loss of confidential data, business, and reputation. Additionally, business disruption through cyber incidents is also a major problem for insurance companies, which need to react quickly to fulfill their contracts and maintain the trust of their clients. Because of the risks posed to our business and customers, we have developed robust processes for assessing, identifying and managing our cybersecurity threats.
We recognize the importance of assessing, identifying, and managing material risks associated with cybersecurity threats. Cybersecurity risks related to our business, technical operations, privacy and compliance issues are identified and addressed through a multi-faceted approach including third party assessments, IT security, and external audits. Cybersecurity risks are integrated into our overall enterprise risk management process. To defend, detect and respond to cybersecurity incidents, we, among other things: perform penetration testing using external third-party tools and techniques to test security controls and conduct employee training.
We have implemented incident response and breach management processes which have four overarching and interconnected stages: 1) preparation for a cybersecurity incident, 2) detection and analysis of a security incident, 3) containment, eradication and recovery, and 4) post-incident analysis. Such cybersecurity incident responses are overseen by leaders from our Information Security, IT, Finance, Compliance and Legal teams.
Security events and data incidents are evaluated, ranked by severity and prioritized for response and remediation. Incidents are evaluated to determine materiality as well as operational and business impact, and reviewed for privacy impact. We also conduct tabletop exercises to simulate responses to cybersecurity incidents.
Our risk management program also assesses third party risks, and we perform third-party risk management assessments to identify and mitigate risks from third parties such as vendors, suppliers, and other business partners associated with our use of third-party service providers. Cybersecurity risks are evaluated when determining the selection and oversight of applicable third-party service providers when handling and/or processing our employee, business or customer data. In addition to new vendor onboarding, we perform periodic ongoing security reviews of our critical vendors.
December 31, 2023 | 10-K 24
We describe whether and how risks from identified cybersecurity threats, including as a result of any previous cybersecurity incidents, have materially affected or are reasonably likely to materially affect us, including our business strategy, results of operations, or financial condition, under the heading “Cybersecurity and Technology Risks” included as part of our risk factor disclosures at Item 1A - Risk Factors - of this 10-K.
While we have devoted significant financial and personnel resources to implement and maintain the security measures described above, and in order to meet regulatory requirements and customer expectations, there can be no guarantee that our policies and procedures will be properly followed in every instance or that those policies and procedures will be effective. Although our Risk Factors include further detail about the material cybersecurity risks we face, cybersecurity incidents have not materially affected our business to date. We can provide no assurance that there will not be incidents in the future or that they will not materially affect us, including our business strategy, results of operations, or financial condition.
Cyber Governance.
Cybersecurity is a key element of the Company's enterprise risk management (ERM). Identification and management of the Company's key risks, including cybersecurity, starts with the executive management team, who is responsible for identifying key strategic, insurance, financial, regulatory and operational risks to the Company and managing them on a day-to-day basis. Because of the importance of cybersecurity, the Company has a Chief Information Security Officer ("CISO") who is primarily responsible for managing our cybersecurity risk in conjunction with our Vice President of Information Technology. Our CISO is informed about and monitors prevention, detection, mitigation, and remediation efforts through regular communication and reporting from employees in the information technology team and through the use of technological tools and software and results from third party audits. We have an escalation process in place to inform senior management and the Board of Directors of material issues.
Our CISO has served in that position since 2018 and is an experienced security leader with over 20 years’ experience. In addition to his current role, our CISO has led security and IT audit functions at healthcare technology and population health organizations. His experience includes work in the fields of security, application development, and internal audit at a Fortune 100 company. Our CISO is a Certified Information Security Manager (CISM), Certified Information Systems Auditor (CISA), and a member of the ISACA and ISSA organizations. He received his bachelors’ degree from Middle Tennessee State University and served in the United States Marine Corps. Additionally, Gerald W. Shields, our CEO and a member of the Board, has experience in assessing and managing cybersecurity risk and, in addition to his former roles as Chief Information Officer at several companies, he has a Cyber Security Oversight Certificate from Carnegie Mellon Institute.
Our Audit Committee Charter tasks this committee with oversight of the Company's major enterprise risk exposure, including risks related to cybersecurity, and the steps management takes to monitor and control such exposures. The Audit Committee holds its regular meetings on a quarterly basis and at each of those meetings receives a information security update report from the Company's CISO, which report includes cybersecurity events that may have impacted the Company as well as an overview of the Company's security program and efforts to prevent, detect, mitigate, and remediate issues. The CISO also attends the regularly scheduled Board meetings to give his information security report to all members of the Board.
Item 2. PROPERTIES
We lease our principal office at the Domain in Austin, Texas to service all business entities and operations. We lease space in Puerto Rico for CICA International and in Louisiana, Arkansas and Mississippi related to our Home Service Insurance operations. We also own properties in Louisiana related to our Home Service Insurance operations.
Item 3. LEGAL PROCEEDINGS
None.
Item 4. MINE SAFETY DISCLOSURES
Not applicable.
December 31, 2023 | 10-K 25
PART II
Item 5. MARKET FOR REGISTRANT'S COMMON EQUITY, RELATED STOCKHOLDER MATTERS AND ISSUER PURCHASES OF EQUITY SECURITIES
Item 5(a)
Market Information. Our Class A common stock is traded on the New York Stock Exchange ("NYSE") under the symbol CIA. Our Class B common stock is not registered with the SEC nor traded on any exchange. We hold 100% of our Class B common stock in treasury and thus there are no Class B shares outstanding.
Holders. The number of stockholders of record as of March 6, 2024 was as follows:
| | | | | | | | |
| • | Class A Common Stock - | 84,212 | |
| • | Class B Common Stock - | — | |
Dividend Policy. We have never paid cash dividends on our Class A or B common stock and do not expect to pay cash dividends in the foreseeable future, as it is our policy to retain earnings for use in the operation and expansion of our business.
Recent Sales of Unregistered Securities; Use of Proceeds. None.
Item 5(c)
Issuer Purchases of Equity Securities. In May 2022, the Board of Directors authorized an equity repurchase plan for up to $8.0 million. The timing of any share repurchases under the repurchase authorization is dependent upon several factors, including market price of the Company's securities, the Company’s cash on hand, cash flows from operations, general market conditions, the Company's blackout periods, and other considerations. This program has no set termination date and may be suspended or discontinued by the Company’s Board of Directors at any time. The Company purchased the following shares of its Class A common stock during the three months ended December 31, 2023.
| | | | | | | | | | | | | | |
| Period | Total Number of Shares Purchased | Average Price Paid Per Share | Total Number of Shares Purchased as Part of Publicly Announced Plans or Programs | Approximate Dollar Value of Shares that May Yet be Purchased Under the Plans or Programs [2] |
| October 2023 | 66,805 | | $ | 2.99 | | 66,805 | | |
| November 2023 | — | | — | | — | | |
| December 2023 | — | | — | | — | | |
| Total | 66,805 | | | 66,805 | | $ | 4,380,000 | |
[1] The stock repurchase program was publicly announced on May 10, 2022.
[2] The Company was authorized to repurchase up to $8.0 million of its outstanding shares of Class A common stock.
[3] The stock repurchase program does not have an expiration date.
[4] No stock repurchase program has expired during the three months ended December 31, 2023.
[5] There is no stock repurchase program that the Company has determined to terminate prior to expiration, or under which the Company does not intend to make further purchases.
Item 6. [RESERVED]
December 31, 2023 | 10-K 26
Item 7. MANAGEMENT'S DISCUSSION AND ANALYSIS OF FINANCIAL CONDITION AND RESULTS OF OPERATIONS
This section of this Annual Report on Form 10-K generally discusses 2023 and 2022 items and year-to-year comparisons between 2023 and 2022. This discussion should be read in conjunction with the consolidated financial statements and notes thereto included elsewhere in this report.
OVERVIEW
For 55 years, we have been fulfilling the needs of our policyholders and their families by providing insurance products that offer both living and death benefits. Citizens conducts insurance related operations through its insurance subsidiaries, which provide benefits to policyholders throughout the United States and in over 75 different countries. We specialize in offering primarily ordinary whole life insurance, endowment products and final expense insurance in niche markets where we believe we can optimize our competitive position.
As an insurance provider, we collect premiums on an ongoing basis from our policyholders and invest the majority of the premiums to pay future benefits, including claims, surrenders and policyholder dividends. Accordingly, the Company derives its revenues principally from: (1) life insurance premiums earned for insurance coverages provided to insureds in our two operating segments – Life Insurance and Home Service Insurance; and (2) net investment income. In addition to paying and reserving for insurance benefits that we pay to our policyholders, our expenses consist primarily of the costs of selling our insurance products (e.g., commissions, underwriting, marketing expenses), operating expenses and income taxes.
Objective of our Management's Discussion and Analysis
We refer to our Management’s Discussion and Analysis of Financial Condition and Results of Operations as our “MD&A”. The objective of our MD&A is to provide investors with a succinct analysis of the Company's financial performance from management's perspective. We start by discussing the factors that we believe drive our operating results and then we discuss how industry developments and economic circumstances in general (e.g., interest rate environment) affected or could affect our financial performance. After telling you about our industry, we discuss in detail our results of operations for the year ended December 31, 2023 so an investor or potential investor understands the various line items of our profit and loss statements from management’s perspective. Since our investments are one of two principal sources of our revenues, we describe them in detail. Finally, we discuss our capital resources and liquidity so investors better understand how those resources are utilized and how we are able to meet our cash needs.
Throughout the MD&A, we describe how we view the Company and which matters we believe are reasonably likely to affect future operations. We describe our priorities for the business in Item 1. Business - “Strategic Initiatives” and in the MD&A, we describe how we performed on those initiatives and any known trends or uncertainties that might impact our ability to achieve our goals.
Impact of LDTI on Prior Financial Statements
In 2018, the Financial Accounting Standards Board (FASB) issued Accounting Standards Update (ASU) No. 2018-12, Financial Services – Insurance (Topic 944): Targeted Improvements to the Accounting for Long-Duration Contracts, also known as long-duration targeted improvements, or "LDTI", which impacts all insurers that issue long-duration contracts, such as life insurance. The goal of LDTI is to improve, simplify and enhance aspects of accounting for long-duration contracts generally issued by life insurance companies. The changes are intended to result in improvements to our accounting records in the following ways.
•In the new model, cash flow assumptions utilized in determining the liability for future policyholder benefits for certain insurance contracts are required to be updated on at least an annual basis. This varies from the prior model which only required us to update the assumptions if a triggering event occurred, like if a premium deficiency is recognized.
•The discount rate used in determining the liability for future policyholder benefits has been standardized and is based on upper medium grade (low credit risk) fixed income instruments. The effect of discount rate changes is recorded immediately through other comprehensive income.
December 31, 2023 | 10-K 27
•Deferred acquisition costs ("DAC") are now amortized on a constant basis over the expected life of the contract, therefore eliminating the prior amortization methods such as proportion to premium (for traditional life), estimated gross profit (for nontraditional life) or estimated gross margin (for participating life). Additionally, amortization rates are now updated prospectively with DAC being reduced when actual terminations and lapses are greater than expected. By conducting this change, the interest accretion and impairment assessment have been eliminated.
LDTI became effective on January 1, 2023 and required us to make certain changes to our financial statements requiring retrospective application back to January 1, 2021, which is known as the transition date. This Form 10-K includes financial statements that reflect the impact of LDTI. See Part II. Item 8. Financial Statements and Supplementary Data and Part IV, Item 15, Note 1 "Significant Accounting Policies" and "Accounting Pronouncements" in the notes to our consolidated financial statements. As a result of implementing LDTI,
•we have included results for the year ended December 31, 2021 in our consolidated statements of operations and comprehensive income (loss) ("Operating Statement") rather than just the years ended December 31, 2023 and December 31, 2022, as required for a smaller reporting company; and
•the discussion of financial results included in this MD&A for the periods ending December 31, 2022 and 2021 may differ, possibly materially, from the discussions included in the MD&A of our previously filed Annual Report on Form 10-K for each respective year.
The implementation of LDTI did not impact our key operating metrics, which are described below in "The Factors that Drive our Operating Results." Accordingly, while we present operating results for the year ended December 31, 2021, we will only discuss the 2021 results or year-to-year comparisons between 2022 and 2021 where they were impacted by the implementation of LDTI. Discussions of 2021 items and year-to-year comparisons between 2022 and 2021 that are not included in this Form 10-K can be found in “Management’s Discussion and Analysis of Financial Condition and Results of Operations” in Part II, Item 7 of the Company’s Annual Reports on Form 10-K for the fiscal years ended December 31, 2022 (the "2022 10-K") and December 31, 2021 (the "2021 10-K").
The Factors that Drive our Operating Results
We see the following as the primary factors that drive our operating results:
•Sales (i.e., premium revenues)
•Investments
•Claims and surrenders
•Operating expenses
Premium revenues and investment income are our two primary sources of income and thus key to our profitability.
Premium revenues consist of all money deposited by customers into new and existing insurance policies. We believe sales statistics are meaningful to gaining an understanding of, among other things, the attractiveness of our new products, how expansion of our distribution channels affects our revenue, customer retention and the performance of our business from period-to-period. Throughout the MD&A and in Item 1 - Business, we describe the actions and initiatives that we are taking to increase sales and improve retention, sales performance in each period and as compared to prior periods, and how we view trends with respect to sales and retention. Because we ceased
December 31, 2023 | 10-K 28
operations in our property insurance business effective June 30, 2023, the premiums charts below only reflect life insurance and accident and health insurance ("A&H") premium results.
First year premiums (i.e, new sales) increased 12% from 2022 to 2023. In our Life Insurance segment first year premiums increased by 13% from 2022 to 2023 due to the introduction of critical illness and whole life products in 2022 in our international markets, as well as expansion of our white label distribution network in our domestic market. In our Home Service Insurance segment, first year premiums increased from 2022 to 2023 by 8% due to focused marketing campaigns and higher critical illness premiums, but were lower in 2022 as compared to 2021, which we believe is attributed to inflationary pressures beginning in 2022, which impacted this market more than our international market, as well as COVID-19 government aid programs in 2021 that we believe led to increased sales that year.
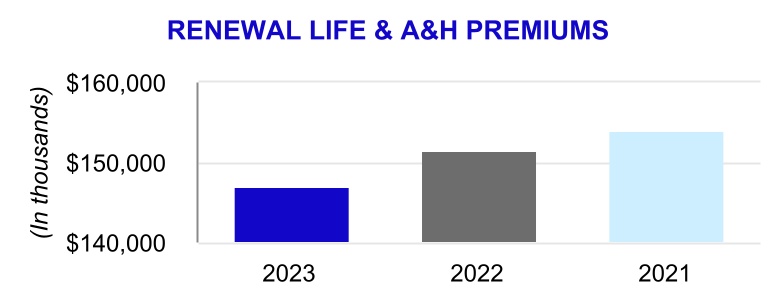
Renewal premiums declined primarily from our Life Insurance segment due to the impact from a higher level of surrenders during the last few years (and thus a lower amount of policies paying renewal premiums) and from matured endowment benefits, which we expected due to contractual expiration dates.
Our net investment income increased by $3.8 million from 2022 to 2023 due primarily to investment income from our limited partnership investments, a growing diversified invested asset base and reinvesting matured or called fixed income maturity securities into a higher interest rate environment.
December 31, 2023 | 10-K 29
Payment of policyholder benefits for claims and surrenders is our largest expense and thus also key to our profitability. The three largest components of this expense are death claims, surrenders and matured endowments.
Our death claim benefits paid have decreased over the 3-year period ending December 31, 2023 due to a lower number of reported death claims. We believe death claims in 2021, and to a lesser extent in 2022, were negatively impacted by COVID-19-related deaths.
Our surrenders increased from 2022 to 2023, which we believe is due to the number of our international life policies that are nearing maturity as well as policies that have passed their surrender charge period.
Matured endowments have increased as expected due to many of our endowment policies reaching their contractual maturity dates.
Operating expenses are our second largest expense and thus also drive our operating results. Operating expenses are meaningful to gaining an understanding of how we manage our business, including among other things, salaries, benefits, and spending on growth initiatives. Our general operating expenses increased by $2.0 million in 2023 as compared to 2022, driven by costs related to strategic growth initiatives, our search for a new CEO, and costs related to moving our international business from Bermuda to Puerto Rico. The transfer of the international business was completed on August 31, 2023.
ECONOMIC AND INSURANCE INDUSTRY DEVELOPMENTS
Over the last decade, life insurers have faced numerous disruptions as an industry, including profitability challenges driven by low interest rates, a global pandemic, high inflation followed by a rapid rise in interest rates, volatility in equity markets, and geopolitical uncertainty. These significant trends and developments have and are impacting our business and industry as follows:
•Increase in Interest Rates; Volatility in Equity and Credit Markets; Inflation. The material uptick in interest rates over the past year has benefited the life insurance sector with respect to increased yields, net investment income and spreads. However, this benefit was offset by inflation and macroeconomic volatility in 2022. The volatility was substantial and the industry moved into material unrealized loss positions on fixed-income portfolios.
Inflation has also impacted our industry over the past year. As the price of energy and food rises, customers will have less discretionary income to spend on insurance products. As the inflationary
December 31, 2023 | 10-K 30
environment continues, the industry may see policy lapses rise, especially among lower and middle-income customers.
•Sustained Low Interest Rate Environment Prior to 2022. Market interest rates are a key driver of our results. The multi-year sustained low interest rate environment significantly reduced the overall yield on investments, as regulations require that the vast majority of a life insurance company's portfolio consist of fixed income securities, which are primarily callable. As interest rates declined, these fixed income securities were called and had to be re-invested in lower rate investments. This has reduced and may continue to reduce profit margins for life insurers by:
◦Reducing the spread between guaranteed interest rates credited to policyholders and interest earned on supporting assets. As older endowment and annuity products are maturing, the guaranteed interest rates may be higher than current yields;
◦Products sold during the last several years with lower interest rate guarantees may be surrendered or lapsed, as customers look to invest in higher interest rate products; or
◦Because products may have been priced with assumptions of higher interest rates (and higher interest earned on supporting assets), life insurance companies may have to increase reserves or trigger loss recognition that could accelerate amortization of COIA.
•Impact of COVID-19. COVID-19 and its related economic conditions have caused significant uncertainty in the world in the past four years. Initially, COVID-19 caused global lockdowns. In response to the pandemic, the U.S. Federal Reserve lowered interest rates to near zero in order to stimulate the economy. COVID-19 has since created significant issues, from supply chain disruptions and staffing issues to surging production costs and high demand of products and services due to financial help from the government. All of these have a role to play in the dramatic rise of inflation.
•Availability of Reinsurance. Reinsurance market dynamics including increased cybersecurity concerns, significant weather-related losses, pandemic losses, and similar to the life insurance industry, economic-related market losses, have led to a decline in the availability of reinsurance, tighter terms (such as, for example, pandemic exclusions) and/or increased reinsurance prices. While we currently cede a limited amount of our primary insurance business to reinsurers, we may encounter difficulty in obtaining reinsurance in the future, forcing us to resort to a more expensive reinsurance market. If we are unable to obtain affordable reinsurance coverage, this may impact our net exposures and the number of underwriting commitments.
•Technology Adoption. Innovation and digital development strategies continue to evolve and impact all industries, including the insurance industry. The onset of the COVID-19 pandemic in 2020 caused companies to adapt to a more digital operations platform, almost overnight. The insurance industry is focused on digitizing distribution channels and empowering agents with advanced digital capabilities. Access to real-time data has streamlined the way we underwrite our products. The rapid development of artificial intelligence and the demand for fee-based, value-added services are challenging our industry. Therefore, it is critical that we embrace these changes for the benefit of our policyholders, agents, employees and stockholders.
EVENTS THAT IMPACTED OUR BUSINESS
From time-to-time, certain events may affect our business in ways that cause current or future results to differ from past results. In addition to factors described in Part I, Item 1A, "Risk Factors", the following events may impact our results of operations or financial condition:
Inflation and Market Volatility
As discussed above, the impact of inflation, which has led to market volatility and rising interest rates, had a material impact on both our results of operations and balance sheet in both 2022 and 2023.
December 31, 2023 | 10-K 31
Market volatility has significantly affected the fair value of our equity securities over the past 3 years and led to large swings in our earnings. Our investment related gains and losses were a gain of $0.8 million in 2023, a loss of $10.3 million in 2022 and a gain of $11.0 million in 2021. Investment related gains and losses derive principally from our investments in equity securities and include unrealized gains and losses from market price changes in these equities during the period. As evidenced, investment related gains and losses can cause significant fluctuations from period to period and while they are included in our operating revenue, are not indicative of our operating results. We believe that investment related gains and losses, whether realized from dispositions or unrealized from changes in market prices of equity securities, have no bearing in understanding our reported results or in evaluating the economic performance of our business. These gains and losses have caused and will continue to cause significant volatility in our periodic earnings.
We could experience higher surrenders and lapses and fewer sales as our policyholders conserve cash due to concerns over inflation and rising costs, particularly in our Home Service Insurance segment, whose customer base is primarily middle- and lower-income individuals.
Rising Interest Rates
To combat the inflation that began as a result of the COVID-19 pandemic, interest rates rose significantly starting in 2022 after being ultra-low for almost a decade. In just a 16-month span starting in March 2022, the Federal Open Market Committee of the Federal Reserve lifted their key benchmark rate from near-zero percent to a 22-year high of 5.25% - 5.5%. Higher interest rates typically reduce the market values of fixed income assets, as the interest payments from existing fixed income assets become less competitive relative to newer higher rate fixed income instruments. Long duration fixed maturity securities, which constitute the vast majority of our investment portfolio as a life insurer because we strive to match our asset duration to our liability duration, were particularly impacted by the rising rates. Higher interest rates resulted in a pre-tax net unrealized loss of $150.1 million on our available-for-sale securities at December 31, 2023 compared to pre-tax net unrealized loss of $201.7 million at December 31, 2022. While the 10 year Treasury yield was the same at both periods, the pre-tax unrealized loss was lower at December 31, 2023, as the investment balance includes recent investment purchases with higher interest rates whose fair market values are closer to amortized cost. The credit ratings and default risk of our fixed maturity securities were not significantly impacted by the rise in interest rates in 2023 and because we intend to hold the long-term investments to maturity, we do not believe that the current unrealized loss is indicative of our long-term financial strength, as we expect the market values to recover prior to the maturity date of most of these investments.
We also believe that the inflationary environment has led to higher surrenders and lapses in 2023 as well as lower sales, as our policyholders conserve cash due to concerns over inflation and rising costs, particularly in our Home Service Insurance segment, where our customer base is primarily middle- and lower-income individuals.
Ceasing Operations of our Property Insurance Business
The Company made a strategic decision to exit the property insurance business on June 30, 2023. This business focused on selling limited liability property insurance policies in Louisiana and Arkansas. This decision negatively impacted our current year premium revenues and financial results. We were contractually obligated to pay the majority of the remaining premiums for our catastrophic reinsurance through the end of 2023. Additionally, we did not collect premiums in the second half of 2023, as we did in the second half of 2022. Accordingly, property premium revenue is less for the year ended December 31, 2023 compared to prior years.
The property insurance business operates through SPFIC and represented less than 1% of the Company’s total consolidated assets as of December 31, 2023 and less than 1% of the Company's total consolidated revenues for the year then ended. The cessation of this business is not reported as a discontinued operation because it is immaterial to our total operations. Additionally, there were no material charges incurred in relation to the exit of our property insurance operations.
December 31, 2023 | 10-K 32
HIGHLIGHTS
Summary
We had income before federal income tax of $26.2 million in 2023, compared to $27.4 million in 2022. In 2023, (i) changes in the fair value of our limited partnership investments due to improved stock market conditions in 2023 increased investment related gains and losses by $11.1 million; and (ii) net investment income improved by $3.8 million due to higher yields on our investment portfolio. These increases were offset by (i) $6.7 million decrease in premiums due to lower renewal premiums in our life insurance segment and ceasing our property insurance business; (ii) $6.7 million increase in total insurance benefits paid or provided due to higher claims and surrenders and higher policyholder liability remeasurement loss; and (iii) $3.0 million of higher commission expense, driven by higher first year sales (which have higher commission payments) and accrual of expense for renewal commissions we may owe to former independent consultants in Venezuela. Our net income per diluted share of Class A common stock was $0.48 for the year ended December 31, 2023.
Key operating results (comparison of 2023 v. 2022):
↓ $6.7 million of premium revenue
Insurance premiums declined 4% in 2023 compared to 2022, totaling $167.0 million and $173.7 million, respectively due to:
•13% growth in first year premiums in our Life Insurance segment was more than offset by lower renewal premiums in this segment due to increases in surrenders and expiring matured endowments;
•our property insurance premiums decreased by $4.1 million due to ceasing this business on June 30, 2023.
↑ $3.8 million of net investment income
Net investment income increased 6% in 2023 compared to 2022, totaling $69.3 million and $65.4 million, respectively, from a higher average portfolio yield in 2023 as well as a growing invested asset base. The average yield on our consolidated investment portfolio was 5% in 2023, a 16 basis point increase from 2022.
↑ $6.7 million of total insurance benefits paid or provided
Total insurance benefits paid or provided increased by 5% due primarily to higher surrenders and matured endowments in our Life Insurance segment.
↑ $2.0 million of general operating expenses
Operating expenses increased due to costs related to strategic growth initiatives, our search for a new CEO, and costs related to moving our international business from Bermuda to Puerto Rico.
Financial Condition at December 31, 2023
•Total assets of $1.7 billion.
•Total investments of $1.4 billion; fixed maturity securities comprised 88% of total investments.
•$4.9 billion of direct insurance in force.
•No debt.
•Fully diluted income per share of Class A common stock of $0.48
•Book value per share of Class A common stock of $3.47.
December 31, 2023 | 10-K 33
CONSOLIDATED RESULTS OF OPERATIONS
Our Operating Segments
We manage our business in two operating segments: Life Insurance and Home Service Insurance. See Part I. Item 1, Business for a discussion about the business operated in each segment.
Our insurance operations are the primary focus of the Company, as those operations generate most of our income. See the discussion under Segment Operations below for detailed analysis. The amount of insurance, number of policies, and average face amounts for ordinary life policies issued during the periods indicated are shown below.
| | | | | | | | | | | | | | | | | | | | | | | | | | | | | | | | | | | | | | |
| Years Ended December 31, | | 2023 | | | | 2022 | |
| | Amount of
Insurance
Issued | | Number of
Policies
Issued | | Average Policy Face
Amount Issued | | Amount of
Insurance
Issued | | Number of
Policies
Issued | | Average Policy Face
Amount Issued | |
| Life Insurance: | | | | | | | | | | | | |
| International | $ | 399,691,578 | | | 4,067 | | | $ | 98,277 | | | $ | 389,338,420 | | | 4,330 | | | $ | 89,916 | | |
| Domestic | 53,356,685 | | | 4,541 | | | 11,750 | | | 1,060,000 | | | 4 | | | 265,000 | | (1) |
| Total Life Insurance | 453,048,263 | | | 8,608 | | | 52,631 | | | 390,398,420 | | | 4,334 | | | 90,078 | | |
| Home Service Insurance | 288,867,758 | | | 22,429 | | | 12,879 | | | 284,320,685 | | | 26,845 | | | 10,591 | | |
| Total | $ | 741,916,021 | | | 31,037 | | | | | $ | 674,719,105 | | | 31,179 | | | | |
(1) The 2022 average domestic policy face amount issued reflects one policy issued for $1.0 million of life insurance in force, driving up the average policy face amount issued. |
In 2023, we issued $741.9 million in new insurance, a 10% increase from 2022. As we previously disclosed, our strategic initiatives include the introduction of new products tailored to our specific markets and expansion of our distribution channels through white-label partnerships. These new products and distribution channels helped drive the increase in total insurance issued of $67.2 million.
The number of policies issued almost doubled in our Life Insurance segment. This growth is attributable to our new white label partnerships and final expense products introduced domestically, which accounted for 53% of the number of policies issued and continued strong sales of our international whole life product introduced in 2022, which accounted for 61% of total insurance issued in this segment in 2023.
In our Home Service Insurance segment, the increase in average policy face amounts issued is attributable to sales campaigns that focused on increasing the face amount of insurance sold as well as the introduction of our new whole life product in this segment, which has a higher maximum face value than our legacy products.
December 31, 2023 | 10-K 34
REVENUES
Our revenues are primarily generated from insurance renewal premiums and investment income from invested assets. The implementation of LDTI did not impact our revenues; for a discussion of 2022 to 2021 comparisons, see the 2022 10-K.
| | | | | | | | | | | | | | | | | |
Years ended December 31,
(In thousands) | 2023 | | 2022 | | 2021 |
| Revenues: | | | | | |
| Premiums: | | | | | |
| Life insurance | $ | 164,609 | | | 167,586 | | | 169,801 | |
| Accident and health insurance | 1,637 | | | 1,278 | | | 1,250 | |
| Property insurance | 793 | | | 4,850 | | | 3,677 | |
| Net investment income | 69,254 | | | 65,426 | | | 61,495 | |
| Investment related gains (losses) | 760 | | | (10,291) | | | 10,991 | |
| Other income | 3,627 | | | 3,675 | | | 3,332 | |
| Total revenues | $ | 240,680 | | | 232,524 | | | 250,546 | |
Total revenues increased in 2023, as we had investment related gains, versus losses in 2022, and higher net investment income.
| | | | | | | | | | | | | | | | | |
Years ended December 31,
(In thousands) | 2023 | | 2022 | | 2021 |
| Premiums: | | | | | |
| First year | $ | 19,341 | | | 17,529 | | | 17,766 | |
| Renewal | 147,698 | | | 156,185 | | | 156,962 | |
| Total premiums | $ | 167,039 | | | 173,714 | | | 174,728 | |
Premium Income. Despite higher first year premium revenues in both segments, life insurance premium revenues decreased in 2023 compared to 2022 due to lower renewal premiums. Accident and health insurance premiums increased in 2023 due to sales of our new critical illness products that were launched in late 2022. Property insurance premiums declined in 2023 as we stopped accepting renewal premiums at the end of May and ceased our operations on June 30, 2023.
Our renewal premiums comprised 88% of our total premium revenue in 2023 and 90% in 2022. Renewal premiums declined by 5% in 2023 compared to 2022; as discussed above, the decline in Life Insurance segment renewal premiums is due to the impact from a higher level of surrenders during the last few years and increasing matured endowment benefits.
Our first year premiums increased 10% in 2023 compared to 2022 due to our new product offerings and expanded domestic distribution.
December 31, 2023 | 10-K 35
Net Investment Income. Our net investment income and investment performance are summarized as follows:
| | | | | | | | | | | | | | | | | |
Years ended December 31,
(In thousands, except for %) | 2023 | | 2022 | | 2021 |
| Gross investment income: | | | | | |
| Fixed maturity securities | $ | 60,127 | | | 58,400 | | | 55,579 | |
| Equity securities | 630 | | | 650 | | | 1,024 | |
| Policy loans | 6,011 | | | 6,189 | | | 6,420 | |
| Other long-term investments | 4,509 | | | 2,535 | | | 809 | |
| Other | 576 | | | 246 | | | 54 | |
| Total investment income | 71,853 | | | 68,020 | | | 63,886 | |
| Less investment expenses | (2,599) | | | (2,594) | | | (2,391) | |
| Net investment income | $ | 69,254 | | | 65,426 | | | 61,495 | |
| | | | | |
| Average invested assets, at amortized cost | $ | 1,517,685 | | | 1,488,408 | | | 1,451,701 | |
| Yield on average invested assets | 4.56 | % | | 4.40 | % | | 4.24 | % |
Due to insurance regulations, fixed maturity securities constitute the vast majority, or 88%, of our investment portfolio based on fair value and thus provide the vast majority of our investment income. Our net investment income increased 6% in 2023 compared to in 2022, primarily due to a higher average portfolio yield on our fixed maturity securities in 2023. Long-term investment income increased as our private equity investment asset base grew.
The annualized yield increased by 16 basis points in 2023 compared to 2022 as a result of the rising interest rate environment.
Investment Related Gains (Losses). We recorded an investment related gain of $0.8 million during 2023, compared to a loss of $10.3 million in 2022. As described above, the gains and losses are primarily related to the fair value change of our limited partnership and equity securities investments, mostly in our Life Insurance segment, due to the volatility in equity markets. We did not sell all of these investments; however, the changes in fair values of our equity securities are reflected as investment related gains or losses in our income statement, in addition to executed transactions that result in a gain or loss.
Other Income. Other income consists primarily of supplemental contracts issued to policyholders in our Life Insurance segment upon the surrender or maturity of their original policies.
December 31, 2023 | 10-K 36
BENEFITS AND EXPENSES
| | | | | | | | | | | | | | | | | |
Years ended December 31,
(In thousands) | 2023 | | 2022 | | 2021 |
| Benefits and expenses: | | | | | |
| Insurance benefits paid or provided: | | | | | |
| Claims and surrenders | $ | 135,993 | | | 119,935 | | | 119,735 | |
| Increase (decrease) in future policy benefit reserves | (5,624) | | | 4,804 | | | 9,773 | |
| Policyholder liability remeasurement (gain) loss | 4,460 | | | 2,884 | | | 1,434 | |
| Policyholders' dividends | 5,542 | | | 6,013 | | | 6,180 | |
| Total insurance benefits paid or provided | 140,371 | | | 133,636 | | | 137,122 | |
| Commissions | 39,241 | | | 36,222 | | | 35,463 | |
| Other general expenses | 47,131 | | | 45,177 | | | 43,370 | |
| Capitalization of deferred policy acquisition costs | (28,301) | | | (24,899) | | | (22,740) | |
| Amortization of deferred policy acquisition costs | 15,460 | | | 14,390 | | | 13,445 | |
| Amortization of cost of insurance acquired | 604 | | | 621 | | | 757 | |
| Goodwill impairment | — | | | — | | | 12,624 | |
| Total benefits and expenses | $ | 214,506 | | | 205,147 | | | 220,041 | |
Payments of claims and surrenders benefits constitute the majority of our expenses. Total benefits and expenses paid increased in 2023 as compared to same period in 2022 driven by higher surrenders and matured endowments, higher policyholder liability remeasurement loss due to the higher surrenders and $3.0 million of higher commissions, driven by higher first year sales (which have higher commissions) and accrual of expense for renewal commissions we may owe to former independent consultants in Venezuela.
Claims and Surrenders. Payments of death claims, surrender benefits and matured endowment benefits are our primary uses of cash. The implementation of LDTI did not impact our reporting for Claims and Surrenders; for a discussion of 2022 to 2021 comparisons, see the 2022 10-K.
| | | | | | | | | | | | | | | | | |
Years ended December 31,
(In thousands) | 2023 | | 2022 | | 2021 |
| Claims and surrenders: | | | | | |
| Death claim benefits | $ | 22,458 | | | 25,758 | | | 31,380 | |
| Surrender benefits | 56,856 | | | 48,743 | | | 51,638 | |
| Endowment benefits | 8,296 | | | 8,864 | | | 9,572 | |
| Matured endowment benefits | 41,855 | | | 31,478 | | | 20,304 | |
| Property claims | 699 | | | 780 | | | 2,112 | |
| Accident and health benefits | 458 | | | 211 | | | 332 | |
| Other policy benefits | 5,371 | | | 4,101 | | | 4,397 | |
| Total claims and surrenders | $ | 135,993 | | | 119,935 | | | 119,735 | |
•Death claim benefits decreased 13% in 2023 compared to 2022 due primarily to a lower volume of reported death claims.
•Surrender benefits increased 17% in 2023 compared to 2022 due to surrenders related to international policies that are nearing maturity as well as policies that have passed their surrender charge period. While we have implemented retention initiatives over the past few years, we believe that the high interest rates are negatively affecting these efforts, as policyholders surrender their policies to re-invest the cash values in higher interest rate products.
December 31, 2023 | 10-K 37
•Many of our endowment policies are reaching their contractual maturity dates and thus matured endowment benefits are increasing. We anticipated the $10.4 million increase in 2023 based upon the contractual maturity dates and expect continued increases in matured endowment benefits over the next few years as more of these contracts expire.
Increase (Decrease) in Future Policy Benefit Reserves. Future policy benefit reserves reflect the liability established to provide for the payment of policy benefits that we expect to pay in the future and thus generally increase when we have a larger in force block of business due to higher sales and persistency (i.e., more policies on which we expect to pay future benefits) and decrease when we have lower sales and persistency. LDTI impacted our reported reserves for 2022 and 2021, as LDTI is intended to improve the timeliness of recognizing changes in the liability for future benefits and standardize the rate used to discount future cash flows. Reserves decreased by $5.0 million from 2021 to 2022 and another $10.4 million from 2022 to 2023 despite increases in insurance issued and increases in our in force block of business due to the amount of reserves released in connection with the higher matured endowments and surrenders.
Policyholder Liability Remeasurement (Gain) Loss. Most of our products are long-duration contracts that provide a specified, fixed amount of insurance benefit in exchange for a fixed premium. When a policy is initially issued, we establish a "net premium ratio" ("NPR") using assumptions regarding expected premiums and policyholder benefit liabilities. On a quarterly basis, we review actual versus expected experience in such quarter, which is reported as a policyholder liability remeasurement gain (if better performance than assumptions) or loss (if lower performance than assumptions). The loss increased from 2021 to 2022 and again to 2023 due to unfavorable surrender experience.
Commissions. Commission expenses are a cost of acquiring business, as commissions are the primary compensation paid to our independent consultants and independent agents for selling our products. First year commission rates are higher than renewal commission rates. Commissions fluctuate directly in relation to sales and thus the increase in commissions over the 3-year period ending December 31, 2023 was due to higher first year sales in each period as compared to the prior period. Additionally, commission expense in 2023 was higher due to a $1.3 million accrual of expense for renewal commissions we may owe to former independent consultants in Venezuela.
Other General Expenses. Total general expenses increased $2.0 million, or 4%, in 2023 compared to 2022. The increase was primarily driven by costs related to strategic growth initiatives, a search for a new CEO and costs related to moving our international business from Bermuda to Puerto Rico. We continue to work on managing controllable operating expenses while investing in growth initiatives.
Capitalization of Deferred Policy Acquisition Costs ("DAC"). We capitalize costs related to successful sales of our insurance products, which include certain commissions, policy issuance costs, and underwriting and agency expenses. These costs vary based upon amounts or premiums received related to new and renewal business. Capitalized DAC increased each year during the 3-year period ended December 31, 2023, which is in line with the increases in new sales activity. Significantly lower amounts are capitalized related to renewal business in correlation with the lower commissions paid on that business compared to first year business, which has higher commission rates.
Amortization of Deferred Policy Acquisition Costs. Amortization of DAC totaled $15.5 million and $14.4 million in 2023 and 2022, respectively. LTDI also changed the manner in which we amortize DAC and thus reported amounts for 2022 and 2021 have changed. DAC is amortized on a constant level basis over the expected term of the related contracts to approximate straight-line amortization.
Goodwill Impairment. In 2021, we recognized a goodwill impairment in our Life Insurance segment of $12.6 million. The impairment was triggered by increases in our carrying value of the Life Insurance segment due to the release of a $43.8 million uncertain tax position in the fourth quarter of 2021 following the expiration of the statute of limitations for the tax year ended December 31, 2017.
December 31, 2023 | 10-K 38
SEGMENT OPERATIONS
As described above, our business is comprised of two operating business segments:
•Life Insurance
•Home Service Insurance
These segments are reported in accordance with U.S. GAAP. The Company evaluates profit and loss performance based on net income (loss) before federal income taxes for these segments. The Company's Other Non-Insurance enterprises include non-insurance operations such as IT and corporate-support functions, which are included in the table presented below to properly reconcile the segment information with the consolidated financial statements of the Company.
The following table sets forth income (loss) before federal income taxes by segment during the periods indicated.
| | | | | | | | | | | | | | | | | |
Years ended December 31,
(In thousands) | 2023 | | 2022 | | 2021 |
| Income before federal income taxes: | | | | | |
| Segments: | | | | | |
| Life Insurance | $ | 28,621 | | | 25,423 | | | 31,902 | |
| Home Service Insurance | 3,013 | | | 6,563 | | | 4,173 | |
| Total Segments | 31,634 | | | 31,986 | | | 36,075 | |
| Other Non-Insurance Enterprises | (5,460) | | | (4,609) | | | (5,570) | |
| Total income before federal income taxes | $ | 26,174 | | | 27,377 | | | 30,505 | |
December 31, 2023 | 10-K 39
LIFE INSURANCE
Our Life Insurance segment primarily issues ordinary whole life insurance and endowment policies in U.S. dollar-denominated amounts to non-U.S. residents in over 75 countries through over 1,000 active independent marketing consultants as of December 31, 2023. Detailed results of operations for the Life Insurance segment for the periods indicated are as follows:
| | | | | | | | | | | | | | | | | |
Years ended December 31,
(In thousands) | 2023 | | 2022 | | 2021 |
| Revenues: | | | | | |
| Premiums: | | | | | |
| Life insurance | $ | 121,424 | | | 124,156 | | | 125,558 | |
| Accident and health insurance | 721 | | | 497 | | | 500 | |
| Net investment income | 54,352 | | | 50,680 | | | 47,216 | |
| Investment related gains (losses), net | 301 | | | (8,826) | | | 9,176 | |
| Other income | 3,605 | | | 3,668 | | | 3,362 | |
| Total revenues | 180,403 | | | 170,175 | | | 185,812 | |
| Benefits and expenses: | | | | | |
| Insurance benefits paid or provided: | | | | | |
| Claims and surrenders | 113,428 | | | 95,576 | | | 91,390 | |
| Increase (decrease) in future policy benefit reserves | (10,931) | | | 3,894 | | | 7,822 | |
| Policyholder liability remeasurement (gain) loss | 4,153 | | | 1,728 | | | 829 | |
| Policyholders' dividends | 5,512 | | | 5,990 | | | 6,140 | |
| Total insurance benefits paid or provided | 112,162 | | | 107,188 | | | 106,181 | |
| Commissions | 22,896 | | | 20,031 | | | 18,747 | |
| Other general expenses | 23,969 | | | 23,192 | | | 20,846 | |
| Capitalization of deferred policy acquisition costs | (20,251) | | | (17,942) | | | (16,174) | |
| Amortization of deferred policy acquisition costs | 12,895 | | | 12,160 | | | 11,536 | |
| Amortization of cost of insurance acquired | 111 | | | 123 | | | 150 | |
| Goodwill impairment | — | | | — | | | 12,624 | |
| Total benefits and expenses | 151,782 | | | 144,752 | | | 153,910 | |
| Income (loss) before federal income taxes | $ | 28,621 | | | 25,423 | | | 31,902 | |
In our Life Insurance segment we reported income before federal income tax of $28.6 million in 2023, as compared to $25.4 million in 2022 and $31.9 million in 2021. As in our consolidated operations, investment related gains and losses caused significant fluctuations from period to period and are not indicative of our operating results. Key operating measures resulted in year-over-year revenue gains in each of the 3-year periods reflected above due to increases in net investment income in each year, and year-over-year benefit and expense increases in each of the 3-year periods due primarily to increases in surrenders and matured endowments and higher commissions, driven by higher first year sales (which have higher commissions) and accrual of expense for renewal commissions we may owe to former independent consultants in Venezuela.
December 31, 2023 | 10-K 40
Life Insurance segment premium breakout is detailed below. Since LDTI did not impact reported revenue results, comparisons between the 2022 and 2021 years are not discussed below. See the 2022 10-K for such discussion.
| | | | | | | | | | | | | | | | | |
Years ended December 31,
(In thousands) | 2023 | | 2022 | | 2021 |
| Premiums: | | | | | |
| First year | $ | 13,479 | | | 11,892 | | | 11,420 | |
| Renewal | 108,666 | | | 112,761 | | | 114,638 | |
| Total premiums | $ | 122,145 | | | 124,653 | | | 126,058 | |
Premiums. First year premiums increased $1.6 million in 2023 compared to 2022 due to sales of new products and expanded domestic distribution. Our total premiums for 2023 decreased $2.5 million compared to 2022 as renewal premiums declined. We derive most of our premium revenue in the Life Insurance segment from renewal premiums, which decreased 4% in 2023 as compared to 2022. As described above, this decline is due to high surrenders and matured endowments over the last several years.
International Premiums. Life insurance premiums are generated largely from our international policyholders living in over 75 different countries across the globe. The majority of our international premiums are derived from whole life and endowment products. The following table sets forth our direct premiums collected from our top five producing countries of our international life insurance business for the periods indicated.
| | | | | | | | | | | | | | | | | | | | | | | | | | | | | | | | | | | |
Years ended December 31,
(In thousands, except for %) | 2023 | | 2022 | | 2021 |
| Country: | | | | | | | | | | | |
| Colombia | $ | 25,453 | | | 21.2 | % | | $ | 25,181 | | | 20.6 | % | | $ | 24,829 | | | 20.2 | % |
| Taiwan | 17,760 | | | 14.8 | | | 18,236 | | | 14.9 | | | 19,042 | | | 15.5 | |
| Venezuela | 15,143 | | | 12.6 | | | 16,429 | | | 13.4 | | | 17,788 | | | 14.5 | |
| Ecuador | 13,379 | | | 11.1 | | | 12,992 | | | 10.6 | | | 13,115 | | | 10.7 | |
| Argentina | 9,533 | | | 7.9 | | | 9,251 | | | 7.6 | | | 9,160 | | | 7.5 | |
| Other Non-U.S. | 38,943 | | | 32.4 | | | 40,172 | | | 32.9 | | | 38,871 | | | 31.6 | |
| Total | $ | 120,211 | | | 100.0 | % | | $ | 122,261 | | | 100.0 | % | | $ | 122,805 | | | 100.0 | % |
Domestic Premiums. Our domestic in-force life insurance business consists primarily of closed blocks of business from various insurance companies we have acquired over the years. As discussed, we have recently re-launched our domestic life insurance business through CICA Domestic by expanding our licenses to new states, developing new final expense and living benefit products, entering into new white label and other distribution agreements and obtaining a B++ A.M. Best rating. Because the majority of this business still consists of closed blocks of business, premiums in our domestic Life Insurance segment were lower in 2023 compared to 2022 despite growth in our newly relaunched business.
Net Investment Income. Our net investment income increased 7% in 2023 compared to 2022 due to our higher average portfolio yield. The majority of investment income is derived from fixed maturity securities; however, long-term investment income continued to increase as our limited partnership asset base grew.
Investment Related Gains (Losses), Net. The investment related gains and losses in each period were a result of the change in estimated fair market value for our limited partnerships, as previously discussed.
Claims and Surrenders. The following table sets forth our primary claims and surrender benefits within our Life Insurance segment. LDTI did not impact claims and surrender benefit expenses; for a discussion of 2022 to 2021 comparison see the 2022 10-K.
December 31, 2023 | 10-K 41
| | | | | | | | | | | | | | | | | |
Years ended December 31,
(In thousands) | 2023 | | 2022 | | 2021 |
| Claims and surrenders: | | | | | |
| Death claim benefits | $ | 4,803 | | | 6,091 | | | 8,160 | |
| Surrender benefits | 53,462 | | | 45,554 | | | 49,439 | |
| Endowment benefits | 8,289 | | | 8,851 | | | 9,565 | |
| Matured endowment benefits | 41,252 | | | 30,897 | | | 19,709 | |
| Accident and health benefits | 265 | | | 96 | | | 135 | |
| Other policy benefits | 5,357 | | | 4,087 | | | 4,382 | |
| Total claims and surrenders | $ | 113,428 | | | 95,576 | | | 91,390 | |
The majority of our claims and surrender benefits in our Life Insurance segment were related to payment of surrender benefits and matured endowment benefits. Policy surrenders and matured endowment benefits increased in 2023 as compared to 2022. Many of our endowment policies are reaching their contractual maturity dates and thus matured endowment benefits are increasing. We expect this trend to continue over the next few years. Policy surrenders increased partially due to surrenders related to international policies that are nearing maturity as well as policies that have passed their surrender charge period. Death claims benefits decreased in 2023 compared to 2022. Mortality experience is closely monitored by the Company as a key performance indicator and these amounts were within expected levels.
Increase (Decrease) in Future Policy Benefit Reserves. The change in future policy benefit reserves decreased in each of the 3-year periods ending December 31, 2023 as a result of reserves released from higher matured endowment and surrender benefits, which decrease was partially offset by increases in insurance issued and increases in our in force block of business.
Policyholder Liability Remeasurement (Gain) Loss. The policyholder liability remeasurement loss increased from 2021 to 2022 and again to 2023 due to unfavorable surrender experience.
Other General Expenses. General expenses increased by 3% in this segment in 2023 compared to 2022 due primarily to expenses related to costs associated with the re-launch of our domestic life insurance business which is a strategic growth initiative.
HOME SERVICE INSURANCE
Our Home Service Insurance products consist primarily of small face amount ordinary whole life and pre-need policies, which are designed to fund final expenses for the insured, primarily consisting of funeral and burial costs. In 2021, we added a new whole life product to this market that has higher allowable face values and a new critical illness insurance product. In June 2023, we stopped selling property insurance.
December 31, 2023 | 10-K 42
Detailed results of operations for the Home Service Insurance segment for the periods indicated are as follows:
| | | | | | | | | | | | | | | | | |
Years ended December 31,
(In thousands) | 2023 | | 2022 | | 2021 |
| Revenues: | | | | | |
| Premiums: | | | | | |
| Life insurance | $ | 43,185 | | | 43,430 | | | 44,243 | |
| Accident and health insurance | 916 | | | 781 | | | 750 | |
| Property insurance | 793 | | | 4,850 | | | 3,677 | |
| Net investment income | 13,832 | | | 13,632 | | | 13,224 | |
| Investment related gains (losses), net | 522 | | | (1,277) | | | 618 | |
| Other income | 17 | | | 1 | | | 7 | |
| Total revenues | 59,265 | | | 61,417 | | | 62,519 | |
| Benefits and expenses: | | | | | |
| Insurance benefits paid or provided: | | | | | |
| Claims and surrenders | 22,565 | | | 24,359 | | | 28,345 | |
| Increase in future policy benefit reserves | 5,307 | | | 910 | | | 1,951 | |
| Policyholder liability remeasurement (gain) loss | 307 | | | 1,156 | | | 605 | |
| Policyholders' dividends | 30 | | | 23 | | | 40 | |
| Total insurance benefits paid or provided | 28,209 | | | 26,448 | | | 30,941 | |
| Commissions | 16,345 | | | 16,191 | | | 16,716 | |
| Other general expenses | 16,690 | | | 16,444 | | | 14,739 | |
| Capitalization of deferred policy acquisition costs | (8,050) | | | (6,957) | | | (6,566) | |
| Amortization of deferred policy acquisition costs | 2,565 | | | 2,230 | | | 1,909 | |
| Amortization of cost of insurance acquired | 493 | | | 498 | | | 607 | |
| Total benefits and expenses | 56,252 | | | 54,854 | | | 58,346 | |
| Income (loss) before federal income taxes | $ | 3,013 | | | 6,563 | | | 4,173 | |
In our Home Service Insurance segment, our net income before federal income taxes decreased by $3.6 million from 2022 to 2023 due primarily to the impact of ceasing our property insurance operations as of June 30, 2023, described above, and higher future policy benefit reserves. Net income before federal income taxes increased from 2021 to 2022 due primarily to lower death claims benefits and fewer hurricane property claims partially offset by investment related losses due to the changes in the fair value of our equity securities and higher other general operating expenses in 2022.
Premiums. Total premium revenue declined in 2023 compared to 2022 due primarily to the impact of ceasing our property insurance operations as of June 30, 2023 and slightly lower life renewal premiums due to lower persistency. Our first year premiums increased 4% in 2023 compared to 2022.
December 31, 2023 | 10-K 43
Claims and Surrenders. Claims and surrender benefits, which are the largest portion of our expenses in the Home Service Insurance segment are summarized below:
| | | | | | | | | | | | | | | | | |
Years ended December 31,
(In thousands) | 2023 | | 2022 | | 2021 |
| Claims and surrenders: | | | | | |
| Death claim benefits | $ | 17,655 | | | 19,667 | | | 23,220 | |
| Surrender benefits | 3,394 | | | 3,189 | | | 2,199 | |
| Endowment benefits | 7 | | | 13 | | | 7 | |
| Matured endowment benefits | 603 | | | 581 | | | 595 | |
| Property claims | 699 | | | 780 | | | 2,112 | |
| Accident and health benefits | 193 | | | 115 | | | 197 | |
| Other policy benefits | 14 | | | 14 | | | 15 | |
| Total claims and surrenders | $ | 22,565 | | | 24,359 | | | 28,345 | |
The majority of claims and surrender benefits in our Home Service Insurance segment are death claim benefits. Death claim benefits decreased 10% in 2023 compared to 2022 due to a lower volume of reported claims. We believe death claims in 2021, and to a lesser extent in 2022 were impacted by COVID-19. Mortality experience is closely monitored by the Company and can fluctuate.
Surrender benefits increased in 2023 compared to 2022. We believe the impact of inflation and curtailment of COVID-19 relief government aid in 2022 is negatively impacting persistency.
Increase in Future Policy Benefit Reserves. Future policy benefit reserves increased in 2023 compared to 2022 due to lower death claims.
Other General Expenses. Other general expenses increased slightly in 2023 compared to 2022 due primarily due to higher employee health benefit costs.
NON-INSURANCE ENTERPRISES
| | | | | | | | | | | | | | | | | |
Years ended December 31,
(In thousands) | 2023 | | 2022 | | 2021 |
| Income (loss) before federal income tax | $ | (5,460) | | | (4,609) | | | (5,570) | |
This operating unit represents the administrative support entities to the insurance operations whose revenues are primarily intercompany and have been eliminated in consolidation under U.S. GAAP, which typically results in a loss. Revenue in this operating unit consists primarily of net investment income and investment related gains or losses, while expenses consist of other general expenses related to corporate functions. The loss reported for 2023 increased as other general expenses increased for reasons discussed above.
INVESTMENTS
Our investments are an integral part of our business success, as we invest the majority of premiums collected to pay for future benefits and rely on net investment income for our ongoing operations. The administration of our investment portfolio is handled by our management and a third-party investment manager, pursuant to Board-approved investment guidelines. As a primary goal of state insurance regulation is to ensure the solvency of an insurance company, state insurance statutes strictly regulate the types of investments that may be made by insurance companies. The majority of investments are required to be in qualified state, municipal, federal and foreign government obligations and high quality corporate bonds. To a lesser extent, we may invest in preferred and common stock, limited partnerships and mortgage loans. In executing investing activities our management and third-party investment manager are incorporating environmental, social and governance factors into their respective
December 31, 2023 | 10-K 44
investment processes as appropriate. These factors include investing in opportunities to help mitigate climate change by pursuing relevant investments across asset classes.
Our cash and invested assets at December 31, 2023 were $1.4 billion, of which 87% was invested in fixed maturity securities, all of which are classified as available-for-sale. We closely monitor the duration of our fixed maturity investments, and investment purchases and sales are executed with the objective of having adequate funds available to satisfy our insurance obligations.
The following table shows the carrying value of our investments by investment category and cash along with the percentage of each to total invested assets.
| | | | | | | | | | | | | | | | | | | | | | | |
As of December 31, (In thousands, except for %) | 2023 | | % | | 2022 | | % |
| Cash and invested assets: | | | | | | | |
| Fixed maturity securities: | | | | | | | |
| U.S. Treasury and U.S. Government-sponsored enterprises | $ | 9,715 | | | 0.7 | % | | $ | 13,278 | | | 1.0 | % |
| Corporate | 787,607 | | | 55.1 | | | 715,645 | | | 52.5 | |
Municipal bonds (1) | 287,231 | | | 20.1 | | | 307,358 | | | 22.5 | |
Mortgage-backed (2) | 97,294 | | | 6.8 | | | 99,995 | | | 7.3 | |
| Asset-backed | 57,134 | | | 4.0 | | | 43,242 | | | 3.2 | |
| Foreign governments | — | | | — | | | 101 | | | — | |
| Total fixed maturity securities | 1,238,981 | | | 86.7 | | | 1,179,619 | | | 86.5 | |
| Short-term investments | — | | | — | | | 1,241 | | | 0.1 | |
| Cash and cash equivalents | 26,997 | | | 1.8 | | | 22,973 | | | 1.7 | |
| Other investments: | | | | | | | |
| Policy loans | 75,359 | | | 5.3 | | | 78,773 | | | 5.8 | |
| Equity securities | 5,282 | | | 0.4 | | | 11,590 | | | 0.8 | |
| Other long-term investments | 82,725 | | | 5.8 | | | 69,558 | | | 5.1 | |
| Total cash and invested assets | $ | 1,429,344 | | | 100.0 | % | | $ | 1,363,754 | | | 100.0 | % |
(1) Includes $124.2 million and $133.2 million of securities guaranteed by third parties at December 31, 2023 and 2022, respectively.
(2) Includes $96.1 million and $98.8 million of U.S. Government agencies and government-sponsored enterprises at December 31, 2023 and 2022, respectively.
The carrying value of the Company’s fixed maturity securities investment portfolio at December 31, 2023 was $1.24 billion compared to $1.18 billion at December 31, 2022. As discussed above, this increase primarily reflects the impact of interest rate sensitivity on the fair value of our fixed maturity securities. The distribution of the credit ratings of our portfolio of fixed maturity securities by carrying value as of December 31, 2023 did not materially change from December 31, 2022 – the weighted average was “A” at both dates.
Cash and cash equivalents increased as of December 31, 2023 compared to December 31, 2022 and fluctuates from period-to-period primarily due to the timing of operating and investing activities.
Equity securities decreased as of December 31, 2023 compared to December 31, 2022 as we reduced our mutual fund exposure to take advantage of higher fixed maturity yields.
Other long-term investments increased to $82.7 million as of December 31, 2023, as compared to $69.6 million as of December 31, 2022 due to additional funding of our limited partnership investments.
December 31, 2023 | 10-K 45
The following table shows annualized investment yields by segment and on a consolidated basis as of December 31 for each year presented.
| | | | | | | | | | | | | | | | | | | | |
| Year | | Life
Insurance | | Home
Service Insurance | | Consolidated |
| 2023 | | 4.58 | % | | 4.53 | % | | 4.56 | % |
| 2022 | | 4.40 | % | | 4.48 | % | | 4.40 | % |
| 2021 | | 4.26 | % | | 4.37 | % | | 4.24 | % |
Yields on invested assets vary between segment operations due to different portfolio mixes and durations in each segment's portfolio. The consolidated yields include our other non-insurance enterprises. The annualized yield increased across our segments in 2023 compared to 2022 resulting primarily from the rising interest rate environment.
Credit quality is an important feature of our investment guidelines for our fixed maturity securities. Credit ratings reported for the periods indicated are assigned by a Nationally Recognized Statistical Rating Organization ("NRSRO") such as Moody’s Investors Service, Standard & Poor’s and Fitch Ratings. A credit rating assigned by a NRSRO is a quality-based rating, with AAA representing the highest quality and D the lowest, with BBB and above being considered investment grade. If there is no NRSRO rating, the Company may use credit ratings of the NAIC Securities Valuation Office ("SVO") as assigned. Securities rated by the SVO are grouped in the equivalent NRSRO category as stated by the SVO, and securities that are not rated by a NRSRO are included in the "other" category.
The following table shows the distribution of the credit ratings of our portfolio of fixed maturity securities by carrying value.
| | | | | | | | | | | | | | | | | | | | | | | |
December 31,
(In thousands, except for %) | 2023 | | % | | 2022 | | % |
| AAA | $ | 36,233 | | | 2.9 | % | | $ | 36,254 | | | 3.1 | % |
| AA | 337,841 | | | 27.3 | | | 355,615 | | | 30.1 | |
| A | 394,158 | | | 31.8 | | | 331,840 | | | 28.2 | |
| BBB | 463,581 | | | 37.4 | | | 440,457 | | | 37.3 | |
| BB and other | 7,168 | | | 0.6 | | | 15,453 | | | 1.3 | |
| Totals | $ | 1,238,981 | | | 100.0 | % | | $ | 1,179,619 | | | 100.0 | % |
The Company made new investments in investment grade bonds during 2023. Non-investment grade securities are the result of downgrades of issuers or securities acquired during acquisitions of other companies, as the Company has not purchased below investment grade securities.
December 31, 2023 | 10-K 46
As of December 31, 2023, the Company held municipal fixed maturity securities that include third-party guarantees. Detailed below is a presentation by credit rating of our municipal holdings by funding type.
| | | | | | | | | | | | | | | | | | | | | | | | | | | | | | | | | | | | | | | | | | | | | | | | | | | | | |
| | December 31, 2023 |
| | General Obligation | | Special Revenue | | Other | | Total | | % Based on
Amortized
Cost |
| (In thousands, except for %) | Fair
Value | | Amortized
Cost | | Fair
Value | | Amortized
Cost | | Fair
Value | | Amortized
Cost | | Fair
Value | | Amortized
Cost | |
| Municipal fixed maturity securities shown including third-party guarantees | | | | |
| AAA | $ | 13,986 | | | 13,921 | | | 6,783 | | | 6,892 | | | — | | | — | | | 20,769 | | | 20,813 | | | 6.6 | % |
| AA | 43,865 | | | 44,132 | | | 109,319 | | | 124,558 | | | 6,367 | | | 6,554 | | | 159,551 | | | 175,244 | | | 55.8 | |
| A | 4,145 | | | 4,462 | | | 88,420 | | | 98,623 | | | 4,411 | | | 4,397 | | | 96,976 | | | 107,482 | | | 34.2 | |
| BBB | 617 | | | 652 | | | 4,878 | | | 5,323 | | | 1,387 | | | 1,450 | | | 6,882 | | | 7,425 | | | 2.4 | |
| BB and other | 2,983 | | | 3,169 | | | 70 | | | 70 | | | — | | | — | | | 3,053 | | | 3,239 | | | 1.0 | |
| Total | $ | 65,596 | | | 66,336 | | | 209,470 | | | 235,466 | | | 12,165 | | | 12,401 | | | 287,231 | | | 314,203 | | | 100.0 | % |
| Municipal fixed maturity securities shown excluding third-party guarantees | | | | |
| | | | | | | | | | | | | | | | | |
| AA | $ | 32,442 | | | 32,513 | | | 33,874 | | | 37,610 | | | 3,886 | | | 3,822 | | | 70,202 | | | 73,945 | | | 23.5 | |
| A | 16,745 | | | 17,073 | | | 98,202 | | | 108,317 | | | 5,890 | | | 6,129 | | | 120,837 | | | 131,519 | | | 41.9 | |
| BBB | 3,009 | | | 3,268 | | | 18,680 | | | 20,356 | | | — | | | — | | | 21,689 | | | 23,624 | | | 7.5 | |
| BB and other | 13,400 | | | 13,482 | | | 58,714 | | | 69,183 | | | 2,389 | | | 2,450 | | | 74,503 | | | 85,115 | | | 27.1 | |
| Total | $ | 65,596 | | | 66,336 | | | 209,470 | | | 235,466 | | | 12,165 | | | 12,401 | | | 287,231 | | | 314,203 | | | 100.0 | % |
The table below shows the categories in which the Company held investments in special revenue bonds that were greater than 10% of fair value based upon the Company's portfolio of municipal fixed maturity securities at December 31, 2023.
| | | | | | | | | | | | | | | | | | | | |
| (In thousands, except for %) | | Fair
Value | | Amortized Cost | | % of Total Fair Value |
| Education | | $ | 47,659 | | | 53,244 | | | 16.6 | % |
| Utilities | | 42,576 | | | 46,035 | | | 14.8 | % |
| Transportation | | 34,068 | | | 40,724 | | | 11.9 | % |
| | | | | | |
The Company's municipal holdings are spread across many states. However, municipal fixed maturity securities from Texas and California comprise the most significant concentration of the total municipal holdings portfolio as of December 31, 2023.
The Company holds 22% and 15% of its municipal holdings in Texas and California issuers, respectively, as of December 31, 2023. There were no other states or individual issuer holdings that represented or exceeded 10% of the total municipal portfolio as of December 31, 2023.
December 31, 2023 | 10-K 47
The table below represents the Company's detailed exposure to municipal bond portfolio by credit rating in Texas at December 31, 2023.
| | | | | | | | | | | | | | | | | | | | | | | | | | | | | | | | | | | | | | | | | | | | | | | |
| | General Obligation | | Special Revenue | | Other | | Total |
| (In thousands) | Fair
Value | | Amortized
Cost | | Fair
Value | | Amortized
Cost | | Fair
Value | | Amortized
Cost | | Fair
Value | | Amortized
Cost |
| Texas securities including third-party guarantees | | | | | | | | |
| AAA | $ | 13,479 | | | 13,416 | | | 2,605 | | | 2,637 | | | — | | | — | | | 16,084 | | | 16,053 | |
| AA | 16,432 | | | 16,405 | | | 13,518 | | | 15,170 | | | — | | | — | | | 29,950 | | | 31,575 | |
| A | — | | | — | | | 17,225 | | | 21,896 | | | — | | | — | | | 17,225 | | | 21,896 | |
| | | | | | | | | | | | | | | |
| | | | | | | | | | | | | | | |
| Total | $ | 29,911 | | | 29,821 | | | 33,348 | | | 39,703 | | | — | | | — | | | 63,259 | | | 69,524 | |
| | | | | | | | | | | | | | | |
| Texas securities excluding third-party guarantees | | | | | | | | |
| | | | | | | | | | | | | | | |
| AA | $ | 25,058 | | | 24,971 | | | 4,496 | | | 4,979 | | | — | | | — | | | 29,554 | | | 29,950 | |
| A | 4,853 | | | 4,850 | | | 16,245 | | | 18,088 | | | — | | | — | | | 21,098 | | | 22,938 | |
| BBB | — | | | — | | | 3,243 | | | 3,416 | | | — | | | — | | | 3,243 | | | 3,416 | |
| BB and other | — | | | — | | | 9,364 | | | 13,220 | | | — | | | — | | | 9,364 | | | 13,220 | |
| Total | $ | 29,911 | | | 29,821 | | | 33,348 | | | 39,703 | | | — | | | — | | | 63,259 | | | 69,524 | |
The table below represents the Company's detailed exposure to municipal bond portfolio by credit rating in California at December 31, 2023.
| | | | | | | | | | | | | | | | | | | | | | | | | | | | | | | | | | | | | | | | | | | | | | | |
| General Obligation | | Special Revenue | | Other | | Total |
| (In thousands) | Fair
Value | | Amortized
Cost | | Fair
Value | | Amortized
Cost | | Fair
Value | | Amortized
Cost | | Fair
Value | | Amortized
Cost |
| California securities including third-party guarantees |
| | | | | | | | | | | | | | | |
| AA | $ | 2,076 | | | 2,055 | | | 29,662 | | | 35,281 | | | 2,480 | | | 2,732 | | | 34,218 | | | 40,068 | |
| A | 1,280 | | | 1,650 | | | 7,079 | | | 8,685 | | | — | | | — | | | 8,359 | | | 10,335 | |
| BBB | — | | | — | | | 570 | | | 570 | | | — | | | — | | | 570 | | | 570 | |
| | | | | | | | | | | | | | | |
| Total | $ | 3,356 | | | 3,705 | | | 37,311 | | | 44,536 | | | 2,480 | | | 2,732 | | | 43,147 | | | 50,973 | |
| California securities excluding third-party guarantees |
| | | | | | | | | | | | | | | |
| AA | $ | 456 | | | 445 | | | 4,524 | | | 5,259 | | | — | | | — | | | 4,980 | | | 5,704 | |
| A | 2,900 | | | 3,260 | | | 15,298 | | | 18,721 | | | 2,480 | | | 2,732 | | | 20,678 | | | 24,713 | |
| BBB | — | | | — | | | 3,275 | | | 3,514 | | | — | | | — | | | 3,275 | | | 3,514 | |
| BB and other | — | | | — | | | 14,214 | | | 17,042 | | | — | | | — | | | 14,214 | | | 17,042 | |
| Total | $ | 3,356 | | | 3,705 | | | 37,311 | | | 44,536 | | | 2,480 | | | 2,732 | | | 43,147 | | | 50,973 | |
IMPAIRMENT CONSIDERATIONS RELATED TO INVESTMENTS IN FIXED MATURITY AND EQUITY SECURITIES
The Company assesses available-for-sale ("AFS") fixed maturity securities in an unrealized loss position for expected credit losses. The Company did not record any credit valuation allowances on fixed maturity securities in 2023 or 2022.
Gross unrealized losses on AFS fixed maturity securities amounted to $158.7 million as of December 31, 2023 and $205.3 million as of December 31, 2022. This decrease in gross unrealized losses during 2023 was a result of the increase in average market interest rates at the end of 2023 as compared to 2022.
December 31, 2023 | 10-K 48
Information on both unrealized and realized gains and losses by category is set forth in Note 2. Investments of the notes to our consolidated financial statements.
REINSURANCE
As is customary among insurance companies, our insurance company subsidiaries reinsure, with other companies, portions of the life insurance risks they underwrite. A primary purpose of reinsurance agreements is to enable an insurance company to reduce the amount of risk by reinsuring the amount exceeding the maximum amount the insurance company is willing to retain. Even though a portion of the risk may be reinsured, our insurance company subsidiaries remain liable to perform all the obligations imposed by the policies issued by them and could be liable if their reinsurers were unable to meet their obligations under the reinsurance agreements.
We believe we have established appropriate reinsurance coverage based upon our net retained insured liabilities compared to our surplus.
The effect of reinsurance on premiums is as follows.
| | | | | | | | | | | | | | | | | |
Years ended December 31,
(In thousands) | 2023 | | 2022 | | 2021 |
| Direct premiums | $ | 170,557 | | | 176,973 | | | 178,806 | |
| Reinsurance assumed | 68 | | | 74 | | | 84 | |
| Reinsurance ceded | (3,586) | | | (3,333) | | | (4,162) | |
| Net premiums | $ | 167,039 | | | 173,714 | | | 174,728 | |
Our insurance subsidiaries monitor the solvency of their reinsurers in seeking to minimize the risk of loss in the event of default by a reinsurer. The primary reinsurers of our insurance subsidiaries are large, well-capitalized entities who have ratings by A.M. Best Company ranging from A- (Excellent) to A+ (Superior).
The effect of reinsurance on life insurance in force is as follows.
| | | | | | | | | | | | | | | | | |
Years ended December 31,
(In millions) | 2023 | | 2022 | | 2021 |
| Direct written life insurance in force | $ | 4,922 | | | 4,797 | | | 4,628 | |
| Reinsurance assumed | 4 | | | 4 | | | 4 | |
| Reinsurance ceded | (620) | | | (544) | | | (466) | |
| Net life insurance in force | $ | 4,306 | | | 4,257 | | | 4,166 | |
Our property insurance company, SPFIC, carried first and second event catastrophe reinsurance coverage of $11.0 million per event and a retention level of $2.4 million per event until it ceased operations on June 30, 2023. Thus, SPFIC was responsible for the first $1.0 million of incurred claims and any claims in excess of $11.0 million per event. In addition, SPFIC shared responsibility with our reinsurers for up to an additional $1.4 million of incurred claims should total incurred claims reach $11.0 million per event.
LIQUIDITY AND CAPITAL RESOURCES
Below are our primary capital resources (based on carrying value) at each of December 31, 2023 and 2022.
| | | | | | | | | | | |
| (In thousands, except for %) | 2023 | | 2022 |
| Fixed maturity securities | $ | 1,238,981 | | | 1,179,619 | |
| Cash and cash equivalents | 26,997 | | | 22,973 | |
Liquidity refers to a company's ability to generate sufficient cash flows to meet the needs of its operations. In the year ended December 31, 2023, our operations provided $22.1 million of net cash. We manage our insurance operations as described herein in order to ensure that we have stable and reliable sources of cash flows to meet our
December 31, 2023 | 10-K 49
obligations. We currently anticipate meeting our short-term and long-term cash needs with cash generated by our insurance operations and from our invested assets. From time-to-time we may raise capital by selling shares in our SIP (as defined below) and we may also access our Credit Facility if needed (also as described below).
PARENT COMPANY LIQUIDITY AND CAPITAL RESOURCES
Citizens is a holding company and has minimal operations of its own. Our assets consist of the capital stock of our subsidiaries, cash and investments. Our liquidity requirements are met primarily from two sources: cash we receive from our operating subsidiaries and our invested assets. We can obtain cash from our insurance subsidiaries in two ways - (1) from dividends, and (2) from fees received for providing administrative services under our service agreements. The ability to receive dividends from our insurance subsidiaries is limited by applicable laws and regulations of Puerto Rico and our U.S. states of domicile (Colorado, Louisiana and Mississippi), which subject insurance operations to significant regulatory restrictions. As discussed in Part I, Item 1, Business and Part I. Item 1A. Risk Factors, these laws and regulations require, among other things, that our insurance subsidiaries maintain minimum capital and surplus requirements, which limit the amount of dividends that can be paid to Citizens. The regulations also require prior approval of our service agreements with the applicable regulatory authority in order to prevent insurance subsidiaries from moving large amounts of cash to the less regulated holding company.
In addition to the above-mentioned sources of cash, we offer a Stock Investment Plan ("SIP"), where investors, policyholders, independent contractors and agents, employees and directors can directly purchase our stock. At our option, purchases of stock under the SIP can be made from newly issued or treasury stock, rather than in the open market, in which case, we can raise capital by selling our shares.
On May 5, 2021, we entered into a 3-year Credit Facility with Regions Bank. See Part IV, Item 15, Note 7, Commitments and Contingencies in the notes to our consolidated financial statements, herein, for a description of the Credit Facility. The Credit Facility may provide additional liquidity to the Company. As of the date of this Form 10-K, we have not borrowed any money under the Credit Facility. We intend to renew the Credit Facility in May 2024.
INSURANCE COMPANY SUBSIDIARY LIQUIDITY AND CAPITAL RESOURCES
The liquidity requirements of our insurance operations are primarily met by premium revenues, investment income and investment maturities or sales. Primary cash needs relate to payments of policyholder benefits, investment purchases, and operating expenses. Historically, cash flow from our operations has been sufficient to meet our cash needs. We have not had to liquidate a material amount of investments to pay our expenses. We believe we have adequate capital resources to support the liquidity requirements of our insurance operations if the cash flow from our insurance operations is insufficient to meet our cash needs. See Contractual Obligations and Off-balance Sheet Arrangements below for a discussion of known and estimated cash needs. Cash flow projections and cash flow tests under various market interest rate scenarios are performed annually to assist in evaluating liquidity needs and adequacy.
Cash from Operating Activities. Cash provided by or used in operating activities is an important liquidity metric because it reflects, during a given period, the amount of cash generated that is available to pay our operating expenses, invest in our business or make strategic acquisitions. Cash provided by operating activities was $22.1 million and $56.9 million for the years ended December 31, 2023 and 2022, respectively. Cash provided by operations was higher in 2022 than 2023 primarily due to higher surrender and matured endowment benefits paid in 2023 as well as higher cash used for payment of commissions in 2023 due to increased first year sales.
Cash used in Investing Activities. We have traditionally also had significant cash flows from both scheduled and unscheduled investment security maturities, redemptions, and prepayments. These cash flows, for the most part, are reinvested in fixed income securities and to a lesser extent limited partnerships or other alternative investments. Net cash outflows from investing activities totaled $14.5 million and $60.7 million for the years ended December 31, 2023 and 2022, respectively. The investing activities fluctuate from period to period due to timing of securities activities such as calls and maturities and reinvestment of those funds. We purchased $72.8 million of fixed maturity securities and we also used $17.3 million to purchase other long-term investments in 2023. 88% of our investments consist of marketable fixed maturity securities classified as available-for-sale that could be readily converted to cash for liquidity needs.
December 31, 2023 | 10-K 50
Trends, Demands and Restrictions on our Uses of Cash
Because claims and surrenders are our largest expense, our primary liquidity concerns include significantly higher than expected (i) early policyholder surrenders or (ii) death claims, as well as high levels of matured endowments in a short timeframe.
In order to mitigate the risk of early policyholder surrenders, we include provisions in some of our insurance policies, such as surrender charges, that help limit and discourage early withdrawals. As previously discussed, surrender benefits have been higher than usual the last several years as many of our policies have reached the age where surrender charges have expired and due to other reasons, like the loss of one of our biggest distributors in Venezuela in 2018. To the extent that early surrenders are higher than expected, our liquidity could be negatively impacted. We continue to monitor surrenders and early withdrawals and have implemented retention initiatives over the last few years in an effort to prevent early surrenders and preserve cash where policies are surrendered near maturity.
We experienced increased death claim benefits in 2021, primarily due to the COVID-19 pandemic. Because the pandemic was an unforeseen event that was not priced into our product assumptions, to the extent we continue to experience increased claims and the associated death benefit payouts as a result of the COVID-19 pandemic or any other unforeseen event, our liquidity could be negatively impacted. Some of our policies include pandemic exclusions, and we carry reinsurance to offset some of these risks. However, death claim benefits decreased by 13% in 2023 compared to 2022.
Our endowment products provide the policyholder with alternatives once the policy matures - they can choose to take a lump sum payout or leave the money on deposit at interest with the Company. As of December 31, 2023, 35% of the Company's total insurance in force was in endowment products. Approximately 18% of the endowments in force will mature in the next five years. Policyholder election behavior is unknown, but if too many policyholders elect lump sum distributions, the Company could be exposed to liquidity risk in years of high maturities. Meeting these distributions could require the Company to sell its investments at inopportune times to pay policyholder withdrawals. Alternatively, if the policyholders were to leave the money on deposit with the Company at interest, our profitability could be impacted if the product guaranteed rate is higher than the market rate we are earning on our investments. We currently anticipate that our available operating cash flow and capital resources will be adequate to meet our need for funds, but we will monitor closely our policyholder behavior patterns.
In our CICA Domestic business, we pay advance commissions on some of our insurance products, meaning we pay an agent their commission immediately upon sale of a policy, rather than "as earned", or when premiums are received by us. Because of this, another liquidity concern is the risk that rapid growth in first year sales of these products could create a significant increase in commission payments, which increases expenses and thus reduces our statutory capital until the commissions are recouped from premiums paid. CICA Domestic sales have increased significantly since the third quarter of 2023 and continue to grow rapidly. To mitigate this risk and strain on capital, we may seek options, such as reinsurance or loans at the holding company level (from the Credit Facility or otherwise) that would allow us to reduce the liquidity risk should CICA Domestic's required commission payments exceed current resources. If we are unable to purchase reinsurance protection in amounts that we consider sufficient or unable to borrow money to contribute capital to CICA Domestic, we could be exposed to cash flow strain.
As discussed above, we are subject to regulatory capital requirements that could affect the Company’s ability to access capital from our insurance operations or cause the Company to have to put additional cash in our wholly-owned subsidiaries.
Our domestic companies are subject to minimum capital requirements set by the NAIC in the form of risk-based capital ("RBC"). RBC considers the type of business written by an insurance company, the quality of its assets, and various other aspects of an insurance company's business to develop a minimum level of capital called "Authorized Control Level Risk-Based Capital". This level of capital is then compared to an adjusted statutory capital that includes capital and surplus as reported under statutory accounting principles, plus certain investment reserves. Should the ratio of adjusted statutory capital to control level RBC fall below 200% for our domestic companies, a series of remedial actions by the affected company would be required. Additionally, we have a parental guarantee between Citizens and CICA Domestic, Citizens' wholly-owned subsidiary domiciled in Colorado, to maintain a RBC level above 350%. At December 31, 2023, our domestic insurance subsidiaries were above the required minimum RBC levels.
December 31, 2023 | 10-K 51
For CICA Domestic, commission advances are non-admitted assets, which increases required regulatory capital and reduces the excess capital available. As discussed above, management is investigating various options in order to reduce both regulatory capital and liquidity risk should the capital required to support this growth exceed current resources. Citizens may have to contribute capital to CICA Domestic to maintain the required RBC ratio.
CICA International is a Puerto Rico domiciled company. The Insurance Code does not specifically set forth minimum capital and surplus standards, but rather requires that an insurer submit a business plan for approval to the OIC that includes proposed minimum capital and surplus. CICA International is required to maintain a minimum of $750,000 in capital and maintain a premium to surplus ratio of 7 to 1. CICA International began issuing new business as of January 1, 2023 and received the transfer of all of CICA Bermuda's in force insurance business as of August 31, 2023. On that date, Citizens entered into a Keep Well Agreement with CICA International to replace the Keep Well Agreement that had been in place between Citizens and CICA Bermuda. The Keep Well Agreement requires Citizens to contribute up to $10 million in capital to CICA International as necessary to ensure that CICA International maintains at least either (i) 112% of its required ratio of premiums to capital and surplus, or (ii) 200% of the minimum capital and surplus requirement, whichever is higher. The initial term of the Keep Well Agreement is 12 months. Since CICA International's capital exceeds both of the metrics, Citizens is not required to make a capital contribution. Any capital that Citizens is required to contribute could negatively impact the Company's capital resources and liquidity.
CONTRACTUAL OBLIGATIONS AND OFF-BALANCE SHEET ARRANGEMENTS
Our material cash requirements from known contractual and other obligations primarily relate to our policy liabilities. Expected timing of those payments are as follows:
| | | | | | | | | | | | | | | | | | | | | | | | | | | | | | | | |
Year ended December 31, 2023 (In thousands) | | Total | | Less than 1
Year | | 1 to 3 Years | | 3 to 5 Years | | More than 5
Years |
| Contractual Obligations: | | | | | | | | | | |
| Investment commitments | | $ | 27,299 | | | 13,149 | | | 11,161 | | | 2,989 | | | — | |
| Real estate leases | | 9,073 | | | 1,283 | | | 2,489 | | | 2,638 | | | 2,663 | |
| | | | | | | | | | |
| | | | | | | | | | |
| | | | | | | | | | |
| | | | | | | | | | |
| | | | | | | | | | |
| | | | | | | | | | |
| | | | | | | | | | |
| | | | | | | | | | |
| Future policy benefit reserves | | 1,403,558 | | | 56,026 | | | 131,253 | | | 103,253 | | | 1,113,026 | |
| | | | | | | | | | |
| | | | | | | | | | |
| | | | | | | | | | |
| | | | | | | | | | |
| Policy claims payable | | 6,637 | | | 6,637 | | | — | | | — | | | — | |
| | | | | | | | | | |
| Total contractual obligations | | $ | 1,446,567 | | | 77,095 | | | 144,903 | | | 108,880 | | | 1,115,689 | |
Future Policy Benefit Reserves and Policy Claims Payable. As a life insurance company, the vast majority of our known cash requirements are for payments related to future policy benefits and policy claims payable, which we estimated in the table above. These amounts have been projected utilizing assumptions based upon our historical experience and anticipated future experience. We have reflected the majority of the obligation in the more than five-years category due to the age of the insured, years to policy maturity and our past experience with claims and surrenders.
The Company does not have off-balance sheet arrangements at December 31, 2023. We do not utilize special purpose entities as investment vehicles, nor do we invest in any such entities that engage in speculative activities of any nature. In addition, we do not hedge our investment positions.
We have no known material cash requirements other than those described above.
CRITICAL ACCOUNTING POLICIES
The preparation of consolidated financial statements in accordance with U.S. GAAP requires management to make estimates and assumptions that affect reported amounts and related disclosures. Management considers an accounting estimate to be critical if: (1) it requires assumptions to be made that were uncertain at the time the estimate was made; and (2) changes in the estimate, or different estimates that could have been selected, could have a material effect on our consolidated results of operations or financial condition. While we believe that our estimates, assumptions and judgments are reasonable, they are based on information presently
December 31, 2023 | 10-K 52
available. Changes in our assumptions, estimates or assessments as a result of unforeseen events or otherwise could have a material impact on our financial position or results of operations.
Management has discussed the development and selection of its critical accounting estimates with the Audit Committee of the Board of Directors, and the Audit Committee has reviewed the disclosure presented. See Note 1. Summary of Significant Accounting Policies in the notes to our consolidated financial statements for further information on our critical accounting policies.
VALUATION OF INVESTMENTS IN FIXED MATURITY SECURITIES
Based upon current accounting guidance, investment securities must be classified as held-to-maturity, available-for-sale ("AFS") or trading. Management determines the appropriate classification at the time of purchase. The classification of securities is significant since it directly impacts the accounting for unrealized gains and losses on securities. Fixed maturity securities are classified as held-to-maturity and carried at amortized cost when management has the positive intent and the Company has the ability to hold the securities to maturity. The Company currently does not hold any fixed maturity securities classified as held-to-maturity. Fixed maturity securities classified as AFS are carried at fair value, with the unrealized holding gains and losses, net of tax, reported in other comprehensive income (loss) and are not reported in earnings until realized. Our fixed maturity securities consist primarily of bonds classified as AFS.
The Company monitors all fixed maturity securities on an on-going basis relative to changes in credit ratings, market prices, earnings trends and financial performance, in addition to specific region or industry reviews. The Company evaluates whether a credit impairment exists for fixed maturity securities by considering primarily the following factors: (a) changes in the financial condition of the security's underlying collateral; (b) whether the issuer is current on contractually obligated interest and principal payments; (c) changes in the financial condition, credit rating and near-term prospects of the issuer; and (d) the payment structure of the security. The Company's best estimate of expected future cash flows used to determine the credit loss amount is a quantitative and qualitative process. Quantitative review includes information received from third-party sources such as financial statements, pricing and rating changes, liquidity and other statistical information. Qualitative factors include judgments related to business strategies, economic impacts on the issuer, overall judgment related to estimates and industry factors as well as the Company's intent to sell the security, or if it is more likely than not that the Company would be required to sell a security before recovery of its amortized cost.
The Company's best estimate of future cash flows involves assumptions including, but not limited to, various performance indicators, such as historical and projected default and recovery rates, credit ratings, and current delinquency rates. These assumptions require the use of significant management judgment and include the probability of issuer default and estimates regarding timing and amount of expected recoveries, which may include estimating the underlying collateral value. In addition, projections of expected future fixed maturity security cash flows may change based upon new information regarding the performance of the issuer. Any credit losses are presented as an allowance rather than as a write-down of AFS fixed maturity securities.
DEFERRED POLICY ACQUISITION COSTS
Deferred policy acquisition costs ("DAC") are costs that are incremental and directly related to the successful acquisition of new or renewal insurance contracts. Such costs include the incremental direct costs of contract acquisition, such as sales commissions; the portion of employees’ total compensation and payroll-related fringe benefits related directly to time spent performing acquisition activities, such as underwriting, issuing, and processing policies for contracts that have actually been acquired; and other costs related directly to acquisition activities that would not have been incurred if the contract had not been acquired.
Inherent in the capitalization and amortization of DAC are certain management judgments about what acquisition costs are deferred, the ending asset balance and the annual amortization. Approximately 93% of our capitalized DAC are attributed to first year and renewal excess commissions. The remaining 7% are attributed to other costs that vary with and are directly related to the successful acquisition of new insurance business. Those costs generally include costs related to the production, underwriting and issuance of new business.
DAC is amortized on a constant level basis over the expected term of the related contracts to approximate straight-line amortization. For the Life Insurance segment, the constant level basis used is policy count in force. For the Home Service Insurance segment, the constant level basis used is face amount in force. The constant level bases used for amortization are projected using mortality and lapse assumptions that are based on the Company’s
December 31, 2023 | 10-K 53
experience, industry data, and other factors at the end of each reporting period and are consistent with those used for the liability for future policy benefit life reserves. Annually, the Company completes experience studies to evaluate mortality and lapse assumptions. If those assumptions are updated, the DAC amortization basis is recalculated and the impact of the assumption change will be reflected in the cohort level amortization in future periods.
POLICY LIABILITIES
As premium revenue is recognized, a liability for future policy benefits is accrued. The liability for a future policy benefit is the present value of estimated future policy benefits to be paid to or on behalf of policyholders less the present value of estimated future net premiums to be collected from policyholders. The liability is estimated using current assumptions that include investment yields, discount rate, mortality, lapses and withdrawals. These current assumptions are based on judgements that consider the Company’s historical experience, industry data, and other factors. Annually, the Company completes experience studies to evaluate mortality and lapse assumptions. The results of these studies are used to update current year best estimate assumptions used in establishing benefit liabilities and DAC.
The current discount rate assumption is a yield curve that equals the yield of an upper-medium grade fixed income instrument, based on A-quality corporate bonds. The current discount rate assumption is updated quarterly and used to remeasure the liability at the reporting date, with the resulting change reflected in other comprehensive income. For liability cash flows that are projected beyond the duration of market-observable A credit-rated fixed-income instruments, the Company uses the last market-observable yield level and uses linear interpolation to determine yield assumptions for durations that do not have market observable yields. The locked-in discount rate for policies issued prior to the LDTI transition date equals the rate set at contract issuance. For current year issues, the locked-in discount rate is the average of the current year quarterly discount rates and will change throughout the year as new discount rates are calculated, with the change reflected in net income.
TAX ACCOUNTING
Deferred tax assets and liabilities are recognized for the estimated future tax consequences attributable to differences between the financial statement carrying amounts of existing assets and liabilities and their respective tax bases. Deferred tax assets and liabilities are measured using enacted tax rates in effect for the year in which those temporary differences are expected to be recovered or settled. The effect on deferred tax assets and liabilities of a change in tax rates is recognized in net income in the period in which the change is enacted. CICA International and CICA Bermuda, wholly-owned subsidiaries of Citizens, are considered controlled foreign corporations for U.S. federal tax purposes. As a result, the insurance activity of CICA International and CICA Bermuda are subject to Subpart F of the Internal Revenue Code and are included in Citizens taxable income on its U.S. federal income tax return. Due to the 0% enacted tax rate in Bermuda there are no deferred taxes recorded for CICA Bermuda's temporary differences. CICA International has applied for a tax exemption decree from the Government of Puerto Rico which will freeze the income tax rate at 4% on any taxable earnings in excess of $1.2 million.
As required by U.S. GAAP, we evaluated the recoverability of deferred tax assets and the establishment of a valuation allowance, if necessary, to reduce the deferred tax asset to an amount that is more likely than not to be realized. For the years ended December 31, 2023 and 2022, changes in market conditions including rising interest rates, resulted in deferred tax assets related to the net unrealized capital losses in our investment portfolio. When assessing the need for a valuation allowance on the unrealized capital loss deferred tax assets, we asserted a tax planning strategy to hold a majority of the underlying securities to recovery or maturity. Our ability to assert such a tax planning strategy is dependent upon factors such as our asset/liability matching process, overall investment strategy, projected future product sales and expected liquidity needs. In the event these estimates differ from our prior estimates due to the receipt of new information, we may be required to significantly change the income tax expense recorded in the consolidated financial statements. This includes a further significant decline in the value of assets incorporated into our tax planning strategies which could lead to an increase in our valuation allowance on deferred tax assets having an adverse effect on current and future results.
RECENT ACCOUNTING PRONOUNCEMENTS
December 31, 2023 | 10-K 54
Item 7A. QUANTITATIVE AND QUALITATIVE DISCLOSURES ABOUT MARKET RISK
As a smaller reporting company, we have elected to comply with certain scaled disclosure reporting obligations and therefore are not required to provide the information required by this Item.
Item 8. FINANCIAL STATEMENTS AND SUPPLEMENTARY DATA
Reference is made to the consolidated financial statements, the notes thereto, and the report of our independent registered public accounting firm, as listed on the table of contents.
All other schedules have been omitted as the required information is inapplicable or the information required is presented in the financial statements or the notes thereto filed elsewhere herein.
Item 9. CHANGES IN AND DISAGREEMENTS WITH ACCOUNTANTS ON ACCOUNTING AND FINANCIAL DISCLOSURE
None.
Item 9A. CONTROLS AND PROCEDURES
(a) EVALUATION OF DISCLOSURE CONTROLS AND PROCEDURES
We maintain disclosure controls and procedures (as defined in Rules 13a-15(e) and 15d-15(e) under the Securities Exchange Act of 1934, as amended (the "Exchange Act")) that are designed to ensure that information required to be disclosed in our reports filed or submitted under the Exchange Act is recorded, processed, summarized and reported within the time periods specified in the SEC’s rules and forms, and that such information is accumulated and communicated to our management, including our principal executive officer and principal financial officer, to allow timely decisions regarding required disclosures.
Our management, including our principal executive officer and principal financial officer, evaluated the effectiveness of our disclosure controls and procedures pursuant to Rules 13a-15(e) and 15d-15(e) under the Exchange Act as of December 31, 2023, the end of the period covered by this Annual Report on Form 10-K. Based on such evaluation, our principal executive officer and principal financial officer concluded that our disclosure controls and procedures were effective as of December 31, 2023 to provide reasonable assurance that information required to be disclosed by us in the reports that we file or submit under the Exchange Act is recorded, processed, summarized and reported within the time periods specified in the rules and forms of the SEC and such information is accumulated and reported to management, including our principal executive and financial officers, as appropriate to allow timely decisions regarding disclosure.
(b) MANAGEMENT REPORT ON INTERNAL CONTROL OVER FINANCIAL REPORTING
Management is responsible for establishing and maintaining adequate internal control over financial reporting as defined in Rules 13a-15(f) and 15d-15(f) of the Exchange Act. The Company’s internal control over financial reporting is designed to provide reasonable assurance regarding the reliability of financial reporting and the preparation of financial statements for external purposes in accordance with U.S. GAAP.
Because of its inherent limitations, internal control over financial reporting may not prevent or detect misstatements. Also, projections of any evaluation of effectiveness to future periods are subject to the risk that controls may become inadequate because of changes in conditions, or that the degree of compliance with the policies or procedures may deteriorate.
Management evaluated the design and operating effectiveness of internal control over financial reporting based on criteria established in Internal Control - Integrated Framework (2013) issued by the Committee of Sponsoring Organizations of the Treadway Commission ("COSO"). Based on this evaluation, management concluded that our internal control over financial reporting as of December 31, 2023 was effective.
December 31, 2023 | 10-K 55
Grant Thornton LLP, an independent registered public accounting firm, audited the effectiveness of our internal control over financial reporting as of December 31, 2023. Their attestation report is included in Item 9A(c) of this Annual Report.
(c) ATTESTATION REPORT OF INDEPENDENT REGISTERED PUBLIC ACCOUNTING FIRM
Report of Independent Registered Public Accounting Firm
Board of Directors and Stockholders
Citizens, Inc.
Opinion on Internal Control over Financial Reporting
We have audited the internal control over financial reporting of Citizens, Inc. (a Colorado corporation) and subsidiaries (the “Company”) as of December 31, 2023, based on criteria established in the 2013 Internal Control — Integrated Framework issued by the Committee of Sponsoring Organizations of the Treadway Commission ("COSO"). In our opinion, the Company maintained, in all material respects, effective internal control over financial reporting as of December 31, 2023, based on criteria established in the 2013 Internal Control — Integrated Framework issued by COSO.
We have also audited, in accordance with the standards of the Public Company Accounting Oversight Board (United States) ("PCAOB"), the consolidated financial statements of the Company as of and for the year ended December 31, 2023, and our report dated March 14, 2024, expressed an unqualified opinion on those consolidated financial statements.
Basis for Opinion
The Company’s management is responsible for maintaining effective internal control over financial reporting and for its assessment of the effectiveness of internal control over financial reporting, included in the accompanying Management Report on Internal Control over Financial Reporting. Our responsibility is to express an opinion on the Company’s internal control over financial reporting based on our audit. We are a public accounting firm registered with the PCAOB and are required to be independent with respect to the Company in accordance with the U.S. federal securities laws and the applicable rules and regulations of the Securities and Exchange Commission and the PCAOB.
We conducted our audit in accordance with the standards of the PCAOB. Those standards require that we plan and perform the audit to obtain reasonable assurance about whether effective internal control over financial reporting was maintained in all material respects. Our audit included obtaining an understanding of internal control over financial reporting, assessing the risk that a material weakness exists, testing and evaluating the design and operating effectiveness of internal control based on the assessed risk, and performing such other procedures as we considered necessary in the circumstances. We believe that our audit provides a reasonable basis for our opinion.
Definition and Limitations of Internal Control over Financial Reporting
A company’s internal control over financial reporting is a process designed to provide reasonable assurance regarding the reliability of financial reporting and the preparation of financial statements for external purposes in accordance with generally accepted accounting principles. A company’s internal control over financial reporting includes those policies and procedures that (1) pertain to the maintenance of records that, in reasonable detail, accurately and fairly reflect the transactions and dispositions of the assets of the company; (2) provide reasonable assurance that transactions are recorded as necessary to permit preparation of financial statements in accordance with generally accepted accounting principles, and that receipts and expenditures of the company are being made only in accordance with authorizations of management and directors of the company; and (3) provide reasonable assurance regarding prevention or timely detection of unauthorized acquisition, use, or disposition of the company’s assets that could have a material effect on the financial statements.
Because of its inherent limitations, internal control over financial reporting may not prevent or detect misstatements. Also, projections of any evaluation of effectiveness to future periods are subject to the risk that controls may
December 31, 2023 | 10-K 56
become inadequate because of changes in conditions, or that the degree of compliance with the policies or procedures may deteriorate.
/s/ GRANT THORNTON LLP
Miami, Florida
March 14, 2024
(d) CHANGES IN INTERNAL CONTROL OVER FINANCIAL REPORTING
There were no changes in our internal control over financial reporting during the quarter ended December 31, 2023 that have materially affected, or are reasonably likely to materially affect, our internal control over financial reporting.
Item 9B. OTHER INFORMATION
During the three months ended December 31, 2023, none of the Company’s directors or executive officers adopted or terminated any contract, instruction or written plan for the purchase or sale of Citizens, Inc. securities that was intended to satisfy the affirmative defense conditions of Rule 10b5-1(c) or any “non-Rule 10b5-1 trading arrangement.”
Item 9C. DISCLOSURE REGARDING FOREIGN JURISDICTIONS THAT PREVENT INSPECTIONS
Not applicable.
December 31, 2023 | 10-K 57
PART III
The information in this Part III indicated below is incorporated by reference from other sections of this Annual Report on Form 10-K or from our definitive proxy statement pursuant to General Instruction G(3) of Form 10-K. We plan to file our definitive proxy statement for our 2024 annual meeting of shareholders within 120 days after December 31, 2023.
Item 10. DIRECTORS, EXECUTIVE OFFICERS AND CORPORATE GOVERNANCE
Item 10 of this Annual Report on Form 10-K incorporates by reference the information in the sections entitled "Corporate Governance," "Audit Matters," "Directors" and "Executive Officers" in our Proxy Statement.
Item 11. EXECUTIVE COMPENSATION
Item 11 of this Annual Report on Form 10-K incorporates by reference the information in the sections entitled "Directors - Director Compensation," "Executive Compensation" and "Board Matters - Compensation Committee Interlocks and Insider Participation" in our Proxy Statement.
Item 12. SECURITY OWNERSHIP OF CERTAIN BENEFICIAL OWNERS AND MANAGEMENT AND RELATED STOCKHOLDER MATTERS
Item 12 of this Annual Report on Form 10-K incorporates by reference the information in the sections entitled "Security Ownership of Directors and Management" and "Security Ownership of Certain Beneficial Owners" in our Proxy Statement.
SECURITIES AUTHORIZED FOR ISSUANCE UNDER EQUITY COMPENSATION PLANS
The following table sets forth information regarding securities authorized for issuance under our equity compensation plan, the Citizens, Inc. Omnibus Incentive Plan, as of December 31, 2023. See Note 13. Stock Compensation in the notes to our consolidated financial statements for additional information regarding our Omnibus Incentive Plan. | | | | | | | | | | | | | | | | | | | | |
| Plan Category | | Number of securities to be issued upon exercise of outstanding options, warrants and rights | | Weighted-average exercise price of outstanding options, warrants and rights | | Number of securities remaining for future issuance under equity compensation plans |
| Equity compensation plans approved by security holders | | 573,978 | | | $ | 3.37 | | | 2,234,569 | |
| | | | | | |
| Equity compensation plans not approved by security holders | | — | | | — | | | — | |
| Total | | 573,978 | | | $ | 3.37 | | | 2,234,569 | |
Item 13. CERTAIN RELATIONSHIPS AND RELATED TRANSACTIONS, AND DIRECTOR INDEPENDENCE
Item 13 of this Annual Report on Form 10-K incorporates by reference the information in the sections entitled "Board Matters - Director Independence" and "Board Matters - Certain Relationships and Related Party Transactions" in our Proxy Statement.
Item 14. PRINCIPAL ACCOUNTANT FEES AND SERVICES
Item 14 of this Annual Report on Form 10-K incorporates by reference the information in the section entitled "Audit Matters" in our Proxy Statement.
December 31, 2023 | 10-K 58
PART IV
Item 15. EXHIBITS, FINANCIAL STATEMENT SCHEDULES
(a)Documents filed as part of this Report
(1) and (2) Financial Statements and Schedules
The financial statements and schedules listed on the following index to financial statements and financial statement schedules are filed under Item 8 as part of this Form 10-K. | | | | | |
| Index to Consolidated Financial Statements and Financial Statement Schedules | Page
Reference |
| |
| Financial Statements at December 31, 2023 and 2022 and for the Years Ended December 31, 2023, 2022 and 2021: | |
| |
| |
| |
| |
| Notes to Consolidated Financial Statements | |
| |
| |
| |
| |
| |
| |
| |
| |
| |
| |
| |
| |
| |
| |
| |
| |
| |
| Financial Statement Schedules at December 31, 2023 and 2022 and for the Years Ended December 31, 2023, 2022 and 2021: | |
| |
| |
| |
All other schedules have been omitted because the required information is inapplicable or the information required is presented in the consolidated financial statements or the notes thereto filed elsewhere herein.
(3) Exhibits
December 31, 2023 | 10-K 59
Report of Independent Registered Public Accounting Firm
Board of Directors and Shareholders
Citizens, Inc.
Opinion on the financial statements
We have audited the accompanying consolidated balance sheets of Citizens, Inc. (a Colorado corporation) and subsidiaries (the “Company”) as of December 31, 2023 and 2022, the related consolidated statements of operations and comprehensive income (loss), stockholders’ equity, and cash flows for each of the three years in the period ended December 31, 2023, and the related notes and financial statement schedules included under Item 15(a) (collectively referred to as the “financial statements”). In our opinion, the financial statements present fairly, in all material respects, the financial position of the Company as of December 31, 2023 and 2022 and the results of its operations and its cash flows for each of the three years in the period ended December 31, 2023, in conformity with accounting principles generally accepted in the United States of America.
We also have audited, in accordance with the standards of the Public Company Accounting Oversight Board (United States) (“PCAOB”), the Company’s internal control over financial reporting as of December 31, 2023, based on criteria established in the 2013 Internal Control—Integrated Framework issued by the Committee of Sponsoring Organizations of the Treadway Commission (“COSO”), and our report dated March 14, 2024 expressed an unqualified opinion.
Change in accounting principle
As discussed in Note 1 to the financial statements, the Company has changed its method of accounting for the liability for future policy benefits, deferred policy acquisition costs, and cost of insurance acquired for all periods presented due to the adoption of Accounting Standard Update No. 2018-12, Financial Services – Insurance (Topic 944) Targeted Improvements to the Accounting for Long-Duration Contracts.
Basis for opinion
These financial statements are the responsibility of the Company’s management. Our responsibility is to express an opinion on the Company’s financial statements based on our audits. We are a public accounting firm registered with the PCAOB and are required to be independent with respect to the Company in accordance with the U.S. federal securities laws and the applicable rules and regulations of the Securities and Exchange Commission and the PCAOB.
We conducted our audits in accordance with the standards of the PCAOB. Those standards require that we plan and perform the audit to obtain reasonable assurance about whether the financial statements are free of material misstatement, whether due to error or fraud. Our audits included performing procedures to assess the risks of material misstatement of the financial statements, whether due to error or fraud, and performing procedures that respond to those risks. Such procedures included examining, on a test basis, evidence regarding the amounts and disclosures in the financial statements. Our audits also included evaluating the accounting principles used and significant estimates made by management, as well as evaluating the overall presentation of the financial statements. We believe that our audits provide a reasonable basis for our opinion.
Critical audit matter
The critical audit matter communicated below is a matter arising from the current period audit of the financial statements that was communicated or required to be communicated to the audit committee and that: (1) relates to accounts or disclosures that are material to the financial statements and (2) involved our especially challenging, subjective, or complex judgments. The communication of critical audit matters does not alter in any way our opinion on the financial statements, taken as a whole, and we are not, by communicating the critical audit matter below, providing a separate opinion on the critical audit matter or on the accounts or disclosures to which it relates.
December 31, 2023 | 10-K 60
Assumptions used in the Estimation of the Liability For Future Policy Benefit Reserves - Life Insurance
As described further in Notes 1 and 5 to the financial statements, the Company estimates a liability for future policy benefits which is calculated as the present value of estimated future policy benefits to be paid to or on behalf of policyholders of life insurance contracts, less the present value of estimated future net premiums to be collected from policyholders on those same life insurance contracts. Management’s estimate of the liability for future policy benefit reserves for life insurance was $1.23 billion as of December 31, 2023. The liability is estimated using actuarial assumptions including mortality and lapse. Changes to the mortality and lapse assumptions impact both the timing and amount of estimated future policy payments to be paid and future net premiums to be received on life insurance contracts. These assumptions, which are updated annually, are based on judgements that consider the Company’s historical experience, industry data and other factors. We identified the updating of the mortality and lapse assumptions used in the estimation of the liability for future policy benefit reserves – life insurance as a critical audit matter.
The principal consideration for our determination that the updating of the mortality and lapse assumptions used in the estimation of the liability for future policy benefit reserves for life insurance contracts is a critical audit matter is that the updating of these assumptions requires management to make significant estimates regarding mortality and lapse based on historical experience, industry data and other factors. As such, auditing the updating of such assumptions involved subjective and complex auditor judgment and the involvement of an actuarial specialist.
Our audit procedures related to the updating of the mortality and lapse assumptions used in the estimation of the liability for future policy benefit reserves - life insurance included the following, among others.
•We tested the design and operating effectiveness of management’s review controls over the mortality and lapse assumption updating and approval processes.
•We utilized an actuarial specialist in evaluating management’s methodologies and reasonableness of the assumptions of mortality and lapse, that were used in management’s calculation of future policy benefit reserves on life insurance contracts.
/s/ GRANT THORNTON LLP
We have served as the Company’s auditor since 2021.
Miami, Florida
March 14, 2024
December 31, 2023 | 10-K 61
| | | | | | | | | | | | | | |
CITIZENS, INC. AND CONSOLIDATED SUBSIDIARIES
Consolidated Balance Sheets |
December 31,
(In thousands) | | 2023 | | 2022 |
| Assets: | | | | |
| Investments: | | | | |
| Fixed maturity securities available-for-sale, at fair value (amortized cost: $1,389,038 and $1,381,318 in 2023 and 2022, respectively) | | $ | 1,238,981 | | | 1,179,619 | |
| | | | |
| Equity securities, at fair value | | 5,282 | | | 11,590 | |
| | | | |
| Policy loans | | 75,359 | | | 78,773 | |
| | | | |
| | | | |
| Other long-term investments (portion measured at fair value $82,460 and $66,846 in 2023 and 2022, respectively) | | 82,725 | | | 69,558 | |
| Short-term investments | | — | | | 1,241 | |
| Total investments | | 1,402,347 | | | 1,340,781 | |
| Cash and cash equivalents | | 26,997 | | | 22,973 | |
| Accrued investment income | | 17,360 | | | 17,131 | |
| | | | |
| Reinsurance recoverable | | 3,991 | | | 4,560 | |
| Deferred policy acquisition costs | | 175,768 | | | 162,927 | |
| Cost of insurance acquired | | 10,043 | | | 10,647 | |
| | | | |
| | | | |
| Federal income tax receivable | | 1,546 | | | 601 | |
| | | | |
| Property and equipment, net | | 11,809 | | | 12,926 | |
| Due premiums | | 11,264 | | | 11,829 | |
| | | | |
| Other assets (less allowance for losses of $408 and $347 in 2023 and 2022, respectively) | | 7,803 | | | 6,328 | |
| Total assets | | $ | 1,668,928 | | | 1,590,703 | |
See accompanying Notes to Consolidated Financial Statements.
December 31, 2023 | 10-K 62
| | | | | | | | | | | | | | |
CITIZENS, INC. AND CONSOLIDATED SUBSIDIARIES
Consolidated Balance Sheets |
December 31, continued
(In thousands, except share amounts) | | 2023 | | 2022 |
| Liabilities and Stockholders' Equity: | | | | |
| Liabilities: | | | | |
| Policy liabilities: | | | | |
| Future policy benefit reserves: | | | | |
| Life insurance | | $ | 1,229,253 | | | 1,198,647 | |
| Accident and health insurance | | 889 | | | 767 | |
| Total future policy benefit reserves | | 1,230,142 | | | 1,199,414 | |
| Policyholders' funds: | | | | |
| Annuities | | 133,216 | | | 121,422 | |
| Dividend accumulations | | 44,960 | | | 41,663 | |
| Premiums paid in advance | | 32,446 | | | 36,384 | |
| Policy claims payable | | 6,637 | | | 9,884 | |
| Other policyholders' funds | | 7,363 | | | 7,501 | |
| Total policyholders' funds | | 224,622 | | | 216,854 | |
| Total policy liabilities | | 1,454,764 | | | 1,416,268 | |
| Commissions payable | | 3,445 | | | 1,967 | |
| Deferred federal income tax liability, net | | 1,102 | | | 3,653 | |
| | | | |
| | | | |
| Other liabilities | | 37,488 | | | 41,025 | |
| Total liabilities | | 1,496,799 | | | 1,462,913 | |
Commitments and contingencies (Notes 7 and 8) | | | | |
| Stockholders' Equity: | | | | |
| Common stock: | | | | |
| Class A, no par value, 100,000,000 shares authorized, 53,882,661 and 53,758,176 shares issued and outstanding as of December 31, 2023 and 2022, respectively, including shares in treasury of 4,327,810 and 3,935,581 as of December 31, 2023 and 2022 | | 268,675 | | | 268,147 | |
| Class B, no par value, 2,000,000 shares authorized, 1,001,714 shares issued and outstanding as of December 31, 2023 and 2022, including shares in treasury of 1,001,714 as of December 31, 2023 and 2022 | | 3,184 | | | 3,184 | |
| Retained earnings | | 42,150 | | | 16,309 | |
| Accumulated other comprehensive income (loss) | | (118,155) | | | (137,044) | |
| Treasury stock, at cost | | (23,725) | | | (22,806) | |
| Total stockholders' equity | | 172,129 | | | 127,790 | |
| Total liabilities and stockholders' equity | | $ | 1,668,928 | | | 1,590,703 | |
See accompanying Notes to Consolidated Financial Statements.
December 31, 2023 | 10-K 63
| | | | | | | | | | | | | | | | | | | | |
CITIZENS, INC. AND CONSOLIDATED SUBSIDIARIES
Consolidated Statements of Operations and Comprehensive Income (Loss) |
Years Ended December 31,
(In thousands, except share amounts) | | 2023 | | 2022 | | 2021 |
| Revenues: | | | | | | |
| Premiums: | | | | | | |
| Life insurance | | $ | 164,609 | | | 167,586 | | | 169,801 | |
| Accident and health insurance | | 1,637 | | | 1,278 | | | 1,250 | |
| Property insurance | | 793 | | | 4,850 | | | 3,677 | |
| Net investment income | | 69,254 | | | 65,426 | | | 61,495 | |
| Investment related gains (losses), net | | 760 | | | (10,291) | | | 10,991 | |
| | | | | | |
| Other income | | 3,627 | | | 3,675 | | | 3,332 | |
| Total revenues | | 240,680 | | | 232,524 | | | 250,546 | |
| Benefits and Expenses: | | | | | | |
| Insurance benefits paid or provided: | | | | | | |
| Claims and surrenders | | 135,993 | | | 119,935 | | | 119,735 | |
| Increase (decrease) in future policy benefit reserves | | (5,624) | | | 4,804 | | | 9,773 | |
| Policyholder liability remeasurement (gain) loss | | 4,460 | | | 2,884 | | | 1,434 | |
| Policyholders' dividends | | 5,542 | | | 6,013 | | | 6,180 | |
| Total insurance benefits paid or provided | | 140,371 | | | 133,636 | | | 137,122 | |
| Commissions | | 39,241 | | | 36,222 | | | 35,463 | |
| Other general expenses | | 47,131 | | | 45,177 | | | 43,370 | |
| Capitalization of deferred policy acquisition costs | | (28,301) | | | (24,899) | | | (22,740) | |
| Amortization of deferred policy acquisition costs | | 15,460 | | | 14,390 | | | 13,445 | |
| Amortization of cost of insurance acquired | | 604 | | | 621 | | | 757 | |
| Goodwill impairment | | — | | | — | | | 12,624 | |
| Total benefits and expenses | | 214,506 | | | 205,147 | | | 220,041 | |
| Income (loss) before federal income tax | | 26,174 | | | 27,377 | | | 30,505 | |
| Federal income tax expense (benefit) | | 1,737 | | | 1,370 | | | (42,201) | |
| Net income (loss) | | 24,437 | | | 26,007 | | | 72,706 | |
| Basic Earnings Per Share: | | | | | | |
| Class A common stock | | $ | 0.49 | | | 0.52 | | | 1.46 | |
| Class B common stock | | — | | | — | | | 0.73 | |
| Diluted Earnings Per Share: | | | | | | |
| Class A common stock | | 0.48 | | | 0.51 | | | 1.44 | |
| Class B common stock | | — | | | — | | | 0.72 | |
| Other Comprehensive Income (Loss): | | | | | | |
| Unrealized gains (losses) on fixed maturity securities: | | | | | | |
| Unrealized holding gains (losses) arising during period | | 50,894 | | | (328,673) | | | (41,123) | |
| Reclassification adjustment for losses (gains) included in net income (loss) | | 756 | | | 104 | | | (243) | |
| Unrealized gains (losses) on fixed maturity securities, net | | 51,650 | | | (328,569) | | | (41,366) | |
| Change in current discount rate for liability for future policy benefits | | (34,790) | | | 337,776 | | | 92,396 | |
| Income tax expense (benefit) on other comprehensive income items | | (2,029) | | | 7,262 | | | 1,449 | |
| Other comprehensive income (loss) | | 18,889 | | | 1,945 | | | 49,581 | |
| Total comprehensive income (loss) | | $ | 43,326 | | | 27,952 | | | 122,287 | |
See accompanying Notes to Consolidated Financial Statements.
December 31, 2023 | 10-K 64
| | | | | | | | | | | | | | | | | | | | | | | | | | | | | | | | | | | |
CITIZENS, INC. AND CONSOLIDATED SUBSIDIARIES
Consolidated Statements of Stockholders' Equity |
|
| | Common Stock | Retained Earnings
(Accumulated
Deficit) | Accumulated Other Comprehensive Income (Loss) | Treasury Stock | Total Stockholders' Equity |
| (In thousands) | Class A | | Class B |
| | | | | | | | | | | |
| | | | | | | | | | | |
| | | | | | | | | | | |
| | | | | | | | | | | |
| | | | | | | | | | | |
| | | | | | | | | | | |
| | | | | | | | | | | |
| | | | | | | | | | | |
| | | | | | | | | | | |
| | | | | | | | | | | |
| | | | | | | | | | | |
| | | | | | | | | | | |
| | | | | | | | | | | |
| | | | | | | | | | | |
| | | | | | | | | | | |
| | | | | | | | | | | |
| | | | | | | | | | | |
| | | | | | | | | | | |
| | | | | | | | | | | |
| | | | | | | | | | | |
| | | | | | | | | | | |
| | | | | | | | | | | |
| | | | | | | | | | | |
| | | | | | | | | | | |
| | | | | | | | | | | | | | | | | | | | | | | | | | | | | | | | | | | | |
| |
| |
| | | | | | |
| | | | |
| Balance at December 31, 2020 | $ | 262,869 | | | 3,184 | | | (82,352) | | | 128,255 | | | (11,011) | | | 300,945 | | |
Accounting Standards adopted January 1, 2021 (1) | — | | | — | | | (52) | | | (316,825) | | | — | | | (316,877) | | |
| | | | | | | | | | | | |
| Comprehensive income (loss): | | | | | | | | | | | | |
| Net income (loss) | — | | | — | | | 72,706 | | | — | | | — | | | 72,706 | | |
| Other comprehensive income (loss) | — | | | — | | | — | | | 49,581 | | | — | | | 49,581 | | |
| Total comprehensive income (loss) | — | | | — | | | 72,706 | | | 49,581 | | | — | | | 122,287 | | |
| Acquisition of treasury stock | — | | | — | | | — | | | — | | | (9,090) | | | (9,090) | | |
| | | | | | | | | | | | |
| Stock-based compensation | 2,692 | | | — | | | — | | | — | | | — | | | 2,692 | | |
| Balance at December 31, 2021 | 265,561 | | | 3,184 | | | (9,698) | | | (138,989) | | | (20,101) | | | 99,957 | | |
| Comprehensive income (loss): | | | | | | | | | | | | |
| Net income (loss) | — | | | — | | | 26,007 | | | — | | | — | | | 26,007 | | |
| Other comprehensive income (loss) | — | | | — | | | — | | | 1,945 | | | — | | | 1,945 | | |
| Total comprehensive income (loss) | — | | | — | | | 26,007 | | | 1,945 | | | — | | | 27,952 | | |
| Acquisition of treasury stock | — | | | — | | | — | | | — | | | (2,705) | | | (2,705) | | |
| Issuance of common stock | 2,244 | | | — | | | — | | | — | | | — | | | 2,244 | | |
| Stock-based compensation | 342 | | | — | | | — | | | — | | | — | | | 342 | | |
| Balance at December 31, 2022 | 268,147 | | | 3,184 | | | 16,309 | | | (137,044) | | | (22,806) | | | 127,790 | | |
| Comprehensive income (loss): | | | | | | | | | | | | |
| Net income (loss) | — | | | — | | | 24,437 | | | — | | | — | | | 24,437 | | |
| Other comprehensive income (loss) | — | | | — | | | — | | | 18,889 | | | — | | | 18,889 | | |
| Total comprehensive income (loss) | — | | | — | | | 24,437 | | | 18,889 | | | — | | | 43,326 | | |
| Acquisition of treasury stock | — | | | — | | | — | | | — | | | (919) | | | (919) | | |
| | | | | | | | | | | | |
| Stock-based compensation | 528 | | | — | | | — | | | — | | | — | | | 528 | | |
Other (2) | — | | | — | | | 1,404 | | | — | | | — | | | 1,404 | | |
| Balance at December 31, 2023 | $ | 268,675 | | | 3,184 | | | 42,150 | | | (118,155) | | | (23,725) | | | 172,129 | | |
(1) See Note 1 and (2) see Note 11 in the Notes to Consolidated Financial Statements for more details.
See accompanying Notes to Consolidated Financial Statements.
December 31, 2023 | 10-K 65
| | | | | | | | | | | | | | | | | |
CITIZENS, INC. AND CONSOLIDATED SUBSIDIARIES
Consolidated Statements of Cash Flows |
|
| | | | | |
Years Ended December 31,
(In thousands) | 2023 | | 2022 | | 2021 |
| Cash Flows from Operating Activities: | | | | | |
| Net income (loss) | $ | 24,437 | | | 26,007 | | | 72,706 | |
| Adjustments to reconcile net income (loss) to net cash provided by (used in) operating activities: | | | | | |
| Investment related (gains) losses, net on sales of investments and other assets | (760) | | | 10,291 | | | (10,991) | |
| Net deferred policy acquisition costs | (12,841) | | | (10,509) | | | (9,295) | |
| Amortization of cost of insurance acquired | 604 | | | 621 | | | 757 | |
| Depreciation | 515 | | | 536 | | | 1,140 | |
| Amortization of premiums and discounts on investments | 4,940 | | | 4,240 | | | 5,568 | |
| Stock-based compensation | 588 | | | 461 | | | 646 | |
| Deferred federal income tax expense (benefit) | 860 | | | 1,923 | | | 1,701 | |
| Goodwill Impairment | — | | | — | | | 12,624 | |
| Change in: | | | | | |
| Accrued investment income | (229) | | | (934) | | | (60) | |
| Reinsurance recoverable | 569 | | | 979 | | | 214 | |
| Due premiums | 565 | | | (1,081) | | | 561 | |
| Future policy benefit reserves | (4,062) | | | 4,694 | | | 3,890 | |
| Other policyholders' liabilities | 10,325 | | | 7,553 | | | 20,247 | |
| Federal income tax payable | (922) | | | 161 | | | (44,678) | |
| Commissions payable and other liabilities | (917) | | | 12,652 | | | (15,450) | |
| Other, net | (1,616) | | | (674) | | | 875 | |
| Net cash provided by (used in) operating activities | 22,056 | | | 56,920 | | | 40,455 | |
| Cash Flows from Investing Activities: | | | | | |
| Sales of fixed maturity securities, available-for-sale | 29,883 | | | 33,914 | | | 8,238 | |
| Maturities and calls of fixed maturity securities, available-for-sale | 29,488 | | | 44,493 | | | 53,089 | |
| | | | | |
| Purchases of fixed maturity securities, available-for-sale | (72,802) | | | (120,094) | | | (94,265) | |
| | | | | |
| | | | | |
| Sales of equity securities | 6,631 | | | 500 | | | 7,383 | |
| Principal payments on mortgage loans | 7 | | | 1,098 | | | 10 | |
| Funding of mortgage loans | — | | | — | | | (1,000) | |
| Change in policy loans, net | 3,414 | | | 1,534 | | | 3,011 | |
| Sales of other long-term investments and real estate | 5,394 | | | 5,033 | | | 24,238 | |
| Purchases of other long-term investments | (17,318) | | | (25,870) | | | (40,788) | |
| Purchases of property and equipment | (442) | | | (100) | | | (1,007) | |
| Sales of property and equipment | — | | | — | | | 14 | |
| Maturities of short-term investments | 750 | | | — | | | — | |
| Sales of short-term investments | 499 | | | — | | | — | |
| Purchases of short-term investments | — | | | (1,250) | | | — | |
| Net cash provided by (used in) investing activities | (14,496) | | | (60,742) | | | (41,077) | |
| | | | | |
| See accompanying Notes to Consolidated Financial Statements. |
| | | | | |
December 31, 2023 | 10-K 66
| | | | | | | | | | | | | | | | | |
CITIZENS, INC. AND CONSOLIDATED SUBSIDIARIES
Consolidated Statements of Cash Flows |
|
| | | | | |
Years Ended December 31,
(In thousands) | 2023 | | 2022 | | 2021 |
| Cash Flows from Financing Activities: | | | | | |
| | | | | |
| Annuity deposits | $ | 7,129 | | | 8,626 | | | 8,839 | |
| Annuity withdrawals | (9,686) | | | (8,546) | | | (7,763) | |
| Issuance of common stock | — | | | 2,244 | | | 2,255 | |
| Acquisition of treasury stock | (919) | | | (2,705) | | | (9,090) | |
| Other | (60) | | | (118) | | | (456) | |
| Net cash used in financing activities | (3,536) | | | (499) | | | (6,215) | |
| Net increase (decrease) in cash and cash equivalents | 4,024 | | | (4,321) | | | (6,837) | |
| Cash and cash equivalents at beginning of year | 22,973 | | | 27,294 | | | 34,131 | |
| Cash and cash equivalents at end of year | $ | 26,997 | | | 22,973 | | | 27,294 | |
| | | | | |
| | | | | |
| | | | | |
SUPPLEMENTAL DISCLOSURE OF OPERATING ACTIVITIES:
Cash paid for income taxes during 2023, 2022 and 2021 was $1.8 million, $0.3 million and $1.2 million, respectively.
SUPPLEMENTAL DISCLOSURES OF NONCASH INVESTING AND FINANCING ACTIVITIES:
During 2023, 2022 and 2021, various fixed maturity issuers exchanged securities with book values of $5.4 million, $6.9 million and $12.1 million, respectively, for securities of equal value.
The Company recognized right-of-use assets of $0.1 million and $0.4 million in exchange for new operating lease liabilities during 2023 and 2022, respectively, and none during 2021.
See accompanying Notes to Consolidated Financial Statements.
December 31, 2023 | 10-K 67
| | | | | |
| CITIZENS, INC. | NOTES TO CONSOLIDATED FINANCIAL STATEMENTS |
| |
| |
(1) SUMMARY OF SIGNIFICANT ACCOUNTING POLICIES
BASIS OF PRESENTATION AND CONSOLIDATION
The accompanying consolidated financial statements of Citizens, Inc. and its wholly-owned subsidiaries have been prepared in conformity with U.S. generally accepted accounting principles ("U.S. GAAP").
The consolidated financial statements include the accounts and operations of Citizens, Inc. ("Citizens" or the "Company"), a Colorado corporation, and its wholly-owned subsidiaries, CICA Life Insurance Company of America ("CICA Domestic"), CICA Life Ltd. ("CICA Bermuda"), CICA Life, A.I., a Puerto Rico company ("CICA International"), Citizens National Life Insurance Company ("CNLIC"), Security Plan Life Insurance Company ("SPLIC"), Security Plan Fire Insurance Company ("SPFIC"), Magnolia Guaranty Life Insurance Company ("MGLIC"), Computing Technology, Inc. ("CTI"), Nexo Global Services LLC, a Puerto Rico holding company ("Nexo") and Nexo Enrollment Services LLC, a Puerto Rico service company ("NES"). All significant inter-company accounts and transactions have been eliminated. Citizens and its wholly-owned subsidiaries are collectively referred to as the "Company," "we," "it," "us," or "our".
Our Life Insurance segment operates through CICA International and CICA Domestic. Until December 31, 2022, our international life insurance business operated through CICA Bermuda. Beginning January 1, 2023, all new international policies are issued by CICA International. These companies provide U.S. dollar-denominated endowment contracts internationally, which are principally accumulation contracts that incorporate an element of life insurance protection and ordinary whole life insurance in U.S. dollar-denominated amounts sold to non-U.S. residents. These contracts are designed to provide a fixed amount of insurance coverage over the life of the insured and may utilize rider benefits to provide additional increasing or decreasing coverage and annuity benefits to enhance accumulations. On August 31, 2023, CICA Bermuda transferred all of its insurance in force business to CICA International. Prior to July 1, 2023, our domestic life insurance business operated through CICA Domestic and CNLIC. CICA Domestic issues ordinary whole life, final expense, life products with living benefits, critical illness and credit life and disability policies throughout the U.S. and CNLIC issued ordinary whole life and critical illness policies through June 30, 2023. CNLIC merged into CICA Domestic on July 1, 2023.
Our Home Service Insurance segment operates through our subsidiaries SPLIC, MGLIC and SPFIC, and focuses on the life insurance needs of the middle- and lower-income markets, primarily in Louisiana, Mississippi and Arkansas. Our products in this segment consist primarily of small face amount ordinary whole life, industrial life and pre-need policies, which are designed to fund final expenses for the insured, primarily consisting of funeral and burial costs as well as critical illness and property insurance policies, which cover dwelling and contents. As of June 30, 2023, the Company ceased all operations for SPFIC.
CTI provides data processing systems and services to the Company.
SIGNIFICANT ACCOUNTING POLICIES
INVESTMENTS
Investment securities are classified as held-to-maturity ("HTM"), available-for-sale ("AFS") or trading. Management determines the appropriate classification at the time of purchase. The classification of securities is significant since it directly impacts the accounting for unrealized gains and losses on securities. Fixed maturity securities are classified as HTM and carried at amortized cost when management has the positive intent and the Company has the ability to hold the securities to maturity. Securities classified as AFS are carried at fair value, with the unrealized holding gains and losses, net of tax, reported in other comprehensive income (loss) and are not reported in earnings until realized. Our fixed maturity securities consist primarily of bonds classified as AFS. The Company does not classify any fixed maturity securities as trading or as HTM. Equity securities are measured at fair value with the change in fair value recorded through net income (loss).
Unrealized gains (losses) of fixed maturity securities held as AFS are shown as a separate component of stockholders' equity, net of tax, and is a separate component of other comprehensive income (loss).
The Company assesses AFS fixed maturity securities in an unrealized loss position for expected credit losses. First, we assess whether we intend to sell, or it is more likely than not that we will be required to sell, the security
December 31, 2023 | 10-K 68
| | | | | |
| CITIZENS, INC. | NOTES TO CONSOLIDATED FINANCIAL STATEMENTS |
| (Continued) |
| |
before recovery of its amortized cost. If either of the criteria is met, the security's amortized cost is written down to its fair value. For AFS fixed maturity securities that do not meet either criteria, we evaluate whether the decline in fair value has resulted from credit losses or other factors. In making this assessment, management considers the extent to which fair value is less than amortized cost, any changes to the rating of the security by a rating agency, and adverse conditions specifically related to the security, among other factors. If management deems a credit loss has occurred, the impairment is recorded through an allowance for credit losses rather than as a write-down. Changes in the allowance for credit losses are recorded through investment related gains and losses. Any impairment that has not been recorded through an allowance for credit losses is recognized in accumulated other comprehensive income (loss) on our consolidated balance sheets.
The Company made a policy election to exclude accrued interest from the amortized cost of AFS fixed maturity securities and report accrued interest separately in accrued investment income on the consolidated balance sheets. AFS fixed maturity securities are placed on non-accrual status when we no longer expect to receive all contractual amounts due. Accrued interest receivable is reversed against interest income when a security is placed on non-accrual status. Accordingly, we do not recognize an allowance for credit loss against accrued interest receivable.
Premiums and discounts are amortized or accreted over the life of the related security as an adjustment to yield using the effective interest method. Dividend and interest income are recognized when earned. Realized gains and losses are included in earnings and are derived using the specific identification method for determining the cost of securities sold.
The Company from time to time may dispose of an impaired security in response to asset/liability management decisions, future market movements, business plan changes, or if the net proceeds can be reinvested at a rate of return that is expected to recover the loss within a reasonable period of time.
Policy loans are reported at unpaid principal balances.
Other long-term investments consist primarily of investments in limited partnerships, Federal Home Loan Bank ("FHLB") common stock and mortgage loans. We initially estimate the fair value of investments in limited partnerships by reference to the transaction price. Subsequently, we obtain the fair value of these investments from net asset value information provided by the general partner or manager of the investments, the financial statements of which are audited annually. Recognition of investment income on these funds is delayed due to the availability of the related financial statements, which are generally obtained from the partnerships' general partners. As a result, our limited partnerships are generally reported on a three-month delay.
We are a member of the FHLB of Dallas and such membership requires members to own stock in the FHLB. Our FHLB stock is carried at amortized cost, which approximates fair value.
Mortgage loans on real estate are reported at unpaid principal balances.
The Company had cash equivalents and fixed maturity securities with an aggregate fair value of $8.6 million and $9.8 million at December 31, 2023 and 2022, respectively, on deposit with various state regulatory authorities to fulfill statutory requirements.
SHORT-TERM INVESTMENTS
The Company considers investments maturing within one year at acquisition as short-term. These securities are carried at fair value.
CASH AND CASH EQUIVALENTS
Cash consists of balances on hand and on deposit in banks and financial institutions. Cash equivalents consists of securities whose duration does not exceed 90 days at the date of acquisition.
December 31, 2023 | 10-K 69
| | | | | |
| CITIZENS, INC. | NOTES TO CONSOLIDATED FINANCIAL STATEMENTS |
| (Continued) |
| |
REINSURANCE RECOVERABLE
Reinsurance recoverable includes expected reimbursements for policyholder claim amounts in excess of the Company's retention, as well as profit sharing and experience refund accruals. Reinsurance recoverable is reduced for estimated uncollectible amounts, if any.
Reinsurance premiums, benefits and expenses are accounted for on a basis consistent with those used in accounting for the original policies issued and the terms of the reinsurance contracts. The cost of reinsurance related to long duration contracts is accounted for over the life of the underlying reinsured policies using assumptions consistent with those used to account for the underlying policies. The cost of reinsurance related to short duration contracts is accounted for over the coverage period. Profit-sharing and similar adjustable provisions are accrued based on the experience of the underlying policies.
DEFERRED POLICY ACQUISITION COSTS
Deferred policy acquisition costs (“DAC”) are costs that are incremental and directly related to the successful acquisition of new or renewal insurance contracts. Such costs include the incremental direct costs of contract acquisition, such as sales commissions; the portion of employees’ total compensation and payroll-related fringe benefits related directly to time spent performing acquisition activities, such as underwriting, issuing and processing policies for contracts that have actually been acquired; and other costs related directly to acquisition activities that would not have been incurred if the contract had not been acquired.
Contracts are grouped by contract type and issue year into cohorts consistent with the grouping used in estimating the associated liability. DAC is amortized on a constant level basis for the grouped contracts over the expected term of the related contracts to approximate straight-line amortization. For the Life Insurance segment, the constant level basis used is policy count in force. For the Home Service Insurance segment, the constant level basis used is face amount in force. The constant level bases used for amortization are projected using mortality and lapse assumptions that are based on the Company’s experience, industry data, and other factors at the end of each reporting period and are consistent with those used for the liability for future policy benefit life reserves. Annually, the Company completes experience studies with respect to mortality and lapse assumptions. If those assumptions are updated, the DAC amortization basis is recalculated and the effect of the assumption change will be reflected in the cohort level amortization in future periods.
Inherent in the capitalization and amortization of DAC are certain management judgments about what acquisition costs are deferred, the ending asset balance and the annual amortization. Approximately 93% of our capitalized DAC are attributed to first year and renewal excess commissions. The remaining 7% are attributed to other costs that vary with and are directly related to the successful acquisition of new insurance business. Those costs generally include costs related to the production, underwriting and issuance of new business.
Amortization of DAC is included in the consolidated statements of operations and comprehensive income (loss). The DAC balance on the consolidated balance sheets is reduced for actual experience in excess of expected experience. Changes in future estimates are recognized prospectively over the remaining expected contract term.
COST OF INSURANCE ACQUIRED
The Company recognizes an intangible asset that arises in the application of U.S. GAAP purchase accounting as the difference between the reported value and the fair value of insurance contract liabilities, or comparable amounts determined in purchased insurance business combinations. This intangible asset is referred to as the Cost of Insurance Acquired (“COIA”), which is amortized on a basis consistent with DAC, such that it is amortized in proportion to policies in force for the Life Insurance segment and face amount in force for the Home Service Insurance segment to approximate straight-line amortization.
A recoverability test that considers, among other things, actual experience and projected future experience is performed at least annually. These annual recoverability tests are based initially on an estimate of the available premium (gross premium less the benefit and expense portion of premium) for the next 50 years. Management believes that our COIA is recoverable for the years ended December 31, 2023 and 2022. This belief is based upon the analysis performed on estimated future results of the block and our annual recoverability testing.
December 31, 2023 | 10-K 70
| | | | | |
| CITIZENS, INC. | NOTES TO CONSOLIDATED FINANCIAL STATEMENTS |
| (Continued) |
| |
The value of COIA resulting from our various acquisitions was determined based on the present value of future profits discounted at annual rates ranging from 3.7% to 8.5%.
GOODWILL AND OTHER INTANGIBLE ASSETS
Goodwill is the difference between the purchase price in a business combination and the fair value of assets and liabilities acquired and is not amortized. Other intangible assets include various state insurance licenses, which have been determined to have indefinite useful lives and, therefore, are not amortized. Both goodwill and other intangible assets with indefinite useful lives are subject to annual impairment analysis.
Goodwill is tested for impairment on an annual basis or more frequently if indicators of potential impairment exist. The goodwill testing requires us to compare the estimated fair value of a reporting unit to its carrying value. If the carrying value of the reporting unit is lower than its estimated fair value, no further evaluation is required. If the carrying value of the reporting unit exceeds its estimated fair value, an impairment charge is recorded for that excess, limited to the total amount of goodwill allocated to that reporting unit. We have the option of performing an assessment of certain qualitative factors to determine if it is more likely than not that the fair value of a reporting unit is less than its carrying value or proceeding directly to a quantitative impairment test. We elected to apply the quantitative assessment for the goodwill in our reporting units within the Life Insurance segment as of December 31, 2021.
We recorded an impairment of $12.6 million in 2021 in our Life Insurance segment caused by increases in our carrying value of the segment due to recognition of a $43.8 million uncertain tax position in the fourth quarter of 2021, following the expiration of the statute of limitations on the tax year ended December 31, 2017. This impairment is recorded on the consolidated statements of operations and comprehensive income (loss). The Company has no remaining goodwill as of December 31, 2021.
PROPERTY AND EQUIPMENT
Property and equipment are carried at cost less accumulated depreciation. Depreciation of property and equipment is computed using the straight-line method over the useful lives of the assets, ranging from three years to thirty years.
The following is a summary of property and equipment.
| | | | | | | | | | | |
December 31,
(In thousands) | 2023 | | 2022 |
| Property and equipment: | | | |
| Home office, land and buildings | $ | 3,980 | | | 3,980 | |
| Furniture and equipment | 1,389 | | | 1,267 | |
| Electronic data processing equipment and computer software | 7,800 | | | 7,485 | |
| | | |
Real estate and equipment leases (See Note 8) | 9,073 | | | 10,116 | |
| | | |
| Total property and equipment | 22,242 | | | 22,848 | |
| Accumulated depreciation | (10,433) | | | (9,922) | |
| Property and equipment, net | $ | 11,809 | | | 12,926 | |
The Company has several lease agreements for real estate and equipment, such as its corporate home office, Puerto Rico service center and several district office locations related to our Home Service Insurance segment. The Company recognizes these lease agreements on the consolidated balance sheets as a right-of-use asset and a corresponding lease liability. The Company uses its estimated incremental borrowing rate, which is derived from information available at lease commencement date, in determining the present value of lease payments.
FUTURE POLICY BENEFITS AND EXPENSES
As premium revenue is recognized, a liability for future policy benefits, which is the present value of estimated future policy benefits to be paid to or on behalf of policyholders less the present value of estimated future net premiums to be collected from policyholders, is accrued. The liability is estimated using current assumptions that include
December 31, 2023 | 10-K 71
| | | | | |
| CITIZENS, INC. | NOTES TO CONSOLIDATED FINANCIAL STATEMENTS |
| (Continued) |
| |
discount rate, mortality and lapses. These current assumptions are based on judgements that consider the Company’s historical experience, industry data, and other factors.
Our traditional and limited-payment contracts are grouped into cohorts by contract type and issue year. Our reporting cohorts are (i) Permanent, which summarizes insurance policies with premiums payable over the lifetime of the policy, and (ii) Permanent Limited Pay, which summarizes insurance policies with premiums payable for a limited time after which the policy is fully paid up. Both reporting cohorts include whole life and endowment policies. The liability is adjusted for differences between actual and expected experience. The Company reviews its historical cash flow assumptions quarterly and in the third quarter of the year, the Company reviews its future cash flow assumptions. The net premium ratio used to calculate the liability is updated each quarter based on the current period's actual experience relative to expected experience. The revised net premium ratio is used to derive an updated liability for future policy benefits as of the beginning of the current reporting period, discounted at the locked-in discount rate. This amount is then compared to the carrying amount of the liability as of that same date, before the updating of cash flow assumptions, to determine the current period change in liability estimate. The current period change in the liability is the policyholder liability remeasurement gain or loss and is presented as a separate component of total insurance benefits paid or provided in the consolidated statements of operations and comprehensive income (loss). In subsequent periods, the revised net premiums are used to measure the liability for future policy benefits, subject to future revisions.
For traditional and limited-payment contracts, the current discount rate assumption is a yield curve that equals the yield of an upper-medium grade fixed income instrument, based on A-quality corporate bonds. The Company selects fixed-income instruments that have been A rated by one of the major credit rating agencies, such as Moody’s, Standard & Poor’s, or Fitch. The current discount rate assumption is updated quarterly and used to remeasure the liability at the reporting date, with the resulting change reflected in other comprehensive income. For liability cash flows that are projected beyond the duration of market-observable A credit-rated fixed-income instruments, the Company uses the last market-observable yield level and linear interpolation to determine yield assumptions for durations that do not have market observable yields. The locked-in discount rate for policies issued prior to transition equals the rate set at contract issuance. For current year issues, the locked-in discount rate is the average of the current year quarterly discount rates and will change throughout the year as new discount rates are calculated, with the change reflected in net income.
The accrued account balance for non-traditional life insurance and investment contracts is computed as deposits net of withdrawals made by the contract holder, plus amounts credited based on contract specifications, less contract fees and charges assessed, plus any additional interest. Annuity interest crediting rates range from 2.5% to 5.5% annually. Benefits and expenses are charged against the account balance to recognize costs as incurred over the estimated lives of the contracts. Expenses include interest credited to contract account balances and benefits paid in excess of contract account balances.
Unpaid claims on accident and health and specialty property insurance policies represent the estimated liability for benefit expenses, both reported but not paid and incurred but not reported to the Company. The liability for incurred but not reported claims includes estimates for additional claim amounts due related to reported claims. Liabilities for unpaid claims are estimated using individual case basis valuations and statistical analysis. Those estimates are subject to the effects of trends in claim severity and frequency.
Anticipated investment income is not considered in determining whether a premium deficiency exists with respect to short-duration contracts. Premium deposits accrue interest at rates ranging from 1.5% to 6.0% per annum. The cost of insurance is included in the premium when collected and interest is credited annually to deposit accounts.
DEFERRED PROFIT LIABILITY
For limited-payment products, gross premiums received in excess of net premiums are deferred at initial recognition as a deferred profit liability (“DPL”). Gross premiums are measured using assumptions consistent with those used in the measurement of the liability for future policy benefit life reserves, including discount rate, mortality and lapses.
The DPL is amortized and recognized in net income within the increase (decrease) in future policy benefit reserves. The amortization basis for the DPL is the present value of insurance in force for life insurance contracts. Interest is accreted on the balance of the DPL using the locked-in discount rate. The Company reviews and updates its estimates of cash flows for the DPL at the same time as the estimates of cash flows for the liability for future policy benefit life reserves. The DPL is updated each quarter based on the current period's actual experience relative to
December 31, 2023 | 10-K 72
| | | | | |
| CITIZENS, INC. | NOTES TO CONSOLIDATED FINANCIAL STATEMENTS |
| (Continued) |
| |
expected experience with the changes recorded within the increase (decrease) in future policy benefit reserves in the consolidated statements of operations and comprehensive income (loss). On the consolidated balance sheets, DPL is recorded as a component of the liability for future policy benefit life reserves.
PARTICIPATING POLICIES
At December 31, 2023 and 2022, participating business approximated 51% and 55%, respectively, of direct life insurance in force.
Policyholder dividends are determined based on the discretion of the board of directors of the policy issuing subsidiary. Policyholder dividends are accrued over the premium paying periods of the insurance contract.
CONTINGENCIES
An estimated loss from a contingency is accrued and charged to results of operations only if both of the following conditions are met:
1.Information available prior to the issuance of the consolidated financial statements indicates that it is probable (virtual certainty is not required) that an asset has been impaired or a liability incurred as of the date of the consolidated financial statements; and
2.The amount of the loss can be reasonably estimated.
Reasonable estimation of a possible loss does not require estimating a single amount of the loss. It requires that a loss be accrued if it can be estimated within a range. If an amount within the range is a better estimate than any other amount within the range, that amount is accrued. If no amount within the range is a better estimate than any other amount, the minimum amount in the range is accrued.
A gain contingency is an uncertain situation that will be resolved in the future, possibly resulting in a gain. We do not allow the recognition of a gain contingency prior to settlement of the underlying event. There were none as of December 31, 2023 and 2022.
PREMIUM REVENUE AND RELATED EXPENSES
Premiums on life policies are recognized as earned when due. Premiums paid in advance on the consolidated balance sheets are held on deposit and accrue interest at rates ranging from 1.5% to 6.0% until such time as the premiums become due. Premiums on accident and health policies are recognized as revenue over the contract period on a pro rata basis. Benefits and expenses are associated with earned premiums resulting in the recognition of profits over the estimated lives of the contracts. This matching is accomplished by means of a provision for future policy benefits and the capitalization and amortization of deferred policy acquisition costs and amortization of deferred profit liability for limited pay plans.
Annuity policies, primarily flexible premium fixed annuity products, are accounted for in a manner consistent with accounting for interest bearing financial instruments. Premium receipts are not reported as revenue, rather as deposit liabilities to annuity contracts. The annuity products issued do not include fees or other such charges. There is also a block of annuity products accounted for as FAS97 insurance products. Reserves are set up for surrenders and death benefits. Acquisition costs and premium loads are capitalized and amortized.
INCOME TAXES
Deferred tax assets and liabilities are recognized for the estimated future tax consequences attributable to differences between the financial statement carrying amounts of existing assets and liabilities and their respective tax bases. Deferred tax assets and liabilities are measured using enacted tax rates in effect for the year in which those temporary differences are expected to be recovered.
A deferred tax asset is recorded only if a determination is made that it is more-likely-than-not that the tax treatment on which the deferred tax asset depends will be sustained in the event of an audit. These determinations inherently involve management's judgment. In addition, the Company must record a tax valuation allowance with respect to deferred tax assets if it is more-likely-than-not that the tax benefit will not be realized.
December 31, 2023 | 10-K 73
| | | | | |
| CITIZENS, INC. | NOTES TO CONSOLIDATED FINANCIAL STATEMENTS |
| (Continued) |
| |
The Company releases stranded tax effects in accumulated other comprehensive income on an aggregate portfolio basis.
EARNINGS PER SHARE
Basic earnings per share are computed by dividing net income available to common stockholders by the weighted average number of shares of common stock outstanding during each period. Diluted earnings per share are computed under the if-converted method for convertible securities and the treasury stock method for warrants, giving effect to all potential dilutive common stock, including options, warrants and convertible/redeemable preferred stock. The basic and diluted earnings per share of Class B common stock are one half the earnings per share of the Class A common stock. We hold 100% of our Class B common stock in treasury.
USE OF ESTIMATES
The preparation of consolidated financial statements in conformity with U.S. GAAP requires management to make estimates and assumptions that affect the reported amounts of assets and liabilities and disclosure of contingent assets and liabilities at the date of the consolidated financial statements and the reported amounts of revenues and expenses during the reporting period. Actual results could differ materially from these estimates.
Significant estimates include those used in the evaluation of credit losses on fixed maturity securities, actuarially determined assets and liabilities and assumptions, valuation allowance on deferred tax assets, valuation of uncertain tax positions and contingencies relating to litigation and regulatory matters.
RECLASSIFICATIONS
Certain amounts presented in prior years have been reclassified to conform to the current presentation.
ACCOUNTING PRONOUNCEMENTS
ACCOUNTING STANDARDS RECENTLY ADOPTED
Impacts at Transition Date
In August 2018, the Financial Accounting Standards Board ("FASB") issued Accounting Standard Update ("ASU") No. 2018-12, Financial Services-Insurance (Topic 944): Targeted Improvements to the Accounting for Long-Duration Contracts. The Company adopted ASU 2018-12 for the liability for future policy benefits, DAC and COIA on a modified retrospective basis such that those balances were adjusted to conform to ASU 2018-12 effective January 1, 2021.
December 31, 2023 | 10-K 74
| | | | | |
| CITIZENS, INC. | NOTES TO CONSOLIDATED FINANCIAL STATEMENTS |
| (Continued) |
| |
The following table summarizes the balance of and changes in the liability for future policy benefits, annuity reserves, DAC and COIA due to the adoption of ASU 2018-12.
| | | | | | | | | | | | | |
| (In thousands) | Life Insurance | Home Service Insurance | | | Consolidated |
| Liability for Future Policy Benefits | | | | | |
| Pre-adoption liability as of 12/31/2020 | $ | 987,373 | | 255,513 | | | | 1,242,886 | |
| | | | | |
| Change in discount rate assumptions | 261,823 | | 108,468 | | | | 370,291 | |
| Effect of reserve changes | 6 | | 96 | | | | 102 | |
| Post-adoption liability as of 1/1/2021 | $ | 1,249,202 | | 364,077 | | | | 1,613,279 | |
| | | | | |
| Fixed Annuity Liability | | | | | |
| Pre-adoption liability as of 12/31/2020 | $ | 60,027 | | 18,277 | | | | 78,304 | |
| Adjustments for the removal of shadow adjustments | — | | 3,426 | | | | 3,426 | |
| Post-adoption liability as of 1/1/2021 | $ | 60,027 | | 21,703 | | | | 81,730 | |
| | | | | |
| Deferred Acquisition Costs | | | | | |
| Pre-adoption balance as of 12/31/2020 | $ | 94,771 | | 10,142 | | | | 104,913 | |
| Adjustments for the removal of shadow adjustments | 8,270 | | 29,905 | | | | 38,175 | |
| Impact of flooring cohorts at zero | 23 | | 12 | | | | 35 | |
| Post adoption balance as of 1/1/2021 | $ | 103,064 | | 40,059 | | | | 143,123 | |
| | | | | |
| Cost of Insurance Acquired | | | | | |
| Pre-adoption balance as of 12/31/2020 | $ | 1,734 | | 9,807 | | | | 11,541 | |
| Adjustments for the removal of shadow adjustments | — | | 484 | | | | 484 | |
| Post adoption balance as of 1/1/2021 | $ | 1,734 | | 10,291 | | | | 12,025 | |
| | | | | |
At transition, the Company recorded a charge of $0.1 million to retained earnings, net of tax, primarily from capping net premium ratios for certain policyholder benefit cohorts at 100%, increasing reserves for certain non-premium paying cohorts and flooring certain DAC cohorts at zero. Other comprehensive income (loss) ("OCI") was reduced by $316.8 million primarily due to the difference in the discount rate used prior to transition and the discount rate at January 1, 2021. The Company also removed shadow adjustments previously recorded in OCI for the impact of unrealized gains and losses on annuity products that previously amortized unearned revenue, DAC and COIA over expected future gross profits.
December 31, 2023 | 10-K 75
| | | | | |
| CITIZENS, INC. | NOTES TO CONSOLIDATED FINANCIAL STATEMENTS |
| (Continued) |
| |
Impacts to Previously Reported Results
Adoption of the standard impacted our previously reported consolidated financial results as follows:
| | | | | | | | | | | |
As of December 31, 2022 (In thousands) | As Previously Reported | Adoption of New Standard | Post Adoption |
| Consolidated Balance Sheet | | | |
| Deferred policy acquisition costs | $ | 140,167 | | 22,760 | | 162,927 | |
| Cost of insurance acquired | 10,260 | | 387 | | 10,647 | |
| Deferred tax asset, net | 2,414 | | (2,414) | | — | |
| Total assets | 1,569,970 | | 20,733 | | 1,590,703 | |
| | | |
| Future policy benefit reserves: | | | |
| Life insurance | 1,305,506 | | (106,859) | | 1,198,647 | |
| Annuities | 91,234 | | (91,234) | | — | |
| Policyholders' funds: | | | |
| Annuities | — | | 121,422 | | 121,422 | |
| Other policyholders' funds | 40,497 | | (32,996) | | 7,501 | |
| Deferred federal income tax liability, net | — | | 3,653 | | 3,653 | |
| Total liabilities | 1,568,927 | | (106,014) | | 1,462,913 | |
| | | |
| Retained earnings (accumulated deficit) | (52,203) | | 68,512 | | 16,309 | |
| Accumulated other comprehensive income (loss) | (195,279) | | 58,235 | | (137,044) | |
| Total stockholders' equity | 1,043 | | 126,747 | | 127,790 | |
| | | |
| | | |
| | | |
| | | |
| | | |
| | | |
| | | |
| | | |
| | | |
| | | |
| | |
| | | |
| | | |
| | | |
| | | |
| | | |
| | | |
| | | |
| | | |
| | | |
| | | |
| | | |
| | | |
| | | |
| | |
| | | |
| | | |
| | | |
| | | | | | | | | | | | | | | | | | | | | | | |
| Year Ended December 31, 2022 | | Year Ended December 31, 2021 |
(In thousands, except per share amounts) | As Previously Reported | Adoption of New Standard | Post Adoption | | As Previously Reported | Adoption of New Standard | Post Adoption |
| | | | | | | |
| | | | | | | |
| | | | | | | |
| | | | | | | |
| | | | | | | |
| | | | | | | |
| | | | | | | |
| | | | | | | |
| | | | | | | |
| | | | | | | |
| | | | | | | |
| | | | | | | |
| | | | | | | |
| | | | | | | |
| | | | | | | |
| | | | | | | |
| | | | | | | |
| | | | | | | |
| | | | | | | |
| | | | | | | |
| | | | | | | |
| | | | | | | |
| | | | | | | |
| | | | | | | |
| | | | | | | |
| | | | | | | |
| | | | | | | |
| | | | | | |
| | | | | | | |
| | | | | | | |
| | | | | | | |
| | | | | | | |
| | | | | | | |
| Consolidated Statements of Operations | | | | | | |
| Increase (decrease) in future policy benefit reserves | $ | 29,640 | | (24,836) | | 4,804 | | | 36,444 | | (26,671) | | 9,773 | |
| Policyholder liability remeasurement (gain) loss | — | | 2,884 | | 2,884 | | | — | | 1,434 | | 1,434 | |
| Amortization of deferred policy acquisition costs | 26,529 | | (12,139) | | 14,390 | | | 24,952 | | (11,507) | | 13,445 | |
| Amortization of cost of insurance acquired | 974 | | (353) | | 621 | | | 1,206 | | (449) | | 757 | |
| Federal income tax expense (benefit) | (429) | | 1,799 | | 1,370 | | | (43,475) | | 1,274 | | (42,201) | |
| Net income (loss) | (6,638) | | 32,645 | | 26,007 | | | 36,787 | | 35,919 | | 72,706 | |
| Basic earnings (losses) per share of Class A common stock | (0.13) | | 0.65 | | 0.52 | | | 0.74 | | 0.72 | | 1.46 | |
| Basic earnings (losses) per share of Class B common stock | — | | — | | — | | | 0.37 | | 0.36 | | 0.73 | |
| Diluted earnings (losses) per share of Class A common stock | (0.13) | | 0.64 | | 0.51 | | | 0.73 | | 0.71 | | 1.44 | |
| Diluted earnings (losses) per share of Class B common stock | — | | — | | — | | | 0.36 | | 0.36 | | 0.72 | |
| | | | | | | |
| | | | | |
| | | | | | | |
| | | | | | | |
| | | | | | | |
| | | | | | | |
| | | | | | | |
December 31, 2023 | 10-K 76
| | | | | |
| CITIZENS, INC. | NOTES TO CONSOLIDATED FINANCIAL STATEMENTS |
| (Continued) |
| |
| | | | | | | | | | | | | | | | | | | | | | | |
| Year Ended December 31, 2022 | | Year Ended December 31, 2021 |
(In thousands) | As Previously Reported | Adoption of New Standard | Post Adoption | | As Previously Reported | Adoption of New Standard | Post Adoption |
| | | | | | | |
| | | | | | | |
| | | | | | | |
| | | | | | | |
| | | | | | | |
| | | | | | | |
| | | | | | | |
| | | | | | | |
| | | | | | | |
| | | | | | | |
| | | | | | | |
| | | | | | | |
| | | | | | | |
| | | | | | | |
| | | | | | | |
| | | | | | | |
| | | | | | | |
| | | | | | | |
| | | | | | | |
| | | | | | | |
| | | | | | | |
| | | | | | | |
| | | | | | | |
| | | | | | | |
| | | | | | | |
| | | | | | | |
| | | | | | | |
| | | | | | |
| | | | | | | |
| | | | | | | |
| | | | | | | |
| | | | | | | |
| | | | | | | |
| | | | | | |
| | | | | | | |
| | | | | | | |
| | | | | | | |
| | | | | | | |
| | | | | | | |
| | | | | | | |
| | | | | | | |
| | | | | | | |
| | | | | | | |
| | | | | | | |
| | | | | | | |
| Consolidated Statement of Comprehensive Income (Loss) | | | | | |
| Unrealized holding gains (losses) arising during period | $ | (330,765) | | 2,196 | | (328,569) | | | (5,298) | | (36,068) | | (41,366) | |
| Change in current discount rate for liability for future policy benefits | — | | 337,776 | | 337,776 | | | — | | 92,396 | | 92,396 | |
| Income tax expense (benefit) on other comprehensive income items | (17,994) | | 25,256 | | 7,262 | | | 5,465 | | (4,016) | | 1,449 | |
| Other comprehensive income (loss) | (312,771) | | 314,716 | | 1,945 | | | (10,763) | | 60,344 | | 49,581 | |
| Total comprehensive income (loss) | (319,409) | | 347,361 | | 27,952 | | | 26,024 | | 96,263 | | 122,287 | |
On June 30, 2022, the FASB issued ASU No. 2022-03, Fair Value Measurement (Topic 820: Fair Value Measurement of Equity Securities Subject to Contractual Sale Restrictions. This standard clarifies that contractual restrictions on equity security sales are not considered part of the security unit of account and, therefore, are not considered in measuring fair value. In addition, the amendments clarify that an entity cannot, as a separate unit of account, recognize and measure a contractual sale restriction. Disclosures on such restrictions are also required. The amendments are effective for fiscal years beginning after December 15, 2023, including interim periods within those fiscal years, and are required to be applied prospectively, with any adjustments from the adoption recognized in earnings and disclosed. Early adoption is available. Citizens' elected to adopt this standard as of December 31, 2023 as adoption of this standard has no impact on our consolidated financial statements.
ACCOUNTING STANDARDS NOT YET ADOPTED
On November 27, 2023, the FASB issued ASU No. 2023-07, Segment Reporting (Topic 280): Improvements to Reportable Segment Disclosures. This amendment expands a public entity's segment disclosures by requiring disclosure of significant segment expenses that are regularly provided to the chief operating decision maker, clarifying when an entity may report one or more additional measures to assess segment performance, requiring enhanced interim disclosures, providing new disclosure requirements for entities with a single reportable segment, and requiring other new disclosures. The amendments are effective for fiscal years beginning after December 15, 2023 and interim periods within fiscal years beginning after December 15, 2024. Early adoption is available. Although the ASU only requires additional disclosures about the Company's operating segments, the Company is currently evaluating the effects of adopting this guidance on the consolidated financial statements.
On December 14, 2023, the FASB issued ASU No. 2023-09, Income Taxes (Topic 740): Improvements to Income Tax Disclosures, which is intended to enhance the transparency, decision usefulness and effectiveness of income tax disclosures. The amendments in this ASU require a public entity to disclose a tabular tax rate reconciliation, using both percentages and currency, with specific categories. A public entity is also required to provide a qualitative description of the state and local jurisdictions that make up the majority of the effect of the state and local income tax category and the net amount of income taxes paid, disaggregated by federal, state and foreign taxes and also disaggregated by individual jurisdictions. The amendments also remove certain disclosures that are no longer considered cost beneficial. The amendments are effective prospectively for annual periods beginning after December 15, 2024 and early adoption and retrospective application are permitted. The Company is currently evaluating the impact of adopting this pronouncement on the consolidated financial statements.
No other new accounting pronouncement issued or effective during 2023 had, or is expected to have, a material impact on our consolidated financial statements.
December 31, 2023 | 10-K 77
| | | | | |
| CITIZENS, INC. | NOTES TO CONSOLIDATED FINANCIAL STATEMENTS |
| (Continued) |
| |
(2) INVESTMENTS
The Company invests primarily in fixed maturity securities, which totaled 86.7% of total cash and invested assets at December 31, 2023.
| | | | | | | | | | | | | | | | | | | | | | | |
Carrying Value as of December 31, (In thousands, except for %) | 2023 | | % | | 2022 | | % |
| Cash and invested assets: | | | | | | | |
| Fixed maturity securities | $ | 1,238,981 | | | 86.7 | % | | $ | 1,179,619 | | | 86.5 | % |
| Equity securities | 5,282 | | | 0.4 | | | 11,590 | | | 0.8 | |
| Policy loans | 75,359 | | | 5.3 | | | 78,773 | | | 5.8 | |
| Other long-term investments | 82,725 | | | 5.8 | | | 69,558 | | | 5.1 | |
| Short-term investments | — | | | — | | | 1,241 | | | 0.1 | |
| Cash and cash equivalents | 26,997 | | | 1.8 | | | 22,973 | | | 1.7 | |
| Total cash and invested assets | $ | 1,429,344 | | | 100.0 | % | | $ | 1,363,754 | | | 100.0 | % |
The following table represents the amortized cost, gross unrealized gains and losses and fair value of fixed maturity securities as of December 31, 2023 and 2022.
| | | | | | | | | | | | | | | | | | | | | | | |
December 31, 2023
(In thousands) | Amortized
Cost | | Gross
Unrealized
Gains | | Gross
Unrealized
Losses | | Fair
Value |
| Fixed maturity securities: | | | | | | | |
| Available-for-sale: | | | | | | | |
| U.S. Treasury securities | $ | 5,983 | | | 127 | | | 48 | | | 6,062 | |
| U.S. Government-sponsored enterprises | 3,404 | | | 250 | | | 1 | | | 3,653 | |
| States and political subdivisions | 314,203 | | | 2,160 | | | 29,132 | | | 287,231 | |
| Corporate: | | | | | | | |
| Financial | 266,485 | | | 2,066 | | | 31,255 | | | 237,296 | |
| Consumer | 250,672 | | | 2,145 | | | 37,094 | | | 215,723 | |
| Utilities | 123,625 | | | 615 | | | 20,253 | | | 103,987 | |
| Energy | 73,808 | | | 64 | | | 8,049 | | | 65,823 | |
| All other | 185,153 | | | 956 | | | 21,331 | | | 164,778 | |
| Commercial mortgage-backed | 171 | | | — | | | — | | | 171 | |
| Residential mortgage-backed | 107,174 | | | 9 | | | 10,060 | | | 97,123 | |
| Asset-backed | 58,360 | | | 290 | | | 1,516 | | | 57,134 | |
| | | | | | | |
| Total fixed maturity securities | $ | 1,389,038 | | | 8,682 | | | 158,739 | | | 1,238,981 | |
December 31, 2023 | 10-K 78
| | | | | |
| CITIZENS, INC. | NOTES TO CONSOLIDATED FINANCIAL STATEMENTS |
| (Continued) |
| |
| | | | | | | | | | | | | | | | | | | | | | | |
December 31, 2022
(In thousands) | Amortized
Cost | | Gross
Unrealized
Gains | | Gross
Unrealized
Losses | | Fair
Value |
| Fixed maturity securities: | | | | | | | |
| Available-for-sale: | | | | | | | |
| U.S. Treasury securities | $ | 9,425 | | | 152 | | | 9 | | | 9,568 | |
| U.S. Government-sponsored enterprises | 3,434 | | | 277 | | | 1 | | | 3,710 | |
| States and political subdivisions | 344,208 | | | 1,114 | | | 37,964 | | | 307,358 | |
| Corporate: | | | | | | | |
| Financial | 243,758 | | | 512 | | | 42,383 | | | 201,887 | |
| Consumer | 247,824 | | | 758 | | | 47,138 | | | 201,444 | |
| Utilities | 115,738 | | | 39 | | | 23,790 | | | 91,987 | |
| Energy | 76,065 | | | — | | | 11,395 | | | 64,670 | |
| All other | 184,022 | | | 683 | | | 29,048 | | | 155,657 | |
| Commercial mortgage-backed | 171 | | | — | | | 2 | | | 169 | |
| Residential mortgage-backed | 110,582 | | | 9 | | | 10,765 | | | 99,826 | |
| Asset-backed | 45,991 | | | 18 | | | 2,767 | | | 43,242 | |
| Foreign governments | 100 | | | 1 | | | — | | | 101 | |
| Total fixed maturity securities | $ | 1,381,318 | | | 3,563 | | | 205,262 | | | 1,179,619 | |
Most of the Company's equity securities are invested in a non-redeemable preferred stock fund at December 31, 2023.
| | | | | | | | | | | |
Fair Value as of December 31, (In thousands) | 2023 | | 2022 |
| Equity securities: | | | |
| Stock mutual funds | $ | — | | | 2,615 | |
| Bond mutual funds | 740 | | | 4,337 | |
| Common stock | 665 | | | 857 | |
| Non-redeemable preferred stock | 7 | | | 8 | |
| Non-redeemable preferred stock fund | 3,870 | | | 3,773 | |
| Total equity securities | $ | 5,282 | | | 11,590 | |
VALUATION OF INVESTMENTS
AFS fixed maturity securities are reported in the consolidated financial statements at fair value. Equity securities are measured at fair value with the change in fair value recorded through net income (loss). The Company recognized net investment related losses of $0.2 million and $2.7 million on equity securities held for the years ended December 31, 2023 and 2022, respectively and net investment related gains of $0.4 million for the year ended December 31, 2021.
The Company monitors all AFS fixed maturity securities on an on-going basis relative to changes in credit ratings, market prices, earnings trends and financial performance, in addition to specific region or industry reviews. The Company evaluates whether a credit impairment exists for fixed maturity securities by considering primarily the following factors: (a) changes in the financial condition of the security's underlying collateral; (b) whether the issuer is current on contractually obligated interest and principal payments; (c) changes in the financial condition, credit rating and near-term prospects of the issuer; and (d) the payment structure of the security. The Company's best estimate of expected future cash flows used to determine the credit loss amount is a quantitative and qualitative process. Quantitative review includes information received from third-party sources such as financial statements,
December 31, 2023 | 10-K 79
| | | | | |
| CITIZENS, INC. | NOTES TO CONSOLIDATED FINANCIAL STATEMENTS |
| (Continued) |
| |
pricing and rating changes, liquidity and other statistical information. Qualitative factors include judgments related to business strategies, economic impacts on the issuer, overall judgment related to estimates and industry factors as well as the Company's intent to sell the security, or if it is more likely than not that the Company would be required to sell a security before recovery of its amortized cost.
The Company's best estimate of future cash flows involves assumptions including, but not limited to, various performance indicators, such as historical and projected default and recovery rates, credit ratings, and current delinquency rates. These assumptions require the use of significant management judgement and include the probability of issuer default and estimates regarding timing and amount of expected recoveries, which may include estimating the underlying collateral value. In addition, projections of expected future fixed maturity security cash flows may change based upon new information regarding the performance of the issuer. Any credit losses are presented as an allowance rather than as a write-down on AFS fixed maturity securities management does not intend to sell or believes that it is more likely than not we will be required to sell.
The Company recorded no credit valuation losses on fixed maturity securities for the years ended December 31, 2023 and 2022.
For fixed maturity security investments that have unrealized losses as of December 31, 2023 and 2022, the gross unrealized losses and related fair values that have been in a continuous unrealized loss position by timeframe are as follows.
| | | | | | | | | | | | | | | | | | | | | | | | | | | | | |
| December 31, 2023 | Less than 12 months | Greater than 12 months | Total |
| (In thousands, except for # of securities) | Fair
Value | Unrealized
Losses | # of
Securities | Fair
Value | Unrealized
Losses | # of
Securities | Fair
Value | Unrealized
Losses | # of
Securities |
| Fixed maturity securities: | | | | | | | | |
| Available-for-sale securities: | | | | | | | | | |
| U.S. Treasury securities | $ | 1,203 | | 40 | | 5 | | 65 | | 8 | | 2 | | 1,268 | | 48 | | 7 | |
| U.S. Government-sponsored enterprises | 221 | | 1 | | 1 | | — | | — | | — | | 221 | | 1 | | 1 | |
| States and political subdivisions | 19,540 | | 357 | | 35 | | 164,264 | | 28,775 | | 192 | | 183,804 | | 29,132 | | 227 | |
| Corporate: | | | | | | | | | |
| Financial | 12,584 | | 383 | | 19 | | 176,521 | | 30,872 | | 217 | | 189,105 | | 31,255 | | 236 | |
| Consumer | 10,175 | | 265 | | 16 | | 176,725 | | 36,829 | | 223 | | 186,900 | | 37,094 | | 239 | |
| Utilities | 3,596 | | 66 | | 20 | | 85,169 | | 20,187 | | 137 | | 88,765 | | 20,253 | | 157 | |
| Energy | 3,291 | | 57 | | 1 | | 59,392 | | 7,992 | | 76 | | 62,683 | | 8,049 | | 77 | |
| All Other | 7,864 | | 185 | | 10 | | 141,865 | | 21,146 | | 169 | | 149,729 | | 21,331 | | 179 | |
| | | | | | | | | |
| Residential mortgage-backed | 849 | | 38 | | 5 | | 95,806 | | 10,022 | | 86 | | 96,655 | | 10,060 | | 91 | |
| Asset-backed | 4,757 | | 111 | | 8 | | 32,764 | | 1,405 | | 40 | | 37,521 | | 1,516 | | 48 | |
| Total fixed maturity securities | $ | 64,080 | | 1,503 | | 120 | | 932,571 | | 157,236 | | 1,142 | | 996,651 | | 158,739 | | 1,262 | |
December 31, 2023 | 10-K 80
| | | | | |
| CITIZENS, INC. | NOTES TO CONSOLIDATED FINANCIAL STATEMENTS |
| (Continued) |
| |
| | | | | | | | | | | | | | | | | | | | | | | | | | | | | |
| December 31, 2022 | Less than 12 months | Greater than 12 months | Total |
| (In thousands, except for # of securities) | Fair
Value | Unrealized
Losses | # of
Securities | Fair
Value | Unrealized
Losses | # of
Securities | Fair
Value | Unrealized
Losses | # of
Securities |
| Fixed maturity securities: | | | | | | | | |
| Available-for-sale securities: | | | | | | | | | |
| U.S. Treasury securities | $ | — | | — | | — | | 64 | | 9 | | 2 | | 64 | | 9 | | 2 | |
| U.S. Government-sponsored enterprises | 223 | | 1 | | 1 | | — | | — | | — | | 223 | | 1 | | 1 | |
| States and political subdivisions | 189,084 | | 30,866 | | 242 | | 14,184 | | 7,098 | | 14 | | 203,268 | | 37,964 | | 256 | |
| Corporate: | | | | | | | | | |
| Financial | 182,447 | | 39,122 | | 237 | | 6,144 | | 3,261 | | 16 | | 188,591 | | 42,383 | | 253 | |
| Consumer | 164,224 | | 34,823 | | 220 | | 23,417 | | 12,315 | | 30 | | 187,641 | | 47,138 | | 250 | |
| Utilities | 73,483 | | 15,959 | | 152 | | 16,413 | | 7,831 | | 18 | | 89,896 | | 23,790 | | 170 | |
| Energy | 59,053 | | 9,601 | | 75 | | 5,617 | | 1,794 | | 8 | | 64,670 | | 11,395 | | 83 | |
| All Other | 140,955 | | 25,337 | | 171 | | 7,910 | | 3,711 | | 15 | | 148,865 | | 29,048 | | 186 | |
| Commercial mortgage-backed | 168 | | 2 | | 2 | | — | | — | | — | | 168 | | 2 | | 2 | |
| Residential mortgage-backed | 98,758 | | 10,514 | | 95 | | 759 | | 251 | | 5 | | 99,517 | | 10,765 | | 100 | |
| Asset-backed | 37,067 | | 2,485 | | 41 | | 4,264 | | 282 | | 9 | | 41,331 | | 2,767 | | 50 | |
| Total fixed maturity securities | $ | 945,462 | | 168,710 | | 1,236 | | 78,772 | | 36,552 | | 117 | | 1,024,234 | | 205,262 | | 1,353 | |
In each category of our fixed maturity securities described above, we do not intend to sell our investments and it is not more likely than not that the Company will be required to sell the investments before recovery of their amortized cost bases. At December 31, 2023 and 2022, 99.4% and 98.7%, respectively, of the fair value of our fixed maturity securities portfolio was rated investment grade. While the losses are currently unrealized, we continue to monitor all fixed maturity securities on an on-going basis as future information may become available which could result in an allowance being recorded.
The unrealized losses on fixed maturity securities detailed in the previous tables are due to noncredit-related factors, including widening credit spreads and rising interest rates since purchase, which have little bearing on the recoverability of our investments, hence they are not recognized as credit losses. The fair value is expected to recover as the securities approach maturity or if market yields for such investments decline.
The amortized cost and fair value of fixed maturity securities at December 31, 2023 by contractual maturity are shown in the table below. Actual maturities may differ from contractual maturities because borrowers may have the right to call or prepay obligations with or without call or prepayment penalties. Securities not due at a single maturity date have been reflected based upon final stated maturity.
| | | | | | | | | | | |
| (In thousands) | Amortized Cost | | Fair Value |
| Fixed maturity securities: | | | |
| Due in one year or less | $ | 11,055 | | | 11,017 | |
| Due after one year through five years | 122,681 | | | 121,443 | |
| Due after five years through ten years | 296,313 | | | 290,023 | |
| Due after ten years | 958,989 | | | 816,498 | |
| Total fixed maturity securities | $ | 1,389,038 | | | 1,238,981 | |
There were no investments that were non-income producing for the years ended December 31, 2023 or 2022.
December 31, 2023 | 10-K 81
| | | | | |
| CITIZENS, INC. | NOTES TO CONSOLIDATED FINANCIAL STATEMENTS |
| (Continued) |
| |
Major categories of net investment income are summarized as follows:
| | | | | | | | | | | | | | | | | |
Years ended December 31,
(In thousands) | 2023 | | 2022 | | 2021 |
| Gross investment income: | | | | | |
| Fixed maturity securities | $ | 60,127 | | | 58,400 | | | 55,579 | |
| Equity securities | 630 | | | 650 | | | 1,024 | |
| Policy loans | 6,011 | | | 6,189 | | | 6,420 | |
| Other long-term investments | 4,509 | | | 2,535 | | | 809 | |
| Other | 576 | | | 246 | | | 54 | |
| Total investment income | 71,853 | | | 68,020 | | | 63,886 | |
| Investment expenses | (2,599) | | | (2,594) | | | (2,391) | |
| Net investment income | $ | 69,254 | | | 65,426 | | | 61,495 | |
The Company uses the specific identification method of the individual security to determine the cost basis used in the calculation of realized gains and losses related to security sales.
| | | | | | | | | | | | | | | | | |
Years ended December 31,
(In thousands) | 2023 | | 2022 | | 2021 |
| Fixed maturity securities, available-for-sale: | | | | | |
| Proceeds | $ | 29,883 | | | 33,914 | | | 8,238 | |
| Gross realized gains | 53 | | | 120 | | | 189 | |
| Gross realized losses | 602 | | | 112 | | | 1 | |
| | | | | |
| Equity securities: | | | | | |
| Proceeds | $ | 6,631 | | | 500 | | | 7,383 | |
| Gross realized gains | 568 | | | 44 | | | — | |
| Gross realized losses | 55 | | | — | | | 149 | |
Investment related gains (losses) are as follows:
| | | | | | | | | | | | | | | | | |
Years ended December 31,
(In thousands) | 2023 | | 2022 | | 2021 |
| Investment related gains (losses): | | | | | |
| Sales, calls and maturities: | | | | | |
| Fixed maturity securities | $ | (756) | | | (104) | | | 243 | |
| Equity securities | 513 | | | 62 | | | (152) | |
| Real estate | — | | | — | | | 981 | |
| Property and equipment | — | | | — | | | 13 | |
| Other long-term investments | 342 | | | 2,320 | | | 1,892 | |
| Investment related gains (losses) | 99 | | | 2,278 | | | 2,977 | |
| Change in fair value of equity securities | (190) | | | (2,665) | | | 376 | |
| Change in fair value of limited partnerships | 912 | | | (9,667) | | | 7,452 | |
| Change in credit loss allowance | (61) | | | (237) | | | 186 | |
| | | | | |
| | | | | |
| | | | | |
| | | | | |
| Net investment related gains (losses) | $ | 760 | | | (10,291) | | | 10,991 | |
December 31, 2023 | 10-K 82
| | | | | |
| CITIZENS, INC. | NOTES TO CONSOLIDATED FINANCIAL STATEMENTS |
| (Continued) |
| |
The Company sold its former training facility near Austin, Texas during 2021 for a gross sale price of $3.8 million, resulting in a gain on the sale of $1.0 million. The facility was owned by Citizens and was held in Other Non-Insurance Enterprises.
(3) FAIR VALUE MEASUREMENTS
Fair value is the price that would be received to sell an asset or paid to transfer a liability in an orderly transaction between market participants at the measurement date. We hold AFS fixed maturity securities, which are carried at fair value with changes in fair value reported through other comprehensive income (loss). We also report our equity securities and certain other long-term investments at fair value with changes in fair value reported through the consolidated statements of operations and comprehensive income (loss).
Fair value measurements are generally based upon observable and unobservable inputs. Observable inputs reflect market data obtained from independent sources, while unobservable inputs reflect our view of market assumptions in the absence of observable market information. We utilize valuation techniques that maximize the use of observable inputs and minimize the use of unobservable inputs. All assets and liabilities carried at fair value are required to be classified and disclosed in one of the following three categories:
•Level 1 - Quoted prices for identical instruments in active markets.
•Level 2 - Quoted prices for similar instruments in active markets; quoted prices for identical or similar instruments in markets that are not active and model-derived valuations whose inputs or whose significant value drivers are observable.
•Level 3 - Instruments whose significant value drivers are unobservable.
Level 1 primarily consists of financial instruments whose value is based on quoted market prices such as U.S. Treasury securities and actively traded mutual fund and stock investments.
Level 2 includes those financial instruments that are valued by independent pricing services or broker quotes. These pricing models are primarily industry-standard models that consider various inputs, such as interest rates, credit spreads and foreign exchange rates for the underlying financial instruments. All significant inputs are observable or derived from observable information in the marketplace or are supported by observable levels at which transactions are executed in the marketplace. Financial instruments in this category primarily include corporate securities, U.S. Government-sponsored enterprise securities, securities issued by states and political subdivisions and certain mortgage and asset-backed securities.
Level 3 is comprised of financial instruments whose fair value is estimated based on non-binding broker prices utilizing significant inputs not based on or corroborated by readily available market information. We have no investments in this category.
December 31, 2023 | 10-K 83
| | | | | |
| CITIZENS, INC. | NOTES TO CONSOLIDATED FINANCIAL STATEMENTS |
| (Continued) |
| |
The following tables set forth our assets that are measured at fair value on a recurring basis.
| | | | | | | | | | | | | | | | | | | | | | | |
December 31, 2023
(In thousands) | Level 1 | | Level 2 | | Level 3 | | Total
Fair Value |
| Financial assets: | | | | | | | |
| Fixed maturity securities, available-for-sale: | | | | | | | |
| U.S. Treasury and U.S. Government-sponsored enterprises | $ | 6,062 | | | 3,653 | | | — | | | 9,715 | |
| States and political subdivisions | — | | | 287,231 | | | — | | | 287,231 | |
| Corporate | 43 | | | 787,564 | | | — | | | 787,607 | |
| Commercial mortgage-backed | — | | | 171 | | | — | | | 171 | |
| Residential mortgage-backed | — | | | 97,123 | | | — | | | 97,123 | |
| Asset-backed | — | | | 57,134 | | | — | | | 57,134 | |
| | | | | | | |
| Total fixed maturity securities available-for-sale | 6,105 | | | 1,232,876 | | | — | | | 1,238,981 | |
| | | | | | | |
| Equity securities: | | | | | | | |
| | | | | | | |
| Bond mutual funds | 740 | | | — | | | — | | | 740 | |
| Common stock | 665 | | | — | | | — | | | 665 | |
| Non-redeemable preferred stock | 7 | | | — | | | — | | | 7 | |
| Non-redeemable preferred stock fund | 3,870 | | | — | | | — | | | 3,870 | |
| Total equity securities | 5,282 | | | — | | | — | | | 5,282 | |
Other long-term investments (1) | — | | | — | | | — | | | 82,460 | |
| Total financial assets | $ | 11,387 | | | 1,232,876 | | | — | | | 1,326,723 | |
(1) In accordance with Subtopic 820-10, certain investments that are measured at fair value using the net asset value per share (or its equivalent) practical expedient have not been classified in the fair value hierarchy. The fair value amounts presented in this table permit reconciliation of the fair value hierarchy to the amounts presented in the consolidated balance sheet.
December 31, 2023 | 10-K 84
| | | | | |
| CITIZENS, INC. | NOTES TO CONSOLIDATED FINANCIAL STATEMENTS |
| (Continued) |
| |
| | | | | | | | | | | | | | | | | | | | | | | |
December 31, 2022
(In thousands) | Level 1 | | Level 2 | | Level 3 | | Total
Fair Value |
| Financial assets: | | | | | | | |
| Fixed maturity securities, available-for-sale: | | | | | | | |
| U.S. Treasury and U.S. Government-sponsored enterprises | $ | 9,567 | | | 3,711 | | | — | | | 13,278 | |
| States and political subdivisions | — | | | 307,358 | | | — | | | 307,358 | |
| Corporate | 44 | | | 715,601 | | | — | | | 715,645 | |
| Commercial mortgage-backed | — | | | 169 | | | — | | | 169 | |
| Residential mortgage-backed | — | | | 99,826 | | | — | | | 99,826 | |
| Asset-backed | — | | | 43,242 | | | — | | | 43,242 | |
| Foreign governments | — | | | 101 | | | — | | | 101 | |
| Total fixed maturity securities available-for-sale | 9,611 | | | 1,170,008 | | | — | | | 1,179,619 | |
| | | | | | | |
| Equity securities: | | | | | | | |
| Stock mutual funds | 2,615 | | | — | | | — | | | 2,615 | |
| Bond mutual funds | 4,337 | | | — | | | — | | | 4,337 | |
| Common stock | 857 | | | — | | | — | | | 857 | |
| Non-redeemable preferred stock | 8 | | | — | | | — | | | 8 | |
| Non-redeemable preferred stock fund | 3,773 | | | — | | | — | | | 3,773 | |
| Total equity securities | 11,590 | | | — | | | — | | | 11,590 | |
Other long-term investments (1) | — | | | — | | | — | | | 66,846 | |
| Total financial assets | $ | 21,201 | | | 1,170,008 | | | — | | | 1,258,055 | |
(1) In accordance with Subtopic 820-10, certain investments that are measured at fair value using the net asset value per share (or its equivalent) practical expedient have not been classified in the fair value hierarchy. The fair value amounts presented in this table permit reconciliation of the fair value hierarchy to the amounts presented in the consolidated balance sheet.
FINANCIAL INSTRUMENTS VALUATION
FINANCIAL INSTRUMENTS CARRIED AT FAIR VALUE
Fixed maturity securities, available-for-sale. At December 31, 2023, fixed maturity securities, valued using a third-party pricing source, totaled $1.2 billion for Level 2 assets and comprised 92.9% of total reported fair value of our financial assets. The Level 1 and Level 2 valuations are reviewed and updated quarterly through testing by comparisons to separate pricing models, other third-party pricing services, and back tested to recent trades. In addition, we obtain information annually relative to the third-party pricing models and review model parameters for reasonableness. There were no Level 3 assets as of December 31, 2023 and 2022. For the year ended December 31, 2023, there were no material changes to the valuation methods or assumptions used to determine fair values, and no broker or third-party prices were changed from the values received.
Equity securities. Our equity securities are classified as Level 1 assets as their fair values are based upon quoted market prices.
Limited partnerships. The Company considers the net asset value ("NAV") to represent the value of the investment fund and is measured by the total value of assets minus the total value of liabilities. The following table includes information related to our investments in limited partnerships that calculate NAV per share. For these investments, which are measured at fair value on a recurring basis, we use the NAV per share to measure fair value. The Company recognized net investment related gains of $0.9 million and $7.5 million on limited partnerships held for the years ended December 31, 2023 and 2021, respectively, and losses of $9.7 million for the year ended
December 31, 2023 | 10-K 85
| | | | | |
| CITIZENS, INC. | NOTES TO CONSOLIDATED FINANCIAL STATEMENTS |
| (Continued) |
| |
December 31, 2022. These investments are included in other long-term investments on the consolidated balance sheets.
| | | | | | | | | | | | | | | | | | | | | | | | | | |
| | December 31, 2023 | | December 31, 2022 |
(In thousands, except years) | | Fair Value Using NAV Per Share | Unfunded Commit-
ments | Range
(In years) | | Fair Value Using NAV Per Share | Unfunded Commit-
ments | Range
(In years) |
| Description | |
| Limited partnerships: | | | | | | | |
| Middle market | Investments in privately-originated, performing senior secured debt primarily in North America-based companies | $ | 34,858 | | 3,452 | | 4 | | $ | 33,234 | | 6,011 | | 5 |
| Global equity fund | Investments in common stocks of U.S., international developed and emerging markets with a focus on long-term capital growth | 10,345 | | — | | 0 | | 9,037 | | — | | 0 |
| | | | | | | | |
| Late-stage growth | Investments in private late-stage, established companies seeking capital to accelerate growth prior to an IPO or sale | 20,524 | | 14,271 | | 4 to 6 | | 16,892 | | 18,444 | | 5 to 7 |
| Infrastructure | Investments in environmental infrastructure and related technology, focusing on renewable power generation and distribution | 16,733 | | 9,576 | | 10 | | 7,683 | | 4,107 | | 11 |
| Total limited partnerships | $ | 82,460 | | 27,299 | | | | $ | 66,846 | | 28,562 | | |
The majority of our limited partnership investments are not redeemable because distributions from the funds will be received when the underlying investments of the funds are liquidated. The life spans indicated above may be shortened or extended at the fund manager's discretion, typically in one or two-year increments. The global equity fund is redeemable monthly.
FINANCIAL INSTRUMENTS NOT CARRIED AT FAIR VALUE
Estimates of fair values are made at a specific point in time, based on relevant market prices and information about the financial instruments. The estimated fair values of financial instruments presented below are not necessarily indicative of the amounts the Company might realize in actual market transactions.
The carrying amount and fair value for the financial assets and liabilities on the consolidated financial statements not otherwise disclosed for the periods indicated were as follows:
| | | | | | | | | | | | | | | | | | | | | | | |
| | December 31, 2023 | | December 31, 2022 |
| (In thousands) | Carrying
Value | | Fair
Value | | Carrying
Value | | Fair
Value |
| Financial assets: | | | | | | | |
| Policy loans | $ | 75,359 | | | 75,359 | | | 78,773 | | | 78,773 | |
| Residential mortgage loans | 42 | | | 42 | | | 49 | | | 50 | |
| | | | | | | |
| Cash and cash equivalents | 26,997 | | | 26,997 | | | 22,973 | | | 22,973 | |
| Financial liabilities: | | | | | | | |
| Annuity - investment contracts | 67,690 | | | 63,283 | | | 67,344 | | | 61,701 | |
Policy loans. Policy loans had a weighted average annual interest rate of 7.7% at both December 31, 2023 and 2022 and no specified maturity dates. Policy loans are an integral part of the life insurance policies we have in force, cannot be valued separately and are not marketable. Therefore, the fair value of policy loans approximates the carrying value reflected on the consolidated balance sheets and are considered Level 3 assets in the fair value hierarchy.
December 31, 2023 | 10-K 86
| | | | | |
| CITIZENS, INC. | NOTES TO CONSOLIDATED FINANCIAL STATEMENTS |
| (Continued) |
| |
Residential mortgage loan. The mortgage loan is secured principally by a residential property. The interest rate for this loan was 7.0% at December 31, 2023 and 2022. At December 31, 2023, the remaining loan matures in five years. Management estimated the fair value using an annual interest rate of 6.25% at both December 31, 2023 and 2022. Our mortgage loan is considered a Level 3 asset in the fair value hierarchy and is included in other long-term investments on the consolidated balance sheets.
Cash and cash equivalents. The fair value of cash and cash equivalents approximate carrying value and are characterized as Level 1 assets in the fair value hierarchy.
Annuity liabilities. The fair value of the Company's liabilities under annuity contracts, which are considered Level 3 liabilities, was estimated at December 31, 2023 and 2022 using discounted cash flows based upon spot rates adjusted for various risk adjustments ranging from 3.80% to 4.50% and 4.74% to 5.09%, respectively. The fair value of liabilities under all insurance contracts are taken into consideration in the overall management of interest rate risk, which seeks to minimize exposure to changing interest rates through the matching of investment maturities with amounts due under insurance contracts.
Other long-term investments. The following table summarizes the carrying amounts of other long-term investments.
| | | | | | | | |
As of December 31, (In thousands) | 2023 | 2022 |
| Other long-term investments: | | |
| Limited partnerships | $ | 82,460 | | 69,294 | |
| FHLB common stock | 202 | | 193 | |
| Mortgage loans | 42 | | 49 | |
| All other investments | 21 | | 22 | |
| Total other long-term investments | $ | 82,725 | | 69,558 | |
We carried no limited partnership investments at cost at December 31, 2023 and $2.4 million were carried at cost at December 31, 2022.
We are a member of the FHLB of Dallas and such membership requires members to own stock in the FHLB. Our FHLB stock is carried at amortized cost, which approximates fair value.
(4) DEFERRED POLICY ACQUISITION COSTS AND COST OF INSURANCE ACQUIRED
The following tables roll forward the DAC and COIA balances for the years ended December 31, 2023 and 2022 by reporting cohort. Our reporting cohorts are Permanent, which summarizes insurance policies with premiums payable over the lifetime of the policy, and Permanent Limited Pay, which summarizes insurance policies with premiums payable for a limited time after which the policy is fully paid up. Both reporting cohorts include whole life and endowment policies.
December 31, 2023 | 10-K 87
| | | | | |
| CITIZENS, INC. | NOTES TO CONSOLIDATED FINANCIAL STATEMENTS |
| (Continued) |
| |
DAC
| | | | | | | | | | | | | | | |
| Year Ended December 31, 2023 |
| (In thousands) | Permanent | Permanent Limited Pay | | Other Business | Total |
| Life Insurance: | | | | | |
| Balance, beginning of year | $ | 100,926 | | 11,542 | | | 1,016 | | 113,484 | |
| Capitalizations | 16,451 | | 3,332 | | | 468 | | 20,251 | |
| Amortization expense | (11,825) | | (799) | | | (271) | | (12,895) | |
| | | | | |
| Balance, end of year | 105,552 | | 14,075 | | | 1,213 | | 120,840 | |
| | | | | |
| Home Service Insurance: | | | | | |
| Balance, beginning of year | 38,793 | | 9,729 | | | 921 | | 49,443 | |
| Capitalizations | 6,570 | | 1,232 | | | 248 | | 8,050 | |
| Amortization expense | (2,083) | | (397) | | | (85) | | (2,565) | |
| | | | | |
| Balance, end of year | 43,280 | | 10,564 | | | 1,084 | | 54,928 | |
| | | | | |
| Consolidated: | | | | | |
| Balance, beginning of year | 139,719 | | 21,271 | | | 1,937 | | 162,927 | |
| Capitalizations | 23,021 | | 4,564 | | | 716 | | 28,301 | |
| Amortization expense | (13,908) | | (1,196) | | | (356) | | (15,460) | |
| | | | | |
| Balance, end of year | $ | 148,832 | | 24,639 | | | 2,297 | | 175,768 | |
| | | | | | | | | | | | | | | |
| Year Ended December 31, 2022 |
| (In thousands) | Permanent | Permanent Limited Pay | | Other Business | Total |
| Life Insurance: | | | | | |
| Balance, beginning of year | $ | 97,675 | | 9,001 | | | 1,026 | | 107,702 | |
| Capitalizations | 14,599 | | 3,193 | | | 150 | | 17,942 | |
| Amortization expense | (11,348) | | (652) | | | (160) | | (12,160) | |
| | | | | |
| Balance, end of year | 100,926 | | 11,542 | | | 1,016 | | 113,484 | |
| | | | | |
| Home Service Insurance: | | | | | |
| Balance, beginning of year | 35,137 | | 8,723 | | | 856 | | 44,716 | |
| Capitalizations | 5,501 | | 1,372 | | | 84 | | 6,957 | |
| Amortization expense | (1,845) | | (366) | | | (19) | | (2,230) | |
| | | | | |
| Balance, end of year | 38,793 | | 9,729 | | | 921 | | 49,443 | |
| | | | | |
| Consolidated: | | | | | |
| Balance, beginning of year | 132,812 | | 17,724 | | | 1,882 | | 152,418 | |
| Capitalizations | 20,100 | | 4,565 | | | 234 | | 24,899 | |
| Amortization expense | (13,193) | | (1,018) | | | (179) | | (14,390) | |
| | | | | |
| Balance, end of year | $ | 139,719 | | 21,271 | | | 1,937 | | 162,927 | |
DAC capitalization increased for the year ended December 31, 2023, compared to the same prior year period mainly from increased commissions from higher first year sales across our business segments.
December 31, 2023 | 10-K 88
| | | | | |
| CITIZENS, INC. | NOTES TO CONSOLIDATED FINANCIAL STATEMENTS |
| (Continued) |
| |
COIA
| | | | | | | | | | | | | | | |
| Year Ended December 31, 2023 |
| (In thousands) | Permanent | Permanent Limited Pay | | Other Business | Total |
| Life Insurance: | | | | | |
| Balance, beginning of year | $ | 267 | | 750 | | | 444 | | 1,461 | |
| Amortization expense | (18) | | (55) | | | (38) | | (111) | |
| | | | | |
| Balance, end of year | 249 | | 695 | | | 406 | | 1,350 | |
| | | | | |
| Home Service Insurance: | | | | | |
| Balance, beginning of year | 7,583 | | 176 | | | 1,427 | | 9,186 | |
| Amortization expense | (389) | | (8) | | | (96) | | (493) | |
| | | | | |
| Balance, end of year | 7,194 | | 168 | | | 1,331 | | 8,693 | |
| | | | | |
| Consolidated: | | | | | |
| Balance, beginning of year | 7,850 | | 926 | | | 1,871 | | 10,647 | |
| Amortization expense | (407) | | (63) | | | (134) | | (604) | |
| | | | | |
| Balance, end of year | $ | 7,443 | | 863 | | | 1,737 | | 10,043 | |
| | | | | | | | | | | | | | | |
| Year Ended December 31, 2022 |
| (In thousands) | Permanent | Permanent Limited Pay | | Other Business | Total |
| Life Insurance: | | | | | |
| Balance, beginning of year | $ | 287 | | 812 | | | 485 | | 1,584 | |
| Amortization expense | (20) | | (62) | | | (41) | | (123) | |
| | | | | |
| Balance, end of year | 267 | | 750 | | | 444 | | 1,461 | |
| | | | | |
| Home Service Insurance: | | | | | |
| Balance, beginning of year | 7,989 | | 184 | | | 1,511 | | 9,684 | |
| Amortization expense | (406) | | (8) | | | (84) | | (498) | |
| | | | | |
| Balance, end of year | 7,583 | | 176 | | | 1,427 | | 9,186 | |
| | | | | |
| Consolidated: | | | | | |
| Balance, beginning of year | 8,276 | | 996 | | | 1,996 | | 11,268 | |
| Amortization expense | (426) | | (70) | | | (125) | | (621) | |
| | | | | |
| Balance, end of year | $ | 7,850 | | 926 | | | 1,871 | | 10,647 | |
December 31, 2023 | 10-K 89
| | | | | |
| CITIZENS, INC. | NOTES TO CONSOLIDATED FINANCIAL STATEMENTS |
| (Continued) |
| |
Estimated amortization of COIA in each of the next five years and thereafter is as follows. Actual future amortization will differ from these estimates due to variances from estimated future withdrawal assumptions.
| | | | | |
| (In thousands) | Amount |
| Cost of insurance acquired: | |
| Year: | |
| 2024 | $ | 647 | |
| 2025 | 599 | |
| 2026 | 555 | |
| 2027 | 515 | |
| 2028 | 479 | |
| Thereafter | 7,248 | |
| Total cost of insurance acquired | $ | 10,043 | |
(5) POLICYHOLDERS’ LIABILITIES
LIABILITY FOR FUTURE POLICY BENEFITS
The following tables summarize balances of and changes in the liability for future policy benefits for our reporting cohorts: Permanent, which summarizes insurance policies with premiums payable over the lifetime of the policy, and Permanent Limited Pay, which summarizes insurance policies with premiums payable for a limited time after which the policy is fully paid up. Both reporting cohorts include whole life and endowment policies.
December 31, 2023 | 10-K 90
| | | | | |
| CITIZENS, INC. | NOTES TO CONSOLIDATED FINANCIAL STATEMENTS |
| (Continued) |
| |
| | | | | | | | | | | | | | | | | | | | | | | | | |
December 31, 2023 (In thousands) | Life Insurance | | Home Service Insurance |
| Permanent | Permanent Limited Pay | | Total | | Permanent | Permanent Limited Pay | | Total |
| Present Value of Expected Net Premiums: | | | | | | | | |
| Balance, beginning of year | $ | 235,228 | | 10,209 | | | 245,437 | | | 93,508 | | 13,255 | | | 106,763 | |
| Beginning balance at original discount rate | 247,601 | | 10,682 | | | 258,283 | | | 100,225 | | 14,394 | | | 114,619 | |
| Effect of changes in cash flow assumptions | (210) | | 38 | | | (172) | | | (343) | | 85 | | | (258) | |
| Effects of actual variances from expected experience | 4,184 | | 1,536 | | | 5,720 | | | (8,287) | | (6,402) | | | (14,689) | |
| Adjusted beginning of year balance | 251,575 | | 12,256 | | | 263,831 | | | 91,595 | | 8,077 | | | 99,672 | |
| Issuances | 34,285 | | 3,607 | | | 37,892 | | | 17,668 | | 3,951 | | | 21,619 | |
| Interest accrual | 9,291 | | 355 | | | 9,646 | | | 4,045 | | 468 | | | 4,513 | |
| Net premiums collected | (43,307) | | (2,955) | | | (46,262) | | | (11,901) | | 2,832 | | | (9,069) | |
| Derecognition and other | 582 | | 270 | | | 852 | | | 638 | | 184 | | | 822 | |
| Ending balance at original discount rate | 252,426 | | 13,533 | | | 265,959 | | | 102,045 | | 15,512 | | | 117,557 | |
| Effect of changes in discount rates | (7,509) | | (273) | | | (7,782) | | | (3,214) | | (586) | | | (3,800) | |
| Balance, end of year | $ | 244,917 | | 13,260 | | | 258,177 | | | 98,831 | | 14,926 | | | 113,757 | |
| | | | | | | | | |
| Present Value of Expected Future Policy Benefits: | | | | | | | |
| Balance, beginning of year | $ | 947,415 | | 195,612 | | | 1,143,027 | | | 200,351 | | 116,356 | | | 316,707 | |
| Beginning balance at original discount rate | 996,169 | | 208,051 | | | 1,204,220 | | | 214,188 | | 121,908 | | | 336,096 | |
| Effect of changes in cash flow assumptions | (389) | | (702) | | | (1,091) | | | (257) | | 331 | | | 74 | |
| Effects of actual variances from expected experience | 7,370 | | 5,330 | | | 12,700 | | | (8,126) | | (2,103) | | | (10,229) | |
| Adjusted beginning of year balance | 1,003,150 | | 212,679 | | | 1,215,829 | | | 205,805 | | 120,136 | | | 325,941 | |
| Issuances | 34,922 | | 3,792 | | | 38,714 | | | 17,664 | | 3,973 | | | 21,637 | |
| Interest accrual | 43,275 | | 8,355 | | | 51,630 | | | 9,339 | | 5,667 | | | 15,006 | |
| Benefit payments | (85,257) | | (22,129) | | | (107,386) | | | (15,891) | | (6,002) | | | (21,893) | |
| Derecognition and other | (128) | | 58 | | | (70) | | | 607 | | 167 | | | 774 | |
| Ending balance at original discount rate | 995,962 | | 202,755 | | | 1,198,717 | | | 217,524 | | 123,941 | | | 341,465 | |
| Effect of changes in discount rates | (22,612) | | (7,633) | | | (30,245) | | | (5,578) | | (1,157) | | | (6,735) | |
| Balance, end of year | $ | 973,350 | | 195,122 | | | 1,168,472 | | | 211,946 | | 122,784 | | | 334,730 | |
| | | | | | | | | |
| Net liability for future policy benefits | $ | 728,433 | | 181,862 | | | 910,295 | | | 113,115 | | 107,858 | | | 220,973 | |
| | | | | | | | | |
| | | | | | | | | |
| | | | | | | | | |
December 31, 2023 | 10-K 91
| | | | | |
| CITIZENS, INC. | NOTES TO CONSOLIDATED FINANCIAL STATEMENTS |
| (Continued) |
| |
| | | | | | | | | | | | | | | | | | | | | | | | | |
December 31, 2022 (In thousands) | Life Insurance | | Home Service Insurance |
| Permanent | Permanent Limited Pay | | Total | | Permanent | Permanent Limited Pay | | Total |
| Present Value of Expected Net Premiums: | | | | | | | | |
| Balance, beginning of year | $ | 269,528 | | 4,939 | | | 274,467 | | | 104,556 | | 10,196 | | | 114,752 | |
| Beginning balance at original discount rate | 246,386 | | 5,093 | | | 251,479 | | | 90,012 | | 9,532 | | | 99,544 | |
| Effect of changes in cash flow assumptions | (3,662) | | 237 | | | (3,425) | | | 4,253 | | 1,214 | | | 5,467 | |
| Effects of actual variances from expected experience | 3,466 | | 1,534 | | | 5,000 | | | (3,744) | | (8,407) | | | (12,151) | |
| Adjusted beginning of year balance | 246,190 | | 6,864 | | | 253,054 | | | 90,521 | | 2,339 | | | 92,860 | |
| Issuances | 35,826 | | 4,086 | | | 39,912 | | | 19,030 | | 5,288 | | | 24,318 | |
| Interest accrual | 8,382 | | 82 | | | 8,464 | | | 3,454 | | 244 | | | 3,698 | |
| Net premiums collected | (41,560) | | (258) | | | (41,818) | | | (11,202) | | 6,752 | | | (4,450) | |
| Derecognition and other | (1,237) | | (92) | | | (1,329) | | | (1,578) | | (229) | | | (1,807) | |
| Ending balance at original discount rate | 247,601 | | 10,682 | | | 258,283 | | | 100,225 | | 14,394 | | | 114,619 | |
| Effect of changes in discount rates | (12,373) | | (473) | | | (12,846) | | | (6,717) | | (1,139) | | | (7,856) | |
| Balance, end of year | $ | 235,228 | | 10,209 | | | 245,437 | | | 93,508 | | 13,255 | | | 106,763 | |
| | | | | | | | | |
| Present Value of Expected Future Policy Benefits: | | | | | | | |
| Balance, beginning of year | $ | 1,168,282 | | 240,679 | | | 1,408,961 | | | 266,206 | | 161,715 | | | 427,921 | |
| Beginning balance at original discount rate | 990,921 | | 207,105 | | | 1,198,026 | | | 205,340 | | 117,425 | | | 322,765 | |
| Effect of changes in cash flow assumptions | (3,916) | | 374 | | | (3,542) | | | 4,822 | | 1,765 | | | 6,587 | |
| Effects of actual variances from expected experience | 4,528 | | 4,910 | | | 9,438 | | | (3,278) | | (992) | | | (4,270) | |
| Adjusted beginning of year balance | 991,533 | | 212,389 | | | 1,203,922 | | | 206,884 | | 118,198 | | | 325,082 | |
| Issuances | 36,604 | | 4,187 | | | 40,791 | | | 19,054 | | 5,286 | | | 24,340 | |
| Interest accrual | 42,547 | | 8,474 | | | 51,021 | | | 8,754 | | 5,452 | | | 14,206 | |
| Benefit payments | (72,383) | | (16,765) | | | (89,148) | | | (18,870) | | (6,770) | | | (25,640) | |
| Derecognition and other | (2,132) | | (234) | | | (2,366) | | | (1,634) | | (258) | | | (1,892) | |
| Ending balance at original discount rate | 996,169 | | 208,051 | | | 1,204,220 | | | 214,188 | | 121,908 | | | 336,096 | |
| Effect of changes in discount rates | (48,754) | | (12,439) | | | (61,193) | | | (13,837) | | (5,552) | | | (19,389) | |
| Balance, end of year | $ | 947,415 | | 195,612 | | | 1,143,027 | | | 200,351 | | 116,356 | | | 316,707 | |
| | | | | | | | | |
| Net liability for future policy benefits | $ | 712,187 | | 185,403 | | | 897,590 | | | 106,843 | | 103,101 | | | 209,944 | |
| Plus: Flooring impact | 1 | | — | | | 1 | | | — | | — | | | — | |
| | | | | | | | | |
| Net liability for future policy benefits, after flooring impact | $ | 712,188 | | 185,403 | | | 897,591 | | | 106,843 | | 103,101 | | | 209,944 | |
Net premiums collected is defined as the transactional gross premiums collected in the current period times the net premium ratio. Issuances are calculated as the present value, using the locked-in discount rate, of the expected net premiums or the expected future policy benefits related to new policies issued during the years ended December 31, 2023 and 2022. Interest accrual is the interest earned on the beginning present value of either the expected net premiums or the expected future policy benefits using the locked-in discount rate. Benefit payments are the transactional benefits (death, lapse, surrenders and maturities) paid in the current period. Derecognition refers to a subset of the issuances or the present value of future premiums released on new issues that lapsed during the years ended December 31, 2023 and 2022 as well as other reconciling items. The effects of actual variances from expected experience lines are primarily impacted by the actual policy cash flows during the period
December 31, 2023 | 10-K 92
| | | | | |
| CITIZENS, INC. | NOTES TO CONSOLIDATED FINANCIAL STATEMENTS |
| (Continued) |
| |
compared to that which was expected in the reserve assumptions. If the net of the two lines is a positive number, the implication is an unfavorable result with policy cash flows less favorable than assumed while a negative number implies a favorable result compared to assumptions. Our policy experience will vary from actual experience in any one period, either favorably or unfavorably.
The following table reconciles the net liability for future policy benefits shown above to the liability for future policy benefits reported in the consolidated balance sheets.
| | | | | | | | | | | | | | | | | | | | | | | |
| December 31, 2023 | | December 31, 2022 |
| (In thousands) | Life
Insurance | Home Service
Insurance | Consolidated | | Life
Insurance | Home Service
Insurance | Consolidated |
| Life Insurance: | | | | | | | |
| Permanent | $ | 728,433 | | 113,115 | | 841,548 | | | 712,188 | | 106,843 | | 819,031 | |
| Permanent limited pay | 181,862 | | 107,858 | | 289,720 | | | 185,403 | | 103,101 | | 288,504 | |
| Deferred profit liability | 28,933 | | 26,804 | | 55,737 | | | 25,655 | | 24,459 | | 50,114 | |
| Other | 28,319 | | 13,929 | | 42,248 | | | 27,370 | | 13,628 | | 40,998 | |
| Total life insurance | 967,547 | | 261,706 | | 1,229,253 | | | 950,616 | | 248,031 | | 1,198,647 | |
| Accident & Health: | | | | | | | |
| | | | | | | |
| Other | 588 | | 301 | | 889 | | | 533 | | 234 | | 767 | |
| | | | | | | |
| Total future policy benefit reserves | $ | 968,135 | | 262,007 | | 1,230,142 | | | 951,149 | | 248,265 | | 1,199,414 | |
The following table provides the amount of undiscounted and discounted expected gross premiums and expected future benefit payments for long-term duration contracts.
| | | | | | | | | | | | | | | | | | | | | | | |
| December 31, 2023 | | December 31, 2022 |
| (In thousands) | Life
Insurance | | Home Service
Insurance | | Life
Insurance | | Home Service
Insurance |
| Undiscounted: | | | | | | | |
| Permanent: | | | | | | | |
| Expected future gross premiums | $ | 621,935 | | | 455,552 | | | 612,531 | | | 461,298 | |
| Expected future benefit payments | 1,495,206 | | | 484,740 | | | 1,479,562 | | | 473,039 | |
| | | | | | | |
| Permanent Limited Pay: | | | | | | | |
| Expected future gross premiums | 47,161 | | | 77,266 | | | 47,447 | | | 74,278 | |
| Expected future benefit payments | 326,821 | | | 320,810 | | | 323,559 | | | 316,225 | |
| | | | | | | |
| | | | | | | |
| | | | | | | |
| | | | | | | |
| | | | | | | |
| Discounted: | | | | | | | |
| Permanent: | | | | | | | |
| Expected future gross premiums | $ | 481,963 | | | 275,629 | | | 472,754 | | | 271,440 | |
| Expected future benefit payments | 973,350 | | | 211,946 | | | 947,415 | | | 200,351 | |
| | | | | | | |
| Permanent Limited Pay: | | | | | | | |
| Expected future gross premiums | 42,138 | | | 53,075 | | | 41,853 | | | 52,030 | |
| Expected future benefit payments | 195,122 | | | 122,784 | | | 195,612 | | | 116,356 | |
| | | | | | | |
| | | | | | | |
| | | | | | | |
| | | | | | | |
December 31, 2023 | 10-K 93
| | | | | |
| CITIZENS, INC. | NOTES TO CONSOLIDATED FINANCIAL STATEMENTS |
| (Continued) |
| |
The following tables summarize the amount of revenue and interest related to long-term duration contracts recognized in the consolidated statements of operations and comprehensive income (loss):
| | | | | | | | | | | | | | | | | | | | | | | | | | | | | | | | | | |
| | | Years Ended December 31, |
| | | | | 2023 | | 2022 | | 2021 |
| (In thousands) | | | | | | | Gross Premiums | Interest Expense | | Gross Premiums | Interest Expense | | Gross Premiums | Interest Expense |
| Life Insurance Segment: | | | | | | | | | | | | | |
| Life Insurance: | | | | | | | | | | | | | | |
| Permanent | | | | | | | $ | 93,917 | | 33,984 | | | 94,905 | | 34,165 | | | 96,766 | | 34,067 | |
| Permanent Limited Pay | | | | | | | 16,396 | | 8,923 | | | 15,023 | | 9,214 | | | 13,678 | | 9,331 | |
| Other | | | | | | | 12,813 | | — | | | 16,047 | | — | | | 16,856 | | — | |
| Less: | | | | | | | | | | | | | | |
| Reinsurance | | | | | | | 1,702 | | — | | | 1,819 | | — | | | 1,742 | | — | |
| Total, net of reinsurance | | | | | | | 121,424 | | 42,907 | | | 124,156 | | 43,379 | | | 125,558 | | 43,398 | |
| Accident & Health: | | | | | | | | | | | | | | |
| | | | | | | | | | | | | | |
| Other | | | | | | | 725 | | — | | | 502 | | — | | | 505 | | — | |
| Less: | | | | | | | | | | | | | | |
| Reinsurance | | | | | | | 4 | | — | | | 5 | | — | | | 5 | | — | |
| Total, net of reinsurance | | | | | | | 721 | | — | | | 497 | | — | | | 500 | | — | |
| Total | | | | | | | $ | 122,145 | | 42,907 | | | 124,653 | | 43,379 | | | 126,058 | | 43,398 | |
| | | | | | | | | | | | | | |
| Home Service Insurance Segment: | | | | | | | | | | | | |
| Life Insurance: | | | | | | | | | | | | | | |
| Permanent | | | | | | | $ | 33,263 | | 5,294 | | | 33,312 | | 5,300 | | | 33,706 | | 5,447 | |
| Permanent Limited Pay | | | | | | | 8,576 | | 6,388 | | | 8,396 | | 6,255 | | | 8,324 | | 6,187 | |
| Other | | | | | | | 1,371 | | — | | | 1,749 | | — | | | 2,236 | | — | |
| Less: | | | | | | | | | | | | | | |
| Reinsurance | | | | | | | 25 | | — | | | 27 | | — | | | 23 | | — | |
| Total, net of reinsurance | | | | | | | 43,185 | | 11,682 | | | 43,430 | | 11,555 | | | 44,243 | | 11,634 | |
| Accident & Health: | | | | | | | | | | | | | | |
| | | | | | | | | | | | | | |
| Other | | | | | | | 916 | | — | | | 781 | | — | | | 750 | | — | |
| | | | | | | | | | | | | | |
| | | | | | | | | | | | | | |
| | | | | | | | | | | | | | |
| Total | | | | | | | $ | 44,101 | | 11,682 | | | 44,211 | | 11,555 | | | 44,993 | | 11,634 | |
The following table provides the weighted-average durations of the liability for future policy benefits.
| | | | | | | | | | | | | | | | | |
| December 31, 2023 | | December 31, 2022 |
| (In years) | Life
Insurance | Home Service
Insurance | | Life
Insurance | Home Service
Insurance |
| Permanent: | | | | | |
| Duration at original discount rate | 8.5 | 16.4 | | 8.0 | 15.4 |
| Duration at current discount rate | 8.5 | 16.4 | | 8.5 | 16.2 |
| Permanent Limited Pay: | | | | | |
| Duration at original discount rate | 8.2 | 14.8 | | 7.6 | 14.3 |
| Duration at current discount rate | 8.1 | 15.3 | | 7.5 | 15.7 |
| | | | | |
| | | | | |
| | | | | |
December 31, 2023 | 10-K 94
| | | | | |
| CITIZENS, INC. | NOTES TO CONSOLIDATED FINANCIAL STATEMENTS |
| (Continued) |
| |
The following table provides the weighted-average interest rates for the liability for future policy benefits.
| | | | | | | | | | | | | | | | | |
| December 31, 2023 | | December 31, 2022 |
| Life
Insurance | Home Service
Insurance | | Life
Insurance | Home Service
Insurance |
| Permanent: | | | | | |
| Interest rate at original discount rate | 4.89 | % | 4.97 | % | | 4.93 | % | 5.00 | % |
| Interest rate at current discount rate | 4.79 | % | 4.96 | % | | 5.10 | % | 5.22 | % |
| Permanent Limited Pay: | | | | | |
| Interest rate at original discount rate | 4.29 | % | 5.04 | % | | 4.30 | % | 5.05 | % |
| Interest rate at current discount rate | 4.77 | % | 4.95 | % | | 5.07 | % | 5.21 | % |
| | | | | |
| | | | | |
| | | | | |
LIABILITY FOR POLICYHOLDERS’ ACCOUNT BALANCES
The following table presents the policyholders' account balances by range of guaranteed minimum crediting rates and the related range of the difference, in basis points, between rates being credited and the respective guaranteed minimums.
| | | | | | | | | | | | | | | | | |
| At Guaranteed Minimum | 1 Basis Point-50 Basis Points Above | 51 Basis Points-150 Basis Points Above | Greater Than 150 Basis Points Above | Total |
December 31, 2023 (In thousands) |
| Range of Guaranteed Minimum Crediting Rates: | | | | |
| 0.00% - 1.49% | $ | 784 | | — | | 1,146 | | 34,886 | | 36,816 | |
| 1.50% - 2.99% | 33,073 | | 671 | | 49 | | — | | 33,793 | |
| 3.00% - 4.49% | 105,684 | | 9 | | — | | — | | 105,693 | |
| Greater or equal to 4.50% | 31,400 | | — | | — | | — | | 31,400 | |
| Total | $ | 170,941 | | 680 | | 1,195 | | 34,886 | | 207,702 | |
| | | | | | | | | | | | | | | | | |
| At Guaranteed Minimum | 1 Basis Point-50 Basis Points Above | 51 Basis Points-150 Basis Points Above | Greater Than 150 Basis Points Above | Total |
December 31, 2022 (In thousands) |
| Range of Guaranteed Minimum Crediting Rates: | | | | |
| 0.00% - 1.49% | $ | 736 | | — | | 1,089 | | 38,671 | | 40,496 | |
| 1.50% - 2.99% | 24,155 | | 631 | | 51 | | — | | 24,837 | |
| 3.00% - 4.49% | 98,902 | | 9 | | — | | — | | 98,911 | |
| Greater or equal to 4.50% | 31,825 | | — | | — | | — | | 31,825 | |
| Total | $ | 155,618 | | 640 | | 1,140 | | 38,671 | | 196,069 | |
December 31, 2023 | 10-K 95
| | | | | |
| CITIZENS, INC. | NOTES TO CONSOLIDATED FINANCIAL STATEMENTS |
| (Continued) |
| |
The following tables summarize balances of and changes in policyholders' account balances.
| | | | | | | | | | | | | | |
December 31, 2023 (In thousands, except for %) | Supplemental Contracts Without Life Contingencies | Fixed Annuity | Dividend Accumulations | Premiums Paid in Advance |
| Balance, beginning of year | $ | 32,995 | | 86,807 | | 41,663 | | 34,603 | |
| Issuances | 22,387 | | 2,741 | | 660 | | 3,693 | |
| Premiums received | 123 | | 4,387 | | 5,860 | | 793 | |
| | | | |
| Interest credited | 1,483 | | 2,653 | | 1,364 | | 1,627 | |
| Other | 1 | | — | | — | | — | |
| Less: | | | | |
| Surrenders and withdrawals | — | | 9,454 | | 4,587 | | 9,677 | |
| Benefit payments | 12,420 | | — | | — | | — | |
| Balance, end of year | $ | 44,569 | | 87,134 | | 44,960 | | 31,039 | |
| Weighted-average crediting rates | 4.00 | % | 3.56 | % | 3.04 | % | 2.95 | % |
| | | | |
| Cash surrender value | $ | 44,569 | | 87,134 | | 44,960 | | 31,039 | |
| | | | | | | | | | | | | | |
December 31, 2022 (In thousands, except for %) | Supplemental Contracts Without Life Contingencies | Fixed Annuity | Dividend Accumulations | Premiums Paid in Advance |
| Balance, beginning of year | $ | 23,950 | | 83,917 | | 37,760 | | 38,875 | |
| Issuances | 12,071 | | 3,044 | | 683 | | 2,820 | |
| Premiums received | 176 | | 4,940 | | 5,538 | | 779 | |
| | | | |
| Interest credited | 1,067 | | 2,631 | | 1,216 | | 964 | |
| Other | 2 | | — | | — | | — | |
| Less: | | | | |
| Surrenders and withdrawals | — | | 7,725 | | 3,534 | | 8,835 | |
| Benefit payments | 4,271 | | — | | — | | — | |
| Balance, end of year | $ | 32,995 | | 86,807 | | 41,663 | | 34,603 | |
| Weighted-average crediting rates | 4.08 | % | 3.59 | % | 3.07 | % | 3.04 | % |
| | | | |
| Cash surrender value | $ | 32,995 | | 86,807 | | 41,663 | | 34,603 | |
December 31, 2023 | 10-K 96
| | | | | |
| CITIZENS, INC. | NOTES TO CONSOLIDATED FINANCIAL STATEMENTS |
| (Continued) |
| |
The following table reconciles policyholders' account balances shown above to the policyholders' account balances liability in the consolidated balance sheets.
| | | | | | | | | | | | | | | |
As of December 31, (In thousands) | | | 2023 | | | | 2022 |
| Annuities: | | | | | | | |
| Supplemental contracts without life contingencies | | | $ | 44,569 | | | | | 32,995 | |
| Fixed annuity | | | 87,134 | | | | | 86,807 | |
| Unearned revenue reserve | | | 1,513 | | | | | 1,619 | |
| Other | | | — | | | | | 1 | |
| Total annuities | | | $ | 133,216 | | | | | 121,422 | |
| | | | | |
| | | | | | | |
| | | | | | | |
| | | | | | | |
| | | | | | | |
| | | | | | | |
| | | | | | | |
| Premiums Paid in Advance: | | | | | | | |
| Premiums paid in advance | | | $ | 31,039 | | | | | 34,603 | |
| Other | | | 1,407 | | | | | 1,781 | |
| Total premiums paid in advance | | | $ | 32,446 | | | | | 36,384 | |
(6) POLICY CLAIM LIABILITY AND SHORT DURATION CONTRACTS
The following table presents information on changes in the liability for life, accident and health and property policy and contract claims.
| | | | | | | | | | | | | | | | | |
Years ended December 31,
(In thousands) | 2023 | | 2022 | | 2021 |
| Policy claims payable: | | | | | |
| Balance at January 1 | $ | 9,884 | | | 14,590 | | | 13,206 | |
| Less: reinsurance recoverable | 2,070 | | | 2,469 | | | 3,012 | |
| Net balance at January 1 | 7,814 | | | 12,121 | | | 10,194 | |
| Add claims incurred, related to: | | | | | |
| Current year | 25,630 | | | 28,720 | | | 32,595 | |
Prior years(1) | (522) | | | (46) | | | 1,052 | |
| | 25,108 | | | 28,674 | | | 33,647 | |
| Deduct claims paid, related to: | | | | | |
| Current year | 20,786 | | | 22,771 | | | 23,369 | |
| Prior years | 6,797 | | | 10,210 | | | 8,351 | |
| | 27,583 | | | 32,981 | | | 31,720 | |
| Net balance December 31 | 5,339 | | | 7,814 | | | 12,121 | |
| Plus: reinsurance recoverable | 1,298 | | | 2,070 | | | 2,469 | |
| Balance at December 31 | $ | 6,637 | | | 9,884 | | | 14,590 | |
(1) This line is primarily impacted by the level of claim resolutions in the period compared to that which is expected by the reserve assumption. A positive number implies an unfavorable result where claim resolutions were less favorable than assumed while a negative number implies a favorable result compared to assumptions. Our claim assumptions will vary from actual experience in any one period, either favorably or unfavorably. |
SHORT DURATION CONTRACTS
The Company's short duration contracts consist of credit life and credit disability in the Life Insurance segment and property insurance in the Home Service Insurance segment. The credit insurance lines are an immaterial part of
December 31, 2023 | 10-K 97
| | | | | |
| CITIZENS, INC. | NOTES TO CONSOLIDATED FINANCIAL STATEMENTS |
| (Continued) |
| |
short duration contracts so the following disclosures cover only the property insurance line of business in the Home Service Insurance segment.
Special Property Insurance (Allied and Fire)
The following table presents incurred claims development as of December 31, 2023, net of reinsurance, as well as cumulative claim frequency and the total of incurred-but-not-reported liabilities plus expected development on reported claims included within the net incurred claims amounts. This information is presented for the last five years as these claims rarely pay out over a longer period of time.
| | | | | | | | | | | | | | | | | | | | | | | |
| | As of December 31, 2023 |
| Incurred Claims and Allocated Claim Adjustment Expenses, Net of Reinsurance | Total of Incurred-but-Not-Reported Liabilities Plus Expected Development on Reported Claims | Cumulative Number of Reported Claims |
| For the Years Ended December 31, |
| ($ In thousands) | 2019 | 2020 | 2021 | 2022 | 2023 |
| Accident Year: | (Unaudited) | | | |
| 2019 | $ | 1,549 | | 1,150 | | 1,161 | | 1,106 | | 1,105 | | — | | 610 | |
| 2020 | | 2,598 | | 2,670 | | 2,577 | | 2,694 | | — | | 2,415 | |
| 2021 | | | 2,087 | | 1,644 | | 1,312 | | 2 | | 2,397 | |
| 2022 | | | | 1,213 | | 1,262 | | 4 | | 362 | |
| 2023 | | | | | 776 | | 27 | | 191 | |
| Total | | | | | $ | 7,149 | | | |
The following table presents paid claims development as of December 31, 2023, net of reinsurance.
| | | | | | | | | | | | | | | | | |
| Cumulative Paid Claims and Allocated Claim Adjustment Expenses, Net of Reinsurance |
| Years Ended December 31, |
| (In thousands) | 2019 | 2020 | 2021 | 2022 | 2023 |
| Accident Year: | (Unaudited) | |
| 2019 | $ | 1,166 | | 1,071 | | 1,091 | | 1,105 | | 1,105 | |
| 2020 | | 1,997 | | 2,639 | | 2,576 | | 2,694 | |
| 2021 | | | 1,435 | | 1,638 | | 1,311 | |
| 2022 | | | | 1,011 | | 1,259 | |
| 2023 | | | | | 755 | |
| Total | | | | | $ | 7,124 | |
| All outstanding liabilities before 2019, net of reinsurance | | $ | — | |
| Liabilities for claims and claim adjustment expenses, net of reinsurance | | $ | 33 | |
December 31, 2023 | 10-K 98
| | | | | |
| CITIZENS, INC. | NOTES TO CONSOLIDATED FINANCIAL STATEMENTS |
| (Continued) |
| |
The reconciliation of the net incurred and paid claims development tables to the liability for claims and claim adjustment expenses in the consolidated balance sheets are as follows:
| | | | | | | | | | | |
As of December 31,
(In thousands) | 2023 | | 2022 |
| Net outstanding liabilities: | | | |
| Special property | $ | 33 | | | 263 | |
| Other short duration insurance lines | 151 | | | 158 | |
| Liabilities for unpaid claims and claim adjustment expenses, net of reinsurance | 184 | | | 421 | |
| Reinsurance recoverable on unpaid claims: | | | |
| Special property | 1,220 | | | 1,275 | |
| Other short duration insurance lines | 78 | | | 798 | |
| Total reinsurance recoverable on unpaid claims | 1,298 | | | 2,073 | |
| Insurance lines other than short duration | 5,155 | | | 7,390 | |
| Total gross liability for unpaid claims and claim adjustment expense | $ | 6,637 | | | 9,884 | |
The following is supplementary information to the consolidated financial statements about average historical claims duration as of December 31, 2023.
| | | | | | | | | | | | | | | | | |
Average Annual Percentage Payout of Incurred Claims by Age, Net of Reinsurance (Unaudited) |
| Years | 1 | 2 | 3 | 4 | 5 |
| | | | | |
| Special property | 93 | % | 13 | % | (8) | % | 3 | % | — | % |
(7) REINSURANCE
In the normal course of business, the Company reinsures portions of certain policies that we underwrite to limit disproportionate risks. During 2023 and 2022, we generally retained $100,000 on any one individual life insurance policy. The Company also reinsures 100% of our accidental death benefit rider coverage. The Company maintained catastrophe reinsurance with the net retention on any one loss of $30,000, which is the maximum policy limit on any single risk. During 2023, this reinsurance provided $11.0 million of coverage with the Company retaining $2.4 million of the risk. In 2022, this reinsurance provided $11.0 million of coverage once the Company paid a $1.4 million deductible. In consideration for a reinstatement premium, second event coverage was provided under the same terms for both years. The Company remains contingently liable in the event that any of the reinsurers are unable to meet their obligations under any reinsurance agreement.
Our amounts recoverable from reinsurers represent receivables from and reserves ceded to reinsurers. We obtain reinsurance from multiple reinsurers, and we monitor concentration as well as financial strength ratings of our principal reinsurers. The ratings by A.M. Best Company range from A- (Excellent) to A+ (Superior). Assumed and ceded life reinsurance activity is summarized as follows:
| | | | | | | | | | | |
December 31,
(In thousands) | 2023 | | 2022 |
| Aggregate assumed life insurance in force | $ | 3,772 | | | 4,074 | |
| Aggregate ceded life insurance in force | $ | 619,597 | | | 543,496 | |
| Net life insurance in force | $ | 4,306,429 | | | 4,257,148 | |
December 31, 2023 | 10-K 99
| | | | | |
| CITIZENS, INC. | NOTES TO CONSOLIDATED FINANCIAL STATEMENTS |
| (Continued) |
| |
The Company's reinsurance recoverable on ceded reinsurance was $4.0 million and $4.6 million in 2023 and 2022, respectively. Premiums and claims and surrenders assumed and ceded for all lines of business for these years are summarized as follows:
| | | | | | | | | | | | | | | | | |
Years ended December 31,
(In thousands) | 2023 | | 2022 | | 2021 |
| Premiums from short duration contracts: | | | | | |
| Direct | $ | 4,425 | | | 7,862 | | | 7,631 | |
| Assumed | — | | | — | | | — | |
| Ceded | (1,792) | | | (1,413) | | | (2,312) | |
| Net premiums earned | 2,633 | | | 6,449 | | | 5,319 | |
| Premiums from long duration contracts: | | | | | |
| Direct | 166,132 | | | 169,111 | | | 171,175 | |
| Assumed | 68 | | | 74 | | | 84 | |
| Ceded | (1,794) | | | (1,920) | | | (1,850) | |
| Net premiums earned | 164,406 | | | 167,265 | | | 169,409 | |
| Total premiums earned | $ | 167,039 | | | 173,714 | | | 174,728 | |
| Claims and surrenders assumed | $ | 113 | | | 151 | | | 169 | |
Claims and surrenders ceded | $ | (936) | | | (1,130) | | | (11,764) | |
During the third quarter of 2021, SPFIC was impacted by Hurricane Ida, the second-most damaging and intense hurricane in Louisiana on record, behind Hurricane Katrina in 2005. The Company has a reinsurance agreement that covers catastrophic events such as Hurricane Ida. We paid the $0.5 million retention in claim amounts for Ida and do not expect to exceed the maximum reinsurance coverage.
(8) COMMITMENTS AND CONTINGENCIES
LITIGATION AND REGULATORY ACTIONS
From time to time, we are subject to legal and regulatory actions relating to our business. We defend all claims vigorously. As a result, we incur defense costs, including attorneys' fees, other direct litigation costs and the expenditure of management time that otherwise would be devoted to our business. If we suffer an adverse judgment as a result of litigation claims or if a regulator fines us, it could have a material adverse effect on our business, results of operations and financial condition.
CREDIT FACILITY
On May 5, 2021, the Company entered into a $20 million senior secured revolving credit facility (the “Credit Facility”) with Regions Bank ("Regions"). The Credit Facility has a three-year term, maturing on May 5, 2024, and allows the Company to borrow up to $20 million for working capital purposes, capital expenditures and other corporate purposes.
Revolving loans may be requested by the Company in aggregate minimum principal amounts of $0.5 million per loan. At the Company's election, the revolving loans may either bear a base rate, which is 1.75% plus a base rate (a fluctuating rate per annum) equal to the greatest of (a) Regions' prime rate, (b) the federal funds rate plus 0.50%, or (c) 0.75%. The Company is required to pay Regions a quarterly commitment fee of 0.375% of the unused portion of the Credit Facility, which the Company expenses as it is incurred.
Obligations under the Credit Facility are secured by substantially all of the assets of the Company other than the equity interests in all of the regulated insurance subsidiaries, real estate owned by the Company, and other limited exceptions. The Credit Facility contains customary events of default and financial, affirmative and negative covenants, including but not limited to restrictions on indebtedness, liens, investments, asset dispositions and restricted payments. As of December 31, 2023, the Company had not borrowed any funds against the Credit Facility and was not in violation of any covenants.
December 31, 2023 | 10-K 100
| | | | | |
| CITIZENS, INC. | NOTES TO CONSOLIDATED FINANCIAL STATEMENTS |
| (Continued) |
| |
CONTRACTUAL OBLIGATIONS
The Company leases home office space in Austin, Texas for Citizens and in Puerto Rico for NES as well as several district office locations related to our Home Service Insurance segment across Louisiana, Mississippi and Arkansas, which are classified as operating leases. Certain operating leases include renewal options that extend the lease term. The exercise of lease renewal options is at our sole discretion when it is reasonably certain that we will exercise such option. Leases with an initial term of 12 months or less are immaterial to the consolidated financial statements and are recognized as lease expense on a straight-line basis over the lease term and not recorded on the consolidated balance sheets.
Our operating lease liabilities had a weighted-average lease term of 6.8 years remaining as of December 31, 2023.
Maturities of our remaining operating lease liabilities as of December 31, 2023 are as follows.
| | | | | | | | |
| (In thousands) | | Operating Lease Payments |
| Maturity of operating lease liabilities: | | |
| 2024 | | $ | 1,499 | |
| 2025 | | 1,433 | |
| 2026 | | 1,385 | |
| 2027 | | 1,403 | |
| 2028 | | 1,438 | |
| After 2028 | | 2,728 | |
| Total operating lease liabilities | | 9,886 | |
| Interest expense | | (813) | |
| Present value of operating lease liabilities | | $ | 9,073 | |
We record the lease right-of-use asset in Property and Equipment, net and the lease liability in Other Liabilities using a weighted average discount rate of 2.59%. Cash payments related to the operating lease liabilities were $1.4 million for both of the years ended December 31, 2023 and 2022 and were reported in operating cash flows.
The Company does not engage in lease agreements among related parties.
As of December 31, 2023, CICA International is committed to fund investments up to $27.3 million related to limited partnership investments.
(9) STOCKHOLDERS' EQUITY AND RESTRICTIONS
STOCK
Our Restated and Amended Articles of Incorporation authorize the issuance of 127,000,000 shares, of which 100,000,000 shares shall be Class A common stock, 2,000,000 shares shall be Class B common stock, and 25,000,000 shall be preferred stock. Both authorized classes of common stock are equal in all respects, except (a) each share of Class A common stock is entitled to receive twice the cash dividends paid on a per share basis to the Class B common stock, if any; and (b) the holders of the Class B common stock have the exclusive right to elect a simple majority of the Board of Directors of Citizens. In April 2021, we repurchased all of the outstanding Class B common stock and it is now classified as treasury stock. As a result, all of the directors are elected by the holders of the Class A common stock. Citizens has never issued any preferred stock.
December 31, 2023 | 10-K 101
| | | | | |
| CITIZENS, INC. | NOTES TO CONSOLIDATED FINANCIAL STATEMENTS |
| (Continued) |
| |
A summary of the change in the number of shares of Class A and Class B common stock and treasury stock issued is as follows:
| | | | | | | | | | | | | | | | | |
| (In thousands) | Common Stock | | Treasury |
| Class A | | Class B | | Stock |
| Balance at December 31, 2020 | 52,654 | | | 1,002 | | | 3,136 | |
| Stock issued under stock investment plan | 404 | | | — | | | — | |
| Stock issued for compensation | 112 | | | — | | | — | |
| | | | | |
| Acquisition of Class B shares | — | | | — | | | 1,002 | |
| | | | | |
| Balance at December 31, 2021 | 53,170 | | | 1,002 | | | 4,138 | |
| Stock issued under stock investment plan | 475 | | | — | | | — | |
| Stock issued for compensation | 91 | | | — | | | — | |
| Acquisition of Class A shares | — | | | — | | | 799 | |
| | | | | |
| Other share issuance | 22 | | | — | | | — | |
| Balance at December 31, 2022 | 53,758 | | | 1,002 | | | 4,937 | |
| | | | | |
| Stock issued for compensation | 125 | | | — | | | — | |
| Acquisition of Class A shares | — | | | — | | | 393 | |
| | | | | |
| | | | | |
| Balance at December 31, 2023 | 53,883 | | | 1,002 | | | 5,330 | |
EARNINGS PER SHARE
The following table sets forth the computation of basic and diluted earnings per share.
| | | | | | | | | | | | | | | | | | | | |
Years ended December 31,
(In thousands, except per share amounts) | | 2023 | | 2022 | | 2021 |
| Net income (loss) | | $ | 24,437 | | | 26,007 | | | 72,706 | |
| Numerator for Basic Earnings Per Share: | | | | | | |
| Net income (loss) allocated to Class A common stock | | $ | 24,437 | | | 26,007 | | | 72,481 | |
| Net income (loss) allocated to Class B common stock | | — | | | — | | | 225 | |
| Net income (loss) | | $ | 24,437 | | | 26,007 | | | 72,706 | |
| Denominator for Basic Earnings Per Share: | | | | | | |
| Weighted average shares of Class A outstanding | | 49,696 | | | 50,139 | | | 49,664 | |
| Weighted average shares of Class B outstanding | | — | | | — | | | 308 | |
| Total weighted average shares outstanding | | 49,696 | | | 50,139 | | | 49,972 | |
| Basic earnings (loss) per share of Class A common stock | | $ | 0.49 | | | 0.52 | | | 1.46 | |
| Basic earnings (loss) per share of Class B common stock | | — | | | — | | | 0.73 | |
| | | | | | |
| Numerator for Diluted Earnings Per Share: | | | | | | |
| Net income (loss) allocated to Class A common stock | | $ | 24,437 | | | 26,007 | | | 72,484 | |
| Net income (loss) allocated to Class B common stock | | — | | | — | | | 222 | |
| Net income (loss) | | $ | 24,437 | | | 26,007 | | | 72,706 | |
| Denominator for Diluted Earnings Per Share: | | | | | | |
| Weighted average shares of Class A outstanding | | 50,681 | | | 50,867 | | | 50,337 | |
| Weighted average shares of Class B outstanding | | — | | | — | | | 308 | |
| Total weighted average shares outstanding | | 50,681 | | | 50,867 | | | 50,645 | |
| Diluted earnings (loss) per share of Class A common stock | | $ | 0.48 | | | 0.51 | | | 1.44 | |
| Diluted earnings (loss) per share of Class B common stock | | — | | | — | | | 0.72 | |
December 31, 2023 | 10-K 102
| | | | | |
| CITIZENS, INC. | NOTES TO CONSOLIDATED FINANCIAL STATEMENTS |
| (Continued) |
| |
STATUTORY CAPITAL AND SURPLUS
The table below shows the combined total of all of our domestic insurance subsidiaries' statutory capital and surplus and statutory net income (loss) for life insurance operations and property insurance operations, although these amounts are not all available as dividends to Citizens since CICA Domestic is the only subsidiary directly owned by Citizens. All other domestic subsidiaries are owned by CICA Domestic.
| | | | | | | | | | | |
As of December 31,
(In thousands) | 2023 | | 2022 |
| Combined statutory capital and surplus: | | | |
| Life insurance operations | $ | 29,416 | | | 35,433 | |
| Property insurance operations | 5,692 | | | 6,912 | |
| Total combined statutory capital and surplus | $ | 35,108 | | | 42,345 | |
| | | | | | | | | | | | | | | | | |
Years ended December 31,
(In thousands) | 2023 | | 2022 | | 2021 |
| Combined statutory net income (loss): | | | | | |
| Life insurance operations | $ | (3,606) | | | (1,885) | | | 5,280 | |
| Property insurance operations | (1,219) | | | 1,615 | | | (1,512) | |
| Total combined statutory net income (loss) | $ | (4,825) | | | (270) | | | 3,768 | |
Generally, the net assets of the domestic insurance subsidiaries available for transfer to their immediate parent are limited to the lesser of the subsidiary's net gain from operations during the preceding year or 10% of the subsidiary's net statutory surplus as of the end of the preceding year as determined in accordance with accounting practices prescribed or permitted by insurance regulatory authorities. Under these practices, total surplus at December 31, 2023 was $26.3 million and net loss from operations was $0.9 million for CICA Domestic for the year ended December 31, 2023. Based upon these amounts, no dividend could be paid to the Company without prior regulatory approval in 2024. Payments of dividends in excess of such amounts would generally require approval by regulatory authorities.
Our domestic insurance subsidiaries have calculated their risk-based capital ("RBC") in accordance with the National Association of Insurance Commissioners' ("NAIC") Model Rule and the RBC rules as adopted by their respective states of domicile. As part of the novation transaction with CICA Bermuda, the Company agreed to infuse capital into CICA Domestic as required by the Colorado Department of Insurance to maintain CICA Domestic's RBC above 350% in any future calendar year-end periods. All domestic insurance subsidiaries exceeded RBC minimum levels at December 31, 2023.
CICA International is a Puerto Rico domiciled company. The Insurance Code of Puerto Rico does not specifically set forth minimum capital and surplus standards, but rather requires that an insurer submit a business plan for approval to the Office of the Commissioner of Insurance ("OIC") that includes proposed minimum capital and surplus. CICA International is required to maintain a minimum of $750,000 in capital and maintain a premium to surplus ratio of 7 to 1. CICA International began issuing new business as of January 1, 2023 and received the transfer of all of CICA Bermuda's in force insurance business as of August 31, 2023. On that date, Citizens entered into a Keep Well Agreement with CICA International to replace the Keep Well Agreement that had been in place between Citizens and CICA Bermuda. The Keep Well Agreement requires Citizens to contribute up to $10 million in capital to CICA International as necessary to ensure that CICA International maintains at least either (i) 112% of its required ratio of premiums to capital and surplus, or (ii) 200% of the minimum capital and surplus requirement, whichever is higher. The initial term of the Keep Well Agreement is 12 months. Since CICA International's capital exceeds both of the metrics, Citizens is not required to make a capital contribution. Any capital that Citizens is required to contribute could negatively impact the Company's capital resources and liquidity.
December 31, 2023 | 10-K 103
| | | | | |
| CITIZENS, INC. | NOTES TO CONSOLIDATED FINANCIAL STATEMENTS |
| (Continued) |
| |
| | | | | | | | | | | |
As of December 31,
(In thousands) | 2023 | | 2022 |
| CICA Bermuda capital and surplus | $ | — | | | 61,801 | |
| CICA International capital and surplus | $ | 66,619 | | | — | |
CICA Bermuda requested a modification as permitted under Section 6C (1) of the Bermuda Insurance Act 1978 (the "Insurance Act") to remove the impact of unrealized gains or losses from the Minimum Margin of Solvency requirement. On January 19, 2023, the Bermuda Monetary Authority granted CICA Bermuda a permitted practice, effective December 31, 2022, pursuant to Section 6C (1) of the Insurance Act to report its fixed income maturity securities at amortized cost in its unconsolidated statutory financial statements.
| | | | | | | | | | | | | | | | | |
Years ended December 31,
(In thousands) | 2023 | | 2022 | | 2021 |
| CICA Bermuda net income (loss) | $ | — | | | (1,024) | | | 14,029 | |
| CICA International net income (loss) | $ | 27,484 | | | — | | | — | |
As stated above, CICA International exceeded both of the capital and surplus metrics established by the OIC. CICA International could pay up to $5.0 million in dividends during 2024 without regulatory approval.
(10) SEGMENT AND OTHER OPERATING INFORMATION
The Company has two reportable segments: Life Insurance and Home Service Insurance. Our Life Insurance segment issues endowment contracts, which are principally accumulation contracts that incorporate an element of life insurance protection, and ordinary whole life insurance to non-U.S. residents through CICA International. These contracts are designed to provide a fixed amount of insurance coverage over the life of the insured and may utilize rider benefits to provide additional coverage and annuity benefits to enhance accumulations. CICA Domestic issues ordinary whole life, final expense, life products with living benefits, critical illness and credit life and credit disability policies throughout the U.S.
Our Home Service Insurance segment operates through our subsidiaries SPLIC, MGLIC and SPFIC, and focuses on the life insurance needs of the middle- and lower-income markets, primarily in Louisiana, Mississippi and Arkansas. Our policies are sold and serviced through funeral homes and independent agents who sell policies, collect premiums and service policyholders. Our Home Service Insurance segment also sold property insurance policies in Louisiana and Arkansas until operations were ceased effective June 30, 2023.
The Life Insurance and Home Service Insurance portions of the Company constitute separate businesses. In addition to the Life Insurance and Home Service Insurance business, the Company also operates other non-insurance portions of the Company ("Other Non-Insurance Enterprises"), which primarily include the Company’s IT and corporate-support functions.
The accounting policies of the reportable segments and Other Non-Insurance Enterprises are presented in accordance with U.S. GAAP and are the same as those described in the summary of significant accounting policies. The Company evaluates profit and loss performance based on U.S. GAAP net income (loss) before federal income taxes for its two reportable segments. The Company's Other Non-Insurance Enterprises represents the only reportable difference between segments and consolidated operations.
December 31, 2023 | 10-K 104
| | | | | |
| CITIZENS, INC. | NOTES TO CONSOLIDATED FINANCIAL STATEMENTS |
| (Continued) |
| |
| | | | | | | | | | | | | | | | | | | | | | | |
Year ended December 31, 2023 (In thousands) | Life
Insurance | | Home
Service Insurance | | Other
Non-Insurance
Enterprises | | Consolidated |
| Revenues: | | | | | | | |
| Premiums: | | | | | | | |
| Life insurance | $ | 121,424 | | | 43,185 | | | — | | | 164,609 | |
| Accident and health insurance | 721 | | | 916 | | | — | | | 1,637 | |
| Property insurance | — | | | 793 | | | — | | | 793 | |
| Net investment income (loss) | 54,352 | | | 13,832 | | | 1,070 | | | 69,254 | |
| Investment related gains (losses), net | 301 | | | 522 | | | (63) | | | 760 | |
| Other income (loss) | 3,605 | | | 17 | | | 5 | | | 3,627 | |
| Total revenues | 180,403 | | | 59,265 | | | 1,012 | | | 240,680 | |
| Benefits and expenses: | | | | | | | |
| Insurance benefits paid or provided: | | | | | | | |
| Claims and surrenders | 113,428 | | | 22,565 | | | — | | | 135,993 | |
| Increase in future policy benefit reserves | (10,931) | | | 5,307 | | | — | | | (5,624) | |
| Policyholder liability remeasurement (gain) loss | 4,153 | | | 307 | | | — | | | 4,460 | |
| Policyholders' dividends | 5,512 | | | 30 | | | — | | | 5,542 | |
| Total insurance benefits paid or provided | 112,162 | | | 28,209 | | | — | | | 140,371 | |
| Commissions | 22,896 | | | 16,345 | | | — | | | 39,241 | |
| Other general expenses | 23,969 | | | 16,690 | | | 6,472 | | | 47,131 | |
| Capitalization of deferred policy acquisition costs | (20,251) | | | (8,050) | | | — | | | (28,301) | |
| Amortization of deferred policy acquisition costs | 12,895 | | | 2,565 | | | — | | | 15,460 | |
| Amortization of cost of insurance acquired | 111 | | | 493 | | | — | | | 604 | |
| Total benefits and expenses | 151,782 | | | 56,252 | | | 6,472 | | | 214,506 | |
| Income (loss) before federal income tax | $ | 28,621 | | | 3,013 | | | (5,460) | | | 26,174 | |
December 31, 2023 | 10-K 105
| | | | | |
| CITIZENS, INC. | NOTES TO CONSOLIDATED FINANCIAL STATEMENTS |
| (Continued) |
| |
| | | | | | | | | | | | | | | | | | | | | | | |
Year ended December 31, 2022 (In thousands) | Life
Insurance | | Home
Service Insurance | | Other
Non-Insurance
Enterprises | | Consolidated |
| Revenues: | | | | | | | |
| Premiums: | | | | | | | |
| Life insurance | $ | 124,156 | | | 43,430 | | | — | | | 167,586 | |
| Accident and health insurance | 497 | | | 781 | | | — | | | 1,278 | |
| Property insurance | — | | | 4,850 | | | — | | | 4,850 | |
| Net investment income (loss) | 50,680 | | | 13,632 | | | 1,114 | | | 65,426 | |
| Investment related gains (losses), net | (8,826) | | | (1,277) | | | (188) | | | (10,291) | |
| Other income (loss) | 3,668 | | | 1 | | | 6 | | | 3,675 | |
| Total revenues | 170,175 | | | 61,417 | | | 932 | | | 232,524 | |
| Benefits and expenses: | | | | | | | |
| Insurance benefits paid or provided: | | | | | | | |
| Claims and surrenders | 95,576 | | | 24,359 | | | — | | | 119,935 | |
| Increase in future policy benefit reserves | 3,894 | | | 910 | | | — | | | 4,804 | |
| Policyholder liability remeasurement (gain) loss | 1,728 | | | 1,156 | | | — | | | 2,884 | |
| Policyholders' dividends | 5,990 | | | 23 | | | — | | | 6,013 | |
| Total insurance benefits paid or provided | 107,188 | | | 26,448 | | | — | | | 133,636 | |
| Commissions | 20,031 | | | 16,191 | | | — | | | 36,222 | |
| Other general expenses | 23,192 | | | 16,444 | | | 5,541 | | | 45,177 | |
| Capitalization of deferred policy acquisition costs | (17,942) | | | (6,957) | | | — | | | (24,899) | |
| Amortization of deferred policy acquisition costs | 12,160 | | | 2,230 | | | — | | | 14,390 | |
| Amortization of cost of insurance acquired | 123 | | | 498 | | | — | | | 621 | |
| | | | | | | |
| Total benefits and expenses | 144,752 | | | 54,854 | | | 5,541 | | | 205,147 | |
| Income (loss) before federal income tax | $ | 25,423 | | | 6,563 | | | (4,609) | | | 27,377 | |
December 31, 2023 | 10-K 106
| | | | | |
| CITIZENS, INC. | NOTES TO CONSOLIDATED FINANCIAL STATEMENTS |
| (Continued) |
| |
| | | | | | | | | | | | | | | | | | | | | | | |
| | | | | | | |
Year ended December 31, 2021 (In thousands) | Life
Insurance | | Home
Service Insurance | | Other
Non-Insurance
Enterprises | | Consolidated |
| Revenues: | | | | | | | |
| Premiums: | | | | | | | |
| Life insurance | $ | 125,558 | | | 44,243 | | | — | | | 169,801 | |
| Accident and health insurance | 500 | | | 750 | | | — | | | 1,250 | |
| Property insurance | — | | | 3,677 | | | — | | | 3,677 | |
| Net investment income (loss) | 47,216 | | | 13,224 | | | 1,055 | | | 61,495 | |
| Investment related gains (losses), net | 9,176 | | | 618 | | | 1,197 | | | 10,991 | |
| Other income (loss) | 3,362 | | | 7 | | | (37) | | | 3,332 | |
| Total revenue | 185,812 | | | 62,519 | | | 2,215 | | | 250,546 | |
| Benefits and expenses: | | | | | | | |
| Insurance benefits paid or provided: | | | | | | | |
| Claims and surrenders | 91,390 | | | 28,345 | | | — | | | 119,735 | |
| Increase in future policy benefit reserves | 7,822 | | | 1,951 | | | — | | | 9,773 | |
| Policyholder liability remeasurement (gain) loss | 829 | | | 605 | | | — | | | 1,434 | |
| Policyholders' dividends | 6,140 | | | 40 | | | — | | | 6,180 | |
| Total insurance benefits paid or provided | 106,181 | | | 30,941 | | | — | | | 137,122 | |
| Commissions | 18,747 | | | 16,716 | | | — | | | 35,463 | |
| Other general expenses | 20,846 | | | 14,739 | | | 7,785 | | | 43,370 | |
| Capitalization of deferred policy acquisition costs | (16,174) | | | (6,566) | | | — | | | (22,740) | |
| Amortization of deferred policy acquisition costs | 11,536 | | | 1,909 | | | — | | | 13,445 | |
| Amortization of cost of insurance acquired | 150 | | | 607 | | | — | | | 757 | |
| Goodwill impairment | 12,624 | | | — | | | — | | | 12,624 | |
| Total benefits and expenses | 153,910 | | | 58,346 | | | 7,785 | | | 220,041 | |
| Income (loss) before federal income tax | $ | 31,902 | | | 4,173 | | | (5,570) | | | 30,505 | |
The table below summarizes assets by segment.
| | | | | | | | | | | |
December 31,
(In thousands) | 2023 | | 2022 |
| Assets: | | | |
| Segments: | | | |
| Life Insurance | $ | 1,267,243 | | | 1,194,285 | |
| Home Service Insurance | 359,773 | | | 341,671 | |
| Total Segments | 1,627,016 | | | 1,535,956 | |
| Other Non-Insurance Enterprises | 41,912 | | | 54,747 | |
| Total assets | $ | 1,668,928 | | | 1,590,703 | |
December 31, 2023 | 10-K 107
| | | | | |
| CITIZENS, INC. | NOTES TO CONSOLIDATED FINANCIAL STATEMENTS |
| (Continued) |
| |
GEOGRAPHIC INFORMATION
The following table sets forth, by country, the Company's annual total of earned premiums from geographic area for the years indicated:
| | | | | | | | | | | | | | | | | |
Years ended December 31,
(In thousands) | 2023 | | 2022 | | 2021 |
| Area: | | | | | |
| United States | $ | 50,594 | | | 54,712 | | | 56,000 | |
| Colombia | 25,453 | | | 25,181 | | | 24,829 | |
| Taiwan | 17,760 | | | 18,236 | | | 19,042 | |
| Venezuela | 15,143 | | | 16,429 | | | 17,788 | |
| Ecuador | 13,379 | | | 12,992 | | | 13,115 | |
| Argentina | 9,533 | | | 9,251 | | | 9,160 | |
| Other foreign countries | 38,695 | | | 40,172 | | | 38,871 | |
| Net reinsurance | (3,518) | | | (3,259) | | | (4,077) | |
| Total premiums | $ | 167,039 | | | 173,714 | | | 174,728 | |
(11) INCOME TAXES
CICA International and CICA Bermuda, wholly-owned subsidiaries of Citizens, are considered controlled foreign corporations for federal income tax purposes. As a result, the insurance activity of CICA International and CICA Bermuda are subject to Subpart F of the Internal Revenue Code ("IRC") and are included in Citizens’ taxable income. Due to the 0% enacted tax rate in Bermuda, there are no deferred taxes recorded for CICA Bermuda's temporary differences. CICA International has applied for a tax exemption decree from the Government of Puerto Rico which will freeze the income tax rate at 4% on any taxable earnings in excess of $1.2 million. For the year ended December 31, 2023, the Subpart F income inclusion generated $1.6 million of federal income tax expense and $2.1 million of federal income tax expense for the years ended December 31, 2022 and 2021.
In connection with the transfer of CICA Bermuda’s business from a zero tax jurisdiction to CICA International’s 4% tax jurisdiction in Puerto Rico, certain opening tax assets and liabilities, mainly related to investments, DAC and reserves, were established. The net deferred tax asset of $1.4 million was recorded to retained earnings during 2023 in accordance with ASC Topic 805.
December 31, 2023 | 10-K 108
| | | | | |
| CITIZENS, INC. | NOTES TO CONSOLIDATED FINANCIAL STATEMENTS |
| (Continued) |
| |
A reconciliation between the U.S. corporate income tax rate and the effective income tax rate is as follows:
| | | | | | | | | | | | | | | | | | | | | | | | | | | | | | | | | | | |
Years ended December 31,
(In thousands, except for %) | 2023 | | % | | 2022 | | % | | 2021 | | % |
| Expected tax expense (benefit) | $ | 5,497 | | | 21.0 | % | | $ | 5,749 | | | 21.0 | % | | $ | 6,406 | | | 21.0 | % |
| Change in valuation allowance | — | | | — | | | 1 | | | — | | | — | | | — | % |
| | | | | | | | | | | |
| Foreign income tax rate differential | (5,029) | | | (19.2) | | | (5,260) | | | (19.2) | | | (9,427) | | | (30.9) | |
| | | | | | | | | | | |
| Tax-exempt interest and dividends-received deduction | (35) | | | (0.1) | | | (63) | | | (0.2) | | | (114) | | | (0.4) | |
| | | | | | | | | | | |
| Adjustment of prior year taxes | — | | | — | | | — | | | — | | | (83) | | | (0.3) | |
| | | | | | | | | | | |
| Effect of uncertain tax position | (971) | | | (3.7) | | | (1,185) | | | (4.3) | | | (43,834) | | | (143.7) | |
| Nondeductible costs to remediate tax compliance issue | — | | | — | | | — | | | — | | | (176) | | | (0.6) | |
| Compensation limitation under 162(m) and 280(g) | 80 | | | 0.3 | | | 67 | | | 0.2 | | | (21) | | | (0.1) | |
| Subpart F income | 1,595 | | | 6.1 | | | 2,053 | | | 7.5 | | | 2,102 | | | 6.9 | |
| PFIC QEF inclusions | 570 | | | 2.2 | | | — | | | — | | | — | | | — | |
| Puerto Rico income tax exclusion | (48) | | | (0.2) | | | — | | | — | | | — | | | — | |
| Rate differential on net operating loss carryback claim | — | | | — | | | — | | | — | | | 290 | | | 1.0 | |
| | | | | | | | | | | |
| Goodwill impairment | — | | | — | | | — | | | — | | | 2,651 | | | 8.7 | |
| Other | 78 | | | 0.2 | | | 8 | | | — | | | 5 | | | — | |
| Total federal income tax expense (benefit) | $ | 1,737 | | | 6.6 | % | | $ | 1,370 | | | 5.0 | % | | $ | (42,201) | | | (138.4) | % |
Income tax expense (benefit) consists of:
| | | | | | | | | | | | | | | | | |
Years ended December 31,
(In thousands) | 2023 | | 2022 | | 2021 |
| Income tax expense (benefit): | | | | | |
| Current - normal operations | $ | 1,848 | | | 632 | | | (68) | |
| Current - UTP release impact | (971) | | | (1,185) | | | (43,834) | |
| Deferred | 860 | | | 1,923 | | | 1,701 | |
| Total income tax expense (benefit) | $ | 1,737 | | | 1,370 | | | (42,201) | |
December 31, 2023 | 10-K 109
| | | | | |
| CITIZENS, INC. | NOTES TO CONSOLIDATED FINANCIAL STATEMENTS |
| (Continued) |
| |
The components of deferred federal income taxes are as follows:
| | | | | | | | | | | |
December 31,
(In thousands) | 2023 | | 2022 |
| Deferred tax assets: | | | |
| Future policy benefit reserves | $ | 739 | | | — | |
| Net operating and capital loss carryforwards | 353 | | | 388 | |
| Accrued policyholder dividends and expenses | 218 | | | 134 | |
| Investments | — | | | 113 | |
| | | |
| Deferred intercompany loss | 1,780 | | | 1,744 | |
| Unrealized losses on investments available-for-sale | 12,786 | | | 11,688 | |
| Accrued compensation | 379 | | | 360 | |
| Lease liability | 1,895 | | | 2,124 | |
| Fixed assets | 249 | | | 237 | |
| Other | 270 | | | 203 | |
| Total gross deferred tax assets | 18,669 | | | 16,991 | |
| Less: | | | |
| Valuation allowance | 4,468 | | | 4,238 | |
| Net deferred tax assets | 14,201 | | | 12,753 | |
| Deferred tax liabilities: | | | |
| DAC, COIA and intangible assets | (11,556) | | | (10,274) | |
| Future policy benefit reserves | — | | | (1,756) | |
| Unrealized gains on investments available-for-sale | (322) | | | — | |
| | | |
| Tax reserves transition liability | (1,494) | | | (2,242) | |
| Right-of-use lease asset | (1,895) | | | (2,124) | |
| Other | (36) | | | (10) | |
| Total gross deferred tax liabilities | (15,303) | | | (16,406) | |
| Net deferred tax liability | $ | (1,102) | | | (3,653) | |
A summary of the changes in the components of deferred federal and state income taxes is as follows:
| | | | | | | | | | | |
December 31,
(In thousands) | 2023 | | 2022 |
| Deferred federal and state income taxes: | | | |
| Balance January 1, | $ | (3,653) | | | 5,533 | |
| Deferred tax benefit (expense) | (860) | | | (1,923) | |
| | | |
| Investments available-for-sale | 2,424 | | | 21,770 | |
| Change in valuation allowance | (230) | | | (4,238) | |
| | | |
| Effects of unrealized gains (losses) on reserves | 1,217 | | | (24,795) | |
| | | |
| | | |
| Balance December 31, | $ | (1,102) | | | (3,653) | |
The Company and our subsidiaries have no net operating loss carryforwards at December 31, 2023. The Company and our subsidiaries have capital loss carryforwards of $1.6 million at December 31, 2023, which begin expiring in 2026.
December 31, 2023 | 10-K 110
| | | | | |
| CITIZENS, INC. | NOTES TO CONSOLIDATED FINANCIAL STATEMENTS |
| (Continued) |
| |
At December 31, 2023 and 2022, we determined it was more likely than not that a portion of our capital deferred tax assets would not be realized in their entirety. Thus, the Company holds valuation allowances of $4.5 million and $4.2 million in other comprehensive income (loss) at December 31, 2023 and 2022.
The Company recognizes only the impact of tax positions that, based on their technical merits, are more likely than not to be sustained upon an audit by the taxing authority.
A reconciliation of unrecognized tax benefits is as follows:
| | | | | | | | | | | | | | | | | |
Years ended December 31,
(In thousands) | 2023 | | 2022 | | 2021 |
| Balance January 1, | $ | 971 | | | 2,156 | | | 45,990 | |
| | | | | |
| | | | | |
| | | | | |
| Reductions for tax positions of prior years | (971) | | | (1,185) | | | (43,834) | |
| Balance December 31, | $ | — | | | 971 | | | 2,156 | |
This unrecognized tax benefit was reported in the balance of current federal income tax payable on the consolidated balance sheets. Included in these amounts are interest expense of $0.2 million and $0.4 million with respect to unrecognized tax benefits as of December 31, 2022 and 2021, respectively. There are no unrecognized tax benefits remaining as of December 31, 2023.
The Company accrued an uncertain tax position of $1.0 million and $2.2 million at December 31, 2022 and 2021, respectively, which would have affected the effective tax rate if recognized. However, the Company released all of the remaining uncertain tax positions, including interest, during the fourth quarter of 2023 following the expiration of the statute of limitations on the tax year ended December 31, 2019.
The Company’s practice is to recognize interest and penalties related to income tax matters in income tax expense. In the consolidated statements of operations and comprehensive income (loss), the amount of interest income recorded was $0.2 million, $0.2 million and $9.5 million for the years ended December 31, 2023, 2022 and 2021, respectively.
The Coronavirus Aid, Relief, and Economic Security Act ("CARES Act") was enacted on March 27, 2020 in response to the COVID-19 pandemic. The CARES Act, among other things, permitted net operating losses incurred in 2018, 2019 and 2020 to be carried back to each of the five preceding taxable years to generate a refund of previously paid income taxes. During the year ended December 31, 2022, the Company was able to claim a net refund for taxes paid in preceding years as a result of the CARES Act. As of December 31, 2023, the Company has an accrued tax refund remaining of $1.5 million.
The American Rescue Plan Act of 2021 was enacted March 11, 2021 and the Inflation Reduction Act was enacted on August 16, 2022. These Acts did not have a material impact on the Company's financial statements.
The Company's federal income tax return is filed on a consolidated basis with the following entities:
Citizens, Inc.
CICA Life Insurance Company of America
Magnolia Guaranty Life Insurance Company
Security Plan Life Insurance Company
Security Plan Fire Insurance Company
Computing Technology, Inc.
The method of tax allocation among companies is subject to a written tax sharing agreement, approved by the Board of Directors, whereby allocation is made primarily on a separate return basis pursuant to the wait-and-see method. Under this method, consolidated group members are not given current credit or refunds for net operating losses until taxable income on a separate return basis is generated. Intercompany tax balances are settled at least annually.
The Company and our subsidiaries file income tax returns in the U.S. federal jurisdiction and various U.S. states. Our subsidiaries are subject to examination by U.S. tax authorities for tax years ending after December 31, 2019.
December 31, 2023 | 10-K 111
| | | | | |
| CITIZENS, INC. | NOTES TO CONSOLIDATED FINANCIAL STATEMENTS |
| (Continued) |
| |
(12) OTHER COMPREHENSIVE INCOME (LOSS)
The changes in the components of other comprehensive income (loss) are reported net of the effects of income taxes of 21% for domestic entities and 4% for Puerto Rican entities as indicated below.
| | | | | | | | | | | | | | | | | |
| (In thousands) | Amount | | Tax Effect | | Total |
| Year ended December 31, 2023: | | | | | |
| Unrealized gains (losses): | | | | | |
| Unrealized holding gains (losses) arising during the period | $ | 50,894 | | | 971 | | | 51,865 | |
| Reclassification adjustment for (gains) losses included in net income (loss) | 756 | | | (159) | | | 597 | |
| Unrealized holding gains (losses), net | 51,650 | | | 812 | | | 52,462 | |
| Change in current discount rate for liability for future policy benefits | (34,790) | | | 1,217 | | | (33,573) | |
| Other comprehensive income (loss) | $ | 16,860 | | | 2,029 | | | 18,889 | |
| Year ended December 31, 2022: | | | | | |
| Unrealized gains (losses): | | | | | |
| Unrealized holding gains (losses) arising during the period | $ | (328,673) | | | 17,555 | | | (311,118) | |
| Reclassification adjustment for (gains) losses included in net income (loss) | 104 | | | (22) | | | 82 | |
| Unrealized holding gains (losses), net | (328,569) | | | 17,533 | | | (311,036) | |
| Change in current discount rate for liability for future policy benefits | 337,776 | | | (24,795) | | | 312,981 | |
| Other comprehensive income (loss) | $ | 9,207 | | | (7,262) | | | 1,945 | |
| Year ended December 31, 2021: | | | | | |
| Unrealized gains (losses): | | | | | |
| Unrealized holding gains (losses) arising during the period | $ | (41,123) | | | 3,084 | | | (38,039) | |
| Reclassification adjustment for (gains) losses included in net income (loss) | (243) | | | 51 | | | (192) | |
| Unrealized holding gains (losses), net | (41,366) | | | 3,135 | | | (38,231) | |
| Change in current discount rate for liability for future policy benefits | 92,396 | | | (4,584) | | | 87,812 | |
| Other comprehensive income (loss) | $ | 51,030 | | | (1,449) | | | 49,581 | |
(13) STOCK COMPENSATION
In 2023, 2022 and 2021, the Company's Board of Directors approved awards of restricted stock units ("RSUs") under the Citizens, Inc. Omnibus Incentive Plan for non-employee directors and the executive management team. The RSUs granted to the directors vest one year from the date of the annual shareholders meeting, subject to continued service on the Board. RSUs granted to the executive management team are subject to achieving performance goals and once the goals are met, RSUs are awarded. These awarded RSUs have a time-based vesting component of three years, subject to continued employment. In addition, the Board also approved an allotment of RSUs for other employees with a delegation to the Chief Executive Officer to determine the participants and number of RSUs to be awarded. There were three million shares originally authorized to be granted under the plan.
December 31, 2023 | 10-K 112
| | | | | |
| CITIZENS, INC. | NOTES TO CONSOLIDATED FINANCIAL STATEMENTS |
| (Continued) |
| |
The following table provides a rollforward of restricted stock activity.
| | | | | | | | | | | | | | | | | | | | | | | |
| Restricted Stock Units | Units | | Weighted Average Grant Price | | Weighted Average Remaining Contractual Life | | Aggregate Fair Value (1) |
| (In thousands) | | | | (In years) | | (In thousands) |
| Outstanding at December 31, 2020 | 190 | | | $ | 6.03 | | | 0.88 | | $ | 1,142 | |
| Granted | 178 | | | 5.83 | | | | | 1,040 | |
| Less: | | | | | | | |
| Vested | 147 | | | 6.21 | | | | | 913 | |
| Forfeited | 8 | | | 5.96 | | | | | 47 | |
| Outstanding at December 31, 2021 | 213 | | | $ | 5.75 | | | 1.63 | | $ | 1,222 | |
| Granted | 184 | | | 4.00 | | | | | 734 | |
| Less: | | | | | | | |
| Vested | 119 | | | 5.63 | | | | | 669 | |
| Forfeited | 12 | | | 4.27 | | | | | 51 | |
| Outstanding at December 31, 2022 | 266 | | | 4.65 | | | 1.61 | | 1,236 | |
| Granted | 464 | | | 3.03 | | | | | 1,409 | |
| Less: | | | | | | | |
| Vested | 148 | | | 4.56 | | | | | 673 | |
| Forfeited | 8 | | | 4.47 | | | | | 37 | |
| Outstanding at December 31, 2023 | 574 | | | $ | 3.37 | | | 1.63 | | $ | 1,935 | |
(1) Fair value per share of restricted stock units was equal to Grant Date fair value per share, which was calculated based on the closing price of the Company's Class A common stock on the NYSE on the grant date, in accordance with ASC Topic 718.
As of December 31, 2023, we recognized $0.9 million of expense, while $1.3 million was unrecognized and is expected to be amortized up to two years.
Restricted stock unit awards give the participant the right to receive common stock in the future, subject to certain restrictions and a risk of forfeiture. Forfeitures are recognized in the period they occur. Compensation expense of $0.6 million, $0.5 million and $0.6 million was recognized in 2023, 2022 and 2021, respectively, related to these awards.
(14) BENEFIT PLANS
The Company sponsors a defined contribution retirement plan. The plan was initially established as the Citizens, Inc. Profit Sharing Plan and was restated as the Citizens, Inc. 401(k) Retirement and Profit Sharing Plan effective March 1, 2016. There have been no profit sharing contributions since 2014.
The 401(k) plan automatically enrolls employees who have completed three months of service. Voluntary contributions are made by employees and the Company provides a matching contribution based upon the employee's level of contribution. The Company's expense was $0.8 million in 2023 and $0.7 million in both 2022 and 2021.
The Company is primarily self-insured for employee health benefits. The Company records its self-insurance liability based on an estimate of claims incurred but not yet reported. There is stop-loss coverage for amounts in excess of $80,000 per individual per year. If more claims are made than were estimated or if the costs of actual claims increase beyond what was anticipated, reserves recorded may not be sufficient and additional accruals may be required in future periods.
December 31, 2023 | 10-K 113
| | | | | |
| CITIZENS, INC. | NOTES TO CONSOLIDATED FINANCIAL STATEMENTS |
| (Continued) |
| |
(15) RELATED PARTY TRANSACTIONS
The Company has various routine related party transactions in conjunction with our holding company structure, such as management service agreements related to costs incurred, a tax sharing agreement between entities, and inter-company dividends and capital contributions. We perform an expense study on an annual basis, utilizing an enterprise-wide time study, and we adjust cost allocations among entities as needed based upon this review. Any allocation changes are reflected in the segment operations, but do not impact consolidated expenses. There were no changes related to these relationships during the year ended December 31, 2023 and no additional related party transactions.
(16) QUARTERLY FINANCIAL INFORMATION (Unaudited)
The following table contains selected unaudited financial data for each quarter.
| | | | | | | | | | | | | | | | | | | | | | | |
| (In thousands, except per share amounts) | Fourth
Quarter | | Third
Quarter | | Second
Quarter | | First
Quarter |
| 2023 | | | | | | | |
| Revenues | $ | 66,849 | | | 59,390 | | | 58,527 | | | 55,914 | |
| Benefits and expenses | 58,075 | | | 54,749 | | | 52,483 | | | 49,199 | |
| Federal income tax expense (benefit) | (1,967) | | | 1,943 | | | (82) | | | 1,843 | |
| Net income (loss) | 10,741 | | | 2,698 | | | 6,126 | | | 4,872 | |
| Net income (loss) available to common shareholders | 10,741 | | | 2,698 | | | 6,126 | | | 4,872 | |
| Basic earnings (losses) per share of Class A common stock | 0.21 | | | 0.06 | | | 0.12 | | | 0.10 | |
| | | | | | | |
| Diluted earnings (losses) per share of Class A common stock | 0.21 | | | 0.05 | | | 0.12 | | | 0.10 | |
| | | | | | | |
| | | | | | | | | | | | | | | | | | | | | | | |
| | | | | | | |
| 2022 | | | | | | | |
| Revenues | $ | 67,257 | | | 56,176 | | | 53,734 | | | 55,357 | |
| Benefits and expenses | 55,846 | | | 51,354 | | | 49,768 | | | 48,179 | |
| Federal income tax expense (benefit) | (2,248) | | | 1,415 | | | 1,474 | | | 729 | |
| Net income (loss) | 13,659 | | | 3,407 | | | 2,492 | | | 6,449 | |
| Net income (loss) available to common shareholders | 13,659 | | | 3,407 | | | 2,492 | | | 6,449 | |
| Basic earnings (losses) per share of Class A common stock | 0.27 | | | 0.07 | | | 0.05 | | | 0.13 | |
| | | | | | | |
| Diluted earnings (losses) per share of Class A common stock | 0.27 | | | 0.06 | | | 0.05 | | | 0.13 | |
| | | | | | | |
(17) SUBSEQUENT EVENTS
The Company has evaluated the impact of subsequent events as defined by the accounting guidance through the date this report was issued and determined that no subsequent events need to be recognized or disclosed.
December 31, 2023 | 10-K 114
| | | | | |
| CITIZENS, INC. | FINANCIAL SCHEDULES |
| |
| |
| | | | | | | | | | | |
Schedule II
Condensed Financial Information of Registrant
CITIZENS, INC. (Parent Company)
Balance Sheets |
December 31, (In thousands) | 2023 | | 2022 |
| | | | |
| Assets: | | | |
Investment in subsidiaries (1) | $ | 140,557 | | | 88,222 | |
| Fixed maturity securities available-for-sale, at fair value | 21,190 | | | 28,566 | |
| Equity securities, at fair value | 23 | | | 770 | |
| | | |
| | | |
| | | |
| Short-term investments | — | | | 1,241 | |
| Cash | 3,905 | | | 2,163 | |
| Accrued investment income | 230 | | | 342 | |
Accounts receivable from subsidiaries (1) | 4,332 | | | 5,126 | |
| Property and equipment, net | 9,251 | | | 10,387 | |
| | | |
| Other assets | 1,151 | | | 1,715 | |
| Total assets | $ | 180,639 | | | 138,532 | |
| Liabilities and Stockholders' Equity: | | | |
| Liabilities: | | | |
| Accrued expense and other liabilities | $ | 8,510 | | | 10,743 | |
| Total liabilities | 8,510 | | | 10,743 | |
| Stockholders' equity: | | | |
| Common stock: | | | |
| Class A | 268,675 | | | 268,147 | |
| Class B | 3,184 | | | 3,184 | |
| Retained earnings | 42,150 | | | 16,308 | |
| Unrealized investment gains (losses) on securities held by parent and subsidiaries, net of tax | (118,155) | | | (137,044) | |
| Treasury stock | (23,725) | | | (22,806) | |
| Total stockholders' equity | 172,129 | | | 127,789 | |
| Total liabilities and stockholders' equity | $ | 180,639 | | | 138,532 | |
(1) Eliminated in consolidation.
Note to Schedule II:
Citizens, Inc.'s investments in consolidated subsidiaries are stated at cost plus equity in undistributed income of consolidated subsidiaries and unrealized gains (losses) on investments held by consolidated subsidiaries. The Company includes in its statements of operations and comprehensive income (loss) dividends from its subsidiaries and equity in income (loss) of consolidated subsidiaries, which represents the net income (loss) of each of its wholly-owned subsidiaries.
December 31, 2023 | 10-K 115
| | | | | |
| CITIZENS, INC. | FINANCIAL SCHEDULES |
| |
| |
| | | | | | | | | | | | | | | | | |
Schedule II, Continued
Condensed Financial Information of Registrant
CITIZENS, INC. (Parent Company)
Statements of Operations and Comprehensive Income (Loss) |
Years ended December 31,
(In thousands) | 2023 | | 2022 | | 2021 |
| Comprehensive Income (Loss): | | | | | |
| Revenues: | | | | | |
Management service fees (1) | $ | 42,394 | | | 35,413 | | | 33,311 | |
| Investment income | 1,083 | | | 6,124 | | | 1,063 | |
| Other | 6 | | | 6 | | | (37) | |
| Investment related gains (losses), net | (63) | | | (188) | | | 1,197 | |
| Total revenues | 43,420 | | | 41,355 | | | 35,534 | |
| Expenses: | | | | | |
| General expenses | 44,642 | | | 38,926 | | | 37,977 | |
| Taxes, licenses and fees | 158 | | | 149 | | | 198 | |
| Total expenses | 44,800 | | | 39,075 | | | 38,175 | |
| Income (loss) before federal income tax expense (benefit) and equity in income (loss) of consolidated subsidiaries | (1,380) | | | 2,280 | | | (2,641) | |
| Federal income tax expense (benefit) | 1,798 | | | (571) | | | (1,661) | |
| Income (loss) before equity in income (loss) of consolidated subsidiaries | (3,178) | | | 2,851 | | | (980) | |
| Equity in income (loss) of consolidated subsidiaries | 27,615 | | | 23,156 | | | 73,686 | |
| Net income (loss) | 24,437 | | | 26,007 | | | 72,706 | |
| Other comprehensive income (loss) | 18,889 | | | 1,945 | | | 49,581 | |
| Total comprehensive income (loss) | $ | 43,326 | | | 27,952 | | | 122,287 | |
(1) Eliminated in consolidation.
Note to Schedule II:
Citizens, Inc.'s investments in consolidated subsidiaries are stated at cost plus equity in undistributed income of consolidated subsidiaries and unrealized gains (losses) on investments held by consolidated subsidiaries. The Company includes in its statements of operations and comprehensive income (loss) dividends from its subsidiaries and equity in income (loss) of consolidated subsidiaries, which represents the net income (loss) of each of its wholly-owned subsidiaries.
December 31, 2023 | 10-K 116
| | | | | |
| CITIZENS, INC. | FINANCIAL SCHEDULES |
| |
| |
| | | | | | | | | | | | | | | | | |
Schedule II, Continued
Condensed Financial Information of Registrant
CITIZENS, INC. (Parent Company)
Statements of Cash Flows |
Years ended December 31,
(In thousands) | 2023 | | 2022 | | 2021 |
| Cash flows from operating activities: | | | | | |
| Net income (loss) | $ | 24,437 | | | 26,007 | | | 72,706 | |
| Adjustments to reconcile net income (loss) to net cash provided by (used in) operating activities: | | | | | |
| Investment related gains (losses), net | 63 | | | 188 | | | (1,197) | |
| Equity in loss (income) of consolidated subsidiaries | (27,615) | | | (23,156) | | | (73,686) | |
| Change in accrued expenses and other liabilities | (1,398) | | | 643 | | | (11,458) | |
| Change in federal income tax payable | — | | | (9,318) | | | (2,683) | |
| Deferred federal income tax expense (benefit) | — | | | — | | | 227 | |
| Amortization of premiums and discounts on investments | 107 | | | 281 | | | 473 | |
| Depreciation | 228 | | | 224 | | | 239 | |
| Change in accrued investment income | 112 | | | 97 | | | 32 | |
| Stock-based compensation | 588 | | | 461 | | | 646 | |
| Decrease (increase) in receivable from subsidiaries and other assets | 795 | | | 705 | | | (921) | |
| Other, net | 481 | | | 188 | | | 151 | |
| Net cash provided by (used in) operating activities | (2,202) | | | (3,680) | | | (15,471) | |
| Cash flows from investing activities: | | | | | |
| | | | | |
| | | | | |
| Purchases of fixed maturity securities, available-for-sale | (723) | | | (11,232) | | | (2,678) | |
| Maturities and calls of fixed maturity securities, available-for-sale | 6,027 | | | 9,721 | | | 7,548 | |
| | | | | |
| Sales of fixed maturity securities, available-for-sale | 2,580 | | | 4,314 | | | 6,952 | |
| Sales of property and equipment | — | | | 2 | | | 14 | |
| Sale of equity securities | 770 | | | 500 | | | — | |
| Sale of other long-term investments | — | | | — | | | 8,790 | |
| Sale of real estate | — | | | — | | | 3,552 | |
| Funding of mortgage loans | — | | | — | | | (1,000) | |
| Principal payments on mortgage loans | — | | | 1,000 | | | — | |
| | | | | |
| Purchases of property and equipment | (130) | | | (32) | | | (119) | |
| Purchases of short-term investments | — | | | (1,250) | | | — | |
| Maturities of short-term investments | 750 | | | — | | | — | |
| Sales of short-term investments | 499 | | | — | | | — | |
| Net cash provided by (used in) investing activities | 9,773 | | | 3,023 | | | 23,059 | |
| Cash flows from financing activities: | | | | | |
| | | | | |
| Issuance of common stock | — | | | 2,244 | | | 2,255 | |
| Acquisition of treasury stock | (919) | | | (2,705) | | | (9,090) | |
| Capital contribution to subsidiary | (4,850) | | | — | | | — | |
| Other | (60) | | | (118) | | | (456) | |
| Net cash provided by (used in) financing activities | (5,829) | | | (579) | | | (7,291) | |
| Net increase (decrease) in cash | 1,742 | | | (1,236) | | | 297 | |
| Cash at beginning of year | 2,163 | | | 3,399 | | | 3,102 | |
| Cash at end of year | $ | 3,905 | | | 2,163 | | | 3,399 | |
Note to Schedule II:
Citizens, Inc.'s investments in consolidated subsidiaries are stated at cost plus equity in undistributed income of consolidated subsidiaries and unrealized gains (losses) on investments held by consolidated subsidiaries. The Company includes in its statements of operations and comprehensive income (loss) dividends from its subsidiaries and equity in income (loss) of consolidated subsidiaries, which represents the net income (loss) of each of its wholly-owned subsidiaries.
December 31, 2023 | 10-K 117
| | | | | |
| CITIZENS, INC. | FINANCIAL SCHEDULES |
| |
| |
| | | | | | | | | | | |
Schedule III
Consolidated Supplementary Insurance Information |
Years ended December 31,
(In thousands) | 2023 | | 2022 |
| Deferred policy acquisition costs: | | | |
| Life Insurance | $ | 120,840 | | | 113,484 | |
| Home Service Insurance | 54,928 | | | 49,443 | |
| Total consolidated deferred policy acquisition costs | $ | 175,768 | | | 162,927 | |
| Future policy benefit reserves and policy claims payable: | | | |
| Life Insurance | $ | 970,327 | | | 955,157 | |
| Home Service Insurance | 266,452 | | | 254,140 | |
| Total consolidated future policy benefit reserves and policy claims payable | $ | 1,236,779 | | | 1,209,297 | |
| Unearned premiums: | | | |
| Life Insurance | $ | 1,356 | | | 1,501 | |
| Home Service Insurance | 38 | | | 267 | |
| Total consolidated unearned premiums | $ | 1,394 | | | 1,768 | |
| Other policy claims and benefits payable: | | | |
| Life Insurance | $ | 192,953 | | | 181,242 | |
| Home Service Insurance | 23,638 | | | 23,961 | |
| Total consolidated other policy claims and benefits payable | $ | 216,591 | | | 205,203 | |
December 31, 2023 | 10-K 118
| | | | | |
| CITIZENS, INC. | FINANCIAL SCHEDULES |
| |
| |
For the Company's short duration contracts (property), written premium is not materially different from earned premium, therefore only earned premiums are detailed in Schedule IV.
| | | | | | | | | | | | | | | | | | | | | | | | | | | | | |
Schedule IV
Consolidated Statement of Reinsurance |
| (In thousands) | Direct
Amount | | Ceded to
Other
Companies | | Assumed
From Other
Companies | | Net Amount | | % of
Amount
Assumed to
Net |
| Year ended December 31, 2023: | | | | | | | | | |
| Life insurance in force | $ | 4,922,254 | | | 619,597 | | | 3,772 | | | 4,306,429 | | | 0.1 | % |
| Premiums: | | | | | | | | | |
| Life insurance | $ | 166,336 | | | 1,795 | | | 68 | | | 164,609 | | | |
| Accident and health insurance | 1,641 | | | 4 | | | — | | | 1,637 | | | |
| Property insurance | 2,580 | | | 1,787 | | | — | | | 793 | | | |
| Total premiums | $ | 170,557 | | | 3,586 | | | 68 | | | 167,039 | | | — | % |
| Year ended December 31, 2022: | | | | | | | | | |
| Life insurance in force | $ | 4,796,570 | | | 543,496 | | | 4,074 | | | 4,257,148 | | | 0.1 | % |
| Premiums: | | | | | | | | | |
| Life insurance | $ | 169,432 | | | 1,920 | | | 74 | | | 167,586 | | | |
| Accident and health insurance | 1,283 | | | 5 | | | — | | | 1,278 | | | |
| Property insurance | 6,258 | | | 1,408 | | | — | | | 4,850 | | | |
| Total premiums | $ | 176,973 | | | 3,333 | | | 74 | | | 173,714 | | | — | % |
| Year ended December 31, 2021: | | | | | | | | | |
| Life insurance in force | $ | 4,627,509 | | | 465,954 | | | 4,366 | | | 4,165,921 | | | 0.1 | % |
| Premiums: | | | | | | | | | |
| Life insurance | $ | 171,567 | | | 1,850 | | | 84 | | | 169,801 | | | |
| Accident and health insurance | 1,255 | | | 5 | | | — | | | 1,250 | | | |
| Property insurance | 5,984 | | | 2,307 | | | — | | | 3,677 | | | |
| Total premiums | $ | 178,806 | | | 4,162 | | | 84 | | | 174,728 | | | — | % |
December 31, 2023 | 10-K 119
EXHIBITS
| | | | | | | | |
| Exhibit No. | | The following exhibits are filed herewith: |
| | |
| | |
| | |
| | |
| | |
| | |
| | |
| | |
| | |
| | |
| | |
| | |
| | |
| | |
| | |
| | |
| | |
| | |
| | |
| | |
| | |
| | |
| | |
| | |
| | |
| | |
| | |
| | |
| | |
| | |
| | |
| | |
| | |
| | |
| | |
| | |
| | |
| | |
| | |
December 31, 2023 | 10-K 120
| | | | | | | | |
| 101.INS | | XBRL Instance Document |
| 101.SCH | | XBRL Taxonomy Extension Schema |
| 101.CAL | | XBRL Taxonomy Extension Calculation Linkbase |
| 101.DEF | | XBRL Taxonomy Extension Definition Linkbase |
| 101.LAB | | XBRL Taxonomy Extension Label Linkbase |
| 101.PRE | | XBRL Taxonomy Extension Presentation Linkbase |
| 104 | | Inline XBRL for the cover page of this Annual Report on Form 10-K for the year ended December 31, 2023, filed electronically herewith, included in the Exhibit 101 Inline XBRL Document Set. |
| | | | | |
| † | Indicates management contract or compensatory plan or arrangement. |
| * | Filed herewith. |
Item 16. FORM 10-K SUMMARY
None.
December 31, 2023 | 10-K 121
SIGNATURES
Pursuant to the requirements of Section 13 or 15(d) of the Securities Exchange Act of 1934, the Registrant has duly caused this report to be signed on its behalf by the undersigned, hereunto duly authorized.
| | | | | | | | | | | | | | |
| | CITIZENS, INC. | |
| | | |
| Date: | March 14, 2024 | By: | /s/ Gerald W. Shields | |
| | | Gerald W. Shields, | |
| | | Chief Executive Officer and President | |
| | | (Principal Executive Officer) | |
| | | | |
| | By: | /s/ Jeffery P. Conklin | |
| | | Jeffery P. Conklin, | |
| | | Vice President, Chief Financial Officer, Chief Investment Officer and Treasurer | |
| | | (Principal Financial and Accounting Officer) | |
POWER OF ATTORNEY
KNOW ALL PERSONS BY THESE PRESENTS, that each person whose signature appears below constitutes and appoints Gerald W. Shields and Jeffery P. Conklin jointly and severally, his or her attorneys-in-fact, each with the power of substitution, for him or her in any and all capacities, to sign any amendments to this Annual Report on Form 10-K, and to file the same, with exhibits thereto and other documents in connection therewith, with the Securities and Exchange Commission, hereby ratifying and confirming all that each of said attorneys-in-fact, or his substitute or substitutes, may do or cause to be done by virtue hereof.
Pursuant to the requirements of the Securities Exchange Act of 1934, this report has been signed below by the following persons on behalf of the registrant and in the capacities indicated and on March 14, 2024.
Dated: March 14, 2024
| | | | | | | | |
| /s/ Jerry D. Davis, Jr. | | /s/ Gerald W. Shields |
| Jerry D. Davis, Jr., Chairman of the Board and Director | | Gerald W. Shields, Vice Chairman of the Board and Director |
| | |
| /s/ Christopher W. Claus | | /s/ Cynthia H. Davis |
| Christopher W. Claus, Director | | Cynthia H. Davis, Director |
| | | |
| /s/ Dr. Terry S. Maness | | /s/ Mary Taylor |
| Dr. Terry S. Maness, Director | | Mary Taylor, Director |
| | |
| /s/ Francis A. Keating II | | /s/ J. Keith Morgan |
| Francis A. Keating II, Director | | J. Keith Morgan, Director |
December 31, 2023 | 10-K 122