
| The following information contains forward-looking statements within the meaning of the Private Securities Litigation Reform Act of 1995, which can be identified by words such as "may," "will," "expect," "anticipate," "estimate," "continue," or comparable words. In addition, all statements other than statements of historical facts that address activities that Citizens, Inc. expects or anticipates will or may occur in the future are forward- looking statements. You are encouraged to read the SEC reports of Citizens, Inc., particularly its Form 10-K for the Fiscal Year Ended December 31, 2002, for meaningful cautionary language disclosing why actual results may vary materially from those anticipated by management. 2 |
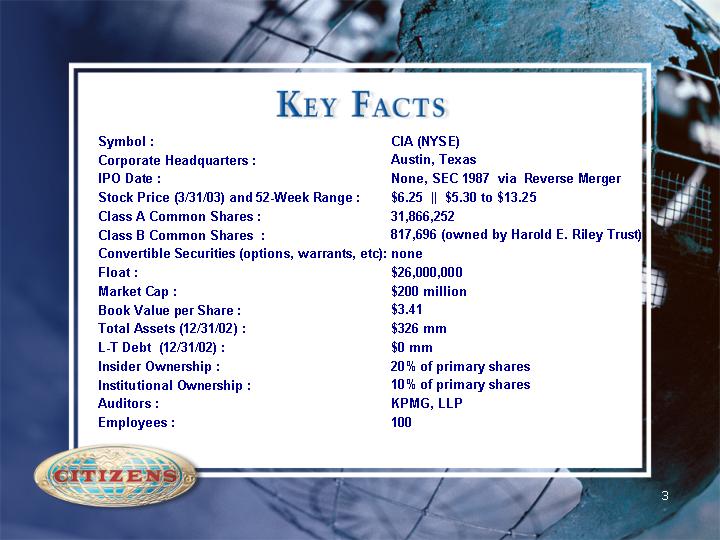
| CIA (NYSE) Austin, Texas None, SEC 1987 via Reverse Merger $6.25 || $5.30 to $13.25 31,866,252 817,696 (owned by Harold E. Riley Trust) none $26,000,000 $200 million $3.41 $326 mm $0 mm 20% of primary shares 10% of primary shares KPMG, LLP 100 Symbol : Corporate Headquarters : IPO Date : Stock Price (3/31/03) and 52-Week Range : Class A Common Shares : Class B Common Shares : Convertible Securities (options, warrants, etc): Float : Market Cap : Book Value per Share : Total Assets (12/31/02) : L-T Debt (12/31/02) : Insider Ownership : Institutional Ownership : Auditors : Employees : 3 |
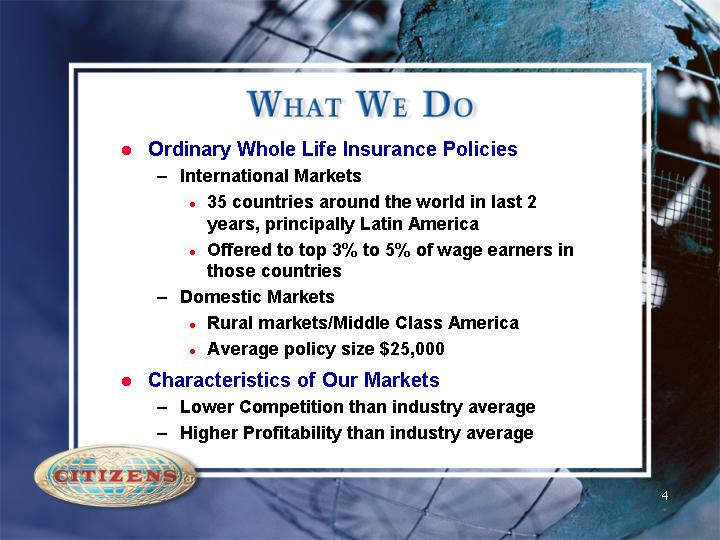
| Ordinary Whole Life Insurance Policies International Markets 35 countries around the world in last 2 years, principally Latin America Offered to top 3% to 5% of wage earners in those countries Domestic Markets Rural markets/Middle Class America Average policy size $25,000 Characteristics of Our Markets Lower Competition than industry average Higher Profitability than industry average 4 |
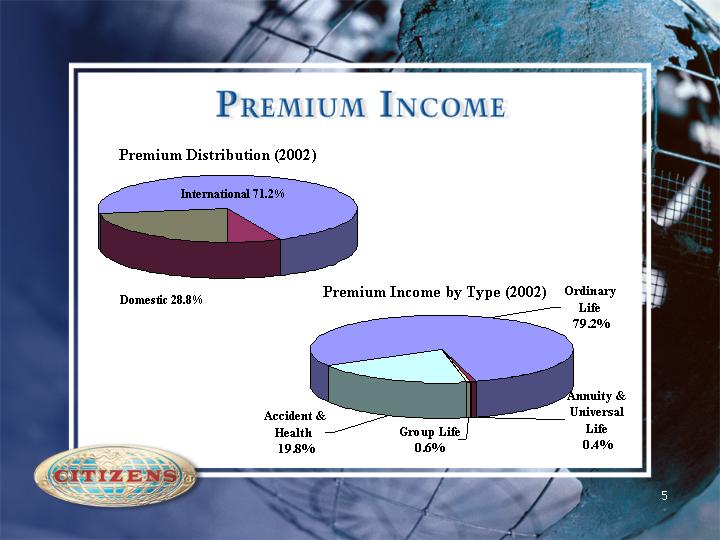
| Universal Premium Income by Type (2002) Accident & Health 19.8% Ordinary Life 79.2% Group Life 0.6% Annuity & Life 0.4% Premium Distribution (2002) Domestic 28.8% International 71.2% 5 |
| 6 |

| Argentina, Uruguay, Colombia, Paraguay, Nicaragua, Ecuador, Venezuela, Costa Rica, Chile, Peru, Brazil, Dominican Republic, Spain, Israel, Japan, Guatemala, Honduras, Taiwan, Switzerland, Italy, Australia, El Salvador, Philippines, Mexico, Bolivia, Germany, Panama, South Africa, Canada, United States, Malaysia, France, Aruba, Sweden, China 7 |
| Portfolio designed exclusively for international markets U.S. dollar-denominated policies All premiums and benefits paid in U.S. dollars on U.S. banks Participating ordinary whole life Terminal illness benefits Special assignment provisions Benefit limitations for certain causes of death Most premiums paid annually 8 |
| 15-20% profit loads vs. industry average of 4-6% Lower lapse rates (5% vs. industry average of 8%) Longer average policy duration (12-15 years vs. industry average of 6-8 years) Annual premium payments 9 |
| Premiums up from $13.5 mm in 1990 to $48.6 mm in 2002 (10% CAGR) Independent agents up from 860 in 1990 to 2,500 in 2002 Applications received from 35 countries in 2002, up from to 15 in 1990 Last several years characterized by economic difficulties in some Latin American markets 10 |

| No. of agents up from 1,000 in 2000 to 2,500 today New markets targeted: Taiwan, China, Brazil Seek to become significant player in international markets Well positioned for an economic rebound in key markets (Argentina, Venezuela) 11 |
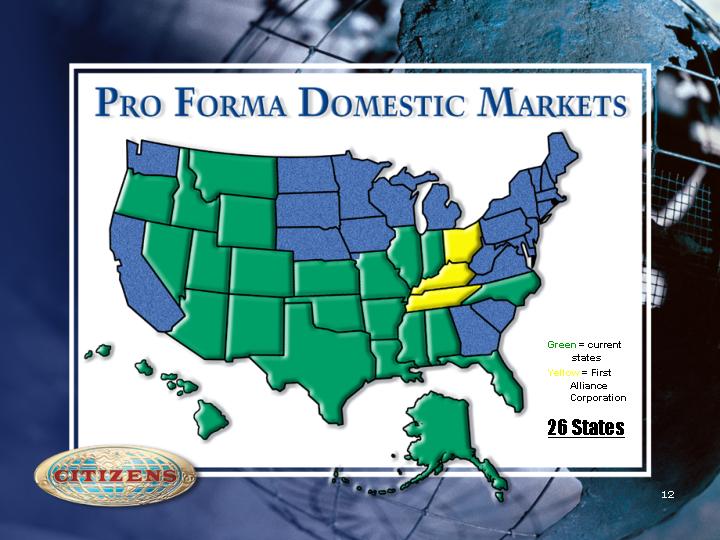
| Green = current states Yellow = First Alliance Corporation 26 States 12 |

| Portfolio of Products called Citizens CCAP 2000 Series Whole life products No Load Annuity Ordinary life policies sold through worksite marketing Can be sold on a payroll deduction basis Credit life and A&H Individual and worksite supplemental accident and health policies Terminal illness benefits 13 |

| Domestic Acquisitions Numerous opportunities for selective acquisitions Focus on ordinary life companies Fragmented market Internal growth New products Focus on new markets 14 |
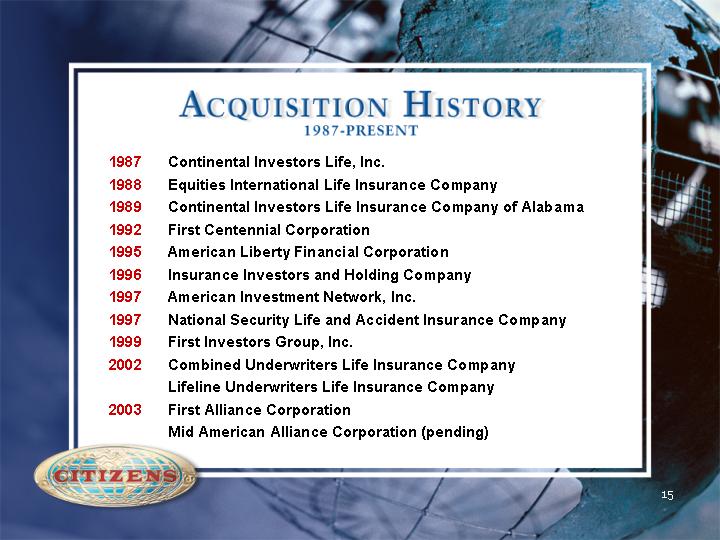
| 1987 Continental Investors Life, Inc. 1988 Equities International Life Insurance Company 1989 Continental Investors Life Insurance Company of Alabama 1992 First Centennial Corporation 1995 American Liberty Financial Corporation 1996 Insurance Investors and Holding Company 1997 American Investment Network, Inc. 1997 National Security Life and Accident Insurance Company First Investors Group, Inc. Combined Underwriters Life Insurance Company Lifeline Underwriters Life Insurance Company 2003 First Alliance Corporation Mid American Alliance Corporation (pending) 15 |
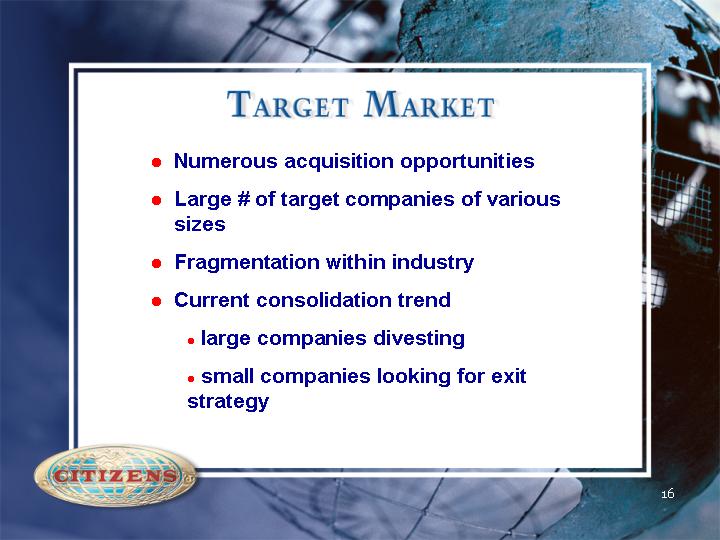
| Numerous acquisition opportunities Large # of target companies of various sizes Fragmentation within industry Current consolidation trend large companies divesting small companies looking for exit strategy 16 |
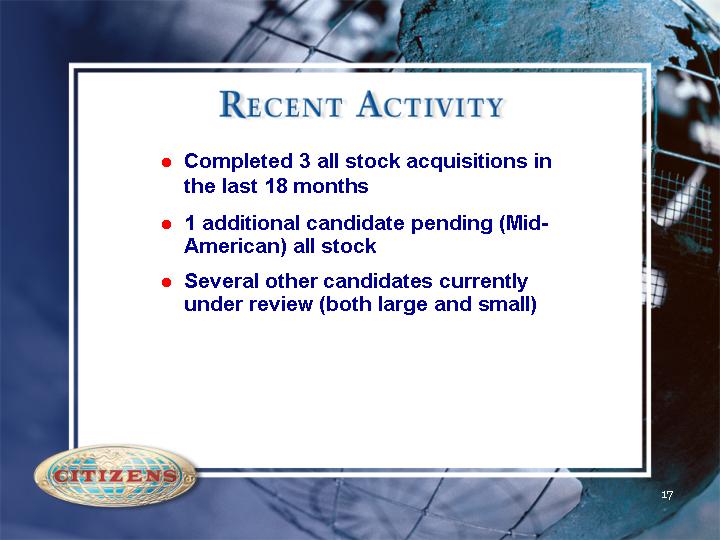
| Completed 3 all stock acquisitions in the last 18 months 1 additional candidate pending (Mid- American) all stock Several other candidates currently under review (both large and small) 17 |
| Valuation Methodology Each book of business is evaluated separately Value based on type of business, profitability, historical lapse rates, etc. Synergy Potential Elimination of duplicate overhead expenses Benefits from synergies usually achieved 1 year after transaction 18 |
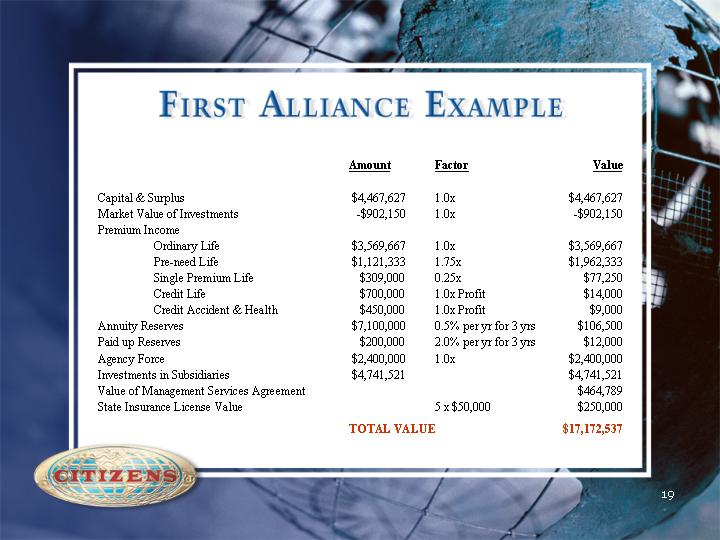
| Amount Factor Value Capital & Surplus $4,467,627 1.0x $4,467,627 Market Value of Investments - -$902,150 1.0x - -$902,150 Premium Income Ordinary Life $3,569,667 1.0x $3,569,667 Pre-need Life $1,121,333 1.75x $1,962,333 Single Premium Life $309,000 0.25x $77,250 Credit Life $700,000 1.0x Profit $14,000 Credit Accident & Health $450,000 1.0x Profit $9,000 Annuity Reserves $7,100,000 0.5% per yr for 3 yrs $106,500 Paid up Reserves $200,000 2.0% per yr for 3 yrs $12,000 Agency Force $2,400,000 1.0x $2,400,000 Investments in Subsidiaries $4,741,521 $4,741,521 Value of Management Services Agreement $464,789 State Insurance License Value 5 x $50,000 $250,000 TOTAL VALUE $17,172,537 19 |
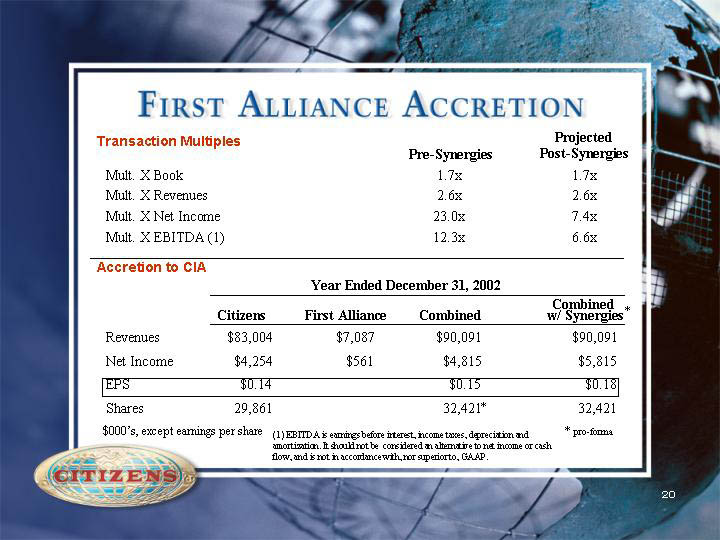
| Transaction Multiples Pre-Synergies Projected Post-Synergies Mult. X Book 1.7x 1.7x Mult. X Revenues 2.6x 2.6x Mult. X Net Income 23.0x 7.4x Mult. X EBITDA 12.3x 6.6x Accretion to CIA Year Ended December 31, 2002 Combined Citizens First Alliance Combined w/ Synergies Revenues $83,004 $7,087 $90,091 $90,091 Net Income $4,254 $561 $4,815 $5,815 EPS $0.14 $0.15 $0.18 Shares 29,861 32,421 32,421 * * pro-forma $000's, except earnings per share * 20 |
| Equity dilution through offering leads to significantly accretive increase in earnings power 2005 Goal: Total assets of $500 million + Approach $1.00 per share in EPS Strategy could require up to $100 million of equity in one or more transactions over the next 3-5 years (subject to NYSE and/or shareholder approval) 21 |
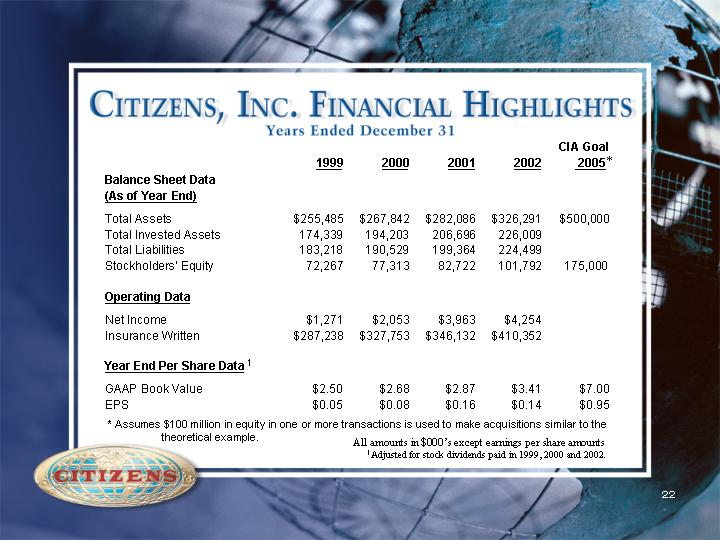
| 1Adjusted for stock dividends paid in 1999, 2000 and 2002. CIA Goal 1999 2000 2001 2002 2005 Balance Sheet Data (As of Year End) Total Assets $255,485 $267,842 $282,086 $326,291 $500,000 Total Invested Assets 174,339 194,203 206,696 226,009 Total Liabilities 183,218 190,529 199,364 224,499 Stockholders' Equity 72,267 77,313 82,722 101,792 Operating Data Net Income $1,271 $2,053 $3,963 $4,254 Insurance Written $287,238 $327,753 $346,132 $410,352 Year End Per Share Data GAAP Book Value $2.50 $2.68 $2.87 $3.41 $7.00 EPS $0.05 $0.08 $0.16 $0.14 $0.95 * Assumes $100 million in equity in one or more transactions is used to make acquisitions similar to the theoretical example. * 175,000 1 22 All amounts in $000's except earnings per share amounts |
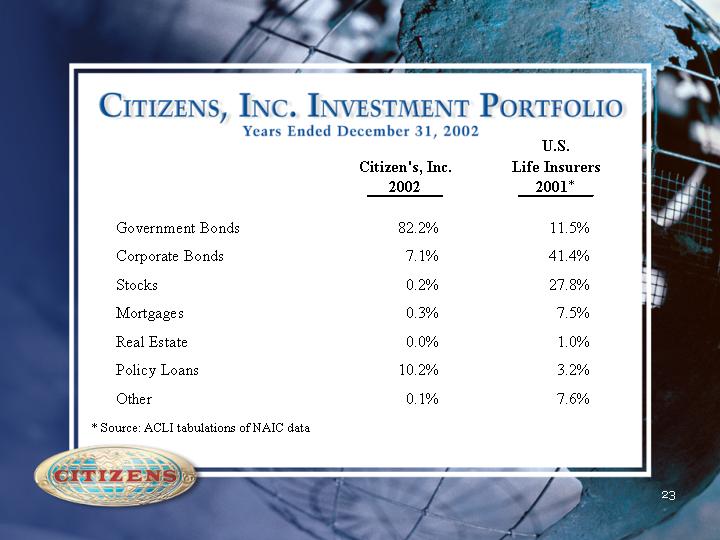
| U.S. Citizen's, Inc. Life Insurers 2002 2001 Government Bonds 82.2% 11.5% Corporate Bonds 7.1% 41.4% Stocks 0.2% 27.8% Mortgages 0.3% 7.5% Real Estate 0.0% 1.0% Policy Loans 10.2% 3.2% Other 0.1% 7.6% * Source: ACLI tabulations of NAIC data * 23 |
| Profitable books of whole life business Focusing on niche markets where we can be significant players Successful selected historical acquisition experience Target rich acquisition environment Significant long-term earnings potential 24 |
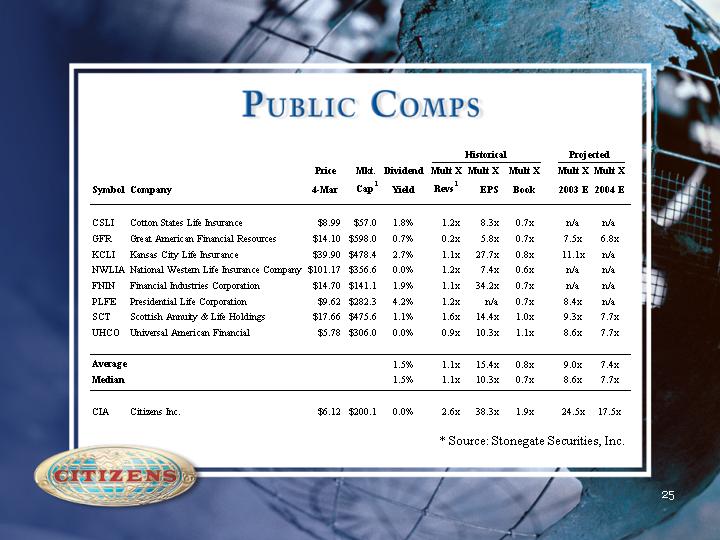
| Historical Projected Price Mkt. Dividend Mult X Mult X Mult X Mult X Mult X Symbol Company 4-Mar Cap 1 Yield Revs 1 EPS Book 2003 E 2004 E CSLI Cotton States Life Insurance $8.99 $57.0 1.8% 1.2x 8.3x 0.7x n/a n/a GFR Great American Financial Resources $14.10 $598.0 0.7% 0.2x 5.8x 0.7x 7.5x 6.8x KCLI Kansas City Life Insurance $39.90 $478.4 2.7% 1.1x 27.7x 0.8x 11.1x n/a NWLIA National Western Life Insurance Company $101.17 $356.6 0.0% 1.2x 7.4x 0.6x n/a n/a FNIN Financial Industries Corporation $14.70 $141.1 1.9% 1.1x 34.2x 0.7x n/a n/a PLFE Presidential Life Corporation $9.62 $282.3 4.2% 1.2x n/a 0.7x 8.4x n/a SCT Scottish Annuity & Life Holdings $17.66 $475.6 1.1% 1.6x 14.4x 1.0x 9.3x 7.7x UHCO Universal American Financial $5.78 $306.0 0.0% 0.9x 10.3x 1.1x 8.6x 7.7x Average 1.5% 1.1x 15.4x 0.8x 9.0x 7.4x Median 1.5% 1.1x 10.3x 0.7x 8.6x 7.7x CIA Citizens Inc. $6.12 $200.1 0.0% 2.6x 38.3x 1.9x 24.5x 17.5x 25 * Source: Stonegate Securities, Inc. |
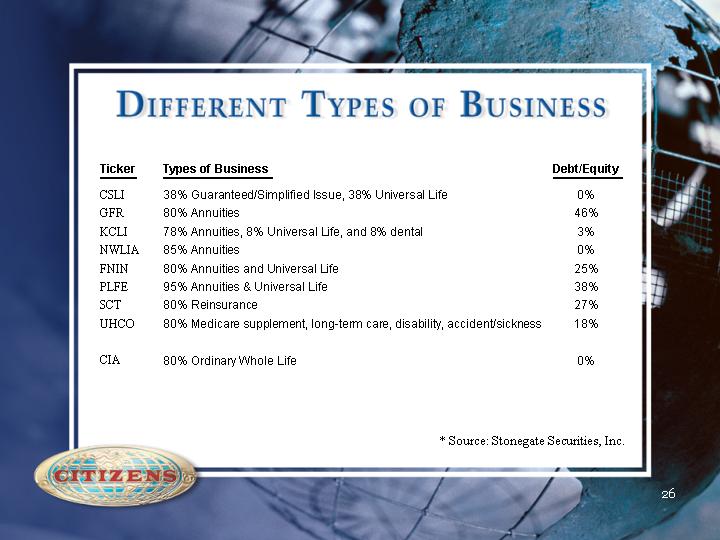
| Ticker Types of Business Debt/Equity CSLI 38% Guaranteed/Simplified Issue, 38% Universal Life 0% GFR 80% Annuities 46% KCLI 78% Annuities, 8% Universal Life, and 8% dental 3% NWLIA 85% Annuities 0% FNIN 80% Annuities and Universal Life 25% PLFE 95% Annuities & Universal Life 38% SCT 80% Reinsurance 27% UHCO 80% Medicare supplement, long-term care, disability, accident/sickness 18% CIA 80% Ordinary Whole Life 0% 26 * Source: Stonegate Securities, Inc. |