UNITED STATES
SECURITIES AND EXCHANGE COMMISSION
Washington, D.C. 20549
FORM N-CSR
CERTIFIED SHAREHOLDER REPORT OF REGISTERED
MANAGEMENT INVESTMENT COMPANIES
Investment Company Act file number 811-1400
Fidelity Contrafund
(Exact name of registrant as specified in charter)
82 Devonshire St., Boston, Massachusetts 02109
(Address of principal executive offices) (Zip code)
Scott C. Goebel, Secretary
82 Devonshire St.
Boston, Massachusetts 02109
(Name and address of agent for service)
Registrant's telephone number, including area code: 617-563-7000
Date of fiscal year end: | December 31 |
| |
Date of reporting period: | December 31, 2012 |
Item 1. Reports to Stockholders
Fidelity®
Contrafund®
Annual Report
December 31, 2012
(Fidelity Cover Art)
Contents
Performance | (Click Here) | How the fund has done over time. |
Management's Discussion of Fund Performance | (Click Here) | The Portfolio Manager's review of fund performance and strategy. |
Shareholder Expense Example | (Click Here) | An example of shareholder expenses. |
Investment Changes | (Click Here) | A summary of major shifts in the fund's investments over the past six months. |
Investments | (Click Here) | A complete list of the fund's investments with their market values. |
Financial Statements | (Click Here) | Statements of assets and liabilities, operations, and changes in net assets, as well as financial highlights. |
Notes | (Click Here) | Notes to the financial statements. |
Report of Independent Registered Public Accounting Firm | (Click Here) | |
Trustees and Officers | (Click Here) | |
Distributions | (Click Here) | |
Board Approval of Investment Advisory Contracts and Management Fees | (Click Here) | |
To view a fund's proxy voting guidelines and proxy voting record for the 12-month period ended June 30, visit http://www.fidelity.com/proxyvotingresults or visit the Securities and Exchange Commission's (SEC) web site at http://www.sec.gov. You may also call 1-800-544-8544 to request a free copy of the proxy voting guidelines.
Standard & Poor's, S&P and S&P 500 are registered service marks of The McGraw-Hill Companies, Inc. and have been licensed for use by Fidelity Distributors Corporation.
Other third party marks appearing herein are the property of their respective owners.
All other marks appearing herein are registered or unregistered trademarks or service marks of FMR LLC or an affiliated company. © 2013 FMR LLC. All rights reserved.
Annual Report
This report and the financial statements contained herein are submitted for the general information of the shareholders of the fund. This report is not authorized for distribution to prospective investors in the fund unless preceded or accompanied by an effective prospectus.
A fund files its complete schedule of portfolio holdings with the SEC for the first and third quarters of each fiscal year on Form N-Q. Forms N-Q are available on the SEC's web site at http://www.sec.gov. A fund's Forms N-Q may be reviewed and copied at the SEC's Public Reference Room in Washington, DC. Information regarding the operation of the SEC's Public Reference Room may be obtained by calling 1-800-SEC-0330. For a complete list of a fund's portfolio holdings, view the most recent holdings listing, semiannual report, or annual report on Fidelity's web site at http://www.fidelity.com, http://www.advisor.fidelity.com, or http://www.401k.com, as applicable.
NOT FDIC INSURED • MAY LOSE VALUE • NO BANK GUARANTEE
Neither the fund nor Fidelity Distributors Corporation is a bank.
Annual Report
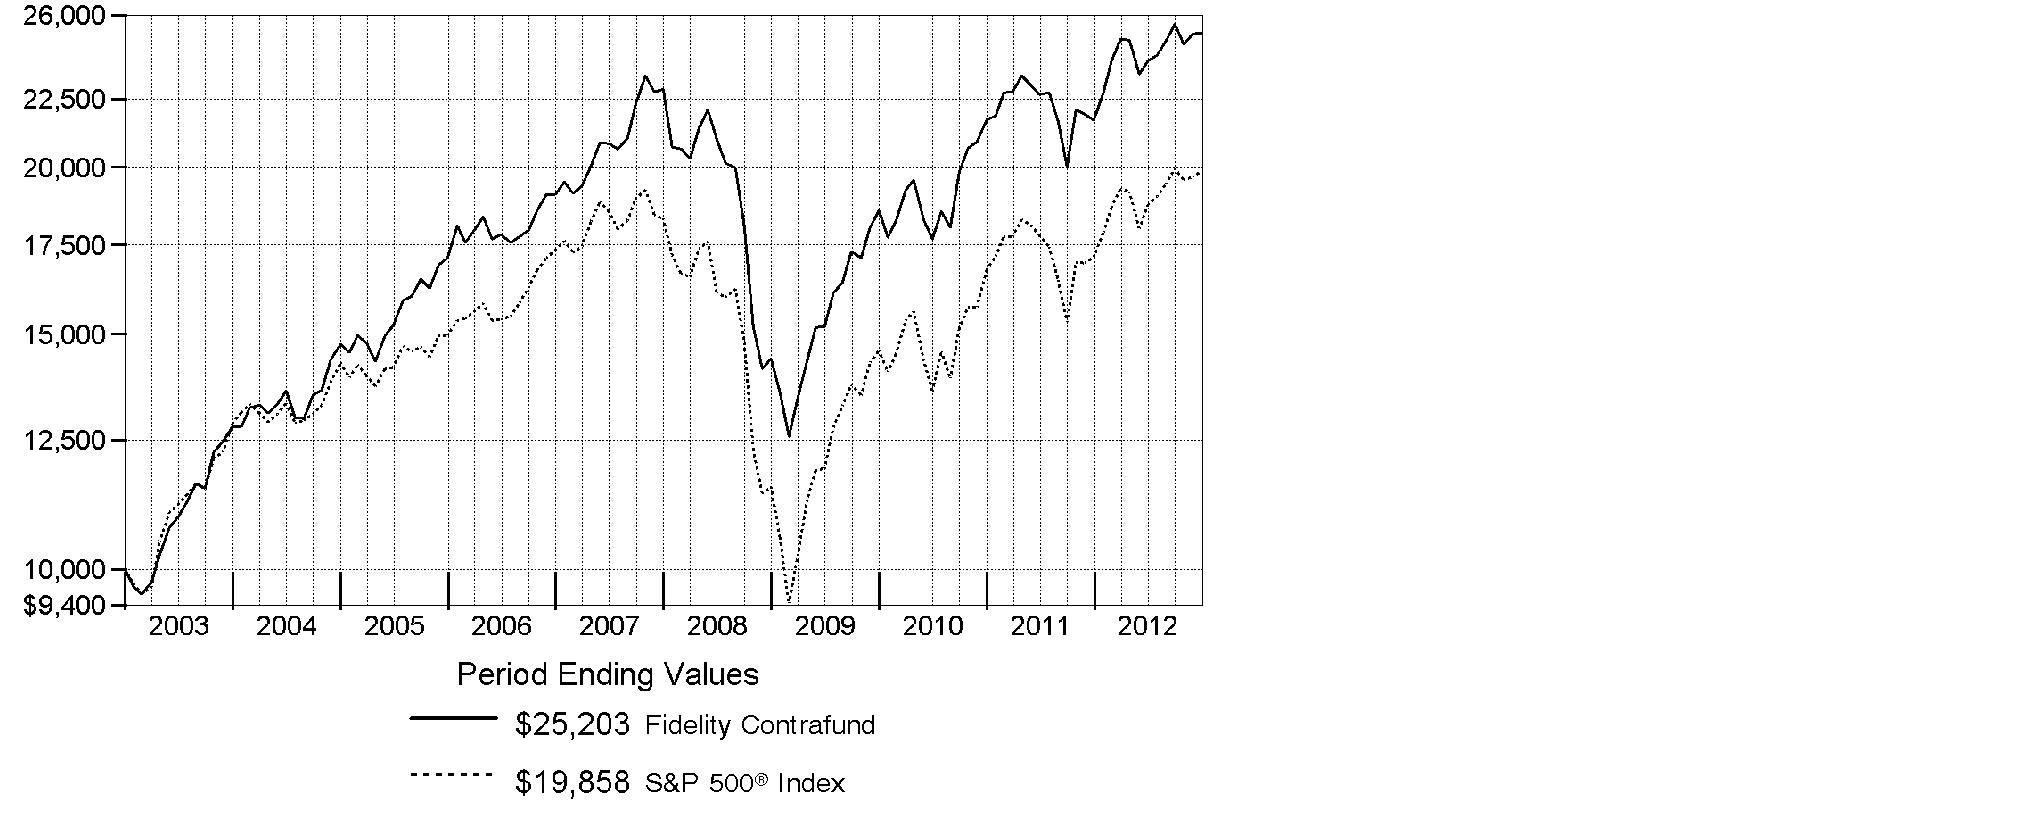
Average annual total return reflects the change in the value of an investment, assuming reinvestment of the class' distributions from dividend income and capital gains (the profits earned upon the sale of securities that have grown in value, if any) and assuming a constant rate of performance each year. The $10,000 table and the fund's returns do not reflect the deduction of taxes that a shareholder would pay on fund distributions or the redemption of fund shares. During periods of reimbursement by Fidelity, a fund's total return will be greater than it would be had the reimbursement not occurred. How a fund did yesterday is no guarantee of how it will do tomorrow.
Average Annual Total Returns
Periods ended December 31, 2012 | Past 1
year | Past 5
years | Past 10
years |
Fidelity® Contrafund® | 16.26% | 1.97% | 9.68% |
$10,000 Over 10 Years
Let's say hypothetically that $10,000 was invested in Fidelity® Contrafund®, a class of the fund, on December 31, 2002. The chart shows how the value of your investment would have changed, and also shows how the S&P 500® Index performed over the same period.
Annual Report
Market Recap: U.S. equity benchmarks posted double-digit gains for the year ending December 31, 2012, despite investors' concerns over debt woes in Europe, slower growth in China and partisan gridlock in Congress. Signs of recovery in the U.S. economy lifted stocks for most of the period, extending an uptrend that began in March 2009. The broad-based S&P 500® Index rose 16.00% for the 12 months, while the technology-heavy Nasdaq Composite Index® gained 17.45% and the blue-chip-laden Dow Jones Industrial AverageSM added 10.24%. Stocks began the year on a high note, with an improving U.S. economy and proposed bailouts in Europe buoying equities in the first quarter. Fear resurfaced in April and May, but stocks rebounded in June on central bank stimulus, a reviving U.S. housing market and more eurozone aid. Although equity benchmarks hit multiyear highs in September, pre-election jitters and the looming "fiscal cliff" of tax hikes and federal spending cuts triggered some profit-taking, followed by a brief post-election sell-off. Hurricane Sandy's aftereffects added to uncertainty, but stocks proved resilient. Within the S&P 500®, the financials and consumer discretionary sectors significantly outpaced the benchmark, while utilities and energy lagged the most, with only modest gains. Despite eurozone turmoil, foreign developed-markets stocks rose strongly, with the MSCI® EAFE® Index adding 17.48%.
Comments from William Danoff, Portfolio Manager of Fidelity® Contrafund®: For the year, the fund's Retail Class shares returned 16.26%, slightly ahead of the S&P 500®. Stock selection drove results versus the index, led by picks in technology, where I've had a strong commitment for many years. Here, market leader Apple was by far the fund's top individual contributor. Its shares rose roughly 33% for the year, despite a weak fourth quarter. The fund also was helped by largely avoiding the weak utilities sector and large energy stocks, based on their inferior relative earnings prospects. This included integrated oil firm and index component Exxon Mobil, which underperformed. Electronic payment leader Visa also notably contributed, fueled by strong earnings. Conversely, the fund was hurt by underweighting the rebounding diversified financials group, as large banks such as Bank of America - which I did not own - and JPMorgan Chase rose sharply with the improving U.S. economy. Weak sales hurt fast-food chain McDonald's. Concerns about intensified competition hurt Internet search giant Google, another of the fund's largest holdings. A cash position also detracted, given the market's strong advance.
The views expressed above reflect those of the portfolio manager(s) only through the end of the period as stated on the cover of this report and do not necessarily represent the views of Fidelity or any other person in the Fidelity organization. Any such views are subject to change at any time based upon market or other conditions and Fidelity disclaims any responsibility to update such views. These views may not be relied on as investment advice and, because investment decisions for a Fidelity fund are based on numerous factors, may not be relied on as an indication of trading intent on behalf of any Fidelity fund.
Annual Report
Shareholder Expense Example
As a shareholder of the Fund, you incur two types of costs: (1) transaction costs, and (2) ongoing costs, including management fees and other Fund expenses. This Example is intended to help you understand your ongoing costs (in dollars) of investing in the Fund and to compare these costs with the ongoing costs of investing in other mutual funds.
The Example is based on an investment of $1,000 invested at the beginning of the period and held for the entire period (July 1, 2012 to December 31, 2012).
Actual Expenses
The first line of the accompanying table for each class of the Fund provides information about actual account values and actual expenses. You may use the information in this line, together with the amount you invested, to estimate the expenses that you paid over the period. Simply divide your account value by $1,000.00 (for example, an $8,600 account value divided by $1,000.00 = 8.6), then multiply the result by the number in the first line for a class of the Fund under the heading entitled "Expenses Paid During Period" to estimate the expenses you paid on your account during this period. A small balance maintenance fee of $12.00 that is charged once a year may apply for certain accounts with a value of less than $2,000. This fee is not included in the table below. If it was, the estimate of expenses you paid during the period would be higher, and your ending account value lower, by this amount. In addition, the Fund, as a shareholder in the underlying Fidelity Central Funds, will indirectly bear its pro-rata share of the fees and expenses incurred by the underlying Fidelity Central Funds. These fees and expenses are not included in the Fund's annualized expense ratio used to calculate the expense estimate in the table below.
Hypothetical Example for Comparison Purposes
The second line of the accompanying table for each class of the Fund provides information about hypothetical account values and hypothetical expenses based on a Class' actual expense ratio and an assumed rate of return of 5% per year before expenses, which is not the Class' actual return. The hypothetical account values and expenses may not be used to estimate the actual ending account balance or expenses you paid for the period. You may use this information to compare the ongoing costs of investing in the Fund and other funds. To do so, compare this 5% hypothetical example with the 5% hypothetical examples that appear in the shareholder reports of the other funds. A small balance maintenance fee of $12.00 that is charged once a year may apply for certain accounts with a value of less than $2,000. This fee is not included in the table below. If it was, the estimate of expenses you paid during the period would be higher, and your ending account value lower, by this amount. In addition, the Fund, as a shareholder in the underlying Fidelity Central Funds, will indirectly bear its pro-rata share of the fees and expenses incurred by the underlying Fidelity Central Funds. These fees and expenses are not included in the Fund's annualized expense ratio used to calculate the expense estimate in the table below.
Please note that the expenses shown in the table are meant to highlight your ongoing costs only and do not reflect any transaction costs. Therefore, the second line of the table is useful in comparing ongoing costs only, and will not help you determine the relative total costs of owning different funds.
Annual Report
Shareholder Expense Example - continued
| Annualized Expense Ratio | Beginning
Account Value
July 1, 2012 | Ending
Account Value
December 31, 2012 | Expenses Paid
During Period*
July 1, 2012 to
December 31, 2012 |
Contrafund | .76% | | | |
Actual | | $ 1,000.00 | $ 1,048.20 | $ 3.91 |
HypotheticalA | | $ 1,000.00 | $ 1,021.32 | $ 3.86 |
Class K | .64% | | | |
Actual | | $ 1,000.00 | $ 1,048.80 | $ 3.30 |
HypotheticalA | | $ 1,000.00 | $ 1,021.92 | $ 3.25 |
A 5% return per year before expenses
* Expenses are equal to each Class' annualized expense ratio, multiplied by the average account value over the period, multiplied by 184/366 (to reflect the one-half year period).
Annual Report
Investment Changes (Unaudited)
Top Ten Stocks as of December 31, 2012 |
| % of fund's
net assets | % of fund's net assets
6 months ago |
Apple, Inc. | 7.3 | 9.0 |
Google, Inc. Class A | 5.3 | 4.3 |
Berkshire Hathaway, Inc. Class A | 3.5 | 3.3 |
Wells Fargo & Co. | 2.5 | 2.4 |
The Coca-Cola Co. | 2.5 | 2.7 |
The Walt Disney Co. | 2.3 | 2.3 |
Noble Energy, Inc. | 2.1 | 1.8 |
Visa, Inc. Class A | 1.9 | 1.5 |
TJX Companies, Inc. | 1.8 | 1.9 |
Amazon.com, Inc. | 1.8 | 1.4 |
| 31.0 | |
Top Five Market Sectors as of December 31, 2012 |
| % of fund's
net assets | % of fund's net assets
6 months ago |
Information Technology | 27.9 | 27.7 |
Consumer Discretionary | 20.0 | 22.7 |
Financials | 13.3 | 11.2 |
Health Care | 12.0 | 9.5 |
Consumer Staples | 9.3 | 9.2 |
Asset Allocation (% of fund's net assets) |
As of December 31, 2012 * | As of June 30, 2012 ** |
 | Stocks 98.7% | | | Stocks 92.9% | |
 | Bonds 0.0%† | | | Bonds 0.0%† | |
 | Convertible
Securities 0.1% | | | Convertible
Securities 0.2% | |
 | Short-Term Investments and Net Other Assets (Liabilities) 1.2% | | | Short-Term Investments and Net Other Assets (Liabilities) 6.9% | |
* Foreign investments | 12.9% | | **Foreign investments | 11.6% | |

† Amount represents less than 0.1%
Annual Report
Investments December 31, 2012
Showing Percentage of Net Assets
Common Stocks - 98.7% |
| Shares | | Value (000s) |
CONSUMER DISCRETIONARY - 20.0% |
Automobiles - 0.2% |
Hyundai Motor Co. | 397,072 | | $ 82,388 |
Tesla Motors, Inc. (a) | 1,968,741 | | 66,681 |
| | 149,069 |
Distributors - 0.1% |
LKQ Corp. (a) | 4,361,714 | | 92,032 |
Diversified Consumer Services - 0.0% |
Kroton Educacional SA (a) | 593,500 | | 13,567 |
Hotels, Restaurants & Leisure - 3.9% |
Chipotle Mexican Grill, Inc. (a)(e) | 2,029,039 | | 603,558 |
Dunkin' Brands Group, Inc. (d)(e) | 7,147,490 | | 237,154 |
Galaxy Entertainment Group Ltd. (a) | 11,114,000 | | 44,565 |
InterContinental Hotel Group PLC | 598,173 | | 16,773 |
McDonald's Corp. | 14,681,486 | | 1,295,054 |
Paddy Power PLC (Ireland) | 118,935 | | 9,818 |
Panera Bread Co. Class A (a) | 81,215 | | 12,899 |
Starbucks Corp. | 10,106,992 | | 541,937 |
Tim Hortons, Inc. (Canada) (e) | 11,216,732 | | 550,631 |
| | 3,312,389 |
Household Durables - 1.2% |
D.R. Horton, Inc. (e) | 16,358,553 | | 323,572 |
Lennar Corp. Class A | 5,360,000 | | 207,271 |
PulteGroup, Inc. (a) | 18,890,934 | | 343,059 |
Ryland Group, Inc. | 1,344,500 | | 49,074 |
Toll Brothers, Inc. (a) | 2,603,900 | | 84,184 |
Whirlpool Corp. | 243,694 | | 24,796 |
| | 1,031,956 |
Internet & Catalog Retail - 2.8% |
Amazon.com, Inc. (a) | 5,901,237 | | 1,482,037 |
Expedia, Inc. | 644,487 | | 39,604 |
Liberty Media Corp.: | | | |
Interactive Series A (a) | 2,547,100 | | 50,127 |
Series A (a) | 84,460 | | 5,723 |
Priceline.com, Inc. (a) | 802,600 | | 498,575 |
TripAdvisor, Inc. | 6,025,610 | | 252,835 |
| | 2,328,901 |
Leisure Equipment & Products - 0.1% |
Polaris Industries, Inc. | 1,431,652 | | 120,474 |
Media - 5.6% |
Comcast Corp. Class A | 25,406,478 | | 949,694 |
Common Stocks - continued |
| Shares | | Value (000s) |
CONSUMER DISCRETIONARY - continued |
Media - continued |
Discovery Communications, Inc. (a)(e) | 16,352,942 | | $ 1,038,085 |
Legend Pictures LLC (a)(g)(h) | 52,165 | | 96,671 |
Liberty Global, Inc. Class A (a) | 2,185,600 | | 137,671 |
Liberty Media Corp. Capital Series A (a) | 1,881,461 | | 218,268 |
Naspers Ltd. Class N | 1,454,963 | | 93,227 |
Sirius XM Radio, Inc. (d) | 46,725,018 | | 135,035 |
The Walt Disney Co. | 39,305,919 | | 1,957,042 |
Time Warner Cable, Inc. | 1,025,057 | | 99,625 |
Weinstein Co. Holdings LLC Class A-1 (a)(g)(h) | 41,234 | | 15,463 |
| | 4,740,781 |
Multiline Retail - 0.3% |
Dollar Tree, Inc. (a) | 4,753,220 | | 192,791 |
Dollarama, Inc. (f) | 410,655 | | 24,345 |
| | 217,136 |
Specialty Retail - 4.2% |
Bed Bath & Beyond, Inc. (a) | 9,368,900 | | 523,815 |
Dick's Sporting Goods, Inc. | 1,658,323 | | 75,437 |
Fast Retailing Co. Ltd. | 200,000 | | 51,042 |
Five Below, Inc. (d) | 537,441 | | 17,220 |
Foot Locker, Inc. | 3,144,100 | | 100,988 |
Gap, Inc. | 2,109,900 | | 65,491 |
GNC Holdings, Inc. | 1,061,300 | | 35,320 |
Home Depot, Inc. | 3,062,900 | | 189,440 |
Inditex SA | 209,424 | | 29,425 |
Penske Automotive Group, Inc. | 1,856,856 | | 55,873 |
PetSmart, Inc. | 2,222,619 | | 151,894 |
Ross Stores, Inc. | 7,963,188 | | 431,207 |
TJX Companies, Inc. | 35,305,965 | | 1,498,738 |
Ulta Salon, Cosmetics & Fragrance, Inc. | 1,738,542 | | 170,829 |
Urban Outfitters, Inc. (a) | 3,848,500 | | 151,477 |
| | 3,548,196 |
Textiles, Apparel & Luxury Goods - 1.6% |
lululemon athletica, Inc. (a) | 454,300 | | 34,631 |
Luxottica Group SpA | 1,310,687 | | 54,098 |
LVMH Moet Hennessy - Louis Vuitton SA | 348,000 | | 64,226 |
Michael Kors Holdings Ltd. | 1,623,400 | | 82,842 |
NIKE, Inc. Class B | 13,337,252 | | 688,202 |
PVH Corp. | 426,600 | | 47,357 |
Salvatore Ferragamo Italia SpA | 286,688 | | 6,347 |
Common Stocks - continued |
| Shares | | Value (000s) |
CONSUMER DISCRETIONARY - continued |
Textiles, Apparel & Luxury Goods - continued |
Under Armour, Inc. Class A (sub. vtg.) (a) | 4,767,322 | | $ 231,358 |
VF Corp. | 932,273 | | 140,745 |
| | 1,349,806 |
TOTAL CONSUMER DISCRETIONARY | | 16,904,307 |
CONSUMER STAPLES - 9.3% |
Beverages - 3.4% |
Anheuser-Busch InBev SA NV ADR | 5,067,400 | | 442,941 |
Boston Beer Co., Inc. Class A (a)(d) | 538,407 | | 72,389 |
Coca-Cola Icecek A/S | 31,979 | | 663 |
Diageo PLC sponsored ADR | 1,049,400 | | 122,339 |
Dr. Pepper Snapple Group, Inc. | 2,881,400 | | 127,300 |
The Coca-Cola Co. | 58,272,982 | | 2,112,396 |
| | 2,878,028 |
Food & Staples Retailing - 2.6% |
Bim Birlesik Magazalar A/S JSC | 293,153 | | 14,338 |
Costco Wholesale Corp. | 5,998,623 | | 592,484 |
CVS Caremark Corp. | 10,048,000 | | 485,821 |
Fresh Market, Inc. (a) | 1,452,437 | | 69,848 |
Wal-Mart Stores, Inc. | 13,839,600 | | 944,276 |
Whole Foods Market, Inc. | 661,350 | | 60,401 |
| | 2,167,168 |
Food Products - 0.6% |
Associated British Foods PLC | 3,742,070 | | 95,604 |
Calbee, Inc. | 196,800 | | 13,867 |
Kraft Foods Group, Inc. | 963,066 | | 43,791 |
Mondelez International, Inc. | 7,450,700 | | 189,769 |
Orion Corp. | 58,453 | | 60,348 |
Want Want China Holdings Ltd. | 72,985,000 | | 102,282 |
| | 505,661 |
Household Products - 1.8% |
Colgate-Palmolive Co. | 12,563,007 | | 1,313,337 |
Kimberly-Clark Corp. | 2,438,200 | | 205,857 |
| | 1,519,194 |
Personal Products - 0.9% |
Estee Lauder Companies, Inc. Class A | 13,525,600 | | 809,642 |
TOTAL CONSUMER STAPLES | | 7,879,693 |
Common Stocks - continued |
| Shares | | Value (000s) |
ENERGY - 5.6% |
Energy Equipment & Services - 0.2% |
Cameron International Corp. (a) | 425,300 | | $ 24,012 |
Schlumberger Ltd. | 1,597,718 | | 110,706 |
Seadrill Partners LLC | 195,600 | | 5,017 |
| | 139,735 |
Oil, Gas & Consumable Fuels - 5.4% |
Americas Petrogas, Inc. (a)(f) | 3,562,500 | | 10,744 |
Anadarko Petroleum Corp. | 7,510,804 | | 558,128 |
Birchcliff Energy Ltd. (a) | 5,035,600 | | 37,766 |
Birchcliff Energy Ltd. (f) | 1,900,000 | | 14,250 |
Cabot Oil & Gas Corp. | 1,533,501 | | 76,276 |
Canadian Natural Resources Ltd. | 936,812 | | 26,973 |
Cobalt International Energy, Inc. (a) | 1,321,200 | | 32,449 |
Concho Resources, Inc. (a) | 1,825,959 | | 147,099 |
Continental Resources, Inc. (a) | 1,442,492 | | 106,009 |
Cosan Ltd. Class A | 717,237 | | 12,415 |
Energy XXI (Bermuda) Ltd. | 402,745 | | 12,964 |
EOG Resources, Inc. | 5,739,257 | | 693,245 |
HollyFrontier Corp. | 804,200 | | 37,436 |
Madalena Ventures, Inc. (f) | 9,370,500 | | 3,627 |
Marathon Petroleum Corp. | 3,746,629 | | 236,038 |
Murphy Oil Corp. | 1,710,100 | | 101,836 |
Noble Energy, Inc. (e) | 17,484,009 | | 1,778,823 |
Occidental Petroleum Corp. | 1,652,019 | | 126,561 |
PBF Energy, Inc. | 1,142,238 | | 33,182 |
Phillips 66 | 4,262,300 | | 226,328 |
TAG Oil Ltd. (a) | 1,065,143 | | 6,104 |
TAG Oil Ltd. (f) | 1,365,935 | | 7,827 |
Tesoro Corp. | 739,467 | | 32,574 |
Tourmaline Oil Corp. (a) | 6,200,700 | | 194,680 |
Tourmaline Oil Corp. (a)(f) | 1,363,300 | | 42,803 |
TransAtlantic Petroleum Ltd. (a)(f) | 1,734,051 | | 1,439 |
Ultrapar Participacoes SA | 899,500 | | 20,580 |
| | 4,578,156 |
TOTAL ENERGY | | 4,717,891 |
FINANCIALS - 13.3% |
Capital Markets - 0.3% |
Bank of New York Mellon Corp. | 672,000 | | 17,270 |
Common Stocks - continued |
| Shares | | Value (000s) |
FINANCIALS - continued |
Capital Markets - continued |
Charles Schwab Corp. | 997,500 | | $ 14,324 |
Goldman Sachs Group, Inc. | 347,800 | | 44,365 |
Morgan Stanley | 2,406,700 | | 46,016 |
State Street Corp. | 2,594,400 | | 121,963 |
T. Rowe Price Group, Inc. | 275,000 | | 17,911 |
| | 261,849 |
Commercial Banks - 4.3% |
Bank of Ireland (a) | 1,355,755,122 | | 205,718 |
BB&T Corp. | 3,228,700 | | 93,987 |
Fifth Third Bancorp | 3,738,500 | | 56,788 |
HDFC Bank Ltd. sponsored ADR | 769,541 | | 31,336 |
M&T Bank Corp. | 1,785,903 | | 175,858 |
Metro Bank PLC Class A (a)(e)(h) | 2,671,250 | | 43,393 |
PNC Financial Services Group, Inc. | 3,299,592 | | 192,399 |
Royal Bank of Canada | 750,000 | | 45,149 |
U.S. Bancorp | 20,941,329 | | 668,866 |
Wells Fargo & Co. | 62,253,197 | | 2,127,814 |
| | 3,641,308 |
Consumer Finance - 0.9% |
American Express Co. | 9,866,900 | | 567,149 |
Capital One Financial Corp. | 3,071,816 | | 177,950 |
| | 745,099 |
Diversified Financial Services - 0.5% |
Citigroup, Inc. | 4,962,702 | | 196,324 |
JPMorgan Chase & Co. | 4,560,232 | | 200,513 |
Kotak Mahindra Bank Ltd. | 1,183,309 | | 14,141 |
| | 410,978 |
Insurance - 6.0% |
ACE Ltd. | 7,513,600 | | 599,585 |
Admiral Group PLC | 2,127,961 | | 40,535 |
AIA Group Ltd. | 67,215,000 | | 266,597 |
Berkshire Hathaway, Inc. Class A (a) | 22,342 | | 2,995,169 |
Direct Line Insurance Group PLC | 15,998,500 | | 56,633 |
Fairfax Financial Holdings Ltd. (sub. vtg.) | 152,622 | | 55,014 |
Marsh & McLennan Companies, Inc. | 5,108,433 | | 176,088 |
The Chubb Corp. | 7,414,074 | | 558,428 |
The Travelers Companies, Inc. | 4,817,828 | | 346,016 |
| | 5,094,065 |
Common Stocks - continued |
| Shares | | Value (000s) |
FINANCIALS - continued |
Real Estate Investment Trusts - 0.8% |
American Tower Corp. | 8,290,300 | | $ 640,591 |
Real Estate Management & Development - 0.5% |
BR Malls Participacoes SA | 18,058,000 | | 241,164 |
Kennedy-Wilson Holdings, Inc. | 1,402,800 | | 19,611 |
Realogy Holdings Corp. | 2,945,674 | | 123,600 |
| | 384,375 |
TOTAL FINANCIALS | | 11,178,265 |
HEALTH CARE - 11.9% |
Biotechnology - 4.6% |
Aegerion Pharmaceuticals, Inc. (a) | 434,980 | | 11,044 |
Alexion Pharmaceuticals, Inc. (a) | 3,479,760 | | 326,436 |
Amgen, Inc. | 11,755,472 | | 1,014,732 |
ARIAD Pharmaceuticals, Inc. (a) | 2,755,323 | | 52,847 |
Biogen Idec, Inc. (a) | 8,813,400 | | 1,292,661 |
BioMarin Pharmaceutical, Inc. (a) | 1,739,560 | | 85,673 |
Celgene Corp. (a) | 1,992,391 | | 156,841 |
CSL Ltd. | 565,138 | | 31,906 |
Gilead Sciences, Inc. (a) | 6,377,400 | | 468,420 |
Grifols SA ADR | 2,719,557 | | 70,518 |
Intercept Pharmaceuticals, Inc. | 574,200 | | 19,661 |
Medivation, Inc. (a) | 1,337,294 | | 68,416 |
Merrimack Pharmaceuticals, Inc. | 1,976,031 | | 12,034 |
Onyx Pharmaceuticals, Inc. (a) | 546,700 | | 41,292 |
Puma Biotechnology, Inc. | 1,122,700 | | 21,051 |
Regeneron Pharmaceuticals, Inc. (a) | 1,042,983 | | 178,423 |
Rigel Pharmaceuticals, Inc. (a) | 1,093,800 | | 7,110 |
Theravance, Inc. (a) | 700,000 | | 15,589 |
| | 3,874,654 |
Health Care Equipment & Supplies - 1.0% |
Baxter International, Inc. | 2,948,000 | | 196,514 |
Boston Scientific Corp. (a) | 956,300 | | 5,480 |
CareFusion Corp. (a) | 621,900 | | 17,774 |
Covidien PLC | 1,832,700 | | 105,820 |
Cyberonics, Inc. (a) | 713,982 | | 37,505 |
Intuitive Surgical, Inc. (a) | 689,143 | | 337,935 |
Medtronic, Inc. | 1,594,100 | | 65,390 |
Common Stocks - continued |
| Shares | | Value (000s) |
HEALTH CARE - continued |
Health Care Equipment & Supplies - continued |
Stryker Corp. | 949,800 | | $ 52,068 |
Varian Medical Systems, Inc. (a) | 241,600 | | 16,970 |
| | 835,456 |
Health Care Providers & Services - 1.0% |
Acadia Healthcare Co., Inc. (a) | 1,002,300 | | 23,384 |
Catamaran Corp. (a) | 1,750,910 | | 82,485 |
CIGNA Corp. | 1,472,500 | | 78,720 |
DaVita, Inc. (a) | 659,300 | | 72,872 |
Express Scripts Holding Co. (a) | 132,328 | | 7,146 |
Henry Schein, Inc. (a) | 1,014,000 | | 81,586 |
McKesson Corp. | 618,400 | | 59,960 |
UnitedHealth Group, Inc. | 7,756,600 | | 420,718 |
| | 826,871 |
Health Care Technology - 0.7% |
athenahealth, Inc. (a) | 1,371,392 | | 100,729 |
Cerner Corp. (a) | 6,251,149 | | 485,339 |
| | 586,068 |
Life Sciences Tools & Services - 0.6% |
Fluidigm Corp. (a)(h) | 1,027,387 | | 14,702 |
Mettler-Toledo International, Inc. (a)(e) | 2,397,775 | | 463,490 |
PerkinElmer, Inc. | 63,857 | | 2,027 |
Waters Corp. (a) | 691,147 | | 60,213 |
| | 540,432 |
Pharmaceuticals - 4.0% |
Abbott Laboratories | 12,229,755 | | 801,049 |
Allergan, Inc. | 515,462 | | 47,283 |
Bayer AG | 3,969,055 | | 378,496 |
Bristol-Myers Squibb Co. | 1,292,092 | | 42,109 |
Eli Lilly & Co. | 2,981,300 | | 147,038 |
Johnson & Johnson | 6,939,000 | | 486,424 |
Merck & Co., Inc. | 5,472,700 | | 224,052 |
Mylan, Inc. (a) | 2,746,722 | | 75,480 |
Novartis AG sponsored ADR | 974,900 | | 61,711 |
Novo Nordisk A/S Series B | 3,350,581 | | 545,597 |
Perrigo Co. | 2,519,878 | | 262,143 |
Pfizer, Inc. | 3,077,900 | | 77,194 |
Common Stocks - continued |
| Shares | | Value (000s) |
HEALTH CARE - continued |
Pharmaceuticals - continued |
Valeant Pharmaceuticals International, Inc. (Canada) (a) | 815,877 | | $ 48,672 |
Watson Pharmaceuticals, Inc. (a) | 1,966,100 | | 169,085 |
| | 3,366,333 |
TOTAL HEALTH CARE | | 10,029,814 |
INDUSTRIALS - 5.5% |
Aerospace & Defense - 0.1% |
Honeywell International, Inc. | 292,627 | | 18,573 |
United Technologies Corp. | 535,000 | | 43,875 |
| | 62,448 |
Air Freight & Logistics - 0.1% |
C.H. Robinson Worldwide, Inc. | 87,925 | | 5,559 |
FedEx Corp. | 534,021 | | 48,980 |
| | 54,539 |
Building Products - 0.1% |
ASSA ABLOY AB (B Shares) | 265,000 | | 9,975 |
Fortune Brands Home & Security, Inc. (a) | 2,738,000 | | 80,004 |
| | 89,979 |
Commercial Services & Supplies - 0.5% |
ADT Corp. | 2,653,550 | | 123,364 |
Edenred SA | 1,920,381 | | 59,394 |
Stericycle, Inc. (a) | 2,964,008 | | 276,453 |
Swisher Hygiene, Inc. (a) | 6,357,060 | | 10,012 |
| | 469,223 |
Construction & Engineering - 0.0% |
Jacobs Engineering Group, Inc. (a) | 212,500 | | 9,046 |
Electrical Equipment - 0.3% |
AMETEK, Inc. | 240,000 | | 9,017 |
Generac Holdings, Inc. | 288,475 | | 9,898 |
Roper Industries, Inc. | 2,225,714 | | 248,123 |
| | 267,038 |
Industrial Conglomerates - 1.1% |
3M Co. | 1,604,300 | | 148,959 |
Danaher Corp. | 12,189,227 | | 681,378 |
General Electric Co. | 6,066,200 | | 127,330 |
| | 957,667 |
Common Stocks - continued |
| Shares | | Value (000s) |
INDUSTRIALS - continued |
Machinery - 0.5% |
Deere & Co. | 383,200 | | $ 33,116 |
Fanuc Corp. | 274,200 | | 51,015 |
Illinois Tool Works, Inc. | 2,991,310 | | 181,902 |
PACCAR, Inc. | 806,700 | | 36,471 |
Rexnord Corp. | 1,116,700 | | 23,786 |
Snap-On, Inc. | 787,999 | | 62,244 |
Wabtec Corp. | 5,600 | | 490 |
| | 389,024 |
Professional Services - 0.4% |
Bureau Veritas SA | 314,600 | | 35,276 |
Experian PLC | 8,489,202 | | 136,820 |
IHS, Inc. Class A (a) | 275,857 | | 26,482 |
On Assignment, Inc. (a) | 1,287,883 | | 26,118 |
Verisk Analytics, Inc. (a) | 2,177,800 | | 111,068 |
| | 335,764 |
Road & Rail - 1.9% |
Canadian Pacific | 5,933,800 | | 601,911 |
J.B. Hunt Transport Services, Inc. | 1,773,130 | | 105,874 |
Localiza Rent A Car SA | 1,364,500 | | 25,291 |
Union Pacific Corp. | 6,694,454 | | 841,627 |
| | 1,574,703 |
Trading Companies & Distributors - 0.5% |
Air Lease Corp.: | | | |
Class A (a)(f) | 1,624,500 | | 34,927 |
Class A (a) | 4,145,725 | | 89,133 |
Mills Estruturas e Servicos de Engenharia SA | 998,200 | | 16,775 |
MRC Global, Inc. | 330,000 | | 9,167 |
W.W. Grainger, Inc. | 1,424,305 | | 288,237 |
| | 438,239 |
TOTAL INDUSTRIALS | | 4,647,670 |
INFORMATION TECHNOLOGY - 27.9% |
Communications Equipment - 1.2% |
Cisco Systems, Inc. | 2,395,000 | | 47,062 |
Motorola Solutions, Inc. | 3,618,652 | | 201,487 |
Palo Alto Networks, Inc. (d) | 646,200 | | 34,585 |
QUALCOMM, Inc. | 10,987,743 | | 681,460 |
| | 964,594 |
Common Stocks - continued |
| Shares | | Value (000s) |
INFORMATION TECHNOLOGY - continued |
Computers & Peripherals - 7.5% |
3D Systems Corp. (a)(d) | 1,138,500 | | $ 60,739 |
Apple, Inc. | 11,536,558 | | 6,149,339 |
EMC Corp. (a) | 3,348,300 | | 84,712 |
Stratasys Ltd. (a) | 695,381 | | 55,735 |
| | 6,350,525 |
Electronic Equipment & Components - 0.7% |
Amphenol Corp. Class A (e) | 9,418,529 | | 609,379 |
Internet Software & Services - 8.3% |
Akamai Technologies, Inc. (a) | 876,731 | | 35,867 |
Constant Contact, Inc. (a)(d) | 1,038,840 | | 14,762 |
Cornerstone OnDemand, Inc. (a) | 1,906,002 | | 56,284 |
Dropbox, Inc. (h) | 5,464,028 | | 49,445 |
eBay, Inc. (a) | 16,805,428 | | 857,413 |
Equinix, Inc. (a) | 690,600 | | 142,402 |
ExactTarget, Inc. | 1,732,500 | | 34,650 |
Facebook, Inc. Class A | 24,588,325 | | 654,787 |
Google, Inc. Class A (a) | 6,291,877 | | 4,463,269 |
LinkedIn Corp. (a) | 2,244,889 | | 257,758 |
MercadoLibre, Inc. (d) | 479,359 | | 37,663 |
Rackspace Hosting, Inc. (a) | 916,400 | | 68,061 |
Web.com Group, Inc. (a) | 193,103 | | 2,858 |
Yahoo!, Inc. (a) | 17,717,200 | | 352,572 |
| | 7,027,791 |
IT Services - 5.7% |
Accenture PLC Class A | 12,015,464 | | 799,028 |
Alliance Data Systems Corp. (a)(e) | 2,731,011 | | 395,341 |
Cognizant Technology Solutions Corp. Class A (a) | 479,600 | | 35,514 |
Fidelity National Information Services, Inc. | 4,527,299 | | 157,595 |
Fiserv, Inc. (a) | 3,073,955 | | 242,935 |
FleetCor Technologies, Inc. (a) | 812,251 | | 43,577 |
Gartner, Inc. Class A (a) | 362,200 | | 16,668 |
IBM Corp. | 915,236 | | 175,313 |
MasterCard, Inc. Class A | 2,603,058 | | 1,278,830 |
Paychex, Inc. | 253,100 | | 7,882 |
Syntel, Inc. | 28,841 | | 1,546 |
Vantiv, Inc. | 132,971 | | 2,715 |
Visa, Inc. Class A | 10,661,179 | | 1,616,022 |
| | 4,772,966 |
Semiconductors & Semiconductor Equipment - 1.5% |
Analog Devices, Inc. | 601,400 | | 25,295 |
Common Stocks - continued |
| Shares | | Value (000s) |
INFORMATION TECHNOLOGY - continued |
Semiconductors & Semiconductor Equipment - continued |
ARM Holdings PLC sponsored ADR | 12,396,815 | | $ 468,972 |
ASML Holding NV | 1,913,128 | | 123,225 |
Linear Technology Corp. | 245,200 | | 8,410 |
Samsung Electronics Co. Ltd. | 432,470 | | 625,424 |
| | 1,251,326 |
Software - 3.0% |
Activision Blizzard, Inc. | 1,500,000 | | 15,930 |
Allot Communications Ltd. (a)(e) | 2,126,503 | | 37,894 |
Citrix Systems, Inc. (a) | 2,155,800 | | 141,744 |
CommVault Systems, Inc. (a) | 1,039,440 | | 72,459 |
Concur Technologies, Inc. (a)(e) | 3,232,849 | | 218,282 |
FleetMatics Group PLC (e) | 1,751,636 | | 44,071 |
Intuit, Inc. | 7,196,400 | | 428,186 |
Jive Software, Inc. | 436,368 | | 6,340 |
NetSuite, Inc. (a) | 3,464,287 | | 233,147 |
Red Hat, Inc. (a) | 1,713,125 | | 90,727 |
salesforce.com, Inc. (a) | 3,054,135 | | 513,400 |
ServiceNow, Inc. (d) | 2,390,986 | | 71,801 |
SolarWinds, Inc. (a)(e) | 3,934,594 | | 206,369 |
Splunk, Inc. | 1,301,088 | | 37,758 |
Symantec Corp. (a) | 8,309,100 | | 156,294 |
Trion World Network, Inc. warrants 8/10/17 (a)(h) | 124,282 | | 0* |
Ultimate Software Group, Inc. (a) | 614,846 | | 58,048 |
VMware, Inc. Class A (a) | 1,141,600 | | 107,470 |
Workday, Inc. | 1,037,800 | | 56,560 |
Workday, Inc. (h) | 1,223,783 | | 60,027 |
| | 2,556,507 |
TOTAL INFORMATION TECHNOLOGY | | 23,533,088 |
MATERIALS - 5.0% |
Chemicals - 2.5% |
Ashland, Inc. | 1,369,000 | | 110,081 |
CF Industries Holdings, Inc. | 288,207 | | 58,552 |
Eastman Chemical Co. | 1,665,645 | | 113,347 |
Ecolab, Inc. | 3,515,063 | | 252,733 |
Filtrona PLC | 5,747,370 | | 51,689 |
FMC Corp. | 1,111,900 | | 65,068 |
LyondellBasell Industries NV Class A | 2,579,700 | | 147,275 |
Mexichem SAB de CV | 9,078,700 | | 50,646 |
Common Stocks - continued |
| Shares | | Value (000s) |
MATERIALS - continued |
Chemicals - continued |
Monsanto Co. | 5,085,700 | | $ 481,362 |
PPG Industries, Inc. | 1,790,100 | | 242,290 |
Sherwin-Williams Co. | 1,478,900 | | 227,484 |
Syngenta AG (Switzerland) | 319,679 | | 129,146 |
Valspar Corp. | 1,554,500 | | 97,001 |
W.R. Grace & Co. (a) | 925,958 | | 62,252 |
| | 2,088,926 |
Construction Materials - 0.0% |
Eagle Materials, Inc. | 175,958 | | 10,294 |
Containers & Packaging - 0.1% |
Ball Corp. | 1,460,660 | | 65,365 |
Metals & Mining - 2.4% |
Allied Nevada Gold Corp. (Canada) (a) | 731,415 | | 22,118 |
Altius Minerals Corp. (a) | 99,600 | | 973 |
B2Gold Corp. (a)(e) | 31,353,833 | | 112,214 |
B2Gold Corp. (a)(e)(f) | 5,850,000 | | 20,937 |
CGA Mining Ltd. (Canada) (a)(e) | 23,305,900 | | 61,621 |
Continental Gold Ltd. (a) | 1,000,000 | | 8,897 |
Dalradian Resources, Inc. (a) | 52,600 | | 81 |
Dalradian Resources, Inc. (f) | 3,000,000 | | 4,614 |
Eldorado Gold Corp. | 2,523,488 | | 32,473 |
Endeavour Mining Corp. (a) | 12,615,135 | | 26,252 |
Franco-Nevada Corp. (e) | 13,238,600 | | 755,693 |
Franco-Nevada Corp. warrants 6/16/17 (a)(f)(e) | 342,250 | | 3,045 |
Freeport-McMoRan Copper & Gold, Inc. | 2,670,900 | | 91,345 |
Glencore International PLC (d) | 7,667,000 | | 44,291 |
Goldcorp, Inc. | 553,182 | | 20,338 |
Inmet Mining Corp. | 750,000 | | 55,803 |
Ivanplats Ltd. (f) | 4,084,500 | | 20,531 |
Ivanplats Ltd. Class A (h) | 11,992,837 | | 54,255 |
Medusa Mining Ltd. (e) | 12,134,545 | | 69,126 |
New Gold, Inc. (a) | 18,212,164 | | 201,584 |
Newcrest Mining Ltd. | 329,339 | | 7,704 |
Novagold Resources, Inc. (a) | 9,207,377 | | 41,654 |
Premier Gold Mines Ltd. (a)(e) | 7,460,600 | | 31,501 |
Premier Gold Mines Ltd. (e)(f) | 3,850,000 | | 16,256 |
Pretium Resources, Inc. (a) | 2,260,406 | | 29,792 |
Primero Mining Corp. (a) | 1,118,200 | | 7,195 |
Royal Gold, Inc. | 532,944 | | 43,334 |
Tahoe Resources, Inc. (a) | 726,703 | | 13,296 |
Common Stocks - continued |
| Shares | | Value (000s) |
MATERIALS - continued |
Metals & Mining - continued |
Tahoe Resources, Inc. (a)(f) | 5,376,500 | | $ 98,374 |
Teranga Gold Corp. (a) | 292,900 | | 665 |
Turquoise Hill Resources Ltd. (a) | 16,112,294 | | 123,106 |
Yamana Gold, Inc. | 460,300 | | 7,918 |
| | 2,026,986 |
Paper & Forest Products - 0.0% |
International Paper Co. | 1,310,800 | | 52,222 |
TOTAL MATERIALS | | 4,243,793 |
TELECOMMUNICATION SERVICES - 0.1% |
Diversified Telecommunication Services - 0.0% |
inContact, Inc. (a) | 695,315 | | 3,602 |
tw telecom, inc. (a) | 1,303,100 | | 33,190 |
| | 36,792 |
Wireless Telecommunication Services - 0.1% |
Rogers Communications, Inc. Class B (non-vtg.) (d) | 1,112,800 | | 50,522 |
TOTAL TELECOMMUNICATION SERVICES | | 87,314 |
UTILITIES - 0.1% |
Multi-Utilities - 0.1% |
YTL Corp. Bhd | 92,209,226 | | 57,538 |
TOTAL COMMON STOCKS (Cost $53,756,045) |
83,279,373
|
Preferred Stocks - 0.1% |
| | | |
Convertible Preferred Stocks - 0.1% |
CONSUMER DISCRETIONARY - 0.0% |
Media - 0.0% |
Glam Media, Inc. Series M-1: | | | |
8.00% (h) | 1,228,555 | | 6,279 |
8.00% (h) | 87,753 | | 449 |
8.00% (h) | 87,754 | | 449 |
| | 7,177 |
Preferred Stocks - continued |
| Shares | | Value (000s) |
Convertible Preferred Stocks - continued |
HEALTH CARE - 0.1% |
Biotechnology - 0.1% |
bluebird bio (h) | 19,295,922 | | $ 9,615 |
Intarcia Therapeutics, Inc. (h) | 2,100,446 | | 28,629 |
| | 38,244 |
INFORMATION TECHNOLOGY - 0.0% |
Internet Software & Services - 0.0% |
Dropbox, Inc. Series A (h) | 1,260,898 | | 11,410 |
Software - 0.0% |
Trion World Network, Inc.: | | | |
Series C, 8.00% (a)(h) | 3,950,196 | | 16,907 |
Series C-1, 8.00% (a)(h) | 310,705 | | 1,330 |
| | 18,237 |
TOTAL INFORMATION TECHNOLOGY | | 29,647 |
TOTAL CONVERTIBLE PREFERRED STOCKS | | 75,068 |
Nonconvertible Preferred Stocks - 0.0% |
CONSUMER DISCRETIONARY - 0.0% |
Automobiles - 0.0% |
Volkswagen AG | 39,400 | | 9,040 |
TOTAL PREFERRED STOCKS (Cost $107,222) |
84,108
|
Nonconvertible Bonds - 0.0% |
| Principal Amount (000s) | | |
CONSUMER DISCRETIONARY - 0.0% |
Media - 0.0% |
Glam Media, Inc.: | | | | |
9% 11/18/13 (h) | | $ 192 | | 192 |
9% 11/18/13 (h) | | 192 | | 192 |
9% 12/2/13 (h) | | 2,693 | | 2,693 |
| | 3,077 |
TOTAL NONCONVERTIBLE BONDS (Cost $3,077) |
3,077
|
Money Market Funds - 1.5% |
| Shares | | Value (000s) |
Fidelity Cash Central Fund, 0.18% (b) | 1,072,093,617 | | $ 1,072,094 |
Fidelity Securities Lending Cash Central Fund, 0.18% (b)(c) | 218,692,235 | | 218,692 |
TOTAL MONEY MARKET FUNDS (Cost $1,290,786) |
1,290,786
|
TOTAL INVESTMENT PORTFOLIO - 100.3% (Cost $55,157,130) | | 84,657,344 |
NET OTHER ASSETS (LIABILITIES) - (0.3)% | | (244,290) |
NET ASSETS - 100% | $ 84,413,054 |
Legend |
(a) Non-income producing |
(b) Affiliated fund that is available only to investment companies and other accounts managed by Fidelity Investments. The rate quoted is the annualized seven-day yield of the fund at period end. A complete unaudited listing of the fund's holdings as of its most recent quarter end is available upon request. In addition, each Fidelity Central Fund's financial statements, which are not covered by the Fund's Report of Independent Registered Public Accounting Firm, are available on the SEC's website or upon request. |
(c) Investment made with cash collateral received from securities on loan. |
(d) Security or a portion of the security is on loan at period end. |
(e) Affiliated company |
(f) Security exempt from registration under Rule 144A of the Securities Act of 1933. These securities may be resold in transactions exempt from registration, normally to qualified institutional buyers. At the end of the period, the value of these securities amounted to $303,719,000 or 0.4% of net assets. |
(g) Investment is owned by an entity that is treated as a corporation for U.S. tax purposes which is owned by the Fund. |
(h) Restricted securities - Investment in securities not registered under the Securities Act of 1933 (excluding 144A issues). At the end of the period, the value of restricted securities (excluding 144A issues) amounted to $412,101,000 or 0.5% of net assets. |
Additional information on each restricted holding is as follows: |
Security | Acquisition Date | Acquisition Cost (000s) |
bluebird bio | 7/23/12 | $ 9,615 |
Dropbox, Inc. | 5/2/12 | $ 49,445 |
Dropbox, Inc. Series A | 5/29/12 | $ 11,410 |
Fluidigm Corp. | 10/9/07 - 1/6/11 | $ 18,170 |
Glam Media, Inc.: Series M-1, 8.00% | 3/19/08 | $ 25,674 |
9% 11/18/13 | 12/2/11 | $ 385 |
9% 12/2/13 | 12/2/11 | $ 2,693 |
Intarcia Therapeutics, Inc. | 11/14/12 | $ 28,629 |
Ivanplats Ltd. Class A | 10/23/12 | $ 58,082 |
Legend Pictures LLC | 9/23/10 - 12/18/12 | $ 57,827 |
Metro Bank PLC Class A | 12/8/09 - 5/21/12 | $ 37,356 |
Trion World Network, Inc.: warrants 8/10/17 | 8/10/10 | $ 0* |
Series C, 8.00% | 8/22/08 | $ 21,691 |
Series C-1, 8.00% | 8/10/10 | $ 1,706 |
Weinstein Co. Holdings LLC Class A-1 | 10/19/05 | $ 41,234 |
Workday, Inc. | 10/13/11 | $ 16,227 |
* Amount represents less than $1,000. |
Affiliated Central Funds |
Information regarding fiscal year to date income earned by the Fund from investments in Fidelity Central Funds is as follows: |
Fund | Income earned (Amounts in thousands) |
Fidelity Cash Central Fund | $ 5,568 |
Fidelity Securities Lending Cash Central Fund | 7,036 |
Total | $ 12,604 |
Other Affiliated Issuers |
An affiliated company is a company in which the Fund has ownership of at least 5% of the voting securities. Fiscal year to date transactions with companies which are or were affiliates are as follows: |
Affiliate (Amounts in thousands) | Value, beginning of period | Purchases | Sales Proceeds | Dividend Income | Value,
end of
period |
Alliance Data Systems Corp. | $ 156,000 | $ 152,954 | $ - | $ - | $ 395,341 |
Allot Communications Ltd. | - | 53,271 | - | - | 37,894 |
Amphenol Corp. Class A | 506,556 | 70,663 | 159,917 | 4,031 | 609,379 |
athenahealth, Inc. | 45,749 | 131,579 | 81,322 | - | - |
Avion Gold Corp. | 59,448 | - | 3,525 | - | - |
B2Gold Corp. | 83,805 | 15,738 | - | - | 112,214 |
B2Gold Corp. (144A) | 17,807 | - | - | - | 20,937 |
Birchcliff Energy Ltd. | 98,366 | 2,147 | 30,091 | - | - |
CGA Mining Ltd. (Canada) | - | 69,345 | - | - | 61,621 |
Chipotle Mexican Grill, Inc. | 949,372 | 15,256 | 270,305 | - | 603,558 |
Concur Technologies, Inc. | 7,872 | 199,355 | - | - | 218,282 |
Constant Contact, Inc. | 43,052 | 4,177 | 13,860 | - | - |
D.R. Horton, Inc. | 16,324 | 261,450 | - | 3,894 | 323,572 |
Dalradian Resources, Inc. (144A) | - | 5,996 | - | - | - |
Dalradian Resources, Inc. | 7,447 | 301 | 3,586 | - | - |
Discovery Communications, Inc. | 649,586 | 36,705 | 8,325 | - | 1,038,085 |
Dollar Tree, Inc. | 720,888 | - | 549,190 | - | - |
Dunkin' Brands Group, Inc. | 116,194 | 71,943 | - | 4,243 | 237,154 |
Affiliate (Amounts in thousands) | Value, beginning of period | Purchases | Sales Proceeds | Dividend Income | Value,
end of
period |
FleetMatics Group PLC | $ - | $ 36,670 | $ - | $ - | $ 44,071 |
Franco-Nevada Corp. | 435,254 | 80,668 | - | 5,846 | 755,693 |
Franco-Nevada Corp. warrants 6/16/17 | 1,916 | - | - | - | 3,045 |
Informatica Corp. | 202,710 | 18,843 | 185,402 | - | - |
LogMeIn, Inc. | 53,513 | 7,642 | 55,721 | - | - |
Medusa Mining Ltd. | 56,958 | 2,539 | 5,083 | 743 | 69,126 |
Metro Bank PLC Class A | 11,513 | 16,046 | - | - | 43,393 |
Mettler-Toledo International, Inc. | 470,560 | 20,574 | 147,152 | - | 463,490 |
Noble Energy, Inc. | 1,613,053 | 38,831 | - | 15,837 | 1,778,823 |
Premier Gold Mines Ltd. | - | 36,186 | - | - | 31,501 |
Premier Gold Mines Ltd. (144A) | - | 22,255 | - | - | 16,256 |
Pretium Resources, Inc. | 23,735 | 49,215 | 38,896 | - | - |
Quality Systems, Inc. | 111,601 | - | 112,490 | 365 | - |
SolarWinds, Inc. | 68,594 | 90,482 | 17,325 | - | 206,369 |
Tim Hortons, Inc. (Canada) | 589,796 | 8,572 | 51,636 | 8,583 | 550,631 |
TJX Companies, Inc. | 1,245,690 | 32,080 | 168,815 | 16,238 | - |
TreeHouse Foods, Inc. | 232,324 | - | 192,392 | - | - |
Total | $ 8,595,683 | $ 1,551,483 | $ 2,095,033 | $ 59,780 | $ 7,620,435 |
Other Information |
The following is a summary of the inputs used, as of December 31, 2012, involving the Fund's assets and liabilities carried at fair value. The inputs or methodology used for valuing securities may not be an indication of the risk associated with investing in those securities. For more information on valuation inputs, and their aggregation into the levels used in the tables below, please refer to the Investment Valuation section in the accompanying Notes to Financial Statements. |
Valuation Inputs at Reporting Date: |
Description
(Amounts in thousands) | Total | Level 1 | Level 2 | Level 3 |
Investments in Securities: | | | | |
Equities: | | | | |
Consumer Discretionary | $ 16,920,524 | $ 16,419,924 | $ 381,289 | $ 119,311 |
Consumer Staples | 7,879,693 | 7,607,592 | 272,101 | - |
Energy | 4,717,891 | 4,697,311 | 20,580 | - |
Financials | 11,178,265 | 10,310,084 | 824,788 | 43,393 |
Health Care | 10,068,058 | 9,073,815 | 955,999 | 38,244 |
Industrials | 4,647,670 | 4,303,112 | 344,558 | - |
Information Technology | 23,562,735 | 22,798,192 | 685,451 | 79,092 |
Materials | 4,243,793 | 3,887,582 | 356,211 | - |
Telecommunication Services | 87,314 | 87,314 | - | - |
Utilities | 57,538 | - | 57,538 | - |
Corporate Bonds | 3,077 | - | - | 3,077 |
Money Market Funds | 1,290,786 | 1,290,786 | - | - |
Total Investments in Securities: | $ 84,657,344 | $ 80,475,712 | $ 3,898,515 | $ 283,117 |
The following is a summary of transfers between Level 1 and Level 2 for the period ended December 31, 2012. Transfers are assumed to have occurred at the beginning of the period, and are primarily attributable to the valuation techniques used for foreign equity securities, as discussed in the accompanying Notes to Financial Statements: |
Transfers | Total (000s) |
Level 1 to Level 2 | $ 2,162,575 |
Level 2 to Level 1 | $ 0 |
Distribution of investments by country or territory of incorporation, as a percentage of total net assets, is as follows. (Unaudited) |
United States of America | 87.1% |
Canada | 4.3% |
Ireland | 1.3% |
United Kingdom | 1.1% |
Others (Individually Less Than 1%) | 6.2% |
| 100.0% |
See accompanying notes which are an integral part of the financial statements.
Annual Report
Statement of Assets and Liabilities
Amounts in thousands (except per-share amounts) | December 31, 2012 |
Assets | | |
Investment in securities, at value (including securities loaned of $217,066) - See accompanying schedule: Unaffiliated issuers (cost $49,560,948) | $ 75,746,123 | |
Fidelity Central Funds (cost $1,290,786) | 1,290,786 | |
Other affiliated issuers (cost $4,305,396) | 7,620,435 | |
Total Investments (cost $55,157,130) | | $ 84,657,344 |
Foreign currency held at value (cost $4) | | 4 |
Receivable for investments sold
Regular delivery | | 76,044 |
Delayed delivery | | 46,629 |
Receivable for fund shares sold | | 111,314 |
Dividends receivable | | 39,991 |
Interest receivable | | 299 |
Distributions receivable from Fidelity Central Funds | | 855 |
Prepaid expenses | | 247 |
Other receivables | | 5,388 |
Total assets | | 84,938,115 |
| | |
Liabilities | | |
Payable for investments purchased | $ 16,897 | |
Payable for fund shares redeemed | 239,185 | |
Accrued management fee | 38,347 | |
Other affiliated payables | 9,352 | |
Other payables and accrued expenses | 2,588 | |
Collateral on securities loaned, at value | 218,692 | |
Total liabilities | | 525,061 |
| | |
Net Assets | | $ 84,413,054 |
Net Assets consist of: | | |
Paid in capital | | $ 54,849,832 |
Accumulated net investment loss | | (55,075) |
Accumulated undistributed net realized gain (loss) on investments and foreign currency transactions | | 118,074 |
Net unrealized appreciation (depreciation) on investments and assets and liabilities in foreign currencies | | 29,500,223 |
Net Assets | | $ 84,413,054 |
Contrafund:
Net Asset Value, offering price and redemption price per share ($58,768,570 ÷ 757,635 shares) | | $ 77.57 |
| | |
Class K:
Net Asset Value, offering price and redemption price per share ($25,644,484 ÷ 330,856 shares) | | $ 77.51 |
See accompanying notes which are an integral part of the financial statements.
Annual Report
Financial Statements - continued
Statement of Operations
Amounts in thousands | Year ended December 31, 2012 |
| | |
Investment Income | | |
Dividends (including $59,780 earned from other affiliated issuers) | | $ 915,969 |
Interest | | 3,978 |
Income from Fidelity Central Funds | | 12,604 |
Total income | | 932,551 |
| | |
Expenses | | |
Management fee
Basic fee | $ 457,846 | |
Performance adjustment | 9,256 | |
Transfer agent fees | 109,411 | |
Accounting and security lending fees | 3,060 | |
Custodian fees and expenses | 1,608 | |
Independent trustees' compensation | 543 | |
Appreciation in deferred trustee compensation account | 1 | |
Registration fees | 782 | |
Audit | 281 | |
Legal | 302 | |
Interest | 1 | |
Miscellaneous | 787 | |
Total expenses before reductions | 583,878 | |
Expense reductions | (4,541) | 579,337 |
Net investment income (loss) | | 353,214 |
Realized and Unrealized Gain (Loss) Net realized gain (loss) on: | | |
Investment securities: | | |
Unaffiliated issuers | 4,665,254 | |
Other affiliated issuers | 736,647 | |
Foreign currency transactions | (191) | |
Total net realized gain (loss) | | 5,401,710 |
Change in net unrealized appreciation (depreciation) on: Investment securities | 6,122,591 | |
Assets and liabilities in foreign currencies | 113 | |
Total change in net unrealized appreciation (depreciation) | | 6,122,704 |
Net gain (loss) | | 11,524,414 |
Net increase (decrease) in net assets resulting from operations | | $ 11,877,628 |
See accompanying notes which are an integral part of the financial statements.
Annual Report
Statement of Changes in Net Assets
Amounts in thousands | Year ended
December 31, 2012 | Year ended
December 31, 2011 |
Increase (Decrease) in Net Assets | | |
Operations | | |
Net investment income (loss) | $ 353,214 | $ 62,576 |
Net realized gain (loss) | 5,401,710 | 1,303,553 |
Change in net unrealized appreciation (depreciation) | 6,122,704 | (1,484,727) |
Net increase (decrease) in net assets resulting
from operations | 11,877,628 | (118,598) |
Distributions to shareholders from net investment income | (234,540) | (63,685) |
Distributions to shareholders from net realized gain | (699,796) | (166,900) |
Total distributions | (934,336) | (230,585) |
Share transactions - net increase (decrease) | 745,692 | (1,458,848) |
Total increase (decrease) in net assets | 11,688,984 | (1,808,031) |
| | |
Net Assets | | |
Beginning of period | 72,724,070 | 74,532,101 |
End of period (including accumulated net investment loss of $55,075 and accumulated net investment loss of $119,976, respectively) | $ 84,413,054 | $ 72,724,070 |
See accompanying notes which are an integral part of the financial statements.
Annual Report
Financial Highlights - Contrafund
Years ended December 31, | 2012 | 2011 | 2010 | 2009 | 2008 |
Selected Per-Share Data | | | | | |
Net asset value, beginning of period | $ 67.45 | $ 67.73 | $ 58.28 | $ 45.26 | $ 73.11 |
Income from Investment Operations | | | | | |
Net investment income (loss) B | .30 | .04 | (.02) | .11 | .23 |
Net realized and unrealized gain (loss) | 10.66 | (.13) | 9.86 | 13.11 | (27.22) |
Total from investment operations | 10.96 | (.09) | 9.84 | 13.22 | (26.99) |
Distributions from net investment income | (.19) G | (.04) | (.01) | (.11) | (.21) |
Distributions from net realized gain | (.65) G | (.15) | (.38) | (.09) | (.65) |
Total distributions | (.84) | (.19) | (.39) | (.20) F | (.86) |
Net asset value, end of period | $ 77.57 | $ 67.45 | $ 67.73 | $ 58.28 | $ 45.26 |
Total Return A | 16.26% | (.14)% | 16.93% | 29.23% | (37.16)% |
Ratios to Average Net Assets C,E | | | | | |
Expenses before reductions | .74% | .81% | .92% | 1.02% | .95% |
Expenses net of fee waivers, if any | .74% | .81% | .92% | 1.02% | .95% |
Expenses net of all reductions | .74% | .81% | .91% | 1.01% | .94% |
Net investment income (loss) | .40% | .06% | (.03)% | .22% | .37% |
Supplemental Data | | | | | |
Net assets, end of period (in millions) | $ 58,769 | $ 54,677 | $ 60,498 | $ 57,225 | $ 45,149 |
Portfolio turnover rate D | 48% | 55% | 46% | 58% | 78% |
A Total returns would have been lower if certain expenses had not been reduced during the applicable periods shown.
B Calculated based on average shares outstanding during the period.
C Fees and expenses of any underlying Fidelity Central Funds are not included in the Fund's expense ratio. The Fund indirectly bears its proportionate share of the expenses of any underlying Fidelity Central Funds.
D Amount does not include the portfolio activity of any underlying Fidelity Central Funds.
E Expense ratios reflect operating expenses of the class. Expenses before reductions do not reflect amounts reimbursed by the investment adviser or reductions from brokerage service arrangements or reductions from other expense offset arrangements and do not represent the amount paid by the class during periods when reimbursements or reductions occur. Expenses net of fee waivers reflect expenses after reimbursement by the investment adviser but prior to reductions from brokerage service arrangements or other expense offset arrangements. Expenses net of all reductions represent the net expenses paid by the class.
F Total distributions of $.20 per share is comprised of distributions from net investment income of $.113 and distributions from net realized gain of $.085 per share.
G The amount shown reflects certain reclassifications related to book to tax differences.
See accompanying notes which are an integral part of the financial statements.
Annual Report
Financial Highlights - Class K
Years ended December 31, | 2012 | 2011 | 2010 | 2009 | 2008 G |
Selected Per-Share Data | | | | | |
Net asset value, beginning of period | $ 67.40 | $ 67.70 | $ 58.25 | $ 45.23 | $ 68.59 |
Income from Investment Operations | | | | | |
Net investment income (loss) D | .39 | .12 | .06 | .19 | .22 |
Net realized and unrealized gain (loss) | 10.65 | (.14) | 9.87 | 13.11 | (23.30) |
Total from investment operations | 11.04 | (.02) | 9.93 | 13.30 | (23.08) |
Distributions from net investment income | (.28) J | (.13) | (.01) | (.20) | (.28) |
Distributions from net realized gain | (.65) J | (.15) | (.47) | (.09) | - |
Total distributions | (.93) | (.28) | (.48) | (.28) I | (.28) |
Net asset value, end of period | $ 77.51 | $ 67.40 | $ 67.70 | $ 58.25 | $ 45.23 |
Total Return B,C | 16.40% | (.02)% | 17.09% | 29.43% | (33.63)% |
Ratios to Average Net Assets E,H | | | | | |
Expenses before reductions | .63% | .69% | .79% | .86% | .82% A |
Expenses net of fee waivers, if any | .63% | .69% | .79% | .86% | .82% A |
Expenses net of all reductions | .62% | .69% | .78% | .85% | .82% A |
Net investment income (loss) | .51% | .18% | .10% | .38% | .75% A |
Supplemental Data | | | | | |
Net assets, end of period (in millions) | $ 25,644 | $ 18,047 | $ 14,034 | $ 6,749 | $ 3,301 |
Portfolio turnover rate F | 48% | 55% | 46% | 58% | 78% |
A Annualized
B Total returns for periods of less than one year are not annualized.
C Total returns would have been lower if certain expenses had not been reduced during the applicable periods shown.
D Calculated based on average shares outstanding during the period.
E Fees and expenses of any underlying Fidelity Central Funds are not included in the Fund's expense ratio. The Fund indirectly bears its proportionate share of the expenses of any underlying Fidelity Central Funds.
F Amount does not include the portfolio activity of any underlying Fidelity Central Funds.
G For the period May 9, 2008 (commencement of sale of shares) to December 31, 2008.
H Expense ratios reflect operating expenses of the class. Expenses before reductions do not reflect amounts reimbursed by the investment adviser or reductions from brokerage service arrangements or reductions from other expense offset arrangements and do not represent the amount paid by the class during periods when reimbursements or reductions occur. Expense ratios before reductions for start-up periods may not be representative of longer-term operating periods. Expenses net of fee waivers reflect expenses after reimbursement by the investment adviser but prior to reductions from brokerage service arrangements or other expense offset arrangements. Expenses net of all reductions represent the net expenses paid by the class.
I Total distributions of $.28 per share is comprised of distributions from net investment income of $.196 and distributions from net realized gain of $.085 per share.
J The amount shown reflects certain reclassifications related to book to tax differences.
See accompanying notes which are an integral part of the financial statements.
Annual Report
Notes to Financial Statements
For the period ended December 31, 2012
(Amounts in thousands except percentages)
1. Organization.
Fidelity® Contrafund® (the Fund) is a fund of Fidelity Contrafund (the Trust) and is authorized to issue an unlimited number of shares. The Trust is registered under the Investment Company Act of 1940, as amended (the 1940 Act), as an open-end management investment company organized as a Massachusetts business trust. The Fund offers Contrafund and Class K shares, each of which has equal rights as to assets and voting privileges. Each class has exclusive voting rights with respect to matters that affect that class. Investment income, realized and unrealized capital gains and losses, the common expenses of the Fund, and certain fund-level expense reductions, if any, are allocated on a pro-rata basis to each class based on the relative net assets of each class to the total net assets of the Fund. Each class differs with respect to transfer agent fees incurred. Certain expense reductions may also differ by class.
2. Investments in Fidelity Central Funds.
The Fund invests in Fidelity Central Funds, which are open-end investment companies available only to other investment companies and accounts managed by Fidelity Management & Research Company (FMR) and its affiliates. The Fund's Schedule of Investments lists each of the Fidelity Central Funds held as of period end, if any, as an investment of the Fund, but does not include the underlying holdings of each Fidelity Central Fund. As an Investing Fund, the Fund indirectly bears its proportionate share of the expenses of the underlying Fidelity Central Funds.
The Money Market Central Funds seek preservation of capital and current income and are managed by Fidelity Investments Money Management, Inc. (FIMM), an affiliate of FMR.
A complete unaudited list of holdings for each Fidelity Central Fund is available upon request or at the Securities and Exchange Commission (the SEC) website at www.sec.gov. In addition, the financial statements of the Fidelity Central Funds, which are not covered by the Fund's Report of Independent Registered Public Accounting Firm, are available on the SEC website or upon request.
3. Significant Accounting Policies.
The financial statements have been prepared in conformity with accounting principles generally accepted in the United States of America (GAAP), which require management to make certain estimates and assumptions at the date of the financial statements. Actual results could differ from those estimates. Subsequent events, if any, through the date that the financial statements were issued have been evaluated in the preparation of the financial statements. The following summarizes the significant accounting policies of the Fund:
Annual Report
3. Significant Accounting Policies - continued
Investment Valuation. Investments are valued as of 4:00 p.m. Eastern time on the last calendar day of the period. In accordance with valuation policies and procedures approved by the Board of Trustees (the Board), the Fund attempts to obtain prices from one or more third party pricing vendors or brokers to value its investments. When current market prices, quotations or rates are not readily available or reliable, investments will be fair valued in good faith by the FMR Fair Value Committee (the Committee), in accordance with procedures adopted by the Fund's Board. Factors used in determining fair value vary by investment type and may include market or investment specific events, changes in interest rates and credit quality. The frequency with which these procedures are used cannot be predicted and they may be utilized to a significant extent. The Committee oversees the Fund's valuation policies and procedures and is responsible for approving and reporting to the Board all fair value determinations.
The Fund categorizes the inputs to valuation techniques used to value its investments into a disclosure hierarchy consisting of three levels as shown below:
Level 1 - quoted prices in active markets for identical investments
Level 2 - other significant observable inputs (including quoted prices for similar investments, interest rates, prepayment speeds, etc.)
Level 3 - unobservable inputs (including the Fund's own assumptions based on the best information available)
Valuation techniques used to value the Fund's investments by major category are as follows:
Equity securities, including restricted securities, for which market quotations are readily available, are valued at the last reported sale price or official closing price as reported by a third party pricing vendor on the primary market or exchange on which they are traded and are categorized as Level 1 in the hierarchy. In the event there were no sales during the day or closing prices are not available, securities are valued at the last quoted bid price or may be valued using the last available price and are generally categorized as Level 2 in the hierarchy. For foreign equity securities, when significant market or security specific events arise, comparisons to the valuation of American Depositary Receipts (ADRs), futures contracts, Exchange-Traded Funds (ETFs) and certain indexes as well as quoted prices for similar securities are used and are categorized as Level 2 in the hierarchy. Utilizing these techniques may result in transfers between Level 1 and Level 2. For restricted equity securities and private placements where observable inputs are limited, assumptions about market activity and risk are used and these securities are generally categorized as Level 3 in the hierarchy.
Annual Report
Notes to Financial Statements - continued
(Amounts in thousands except percentages)
3. Significant Accounting Policies - continued
Investment Valuation - continued
Debt securities, including restricted securities, are valued based on evaluated prices received from third party pricing vendors or from brokers who make markets in such securities. For corporate bonds, pricing vendors utilize matrix pricing which considers yield or price of bonds of comparable quality, coupon, maturity and type as well as broker-supplied prices and are generally categorized as Level 2 in the hierarchy. When independent prices are unavailable or unreliable, debt securities may be valued utilizing pricing methodologies which consider similar factors that would be used by third party pricing vendors. These are generally categorized as Level 2 in the hierarchy but may be Level 3 depending on the circumstances.
Investments in open-end mutual funds, including the Fidelity Central Funds, are valued at their closing net asset value (NAV) each business day and are categorized as Level 1 in the hierarchy.
Changes in valuation techniques may result in transfers in or out of an assigned level within the disclosure hierarchy. The aggregate value of investments by input level, as of December 31, 2012, including information on transfers between Levels 1 and 2, is included at the end of the Fund's Schedule of Investments.
Foreign Currency. The Fund may use foreign currency contracts to facilitate transactions in foreign-denominated securities. Gains and losses from these transactions may arise from changes in the value of the foreign currency or if the counterparties do not perform under the contracts' terms.
Foreign-denominated assets, including investment securities, and liabilities are translated into U.S. dollars at the exchange rates at period end. Purchases and sales of investment securities, income and dividends received and expenses denominated in foreign currencies are translated into U.S. dollars at the exchange rate in effect on the transaction date.
The effects of exchange rate fluctuations on investments are included with the net realized and unrealized gain (loss) on investment securities. Other foreign currency transactions resulting in realized and unrealized gain (loss) are disclosed separately.
Investment Transactions and Income. For financial reporting purposes, the Fund's investment holdings and NAV include trades executed through the end of the last business day of the period. The NAV per share for processing shareholder transactions is calculated as of the close of business of the New York Stock Exchange (NYSE), normally 4:00 p.m. Eastern time and includes trades executed through the end of the prior business day. Gains and losses on securities sold are determined on the basis of identified
Annual Report
3. Significant Accounting Policies - continued
Investment Transactions and Income - continued
cost and may include proceeds received from litigation. Dividend income is recorded on the ex-dividend date, except for certain dividends from foreign securities where the ex-dividend date may have passed, which are recorded as soon as the Fund is informed of the ex-dividend date. Non-cash dividends included in dividend income, if any, are recorded at the fair market value of the securities received. Distributions received on securities that represent a return of capital or capital gain are recorded as a reduction of cost of investments and/or as a realized gain. The Fund estimates the components of distributions received that may be considered return of capital distributions or capital gain distributions. Interest income and distributions from the Fidelity Central Funds are accrued as earned. Interest income includes coupon interest and amortization of premium and accretion of discount on debt securities. Investment income is recorded net of foreign taxes withheld where recovery of such taxes is uncertain.
Expenses. Expenses directly attributable to a fund are charged to that fund. Expenses attributable to more than one fund are allocated among the respective funds on the basis of relative net assets or other appropriate methods. Expense estimates are accrued in the period to which they relate and adjustments are made when actual amounts are known.
Deferred Trustee Compensation. Under a Deferred Compensation Plan (the Plan), independent Trustees may elect to defer receipt of a portion of their annual compensation. Deferred amounts are invested in a cross-section of Fidelity funds, are marked-to-market and remain in the Fund until distributed in accordance with the Plan. The investment of deferred amounts and the offsetting payable to the Trustees are included in the accompanying Statement of Assets and Liabilities.
Income Tax Information and Distributions to Shareholders. Each year, the Fund intends to qualify as a regulated investment company under Subchapter M of the Internal Revenue Code, including distributing substantially all of its taxable income and realized gains. As a result, no provision for income taxes is required. As of December 31, 2012, the Fund did not have any unrecognized tax benefits in the financial statements; nor is the Fund aware of any tax positions for which it is reasonably possible that the total amounts of unrecognized tax benefits will significantly change in the next twelve months. The Fund files a U.S. federal tax return, in addition to state and local tax returns as required. A fund's federal income tax returns are subject to examination by the Internal Revenue Service (IRS) for a period of three fiscal years after they are filed. State and local tax returns may be subject to examination for an additional fiscal year depending on the jurisdiction. Foreign taxes are provided for based on the Fund's understanding of the tax rules and rates that exist in the foreign markets in which it invests.
Annual Report
Notes to Financial Statements - continued
(Amounts in thousands except percentages)
3. Significant Accounting Policies - continued
Income Tax Information and Distributions to Shareholders - continued
Distributions are declared and recorded on the ex-dividend date. Income dividends and capital gain distributions are declared separately for each class. Income and capital gain distributions are determined in accordance with income tax regulations, which may differ from GAAP. These differences resulted in distribution reclassifications. In addition, the Fund claimed a portion of the payment made to redeeming shareholders as a distribution for income tax purposes.
Capital accounts within the financial statements are adjusted for permanent book-tax differences. These adjustments have no impact on net assets or the results of operations. Temporary book-tax differences will reverse in a subsequent period.
Book-tax differences are primarily due to foreign currency transactions, passive foreign investment companies (PFIC), market discount, contingent interest, partnerships, deferred trustees compensation, capital loss carryforwards, and losses deferred due to wash sales and excise tax regulations.
Gross unrealized appreciation | $ 29,503,162 |
Gross unrealized depreciation | (697,425) |
Net unrealized appreciation (depreciation) on securities and other investments | $ 28,805,737 |
| |
Tax Cost | $ 55,851,607 |
The tax-based components of distributable earnings as of period end were as follows:
Undistributed long-term capital gain | $ 812,550 |
Net unrealized appreciation (depreciation) | $ 28,805,746 |
The tax character of distributions paid was as follows:
| December 31, 2012 | December 31, 2011 |
Ordinary Income | $ 554,101 | $ 230,585 |
Long-term Capital Gains | 380,235 | - |
Total | $ 934,336 | $ 230,585 |
Delayed Delivery Transactions and When-Issued Securities. During the period, the Fund transacted in securities on a delayed delivery or when-issued basis. Payment and delivery may take place after the customary settlement period for that security. The price of the underlying securities and the date when the securities will be delivered and paid for are fixed at the time the transaction is negotiated. The Fund may receive compensation for interest forgone in the purchase of a delayed delivery or when-issued security. With respect to purchase commitments, the Fund identifies securities as
Annual Report
3. Significant Accounting Policies - continued
Delayed Delivery Transactions and When-Issued Securities - continued
segregated in its records with a value at least equal to the amount of the commitment. Losses may arise due to changes in the value of the underlying securities or if the counterparty does not perform under the contract's terms, or if the issuer does not issue the securities due to political, economic, or other factors.
Restricted Securities. The Fund may invest in securities that are subject to legal or contractual restrictions on resale. These securities generally may be resold in transactions exempt from registration or to the public if the securities are registered. Disposal of these securities may involve time-consuming negotiations and expense, and prompt sale at an acceptable price may be difficult. Information regarding restricted securities is included at the end of the Fund's Schedule of Investments.
4. Purchases and Sales of Investments.
Purchases and sales of securities, other than short-term securities, aggregated $40,097,395 and $37,941,922, respectively.
5. Fees and Other Transactions with Affiliates.
Management Fee. FMR and its affiliates provide the Fund with investment management related services for which the Fund pays a monthly management fee. The management fee is the sum of an individual fund fee rate that is based on an annual rate of .30% of the Fund's average net assets and an annualized group fee rate that averaged .26% during the period. The group fee rate is based upon the average net assets of all the mutual funds advised by FMR. The group fee rate decreases as assets under management increase and increases as assets under management decrease. In addition, the management fee is subject to a performance adjustment (up to a maximum of ± .20% of the Fund's average net assets over a 36 month performance period). The upward or downward adjustment to the management fee is based on the relative investment performance of Contrafund as compared to an appropriate benchmark index. For the period, the total annual management fee rate, including the performance adjustment, was .57% of the Fund's average net assets.
Transfer Agent Fees. Fidelity Investments Institutional Operations Company, Inc. (FIIOC), an affiliate of FMR, is the transfer, dividend disbursing and shareholder servicing agent for each class of the Fund. FIIOC receives account fees and asset-based fees that vary according to the account size and type of account of the shareholders of Contrafund. FIIOC receives an asset-based fee of Class K's average net assets. FIIOC pays for typesetting, printing and mailing of shareholder reports, except proxy statements. For the period, transfer agent fees for each class were as follows:
Annual Report
Notes to Financial Statements - continued
(Amounts in thousands except percentages)
5. Fees and Other Transactions with Affiliates - continued
Transfer Agent Fees - continued
| Amount | % of
Average
Net Assets |
Contrafund | $ 97,722 | .17 |
Class K | 11,689 | .05 |
| $ 109,411 | |
Accounting and Security Lending Fees. Fidelity Service Company, Inc. (FSC), an affiliate of FMR, maintains the Fund's accounting records. The accounting fee is based on the level of average net assets for each month. Under a separate contract, FSC administers the security lending program. The security lending fee is based on the number and duration of lending transactions.
Brokerage Commissions. The Fund placed a portion of its portfolio transactions with brokerage firms which are affiliates of the investment adviser. The commissions paid to these affiliated firms were $560 for the period.
Interfund Lending Program. Pursuant to an Exemptive Order issued by the SEC, the Fund, along with other registered investment companies having management contracts with FMR, may participate in an interfund lending program. This program provides an alternative credit facility allowing the funds to borrow from, or lend money to, other participating affiliated funds. At period end, there were no interfund loans outstanding. The Fund's activity in this program during the period for which loans were outstanding was as follows:
Borrower or Lender | Average Loan
Balance | Weighted Average Interest Rate | Interest
Expense |
Borrower | $ 62,618 | .48% | $ 1 |
6. Committed Line of Credit.
The Fund participates with other funds managed by FMR or an affiliate in a $4.25 billion credit facility (the "line of credit") to be utilized for temporary or emergency purposes to fund shareholder redemptions or for other short-term liquidity purposes. The Fund has agreed to pay commitment fees on its pro-rata portion of the line of credit, which amounted to $217 and is reflected in Miscellaneous expenses on the Statement of Operations. During the period, there were no borrowings on this line of credit.
Annual Report
7. Security Lending.
The Fund lends portfolio securities through a lending agent from time to time in order to earn additional income. For equity securities, a lending agent is used and may loan securities to certain qualified borrowers, including Fidelity Capital Markets (FCM), a broker-dealer affiliated with the Fund. On the settlement date of the loan, the Fund receives collateral (in the form of U.S. Treasury obligations, letters of credit and/or cash) against the loaned securities and maintains collateral in an amount not less than 100% of the market value of the loaned securities during the period of the loan. The market value of the loaned securities is determined at the close of business of the Fund and any additional required collateral is delivered to the Fund on the next business day. If the borrower defaults on its obligation to return the securities loaned because of insolvency or other reasons, a fund could experience delays and costs in recovering the securities loaned or in gaining access to the collateral. Any cash collateral received is invested in the Fidelity Securities Lending Cash Central Fund. The value of loaned securities and cash collateral at period end are disclosed on the Fund's Statement of Assets and Liabilities. The value of securities loaned to FCM at period end was $9,894. Security lending income represents the income earned on investing cash collateral, less rebates paid to borrowers and any lending agent fees associated with the loan, plus any premium payments received for lending certain types of securities. Security lending income is presented in the Statement of Operations as a component of income from Fidelity Central Funds. Total security lending income during the period amounted to $7,036, including $220 from securities loaned to FCM.
8. Bank Borrowings.
The Fund is permitted to have bank borrowings for temporary or emergency purposes to fund shareholder redemptions or for other short-term liquidity requirements. The Fund has established borrowing arrangements with certain banks. The interest rate on the borrowings is the bank's base rate, as revised from time to time. The average loan balance during the period for which loans were outstanding amounted to $7,356. The weighted average interest rate was .65%. The interest expense amounted to one hundred thirty-three dollars under the bank borrowing program. At period end, there were no bank borrowings outstanding.
9. Expense Reductions.
Many of the brokers with whom FMR places trades on behalf of the Fund provided services to the Fund in addition to trade execution. These services included payments of certain expenses on behalf of the Fund totaling $4,539 for the period. In addition, through arrangements with the Fund's custodian, credits realized as a result of uninvested cash balances were used to reduce the Fund's expenses. During the period, these credits reduced the Fund's custody expenses by $2.
Annual Report
Notes to Financial Statements - continued
(Amounts in thousands except percentages)
10. Distributions to Shareholders.
Distributions to shareholders of each class were as follows:
Years ended December 31, | 2012 | 2011 |
From net investment income | | |
Contrafund | $ 142,141 | $ 28,410 |
Class K | 92,399 | 35,275 |
Total | $ 234,540 | $ 63,685 |
From net realized gain | | |
Contrafund | $ 488,008 | $ 130,522 |
Class K | 211,788 | 36,378 |
Total | $ 699,796 | $ 166,900 |
11. Share Transactions.
Transactions for each class of shares were as follows:
| Shares | Dollars |
Years ended December 31, | 2012 | 2011 | 2012 | 2011 |
Contrafund | | | | |
Shares sold | 111,368 | 136,499 | $ 8,438,526 | $ 9,377,328 |
Reinvestment of distributions | 7,912 | 2,271 | 607,022 | 153,775 |
Shares redeemed | (172,284) | (221,335) | (12,991,518) | (15,103,275) |
Net increase (decrease) | (53,004) | (82,565) | $ (3,945,970) | $ (5,572,172) |
Class K | | | | |
Shares sold | 117,840 | 113,775 | $ 8,818,893 | $ 7,765,531 |
Reinvestment of distributions | 3,969 | 1,073 | 304,187 | 71,653 |
Shares redeemed | (58,709) | (54,389) | (4,431,418) | (3,723,860) |
Net increase (decrease) | 63,100 | 60,459 | $ 4,691,662 | $ 4,113,324 |
12. Other.
The Fund's organizational documents provide former and current trustees and officers with a limited indemnification against liabilities arising in connection with the performance of their duties to the Fund. In the normal course of business, the Fund may also enter into contracts that provide general indemnifications. The Fund's maximum exposure under these arrangements is unknown as this would be dependent on future claims that may be made against the Fund. The risk of material loss from such claims is considered remote.
Annual Report
To the Trustees of Fidelity Contrafund and the Shareholders of Fidelity Contrafund:
In our opinion, the accompanying statement of assets and liabilities, including the schedule of investments, and the related statements of operations and of changes in net assets and the financial highlights present fairly, in all material respects, the financial position of Fidelity Contrafund (a fund of Fidelity Contrafund) at December 31, 2012, the results of its operations for the year then ended, the changes in its net assets for each of the two years in the period then ended and the financial highlights for each of the five years in the period then ended, in conformity with accounting principles generally accepted in the United States of America. These financial statements and financial highlights (hereafter referred to as "financial statements") are the responsibility of the Fidelity Contrafund's management. Our responsibility is to express an opinion on these financial statements based on our audits. We conducted our audits of these financial statements in accordance with the standards of the Public Company Accounting Oversight Board (United States). Those standards require that we plan and perform the audit to obtain reasonable assurance about whether the financial statements are free of material misstatement. An audit includes examining, on a test basis, evidence supporting the amounts and disclosures in the financial statements, assessing the accounting principles used and significant estimates made by management, and evaluating the overall financial statement presentation. We believe that our audits, which included confirmation of securities at December 31, 2012 by correspondence with the custodian and brokers, provide a reasonable basis for our opinion.
PricewaterhouseCoopers LLP
Boston, Massachusetts
February 12, 2013
Annual Report
The Trustees, Members of the Advisory Board, and executive officers of the trust and fund, as applicable, are listed below. The Board of Trustees governs the fund and is responsible for protecting the interests of shareholders. The Trustees are experienced executives who meet periodically throughout the year to oversee the fund's activities, review contractual arrangements with companies that provide services to the fund, oversee management of the risks associated with such activities and contractual arrangements, and review the fund's performance. Except for James C. Curvey, each of the Trustees oversees 234 funds advised by FMR or an affiliate. Mr. Curvey oversees 452 funds advised by FMR or an affiliate.
The Trustees hold office without limit in time except that (a) any Trustee may resign; (b) any Trustee may be removed by written instrument, signed by at least two-thirds of the number of Trustees prior to such removal; (c) any Trustee who requests to be retired or who has become incapacitated by illness or injury may be retired by written instrument signed by a majority of the other Trustees; and (d) any Trustee may be removed at any special meeting of shareholders by a two-thirds vote of the outstanding voting securities of the trust. Each Trustee who is not an interested person (as defined in the 1940 Act) (Independent Trustee), shall retire not later than the last day of the calendar year in which his or her 75th birthday occurs. The Independent Trustees may waive this mandatory retirement age policy with respect to individual Trustees. The executive officers and Advisory Board Members hold office without limit in time, except that any officer and Advisory Board Member may resign or may be removed by a vote of a majority of the Trustees at any regular meeting or any special meeting of the Trustees. Except as indicated, each individual has held the office shown or other offices in the same company for the past five years.
Experience, Skills, Attributes, and Qualifications of the Fund's Trustees. The Governance and Nominating Committee has adopted a statement of policy that describes the experience, qualifications, attributes, and skills that are necessary and desirable for potential Independent Trustee candidates (Statement of Policy). The Board believes that each Trustee satisfied at the time he or she was initially elected or appointed a Trustee, and continues to satisfy, the standards contemplated by the Statement of Policy. The Governance and Nominating Committee also engages professional search firms to help identify potential Independent Trustee candidates who have the experience, qualifications, attributes, and skills consistent with the Statement of Policy. From time to time, additional criteria based on the composition and skills of the current Independent Trustees, as well as experience or skills that may be appropriate in light of future changes to board composition, business conditions, and regulatory or other developments, have also been considered by the professional search firms and the Governance and Nominating Committee. In addition, the Board takes into account the Trustees' commitment and participation in Board and committee meetings, as well as their leadership of standing and ad hoc committees throughout their tenure.
In determining that a particular Trustee was and continues to be qualified to serve as a Trustee, the Board has considered a variety of criteria, none of which, in isolation, was controlling. The Board believes that, collectively, the Trustees have balanced and diverse experience, qualifications, attributes, and skills, which allow the Board to operate effectively in governing the fund and protecting the interests of shareholders. Information about the specific experience, skills, attributes, and qualifications of each Trustee, which in each case led to the Board's conclusion that the Trustee should serve (or continue to serve) as a trustee of the fund, is provided below.
Annual Report
Trustees and Officers - continued
Board Structure and Oversight Function. James C. Curvey is an interested person (as defined in the 1940 Act) and currently serves as Chairman. The Trustees have determined that an interested Chairman is appropriate and benefits shareholders because an interested Chairman has a personal and professional stake in the quality and continuity of services provided to the fund. Independent Trustees exercise their informed business judgment to appoint an individual of their choosing to serve as Chairman, regardless of whether the Trustee happens to be independent or a member of management. The Independent Trustees have determined that they can act independently and effectively without having an Independent Trustee serve as Chairman and that a key structural component for assuring that they are in a position to do so is for the Independent Trustees to constitute a substantial majority for the Board. The Independent Trustees also regularly meet in executive session. Ned C. Lautenbach serves as Chairman of the Independent Trustees and as such (i) acts as a liaison between the Independent Trustees and management with respect to matters important to the Independent Trustees and (ii) with management prepares agendas for Board meetings.
Fidelity funds are overseen by different Boards of Trustees. The fund's Board oversees Fidelity's equity and high income funds and another Board oversees Fidelity's investment-grade bond, money market, and asset allocation funds. The asset allocation funds may invest in Fidelity funds overseen by the fund's Board. The use of separate Boards, each with its own committee structure, allows the Trustees of each group of Fidelity funds to focus on the unique issues of the funds they oversee, including common research, investment, and operational issues. On occasion, the separate Boards establish joint committees to address issues of overlapping consequences for the Fidelity funds overseen by each Board.
The Trustees operate using a system of committees to facilitate the timely and efficient consideration of all matters of importance to the Trustees, the fund, and fund shareholders and to facilitate compliance with legal and regulatory requirements and oversight of the fund's activities and associated risks. The Board, acting through its committees, has charged FMR and its affiliates with (i) identifying events or circumstances the occurrence of which could have demonstrably adverse effects on the fund's business and/or reputation; (ii) implementing processes and controls to lessen the possibility that such events or circumstances occur or to mitigate the effects of such events or circumstances if they do occur; and (iii) creating and maintaining a system designed to evaluate continuously business and market conditions in order to facilitate the identification and implementation processes described in (i) and (ii) above. Because the day-to-day operations and activities of the fund are carried out by or through FMR, its affiliates and other service providers, the fund's exposure to risks is mitigated but not eliminated by the processes overseen by the Trustees. While each of the Board's committees has responsibility for overseeing different aspects of the fund's activities, oversight is exercised primarily through the Operations, Audit, and Compliance Committees. In addition, the Independent Trustees have worked with FMR to enhance the Board's oversight of investment and financial risks, legal and regulatory risks, technology risks, and operational risks, including the development of additional risk reporting to the Board. For example, a working group comprised of Independent Trustees and FMR has worked and continues to work to review the Fidelity funds' valuation-related activities, reporting and risk management. Appropriate personnel, including but not limited to the fund's Chief Compliance Officer (CCO), FMR's internal auditor, the independent accountants, the fund's Treasurer and portfolio management personnel, make periodic reports to the Board's committees, as appropriate, including an annual review of FMR's risk management program for the Fidelity funds. The responsibilities of each standing committee, including their oversight responsibilities, are described further under "Standing Committees of the Fund's Trustees."
Annual Report
The fund's Statement of Additional Information (SAI) includes more information about the Trustees. To request a free copy, call Fidelity at 1-800-544-8544.
Interested Trustees*:
Correspondence intended for each Trustee who is an interested person may be sent to Fidelity Investments, 82 Devonshire Street, Boston, Massachusetts 02109.
Name, Age; Principal Occupations and Other Relevant Experience+ |
James C. Curvey (77) |
| Year of Election or Appointment: 2007 Mr. Curvey is Trustee and Chairman of the Board of Trustees of certain Trusts. Mr. Curvey also serves as Trustee (2007-present) of other investment companies advised by FMR. Mr. Curvey is a Director of Fidelity Investments Money Management, Inc. (2009-present), Director of Fidelity Research & Analysis Co. (2009-present) and Director of FMR and FMR Co., Inc. (2007-present). Mr. Curvey is also Vice Chairman (2007-present) and Director of FMR LLC. In addition, Mr. Curvey serves as an Overseer for the Boston Symphony Orchestra and a member of the Trustees of Villanova University. Previously, Mr. Curvey was the Vice Chairman (2006-2007) and Director (2000-2007) of FMR Corp. |
Ronald P. O'Hanley (55) |
| Year of Election or Appointment: 2011 Mr. O'Hanley is Director of FMR Co., Inc. (2010-present), Director of Fidelity Investments Money Management, Inc. (2010-present), Director of Fidelity Research & Analysis Company (2010-present), President of Fidelity Asset Management and Corporate Services and a member of Fidelity's Executive Committee (2010-present). Previously, Mr. O'Hanley served as President and Chief Executive Officer of BNY Mellon Asset Management (2007-2010). Mr. O'Hanley also served as Vice Chairman of Bank New York Mellon Corp. and a member of that firm's Executive Committee. Prior to the 2007 merger of The Bank of New York and Mellon Financial Corporation, he was Vice Chairman of Mellon Financial Corporation and President and Chief Executive Officer of Mellon Asset Management. He joined Mellon in February 1997. Mr. O'Hanley currently serves as Chairman of the Boston Public Library Foundation Board of Directors and sits on the Board of Directors of Beth Israel Deaconess Medical Center, the Board of Trustees of the Marine Biological Laboratory and the Advisory Board of the Maxwell School of Citizenship and Public Administration at Syracuse University. Mr. O'Hanley also chairs the Council on Asset Management for the Financial Services Roundtable and is a member of the Board of Directors of Institutional Investor's U.S. Institute. |
* Trustees have been determined to be "Interested Trustees" by virtue of, among other things, their affiliation with the trust or various entities under common control with FMR.
+ The information above includes each Trustee's principal occupation during the last five years and other information relating to the experience, attributes, and skills relevant to each Trustee's qualifications to serve as a Trustee, which led to the conclusion that each Trustee should serve as a Trustee for the fund.
Annual Report
Independent Trustees:
Correspondence intended for each Independent Trustee (that is, the Trustees other than the Interested Trustees) may be sent to Fidelity Investments, P.O. Box 55235, Boston, Massachusetts 02205-5235.
Name, Age; Principal Occupations and Other Relevant Experience+ |
Dennis J. Dirks (64) |
| Year of Election or Appointment: 2005 Prior to his retirement in May 2003, Mr. Dirks was Chief Operating Officer and a member of the Board of The Depository Trust & Clearing Corporation (DTCC). He also served as President, Chief Operating Officer, and Board member of The Depository Trust Company (DTC) and President and Board member of the National Securities Clearing Corporation (NSCC). In addition, Mr. Dirks served as Chief Executive Officer and Board member of the Government Securities Clearing Corporation, Chief Executive Officer and Board member of the Mortgage-Backed Securities Clearing Corporation, as a Trustee and a member of the Finance Committee of Manhattan College (2005-2008), and as a Trustee and a member of the Finance Committee of AHRC of Nassau County (2006-2008). Mr. Dirks is a member of the Independent Directors Council (IDC) Governing Council (2010-present) and Board of Directors for The Brookville Center for Children's Services, Inc. (2009-present). |
Alan J. Lacy (59) |
| Year of Election or Appointment: 2008 Mr. Lacy serves as Senior Adviser (2007-present) of Oak Hill Capital Partners, L.P. (private equity). Mr. Lacy also served as Chief Executive Officer (2000-2005) and Vice Chairman (2005-2006) of Sears Holdings Corporation and Sears, Roebuck and Co. (retail). In addition, Mr. Lacy serves as a member of the Board of Directors of Dave & Buster's Entertainment, Inc. (restaurant and entertainment complexes, 2010-present), Earth Fare, Inc. (retail grocery, 2012-present), The Hillman Companies, Inc. (hardware wholesalers, 2010-present), and Bristol-Myers Squibb Company (global pharmaceuticals, 2008-present). Mr. Lacy is a member of the Board of Trustees of The National Parks Conservation Association (2006-present). Previously, Mr. Lacy served as Chairman of the Board of Trustees of the National Parks Conservation Association (2008-2011) and as a member of the Board of Directors for the Western Union Company (global money transfer, 2006-2011). |
Ned C. Lautenbach (68) |
| Year of Election or Appointment: 2000 Mr. Lautenbach is Chairman of the Independent Trustees of the Equity and High Income Funds (2006-present). Mr. Lautenbach currently serves as the Lead Director of the Eaton Corporation Board of Directors (diversified industrial, 1997-present). Mr. Lautenbach is Chairman of the Board of Directors of the Philharmonic Center for the Arts in Naples, Florida (2012-present) and a member of the Council on Foreign Relations (1994-present). Previously, Mr. Lautenbach was a Partner/Advisory Partner at Clayton, Dubilier & Rice, LLC (private equity investment, 1998-2010), as well as a Director of Sony Corporation (2006-2007). |
Joseph Mauriello (68) |
| Year of Election or Appointment: 2008 Prior to his retirement in January 2006, Mr. Mauriello served in numerous senior management positions including Deputy Chairman and Chief Operating Officer (2004-2005), and Vice Chairman of Financial Services (2002-2004) of KPMG LLP US (professional services, 1965-2005). Mr. Mauriello currently serves as a member of the Board of Directors of XL Group plc. (global insurance and re-insurance, 2006-present). Previously, Mr. Mauriello served as a Director of the Hamilton Funds of the Bank of New York (2006-2007) and of Arcadia Resources Inc. (health care services and products, 2007-2012). |
Robert W. Selander (62) |
| Year of Election or Appointment: 2011 Previously, Mr. Selander served as a Member of the Advisory Board of Fidelity's Equity and High Income Funds (2011), Executive Vice Chairman (2010), Chief Executive Officer (2009-2010), and President and Chief Executive Officer (1997-2009) of Mastercard, Inc. |
Cornelia M. Small (68) |
| Year of Election or Appointment: 2005 Ms. Small is a member of the Board of Directors (2009-present) and Chair of the Investment Committee (2010-present) of the Teagle Foundation. Ms. Small also serves on the Investment Committee of the Berkshire Taconic Community Foundation (2008-present). Previously, Ms. Small served as Chairperson (2002-2008) and a member of the Investment Committee and Chairperson (2008-2012) and a member of the Board of Trustees of Smith College. In addition, Ms. Small served as Chief Investment Officer, Director of Global Equity Investments, and a member of the Board of Directors of Scudder, Stevens & Clark and Scudder Kemper Investments. |
William S. Stavropoulos (73) |
| Year of Election or Appointment: 2001 Mr. Stavropoulos is Vice Chairman of the Independent Trustees of the Equity and High Income Funds (2006-present). Mr. Stavropoulos serves as President and Founder of the Michigan Baseball Foundation, the Great Lakes Loons (2007-present). Mr. Stavropoulos is Chairman Emeritus of the Board of Directors of The Dow Chemical Company, where he previously served in numerous senior management positions, including President, CEO (1995-2000; 2002-2004), Chairman of the Executive Committee (2000-2006), and as a member of the Board of Directors (1990-2006). Currently, Mr. Stavropoulos is a Director of Univar Inc. (global distributor of commodity and specialty chemicals, Chairman from 2010-May 2012 and Lead Director from May 2012-present), Teradata Corporation (data warehousing and technology solutions, 2008-present), Maersk Inc. (industrial conglomerate), and Tyco International, Ltd. (multinational manufacturing and services, 2007-present), and a member of the Advisory Board for Metalmark Capital LLC (private equity investment, 2005-present). Mr. Stavropoulos is an operating advisor to Clayton, Dubilier & Rice, LLC (private equity investment). In addition, Mr. Stavropoulos is a member of the University of Notre Dame Advisory Council for the College of Science, a Trustee of the Rollin L. Gerstacker Foundation, and a Director of the Naples Philharmonic Center for the Arts. Previously, Mr. Stavropoulos served as a Director of Chemical Financial Corporation (bank holding company, 1993-2012). |
David M. Thomas (63) |
| Year of Election or Appointment: 2008 Previously, Mr. Thomas served as Executive Chairman (2005-2006) and Chairman and Chief Executive Officer (2000-2005) of IMS Health, Inc. (pharmaceutical and healthcare information solutions), and a Director of Fortune Brands, Inc. (consumer products, 2000-2011). In addition, Mr. Thomas serves as Non-Executive Chairman of the Board of Directors of Fortune Brands Home and Security (home and security products, 2011-present), and as a member of the Board of Directors of Interpublic Group of Companies, Inc. (marketing communication, 2004-present). |
Michael E. Wiley (62) |
| Year of Election or Appointment: 2008 Mr. Wiley also serves as a Director of Asia Pacific Exploration Consolidated (international oil and gas exploration and production, 2008-present). Mr. Wiley serves as a Director of Tesoro Corporation (independent oil refiner and marketer, 2005-present), and a Director of Bill Barrett Corporation (exploration and production, 2005-present). In addition, Mr. Wiley also serves as a Director of Post Oak Bank (privately-held bank, 2004-present). Previously, Mr. Wiley served as a member of the Board of Trustees of the University of Tulsa (2000-2006; 2007-2010), as a Senior Energy Advisor of Katzenbach Partners, LLC (consulting, 2006-2007), as an Advisory Director of Riverstone Holdings (private investment), Chairman, President, and CEO of Baker Hughes, Inc. (oilfield services, 2000-2004), and as Director of Spinnaker Exploration Company (exploration and production, 2001-2005). |
+ The information above includes each Trustee's principal occupation during the last five years and other information relating to the experience, attributes, and skills relevant to each Trustee's qualifications to serve as a Trustee, which led to the conclusion that each Trustee should serve as a Trustee for the fund.
Advisory Board Members and Executive Officers:
Correspondence intended for David A. Rosow and Garnett A. Smith may be sent to Fidelity Investments, P.O. Box 55235, Boston, Massachusetts 02205-5235. Correspondence intended for each executive officer and Peter S. Lynch may be sent to Fidelity Investments, 82 Devonshire Street, Boston, Massachusetts 02109.
Name, Age; Principal Occupation |
Peter S. Lynch (68) |
| Year of Election or Appointment: 2003 Member of the Advisory Board of Fidelity's Equity and High Income Funds. Mr. Lynch is Vice Chairman and a Director of FMR and FMR Co., Inc. In addition, Mr. Lynch serves as a Trustee of Boston College and as the Chairman of the Inner-City Scholarship Fund. Previously, Mr. Lynch served on the Special Olympics International Board of Directors (1997-2006). |
David A. Rosow (70) |
| Year of Election or Appointment: 2012 Member of the Advisory Board of Fidelity's Equity and High Income Funds. Chairman and Chief Executive Officer of International Golf Group, Inc. (golf course development, 1989-present). Previously, Mr. Rosow served as Chairman and Chief Executive Officer of Rosow & Company, Inc. (private investment company, 1989-2011), a Lead Director of Hudson United Bancorp (2001-2006) and as a Director of TD Banknorth (1996-2006). In addition, Mr. Rosow is a member (2008-present) and President (2009-present) of the Town Council of Palm Beach, Florida. |
Garnett A. Smith (65) |
| Year of Election or Appointment: 2012 Member of the Advisory Board of Fidelity's Equity and High Income Funds. Prior to Mr. Smith's retirement, he served as Chairman and Chief Executive Officer of Inbrand Corp. (manufacturer of personal absorbent products, 1990-1997). He also served as President (1986-1990) of Inbrand Corp. Prior to his employment with Inbrand Corp., he was employed by a retail fabric chain and North Carolina National Bank. In addition, Mr. Smith is a board member of the Jackson Hole Land Trust (2009-present). |
Kenneth B. Robins (43) |
| Year of Election or Appointment: 2008 President and Treasurer of Fidelity's Equity and High Income Funds. Mr. Robins also serves as President and Treasurer (2010-present) and Assistant Treasurer (2009-present) of other Fidelity funds and is an employee of Fidelity Investments (2004-present). Previously, Mr. Robins served as Deputy Treasurer of the Fidelity funds (2005-2008) and Treasurer and Chief Financial Officer of The North Carolina Capital Management Trust: Cash and Term Portfolios (2006-2008). |
Bruce T. Herring (47) |
| Year of Election or Appointment: 2006 Vice President of certain Equity Funds. Mr. Herring also serves as President of Fidelity Research & Analysis Company (2010-present), Chief Investment Officer and Director of Fidelity Management & Research (U.K.) Inc. (2010-present) and Group Chief Investment Officer of FMR. Previously, Mr. Herring served as Vice President (2005-2006) and Senior Vice President (2006-2007) of Fidelity Management & Research Company, Vice President of FMR Co., Inc. (2001-2007) and as a portfolio manager for Fidelity U.S. Equity Funds. |
Brian B. Hogan (48) |
| Year of Election or Appointment: 2009 Vice President of Equity and High Income Funds. Mr. Hogan also serves as President of FMR's Equity Division (2009-present). Previously, Mr. Hogan served as Senior Vice President, Equity Research of FMR (2006-2009) and as a portfolio manager. |
Scott C. Goebel (44) |
| Year of Election or Appointment: 2008 Secretary and Chief Legal Officer (CLO) of the Fidelity funds. Mr. Goebel also serves as Secretary of Fidelity Investments Money Management, Inc. (FIMM) (2010-present) and Fidelity Research and Analysis Company (FRAC) (2010-present); Secretary and CLO of The North Carolina Capital Management Trust: Cash and Term Portfolios (2008-present); General Counsel, Secretary, and Senior Vice President of FMR (2008-present) and FMR Co., Inc. (2008-present); employed by FMR LLC or an affiliate (2001-present); Chief Legal Officer of Fidelity Management & Research (Hong Kong) Limited (2008-present) and Assistant Secretary of Fidelity Management & Research (Japan) Inc. (2008-present), and Fidelity Management & Research (U.K.) Inc. (2008-present). Previously, Mr. Goebel served as Assistant Secretary of FIMM (2008-2010), FRAC (2008-2010), and the Funds (2007-2008) and as Vice President and Secretary of Fidelity Distributors Corporation (FDC) (2005-2007). |
William C. Coffey (43) |
| Year of Election or Appointment: 2009 Assistant Secretary of Fidelity's Equity and High Income Funds. Mr. Coffey also serves as Senior Vice President and Deputy General Counsel of FMR LLC (2010-present), and is an employee of Fidelity Investments. Previously, Mr. Coffey served as Vice President and Associate General Counsel of FMR LLC (2005-2009). |
Elizabeth Paige Baumann (44) |
| Year of Election or Appointment: 2012 Anti-Money Laundering (AML) Officer of the Fidelity funds. Ms. Baumann also serves as AML Officer of The North Carolina Capital Management Trust: Cash and Term Portfolios (2012-present), Chief AML Officer of FMR LLC (2012-present), and is an employee of Fidelity Investments. Previously, Ms. Baumann served as Vice President and Deputy Anti-Money Laundering Officer (2007-2012). |
Christine Reynolds (54) |
| Year of Election or Appointment: 2008 Chief Financial Officer of the Fidelity funds. Ms. Reynolds became President of Fidelity Pricing and Cash Management Services (FPCMS) in August 2008. Ms. Reynolds served as Chief Operating Officer of FPCMS (2007-2008). Previously, Ms. Reynolds served as President, Treasurer, and Anti-Money Laundering officer of the Fidelity funds (2004-2007). |
Joseph A. Hanlon (44) |
| Year of Election or Appointment: 2012 Chief Compliance Officer of Fidelity's Equity and High Income Funds. Mr. Hanlon serves as Compliance Officer of FMR, FMR Co., Inc., Fidelity Investments Money Management, Inc. (FIMM), Fidelity Research and Analysis Company (FRAC), Fidelity Management & Research (Japan) Inc., Fidelity Management & Research (U.K.) Inc., Fidelity Management & Research (Hong Kong), and Strategic Advisers, Inc. (2009-present), as Senior Vice President of the Fidelity Asset Management Division (2009-present), and is an employee of Fidelity Investments. |
Joseph F. Zambello (55) |
| Year of Election or Appointment: 2011 Deputy Treasurer of the Fidelity funds. Mr. Zambello is an employee of Fidelity Investments. Previously, Mr. Zambello served as Vice President of FMR's Program Management Group (2009-2011) and Vice President of the Transfer Agent Oversight Group (2005-2009). |
Adrien E. Deberghes (45) |
| Year of Election or Appointment: 2008 Deputy Treasurer of Fidelity's Equity and High Income Funds. Mr. Deberghes also serves as Vice President (2011-present) and Assistant Treasurer (2010-present) of other Fidelity funds, and is an employee of Fidelity Investments (2008-present). Previously, Mr. Deberghes served as Senior Vice President of Mutual Fund Administration at State Street Corporation (2007-2008), Senior Director of Mutual Fund Administration at Investors Bank & Trust (2005-2007), and Director of Finance for Dunkin' Brands (2000-2005). |
Stephen Sadoski (41) |
| Year of Election or Appointment: 2012 Deputy Treasurer of Fidelity's Equity and High Income Funds. Mr. Sadoski also serves as Deputy Treasurer of other Fidelity funds (2013-present) and is an employee of Fidelity Investments (2012-present). Previously, Mr. Sadoski served as Assistant Treasurer of Fidelity's Fixed Income and Asset Allocation Funds (2012-2013), an assistant chief accountant in the Division of Investment Management of the Securities and Exchange Commission (SEC) (2009-2012) and as a senior manager at Deloitte & Touche (1997-2009). |
Stacie Smith (38) |
| Year of Election or Appointment: 2013 Deputy Treasurer of Fidelity's Equity and High Income Funds. Ms. Smith is an employee of Fidelity Investments (2009-present). Previously, Ms. Smith served as Senior Audit Manager of Ernst & Young LLP (1996-2009). |
Stephanie J. Dorsey (43) |
| Year of Election or Appointment: 2010 Assistant Treasurer of Fidelity's Equity and High Income Funds. Ms. Dorsey also serves as President and Treasurer (2013-present) and Assistant Treasurer (2012-present) of other Fidelity funds and is an employee of Fidelity Investments (2008-present). Previously, Ms. Dorsey served as Deputy Treasurer of Fidelity's Fixed Income and Asset Allocation Funds (2008-2013), Treasurer (2004-2008) of the JPMorgan Mutual Funds and Vice President (2004-2008) of JPMorgan Chase Bank. |
John R. Hebble (54) |
| Year of Election or Appointment: 2009 Assistant Treasurer of Fidelity's Equity and High Income Funds. Mr. Hebble also serves as President (2011-present), Treasurer, and Chief Financial Officer of The North Carolina Capital Management Trust: Cash and Term Portfolios (2008-present) and is an employee of Fidelity Investments. Previously, Mr. Hebble served as President and Treasurer of Fidelity's Fixed Income and Asset Allocation Funds (2008-2013). |
Gary W. Ryan (54) |
| Year of Election or Appointment: 2005 Assistant Treasurer of the Fidelity funds. Mr. Ryan is an employee of Fidelity Investments. Previously, Mr. Ryan served as Vice President of Fund Reporting in Fidelity Pricing and Cash Management Services (FPCMS) (1999-2005). |
Jonathan Davis (44) |
| Year of Election or Appointment: 2010 Assistant Treasurer of the Fidelity funds. Mr. Davis is also Assistant Treasurer of Fidelity Rutland Square Trust II and Fidelity Commonwealth Trust II. Mr. Davis is an employee of Fidelity Investments. Previously, Mr. Davis served as Vice President and Associate General Counsel of FMR LLC (2003-2010). |
Annual Report
The Board of Trustees of Contrafund voted to pay shareholders of record at the opening of business on record date, the following distributions per share derived from capital gains realized from sales of portfolio securities:
| Pay Date | Record Date | Capital Gains |
Contrafund | 02/11/13 | 02/08/13 | $0.745 |
The fund hereby designates as a capital gain dividend with respect to the taxable year ended December 31, 2012, $1,235,123,803, or, if subsequently determined to be different, the net capital gain of such year.
Contrafund designates 100% of the dividends distributed during the fiscal year as qualifying for the dividends-received deduction for corporate shareholders.
Contrafund designates 100% of the dividends distributed during the fiscal year as amounts which may be taken into account as a dividend for the purposes of the maximum rate under section 1(h)(11) of the Internal Revenue Code.
The fund will notify shareholders in January 2013 of amounts for use in preparing 2012 income tax returns.
Annual Report
Board Approval of Investment Advisory Contracts and Management Fees
Fidelity Contrafund
Each year, the Board of Trustees, including the Independent Trustees (together, the Board), votes on the renewal of the management contract and sub-advisory agreements (together, the Advisory Contracts) for the fund. The Board, assisted by the advice of fund counsel and Independent Trustees' counsel, requests and considers a broad range of information relevant to the renewal of the Advisory Contracts throughout the year.
The Board meets regularly and, at each of its meetings, considers factors that are relevant to its annual consideration of the renewal of the fund's Advisory Contracts, including the services and support provided to the fund and its shareholders. The Board has established various standing committees, each composed of and chaired by Independent Trustees with varying backgrounds, to which the Board has assigned specific subject matter responsibilities in order to enhance effective decision-making by the Board. The Board, acting directly and through its Committees, requests and receives information concerning the annual consideration of the renewal of the fund's Advisory Contracts. The Board also meets as needed to consider matters specifically related to the Board's annual consideration of the renewal of Advisory Contracts. Members of the Board may also meet with trustees of other Fidelity funds through ad hoc joint committees to discuss certain matters relevant to the Fidelity funds.
At its July 2012 meeting, the Board of Trustees, including the Independent Trustees, unanimously determined to renew the fund's Advisory Contracts. In reaching its determination, the Board considered all factors it believed relevant, including (i) the nature, extent, and quality of the services to be provided to the fund and its shareholders (including the investment performance of the fund); (ii) the competitiveness of the fund's management fee and total expense ratio relative to peer funds; (iii) the total costs of the services to be provided by and the profits to be realized by Fidelity from its relationship with the fund; (iv) the extent to which economies of scale exist and would be realized as the fund grows; and (v) whether fee levels reflect these economies of scale, if any, for the benefit of fund shareholders.
In considering whether to renew the Advisory Contracts for the fund, the Board reached a determination, with the assistance of fund counsel and Independent Trustees' counsel and through the exercise of its business judgment, that the renewal of the Advisory Contracts is in the best interests of the fund and its shareholders and that the compensation payable under the Advisory Contracts is fair and reasonable. The Board's decision to renew the Advisory Contracts was not based on any single factor, but rather was based on a comprehensive consideration of all the information provided to the Board at its meetings throughout the year. The Board, in reaching its determination to renew the Advisory Contracts, is aware that shareholders in the fund have a broad range of investment choices available to them, including a wide choice among mutual funds offered by Fidelity's competitors, and that the fund's shareholders, who have the opportunity to review and weigh the disclosure provided by the fund in its prospectus and other public disclosures, have chosen to invest in this fund, managed by Fidelity.
Annual Report
Board Approval of Investment Advisory Contracts and
Management Fees - continued
Nature, Extent, and Quality of Services Provided. The Board considered the staffing within the investment adviser, FMR, and the sub-advisers (together, the Investment Advisers), including the backgrounds of the fund's investment personnel, and also considered the fund's investment objective, strategies, and related investment philosophy. The Independent Trustees also had discussions with senior management of Fidelity's investment operations and investment groups. The Board considered the structure of the portfolio manager compensation program and whether this structure provides appropriate incentives to act in the best interests of the fund.
Resources Dedicated to Investment Management and Support Services. The Board and the Fund Oversight and Research Committees reviewed the general qualifications and capabilities of the Investment Advisers' investment staff, including its size, education, experience, and resources, as well as the Investment Advisers' approach to recruiting, training, managing, and compensating investment personnel. The Board also noted that FMR has continued to increase the resources devoted to non-U.S. offices, including expansion of Fidelity's global investment organization. The Board noted that Fidelity's analysts have extensive resources, tools and capabilities that allow them to conduct sophisticated quantitative and fundamental analysis, as well as credit analysis of issuers, counterparties and guarantors. The Board also believes that Fidelity's investment professionals have sufficient access to global information and data so as to provide competitive investment results over time, and that those professionals also have access to sophisticated tools that permit them to assess portfolio construction and risk and performance attribution characteristics continuously, as well as to transmit new information and research conclusions rapidly around the world. Additionally, in its deliberations, the Board considered the Investment Advisers' trading and risk management capabilities and resources, which are an integral part of the investment management process.
Shareholder and Administrative Services. The Board considered (i) the nature, extent, quality, and cost of advisory, administrative, and shareholder services performed by the Investment Advisers and their affiliates under the Advisory Contracts and under separate agreements covering transfer agency, pricing and bookkeeping, and securities lending services for the fund; (ii) the nature and extent of the supervision of third party service providers, principally custodians and subcustodians; and (iii) the resources devoted to, and the record of compliance with, the fund's compliance policies and procedures. The Board also reviewed the allocation of fund brokerage, including allocations to brokers affiliated with the Investment Advisers, the use of brokerage commissions to pay fund expenses, and the use of "soft" commission dollars to pay for research services.
Annual Report
The Board noted that the growth of fund assets over time across the complex allows Fidelity to reinvest in the development of services designed to enhance the value or convenience of the Fidelity funds as investment vehicles. These services include 24-hour access to account information and market information through telephone representatives and over the Internet, investor education materials and asset allocation tools, and the expanded availability of Fidelity Investor Centers.
Investment in a Large Fund Family. The Board considered the benefits to shareholders of investing in a Fidelity fund, including the benefits of investing in a fund that is part of a large family of funds offering a variety of investment disciplines and providing a large variety of mutual fund investor services. The Board noted that Fidelity had taken, or had made recommendations that resulted in the Fidelity funds taking, a number of actions over the previous year that benefited particular funds, including (i) continuing to dedicate additional resources to investment research and support of the senior management team that oversees asset management; (ii) persisting in efforts to enhance Fidelity's research capabilities, in particular, international research; (iii) launching new funds and making other enhancements to meet client needs for global and income-oriented solutions; (iv) continuing to launch dedicated lower cost underlying funds to meet investment management's portfolio construction needs related to expanding underlying fund options, specifically for the Freedom Fund product lines; (v) adopting a "Stock Selector" sector neutral investment approach and employing a team of portfolio managers who are sector specialists to manage certain funds; (vi) rationalizing product lines and gaining increased efficiencies through the mergers of several funds into other funds; (vii) strengthening the Spartan Index Fund product line by adding new funds and/or new low-cost institutional share classes, restructuring fund expenses to accommodate new classes, and reducing investment minimums for certain classes of shares; (viii) modifying the eligibility criteria for Institutional Class shares to increase their appeal to government entities and charitable investors; and (ix) reducing certain transfer agent fee rates.
Investment Performance. The Board considered whether the fund has operated in accordance with its investment objective, as well as its record of compliance with its investment restrictions. It also reviewed the fund's absolute investment performance for each class, as well as the fund's relative investment performance for each class measured over multiple periods against (i) a broad-based securities market index, and (ii) a custom peer group of mutual funds deemed appropriate by Fidelity and reviewed by the Board. The following charts considered by the Board show, over the one-, three-, and five-year periods ended December 31, 2011, as available, the cumulative total returns of Class K and the retail class of the fund, the cumulative total returns of a broad-based securities market index ("benchmark"), and a range of cumulative total returns of a custom peer group of mutual funds defined by FMR based on categories assigned by Morningstar, Inc. The box within each chart shows the 25th percentile return (top of box) and the 75th percentile return (bottom of box) of the peer group. Returns shown above the box are in the first quartile and returns shown below the box are in the fourth quartile. The percentage beaten numbers noted below each chart correspond to the percentile box and represent the percentage of funds in the peer group whose performance was equal to or lower than that of the class indicated. The fund's custom peer group, defined by FMR, is a peer group that FMR believes provides a more meaningful performance comparison than the peer group assigned by Morningstar, Inc., which assigns mutual funds to categories based on their investment styles as measured by their underlying portfolio holdings.
Annual Report
Board Approval of Investment Advisory Contracts and
Management Fees - continued
Fidelity Contrafund
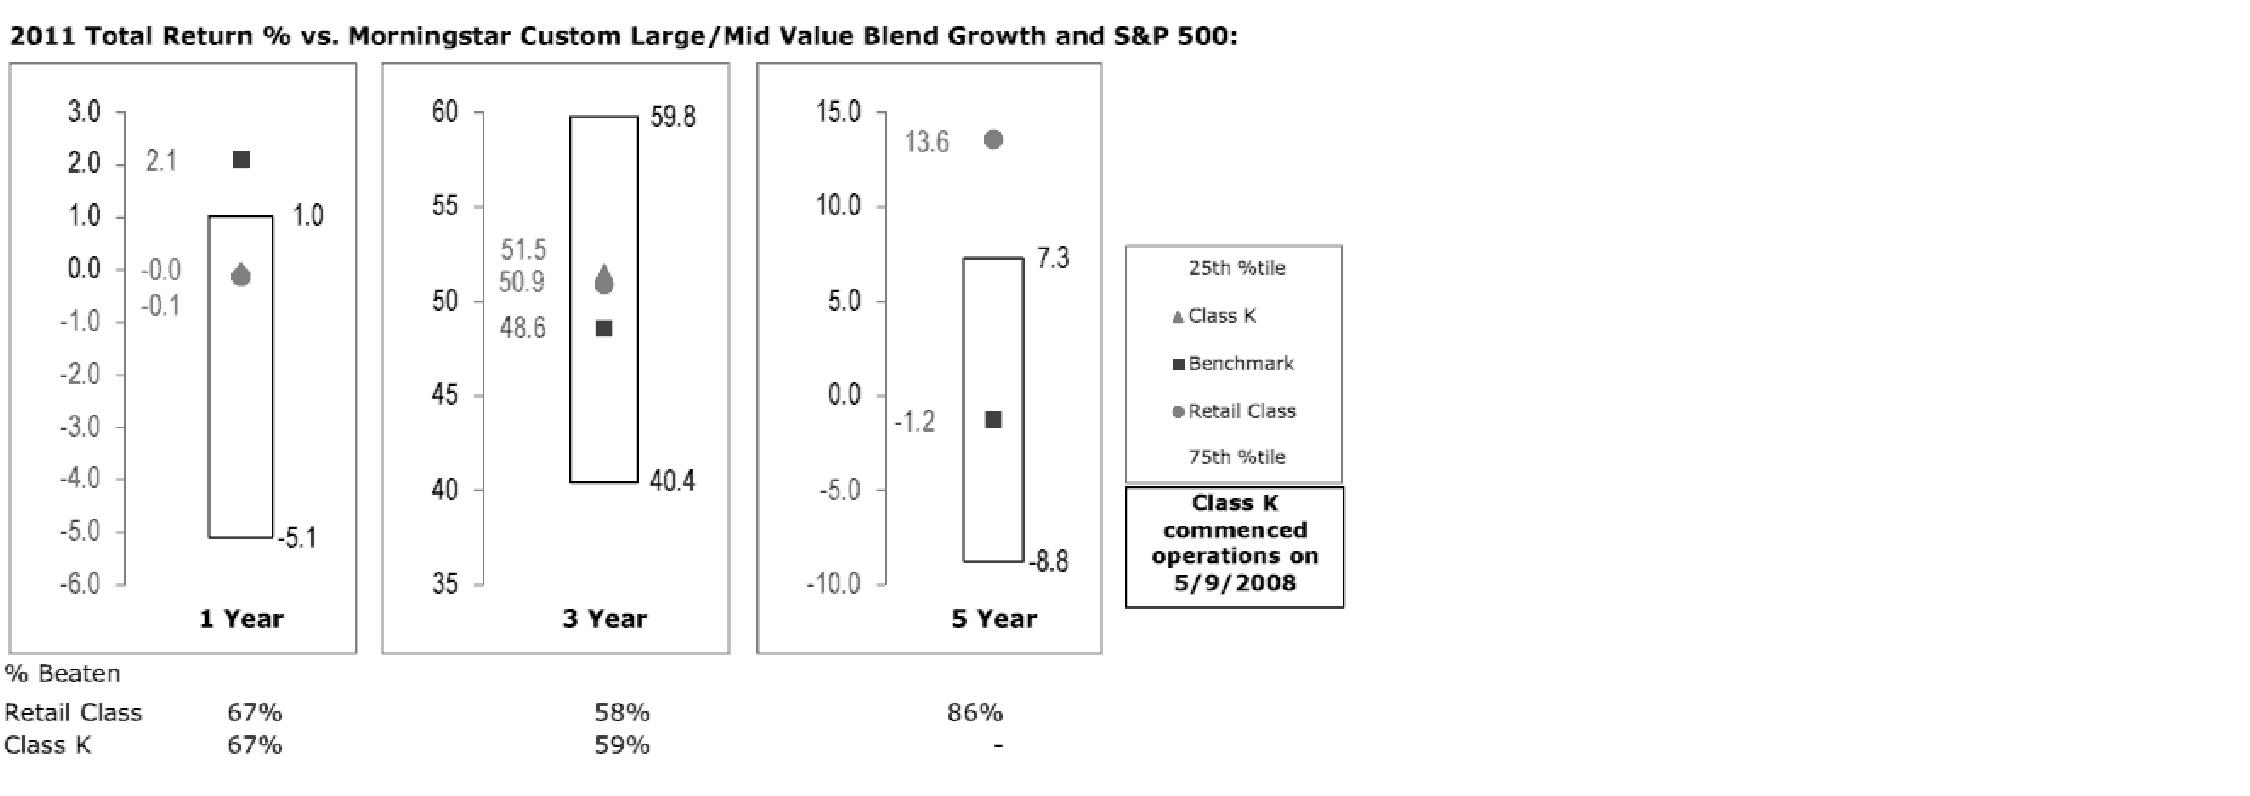
The Board reviewed the fund's relative investment performance against its peer group and noted that the performance of the retail class of the fund (the class with the longer performance record) was in the second quartile for the one- and three-year periods and the first quartile for the five-year period. The Board also noted that the investment performance of the retail class of the fund compared favorably to its benchmark for the three- and five-year periods, although the fund's one-year total return was lower than its benchmark. The Board considered that the variations in performance between the fund's classes reflect the variations in class expenses, which result in lower performance for the higher expense class. The Board noted that there was a portfolio management change for the fund in November 2011. The Board also reviewed the fund's performance since inception as well as performance in the current year.
The Board also considered that the fund's management fee is subject to upward or downward adjustment depending upon whether, and to what extent, the fund's investment performance for the performance period exceeds, or is exceeded by, the record (over the same period) of a Board-approved performance adjustment index. The Board noted that the performance adjustment provides FMR with a strong economic incentive to seek to achieve superior performance for the fund's shareholders and helps to more closely align the interests of FMR and the fund's shareholders.
Annual Report
Based on its review, the Board concluded that the nature, extent, and quality of services provided to the fund under the Advisory Contracts should benefit the fund's shareholders.
Competitiveness of Management Fee and Total Expense Ratio. The Board considered the fund's management fee and total expense ratio compared to "mapped groups" of competitive funds and classes. Fidelity creates "mapped groups" by combining similar Lipper investment objective categories that have comparable management fee characteristics. Combining Lipper investment objective categories aids the Board's management fee and total expense ratio comparisons by broadening the competitive group used for comparison and by reducing the number of universes to which various Fidelity funds are compared.
Management Fee. The Board considered two proprietary management fee comparisons for the 12-month periods shown in the chart below. The group of Lipper funds used by the Board for management fee comparisons is referred to below as the "Total Mapped Group." The Total Mapped Group comparison focuses on a fund's standing relative to the total universe of comparable funds available to investors in terms of gross management fees before expense reimbursements or caps, and without giving effect to the fund's performance adjustment. "TMG %" represents the percentage of funds in the Total Mapped Group that had management fees that were lower than the fund's. For example, a TMG % of 10% means that 90% of the funds in the Total Mapped Group had higher management fees than the fund. The "Asset-Size Peer Group" (ASPG) comparison focuses on a fund's standing relative to non-Fidelity funds similar in size to the fund within the Total Mapped Group. The ASPG represents at least 15% of the funds in the Total Mapped Group with comparable asset size and management fee characteristics, subject to a minimum of 50 funds (or all funds in the Total Mapped Group if fewer than 50). Additional information, such as the ASPG quartile in which the fund's management fee ranked and the impact of the fund's performance adjustment, is also included in the chart and considered by the Board.
Annual Report
Board Approval of Investment Advisory Contracts and
Management Fees - continued
Fidelity Contrafund
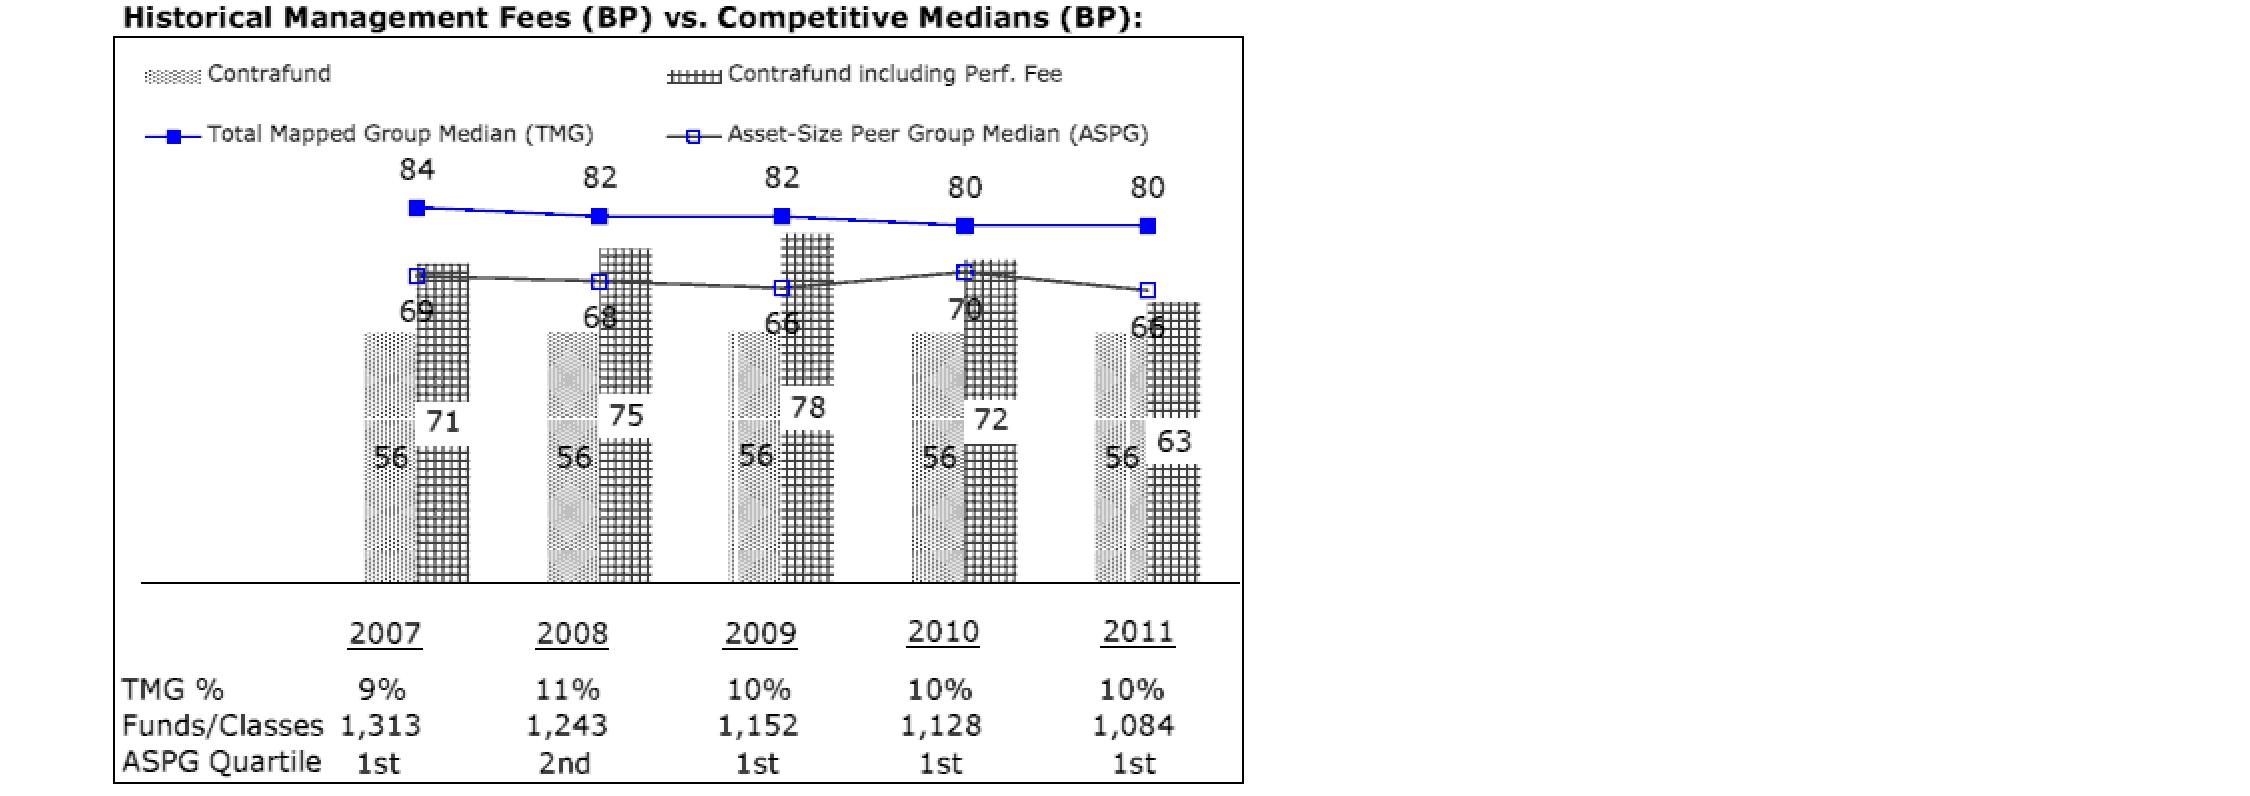
The Board noted that the fund's management fee ranked below the median of its Total Mapped Group and below the median of its ASPG for 2011. The Board also noted the effect of the fund's positive performance adjustment on the fund's management fee ranking. The Board noted that the performance adjustment for each year represents calculations for performance periods that differ from the periods shown in the performance charts above.
Based on its review, the Board concluded that the fund's management fee is fair and reasonable in light of the services that the fund receives and the other factors considered.
Total Expense Ratio. In its review of each class's total expense ratio, the Board considered the fund's management fee as well as other fund or class expenses, as applicable, such as transfer agent fees, pricing and bookkeeping fees, and custodial, legal, and audit fees. The Board also noted the effects of any waivers and reimbursements on fees and expenses, as well as the impact of the fund's performance adjustment. As part of its review, the Board also considered the current and historical total expense ratios of each class of the fund compared to competitive fund median expenses. Each class of the fund is compared to those funds and classes in the Total Mapped Group (used by the Board for management fee comparisons) that have a similar sales load structure.
The Board noted that the total expense ratio of each class ranked below its competitive median for 2011.
Fees Charged to Other Fidelity Clients. The Board also considered Fidelity fee structures and other information with respect to clients of FMR and its affiliates, such as other mutual funds advised or subadvised by FMR or its affiliates, pension plan clients, and other institutional clients. The Board noted the findings of the 2010 ad hoc joint committee (created with the board of other Fidelity funds), which reviewed and compared Fidelity's institutional investment advisory business with its business of providing services to the Fidelity funds, including the differences in services provided, fees charged, and costs incurred, as well as competition in their respective marketplaces.
Annual Report
Based on its review of total expense ratios and fees charged to other Fidelity clients, the Board concluded that the total expense ratio of each class of the fund was reasonable in light of the services that the fund and its shareholders receive and the other factors considered.
Costs of the Services and Profitability. The Board considered the revenues earned and the expenses incurred by Fidelity in conducting the business of developing, marketing, distributing, managing, administering and servicing the fund and its shareholders. The Board also considered the level of Fidelity's profits in respect of all the Fidelity funds.
On an annual basis, FMR presents to the Board Fidelity's profitability for the fund. Fidelity calculates the profitability for each fund, as well as aggregate profitability for groups of Fidelity funds and all Fidelity funds, using a series of detailed revenue and cost allocation methodologies which originate with the books and records of Fidelity on which Fidelity's audited financial statements are based. The Audit Committee of the Board reviews any significant changes from the prior year's methodologies.
PricewaterhouseCoopers LLP (PwC), independent registered public accounting firm and auditor to Fidelity and certain Fidelity funds, has been engaged annually by the Board as part of the Board's assessment of Fidelity's profitability analysis. PwC's engagement includes the review and assessment of Fidelity's methodologies used in determining the revenues and expenses attributable to Fidelity's mutual fund business, and completion of agreed-upon procedures surrounding the mathematical accuracy of fund profitability and its conformity to allocation methodologies. After considering PwC's reports issued under the engagement and information provided by Fidelity, the Board concluded that while other allocation methods may also be reasonable, Fidelity's profitability methodologies are reasonable in all material respects.
The Board also reviewed Fidelity's non-fund businesses and fall-out benefits related to the mutual fund business as well as cases where Fidelity's affiliates may benefit from or be related to the fund's business.
The Board considered the costs of the services provided by and the profits realized by Fidelity in connection with the operation of the fund and was satisfied that the profitability was not excessive in the circumstances.
Annual Report
Board Approval of Investment Advisory Contracts and
Management Fees - continued
Economies of Scale. The Board considered whether there have been economies of scale in respect of the management of the Fidelity funds, whether the Fidelity funds (including the fund) have appropriately benefited from any such economies of scale, and whether there is potential for realization of any further economies of scale. The Board considered the extent to which the fund will benefit from economies of scale through increased services to the fund, through waivers or reimbursements, or through fee or expense reductions. The Board also noted that in 2009, it and the board of other Fidelity funds created an ad hoc committee (the Economies of Scale Committee) to analyze whether FMR attains economies of scale in respect of the management and servicing of the Fidelity funds, whether the Fidelity funds have appropriately benefited from such economies of scale, and whether there is potential for realization of any further economies of scale.
The Board recognized that the fund's management contract incorporates a "group fee" structure, which provides for lower group fee rates as total fund assets under FMR's management increase, and for higher group fee rates as total fund assets under FMR's management decrease. FMR calculates the group fee rates based on a tiered asset "breakpoint" schedule that varies based on asset class. The Board considered that the group fee is designed to deliver the benefits of economies of scale to fund shareholders when total Fidelity fund assets increase, even if assets of any particular fund are unchanged or have declined, because some portion of Fidelity's costs are attributable to services provided to all Fidelity funds, and all funds benefit if those costs can be allocated among more assets. The Board concluded that, given the group fee structure, fund shareholders will benefit from lower management fees as assets under FMR's management increase at the fund complex level, regardless of whether Fidelity achieves any such economies of scale.
The Board concluded, taking into account the analysis of the Economies of Scale Committee, that economies of scale, if any, are being appropriately shared between fund shareholders and Fidelity.
Additional Information Requested by the Board. In order to develop fully the factual basis for consideration of the Fidelity funds' Advisory Contracts, the Board requested and received additional information on certain topics, including (i) fund performance trends, actions to be taken by FMR to improve certain funds' overall performance, and Fidelity's long-term strategies for certain funds; (ii) the potential to further rationalize the Fidelity fund lineup with the possibility of achieving savings for the funds and Fidelity; (iii) Fidelity's compensation structure for portfolio managers and other key investment personnel; (iv) the amount of the investment that each portfolio manager has made in the Fidelity fund(s) that he or she manages; (v) the realization of fall-out benefits in certain Fidelity business units; (vi) Fidelity's group fee structures, the potential impact of regulatory changes on such structures, and the rationale for the individual fee rates of certain funds; (vii) fund profitability methodology, including Fidelity's cost allocation methodology, and the impact of certain factors on fund profitability results; (viii) trends regarding industry use of performance fee structures and the possibility of implementing performance fee structures for additional funds; and (ix) the impact of net redemptions from the Fidelity funds.
Annual Report
Based on its evaluation of all of the conclusions noted above, and after considering all factors it believed relevant, the Board ultimately concluded that the advisory fee structures are fair and reasonable, and that the fund's Advisory Contracts should be renewed.
Annual Report
Investment Adviser
Fidelity Management & Research Company
Boston, MA
Investment Sub-Advisers
FMR Co., Inc.
Fidelity Management & Research
(U.K.) Inc.
Fidelity Management & Research
(Hong Kong) Limited
Fidelity Management & Research
(Japan) Inc.
General Distributor
Fidelity Distributors Corporation
Smithfield, RI
Transfer and Service Agents
Fidelity Investments Institutional
Operations Company, Inc.
Boston, MA
Fidelity Service Company, Inc. Boston, MA
Custodian
Brown Brothers Harriman & Co.
Boston, MA
(Fidelity Investment logo)(registered trademark)
Corporate Headquarters
82 Devonshire St., Boston, MA 02109
www.fidelity.com
The Fidelity Telephone Connection
Mutual Fund 24-Hour Service
Exchanges/Redemptions
and Account Assistance 1-800-544-6666
Product Information 1-800-544-6666
Retirement Accounts 1-800-544-4774
(8 a.m. - 9 p.m.)
TDD Service 1-800-544-0118
for the deaf and hearing impaired
(9 a.m. - 9 p.m. Eastern time)
Fidelity Automated Service
Telephone (FAST®) 1-800-544-5555
Automated line for quickest service
CON-UANN-0213
1.787729.109
Fidelity®
Contrafund®-
Class K
Annual Report
December 31, 2012
(Fidelity Cover Art)
Contents
Performance | (Click Here) | How the fund has done over time. |
Management's Discussion of Fund Performance | (Click Here) | The Portfolio Manager's review of fund performance and strategy. |
Shareholder Expense Example | (Click Here) | An example of shareholder expenses. |
Investment Changes | (Click Here) | A summary of major shifts in the fund's investments over the past six months. |
Investments | (Click Here) | A complete list of the fund's investments with their market values. |
Financial Statements | (Click Here) | Statements of assets and liabilities, operations, and changes in net assets, as well as financial highlights. |
Notes | (Click Here) | Notes to the financial statements. |
Report of Independent Registered Public Accounting Firm | (Click Here) | |
Trustees and Officers | (Click Here) | |
Distributions | (Click Here) | |
Board Approval of Investment Advisory Contracts and Management Fees | (Click Here) | |
To view a fund's proxy voting guidelines and proxy voting record for the 12-month period ended June 30, visit http://www.fidelity.com/proxyvotingresults or visit the Securities and Exchange Commission's (SEC) web site at http://www.sec.gov. You may also call 1-800-835-5092 to request a free copy of the proxy voting guidelines.
Standard & Poor's, S&P and S&P 500 are registered service marks of The McGraw-Hill Companies, Inc. and have been licensed for use by Fidelity Distributors Corporation.
Other third party marks appearing herein are the property of their respective owners.
All other marks appearing herein are registered or unregistered trademarks or service marks of FMR LLC or an affiliated company. © 2013 FMR LLC. All rights reserved.
Annual Report
This report and the financial statements contained herein are submitted for the general information of the shareholders of the fund. This report is not authorized for distribution to prospective investors in the fund unless preceded or accompanied by an effective prospectus.
A fund files its complete schedule of portfolio holdings with the SEC for the first and third quarters of each fiscal year on Form N-Q. Forms N-Q are available on the SEC's web site at http://www.sec.gov. A fund's Forms N-Q may be reviewed and copied at the SEC's Public Reference Room in Washington, DC. Information regarding the operation of the SEC's Public Reference Room may be obtained by calling 1-800-SEC-0330. For a complete list of a fund's portfolio holdings, view the most recent holdings listing, semiannual report, or annual report on Fidelity's web site at http://www.fidelity.com, http://www.advisor.fidelity.com, or http://www.401k.com, as applicable.
NOT FDIC INSURED • MAY LOSE VALUE • NO BANK GUARANTEE
Neither the fund nor Fidelity Distributors Corporation is a bank.
Annual Report
Average annual total return reflects the change in the value of an investment, assuming reinvestment of the class' distributions from dividend income and capital gains (the profits earned upon the sale of securities that have grown in value, if any) and assuming a constant rate of performance each year. The $10,000 table and the fund's returns do not reflect the deduction of taxes that a shareholder would pay on fund distributions or the redemption of fund shares. During periods of reimbursement by Fidelity, a fund's total return will be greater than it would be had the reimbursement not occurred. How a fund did yesterday is no guarantee of how it will do tomorrow.
Average Annual Total Returns
Periods ended December 31, 2012 | Past 1
year | Past 5
years | Past 10
years |
Class KA | 16.40% | 2.10% | 9.75% |
A The initial offering of Class K shares took place on May 9, 2008. Returns prior to May 9, 2008, are
those of Fidelity® Contrafund®, the original class of the fund.
$10,000 Over 10 Years
Let's say hypothetically that $10,000 was invested in Fidelity® Contrafund® - Class K on December 31, 2002. The chart shows how the value of your investment would have changed, and also shows how S&P 500® Index performed over the same period. The initial offering of Class K took place on May 9, 2008. See above for additional information regarding the performance of Class K.
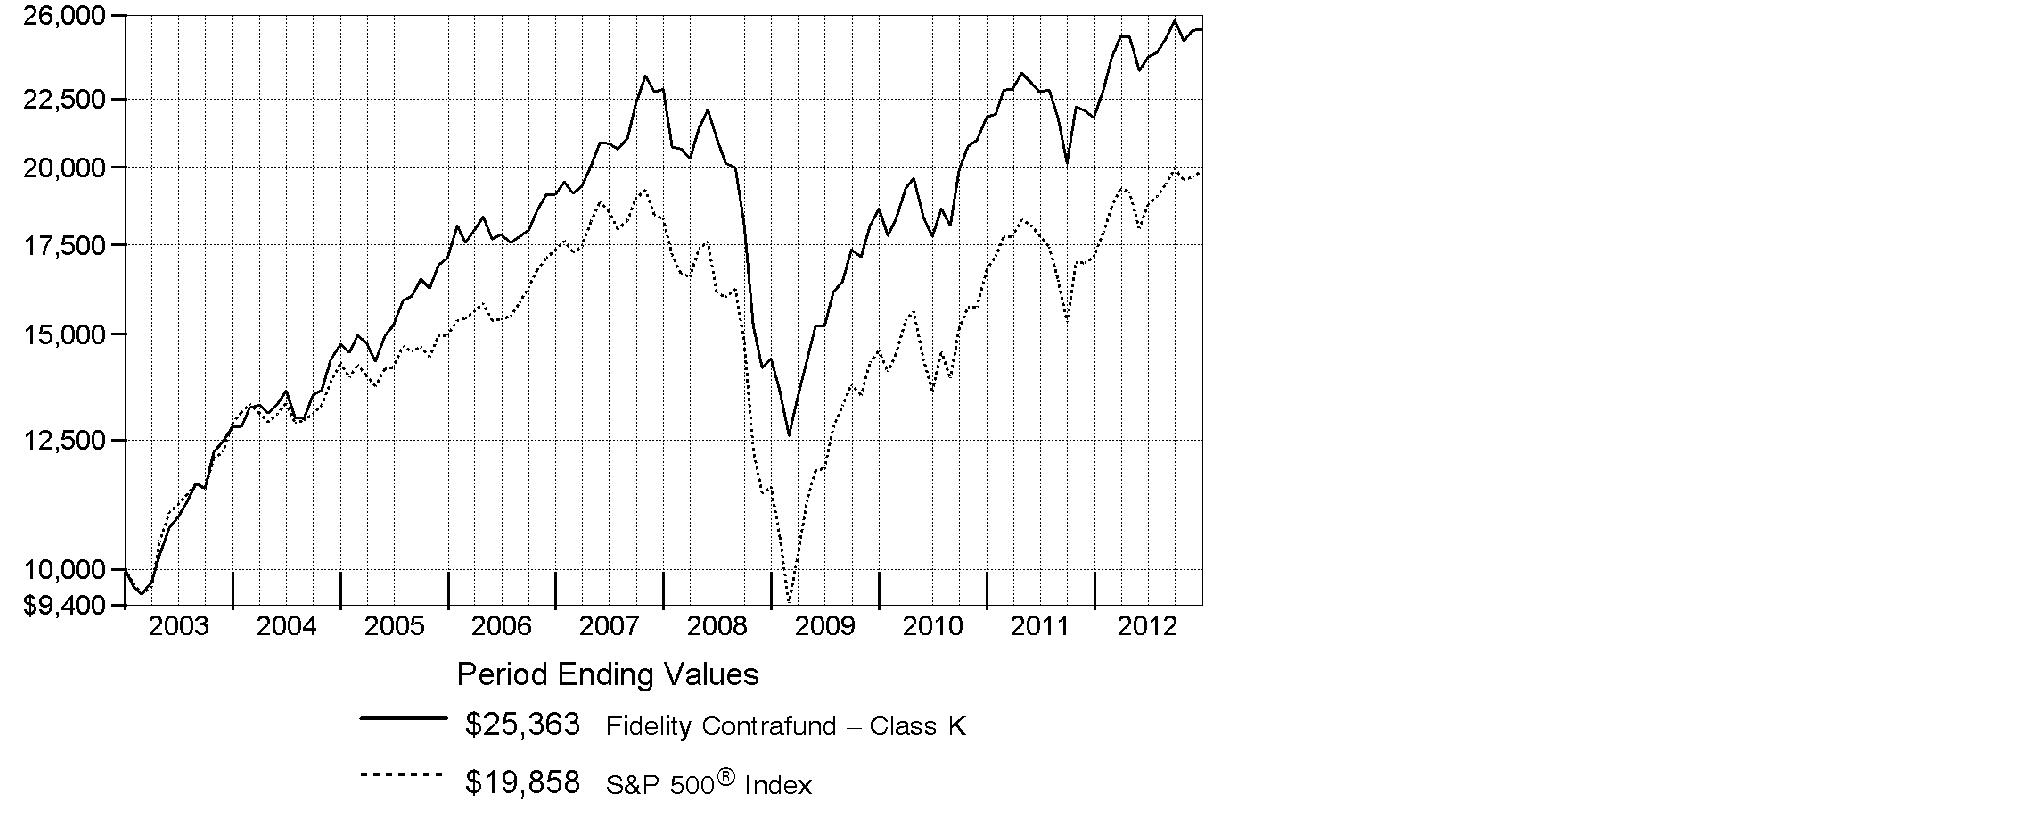
Annual Report
Market Recap: U.S. equity benchmarks posted double-digit gains for the year ending December 31, 2012, despite investors' concerns over debt woes in Europe, slower growth in China and partisan gridlock in Congress. Signs of recovery in the U.S. economy lifted stocks for most of the period, extending an uptrend that began in March 2009. The broad-based S&P 500® Index rose 16.00% for the 12 months, while the technology-heavy Nasdaq Composite Index® gained 17.45% and the blue-chip-laden Dow Jones Industrial AverageSM added 10.24%. Stocks began the year on a high note, with an improving U.S. economy and proposed bailouts in Europe buoying equities in the first quarter. Fear resurfaced in April and May, but stocks rebounded in June on central bank stimulus, a reviving U.S. housing market and more eurozone aid. Although equity benchmarks hit multiyear highs in September, pre-election jitters and the looming "fiscal cliff" of tax hikes and federal spending cuts triggered some profit-taking, followed by a brief post-election sell-off. Hurricane Sandy's aftereffects added to uncertainty, but stocks proved resilient. Within the S&P 500®, the financials and consumer discretionary sectors significantly outpaced the benchmark, while utilities and energy lagged the most, with only modest gains. Despite eurozone turmoil, foreign developed-markets stocks rose strongly, with the MSCI® EAFE® Index adding 17.48%.
Comments from William Danoff, Portfolio Manager of Fidelity® Contrafund®: For the year, the fund's Class K shares returned 16.40%, slightly ahead of the S&P 500®. Stock selection drove results versus the index, led by picks in technology, where I've had a strong commitment for many years. Here, market leader Apple was by far the fund's top individual contributor. Its shares rose roughly 33% for the year, despite a weak fourth quarter. The fund also was helped by largely avoiding the weak utilities sector and large energy stocks, based on their inferior relative earnings prospects. This included integrated oil firm and index component Exxon Mobil, which underperformed. Electronic payment leader Visa also notably contributed, fueled by strong earnings. Conversely, the fund was hurt by underweighting the rebounding diversified financials group, as large banks such as Bank of America - which I did not own - and JPMorgan Chase rose sharply with the improving U.S. economy. Weak sales hurt fast-food chain McDonald's. Concerns about intensified competition hurt Internet search giant Google, another of the fund's largest holdings. A cash position also detracted, given the market's strong advance.
The views expressed above reflect those of the portfolio manager(s) only through the end of the period as stated on the cover of this report and do not necessarily represent the views of Fidelity or any other person in the Fidelity organization. Any such views are subject to change at any time based upon market or other conditions and Fidelity disclaims any responsibility to update such views. These views may not be relied on as investment advice and, because investment decisions for a Fidelity fund are based on numerous factors, may not be relied on as an indication of trading intent on behalf of any Fidelity fund.
Annual Report
Shareholder Expense Example
As a shareholder of the Fund, you incur two types of costs: (1) transaction costs, and (2) ongoing costs, including management fees and other Fund expenses. This Example is intended to help you understand your ongoing costs (in dollars) of investing in the Fund and to compare these costs with the ongoing costs of investing in other mutual funds.
The Example is based on an investment of $1,000 invested at the beginning of the period and held for the entire period (July 1, 2012 to December 31, 2012).
Actual Expenses
The first line of the accompanying table for each class of the Fund provides information about actual account values and actual expenses. You may use the information in this line, together with the amount you invested, to estimate the expenses that you paid over the period. Simply divide your account value by $1,000.00 (for example, an $8,600 account value divided by $1,000.00 = 8.6), then multiply the result by the number in the first line for a class of the Fund under the heading entitled "Expenses Paid During Period" to estimate the expenses you paid on your account during this period. A small balance maintenance fee of $12.00 that is charged once a year may apply for certain accounts with a value of less than $2,000. This fee is not included in the table below. If it was, the estimate of expenses you paid during the period would be higher, and your ending account value lower, by this amount. In addition, the Fund, as a shareholder in the underlying Fidelity Central Funds, will indirectly bear its pro-rata share of the fees and expenses incurred by the underlying Fidelity Central Funds. These fees and expenses are not included in the Fund's annualized expense ratio used to calculate the expense estimate in the table below.
Hypothetical Example for Comparison Purposes
The second line of the accompanying table for each class of the Fund provides information about hypothetical account values and hypothetical expenses based on a Class' actual expense ratio and an assumed rate of return of 5% per year before expenses, which is not the Class' actual return. The hypothetical account values and expenses may not be used to estimate the actual ending account balance or expenses you paid for the period. You may use this information to compare the ongoing costs of investing in the Fund and other funds. To do so, compare this 5% hypothetical example with the 5% hypothetical examples that appear in the shareholder reports of the other funds. A small balance maintenance fee of $12.00 that is charged once a year may apply for certain accounts with a value of less than $2,000. This fee is not included in the table below. If it was, the estimate of expenses you paid during the period would be higher, and your ending account value lower, by this amount. In addition, the Fund, as a shareholder in the underlying Fidelity Central Funds, will indirectly bear its pro-rata share of the fees and expenses incurred by the underlying Fidelity Central Funds. These fees and expenses are not included in the Fund's annualized expense ratio used to calculate the expense estimate in the table below.
Please note that the expenses shown in the table are meant to highlight your ongoing costs only and do not reflect any transaction costs. Therefore, the second line of the table is useful in comparing ongoing costs only, and will not help you determine the relative total costs of owning different funds.
Annual Report
| Annualized Expense Ratio | Beginning
Account Value
July 1, 2012 | Ending
Account Value
December 31, 2012 | Expenses Paid
During Period*
July 1, 2012 to
December 31, 2012 |
Contrafund | .76% | | | |
Actual | | $ 1,000.00 | $ 1,048.20 | $ 3.91 |
HypotheticalA | | $ 1,000.00 | $ 1,021.32 | $ 3.86 |
Class K | .64% | | | |
Actual | | $ 1,000.00 | $ 1,048.80 | $ 3.30 |
HypotheticalA | | $ 1,000.00 | $ 1,021.92 | $ 3.25 |
A 5% return per year before expenses
* Expenses are equal to each Class' annualized expense ratio, multiplied by the average account value over the period, multiplied by 184/366 (to reflect the one-half year period).
Annual Report
Investment Changes (Unaudited)
Top Ten Stocks as of December 31, 2012 |
| % of fund's
net assets | % of fund's net assets
6 months ago |
Apple, Inc. | 7.3 | 9.0 |
Google, Inc. Class A | 5.3 | 4.3 |
Berkshire Hathaway, Inc. Class A | 3.5 | 3.3 |
Wells Fargo & Co. | 2.5 | 2.4 |
The Coca-Cola Co. | 2.5 | 2.7 |
The Walt Disney Co. | 2.3 | 2.3 |
Noble Energy, Inc. | 2.1 | 1.8 |
Visa, Inc. Class A | 1.9 | 1.5 |
TJX Companies, Inc. | 1.8 | 1.9 |
Amazon.com, Inc. | 1.8 | 1.4 |
| 31.0 | |
Top Five Market Sectors as of December 31, 2012 |
| % of fund's
net assets | % of fund's net assets
6 months ago |
Information Technology | 27.9 | 27.7 |
Consumer Discretionary | 20.0 | 22.7 |
Financials | 13.3 | 11.2 |
Health Care | 12.0 | 9.5 |
Consumer Staples | 9.3 | 9.2 |
Asset Allocation (% of fund's net assets) |
As of December 31, 2012 * | As of June 30, 2012 ** |
| Stocks 98.7% | | | Stocks 92.9% | |
| Bonds 0.0%† | | | Bonds 0.0%† | |
| Convertible
Securities 0.1% | | | Convertible
Securities 0.2% | |
| Short-Term Investments and Net Other Assets (Liabilities) 1.2% | | | Short-Term Investments and Net Other Assets (Liabilities) 6.9% | |
* Foreign investments | 12.9% | | **Foreign investments | 11.6% | |

† Amount represents less than 0.1%
Annual Report
Investments December 31, 2012
Showing Percentage of Net Assets
Common Stocks - 98.7% |
| Shares | | Value (000s) |
CONSUMER DISCRETIONARY - 20.0% |
Automobiles - 0.2% |
Hyundai Motor Co. | 397,072 | | $ 82,388 |
Tesla Motors, Inc. (a) | 1,968,741 | | 66,681 |
| | 149,069 |
Distributors - 0.1% |
LKQ Corp. (a) | 4,361,714 | | 92,032 |
Diversified Consumer Services - 0.0% |
Kroton Educacional SA (a) | 593,500 | | 13,567 |
Hotels, Restaurants & Leisure - 3.9% |
Chipotle Mexican Grill, Inc. (a)(e) | 2,029,039 | | 603,558 |
Dunkin' Brands Group, Inc. (d)(e) | 7,147,490 | | 237,154 |
Galaxy Entertainment Group Ltd. (a) | 11,114,000 | | 44,565 |
InterContinental Hotel Group PLC | 598,173 | | 16,773 |
McDonald's Corp. | 14,681,486 | | 1,295,054 |
Paddy Power PLC (Ireland) | 118,935 | | 9,818 |
Panera Bread Co. Class A (a) | 81,215 | | 12,899 |
Starbucks Corp. | 10,106,992 | | 541,937 |
Tim Hortons, Inc. (Canada) (e) | 11,216,732 | | 550,631 |
| | 3,312,389 |
Household Durables - 1.2% |
D.R. Horton, Inc. (e) | 16,358,553 | | 323,572 |
Lennar Corp. Class A | 5,360,000 | | 207,271 |
PulteGroup, Inc. (a) | 18,890,934 | | 343,059 |
Ryland Group, Inc. | 1,344,500 | | 49,074 |
Toll Brothers, Inc. (a) | 2,603,900 | | 84,184 |
Whirlpool Corp. | 243,694 | | 24,796 |
| | 1,031,956 |
Internet & Catalog Retail - 2.8% |
Amazon.com, Inc. (a) | 5,901,237 | | 1,482,037 |
Expedia, Inc. | 644,487 | | 39,604 |
Liberty Media Corp.: | | | |
Interactive Series A (a) | 2,547,100 | | 50,127 |
Series A (a) | 84,460 | | 5,723 |
Priceline.com, Inc. (a) | 802,600 | | 498,575 |
TripAdvisor, Inc. | 6,025,610 | | 252,835 |
| | 2,328,901 |
Leisure Equipment & Products - 0.1% |
Polaris Industries, Inc. | 1,431,652 | | 120,474 |
Media - 5.6% |
Comcast Corp. Class A | 25,406,478 | | 949,694 |
Common Stocks - continued |
| Shares | | Value (000s) |
CONSUMER DISCRETIONARY - continued |
Media - continued |
Discovery Communications, Inc. (a)(e) | 16,352,942 | | $ 1,038,085 |
Legend Pictures LLC (a)(g)(h) | 52,165 | | 96,671 |
Liberty Global, Inc. Class A (a) | 2,185,600 | | 137,671 |
Liberty Media Corp. Capital Series A (a) | 1,881,461 | | 218,268 |
Naspers Ltd. Class N | 1,454,963 | | 93,227 |
Sirius XM Radio, Inc. (d) | 46,725,018 | | 135,035 |
The Walt Disney Co. | 39,305,919 | | 1,957,042 |
Time Warner Cable, Inc. | 1,025,057 | | 99,625 |
Weinstein Co. Holdings LLC Class A-1 (a)(g)(h) | 41,234 | | 15,463 |
| | 4,740,781 |
Multiline Retail - 0.3% |
Dollar Tree, Inc. (a) | 4,753,220 | | 192,791 |
Dollarama, Inc. (f) | 410,655 | | 24,345 |
| | 217,136 |
Specialty Retail - 4.2% |
Bed Bath & Beyond, Inc. (a) | 9,368,900 | | 523,815 |
Dick's Sporting Goods, Inc. | 1,658,323 | | 75,437 |
Fast Retailing Co. Ltd. | 200,000 | | 51,042 |
Five Below, Inc. (d) | 537,441 | | 17,220 |
Foot Locker, Inc. | 3,144,100 | | 100,988 |
Gap, Inc. | 2,109,900 | | 65,491 |
GNC Holdings, Inc. | 1,061,300 | | 35,320 |
Home Depot, Inc. | 3,062,900 | | 189,440 |
Inditex SA | 209,424 | | 29,425 |
Penske Automotive Group, Inc. | 1,856,856 | | 55,873 |
PetSmart, Inc. | 2,222,619 | | 151,894 |
Ross Stores, Inc. | 7,963,188 | | 431,207 |
TJX Companies, Inc. | 35,305,965 | | 1,498,738 |
Ulta Salon, Cosmetics & Fragrance, Inc. | 1,738,542 | | 170,829 |
Urban Outfitters, Inc. (a) | 3,848,500 | | 151,477 |
| | 3,548,196 |
Textiles, Apparel & Luxury Goods - 1.6% |
lululemon athletica, Inc. (a) | 454,300 | | 34,631 |
Luxottica Group SpA | 1,310,687 | | 54,098 |
LVMH Moet Hennessy - Louis Vuitton SA | 348,000 | | 64,226 |
Michael Kors Holdings Ltd. | 1,623,400 | | 82,842 |
NIKE, Inc. Class B | 13,337,252 | | 688,202 |
PVH Corp. | 426,600 | | 47,357 |
Salvatore Ferragamo Italia SpA | 286,688 | | 6,347 |
Common Stocks - continued |
| Shares | | Value (000s) |
CONSUMER DISCRETIONARY - continued |
Textiles, Apparel & Luxury Goods - continued |
Under Armour, Inc. Class A (sub. vtg.) (a) | 4,767,322 | | $ 231,358 |
VF Corp. | 932,273 | | 140,745 |
| | 1,349,806 |
TOTAL CONSUMER DISCRETIONARY | | 16,904,307 |
CONSUMER STAPLES - 9.3% |
Beverages - 3.4% |
Anheuser-Busch InBev SA NV ADR | 5,067,400 | | 442,941 |
Boston Beer Co., Inc. Class A (a)(d) | 538,407 | | 72,389 |
Coca-Cola Icecek A/S | 31,979 | | 663 |
Diageo PLC sponsored ADR | 1,049,400 | | 122,339 |
Dr. Pepper Snapple Group, Inc. | 2,881,400 | | 127,300 |
The Coca-Cola Co. | 58,272,982 | | 2,112,396 |
| | 2,878,028 |
Food & Staples Retailing - 2.6% |
Bim Birlesik Magazalar A/S JSC | 293,153 | | 14,338 |
Costco Wholesale Corp. | 5,998,623 | | 592,484 |
CVS Caremark Corp. | 10,048,000 | | 485,821 |
Fresh Market, Inc. (a) | 1,452,437 | | 69,848 |
Wal-Mart Stores, Inc. | 13,839,600 | | 944,276 |
Whole Foods Market, Inc. | 661,350 | | 60,401 |
| | 2,167,168 |
Food Products - 0.6% |
Associated British Foods PLC | 3,742,070 | | 95,604 |
Calbee, Inc. | 196,800 | | 13,867 |
Kraft Foods Group, Inc. | 963,066 | | 43,791 |
Mondelez International, Inc. | 7,450,700 | | 189,769 |
Orion Corp. | 58,453 | | 60,348 |
Want Want China Holdings Ltd. | 72,985,000 | | 102,282 |
| | 505,661 |
Household Products - 1.8% |
Colgate-Palmolive Co. | 12,563,007 | | 1,313,337 |
Kimberly-Clark Corp. | 2,438,200 | | 205,857 |
| | 1,519,194 |
Personal Products - 0.9% |
Estee Lauder Companies, Inc. Class A | 13,525,600 | | 809,642 |
TOTAL CONSUMER STAPLES | | 7,879,693 |
Common Stocks - continued |
| Shares | | Value (000s) |
ENERGY - 5.6% |
Energy Equipment & Services - 0.2% |
Cameron International Corp. (a) | 425,300 | | $ 24,012 |
Schlumberger Ltd. | 1,597,718 | | 110,706 |
Seadrill Partners LLC | 195,600 | | 5,017 |
| | 139,735 |
Oil, Gas & Consumable Fuels - 5.4% |
Americas Petrogas, Inc. (a)(f) | 3,562,500 | | 10,744 |
Anadarko Petroleum Corp. | 7,510,804 | | 558,128 |
Birchcliff Energy Ltd. (a) | 5,035,600 | | 37,766 |
Birchcliff Energy Ltd. (f) | 1,900,000 | | 14,250 |
Cabot Oil & Gas Corp. | 1,533,501 | | 76,276 |
Canadian Natural Resources Ltd. | 936,812 | | 26,973 |
Cobalt International Energy, Inc. (a) | 1,321,200 | | 32,449 |
Concho Resources, Inc. (a) | 1,825,959 | | 147,099 |
Continental Resources, Inc. (a) | 1,442,492 | | 106,009 |
Cosan Ltd. Class A | 717,237 | | 12,415 |
Energy XXI (Bermuda) Ltd. | 402,745 | | 12,964 |
EOG Resources, Inc. | 5,739,257 | | 693,245 |
HollyFrontier Corp. | 804,200 | | 37,436 |
Madalena Ventures, Inc. (f) | 9,370,500 | | 3,627 |
Marathon Petroleum Corp. | 3,746,629 | | 236,038 |
Murphy Oil Corp. | 1,710,100 | | 101,836 |
Noble Energy, Inc. (e) | 17,484,009 | | 1,778,823 |
Occidental Petroleum Corp. | 1,652,019 | | 126,561 |
PBF Energy, Inc. | 1,142,238 | | 33,182 |
Phillips 66 | 4,262,300 | | 226,328 |
TAG Oil Ltd. (a) | 1,065,143 | | 6,104 |
TAG Oil Ltd. (f) | 1,365,935 | | 7,827 |
Tesoro Corp. | 739,467 | | 32,574 |
Tourmaline Oil Corp. (a) | 6,200,700 | | 194,680 |
Tourmaline Oil Corp. (a)(f) | 1,363,300 | | 42,803 |
TransAtlantic Petroleum Ltd. (a)(f) | 1,734,051 | | 1,439 |
Ultrapar Participacoes SA | 899,500 | | 20,580 |
| | 4,578,156 |
TOTAL ENERGY | | 4,717,891 |
FINANCIALS - 13.3% |
Capital Markets - 0.3% |
Bank of New York Mellon Corp. | 672,000 | | 17,270 |
Common Stocks - continued |
| Shares | | Value (000s) |
FINANCIALS - continued |
Capital Markets - continued |
Charles Schwab Corp. | 997,500 | | $ 14,324 |
Goldman Sachs Group, Inc. | 347,800 | | 44,365 |
Morgan Stanley | 2,406,700 | | 46,016 |
State Street Corp. | 2,594,400 | | 121,963 |
T. Rowe Price Group, Inc. | 275,000 | | 17,911 |
| | 261,849 |
Commercial Banks - 4.3% |
Bank of Ireland (a) | 1,355,755,122 | | 205,718 |
BB&T Corp. | 3,228,700 | | 93,987 |
Fifth Third Bancorp | 3,738,500 | | 56,788 |
HDFC Bank Ltd. sponsored ADR | 769,541 | | 31,336 |
M&T Bank Corp. | 1,785,903 | | 175,858 |
Metro Bank PLC Class A (a)(e)(h) | 2,671,250 | | 43,393 |
PNC Financial Services Group, Inc. | 3,299,592 | | 192,399 |
Royal Bank of Canada | 750,000 | | 45,149 |
U.S. Bancorp | 20,941,329 | | 668,866 |
Wells Fargo & Co. | 62,253,197 | | 2,127,814 |
| | 3,641,308 |
Consumer Finance - 0.9% |
American Express Co. | 9,866,900 | | 567,149 |
Capital One Financial Corp. | 3,071,816 | | 177,950 |
| | 745,099 |
Diversified Financial Services - 0.5% |
Citigroup, Inc. | 4,962,702 | | 196,324 |
JPMorgan Chase & Co. | 4,560,232 | | 200,513 |
Kotak Mahindra Bank Ltd. | 1,183,309 | | 14,141 |
| | 410,978 |
Insurance - 6.0% |
ACE Ltd. | 7,513,600 | | 599,585 |
Admiral Group PLC | 2,127,961 | | 40,535 |
AIA Group Ltd. | 67,215,000 | | 266,597 |
Berkshire Hathaway, Inc. Class A (a) | 22,342 | | 2,995,169 |
Direct Line Insurance Group PLC | 15,998,500 | | 56,633 |
Fairfax Financial Holdings Ltd. (sub. vtg.) | 152,622 | | 55,014 |
Marsh & McLennan Companies, Inc. | 5,108,433 | | 176,088 |
The Chubb Corp. | 7,414,074 | | 558,428 |
The Travelers Companies, Inc. | 4,817,828 | | 346,016 |
| | 5,094,065 |
Common Stocks - continued |
| Shares | | Value (000s) |
FINANCIALS - continued |
Real Estate Investment Trusts - 0.8% |
American Tower Corp. | 8,290,300 | | $ 640,591 |
Real Estate Management & Development - 0.5% |
BR Malls Participacoes SA | 18,058,000 | | 241,164 |
Kennedy-Wilson Holdings, Inc. | 1,402,800 | | 19,611 |
Realogy Holdings Corp. | 2,945,674 | | 123,600 |
| | 384,375 |
TOTAL FINANCIALS | | 11,178,265 |
HEALTH CARE - 11.9% |
Biotechnology - 4.6% |
Aegerion Pharmaceuticals, Inc. (a) | 434,980 | | 11,044 |
Alexion Pharmaceuticals, Inc. (a) | 3,479,760 | | 326,436 |
Amgen, Inc. | 11,755,472 | | 1,014,732 |
ARIAD Pharmaceuticals, Inc. (a) | 2,755,323 | | 52,847 |
Biogen Idec, Inc. (a) | 8,813,400 | | 1,292,661 |
BioMarin Pharmaceutical, Inc. (a) | 1,739,560 | | 85,673 |
Celgene Corp. (a) | 1,992,391 | | 156,841 |
CSL Ltd. | 565,138 | | 31,906 |
Gilead Sciences, Inc. (a) | 6,377,400 | | 468,420 |
Grifols SA ADR | 2,719,557 | | 70,518 |
Intercept Pharmaceuticals, Inc. | 574,200 | | 19,661 |
Medivation, Inc. (a) | 1,337,294 | | 68,416 |
Merrimack Pharmaceuticals, Inc. | 1,976,031 | | 12,034 |
Onyx Pharmaceuticals, Inc. (a) | 546,700 | | 41,292 |
Puma Biotechnology, Inc. | 1,122,700 | | 21,051 |
Regeneron Pharmaceuticals, Inc. (a) | 1,042,983 | | 178,423 |
Rigel Pharmaceuticals, Inc. (a) | 1,093,800 | | 7,110 |
Theravance, Inc. (a) | 700,000 | | 15,589 |
| | 3,874,654 |
Health Care Equipment & Supplies - 1.0% |
Baxter International, Inc. | 2,948,000 | | 196,514 |
Boston Scientific Corp. (a) | 956,300 | | 5,480 |
CareFusion Corp. (a) | 621,900 | | 17,774 |
Covidien PLC | 1,832,700 | | 105,820 |
Cyberonics, Inc. (a) | 713,982 | | 37,505 |
Intuitive Surgical, Inc. (a) | 689,143 | | 337,935 |
Medtronic, Inc. | 1,594,100 | | 65,390 |
Common Stocks - continued |
| Shares | | Value (000s) |
HEALTH CARE - continued |
Health Care Equipment & Supplies - continued |
Stryker Corp. | 949,800 | | $ 52,068 |
Varian Medical Systems, Inc. (a) | 241,600 | | 16,970 |
| | 835,456 |
Health Care Providers & Services - 1.0% |
Acadia Healthcare Co., Inc. (a) | 1,002,300 | | 23,384 |
Catamaran Corp. (a) | 1,750,910 | | 82,485 |
CIGNA Corp. | 1,472,500 | | 78,720 |
DaVita, Inc. (a) | 659,300 | | 72,872 |
Express Scripts Holding Co. (a) | 132,328 | | 7,146 |
Henry Schein, Inc. (a) | 1,014,000 | | 81,586 |
McKesson Corp. | 618,400 | | 59,960 |
UnitedHealth Group, Inc. | 7,756,600 | | 420,718 |
| | 826,871 |
Health Care Technology - 0.7% |
athenahealth, Inc. (a) | 1,371,392 | | 100,729 |
Cerner Corp. (a) | 6,251,149 | | 485,339 |
| | 586,068 |
Life Sciences Tools & Services - 0.6% |
Fluidigm Corp. (a)(h) | 1,027,387 | | 14,702 |
Mettler-Toledo International, Inc. (a)(e) | 2,397,775 | | 463,490 |
PerkinElmer, Inc. | 63,857 | | 2,027 |
Waters Corp. (a) | 691,147 | | 60,213 |
| | 540,432 |
Pharmaceuticals - 4.0% |
Abbott Laboratories | 12,229,755 | | 801,049 |
Allergan, Inc. | 515,462 | | 47,283 |
Bayer AG | 3,969,055 | | 378,496 |
Bristol-Myers Squibb Co. | 1,292,092 | | 42,109 |
Eli Lilly & Co. | 2,981,300 | | 147,038 |
Johnson & Johnson | 6,939,000 | | 486,424 |
Merck & Co., Inc. | 5,472,700 | | 224,052 |
Mylan, Inc. (a) | 2,746,722 | | 75,480 |
Novartis AG sponsored ADR | 974,900 | | 61,711 |
Novo Nordisk A/S Series B | 3,350,581 | | 545,597 |
Perrigo Co. | 2,519,878 | | 262,143 |
Pfizer, Inc. | 3,077,900 | | 77,194 |
Common Stocks - continued |
| Shares | | Value (000s) |
HEALTH CARE - continued |
Pharmaceuticals - continued |
Valeant Pharmaceuticals International, Inc. (Canada) (a) | 815,877 | | $ 48,672 |
Watson Pharmaceuticals, Inc. (a) | 1,966,100 | | 169,085 |
| | 3,366,333 |
TOTAL HEALTH CARE | | 10,029,814 |
INDUSTRIALS - 5.5% |
Aerospace & Defense - 0.1% |
Honeywell International, Inc. | 292,627 | | 18,573 |
United Technologies Corp. | 535,000 | | 43,875 |
| | 62,448 |
Air Freight & Logistics - 0.1% |
C.H. Robinson Worldwide, Inc. | 87,925 | | 5,559 |
FedEx Corp. | 534,021 | | 48,980 |
| | 54,539 |
Building Products - 0.1% |
ASSA ABLOY AB (B Shares) | 265,000 | | 9,975 |
Fortune Brands Home & Security, Inc. (a) | 2,738,000 | | 80,004 |
| | 89,979 |
Commercial Services & Supplies - 0.5% |
ADT Corp. | 2,653,550 | | 123,364 |
Edenred SA | 1,920,381 | | 59,394 |
Stericycle, Inc. (a) | 2,964,008 | | 276,453 |
Swisher Hygiene, Inc. (a) | 6,357,060 | | 10,012 |
| | 469,223 |
Construction & Engineering - 0.0% |
Jacobs Engineering Group, Inc. (a) | 212,500 | | 9,046 |
Electrical Equipment - 0.3% |
AMETEK, Inc. | 240,000 | | 9,017 |
Generac Holdings, Inc. | 288,475 | | 9,898 |
Roper Industries, Inc. | 2,225,714 | | 248,123 |
| | 267,038 |
Industrial Conglomerates - 1.1% |
3M Co. | 1,604,300 | | 148,959 |
Danaher Corp. | 12,189,227 | | 681,378 |
General Electric Co. | 6,066,200 | | 127,330 |
| | 957,667 |
Common Stocks - continued |
| Shares | | Value (000s) |
INDUSTRIALS - continued |
Machinery - 0.5% |
Deere & Co. | 383,200 | | $ 33,116 |
Fanuc Corp. | 274,200 | | 51,015 |
Illinois Tool Works, Inc. | 2,991,310 | | 181,902 |
PACCAR, Inc. | 806,700 | | 36,471 |
Rexnord Corp. | 1,116,700 | | 23,786 |
Snap-On, Inc. | 787,999 | | 62,244 |
Wabtec Corp. | 5,600 | | 490 |
| | 389,024 |
Professional Services - 0.4% |
Bureau Veritas SA | 314,600 | | 35,276 |
Experian PLC | 8,489,202 | | 136,820 |
IHS, Inc. Class A (a) | 275,857 | | 26,482 |
On Assignment, Inc. (a) | 1,287,883 | | 26,118 |
Verisk Analytics, Inc. (a) | 2,177,800 | | 111,068 |
| | 335,764 |
Road & Rail - 1.9% |
Canadian Pacific | 5,933,800 | | 601,911 |
J.B. Hunt Transport Services, Inc. | 1,773,130 | | 105,874 |
Localiza Rent A Car SA | 1,364,500 | | 25,291 |
Union Pacific Corp. | 6,694,454 | | 841,627 |
| | 1,574,703 |
Trading Companies & Distributors - 0.5% |
Air Lease Corp.: | | | |
Class A (a)(f) | 1,624,500 | | 34,927 |
Class A (a) | 4,145,725 | | 89,133 |
Mills Estruturas e Servicos de Engenharia SA | 998,200 | | 16,775 |
MRC Global, Inc. | 330,000 | | 9,167 |
W.W. Grainger, Inc. | 1,424,305 | | 288,237 |
| | 438,239 |
TOTAL INDUSTRIALS | | 4,647,670 |
INFORMATION TECHNOLOGY - 27.9% |
Communications Equipment - 1.2% |
Cisco Systems, Inc. | 2,395,000 | | 47,062 |
Motorola Solutions, Inc. | 3,618,652 | | 201,487 |
Palo Alto Networks, Inc. (d) | 646,200 | | 34,585 |
QUALCOMM, Inc. | 10,987,743 | | 681,460 |
| | 964,594 |
Common Stocks - continued |
| Shares | | Value (000s) |
INFORMATION TECHNOLOGY - continued |
Computers & Peripherals - 7.5% |
3D Systems Corp. (a)(d) | 1,138,500 | | $ 60,739 |
Apple, Inc. | 11,536,558 | | 6,149,339 |
EMC Corp. (a) | 3,348,300 | | 84,712 |
Stratasys Ltd. (a) | 695,381 | | 55,735 |
| | 6,350,525 |
Electronic Equipment & Components - 0.7% |
Amphenol Corp. Class A (e) | 9,418,529 | | 609,379 |
Internet Software & Services - 8.3% |
Akamai Technologies, Inc. (a) | 876,731 | | 35,867 |
Constant Contact, Inc. (a)(d) | 1,038,840 | | 14,762 |
Cornerstone OnDemand, Inc. (a) | 1,906,002 | | 56,284 |
Dropbox, Inc. (h) | 5,464,028 | | 49,445 |
eBay, Inc. (a) | 16,805,428 | | 857,413 |
Equinix, Inc. (a) | 690,600 | | 142,402 |
ExactTarget, Inc. | 1,732,500 | | 34,650 |
Facebook, Inc. Class A | 24,588,325 | | 654,787 |
Google, Inc. Class A (a) | 6,291,877 | | 4,463,269 |
LinkedIn Corp. (a) | 2,244,889 | | 257,758 |
MercadoLibre, Inc. (d) | 479,359 | | 37,663 |
Rackspace Hosting, Inc. (a) | 916,400 | | 68,061 |
Web.com Group, Inc. (a) | 193,103 | | 2,858 |
Yahoo!, Inc. (a) | 17,717,200 | | 352,572 |
| | 7,027,791 |
IT Services - 5.7% |
Accenture PLC Class A | 12,015,464 | | 799,028 |
Alliance Data Systems Corp. (a)(e) | 2,731,011 | | 395,341 |
Cognizant Technology Solutions Corp. Class A (a) | 479,600 | | 35,514 |
Fidelity National Information Services, Inc. | 4,527,299 | | 157,595 |
Fiserv, Inc. (a) | 3,073,955 | | 242,935 |
FleetCor Technologies, Inc. (a) | 812,251 | | 43,577 |
Gartner, Inc. Class A (a) | 362,200 | | 16,668 |
IBM Corp. | 915,236 | | 175,313 |
MasterCard, Inc. Class A | 2,603,058 | | 1,278,830 |
Paychex, Inc. | 253,100 | | 7,882 |
Syntel, Inc. | 28,841 | | 1,546 |
Vantiv, Inc. | 132,971 | | 2,715 |
Visa, Inc. Class A | 10,661,179 | | 1,616,022 |
| | 4,772,966 |
Semiconductors & Semiconductor Equipment - 1.5% |
Analog Devices, Inc. | 601,400 | | 25,295 |
Common Stocks - continued |
| Shares | | Value (000s) |
INFORMATION TECHNOLOGY - continued |
Semiconductors & Semiconductor Equipment - continued |
ARM Holdings PLC sponsored ADR | 12,396,815 | | $ 468,972 |
ASML Holding NV | 1,913,128 | | 123,225 |
Linear Technology Corp. | 245,200 | | 8,410 |
Samsung Electronics Co. Ltd. | 432,470 | | 625,424 |
| | 1,251,326 |
Software - 3.0% |
Activision Blizzard, Inc. | 1,500,000 | | 15,930 |
Allot Communications Ltd. (a)(e) | 2,126,503 | | 37,894 |
Citrix Systems, Inc. (a) | 2,155,800 | | 141,744 |
CommVault Systems, Inc. (a) | 1,039,440 | | 72,459 |
Concur Technologies, Inc. (a)(e) | 3,232,849 | | 218,282 |
FleetMatics Group PLC (e) | 1,751,636 | | 44,071 |
Intuit, Inc. | 7,196,400 | | 428,186 |
Jive Software, Inc. | 436,368 | | 6,340 |
NetSuite, Inc. (a) | 3,464,287 | | 233,147 |
Red Hat, Inc. (a) | 1,713,125 | | 90,727 |
salesforce.com, Inc. (a) | 3,054,135 | | 513,400 |
ServiceNow, Inc. (d) | 2,390,986 | | 71,801 |
SolarWinds, Inc. (a)(e) | 3,934,594 | | 206,369 |
Splunk, Inc. | 1,301,088 | | 37,758 |
Symantec Corp. (a) | 8,309,100 | | 156,294 |
Trion World Network, Inc. warrants 8/10/17 (a)(h) | 124,282 | | 0* |
Ultimate Software Group, Inc. (a) | 614,846 | | 58,048 |
VMware, Inc. Class A (a) | 1,141,600 | | 107,470 |
Workday, Inc. | 1,037,800 | | 56,560 |
Workday, Inc. (h) | 1,223,783 | | 60,027 |
| | 2,556,507 |
TOTAL INFORMATION TECHNOLOGY | | 23,533,088 |
MATERIALS - 5.0% |
Chemicals - 2.5% |
Ashland, Inc. | 1,369,000 | | 110,081 |
CF Industries Holdings, Inc. | 288,207 | | 58,552 |
Eastman Chemical Co. | 1,665,645 | | 113,347 |
Ecolab, Inc. | 3,515,063 | | 252,733 |
Filtrona PLC | 5,747,370 | | 51,689 |
FMC Corp. | 1,111,900 | | 65,068 |
LyondellBasell Industries NV Class A | 2,579,700 | | 147,275 |
Mexichem SAB de CV | 9,078,700 | | 50,646 |
Common Stocks - continued |
| Shares | | Value (000s) |
MATERIALS - continued |
Chemicals - continued |
Monsanto Co. | 5,085,700 | | $ 481,362 |
PPG Industries, Inc. | 1,790,100 | | 242,290 |
Sherwin-Williams Co. | 1,478,900 | | 227,484 |
Syngenta AG (Switzerland) | 319,679 | | 129,146 |
Valspar Corp. | 1,554,500 | | 97,001 |
W.R. Grace & Co. (a) | 925,958 | | 62,252 |
| | 2,088,926 |
Construction Materials - 0.0% |
Eagle Materials, Inc. | 175,958 | | 10,294 |
Containers & Packaging - 0.1% |
Ball Corp. | 1,460,660 | | 65,365 |
Metals & Mining - 2.4% |
Allied Nevada Gold Corp. (Canada) (a) | 731,415 | | 22,118 |
Altius Minerals Corp. (a) | 99,600 | | 973 |
B2Gold Corp. (a)(e) | 31,353,833 | | 112,214 |
B2Gold Corp. (a)(e)(f) | 5,850,000 | | 20,937 |
CGA Mining Ltd. (Canada) (a)(e) | 23,305,900 | | 61,621 |
Continental Gold Ltd. (a) | 1,000,000 | | 8,897 |
Dalradian Resources, Inc. (a) | 52,600 | | 81 |
Dalradian Resources, Inc. (f) | 3,000,000 | | 4,614 |
Eldorado Gold Corp. | 2,523,488 | | 32,473 |
Endeavour Mining Corp. (a) | 12,615,135 | | 26,252 |
Franco-Nevada Corp. (e) | 13,238,600 | | 755,693 |
Franco-Nevada Corp. warrants 6/16/17 (a)(f)(e) | 342,250 | | 3,045 |
Freeport-McMoRan Copper & Gold, Inc. | 2,670,900 | | 91,345 |
Glencore International PLC (d) | 7,667,000 | | 44,291 |
Goldcorp, Inc. | 553,182 | | 20,338 |
Inmet Mining Corp. | 750,000 | | 55,803 |
Ivanplats Ltd. (f) | 4,084,500 | | 20,531 |
Ivanplats Ltd. Class A (h) | 11,992,837 | | 54,255 |
Medusa Mining Ltd. (e) | 12,134,545 | | 69,126 |
New Gold, Inc. (a) | 18,212,164 | | 201,584 |
Newcrest Mining Ltd. | 329,339 | | 7,704 |
Novagold Resources, Inc. (a) | 9,207,377 | | 41,654 |
Premier Gold Mines Ltd. (a)(e) | 7,460,600 | | 31,501 |
Premier Gold Mines Ltd. (e)(f) | 3,850,000 | | 16,256 |
Pretium Resources, Inc. (a) | 2,260,406 | | 29,792 |
Primero Mining Corp. (a) | 1,118,200 | | 7,195 |
Royal Gold, Inc. | 532,944 | | 43,334 |
Tahoe Resources, Inc. (a) | 726,703 | | 13,296 |
Common Stocks - continued |
| Shares | | Value (000s) |
MATERIALS - continued |
Metals & Mining - continued |
Tahoe Resources, Inc. (a)(f) | 5,376,500 | | $ 98,374 |
Teranga Gold Corp. (a) | 292,900 | | 665 |
Turquoise Hill Resources Ltd. (a) | 16,112,294 | | 123,106 |
Yamana Gold, Inc. | 460,300 | | 7,918 |
| | 2,026,986 |
Paper & Forest Products - 0.0% |
International Paper Co. | 1,310,800 | | 52,222 |
TOTAL MATERIALS | | 4,243,793 |
TELECOMMUNICATION SERVICES - 0.1% |
Diversified Telecommunication Services - 0.0% |
inContact, Inc. (a) | 695,315 | | 3,602 |
tw telecom, inc. (a) | 1,303,100 | | 33,190 |
| | 36,792 |
Wireless Telecommunication Services - 0.1% |
Rogers Communications, Inc. Class B (non-vtg.) (d) | 1,112,800 | | 50,522 |
TOTAL TELECOMMUNICATION SERVICES | | 87,314 |
UTILITIES - 0.1% |
Multi-Utilities - 0.1% |
YTL Corp. Bhd | 92,209,226 | | 57,538 |
TOTAL COMMON STOCKS (Cost $53,756,045) |
83,279,373
|
Preferred Stocks - 0.1% |
| | | |
Convertible Preferred Stocks - 0.1% |
CONSUMER DISCRETIONARY - 0.0% |
Media - 0.0% |
Glam Media, Inc. Series M-1: | | | |
8.00% (h) | 1,228,555 | | 6,279 |
8.00% (h) | 87,753 | | 449 |
8.00% (h) | 87,754 | | 449 |
| | 7,177 |
Preferred Stocks - continued |
| Shares | | Value (000s) |
Convertible Preferred Stocks - continued |
HEALTH CARE - 0.1% |
Biotechnology - 0.1% |
bluebird bio (h) | 19,295,922 | | $ 9,615 |
Intarcia Therapeutics, Inc. (h) | 2,100,446 | | 28,629 |
| | 38,244 |
INFORMATION TECHNOLOGY - 0.0% |
Internet Software & Services - 0.0% |
Dropbox, Inc. Series A (h) | 1,260,898 | | 11,410 |
Software - 0.0% |
Trion World Network, Inc.: | | | |
Series C, 8.00% (a)(h) | 3,950,196 | | 16,907 |
Series C-1, 8.00% (a)(h) | 310,705 | | 1,330 |
| | 18,237 |
TOTAL INFORMATION TECHNOLOGY | | 29,647 |
TOTAL CONVERTIBLE PREFERRED STOCKS | | 75,068 |
Nonconvertible Preferred Stocks - 0.0% |
CONSUMER DISCRETIONARY - 0.0% |
Automobiles - 0.0% |
Volkswagen AG | 39,400 | | 9,040 |
TOTAL PREFERRED STOCKS (Cost $107,222) |
84,108
|
Nonconvertible Bonds - 0.0% |
| Principal Amount (000s) | | |
CONSUMER DISCRETIONARY - 0.0% |
Media - 0.0% |
Glam Media, Inc.: | | | | |
9% 11/18/13 (h) | | $ 192 | | 192 |
9% 11/18/13 (h) | | 192 | | 192 |
9% 12/2/13 (h) | | 2,693 | | 2,693 |
| | 3,077 |
TOTAL NONCONVERTIBLE BONDS (Cost $3,077) |
3,077
|
Money Market Funds - 1.5% |
| Shares | | Value (000s) |
Fidelity Cash Central Fund, 0.18% (b) | 1,072,093,617 | | $ 1,072,094 |
Fidelity Securities Lending Cash Central Fund, 0.18% (b)(c) | 218,692,235 | | 218,692 |
TOTAL MONEY MARKET FUNDS (Cost $1,290,786) |
1,290,786
|
TOTAL INVESTMENT PORTFOLIO - 100.3% (Cost $55,157,130) | | 84,657,344 |
NET OTHER ASSETS (LIABILITIES) - (0.3)% | | (244,290) |
NET ASSETS - 100% | $ 84,413,054 |
Legend |
(a) Non-income producing |
(b) Affiliated fund that is available only to investment companies and other accounts managed by Fidelity Investments. The rate quoted is the annualized seven-day yield of the fund at period end. A complete unaudited listing of the fund's holdings as of its most recent quarter end is available upon request. In addition, each Fidelity Central Fund's financial statements, which are not covered by the Fund's Report of Independent Registered Public Accounting Firm, are available on the SEC's website or upon request. |
(c) Investment made with cash collateral received from securities on loan. |
(d) Security or a portion of the security is on loan at period end. |
(e) Affiliated company |
(f) Security exempt from registration under Rule 144A of the Securities Act of 1933. These securities may be resold in transactions exempt from registration, normally to qualified institutional buyers. At the end of the period, the value of these securities amounted to $303,719,000 or 0.4% of net assets. |
(g) Investment is owned by an entity that is treated as a corporation for U.S. tax purposes which is owned by the Fund. |
(h) Restricted securities - Investment in securities not registered under the Securities Act of 1933 (excluding 144A issues). At the end of the period, the value of restricted securities (excluding 144A issues) amounted to $412,101,000 or 0.5% of net assets. |
Additional information on each restricted holding is as follows: |
Security | Acquisition Date | Acquisition Cost (000s) |
bluebird bio | 7/23/12 | $ 9,615 |
Dropbox, Inc. | 5/2/12 | $ 49,445 |
Dropbox, Inc. Series A | 5/29/12 | $ 11,410 |
Fluidigm Corp. | 10/9/07 - 1/6/11 | $ 18,170 |
Glam Media, Inc.: Series M-1, 8.00% | 3/19/08 | $ 25,674 |
9% 11/18/13 | 12/2/11 | $ 385 |
9% 12/2/13 | 12/2/11 | $ 2,693 |
Intarcia Therapeutics, Inc. | 11/14/12 | $ 28,629 |
Ivanplats Ltd. Class A | 10/23/12 | $ 58,082 |
Legend Pictures LLC | 9/23/10 - 12/18/12 | $ 57,827 |
Metro Bank PLC Class A | 12/8/09 - 5/21/12 | $ 37,356 |
Trion World Network, Inc.: warrants 8/10/17 | 8/10/10 | $ 0* |
Series C, 8.00% | 8/22/08 | $ 21,691 |
Series C-1, 8.00% | 8/10/10 | $ 1,706 |
Weinstein Co. Holdings LLC Class A-1 | 10/19/05 | $ 41,234 |
Workday, Inc. | 10/13/11 | $ 16,227 |
* Amount represents less than $1,000. |
Affiliated Central Funds |
Information regarding fiscal year to date income earned by the Fund from investments in Fidelity Central Funds is as follows: |
Fund | Income earned (Amounts in thousands) |
Fidelity Cash Central Fund | $ 5,568 |
Fidelity Securities Lending Cash Central Fund | 7,036 |
Total | $ 12,604 |
Other Affiliated Issuers |
An affiliated company is a company in which the Fund has ownership of at least 5% of the voting securities. Fiscal year to date transactions with companies which are or were affiliates are as follows: |
Affiliate (Amounts in thousands) | Value, beginning of period | Purchases | Sales Proceeds | Dividend Income | Value,
end of
period |
Alliance Data Systems Corp. | $ 156,000 | $ 152,954 | $ - | $ - | $ 395,341 |
Allot Communications Ltd. | - | 53,271 | - | - | 37,894 |
Amphenol Corp. Class A | 506,556 | 70,663 | 159,917 | 4,031 | 609,379 |
athenahealth, Inc. | 45,749 | 131,579 | 81,322 | - | - |
Avion Gold Corp. | 59,448 | - | 3,525 | - | - |
B2Gold Corp. | 83,805 | 15,738 | - | - | 112,214 |
B2Gold Corp. (144A) | 17,807 | - | - | - | 20,937 |
Birchcliff Energy Ltd. | 98,366 | 2,147 | 30,091 | - | - |
CGA Mining Ltd. (Canada) | - | 69,345 | - | - | 61,621 |
Chipotle Mexican Grill, Inc. | 949,372 | 15,256 | 270,305 | - | 603,558 |
Concur Technologies, Inc. | 7,872 | 199,355 | - | - | 218,282 |
Constant Contact, Inc. | 43,052 | 4,177 | 13,860 | - | - |
D.R. Horton, Inc. | 16,324 | 261,450 | - | 3,894 | 323,572 |
Dalradian Resources, Inc. (144A) | - | 5,996 | - | - | - |
Dalradian Resources, Inc. | 7,447 | 301 | 3,586 | - | - |
Discovery Communications, Inc. | 649,586 | 36,705 | 8,325 | - | 1,038,085 |
Dollar Tree, Inc. | 720,888 | - | 549,190 | - | - |
Dunkin' Brands Group, Inc. | 116,194 | 71,943 | - | 4,243 | 237,154 |
Affiliate (Amounts in thousands) | Value, beginning of period | Purchases | Sales Proceeds | Dividend Income | Value,
end of
period |
FleetMatics Group PLC | $ - | $ 36,670 | $ - | $ - | $ 44,071 |
Franco-Nevada Corp. | 435,254 | 80,668 | - | 5,846 | 755,693 |
Franco-Nevada Corp. warrants 6/16/17 | 1,916 | - | - | - | 3,045 |
Informatica Corp. | 202,710 | 18,843 | 185,402 | - | - |
LogMeIn, Inc. | 53,513 | 7,642 | 55,721 | - | - |
Medusa Mining Ltd. | 56,958 | 2,539 | 5,083 | 743 | 69,126 |
Metro Bank PLC Class A | 11,513 | 16,046 | - | - | 43,393 |
Mettler-Toledo International, Inc. | 470,560 | 20,574 | 147,152 | - | 463,490 |
Noble Energy, Inc. | 1,613,053 | 38,831 | - | 15,837 | 1,778,823 |
Premier Gold Mines Ltd. | - | 36,186 | - | - | 31,501 |
Premier Gold Mines Ltd. (144A) | - | 22,255 | - | - | 16,256 |
Pretium Resources, Inc. | 23,735 | 49,215 | 38,896 | - | - |
Quality Systems, Inc. | 111,601 | - | 112,490 | 365 | - |
SolarWinds, Inc. | 68,594 | 90,482 | 17,325 | - | 206,369 |
Tim Hortons, Inc. (Canada) | 589,796 | 8,572 | 51,636 | 8,583 | 550,631 |
TJX Companies, Inc. | 1,245,690 | 32,080 | 168,815 | 16,238 | - |
TreeHouse Foods, Inc. | 232,324 | - | 192,392 | - | - |
Total | $ 8,595,683 | $ 1,551,483 | $ 2,095,033 | $ 59,780 | $ 7,620,435 |
Other Information |
The following is a summary of the inputs used, as of December 31, 2012, involving the Fund's assets and liabilities carried at fair value. The inputs or methodology used for valuing securities may not be an indication of the risk associated with investing in those securities. For more information on valuation inputs, and their aggregation into the levels used in the tables below, please refer to the Investment Valuation section in the accompanying Notes to Financial Statements. |
Valuation Inputs at Reporting Date: |
Description
(Amounts in thousands) | Total | Level 1 | Level 2 | Level 3 |
Investments in Securities: | | | | |
Equities: | | | | |
Consumer Discretionary | $ 16,920,524 | $ 16,419,924 | $ 381,289 | $ 119,311 |
Consumer Staples | 7,879,693 | 7,607,592 | 272,101 | - |
Energy | 4,717,891 | 4,697,311 | 20,580 | - |
Financials | 11,178,265 | 10,310,084 | 824,788 | 43,393 |
Health Care | 10,068,058 | 9,073,815 | 955,999 | 38,244 |
Industrials | 4,647,670 | 4,303,112 | 344,558 | - |
Information Technology | 23,562,735 | 22,798,192 | 685,451 | 79,092 |
Materials | 4,243,793 | 3,887,582 | 356,211 | - |
Telecommunication Services | 87,314 | 87,314 | - | - |
Utilities | 57,538 | - | 57,538 | - |
Corporate Bonds | 3,077 | - | - | 3,077 |
Money Market Funds | 1,290,786 | 1,290,786 | - | - |
Total Investments in Securities: | $ 84,657,344 | $ 80,475,712 | $ 3,898,515 | $ 283,117 |
The following is a summary of transfers between Level 1 and Level 2 for the period ended December 31, 2012. Transfers are assumed to have occurred at the beginning of the period, and are primarily attributable to the valuation techniques used for foreign equity securities, as discussed in the accompanying Notes to Financial Statements: |
Transfers | Total (000s) |
Level 1 to Level 2 | $ 2,162,575 |
Level 2 to Level 1 | $ 0 |
Distribution of investments by country or territory of incorporation, as a percentage of total net assets, is as follows. (Unaudited) |
United States of America | 87.1% |
Canada | 4.3% |
Ireland | 1.3% |
United Kingdom | 1.1% |
Others (Individually Less Than 1%) | 6.2% |
| 100.0% |
See accompanying notes which are an integral part of the financial statements.
Annual Report
Statement of Assets and Liabilities
Amounts in thousands (except per-share amounts) | December 31, 2012 |
Assets | | |
Investment in securities, at value (including securities loaned of $217,066) - See accompanying schedule: Unaffiliated issuers (cost $49,560,948) | $ 75,746,123 | |
Fidelity Central Funds (cost $1,290,786) | 1,290,786 | |
Other affiliated issuers (cost $4,305,396) | 7,620,435 | |
Total Investments (cost $55,157,130) | | $ 84,657,344 |
Foreign currency held at value (cost $4) | | 4 |
Receivable for investments sold
Regular delivery | | 76,044 |
Delayed delivery | | 46,629 |
Receivable for fund shares sold | | 111,314 |
Dividends receivable | | 39,991 |
Interest receivable | | 299 |
Distributions receivable from Fidelity Central Funds | | 855 |
Prepaid expenses | | 247 |
Other receivables | | 5,388 |
Total assets | | 84,938,115 |
| | |
Liabilities | | |
Payable for investments purchased | $ 16,897 | |
Payable for fund shares redeemed | 239,185 | |
Accrued management fee | 38,347 | |
Other affiliated payables | 9,352 | |
Other payables and accrued expenses | 2,588 | |
Collateral on securities loaned, at value | 218,692 | |
Total liabilities | | 525,061 |
| | |
Net Assets | | $ 84,413,054 |
Net Assets consist of: | | |
Paid in capital | | $ 54,849,832 |
Accumulated net investment loss | | (55,075) |
Accumulated undistributed net realized gain (loss) on investments and foreign currency transactions | | 118,074 |
Net unrealized appreciation (depreciation) on investments and assets and liabilities in foreign currencies | | 29,500,223 |
Net Assets | | $ 84,413,054 |
Contrafund:
Net Asset Value, offering price and redemption price per share ($58,768,570 ÷ 757,635 shares) | | $ 77.57 |
| | |
Class K:
Net Asset Value, offering price and redemption price per share ($25,644,484 ÷ 330,856 shares) | | $ 77.51 |
See accompanying notes which are an integral part of the financial statements.
Annual Report
Statement of Operations
Amounts in thousands | Year ended December 31, 2012 |
| | |
Investment Income | | |
Dividends (including $59,780 earned from other affiliated issuers) | | $ 915,969 |
Interest | | 3,978 |
Income from Fidelity Central Funds | | 12,604 |
Total income | | 932,551 |
| | |
Expenses | | |
Management fee
Basic fee | $ 457,846 | |
Performance adjustment | 9,256 | |
Transfer agent fees | 109,411 | |
Accounting and security lending fees | 3,060 | |
Custodian fees and expenses | 1,608 | |
Independent trustees' compensation | 543 | |
Appreciation in deferred trustee compensation account | 1 | |
Registration fees | 782 | |
Audit | 281 | |
Legal | 302 | |
Interest | 1 | |
Miscellaneous | 787 | |
Total expenses before reductions | 583,878 | |
Expense reductions | (4,541) | 579,337 |
Net investment income (loss) | | 353,214 |
Realized and Unrealized Gain (Loss) Net realized gain (loss) on: | | |
Investment securities: | | |
Unaffiliated issuers | 4,665,254 | |
Other affiliated issuers | 736,647 | |
Foreign currency transactions | (191) | |
Total net realized gain (loss) | | 5,401,710 |
Change in net unrealized appreciation (depreciation) on: Investment securities | 6,122,591 | |
Assets and liabilities in foreign currencies | 113 | |
Total change in net unrealized appreciation (depreciation) | | 6,122,704 |
Net gain (loss) | | 11,524,414 |
Net increase (decrease) in net assets resulting from operations | | $ 11,877,628 |
See accompanying notes which are an integral part of the financial statements.
Annual Report
Financial Statements - continued
Statement of Changes in Net Assets
Amounts in thousands | Year ended
December 31, 2012 | Year ended
December 31, 2011 |
Increase (Decrease) in Net Assets | | |
Operations | | |
Net investment income (loss) | $ 353,214 | $ 62,576 |
Net realized gain (loss) | 5,401,710 | 1,303,553 |
Change in net unrealized appreciation (depreciation) | 6,122,704 | (1,484,727) |
Net increase (decrease) in net assets resulting
from operations | 11,877,628 | (118,598) |
Distributions to shareholders from net investment income | (234,540) | (63,685) |
Distributions to shareholders from net realized gain | (699,796) | (166,900) |
Total distributions | (934,336) | (230,585) |
Share transactions - net increase (decrease) | 745,692 | (1,458,848) |
Total increase (decrease) in net assets | 11,688,984 | (1,808,031) |
| | |
Net Assets | | |
Beginning of period | 72,724,070 | 74,532,101 |
End of period (including accumulated net investment loss of $55,075 and accumulated net investment loss of $119,976, respectively) | $ 84,413,054 | $ 72,724,070 |
See accompanying notes which are an integral part of the financial statements.
Annual Report
Financial Highlights - Contrafund
Years ended December 31, | 2012 | 2011 | 2010 | 2009 | 2008 |
Selected Per-Share Data | | | | | |
Net asset value, beginning of period | $ 67.45 | $ 67.73 | $ 58.28 | $ 45.26 | $ 73.11 |
Income from Investment Operations | | | | | |
Net investment income (loss) B | .30 | .04 | (.02) | .11 | .23 |
Net realized and unrealized gain (loss) | 10.66 | (.13) | 9.86 | 13.11 | (27.22) |
Total from investment operations | 10.96 | (.09) | 9.84 | 13.22 | (26.99) |
Distributions from net investment income | (.19) G | (.04) | (.01) | (.11) | (.21) |
Distributions from net realized gain | (.65) G | (.15) | (.38) | (.09) | (.65) |
Total distributions | (.84) | (.19) | (.39) | (.20) F | (.86) |
Net asset value, end of period | $ 77.57 | $ 67.45 | $ 67.73 | $ 58.28 | $ 45.26 |
Total Return A | 16.26% | (.14)% | 16.93% | 29.23% | (37.16)% |
Ratios to Average Net Assets C,E | | | | | |
Expenses before reductions | .74% | .81% | .92% | 1.02% | .95% |
Expenses net of fee waivers, if any | .74% | .81% | .92% | 1.02% | .95% |
Expenses net of all reductions | .74% | .81% | .91% | 1.01% | .94% |
Net investment income (loss) | .40% | .06% | (.03)% | .22% | .37% |
Supplemental Data | | | | | |
Net assets, end of period (in millions) | $ 58,769 | $ 54,677 | $ 60,498 | $ 57,225 | $ 45,149 |
Portfolio turnover rate D | 48% | 55% | 46% | 58% | 78% |
A Total returns would have been lower if certain expenses had not been reduced during the applicable periods shown.
B Calculated based on average shares outstanding during the period.
C Fees and expenses of any underlying Fidelity Central Funds are not included in the Fund's expense ratio. The Fund indirectly bears its proportionate share of the expenses of any underlying Fidelity Central Funds.
D Amount does not include the portfolio activity of any underlying Fidelity Central Funds.
E Expense ratios reflect operating expenses of the class. Expenses before reductions do not reflect amounts reimbursed by the investment adviser or reductions from brokerage service arrangements or reductions from other expense offset arrangements and do not represent the amount paid by the class during periods when reimbursements or reductions occur. Expenses net of fee waivers reflect expenses after reimbursement by the investment adviser but prior to reductions from brokerage service arrangements or other expense offset arrangements. Expenses net of all reductions represent the net expenses paid by the class.
F Total distributions of $.20 per share is comprised of distributions from net investment income of $.113 and distributions from net realized gain of $.085 per share.
G The amount shown reflects certain reclassifications related to book to tax differences.
See accompanying notes which are an integral part of the financial statements.
Annual Report
Financial Highlights - Class K
Years ended December 31, | 2012 | 2011 | 2010 | 2009 | 2008 G |
Selected Per-Share Data | | | | | |
Net asset value, beginning of period | $ 67.40 | $ 67.70 | $ 58.25 | $ 45.23 | $ 68.59 |
Income from Investment Operations | | | | | |
Net investment income (loss) D | .39 | .12 | .06 | .19 | .22 |
Net realized and unrealized gain (loss) | 10.65 | (.14) | 9.87 | 13.11 | (23.30) |
Total from investment operations | 11.04 | (.02) | 9.93 | 13.30 | (23.08) |
Distributions from net investment income | (.28) J | (.13) | (.01) | (.20) | (.28) |
Distributions from net realized gain | (.65) J | (.15) | (.47) | (.09) | - |
Total distributions | (.93) | (.28) | (.48) | (.28) I | (.28) |
Net asset value, end of period | $ 77.51 | $ 67.40 | $ 67.70 | $ 58.25 | $ 45.23 |
Total Return B,C | 16.40% | (.02)% | 17.09% | 29.43% | (33.63)% |
Ratios to Average Net Assets E,H | | | | | |
Expenses before reductions | .63% | .69% | .79% | .86% | .82% A |
Expenses net of fee waivers, if any | .63% | .69% | .79% | .86% | .82% A |
Expenses net of all reductions | .62% | .69% | .78% | .85% | .82% A |
Net investment income (loss) | .51% | .18% | .10% | .38% | .75% A |
Supplemental Data | | | | | |
Net assets, end of period (in millions) | $ 25,644 | $ 18,047 | $ 14,034 | $ 6,749 | $ 3,301 |
Portfolio turnover rate F | 48% | 55% | 46% | 58% | 78% |
A Annualized
B Total returns for periods of less than one year are not annualized.
C Total returns would have been lower if certain expenses had not been reduced during the applicable periods shown.
D Calculated based on average shares outstanding during the period.
E Fees and expenses of any underlying Fidelity Central Funds are not included in the Fund's expense ratio. The Fund indirectly bears its proportionate share of the expenses of any underlying Fidelity Central Funds.
F Amount does not include the portfolio activity of any underlying Fidelity Central Funds.
G For the period May 9, 2008 (commencement of sale of shares) to December 31, 2008.
H Expense ratios reflect operating expenses of the class. Expenses before reductions do not reflect amounts reimbursed by the investment adviser or reductions from brokerage service arrangements or reductions from other expense offset arrangements and do not represent the amount paid by the class during periods when reimbursements or reductions occur. Expense ratios before reductions for start-up periods may not be representative of longer-term operating periods. Expenses net of fee waivers reflect expenses after reimbursement by the investment adviser but prior to reductions from brokerage service arrangements or other expense offset arrangements. Expenses net of all reductions represent the net expenses paid by the class.
I Total distributions of $.28 per share is comprised of distributions from net investment income of $.196 and distributions from net realized gain of $.085 per share.
J The amount shown reflects certain reclassifications related to book to tax differences.
See accompanying notes which are an integral part of the financial statements.
Annual Report
Notes to Financial Statements
For the period ended December 31, 2012
(Amounts in thousands except percentages)
1. Organization.
Fidelity® Contrafund® (the Fund) is a fund of Fidelity Contrafund (the Trust) and is authorized to issue an unlimited number of shares. The Trust is registered under the Investment Company Act of 1940, as amended (the 1940 Act), as an open-end management investment company organized as a Massachusetts business trust. The Fund offers Contrafund and Class K shares, each of which has equal rights as to assets and voting privileges. Each class has exclusive voting rights with respect to matters that affect that class. Investment income, realized and unrealized capital gains and losses, the common expenses of the Fund, and certain fund-level expense reductions, if any, are allocated on a pro-rata basis to each class based on the relative net assets of each class to the total net assets of the Fund. Each class differs with respect to transfer agent fees incurred. Certain expense reductions may also differ by class.
2. Investments in Fidelity Central Funds.
The Fund invests in Fidelity Central Funds, which are open-end investment companies available only to other investment companies and accounts managed by Fidelity Management & Research Company (FMR) and its affiliates. The Fund's Schedule of Investments lists each of the Fidelity Central Funds held as of period end, if any, as an investment of the Fund, but does not include the underlying holdings of each Fidelity Central Fund. As an Investing Fund, the Fund indirectly bears its proportionate share of the expenses of the underlying Fidelity Central Funds.
The Money Market Central Funds seek preservation of capital and current income and are managed by Fidelity Investments Money Management, Inc. (FIMM), an affiliate of FMR.
A complete unaudited list of holdings for each Fidelity Central Fund is available upon request or at the Securities and Exchange Commission (the SEC) website at www.sec.gov. In addition, the financial statements of the Fidelity Central Funds, which are not covered by the Fund's Report of Independent Registered Public Accounting Firm, are available on the SEC website or upon request.
3. Significant Accounting Policies.
The financial statements have been prepared in conformity with accounting principles generally accepted in the United States of America (GAAP), which require management to make certain estimates and assumptions at the date of the financial statements. Actual results could differ from those estimates. Subsequent events, if any, through the date that the financial statements were issued have been evaluated in the preparation of the financial statements. The following summarizes the significant accounting policies of the Fund:
Annual Report
Notes to Financial Statements - continued
(Amounts in thousands except percentages)
3. Significant Accounting Policies - continued
Investment Valuation. Investments are valued as of 4:00 p.m. Eastern time on the last calendar day of the period. In accordance with valuation policies and procedures approved by the Board of Trustees (the Board), the Fund attempts to obtain prices from one or more third party pricing vendors or brokers to value its investments. When current market prices, quotations or rates are not readily available or reliable, investments will be fair valued in good faith by the FMR Fair Value Committee (the Committee), in accordance with procedures adopted by the Fund's Board. Factors used in determining fair value vary by investment type and may include market or investment specific events, changes in interest rates and credit quality. The frequency with which these procedures are used cannot be predicted and they may be utilized to a significant extent. The Committee oversees the Fund's valuation policies and procedures and is responsible for approving and reporting to the Board all fair value determinations.
The Fund categorizes the inputs to valuation techniques used to value its investments into a disclosure hierarchy consisting of three levels as shown below:
Level 1 - quoted prices in active markets for identical investments
Level 2 - other significant observable inputs (including quoted prices for similar investments, interest rates, prepayment speeds, etc.)
Level 3 - unobservable inputs (including the Fund's own assumptions based on the best information available)
Valuation techniques used to value the Fund's investments by major category are as follows:
Equity securities, including restricted securities, for which market quotations are readily available, are valued at the last reported sale price or official closing price as reported by a third party pricing vendor on the primary market or exchange on which they are traded and are categorized as Level 1 in the hierarchy. In the event there were no sales during the day or closing prices are not available, securities are valued at the last quoted bid price or may be valued using the last available price and are generally categorized as Level 2 in the hierarchy. For foreign equity securities, when significant market or security specific events arise, comparisons to the valuation of American Depositary Receipts (ADRs), futures contracts, Exchange-Traded Funds (ETFs) and certain indexes as well as quoted prices for similar securities are used and are categorized as Level 2 in the hierarchy. Utilizing these techniques may result in transfers between Level 1 and Level 2. For restricted equity securities and private placements where observable inputs are limited, assumptions about market activity and risk are used and these securities are generally categorized as Level 3 in the hierarchy.
Annual Report
3. Significant Accounting Policies - continued
Investment Valuation - continued
Debt securities, including restricted securities, are valued based on evaluated prices received from third party pricing vendors or from brokers who make markets in such securities. For corporate bonds, pricing vendors utilize matrix pricing which considers yield or price of bonds of comparable quality, coupon, maturity and type as well as broker-supplied prices and are generally categorized as Level 2 in the hierarchy. When independent prices are unavailable or unreliable, debt securities may be valued utilizing pricing methodologies which consider similar factors that would be used by third party pricing vendors. These are generally categorized as Level 2 in the hierarchy but may be Level 3 depending on the circumstances.
Investments in open-end mutual funds, including the Fidelity Central Funds, are valued at their closing net asset value (NAV) each business day and are categorized as Level 1 in the hierarchy.
Changes in valuation techniques may result in transfers in or out of an assigned level within the disclosure hierarchy. The aggregate value of investments by input level, as of December 31, 2012, including information on transfers between Levels 1 and 2, is included at the end of the Fund's Schedule of Investments.
Foreign Currency. The Fund may use foreign currency contracts to facilitate transactions in foreign-denominated securities. Gains and losses from these transactions may arise from changes in the value of the foreign currency or if the counterparties do not perform under the contracts' terms.
Foreign-denominated assets, including investment securities, and liabilities are translated into U.S. dollars at the exchange rates at period end. Purchases and sales of investment securities, income and dividends received and expenses denominated in foreign currencies are translated into U.S. dollars at the exchange rate in effect on the transaction date.
The effects of exchange rate fluctuations on investments are included with the net realized and unrealized gain (loss) on investment securities. Other foreign currency transactions resulting in realized and unrealized gain (loss) are disclosed separately.
Investment Transactions and Income. For financial reporting purposes, the Fund's investment holdings and NAV include trades executed through the end of the last business day of the period. The NAV per share for processing shareholder transactions is calculated as of the close of business of the New York Stock Exchange (NYSE), normally 4:00 p.m. Eastern time and includes trades executed through the end of the prior business day. Gains and losses on securities sold are determined on the basis of identified
Annual Report
Notes to Financial Statements - continued
(Amounts in thousands except percentages)
3. Significant Accounting Policies - continued
Investment Transactions and Income - continued
cost and may include proceeds received from litigation. Dividend income is recorded on the ex-dividend date, except for certain dividends from foreign securities where the ex-dividend date may have passed, which are recorded as soon as the Fund is informed of the ex-dividend date. Non-cash dividends included in dividend income, if any, are recorded at the fair market value of the securities received. Distributions received on securities that represent a return of capital or capital gain are recorded as a reduction of cost of investments and/or as a realized gain. The Fund estimates the components of distributions received that may be considered return of capital distributions or capital gain distributions. Interest income and distributions from the Fidelity Central Funds are accrued as earned. Interest income includes coupon interest and amortization of premium and accretion of discount on debt securities. Investment income is recorded net of foreign taxes withheld where recovery of such taxes is uncertain.
Expenses. Expenses directly attributable to a fund are charged to that fund. Expenses attributable to more than one fund are allocated among the respective funds on the basis of relative net assets or other appropriate methods. Expense estimates are accrued in the period to which they relate and adjustments are made when actual amounts are known.
Deferred Trustee Compensation. Under a Deferred Compensation Plan (the Plan), independent Trustees may elect to defer receipt of a portion of their annual compensation. Deferred amounts are invested in a cross-section of Fidelity funds, are marked-to-market and remain in the Fund until distributed in accordance with the Plan. The investment of deferred amounts and the offsetting payable to the Trustees are included in the accompanying Statement of Assets and Liabilities.
Income Tax Information and Distributions to Shareholders. Each year, the Fund intends to qualify as a regulated investment company under Subchapter M of the Internal Revenue Code, including distributing substantially all of its taxable income and realized gains. As a result, no provision for income taxes is required. As of December 31, 2012, the Fund did not have any unrecognized tax benefits in the financial statements; nor is the Fund aware of any tax positions for which it is reasonably possible that the total amounts of unrecognized tax benefits will significantly change in the next twelve months. The Fund files a U.S. federal tax return, in addition to state and local tax returns as required. A fund's federal income tax returns are subject to examination by the Internal Revenue Service (IRS) for a period of three fiscal years after they are filed. State and local tax returns may be subject to examination for an additional fiscal year depending on the jurisdiction. Foreign taxes are provided for based on the Fund's understanding of the tax rules and rates that exist in the foreign markets in which it invests.
Annual Report
3. Significant Accounting Policies - continued
Income Tax Information and Distributions to Shareholders - continued
Distributions are declared and recorded on the ex-dividend date. Income dividends and capital gain distributions are declared separately for each class. Income and capital gain distributions are determined in accordance with income tax regulations, which may differ from GAAP. These differences resulted in distribution reclassifications. In addition, the Fund claimed a portion of the payment made to redeeming shareholders as a distribution for income tax purposes.
Capital accounts within the financial statements are adjusted for permanent book-tax differences. These adjustments have no impact on net assets or the results of operations. Temporary book-tax differences will reverse in a subsequent period.
Book-tax differences are primarily due to foreign currency transactions, passive foreign investment companies (PFIC), market discount, contingent interest, partnerships, deferred trustees compensation, capital loss carryforwards, and losses deferred due to wash sales and excise tax regulations.
Gross unrealized appreciation | $ 29,503,162 |
Gross unrealized depreciation | (697,425) |
Net unrealized appreciation (depreciation) on securities and other investments | $ 28,805,737 |
| |
Tax Cost | $ 55,851,607 |
The tax-based components of distributable earnings as of period end were as follows:
Undistributed long-term capital gain | $ 812,550 |
Net unrealized appreciation (depreciation) | $ 28,805,746 |
The tax character of distributions paid was as follows:
| December 31, 2012 | December 31, 2011 |
Ordinary Income | $ 554,101 | $ 230,585 |
Long-term Capital Gains | 380,235 | - |
Total | $ 934,336 | $ 230,585 |
Delayed Delivery Transactions and When-Issued Securities. During the period, the Fund transacted in securities on a delayed delivery or when-issued basis. Payment and delivery may take place after the customary settlement period for that security. The price of the underlying securities and the date when the securities will be delivered and paid for are fixed at the time the transaction is negotiated. The Fund may receive compensation for interest forgone in the purchase of a delayed delivery or when-issued security. With respect to purchase commitments, the Fund identifies securities as
Annual Report
Notes to Financial Statements - continued
(Amounts in thousands except percentages)
3. Significant Accounting Policies - continued
Delayed Delivery Transactions and When-Issued Securities - continued
segregated in its records with a value at least equal to the amount of the commitment. Losses may arise due to changes in the value of the underlying securities or if the counterparty does not perform under the contract's terms, or if the issuer does not issue the securities due to political, economic, or other factors.
Restricted Securities. The Fund may invest in securities that are subject to legal or contractual restrictions on resale. These securities generally may be resold in transactions exempt from registration or to the public if the securities are registered. Disposal of these securities may involve time-consuming negotiations and expense, and prompt sale at an acceptable price may be difficult. Information regarding restricted securities is included at the end of the Fund's Schedule of Investments.
4. Purchases and Sales of Investments.
Purchases and sales of securities, other than short-term securities, aggregated $40,097,395 and $37,941,922, respectively.
5. Fees and Other Transactions with Affiliates.
Management Fee. FMR and its affiliates provide the Fund with investment management related services for which the Fund pays a monthly management fee. The management fee is the sum of an individual fund fee rate that is based on an annual rate of .30% of the Fund's average net assets and an annualized group fee rate that averaged .26% during the period. The group fee rate is based upon the average net assets of all the mutual funds advised by FMR. The group fee rate decreases as assets under management increase and increases as assets under management decrease. In addition, the management fee is subject to a performance adjustment (up to a maximum of ± .20% of the Fund's average net assets over a 36 month performance period). The upward or downward adjustment to the management fee is based on the relative investment performance of Contrafund as compared to an appropriate benchmark index. For the period, the total annual management fee rate, including the performance adjustment, was .57% of the Fund's average net assets.
Transfer Agent Fees. Fidelity Investments Institutional Operations Company, Inc. (FIIOC), an affiliate of FMR, is the transfer, dividend disbursing and shareholder servicing agent for each class of the Fund. FIIOC receives account fees and asset-based fees that vary according to the account size and type of account of the shareholders of Contrafund. FIIOC receives an asset-based fee of Class K's average net assets. FIIOC pays for typesetting, printing and mailing of shareholder reports, except proxy statements. For the period, transfer agent fees for each class were as follows:
Annual Report
5. Fees and Other Transactions with Affiliates - continued
Transfer Agent Fees - continued
| Amount | % of
Average
Net Assets |
Contrafund | $ 97,722 | .17 |
Class K | 11,689 | .05 |
| $ 109,411 | |
Accounting and Security Lending Fees. Fidelity Service Company, Inc. (FSC), an affiliate of FMR, maintains the Fund's accounting records. The accounting fee is based on the level of average net assets for each month. Under a separate contract, FSC administers the security lending program. The security lending fee is based on the number and duration of lending transactions.
Brokerage Commissions. The Fund placed a portion of its portfolio transactions with brokerage firms which are affiliates of the investment adviser. The commissions paid to these affiliated firms were $560 for the period.
Interfund Lending Program. Pursuant to an Exemptive Order issued by the SEC, the Fund, along with other registered investment companies having management contracts with FMR, may participate in an interfund lending program. This program provides an alternative credit facility allowing the funds to borrow from, or lend money to, other participating affiliated funds. At period end, there were no interfund loans outstanding. The Fund's activity in this program during the period for which loans were outstanding was as follows:
Borrower or Lender | Average Loan
Balance | Weighted Average Interest Rate | Interest
Expense |
Borrower | $ 62,618 | .48% | $ 1 |
6. Committed Line of Credit.
The Fund participates with other funds managed by FMR or an affiliate in a $4.25 billion credit facility (the "line of credit") to be utilized for temporary or emergency purposes to fund shareholder redemptions or for other short-term liquidity purposes. The Fund has agreed to pay commitment fees on its pro-rata portion of the line of credit, which amounted to $217 and is reflected in Miscellaneous expenses on the Statement of Operations. During the period, there were no borrowings on this line of credit.
Annual Report
Notes to Financial Statements - continued
(Amounts in thousands except percentages)
7. Security Lending.
The Fund lends portfolio securities through a lending agent from time to time in order to earn additional income. For equity securities, a lending agent is used and may loan securities to certain qualified borrowers, including Fidelity Capital Markets (FCM), a broker-dealer affiliated with the Fund. On the settlement date of the loan, the Fund receives collateral (in the form of U.S. Treasury obligations, letters of credit and/or cash) against the loaned securities and maintains collateral in an amount not less than 100% of the market value of the loaned securities during the period of the loan. The market value of the loaned securities is determined at the close of business of the Fund and any additional required collateral is delivered to the Fund on the next business day. If the borrower defaults on its obligation to return the securities loaned because of insolvency or other reasons, a fund could experience delays and costs in recovering the securities loaned or in gaining access to the collateral. Any cash collateral received is invested in the Fidelity Securities Lending Cash Central Fund. The value of loaned securities and cash collateral at period end are disclosed on the Fund's Statement of Assets and Liabilities. The value of securities loaned to FCM at period end was $9,894. Security lending income represents the income earned on investing cash collateral, less rebates paid to borrowers and any lending agent fees associated with the loan, plus any premium payments received for lending certain types of securities. Security lending income is presented in the Statement of Operations as a component of income from Fidelity Central Funds. Total security lending income during the period amounted to $7,036, including $220 from securities loaned to FCM.
8. Bank Borrowings.
The Fund is permitted to have bank borrowings for temporary or emergency purposes to fund shareholder redemptions or for other short-term liquidity requirements. The Fund has established borrowing arrangements with certain banks. The interest rate on the borrowings is the bank's base rate, as revised from time to time. The average loan balance during the period for which loans were outstanding amounted to $7,356. The weighted average interest rate was .65%. The interest expense amounted to one hundred thirty-three dollars under the bank borrowing program. At period end, there were no bank borrowings outstanding.
9. Expense Reductions.
Many of the brokers with whom FMR places trades on behalf of the Fund provided services to the Fund in addition to trade execution. These services included payments of certain expenses on behalf of the Fund totaling $4,539 for the period. In addition, through arrangements with the Fund's custodian, credits realized as a result of uninvested cash balances were used to reduce the Fund's expenses. During the period, these credits reduced the Fund's custody expenses by $2.
Annual Report
10. Distributions to Shareholders.
Distributions to shareholders of each class were as follows:
Years ended December 31, | 2012 | 2011 |
From net investment income | | |
Contrafund | $ 142,141 | $ 28,410 |
Class K | 92,399 | 35,275 |
Total | $ 234,540 | $ 63,685 |
From net realized gain | | |
Contrafund | $ 488,008 | $ 130,522 |
Class K | 211,788 | 36,378 |
Total | $ 699,796 | $ 166,900 |
11. Share Transactions.
Transactions for each class of shares were as follows:
| Shares | Dollars |
Years ended December 31, | 2012 | 2011 | 2012 | 2011 |
Contrafund | | | | |
Shares sold | 111,368 | 136,499 | $ 8,438,526 | $ 9,377,328 |
Reinvestment of distributions | 7,912 | 2,271 | 607,022 | 153,775 |
Shares redeemed | (172,284) | (221,335) | (12,991,518) | (15,103,275) |
Net increase (decrease) | (53,004) | (82,565) | $ (3,945,970) | $ (5,572,172) |
Class K | | | | |
Shares sold | 117,840 | 113,775 | $ 8,818,893 | $ 7,765,531 |
Reinvestment of distributions | 3,969 | 1,073 | 304,187 | 71,653 |
Shares redeemed | (58,709) | (54,389) | (4,431,418) | (3,723,860) |
Net increase (decrease) | 63,100 | 60,459 | $ 4,691,662 | $ 4,113,324 |
12. Other.
The Fund's organizational documents provide former and current trustees and officers with a limited indemnification against liabilities arising in connection with the performance of their duties to the Fund. In the normal course of business, the Fund may also enter into contracts that provide general indemnifications. The Fund's maximum exposure under these arrangements is unknown as this would be dependent on future claims that may be made against the Fund. The risk of material loss from such claims is considered remote.
Annual Report
To the Trustees of Fidelity Contrafund and the Shareholders of Fidelity Contrafund:
In our opinion, the accompanying statement of assets and liabilities, including the schedule of investments, and the related statements of operations and of changes in net assets and the financial highlights present fairly, in all material respects, the financial position of Fidelity Contrafund (a fund of Fidelity Contrafund) at December 31, 2012, the results of its operations for the year then ended, the changes in its net assets for each of the two years in the period then ended and the financial highlights for each of the five years in the period then ended, in conformity with accounting principles generally accepted in the United States of America. These financial statements and financial highlights (hereafter referred to as "financial statements") are the responsibility of the Fidelity Contrafund's management. Our responsibility is to express an opinion on these financial statements based on our audits. We conducted our audits of these financial statements in accordance with the standards of the Public Company Accounting Oversight Board (United States). Those standards require that we plan and perform the audit to obtain reasonable assurance about whether the financial statements are free of material misstatement. An audit includes examining, on a test basis, evidence supporting the amounts and disclosures in the financial statements, assessing the accounting principles used and significant estimates made by management, and evaluating the overall financial statement presentation. We believe that our audits, which included confirmation of securities at December 31, 2012 by correspondence with the custodian and brokers, provide a reasonable basis for our opinion.
PricewaterhouseCoopers LLP
Boston, Massachusetts
February 12, 2013
Annual Report
The Trustees, Members of the Advisory Board, and executive officers of the trust and fund, as applicable, are listed below. The Board of Trustees governs the fund and is responsible for protecting the interests of shareholders. The Trustees are experienced executives who meet periodically throughout the year to oversee the fund's activities, review contractual arrangements with companies that provide services to the fund, oversee management of the risks associated with such activities and contractual arrangements, and review the fund's performance. Except for James C. Curvey, each of the Trustees oversees 234 funds advised by FMR or an affiliate. Mr. Curvey oversees 452 funds advised by FMR or an affiliate.
The Trustees hold office without limit in time except that (a) any Trustee may resign; (b) any Trustee may be removed by written instrument, signed by at least two-thirds of the number of Trustees prior to such removal; (c) any Trustee who requests to be retired or who has become incapacitated by illness or injury may be retired by written instrument signed by a majority of the other Trustees; and (d) any Trustee may be removed at any special meeting of shareholders by a two-thirds vote of the outstanding voting securities of the trust. Each Trustee who is not an interested person (as defined in the 1940 Act) (Independent Trustee), shall retire not later than the last day of the calendar year in which his or her 75th birthday occurs. The Independent Trustees may waive this mandatory retirement age policy with respect to individual Trustees. The executive officers and Advisory Board Members hold office without limit in time, except that any officer and Advisory Board Member may resign or may be removed by a vote of a majority of the Trustees at any regular meeting or any special meeting of the Trustees. Except as indicated, each individual has held the office shown or other offices in the same company for the past five years.
Experience, Skills, Attributes, and Qualifications of the Fund's Trustees. The Governance and Nominating Committee has adopted a statement of policy that describes the experience, qualifications, attributes, and skills that are necessary and desirable for potential Independent Trustee candidates (Statement of Policy). The Board believes that each Trustee satisfied at the time he or she was initially elected or appointed a Trustee, and continues to satisfy, the standards contemplated by the Statement of Policy. The Governance and Nominating Committee also engages professional search firms to help identify potential Independent Trustee candidates who have the experience, qualifications, attributes, and skills consistent with the Statement of Policy. From time to time, additional criteria based on the composition and skills of the current Independent Trustees, as well as experience or skills that may be appropriate in light of future changes to board composition, business conditions, and regulatory or other developments, have also been considered by the professional search firms and the Governance and Nominating Committee. In addition, the Board takes into account the Trustees' commitment and participation in Board and committee meetings, as well as their leadership of standing and ad hoc committees throughout their tenure.
In determining that a particular Trustee was and continues to be qualified to serve as a Trustee, the Board has considered a variety of criteria, none of which, in isolation, was controlling. The Board believes that, collectively, the Trustees have balanced and diverse experience, qualifications, attributes, and skills, which allow the Board to operate effectively in governing the fund and protecting the interests of shareholders. Information about the specific experience, skills, attributes, and qualifications of each Trustee, which in each case led to the Board's conclusion that the Trustee should serve (or continue to serve) as a trustee of the fund, is provided below.
Annual Report
Board Structure and Oversight Function. James C. Curvey is an interested person (as defined in the 1940 Act) and currently serves as Chairman. The Trustees have determined that an interested Chairman is appropriate and benefits shareholders because an interested Chairman has a personal and professional stake in the quality and continuity of services provided to the fund. Independent Trustees exercise their informed business judgment to appoint an individual of their choosing to serve as Chairman, regardless of whether the Trustee happens to be independent or a member of management. The Independent Trustees have determined that they can act independently and effectively without having an Independent Trustee serve as Chairman and that a key structural component for assuring that they are in a position to do so is for the Independent Trustees to constitute a substantial majority for the Board. The Independent Trustees also regularly meet in executive session. Ned C. Lautenbach serves as Chairman of the Independent Trustees and as such (i) acts as a liaison between the Independent Trustees and management with respect to matters important to the Independent Trustees and (ii) with management prepares agendas for Board meetings.
Fidelity funds are overseen by different Boards of Trustees. The fund's Board oversees Fidelity's equity and high income funds and another Board oversees Fidelity's investment-grade bond, money market, and asset allocation funds. The asset allocation funds may invest in Fidelity funds overseen by the fund's Board. The use of separate Boards, each with its own committee structure, allows the Trustees of each group of Fidelity funds to focus on the unique issues of the funds they oversee, including common research, investment, and operational issues. On occasion, the separate Boards establish joint committees to address issues of overlapping consequences for the Fidelity funds overseen by each Board.
The Trustees operate using a system of committees to facilitate the timely and efficient consideration of all matters of importance to the Trustees, the fund, and fund shareholders and to facilitate compliance with legal and regulatory requirements and oversight of the fund's activities and associated risks. The Board, acting through its committees, has charged FMR and its affiliates with (i) identifying events or circumstances the occurrence of which could have demonstrably adverse effects on the fund's business and/or reputation; (ii) implementing processes and controls to lessen the possibility that such events or circumstances occur or to mitigate the effects of such events or circumstances if they do occur; and (iii) creating and maintaining a system designed to evaluate continuously business and market conditions in order to facilitate the identification and implementation processes described in (i) and (ii) above. Because the day-to-day operations and activities of the fund are carried out by or through FMR, its affiliates and other service providers, the fund's exposure to risks is mitigated but not eliminated by the processes overseen by the Trustees. While each of the Board's committees has responsibility for overseeing different aspects of the fund's activities, oversight is exercised primarily through the Operations, Audit, and Compliance Committees. In addition, the Independent Trustees have worked with FMR to enhance the Board's oversight of investment and financial risks, legal and regulatory risks, technology risks, and operational risks, including the development of additional risk reporting to the Board. For example, a working group comprised of Independent Trustees and FMR has worked and continues to work to review the Fidelity funds' valuation-related activities, reporting and risk management. Appropriate personnel, including but not limited to the fund's Chief Compliance Officer (CCO), FMR's internal auditor, the independent accountants, the fund's Treasurer and portfolio management personnel, make periodic reports to the Board's committees, as appropriate, including an annual review of FMR's risk management program for the Fidelity funds. The responsibilities of each standing committee, including their oversight responsibilities, are described further under "Standing Committees of the Fund's Trustees."
Annual Report
Trustees and Officers - continued
The fund's Statement of Additional Information (SAI) includes more information about the Trustees. To request a free copy, call Fidelity at 1-800-835-5092.
Interested Trustees*:
Correspondence intended for each Trustee who is an interested person may be sent to Fidelity Investments, 82 Devonshire Street, Boston, Massachusetts 02109.
Name, Age; Principal Occupations and Other Relevant Experience+ |
James C. Curvey (77) |
| Year of Election or Appointment: 2007 Mr. Curvey is Trustee and Chairman of the Board of Trustees of certain Trusts. Mr. Curvey also serves as Trustee (2007-present) of other investment companies advised by FMR. Mr. Curvey is a Director of Fidelity Investments Money Management, Inc. (2009-present), Director of Fidelity Research & Analysis Co. (2009-present) and Director of FMR and FMR Co., Inc. (2007-present). Mr. Curvey is also Vice Chairman (2007-present) and Director of FMR LLC. In addition, Mr. Curvey serves as an Overseer for the Boston Symphony Orchestra and a member of the Trustees of Villanova University. Previously, Mr. Curvey was the Vice Chairman (2006-2007) and Director (2000-2007) of FMR Corp. |
Ronald P. O'Hanley (55) |
| Year of Election or Appointment: 2011 Mr. O'Hanley is Director of FMR Co., Inc. (2010-present), Director of Fidelity Investments Money Management, Inc. (2010-present), Director of Fidelity Research & Analysis Company (2010-present), President of Fidelity Asset Management and Corporate Services and a member of Fidelity's Executive Committee (2010-present). Previously, Mr. O'Hanley served as President and Chief Executive Officer of BNY Mellon Asset Management (2007-2010). Mr. O'Hanley also served as Vice Chairman of Bank New York Mellon Corp. and a member of that firm's Executive Committee. Prior to the 2007 merger of The Bank of New York and Mellon Financial Corporation, he was Vice Chairman of Mellon Financial Corporation and President and Chief Executive Officer of Mellon Asset Management. He joined Mellon in February 1997. Mr. O'Hanley currently serves as Chairman of the Boston Public Library Foundation Board of Directors and sits on the Board of Directors of Beth Israel Deaconess Medical Center, the Board of Trustees of the Marine Biological Laboratory and the Advisory Board of the Maxwell School of Citizenship and Public Administration at Syracuse University. Mr. O'Hanley also chairs the Council on Asset Management for the Financial Services Roundtable and is a member of the Board of Directors of Institutional Investor's U.S. Institute. |
* Trustees have been determined to be "Interested Trustees" by virtue of, among other things, their affiliation with the trust or various entities under common control with FMR.
+ The information above includes each Trustee's principal occupation during the last five years and other information relating to the experience, attributes, and skills relevant to each Trustee's qualifications to serve as a Trustee, which led to the conclusion that each Trustee should serve as a Trustee for the fund.
Annual Report
Trustees and Officers - continued
Independent Trustees:
Correspondence intended for each Independent Trustee (that is, the Trustees other than the Interested Trustees) may be sent to Fidelity Investments, P.O. Box 55235, Boston, Massachusetts 02205-5235.
Name, Age; Principal Occupations and Other Relevant Experience+ |
Dennis J. Dirks (64) |
| Year of Election or Appointment: 2005 Prior to his retirement in May 2003, Mr. Dirks was Chief Operating Officer and a member of the Board of The Depository Trust & Clearing Corporation (DTCC). He also served as President, Chief Operating Officer, and Board member of The Depository Trust Company (DTC) and President and Board member of the National Securities Clearing Corporation (NSCC). In addition, Mr. Dirks served as Chief Executive Officer and Board member of the Government Securities Clearing Corporation, Chief Executive Officer and Board member of the Mortgage-Backed Securities Clearing Corporation, as a Trustee and a member of the Finance Committee of Manhattan College (2005-2008), and as a Trustee and a member of the Finance Committee of AHRC of Nassau County (2006-2008). Mr. Dirks is a member of the Independent Directors Council (IDC) Governing Council (2010-present) and Board of Directors for The Brookville Center for Children's Services, Inc. (2009-present). |
Alan J. Lacy (59) |
| Year of Election or Appointment: 2008 Mr. Lacy serves as Senior Adviser (2007-present) of Oak Hill Capital Partners, L.P. (private equity). Mr. Lacy also served as Chief Executive Officer (2000-2005) and Vice Chairman (2005-2006) of Sears Holdings Corporation and Sears, Roebuck and Co. (retail). In addition, Mr. Lacy serves as a member of the Board of Directors of Dave & Buster's Entertainment, Inc. (restaurant and entertainment complexes, 2010-present), Earth Fare, Inc. (retail grocery, 2012-present), The Hillman Companies, Inc. (hardware wholesalers, 2010-present), and Bristol-Myers Squibb Company (global pharmaceuticals, 2008-present). Mr. Lacy is a member of the Board of Trustees of The National Parks Conservation Association (2006-present). Previously, Mr. Lacy served as Chairman of the Board of Trustees of the National Parks Conservation Association (2008-2011) and as a member of the Board of Directors for the Western Union Company (global money transfer, 2006-2011). |
Ned C. Lautenbach (68) |
| Year of Election or Appointment: 2000 Mr. Lautenbach is Chairman of the Independent Trustees of the Equity and High Income Funds (2006-present). Mr. Lautenbach currently serves as the Lead Director of the Eaton Corporation Board of Directors (diversified industrial, 1997-present). Mr. Lautenbach is Chairman of the Board of Directors of the Philharmonic Center for the Arts in Naples, Florida (2012-present) and a member of the Council on Foreign Relations (1994-present). Previously, Mr. Lautenbach was a Partner/Advisory Partner at Clayton, Dubilier & Rice, LLC (private equity investment, 1998-2010), as well as a Director of Sony Corporation (2006-2007). |
Joseph Mauriello (68) |
| Year of Election or Appointment: 2008 Prior to his retirement in January 2006, Mr. Mauriello served in numerous senior management positions including Deputy Chairman and Chief Operating Officer (2004-2005), and Vice Chairman of Financial Services (2002-2004) of KPMG LLP US (professional services, 1965-2005). Mr. Mauriello currently serves as a member of the Board of Directors of XL Group plc. (global insurance and re-insurance, 2006-present). Previously, Mr. Mauriello served as a Director of the Hamilton Funds of the Bank of New York (2006-2007) and of Arcadia Resources Inc. (health care services and products, 2007-2012). |
Robert W. Selander (62) |
| Year of Election or Appointment: 2011 Previously, Mr. Selander served as a Member of the Advisory Board of Fidelity's Equity and High Income Funds (2011), Executive Vice Chairman (2010), Chief Executive Officer (2009-2010), and President and Chief Executive Officer (1997-2009) of Mastercard, Inc. |
Cornelia M. Small (68) |
| Year of Election or Appointment: 2005 Ms. Small is a member of the Board of Directors (2009-present) and Chair of the Investment Committee (2010-present) of the Teagle Foundation. Ms. Small also serves on the Investment Committee of the Berkshire Taconic Community Foundation (2008-present). Previously, Ms. Small served as Chairperson (2002-2008) and a member of the Investment Committee and Chairperson (2008-2012) and a member of the Board of Trustees of Smith College. In addition, Ms. Small served as Chief Investment Officer, Director of Global Equity Investments, and a member of the Board of Directors of Scudder, Stevens & Clark and Scudder Kemper Investments. |
William S. Stavropoulos (73) |
| Year of Election or Appointment: 2001 Mr. Stavropoulos is Vice Chairman of the Independent Trustees of the Equity and High Income Funds (2006-present). Mr. Stavropoulos serves as President and Founder of the Michigan Baseball Foundation, the Great Lakes Loons (2007-present). Mr. Stavropoulos is Chairman Emeritus of the Board of Directors of The Dow Chemical Company, where he previously served in numerous senior management positions, including President, CEO (1995-2000; 2002-2004), Chairman of the Executive Committee (2000-2006), and as a member of the Board of Directors (1990-2006). Currently, Mr. Stavropoulos is a Director of Univar Inc. (global distributor of commodity and specialty chemicals, Chairman from 2010-May 2012 and Lead Director from May 2012-present), Teradata Corporation (data warehousing and technology solutions, 2008-present), Maersk Inc. (industrial conglomerate), and Tyco International, Ltd. (multinational manufacturing and services, 2007-present), and a member of the Advisory Board for Metalmark Capital LLC (private equity investment, 2005-present). Mr. Stavropoulos is an operating advisor to Clayton, Dubilier & Rice, LLC (private equity investment). In addition, Mr. Stavropoulos is a member of the University of Notre Dame Advisory Council for the College of Science, a Trustee of the Rollin L. Gerstacker Foundation, and a Director of the Naples Philharmonic Center for the Arts. Previously, Mr. Stavropoulos served as a Director of Chemical Financial Corporation (bank holding company, 1993-2012). |
David M. Thomas (63) |
| Year of Election or Appointment: 2008 Previously, Mr. Thomas served as Executive Chairman (2005-2006) and Chairman and Chief Executive Officer (2000-2005) of IMS Health, Inc. (pharmaceutical and healthcare information solutions), and a Director of Fortune Brands, Inc. (consumer products, 2000-2011). In addition, Mr. Thomas serves as Non-Executive Chairman of the Board of Directors of Fortune Brands Home and Security (home and security products, 2011-present), and as a member of the Board of Directors of Interpublic Group of Companies, Inc. (marketing communication, 2004-present). |
Michael E. Wiley (62) |
| Year of Election or Appointment: 2008 Mr. Wiley also serves as a Director of Asia Pacific Exploration Consolidated (international oil and gas exploration and production, 2008-present). Mr. Wiley serves as a Director of Tesoro Corporation (independent oil refiner and marketer, 2005-present), and a Director of Bill Barrett Corporation (exploration and production, 2005-present). In addition, Mr. Wiley also serves as a Director of Post Oak Bank (privately-held bank, 2004-present). Previously, Mr. Wiley served as a member of the Board of Trustees of the University of Tulsa (2000-2006; 2007-2010), as a Senior Energy Advisor of Katzenbach Partners, LLC (consulting, 2006-2007), as an Advisory Director of Riverstone Holdings (private investment), Chairman, President, and CEO of Baker Hughes, Inc. (oilfield services, 2000-2004), and as Director of Spinnaker Exploration Company (exploration and production, 2001-2005). |
+ The information above includes each Trustee's principal occupation during the last five years and other information relating to the experience, attributes, and skills relevant to each Trustee's qualifications to serve as a Trustee, which led to the conclusion that each Trustee should serve as a Trustee for the fund.
Advisory Board Members and Executive Officers:
Correspondence intended for David A. Rosow and Garnett A. Smith may be sent to Fidelity Investments, P.O. Box 55235, Boston, Massachusetts 02205-5235. Correspondence intended for each executive officer and Peter S. Lynch may be sent to Fidelity Investments, 82 Devonshire Street, Boston, Massachusetts 02109.
Name, Age; Principal Occupation |
Peter S. Lynch (68) |
| Year of Election or Appointment: 2003 Member of the Advisory Board of Fidelity's Equity and High Income Funds. Mr. Lynch is Vice Chairman and a Director of FMR and FMR Co., Inc. In addition, Mr. Lynch serves as a Trustee of Boston College and as the Chairman of the Inner-City Scholarship Fund. Previously, Mr. Lynch served on the Special Olympics International Board of Directors (1997-2006). |
David A. Rosow (70) |
| Year of Election or Appointment: 2012 Member of the Advisory Board of Fidelity's Equity and High Income Funds. Chairman and Chief Executive Officer of International Golf Group, Inc. (golf course development, 1989-present). Previously, Mr. Rosow served as Chairman and Chief Executive Officer of Rosow & Company, Inc. (private investment company, 1989-2011), a Lead Director of Hudson United Bancorp (2001-2006) and as a Director of TD Banknorth (1996-2006). In addition, Mr. Rosow is a member (2008-present) and President (2009-present) of the Town Council of Palm Beach, Florida. |
Garnett A. Smith (65) |
| Year of Election or Appointment: 2012 Member of the Advisory Board of Fidelity's Equity and High Income Funds. Prior to Mr. Smith's retirement, he served as Chairman and Chief Executive Officer of Inbrand Corp. (manufacturer of personal absorbent products, 1990-1997). He also served as President (1986-1990) of Inbrand Corp. Prior to his employment with Inbrand Corp., he was employed by a retail fabric chain and North Carolina National Bank. In addition, Mr. Smith is a board member of the Jackson Hole Land Trust (2009-present). |
Kenneth B. Robins (43) |
| Year of Election or Appointment: 2008 President and Treasurer of Fidelity's Equity and High Income Funds. Mr. Robins also serves as President and Treasurer (2010-present) and Assistant Treasurer (2009-present) of other Fidelity funds and is an employee of Fidelity Investments (2004-present). Previously, Mr. Robins served as Deputy Treasurer of the Fidelity funds (2005-2008) and Treasurer and Chief Financial Officer of The North Carolina Capital Management Trust: Cash and Term Portfolios (2006-2008). |
Bruce T. Herring (47) |
| Year of Election or Appointment: 2006 Vice President of certain Equity Funds. Mr. Herring also serves as President of Fidelity Research & Analysis Company (2010-present), Chief Investment Officer and Director of Fidelity Management & Research (U.K.) Inc. (2010-present) and Group Chief Investment Officer of FMR. Previously, Mr. Herring served as Vice President (2005-2006) and Senior Vice President (2006-2007) of Fidelity Management & Research Company, Vice President of FMR Co., Inc. (2001-2007) and as a portfolio manager for Fidelity U.S. Equity Funds. |
Brian B. Hogan (48) |
| Year of Election or Appointment: 2009 Vice President of Equity and High Income Funds. Mr. Hogan also serves as President of FMR's Equity Division (2009-present). Previously, Mr. Hogan served as Senior Vice President, Equity Research of FMR (2006-2009) and as a portfolio manager. |
Scott C. Goebel (44) |
| Year of Election or Appointment: 2008 Secretary and Chief Legal Officer (CLO) of the Fidelity funds. Mr. Goebel also serves as Secretary of Fidelity Investments Money Management, Inc. (FIMM) (2010-present) and Fidelity Research and Analysis Company (FRAC) (2010-present); Secretary and CLO of The North Carolina Capital Management Trust: Cash and Term Portfolios (2008-present); General Counsel, Secretary, and Senior Vice President of FMR (2008-present) and FMR Co., Inc. (2008-present); employed by FMR LLC or an affiliate (2001-present); Chief Legal Officer of Fidelity Management & Research (Hong Kong) Limited (2008-present) and Assistant Secretary of Fidelity Management & Research (Japan) Inc. (2008-present), and Fidelity Management & Research (U.K.) Inc. (2008-present). Previously, Mr. Goebel served as Assistant Secretary of FIMM (2008-2010), FRAC (2008-2010), and the Funds (2007-2008) and as Vice President and Secretary of Fidelity Distributors Corporation (FDC) (2005-2007). |
William C. Coffey (43) |
| Year of Election or Appointment: 2009 Assistant Secretary of Fidelity's Equity and High Income Funds. Mr. Coffey also serves as Senior Vice President and Deputy General Counsel of FMR LLC (2010-present), and is an employee of Fidelity Investments. Previously, Mr. Coffey served as Vice President and Associate General Counsel of FMR LLC (2005-2009). |
Elizabeth Paige Baumann (44) |
| Year of Election or Appointment: 2012 Anti-Money Laundering (AML) Officer of the Fidelity funds. Ms. Baumann also serves as AML Officer of The North Carolina Capital Management Trust: Cash and Term Portfolios (2012-present), Chief AML Officer of FMR LLC (2012-present), and is an employee of Fidelity Investments. Previously, Ms. Baumann served as Vice President and Deputy Anti-Money Laundering Officer (2007-2012). |
Christine Reynolds (54) |
| Year of Election or Appointment: 2008 Chief Financial Officer of the Fidelity funds. Ms. Reynolds became President of Fidelity Pricing and Cash Management Services (FPCMS) in August 2008. Ms. Reynolds served as Chief Operating Officer of FPCMS (2007-2008). Previously, Ms. Reynolds served as President, Treasurer, and Anti-Money Laundering officer of the Fidelity funds (2004-2007). |
Joseph A. Hanlon (44) |
| Year of Election or Appointment: 2012 Chief Compliance Officer of Fidelity's Equity and High Income Funds. Mr. Hanlon serves as Compliance Officer of FMR, FMR Co., Inc., Fidelity Investments Money Management, Inc. (FIMM), Fidelity Research and Analysis Company (FRAC), Fidelity Management & Research (Japan) Inc., Fidelity Management & Research (U.K.) Inc., Fidelity Management & Research (Hong Kong), and Strategic Advisers, Inc. (2009-present), as Senior Vice President of the Fidelity Asset Management Division (2009-present), and is an employee of Fidelity Investments. |
Joseph F. Zambello (55) |
| Year of Election or Appointment: 2011 Deputy Treasurer of the Fidelity funds. Mr. Zambello is an employee of Fidelity Investments. Previously, Mr. Zambello served as Vice President of FMR's Program Management Group (2009-2011) and Vice President of the Transfer Agent Oversight Group (2005-2009). |
Adrien E. Deberghes (45) |
| Year of Election or Appointment: 2008 Deputy Treasurer of Fidelity's Equity and High Income Funds. Mr. Deberghes also serves as Vice President (2011-present) and Assistant Treasurer (2010-present) of other Fidelity funds, and is an employee of Fidelity Investments (2008-present). Previously, Mr. Deberghes served as Senior Vice President of Mutual Fund Administration at State Street Corporation (2007-2008), Senior Director of Mutual Fund Administration at Investors Bank & Trust (2005-2007), and Director of Finance for Dunkin' Brands (2000-2005). |
Stephen Sadoski (41) |
| Year of Election or Appointment: 2012 Deputy Treasurer of Fidelity's Equity and High Income Funds. Mr. Sadoski also serves as Deputy Treasurer of other Fidelity funds (2013-present) and is an employee of Fidelity Investments (2012-present). Previously, Mr. Sadoski served as Assistant Treasurer of Fidelity's Fixed Income and Asset Allocation Funds (2012-2013), an assistant chief accountant in the Division of Investment Management of the Securities and Exchange Commission (SEC) (2009-2012) and as a senior manager at Deloitte & Touche (1997-2009). |
Stacie Smith (38) |
| Year of Election or Appointment: 2013 Deputy Treasurer of Fidelity's Equity and High Income Funds. Ms. Smith is an employee of Fidelity Investments (2009-present). Previously, Ms. Smith served as Senior Audit Manager of Ernst & Young LLP (1996-2009). |
Stephanie J. Dorsey (43) |
| Year of Election or Appointment: 2010 Assistant Treasurer of Fidelity's Equity and High Income Funds. Ms. Dorsey also serves as President and Treasurer (2013-present) and Assistant Treasurer (2012-present) of other Fidelity funds and is an employee of Fidelity Investments (2008-present). Previously, Ms. Dorsey served as Deputy Treasurer of Fidelity's Fixed Income and Asset Allocation Funds (2008-2013), Treasurer (2004-2008) of the JPMorgan Mutual Funds and Vice President (2004-2008) of JPMorgan Chase Bank. |
John R. Hebble (54) |
| Year of Election or Appointment: 2009 Assistant Treasurer of Fidelity's Equity and High Income Funds. Mr. Hebble also serves as President (2011-present), Treasurer, and Chief Financial Officer of The North Carolina Capital Management Trust: Cash and Term Portfolios (2008-present) and is an employee of Fidelity Investments. Previously, Mr. Hebble served as President and Treasurer of Fidelity's Fixed Income and Asset Allocation Funds (2008-2013). |
Gary W. Ryan (54) |
| Year of Election or Appointment: 2005 Assistant Treasurer of the Fidelity funds. Mr. Ryan is an employee of Fidelity Investments. Previously, Mr. Ryan served as Vice President of Fund Reporting in Fidelity Pricing and Cash Management Services (FPCMS) (1999-2005). |
Jonathan Davis (44) |
| Year of Election or Appointment: 2010 Assistant Treasurer of the Fidelity funds. Mr. Davis is also Assistant Treasurer of Fidelity Rutland Square Trust II and Fidelity Commonwealth Trust II. Mr. Davis is an employee of Fidelity Investments. Previously, Mr. Davis served as Vice President and Associate General Counsel of FMR LLC (2003-2010). |
Annual Report
The Board of Trustees of Contrafund voted to pay shareholders of record at the opening of business on record date, the following distributions per share derived from capital gains realized from sales of portfolio securities:
| Pay Date | Record Date | Capital Gains |
Class K | 02/11/13 | 02/08/13 | $0.745 |
The fund hereby designates as a capital gain dividend with respect to the taxable year ended December 31, 2012, $1,235,123,803, or, if subsequently determined to be different, the net capital gain of such year.
Class K designates 100% of the dividends distributed during the fiscal year as qualifying for the dividends-received deduction for corporate shareholders.
Class K designates 100% of the dividends distributed during the fiscal year as amounts which may be taken into account as a dividend for the purposes of the maximum rate under section 1(h)(11) of the Internal Revenue Code.
The fund will notify shareholders in January 2013 of amounts for use in preparing 2012 income tax returns.
Annual Report
Board Approval of Investment Advisory Contracts and Management Fees
Fidelity Contrafund
Each year, the Board of Trustees, including the Independent Trustees (together, the Board), votes on the renewal of the management contract and sub-advisory agreements (together, the Advisory Contracts) for the fund. The Board, assisted by the advice of fund counsel and Independent Trustees' counsel, requests and considers a broad range of information relevant to the renewal of the Advisory Contracts throughout the year.
The Board meets regularly and, at each of its meetings, considers factors that are relevant to its annual consideration of the renewal of the fund's Advisory Contracts, including the services and support provided to the fund and its shareholders. The Board has established various standing committees, each composed of and chaired by Independent Trustees with varying backgrounds, to which the Board has assigned specific subject matter responsibilities in order to enhance effective decision-making by the Board. The Board, acting directly and through its Committees, requests and receives information concerning the annual consideration of the renewal of the fund's Advisory Contracts. The Board also meets as needed to consider matters specifically related to the Board's annual consideration of the renewal of Advisory Contracts. Members of the Board may also meet with trustees of other Fidelity funds through ad hoc joint committees to discuss certain matters relevant to the Fidelity funds.
At its July 2012 meeting, the Board of Trustees, including the Independent Trustees, unanimously determined to renew the fund's Advisory Contracts. In reaching its determination, the Board considered all factors it believed relevant, including (i) the nature, extent, and quality of the services to be provided to the fund and its shareholders (including the investment performance of the fund); (ii) the competitiveness of the fund's management fee and total expense ratio relative to peer funds; (iii) the total costs of the services to be provided by and the profits to be realized by Fidelity from its relationship with the fund; (iv) the extent to which economies of scale exist and would be realized as the fund grows; and (v) whether fee levels reflect these economies of scale, if any, for the benefit of fund shareholders.
In considering whether to renew the Advisory Contracts for the fund, the Board reached a determination, with the assistance of fund counsel and Independent Trustees' counsel and through the exercise of its business judgment, that the renewal of the Advisory Contracts is in the best interests of the fund and its shareholders and that the compensation payable under the Advisory Contracts is fair and reasonable. The Board's decision to renew the Advisory Contracts was not based on any single factor, but rather was based on a comprehensive consideration of all the information provided to the Board at its meetings throughout the year. The Board, in reaching its determination to renew the Advisory Contracts, is aware that shareholders in the fund have a broad range of investment choices available to them, including a wide choice among mutual funds offered by Fidelity's competitors, and that the fund's shareholders, who have the opportunity to review and weigh the disclosure provided by the fund in its prospectus and other public disclosures, have chosen to invest in this fund, managed by Fidelity.
Annual Report
Nature, Extent, and Quality of Services Provided. The Board considered the staffing within the investment adviser, FMR, and the sub-advisers (together, the Investment Advisers), including the backgrounds of the fund's investment personnel, and also considered the fund's investment objective, strategies, and related investment philosophy. The Independent Trustees also had discussions with senior management of Fidelity's investment operations and investment groups. The Board considered the structure of the portfolio manager compensation program and whether this structure provides appropriate incentives to act in the best interests of the fund.
Resources Dedicated to Investment Management and Support Services. The Board and the Fund Oversight and Research Committees reviewed the general qualifications and capabilities of the Investment Advisers' investment staff, including its size, education, experience, and resources, as well as the Investment Advisers' approach to recruiting, training, managing, and compensating investment personnel. The Board also noted that FMR has continued to increase the resources devoted to non-U.S. offices, including expansion of Fidelity's global investment organization. The Board noted that Fidelity's analysts have extensive resources, tools and capabilities that allow them to conduct sophisticated quantitative and fundamental analysis, as well as credit analysis of issuers, counterparties and guarantors. The Board also believes that Fidelity's investment professionals have sufficient access to global information and data so as to provide competitive investment results over time, and that those professionals also have access to sophisticated tools that permit them to assess portfolio construction and risk and performance attribution characteristics continuously, as well as to transmit new information and research conclusions rapidly around the world. Additionally, in its deliberations, the Board considered the Investment Advisers' trading and risk management capabilities and resources, which are an integral part of the investment management process.
Shareholder and Administrative Services. The Board considered (i) the nature, extent, quality, and cost of advisory, administrative, and shareholder services performed by the Investment Advisers and their affiliates under the Advisory Contracts and under separate agreements covering transfer agency, pricing and bookkeeping, and securities lending services for the fund; (ii) the nature and extent of the supervision of third party service providers, principally custodians and subcustodians; and (iii) the resources devoted to, and the record of compliance with, the fund's compliance policies and procedures. The Board also reviewed the allocation of fund brokerage, including allocations to brokers affiliated with the Investment Advisers, the use of brokerage commissions to pay fund expenses, and the use of "soft" commission dollars to pay for research services.
Annual Report
Board Approval of Investment Advisory Contracts and
Management Fees - continued
The Board noted that the growth of fund assets over time across the complex allows Fidelity to reinvest in the development of services designed to enhance the value or convenience of the Fidelity funds as investment vehicles. These services include 24-hour access to account information and market information through telephone representatives and over the Internet, investor education materials and asset allocation tools, and the expanded availability of Fidelity Investor Centers.
Investment in a Large Fund Family. The Board considered the benefits to shareholders of investing in a Fidelity fund, including the benefits of investing in a fund that is part of a large family of funds offering a variety of investment disciplines and providing a large variety of mutual fund investor services. The Board noted that Fidelity had taken, or had made recommendations that resulted in the Fidelity funds taking, a number of actions over the previous year that benefited particular funds, including (i) continuing to dedicate additional resources to investment research and support of the senior management team that oversees asset management; (ii) persisting in efforts to enhance Fidelity's research capabilities, in particular, international research; (iii) launching new funds and making other enhancements to meet client needs for global and income-oriented solutions; (iv) continuing to launch dedicated lower cost underlying funds to meet investment management's portfolio construction needs related to expanding underlying fund options, specifically for the Freedom Fund product lines; (v) adopting a "Stock Selector" sector neutral investment approach and employing a team of portfolio managers who are sector specialists to manage certain funds; (vi) rationalizing product lines and gaining increased efficiencies through the mergers of several funds into other funds; (vii) strengthening the Spartan Index Fund product line by adding new funds and/or new low-cost institutional share classes, restructuring fund expenses to accommodate new classes, and reducing investment minimums for certain classes of shares; (viii) modifying the eligibility criteria for Institutional Class shares to increase their appeal to government entities and charitable investors; and (ix) reducing certain transfer agent fee rates.
Investment Performance. The Board considered whether the fund has operated in accordance with its investment objective, as well as its record of compliance with its investment restrictions. It also reviewed the fund's absolute investment performance for each class, as well as the fund's relative investment performance for each class measured over multiple periods against (i) a broad-based securities market index, and (ii) a custom peer group of mutual funds deemed appropriate by Fidelity and reviewed by the Board. The following charts considered by the Board show, over the one-, three-, and five-year periods ended December 31, 2011, as available, the cumulative total returns of Class K and the retail class of the fund, the cumulative total returns of a broad-based securities market index ("benchmark"), and a range of cumulative total returns of a custom peer group of mutual funds defined by FMR based on categories assigned by Morningstar, Inc. The box within each chart shows the 25th percentile return (top of box) and the 75th percentile return (bottom of box) of the peer group. Returns shown above the box are in the first quartile and returns shown below the box are in the fourth quartile. The percentage beaten numbers noted below each chart correspond to the percentile box and represent the percentage of funds in the peer group whose performance was equal to or lower than that of the class indicated. The fund's custom peer group, defined by FMR, is a peer group that FMR believes provides a more meaningful performance comparison than the peer group assigned by Morningstar, Inc., which assigns mutual funds to categories based on their investment styles as measured by their underlying portfolio holdings.
Annual Report
Fidelity Contrafund

The Board reviewed the fund's relative investment performance against its peer group and noted that the performance of the retail class of the fund (the class with the longer performance record) was in the second quartile for the one- and three-year periods and the first quartile for the five-year period. The Board also noted that the investment performance of the retail class of the fund compared favorably to its benchmark for the three- and five-year periods, although the fund's one-year total return was lower than its benchmark. The Board considered that the variations in performance between the fund's classes reflect the variations in class expenses, which result in lower performance for the higher expense class. The Board noted that there was a portfolio management change for the fund in November 2011. The Board also reviewed the fund's performance since inception as well as performance in the current year.
The Board also considered that the fund's management fee is subject to upward or downward adjustment depending upon whether, and to what extent, the fund's investment performance for the performance period exceeds, or is exceeded by, the record (over the same period) of a Board-approved performance adjustment index. The Board noted that the performance adjustment provides FMR with a strong economic incentive to seek to achieve superior performance for the fund's shareholders and helps to more closely align the interests of FMR and the fund's shareholders.
Annual Report
Board Approval of Investment Advisory Contracts and
Management Fees - continued
Based on its review, the Board concluded that the nature, extent, and quality of services provided to the fund under the Advisory Contracts should benefit the fund's shareholders.
Competitiveness of Management Fee and Total Expense Ratio. The Board considered the fund's management fee and total expense ratio compared to "mapped groups" of competitive funds and classes. Fidelity creates "mapped groups" by combining similar Lipper investment objective categories that have comparable management fee characteristics. Combining Lipper investment objective categories aids the Board's management fee and total expense ratio comparisons by broadening the competitive group used for comparison and by reducing the number of universes to which various Fidelity funds are compared.
Management Fee. The Board considered two proprietary management fee comparisons for the 12-month periods shown in the chart below. The group of Lipper funds used by the Board for management fee comparisons is referred to below as the "Total Mapped Group." The Total Mapped Group comparison focuses on a fund's standing relative to the total universe of comparable funds available to investors in terms of gross management fees before expense reimbursements or caps, and without giving effect to the fund's performance adjustment. "TMG %" represents the percentage of funds in the Total Mapped Group that had management fees that were lower than the fund's. For example, a TMG % of 10% means that 90% of the funds in the Total Mapped Group had higher management fees than the fund. The "Asset-Size Peer Group" (ASPG) comparison focuses on a fund's standing relative to non-Fidelity funds similar in size to the fund within the Total Mapped Group. The ASPG represents at least 15% of the funds in the Total Mapped Group with comparable asset size and management fee characteristics, subject to a minimum of 50 funds (or all funds in the Total Mapped Group if fewer than 50). Additional information, such as the ASPG quartile in which the fund's management fee ranked and the impact of the fund's performance adjustment, is also included in the chart and considered by the Board.
Annual Report
Fidelity Contrafund

The Board noted that the fund's management fee ranked below the median of its Total Mapped Group and below the median of its ASPG for 2011. The Board also noted the effect of the fund's positive performance adjustment on the fund's management fee ranking. The Board noted that the performance adjustment for each year represents calculations for performance periods that differ from the periods shown in the performance charts above.
Based on its review, the Board concluded that the fund's management fee is fair and reasonable in light of the services that the fund receives and the other factors considered.
Total Expense Ratio. In its review of each class's total expense ratio, the Board considered the fund's management fee as well as other fund or class expenses, as applicable, such as transfer agent fees, pricing and bookkeeping fees, and custodial, legal, and audit fees. The Board also noted the effects of any waivers and reimbursements on fees and expenses, as well as the impact of the fund's performance adjustment. As part of its review, the Board also considered the current and historical total expense ratios of each class of the fund compared to competitive fund median expenses. Each class of the fund is compared to those funds and classes in the Total Mapped Group (used by the Board for management fee comparisons) that have a similar sales load structure.
The Board noted that the total expense ratio of each class ranked below its competitive median for 2011.
Fees Charged to Other Fidelity Clients. The Board also considered Fidelity fee structures and other information with respect to clients of FMR and its affiliates, such as other mutual funds advised or subadvised by FMR or its affiliates, pension plan clients, and other institutional clients. The Board noted the findings of the 2010 ad hoc joint committee (created with the board of other Fidelity funds), which reviewed and compared Fidelity's institutional investment advisory business with its business of providing services to the Fidelity funds, including the differences in services provided, fees charged, and costs incurred, as well as competition in their respective marketplaces.
Annual Report
Board Approval of Investment Advisory Contracts and
Management Fees - continued
Based on its review of total expense ratios and fees charged to other Fidelity clients, the Board concluded that the total expense ratio of each class of the fund was reasonable in light of the services that the fund and its shareholders receive and the other factors considered.
Costs of the Services and Profitability. The Board considered the revenues earned and the expenses incurred by Fidelity in conducting the business of developing, marketing, distributing, managing, administering and servicing the fund and its shareholders. The Board also considered the level of Fidelity's profits in respect of all the Fidelity funds.
On an annual basis, FMR presents to the Board Fidelity's profitability for the fund. Fidelity calculates the profitability for each fund, as well as aggregate profitability for groups of Fidelity funds and all Fidelity funds, using a series of detailed revenue and cost allocation methodologies which originate with the books and records of Fidelity on which Fidelity's audited financial statements are based. The Audit Committee of the Board reviews any significant changes from the prior year's methodologies.
PricewaterhouseCoopers LLP (PwC), independent registered public accounting firm and auditor to Fidelity and certain Fidelity funds, has been engaged annually by the Board as part of the Board's assessment of Fidelity's profitability analysis. PwC's engagement includes the review and assessment of Fidelity's methodologies used in determining the revenues and expenses attributable to Fidelity's mutual fund business, and completion of agreed-upon procedures surrounding the mathematical accuracy of fund profitability and its conformity to allocation methodologies. After considering PwC's reports issued under the engagement and information provided by Fidelity, the Board concluded that while other allocation methods may also be reasonable, Fidelity's profitability methodologies are reasonable in all material respects.
The Board also reviewed Fidelity's non-fund businesses and fall-out benefits related to the mutual fund business as well as cases where Fidelity's affiliates may benefit from or be related to the fund's business.
The Board considered the costs of the services provided by and the profits realized by Fidelity in connection with the operation of the fund and was satisfied that the profitability was not excessive in the circumstances.
Annual Report
Economies of Scale. The Board considered whether there have been economies of scale in respect of the management of the Fidelity funds, whether the Fidelity funds (including the fund) have appropriately benefited from any such economies of scale, and whether there is potential for realization of any further economies of scale. The Board considered the extent to which the fund will benefit from economies of scale through increased services to the fund, through waivers or reimbursements, or through fee or expense reductions. The Board also noted that in 2009, it and the board of other Fidelity funds created an ad hoc committee (the Economies of Scale Committee) to analyze whether FMR attains economies of scale in respect of the management and servicing of the Fidelity funds, whether the Fidelity funds have appropriately benefited from such economies of scale, and whether there is potential for realization of any further economies of scale.
The Board recognized that the fund's management contract incorporates a "group fee" structure, which provides for lower group fee rates as total fund assets under FMR's management increase, and for higher group fee rates as total fund assets under FMR's management decrease. FMR calculates the group fee rates based on a tiered asset "breakpoint" schedule that varies based on asset class. The Board considered that the group fee is designed to deliver the benefits of economies of scale to fund shareholders when total Fidelity fund assets increase, even if assets of any particular fund are unchanged or have declined, because some portion of Fidelity's costs are attributable to services provided to all Fidelity funds, and all funds benefit if those costs can be allocated among more assets. The Board concluded that, given the group fee structure, fund shareholders will benefit from lower management fees as assets under FMR's management increase at the fund complex level, regardless of whether Fidelity achieves any such economies of scale.
The Board concluded, taking into account the analysis of the Economies of Scale Committee, that economies of scale, if any, are being appropriately shared between fund shareholders and Fidelity.
Additional Information Requested by the Board. In order to develop fully the factual basis for consideration of the Fidelity funds' Advisory Contracts, the Board requested and received additional information on certain topics, including (i) fund performance trends, actions to be taken by FMR to improve certain funds' overall performance, and Fidelity's long-term strategies for certain funds; (ii) the potential to further rationalize the Fidelity fund lineup with the possibility of achieving savings for the funds and Fidelity; (iii) Fidelity's compensation structure for portfolio managers and other key investment personnel; (iv) the amount of the investment that each portfolio manager has made in the Fidelity fund(s) that he or she manages; (v) the realization of fall-out benefits in certain Fidelity business units; (vi) Fidelity's group fee structures, the potential impact of regulatory changes on such structures, and the rationale for the individual fee rates of certain funds; (vii) fund profitability methodology, including Fidelity's cost allocation methodology, and the impact of certain factors on fund profitability results; (viii) trends regarding industry use of performance fee structures and the possibility of implementing performance fee structures for additional funds; and (ix) the impact of net redemptions from the Fidelity funds.
Annual Report
Board Approval of Investment Advisory Contracts and
Management Fees - continued
Based on its evaluation of all of the conclusions noted above, and after considering all factors it believed relevant, the Board ultimately concluded that the advisory fee structures are fair and reasonable, and that the fund's Advisory Contracts should be renewed.
Annual Report
Investment Adviser
Fidelity Management & Research Company
Boston, MA
Investment Sub-Advisers
FMR Co., Inc.
Fidelity Management & Research
(U.K.) Inc.
Fidelity Management & Research
(Hong Kong) Limited
Fidelity Management & Research
(Japan) Inc.
General Distributor
Fidelity Distributors Corporation
Smithfield, RI
Transfer and Service Agents
Fidelity Investments Institutional
Operations Company, Inc.
Boston, MA
Fidelity Service Company, Inc. Boston, MA
Custodian
Brown Brothers Harriman & Co.
Boston, MA
(Fidelity Investment logo)(registered trademark)
Corporate Headquarters
82 Devonshire St., Boston, MA 02109
www.fidelity.com
CON-K-UANN-0213
1.863186.104
(Fidelity Investment logo)(registered trademark)
Fidelity Advisor®
New Insights
Fund - Class A, Class T, Class B
and Class C
Annual Report
December 31, 2012
(Fidelity Cover Art)
Contents
Performance | (Click Here) | How the fund has done over time. |
Management's Discussion of Fund Performance | (Click Here) | The Portfolio Manager's review of fund performance and strategy. |
Shareholder Expense Example | (Click Here) | An example of shareholder expenses. |
Investment Changes | (Click Here) | A summary of major shifts in the fund's investments over the past six months. |
Investments | (Click Here) | A complete list of the fund's investments with their market values. |
Financial Statements | (Click Here) | Statements of assets and liabilities, operations, and changes in net assets, as well as financial highlights. |
Notes | (Click Here) | Notes to the financial statements. |
Report of Independent Registered Public Accounting Firm | (Click Here) | |
Trustees and Officers | (Click Here) | |
Distributions | (Click Here) | |
Board Approval of Investment Advisory Contracts and Management Fees | (Click Here) | |
To view a fund's proxy voting guidelines and proxy voting record for the 12-month period ended June 30, visit http://www.fidelity.com/proxyvotingresults or visit the Securities and Exchange Commission's (SEC) web site at http://www.sec.gov. You may also call 1-877-208-0098 to request a free copy of the proxy voting guidelines.
Standard & Poor's, S&P and S&P 500 are registered service marks of The McGraw-Hill Companies, Inc. and have been licensed for use by Fidelity Distributors Corporation.
Other third-party marks appearing herein are the property of their respective owners.
All other marks appearing herein are registered or unregistered trademarks or service marks of FMR LLC or an affiliated company. © 2013 FMR LLC. All rights reserved.
Annual Report
This report and the financial statements contained herein are submitted for the general information of the shareholders of the fund. This report is not authorized for distribution to prospective investors in the fund unless preceded or accompanied by an effective prospectus.
A fund files its complete schedule of portfolio holdings with the SEC for the first and third quarters of each fiscal year on Form N-Q. Forms N-Q are available on the SEC's web site at http://www.sec.gov. A fund's Forms N-Q may be reviewed and copied at the SEC's Public Reference Room in Washington, DC. Information regarding the operation of the SEC's Public Reference Room may be obtained by calling 1-800-SEC-0330. For a complete list of a fund's portfolio holdings, view the most recent holdings listing, semiannual report, or annual report on Fidelity's web site at http://www.fidelity.com, http://www.advisor.fidelity.com, or http://www.401k.com, as applicable.
NOT FDIC INSURED • MAY LOSE VALUE • NO BANK GUARANTEE
Neither the fund nor Fidelity Distributors Corporation is a bank.
Annual Report
Average annual total return reflects the change in the value of an investment, assuming reinvestment of the class' distributions from dividend income and capital gains (the profits earned upon the sale of securities that have grown in value, if any) and assuming a constant rate of performance each year. The $10,000 table and the fund's returns do not reflect the deduction of taxes that a shareholder would pay on fund distributions or the redemption of fund shares. During periods of reimbursement by Fidelity, a fund's total return will be greater than it would be had the reimbursement not occurred. How a fund did yesterday is no guarantee of how it will do tomorrow. Returns reflect the conversion of Class B shares to Class A shares after a maximum of seven years.
Average Annual Total Returns
Periods ended December 31, 2012 | Past 1
year | Past 5
years | Life of
fund A |
Class A (incl. 5.75% sales charge) | 9.18% | 0.10% | 8.96% |
Class T (incl. 3.50% sales charge) | 11.47% | 0.32% | 8.98% |
Class B (incl. contingent deferred sales charge)B | 9.89% | 0.08% | 8.99% |
Class C (incl. contingent deferred sales charge)C | 13.92% | 0.53% | 8.83% |
A From July 31, 2003.
B Class B shares' contingent deferred sales charges included in the past one year, past five years, and life of fund total return figures are 5%, 2%, and 0%, respectively.
C Class C shares' contingent deferred sales charge included in the past one year, past five years, and life of fund total return figures are 1%, 0%, and 0%, respectively.
See accompanying notes which are an integral part of the financial statements.
Annual Report
$10,000 Over Life of Fund
Let's say hypothetically that $10,000 was invested in Fidelity Advisor ® New Insights Fund - Class A on July 31, 2003, when the fund started, and the current 5.75% sales charge was paid. The chart shows how the value of your investment would have changed, and also shows how the S&P 500® Index performed over the same period.
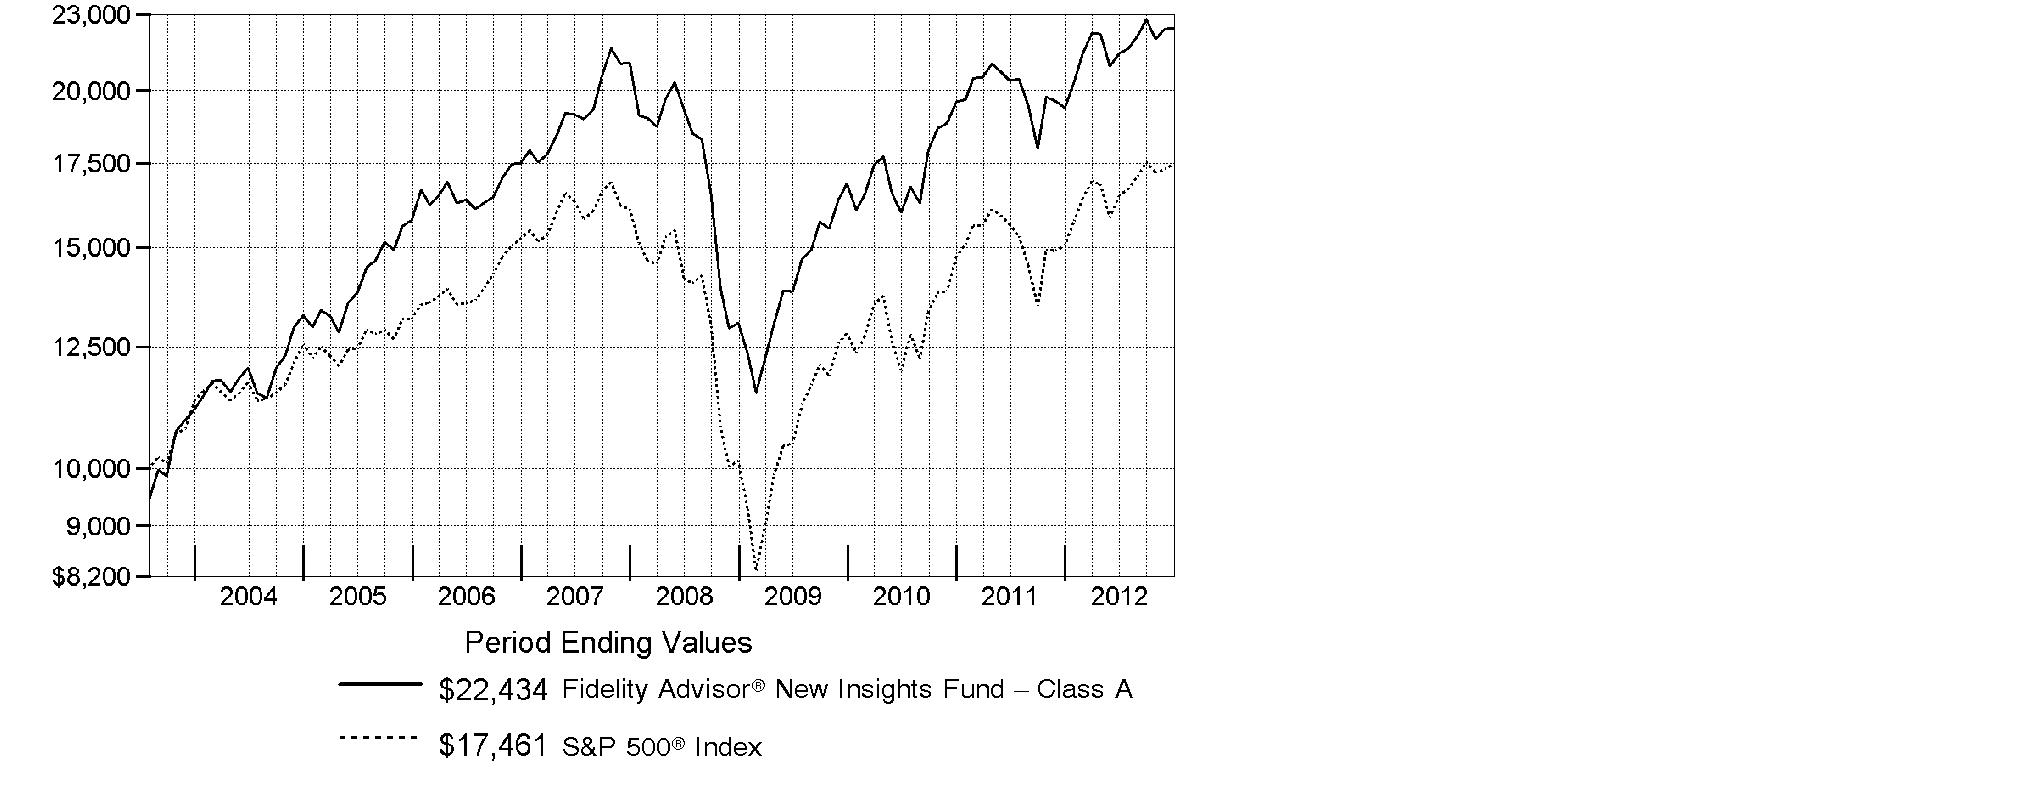
Annual Report
Market Recap: U.S. equity benchmarks posted double-digit gains for the year ending December 31, 2012, despite investors' concerns over debt woes in Europe, slower growth in China and partisan gridlock in Congress. Signs of recovery in the U.S. economy lifted stocks for most of the period, extending an uptrend that began in March 2009. The broad-based S&P 500® Index rose 16.00% for the 12 months, while the technology-heavy Nasdaq Composite Index® gained 17.45% and the blue-chip-laden Dow Jones Industrial AverageSM added 10.24%. Stocks began the year on a high note, with an improving U.S. economy and proposed bailouts in Europe buoying equities in the first quarter. Fear resurfaced in April and May, but stocks rebounded in June on central bank stimulus, a reviving U.S. housing market and more eurozone aid. Although equity benchmarks hit multiyear highs in September, pre-election jitters and the looming "fiscal cliff" of tax hikes and federal spending cuts triggered some profit-taking, followed by a brief post-election sell-off. Hurricane Sandy's aftereffects added to uncertainty, but stocks proved resilient. Within the S&P 500®, the financials and consumer discretionary sectors significantly outpaced the benchmark, while utilities and energy lagged the most, with only modest gains. Despite eurozone turmoil, foreign developed-markets stocks rose strongly, with the MSCI® EAFE® Index adding 17.48%.
Comments from William Danoff, Portfolio Manager of Fidelity Advisor® New Insights Fund: For the year, the fund's Class A, Class T, Class B and Class C shares returned 15.84%, 15.52%, 14.89% and 14.92%, respectively (excluding sales charges), underperforming the S&P 500®. Stock selection drove results versus the index, led by picks in technology, where I've had a strong commitment for many years. Here, market leader Apple was by far the fund's top individual contributor. Its shares rose roughly 33% for the year, despite a weak fourth quarter. The fund also was helped by largely avoiding the weak utilities sector and large energy stocks, based on their inferior relative earnings prospects. This included integrated oil firm and index component Exxon Mobil, which underperformed. Electronic payment leader Visa also notably contributed, fueled by strong earnings. Conversely, the fund was hurt by underweighting the rebounding diversified financials group, as large banks such as Bank of America - which I did not own - and JPMorgan Chase rose sharply with the improving U.S. economy. Weak sales hurt fast-food chain McDonald's. Concerns about intensified competition hurt Internet search giant Google, another of the fund's largest holdings. A cash position also detracted, given the market's strong advance.
The views expressed above reflect those of the portfolio manager(s) only through the end of the period as stated on the cover of this report and do not necessarily represent the views of Fidelity or any other person in the Fidelity organization. Any such views are subject to change at any time based upon market or other conditions and Fidelity disclaims any responsibility to update such views. These views may not be relied on as investment advice and, because investment decisions for a Fidelity fund are based on numerous factors, may not be relied on as an indication of trading intent on behalf of any Fidelity fund.
Annual Report
Shareholder Expense Example
As a shareholder of the Fund, you incur two types of costs: (1) transaction costs, including sales charges (loads) on purchase payments or redemption proceeds, and (2) ongoing costs, including management fees, distribution and/or service (12b-1) fees and other Fund expenses. This Example is intended to help you understand your ongoing costs (in dollars) of investing in the Fund and to compare these costs with the ongoing costs of investing in other mutual funds.
The Example is based on an investment of $1,000 invested at the beginning of the period and held for the entire period (July 1, 2012 to December 31, 2012).
Actual Expenses
The first line of the accompanying table for each class of the Fund provides information about actual account values and actual expenses. You may use the information in this line, together with the amount you invested, to estimate the expenses that you paid over the period. Simply divide your account value by $1,000.00 (for example, an $8,600 account value divided by $1,000.00 = 8.6), then multiply the result by the number in the first line for a class of the Fund under the heading entitled "Expenses Paid During Period" to estimate the expenses you paid on your account during this period. In addition, the Fund, as a shareholder in the underlying Fidelity Central Funds, will indirectly bear its pro-rata share of the fees and expenses incurred by the underlying Fidelity Central Funds. These fees and expenses are not included in the Fund's annualized expense ratio used to calculate the expense estimate in the table below.
Hypothetical Example for Comparison Purposes
The second line of the accompanying table for each class of the Fund provides information about hypothetical account values and hypothetical expenses based on a Class' actual expense ratio and an assumed rate of return of 5% per year before expenses, which is not the Class' actual return. The hypothetical account values and expenses may not be used to estimate the actual ending account balance or expenses you paid for the period. You may use this information to compare the ongoing costs of investing in the Fund and other funds. To do so, compare this 5% hypothetical example with the 5% hypothetical examples that appear in the shareholder reports of the other funds. In addition, the Fund, as a shareholder in the underlying Fidelity Central Funds, will indirectly bear its pro-rata share of the fees and expenses incurred by the underlying Fidelity Central Funds. These fees and expenses are not included in the Fund's annualized expense ratio used to calculate the expense estimate in the table below.
Please note that the expenses shown in the table are meant to highlight your ongoing costs only and do not reflect any transaction costs. Therefore, the second line of the table is useful in comparing ongoing costs only, and will not help you determine the relative total costs of owning different funds. In addition, if these transactional costs were included, your costs would have been higher.
Annual Report
| Annualized Expense Ratio | Beginning
Account Value
July 1, 2012 | Ending
Account Value
December 31, 2012 | Expenses Paid
During Period*
July 1, 2012 to
December 31, 2012 |
Class A | 1.03% | | | |
Actual | | $ 1,000.00 | $ 1,047.90 | $ 5.30 |
HypotheticalA | | $ 1,000.00 | $ 1,019.96 | $ 5.23 |
Class T | 1.27% | | | |
Actual | | $ 1,000.00 | $ 1,046.50 | $ 6.53 |
HypotheticalA | | $ 1,000.00 | $ 1,018.75 | $ 6.44 |
Class B | 1.84% | | | |
Actual | | $ 1,000.00 | $ 1,043.50 | $ 9.45 |
HypotheticalA | | $ 1,000.00 | $ 1,015.89 | $ 9.32 |
Class C | 1.78% | | | |
Actual | | $ 1,000.00 | $ 1,043.70 | $ 9.14 |
HypotheticalA | | $ 1,000.00 | $ 1,016.19 | $ 9.02 |
Institutional Class | .76% | | | |
Actual | | $ 1,000.00 | $ 1,049.20 | $ 3.91 |
HypotheticalA | | $ 1,000.00 | $ 1,021.32 | $ 3.86 |
A 5% return per year before expenses
* Expenses are equal to each Class' annualized expense ratio, multiplied by the average account value over the period, multiplied by 184/366 (to reflect the one-half year period).
Annual Report
Investment Changes (Unaudited)
Top Ten Stocks as of December 31, 2012 |
| % of fund's
net assets | % of fund's net assets
6 months ago |
Apple, Inc. | 7.0 | 8.7 |
Google, Inc. Class A | 5.3 | 4.2 |
Berkshire Hathaway, Inc. Class A | 3.5 | 3.0 |
Wells Fargo & Co. | 2.5 | 2.4 |
The Coca-Cola Co. | 2.4 | 2.7 |
The Walt Disney Co. | 2.3 | 2.3 |
Noble Energy, Inc. | 2.0 | 1.7 |
Visa, Inc. Class A | 1.9 | 1.5 |
Amazon.com, Inc. | 1.7 | 1.4 |
TJX Companies, Inc. | 1.7 | 1.9 |
| 30.3 | |
Top Five Market Sectors as of December 31, 2012 |
| % of fund's
net assets | % of fund's net assets
6 months ago |
Information Technology | 27.7 | 27.3 |
Consumer Discretionary | 19.7 | 22.2 |
Financials | 13.0 | 10.8 |
Health Care | 12.5 | 10.2 |
Consumer Staples | 9.1 | 9.0 |
Asset Allocation (% of fund's net assets) |
As of December 31, 2012 * | As of June 30, 2012 ** |
 | Stocks 97.8% | | | Stocks 92.0% | |
 | Bonds† 0.0% | | | Bonds 0.1% | |
 | Convertible
Securities 0.2% | | | Convertible
Securities 0.3% | |
 | Short-Term
Investments and
Net Other Assets (Liabilities) 2.0% | | | Short-Term
Investments and
Net Other Assets (Liabilities) 7.6% | |
* Foreign investments | 12.5% | | ** Foreign investments | 11.3% | |

† Amount represents less than 0.1%
Annual Report
Investments December 31, 2012
Showing Percentage of Net Assets
Common Stocks - 97.8% |
| Shares | | Value (000s) |
CONSUMER DISCRETIONARY - 19.7% |
Automobiles - 0.2% |
Hyundai Motor Co. | 93,734 | | $ 19,449 |
Tesla Motors, Inc. (a) | 405,300 | | 13,728 |
| | 33,177 |
Distributors - 0.1% |
LKQ Corp. (a) | 1,004,600 | | 21,197 |
Diversified Consumer Services - 0.0% |
Kroton Educacional SA (a) | 116,900 | | 2,672 |
Hotels, Restaurants & Leisure - 3.8% |
Chipotle Mexican Grill, Inc. (a) | 477,678 | | 142,090 |
Dunkin' Brands Group, Inc. | 1,709,800 | | 56,731 |
Galaxy Entertainment Group Ltd. (a) | 2,222,000 | | 8,910 |
InterContinental Hotel Group PLC | 150,173 | | 4,211 |
McDonald's Corp. | 3,495,998 | | 308,382 |
Paddy Power PLC (Ireland) | 29,400 | | 2,427 |
Panera Bread Co. Class A (a) | 20,200 | | 3,208 |
Starbucks Corp. | 2,403,482 | | 128,875 |
Tim Hortons, Inc. (Canada) | 2,695,700 | | 132,332 |
| | 787,166 |
Household Durables - 1.3% |
D.R. Horton, Inc. | 4,251,657 | | 84,098 |
Lennar Corp. Class A (d) | 1,362,600 | | 52,692 |
PulteGroup, Inc. (a) | 5,269,000 | | 95,685 |
Ryland Group, Inc. | 328,400 | | 11,987 |
Toll Brothers, Inc. (a) | 566,906 | | 18,328 |
Whirlpool Corp. | 59,700 | | 6,074 |
| | 268,864 |
Internet & Catalog Retail - 2.7% |
Amazon.com, Inc. (a) | 1,432,900 | | 359,859 |
Expedia, Inc. | 111,251 | | 6,836 |
Liberty Media Corp.: | | | |
Interactive Series A (a) | 607,400 | | 11,954 |
Series A (a) | 19,400 | | 1,315 |
priceline.com, Inc. (a) | 206,120 | | 128,042 |
TripAdvisor, Inc. | 1,515,300 | | 63,582 |
| | 571,588 |
Leisure Equipment & Products - 0.1% |
Polaris Industries, Inc. | 359,400 | | 30,244 |
Media - 5.5% |
Comcast Corp. Class A | 6,265,500 | | 234,204 |
Common Stocks - continued |
| Shares | | Value (000s) |
CONSUMER DISCRETIONARY - continued |
Media - continued |
Discovery Communications, Inc. (a) | 3,956,727 | | $ 251,173 |
Legend Pictures LLC (a)(g)(h) | 11,303 | | 20,946 |
Liberty Global, Inc. Class A (a) | 596,600 | | 37,580 |
Liberty Media Corp. Capital Series A (a) | 473,632 | | 54,946 |
Naspers Ltd. Class N | 378,200 | | 24,233 |
Sirius XM Radio, Inc. (d) | 11,190,279 | | 32,340 |
The Walt Disney Co. | 9,517,880 | | 473,895 |
Time Warner Cable, Inc. | 272,141 | | 26,449 |
Weinstein Co. Holdings LLC Class A-1 (a)(g)(h) | 2,267 | | 850 |
| | 1,156,616 |
Multiline Retail - 0.2% |
Dollar Tree, Inc. (a) | 1,065,718 | | 43,226 |
Dollarama, Inc. (f) | 63,100 | | 3,741 |
| | 46,967 |
Specialty Retail - 4.2% |
Bed Bath & Beyond, Inc. (a) | 2,201,600 | | 123,091 |
Dick's Sporting Goods, Inc. | 384,400 | | 17,486 |
DSW, Inc. Class A | 146,100 | | 9,597 |
Fast Retailing Co. Ltd. | 46,300 | | 11,816 |
Five Below, Inc. (d) | 124,200 | | 3,979 |
Foot Locker, Inc. | 763,700 | | 24,530 |
Gap, Inc. | 546,100 | | 16,951 |
GNC Holdings, Inc. | 250,400 | | 8,333 |
Home Depot, Inc. | 783,400 | | 48,453 |
Inditex SA | 51,277 | | 7,205 |
Lithia Motors, Inc. Class A (sub. vtg.) | 400,000 | | 14,968 |
Penske Automotive Group, Inc. | 418,100 | | 12,581 |
PetSmart, Inc. | 520,100 | | 35,544 |
Ross Stores, Inc. | 1,911,600 | | 103,513 |
TJX Companies, Inc. | 8,328,300 | | 353,536 |
Ulta Salon, Cosmetics & Fragrance, Inc. | 429,902 | | 42,242 |
Urban Outfitters, Inc. (a) | 922,800 | | 36,321 |
| | 870,146 |
Textiles, Apparel & Luxury Goods - 1.6% |
China Hongxing Sports Ltd. (a) | 6,000,000 | | 565 |
lululemon athletica, Inc. (a) | 112,000 | | 8,538 |
Luxottica Group SpA | 318,900 | | 13,163 |
LVMH Moet Hennessy - Louis Vuitton SA | 84,200 | | 15,540 |
Michael Kors Holdings Ltd. | 396,900 | | 20,254 |
NIKE, Inc. Class B | 3,178,400 | | 164,005 |
Common Stocks - continued |
| Shares | | Value (000s) |
CONSUMER DISCRETIONARY - continued |
Textiles, Apparel & Luxury Goods - continued |
PVH Corp. | 105,500 | | $ 11,712 |
Salvatore Ferragamo Italia SpA | 70,000 | | 1,550 |
Under Armour, Inc. Class A (sub. vtg.) (a)(d) | 1,208,100 | | 58,629 |
VF Corp. | 241,800 | | 36,505 |
| | 330,461 |
TOTAL CONSUMER DISCRETIONARY | | 4,119,098 |
CONSUMER STAPLES - 9.1% |
Beverages - 3.3% |
Anheuser-Busch InBev SA NV ADR | 1,194,400 | | 104,403 |
Boston Beer Co., Inc. Class A (a)(d) | 127,270 | | 17,111 |
Coca-Cola Icecek A/S | 8,000 | | 166 |
Diageo PLC sponsored ADR | 261,500 | | 30,486 |
Dr. Pepper Snapple Group, Inc. | 636,900 | | 28,138 |
The Coca-Cola Co. | 14,021,774 | | 508,289 |
| | 688,593 |
Food & Staples Retailing - 2.5% |
Bim Birlesik Magazalar A/S JSC | 70,000 | | 3,424 |
Costco Wholesale Corp. | 1,481,800 | | 146,357 |
CVS Caremark Corp. | 2,303,300 | | 111,365 |
Fresh Market, Inc. (a) | 349,400 | | 16,803 |
Wal-Mart Stores, Inc. | 3,499,400 | | 238,764 |
Whole Foods Market, Inc. | 150,900 | | 13,782 |
| | 530,495 |
Food Products - 0.6% |
Associated British Foods PLC | 911,300 | | 23,282 |
Calbee, Inc. | 49,300 | | 3,474 |
Kraft Foods Group, Inc. | 231,100 | | 10,508 |
Mondelez International, Inc. | 1,819,200 | | 46,335 |
Orion Corp. | 11,348 | | 11,716 |
Want Want China Holdings Ltd. | 18,152,000 | | 25,438 |
| | 120,753 |
Household Products - 1.8% |
Colgate-Palmolive Co. | 3,040,200 | | 317,823 |
Kimberly-Clark Corp. | 585,800 | | 49,459 |
| | 367,282 |
Common Stocks - continued |
| Shares | | Value (000s) |
CONSUMER STAPLES - continued |
Personal Products - 0.9% |
Estee Lauder Companies, Inc. Class A | 3,271,300 | | $ 195,820 |
TOTAL CONSUMER STAPLES | | 1,902,943 |
ENERGY - 5.5% |
Energy Equipment & Services - 0.2% |
Cameron International Corp. (a) | 100,100 | | 5,652 |
Schlumberger Ltd. | 417,600 | | 28,936 |
Seadrill Partners LLC | 48,100 | | 1,234 |
| | 35,822 |
Oil, Gas & Consumable Fuels - 5.3% |
Americas Petrogas, Inc. (a)(f) | 836,000 | | 2,521 |
Anadarko Petroleum Corp. | 1,978,700 | | 147,037 |
Birchcliff Energy Ltd. (a) | 844,700 | | 6,335 |
Birchcliff Energy Ltd. (f) | 900,000 | | 6,750 |
Cabot Oil & Gas Corp. | 370,800 | | 18,444 |
Canadian Natural Resources Ltd. | 312,200 | | 8,989 |
Cobalt International Energy, Inc. (a) | 326,700 | | 8,024 |
Concho Resources, Inc. (a) | 393,980 | | 31,739 |
Continental Resources, Inc. (a) | 380,400 | | 27,956 |
Cosan Ltd. Class A | 171,100 | | 2,962 |
Energy XXI (Bermuda) Ltd. | 99,400 | | 3,200 |
EOG Resources, Inc. | 1,423,900 | | 171,993 |
GoviEx Uranium, Inc. (a)(h) | 3,477,000 | | 9,110 |
HollyFrontier Corp. | 197,600 | | 9,198 |
Madalena Ventures, Inc. (f) | 2,200,000 | | 852 |
Marathon Petroleum Corp. | 913,500 | | 57,551 |
Murphy Oil Corp. | 410,400 | | 24,439 |
Noble Energy, Inc. | 3,994,700 | | 406,421 |
Occidental Petroleum Corp. | 412,648 | | 31,613 |
PBF Energy, Inc. | 282,500 | | 8,207 |
Phillips 66 | 1,027,600 | | 54,566 |
Rooster Energy Ltd. (a)(e) | 9,925,000 | | 5,188 |
Skope Energy, Inc. (a)(e)(f) | 784,000 | | 51 |
TAG Oil Ltd. (a) | 854,100 | | 4,894 |
TAG Oil Ltd. (f) | 322,900 | | 1,850 |
Tesoro Corp. | 182,892 | | 8,056 |
Tourmaline Oil Corp. (a) | 1,428,600 | | 44,853 |
Tourmaline Oil Corp. (a)(f) | 303,400 | | 9,526 |
Common Stocks - continued |
| Shares | | Value (000s) |
ENERGY - continued |
Oil, Gas & Consumable Fuels - continued |
TransAtlantic Petroleum Ltd. (a)(f) | 325,400 | | $ 270 |
Ultrapar Participacoes SA | 158,200 | | 3,620 |
| | 1,116,215 |
TOTAL ENERGY | | 1,152,037 |
FINANCIALS - 13.0% |
Capital Markets - 0.3% |
Bank of New York Mellon Corp. | 166,800 | | 4,287 |
Charles Schwab Corp. | 286,000 | | 4,107 |
Goldman Sachs Group, Inc. | 85,400 | | 10,894 |
Morgan Stanley | 460,200 | | 8,799 |
State Street Corp. | 616,800 | | 28,996 |
T. Rowe Price Group, Inc. | 64,800 | | 4,220 |
| | 61,303 |
Commercial Banks - 4.2% |
Bank of Ireland (a) | 320,846,128 | | 48,684 |
BB&T Corp. | 729,000 | | 21,221 |
Fifth Third Bancorp | 882,600 | | 13,407 |
HDFC Bank Ltd. sponsored ADR | 189,700 | | 7,725 |
M&T Bank Corp. | 456,411 | | 44,943 |
Metro Bank PLC Class A (a)(h) | 239,350 | | 3,888 |
PNC Financial Services Group, Inc. | 773,100 | | 45,079 |
Royal Bank of Canada | 176,200 | | 10,607 |
U.S. Bancorp | 5,016,500 | | 160,227 |
Wells Fargo & Co. | 15,140,085 | | 517,488 |
| | 873,269 |
Consumer Finance - 0.9% |
American Express Co. | 2,446,600 | | 140,631 |
Capital One Financial Corp. | 735,800 | | 42,625 |
| | 183,256 |
Diversified Financial Services - 0.5% |
Citigroup, Inc. | 1,154,570 | | 45,675 |
JPMorgan Chase & Co. | 1,097,714 | | 48,266 |
Kotak Mahindra Bank Ltd. | 284,313 | | 3,398 |
| | 97,339 |
Insurance - 5.9% |
ACE Ltd. | 1,805,700 | | 144,095 |
Admiral Group PLC | 635,100 | | 12,098 |
Common Stocks - continued |
| Shares | | Value (000s) |
FINANCIALS - continued |
Insurance - continued |
AIA Group Ltd. | 16,288,600 | | $ 64,606 |
Berkshire Hathaway, Inc. Class A (a) | 5,501 | | 737,464 |
Direct Line Insurance Group PLC | 3,926,200 | | 13,898 |
Fairfax Financial Holdings Ltd. (sub. vtg.) | 24,600 | | 8,867 |
Marsh & McLennan Companies, Inc. | 1,176,200 | | 40,544 |
The Chubb Corp. | 1,789,900 | | 134,815 |
The Travelers Companies, Inc. | 1,229,600 | | 88,310 |
| | 1,244,697 |
Real Estate Investment Trusts - 0.7% |
American Tower Corp. | 2,071,100 | | 160,034 |
Real Estate Management & Development - 0.5% |
BR Malls Participacoes SA | 4,407,550 | | 58,863 |
Kennedy-Wilson Holdings, Inc. | 638,900 | | 8,932 |
Realogy Holdings Corp. | 724,199 | | 30,387 |
| | 98,182 |
TOTAL FINANCIALS | | 2,718,080 |
HEALTH CARE - 12.3% |
Biotechnology - 5.0% |
Achillion Pharmaceuticals, Inc. (a) | 20,700 | | 166 |
Aegerion Pharmaceuticals, Inc. (a) | 108,017 | | 2,743 |
Alexion Pharmaceuticals, Inc. (a) | 1,075,200 | | 100,865 |
Amgen, Inc. | 2,782,142 | | 240,154 |
ARIAD Pharmaceuticals, Inc. (a) | 2,137,172 | | 40,991 |
Biogen Idec, Inc. (a) | 2,162,800 | | 317,218 |
BioMarin Pharmaceutical, Inc. (a) | 380,300 | | 18,730 |
Celgene Corp. (a) | 509,300 | | 40,092 |
CSL Ltd. | 137,187 | | 7,745 |
Gilead Sciences, Inc. (a) | 1,578,330 | | 115,928 |
Grifols SA ADR | 665,241 | | 17,250 |
Intercept Pharmaceuticals, Inc. | 100,000 | | 3,424 |
KYTHERA Biopharmaceuticals, Inc. (e) | 105,900 | | 3,213 |
KYTHERA Biopharmaceuticals, Inc. (e)(h) | 1,438,435 | | 39,278 |
Light Sciences Oncology, Inc. (a) | 2,708,254 | | 160 |
Medivation, Inc. (a) | 350,340 | | 17,923 |
Merrimack Pharmaceuticals, Inc. | 502,236 | | 3,059 |
Onyx Pharmaceuticals, Inc. (a) | 102,200 | | 7,719 |
Puma Biotechnology, Inc. | 588,623 | | 11,037 |
Regeneron Pharmaceuticals, Inc. (a) | 262,200 | | 44,855 |
Common Stocks - continued |
| Shares | | Value (000s) |
HEALTH CARE - continued |
Biotechnology - continued |
Rigel Pharmaceuticals, Inc. (a) | 267,900 | | $ 1,741 |
RXi Pharmaceuticals Corp. warrants 2/4/15 (a) | 228,571 | | 116 |
Synageva BioPharma Corp. (a) | 134,100 | | 6,207 |
Theravance, Inc. (a) | 196,600 | | 4,378 |
Verastem, Inc. | 575,000 | | 5,054 |
| | 1,050,046 |
Health Care Equipment & Supplies - 1.0% |
Baxter International, Inc. | 716,600 | | 47,769 |
Boston Scientific Corp. (a) | 217,600 | | 1,247 |
CareFusion Corp. (a) | 150,000 | | 4,287 |
Covidien PLC | 423,200 | | 24,436 |
Cyberonics, Inc. (a) | 166,500 | | 8,746 |
High Power Exploration (a) | 58,562 | | 94 |
Intuitive Surgical, Inc. (a) | 173,100 | | 84,883 |
Medtronic, Inc. | 396,700 | | 16,273 |
Stryker Corp. | 203,900 | | 11,178 |
Varian Medical Systems, Inc. (a) | 59,600 | | 4,186 |
| | 203,099 |
Health Care Providers & Services - 1.0% |
Acadia Healthcare Co., Inc. (a) | 247,700 | | 5,779 |
Catamaran Corp. (a) | 405,172 | | 19,088 |
CIGNA Corp. | 366,800 | | 19,609 |
DaVita, Inc. (a) | 158,300 | | 17,497 |
Express Scripts Holding Co. (a) | 32,000 | | 1,728 |
Henry Schein, Inc. (a) | 242,945 | | 19,547 |
McKesson Corp. | 153,300 | | 14,864 |
OvaScience, Inc. (a)(e) | 1,090,900 | | 9,131 |
UnitedHealth Group, Inc. | 1,878,700 | | 101,901 |
| | 209,144 |
Health Care Technology - 0.7% |
athenahealth, Inc. (a)(d) | 325,890 | | 23,937 |
Cerner Corp. (a) | 1,532,839 | | 119,010 |
| | 142,947 |
Life Sciences Tools & Services - 0.6% |
Fluidigm Corp. (a)(h) | 112,607 | | 1,611 |
Mettler-Toledo International, Inc. (a) | 572,300 | | 110,626 |
PerkinElmer, Inc. | 15,800 | | 501 |
Waters Corp. (a) | 139,700 | | 12,171 |
| | 124,909 |
Common Stocks - continued |
| Shares | | Value (000s) |
HEALTH CARE - continued |
Pharmaceuticals - 4.0% |
Abbott Laboratories | 2,984,128 | | $ 195,460 |
Allergan, Inc. | 124,500 | | 11,420 |
Bayer AG | 982,705 | | 93,712 |
Bristol-Myers Squibb Co. | 426,500 | | 13,900 |
Eli Lilly & Co. | 709,300 | | 34,983 |
Johnson & Johnson | 1,728,700 | | 121,182 |
Merck & Co., Inc. | 1,291,400 | | 52,870 |
Mylan, Inc. (a) | 668,300 | | 18,365 |
Novartis AG sponsored ADR | 238,500 | | 15,097 |
Novo Nordisk A/S Series B | 810,620 | | 131,999 |
Perrigo Co. | 636,760 | | 66,242 |
Pfizer, Inc. | 762,500 | | 19,124 |
Valeant Pharmaceuticals International, Inc. (Canada) (a) | 247,506 | | 14,765 |
Watson Pharmaceuticals, Inc. (a) | 502,700 | | 43,232 |
| | 832,351 |
TOTAL HEALTH CARE | | 2,562,496 |
INDUSTRIALS - 5.3% |
Aerospace & Defense - 0.1% |
Honeywell International, Inc. | 72,300 | | 4,589 |
United Technologies Corp. | 128,900 | | 10,571 |
| | 15,160 |
Air Freight & Logistics - 0.1% |
C.H. Robinson Worldwide, Inc. | 16,072 | | 1,016 |
FedEx Corp. | 131,600 | | 12,070 |
| | 13,086 |
Building Products - 0.1% |
ASSA ABLOY AB (B Shares) | 65,400 | | 2,462 |
Fortune Brands Home & Security, Inc. (a) | 660,900 | | 19,311 |
| | 21,773 |
Commercial Services & Supplies - 0.5% |
ADT Corp. | 598,550 | | 27,827 |
Edenred SA | 460,600 | | 14,246 |
Stericycle, Inc. (a) | 690,015 | | 64,358 |
Swisher Hygiene, Inc. (a) | 1,395,310 | | 2,198 |
| | 108,629 |
Construction & Engineering - 0.0% |
Jacobs Engineering Group, Inc. (a) | 52,100 | | 2,218 |
Common Stocks - continued |
| Shares | | Value (000s) |
INDUSTRIALS - continued |
Electrical Equipment - 0.3% |
AMETEK, Inc. | 55,900 | | $ 2,100 |
Generac Holdings, Inc. | 71,157 | | 2,441 |
Roper Industries, Inc. | 550,100 | | 61,325 |
| | 65,866 |
Industrial Conglomerates - 1.1% |
3M Co. | 380,600 | | 35,339 |
Danaher Corp. | 2,948,554 | | 164,824 |
General Electric Co. | 1,466,000 | | 30,771 |
| | 230,934 |
Machinery - 0.4% |
Deere & Co. | 94,500 | | 8,167 |
Fanuc Corp. | 62,600 | | 11,647 |
Illinois Tool Works, Inc. | 709,000 | | 43,114 |
PACCAR, Inc. | 194,800 | | 8,807 |
Rexnord Corp. | 263,300 | | 5,608 |
Snap-On, Inc. | 190,743 | | 15,067 |
| | 92,410 |
Professional Services - 0.4% |
Bureau Veritas SA | 76,362 | | 8,562 |
Experian PLC | 2,137,600 | | 34,452 |
IHS, Inc. Class A (a) | 77,962 | | 7,484 |
On Assignment, Inc. (a) | 314,700 | | 6,382 |
Verisk Analytics, Inc. (a) | 515,200 | | 26,275 |
| | 83,155 |
Road & Rail - 1.8% |
Canadian Pacific (d) | 1,479,600 | | 150,087 |
J.B. Hunt Transport Services, Inc. | 416,100 | | 24,845 |
Localiza Rent A Car SA | 201,300 | | 3,731 |
Union Pacific Corp. | 1,583,100 | | 199,027 |
| | 377,690 |
Trading Companies & Distributors - 0.5% |
Air Lease Corp.: | | | |
Class A (a)(f) | 320,800 | | 6,897 |
Class A (a)(d) | 1,102,578 | | 23,705 |
Mills Estruturas e Servicos de Engenharia SA | 92,300 | | 1,551 |
Common Stocks - continued |
| Shares | | Value (000s) |
INDUSTRIALS - continued |
Trading Companies & Distributors - continued |
MRC Global, Inc. | 77,300 | | $ 2,147 |
W.W. Grainger, Inc. | 357,400 | | 72,327 |
| | 106,627 |
TOTAL INDUSTRIALS | | 1,117,548 |
INFORMATION TECHNOLOGY - 27.7% |
Communications Equipment - 1.1% |
Cisco Systems, Inc. | 434,800 | | 8,544 |
Motorola Solutions, Inc. | 879,400 | | 48,965 |
Palo Alto Networks, Inc. (d) | 157,900 | | 8,451 |
QUALCOMM, Inc. | 2,808,951 | | 174,211 |
| | 240,171 |
Computers & Peripherals - 7.3% |
3D Systems Corp. (a)(d) | 277,700 | | 14,815 |
Apple, Inc. | 2,763,579 | | 1,473,057 |
EMC Corp. (a) | 741,800 | | 18,768 |
Stratasys Ltd. (a) | 172,850 | | 13,854 |
| | 1,520,494 |
Electronic Equipment & Components - 0.7% |
Amphenol Corp. Class A | 2,301,538 | | 148,910 |
Internet Software & Services - 8.5% |
Akamai Technologies, Inc. (a) | 189,600 | | 7,757 |
Constant Contact, Inc. (a)(d) | 205,400 | | 2,919 |
Cornerstone OnDemand, Inc. (a) | 501,550 | | 14,811 |
Dropbox, Inc. (h) | 1,289,836 | | 11,672 |
eBay, Inc. (a) | 4,164,461 | | 212,471 |
Equinix, Inc. (a) | 161,100 | | 33,219 |
ExactTarget, Inc. | 420,800 | | 8,416 |
Facebook, Inc. Class A | 6,049,742 | | 161,105 |
Google, Inc. Class A (a) | 1,550,105 | | 1,099,598 |
LinkedIn Corp. (a) | 556,000 | | 63,840 |
MercadoLibre, Inc. (d) | 123,900 | | 9,735 |
Rackspace Hosting, Inc. (a) | 220,900 | | 16,406 |
Responsys, Inc. (a) | 500,000 | | 2,980 |
SPS Commerce, Inc. (a)(e) | 1,000,000 | | 37,270 |
Web.com Group, Inc. (a) | 64,076 | | 948 |
Yahoo!, Inc. (a) | 4,316,000 | | 85,888 |
| | 1,769,035 |
Common Stocks - continued |
| Shares | | Value (000s) |
INFORMATION TECHNOLOGY - continued |
IT Services - 5.6% |
Accenture PLC Class A | 2,956,800 | | $ 196,627 |
Alliance Data Systems Corp. (a) | 651,930 | | 94,373 |
Cognizant Technology Solutions Corp. Class A (a) | 118,500 | | 8,775 |
Fidelity National Information Services, Inc. | 1,141,697 | | 39,742 |
Fiserv, Inc. (a) | 738,881 | | 58,394 |
FleetCor Technologies, Inc. (a) | 200,686 | | 10,767 |
Gartner, Inc. Class A (a) | 87,500 | | 4,027 |
IBM Corp. | 219,000 | | 41,949 |
MasterCard, Inc. Class A | 647,060 | | 317,888 |
Paychex, Inc. | 61,300 | | 1,909 |
Syntel, Inc. | 7,200 | | 386 |
Vantiv, Inc. | 31,900 | | 651 |
Visa, Inc. Class A | 2,622,279 | | 397,485 |
| | 1,172,973 |
Semiconductors & Semiconductor Equipment - 1.5% |
Analog Devices, Inc. | 148,900 | | 6,263 |
ARM Holdings PLC sponsored ADR | 3,051,200 | | 115,427 |
ASML Holding NV | 449,991 | | 28,984 |
Linear Technology Corp. | 60,600 | | 2,079 |
Samsung Electronics Co. Ltd. | 107,109 | | 154,898 |
| | 307,651 |
Software - 3.0% |
Activision Blizzard, Inc. | 362,200 | | 3,847 |
Allot Communications Ltd. (a) | 631,288 | | 11,250 |
Citrix Systems, Inc. (a) | 464,900 | | 30,567 |
CommVault Systems, Inc. (a) | 247,800 | | 17,274 |
Concur Technologies, Inc. (a) | 821,727 | | 55,483 |
FleetMatics Group PLC | 429,600 | | 10,809 |
Intuit, Inc. | 1,729,200 | | 102,887 |
Jive Software, Inc. | 107,300 | | 1,559 |
Mu Sigma, Inc. (h) | 619,826 | | 15,000 |
NetSuite, Inc. (a) | 859,852 | | 57,868 |
Red Hat, Inc. (a) | 445,800 | | 23,610 |
salesforce.com, Inc. (a) | 702,633 | | 118,113 |
ServiceNow, Inc. (d) | 584,500 | | 17,553 |
SolarWinds, Inc. (a) | 969,262 | | 50,838 |
Splunk, Inc. | 324,003 | | 9,403 |
Symantec Corp. (a) | 2,118,800 | | 39,855 |
Trion World Network, Inc. warrants 8/10/17 (a)(h) | 18,952 | | 0* |
Ultimate Software Group, Inc. (a) | 142,906 | | 13,492 |
Common Stocks - continued |
| Shares | | Value (000s) |
INFORMATION TECHNOLOGY - continued |
Software - continued |
VMware, Inc. Class A (a) | 294,800 | | $ 27,752 |
Workday, Inc. | 254,331 | | 13,861 |
Workday, Inc. (h) | 284,512 | | 13,955 |
| | 634,976 |
TOTAL INFORMATION TECHNOLOGY | | 5,794,210 |
MATERIALS - 5.0% |
Chemicals - 2.4% |
Ashland, Inc. | 306,900 | | 24,678 |
CF Industries Holdings, Inc. | 58,500 | | 11,885 |
Eastman Chemical Co. | 394,100 | | 26,819 |
Ecolab, Inc. | 864,500 | | 62,158 |
Filtrona PLC | 1,365,318 | | 12,279 |
FMC Corp. | 258,900 | | 15,151 |
LyondellBasell Industries NV Class A | 579,200 | | 33,067 |
Mexichem SAB de CV | 2,226,500 | | 12,421 |
Monsanto Co. | 1,266,200 | | 119,846 |
PPG Industries, Inc. | 486,300 | | 65,821 |
Sherwin-Williams Co. | 361,100 | | 55,544 |
Syngenta AG (Switzerland) | 78,131 | | 31,564 |
Valspar Corp. | 355,200 | | 22,164 |
W.R. Grace & Co. (a) | 235,500 | | 15,833 |
| | 509,230 |
Construction Materials - 0.0% |
Eagle Materials, Inc. | 43,200 | | 2,527 |
Containers & Packaging - 0.1% |
Ball Corp. | 360,300 | | 16,123 |
Metals & Mining - 2.4% |
Allied Nevada Gold Corp. (Canada) (a) | 177,100 | | 5,356 |
Altius Minerals Corp. (a) | 23,100 | | 226 |
B2Gold Corp. (a) | 7,220,600 | | 25,842 |
B2Gold Corp. (a)(f) | 660,000 | | 2,362 |
CGA Mining Ltd. (Canada) (a) | 5,671,800 | | 14,996 |
Colossus Minerals, Inc. (a) | 473,000 | | 2,192 |
Continental Gold Ltd. (a) | 222,400 | | 1,979 |
Dalradian Resources, Inc. (a)(d) | 2,427,900 | | 3,734 |
Dalradian Resources, Inc. (f) | 1,000,000 | | 1,538 |
Eldorado Gold Corp. | 815,803 | | 10,498 |
Endeavour Mining Corp. (a) | 3,415,195 | | 7,107 |
Common Stocks - continued |
| Shares | | Value (000s) |
MATERIALS - continued |
Metals & Mining - continued |
Franco-Nevada Corp. | 3,201,500 | | $ 182,750 |
Franco-Nevada Corp. warrants 6/16/17 (a)(f) | 62,150 | | 553 |
Freeport-McMoRan Copper & Gold, Inc. | 638,900 | | 21,850 |
Glencore International PLC (d) | 1,894,800 | | 10,946 |
Goldcorp, Inc. | 52,201 | | 1,919 |
Inmet Mining Corp. | 190,500 | | 14,174 |
Ivanplats Ltd. (f) | 1,002,800 | | 5,041 |
Ivanplats Ltd. Class A (h) | 2,789,499 | | 12,620 |
Medusa Mining Ltd. | 2,560,151 | | 14,584 |
New Gold, Inc. (a) | 4,179,900 | | 46,266 |
Newcrest Mining Ltd. | 81,391 | | 1,904 |
Novagold Resources, Inc. (a) | 2,170,200 | | 9,818 |
Pilot Gold, Inc. (a) | 2,778,800 | | 5,950 |
Premier Gold Mines Ltd. (a) | 1,637,000 | | 6,912 |
Premier Gold Mines Ltd. (f) | 900,000 | | 3,800 |
Pretium Resources, Inc. (a) | 683,300 | | 9,006 |
Primero Mining Corp. (a) | 275,500 | | 1,773 |
Royal Gold, Inc. | 340,000 | | 27,645 |
Tahoe Resources, Inc. (a) | 178,000 | | 3,257 |
Tahoe Resources, Inc. (a)(f) | 1,074,200 | | 19,655 |
Teranga Gold Corp. (a) | 72,200 | | 164 |
Turquoise Hill Resources Ltd. (a) | 3,913,304 | | 29,900 |
Yamana Gold, Inc. | 112,900 | | 1,942 |
| | 508,259 |
Paper & Forest Products - 0.1% |
International Paper Co. | 320,500 | | 12,769 |
TOTAL MATERIALS | | 1,048,908 |
TELECOMMUNICATION SERVICES - 0.1% |
Diversified Telecommunication Services - 0.0% |
inContact, Inc. (a) | 169,600 | | 879 |
tw telecom, inc. (a) | 312,000 | | 7,947 |
| | 8,826 |
Wireless Telecommunication Services - 0.1% |
Rogers Communications, Inc. Class B (non-vtg.) | 268,600 | | 12,195 |
TOTAL TELECOMMUNICATION SERVICES | | 21,021 |
Common Stocks - continued |
| Shares | | Value (000s) |
UTILITIES - 0.1% |
Multi-Utilities - 0.1% |
YTL Corp. Bhd | 19,223,626 | | $ 11,997 |
TOTAL COMMON STOCKS (Cost $15,120,078) |
20,448,338
|
Preferred Stocks - 0.2% |
| | | |
Convertible Preferred Stocks - 0.2% |
CONSUMER DISCRETIONARY - 0.0% |
Media - 0.0% |
Glam Media, Inc. Series M-1: | | | |
8.00% (h) | 165,366 | | 845 |
8.00% (h) | 11,811 | | 60 |
8.00% (h) | 11,812 | | 60 |
| | 965 |
HEALTH CARE - 0.2% |
Biotechnology - 0.1% |
bluebird bio (h) | 4,658,909 | | 2,322 |
Intarcia Therapeutics, Inc. (h) | 516,522 | | 7,040 |
| | 9,362 |
Health Care Technology - 0.0% |
Castlight Health, Inc. Series D (a)(h) | 1,325,100 | | 9,276 |
Pharmaceuticals - 0.1% |
Agios Pharmaceuticals, Inc. Series C (a)(h) | 3,363,446 | | 16,518 |
TOTAL HEALTH CARE | | 35,156 |
INFORMATION TECHNOLOGY - 0.0% |
Internet Software & Services - 0.0% |
Dropbox, Inc. Series A (h) | 299,518 | | 2,710 |
Preferred Stocks - continued |
| Shares | | Value (000s) |
Convertible Preferred Stocks - continued |
INFORMATION TECHNOLOGY - continued |
Software - 0.0% |
Trion World Network, Inc.: | | | |
Series C, 8.00% (a)(h) | 602,295 | | $ 2,578 |
Series C-1, 8.00% (a)(h) | 47,380 | | 203 |
| | 2,781 |
TOTAL INFORMATION TECHNOLOGY | | 5,491 |
TOTAL CONVERTIBLE PREFERRED STOCKS | | 41,612 |
Nonconvertible Preferred Stocks - 0.0% |
CONSUMER DISCRETIONARY - 0.0% |
Automobiles - 0.0% |
Volkswagen AG | 9,700 | | 2,226 |
TOTAL PREFERRED STOCKS (Cost $45,704) |
43,838
|
Nonconvertible Bonds - 0.0% |
| Principal Amount (000s) | | |
CONSUMER DISCRETIONARY - 0.0% |
Media - 0.0% |
Glam Media, Inc.: | | | | |
9% 11/18/13 (h) | | $ 26 | | 26 |
9% 11/18/13 (h) | | 26 | | 26 |
9% 12/2/13 (h) | | 362 | | 362 |
| | 414 |
TOTAL NONCONVERTIBLE BONDS (Cost $414) |
414
|
Money Market Funds - 2.6% |
| Shares | | Value (000s) |
Fidelity Cash Central Fund, 0.18% (b) | 420,062,615 | | $ 420,062 |
Fidelity Securities Lending Cash Central Fund, 0.18% (b)(c) | 110,038,793 | | 110,039 |
TOTAL MONEY MARKET FUNDS (Cost $530,101) |
530,101
|
TOTAL INVESTMENT PORTFOLIO - 100.6% (Cost $15,696,297) | | 21,022,691 |
NET OTHER ASSETS (LIABILITIES) - (0.6)% | | (115,324) |
NET ASSETS - 100% | $ 20,907,367 |
Legend |
(a) Non-income producing |
(b) Affiliated fund that is available only to investment companies and other accounts managed by Fidelity Investments. The rate quoted is the annualized seven-day yield of the fund at period end. A complete unaudited listing of the fund's holdings as of its most recent quarter end is available upon request. In addition, each Fidelity Central Fund's financial statements, which are not covered by the Fund's Report of Independent Registered Public Accounting Firm, are available on the SEC's website or upon request. |
(c) Investment made with cash collateral received from securities on loan. |
(d) Security or a portion of the security is on loan at period end. |
(e) Affiliated company |
(f) Security exempt from registration under Rule 144A of the Securities Act of 1933. These securities may be resold in transactions exempt from registration, normally to qualified institutional buyers. At the end of the period, the value of these securities amounted to $65,407,000 or 0.3% of net assets. |
(g) Investment is owned by an entity that is treated as a corporation for U.S. tax purposes which is owned by the Fund. |
(h) Restricted securities - Investment in securities not registered under the Securities Act of 1933 (excluding 144A issues). At the end of the period, the value of restricted securities (excluding 144A issues) amounted to $170,956,000 or 0.8% of net assets. |
Additional information on each restricted holding is as follows: |
Security | Acquisition Date | Acquisition Cost (000s) |
Agios Pharmaceuticals, Inc. Series C | 11/16/11 | $ 16,518 |
bluebird bio | 7/23/12 | $ 2,322 |
Castlight Health, Inc. Series D | 4/25/12 | $ 7,999 |
Dropbox, Inc. | 5/2/12 | $ 11,672 |
Dropbox, Inc. Series A | 5/29/12 | $ 2,710 |
Fluidigm Corp. | 10/9/07 - 1/6/11 | $ 1,992 |
Glam Media, Inc. Series M-1:
8.00% | 3/19/08 | $ 3,024 |
8.00% | 3/19/08 | $ 216 |
8.00% | 3/19/08 | $ 216 |
Glam Media, Inc.: 9% 11/18/13 | 12/2/11 | $ 26 |
9% 11/18/13 | 12/2/11 | $ 26 |
9% 12/2/13 | 12/2/11 | $ 362 |
GoviEx Uranium, Inc. | 9/28/07 - 4/6/10 | $ 7,499 |
Intarcia Therapeutics, Inc. | 11/14/12 | $ 7,040 |
Ivanplats Ltd.
Class A | 10/23/12 | $ 13,509 |
KYTHERA Biopharmaceuticals, Inc. | 8/30/11 | $ 20,000 |
Security | Acquisition Date | Acquisition Cost (000s) |
Legend Pictures LLC | 9/23/10 - 12/18/12 | $ 12,915 |
Metro Bank PLC Class A | 5/21/12 | $ 3,791 |
Mu Sigma, Inc. | 12/21/12 | $ 15,000 |
Trion World Network, Inc. warrants 8/10/17 | 8/10/10 | $ 0* |
Trion World Network, Inc. Series C, 8.00% | 8/22/08 | $ 3,307 |
Trion World Network, Inc. Series C-1, 8.00% | 8/10/10 | $ 260 |
Weinstein Co. Holdings LLC Class A-1 | 10/19/05 | $ 2,267 |
Workday, Inc. | 10/13/11 | $ 3,773 |
* Amount represents less than $1,000. |
Affiliated Central Funds |
Information regarding fiscal year to date income earned by the Fund from investments in Fidelity Central Funds is as follows: |
Fund | Income earned
(Amounts in thousands) |
Fidelity Cash Central Fund | $ 1,482 |
Fidelity Securities Lending Cash Central Fund | 2,494 |
Total | $ 3,976 |
Other Affiliated Issuers |
An affiliated company is a company in which the Fund has ownership of at least 5% of the voting securities. Fiscal year to date transactions with companies which are or were affiliates are as follows: |
Affiliate
(Amounts in thousands) | Value, beginning of period | Purchases | Sales Proceeds | Dividend Income | Value,
end of
period |
KYTHERA Biopharmaceuticals, Inc. | $ - | $ 2,497 | $ - | $ - | $ 3,213 |
KYTHERA Biopharmaceuticals, Inc. | - | - | - | - | 39,278 |
New World Oil & Gas PLC | - | 2,884 | 3,633 | - | - |
OvaScience, Inc. | - | 6,000 | - | - | 9,131 |
Rooster Energy Ltd. | - | 6,357 | 299 | - | 5,188 |
Skope Energy, Inc. | 1,193 | - | - | - | 51 |
SPS Commerce, Inc. | 25,950 | - | - | - | 37,270 |
Total | $ 27,143 | $ 17,738 | $ 3,932 | $ - | $ 94,131 |
Other Information |
The following is a summary of the inputs used, as of December 31, 2012, involving the Fund's assets and liabilities carried at fair value. The inputs or methodology used for valuing securities may not be an indication of the risk associated with investing in those securities. For more information on valuation inputs, and their aggregation into the levels used in the tables below, please refer to the Investment Valuation section in the accompanying Notes to Financial Statements. |
Valuation Inputs at Reporting Date: |
Description
(Amounts in thousands) | Total | Level 1 | Level 2 | Level 3 |
Investments in Securities: | | | | |
Equities: | | | | |
Consumer Discretionary | $ 4,122,289 | $ 4,009,794 | $ 89,169 | $ 23,326 |
Consumer Staples | 1,902,943 | 1,839,033 | 63,910 | - |
Energy | 1,152,037 | 1,139,256 | 3,620 | 9,161 |
Financials | 2,718,080 | 2,512,645 | 201,547 | 3,888 |
Health Care | 2,597,652 | 2,289,392 | 272,850 | 35,410 |
Industrials | 1,117,548 | 1,038,699 | 78,849 | - |
Information Technology | 5,799,701 | 5,598,685 | 168,853 | 32,163 |
Materials | 1,048,908 | 965,011 | 83,897 | - |
Telecommunication Services | 21,021 | 21,021 | - | - |
Utilities | 11,997 | - | 11,997 | - |
Corporate Bonds | 414 | - | - | 414 |
Money Market Funds | 530,101 | 530,101 | - | - |
Total Investments in Securities: | $ 21,022,691 | $ 19,943,637 | $ 974,692 | $ 104,362 |
The following is a summary of transfers between Level 1 and Level 2 for the period ended December 31, 2012. Transfers are assumed to have occurred at the beginning of the period, and are primarily attributable to the valuation techniques used for foreign equity securities, as discussed in the accompanying Notes to Financial Statements: |
Transfers | Total (000s) |
Level 1 to Level 2 | $ 491,741 |
Level 2 to Level 1 | $ 0 |
Distribution of investments by country or territory of incorporation, as a percentage of total net assets, is as follows. (Unaudited) |
United States of America | 87.5% |
Canada | 3.9% |
Ireland | 1.2% |
United Kingdom | 1.2% |
Korea (South) | 1.0% |
Others (Individually Less Than 1%) | 5.2% |
| 100.0% |
See accompanying notes which are an integral part of the financial statements.
Annual Report
Statement of Assets and Liabilities
Amounts in thousands (except per-share amounts) | December 31, 2012 |
| | |
Assets | | |
Investment in securities, at value (including securities loaned of $108,679) - See accompanying schedule: Unaffiliated issuers (cost $15,101,098) | $ 20,398,459 | |
Fidelity Central Funds (cost $530,101) | 530,101 | |
Other affiliated issuers (cost $65,098) | 94,131 | |
Total Investments (cost $15,696,297) | | $ 21,022,691 |
Foreign currency held at value (cost $157) | | 157 |
Receivable for investments sold | | |
Regular delivery | | 15,712 |
Delayed delivery | | 10,105 |
Receivable for fund shares sold | | 53,293 |
Dividends receivable | | 9,162 |
Interest receivable | | 40 |
Distributions receivable from Fidelity Central Funds | | 307 |
Prepaid expenses | | 62 |
Other receivables | | 913 |
Total assets | | 21,112,442 |
| | |
Liabilities | | |
Payable for investments purchased | $ 4,314 | |
Payable for fund shares redeemed | 72,928 | |
Accrued management fee | 9,050 | |
Distribution and service plan fees payable | 4,389 | |
Other affiliated payables | 3,545 | |
Other payables and accrued expenses | 810 | |
Collateral on securities loaned, at value | 110,039 | |
Total liabilities | | 205,075 |
| | |
Net Assets | | $ 20,907,367 |
Net Assets consist of: | | |
Paid in capital | | $ 16,021,944 |
Accumulated net investment loss | | (11,189) |
Accumulated undistributed net realized gain (loss) on investments and foreign currency transactions | | (429,781) |
Net unrealized appreciation (depreciation) on investments and assets and liabilities in foreign currencies | | 5,326,393 |
Net Assets | | $ 20,907,367 |
See accompanying notes which are an integral part of the financial statements.
Annual Report
Statement of Assets and Liabilities - continued
Amounts in thousands (except per-share amounts) | December 31, 2012 |
| | |
Calculation of Maximum Offering Price Class A:
Net Asset Value and redemption price per share ($6,459,221 ÷ 283,978 shares) | | $ 22.75 |
| | |
Maximum offering price per share (100/94.25 of $22.75) | | $ 24.14 |
Class T:
Net Asset Value and redemption price per share ($1,794,864 ÷ 79,979 shares) | | $ 22.44 |
| | |
Maximum offering price per share (100/96.50 of $22.44) | | $ 23.25 |
Class B:
Net Asset Value and offering price per share ($239,491 ÷ 11,206 shares)A | | $ 21.37 |
| | |
Class C:
Net Asset Value and offering price per share ($2,515,368 ÷ 117,022 shares)A | | $ 21.49 |
| | |
Institutional Class:
Net Asset Value, offering price and redemption price per share ($9,898,423 ÷ 430,000 shares) | | $ 23.02 |
A Redemption price per share is equal to net asset value less any applicable contingent deferred sales charge.
See accompanying notes which are an integral part of the financial statements.
Annual Report
Financial Statements - continued
Statement of Operations
Amounts in thousands | Year ended December 31, 2012 |
| | |
Investment Income | | |
Dividends | | $ 218,773 |
Interest | | 789 |
Income from Fidelity Central Funds | | 3,976 |
Total income | | 223,538 |
| | |
Expenses | | |
Management fee
Basic fee | $ 110,084 | |
Performance adjustment | (4,764) | |
Transfer agent fees | 39,486 | |
Distribution and service plan fees | 51,921 | |
Accounting and security lending fees | 1,734 | |
Custodian fees and expenses | 521 | |
Independent trustees' compensation | 129 | |
Registration fees | 721 | |
Audit | 112 | |
Legal | 69 | |
Miscellaneous | 184 | |
Total expenses before reductions | 200,197 | |
Expense reductions | (1,159) | 199,038 |
Net investment income (loss) | | 24,500 |
Realized and Unrealized Gain (Loss) Net realized gain (loss) on: | | |
Investment securities: | | |
Unaffiliated issuers | 860,821 | |
Other affiliated issuers | 743 | |
Foreign currency transactions | (162) | |
Total net realized gain (loss) | | 861,402 |
Change in net unrealized appreciation (depreciation) on: Investment securities | 1,859,086 | |
Assets and liabilities in foreign currencies | 6 | |
Total change in net unrealized appreciation (depreciation) | | 1,859,092 |
Net gain (loss) | | 2,720,494 |
Net increase (decrease) in net assets resulting from operations | | $ 2,744,994 |
See accompanying notes which are an integral part of the financial statements.
Annual Report
Statement of Changes in Net Assets
Amounts in thousands | Year ended
December 31, 2012 | Year ended
December 31, 2011 |
Increase (Decrease) in Net Assets | | |
Operations | | |
Net investment income (loss) | $ 24,500 | $ (45,595) |
Net realized gain (loss) | 861,402 | 606,286 |
Change in net unrealized appreciation (depreciation) | 1,859,092 | (772,221) |
Net increase (decrease) in net assets resulting
from operations | 2,744,994 | (211,530) |
Distributions to shareholders from net investment income | (8,962) | - |
Distributions to shareholders from net realized gain | (86,291) | (24,043) |
Total distributions | (95,253) | (24,043) |
Share transactions - net increase (decrease) | 1,197,565 | 1,490,230 |
Total increase (decrease) in net assets | 3,847,306 | 1,254,657 |
| | |
Net Assets | | |
Beginning of period | 17,060,061 | 15,805,404 |
End of period (including accumulated net investment loss of $11,189 and accumulated net investment loss of $22,699, respectively) | $ 20,907,367 | $ 17,060,061 |
See accompanying notes which are an integral part of the financial statements.
Annual Report
Financial Highlights - Class A
Years ended December 31, | 2012 | 2011 | 2010 | 2009 | 2008 |
Selected Per-Share Data | | | | | |
Net asset value, beginning of period | $ 19.72 | $ 19.96 | $ 17.24 | $ 13.36 | $ 21.65 |
Income from Investment Operations | | | | | |
Net investment income (loss) C | .03 | (.05) | (.05) | - I | .05 |
Net realized and unrealized gain (loss) | 3.09 | (.15) | 2.81 | 3.89 | (8.22) |
Total from investment operations | 3.12 | (.20) | 2.76 | 3.89 | (8.17) |
Distributions from net investment income | - | - | - | - | - I |
Distributions from net realized gain | (.09) | (.04) | (.04) | (.01) | (.12) |
Total distributions | (.09) | (.04) | (.04) | (.01) | (.12) |
Net asset value, end of period | $ 22.75 | $ 19.72 | $ 19.96 | $ 17.24 | $ 13.36 |
Total Return A,B | 15.84% | (1.04)% | 16.07% | 29.12% | (37.92)% |
Ratios to Average Net Assets D,G | | | | | |
Expenses before reductions | 1.01% | 1.08% | 1.14% | 1.19% | 1.10% |
Expenses net of fee waivers, if any | 1.01% | 1.08% | 1.14% | 1.19% | 1.10% |
Expenses net of all reductions | 1.00% | 1.07% | 1.13% | 1.18% | 1.10% |
Net investment income (loss) | .13% | (.23)% | (.28)% | -% F | .26% |
Supplemental Data | | | | | |
Net assets, end of period (in millions) | $ 6,459 | $ 5,809 | $ 5,603 | $ 4,265 | $ 2,614 |
Portfolio turnover rate E | 47% | 58% | 47% H | 58% | 74% |
A Total returns would have been lower if certain expenses had not been reduced during the applicable periods shown.
B Total returns do not include the effect of the sales charges.
C Calculated based on average shares outstanding during the period.
D Fees and expenses of any underlying Fidelity Central Funds are not included in the Fund's expense ratio. The Fund indirectly bears its proportionate share of the expenses of any underlying Fidelity Central Funds.
E Amount does not include the portfolio activity of any underlying Fidelity Central Funds.
F Amount represents less than .01%.
G Expense ratios reflect operating expenses of the class. Expenses before reductions do not reflect amounts reimbursed by the investment adviser or reductions from brokerage service arrangements or reductions from other expense offset arrangements and do not represent the amount paid by the class during periods when reimbursements or reductions occur. Expenses net of fee waivers reflect expenses after reimbursement by the investment adviser but prior to reductions from brokerage service arrangements or other expense offset arrangements. Expenses net of all reductions represent the net expenses paid by the class.
H The portfolio turnover rate does not include the assets acquired in the merger.
I Amount represents less than $.01 per share.
See accompanying notes which are an integral part of the financial statements.
Annual Report
Financial Highlights - Class T
Years ended December 31, | 2012 | 2011 | 2010 | 2009 | 2008 |
Selected Per-Share Data | | | | | |
Net asset value, beginning of period | $ 19.46 | $ 19.74 | $ 17.08 | $ 13.26 | $ 21.56 |
Income from Investment Operations | | | | | |
Net investment income (loss) C | (.02) | (.10) | (.09) | (.04) | - H |
Net realized and unrealized gain (loss) C | 3.04 | (.14) | 2.78 | 3.86 | (8.18) |
Total from investment operations | 3.02 | (.24) | 2.69 | 3.82 | (8.18) |
Distributions from net realized gain | (.04) | (.04) | (.03) | - | (.12) |
Net asset value, end of period | $ 22.44 | $ 19.46 | $ 19.74 | $ 17.08 | $ 13.26 |
Total Return A,B | 15.52% | (1.25)% | 15.81% | 28.81% | (38.13)% |
Ratios to Average Net Assets D,F | | | | | |
Expenses before reductions | 1.25% | 1.32% | 1.38% | 1.45% | 1.34% |
Expenses net of fee waivers, if any | 1.25% | 1.32% | 1.38% | 1.45% | 1.34% |
Expenses net of all reductions | 1.24% | 1.32% | 1.38% | 1.44% | 1.34% |
Net investment income (loss) | (.11)% | (.48)% | (.52)% | (.25)% | .02% |
Supplemental Data | | | | | |
Net assets, end of period (in millions) | $ 1,795 | $ 1,640 | $ 1,756 | $ 1,557 | $ 1,254 |
Portfolio turnover rate E | 47% | 58% | 47% G | 58% | 74% |
A Total returns would have been lower if certain expenses had not been reduced during the applicable periods shown.
B Total returns do not include the effect of the sales charges.
C Calculated based on average shares outstanding during the period.
D Fees and expenses of any underlying Fidelity Central Funds are not included in the Fund's expense ratio. The Fund indirectly bears its proportionate share of the expenses of any underlying Fidelity Central Funds.
E Amount does not include the portfolio activity of any underlying Fidelity Central Funds.
F Expense ratios reflect operating expenses of the class. Expenses before reductions do not reflect amounts reimbursed by the investment adviser or reductions from brokerage service arrangements or reductions from other expense offset arrangements and do not represent the amount paid by the class during periods when reimbursements or reductions occur. Expenses net of fee waivers reflect expenses after reimbursement by the investment adviser but prior to reductions from brokerage service arrangements or other expense offset arrangements. Expenses net of all reductions represent the net expenses paid by the class.
G The portfolio turnover rate does not include the assets acquired in the merger.
H Amount represents less than $.01 per share.
See accompanying notes which are an integral part of the financial statements.
Annual Report
Financial Highlights - Class B
Years ended December 31, | 2012 | 2011 | 2010 | 2009 | 2008 |
Selected Per-Share Data | | | | | |
Net asset value, beginning of period | $ 18.60 | $ 18.95 | $ 16.49 | $ 12.88 | $ 21.04 |
Income from Investment Operations | | | | | |
Net investment income (loss) C | (.14) | (.20) | (.19) | (.11) | (.10) |
Net realized and unrealized gain (loss) | 2.91 | (.15) | 2.68 | 3.72 | (7.94) |
Total from investment operations | 2.77 | (.35) | 2.49 | 3.61 | (8.04) |
Distributions from net realized gain | - | - | (.03) | - | (.12) |
Net asset value, end of period | $ 21.37 | $ 18.60 | $ 18.95 | $ 16.49 | $ 12.88 |
Total Return A,B | 14.89% | (1.85)% | 15.14% | 28.03% | (38.41)% |
Ratios to Average Net Assets D,F | | | | | |
Expenses before reductions | 1.82% | 1.89% | 1.96% | 2.01% | 1.91% |
Expenses net of fee waivers, if any | 1.82% | 1.89% | 1.96% | 2.00% | 1.91% |
Expenses net of all reductions | 1.81% | 1.89% | 1.95% | 1.99% | 1.91% |
Net investment income (loss) | (.68)% | (1.05)% | (1.10)% | (.81)% | (.55)% |
Supplemental Data | | | | | |
Net assets, end of period (in millions) | $ 239 | $ 309 | $ 410 | $ 401 | $ 313 |
Portfolio turnover rate E | 47% | 58% | 47% G | 58% | 74% |
A Total returns would have been lower if certain expenses had not been reduced during the applicable periods shown.
B Total returns do not include the effect of the contingent deferred sales charge.
C Calculated based on average shares outstanding during the period.
D Fees and expenses of any underlying Fidelity Central Funds are not included in the Fund's expense ratio. The Fund indirectly bears its proportionate share of the expenses of any underlying Fidelity Central Funds.
E Amount does not include the portfolio activity of any underlying Fidelity Central Funds.
F Expense ratios reflect operating expenses of the class. Expenses before reductions do not reflect amounts reimbursed by the investment adviser or reductions from brokerage service arrangements or reductions from other expense offset arrangements and do not represent the amount paid by the class during periods when reimbursements or reductions occur. Expenses net of fee waivers reflect expenses after reimbursement by the investment adviser but prior to reductions from brokerage service arrangements or other expense offset arrangements. Expenses net of all reductions represent the net expenses paid by the class.
G The portfolio turnover rate does not include the assets acquired in the merger.
See accompanying notes which are an integral part of the financial statements.
Annual Report
Financial Highlights - Class C
Years ended December 31, | 2012 | 2011 | 2010 | 2009 | 2008 |
Selected Per-Share Data | | | | | |
Net asset value, beginning of period | $ 18.70 | $ 19.03 | $ 16.55 | $ 12.92 | $ 21.10 |
Income from Investment Operations | | | | | |
Net investment income (loss) C | (.13) | (.19) | (.17) | (.11) | (.09) |
Net realized and unrealized gain (loss) | 2.92 | (.14) | 2.68 | 3.74 | (7.97) |
Total from investment operations | 2.79 | (.33) | 2.51 | 3.63 | (8.06) |
Distributions from net realized gain | - | - | (.03) | - | (.12) |
Net asset value, end of period | $ 21.49 | $ 18.70 | $ 19.03 | $ 16.55 | $ 12.92 |
Total Return A,B | 14.92% | (1.73)% | 15.21% | 28.10% | (38.39)% |
Ratios to Average Net Assets D,F | | | | | |
Expenses before reductions | 1.75% | 1.83% | 1.88% | 1.95% | 1.85% |
Expenses net of fee waivers, if any | 1.75% | 1.83% | 1.88% | 1.95% | 1.85% |
Expenses net of all reductions | 1.75% | 1.82% | 1.88% | 1.94% | 1.85% |
Net investment income (loss) | (.62)% | (.98)% | (1.02)% | (.76)% | (.49)% |
Supplemental Data | | | | | |
Net assets, end of period (in millions) | $ 2,515 | $ 2,133 | $ 2,138 | $ 1,799 | $ 1,355 |
Portfolio turnover rate E | 47% | 58% | 47% G | 58% | 74% |
A Total returns would have been lower if certain expenses had not been reduced during the applicable periods shown.
B Total returns do not include the effect of the contingent deferred sales charge.
C Calculated based on average shares outstanding during the period.
D Fees and expenses of any underlying Fidelity Central Funds are not included in the Fund's expense ratio. The Fund indirectly bears its proportionate share of the expenses of any underlying Fidelity Central Funds.
E Amount does not include the portfolio activity of any underlying Fidelity Central Funds.
F Expense ratios reflect operating expenses of the class. Expenses before reductions do not reflect amounts reimbursed by the investment adviser or reductions from brokerage service arrangements or reductions from other expense offset arrangements and do not represent the amount paid by the class during periods when reimbursements or reductions occur. Expenses net of fee waivers reflect expenses after reimbursement by the investment adviser but prior to reductions from brokerage service arrangements or other expense offset arrangements. Expenses net of all reductions represent the net expenses paid by the class.
G The portfolio turnover rate does not include the assets acquired in the merger.
See accompanying notes which are an integral part of the financial statements.
Annual Report
Financial Highlights - Institutional Class
Years ended December 31, | 2012 | 2011 | 2010 | 2009 | 2008 |
Selected Per-Share Data | | | | | |
Net asset value, beginning of period | $ 19.96 | $ 20.14 | $ 17.39 | $ 13.49 | $ 21.84 |
Income from Investment Operations | | | | | |
Net investment income (loss) B | .09 | .01 | (.01) | .03 | .09 |
Net realized and unrealized gain (loss) | 3.12 | (.15) | 2.85 | 3.93 | (8.30) |
Total from investment operations | 3.21 | (.14) | 2.84 | 3.96 | (8.21) |
Distributions from net investment income | (.02) | - | - | (.02) | (.02) |
Distributions from net realized gain | (.13) | (.04) | (.09) | (.04) | (.12) |
Total distributions | (.15) | (.04) | (.09) | (.06) | (.14) |
Net asset value, end of period | $ 23.02 | $ 19.96 | $ 20.14 | $ 17.39 | $ 13.49 |
Total Return A | 16.11% | (.73)% | 16.34% | 29.37% | (37.76)% |
Ratios to Average Net Assets C,E | | | | | |
Expenses before reductions | .74% | .81% | .89% | .96% | .86% |
Expenses net of fee waivers, if any | .74% | .81% | .89% | .96% | .86% |
Expenses net of all reductions | .74% | .81% | .89% | .95% | .85% |
Net investment income (loss) | .39% | .03% | (.04)% | .24% | .50% |
Supplemental Data | | | | | |
Net assets, end of period (in millions) | $ 9,898 | $ 7,169 | $ 5,898 | $ 4,225 | $ 2,793 |
Portfolio turnover rate D | 47% | 58% | 47% F | 58% | 74% |
A Total returns would have been lower if certain expenses had not been reduced during the applicable periods shown.
B Calculated based on average shares outstanding during the period.
C Fees and expenses of any underlying Fidelity Central Funds are not included in the Fund's expense ratio. The Fund indirectly bears its proportionate share of the expenses of any underlying Fidelity Central Funds.
D Amount does not include the portfolio activity of any underlying Fidelity Central Funds.
E Expense ratios reflect operating expenses of the class. Expenses before reductions do not reflect amounts reimbursed by the investment adviser or reductions from brokerage service arrangements or reductions from other expense offset arrangements and do not represent the amount paid by the class during periods when reimbursements or reductions occur. Expenses net of fee waivers reflect expenses after reimbursement by the investment adviser but prior to reductions from brokerage service arrangements or other expense offset arrangements. Expenses net of all reductions represent the net expenses paid by the class.
F The portfolio turnover rate does not include the assets acquired in the merger.
See accompanying notes which are an integral part of the financial statements.
Annual Report
Notes to Financial Statements
For the period ended December 31, 2012
(Amounts in thousands except percentages)
1. Organization.
Fidelity Advisor New Insights Fund (the Fund) is a fund of Fidelity Contrafund (the Trust) and is authorized to issue an unlimited number of shares. The Trust is registered under the Investment Company Act of 1940, as amended (the 1940 Act), as an open-end management investment company organized as a Massachusetts business trust. The Fund offers Class A, Class T, Class C and Institutional Class shares, each of which, along with Class B shares, has equal rights as to assets and voting privileges. Class B shares are closed to new accounts and additional purchases, except for exchanges and reinvestments. Each class has exclusive voting rights with respect to matters that affect that class. Class B shares will automatically convert to Class A shares after a holding period of seven years from the initial date of purchase. Investment income, realized and unrealized capital gains and losses, the common expenses of the Fund, and certain fund-level expense reductions, if any, are allocated on a pro-rata basis to each class based on the relative net assets of each class to the total net assets of the Fund. Each class differs with respect to transfer agent and distribution and service plan fees incurred. Certain expense reductions may also differ by class.
2. Investments in Fidelity Central Funds.
The Fund invests in Fidelity Central Funds, which are open-end investment companies available only to other investment companies and accounts managed by Fidelity Management & Research Company (FMR) and its affiliates. The Fund's Schedule of Investments lists each of the Fidelity Central Funds held as of period end, if any, as an investment of the Fund, but does not include the underlying holdings of each Fidelity Central Fund. As an Investing Fund, the Fund indirectly bears its proportionate share of the expenses of the underlying Fidelity Central Funds.
The Money Market Central Funds seek preservation of capital and current income and are managed by Fidelity Investments Money Management, Inc. (FIMM), an affiliate of FMR.
A complete unaudited list of holdings for each Fidelity Central Fund is available upon request or at the Securities and Exchange Commission (the SEC) website at www.sec.gov. In addition, the financial statements of the Fidelity Central Funds, which are not covered by the Fund's Report of Independent Registered Public Accounting Firm, are available on the SEC website or upon request.
3. Significant Accounting Policies.
The financial statements have been prepared in conformity with accounting principles generally accepted in the United States of America (GAAP), which require management to make certain estimates and assumptions at the date of the financial statements. Actual results could differ from those estimates. Subsequent events, if any, through the date that the financial statements were issued have been evaluated in the preparation of the financial statements. The following summarizes the significant accounting policies of the Fund:
Annual Report
3. Significant Accounting Policies - continued
Investment Valuation. Investments are valued as of 4:00 p.m. Eastern time on the last calendar day of the period. In accordance with valuation policies and procedures approved by the Board of Trustees (the Board), the Fund attempts to obtain prices from one or more third party pricing vendors or brokers to value its investments. When current market prices, quotations or rates are not readily available or reliable, investments will be fair valued in good faith by the FMR Fair Value Committee (the Committee), in accordance with procedures adopted by the Fund's Board. Factors used in determining fair value vary by investment type and may include market or investment specific events, changes in interest rates and credit quality. The frequency with which these procedures are used cannot be predicted and they may be utilized to a significant extent. The Committee oversees the Fund's valuation policies and procedures and is responsible for approving and reporting to the Board all fair value determinations.
The Fund categorizes the inputs to valuation techniques used to value its investments into a disclosure hierarchy consisting of three levels as shown below:
Level 1 - quoted prices in active markets for identical investments
Level 2 - other significant observable inputs (including quoted prices for similar investments, interest rates, prepayment speeds, etc.)
Level 3 - unobservable inputs (including the Fund's own assumptions based on the best information available)
Valuation techniques used to value the Fund's investments by major category are as follows:
Equity securities, including restricted securities, for which market quotations are readily available, are valued at the last reported sale price or official closing price as reported by a third party pricing vendor on the primary market or exchange on which they are traded and are categorized as Level 1 in the hierarchy. In the event there were no sales during the day or closing prices are not available, securities are valued at the last quoted bid price or may be valued using the last available price and are generally categorized as Level 2 in the hierarchy. For foreign equity securities, when significant market or security specific events arise, comparisons to the valuation of American Depositary Receipts (ADRs), futures contracts, Exchange-Traded Funds (ETFs) and certain indexes as well as quoted prices for similar securities are used and are categorized as Level 2 in the hierarchy. Utilizing these techniques may result in transfers between Level 1 and Level 2. For restricted equity securities and private placements where observable inputs are limited, assumptions about market activity and risk are used and these securities are generally categorized as Level 3 in the hierarchy.
Annual Report
Notes to Financial Statements - continued
(Amounts in thousands except percentages)
3. Significant Accounting Policies - continued
Investment Valuation - continued
Debt securities, including restricted securities, are valued based on evaluated prices received from third party pricing vendors or from brokers who make markets in such securities. For corporate bonds, pricing vendors utilize matrix pricing which considers yield or price of bonds of comparable quality, coupon, maturity and type as well as broker-supplied prices and are generally categorized as Level 2 in the hierarchy. When independent prices are unavailable or unreliable, debt securities may be valued utilizing pricing methodologies which consider similar factors that would be used by third party pricing vendors. These are generally categorized as Level 2 in the hierarchy but may be Level 3 depending on the circumstances.
Investments in open-end mutual funds, including the Fidelity Central Funds, are valued at their closing net asset value (NAV) each business day and are categorized as Level 1 in the hierarchy.
Changes in valuation techniques may result in transfers in or out of an assigned level within the disclosure hierarchy. The aggregate value of investments by input level, as of December 31, 2012, including information on transfers between Levels 1 and 2, is included at the end of the Fund's Schedule of Investments.
Foreign Currency. The Fund may use foreign currency contracts to facilitate transactions in foreign-denominated securities. Gains and losses from these transactions may arise from changes in the value of the foreign currency or if the counterparties do not perform under the contracts' terms.
Foreign-denominated assets, including investment securities, and liabilities are translated into U.S. dollars at the exchange rates at period end. Purchases and sales of investment securities, income and dividends received and expenses denominated in foreign currencies are translated into U.S. dollars at the exchange rate in effect on the transaction date.
The effects of exchange rate fluctuations on investments are included with the net realized and unrealized gain (loss) on investment securities. Other foreign currency transactions resulting in realized and unrealized gain (loss) are disclosed separately.
Investment Transactions and Income. For financial reporting purposes, the Fund's investment holdings and NAV include trades executed through the end of the last business day of the period. The NAV per share for processing shareholder transactions is calculated as of the close of business of the New York Stock Exchange (NYSE), normally 4:00 p.m. Eastern time and includes trades executed through the end of the prior business day. Gains and losses on securities sold are determined on the basis of identified
Annual Report
3. Significant Accounting Policies - continued
Investment Transactions and Income - continued
cost and may include proceeds received from litigation. Dividend income is recorded on the ex-dividend date, except for certain dividends from foreign securities where the ex-dividend date may have passed, which are recorded as soon as the Fund is informed of the ex-dividend date. Non-cash dividends included in dividend income, if any, are recorded at the fair market value of the securities received. Distributions received on securities that represent a return of capital or capital gain are recorded as a reduction of cost of investments and/or as a realized gain. The Fund estimates the components of distributions received that may be considered return of capital distributions or capital gain distributions. Interest income and distributions from the Fidelity Central Funds are accrued as earned. Interest income includes coupon interest and amortization of premium and accretion of discount on debt securities. Investment income is recorded net of foreign taxes withheld where recovery of such taxes is uncertain.
Expenses. Expenses directly attributable to a fund are charged to that fund. Expenses attributable to more than one fund are allocated among the respective funds on the basis of relative net assets or other appropriate methods. Expense estimates are accrued in the period to which they relate and adjustments are made when actual amounts are known.
Deferred Trustee Compensation. Under a Deferred Compensation Plan (the Plan), independent Trustees may elect to defer receipt of a portion of their annual compensation. Deferred amounts are invested in a cross-section of Fidelity funds, are marked-to-market and remain in the Fund until distributed in accordance with the Plan. The investment of deferred amounts and the offsetting payable to the Trustees are included in the accompanying Statement of Assets and Liabilities.
Income Tax Information and Distributions to Shareholders. Each year, the Fund intends to qualify as a regulated investment company under Subchapter M of the Internal Revenue Code, including distributing substantially all of its taxable income and realized gains. As a result, no provision for income taxes is required. As of December 31, 2012, the Fund did not have any unrecognized tax benefits in the financial statements; nor is the Fund aware of any tax positions for which it is reasonably possible that the total amounts of unrecognized tax benefits will significantly change in the next twelve months. The Fund files a U.S. federal tax return, in addition to state and local tax returns as required. A fund's federal income tax returns are subject to examination by the Internal Revenue Service (IRS) for a period of three fiscal years after they are filed. State and local tax returns may be subject to examination for an additional fiscal year depending on the jurisdiction. Foreign taxes are provided for based on the Fund's understanding of the tax rules and rates that exist in the foreign markets in which it invests.
Annual Report
Notes to Financial Statements - continued
(Amounts in thousands except percentages)
3. Significant Accounting Policies - continued
Income Tax Information and Distributions to Shareholders - continued
Distributions are declared and recorded on the ex-dividend date. Income dividends and capital gain distributions are declared separately for each class. Income and capital gain distributions are determined in accordance with income tax regulations, which may differ from GAAP.
Capital accounts within the financial statements are adjusted for permanent book-tax differences. These adjustments have no impact on net assets or the results of operations. Temporary book-tax differences will reverse in a subsequent period.
Book-tax differences are primarily due to foreign currency transactions, passive foreign investment companies (PFIC), market discount, contingent interest, partnerships, deferred trustees compensation, capital loss carryforwards, and losses deferred due to wash sales and excise tax regulations.
The federal tax cost of investment securities and unrealized appreciation (depreciation) as of period end were as follows:
Gross unrealized appreciation | $ 5,444,974 |
Gross unrealized depreciation | (276,653) |
Net unrealized appreciation (depreciation) on securities and other investments | $ 5,168,321 |
| |
Tax Cost | $ 15,854,370 |
The tax-based components of distributable earnings as of period end were as follows:
Capital loss carryforward | $ (268,609) |
Net unrealized appreciation (depreciation) | $ 5,168,321 |
Capital loss carryforwards are only available to offset future capital gains of the Fund to the extent provided by regulations and may be limited. Under the Regulated Investment Company Modernization Act of 2010 (the Act), the Fund is permitted to carry forward capital losses incurred in taxable years beginning after December 22, 2010 for an unlimited period and such capital losses are required to be used prior to any losses that expire. Capital loss carryforwards were as follows:
Fiscal year of expiration | |
2015 | $ (5,939) |
2017 | (149,558) |
2018 | (113,112) |
Total with expiration | $ (268,609) |
Annual Report
3. Significant Accounting Policies - continued
Income Tax Information and Distributions to Shareholders - continued
The Fund acquired $5,939 of its capital loss carryforward as part of a merger in a prior period. The losses acquired that will be available to offset future capital gains of the Fund will be limited to approximately $1,979 per year.
The tax character of distributions paid was as follows:
| December 31, 2012 | December 31, 2011 |
Ordinary Income | $ 95,253 | $ 24,043 |
Delayed Delivery Transactions and When-Issued Securities. During the period, the Fund transacted in securities on a delayed delivery or when-issued basis. Payment and delivery may take place after the customary settlement period for that security. The price of the underlying securities and the date when the securities will be delivered and paid for are fixed at the time the transaction is negotiated. The Fund may receive compensation for interest forgone in the purchase of a delayed delivery or when-issued security. With respect to purchase commitments, the Fund identifies securities as segregated in its records with a value at least equal to the amount of the commitment. Losses may arise due to changes in the value of the underlying securities or if the counterparty does not perform under the contract's terms, or if the issuer does not issue the securities due to political, economic, or other factors.
Restricted Securities. The Fund may invest in securities that are subject to legal or contractual restrictions on resale. These securities generally may be resold in transactions exempt from registration or to the public if the securities are registered. Disposal of these securities may involve time-consuming negotiations and expense, and prompt sale at an acceptable price may be difficult. Information regarding restricted securities is included at the end of the Fund's Schedule of Investments.
4. Purchases and Sales of Investments.
Purchases and sales of securities, other than short-term securities, aggregated $10,493,187 and $8,803,571, respectively.
Annual Report
Notes to Financial Statements - continued
(Amounts in thousands except percentages)
5. Fees and Other Transactions with Affiliates.
Management Fee. FMR and its affiliates provide the Fund with investment management related services for which the Fund pays a monthly management fee. The management fee is the sum of an individual fund fee rate that is based on an annual rate of .30% of the Fund's average net assets and an annualized group fee rate that averaged .26% during the period. The group fee rate is based upon the average net assets of all the mutual funds advised by FMR. The group fee rate decreases as assets under management increase and increases as assets under management decrease. In addition, the management fee is subject to a performance adjustment (up to a maximum of ± .20% of the Fund's average net assets over a 36 month performance period). The upward or downward adjustment to the management fee is based on the relative investment performance of the Institutional Class of the Fund as compared to an appropriate benchmark index. For the period, the total annual management fee rate, including the performance adjustment, was .53% of the Fund's average net assets.
Distribution and Service Plan Fees. In accordance with Rule 12b-1 of the 1940 Act, the Fund has adopted separate Distribution and Service Plans for each class of shares. Certain classes pay Fidelity Distributors Corporation (FDC), an affiliate of FMR, separate Distribution and Service Fees, each of which is based on an annual percentage of each class' average net assets. In addition, FDC may pay financial intermediaries for selling shares of the Fund and providing shareholder support services. For the period, the Distribution and Service Fee rates, total fees and amounts retained by FDC were as follows:
| Distribution
Fee | Service
Fee | Total Fees | Retained
by FDC |
Class A | -% | .25% | $ 15,824 | $ 391 |
Class T | .25% | .25% | 8,968 | 47 |
Class B | .75% | .25% | 2,912 | 2,192 |
Class C | .75% | .25% | 24,217 | 3,870 |
| | | $ 51,921 | $ 6,500 |
Sales Load. FDC may receive a front-end sales charge of up to 5.75% for selling Class A shares and 3.50% for selling Class T shares, some of which is paid to financial intermediaries for selling shares of the Fund. Depending on the holding period, FDC may receive contingent deferred sales charges levied on Class A, Class T, Class B, and Class C redemptions. The deferred sales charges range from 5.00% to 1.00% for Class B shares, 1.00% for Class C shares, 1.00% for certain purchases of Class A shares and .25% for certain purchases of Class T shares.
Annual Report
5. Fees and Other Transactions with Affiliates - continued
Sales Load - continued
For the period, sales charge amounts retained by FDC were as follows:
| Retained
by FDC |
Class A | $ 1,352 |
Class T | 196 |
Class B* | 333 |
Class C* | 173 |
| $ 2,054 |
* When Class B and Class C shares are initially sold, FDC pays commissions from its own resources to financial intermediaries through which the sales are made.
Transfer Agent Fees. Fidelity Investments Institutional Operations Company, Inc. (FIIOC), an affiliate of FMR, is the transfer, dividend disbursing and shareholder servicing agent for each class of the Fund. FIIOC receives account fees and asset-based fees that vary according to the account size and type of account of the shareholders of the respective classes of the Fund. FIIOC pays for typesetting, printing and mailing of shareholder reports, except proxy statements. For the period, transfer agent fees for each class were as follows:
| Amount | % of
Average
Net Assets |
Class A | $ 13,092 | .21 |
Class T | 3,551 | .20 |
Class B | 780 | .27 |
Class C | 4,950 | .20 |
Institutional Class | 17,113 | .19 |
| $ 39,486 | |
Accounting and Security Lending Fees. Fidelity Service Company, Inc. (FSC), an affiliate of FMR, maintains the Fund's accounting records. The accounting fee is based on the level of average net assets for each month. Under a separate contract, FSC administers the security lending program. The security lending fee is based on the number and duration of lending transactions.
Brokerage Commissions. The Fund placed a portion of its portfolio transactions with brokerage firms which are affiliates of the investment adviser. The commissions paid to these affiliated firms were $136 for the period.
Annual Report
Notes to Financial Statements - continued
(Amounts in thousands except percentages)
6. Committed Line of Credit.
The Fund participates with other funds managed by FMR or an affiliate in a $4.25 billion credit facility (the "line of credit") to be utilized for temporary or emergency purposes to fund shareholder redemptions or for other short-term liquidity purposes. The Fund has agreed to pay commitment fees on its pro-rata portion of the line of credit, which amounted to $51 and is reflected in Miscellaneous expenses on the Statement of Operations. During the period, there were no borrowings on this line of credit.
7. Security Lending.
The Fund lends portfolio securities through a lending agent from time to time in order to earn additional income. For equity securities, a lending agent is used and may loan securities to certain qualified borrowers, including Fidelity Capital Markets (FCM), a broker-dealer affiliated with the Fund. On the settlement date of the loan, the Fund receives collateral (in the form of U.S. Treasury obligations, letters of credit and/or cash) against the loaned securities and maintains collateral in an amount not less than 100% of the market value of the loaned securities during the period of the loan. The market value of the loaned securities is determined at the close of business of the Fund and any additional required collateral is delivered to the Fund on the next business day. If the borrower defaults on its obligation to return the securities loaned because of insolvency or other reasons, a fund could experience delays and costs in recovering the securities loaned or in gaining access to the collateral. Any cash collateral received is invested in the Fidelity Securities Lending Cash Central Fund. The value of loaned securities and cash collateral at period end are disclosed on the Fund's Statement of Assets and Liabilities. The value of securities loaned to FCM at period end was $1,721. Security lending income represents the income earned on investing cash collateral, less rebates paid to borrowers and any lending agent fees associated with the loan, plus any premium payments received for lending certain types of securities. Security lending income is presented in the Statement of Operations as a component of income from Fidelity Central Funds. Total security lending income during the period amounted to $2,494, including $112 from securities loaned to FCM.
8. Expense Reductions.
Many of the brokers with whom FMR places trades on behalf of the Fund provided services to the Fund in addition to trade execution. These services included payments of certain expenses on behalf of the Fund totaling $1,158 for the period. In addition, through arrangements with the Fund's custodian, credits realized as a result of uninvested cash balances were used to reduce the Fund's expenses. During the period, these credits reduced the Fund's custody expenses by $1.
Annual Report
9. Distributions to Shareholders.
Distributions to shareholders of each class were as follows:
Years ended December 31, | 2012 | 2011 |
From net investment income | | |
Class A | $ - | $ - |
Class T | - | - |
Class B | - | - |
Class C | - | - |
Institutional Class | 8,962 | - |
Total | $ 8,962 | $ - |
From net realized gain | | |
Class A | $ 26,405 | $ 10,098 |
Class T | 3,128 | 3,142 |
Class B | - | - |
Class C | - | - |
Institutional Class | 56,758 | 10,803 |
Total | $ 86,291 | $ 24,043 |
10. Share Transactions.
Transactions for each class of shares were as follows:
| Shares | Dollars |
Years ended December 31, | 2012 | 2011 | 2012 | 2011 |
Class A | | | | |
Shares sold | 69,742 | 90,043 | $ 1,537,976 | $ 1,820,476 |
Reinvestment of distributions | 1,068 | 439 | 24,021 | 9,175 |
Shares redeemed | (81,404) | (76,699) | (1,797,007) | (1,538,413) |
Net increase (decrease) | (10,594) | 13,783 | $ (235,010) | $ 291,238 |
Class T | | | | |
Shares sold | 13,706 | 18,906 | $ 297,340 | $ 377,982 |
Reinvestment of distributions | 128 | 139 | 2,849 | 2,869 |
Shares redeemed | (18,113) | (23,772) | (394,342) | (474,099) |
Net increase (decrease) | (4,279) | (4,727) | $ (94,153) | $ (93,248) |
Class B | | | | |
Shares sold | 265 | 510 | $ 5,463 | $ 9,732 |
Reinvestment of distributions | - | - | - | - |
Shares redeemed | (5,694) | (5,503) | (118,394) | (105,005) |
Net increase (decrease) | (5,429) | (4,993) | $ (112,931) | $ (95,273) |
Annual Report
Notes to Financial Statements - continued
(Amounts in thousands except percentages)
10. Share Transactions - continued
| Shares | Dollars |
Years ended December 31, | 2012 | 2011 | 2012 | 2011 |
Class C | | | | |
Shares sold | 22,815 | 23,065 | $ 474,829 | $ 444,337 |
Reinvestment of distributions | - | - | - | - |
Shares redeemed | (19,869) | (21,338) | (414,007) | (406,710) |
Net increase (decrease) | 2,946 | 1,727 | $ 60,822 | $ 37,627 |
Institutional Class | | | | |
Shares sold | 143,736 | 141,293 | $ 3,208,589 | $ 2,863,246 |
Reinvestment of distributions | 2,421 | 404 | 55,102 | 8,538 |
Shares redeemed | (75,358) | (75,337) | (1,684,854) | (1,521,898) |
Net increase (decrease) | 70,799 | 66,360 | $ 1,578,837 | $ 1,349,886 |
11. Other.
The Fund's organizational documents provide former and current trustees and officers with a limited indemnification against liabilities arising in connection with the performance of their duties to the Fund. In the normal course of business, the Fund may also enter into contracts that provide general indemnifications. The Fund's maximum exposure under these arrangements is unknown as this would be dependent on future claims that may be made against the Fund. The risk of material loss from such claims is considered remote.
Annual Report
To the Trustees of Fidelity Contrafund and the Shareholders of Fidelity Advisor New Insights Fund:
In our opinion, the accompanying statement of assets and liabilities, including the schedule of investments, and the related statements of operations and of changes in net assets and the financial highlights present fairly, in all material respects, the financial position of Fidelity Advisor New Insights Fund (a fund of Fidelity Contrafund) at December 31, 2012, the results of its operations for the year then ended, the changes in its net assets for each of the two years in the period then ended and the financial highlights for each of the five years in the period then ended, in conformity with accounting principles generally accepted in the United States of America. These financial statements and financial highlights (hereafter referred to as "financial statements") are the responsibility of the Fidelity Advisor New Insights Fund's management. Our responsibility is to express an opinion on these financial statements based on our audits. We conducted our audits of these financial statements in accordance with the standards of the Public Company Accounting Oversight Board (United States). Those standards require that we plan and perform the audit to obtain reasonable assurance about whether the financial statements are free of material misstatement. An audit includes examining, on a test basis, evidence supporting the amounts and disclosures in the financial statements, assessing the accounting principles used and significant estimates made by management, and evaluating the overall financial statement presentation. We believe that our audits, which included confirmation of securities at December 31, 2012 by correspondence with the custodian and brokers, provide a reasonable basis for our opinion.
PricewaterhouseCoopers LLP
Boston, Massachusetts
February 15, 2013
Annual Report
The Trustees, Members of the Advisory Board, and executive officers of the trust and fund, as applicable, are listed below. The Board of Trustees governs the fund and is responsible for protecting the interests of shareholders. The Trustees are experienced executives who meet periodically throughout the year to oversee the fund's activities, review contractual arrangements with companies that provide services to the fund, oversee management of the risks associated with such activities and contractual arrangements, and review the fund's performance. Except for James C. Curvey, each of the Trustees oversees 234 funds advised by FMR or an affiliate. Mr. Curvey oversees 452 funds advised by FMR or an affiliate.
The Trustees hold office without limit in time except that (a) any Trustee may resign; (b) any Trustee may be removed by written instrument, signed by at least two-thirds of the number of Trustees prior to such removal; (c) any Trustee who requests to be retired or who has become incapacitated by illness or injury may be retired by written instrument signed by a majority of the other Trustees; and (d) any Trustee may be removed at any special meeting of shareholders by a two-thirds vote of the outstanding voting securities of the trust. Each Trustee who is not an interested person (as defined in the 1940 Act) (Independent Trustee), shall retire not later than the last day of the calendar year in which his or her 75th birthday occurs. The Independent Trustees may waive this mandatory retirement age policy with respect to individual Trustees. The executive officers and Advisory Board Members hold office without limit in time, except that any officer and Advisory Board Member may resign or may be removed by a vote of a majority of the Trustees at any regular meeting or any special meeting of the Trustees. Except as indicated, each individual has held the office shown or other offices in the same company for the past five years.
Experience, Skills, Attributes, and Qualifications of the Fund's Trustees. The Governance and Nominating Committee has adopted a statement of policy that describes the experience, qualifications, attributes, and skills that are necessary and desirable for potential Independent Trustee candidates (Statement of Policy). The Board believes that each Trustee satisfied at the time he or she was initially elected or appointed a Trustee, and continues to satisfy, the standards contemplated by the Statement of Policy. The Governance and Nominating Committee also engages professional search firms to help identify potential Independent Trustee candidates who have the experience, qualifications, attributes, and skills consistent with the Statement of Policy. From time to time, additional criteria based on the composition and skills of the current Independent Trustees, as well as experience or skills that may be appropriate in light of future changes to board composition, business conditions, and regulatory or other developments, have also been considered by the professional search firms and the Governance and Nominating Committee. In addition, the Board takes into account the Trustees' commitment and participation in Board and committee meetings, as well as their leadership of standing and ad hoc committees throughout their tenure.
In determining that a particular Trustee was and continues to be qualified to serve as a Trustee, the Board has considered a variety of criteria, none of which, in isolation, was controlling. The Board believes that, collectively, the Trustees have balanced and diverse experience, qualifications, attributes, and skills, which allow the Board to operate effectively in governing the fund and protecting the interests of shareholders. Information about the specific experience, skills, attributes, and qualifications of each Trustee, which in each case led to the Board's conclusion that the Trustee should serve (or continue to serve) as a trustee of the fund, is provided below.
Annual Report
Board Structure and Oversight Function. James C. Curvey is an interested person (as defined in the 1940 Act) and currently serves as Chairman. The Trustees have determined that an interested Chairman is appropriate and benefits shareholders because an interested Chairman has a personal and professional stake in the quality and continuity of services provided to the fund. Independent Trustees exercise their informed business judgment to appoint an individual of their choosing to serve as Chairman, regardless of whether the Trustee happens to be independent or a member of management. The Independent Trustees have determined that they can act independently and effectively without having an Independent Trustee serve as Chairman and that a key structural component for assuring that they are in a position to do so is for the Independent Trustees to constitute a substantial majority for the Board. The Independent Trustees also regularly meet in executive session. Ned C. Lautenbach serves as Chairman of the Independent Trustees and as such (i) acts as a liaison between the Independent Trustees and management with respect to matters important to the Independent Trustees and (ii) with management prepares agendas for Board meetings.
Fidelity funds are overseen by different Boards of Trustees. The fund's Board oversees Fidelity's equity and high income funds and another Board oversees Fidelity's investment-grade bond, money market, and asset allocation funds. The asset allocation funds may invest in Fidelity funds overseen by the fund's Board. The use of separate Boards, each with its own committee structure, allows the Trustees of each group of Fidelity funds to focus on the unique issues of the funds they oversee, including common research, investment, and operational issues. On occasion, the separate Boards establish joint committees to address issues of overlapping consequences for the Fidelity funds overseen by each Board.
The Trustees operate using a system of committees to facilitate the timely and efficient consideration of all matters of importance to the Trustees, the fund, and fund shareholders and to facilitate compliance with legal and regulatory requirements and oversight of the fund's activities and associated risks. The Board, acting through its committees, has charged FMR and its affiliates with (i) identifying events or circumstances the occurrence of which could have demonstrably adverse effects on the fund's business and/or reputation; (ii) implementing processes and controls to lessen the possibility that such events or circumstances occur or to mitigate the effects of such events or circumstances if they do occur; and (iii) creating and maintaining a system designed to evaluate continuously business and market conditions in order to facilitate the identification and implementation processes described in (i) and (ii) above. Because the day-to-day operations and activities of the fund are carried out by or through FMR, its affiliates and other service providers, the fund's exposure to risks is mitigated but not eliminated by the processes overseen by the Trustees. While each of the Board's committees has responsibility for overseeing different aspects of the fund's activities, oversight is exercised primarily through the Operations, Audit, and Compliance Committees. In addition, the Independent Trustees have worked with FMR to enhance the Board's oversight of investment and financial risks, legal and regulatory risks, technology risks, and operational risks, including the development of additional risk reporting to the Board. For example, a working group comprised of Independent Trustees and FMR has worked and continues to work to review the Fidelity funds' valuation-related activities, reporting and risk management. Appropriate personnel, including but not limited to the fund's Chief Compliance Officer (CCO), FMR's internal auditor, the independent accountants, the fund's Treasurer and portfolio management personnel, make periodic reports to the Board's committees, as appropriate, including an annual review of FMR's risk management program for the Fidelity funds. The responsibilities of each standing committee, including their oversight responsibilities, are described further under "Standing Committees of the Fund's Trustees."
Annual Report
Trustees and Officers - continued
The fund's Statement of Additional Information (SAI) includes more information about the Trustees. To request a free copy, call Fidelity at 1-877-208-0098.
Interested Trustees*:
Correspondence intended for each Trustee who is an interested person may be sent to Fidelity Investments, 82 Devonshire Street, Boston, Massachusetts 02109.
Name, Age; Principal Occupations and Other Relevant Experience+ |
James C. Curvey (77) |
| Year of Election or Appointment: 2007 Mr. Curvey is Trustee and Chairman of the Board of Trustees of certain Trusts. Mr. Curvey also serves as Trustee (2007-present) of other investment companies advised by FMR. Mr. Curvey is a Director of Fidelity Investments Money Management, Inc. (2009-present), Director of Fidelity Research & Analysis Co. (2009-present) and Director of FMR and FMR Co., Inc. (2007-present). Mr. Curvey is also Vice Chairman (2007-present) and Director of FMR LLC. In addition, Mr. Curvey serves as an Overseer for the Boston Symphony Orchestra and a member of the Trustees of Villanova University. Previously, Mr. Curvey was the Vice Chairman (2006-2007) and Director (2000-2007) of FMR Corp. |
Ronald P. O'Hanley (55) |
| Year of Election or Appointment: 2011 Mr. O'Hanley is Director of FMR Co., Inc. (2010-present), Director of Fidelity Investments Money Management, Inc. (2010-present), Director of Fidelity Research & Analysis Company (2010-present), President of Fidelity Asset Management and Corporate Services and a member of Fidelity's Executive Committee (2010-present). Previously, Mr. O'Hanley served as President and Chief Executive Officer of BNY Mellon Asset Management (2007-2010). Mr. O'Hanley also served as Vice Chairman of Bank New York Mellon Corp. and a member of that firm's Executive Committee. Prior to the 2007 merger of The Bank of New York and Mellon Financial Corporation, he was Vice Chairman of Mellon Financial Corporation and President and Chief Executive Officer of Mellon Asset Management. He joined Mellon in February 1997. Mr. O'Hanley currently serves as Chairman of the Boston Public Library Foundation Board of Directors and sits on the Board of Directors of Beth Israel Deaconess Medical Center, the Board of Trustees of the Marine Biological Laboratory and the Advisory Board of the Maxwell School of Citizenship and Public Administration at Syracuse University. Mr. O'Hanley also chairs the Council on Asset Management for the Financial Services Roundtable and is a member of the Board of Directors of Institutional Investor's U.S. Institute. |
* Trustees have been determined to be "Interested Trustees" by virtue of, among other things, their affiliation with the trust or various entities under common control with FMR.
+ The information above includes each Trustee's principal occupation during the last five years and other information relating to the experience, attributes, and skills relevant to each Trustee's qualifications to serve as a Trustee, which led to the conclusion that each Trustee should serve as a Trustee for the fund.
Annual Report
Trustees and Officers - continued
Independent Trustees:
Correspondence intended for each Independent Trustee (that is, the Trustees other than the Interested Trustees) may be sent to Fidelity Investments, P.O. Box 55235, Boston, Massachusetts 02205-5235.
Name, Age; Principal Occupations and Other Relevant Experience+ |
Dennis J. Dirks (64) |
| Year of Election or Appointment: 2005 Prior to his retirement in May 2003, Mr. Dirks was Chief Operating Officer and a member of the Board of The Depository Trust & Clearing Corporation (DTCC). He also served as President, Chief Operating Officer, and Board member of The Depository Trust Company (DTC) and President and Board member of the National Securities Clearing Corporation (NSCC). In addition, Mr. Dirks served as Chief Executive Officer and Board member of the Government Securities Clearing Corporation, Chief Executive Officer and Board member of the Mortgage-Backed Securities Clearing Corporation, as a Trustee and a member of the Finance Committee of Manhattan College (2005-2008), and as a Trustee and a member of the Finance Committee of AHRC of Nassau County (2006-2008). Mr. Dirks is a member of the Independent Directors Council (IDC) Governing Council (2010-present) and Board of Directors for The Brookville Center for Children's Services, Inc. (2009-present). |
Alan J. Lacy (59) |
| Year of Election or Appointment: 2008 Mr. Lacy serves as Senior Adviser (2007-present) of Oak Hill Capital Partners, L.P. (private equity). Mr. Lacy also served as Chief Executive Officer (2000-2005) and Vice Chairman (2005-2006) of Sears Holdings Corporation and Sears, Roebuck and Co. (retail). In addition, Mr. Lacy serves as a member of the Board of Directors of Dave & Buster's Entertainment, Inc. (restaurant and entertainment complexes, 2010-present), Earth Fare, Inc. (retail grocery, 2012-present), The Hillman Companies, Inc. (hardware wholesalers, 2010-present), and Bristol-Myers Squibb Company (global pharmaceuticals, 2008-present). Mr. Lacy is a member of the Board of Trustees of The National Parks Conservation Association (2006-present). Previously, Mr. Lacy served as Chairman of the Board of Trustees of the National Parks Conservation Association (2008-2011) and as a member of the Board of Directors for the Western Union Company (global money transfer, 2006-2011). |
Ned C. Lautenbach (68) |
| Year of Election or Appointment: 2000 Mr. Lautenbach is Chairman of the Independent Trustees of the Equity and High Income Funds (2006-present). Mr. Lautenbach currently serves as the Lead Director of the Eaton Corporation Board of Directors (diversified industrial, 1997-present). Mr. Lautenbach is Chairman of the Board of Directors of the Philharmonic Center for the Arts in Naples, Florida (2012-present) and a member of the Council on Foreign Relations (1994-present). Previously, Mr. Lautenbach was a Partner/Advisory Partner at Clayton, Dubilier & Rice, LLC (private equity investment, 1998-2010), as well as a Director of Sony Corporation (2006-2007). |
Joseph Mauriello (68) |
| Year of Election or Appointment: 2008 Prior to his retirement in January 2006, Mr. Mauriello served in numerous senior management positions including Deputy Chairman and Chief Operating Officer (2004-2005), and Vice Chairman of Financial Services (2002-2004) of KPMG LLP US (professional services, 1965-2005). Mr. Mauriello currently serves as a member of the Board of Directors of XL Group plc. (global insurance and re-insurance, 2006-present). Previously, Mr. Mauriello served as a Director of the Hamilton Funds of the Bank of New York (2006-2007) and of Arcadia Resources Inc. (health care services and products, 2007-2012). |
Robert W. Selander (62) |
| Year of Election or Appointment: 2011 Previously, Mr. Selander served as a Member of the Advisory Board of Fidelity's Equity and High Income Funds (2011), Executive Vice Chairman (2010), Chief Executive Officer (2009-2010), and President and Chief Executive Officer (1997-2009) of Mastercard, Inc. |
Cornelia M. Small (68) |
| Year of Election or Appointment: 2005 Ms. Small is a member of the Board of Directors (2009-present) and Chair of the Investment Committee (2010-present) of the Teagle Foundation. Ms. Small also serves on the Investment Committee of the Berkshire Taconic Community Foundation (2008-present). Previously, Ms. Small served as Chairperson (2002-2008) and a member of the Investment Committee and Chairperson (2008-2012) and a member of the Board of Trustees of Smith College. In addition, Ms. Small served as Chief Investment Officer, Director of Global Equity Investments, and a member of the Board of Directors of Scudder, Stevens & Clark and Scudder Kemper Investments. |
William S. Stavropoulos (73) |
| Year of Election or Appointment: 2001 Mr. Stavropoulos is Vice Chairman of the Independent Trustees of the Equity and High Income Funds (2006-present). Mr. Stavropoulos serves as President and Founder of the Michigan Baseball Foundation, the Great Lakes Loons (2007-present). Mr. Stavropoulos is Chairman Emeritus of the Board of Directors of The Dow Chemical Company, where he previously served in numerous senior management positions, including President, CEO (1995-2000; 2002-2004), Chairman of the Executive Committee (2000-2006), and as a member of the Board of Directors (1990-2006). Currently, Mr. Stavropoulos is a Director of Univar Inc. (global distributor of commodity and specialty chemicals, Chairman from 2010-May 2012 and Lead Director from May 2012-present), Teradata Corporation (data warehousing and technology solutions, 2008-present), Maersk Inc. (industrial conglomerate), and Tyco International, Ltd. (multinational manufacturing and services, 2007-present), and a member of the Advisory Board for Metalmark Capital LLC (private equity investment, 2005-present). Mr. Stavropoulos is an operating advisor to Clayton, Dubilier & Rice, LLC (private equity investment). In addition, Mr. Stavropoulos is a member of the University of Notre Dame Advisory Council for the College of Science, a Trustee of the Rollin L. Gerstacker Foundation, and a Director of the Naples Philharmonic Center for the Arts. Previously, Mr. Stavropoulos served as a Director of Chemical Financial Corporation (bank holding company, 1993-2012). |
David M. Thomas (63) |
| Year of Election or Appointment: 2008 Previously, Mr. Thomas served as Executive Chairman (2005-2006) and Chairman and Chief Executive Officer (2000-2005) of IMS Health, Inc. (pharmaceutical and healthcare information solutions), and a Director of Fortune Brands, Inc. (consumer products, 2000-2011). In addition, Mr. Thomas serves as Non-Executive Chairman of the Board of Directors of Fortune Brands Home and Security (home and security products, 2011-present), and as a member of the Board of Directors of Interpublic Group of Companies, Inc. (marketing communication, 2004-present). |
Michael E. Wiley (62) |
| Year of Election or Appointment: 2008 Mr. Wiley also serves as a Director of Asia Pacific Exploration Consolidated (international oil and gas exploration and production, 2008-present). Mr. Wiley serves as a Director of Tesoro Corporation (independent oil refiner and marketer, 2005-present), and a Director of Bill Barrett Corporation (exploration and production, 2005-present). In addition, Mr. Wiley also serves as a Director of Post Oak Bank (privately-held bank, 2004-present). Previously, Mr. Wiley served as a member of the Board of Trustees of the University of Tulsa (2000-2006; 2007-2010), as a Senior Energy Advisor of Katzenbach Partners, LLC (consulting, 2006-2007), as an Advisory Director of Riverstone Holdings (private investment), Chairman, President, and CEO of Baker Hughes, Inc. (oilfield services, 2000-2004), and as Director of Spinnaker Exploration Company (exploration and production, 2001-2005). |
+ The information above includes each Trustee's principal occupation during the last five years and other information relating to the experience, attributes, and skills relevant to each Trustee's qualifications to serve as a Trustee, which led to the conclusion that each Trustee should serve as a Trustee for the fund.
Advisory Board Members and Executive Officers:
Correspondence intended for David A. Rosow and Garnett A. Smith may be sent to Fidelity Investments, P.O. Box 55235, Boston, Massachusetts 02205-5235. Correspondence intended for each executive officer and Peter S. Lynch may be sent to Fidelity Investments, 82 Devonshire Street, Boston, Massachusetts 02109.
Name, Age; Principal Occupation |
Peter S. Lynch (68) |
| Year of Election or Appointment: 2003 Member of the Advisory Board of Fidelity's Equity and High Income Funds. Mr. Lynch is Vice Chairman and a Director of FMR and FMR Co., Inc. In addition, Mr. Lynch serves as a Trustee of Boston College and as the Chairman of the Inner-City Scholarship Fund. Previously, Mr. Lynch served on the Special Olympics International Board of Directors (1997-2006). |
David A. Rosow (70) |
| Year of Election or Appointment: 2012 Member of the Advisory Board of Fidelity's Equity and High Income Funds. Chairman and Chief Executive Officer of International Golf Group, Inc. (golf course development, 1989-present). Previously, Mr. Rosow served as Chairman and Chief Executive Officer of Rosow & Company, Inc. (private investment company, 1989-2011), a Lead Director of Hudson United Bancorp (2001-2006) and as a Director of TD Banknorth (1996-2006). In addition, Mr. Rosow is a member (2008-present) and President (2009-present) of the Town Council of Palm Beach, Florida. |
Garnett A. Smith (65) |
| Year of Election or Appointment: 2012 Member of the Advisory Board of Fidelity's Equity and High Income Funds. Prior to Mr. Smith's retirement, he served as Chairman and Chief Executive Officer of Inbrand Corp. (manufacturer of personal absorbent products, 1990-1997). He also served as President (1986-1990) of Inbrand Corp. Prior to his employment with Inbrand Corp., he was employed by a retail fabric chain and North Carolina National Bank. In addition, Mr. Smith is a board member of the Jackson Hole Land Trust (2009-present). |
Kenneth B. Robins (43) |
| Year of Election or Appointment: 2008 President and Treasurer of Fidelity's Equity and High Income Funds. Mr. Robins also serves as President and Treasurer (2010-present) and Assistant Treasurer (2009-present) of other Fidelity funds and is an employee of Fidelity Investments (2004-present). Previously, Mr. Robins served as Deputy Treasurer of the Fidelity funds (2005-2008) and Treasurer and Chief Financial Officer of The North Carolina Capital Management Trust: Cash and Term Portfolios (2006-2008). |
Bruce T. Herring (47) |
| Year of Election or Appointment: 2006 Vice President of certain Equity Funds. Mr. Herring also serves as President of Fidelity Research & Analysis Company (2010-present), Chief Investment Officer and Director of Fidelity Management & Research (U.K.) Inc. (2010-present) and Group Chief Investment Officer of FMR. Previously, Mr. Herring served as Vice President (2005-2006) and Senior Vice President (2006-2007) of Fidelity Management & Research Company, Vice President of FMR Co., Inc. (2001-2007) and as a portfolio manager for Fidelity U.S. Equity Funds. |
Brian B. Hogan (48) |
| Year of Election or Appointment: 2009 Vice President of Equity and High Income Funds. Mr. Hogan also serves as President of FMR's Equity Division (2009-present). Previously, Mr. Hogan served as Senior Vice President, Equity Research of FMR (2006-2009) and as a portfolio manager. |
Scott C. Goebel (44) |
| Year of Election or Appointment: 2008 Secretary and Chief Legal Officer (CLO) of the Fidelity funds. Mr. Goebel also serves as Secretary of Fidelity Investments Money Management, Inc. (FIMM) (2010-present) and Fidelity Research and Analysis Company (FRAC) (2010-present); Secretary and CLO of The North Carolina Capital Management Trust: Cash and Term Portfolios (2008-present); General Counsel, Secretary, and Senior Vice President of FMR (2008-present) and FMR Co., Inc. (2008-present); employed by FMR LLC or an affiliate (2001-present); Chief Legal Officer of Fidelity Management & Research (Hong Kong) Limited (2008-present) and Assistant Secretary of Fidelity Management & Research (Japan) Inc. (2008-present), and Fidelity Management & Research (U.K.) Inc. (2008-present). Previously, Mr. Goebel served as Assistant Secretary of FIMM (2008-2010), FRAC (2008-2010), and the Funds (2007-2008) and as Vice President and Secretary of Fidelity Distributors Corporation (FDC) (2005-2007). |
William C. Coffey (43) |
| Year of Election or Appointment: 2009 Assistant Secretary of Fidelity's Equity and High Income Funds. Mr. Coffey also serves as Senior Vice President and Deputy General Counsel of FMR LLC (2010-present), and is an employee of Fidelity Investments. Previously, Mr. Coffey served as Vice President and Associate General Counsel of FMR LLC (2005-2009). |
Elizabeth Paige Baumann (44) |
| Year of Election or Appointment: 2012 Anti-Money Laundering (AML) Officer of the Fidelity funds. Ms. Baumann also serves as AML Officer of The North Carolina Capital Management Trust: Cash and Term Portfolios (2012-present), Chief AML Officer of FMR LLC (2012-present), and is an employee of Fidelity Investments. Previously, Ms. Baumann served as Vice President and Deputy Anti-Money Laundering Officer (2007-2012). |
Christine Reynolds (54) |
| Year of Election or Appointment: 2008 Chief Financial Officer of the Fidelity funds. Ms. Reynolds became President of Fidelity Pricing and Cash Management Services (FPCMS) in August 2008. Ms. Reynolds served as Chief Operating Officer of FPCMS (2007-2008). Previously, Ms. Reynolds served as President, Treasurer, and Anti-Money Laundering officer of the Fidelity funds (2004-2007). |
Joseph A. Hanlon (44) |
| Year of Election or Appointment: 2012 Chief Compliance Officer of Fidelity's Equity and High Income Funds. Mr. Hanlon serves as Compliance Officer of FMR, FMR Co., Inc., Fidelity Investments Money Management, Inc. (FIMM), Fidelity Research and Analysis Company (FRAC), Fidelity Management & Research (Japan) Inc., Fidelity Management & Research (U.K.) Inc., Fidelity Management & Research (Hong Kong), and Strategic Advisers, Inc. (2009-present), as Senior Vice President of the Fidelity Asset Management Division (2009-present), and is an employee of Fidelity Investments. |
Joseph F. Zambello (55) |
| Year of Election or Appointment: 2011 Deputy Treasurer of the Fidelity funds. Mr. Zambello is an employee of Fidelity Investments. Previously, Mr. Zambello served as Vice President of FMR's Program Management Group (2009-2011) and Vice President of the Transfer Agent Oversight Group (2005-2009). |
Adrien E. Deberghes (45) |
| Year of Election or Appointment: 2008 Deputy Treasurer of Fidelity's Equity and High Income Funds. Mr. Deberghes also serves as Vice President (2011-present) and Assistant Treasurer (2010-present) of other Fidelity funds, and is an employee of Fidelity Investments (2008-present). Previously, Mr. Deberghes served as Senior Vice President of Mutual Fund Administration at State Street Corporation (2007-2008), Senior Director of Mutual Fund Administration at Investors Bank & Trust (2005-2007), and Director of Finance for Dunkin' Brands (2000-2005). |
Stephen Sadoski (41) |
| Year of Election or Appointment: 2012 Deputy Treasurer of Fidelity's Equity and High Income Funds. Mr. Sadoski also serves as Deputy Treasurer of other Fidelity funds (2013-present) and is an employee of Fidelity Investments (2012-present). Previously, Mr. Sadoski served as Assistant Treasurer of Fidelity's Fixed Income and Asset Allocation Funds (2012-2013), an assistant chief accountant in the Division of Investment Management of the Securities and Exchange Commission (SEC) (2009-2012) and as a senior manager at Deloitte & Touche (1997-2009). |
Stacie Smith (38) |
| Year of Election or Appointment: 2013 Deputy Treasurer of Fidelity's Equity and High Income Funds. Ms. Smith is an employee of Fidelity Investments (2009-present). Previously, Ms. Smith served as Senior Audit Manager of Ernst & Young LLP (1996-2009). |
Stephanie J. Dorsey (43) |
| Year of Election or Appointment: 2010 Assistant Treasurer of Fidelity's Equity and High Income Funds. Ms. Dorsey also serves as President and Treasurer (2013-present) and Assistant Treasurer (2012-present) of other Fidelity funds and is an employee of Fidelity Investments (2008-present). Previously, Ms. Dorsey served as Deputy Treasurer of Fidelity's Fixed Income and Asset Allocation Funds (2008-2013), Treasurer (2004-2008) of the JPMorgan Mutual Funds and Vice President (2004-2008) of JPMorgan Chase Bank. |
John R. Hebble (54) |
| Year of Election or Appointment: 2009 Assistant Treasurer of Fidelity's Equity and High Income Funds. Mr. Hebble also serves as President (2011-present), Treasurer, and Chief Financial Officer of The North Carolina Capital Management Trust: Cash and Term Portfolios (2008-present) and is an employee of Fidelity Investments. Previously, Mr. Hebble served as President and Treasurer of Fidelity's Fixed Income and Asset Allocation Funds (2008-2013). |
Gary W. Ryan (54) |
| Year of Election or Appointment: 2005 Assistant Treasurer of the Fidelity funds. Mr. Ryan is an employee of Fidelity Investments. Previously, Mr. Ryan served as Vice President of Fund Reporting in Fidelity Pricing and Cash Management Services (FPCMS) (1999-2005). |
Jonathan Davis (44) |
| Year of Election or Appointment: 2010 Assistant Treasurer of the Fidelity funds. Mr. Davis is also Assistant Treasurer of Fidelity Rutland Square Trust II and Fidelity Commonwealth Trust II. Mr. Davis is an employee of Fidelity Investments. Previously, Mr. Davis served as Vice President and Associate General Counsel of FMR LLC (2003-2010). |
Annual Report
Class A and Class T designate 100% of the dividends distributed during the fiscal year as qualifying for the dividends-received deduction for corporate shareholders.
Class A and Class T designate 100% of the dividends distributed during the fiscal year as amounts which may be taken into account as a dividend for purposes of the maximum rate under section 1(h)(11) of the Internal Revenue Code.
The fund will notify shareholders in January 2013 of amounts for use in preparing 2012 income tax returns.
Annual Report
Board Approval of Investment Advisory Contracts and Management Fees
Fidelity Advisor New Insights Fund
Each year, the Board of Trustees, including the Independent Trustees (together, the Board), votes on the renewal of the management contract and sub-advisory agreements (together, the Advisory Contracts) for the fund. The Board, assisted by the advice of fund counsel and Independent Trustees' counsel, requests and considers a broad range of information relevant to the renewal of the Advisory Contracts throughout the year.
The Board meets regularly and, at each of its meetings, considers factors that are relevant to its annual consideration of the renewal of the fund's Advisory Contracts, including the services and support provided to the fund and its shareholders. The Board has established various standing committees, each composed of and chaired by Independent Trustees with varying backgrounds, to which the Board has assigned specific subject matter responsibilities in order to enhance effective decision-making by the Board. The Board, acting directly and through its Committees, requests and receives information concerning the annual consideration of the renewal of the fund's Advisory Contracts. The Board also meets as needed to consider matters specifically related to the Board's annual consideration of the renewal of Advisory Contracts. Members of the Board may also meet with trustees of other Fidelity funds through ad hoc joint committees to discuss certain matters relevant to the Fidelity funds.
At its July 2012 meeting, the Board of Trustees, including the Independent Trustees, unanimously determined to renew the fund's Advisory Contracts. In reaching its determination, the Board considered all factors it believed relevant, including (i) the nature, extent, and quality of the services to be provided to the fund and its shareholders (including the investment performance of the fund); (ii) the competitiveness of the fund's management fee and total expense ratio relative to peer funds; (iii) the total costs of the services to be provided by and the profits to be realized by Fidelity from its relationship with the fund; (iv) the extent to which economies of scale exist and would be realized as the fund grows; and (v) whether fee levels reflect these economies of scale, if any, for the benefit of fund shareholders.
In considering whether to renew the Advisory Contracts for the fund, the Board reached a determination, with the assistance of fund counsel and Independent Trustees' counsel and through the exercise of its business judgment, that the renewal of the Advisory Contracts is in the best interests of the fund and its shareholders and that the compensation payable under the Advisory Contracts is fair and reasonable. The Board's decision to renew the Advisory Contracts was not based on any single factor, but rather was based on a comprehensive consideration of all the information provided to the Board at its meetings throughout the year. The Board, in reaching its determination to renew the Advisory Contracts, is aware that shareholders in the fund have a broad range of investment choices available to them, including a wide choice among mutual funds offered by Fidelity's competitors, and that the fund's shareholders, who have the opportunity to review and weigh the disclosure provided by the fund in its prospectus and other public disclosures, have chosen to invest in this fund, managed by Fidelity.
Annual Report
Nature, Extent, and Quality of Services Provided. The Board considered the staffing within the investment adviser, FMR, and the sub-advisers (together, the Investment Advisers), including the backgrounds of the fund's investment personnel, and also considered the fund's investment objective, strategies, and related investment philosophy. The Independent Trustees also had discussions with senior management of Fidelity's investment operations and investment groups. The Board considered the structure of the portfolio manager compensation program and whether this structure provides appropriate incentives to act in the best interests of the fund.
Resources Dedicated to Investment Management and Support Services. The Board and the Fund Oversight and Research Committees reviewed the general qualifications and capabilities of the Investment Advisers' investment staff, including its size, education, experience, and resources, as well as the Investment Advisers' approach to recruiting, training, managing, and compensating investment personnel. The Board also noted that FMR has continued to increase the resources devoted to non-U.S. offices, including expansion of Fidelity's global investment organization. The Board noted that Fidelity's analysts have extensive resources, tools and capabilities that allow them to conduct sophisticated quantitative and fundamental analysis, as well as credit analysis of issuers, counterparties and guarantors. The Board also believes that Fidelity's investment professionals have sufficient access to global information and data so as to provide competitive investment results over time, and that those professionals also have access to sophisticated tools that permit them to assess portfolio construction and risk and performance attribution characteristics continuously, as well as to transmit new information and research conclusions rapidly around the world. Additionally, in its deliberations, the Board considered the Investment Advisers' trading and risk management capabilities and resources, which are an integral part of the investment management process.
Shareholder and Administrative Services. The Board considered (i) the nature, extent, quality, and cost of advisory, administrative, and shareholder services performed by the Investment Advisers and their affiliates under the Advisory Contracts and under separate agreements covering transfer agency, pricing and bookkeeping, and securities lending services for the fund; (ii) the nature and extent of the supervision of third party service providers, principally custodians and subcustodians; and (iii) the resources devoted to, and the record of compliance with, the fund's compliance policies and procedures. The Board also reviewed the allocation of fund brokerage, including allocations to brokers affiliated with the Investment Advisers, the use of brokerage commissions to pay fund expenses, and the use of "soft" commission dollars to pay for research services.
Annual Report
Board Approval of Investment Advisory Contracts and
Management Fees - continued
The Board noted that the growth of fund assets over time across the complex allows Fidelity to reinvest in the development of services designed to enhance the value or convenience of the Fidelity funds as investment vehicles. These services include 24-hour access to account information and market information through telephone representatives and over the Internet, investor education materials and asset allocation tools, and the expanded availability of Fidelity Investor Centers.
Investment in a Large Fund Family. The Board considered the benefits to shareholders of investing in a Fidelity fund, including the benefits of investing in a fund that is part of a large family of funds offering a variety of investment disciplines and providing a large variety of mutual fund investor services. The Board noted that Fidelity had taken, or had made recommendations that resulted in the Fidelity funds taking, a number of actions over the previous year that benefited particular funds, including (i) continuing to dedicate additional resources to investment research and support of the senior management team that oversees asset management; (ii) persisting in efforts to enhance Fidelity's research capabilities, in particular, international research; (iii) launching new funds and making other enhancements to meet client needs for global and income-oriented solutions; (iv) continuing to launch dedicated lower cost underlying funds to meet investment management's portfolio construction needs related to expanding underlying fund options, specifically for the Freedom Fund product lines; (v) adopting a "Stock Selector" sector neutral investment approach and employing a team of portfolio managers who are sector specialists to manage certain funds; (vi) rationalizing product lines and gaining increased efficiencies through the mergers of several funds into other funds; (vii) strengthening the Spartan Index Fund product line by adding new funds and/or new low-cost institutional share classes, restructuring fund expenses to accommodate new classes, and reducing investment minimums for certain classes of shares; (viii) modifying the eligibility criteria for Institutional Class shares to increase their appeal to government entities and charitable investors; and (ix) reducing certain transfer agent fee rates.
Investment Performance. The Board considered whether the fund has operated in accordance with its investment objective, as well as its record of compliance with its investment restrictions. It also reviewed the fund's absolute investment performance for each class, as well as the fund's relative investment performance for each class measured over multiple periods against (i) a broad-based securities market index, and (ii) a custom peer group of mutual funds deemed appropriate by Fidelity and reviewed by the Board. The following charts considered by the Board show, over the one-, three-, and five-year periods ended December 31, 2011, the cumulative total returns of Institutional Class (Class I) and Class B of the fund, the cumulative total returns of a broad-based securities market index ("benchmark"), and a range of cumulative total returns of a custom peer group of mutual funds defined by FMR based on categories assigned by Morningstar, Inc. The returns of Institutional Class (Class I) and Class B show the performance of the highest and lowest performing classes, respectively (based on five-year performance). The box within each chart shows the 25th percentile return (top of box) and the 75th percentile return (bottom of box) of the peer group. Returns shown above the box are in the first quartile and returns shown below the box are in the fourth quartile. The percentage beaten numbers noted below each chart correspond to the percentile box and represent the percentage of funds in the peer group whose performance was equal to or lower than that of the class indicated. The fund's custom peer group, defined by FMR, is a peer group that FMR believes provides a more meaningful performance comparison than the peer group assigned by Morningstar, Inc., which assigns mutual funds to categories based on their investment styles as measured by their underlying portfolio holdings.
Annual Report
Fidelity Advisor New Insights Fund

The Board reviewed the fund's relative investment performance against its peer group and noted that the performance of Institutional Class (Class I) of the fund was in the second quartile for the one- and three-year periods and the first quartile for the five-year period. The Board also noted that the investment performance of Institutional Class (Class I) of the fund compared favorably to its benchmark for the three- and five-year periods, although the fund's one-year total return was lower than its benchmark. The Board considered that the variations in performance among the fund's classes reflect the variations in class expenses, which result in lower performance for higher expense classes. The Board also reviewed the fund's performance since inception as well as performance in the current year.
Annual Report
Board Approval of Investment Advisory Contracts and
Management Fees - continued
The Board also considered that the fund's management fee is subject to upward or downward adjustment depending upon whether, and to what extent, the fund's investment performance for the performance period exceeds, or is exceeded by, the record (over the same period) of a Board-approved performance adjustment index. The Board noted that the performance adjustment provides FMR with a strong economic incentive to seek to achieve superior performance for the fund's shareholders and helps to more closely align the interests of FMR and the fund's shareholders.
Based on its review, the Board concluded that the nature, extent, and quality of services provided to the fund under the Advisory Contracts should benefit the fund's shareholders.
Competitiveness of Management Fee and Total Expense Ratio. The Board considered the fund's management fee and total expense ratio compared to "mapped groups" of competitive funds and classes. Fidelity creates "mapped groups" by combining similar Lipper investment objective categories that have comparable management fee characteristics. Combining Lipper investment objective categories aids the Board's management fee and total expense ratio comparisons by broadening the competitive group used for comparison and by reducing the number of universes to which various Fidelity funds are compared.
Management Fee. The Board considered two proprietary management fee comparisons for the 12-month periods shown in the chart below. The group of Lipper funds used by the Board for management fee comparisons is referred to below as the "Total Mapped Group." The Total Mapped Group comparison focuses on a fund's standing relative to the total universe of comparable funds available to investors in terms of gross management fees before expense reimbursements or caps, and without giving effect to the fund's performance adjustment. "TMG %" represents the percentage of funds in the Total Mapped Group that had management fees that were lower than the fund's. For example, a TMG % of 10% means that 90% of the funds in the Total Mapped Group had higher management fees than the fund. The "Asset-Size Peer Group" (ASPG) comparison focuses on a fund's standing relative to non-Fidelity funds similar in size to the fund within the Total Mapped Group. The ASPG represents at least 15% of the funds in the Total Mapped Group with comparable asset size and management fee characteristics, subject to a minimum of 50 funds (or all funds in the Total Mapped Group if fewer than 50). Additional information, such as the ASPG quartile in which the fund's management fee ranked and the impact of the fund's performance adjustment, is also included in the chart and considered by the Board.
Annual Report
Fidelity Advisor New Insights Fund

The Board noted that the fund's management fee ranked below the median of its Total Mapped Group and below the median of its ASPG for 2011. The Board also noted the effect of the fund's positive performance adjustment on the fund's management fee ranking. The Board noted that the performance adjustment for each year represents calculations for performance periods that differ from the periods shown in the performance charts above.
Based on its review, the Board concluded that the fund's management fee is fair and reasonable in light of the services that the fund receives and the other factors considered.
Total Expense Ratio. In its review of each class's total expense ratio, the Board considered the fund's management fee as well as other fund or class expenses, as applicable, such as transfer agent fees, pricing and bookkeeping fees, fund-paid 12b-1 fees, and custodial, legal, and audit fees. The Board also noted the effects of any waivers and reimbursements on fees and expenses, as well as the impact of the fund's performance adjustment. As part of its review, the Board also considered the current and historical total expense ratios of each class of the fund compared to competitive fund median expenses. Each class of the fund is compared to those funds and classes in the Total Mapped Group (used by the Board for management fee comparisons) that have a similar sales load structure.
The Board noted that the total expense ratio of each of Class A, Class B, Class C, and Institutional Class ranked below its competitive median for 2011 and the total expense ratio of Class T ranked above its competitive median for 2011. The Board considered that various factors, including 12b-1 fees, positive or negative performance adjustments, and relatively higher other expenses in the case of small fund size, can affect total expense ratios. The Board noted that the total expense ratio of Class T was above the competitive median primarily because of higher 12b-1 fees on Class T. Class T has a higher 12b-1 fee, but a lower front-end sales charge, than traditionally priced front-end sales charge classes. The Board considered that Class T is primarily sold load-waived in the retirement plan market where its 0.50% 12b-1 fee is comparable to competing no-load, higher 12b-1 fee classes designed specifically for retirement plans. The Board noted that the fund offers multiple classes, each of which has a different sales load and 12b-1 fee structure, and that the multiple structures are intended to offer a range of pricing options for the intermediary market. The Board also noted that the total expense ratios of the classes vary primarily by the level of their 12b-1 fees, although differences in transfer agent fees may also cause expenses to vary from class to class.
Annual Report
Board Approval of Investment Advisory Contracts and
Management Fees - continued
Fees Charged to Other Fidelity Clients. The Board also considered Fidelity fee structures and other information with respect to clients of FMR and its affiliates, such as other mutual funds advised or subadvised by FMR or its affiliates, pension plan clients, and other institutional clients. The Board noted the findings of the 2010 ad hoc joint committee (created with the board of other Fidelity funds), which reviewed and compared Fidelity's institutional investment advisory business with its business of providing services to the Fidelity funds, including the differences in services provided, fees charged, and costs incurred, as well as competition in their respective marketplaces.
Based on its review of total expense ratios and fees charged to other Fidelity clients, the Board concluded that the total expense ratio of each class of the fund was reasonable, although Class T was above the median of the universe presented for comparison, in light of the services that the fund and its shareholders receive and the other factors considered.
Costs of the Services and Profitability. The Board considered the revenues earned and the expenses incurred by Fidelity in conducting the business of developing, marketing, distributing, managing, administering and servicing the fund and its shareholders. The Board also considered the level of Fidelity's profits in respect of all the Fidelity funds.
On an annual basis, FMR presents to the Board Fidelity's profitability for the fund. Fidelity calculates the profitability for each fund, as well as aggregate profitability for groups of Fidelity funds and all Fidelity funds, using a series of detailed revenue and cost allocation methodologies which originate with the books and records of Fidelity on which Fidelity's audited financial statements are based. The Audit Committee of the Board reviews any significant changes from the prior year's methodologies.
PricewaterhouseCoopers LLP (PwC), independent registered public accounting firm and auditor to Fidelity and certain Fidelity funds, has been engaged annually by the Board as part of the Board's assessment of Fidelity's profitability analysis. PwC's engagement includes the review and assessment of Fidelity's methodologies used in determining the revenues and expenses attributable to Fidelity's mutual fund business, and completion of agreed-upon procedures surrounding the mathematical accuracy of fund profitability and its conformity to allocation methodologies. After considering PwC's reports issued under the engagement and information provided by Fidelity, the Board concluded that while other allocation methods may also be reasonable, Fidelity's profitability methodologies are reasonable in all material respects.
Annual Report
The Board also reviewed Fidelity's non-fund businesses and fall-out benefits related to the mutual fund business as well as cases where Fidelity's affiliates may benefit from or be related to the fund's business.
The Board considered the costs of the services provided by and the profits realized by Fidelity in connection with the operation of the fund and was satisfied that the profitability was not excessive in the circumstances.
Economies of Scale. The Board considered whether there have been economies of scale in respect of the management of the Fidelity funds, whether the Fidelity funds (including the fund) have appropriately benefited from any such economies of scale, and whether there is potential for realization of any further economies of scale. The Board considered the extent to which the fund will benefit from economies of scale through increased services to the fund, through waivers or reimbursements, or through fee or expense reductions. The Board also noted that in 2009, it and the board of other Fidelity funds created an ad hoc committee (the Economies of Scale Committee) to analyze whether FMR attains economies of scale in respect of the management and servicing of the Fidelity funds, whether the Fidelity funds have appropriately benefited from such economies of scale, and whether there is potential for realization of any further economies of scale.
The Board recognized that the fund's management contract incorporates a "group fee" structure, which provides for lower group fee rates as total fund assets under FMR's management increase, and for higher group fee rates as total fund assets under FMR's management decrease. FMR calculates the group fee rates based on a tiered asset "breakpoint" schedule that varies based on asset class. The Board considered that the group fee is designed to deliver the benefits of economies of scale to fund shareholders when total Fidelity fund assets increase, even if assets of any particular fund are unchanged or have declined, because some portion of Fidelity's costs are attributable to services provided to all Fidelity funds, and all funds benefit if those costs can be allocated among more assets. The Board concluded that, given the group fee structure, fund shareholders will benefit from lower management fees as assets under FMR's management increase at the fund complex level, regardless of whether Fidelity achieves any such economies of scale.
Annual Report
Board Approval of Investment Advisory Contracts and
Management Fees - continued
The Board concluded, taking into account the analysis of the Economies of Scale Committee, that economies of scale, if any, are being appropriately shared between fund shareholders and Fidelity.
Additional Information Requested by the Board. In order to develop fully the factual basis for consideration of the Fidelity funds' Advisory Contracts, the Board requested and received additional information on certain topics, including (i) fund performance trends, actions to be taken by FMR to improve certain funds' overall performance, and Fidelity's long-term strategies for certain funds; (ii) the potential to further rationalize the Fidelity fund lineup with the possibility of achieving savings for the funds and Fidelity; (iii) Fidelity's compensation structure for portfolio managers and other key investment personnel; (iv) the amount of the investment that each portfolio manager has made in the Fidelity fund(s) that he or she manages; (v) the realization of fall-out benefits in certain Fidelity business units; (vi) Fidelity's group fee structures, the potential impact of regulatory changes on such structures, and the rationale for the individual fee rates of certain funds; (vii) fund profitability methodology, including Fidelity's cost allocation methodology, and the impact of certain factors on fund profitability results; (viii) trends regarding industry use of performance fee structures and the possibility of implementing performance fee structures for additional funds; and (ix) the impact of net redemptions from the Fidelity funds.
Based on its evaluation of all of the conclusions noted above, and after considering all factors it believed relevant, the Board ultimately concluded that the advisory fee structures are fair and reasonable, and that the fund's Advisory Contracts should be renewed.
Annual Report
Investment Adviser
Fidelity Management & Research Company
Boston, MA
Investment Sub-Adviser
FMR Co., Inc.
Fidelity Management & Research
(U.K.) Inc.
Fidelity Management & Research
(Hong Kong) Limited
Fidelity Management & Research
(Japan) Inc.
General Distributor
Fidelity Distributors Corporation
Smithfield, RI
Transfer and Service Agents
Fidelity Investments Institutional Operations Company, Inc.
Boston, MA
Fidelity Service Company, Inc.
Boston, MA
Custodian
Brown Brothers Harriman & Co.
Boston, MA
(Fidelity Investment logo)(registered trademark)
ANIF-UANN-0213
1.796408.109
(Fidelity Investment logo)(registered trademark)
Fidelity Advisor ®
New Insights
Fund - Institutional Class
Annual Report
December 31, 2012
(Fidelity Cover Art)
Contents
Performance | (Click Here) | How the fund has done over time. |
Management's Discussion of Fund Performance | (Click Here) | The Portfolio Manager's review of fund performance and strategy. |
Shareholder Expense Example | (Click Here) | An example of shareholder expenses. |
Investment Changes | (Click Here) | A summary of major shifts in the fund's investments over the past six months. |
Investments | (Click Here) | A complete list of the fund's investments with their market values. |
Financial Statements | (Click Here) | Statements of assets and liabilities, operations, and changes in net assets,
as well as financial highlights. |
Notes | (Click Here) | Notes to the financial statements. |
Report of Independent Registered Public Accounting Firm | (Click Here) | |
Trustees and Officers | (Click Here) | |
Distributions | (Click Here) | |
Board Approval of Investment Advisory Contracts and Management Fees | (Click Here) | |
To view a fund's proxy voting guidelines and proxy voting record for the 12-month period ended June 30, visit http://www.fidelity.com/proxyvotingresults or visit the Securities and Exchange Commission's (SEC) web site at http://www.sec.gov. You may also call 1-877-208-0098 to request a free copy of the proxy voting guidelines.
Standard & Poor's, S&P and S&P 500 are registered service marks of The McGraw-Hill Companies, Inc. and have been licensed for use by Fidelity Distributors Corporation.
Other third-party marks appearing herein are the property of their respective owners.
All other marks appearing herein are registered or unregistered trademarks or service marks of FMR LLC or an affiliated company. © 2013 FMR LLC. All rights reserved.
Annual Report
This report and the financial statements contained herein are submitted for the general information of the shareholders of the fund. This report is not authorized for distribution to prospective investors in the fund unless preceded or accompanied by an effective prospectus.
A fund files its complete schedule of portfolio holdings with the SEC for the first and third quarters of each fiscal year on Form N-Q. Forms N-Q are available on the SEC's web site at http://www.sec.gov. A fund's Forms N-Q may be reviewed and copied at the SEC's Public Reference Room in Washington, DC. Information regarding the operation of the SEC's Public Reference Room may be obtained by calling 1-800-SEC-0330. For a complete list of a fund's portfolio holdings, view the most recent holdings listing, semiannual report, or annual report on Fidelity's web site at http://www.fidelity.com, http://www.advisor.fidelity.com, or http://www.401k.com, as applicable.
NOT FDIC INSURED • MAY LOSE VALUE • NO BANK GUARANTEE
Neither the fund nor Fidelity Distributors Corporation is a bank.
Annual Report
Average annual total return reflects the change in the value of an investment, assuming reinvestment of the class' distributions from dividend income and capital gains (the profits earned upon the sale of securities that have grown in value, if any) and assuming a constant rate of performance each year. The $10,000 table and the fund's returns do not reflect the deduction of taxes that a shareholder would pay on fund distributions or the redemption of fund shares. During periods of reimbursement by Fidelity, a fund's total return will be greater than it would be had the reimbursement not occurred. How a fund did yesterday is no guarantee of how it will do tomorrow.
Average Annual Total Returns
Periods ended December 31, 2012 | Past 1
year | Past 5
years | Life of
fund A |
Institutional Class | 16.11% | 1.54% | 9.95% |
A From July 31, 2003.
$10,000 Over Life of Fund
Let's say hypothetically that $10,000 was invested in Fidelity Advisor® New Insights Fund - Institutional Class on July 31, 2003, when the fund started. The chart shows how the value of your investment would have changed, and also shows how the S&P 500® Index performed over the same period.
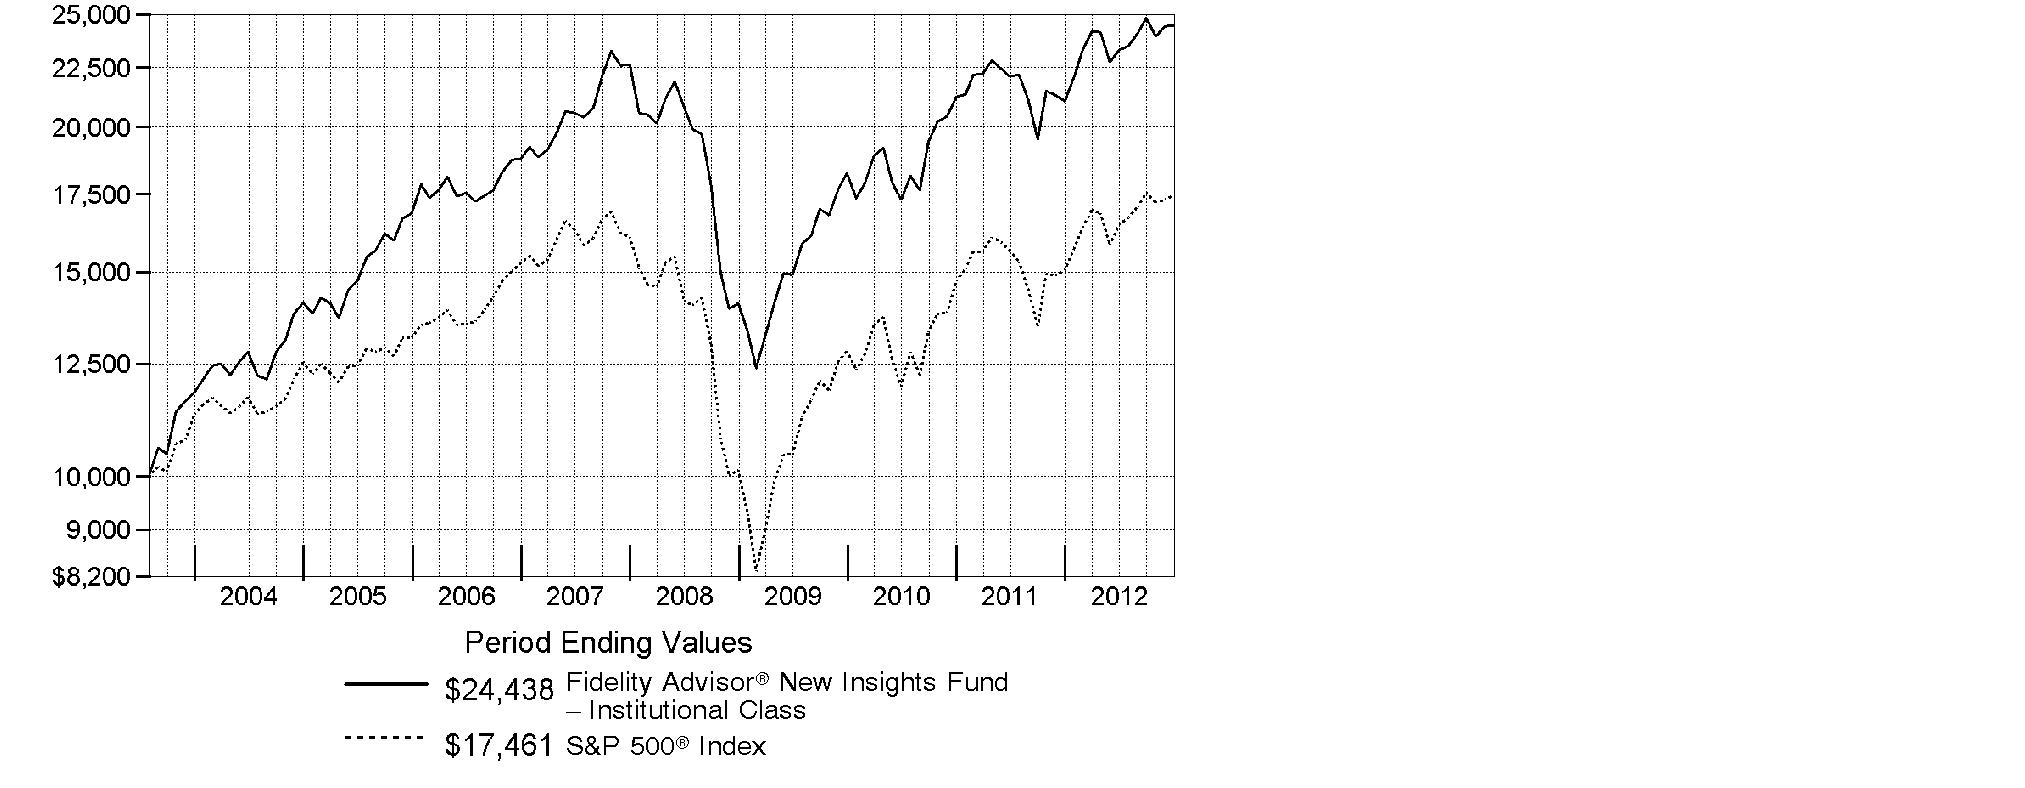
See accompanying notes which are an integral part of the financial statements.
Annual Report
Market Recap: U.S. equity benchmarks posted double-digit gains for the year ending December 31, 2012, despite investors' concerns over debt woes in Europe, slower growth in China and partisan gridlock in Congress. Signs of recovery in the U.S. economy lifted stocks for most of the period, extending an uptrend that began in March 2009. The broad-based S&P 500® Index rose 16.00% for the 12 months, while the technology-heavy Nasdaq Composite Index® gained 17.45% and the blue-chip-laden Dow Jones Industrial AverageSM added 10.24%. Stocks began the year on a high note, with an improving U.S. economy and proposed bailouts in Europe buoying equities in the first quarter. Fear resurfaced in April and May, but stocks rebounded in June on central bank stimulus, a reviving U.S. housing market and more eurozone aid. Although equity benchmarks hit multiyear highs in September, pre-election jitters and the looming "fiscal cliff" of tax hikes and federal spending cuts triggered some profit-taking, followed by a brief post-election sell-off. Hurricane Sandy's aftereffects added to uncertainty, but stocks proved resilient. Within the S&P 500®, the financials and consumer discretionary sectors significantly outpaced the benchmark, while utilities and energy lagged the most, with only modest gains. Despite eurozone turmoil, foreign developed-markets stocks rose strongly, with the MSCI® EAFE® Index adding 17.48%.
Comments from William Danoff, Portfolio Manager of Fidelity Advisor® New Insights Fund: For the year, the fund's Institutional Class shares returned 16.11%, slightly ahead of the S&P 500®. Stock selection drove results versus the index, led by picks in technology, where I've had a strong commitment for many years. Here, market leader Apple was by far the fund's top individual contributor. Its shares rose roughly 33% for the year, despite a weak fourth quarter. The fund also was helped by largely avoiding the weak utilities sector and large energy stocks, based on their inferior relative earnings prospects. This included integrated oil firm and index component Exxon Mobil, which underperformed. Electronic payment leader Visa also notably contributed, fueled by strong earnings. Conversely, the fund was hurt by underweighting the rebounding diversified financials group, as large banks such as Bank of America - which I did not own - and JPMorgan Chase rose sharply with the improving U.S. economy. Weak sales hurt fast-food chain McDonald's. Concerns about intensified competition hurt Internet search giant Google, another of the fund's largest holdings. A cash position also detracted, given the market's strong advance.
The views expressed above reflect those of the portfolio manager(s) only through the end of the period as stated on the cover of this report and do not necessarily represent the views of Fidelity or any other person in the Fidelity organization. Any such views are subject to change at any time based upon market or other conditions and Fidelity disclaims any responsibility to update such views. These views may not be relied on as investment advice and, because investment decisions for a Fidelity fund are based on numerous factors, may not be relied on as an indication of trading intent on behalf of any Fidelity fund.
Annual Report
Shareholder Expense Example
As a shareholder of the Fund, you incur two types of costs: (1) transaction costs, including sales charges (loads) on purchase payments or redemption proceeds, and (2) ongoing costs, including management fees, distribution and/or service (12b-1) fees and other Fund expenses. This Example is intended to help you understand your ongoing costs (in dollars) of investing in the Fund and to compare these costs with the ongoing costs of investing in other mutual funds.
The Example is based on an investment of $1,000 invested at the beginning of the period and held for the entire period (July 1, 2012 to December 31, 2012).
Actual Expenses
The first line of the accompanying table for each class of the Fund provides information about actual account values and actual expenses. You may use the information in this line, together with the amount you invested, to estimate the expenses that you paid over the period. Simply divide your account value by $1,000.00 (for example, an $8,600 account value divided by $1,000.00 = 8.6), then multiply the result by the number in the first line for a class of the Fund under the heading entitled "Expenses Paid During Period" to estimate the expenses you paid on your account during this period. In addition, the Fund, as a shareholder in the underlying Fidelity Central Funds, will indirectly bear its pro-rata share of the fees and expenses incurred by the underlying Fidelity Central Funds. These fees and expenses are not included in the Fund's annualized expense ratio used to calculate the expense estimate in the table below.
Hypothetical Example for Comparison Purposes
The second line of the accompanying table for each class of the Fund provides information about hypothetical account values and hypothetical expenses based on a Class' actual expense ratio and an assumed rate of return of 5% per year before expenses, which is not the Class' actual return. The hypothetical account values and expenses may not be used to estimate the actual ending account balance or expenses you paid for the period. You may use this information to compare the ongoing costs of investing in the Fund and other funds. To do so, compare this 5% hypothetical example with the 5% hypothetical examples that appear in the shareholder reports of the other funds. In addition, the Fund, as a shareholder in the underlying Fidelity Central Funds, will indirectly bear its pro-rata share of the fees and expenses incurred by the underlying Fidelity Central Funds. These fees and expenses are not included in the Fund's annualized expense ratio used to calculate the expense estimate in the table below.
Please note that the expenses shown in the table are meant to highlight your ongoing costs only and do not reflect any transaction costs. Therefore, the second line of the table is useful in comparing ongoing costs only, and will not help you determine the relative total costs of owning different funds. In addition, if these transactional costs were included, your costs would have been higher.
Annual Report
| Annualized Expense Ratio | Beginning
Account Value
July 1, 2012 | Ending
Account Value
December 31, 2012 | Expenses Paid
During Period*
July 1, 2012 to
December 31, 2012 |
Class A | 1.03% | | | |
Actual | | $ 1,000.00 | $ 1,047.90 | $ 5.30 |
HypotheticalA | | $ 1,000.00 | $ 1,019.96 | $ 5.23 |
Class T | 1.27% | | | |
Actual | | $ 1,000.00 | $ 1,046.50 | $ 6.53 |
HypotheticalA | | $ 1,000.00 | $ 1,018.75 | $ 6.44 |
Class B | 1.84% | | | |
Actual | | $ 1,000.00 | $ 1,043.50 | $ 9.45 |
HypotheticalA | | $ 1,000.00 | $ 1,015.89 | $ 9.32 |
Class C | 1.78% | | | |
Actual | | $ 1,000.00 | $ 1,043.70 | $ 9.14 |
HypotheticalA | | $ 1,000.00 | $ 1,016.19 | $ 9.02 |
Institutional Class | .76% | | | |
Actual | | $ 1,000.00 | $ 1,049.20 | $ 3.91 |
HypotheticalA | | $ 1,000.00 | $ 1,021.32 | $ 3.86 |
A 5% return per year before expenses
* Expenses are equal to each Class' annualized expense ratio, multiplied by the average account value over the period, multiplied by 184/366 (to reflect the one-half year period).
Annual Report
Investment Changes (Unaudited)
Top Ten Stocks as of December 31, 2012 |
| % of fund's
net assets | % of fund's net assets
6 months ago |
Apple, Inc. | 7.0 | 8.7 |
Google, Inc. Class A | 5.3 | 4.2 |
Berkshire Hathaway, Inc. Class A | 3.5 | 3.0 |
Wells Fargo & Co. | 2.5 | 2.4 |
The Coca-Cola Co. | 2.4 | 2.7 |
The Walt Disney Co. | 2.3 | 2.3 |
Noble Energy, Inc. | 2.0 | 1.7 |
Visa, Inc. Class A | 1.9 | 1.5 |
Amazon.com, Inc. | 1.7 | 1.4 |
TJX Companies, Inc. | 1.7 | 1.9 |
| 30.3 | |
Top Five Market Sectors as of December 31, 2012 |
| % of fund's
net assets | % of fund's net assets
6 months ago |
Information Technology | 27.7 | 27.3 |
Consumer Discretionary | 19.7 | 22.2 |
Financials | 13.0 | 10.8 |
Health Care | 12.5 | 10.2 |
Consumer Staples | 9.1 | 9.0 |
Asset Allocation (% of fund's net assets) |
As of December 31, 2012 * | As of June 30, 2012 ** |
 | Stocks 97.8% | | | Stocks 92.0% | |
 | Bonds† 0.0% | | | Bonds 0.1% | |
 | Convertible
Securities 0.2% | | | Convertible
Securities 0.3% | |
 | Short-Term
Investments and
Net Other Assets (Liabilities) 2.0% | | | Short-Term
Investments and
Net Other Assets (Liabilities) 7.6% | |
* Foreign investments | 12.5% | | ** Foreign investments | 11.3% | |

† Amount represents less than 0.1%
Annual Report
Investments December 31, 2012
Showing Percentage of Net Assets
Common Stocks - 97.8% |
| Shares | | Value (000s) |
CONSUMER DISCRETIONARY - 19.7% |
Automobiles - 0.2% |
Hyundai Motor Co. | 93,734 | | $ 19,449 |
Tesla Motors, Inc. (a) | 405,300 | | 13,728 |
| | 33,177 |
Distributors - 0.1% |
LKQ Corp. (a) | 1,004,600 | | 21,197 |
Diversified Consumer Services - 0.0% |
Kroton Educacional SA (a) | 116,900 | | 2,672 |
Hotels, Restaurants & Leisure - 3.8% |
Chipotle Mexican Grill, Inc. (a) | 477,678 | | 142,090 |
Dunkin' Brands Group, Inc. | 1,709,800 | | 56,731 |
Galaxy Entertainment Group Ltd. (a) | 2,222,000 | | 8,910 |
InterContinental Hotel Group PLC | 150,173 | | 4,211 |
McDonald's Corp. | 3,495,998 | | 308,382 |
Paddy Power PLC (Ireland) | 29,400 | | 2,427 |
Panera Bread Co. Class A (a) | 20,200 | | 3,208 |
Starbucks Corp. | 2,403,482 | | 128,875 |
Tim Hortons, Inc. (Canada) | 2,695,700 | | 132,332 |
| | 787,166 |
Household Durables - 1.3% |
D.R. Horton, Inc. | 4,251,657 | | 84,098 |
Lennar Corp. Class A (d) | 1,362,600 | | 52,692 |
PulteGroup, Inc. (a) | 5,269,000 | | 95,685 |
Ryland Group, Inc. | 328,400 | | 11,987 |
Toll Brothers, Inc. (a) | 566,906 | | 18,328 |
Whirlpool Corp. | 59,700 | | 6,074 |
| | 268,864 |
Internet & Catalog Retail - 2.7% |
Amazon.com, Inc. (a) | 1,432,900 | | 359,859 |
Expedia, Inc. | 111,251 | | 6,836 |
Liberty Media Corp.: | | | |
Interactive Series A (a) | 607,400 | | 11,954 |
Series A (a) | 19,400 | | 1,315 |
priceline.com, Inc. (a) | 206,120 | | 128,042 |
TripAdvisor, Inc. | 1,515,300 | | 63,582 |
| | 571,588 |
Leisure Equipment & Products - 0.1% |
Polaris Industries, Inc. | 359,400 | | 30,244 |
Media - 5.5% |
Comcast Corp. Class A | 6,265,500 | | 234,204 |
Common Stocks - continued |
| Shares | | Value (000s) |
CONSUMER DISCRETIONARY - continued |
Media - continued |
Discovery Communications, Inc. (a) | 3,956,727 | | $ 251,173 |
Legend Pictures LLC (a)(g)(h) | 11,303 | | 20,946 |
Liberty Global, Inc. Class A (a) | 596,600 | | 37,580 |
Liberty Media Corp. Capital Series A (a) | 473,632 | | 54,946 |
Naspers Ltd. Class N | 378,200 | | 24,233 |
Sirius XM Radio, Inc. (d) | 11,190,279 | | 32,340 |
The Walt Disney Co. | 9,517,880 | | 473,895 |
Time Warner Cable, Inc. | 272,141 | | 26,449 |
Weinstein Co. Holdings LLC Class A-1 (a)(g)(h) | 2,267 | | 850 |
| | 1,156,616 |
Multiline Retail - 0.2% |
Dollar Tree, Inc. (a) | 1,065,718 | | 43,226 |
Dollarama, Inc. (f) | 63,100 | | 3,741 |
| | 46,967 |
Specialty Retail - 4.2% |
Bed Bath & Beyond, Inc. (a) | 2,201,600 | | 123,091 |
Dick's Sporting Goods, Inc. | 384,400 | | 17,486 |
DSW, Inc. Class A | 146,100 | | 9,597 |
Fast Retailing Co. Ltd. | 46,300 | | 11,816 |
Five Below, Inc. (d) | 124,200 | | 3,979 |
Foot Locker, Inc. | 763,700 | | 24,530 |
Gap, Inc. | 546,100 | | 16,951 |
GNC Holdings, Inc. | 250,400 | | 8,333 |
Home Depot, Inc. | 783,400 | | 48,453 |
Inditex SA | 51,277 | | 7,205 |
Lithia Motors, Inc. Class A (sub. vtg.) | 400,000 | | 14,968 |
Penske Automotive Group, Inc. | 418,100 | | 12,581 |
PetSmart, Inc. | 520,100 | | 35,544 |
Ross Stores, Inc. | 1,911,600 | | 103,513 |
TJX Companies, Inc. | 8,328,300 | | 353,536 |
Ulta Salon, Cosmetics & Fragrance, Inc. | 429,902 | | 42,242 |
Urban Outfitters, Inc. (a) | 922,800 | | 36,321 |
| | 870,146 |
Textiles, Apparel & Luxury Goods - 1.6% |
China Hongxing Sports Ltd. (a) | 6,000,000 | | 565 |
lululemon athletica, Inc. (a) | 112,000 | | 8,538 |
Luxottica Group SpA | 318,900 | | 13,163 |
LVMH Moet Hennessy - Louis Vuitton SA | 84,200 | | 15,540 |
Michael Kors Holdings Ltd. | 396,900 | | 20,254 |
NIKE, Inc. Class B | 3,178,400 | | 164,005 |
Common Stocks - continued |
| Shares | | Value (000s) |
CONSUMER DISCRETIONARY - continued |
Textiles, Apparel & Luxury Goods - continued |
PVH Corp. | 105,500 | | $ 11,712 |
Salvatore Ferragamo Italia SpA | 70,000 | | 1,550 |
Under Armour, Inc. Class A (sub. vtg.) (a)(d) | 1,208,100 | | 58,629 |
VF Corp. | 241,800 | | 36,505 |
| | 330,461 |
TOTAL CONSUMER DISCRETIONARY | | 4,119,098 |
CONSUMER STAPLES - 9.1% |
Beverages - 3.3% |
Anheuser-Busch InBev SA NV ADR | 1,194,400 | | 104,403 |
Boston Beer Co., Inc. Class A (a)(d) | 127,270 | | 17,111 |
Coca-Cola Icecek A/S | 8,000 | | 166 |
Diageo PLC sponsored ADR | 261,500 | | 30,486 |
Dr. Pepper Snapple Group, Inc. | 636,900 | | 28,138 |
The Coca-Cola Co. | 14,021,774 | | 508,289 |
| | 688,593 |
Food & Staples Retailing - 2.5% |
Bim Birlesik Magazalar A/S JSC | 70,000 | | 3,424 |
Costco Wholesale Corp. | 1,481,800 | | 146,357 |
CVS Caremark Corp. | 2,303,300 | | 111,365 |
Fresh Market, Inc. (a) | 349,400 | | 16,803 |
Wal-Mart Stores, Inc. | 3,499,400 | | 238,764 |
Whole Foods Market, Inc. | 150,900 | | 13,782 |
| | 530,495 |
Food Products - 0.6% |
Associated British Foods PLC | 911,300 | | 23,282 |
Calbee, Inc. | 49,300 | | 3,474 |
Kraft Foods Group, Inc. | 231,100 | | 10,508 |
Mondelez International, Inc. | 1,819,200 | | 46,335 |
Orion Corp. | 11,348 | | 11,716 |
Want Want China Holdings Ltd. | 18,152,000 | | 25,438 |
| | 120,753 |
Household Products - 1.8% |
Colgate-Palmolive Co. | 3,040,200 | | 317,823 |
Kimberly-Clark Corp. | 585,800 | | 49,459 |
| | 367,282 |
Common Stocks - continued |
| Shares | | Value (000s) |
CONSUMER STAPLES - continued |
Personal Products - 0.9% |
Estee Lauder Companies, Inc. Class A | 3,271,300 | | $ 195,820 |
TOTAL CONSUMER STAPLES | | 1,902,943 |
ENERGY - 5.5% |
Energy Equipment & Services - 0.2% |
Cameron International Corp. (a) | 100,100 | | 5,652 |
Schlumberger Ltd. | 417,600 | | 28,936 |
Seadrill Partners LLC | 48,100 | | 1,234 |
| | 35,822 |
Oil, Gas & Consumable Fuels - 5.3% |
Americas Petrogas, Inc. (a)(f) | 836,000 | | 2,521 |
Anadarko Petroleum Corp. | 1,978,700 | | 147,037 |
Birchcliff Energy Ltd. (a) | 844,700 | | 6,335 |
Birchcliff Energy Ltd. (f) | 900,000 | | 6,750 |
Cabot Oil & Gas Corp. | 370,800 | | 18,444 |
Canadian Natural Resources Ltd. | 312,200 | | 8,989 |
Cobalt International Energy, Inc. (a) | 326,700 | | 8,024 |
Concho Resources, Inc. (a) | 393,980 | | 31,739 |
Continental Resources, Inc. (a) | 380,400 | | 27,956 |
Cosan Ltd. Class A | 171,100 | | 2,962 |
Energy XXI (Bermuda) Ltd. | 99,400 | | 3,200 |
EOG Resources, Inc. | 1,423,900 | | 171,993 |
GoviEx Uranium, Inc. (a)(h) | 3,477,000 | | 9,110 |
HollyFrontier Corp. | 197,600 | | 9,198 |
Madalena Ventures, Inc. (f) | 2,200,000 | | 852 |
Marathon Petroleum Corp. | 913,500 | | 57,551 |
Murphy Oil Corp. | 410,400 | | 24,439 |
Noble Energy, Inc. | 3,994,700 | | 406,421 |
Occidental Petroleum Corp. | 412,648 | | 31,613 |
PBF Energy, Inc. | 282,500 | | 8,207 |
Phillips 66 | 1,027,600 | | 54,566 |
Rooster Energy Ltd. (a)(e) | 9,925,000 | | 5,188 |
Skope Energy, Inc. (a)(e)(f) | 784,000 | | 51 |
TAG Oil Ltd. (a) | 854,100 | | 4,894 |
TAG Oil Ltd. (f) | 322,900 | | 1,850 |
Tesoro Corp. | 182,892 | | 8,056 |
Tourmaline Oil Corp. (a) | 1,428,600 | | 44,853 |
Tourmaline Oil Corp. (a)(f) | 303,400 | | 9,526 |
Common Stocks - continued |
| Shares | | Value (000s) |
ENERGY - continued |
Oil, Gas & Consumable Fuels - continued |
TransAtlantic Petroleum Ltd. (a)(f) | 325,400 | | $ 270 |
Ultrapar Participacoes SA | 158,200 | | 3,620 |
| | 1,116,215 |
TOTAL ENERGY | | 1,152,037 |
FINANCIALS - 13.0% |
Capital Markets - 0.3% |
Bank of New York Mellon Corp. | 166,800 | | 4,287 |
Charles Schwab Corp. | 286,000 | | 4,107 |
Goldman Sachs Group, Inc. | 85,400 | | 10,894 |
Morgan Stanley | 460,200 | | 8,799 |
State Street Corp. | 616,800 | | 28,996 |
T. Rowe Price Group, Inc. | 64,800 | | 4,220 |
| | 61,303 |
Commercial Banks - 4.2% |
Bank of Ireland (a) | 320,846,128 | | 48,684 |
BB&T Corp. | 729,000 | | 21,221 |
Fifth Third Bancorp | 882,600 | | 13,407 |
HDFC Bank Ltd. sponsored ADR | 189,700 | | 7,725 |
M&T Bank Corp. | 456,411 | | 44,943 |
Metro Bank PLC Class A (a)(h) | 239,350 | | 3,888 |
PNC Financial Services Group, Inc. | 773,100 | | 45,079 |
Royal Bank of Canada | 176,200 | | 10,607 |
U.S. Bancorp | 5,016,500 | | 160,227 |
Wells Fargo & Co. | 15,140,085 | | 517,488 |
| | 873,269 |
Consumer Finance - 0.9% |
American Express Co. | 2,446,600 | | 140,631 |
Capital One Financial Corp. | 735,800 | | 42,625 |
| | 183,256 |
Diversified Financial Services - 0.5% |
Citigroup, Inc. | 1,154,570 | | 45,675 |
JPMorgan Chase & Co. | 1,097,714 | | 48,266 |
Kotak Mahindra Bank Ltd. | 284,313 | | 3,398 |
| | 97,339 |
Insurance - 5.9% |
ACE Ltd. | 1,805,700 | | 144,095 |
Admiral Group PLC | 635,100 | | 12,098 |
Common Stocks - continued |
| Shares | | Value (000s) |
FINANCIALS - continued |
Insurance - continued |
AIA Group Ltd. | 16,288,600 | | $ 64,606 |
Berkshire Hathaway, Inc. Class A (a) | 5,501 | | 737,464 |
Direct Line Insurance Group PLC | 3,926,200 | | 13,898 |
Fairfax Financial Holdings Ltd. (sub. vtg.) | 24,600 | | 8,867 |
Marsh & McLennan Companies, Inc. | 1,176,200 | | 40,544 |
The Chubb Corp. | 1,789,900 | | 134,815 |
The Travelers Companies, Inc. | 1,229,600 | | 88,310 |
| | 1,244,697 |
Real Estate Investment Trusts - 0.7% |
American Tower Corp. | 2,071,100 | | 160,034 |
Real Estate Management & Development - 0.5% |
BR Malls Participacoes SA | 4,407,550 | | 58,863 |
Kennedy-Wilson Holdings, Inc. | 638,900 | | 8,932 |
Realogy Holdings Corp. | 724,199 | | 30,387 |
| | 98,182 |
TOTAL FINANCIALS | | 2,718,080 |
HEALTH CARE - 12.3% |
Biotechnology - 5.0% |
Achillion Pharmaceuticals, Inc. (a) | 20,700 | | 166 |
Aegerion Pharmaceuticals, Inc. (a) | 108,017 | | 2,743 |
Alexion Pharmaceuticals, Inc. (a) | 1,075,200 | | 100,865 |
Amgen, Inc. | 2,782,142 | | 240,154 |
ARIAD Pharmaceuticals, Inc. (a) | 2,137,172 | | 40,991 |
Biogen Idec, Inc. (a) | 2,162,800 | | 317,218 |
BioMarin Pharmaceutical, Inc. (a) | 380,300 | | 18,730 |
Celgene Corp. (a) | 509,300 | | 40,092 |
CSL Ltd. | 137,187 | | 7,745 |
Gilead Sciences, Inc. (a) | 1,578,330 | | 115,928 |
Grifols SA ADR | 665,241 | | 17,250 |
Intercept Pharmaceuticals, Inc. | 100,000 | | 3,424 |
KYTHERA Biopharmaceuticals, Inc. (e) | 105,900 | | 3,213 |
KYTHERA Biopharmaceuticals, Inc. (e)(h) | 1,438,435 | | 39,278 |
Light Sciences Oncology, Inc. (a) | 2,708,254 | | 160 |
Medivation, Inc. (a) | 350,340 | | 17,923 |
Merrimack Pharmaceuticals, Inc. | 502,236 | | 3,059 |
Onyx Pharmaceuticals, Inc. (a) | 102,200 | | 7,719 |
Puma Biotechnology, Inc. | 588,623 | | 11,037 |
Regeneron Pharmaceuticals, Inc. (a) | 262,200 | | 44,855 |
Common Stocks - continued |
| Shares | | Value (000s) |
HEALTH CARE - continued |
Biotechnology - continued |
Rigel Pharmaceuticals, Inc. (a) | 267,900 | | $ 1,741 |
RXi Pharmaceuticals Corp. warrants 2/4/15 (a) | 228,571 | | 116 |
Synageva BioPharma Corp. (a) | 134,100 | | 6,207 |
Theravance, Inc. (a) | 196,600 | | 4,378 |
Verastem, Inc. | 575,000 | | 5,054 |
| | 1,050,046 |
Health Care Equipment & Supplies - 1.0% |
Baxter International, Inc. | 716,600 | | 47,769 |
Boston Scientific Corp. (a) | 217,600 | | 1,247 |
CareFusion Corp. (a) | 150,000 | | 4,287 |
Covidien PLC | 423,200 | | 24,436 |
Cyberonics, Inc. (a) | 166,500 | | 8,746 |
High Power Exploration (a) | 58,562 | | 94 |
Intuitive Surgical, Inc. (a) | 173,100 | | 84,883 |
Medtronic, Inc. | 396,700 | | 16,273 |
Stryker Corp. | 203,900 | | 11,178 |
Varian Medical Systems, Inc. (a) | 59,600 | | 4,186 |
| | 203,099 |
Health Care Providers & Services - 1.0% |
Acadia Healthcare Co., Inc. (a) | 247,700 | | 5,779 |
Catamaran Corp. (a) | 405,172 | | 19,088 |
CIGNA Corp. | 366,800 | | 19,609 |
DaVita, Inc. (a) | 158,300 | | 17,497 |
Express Scripts Holding Co. (a) | 32,000 | | 1,728 |
Henry Schein, Inc. (a) | 242,945 | | 19,547 |
McKesson Corp. | 153,300 | | 14,864 |
OvaScience, Inc. (a)(e) | 1,090,900 | | 9,131 |
UnitedHealth Group, Inc. | 1,878,700 | | 101,901 |
| | 209,144 |
Health Care Technology - 0.7% |
athenahealth, Inc. (a)(d) | 325,890 | | 23,937 |
Cerner Corp. (a) | 1,532,839 | | 119,010 |
| | 142,947 |
Life Sciences Tools & Services - 0.6% |
Fluidigm Corp. (a)(h) | 112,607 | | 1,611 |
Mettler-Toledo International, Inc. (a) | 572,300 | | 110,626 |
PerkinElmer, Inc. | 15,800 | | 501 |
Waters Corp. (a) | 139,700 | | 12,171 |
| | 124,909 |
Common Stocks - continued |
| Shares | | Value (000s) |
HEALTH CARE - continued |
Pharmaceuticals - 4.0% |
Abbott Laboratories | 2,984,128 | | $ 195,460 |
Allergan, Inc. | 124,500 | | 11,420 |
Bayer AG | 982,705 | | 93,712 |
Bristol-Myers Squibb Co. | 426,500 | | 13,900 |
Eli Lilly & Co. | 709,300 | | 34,983 |
Johnson & Johnson | 1,728,700 | | 121,182 |
Merck & Co., Inc. | 1,291,400 | | 52,870 |
Mylan, Inc. (a) | 668,300 | | 18,365 |
Novartis AG sponsored ADR | 238,500 | | 15,097 |
Novo Nordisk A/S Series B | 810,620 | | 131,999 |
Perrigo Co. | 636,760 | | 66,242 |
Pfizer, Inc. | 762,500 | | 19,124 |
Valeant Pharmaceuticals International, Inc. (Canada) (a) | 247,506 | | 14,765 |
Watson Pharmaceuticals, Inc. (a) | 502,700 | | 43,232 |
| | 832,351 |
TOTAL HEALTH CARE | | 2,562,496 |
INDUSTRIALS - 5.3% |
Aerospace & Defense - 0.1% |
Honeywell International, Inc. | 72,300 | | 4,589 |
United Technologies Corp. | 128,900 | | 10,571 |
| | 15,160 |
Air Freight & Logistics - 0.1% |
C.H. Robinson Worldwide, Inc. | 16,072 | | 1,016 |
FedEx Corp. | 131,600 | | 12,070 |
| | 13,086 |
Building Products - 0.1% |
ASSA ABLOY AB (B Shares) | 65,400 | | 2,462 |
Fortune Brands Home & Security, Inc. (a) | 660,900 | | 19,311 |
| | 21,773 |
Commercial Services & Supplies - 0.5% |
ADT Corp. | 598,550 | | 27,827 |
Edenred SA | 460,600 | | 14,246 |
Stericycle, Inc. (a) | 690,015 | | 64,358 |
Swisher Hygiene, Inc. (a) | 1,395,310 | | 2,198 |
| | 108,629 |
Construction & Engineering - 0.0% |
Jacobs Engineering Group, Inc. (a) | 52,100 | | 2,218 |
Common Stocks - continued |
| Shares | | Value (000s) |
INDUSTRIALS - continued |
Electrical Equipment - 0.3% |
AMETEK, Inc. | 55,900 | | $ 2,100 |
Generac Holdings, Inc. | 71,157 | | 2,441 |
Roper Industries, Inc. | 550,100 | | 61,325 |
| | 65,866 |
Industrial Conglomerates - 1.1% |
3M Co. | 380,600 | | 35,339 |
Danaher Corp. | 2,948,554 | | 164,824 |
General Electric Co. | 1,466,000 | | 30,771 |
| | 230,934 |
Machinery - 0.4% |
Deere & Co. | 94,500 | | 8,167 |
Fanuc Corp. | 62,600 | | 11,647 |
Illinois Tool Works, Inc. | 709,000 | | 43,114 |
PACCAR, Inc. | 194,800 | | 8,807 |
Rexnord Corp. | 263,300 | | 5,608 |
Snap-On, Inc. | 190,743 | | 15,067 |
| | 92,410 |
Professional Services - 0.4% |
Bureau Veritas SA | 76,362 | | 8,562 |
Experian PLC | 2,137,600 | | 34,452 |
IHS, Inc. Class A (a) | 77,962 | | 7,484 |
On Assignment, Inc. (a) | 314,700 | | 6,382 |
Verisk Analytics, Inc. (a) | 515,200 | | 26,275 |
| | 83,155 |
Road & Rail - 1.8% |
Canadian Pacific (d) | 1,479,600 | | 150,087 |
J.B. Hunt Transport Services, Inc. | 416,100 | | 24,845 |
Localiza Rent A Car SA | 201,300 | | 3,731 |
Union Pacific Corp. | 1,583,100 | | 199,027 |
| | 377,690 |
Trading Companies & Distributors - 0.5% |
Air Lease Corp.: | | | |
Class A (a)(f) | 320,800 | | 6,897 |
Class A (a)(d) | 1,102,578 | | 23,705 |
Mills Estruturas e Servicos de Engenharia SA | 92,300 | | 1,551 |
Common Stocks - continued |
| Shares | | Value (000s) |
INDUSTRIALS - continued |
Trading Companies & Distributors - continued |
MRC Global, Inc. | 77,300 | | $ 2,147 |
W.W. Grainger, Inc. | 357,400 | | 72,327 |
| | 106,627 |
TOTAL INDUSTRIALS | | 1,117,548 |
INFORMATION TECHNOLOGY - 27.7% |
Communications Equipment - 1.1% |
Cisco Systems, Inc. | 434,800 | | 8,544 |
Motorola Solutions, Inc. | 879,400 | | 48,965 |
Palo Alto Networks, Inc. (d) | 157,900 | | 8,451 |
QUALCOMM, Inc. | 2,808,951 | | 174,211 |
| | 240,171 |
Computers & Peripherals - 7.3% |
3D Systems Corp. (a)(d) | 277,700 | | 14,815 |
Apple, Inc. | 2,763,579 | | 1,473,057 |
EMC Corp. (a) | 741,800 | | 18,768 |
Stratasys Ltd. (a) | 172,850 | | 13,854 |
| | 1,520,494 |
Electronic Equipment & Components - 0.7% |
Amphenol Corp. Class A | 2,301,538 | | 148,910 |
Internet Software & Services - 8.5% |
Akamai Technologies, Inc. (a) | 189,600 | | 7,757 |
Constant Contact, Inc. (a)(d) | 205,400 | | 2,919 |
Cornerstone OnDemand, Inc. (a) | 501,550 | | 14,811 |
Dropbox, Inc. (h) | 1,289,836 | | 11,672 |
eBay, Inc. (a) | 4,164,461 | | 212,471 |
Equinix, Inc. (a) | 161,100 | | 33,219 |
ExactTarget, Inc. | 420,800 | | 8,416 |
Facebook, Inc. Class A | 6,049,742 | | 161,105 |
Google, Inc. Class A (a) | 1,550,105 | | 1,099,598 |
LinkedIn Corp. (a) | 556,000 | | 63,840 |
MercadoLibre, Inc. (d) | 123,900 | | 9,735 |
Rackspace Hosting, Inc. (a) | 220,900 | | 16,406 |
Responsys, Inc. (a) | 500,000 | | 2,980 |
SPS Commerce, Inc. (a)(e) | 1,000,000 | | 37,270 |
Web.com Group, Inc. (a) | 64,076 | | 948 |
Yahoo!, Inc. (a) | 4,316,000 | | 85,888 |
| | 1,769,035 |
Common Stocks - continued |
| Shares | | Value (000s) |
INFORMATION TECHNOLOGY - continued |
IT Services - 5.6% |
Accenture PLC Class A | 2,956,800 | | $ 196,627 |
Alliance Data Systems Corp. (a) | 651,930 | | 94,373 |
Cognizant Technology Solutions Corp. Class A (a) | 118,500 | | 8,775 |
Fidelity National Information Services, Inc. | 1,141,697 | | 39,742 |
Fiserv, Inc. (a) | 738,881 | | 58,394 |
FleetCor Technologies, Inc. (a) | 200,686 | | 10,767 |
Gartner, Inc. Class A (a) | 87,500 | | 4,027 |
IBM Corp. | 219,000 | | 41,949 |
MasterCard, Inc. Class A | 647,060 | | 317,888 |
Paychex, Inc. | 61,300 | | 1,909 |
Syntel, Inc. | 7,200 | | 386 |
Vantiv, Inc. | 31,900 | | 651 |
Visa, Inc. Class A | 2,622,279 | | 397,485 |
| | 1,172,973 |
Semiconductors & Semiconductor Equipment - 1.5% |
Analog Devices, Inc. | 148,900 | | 6,263 |
ARM Holdings PLC sponsored ADR | 3,051,200 | | 115,427 |
ASML Holding NV | 449,991 | | 28,984 |
Linear Technology Corp. | 60,600 | | 2,079 |
Samsung Electronics Co. Ltd. | 107,109 | | 154,898 |
| | 307,651 |
Software - 3.0% |
Activision Blizzard, Inc. | 362,200 | | 3,847 |
Allot Communications Ltd. (a) | 631,288 | | 11,250 |
Citrix Systems, Inc. (a) | 464,900 | | 30,567 |
CommVault Systems, Inc. (a) | 247,800 | | 17,274 |
Concur Technologies, Inc. (a) | 821,727 | | 55,483 |
FleetMatics Group PLC | 429,600 | | 10,809 |
Intuit, Inc. | 1,729,200 | | 102,887 |
Jive Software, Inc. | 107,300 | | 1,559 |
Mu Sigma, Inc. (h) | 619,826 | | 15,000 |
NetSuite, Inc. (a) | 859,852 | | 57,868 |
Red Hat, Inc. (a) | 445,800 | | 23,610 |
salesforce.com, Inc. (a) | 702,633 | | 118,113 |
ServiceNow, Inc. (d) | 584,500 | | 17,553 |
SolarWinds, Inc. (a) | 969,262 | | 50,838 |
Splunk, Inc. | 324,003 | | 9,403 |
Symantec Corp. (a) | 2,118,800 | | 39,855 |
Trion World Network, Inc. warrants 8/10/17 (a)(h) | 18,952 | | 0* |
Ultimate Software Group, Inc. (a) | 142,906 | | 13,492 |
Common Stocks - continued |
| Shares | | Value (000s) |
INFORMATION TECHNOLOGY - continued |
Software - continued |
VMware, Inc. Class A (a) | 294,800 | | $ 27,752 |
Workday, Inc. | 254,331 | | 13,861 |
Workday, Inc. (h) | 284,512 | | 13,955 |
| | 634,976 |
TOTAL INFORMATION TECHNOLOGY | | 5,794,210 |
MATERIALS - 5.0% |
Chemicals - 2.4% |
Ashland, Inc. | 306,900 | | 24,678 |
CF Industries Holdings, Inc. | 58,500 | | 11,885 |
Eastman Chemical Co. | 394,100 | | 26,819 |
Ecolab, Inc. | 864,500 | | 62,158 |
Filtrona PLC | 1,365,318 | | 12,279 |
FMC Corp. | 258,900 | | 15,151 |
LyondellBasell Industries NV Class A | 579,200 | | 33,067 |
Mexichem SAB de CV | 2,226,500 | | 12,421 |
Monsanto Co. | 1,266,200 | | 119,846 |
PPG Industries, Inc. | 486,300 | | 65,821 |
Sherwin-Williams Co. | 361,100 | | 55,544 |
Syngenta AG (Switzerland) | 78,131 | | 31,564 |
Valspar Corp. | 355,200 | | 22,164 |
W.R. Grace & Co. (a) | 235,500 | | 15,833 |
| | 509,230 |
Construction Materials - 0.0% |
Eagle Materials, Inc. | 43,200 | | 2,527 |
Containers & Packaging - 0.1% |
Ball Corp. | 360,300 | | 16,123 |
Metals & Mining - 2.4% |
Allied Nevada Gold Corp. (Canada) (a) | 177,100 | | 5,356 |
Altius Minerals Corp. (a) | 23,100 | | 226 |
B2Gold Corp. (a) | 7,220,600 | | 25,842 |
B2Gold Corp. (a)(f) | 660,000 | | 2,362 |
CGA Mining Ltd. (Canada) (a) | 5,671,800 | | 14,996 |
Colossus Minerals, Inc. (a) | 473,000 | | 2,192 |
Continental Gold Ltd. (a) | 222,400 | | 1,979 |
Dalradian Resources, Inc. (a)(d) | 2,427,900 | | 3,734 |
Dalradian Resources, Inc. (f) | 1,000,000 | | 1,538 |
Eldorado Gold Corp. | 815,803 | | 10,498 |
Endeavour Mining Corp. (a) | 3,415,195 | | 7,107 |
Common Stocks - continued |
| Shares | | Value (000s) |
MATERIALS - continued |
Metals & Mining - continued |
Franco-Nevada Corp. | 3,201,500 | | $ 182,750 |
Franco-Nevada Corp. warrants 6/16/17 (a)(f) | 62,150 | | 553 |
Freeport-McMoRan Copper & Gold, Inc. | 638,900 | | 21,850 |
Glencore International PLC (d) | 1,894,800 | | 10,946 |
Goldcorp, Inc. | 52,201 | | 1,919 |
Inmet Mining Corp. | 190,500 | | 14,174 |
Ivanplats Ltd. (f) | 1,002,800 | | 5,041 |
Ivanplats Ltd. Class A (h) | 2,789,499 | | 12,620 |
Medusa Mining Ltd. | 2,560,151 | | 14,584 |
New Gold, Inc. (a) | 4,179,900 | | 46,266 |
Newcrest Mining Ltd. | 81,391 | | 1,904 |
Novagold Resources, Inc. (a) | 2,170,200 | | 9,818 |
Pilot Gold, Inc. (a) | 2,778,800 | | 5,950 |
Premier Gold Mines Ltd. (a) | 1,637,000 | | 6,912 |
Premier Gold Mines Ltd. (f) | 900,000 | | 3,800 |
Pretium Resources, Inc. (a) | 683,300 | | 9,006 |
Primero Mining Corp. (a) | 275,500 | | 1,773 |
Royal Gold, Inc. | 340,000 | | 27,645 |
Tahoe Resources, Inc. (a) | 178,000 | | 3,257 |
Tahoe Resources, Inc. (a)(f) | 1,074,200 | | 19,655 |
Teranga Gold Corp. (a) | 72,200 | | 164 |
Turquoise Hill Resources Ltd. (a) | 3,913,304 | | 29,900 |
Yamana Gold, Inc. | 112,900 | | 1,942 |
| | 508,259 |
Paper & Forest Products - 0.1% |
International Paper Co. | 320,500 | | 12,769 |
TOTAL MATERIALS | | 1,048,908 |
TELECOMMUNICATION SERVICES - 0.1% |
Diversified Telecommunication Services - 0.0% |
inContact, Inc. (a) | 169,600 | | 879 |
tw telecom, inc. (a) | 312,000 | | 7,947 |
| | 8,826 |
Wireless Telecommunication Services - 0.1% |
Rogers Communications, Inc. Class B (non-vtg.) | 268,600 | | 12,195 |
TOTAL TELECOMMUNICATION SERVICES | | 21,021 |
Common Stocks - continued |
| Shares | | Value (000s) |
UTILITIES - 0.1% |
Multi-Utilities - 0.1% |
YTL Corp. Bhd | 19,223,626 | | $ 11,997 |
TOTAL COMMON STOCKS (Cost $15,120,078) |
20,448,338
|
Preferred Stocks - 0.2% |
| | | |
Convertible Preferred Stocks - 0.2% |
CONSUMER DISCRETIONARY - 0.0% |
Media - 0.0% |
Glam Media, Inc. Series M-1: | | | |
8.00% (h) | 165,366 | | 845 |
8.00% (h) | 11,811 | | 60 |
8.00% (h) | 11,812 | | 60 |
| | 965 |
HEALTH CARE - 0.2% |
Biotechnology - 0.1% |
bluebird bio (h) | 4,658,909 | | 2,322 |
Intarcia Therapeutics, Inc. (h) | 516,522 | | 7,040 |
| | 9,362 |
Health Care Technology - 0.0% |
Castlight Health, Inc. Series D (a)(h) | 1,325,100 | | 9,276 |
Pharmaceuticals - 0.1% |
Agios Pharmaceuticals, Inc. Series C (a)(h) | 3,363,446 | | 16,518 |
TOTAL HEALTH CARE | | 35,156 |
INFORMATION TECHNOLOGY - 0.0% |
Internet Software & Services - 0.0% |
Dropbox, Inc. Series A (h) | 299,518 | | 2,710 |
Preferred Stocks - continued |
| Shares | | Value (000s) |
Convertible Preferred Stocks - continued |
INFORMATION TECHNOLOGY - continued |
Software - 0.0% |
Trion World Network, Inc.: | | | |
Series C, 8.00% (a)(h) | 602,295 | | $ 2,578 |
Series C-1, 8.00% (a)(h) | 47,380 | | 203 |
| | 2,781 |
TOTAL INFORMATION TECHNOLOGY | | 5,491 |
TOTAL CONVERTIBLE PREFERRED STOCKS | | 41,612 |
Nonconvertible Preferred Stocks - 0.0% |
CONSUMER DISCRETIONARY - 0.0% |
Automobiles - 0.0% |
Volkswagen AG | 9,700 | | 2,226 |
TOTAL PREFERRED STOCKS (Cost $45,704) |
43,838
|
Nonconvertible Bonds - 0.0% |
| Principal Amount (000s) | | |
CONSUMER DISCRETIONARY - 0.0% |
Media - 0.0% |
Glam Media, Inc.: | | | | |
9% 11/18/13 (h) | | $ 26 | | 26 |
9% 11/18/13 (h) | | 26 | | 26 |
9% 12/2/13 (h) | | 362 | | 362 |
| | 414 |
TOTAL NONCONVERTIBLE BONDS (Cost $414) |
414
|
Money Market Funds - 2.6% |
| Shares | | Value (000s) |
Fidelity Cash Central Fund, 0.18% (b) | 420,062,615 | | $ 420,062 |
Fidelity Securities Lending Cash Central Fund, 0.18% (b)(c) | 110,038,793 | | 110,039 |
TOTAL MONEY MARKET FUNDS (Cost $530,101) |
530,101
|
TOTAL INVESTMENT PORTFOLIO - 100.6% (Cost $15,696,297) | | 21,022,691 |
NET OTHER ASSETS (LIABILITIES) - (0.6)% | | (115,324) |
NET ASSETS - 100% | $ 20,907,367 |
Legend |
(a) Non-income producing |
(b) Affiliated fund that is available only to investment companies and other accounts managed by Fidelity Investments. The rate quoted is the annualized seven-day yield of the fund at period end. A complete unaudited listing of the fund's holdings as of its most recent quarter end is available upon request. In addition, each Fidelity Central Fund's financial statements, which are not covered by the Fund's Report of Independent Registered Public Accounting Firm, are available on the SEC's website or upon request. |
(c) Investment made with cash collateral received from securities on loan. |
(d) Security or a portion of the security is on loan at period end. |
(e) Affiliated company |
(f) Security exempt from registration under Rule 144A of the Securities Act of 1933. These securities may be resold in transactions exempt from registration, normally to qualified institutional buyers. At the end of the period, the value of these securities amounted to $65,407,000 or 0.3% of net assets. |
(g) Investment is owned by an entity that is treated as a corporation for U.S. tax purposes which is owned by the Fund. |
(h) Restricted securities - Investment in securities not registered under the Securities Act of 1933 (excluding 144A issues). At the end of the period, the value of restricted securities (excluding 144A issues) amounted to $170,956,000 or 0.8% of net assets. |
Additional information on each restricted holding is as follows: |
Security | Acquisition Date | Acquisition Cost (000s) |
Agios Pharmaceuticals, Inc. Series C | 11/16/11 | $ 16,518 |
bluebird bio | 7/23/12 | $ 2,322 |
Castlight Health, Inc. Series D | 4/25/12 | $ 7,999 |
Dropbox, Inc. | 5/2/12 | $ 11,672 |
Dropbox, Inc. Series A | 5/29/12 | $ 2,710 |
Fluidigm Corp. | 10/9/07 - 1/6/11 | $ 1,992 |
Glam Media, Inc. Series M-1:
8.00% | 3/19/08 | $ 3,024 |
8.00% | 3/19/08 | $ 216 |
8.00% | 3/19/08 | $ 216 |
Glam Media, Inc.: 9% 11/18/13 | 12/2/11 | $ 26 |
9% 11/18/13 | 12/2/11 | $ 26 |
9% 12/2/13 | 12/2/11 | $ 362 |
GoviEx Uranium, Inc. | 9/28/07 - 4/6/10 | $ 7,499 |
Intarcia Therapeutics, Inc. | 11/14/12 | $ 7,040 |
Ivanplats Ltd.
Class A | 10/23/12 | $ 13,509 |
KYTHERA Biopharmaceuticals, Inc. | 8/30/11 | $ 20,000 |
Security | Acquisition Date | Acquisition Cost (000s) |
Legend Pictures LLC | 9/23/10 - 12/18/12 | $ 12,915 |
Metro Bank PLC Class A | 5/21/12 | $ 3,791 |
Mu Sigma, Inc. | 12/21/12 | $ 15,000 |
Trion World Network, Inc. warrants 8/10/17 | 8/10/10 | $ 0* |
Trion World Network, Inc. Series C, 8.00% | 8/22/08 | $ 3,307 |
Trion World Network, Inc. Series C-1, 8.00% | 8/10/10 | $ 260 |
Weinstein Co. Holdings LLC Class A-1 | 10/19/05 | $ 2,267 |
Workday, Inc. | 10/13/11 | $ 3,773 |
* Amount represents less than $1,000. |
Affiliated Central Funds |
Information regarding fiscal year to date income earned by the Fund from investments in Fidelity Central Funds is as follows: |
Fund | Income earned
(Amounts in thousands) |
Fidelity Cash Central Fund | $ 1,482 |
Fidelity Securities Lending Cash Central Fund | 2,494 |
Total | $ 3,976 |
Other Affiliated Issuers |
An affiliated company is a company in which the Fund has ownership of at least 5% of the voting securities. Fiscal year to date transactions with companies which are or were affiliates are as follows: |
Affiliate
(Amounts in thousands) | Value, beginning of period | Purchases | Sales Proceeds | Dividend Income | Value,
end of
period |
KYTHERA Biopharmaceuticals, Inc. | $ - | $ 2,497 | $ - | $ - | $ 3,213 |
KYTHERA Biopharmaceuticals, Inc. | - | - | - | - | 39,278 |
New World Oil & Gas PLC | - | 2,884 | 3,633 | - | - |
OvaScience, Inc. | - | 6,000 | - | - | 9,131 |
Rooster Energy Ltd. | - | 6,357 | 299 | - | 5,188 |
Skope Energy, Inc. | 1,193 | - | - | - | 51 |
SPS Commerce, Inc. | 25,950 | - | - | - | 37,270 |
Total | $ 27,143 | $ 17,738 | $ 3,932 | $ - | $ 94,131 |
Other Information |
The following is a summary of the inputs used, as of December 31, 2012, involving the Fund's assets and liabilities carried at fair value. The inputs or methodology used for valuing securities may not be an indication of the risk associated with investing in those securities. For more information on valuation inputs, and their aggregation into the levels used in the tables below, please refer to the Investment Valuation section in the accompanying Notes to Financial Statements. |
Valuation Inputs at Reporting Date: |
Description
(Amounts in thousands) | Total | Level 1 | Level 2 | Level 3 |
Investments in Securities: | | | | |
Equities: | | | | |
Consumer Discretionary | $ 4,122,289 | $ 4,009,794 | $ 89,169 | $ 23,326 |
Consumer Staples | 1,902,943 | 1,839,033 | 63,910 | - |
Energy | 1,152,037 | 1,139,256 | 3,620 | 9,161 |
Financials | 2,718,080 | 2,512,645 | 201,547 | 3,888 |
Health Care | 2,597,652 | 2,289,392 | 272,850 | 35,410 |
Industrials | 1,117,548 | 1,038,699 | 78,849 | - |
Information Technology | 5,799,701 | 5,598,685 | 168,853 | 32,163 |
Materials | 1,048,908 | 965,011 | 83,897 | - |
Telecommunication Services | 21,021 | 21,021 | - | - |
Utilities | 11,997 | - | 11,997 | - |
Corporate Bonds | 414 | - | - | 414 |
Money Market Funds | 530,101 | 530,101 | - | - |
Total Investments in Securities: | $ 21,022,691 | $ 19,943,637 | $ 974,692 | $ 104,362 |
The following is a summary of transfers between Level 1 and Level 2 for the period ended December 31, 2012. Transfers are assumed to have occurred at the beginning of the period, and are primarily attributable to the valuation techniques used for foreign equity securities, as discussed in the accompanying Notes to Financial Statements: |
Transfers | Total (000s) |
Level 1 to Level 2 | $ 491,741 |
Level 2 to Level 1 | $ 0 |
Distribution of investments by country or territory of incorporation, as a percentage of total net assets, is as follows. (Unaudited) |
United States of America | 87.5% |
Canada | 3.9% |
Ireland | 1.2% |
United Kingdom | 1.2% |
Korea (South) | 1.0% |
Others (Individually Less Than 1%) | 5.2% |
| 100.0% |
See accompanying notes which are an integral part of the financial statements.
Annual Report
Statement of Assets and Liabilities
Amounts in thousands (except per-share amounts) | December 31, 2012 |
| | |
Assets | | |
Investment in securities, at value (including securities loaned of $108,679) - See accompanying schedule: Unaffiliated issuers (cost $15,101,098) | $ 20,398,459 | |
Fidelity Central Funds (cost $530,101) | 530,101 | |
Other affiliated issuers (cost $65,098) | 94,131 | |
Total Investments (cost $15,696,297) | | $ 21,022,691 |
Foreign currency held at value (cost $157) | | 157 |
Receivable for investments sold | | |
Regular delivery | | 15,712 |
Delayed delivery | | 10,105 |
Receivable for fund shares sold | | 53,293 |
Dividends receivable | | 9,162 |
Interest receivable | | 40 |
Distributions receivable from Fidelity Central Funds | | 307 |
Prepaid expenses | | 62 |
Other receivables | | 913 |
Total assets | | 21,112,442 |
| | |
Liabilities | | |
Payable for investments purchased | $ 4,314 | |
Payable for fund shares redeemed | 72,928 | |
Accrued management fee | 9,050 | |
Distribution and service plan fees payable | 4,389 | |
Other affiliated payables | 3,545 | |
Other payables and accrued expenses | 810 | |
Collateral on securities loaned, at value | 110,039 | |
Total liabilities | | 205,075 |
| | |
Net Assets | | $ 20,907,367 |
Net Assets consist of: | | |
Paid in capital | | $ 16,021,944 |
Accumulated net investment loss | | (11,189) |
Accumulated undistributed net realized gain (loss) on investments and foreign currency transactions | | (429,781) |
Net unrealized appreciation (depreciation) on investments and assets and liabilities in foreign currencies | | 5,326,393 |
Net Assets | | $ 20,907,367 |
See accompanying notes which are an integral part of the financial statements.
Annual Report
Statement of Assets and Liabilities - continued
Amounts in thousands (except per-share amounts) | December 31, 2012 |
| | |
Calculation of Maximum Offering Price Class A:
Net Asset Value and redemption price per share ($6,459,221 ÷ 283,978 shares) | | $ 22.75 |
| | |
Maximum offering price per share (100/94.25 of $22.75) | | $ 24.14 |
Class T:
Net Asset Value and redemption price per share ($1,794,864 ÷ 79,979 shares) | | $ 22.44 |
| | |
Maximum offering price per share (100/96.50 of $22.44) | | $ 23.25 |
Class B:
Net Asset Value and offering price per share ($239,491 ÷ 11,206 shares)A | | $ 21.37 |
| | |
Class C:
Net Asset Value and offering price per share ($2,515,368 ÷ 117,022 shares)A | | $ 21.49 |
| | |
Institutional Class:
Net Asset Value, offering price and redemption price per share ($9,898,423 ÷ 430,000 shares) | | $ 23.02 |
A Redemption price per share is equal to net asset value less any applicable contingent deferred sales charge.
See accompanying notes which are an integral part of the financial statements.
Annual Report
Financial Statements - continued
Statement of Operations
Amounts in thousands | Year ended December 31, 2012 |
| | |
Investment Income | | |
Dividends | | $ 218,773 |
Interest | | 789 |
Income from Fidelity Central Funds | | 3,976 |
Total income | | 223,538 |
| | |
Expenses | | |
Management fee
Basic fee | $ 110,084 | |
Performance adjustment | (4,764) | |
Transfer agent fees | 39,486 | |
Distribution and service plan fees | 51,921 | |
Accounting and security lending fees | 1,734 | |
Custodian fees and expenses | 521 | |
Independent trustees' compensation | 129 | |
Registration fees | 721 | |
Audit | 112 | |
Legal | 69 | |
Miscellaneous | 184 | |
Total expenses before reductions | 200,197 | |
Expense reductions | (1,159) | 199,038 |
Net investment income (loss) | | 24,500 |
Realized and Unrealized Gain (Loss) Net realized gain (loss) on: | | |
Investment securities: | | |
Unaffiliated issuers | 860,821 | |
Other affiliated issuers | 743 | |
Foreign currency transactions | (162) | |
Total net realized gain (loss) | | 861,402 |
Change in net unrealized appreciation (depreciation) on: Investment securities | 1,859,086 | |
Assets and liabilities in foreign currencies | 6 | |
Total change in net unrealized appreciation (depreciation) | | 1,859,092 |
Net gain (loss) | | 2,720,494 |
Net increase (decrease) in net assets resulting from operations | | $ 2,744,994 |
See accompanying notes which are an integral part of the financial statements.
Annual Report
Statement of Changes in Net Assets
Amounts in thousands | Year ended
December 31, 2012 | Year ended
December 31, 2011 |
Increase (Decrease) in Net Assets | | |
Operations | | |
Net investment income (loss) | $ 24,500 | $ (45,595) |
Net realized gain (loss) | 861,402 | 606,286 |
Change in net unrealized appreciation (depreciation) | 1,859,092 | (772,221) |
Net increase (decrease) in net assets resulting
from operations | 2,744,994 | (211,530) |
Distributions to shareholders from net investment income | (8,962) | - |
Distributions to shareholders from net realized gain | (86,291) | (24,043) |
Total distributions | (95,253) | (24,043) |
Share transactions - net increase (decrease) | 1,197,565 | 1,490,230 |
Total increase (decrease) in net assets | 3,847,306 | 1,254,657 |
| | |
Net Assets | | |
Beginning of period | 17,060,061 | 15,805,404 |
End of period (including accumulated net investment loss of $11,189 and accumulated net investment loss of $22,699, respectively) | $ 20,907,367 | $ 17,060,061 |
See accompanying notes which are an integral part of the financial statements.
Annual Report
Financial Highlights - Class A
Years ended December 31, | 2012 | 2011 | 2010 | 2009 | 2008 |
Selected Per-Share Data | | | | | |
Net asset value, beginning of period | $ 19.72 | $ 19.96 | $ 17.24 | $ 13.36 | $ 21.65 |
Income from Investment Operations | | | | | |
Net investment income (loss) C | .03 | (.05) | (.05) | - I | .05 |
Net realized and unrealized gain (loss) | 3.09 | (.15) | 2.81 | 3.89 | (8.22) |
Total from investment operations | 3.12 | (.20) | 2.76 | 3.89 | (8.17) |
Distributions from net investment income | - | - | - | - | - I |
Distributions from net realized gain | (.09) | (.04) | (.04) | (.01) | (.12) |
Total distributions | (.09) | (.04) | (.04) | (.01) | (.12) |
Net asset value, end of period | $ 22.75 | $ 19.72 | $ 19.96 | $ 17.24 | $ 13.36 |
Total Return A,B | 15.84% | (1.04)% | 16.07% | 29.12% | (37.92)% |
Ratios to Average Net Assets D,G | | | | | |
Expenses before reductions | 1.01% | 1.08% | 1.14% | 1.19% | 1.10% |
Expenses net of fee waivers, if any | 1.01% | 1.08% | 1.14% | 1.19% | 1.10% |
Expenses net of all reductions | 1.00% | 1.07% | 1.13% | 1.18% | 1.10% |
Net investment income (loss) | .13% | (.23)% | (.28)% | -% F | .26% |
Supplemental Data | | | | | |
Net assets, end of period (in millions) | $ 6,459 | $ 5,809 | $ 5,603 | $ 4,265 | $ 2,614 |
Portfolio turnover rate E | 47% | 58% | 47% H | 58% | 74% |
A Total returns would have been lower if certain expenses had not been reduced during the applicable periods shown.
B Total returns do not include the effect of the sales charges.
C Calculated based on average shares outstanding during the period.
D Fees and expenses of any underlying Fidelity Central Funds are not included in the Fund's expense ratio. The Fund indirectly bears its proportionate share of the expenses of any underlying Fidelity Central Funds.
E Amount does not include the portfolio activity of any underlying Fidelity Central Funds.
F Amount represents less than .01%.
G Expense ratios reflect operating expenses of the class. Expenses before reductions do not reflect amounts reimbursed by the investment adviser or reductions from brokerage service arrangements or reductions from other expense offset arrangements and do not represent the amount paid by the class during periods when reimbursements or reductions occur. Expenses net of fee waivers reflect expenses after reimbursement by the investment adviser but prior to reductions from brokerage service arrangements or other expense offset arrangements. Expenses net of all reductions represent the net expenses paid by the class.
H The portfolio turnover rate does not include the assets acquired in the merger.
I Amount represents less than $.01 per share.
See accompanying notes which are an integral part of the financial statements.
Annual Report
Financial Highlights - Class T
Years ended December 31, | 2012 | 2011 | 2010 | 2009 | 2008 |
Selected Per-Share Data | | | | | |
Net asset value, beginning of period | $ 19.46 | $ 19.74 | $ 17.08 | $ 13.26 | $ 21.56 |
Income from Investment Operations | | | | | |
Net investment income (loss) C | (.02) | (.10) | (.09) | (.04) | - H |
Net realized and unrealized gain (loss) C | 3.04 | (.14) | 2.78 | 3.86 | (8.18) |
Total from investment operations | 3.02 | (.24) | 2.69 | 3.82 | (8.18) |
Distributions from net realized gain | (.04) | (.04) | (.03) | - | (.12) |
Net asset value, end of period | $ 22.44 | $ 19.46 | $ 19.74 | $ 17.08 | $ 13.26 |
Total Return A,B | 15.52% | (1.25)% | 15.81% | 28.81% | (38.13)% |
Ratios to Average Net Assets D,F | | | | | |
Expenses before reductions | 1.25% | 1.32% | 1.38% | 1.45% | 1.34% |
Expenses net of fee waivers, if any | 1.25% | 1.32% | 1.38% | 1.45% | 1.34% |
Expenses net of all reductions | 1.24% | 1.32% | 1.38% | 1.44% | 1.34% |
Net investment income (loss) | (.11)% | (.48)% | (.52)% | (.25)% | .02% |
Supplemental Data | | | | | |
Net assets, end of period (in millions) | $ 1,795 | $ 1,640 | $ 1,756 | $ 1,557 | $ 1,254 |
Portfolio turnover rate E | 47% | 58% | 47% G | 58% | 74% |
A Total returns would have been lower if certain expenses had not been reduced during the applicable periods shown.
B Total returns do not include the effect of the sales charges.
C Calculated based on average shares outstanding during the period.
D Fees and expenses of any underlying Fidelity Central Funds are not included in the Fund's expense ratio. The Fund indirectly bears its proportionate share of the expenses of any underlying Fidelity Central Funds.
E Amount does not include the portfolio activity of any underlying Fidelity Central Funds.
F Expense ratios reflect operating expenses of the class. Expenses before reductions do not reflect amounts reimbursed by the investment adviser or reductions from brokerage service arrangements or reductions from other expense offset arrangements and do not represent the amount paid by the class during periods when reimbursements or reductions occur. Expenses net of fee waivers reflect expenses after reimbursement by the investment adviser but prior to reductions from brokerage service arrangements or other expense offset arrangements. Expenses net of all reductions represent the net expenses paid by the class.
G The portfolio turnover rate does not include the assets acquired in the merger.
H Amount represents less than $.01 per share.
See accompanying notes which are an integral part of the financial statements.
Annual Report
Financial Highlights - Class B
Years ended December 31, | 2012 | 2011 | 2010 | 2009 | 2008 |
Selected Per-Share Data | | | | | |
Net asset value, beginning of period | $ 18.60 | $ 18.95 | $ 16.49 | $ 12.88 | $ 21.04 |
Income from Investment Operations | | | | | |
Net investment income (loss) C | (.14) | (.20) | (.19) | (.11) | (.10) |
Net realized and unrealized gain (loss) | 2.91 | (.15) | 2.68 | 3.72 | (7.94) |
Total from investment operations | 2.77 | (.35) | 2.49 | 3.61 | (8.04) |
Distributions from net realized gain | - | - | (.03) | - | (.12) |
Net asset value, end of period | $ 21.37 | $ 18.60 | $ 18.95 | $ 16.49 | $ 12.88 |
Total Return A,B | 14.89% | (1.85)% | 15.14% | 28.03% | (38.41)% |
Ratios to Average Net Assets D,F | | | | | |
Expenses before reductions | 1.82% | 1.89% | 1.96% | 2.01% | 1.91% |
Expenses net of fee waivers, if any | 1.82% | 1.89% | 1.96% | 2.00% | 1.91% |
Expenses net of all reductions | 1.81% | 1.89% | 1.95% | 1.99% | 1.91% |
Net investment income (loss) | (.68)% | (1.05)% | (1.10)% | (.81)% | (.55)% |
Supplemental Data | | | | | |
Net assets, end of period (in millions) | $ 239 | $ 309 | $ 410 | $ 401 | $ 313 |
Portfolio turnover rate E | 47% | 58% | 47% G | 58% | 74% |
A Total returns would have been lower if certain expenses had not been reduced during the applicable periods shown.
B Total returns do not include the effect of the contingent deferred sales charge.
C Calculated based on average shares outstanding during the period.
D Fees and expenses of any underlying Fidelity Central Funds are not included in the Fund's expense ratio. The Fund indirectly bears its proportionate share of the expenses of any underlying Fidelity Central Funds.
E Amount does not include the portfolio activity of any underlying Fidelity Central Funds.
F Expense ratios reflect operating expenses of the class. Expenses before reductions do not reflect amounts reimbursed by the investment adviser or reductions from brokerage service arrangements or reductions from other expense offset arrangements and do not represent the amount paid by the class during periods when reimbursements or reductions occur. Expenses net of fee waivers reflect expenses after reimbursement by the investment adviser but prior to reductions from brokerage service arrangements or other expense offset arrangements. Expenses net of all reductions represent the net expenses paid by the class.
G The portfolio turnover rate does not include the assets acquired in the merger.
See accompanying notes which are an integral part of the financial statements.
Annual Report
Financial Highlights - Class C
Years ended December 31, | 2012 | 2011 | 2010 | 2009 | 2008 |
Selected Per-Share Data | | | | | |
Net asset value, beginning of period | $ 18.70 | $ 19.03 | $ 16.55 | $ 12.92 | $ 21.10 |
Income from Investment Operations | | | | | |
Net investment income (loss) C | (.13) | (.19) | (.17) | (.11) | (.09) |
Net realized and unrealized gain (loss) | 2.92 | (.14) | 2.68 | 3.74 | (7.97) |
Total from investment operations | 2.79 | (.33) | 2.51 | 3.63 | (8.06) |
Distributions from net realized gain | - | - | (.03) | - | (.12) |
Net asset value, end of period | $ 21.49 | $ 18.70 | $ 19.03 | $ 16.55 | $ 12.92 |
Total Return A,B | 14.92% | (1.73)% | 15.21% | 28.10% | (38.39)% |
Ratios to Average Net Assets D,F | | | | | |
Expenses before reductions | 1.75% | 1.83% | 1.88% | 1.95% | 1.85% |
Expenses net of fee waivers, if any | 1.75% | 1.83% | 1.88% | 1.95% | 1.85% |
Expenses net of all reductions | 1.75% | 1.82% | 1.88% | 1.94% | 1.85% |
Net investment income (loss) | (.62)% | (.98)% | (1.02)% | (.76)% | (.49)% |
Supplemental Data | | | | | |
Net assets, end of period (in millions) | $ 2,515 | $ 2,133 | $ 2,138 | $ 1,799 | $ 1,355 |
Portfolio turnover rate E | 47% | 58% | 47% G | 58% | 74% |
A Total returns would have been lower if certain expenses had not been reduced during the applicable periods shown.
B Total returns do not include the effect of the contingent deferred sales charge.
C Calculated based on average shares outstanding during the period.
D Fees and expenses of any underlying Fidelity Central Funds are not included in the Fund's expense ratio. The Fund indirectly bears its proportionate share of the expenses of any underlying Fidelity Central Funds.
E Amount does not include the portfolio activity of any underlying Fidelity Central Funds.
F Expense ratios reflect operating expenses of the class. Expenses before reductions do not reflect amounts reimbursed by the investment adviser or reductions from brokerage service arrangements or reductions from other expense offset arrangements and do not represent the amount paid by the class during periods when reimbursements or reductions occur. Expenses net of fee waivers reflect expenses after reimbursement by the investment adviser but prior to reductions from brokerage service arrangements or other expense offset arrangements. Expenses net of all reductions represent the net expenses paid by the class.
G The portfolio turnover rate does not include the assets acquired in the merger.
See accompanying notes which are an integral part of the financial statements.
Annual Report
Financial Highlights - Institutional Class
Years ended December 31, | 2012 | 2011 | 2010 | 2009 | 2008 |
Selected Per-Share Data | | | | | |
Net asset value, beginning of period | $ 19.96 | $ 20.14 | $ 17.39 | $ 13.49 | $ 21.84 |
Income from Investment Operations | | | | | |
Net investment income (loss) B | .09 | .01 | (.01) | .03 | .09 |
Net realized and unrealized gain (loss) | 3.12 | (.15) | 2.85 | 3.93 | (8.30) |
Total from investment operations | 3.21 | (.14) | 2.84 | 3.96 | (8.21) |
Distributions from net investment income | (.02) | - | - | (.02) | (.02) |
Distributions from net realized gain | (.13) | (.04) | (.09) | (.04) | (.12) |
Total distributions | (.15) | (.04) | (.09) | (.06) | (.14) |
Net asset value, end of period | $ 23.02 | $ 19.96 | $ 20.14 | $ 17.39 | $ 13.49 |
Total Return A | 16.11% | (.73)% | 16.34% | 29.37% | (37.76)% |
Ratios to Average Net Assets C,E | | | | | |
Expenses before reductions | .74% | .81% | .89% | .96% | .86% |
Expenses net of fee waivers, if any | .74% | .81% | .89% | .96% | .86% |
Expenses net of all reductions | .74% | .81% | .89% | .95% | .85% |
Net investment income (loss) | .39% | .03% | (.04)% | .24% | .50% |
Supplemental Data | | | | | |
Net assets, end of period (in millions) | $ 9,898 | $ 7,169 | $ 5,898 | $ 4,225 | $ 2,793 |
Portfolio turnover rate D | 47% | 58% | 47% F | 58% | 74% |
A Total returns would have been lower if certain expenses had not been reduced during the applicable periods shown.
B Calculated based on average shares outstanding during the period.
C Fees and expenses of any underlying Fidelity Central Funds are not included in the Fund's expense ratio. The Fund indirectly bears its proportionate share of the expenses of any underlying Fidelity Central Funds.
D Amount does not include the portfolio activity of any underlying Fidelity Central Funds.
E Expense ratios reflect operating expenses of the class. Expenses before reductions do not reflect amounts reimbursed by the investment adviser or reductions from brokerage service arrangements or reductions from other expense offset arrangements and do not represent the amount paid by the class during periods when reimbursements or reductions occur. Expenses net of fee waivers reflect expenses after reimbursement by the investment adviser but prior to reductions from brokerage service arrangements or other expense offset arrangements. Expenses net of all reductions represent the net expenses paid by the class.
F The portfolio turnover rate does not include the assets acquired in the merger.
See accompanying notes which are an integral part of the financial statements.
Annual Report
Notes to Financial Statements
For the period ended December 31, 2012
(Amounts in thousands except percentages)
1. Organization.
Fidelity Advisor New Insights Fund (the Fund) is a fund of Fidelity Contrafund (the Trust) and is authorized to issue an unlimited number of shares. The Trust is registered under the Investment Company Act of 1940, as amended (the 1940 Act), as an open-end management investment company organized as a Massachusetts business trust. The Fund offers Class A, Class T, Class C and Institutional Class shares, each of which, along with Class B shares, has equal rights as to assets and voting privileges. Class B shares are closed to new accounts and additional purchases, except for exchanges and reinvestments. Each class has exclusive voting rights with respect to matters that affect that class. Class B shares will automatically convert to Class A shares after a holding period of seven years from the initial date of purchase. Investment income, realized and unrealized capital gains and losses, the common expenses of the Fund, and certain fund-level expense reductions, if any, are allocated on a pro-rata basis to each class based on the relative net assets of each class to the total net assets of the Fund. Each class differs with respect to transfer agent and distribution and service plan fees incurred. Certain expense reductions may also differ by class.
2. Investments in Fidelity Central Funds.
The Fund invests in Fidelity Central Funds, which are open-end investment companies available only to other investment companies and accounts managed by Fidelity Management & Research Company (FMR) and its affiliates. The Fund's Schedule of Investments lists each of the Fidelity Central Funds held as of period end, if any, as an investment of the Fund, but does not include the underlying holdings of each Fidelity Central Fund. As an Investing Fund, the Fund indirectly bears its proportionate share of the expenses of the underlying Fidelity Central Funds.
The Money Market Central Funds seek preservation of capital and current income and are managed by Fidelity Investments Money Management, Inc. (FIMM), an affiliate of FMR.
A complete unaudited list of holdings for each Fidelity Central Fund is available upon request or at the Securities and Exchange Commission (the SEC) website at www.sec.gov. In addition, the financial statements of the Fidelity Central Funds, which are not covered by the Fund's Report of Independent Registered Public Accounting Firm, are available on the SEC website or upon request.
3. Significant Accounting Policies.
The financial statements have been prepared in conformity with accounting principles generally accepted in the United States of America (GAAP), which require management to make certain estimates and assumptions at the date of the financial statements. Actual results could differ from those estimates. Subsequent events, if any, through the date that the financial statements were issued have been evaluated in the preparation of the financial statements. The following summarizes the significant accounting policies of the Fund:
Annual Report
3. Significant Accounting Policies - continued
Investment Valuation. Investments are valued as of 4:00 p.m. Eastern time on the last calendar day of the period. In accordance with valuation policies and procedures approved by the Board of Trustees (the Board), the Fund attempts to obtain prices from one or more third party pricing vendors or brokers to value its investments. When current market prices, quotations or rates are not readily available or reliable, investments will be fair valued in good faith by the FMR Fair Value Committee (the Committee), in accordance with procedures adopted by the Fund's Board. Factors used in determining fair value vary by investment type and may include market or investment specific events, changes in interest rates and credit quality. The frequency with which these procedures are used cannot be predicted and they may be utilized to a significant extent. The Committee oversees the Fund's valuation policies and procedures and is responsible for approving and reporting to the Board all fair value determinations.
The Fund categorizes the inputs to valuation techniques used to value its investments into a disclosure hierarchy consisting of three levels as shown below:
Level 1 - quoted prices in active markets for identical investments
Level 2 - other significant observable inputs (including quoted prices for similar investments, interest rates, prepayment speeds, etc.)
Level 3 - unobservable inputs (including the Fund's own assumptions based on the best information available)
Valuation techniques used to value the Fund's investments by major category are as follows:
Equity securities, including restricted securities, for which market quotations are readily available, are valued at the last reported sale price or official closing price as reported by a third party pricing vendor on the primary market or exchange on which they are traded and are categorized as Level 1 in the hierarchy. In the event there were no sales during the day or closing prices are not available, securities are valued at the last quoted bid price or may be valued using the last available price and are generally categorized as Level 2 in the hierarchy. For foreign equity securities, when significant market or security specific events arise, comparisons to the valuation of American Depositary Receipts (ADRs), futures contracts, Exchange-Traded Funds (ETFs) and certain indexes as well as quoted prices for similar securities are used and are categorized as Level 2 in the hierarchy. Utilizing these techniques may result in transfers between Level 1 and Level 2. For restricted equity securities and private placements where observable inputs are limited, assumptions about market activity and risk are used and these securities are generally categorized as Level 3 in the hierarchy.
Annual Report
Notes to Financial Statements - continued
(Amounts in thousands except percentages)
3. Significant Accounting Policies - continued
Investment Valuation - continued
Debt securities, including restricted securities, are valued based on evaluated prices received from third party pricing vendors or from brokers who make markets in such securities. For corporate bonds, pricing vendors utilize matrix pricing which considers yield or price of bonds of comparable quality, coupon, maturity and type as well as broker-supplied prices and are generally categorized as Level 2 in the hierarchy. When independent prices are unavailable or unreliable, debt securities may be valued utilizing pricing methodologies which consider similar factors that would be used by third party pricing vendors. These are generally categorized as Level 2 in the hierarchy but may be Level 3 depending on the circumstances.
Investments in open-end mutual funds, including the Fidelity Central Funds, are valued at their closing net asset value (NAV) each business day and are categorized as Level 1 in the hierarchy.
Changes in valuation techniques may result in transfers in or out of an assigned level within the disclosure hierarchy. The aggregate value of investments by input level, as of December 31, 2012, including information on transfers between Levels 1 and 2, is included at the end of the Fund's Schedule of Investments.
Foreign Currency. The Fund may use foreign currency contracts to facilitate transactions in foreign-denominated securities. Gains and losses from these transactions may arise from changes in the value of the foreign currency or if the counterparties do not perform under the contracts' terms.
Foreign-denominated assets, including investment securities, and liabilities are translated into U.S. dollars at the exchange rates at period end. Purchases and sales of investment securities, income and dividends received and expenses denominated in foreign currencies are translated into U.S. dollars at the exchange rate in effect on the transaction date.
The effects of exchange rate fluctuations on investments are included with the net realized and unrealized gain (loss) on investment securities. Other foreign currency transactions resulting in realized and unrealized gain (loss) are disclosed separately.
Investment Transactions and Income. For financial reporting purposes, the Fund's investment holdings and NAV include trades executed through the end of the last business day of the period. The NAV per share for processing shareholder transactions is calculated as of the close of business of the New York Stock Exchange (NYSE), normally 4:00 p.m. Eastern time and includes trades executed through the end of the prior business day. Gains and losses on securities sold are determined on the basis of identified
Annual Report
3. Significant Accounting Policies - continued
Investment Transactions and Income - continued
cost and may include proceeds received from litigation. Dividend income is recorded on the ex-dividend date, except for certain dividends from foreign securities where the ex-dividend date may have passed, which are recorded as soon as the Fund is informed of the ex-dividend date. Non-cash dividends included in dividend income, if any, are recorded at the fair market value of the securities received. Distributions received on securities that represent a return of capital or capital gain are recorded as a reduction of cost of investments and/or as a realized gain. The Fund estimates the components of distributions received that may be considered return of capital distributions or capital gain distributions. Interest income and distributions from the Fidelity Central Funds are accrued as earned. Interest income includes coupon interest and amortization of premium and accretion of discount on debt securities. Investment income is recorded net of foreign taxes withheld where recovery of such taxes is uncertain.
Expenses. Expenses directly attributable to a fund are charged to that fund. Expenses attributable to more than one fund are allocated among the respective funds on the basis of relative net assets or other appropriate methods. Expense estimates are accrued in the period to which they relate and adjustments are made when actual amounts are known.
Deferred Trustee Compensation. Under a Deferred Compensation Plan (the Plan), independent Trustees may elect to defer receipt of a portion of their annual compensation. Deferred amounts are invested in a cross-section of Fidelity funds, are marked-to-market and remain in the Fund until distributed in accordance with the Plan. The investment of deferred amounts and the offsetting payable to the Trustees are included in the accompanying Statement of Assets and Liabilities.
Income Tax Information and Distributions to Shareholders. Each year, the Fund intends to qualify as a regulated investment company under Subchapter M of the Internal Revenue Code, including distributing substantially all of its taxable income and realized gains. As a result, no provision for income taxes is required. As of December 31, 2012, the Fund did not have any unrecognized tax benefits in the financial statements; nor is the Fund aware of any tax positions for which it is reasonably possible that the total amounts of unrecognized tax benefits will significantly change in the next twelve months. The Fund files a U.S. federal tax return, in addition to state and local tax returns as required. A fund's federal income tax returns are subject to examination by the Internal Revenue Service (IRS) for a period of three fiscal years after they are filed. State and local tax returns may be subject to examination for an additional fiscal year depending on the jurisdiction. Foreign taxes are provided for based on the Fund's understanding of the tax rules and rates that exist in the foreign markets in which it invests.
Annual Report
Notes to Financial Statements - continued
(Amounts in thousands except percentages)
3. Significant Accounting Policies - continued
Income Tax Information and Distributions to Shareholders - continued
Distributions are declared and recorded on the ex-dividend date. Income dividends and capital gain distributions are declared separately for each class. Income and capital gain distributions are determined in accordance with income tax regulations, which may differ from GAAP.
Capital accounts within the financial statements are adjusted for permanent book-tax differences. These adjustments have no impact on net assets or the results of operations. Temporary book-tax differences will reverse in a subsequent period.
Book-tax differences are primarily due to foreign currency transactions, passive foreign investment companies (PFIC), market discount, contingent interest, partnerships, deferred trustees compensation, capital loss carryforwards, and losses deferred due to wash sales and excise tax regulations.
The federal tax cost of investment securities and unrealized appreciation (depreciation) as of period end were as follows:
Gross unrealized appreciation | $ 5,444,974 |
Gross unrealized depreciation | (276,653) |
Net unrealized appreciation (depreciation) on securities and other investments | $ 5,168,321 |
| |
Tax Cost | $ 15,854,370 |
The tax-based components of distributable earnings as of period end were as follows:
Capital loss carryforward | $ (268,609) |
Net unrealized appreciation (depreciation) | $ 5,168,321 |
Capital loss carryforwards are only available to offset future capital gains of the Fund to the extent provided by regulations and may be limited. Under the Regulated Investment Company Modernization Act of 2010 (the Act), the Fund is permitted to carry forward capital losses incurred in taxable years beginning after December 22, 2010 for an unlimited period and such capital losses are required to be used prior to any losses that expire. Capital loss carryforwards were as follows:
Fiscal year of expiration | |
2015 | $ (5,939) |
2017 | (149,558) |
2018 | (113,112) |
Total with expiration | $ (268,609) |
Annual Report
3. Significant Accounting Policies - continued
Income Tax Information and Distributions to Shareholders - continued
The Fund acquired $5,939 of its capital loss carryforward as part of a merger in a prior period. The losses acquired that will be available to offset future capital gains of the Fund will be limited to approximately $1,979 per year.
The tax character of distributions paid was as follows:
| December 31, 2012 | December 31, 2011 |
Ordinary Income | $ 95,253 | $ 24,043 |
Delayed Delivery Transactions and When-Issued Securities. During the period, the Fund transacted in securities on a delayed delivery or when-issued basis. Payment and delivery may take place after the customary settlement period for that security. The price of the underlying securities and the date when the securities will be delivered and paid for are fixed at the time the transaction is negotiated. The Fund may receive compensation for interest forgone in the purchase of a delayed delivery or when-issued security. With respect to purchase commitments, the Fund identifies securities as segregated in its records with a value at least equal to the amount of the commitment. Losses may arise due to changes in the value of the underlying securities or if the counterparty does not perform under the contract's terms, or if the issuer does not issue the securities due to political, economic, or other factors.
Restricted Securities. The Fund may invest in securities that are subject to legal or contractual restrictions on resale. These securities generally may be resold in transactions exempt from registration or to the public if the securities are registered. Disposal of these securities may involve time-consuming negotiations and expense, and prompt sale at an acceptable price may be difficult. Information regarding restricted securities is included at the end of the Fund's Schedule of Investments.
4. Purchases and Sales of Investments.
Purchases and sales of securities, other than short-term securities, aggregated $10,493,187 and $8,803,571, respectively.
Annual Report
Notes to Financial Statements - continued
(Amounts in thousands except percentages)
5. Fees and Other Transactions with Affiliates.
Management Fee. FMR and its affiliates provide the Fund with investment management related services for which the Fund pays a monthly management fee. The management fee is the sum of an individual fund fee rate that is based on an annual rate of .30% of the Fund's average net assets and an annualized group fee rate that averaged .26% during the period. The group fee rate is based upon the average net assets of all the mutual funds advised by FMR. The group fee rate decreases as assets under management increase and increases as assets under management decrease. In addition, the management fee is subject to a performance adjustment (up to a maximum of ± .20% of the Fund's average net assets over a 36 month performance period). The upward or downward adjustment to the management fee is based on the relative investment performance of the Institutional Class of the Fund as compared to an appropriate benchmark index. For the period, the total annual management fee rate, including the performance adjustment, was .53% of the Fund's average net assets.
Distribution and Service Plan Fees. In accordance with Rule 12b-1 of the 1940 Act, the Fund has adopted separate Distribution and Service Plans for each class of shares. Certain classes pay Fidelity Distributors Corporation (FDC), an affiliate of FMR, separate Distribution and Service Fees, each of which is based on an annual percentage of each class' average net assets. In addition, FDC may pay financial intermediaries for selling shares of the Fund and providing shareholder support services. For the period, the Distribution and Service Fee rates, total fees and amounts retained by FDC were as follows:
| Distribution
Fee | Service
Fee | Total Fees | Retained
by FDC |
Class A | -% | .25% | $ 15,824 | $ 391 |
Class T | .25% | .25% | 8,968 | 47 |
Class B | .75% | .25% | 2,912 | 2,192 |
Class C | .75% | .25% | 24,217 | 3,870 |
| | | $ 51,921 | $ 6,500 |
Sales Load. FDC may receive a front-end sales charge of up to 5.75% for selling Class A shares and 3.50% for selling Class T shares, some of which is paid to financial intermediaries for selling shares of the Fund. Depending on the holding period, FDC may receive contingent deferred sales charges levied on Class A, Class T, Class B, and Class C redemptions. The deferred sales charges range from 5.00% to 1.00% for Class B shares, 1.00% for Class C shares, 1.00% for certain purchases of Class A shares and .25% for certain purchases of Class T shares.
Annual Report
5. Fees and Other Transactions with Affiliates - continued
Sales Load - continued
For the period, sales charge amounts retained by FDC were as follows:
| Retained
by FDC |
Class A | $ 1,352 |
Class T | 196 |
Class B* | 333 |
Class C* | 173 |
| $ 2,054 |
* When Class B and Class C shares are initially sold, FDC pays commissions from its own resources to financial intermediaries through which the sales are made.
Transfer Agent Fees. Fidelity Investments Institutional Operations Company, Inc. (FIIOC), an affiliate of FMR, is the transfer, dividend disbursing and shareholder servicing agent for each class of the Fund. FIIOC receives account fees and asset-based fees that vary according to the account size and type of account of the shareholders of the respective classes of the Fund. FIIOC pays for typesetting, printing and mailing of shareholder reports, except proxy statements. For the period, transfer agent fees for each class were as follows:
| Amount | % of
Average
Net Assets |
Class A | $ 13,092 | .21 |
Class T | 3,551 | .20 |
Class B | 780 | .27 |
Class C | 4,950 | .20 |
Institutional Class | 17,113 | .19 |
| $ 39,486 | |
Accounting and Security Lending Fees. Fidelity Service Company, Inc. (FSC), an affiliate of FMR, maintains the Fund's accounting records. The accounting fee is based on the level of average net assets for each month. Under a separate contract, FSC administers the security lending program. The security lending fee is based on the number and duration of lending transactions.
Brokerage Commissions. The Fund placed a portion of its portfolio transactions with brokerage firms which are affiliates of the investment adviser. The commissions paid to these affiliated firms were $136 for the period.
Annual Report
Notes to Financial Statements - continued
(Amounts in thousands except percentages)
6. Committed Line of Credit.
The Fund participates with other funds managed by FMR or an affiliate in a $4.25 billion credit facility (the "line of credit") to be utilized for temporary or emergency purposes to fund shareholder redemptions or for other short-term liquidity purposes. The Fund has agreed to pay commitment fees on its pro-rata portion of the line of credit, which amounted to $51 and is reflected in Miscellaneous expenses on the Statement of Operations. During the period, there were no borrowings on this line of credit.
7. Security Lending.
The Fund lends portfolio securities through a lending agent from time to time in order to earn additional income. For equity securities, a lending agent is used and may loan securities to certain qualified borrowers, including Fidelity Capital Markets (FCM), a broker-dealer affiliated with the Fund. On the settlement date of the loan, the Fund receives collateral (in the form of U.S. Treasury obligations, letters of credit and/or cash) against the loaned securities and maintains collateral in an amount not less than 100% of the market value of the loaned securities during the period of the loan. The market value of the loaned securities is determined at the close of business of the Fund and any additional required collateral is delivered to the Fund on the next business day. If the borrower defaults on its obligation to return the securities loaned because of insolvency or other reasons, a fund could experience delays and costs in recovering the securities loaned or in gaining access to the collateral. Any cash collateral received is invested in the Fidelity Securities Lending Cash Central Fund. The value of loaned securities and cash collateral at period end are disclosed on the Fund's Statement of Assets and Liabilities. The value of securities loaned to FCM at period end was $1,721. Security lending income represents the income earned on investing cash collateral, less rebates paid to borrowers and any lending agent fees associated with the loan, plus any premium payments received for lending certain types of securities. Security lending income is presented in the Statement of Operations as a component of income from Fidelity Central Funds. Total security lending income during the period amounted to $2,494, including $112 from securities loaned to FCM.
8. Expense Reductions.
Many of the brokers with whom FMR places trades on behalf of the Fund provided services to the Fund in addition to trade execution. These services included payments of certain expenses on behalf of the Fund totaling $1,158 for the period. In addition, through arrangements with the Fund's custodian, credits realized as a result of uninvested cash balances were used to reduce the Fund's expenses. During the period, these credits reduced the Fund's custody expenses by $1.
Annual Report
9. Distributions to Shareholders.
Distributions to shareholders of each class were as follows:
Years ended December 31, | 2012 | 2011 |
From net investment income | | |
Class A | $ - | $ - |
Class T | - | - |
Class B | - | - |
Class C | - | - |
Institutional Class | 8,962 | - |
Total | $ 8,962 | $ - |
From net realized gain | | |
Class A | $ 26,405 | $ 10,098 |
Class T | 3,128 | 3,142 |
Class B | - | - |
Class C | - | - |
Institutional Class | 56,758 | 10,803 |
Total | $ 86,291 | $ 24,043 |
10. Share Transactions.
Transactions for each class of shares were as follows:
| Shares | Dollars |
Years ended December 31, | 2012 | 2011 | 2012 | 2011 |
Class A | | | | |
Shares sold | 69,742 | 90,043 | $ 1,537,976 | $ 1,820,476 |
Reinvestment of distributions | 1,068 | 439 | 24,021 | 9,175 |
Shares redeemed | (81,404) | (76,699) | (1,797,007) | (1,538,413) |
Net increase (decrease) | (10,594) | 13,783 | $ (235,010) | $ 291,238 |
Class T | | | | |
Shares sold | 13,706 | 18,906 | $ 297,340 | $ 377,982 |
Reinvestment of distributions | 128 | 139 | 2,849 | 2,869 |
Shares redeemed | (18,113) | (23,772) | (394,342) | (474,099) |
Net increase (decrease) | (4,279) | (4,727) | $ (94,153) | $ (93,248) |
Class B | | | | |
Shares sold | 265 | 510 | $ 5,463 | $ 9,732 |
Reinvestment of distributions | - | - | - | - |
Shares redeemed | (5,694) | (5,503) | (118,394) | (105,005) |
Net increase (decrease) | (5,429) | (4,993) | $ (112,931) | $ (95,273) |
Annual Report
Notes to Financial Statements - continued
(Amounts in thousands except percentages)
10. Share Transactions - continued
| Shares | Dollars |
Years ended December 31, | 2012 | 2011 | 2012 | 2011 |
Class C | | | | |
Shares sold | 22,815 | 23,065 | $ 474,829 | $ 444,337 |
Reinvestment of distributions | - | - | - | - |
Shares redeemed | (19,869) | (21,338) | (414,007) | (406,710) |
Net increase (decrease) | 2,946 | 1,727 | $ 60,822 | $ 37,627 |
Institutional Class | | | | |
Shares sold | 143,736 | 141,293 | $ 3,208,589 | $ 2,863,246 |
Reinvestment of distributions | 2,421 | 404 | 55,102 | 8,538 |
Shares redeemed | (75,358) | (75,337) | (1,684,854) | (1,521,898) |
Net increase (decrease) | 70,799 | 66,360 | $ 1,578,837 | $ 1,349,886 |
11. Other.
The Fund's organizational documents provide former and current trustees and officers with a limited indemnification against liabilities arising in connection with the performance of their duties to the Fund. In the normal course of business, the Fund may also enter into contracts that provide general indemnifications. The Fund's maximum exposure under these arrangements is unknown as this would be dependent on future claims that may be made against the Fund. The risk of material loss from such claims is considered remote.
Annual Report
To the Trustees of Fidelity Contrafund and the Shareholders of Fidelity Advisor New Insights Fund:
In our opinion, the accompanying statement of assets and liabilities, including the schedule of investments, and the related statements of operations and of changes in net assets and the financial highlights present fairly, in all material respects, the financial position of Fidelity Advisor New Insights Fund (a fund of Fidelity Contrafund) at December 31, 2012, the results of its operations for the year then ended, the changes in its net assets for each of the two years in the period then ended and the financial highlights for each of the five years in the period then ended, in conformity with accounting principles generally accepted in the United States of America. These financial statements and financial highlights (hereafter referred to as "financial statements") are the responsibility of the Fidelity Advisor New Insights Fund's management. Our responsibility is to express an opinion on these financial statements based on our audits. We conducted our audits of these financial statements in accordance with the standards of the Public Company Accounting Oversight Board (United States). Those standards require that we plan and perform the audit to obtain reasonable assurance about whether the financial statements are free of material misstatement. An audit includes examining, on a test basis, evidence supporting the amounts and disclosures in the financial statements, assessing the accounting principles used and significant estimates made by management, and evaluating the overall financial statement presentation. We believe that our audits, which included confirmation of securities at December 31, 2012 by correspondence with the custodian and brokers, provide a reasonable basis for our opinion.
PricewaterhouseCoopers LLP
Boston, Massachusetts
February 15, 2013
Annual Report
The Trustees, Members of the Advisory Board, and executive officers of the trust and fund, as applicable, are listed below. The Board of Trustees governs the fund and is responsible for protecting the interests of shareholders. The Trustees are experienced executives who meet periodically throughout the year to oversee the fund's activities, review contractual arrangements with companies that provide services to the fund, oversee management of the risks associated with such activities and contractual arrangements, and review the fund's performance. Except for James C. Curvey, each of the Trustees oversees 234 funds advised by FMR or an affiliate. Mr. Curvey oversees 452 funds advised by FMR or an affiliate.
The Trustees hold office without limit in time except that (a) any Trustee may resign; (b) any Trustee may be removed by written instrument, signed by at least two-thirds of the number of Trustees prior to such removal; (c) any Trustee who requests to be retired or who has become incapacitated by illness or injury may be retired by written instrument signed by a majority of the other Trustees; and (d) any Trustee may be removed at any special meeting of shareholders by a two-thirds vote of the outstanding voting securities of the trust. Each Trustee who is not an interested person (as defined in the 1940 Act) (Independent Trustee), shall retire not later than the last day of the calendar year in which his or her 75th birthday occurs. The Independent Trustees may waive this mandatory retirement age policy with respect to individual Trustees. The executive officers and Advisory Board Members hold office without limit in time, except that any officer and Advisory Board Member may resign or may be removed by a vote of a majority of the Trustees at any regular meeting or any special meeting of the Trustees. Except as indicated, each individual has held the office shown or other offices in the same company for the past five years.
Experience, Skills, Attributes, and Qualifications of the Fund's Trustees. The Governance and Nominating Committee has adopted a statement of policy that describes the experience, qualifications, attributes, and skills that are necessary and desirable for potential Independent Trustee candidates (Statement of Policy). The Board believes that each Trustee satisfied at the time he or she was initially elected or appointed a Trustee, and continues to satisfy, the standards contemplated by the Statement of Policy. The Governance and Nominating Committee also engages professional search firms to help identify potential Independent Trustee candidates who have the experience, qualifications, attributes, and skills consistent with the Statement of Policy. From time to time, additional criteria based on the composition and skills of the current Independent Trustees, as well as experience or skills that may be appropriate in light of future changes to board composition, business conditions, and regulatory or other developments, have also been considered by the professional search firms and the Governance and Nominating Committee. In addition, the Board takes into account the Trustees' commitment and participation in Board and committee meetings, as well as their leadership of standing and ad hoc committees throughout their tenure.
In determining that a particular Trustee was and continues to be qualified to serve as a Trustee, the Board has considered a variety of criteria, none of which, in isolation, was controlling. The Board believes that, collectively, the Trustees have balanced and diverse experience, qualifications, attributes, and skills, which allow the Board to operate effectively in governing the fund and protecting the interests of shareholders. Information about the specific experience, skills, attributes, and qualifications of each Trustee, which in each case led to the Board's conclusion that the Trustee should serve (or continue to serve) as a trustee of the fund, is provided below.
Annual Report
Board Structure and Oversight Function. James C. Curvey is an interested person (as defined in the 1940 Act) and currently serves as Chairman. The Trustees have determined that an interested Chairman is appropriate and benefits shareholders because an interested Chairman has a personal and professional stake in the quality and continuity of services provided to the fund. Independent Trustees exercise their informed business judgment to appoint an individual of their choosing to serve as Chairman, regardless of whether the Trustee happens to be independent or a member of management. The Independent Trustees have determined that they can act independently and effectively without having an Independent Trustee serve as Chairman and that a key structural component for assuring that they are in a position to do so is for the Independent Trustees to constitute a substantial majority for the Board. The Independent Trustees also regularly meet in executive session. Ned C. Lautenbach serves as Chairman of the Independent Trustees and as such (i) acts as a liaison between the Independent Trustees and management with respect to matters important to the Independent Trustees and (ii) with management prepares agendas for Board meetings.
Fidelity funds are overseen by different Boards of Trustees. The fund's Board oversees Fidelity's equity and high income funds and another Board oversees Fidelity's investment-grade bond, money market, and asset allocation funds. The asset allocation funds may invest in Fidelity funds overseen by the fund's Board. The use of separate Boards, each with its own committee structure, allows the Trustees of each group of Fidelity funds to focus on the unique issues of the funds they oversee, including common research, investment, and operational issues. On occasion, the separate Boards establish joint committees to address issues of overlapping consequences for the Fidelity funds overseen by each Board.
The Trustees operate using a system of committees to facilitate the timely and efficient consideration of all matters of importance to the Trustees, the fund, and fund shareholders and to facilitate compliance with legal and regulatory requirements and oversight of the fund's activities and associated risks. The Board, acting through its committees, has charged FMR and its affiliates with (i) identifying events or circumstances the occurrence of which could have demonstrably adverse effects on the fund's business and/or reputation; (ii) implementing processes and controls to lessen the possibility that such events or circumstances occur or to mitigate the effects of such events or circumstances if they do occur; and (iii) creating and maintaining a system designed to evaluate continuously business and market conditions in order to facilitate the identification and implementation processes described in (i) and (ii) above. Because the day-to-day operations and activities of the fund are carried out by or through FMR, its affiliates and other service providers, the fund's exposure to risks is mitigated but not eliminated by the processes overseen by the Trustees. While each of the Board's committees has responsibility for overseeing different aspects of the fund's activities, oversight is exercised primarily through the Operations, Audit, and Compliance Committees. In addition, the Independent Trustees have worked with FMR to enhance the Board's oversight of investment and financial risks, legal and regulatory risks, technology risks, and operational risks, including the development of additional risk reporting to the Board. For example, a working group comprised of Independent Trustees and FMR has worked and continues to work to review the Fidelity funds' valuation-related activities, reporting and risk management. Appropriate personnel, including but not limited to the fund's Chief Compliance Officer (CCO), FMR's internal auditor, the independent accountants, the fund's Treasurer and portfolio management personnel, make periodic reports to the Board's committees, as appropriate, including an annual review of FMR's risk management program for the Fidelity funds. The responsibilities of each standing committee, including their oversight responsibilities, are described further under "Standing Committees of the Fund's Trustees."
Annual Report
Trustees and Officers - continued
The fund's Statement of Additional Information (SAI) includes more information about the Trustees. To request a free copy, call Fidelity at 1-877-208-0098.
Interested Trustees*:
Correspondence intended for each Trustee who is an interested person may be sent to Fidelity Investments, 82 Devonshire Street, Boston, Massachusetts 02109.
Name, Age; Principal Occupations and Other Relevant Experience+ |
James C. Curvey (77) |
| Year of Election or Appointment: 2007 Mr. Curvey is Trustee and Chairman of the Board of Trustees of certain Trusts. Mr. Curvey also serves as Trustee (2007-present) of other investment companies advised by FMR. Mr. Curvey is a Director of Fidelity Investments Money Management, Inc. (2009-present), Director of Fidelity Research & Analysis Co. (2009-present) and Director of FMR and FMR Co., Inc. (2007-present). Mr. Curvey is also Vice Chairman (2007-present) and Director of FMR LLC. In addition, Mr. Curvey serves as an Overseer for the Boston Symphony Orchestra and a member of the Trustees of Villanova University. Previously, Mr. Curvey was the Vice Chairman (2006-2007) and Director (2000-2007) of FMR Corp. |
Ronald P. O'Hanley (55) |
| Year of Election or Appointment: 2011 Mr. O'Hanley is Director of FMR Co., Inc. (2010-present), Director of Fidelity Investments Money Management, Inc. (2010-present), Director of Fidelity Research & Analysis Company (2010-present), President of Fidelity Asset Management and Corporate Services and a member of Fidelity's Executive Committee (2010-present). Previously, Mr. O'Hanley served as President and Chief Executive Officer of BNY Mellon Asset Management (2007-2010). Mr. O'Hanley also served as Vice Chairman of Bank New York Mellon Corp. and a member of that firm's Executive Committee. Prior to the 2007 merger of The Bank of New York and Mellon Financial Corporation, he was Vice Chairman of Mellon Financial Corporation and President and Chief Executive Officer of Mellon Asset Management. He joined Mellon in February 1997. Mr. O'Hanley currently serves as Chairman of the Boston Public Library Foundation Board of Directors and sits on the Board of Directors of Beth Israel Deaconess Medical Center, the Board of Trustees of the Marine Biological Laboratory and the Advisory Board of the Maxwell School of Citizenship and Public Administration at Syracuse University. Mr. O'Hanley also chairs the Council on Asset Management for the Financial Services Roundtable and is a member of the Board of Directors of Institutional Investor's U.S. Institute. |
* Trustees have been determined to be "Interested Trustees" by virtue of, among other things, their affiliation with the trust or various entities under common control with FMR.
+ The information above includes each Trustee's principal occupation during the last five years and other information relating to the experience, attributes, and skills relevant to each Trustee's qualifications to serve as a Trustee, which led to the conclusion that each Trustee should serve as a Trustee for the fund.
Annual Report
Trustees and Officers - continued
Independent Trustees:
Correspondence intended for each Independent Trustee (that is, the Trustees other than the Interested Trustees) may be sent to Fidelity Investments, P.O. Box 55235, Boston, Massachusetts 02205-5235.
Name, Age; Principal Occupations and Other Relevant Experience+ |
Dennis J. Dirks (64) |
| Year of Election or Appointment: 2005 Prior to his retirement in May 2003, Mr. Dirks was Chief Operating Officer and a member of the Board of The Depository Trust & Clearing Corporation (DTCC). He also served as President, Chief Operating Officer, and Board member of The Depository Trust Company (DTC) and President and Board member of the National Securities Clearing Corporation (NSCC). In addition, Mr. Dirks served as Chief Executive Officer and Board member of the Government Securities Clearing Corporation, Chief Executive Officer and Board member of the Mortgage-Backed Securities Clearing Corporation, as a Trustee and a member of the Finance Committee of Manhattan College (2005-2008), and as a Trustee and a member of the Finance Committee of AHRC of Nassau County (2006-2008). Mr. Dirks is a member of the Independent Directors Council (IDC) Governing Council (2010-present) and Board of Directors for The Brookville Center for Children's Services, Inc. (2009-present). |
Alan J. Lacy (59) |
| Year of Election or Appointment: 2008 Mr. Lacy serves as Senior Adviser (2007-present) of Oak Hill Capital Partners, L.P. (private equity). Mr. Lacy also served as Chief Executive Officer (2000-2005) and Vice Chairman (2005-2006) of Sears Holdings Corporation and Sears, Roebuck and Co. (retail). In addition, Mr. Lacy serves as a member of the Board of Directors of Dave & Buster's Entertainment, Inc. (restaurant and entertainment complexes, 2010-present), Earth Fare, Inc. (retail grocery, 2012-present), The Hillman Companies, Inc. (hardware wholesalers, 2010-present), and Bristol-Myers Squibb Company (global pharmaceuticals, 2008-present). Mr. Lacy is a member of the Board of Trustees of The National Parks Conservation Association (2006-present). Previously, Mr. Lacy served as Chairman of the Board of Trustees of the National Parks Conservation Association (2008-2011) and as a member of the Board of Directors for the Western Union Company (global money transfer, 2006-2011). |
Ned C. Lautenbach (68) |
| Year of Election or Appointment: 2000 Mr. Lautenbach is Chairman of the Independent Trustees of the Equity and High Income Funds (2006-present). Mr. Lautenbach currently serves as the Lead Director of the Eaton Corporation Board of Directors (diversified industrial, 1997-present). Mr. Lautenbach is Chairman of the Board of Directors of the Philharmonic Center for the Arts in Naples, Florida (2012-present) and a member of the Council on Foreign Relations (1994-present). Previously, Mr. Lautenbach was a Partner/Advisory Partner at Clayton, Dubilier & Rice, LLC (private equity investment, 1998-2010), as well as a Director of Sony Corporation (2006-2007). |
Joseph Mauriello (68) |
| Year of Election or Appointment: 2008 Prior to his retirement in January 2006, Mr. Mauriello served in numerous senior management positions including Deputy Chairman and Chief Operating Officer (2004-2005), and Vice Chairman of Financial Services (2002-2004) of KPMG LLP US (professional services, 1965-2005). Mr. Mauriello currently serves as a member of the Board of Directors of XL Group plc. (global insurance and re-insurance, 2006-present). Previously, Mr. Mauriello served as a Director of the Hamilton Funds of the Bank of New York (2006-2007) and of Arcadia Resources Inc. (health care services and products, 2007-2012). |
Robert W. Selander (62) |
| Year of Election or Appointment: 2011 Previously, Mr. Selander served as a Member of the Advisory Board of Fidelity's Equity and High Income Funds (2011), Executive Vice Chairman (2010), Chief Executive Officer (2009-2010), and President and Chief Executive Officer (1997-2009) of Mastercard, Inc. |
Cornelia M. Small (68) |
| Year of Election or Appointment: 2005 Ms. Small is a member of the Board of Directors (2009-present) and Chair of the Investment Committee (2010-present) of the Teagle Foundation. Ms. Small also serves on the Investment Committee of the Berkshire Taconic Community Foundation (2008-present). Previously, Ms. Small served as Chairperson (2002-2008) and a member of the Investment Committee and Chairperson (2008-2012) and a member of the Board of Trustees of Smith College. In addition, Ms. Small served as Chief Investment Officer, Director of Global Equity Investments, and a member of the Board of Directors of Scudder, Stevens & Clark and Scudder Kemper Investments. |
William S. Stavropoulos (73) |
| Year of Election or Appointment: 2001 Mr. Stavropoulos is Vice Chairman of the Independent Trustees of the Equity and High Income Funds (2006-present). Mr. Stavropoulos serves as President and Founder of the Michigan Baseball Foundation, the Great Lakes Loons (2007-present). Mr. Stavropoulos is Chairman Emeritus of the Board of Directors of The Dow Chemical Company, where he previously served in numerous senior management positions, including President, CEO (1995-2000; 2002-2004), Chairman of the Executive Committee (2000-2006), and as a member of the Board of Directors (1990-2006). Currently, Mr. Stavropoulos is a Director of Univar Inc. (global distributor of commodity and specialty chemicals, Chairman from 2010-May 2012 and Lead Director from May 2012-present), Teradata Corporation (data warehousing and technology solutions, 2008-present), Maersk Inc. (industrial conglomerate), and Tyco International, Ltd. (multinational manufacturing and services, 2007-present), and a member of the Advisory Board for Metalmark Capital LLC (private equity investment, 2005-present). Mr. Stavropoulos is an operating advisor to Clayton, Dubilier & Rice, LLC (private equity investment). In addition, Mr. Stavropoulos is a member of the University of Notre Dame Advisory Council for the College of Science, a Trustee of the Rollin L. Gerstacker Foundation, and a Director of the Naples Philharmonic Center for the Arts. Previously, Mr. Stavropoulos served as a Director of Chemical Financial Corporation (bank holding company, 1993-2012). |
David M. Thomas (63) |
| Year of Election or Appointment: 2008 Previously, Mr. Thomas served as Executive Chairman (2005-2006) and Chairman and Chief Executive Officer (2000-2005) of IMS Health, Inc. (pharmaceutical and healthcare information solutions), and a Director of Fortune Brands, Inc. (consumer products, 2000-2011). In addition, Mr. Thomas serves as Non-Executive Chairman of the Board of Directors of Fortune Brands Home and Security (home and security products, 2011-present), and as a member of the Board of Directors of Interpublic Group of Companies, Inc. (marketing communication, 2004-present). |
Michael E. Wiley (62) |
| Year of Election or Appointment: 2008 Mr. Wiley also serves as a Director of Asia Pacific Exploration Consolidated (international oil and gas exploration and production, 2008-present). Mr. Wiley serves as a Director of Tesoro Corporation (independent oil refiner and marketer, 2005-present), and a Director of Bill Barrett Corporation (exploration and production, 2005-present). In addition, Mr. Wiley also serves as a Director of Post Oak Bank (privately-held bank, 2004-present). Previously, Mr. Wiley served as a member of the Board of Trustees of the University of Tulsa (2000-2006; 2007-2010), as a Senior Energy Advisor of Katzenbach Partners, LLC (consulting, 2006-2007), as an Advisory Director of Riverstone Holdings (private investment), Chairman, President, and CEO of Baker Hughes, Inc. (oilfield services, 2000-2004), and as Director of Spinnaker Exploration Company (exploration and production, 2001-2005). |
+ The information above includes each Trustee's principal occupation during the last five years and other information relating to the experience, attributes, and skills relevant to each Trustee's qualifications to serve as a Trustee, which led to the conclusion that each Trustee should serve as a Trustee for the fund.
Advisory Board Members and Executive Officers:
Correspondence intended for David A. Rosow and Garnett A. Smith may be sent to Fidelity Investments, P.O. Box 55235, Boston, Massachusetts 02205-5235. Correspondence intended for each executive officer and Peter S. Lynch may be sent to Fidelity Investments, 82 Devonshire Street, Boston, Massachusetts 02109.
Name, Age; Principal Occupation |
Peter S. Lynch (68) |
| Year of Election or Appointment: 2003 Member of the Advisory Board of Fidelity's Equity and High Income Funds. Mr. Lynch is Vice Chairman and a Director of FMR and FMR Co., Inc. In addition, Mr. Lynch serves as a Trustee of Boston College and as the Chairman of the Inner-City Scholarship Fund. Previously, Mr. Lynch served on the Special Olympics International Board of Directors (1997-2006). |
David A. Rosow (70) |
| Year of Election or Appointment: 2012 Member of the Advisory Board of Fidelity's Equity and High Income Funds. Chairman and Chief Executive Officer of International Golf Group, Inc. (golf course development, 1989-present). Previously, Mr. Rosow served as Chairman and Chief Executive Officer of Rosow & Company, Inc. (private investment company, 1989-2011), a Lead Director of Hudson United Bancorp (2001-2006) and as a Director of TD Banknorth (1996-2006). In addition, Mr. Rosow is a member (2008-present) and President (2009-present) of the Town Council of Palm Beach, Florida. |
Garnett A. Smith (65) |
| Year of Election or Appointment: 2012 Member of the Advisory Board of Fidelity's Equity and High Income Funds. Prior to Mr. Smith's retirement, he served as Chairman and Chief Executive Officer of Inbrand Corp. (manufacturer of personal absorbent products, 1990-1997). He also served as President (1986-1990) of Inbrand Corp. Prior to his employment with Inbrand Corp., he was employed by a retail fabric chain and North Carolina National Bank. In addition, Mr. Smith is a board member of the Jackson Hole Land Trust (2009-present). |
Kenneth B. Robins (43) |
| Year of Election or Appointment: 2008 President and Treasurer of Fidelity's Equity and High Income Funds. Mr. Robins also serves as President and Treasurer (2010-present) and Assistant Treasurer (2009-present) of other Fidelity funds and is an employee of Fidelity Investments (2004-present). Previously, Mr. Robins served as Deputy Treasurer of the Fidelity funds (2005-2008) and Treasurer and Chief Financial Officer of The North Carolina Capital Management Trust: Cash and Term Portfolios (2006-2008). |
Bruce T. Herring (47) |
| Year of Election or Appointment: 2006 Vice President of certain Equity Funds. Mr. Herring also serves as President of Fidelity Research & Analysis Company (2010-present), Chief Investment Officer and Director of Fidelity Management & Research (U.K.) Inc. (2010-present) and Group Chief Investment Officer of FMR. Previously, Mr. Herring served as Vice President (2005-2006) and Senior Vice President (2006-2007) of Fidelity Management & Research Company, Vice President of FMR Co., Inc. (2001-2007) and as a portfolio manager for Fidelity U.S. Equity Funds. |
Brian B. Hogan (48) |
| Year of Election or Appointment: 2009 Vice President of Equity and High Income Funds. Mr. Hogan also serves as President of FMR's Equity Division (2009-present). Previously, Mr. Hogan served as Senior Vice President, Equity Research of FMR (2006-2009) and as a portfolio manager. |
Scott C. Goebel (44) |
| Year of Election or Appointment: 2008 Secretary and Chief Legal Officer (CLO) of the Fidelity funds. Mr. Goebel also serves as Secretary of Fidelity Investments Money Management, Inc. (FIMM) (2010-present) and Fidelity Research and Analysis Company (FRAC) (2010-present); Secretary and CLO of The North Carolina Capital Management Trust: Cash and Term Portfolios (2008-present); General Counsel, Secretary, and Senior Vice President of FMR (2008-present) and FMR Co., Inc. (2008-present); employed by FMR LLC or an affiliate (2001-present); Chief Legal Officer of Fidelity Management & Research (Hong Kong) Limited (2008-present) and Assistant Secretary of Fidelity Management & Research (Japan) Inc. (2008-present), and Fidelity Management & Research (U.K.) Inc. (2008-present). Previously, Mr. Goebel served as Assistant Secretary of FIMM (2008-2010), FRAC (2008-2010), and the Funds (2007-2008) and as Vice President and Secretary of Fidelity Distributors Corporation (FDC) (2005-2007). |
William C. Coffey (43) |
| Year of Election or Appointment: 2009 Assistant Secretary of Fidelity's Equity and High Income Funds. Mr. Coffey also serves as Senior Vice President and Deputy General Counsel of FMR LLC (2010-present), and is an employee of Fidelity Investments. Previously, Mr. Coffey served as Vice President and Associate General Counsel of FMR LLC (2005-2009). |
Elizabeth Paige Baumann (44) |
| Year of Election or Appointment: 2012 Anti-Money Laundering (AML) Officer of the Fidelity funds. Ms. Baumann also serves as AML Officer of The North Carolina Capital Management Trust: Cash and Term Portfolios (2012-present), Chief AML Officer of FMR LLC (2012-present), and is an employee of Fidelity Investments. Previously, Ms. Baumann served as Vice President and Deputy Anti-Money Laundering Officer (2007-2012). |
Christine Reynolds (54) |
| Year of Election or Appointment: 2008 Chief Financial Officer of the Fidelity funds. Ms. Reynolds became President of Fidelity Pricing and Cash Management Services (FPCMS) in August 2008. Ms. Reynolds served as Chief Operating Officer of FPCMS (2007-2008). Previously, Ms. Reynolds served as President, Treasurer, and Anti-Money Laundering officer of the Fidelity funds (2004-2007). |
Joseph A. Hanlon (44) |
| Year of Election or Appointment: 2012 Chief Compliance Officer of Fidelity's Equity and High Income Funds. Mr. Hanlon serves as Compliance Officer of FMR, FMR Co., Inc., Fidelity Investments Money Management, Inc. (FIMM), Fidelity Research and Analysis Company (FRAC), Fidelity Management & Research (Japan) Inc., Fidelity Management & Research (U.K.) Inc., Fidelity Management & Research (Hong Kong), and Strategic Advisers, Inc. (2009-present), as Senior Vice President of the Fidelity Asset Management Division (2009-present), and is an employee of Fidelity Investments. |
Joseph F. Zambello (55) |
| Year of Election or Appointment: 2011 Deputy Treasurer of the Fidelity funds. Mr. Zambello is an employee of Fidelity Investments. Previously, Mr. Zambello served as Vice President of FMR's Program Management Group (2009-2011) and Vice President of the Transfer Agent Oversight Group (2005-2009). |
Adrien E. Deberghes (45) |
| Year of Election or Appointment: 2008 Deputy Treasurer of Fidelity's Equity and High Income Funds. Mr. Deberghes also serves as Vice President (2011-present) and Assistant Treasurer (2010-present) of other Fidelity funds, and is an employee of Fidelity Investments (2008-present). Previously, Mr. Deberghes served as Senior Vice President of Mutual Fund Administration at State Street Corporation (2007-2008), Senior Director of Mutual Fund Administration at Investors Bank & Trust (2005-2007), and Director of Finance for Dunkin' Brands (2000-2005). |
Stephen Sadoski (41) |
| Year of Election or Appointment: 2012 Deputy Treasurer of Fidelity's Equity and High Income Funds. Mr. Sadoski also serves as Deputy Treasurer of other Fidelity funds (2013-present) and is an employee of Fidelity Investments (2012-present). Previously, Mr. Sadoski served as Assistant Treasurer of Fidelity's Fixed Income and Asset Allocation Funds (2012-2013), an assistant chief accountant in the Division of Investment Management of the Securities and Exchange Commission (SEC) (2009-2012) and as a senior manager at Deloitte & Touche (1997-2009). |
Stacie Smith (38) |
| Year of Election or Appointment: 2013 Deputy Treasurer of Fidelity's Equity and High Income Funds. Ms. Smith is an employee of Fidelity Investments (2009-present). Previously, Ms. Smith served as Senior Audit Manager of Ernst & Young LLP (1996-2009). |
Stephanie J. Dorsey (43) |
| Year of Election or Appointment: 2010 Assistant Treasurer of Fidelity's Equity and High Income Funds. Ms. Dorsey also serves as President and Treasurer (2013-present) and Assistant Treasurer (2012-present) of other Fidelity funds and is an employee of Fidelity Investments (2008-present). Previously, Ms. Dorsey served as Deputy Treasurer of Fidelity's Fixed Income and Asset Allocation Funds (2008-2013), Treasurer (2004-2008) of the JPMorgan Mutual Funds and Vice President (2004-2008) of JPMorgan Chase Bank. |
John R. Hebble (54) |
| Year of Election or Appointment: 2009 Assistant Treasurer of Fidelity's Equity and High Income Funds. Mr. Hebble also serves as President (2011-present), Treasurer, and Chief Financial Officer of The North Carolina Capital Management Trust: Cash and Term Portfolios (2008-present) and is an employee of Fidelity Investments. Previously, Mr. Hebble served as President and Treasurer of Fidelity's Fixed Income and Asset Allocation Funds (2008-2013). |
Gary W. Ryan (54) |
| Year of Election or Appointment: 2005 Assistant Treasurer of the Fidelity funds. Mr. Ryan is an employee of Fidelity Investments. Previously, Mr. Ryan served as Vice President of Fund Reporting in Fidelity Pricing and Cash Management Services (FPCMS) (1999-2005). |
Jonathan Davis (44) |
| Year of Election or Appointment: 2010 Assistant Treasurer of the Fidelity funds. Mr. Davis is also Assistant Treasurer of Fidelity Rutland Square Trust II and Fidelity Commonwealth Trust II. Mr. Davis is an employee of Fidelity Investments. Previously, Mr. Davis served as Vice President and Associate General Counsel of FMR LLC (2003-2010). |
Annual Report
Institutional Class designates 100% of the dividends distributed during the fiscal year as qualifying for the dividends-received deduction for corporate shareholders.
Institutional Class designates 100% of the dividends distributed during the fiscal year as amounts which may be taken into account as a dividend for purposes of the maximum rate under section 1(h)(11) of the Internal Revenue Code.
The fund will notify shareholders in January 2013 of amounts for use in preparing 2012 income tax returns.
Annual Report
Board Approval of Investment Advisory Contracts and Management Fees
Fidelity Advisor New Insights Fund
Each year, the Board of Trustees, including the Independent Trustees (together, the Board), votes on the renewal of the management contract and sub-advisory agreements (together, the Advisory Contracts) for the fund. The Board, assisted by the advice of fund counsel and Independent Trustees' counsel, requests and considers a broad range of information relevant to the renewal of the Advisory Contracts throughout the year.
The Board meets regularly and, at each of its meetings, considers factors that are relevant to its annual consideration of the renewal of the fund's Advisory Contracts, including the services and support provided to the fund and its shareholders. The Board has established various standing committees, each composed of and chaired by Independent Trustees with varying backgrounds, to which the Board has assigned specific subject matter responsibilities in order to enhance effective decision-making by the Board. The Board, acting directly and through its Committees, requests and receives information concerning the annual consideration of the renewal of the fund's Advisory Contracts. The Board also meets as needed to consider matters specifically related to the Board's annual consideration of the renewal of Advisory Contracts. Members of the Board may also meet with trustees of other Fidelity funds through ad hoc joint committees to discuss certain matters relevant to the Fidelity funds.
At its July 2012 meeting, the Board of Trustees, including the Independent Trustees, unanimously determined to renew the fund's Advisory Contracts. In reaching its determination, the Board considered all factors it believed relevant, including (i) the nature, extent, and quality of the services to be provided to the fund and its shareholders (including the investment performance of the fund); (ii) the competitiveness of the fund's management fee and total expense ratio relative to peer funds; (iii) the total costs of the services to be provided by and the profits to be realized by Fidelity from its relationship with the fund; (iv) the extent to which economies of scale exist and would be realized as the fund grows; and (v) whether fee levels reflect these economies of scale, if any, for the benefit of fund shareholders.
In considering whether to renew the Advisory Contracts for the fund, the Board reached a determination, with the assistance of fund counsel and Independent Trustees' counsel and through the exercise of its business judgment, that the renewal of the Advisory Contracts is in the best interests of the fund and its shareholders and that the compensation payable under the Advisory Contracts is fair and reasonable. The Board's decision to renew the Advisory Contracts was not based on any single factor, but rather was based on a comprehensive consideration of all the information provided to the Board at its meetings throughout the year. The Board, in reaching its determination to renew the Advisory Contracts, is aware that shareholders in the fund have a broad range of investment choices available to them, including a wide choice among mutual funds offered by Fidelity's competitors, and that the fund's shareholders, who have the opportunity to review and weigh the disclosure provided by the fund in its prospectus and other public disclosures, have chosen to invest in this fund, managed by Fidelity.
Annual Report
Nature, Extent, and Quality of Services Provided. The Board considered the staffing within the investment adviser, FMR, and the sub-advisers (together, the Investment Advisers), including the backgrounds of the fund's investment personnel, and also considered the fund's investment objective, strategies, and related investment philosophy. The Independent Trustees also had discussions with senior management of Fidelity's investment operations and investment groups. The Board considered the structure of the portfolio manager compensation program and whether this structure provides appropriate incentives to act in the best interests of the fund.
Resources Dedicated to Investment Management and Support Services. The Board and the Fund Oversight and Research Committees reviewed the general qualifications and capabilities of the Investment Advisers' investment staff, including its size, education, experience, and resources, as well as the Investment Advisers' approach to recruiting, training, managing, and compensating investment personnel. The Board also noted that FMR has continued to increase the resources devoted to non-U.S. offices, including expansion of Fidelity's global investment organization. The Board noted that Fidelity's analysts have extensive resources, tools and capabilities that allow them to conduct sophisticated quantitative and fundamental analysis, as well as credit analysis of issuers, counterparties and guarantors. The Board also believes that Fidelity's investment professionals have sufficient access to global information and data so as to provide competitive investment results over time, and that those professionals also have access to sophisticated tools that permit them to assess portfolio construction and risk and performance attribution characteristics continuously, as well as to transmit new information and research conclusions rapidly around the world. Additionally, in its deliberations, the Board considered the Investment Advisers' trading and risk management capabilities and resources, which are an integral part of the investment management process.
Shareholder and Administrative Services. The Board considered (i) the nature, extent, quality, and cost of advisory, administrative, and shareholder services performed by the Investment Advisers and their affiliates under the Advisory Contracts and under separate agreements covering transfer agency, pricing and bookkeeping, and securities lending services for the fund; (ii) the nature and extent of the supervision of third party service providers, principally custodians and subcustodians; and (iii) the resources devoted to, and the record of compliance with, the fund's compliance policies and procedures. The Board also reviewed the allocation of fund brokerage, including allocations to brokers affiliated with the Investment Advisers, the use of brokerage commissions to pay fund expenses, and the use of "soft" commission dollars to pay for research services.
Annual Report
Board Approval of Investment Advisory Contracts and
Management Fees - continued
The Board noted that the growth of fund assets over time across the complex allows Fidelity to reinvest in the development of services designed to enhance the value or convenience of the Fidelity funds as investment vehicles. These services include 24-hour access to account information and market information through telephone representatives and over the Internet, investor education materials and asset allocation tools, and the expanded availability of Fidelity Investor Centers.
Investment in a Large Fund Family. The Board considered the benefits to shareholders of investing in a Fidelity fund, including the benefits of investing in a fund that is part of a large family of funds offering a variety of investment disciplines and providing a large variety of mutual fund investor services. The Board noted that Fidelity had taken, or had made recommendations that resulted in the Fidelity funds taking, a number of actions over the previous year that benefited particular funds, including (i) continuing to dedicate additional resources to investment research and support of the senior management team that oversees asset management; (ii) persisting in efforts to enhance Fidelity's research capabilities, in particular, international research; (iii) launching new funds and making other enhancements to meet client needs for global and income-oriented solutions; (iv) continuing to launch dedicated lower cost underlying funds to meet investment management's portfolio construction needs related to expanding underlying fund options, specifically for the Freedom Fund product lines; (v) adopting a "Stock Selector" sector neutral investment approach and employing a team of portfolio managers who are sector specialists to manage certain funds; (vi) rationalizing product lines and gaining increased efficiencies through the mergers of several funds into other funds; (vii) strengthening the Spartan Index Fund product line by adding new funds and/or new low-cost institutional share classes, restructuring fund expenses to accommodate new classes, and reducing investment minimums for certain classes of shares; (viii) modifying the eligibility criteria for Institutional Class shares to increase their appeal to government entities and charitable investors; and (ix) reducing certain transfer agent fee rates.
Investment Performance. The Board considered whether the fund has operated in accordance with its investment objective, as well as its record of compliance with its investment restrictions. It also reviewed the fund's absolute investment performance for each class, as well as the fund's relative investment performance for each class measured over multiple periods against (i) a broad-based securities market index, and (ii) a custom peer group of mutual funds deemed appropriate by Fidelity and reviewed by the Board. The following charts considered by the Board show, over the one-, three-, and five-year periods ended December 31, 2011, the cumulative total returns of Institutional Class (Class I) and Class B of the fund, the cumulative total returns of a broad-based securities market index ("benchmark"), and a range of cumulative total returns of a custom peer group of mutual funds defined by FMR based on categories assigned by Morningstar, Inc. The returns of Institutional Class (Class I) and Class B show the performance of the highest and lowest performing classes, respectively (based on five-year performance). The box within each chart shows the 25th percentile return (top of box) and the 75th percentile return (bottom of box) of the peer group. Returns shown above the box are in the first quartile and returns shown below the box are in the fourth quartile. The percentage beaten numbers noted below each chart correspond to the percentile box and represent the percentage of funds in the peer group whose performance was equal to or lower than that of the class indicated. The fund's custom peer group, defined by FMR, is a peer group that FMR believes provides a more meaningful performance comparison than the peer group assigned by Morningstar, Inc., which assigns mutual funds to categories based on their investment styles as measured by their underlying portfolio holdings.
Annual Report
Fidelity Advisor New Insights Fund
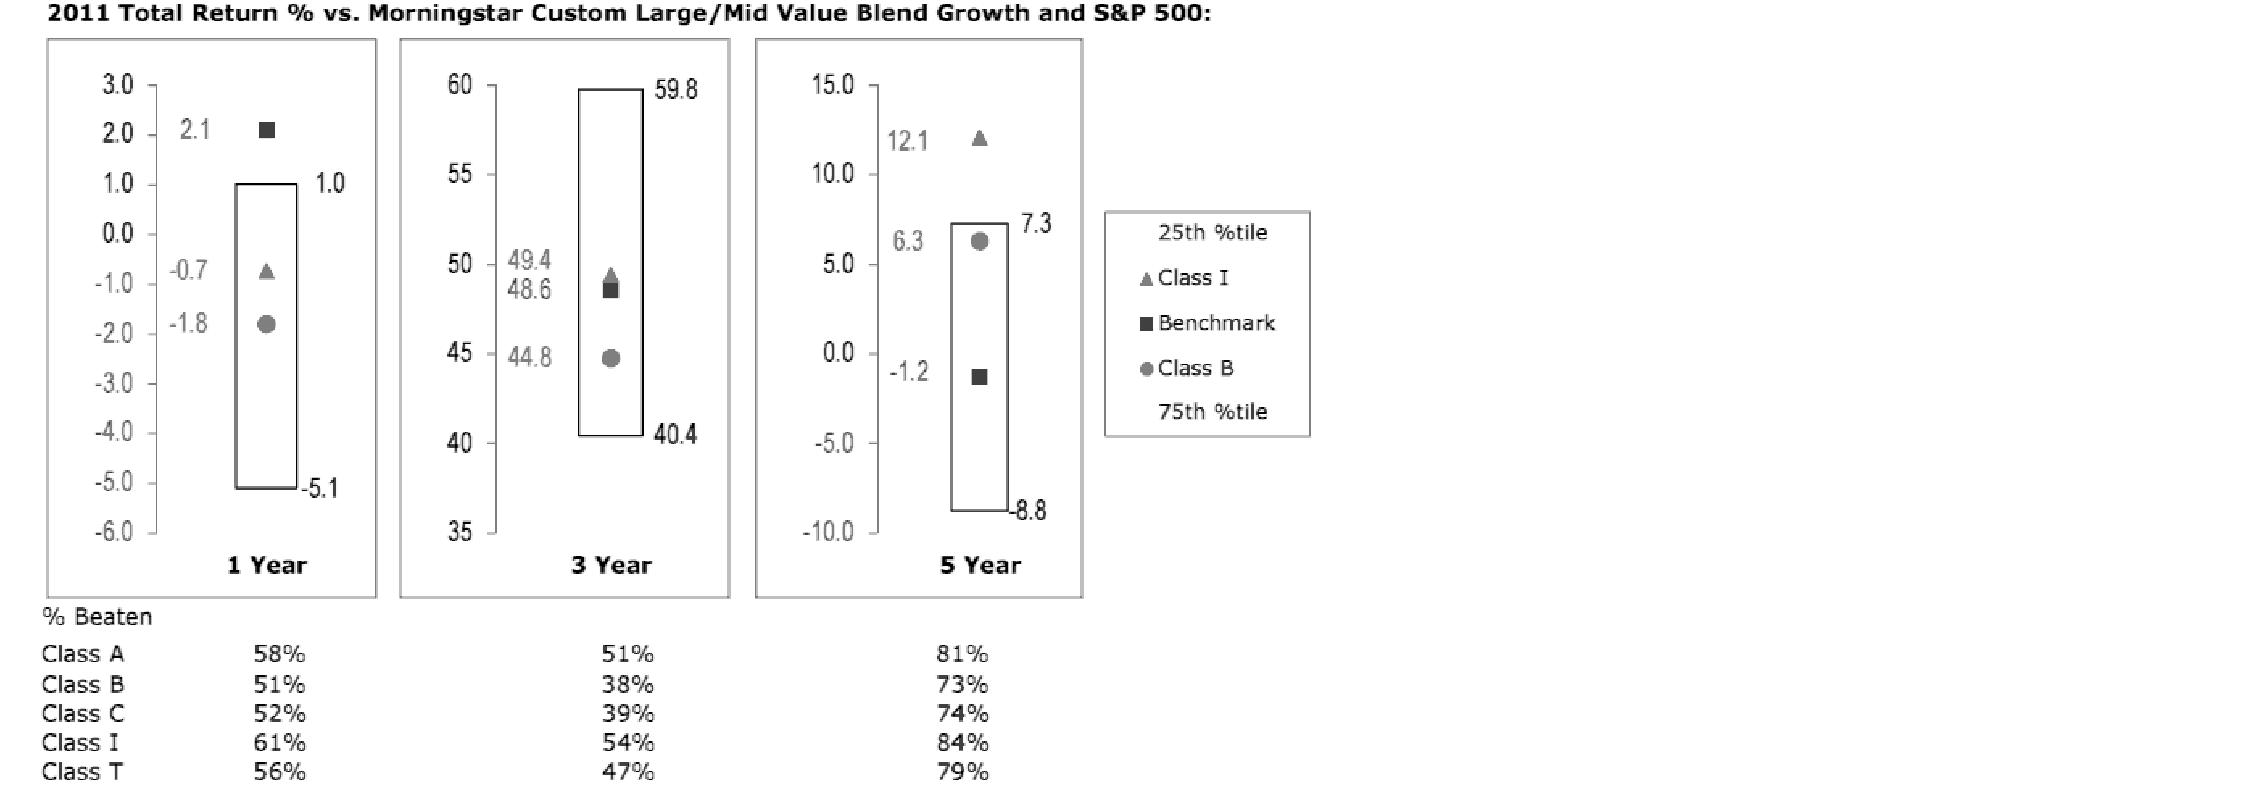
The Board reviewed the fund's relative investment performance against its peer group and noted that the performance of Institutional Class (Class I) of the fund was in the second quartile for the one- and three-year periods and the first quartile for the five-year period. The Board also noted that the investment performance of Institutional Class (Class I) of the fund compared favorably to its benchmark for the three- and five-year periods, although the fund's one-year total return was lower than its benchmark. The Board considered that the variations in performance among the fund's classes reflect the variations in class expenses, which result in lower performance for higher expense classes. The Board also reviewed the fund's performance since inception as well as performance in the current year.
Annual Report
Board Approval of Investment Advisory Contracts and
Management Fees - continued
The Board also considered that the fund's management fee is subject to upward or downward adjustment depending upon whether, and to what extent, the fund's investment performance for the performance period exceeds, or is exceeded by, the record (over the same period) of a Board-approved performance adjustment index. The Board noted that the performance adjustment provides FMR with a strong economic incentive to seek to achieve superior performance for the fund's shareholders and helps to more closely align the interests of FMR and the fund's shareholders.
Based on its review, the Board concluded that the nature, extent, and quality of services provided to the fund under the Advisory Contracts should benefit the fund's shareholders.
Competitiveness of Management Fee and Total Expense Ratio. The Board considered the fund's management fee and total expense ratio compared to "mapped groups" of competitive funds and classes. Fidelity creates "mapped groups" by combining similar Lipper investment objective categories that have comparable management fee characteristics. Combining Lipper investment objective categories aids the Board's management fee and total expense ratio comparisons by broadening the competitive group used for comparison and by reducing the number of universes to which various Fidelity funds are compared.
Management Fee. The Board considered two proprietary management fee comparisons for the 12-month periods shown in the chart below. The group of Lipper funds used by the Board for management fee comparisons is referred to below as the "Total Mapped Group." The Total Mapped Group comparison focuses on a fund's standing relative to the total universe of comparable funds available to investors in terms of gross management fees before expense reimbursements or caps, and without giving effect to the fund's performance adjustment. "TMG %" represents the percentage of funds in the Total Mapped Group that had management fees that were lower than the fund's. For example, a TMG % of 10% means that 90% of the funds in the Total Mapped Group had higher management fees than the fund. The "Asset-Size Peer Group" (ASPG) comparison focuses on a fund's standing relative to non-Fidelity funds similar in size to the fund within the Total Mapped Group. The ASPG represents at least 15% of the funds in the Total Mapped Group with comparable asset size and management fee characteristics, subject to a minimum of 50 funds (or all funds in the Total Mapped Group if fewer than 50). Additional information, such as the ASPG quartile in which the fund's management fee ranked and the impact of the fund's performance adjustment, is also included in the chart and considered by the Board.
Annual Report
Fidelity Advisor New Insights Fund
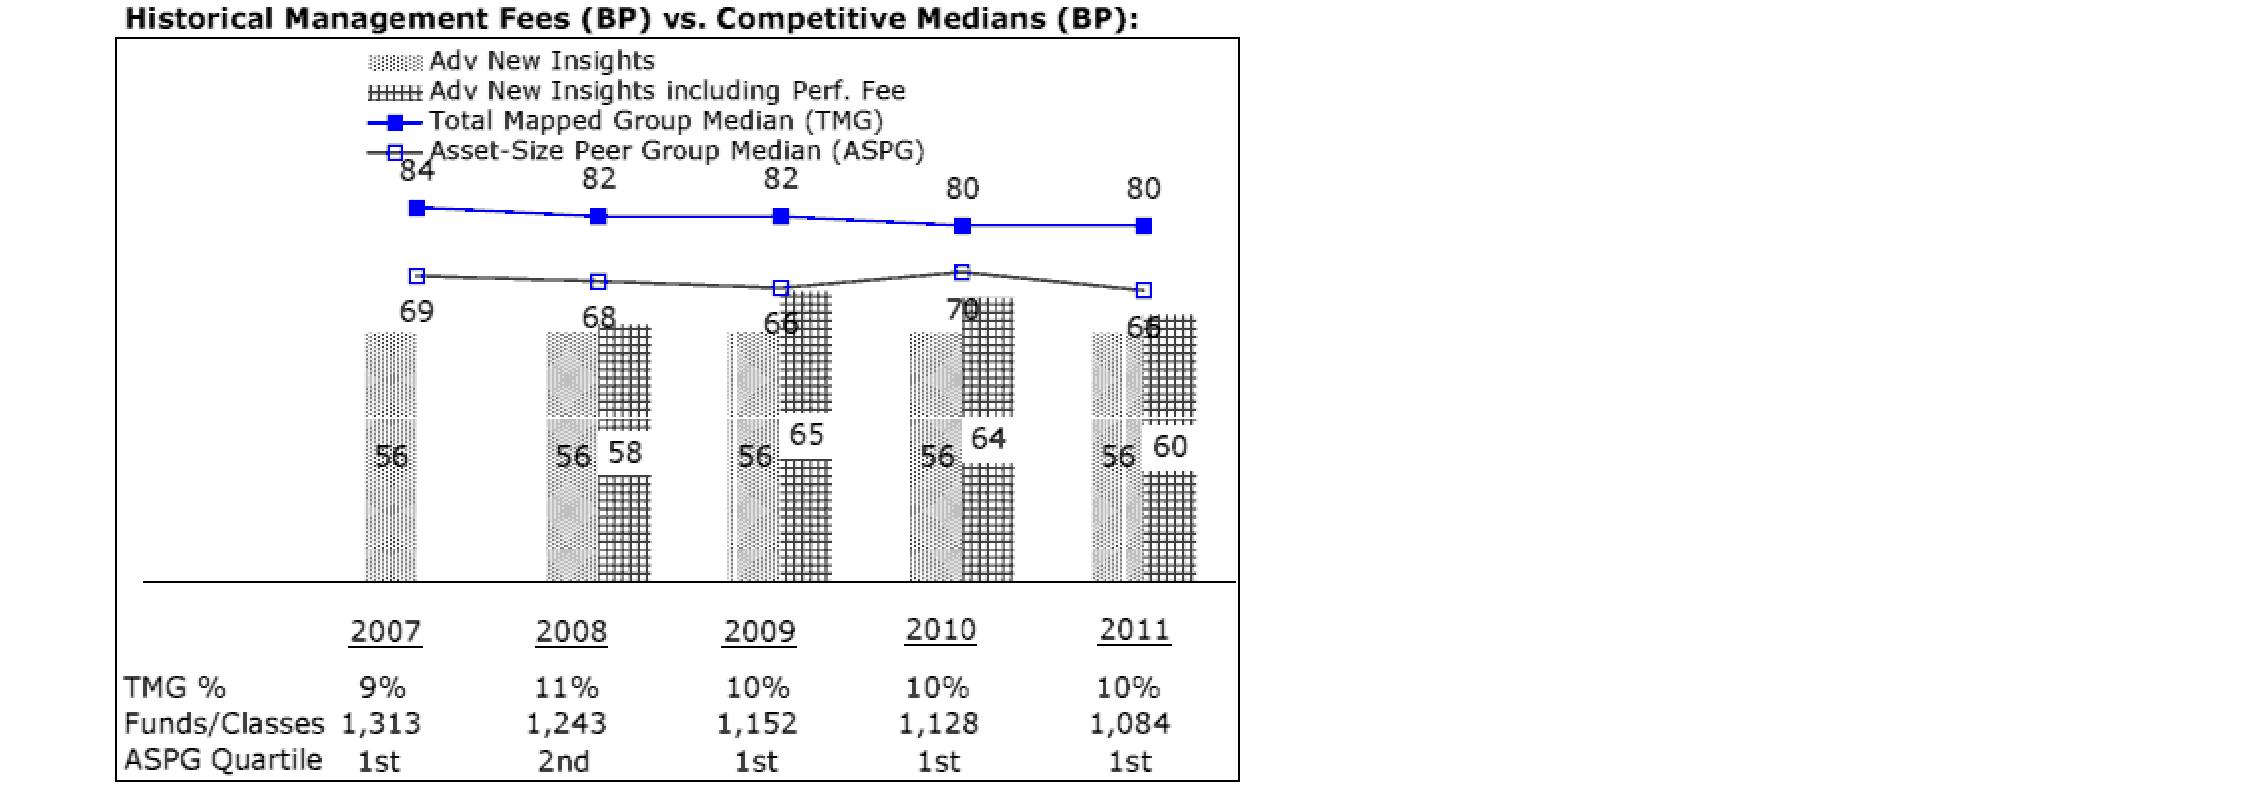
The Board noted that the fund's management fee ranked below the median of its Total Mapped Group and below the median of its ASPG for 2011. The Board also noted the effect of the fund's positive performance adjustment on the fund's management fee ranking. The Board noted that the performance adjustment for each year represents calculations for performance periods that differ from the periods shown in the performance charts above.
Based on its review, the Board concluded that the fund's management fee is fair and reasonable in light of the services that the fund receives and the other factors considered.
Total Expense Ratio. In its review of each class's total expense ratio, the Board considered the fund's management fee as well as other fund or class expenses, as applicable, such as transfer agent fees, pricing and bookkeeping fees, fund-paid 12b-1 fees, and custodial, legal, and audit fees. The Board also noted the effects of any waivers and reimbursements on fees and expenses, as well as the impact of the fund's performance adjustment. As part of its review, the Board also considered the current and historical total expense ratios of each class of the fund compared to competitive fund median expenses. Each class of the fund is compared to those funds and classes in the Total Mapped Group (used by the Board for management fee comparisons) that have a similar sales load structure.
The Board noted that the total expense ratio of each of Class A, Class B, Class C, and Institutional Class ranked below its competitive median for 2011 and the total expense ratio of Class T ranked above its competitive median for 2011. The Board considered that various factors, including 12b-1 fees, positive or negative performance adjustments, and relatively higher other expenses in the case of small fund size, can affect total expense ratios. The Board noted that the total expense ratio of Class T was above the competitive median primarily because of higher 12b-1 fees on Class T. Class T has a higher 12b-1 fee, but a lower front-end sales charge, than traditionally priced front-end sales charge classes. The Board considered that Class T is primarily sold load-waived in the retirement plan market where its 0.50% 12b-1 fee is comparable to competing no-load, higher 12b-1 fee classes designed specifically for retirement plans. The Board noted that the fund offers multiple classes, each of which has a different sales load and 12b-1 fee structure, and that the multiple structures are intended to offer a range of pricing options for the intermediary market. The Board also noted that the total expense ratios of the classes vary primarily by the level of their 12b-1 fees, although differences in transfer agent fees may also cause expenses to vary from class to class.
Annual Report
Board Approval of Investment Advisory Contracts and
Management Fees - continued
Fees Charged to Other Fidelity Clients. The Board also considered Fidelity fee structures and other information with respect to clients of FMR and its affiliates, such as other mutual funds advised or subadvised by FMR or its affiliates, pension plan clients, and other institutional clients. The Board noted the findings of the 2010 ad hoc joint committee (created with the board of other Fidelity funds), which reviewed and compared Fidelity's institutional investment advisory business with its business of providing services to the Fidelity funds, including the differences in services provided, fees charged, and costs incurred, as well as competition in their respective marketplaces.
Based on its review of total expense ratios and fees charged to other Fidelity clients, the Board concluded that the total expense ratio of each class of the fund was reasonable, although Class T was above the median of the universe presented for comparison, in light of the services that the fund and its shareholders receive and the other factors considered.
Costs of the Services and Profitability. The Board considered the revenues earned and the expenses incurred by Fidelity in conducting the business of developing, marketing, distributing, managing, administering and servicing the fund and its shareholders. The Board also considered the level of Fidelity's profits in respect of all the Fidelity funds.
On an annual basis, FMR presents to the Board Fidelity's profitability for the fund. Fidelity calculates the profitability for each fund, as well as aggregate profitability for groups of Fidelity funds and all Fidelity funds, using a series of detailed revenue and cost allocation methodologies which originate with the books and records of Fidelity on which Fidelity's audited financial statements are based. The Audit Committee of the Board reviews any significant changes from the prior year's methodologies.
PricewaterhouseCoopers LLP (PwC), independent registered public accounting firm and auditor to Fidelity and certain Fidelity funds, has been engaged annually by the Board as part of the Board's assessment of Fidelity's profitability analysis. PwC's engagement includes the review and assessment of Fidelity's methodologies used in determining the revenues and expenses attributable to Fidelity's mutual fund business, and completion of agreed-upon procedures surrounding the mathematical accuracy of fund profitability and its conformity to allocation methodologies. After considering PwC's reports issued under the engagement and information provided by Fidelity, the Board concluded that while other allocation methods may also be reasonable, Fidelity's profitability methodologies are reasonable in all material respects.
Annual Report
The Board also reviewed Fidelity's non-fund businesses and fall-out benefits related to the mutual fund business as well as cases where Fidelity's affiliates may benefit from or be related to the fund's business.
The Board considered the costs of the services provided by and the profits realized by Fidelity in connection with the operation of the fund and was satisfied that the profitability was not excessive in the circumstances.
Economies of Scale. The Board considered whether there have been economies of scale in respect of the management of the Fidelity funds, whether the Fidelity funds (including the fund) have appropriately benefited from any such economies of scale, and whether there is potential for realization of any further economies of scale. The Board considered the extent to which the fund will benefit from economies of scale through increased services to the fund, through waivers or reimbursements, or through fee or expense reductions. The Board also noted that in 2009, it and the board of other Fidelity funds created an ad hoc committee (the Economies of Scale Committee) to analyze whether FMR attains economies of scale in respect of the management and servicing of the Fidelity funds, whether the Fidelity funds have appropriately benefited from such economies of scale, and whether there is potential for realization of any further economies of scale.
The Board recognized that the fund's management contract incorporates a "group fee" structure, which provides for lower group fee rates as total fund assets under FMR's management increase, and for higher group fee rates as total fund assets under FMR's management decrease. FMR calculates the group fee rates based on a tiered asset "breakpoint" schedule that varies based on asset class. The Board considered that the group fee is designed to deliver the benefits of economies of scale to fund shareholders when total Fidelity fund assets increase, even if assets of any particular fund are unchanged or have declined, because some portion of Fidelity's costs are attributable to services provided to all Fidelity funds, and all funds benefit if those costs can be allocated among more assets. The Board concluded that, given the group fee structure, fund shareholders will benefit from lower management fees as assets under FMR's management increase at the fund complex level, regardless of whether Fidelity achieves any such economies of scale.
Annual Report
Board Approval of Investment Advisory Contracts and
Management Fees - continued
The Board concluded, taking into account the analysis of the Economies of Scale Committee, that economies of scale, if any, are being appropriately shared between fund shareholders and Fidelity.
Additional Information Requested by the Board. In order to develop fully the factual basis for consideration of the Fidelity funds' Advisory Contracts, the Board requested and received additional information on certain topics, including (i) fund performance trends, actions to be taken by FMR to improve certain funds' overall performance, and Fidelity's long-term strategies for certain funds; (ii) the potential to further rationalize the Fidelity fund lineup with the possibility of achieving savings for the funds and Fidelity; (iii) Fidelity's compensation structure for portfolio managers and other key investment personnel; (iv) the amount of the investment that each portfolio manager has made in the Fidelity fund(s) that he or she manages; (v) the realization of fall-out benefits in certain Fidelity business units; (vi) Fidelity's group fee structures, the potential impact of regulatory changes on such structures, and the rationale for the individual fee rates of certain funds; (vii) fund profitability methodology, including Fidelity's cost allocation methodology, and the impact of certain factors on fund profitability results; (viii) trends regarding industry use of performance fee structures and the possibility of implementing performance fee structures for additional funds; and (ix) the impact of net redemptions from the Fidelity funds.
Based on its evaluation of all of the conclusions noted above, and after considering all factors it believed relevant, the Board ultimately concluded that the advisory fee structures are fair and reasonable, and that the fund's Advisory Contracts should be renewed.
Annual Report
Investment Adviser
Fidelity Management & Research Company
Boston, MA
Investment Sub-Adviser
FMR Co., Inc.
Fidelity Management & Research
(U.K.) Inc.
Fidelity Management & Research
(Hong Kong) Limited
Fidelity Management & Research
(Japan) Inc.
General Distributor
Fidelity Distributors Corporation
Smithfield, RI
Transfer and Service Agents
Fidelity Investments Institutional Operations Company, Inc.
Boston, MA
Fidelity Service Company, Inc.
Boston, MA
Custodian
Brown Brothers Harriman & Co.
Boston, MA
(Fidelity Investment logo)(registered trademark)
ANIFI-UANN-0213
1.796411.109
Fidelity®
Series Opportunistic Insights Fund
Fidelity Series Opportunistic Insights Fund
Class F
Annual Report
December 31, 2012
(Fidelity Cover Art)
Contents
Shareholder Expense Example | (Click Here) | An example of shareholder expenses. |
Investment Summary | (Click Here) | A summary of the fund's holdings. |
Investments | (Click Here) | A complete list of the fund's investments with their market values. |
Financial Statements | (Click Here) | Statements of assets and liabilities, operations, and changes in net assets, as well as financial highlights. |
Notes | (Click Here) | Notes to the Financial Statements. |
Report of Independent Registered Public Accounting Firm | (Click Here) | |
Trustees and Officers | (Click Here) | |
Distributions | (Click Here) | |
Board Approval of Investment Advisory Contracts and Management Fees | (Click Here) | |
To view a fund's proxy voting guidelines and proxy voting record for the 12-month period ended June 30, visit http://www.fidelity.com/proxyvotingresults or visit the Securities and Exchange Commission's (SEC) web site at http://www.sec.gov. You may also call 1-800-544-8544 for Fidelity Series Opportunistic Insights Fund or 1-800-835-5092 for Class F of the fund to request a free copy of the proxy voting guidelines.
Standard & Poor's, S&P and S&P 500 are registered service marks of The McGraw-Hill Companies, Inc. and have been licensed for use by Fidelity Distributors Corporation.
Other third party marks appearing herein are the property of their respective owners.
All other marks appearing herein are registered or unregistered trademarks or service marks of FMR LLC or an affiliated company. © 2013 FMR LLC. All rights reserved.
This report and the financial statements contained herein are submitted for the general information of the shareholders of the fund. This report is not authorized for distribution to prospective investors in the fund unless preceded or accompanied by an effective prospectus.
A fund files its complete schedule of portfolio holdings with the SEC for the first and third quarters of each fiscal year on Form N-Q. Forms N-Q are available on the SEC's web site at http://www.sec.gov. A fund's Forms N-Q may be reviewed and copied at the SEC's Public Reference Room in Washington, DC. Information regarding the operation of the SEC's Public Reference Room may be obtained by calling 1-800-SEC-0330. For a complete list of a fund's portfolio holdings, view the most recent holdings listing, semiannual report, or annual report on Fidelity's web site at http://www.fidelity.com, http://www.advisor.fidelity.com, or http://www.401k.com, as applicable.
NOT FDIC INSURED • MAY LOSE VALUE • NO BANK GUARANTEE
Neither the fund nor Fidelity Distributors Corporation is a bank.
Annual Report
Shareholder Expense Example
As a shareholder of the Fund, you incur two types of costs: (1) transaction costs, and (2) ongoing costs, including management fees and other Fund expenses. This Example is intended to help you understand your ongoing costs (in dollars) of investing in the Fund and to compare these costs with the ongoing costs of investing in other mutual funds.
The actual expense Example is based on an investment of $1,000 invested at the beginning of the period and held for the entire period (December 6, 2012 to December 31, 2012). The hypothetical expense Example is based on an investment of $1,000 invested for the one-half year period (July 1, 2012 to December 31, 2012).
Actual Expenses
The first line of the accompanying table for each class of the Fund provides information about actual account values and actual expenses. You may use the information in this line, together with the amount you invested, to estimate the expenses that you paid over the period. Simply divide your account value by $1,000.00 (for example, an $8,600 account value divided by $1,000.00 = 8.6), then multiply the result by the number in the first line for a class of the Fund under the heading entitled "Expenses Paid During Period" to estimate the expenses you paid on your account during this period. In addition, the Fund, as a shareholder in the underlying Fidelity Central Funds, will indirectly bear its pro-rata share of the fees and expenses incurred by the underlying Fidelity Central Funds. These fees and expenses are not included in the Fund's annualized expense ratio used to calculate the expense estimate in the table below.
Hypothetical Example for Comparison Purposes
The second line of the accompanying table for each class of the Fund provides information about hypothetical account values and hypothetical expenses based on a Class' actual expense ratio and an assumed rate of return of 5% per year before expenses, which is not the Class' actual return. The hypothetical account values and expenses may not be used to estimate the actual ending account balance or expenses you paid for the period. You may use this information to compare the ongoing costs of investing in the Fund and other funds. To do so, compare this 5% hypothetical example with the 5% hypothetical examples that appear in the shareholder reports of the other funds. In addition, the Fund, as a shareholder in the underlying Fidelity Central Funds, will indirectly bear its pro-rata share of the fees and expenses incurred by the underlying Fidelity Central Funds. These fees and expenses are not included in the Fund's annualized expense ratio used to calculate the expense estimate in the table below.
Please note that the expenses shown in the table are meant to highlight your ongoing costs only and do not reflect any transaction costs. Therefore, the second line of the table is useful in comparing ongoing costs only, and will not help you determine the relative total costs of owning different funds.
Annual Report
Shareholder Expense Example - continued
| Annualized Expense Ratio | Beginning
Account Value | Ending
Account Value
December 31, 2012 | Expenses Paid
During Period |
Series Opportunistic Insights | 1.00% | | | |
Actual | | $ 1,000.00 | $ 1,002.70 | $ .71 B |
Hypothetical A | | $ 1,000.00 | $ 1,020.11 | $ 5.08 C |
Class F | .80% | | | |
Actual | | $ 1,000.00 | $ 1,002.80 | $ .57 B |
Hypothetical A | | $ 1,000.00 | $ 1,021.11 | $ 4.06 C |
A 5% return per year before expenses
B Actual expenses are equal to each Class' annualized expense ratio, multiplied by the average account value over the period, multiplied by 26/366 (to reflect the period December 6, 2012 to December 31, 2012).
C Hypothetical expenses are equal to each Class' annualized expense ratio, multiplied by the average account value over the period, multiplied by 184/366 (to reflect the one-half year period).
Annual Report
Investment Summary (Unaudited)
Top Ten Stocks as of December 31, 2012 |
| % of fund's
net assets |
Google, Inc. Class A | 4.9 |
Facebook, Inc. Class A | 4.8 |
Apple, Inc. | 4.5 |
Gilead Sciences, Inc. | 4.0 |
MasterCard, Inc. Class A | 3.6 |
Berkshire Hathaway, Inc. Class A | 3.1 |
EOG Resources, Inc. | 3.1 |
Amazon.com, Inc. | 3.0 |
Biogen Idec, Inc. | 2.4 |
Intuitive Surgical, Inc. | 1.7 |
| 35.1 |
Top Five Market Sectors as of December 31, 2012 |
| % of fund's
net assets |
Information Technology | 33.6 |
Health Care | 17.2 |
Consumer Discretionary | 16.4 |
Financials | 8.4 |
Industrials | 6.3 |
Asset Allocation (% of fund's net assets) |
As of December 31, 2012* | |
 | Stocks 98.3% | |  | | |
 | Short-Term
Investments and
Net Other Assets (Liabilities) 1.7% | |  | | |
* Foreign investments | 9.2% | | | | |

Annual Report
Investments December 31, 2012
Showing Percentage of Net Assets
Common Stocks - 98.3% |
| Shares | | Value |
CONSUMER DISCRETIONARY - 16.4% |
Hotels, Restaurants & Leisure - 1.8% |
Chipotle Mexican Grill, Inc. (a) | 68,600 | | $ 20,405,756 |
Panera Bread Co. Class A (a) | 116,200 | | 18,456,046 |
Starbucks Corp. | 515,000 | | 27,614,300 |
| | 66,476,102 |
Household Durables - 0.8% |
Lennar Corp. Class A | 752,800 | | 29,110,776 |
Internet & Catalog Retail - 4.7% |
Amazon.com, Inc. (a) | 436,400 | | 109,597,496 |
priceline.com, Inc. (a) | 55,900 | | 34,725,080 |
TripAdvisor, Inc. | 715,800 | | 30,034,968 |
| | 174,357,544 |
Leisure Equipment & Products - 1.1% |
Polaris Industries, Inc. | 460,000 | | 38,709,000 |
Media - 3.6% |
Comcast Corp. Class A | 994,300 | | 37,166,934 |
Discovery Communications, Inc. (a) | 301,400 | | 19,132,872 |
Liberty Global, Inc. Class A (a) | 613,300 | | 38,631,767 |
Liberty Media Corp. Capital Series A (a) | 336,200 | | 39,002,562 |
| | 133,934,135 |
Specialty Retail - 2.9% |
Foot Locker, Inc. | 522,300 | | 16,776,276 |
Home Depot, Inc. | 571,400 | | 35,341,090 |
PetSmart, Inc. | 261,600 | | 17,877,744 |
TJX Companies, Inc. | 423,800 | | 17,990,310 |
Urban Outfitters, Inc. (a) | 493,000 | | 19,404,480 |
| | 107,389,900 |
Textiles, Apparel & Luxury Goods - 1.5% |
lululemon athletica, Inc. (a) | 253,900 | | 19,354,797 |
Michael Kors Holdings Ltd. | 356,900 | | 18,212,607 |
NIKE, Inc. Class B | 373,600 | | 19,277,760 |
| | 56,845,164 |
TOTAL CONSUMER DISCRETIONARY | | 606,822,621 |
CONSUMER STAPLES - 5.8% |
Beverages - 1.7% |
Anheuser-Busch InBev SA NV ADR | 209,800 | | 18,338,618 |
Common Stocks - continued |
| Shares | | Value |
CONSUMER STAPLES - continued |
Beverages - continued |
Boston Beer Co., Inc. Class A (a) | 123,432 | | $ 16,595,432 |
The Coca-Cola Co. | 732,500 | | 26,553,125 |
| | 61,487,175 |
Food & Staples Retailing - 1.9% |
Costco Wholesale Corp. | 373,700 | | 36,910,349 |
Wal-Mart Stores, Inc. | 509,500 | | 34,763,185 |
| | 71,673,534 |
Food Products - 0.5% |
Associated British Foods PLC | 773,800 | | 19,769,304 |
Household Products - 0.7% |
Colgate-Palmolive Co. | 254,900 | | 26,647,246 |
Personal Products - 1.0% |
Estee Lauder Companies, Inc. Class A | 607,000 | | 36,335,020 |
TOTAL CONSUMER STAPLES | | 215,912,279 |
ENERGY - 5.1% |
Oil, Gas & Consumable Fuels - 5.1% |
EOG Resources, Inc. | 941,500 | | 113,723,785 |
Murphy Oil Corp. | 657,500 | | 39,154,125 |
Phillips 66 | 703,700 | | 37,366,470 |
| | 190,244,380 |
FINANCIALS - 8.4% |
Commercial Banks - 2.3% |
HDFC Bank Ltd. sponsored ADR | 435,800 | | 17,745,776 |
M&T Bank Corp. | 282,900 | | 27,857,163 |
Wells Fargo & Co. | 1,108,300 | | 37,881,694 |
| | 83,484,633 |
Insurance - 5.0% |
ACE Ltd. | 227,400 | | 18,146,520 |
Berkshire Hathaway, Inc. Class A (a) | 856 | | 114,755,360 |
Marsh & McLennan Companies, Inc. | 524,500 | | 18,079,515 |
The Chubb Corp. | 237,500 | | 17,888,500 |
The Travelers Companies, Inc. | 250,900 | | 18,019,638 |
| | 186,889,533 |
Real Estate Investment Trusts - 0.5% |
American Tower Corp. | 244,100 | | 18,861,607 |
Common Stocks - continued |
| Shares | | Value |
FINANCIALS - continued |
Real Estate Management & Development - 0.6% |
Realogy Holdings Corp. | 488,200 | | $ 20,484,872 |
TOTAL FINANCIALS | | 309,720,645 |
HEALTH CARE - 17.2% |
Biotechnology - 9.8% |
Alexion Pharmaceuticals, Inc. (a) | 201,200 | | 18,874,572 |
Amgen, Inc. | 625,300 | | 53,975,896 |
Biogen Idec, Inc. (a) | 608,500 | | 89,248,695 |
Gilead Sciences, Inc. (a) | 1,992,400 | | 146,341,780 |
Onyx Pharmaceuticals, Inc. (a) | 238,200 | | 17,991,246 |
Regeneron Pharmaceuticals, Inc. (a) | 203,600 | | 34,829,852 |
| | 361,262,041 |
Health Care Equipment & Supplies - 3.2% |
Baxter International, Inc. | 566,000 | | 37,729,560 |
Covidien PLC | 316,700 | | 18,286,258 |
Intuitive Surgical, Inc. (a) | 129,760 | | 63,630,411 |
| | 119,646,229 |
Health Care Providers & Services - 1.7% |
Catamaran Corp. (a) | 373,000 | | 17,572,031 |
DaVita, Inc. (a) | 259,400 | | 28,671,482 |
Henry Schein, Inc. (a) | 230,500 | | 18,546,030 |
| | 64,789,543 |
Health Care Technology - 0.5% |
Cerner Corp. (a) | 235,700 | | 18,299,748 |
Life Sciences Tools & Services - 1.0% |
Mettler-Toledo International, Inc. (a) | 86,645 | | 16,748,479 |
Waters Corp. (a) | 215,400 | | 18,765,648 |
| | 35,514,127 |
Pharmaceuticals - 1.0% |
Mylan, Inc. (a) | 676,000 | | 18,576,480 |
Novo Nordisk A/S Series B sponsored ADR | 114,200 | | 18,638,582 |
| | 37,215,062 |
TOTAL HEALTH CARE | | 636,726,750 |
INDUSTRIALS - 6.3% |
Building Products - 0.5% |
Fortune Brands Home & Security, Inc. (a) | 635,900 | | 18,580,998 |
Common Stocks - continued |
| Shares | | Value |
INDUSTRIALS - continued |
Electrical Equipment - 1.0% |
Generac Holdings, Inc. | 558,500 | | $ 19,162,135 |
Roper Industries, Inc. | 164,800 | | 18,371,904 |
| | 37,534,039 |
Industrial Conglomerates - 0.5% |
Danaher Corp. | 344,200 | | 19,240,780 |
Machinery - 0.8% |
Deere & Co. | 323,300 | | 27,939,586 |
Professional Services - 1.0% |
Verisk Analytics, Inc. (a) | 744,200 | | 37,954,200 |
Road & Rail - 2.5% |
Canadian Pacific | 373,000 | | 37,836,232 |
Hertz Global Holdings, Inc. (a) | 1,143,700 | | 18,607,999 |
Union Pacific Corp. | 297,100 | | 37,351,412 |
| | 93,795,643 |
TOTAL INDUSTRIALS | | 235,045,246 |
INFORMATION TECHNOLOGY - 33.6% |
Communications Equipment - 0.5% |
Motorola Solutions, Inc. | 337,300 | | 18,780,864 |
Computers & Peripherals - 5.9% |
3D Systems Corp. (a) | 403,700 | | 21,537,395 |
Apple, Inc. | 310,900 | | 165,719,027 |
Stratasys Ltd. (a) | 379,000 | | 30,376,850 |
| | 217,633,272 |
Electronic Equipment & Components - 0.5% |
Amphenol Corp. Class A | 298,800 | | 19,332,360 |
Internet Software & Services - 14.1% |
eBay, Inc. (a) | 533,800 | | 27,234,476 |
Facebook, Inc. Class A | 6,693,700 | | 178,253,231 |
Google, Inc. Class A (a) | 255,500 | | 181,244,036 |
LinkedIn Corp. (a) | 335,700 | | 38,545,074 |
Rackspace Hosting, Inc. (a) | 547,000 | | 40,625,690 |
Yahoo!, Inc. (a) | 2,875,700 | | 57,226,430 |
| | 523,128,937 |
IT Services - 6.8% |
Accenture PLC Class A | 397,600 | | 26,440,400 |
Alliance Data Systems Corp. (a) | 840 | | 121,598 |
Fidelity National Information Services, Inc. | 1,018,500 | | 35,453,985 |
Common Stocks - continued |
| Shares | | Value |
INFORMATION TECHNOLOGY - continued |
IT Services - continued |
MasterCard, Inc. Class A | 270,700 | | $ 132,989,496 |
Visa, Inc. Class A | 371,900 | | 56,372,602 |
| | 251,378,081 |
Semiconductors & Semiconductor Equipment - 2.6% |
ARM Holdings PLC sponsored ADR | 1,009,900 | | 38,204,517 |
ASML Holding NV | 290,100 | | 18,685,341 |
Samsung Electronics Co. Ltd. | 26,896 | | 38,896,142 |
| | 95,786,000 |
Software - 3.2% |
CommVault Systems, Inc. (a) | 557,300 | | 38,849,383 |
Concur Technologies, Inc. (a) | 297,700 | | 20,100,704 |
NetSuite, Inc. (a) | 309,400 | | 20,822,620 |
ServiceNow, Inc. | 628,500 | | 18,873,855 |
Ultimate Software Group, Inc. (a) | 199,700 | | 18,853,677 |
| | 117,500,239 |
TOTAL INFORMATION TECHNOLOGY | | 1,243,539,753 |
MATERIALS - 5.5% |
Chemicals - 4.4% |
Ecolab, Inc. | 506,500 | | 36,417,350 |
Monsanto Co. | 609,100 | | 57,651,315 |
PPG Industries, Inc. | 227,600 | | 30,805,660 |
Sherwin-Williams Co. | 247,300 | | 38,039,686 |
| | 162,914,011 |
Containers & Packaging - 0.5% |
Ball Corp. | 417,100 | | 18,665,225 |
Metals & Mining - 0.6% |
Franco-Nevada Corp. | 403,206 | | 23,016,022 |
TOTAL MATERIALS | | 204,595,258 |
TOTAL COMMON STOCKS (Cost $3,644,597,026) |
3,642,606,932
|
Money Market Funds - 2.2% |
| Shares | | Value |
Fidelity Cash Central Fund, 0.18% (b)
(Cost $80,385,813) | 80,385,813 | | $ 80,385,813 |
TOTAL INVESTMENT PORTFOLIO - 100.5% (Cost $3,724,982,839) | | 3,722,992,745 |
NET OTHER ASSETS (LIABILITIES) - (0.5)% | | (19,637,523) |
NET ASSETS - 100% | $ 3,703,355,222 |
Legend |
(a) Non-income producing |
(b) Affiliated fund that is available only to investment companies and other accounts managed by Fidelity Investments. The rate quoted is the annualized seven-day yield of the fund at period end. A complete unaudited listing of the fund's holdings as of its most recent quarter end is available upon request. In addition, each Fidelity Central Fund's financial statements, which are not covered by the Fund's Report of Independent Registered Public Accounting Firm, are available on the SEC's website or upon request. |
Affiliated Central Funds |
Information regarding fiscal year to date income earned by the Fund from investments in Fidelity Central Funds is as follows: |
Fund | Income earned |
Fidelity Cash Central Fund | $ 6,718 |
Other Information |
The following is a summary of the inputs used, as of December 31, 2012, involving the Fund's assets and liabilities carried at fair value. The inputs or methodology used for valuing securities may not be an indication of the risk associated with investing in those securities. For more information on valuation inputs, and their aggregation into the levels used in the table below, please refer to the Investment Valuation section in the accompanying Notes to Financial Statements. |
Valuation Inputs at Reporting Date: |
Description | Total | Level 1 | Level 2 | Level 3 |
Investments in Securities: | | | | |
Equities: | | | | |
Consumer Discretionary | $ 606,822,621 | $ 606,822,621 | $ - | $ - |
Consumer Staples | 215,912,279 | 196,142,975 | 19,769,304 | - |
Energy | 190,244,380 | 190,244,380 | - | - |
Financials | 309,720,645 | 309,720,645 | - | - |
Health Care | 636,726,750 | 636,726,750 | - | - |
Industrials | 235,045,246 | 235,045,246 | - | - |
Information Technology | 1,243,539,753 | 1,204,643,611 | 38,896,142 | - |
Materials | 204,595,258 | 204,595,258 | - | - |
Money Market Funds | 80,385,813 | 80,385,813 | - | - |
Total Investments in Securities: | $ 3,722,992,745 | $ 3,664,327,299 | $ 58,665,446 | $ - |
See accompanying notes which are an integral part of the financial statements.
Annual Report
Statement of Assets and Liabilities
| December 31, 2012 |
| | |
Assets | | |
Investment in securities, at value - See accompanying schedule: Unaffiliated issuers (cost $3,644,597,026) | $ 3,642,606,932 | |
Fidelity Central Funds (cost $80,385,813) | 80,385,813 | |
Total Investments (cost $3,724,982,839) | | $ 3,722,992,745 |
Foreign currency held at value (cost $74,262) | | 74,032 |
Receivable for investments sold | | 6,594,252 |
Receivable for fund shares sold | | 120,211 |
Dividends receivable | | 839,408 |
Distributions receivable from Fidelity Central Funds | | 6,718 |
Other receivables | | 12,746 |
Total assets | | 3,730,640,112 |
| | |
Liabilities | | |
Payable to custodian bank | $ 1,392,498 | |
Payable for investments purchased | 501,018 | |
Payable for fund shares redeemed | 23,291,848 | |
Accrued management fee | 1,295,415 | |
Other affiliated payables | 296,515 | |
Other payables and accrued expenses | 507,596 | |
Total liabilities | | 27,284,890 |
| | |
Net Assets | | $ 3,703,355,222 |
Net Assets consist of: | | |
Paid in capital | | $ 3,697,019,845 |
Accumulated undistributed net realized gain (loss) on investments and foreign currency transactions | | 8,324,866 |
Net unrealized appreciation (depreciation) on investments and assets and liabilities in foreign currencies | | (1,989,489) |
Net Assets | | $ 3,703,355,222 |
See accompanying notes which are an integral part of the financial statements.
Annual Report
Statement of Assets and Liabilities - continued
| December 31, 2012 |
| | |
Series Opportunistic Insights:
Net Asset Value, offering price and redemption price per share ($1,803,957,603 ÷ 180,089,181 shares) | | $ 10.02 |
| | |
Class F:
Net Asset Value, offering price and redemption price per share ($1,899,397,619 ÷ 189,614,403 shares) | | $ 10.02 |
See accompanying notes which are an integral part of the financial statements.
Annual Report
Financial Statements - continued
Statement of Operations
For the period December 6, 2012
(commencement of operations)
to December 31, 2012 |
| | |
Investment Income | | |
Dividends | | $ 3,023,844 |
Special dividends | | 440,000 |
Interest | | 420 |
Income from Fidelity Central Funds | | 6,718 |
Total income | | 3,470,982 |
| | |
Expenses | | |
Management fee | $ 1,295,415 | |
Transfer agent fees | 228,394 | |
Accounting fees and expenses | 68,121 | |
Custodian fees and expenses | 26,668 | |
Registration fees | 441,950 | |
Audit | 38,979 | |
Total expenses before reductions | 2,099,527 | |
Expense reductions | (12,746) | 2,086,781 |
Net investment income (loss) | | 1,384,201 |
Realized and Unrealized Gain (Loss) Net realized gain (loss) on: | | |
Investment securities: | | |
Unaffiliated issuers | 9,754,183 | |
Foreign currency transactions | (18,216) | |
Total net realized gain (loss) | | 9,735,967 |
Change in net unrealized appreciation (depreciation) on: Investment securities | (1,990,094) | |
Assets and liabilities in foreign currencies | 605 | |
Total change in net unrealized appreciation (depreciation) | | (1,989,489) |
Net gain (loss) | | 7,746,478 |
Net increase (decrease) in net assets resulting from operations | | $ 9,130,679 |
See accompanying notes which are an integral part of the financial statements.
Annual Report
Statement of Changes in Net Assets
| For the period
December 6, 2012 (commencement of operations) to
December 31, 2012 |
Increase (Decrease) in Net Assets | |
Operations | |
Net investment income (loss) | $ 1,384,201 |
Net realized gain (loss) | 9,735,967 |
Change in net unrealized appreciation (depreciation) | (1,989,489) |
Net increase (decrease) in net assets resulting
from operations | 9,130,679 |
Distributions to shareholders from net investment income | (2,795,302) |
Share transactions - net increase (decrease) | 3,697,019,845 |
Total increase (decrease) in net assets | 3,703,355,222 |
| |
Net Assets | |
Beginning of period | - |
End of period | $ 3,703,355,222 |
See accompanying notes which are an integral part of the financial statements.
Annual Report
Financial Highlights - Series Opportunistic Insights
Period ended December 31, | Period ended December 31, 2012 H |
Selected Per-Share Data | |
Net asset value, beginning of period | $ 10.00 |
Income from Investment Operations | |
Net investment income (loss) D | - G,J |
Net realized and unrealized gain (loss) | .03 |
Total from investment operations | .03 |
Distributions from net investment income | (.01) |
Net asset value, end of period | $ 10.02 |
Total Return B,C | .27% |
Ratios to Average Net Assets E,I | |
Expenses before reductions | 1.00% A |
Expenses net of fee waivers, if any | 1.00% A |
Expenses net of all reductions | 1.00% A |
Net investment income (loss) | .49% A,G |
Supplemental Data | |
Net assets, end of period (000 omitted) | $ 1,803,958 |
Portfolio turnover rate F | 64% K |
A Annualized
B Total returns for periods of less than one year are not annualized.
C Total returns would have been lower if certain expenses had not been reduced during the applicable periods shown.
D Calculated based on average shares outstanding during the period.
E Fees and expenses of any underlying Fidelity Central Funds are not included in the Fund's expense ratio. The Fund indirectly bears its proportionate share of the expenses of any underlying Fidelity Central Funds.
F Amount does not include the portfolio activity of any underlying Fidelity Central Funds.
G Investment income per share reflects a large, non-recurring dividend which amounted to less than $.01 per share. Excluding this non-recurring dividend, the ratio of net investment income (loss) to average net assets would have been .30%.
H For the period December 6, 2012 (commencement of operations) to December 31, 2012.
I Expense ratios reflect operating expenses of the class. Expenses before reductions do not reflect amounts reimbursed by the investment adviser or reductions from brokerage service arrangements or reductions from other expense offset arrangements and do not represent the amount paid by the class during periods when reimbursements or reductions occur. Expense ratios before reductions for start-up periods may not be representative of longer-term operating periods. Expenses net of fee waivers reflect expenses after reimbursement by the investment adviser but prior to reductions from brokerage service arrangements or other expense offset arrangements. Expenses net of all reductions represent the net expenses paid by the class.
J Amount represents less than $.01 per share.
K Amount not annualized.
See accompanying notes which are an integral part of the financial statements.
Annual Report
Financial Highlights - Class F
Period ended December 31, | Period ended
December 31,
2012 H |
Selected Per-Share Data | |
Net asset value, beginning of period | $ 10.00 |
Income from Investment Operations | |
Net investment income (loss) D | - G,J |
Net realized and unrealized gain (loss) | .03 |
Total from investment operations | .03 |
Distributions from net investment income | (.01) |
Net asset value, end of period | $ 10.02 |
Total Return B,C | .28% |
Ratios to Average Net Assets E,I | |
Expenses before reductions | .80% A |
Expenses net of fee waivers, if any | .80% A |
Expenses net of all reductions | .80% A |
Net investment income (loss) | .69% A,G |
Supplemental Data | |
Net assets, end of period (000 omitted) | $ 1,899,398 |
Portfolio turnover rate F | 64% K |
A Annualized
B Total returns for periods of less than one year are not annualized.
C Total returns would have been lower if certain expenses had not been reduced during the applicable periods shown.
D Calculated based on average shares outstanding during the period.
E Fees and expenses of any underlying Fidelity Central Funds are not included in the Fund's expense ratio. The Fund indirectly bears its proportionate share of the expenses of any underlying Fidelity Central Funds.
F Amount does not include the portfolio activity of any underlying Fidelity Central Funds.
G Investment income per share reflects a large, non-recurring dividend which amounted to less than $.01 per share. Excluding this non-recurring dividend, the ratio of net investment income (loss) to average net assets would have been .50%.
H For the period December 6, 2012 (commencement of operations) to December 31, 2012.
I Expense ratios reflect operating expenses of the class. Expenses before reductions do not reflect amounts reimbursed by the investment adviser or reductions from brokerage service arrangements or reductions from other expense offset arrangements and do not represent the amount paid by the class during periods when reimbursements or reductions occur. Expense ratios before reductions for start-up periods may not be representative of longer-term operating periods. Expenses net of fee waivers reflect expenses after reimbursement by the investment adviser but prior to reductions from brokerage service arrangements or other expense offset arrangements. Expenses net of all reductions represent the net expenses paid by the class.
J Amount represents less than $.01 per share.
K Amount not annualized.
See accompanying notes which are an integral part of the financial statements.
Annual Report
Notes to Financial Statements
For the period ended December 31, 2012
1. Organization.
Fidelity® Series Opportunistic Insights Fund (the Fund) is a fund of Fidelity Contrafund (the Trust) and is authorized to issue an unlimited number of shares. Shares of the Fund are only available for purchase by mutual funds for which Fidelity Management & Research Company (FMR) or an affiliate serves as an investment manager. The Trust is registered under the Investment Company Act of 1940, as amended (the 1940 Act), as an open-end management investment company organized as a Massachusetts business trust. The Fund offers Series Opportunistic Insights and Class F shares, each of which has equal rights as to assets and voting privileges. Each class has exclusive voting rights with respect to matters that affect that class. Investment income, realized and unrealized capital gains and losses, the common expenses of the Fund, and certain fund-level expense reductions, if any, are allocated on a pro-rata basis to each class based on the relative net assets of each class to the total net assets of the Fund. Each class differs with respect to transfer agent fees incurred. Certain expense reductions may also differ by class.
2. Investments in Fidelity Central Funds.
The Fund invests in Fidelity Central Funds, which are open-end investment companies available only to other investment companies and accounts managed by FMR and its affiliates. The Fund's Schedule of Investments lists each of the Fidelity Central Funds held as of period end, if any, as an investment of the Fund, but does not include the underlying holdings of each Fidelity Central Fund. As an Investing Fund, the Fund indirectly bears its proportionate share of the expenses of the underlying Fidelity Central Funds.
The Money Market Central Funds seek preservation of capital and current income and are managed by Fidelity Investments Money Management, Inc. (FIMM), an affiliate of FMR.
A complete unaudited list of holdings for each Fidelity Central Fund is available upon request or at the Securities and Exchange Commission (the SEC) website at www.sec.gov. In addition, the financial statements of the Fidelity Central Funds, which are not covered by the Fund's Report of Independent Registered Public Accounting Firm, are available on the SEC website or upon request.
3. Significant Accounting Policies.
The financial statements have been prepared in conformity with accounting principles generally accepted in the United States of America (GAAP), which require management to make certain estimates and assumptions at the date of the financial statements. Actual results could differ from those estimates. Subsequent events, if any, through the date that the financial statements were issued have been evaluated in the preparation of the financial statements. The following summarizes the significant accounting policies of the Fund:
Annual Report
3. Significant Accounting Policies - continued
Investment Valuation. Investments are valued as of 4:00 p.m. Eastern time on the last calendar day of the period. In accordance with valuation policies and procedures approved by the Board of Trustees (the Board), the Fund attempts to obtain prices from one or more third party pricing vendors or brokers to value its investments. When current market prices, quotations or rates are not readily available or reliable, investments will be fair valued in good faith by the FMR Fair Value Committee (the Committee), in accordance with procedures adopted by the Fund's Board. Factors used in determining fair value vary by investment type and may include market or investment specific events. The frequency with which these procedures are used cannot be predicted and they may be utilized to a significant extent. The Committee oversees the Fund's valuation policies and procedures and is responsible for approving and reporting to the Board all fair value determinations.
The Fund categorizes the inputs to valuation techniques used to value its investments into a disclosure hierarchy consisting of three levels as shown below:
Level 1 - quoted prices in active markets for identical investments
Level 2 - other significant observable inputs (including quoted prices for similar investments, interest rates, prepayment speeds, etc.)
Level 3 - unobservable inputs (including the Fund's own assumptions based on the best information available)
Valuation techniques used to value the Fund's investments by major category are as follows:
Equity securities, including restricted securities, for which market quotations are readily available, are valued at the last reported sale price or official closing price as reported by a third party pricing vendor on the primary market or exchange on which they are traded and are categorized as Level 1 in the hierarchy. In the event there were no sales during the day or closing prices are not available, securities are valued at the last quoted bid price or may be valued using the last available price and are generally categorized as Level 2 in the hierarchy. For foreign equity securities, when significant market or security specific events arise, comparisons to the valuation of American Depositary Receipts (ADRs), futures contracts, Exchange-Traded Funds (ETFs) and certain indexes as well as quoted prices for similar securities are used and are categorized as Level 2 in the hierarchy. Utilizing these techniques may result in transfers between Level 1 and Level 2.
Investments in open-end mutual funds, including the Fidelity Central Funds, are valued at their closing net asset value (NAV) each business day and are categorized as Level 1 in the hierarchy.
Annual Report
Notes to Financial Statements - continued
3. Significant Accounting Policies - continued
Investment Valuation - continued
Changes in valuation techniques may result in transfers in or out of an assigned level within the disclosure hierarchy. The aggregate value of investments by input level, as of December 31, 2012, is included at the end of the Fund's Schedule of Investments.
Foreign Currency. The Fund may use foreign currency contracts to facilitate transactions in foreign-denominated securities. Gains and losses from these transactions may arise from changes in the value of the foreign currency or if the counterparties do not perform under the contracts' terms.
Foreign-denominated assets, including investment securities, and liabilities are translated into U.S. dollars at the exchange rates at period end. Purchases and sales of investment securities, income and dividends received and expenses denominated in foreign currencies are translated into U.S. dollars at the exchange rate in effect on the transaction date.
The effects of exchange rate fluctuations on investments are included with the net realized and unrealized gain (loss) on investment securities. Other foreign currency transactions resulting in realized and unrealized gain (loss) are disclosed separately.
Investment Transactions and Income. For financial reporting purposes, the Fund's investment holdings and NAV include trades executed through the end of the last business day of the period. The NAV per share for processing shareholder transactions is calculated as of the close of business of the New York Stock Exchange (NYSE), normally 4:00 p.m. Eastern time and includes trades executed through the end of the prior business day. Gains and losses on securities sold are determined on the basis of identified cost. Dividend income is recorded on the ex-dividend date, except for certain dividends from foreign securities where the ex-dividend date may have passed, which are recorded as soon as the Fund is informed of the ex-dividend date. Non-cash dividends included in dividend income, if any, are recorded at the fair market value of the securities received. Distributions received on securities that represent a return of capital or capital gain are recorded as a reduction of cost of investments and/or as a realized gain. The Fund estimates the components of distributions received that may be considered return of capital distributions or capital gain distributions. Large, non-recurring dividends recognized by the Fund are presented separately on the Statement of Operations as "Special Dividends" and the impact of these dividends is presented in the Financial Highlights. Interest income and distributions from the Fidelity Central Funds are accrued as earned. Interest income includes coupon interest and amortization of premium and accretion of discount on debt securities. Investment income is recorded net of foreign taxes withheld where recovery of such taxes is uncertain.
Annual Report
3. Significant Accounting Policies - continued
Expenses. Expenses directly attributable to a fund are charged to that fund. Expenses attributable to more than one fund are allocated among the respective funds on the basis of relative net assets or other appropriate methods. Expense estimates are accrued in the period to which they relate and adjustments are made when actual amounts are known.
Income Tax Information and Distributions to Shareholders. Each year, the Fund intends to qualify as a regulated investment company under Subchapter M of the Internal Revenue Code, including distributing substantially all of its taxable income and realized gains. As a result, no provision for income taxes is required. As of December 31, 2012, the Fund did not have any unrecognized tax benefits in the financial statements; nor is the Fund aware of any tax positions for which it is reasonably possible that the total amounts of unrecognized tax benefits will significantly change in the next twelve months. The Fund files a U.S. federal tax return, in addition to state and local tax returns as required. A fund's federal income tax returns are subject to examination by the Internal Revenue Service (IRS) for a period of three fiscal years after they are filed. State and local tax returns may be subject to examination for an additional fiscal year depending on the jurisdiction. Foreign taxes are provided for based on the Fund's understanding of the tax rules and rates that exist in the foreign markets in which it invests.
Distributions are declared and recorded on the ex-dividend date. Income dividends and capital gain distributions are declared separately for each class. Income and capital gain distributions are determined in accordance with income tax regulations, which may differ from GAAP.
Capital accounts within the financial statements are adjusted for permanent book-tax differences. These adjustments have no impact on net assets or the results of operations. Temporary book-tax differences will reverse in a subsequent period.
Book-tax differences are primarily due to foreign currency transactions, passive foreign investment companies (PFIC) and losses deferred due to wash sales.
The federal tax cost of investment securities and unrealized appreciation (depreciation) as of period end were as follows:
Gross unrealized appreciation | $ 44,571,865 |
Gross unrealized depreciation | (47,188,054) |
Net unrealized appreciation (depreciation) on securities and other investments | $ (2,616,189) |
| |
Tax Cost | $ 3,725,608,934 |
Annual Report
Notes to Financial Statements - continued
3. Significant Accounting Policies - continued
Income Tax Information and Distributions to Shareholders - continued
The tax-based components of distributable earnings as of period end were as follows:
Undistributed ordinary income | $ 8,950,961 |
Net unrealized appreciation (depreciation) | $ (2,615,584) |
The tax character of distributions paid was as follows:
| December 31, 2012 |
Ordinary Income | $ 2,795,302 |
4. Purchases and Sales of Investments.
Purchases and sales of securities, other than short-term securities, aggregated $5,994,877,620 and $2,359,988,697, respectively.
5. Fees and Other Transactions with Affiliates.
Management Fee. FMR and its affiliates provide the Fund with investment management related services for which the Fund pays a monthly management fee. The management fee is the sum of an individual fund fee rate that is based on an annual rate of .30% of the Fund's average net assets and an annualized group fee rate that averaged .26% during the period. The group fee rate is based upon the average net assets of all the mutual funds advised by FMR. The group fee rate decreases as assets under management increase and increases as assets under management decrease. In addition, the management fee is subject to a performance adjustment (up to a maximum of ± .20% of the Fund's average net assets over a 36 month performance period). The upward or downward adjustment to the management fee is based on the relative investment performance of Series Opportunistic Insights as compared to an appropriate benchmark index. The Fund's performance adjustment will not take effect until December 1, 2013. Subsequent months will be added until the performance period includes 36 months. For the period, the total annualized management fee rate was .56% of the Fund's average net assets.
Transfer Agent Fees. Fidelity Investments Institutional Operations Company, Inc. (FIIOC), an affiliate of FMR, is the transfer, dividend disbursing and shareholder servicing agent for each class of the Fund. FIIOC receives account fees and asset-based fees that vary according to the account size and type of account of the shareholders of Series Opportunistic Insights. FIIOC receives no fees for providing transfer agency services to Class F. FIIOC pays for
Annual Report
5. Fees and Other Transactions with Affiliates - continued
Transfer Agent Fees - continued
typesetting, printing and mailing of shareholder reports, except proxy statements. For the period, transfer agent fees for each applicable class were as follows:
| Amount | % of
Average
Net Assets* |
Series Opportunistic Insights | $ 228,394 | .20 |
* Annualized
Accounting Fees. Fidelity Service Company, Inc.(FSC), an affiliate of FMR, maintains the Fund's accounting records. The fee is based on the level of average net assets for each month.
Brokerage Commissions. The Fund placed a portion of its portfolio transactions with brokerage firms which are affiliates of the investment adviser. The commissions paid to these affiliated firms were $50,214 for the period.
Exchanges In-Kind. During the period, certain investment companies managed by FMR or its affiliates (Investing Funds) completed exchanges in-kind with the Fund. The Investing Funds delivered cash and securities valued at $3,720,086,995 in exchange for 372,008,700 shares of the Fund. The amount of in-kind exchanges is included in share transactions in the accompanying Statement of Changes in Net Assets as well as Note 8: Share Transactions. The Fund recognized no gain or loss for federal income tax purposes.
6. Expense Reductions.
Many of the brokers with whom FMR places trades on behalf of the Fund provided services to the Fund in addition to trade execution. These services included payments of certain expenses on behalf of the Fund totaling $12,746 for the period.
7. Distributions to Shareholders.
Distributions to shareholders of each class were as follows:
Period ended December 31, | 2012 A |
From net investment income | |
Series Opportunistic Insights | $ 1,265,374 |
Class F | 1,529,928 |
Total | $ 2,795,302 |
A For the period December 6, 2012 (commencement of operations) to December 31, 2012.
Annual Report
Notes to Financial Statements - continued
8. Share Transactions.
Transactions for each class of shares were as follows:
| Shares | Dollars |
Period ended December 31, | Period ended
December 31,
2012 A | Period ended
December 31,
2012 A |
Series Opportunistic Insights | | |
Shares sold | 180,776,400 B | $ 1,807,763,739B |
Reinvestment of distributions | 126,159 | 1,265,374 |
Shares redeemed | (813,378) | (8,121,063) |
Net increase (decrease) | 180,089,181 | $ 1,800,908,050 |
Class F | | |
Shares sold | 191,283,348 B | $ 1,912,830,854 B |
Reinvestment of distributions | 152,535 | 1,529,928 |
Shares redeemed | (1,821,480) | (18,248,987) |
Net increase (decrease) | 189,614,403 | $ 1,896,111,795 |
A For the period December 6, 2012 (commencement of operations) to December 31, 2012.
B Amount includes in-kind exchanges (See Note 5: Exchanges In-Kind).
9. Other.
The Fund's organizational documents provide former and current trustees and officers with a limited indemnification against liabilities arising in connection with the performance of their duties to the Fund. In the normal course of business, the Fund may also enter into contracts that provide general indemnifications. The Fund's maximum exposure under these arrangements is unknown as this would be dependent on future claims that may be made against the Fund. The risk of material loss from such claims is considered remote.
At the end of the period, mutual funds managed by FMR or an FMR affiliate were the owners of record of all of the outstanding shares of the Fund.
Annual Report
To the Trustees of Fidelity Contrafund and the Shareholders of Fidelity Series Opportunistic Insights Fund:
In our opinion, the accompanying statement of assets and liabilities, including the schedule of investments, and the related statements of operations and of changes in net assets and the financial highlights present fairly, in all material respects, the financial position of Fidelity Series Opportunistic Insights Fund (a fund of Fidelity Contrafund) at December 31, 2012 and the results of its operations, the changes in its net assets and the financial highlights for the period indicated, in conformity with accounting principles generally accepted in the United States of America. These financial statements and financial highlights (hereafter referred to as "financial statements") are the responsibility of the Fidelity Series Opportunistic Insights Fund's management. Our responsibility is to express an opinion on these financial statements based on our audit. We conducted our audit of these financial statements in accordance with the standards of the Public Company Accounting Oversight Board (United States). Those standards require that we plan and perform the audit to obtain reasonable assurance about whether the financial statements are free of material misstatement. An audit includes examining, on a test basis, evidence supporting the amounts and disclosures in the financial statements, assessing the accounting principles used and significant estimates made by management, and evaluating the overall financial statement presentation. We believe that our audit, which included confirmation of securities at December 31, 2012 by correspondence with the custodian and brokers, provides a reasonable basis for our opinion.
PricewaterhouseCoopers LLP
Boston, Massachusetts
February 19, 2013
Annual Report
The Trustees, Members of the Advisory Board, and executive officers of the trust and fund, as applicable, are listed below. The Board of Trustees governs the fund and is responsible for protecting the interests of shareholders. The Trustees are experienced executives who meet periodically throughout the year to oversee the fund's activities, review contractual arrangements with companies that provide services to the fund, oversee management of the risks associated with such activities and contractual arrangements, and review the fund's performance. Except for James C. Curvey, each of the Trustees oversees 234 funds advised by FMR or an affiliate. Mr. Curvey oversees 452 funds advised by FMR or an affiliate.
The Trustees hold office without limit in time except that (a) any Trustee may resign; (b) any Trustee may be removed by written instrument, signed by at least two-thirds of the number of Trustees prior to such removal; (c) any Trustee who requests to be retired or who has become incapacitated by illness or injury may be retired by written instrument signed by a majority of the other Trustees; and (d) any Trustee may be removed at any special meeting of shareholders by a two-thirds vote of the outstanding voting securities of the trust. Each Trustee who is not an interested person (as defined in the 1940 Act) (Independent Trustee), shall retire not later than the last day of the calendar year in which his or her 75th birthday occurs. The Independent Trustees may waive this mandatory retirement age policy with respect to individual Trustees. The executive officers and Advisory Board Members hold office without limit in time, except that any officer and Advisory Board Member may resign or may be removed by a vote of a majority of the Trustees at any regular meeting or any special meeting of the Trustees. Except as indicated, each individual has held the office shown or other offices in the same company for the past five years.
Experience, Skills, Attributes, and Qualifications of the Fund's Trustees. The Governance and Nominating Committee has adopted a statement of policy that describes the experience, qualifications, attributes, and skills that are necessary and desirable for potential Independent Trustee candidates (Statement of Policy). The Board believes that each Trustee satisfied at the time he or she was initially elected or appointed a Trustee, and continues to satisfy, the standards contemplated by the Statement of Policy. The Governance and Nominating Committee also engages professional search firms to help identify potential Independent Trustee candidates who have the experience, qualifications, attributes, and skills consistent with the Statement of Policy. From time to time, additional criteria based on the composition and skills of the current Independent Trustees, as well as experience or skills that may be appropriate in light of future changes to board composition, business conditions, and regulatory or other developments, have also been considered by the professional search firms and the Governance and Nominating Committee. In addition, the Board takes into account the Trustees' commitment and participation in Board and committee meetings, as well as their leadership of standing and ad hoc committees throughout their tenure.
In determining that a particular Trustee was and continues to be qualified to serve as a Trustee, the Board has considered a variety of criteria, none of which, in isolation, was controlling. The Board believes that, collectively, the Trustees have balanced and diverse experience, qualifications, attributes, and skills, which allow the Board to operate effectively in governing the fund and protecting the interests of shareholders. Information about the specific experience, skills, attributes, and qualifications of each Trustee, which in each case led to the Board's conclusion that the Trustee should serve (or continue to serve) as a trustee of the fund, is provided below.
Annual Report
Board Structure and Oversight Function. James C. Curvey is an interested person (as defined in the 1940 Act) and currently serves as Chairman. The Trustees have determined that an interested Chairman is appropriate and benefits shareholders because an interested Chairman has a personal and professional stake in the quality and continuity of services provided to the fund. Independent Trustees exercise their informed business judgment to appoint an individual of their choosing to serve as Chairman, regardless of whether the Trustee happens to be independent or a member of management. The Independent Trustees have determined that they can act independently and effectively without having an Independent Trustee serve as Chairman and that a key structural component for assuring that they are in a position to do so is for the Independent Trustees to constitute a substantial majority for the Board. The Independent Trustees also regularly meet in executive session. Ned C. Lautenbach serves as Chairman of the Independent Trustees and as such (i) acts as a liaison between the Independent Trustees and management with respect to matters important to the Independent Trustees and (ii) with management prepares agendas for Board meetings.
Fidelity funds are overseen by different Boards of Trustees. The fund's Board oversees Fidelity's equity and high income funds and another Board oversees Fidelity's investment-grade bond, money market, and asset allocation funds. The asset allocation funds may invest in Fidelity funds overseen by the fund's Board. The use of separate Boards, each with its own committee structure, allows the Trustees of each group of Fidelity funds to focus on the unique issues of the funds they oversee, including common research, investment, and operational issues. On occasion, the separate Boards establish joint committees to address issues of overlapping consequences for the Fidelity funds overseen by each Board.
The Trustees operate using a system of committees to facilitate the timely and efficient consideration of all matters of importance to the Trustees, the fund, and fund shareholders and to facilitate compliance with legal and regulatory requirements and oversight of the fund's activities and associated risks. The Board, acting through its committees, has charged FMR and its affiliates with (i) identifying events or circumstances the occurrence of which could have demonstrably adverse effects on the fund's business and/or reputation; (ii) implementing processes and controls to lessen the possibility that such events or circumstances occur or to mitigate the effects of such events or circumstances if they do occur; and (iii) creating and maintaining a system designed to evaluate continuously business and market conditions in order to facilitate the identification and implementation processes described in (i) and (ii) above. Because the day-to-day operations and activities of the fund are carried out by or through FMR, its affiliates and other service providers, the fund's exposure to risks is mitigated but not eliminated by the processes overseen by the Trustees. While each of the Board's committees has responsibility for overseeing different aspects of the fund's activities, oversight is exercised primarily through the Operations, Audit, and Compliance Committees. In addition, the Independent Trustees have worked with FMR to enhance the Board's oversight of investment and financial risks, legal and regulatory risks, technology risks, and operational risks, including the development of additional risk reporting to the Board. For example, a working group comprised of Independent Trustees and FMR has worked and continues to work to review the Fidelity funds' valuation-related activities, reporting and risk management. Appropriate personnel, including but not limited to the fund's Chief Compliance Officer (CCO), FMR's internal auditor, the independent accountants, the fund's Treasurer and portfolio management personnel, make periodic reports to the Board's committees, as appropriate, including an annual review of FMR's risk management program for the Fidelity funds. The responsibilities of each standing committee, including their oversight responsibilities, are described further under "Standing Committees of the Fund's Trustees."
Annual Report
Trustees and Officers - continued
The fund's Statements of Additional Information (SAIs) include more information about the Trustees. To request a free copy, call Fidelity at 1-800-544-8544 for Fidelity Series Opportunistic Insights Fund or 1-800-835-5092 for Class F.
Interested Trustees*:
Correspondence intended for each Trustee who is an interested person may be sent to Fidelity Investments, 82 Devonshire Street, Boston, Massachusetts 02109.
Name, Age; Principal Occupations and Other Relevant Experience+ |
James C. Curvey (77) |
| Year of Election or Appointment: 2007 Mr. Curvey is Trustee and Chairman of the Board of Trustees of certain Trusts. Mr. Curvey also serves as Trustee (2007-present) of other investment companies advised by FMR. Mr. Curvey is a Director of Fidelity Investments Money Management, Inc. (2009-present), Director of Fidelity Research & Analysis Co. (2009-present) and Director of FMR and FMR Co., Inc. (2007-present). Mr. Curvey is also Vice Chairman (2007-present) and Director of FMR LLC. In addition, Mr. Curvey serves as an Overseer for the Boston Symphony Orchestra and a member of the Trustees of Villanova University. Previously, Mr. Curvey was the Vice Chairman (2006-2007) and Director (2000-2007) of FMR Corp. |
Ronald P. O'Hanley (55) |
| Year of Election or Appointment: 2011 Mr. O'Hanley is Director of FMR Co., Inc. (2010-present), Director of Fidelity Investments Money Management, Inc. (2010-present), Director of Fidelity Research & Analysis Company (2010-present), President of Fidelity Asset Management and Corporate Services and a member of Fidelity's Executive Committee (2010-present). Previously, Mr. O'Hanley served as President and Chief Executive Officer of BNY Mellon Asset Management (2007-2010). Mr. O'Hanley also served as Vice Chairman of Bank New York Mellon Corp. and a member of that firm's Executive Committee. Prior to the 2007 merger of The Bank of New York and Mellon Financial Corporation, he was Vice Chairman of Mellon Financial Corporation and President and Chief Executive Officer of Mellon Asset Management. He joined Mellon in February 1997. Mr. O'Hanley currently serves as Chairman of the Boston Public Library Foundation Board of Directors and sits on the Board of Directors of Beth Israel Deaconess Medical Center, the Board of Trustees of the Marine Biological Laboratory and the Advisory Board of the Maxwell School of Citizenship and Public Administration at Syracuse University. Mr. O'Hanley also chairs the Council on Asset Management for the Financial Services Roundtable and is a member of the Board of Directors of Institutional Investor's U.S. Institute. |
* Trustees have been determined to be "Interested Trustees" by virtue of, among other things, their affiliation with the trust or various entities under common control with FMR.
+ The information above includes each Trustee's principal occupation during the last five years and other information relating to the experience, attributes, and skills relevant to each Trustee's qualifications to serve as a Trustee, which led to the conclusion that each Trustee should serve as a Trustee for the fund.
Annual Report
Trustees and Officers - continued
Independent Trustees:
Correspondence intended for each Independent Trustee (that is, the Trustees other than the Interested Trustees) may be sent to Fidelity Investments, P.O. Box 55235, Boston, Massachusetts 02205-5235.
Name, Age; Principal Occupations and Other Relevant Experience+ |
Dennis J. Dirks (64) |
| Year of Election or Appointment: 2005 Prior to his retirement in May 2003, Mr. Dirks was Chief Operating Officer and a member of the Board of The Depository Trust & Clearing Corporation (DTCC). He also served as President, Chief Operating Officer, and Board member of The Depository Trust Company (DTC) and President and Board member of the National Securities Clearing Corporation (NSCC). In addition, Mr. Dirks served as Chief Executive Officer and Board member of the Government Securities Clearing Corporation, Chief Executive Officer and Board member of the Mortgage-Backed Securities Clearing Corporation, as a Trustee and a member of the Finance Committee of Manhattan College (2005-2008), and as a Trustee and a member of the Finance Committee of AHRC of Nassau County (2006-2008). Mr. Dirks is a member of the Independent Directors Council (IDC) Governing Council (2010-present) and Board of Directors for The Brookville Center for Children's Services, Inc. (2009-present). |
Alan J. Lacy (59) |
| Year of Election or Appointment: 2008 Mr. Lacy serves as Senior Adviser (2007-present) of Oak Hill Capital Partners, L.P. (private equity). Mr. Lacy also served as Chief Executive Officer (2000-2005) and Vice Chairman (2005-2006) of Sears Holdings Corporation and Sears, Roebuck and Co. (retail). In addition, Mr. Lacy serves as a member of the Board of Directors of Dave & Buster's Entertainment, Inc. (restaurant and entertainment complexes, 2010-present), Earth Fare, Inc. (retail grocery, 2012-present), The Hillman Companies, Inc. (hardware wholesalers, 2010-present), and Bristol-Myers Squibb Company (global pharmaceuticals, 2008-present). Mr. Lacy is a member of the Board of Trustees of The National Parks Conservation Association (2006-present). Previously, Mr. Lacy served as Chairman of the Board of Trustees of the National Parks Conservation Association (2008-2011) and as a member of the Board of Directors for the Western Union Company (global money transfer, 2006-2011). |
Ned C. Lautenbach (68) |
| Year of Election or Appointment: 2000 Mr. Lautenbach is Chairman of the Independent Trustees of the Equity and High Income Funds (2006-present). Mr. Lautenbach currently serves as the Lead Director of the Eaton Corporation Board of Directors (diversified industrial, 1997-present). Mr. Lautenbach is Chairman of the Board of Directors of the Philharmonic Center for the Arts in Naples, Florida (2012-present) and a member of the Council on Foreign Relations (1994-present). Previously, Mr. Lautenbach was a Partner/Advisory Partner at Clayton, Dubilier & Rice, LLC (private equity investment, 1998-2010), as well as a Director of Sony Corporation (2006-2007). |
Joseph Mauriello (68) |
| Year of Election or Appointment: 2008 Prior to his retirement in January 2006, Mr. Mauriello served in numerous senior management positions including Deputy Chairman and Chief Operating Officer (2004-2005), and Vice Chairman of Financial Services (2002-2004) of KPMG LLP US (professional services, 1965-2005). Mr. Mauriello currently serves as a member of the Board of Directors of XL Group plc. (global insurance and re-insurance, 2006-present). Previously, Mr. Mauriello served as a Director of the Hamilton Funds of the Bank of New York (2006-2007) and of Arcadia Resources Inc. (health care services and products, 2007-2012). |
Robert W. Selander (62) |
| Year of Election or Appointment: 2011 Previously, Mr. Selander served as a Member of the Advisory Board of Fidelity's Equity and High Income Funds (2011), Executive Vice Chairman (2010), Chief Executive Officer (2009-2010), and President and Chief Executive Officer (1997-2009) of Mastercard, Inc. |
Cornelia M. Small (68) |
| Year of Election or Appointment: 2005 Ms. Small is a member of the Board of Directors (2009-present) and Chair of the Investment Committee (2010-present) of the Teagle Foundation. Ms. Small also serves on the Investment Committee of the Berkshire Taconic Community Foundation (2008-present). Previously, Ms. Small served as Chairperson (2002-2008) and a member of the Investment Committee and Chairperson (2008-2012) and a member of the Board of Trustees of Smith College. In addition, Ms. Small served as Chief Investment Officer, Director of Global Equity Investments, and a member of the Board of Directors of Scudder, Stevens & Clark and Scudder Kemper Investments. |
William S. Stavropoulos (73) |
| Year of Election or Appointment: 2001 Mr. Stavropoulos is Vice Chairman of the Independent Trustees of the Equity and High Income Funds (2006-present). Mr. Stavropoulos serves as President and Founder of the Michigan Baseball Foundation, the Great Lakes Loons (2007-present). Mr. Stavropoulos is Chairman Emeritus of the Board of Directors of The Dow Chemical Company, where he previously served in numerous senior management positions, including President, CEO (1995-2000; 2002-2004), Chairman of the Executive Committee (2000-2006), and as a member of the Board of Directors (1990-2006). Currently, Mr. Stavropoulos is a Director of Univar Inc. (global distributor of commodity and specialty chemicals, Chairman from 2010-May 2012 and Lead Director from May 2012-present), Teradata Corporation (data warehousing and technology solutions, 2008-present), Maersk Inc. (industrial conglomerate), and Tyco International, Ltd. (multinational manufacturing and services, 2007-present), and a member of the Advisory Board for Metalmark Capital LLC (private equity investment, 2005-present). Mr. Stavropoulos is an operating advisor to Clayton, Dubilier & Rice, LLC (private equity investment). In addition, Mr. Stavropoulos is a member of the University of Notre Dame Advisory Council for the College of Science, a Trustee of the Rollin L. Gerstacker Foundation, and a Director of the Naples Philharmonic Center for the Arts. Previously, Mr. Stavropoulos served as a Director of Chemical Financial Corporation (bank holding company, 1993-2012). |
David M. Thomas (63) |
| Year of Election or Appointment: 2008 Previously, Mr. Thomas served as Executive Chairman (2005-2006) and Chairman and Chief Executive Officer (2000-2005) of IMS Health, Inc. (pharmaceutical and healthcare information solutions), and a Director of Fortune Brands, Inc. (consumer products, 2000-2011). In addition, Mr. Thomas serves as Non-Executive Chairman of the Board of Directors of Fortune Brands Home and Security (home and security products, 2011-present), and as a member of the Board of Directors of Interpublic Group of Companies, Inc. (marketing communication, 2004-present). |
Michael E. Wiley (62) |
| Year of Election or Appointment: 2008 Mr. Wiley also serves as a Director of Asia Pacific Exploration Consolidated (international oil and gas exploration and production, 2008-present). Mr. Wiley serves as a Director of Tesoro Corporation (independent oil refiner and marketer, 2005-present), and a Director of Bill Barrett Corporation (exploration and production, 2005-present). In addition, Mr. Wiley also serves as a Director of Post Oak Bank (privately-held bank, 2004-present). Previously, Mr. Wiley served as a member of the Board of Trustees of the University of Tulsa (2000-2006; 2007-2010), as a Senior Energy Advisor of Katzenbach Partners, LLC (consulting, 2006-2007), as an Advisory Director of Riverstone Holdings (private investment), Chairman, President, and CEO of Baker Hughes, Inc. (oilfield services, 2000-2004), and as Director of Spinnaker Exploration Company (exploration and production, 2001-2005). |
+ The information above includes each Trustee's principal occupation during the last five years and other information relating to the experience, attributes, and skills relevant to each Trustee's qualifications to serve as a Trustee, which led to the conclusion that each Trustee should serve as a Trustee for the fund.
Advisory Board Members and Executive Officers:
Correspondence intended for David A. Rosow and Garnett A. Smith may be sent to Fidelity Investments, P.O. Box 55235, Boston, Massachusetts 02205-5235. Correspondence intended for each executive officer and Peter S. Lynch may be sent to Fidelity Investments, 82 Devonshire Street, Boston, Massachusetts 02109.
Name, Age; Principal Occupation |
Peter S. Lynch (68) |
| Year of Election or Appointment: 2003 Member of the Advisory Board of Fidelity's Equity and High Income Funds. Mr. Lynch is Vice Chairman and a Director of FMR and FMR Co., Inc. In addition, Mr. Lynch serves as a Trustee of Boston College and as the Chairman of the Inner-City Scholarship Fund. Previously, Mr. Lynch served on the Special Olympics International Board of Directors (1997-2006). |
David A. Rosow (70) |
| Year of Election or Appointment: 2012 Member of the Advisory Board of Fidelity's Equity and High Income Funds. Chairman and Chief Executive Officer of International Golf Group, Inc. (golf course development, 1989-present). Previously, Mr. Rosow served as Chairman and Chief Executive Officer of Rosow & Company, Inc. (private investment company, 1989-2011), a Lead Director of Hudson United Bancorp (2001-2006) and as a Director of TD Banknorth (1996-2006). In addition, Mr. Rosow is a member (2008-present) and President (2009-present) of the Town Council of Palm Beach, Florida. |
Garnett A. Smith (65) |
| Year of Election or Appointment: 2012 Member of the Advisory Board of Fidelity's Equity and High Income Funds. Prior to Mr. Smith's retirement, he served as Chairman and Chief Executive Officer of Inbrand Corp. (manufacturer of personal absorbent products, 1990-1997). He also served as President (1986-1990) of Inbrand Corp. Prior to his employment with Inbrand Corp., he was employed by a retail fabric chain and North Carolina National Bank. In addition, Mr. Smith is a board member of the Jackson Hole Land Trust (2009-present). |
Kenneth B. Robins (43) |
| Year of Election or Appointment: 2008 President and Treasurer of Fidelity's Equity and High Income Funds. Mr. Robins also serves as President and Treasurer (2010-present) and Assistant Treasurer (2009-present) of other Fidelity funds and is an employee of Fidelity Investments (2004-present). Previously, Mr. Robins served as Deputy Treasurer of the Fidelity funds (2005-2008) and Treasurer and Chief Financial Officer of The North Carolina Capital Management Trust: Cash and Term Portfolios (2006-2008). |
Bruce T. Herring (47) |
| Year of Election or Appointment: 2006 Vice President of certain Equity Funds. Mr. Herring also serves as President of Fidelity Research & Analysis Company (2010-present), Chief Investment Officer and Director of Fidelity Management & Research (U.K.) Inc. (2010-present) and Group Chief Investment Officer of FMR. Previously, Mr. Herring served as Vice President (2005-2006) and Senior Vice President (2006-2007) of Fidelity Management & Research Company, Vice President of FMR Co., Inc. (2001-2007) and as a portfolio manager for Fidelity U.S. Equity Funds. |
Brian B. Hogan (48) |
| Year of Election or Appointment: 2009 Vice President of Equity and High Income Funds. Mr. Hogan also serves as President of FMR's Equity Division (2009-present). Previously, Mr. Hogan served as Senior Vice President, Equity Research of FMR (2006-2009) and as a portfolio manager. |
Scott C. Goebel (44) |
| Year of Election or Appointment: 2008 Secretary and Chief Legal Officer (CLO) of the Fidelity funds. Mr. Goebel also serves as Secretary of Fidelity Investments Money Management, Inc. (FIMM) (2010-present) and Fidelity Research and Analysis Company (FRAC) (2010-present); Secretary and CLO of The North Carolina Capital Management Trust: Cash and Term Portfolios (2008-present); General Counsel, Secretary, and Senior Vice President of FMR (2008-present) and FMR Co., Inc. (2008-present); employed by FMR LLC or an affiliate (2001-present); Chief Legal Officer of Fidelity Management & Research (Hong Kong) Limited (2008-present) and Assistant Secretary of Fidelity Management & Research (Japan) Inc. (2008-present), and Fidelity Management & Research (U.K.) Inc. (2008-present). Previously, Mr. Goebel served as Assistant Secretary of FIMM (2008-2010), FRAC (2008-2010), and the Funds (2007-2008) and as Vice President and Secretary of Fidelity Distributors Corporation (FDC) (2005-2007). |
William C. Coffey (43) |
| Year of Election or Appointment: 2009 Assistant Secretary of Fidelity's Equity and High Income Funds. Mr. Coffey also serves as Senior Vice President and Deputy General Counsel of FMR LLC (2010-present), and is an employee of Fidelity Investments. Previously, Mr. Coffey served as Vice President and Associate General Counsel of FMR LLC (2005-2009). |
Elizabeth Paige Baumann (44) |
| Year of Election or Appointment: 2012 Anti-Money Laundering (AML) Officer of the Fidelity funds. Ms. Baumann also serves as AML Officer of The North Carolina Capital Management Trust: Cash and Term Portfolios (2012-present), Chief AML Officer of FMR LLC (2012-present), and is an employee of Fidelity Investments. Previously, Ms. Baumann served as Vice President and Deputy Anti-Money Laundering Officer (2007-2012). |
Christine Reynolds (54) |
| Year of Election or Appointment: 2008 Chief Financial Officer of the Fidelity funds. Ms. Reynolds became President of Fidelity Pricing and Cash Management Services (FPCMS) in August 2008. Ms. Reynolds served as Chief Operating Officer of FPCMS (2007-2008). Previously, Ms. Reynolds served as President, Treasurer, and Anti-Money Laundering officer of the Fidelity funds (2004-2007). |
Joseph A. Hanlon (44) |
| Year of Election or Appointment: 2012 Chief Compliance Officer of Fidelity's Equity and High Income Funds. Mr. Hanlon serves as Compliance Officer of FMR, FMR Co., Inc., Fidelity Investments Money Management, Inc. (FIMM), Fidelity Research and Analysis Company (FRAC), Fidelity Management & Research (Japan) Inc., Fidelity Management & Research (U.K.) Inc., Fidelity Management & Research (Hong Kong), and Strategic Advisers, Inc. (2009-present), as Senior Vice President of the Fidelity Asset Management Division (2009-present), and is an employee of Fidelity Investments. |
Joseph F. Zambello (55) |
| Year of Election or Appointment: 2011 Deputy Treasurer of the Fidelity funds. Mr. Zambello is an employee of Fidelity Investments. Previously, Mr. Zambello served as Vice President of FMR's Program Management Group (2009-2011) and Vice President of the Transfer Agent Oversight Group (2005-2009). |
Adrien E. Deberghes (45) |
| Year of Election or Appointment: 2008 Deputy Treasurer of Fidelity's Equity and High Income Funds. Mr. Deberghes also serves as Vice President (2011-present) and Assistant Treasurer (2010-present) of other Fidelity funds, and is an employee of Fidelity Investments (2008-present). Previously, Mr. Deberghes served as Senior Vice President of Mutual Fund Administration at State Street Corporation (2007-2008), Senior Director of Mutual Fund Administration at Investors Bank & Trust (2005-2007), and Director of Finance for Dunkin' Brands (2000-2005). |
Stephen Sadoski (41) |
| Year of Election or Appointment: 2012 Deputy Treasurer of Fidelity's Equity and High Income Funds. Mr. Sadoski also serves as Deputy Treasurer of other Fidelity funds (2013-present) and is an employee of Fidelity Investments (2012-present). Previously, Mr. Sadoski served as Assistant Treasurer of Fidelity's Fixed Income and Asset Allocation Funds (2012-2013), an assistant chief accountant in the Division of Investment Management of the Securities and Exchange Commission (SEC) (2009-2012) and as a senior manager at Deloitte & Touche (1997-2009). |
Stacie Smith (38) |
| Year of Election or Appointment: 2013 Deputy Treasurer of Fidelity's Equity and High Income Funds. Ms. Smith is an employee of Fidelity Investments (2009-present). Previously, Ms. Smith served as Senior Audit Manager of Ernst & Young LLP (1996-2009). |
Stephanie J. Dorsey (43) |
| Year of Election or Appointment: 2010 Assistant Treasurer of Fidelity's Equity and High Income Funds. Ms. Dorsey also serves as President and Treasurer (2013-present) and Assistant Treasurer (2012-present) of other Fidelity funds and is an employee of Fidelity Investments (2008-present). Previously, Ms. Dorsey served as Deputy Treasurer of Fidelity's Fixed Income and Asset Allocation Funds (2008-2013), Treasurer (2004-2008) of the JPMorgan Mutual Funds and Vice President (2004-2008) of JPMorgan Chase Bank. |
John R. Hebble (54) |
| Year of Election or Appointment: 2009 Assistant Treasurer of Fidelity's Equity and High Income Funds. Mr. Hebble also serves as President (2011-present), Treasurer, and Chief Financial Officer of The North Carolina Capital Management Trust: Cash and Term Portfolios (2008-present) and is an employee of Fidelity Investments. Previously, Mr. Hebble served as President and Treasurer of Fidelity's Fixed Income and Asset Allocation Funds (2008-2013). |
Gary W. Ryan (54) |
| Year of Election or Appointment: 2005 Assistant Treasurer of the Fidelity funds. Mr. Ryan is an employee of Fidelity Investments. Previously, Mr. Ryan served as Vice President of Fund Reporting in Fidelity Pricing and Cash Management Services (FPCMS) (1999-2005). |
Jonathan Davis (44) |
| Year of Election or Appointment: 2010 Assistant Treasurer of the Fidelity funds. Mr. Davis is also Assistant Treasurer of Fidelity Rutland Square Trust II and Fidelity Commonwealth Trust II. Mr. Davis is an employee of Fidelity Investments. Previously, Mr. Davis served as Vice President and Associate General Counsel of FMR LLC (2003-2010). |
Annual Report
The Board of Trustees of Fidelity Series Opportunistic Insights Fund voted to pay to shareholders of record at the opening of business on record date, the following distributions per share derived from capital gains realized from sales of portfolio securities:
| Pay Date | Record Date | Capital Gains |
Fidelity Series Opportunistic Insights Fund | 02/19/13 | 02/15/13 | $0.026 |
Class F | 02/19/13 | 02/15/13 | $0.026 |
Fidelity Series Opportunistic Insights Fund designates 28% and Class F designates 25% of the dividends distributed in December 2012, respectively during the fiscal year as amounts which may be taken into account as a dividend for purposes of the maximum rate under section 1(h)(11) of the Internal Revenue Code.
Fidelity Series Opportunistic Insights Fund designates 29% and Class F designates 26% of the dividends distributed in December 2012, respectively during the fiscal year as qualifying for the dividends-received deduction for corporate shareholders.
The fund will notify shareholders in January 2013 of amounts for use in preparing 2012 income tax returns.
Annual Report
Board Approval of Investment Advisory Contracts and Management Fees
Fidelity Series Opportunistic Insights Fund
On September 19, 2012, the Board of Trustees, including the Independent Trustees (together, the Board), voted to approve the management contract and sub-advisory agreements (together, the Advisory Contracts) for the fund. The Board, assisted by the advice of fund counsel and Independent Trustees' counsel, considered a broad range of information.
Nature, Extent, and Quality of Services Provided. The Board considered the staffing within the investment adviser, FMR, and the sub-advisers (together, the Investment Advisers), including the backgrounds of the fund's investment personnel, and also considered the fund's investment objective, strategies, and related investment philosophy. The Board considered the structure of the portfolio manager compensation program and whether this structure provides appropriate incentives to act in the best interests of the fund.
Resources Dedicated to Investment Management and Support Services. The Board and the Fund Oversight and Research Committees reviewed the general qualifications and capabilities of the Investment Advisers' investment staff, including its size, education, experience, and resources, as well as the Investment Advisers' approach to recruiting, training, managing, and compensating investment personnel. The Board also noted that FMR has continued to increase the resources devoted to non-U.S. offices, including expansion of Fidelity's global investment organization. The Board noted that Fidelity's analysts have extensive resources, tools and capabilities that allow them to conduct sophisticated quantitative and fundamental analysis, as well as credit analysis of issuers, counterparties and guarantors. The Board also believes that Fidelity's investment professionals have sufficient access to global information and data so as to provide competitive investment results over time, and that those professionals also have access to sophisticated tools that permit them to assess portfolio construction and risk and performance attribution characteristics continuously, as well as to transmit new information and research conclusions rapidly around the world. Additionally, in its deliberations, the Board considered the Investment Advisers' trading and risk management capabilities and resources, which are an integral part of the investment management process.
Shareholder and Administrative Services. The Board considered the nature, extent, quality, and cost of advisory, administrative, and shareholder services to be performed by the Investment Advisers and their affiliates under the Advisory Contracts and under separate agreements covering transfer agency, pricing and bookkeeping, and securities lending services for the fund. The Board also considered the nature and extent of the supervision of third party service providers, principally custodians and subcustodians.
The Board noted that the growth of fund assets over time across the complex allows Fidelity to reinvest in the development of services designed to enhance the value or convenience of the Fidelity funds as investment vehicles. These services include 24-hour access to account information and market information through telephone representatives and over the Internet, investor education materials and asset allocation tools, and the expanded availability of Fidelity Investor Centers.
Annual Report
Investment Performance. The fund is a new fund and therefore had no historical performance for the Board to review at the time it approved the fund's Advisory Contracts. The Board considered the Investment Advisers' strength in fundamental, research-driven Growth & Capital Appreciation selection, which the Board is familiar with through its supervision of other Fidelity funds that invest in such securities.
Based on its review, the Board concluded that the nature, extent, and quality of services to be provided to the fund under the Advisory Contracts should benefit the fund's shareholders.
Competitiveness of Management Fee and Total Expense Ratio. The Board considered the fund's proposed management fee and the projected total expense ratio of each class of the fund in reviewing the Advisory Contracts. The Board noted that the fund's proposed management fee rate is lower than the median fee rate of funds with similar Lipper investment objective categories and comparable management fee characteristics. The Board also considered that the projected total expense ratios are comparable to those of similar classes and funds that Fidelity offers to shareholders.
Based on its review, the Board concluded that the management fee and the projected total expense ratio of each class of the fund were reasonable in light of the services that the fund and its shareholders will receive and the other factors considered.
Costs of the Services and Profitability. The fund is a new fund and therefore no revenue, cost, or profitability data was available for the Board to review in respect of the fund at the time it approved the Advisory Contracts. In connection with its future renewal of the fund's Advisory Contracts, the Board will consider the revenues earned and the expenses incurred by Fidelity in conducting the business of developing, marketing, distributing, managing, administering and servicing the fund and its shareholders.
Economies of Scale. The Board will consider economies of scale when there is operating experience to permit assessment thereof. It noted that, notwithstanding the entrepreneurial risk associated with a new fund, the management fee was at a level normally associated, by comparison with competitors, with very high fund net assets, and Fidelity asserted to the Board that the level of the fee anticipated economies of scale at lower asset levels even before, if ever, economies of scale are achieved. The Board also noted that the fund and its shareholders would have access to the very considerable number and variety of services available through Fidelity and its affiliates.
Based on its evaluation of all of the conclusions noted above, and after considering all factors it believed relevant, the Board ultimately concluded that the advisory fee structures are fair and reasonable, and that the fund's Advisory Contracts should be approved.
Annual Report
Investment Adviser
Fidelity Management & Research Company
Boston, MA
Investment Sub-Advisers
FMR Co., Inc.
Fidelity Management & Research (U.K.) Inc.
Fidelity Management & Research (Hong Kong) Limited
Fidelity Management & Research (Japan) Inc.
General Distributor
Fidelity Distributors Corporation
Smithfield, RI
Transfer and Service Agents
Fidelity Investments Institutional Operations Company, Inc.
Boston, MA
Fidelity Service Company, Inc.
Boston, MA
Custodian
Brown Brothers Harriman & Co.
Boston, MA
(Fidelity Investment logo)(registered trademark)
Corporate Headquarters
82 Devonshire St., Boston, MA 02109
www.fidelity.com
O1T-ANN-0213
1.951052.100
Fidelity Advisor®
Series Opportunistic Insights Fund
Annual Report
December 31, 2012
(Fidelity Cover Art)
Contents
Shareholder Expense Example | (Click Here) | An example of shareholder expenses. |
Investment Summary | (Click Here) | A summary of the fund's holdings. |
Investments | (Click Here) | A complete list of the fund's investments with their market values. |
Financial Statements | (Click Here) | Statements of assets and liabilities, operations, and changes in net assets, as well as financial highlights. |
Notes | (Click Here) | Notes to the Financial Statements. |
Report of Independent Registered Public Accounting Firm | (Click Here) | |
Trustees and Officers | (Click Here) | |
Distributions | (Click Here) | |
Board Approval of Investment Advisory Contracts and Management Fees | (Click Here) | |
To view a fund's proxy voting guidelines and proxy voting record for the 12-month period ended June 30, visit http://www.fidelity.com/proxyvotingresults or visit the Securities and Exchange Commission's (SEC) web site at http://www.sec.gov. You may also call 1-877-208-0098 to request a free copy of the proxy voting guidelines.
Standard & Poor's, S&P and S&P 500 are registered service marks of The McGraw-Hill Companies, Inc. and have been licensed for use by Fidelity Distributors Corporation.
Other third party marks appearing herein are the property of their respective owners.
All other marks appearing herein are registered or unregistered trademarks or service marks of FMR LLC or an affiliated company. © 2013 FMR LLC. All rights reserved.
This report and the financial statements contained herein are submitted for the general information of the shareholders of the fund. This report is not authorized for distribution to prospective investors in the fund unless preceded or accompanied by an effective prospectus.
A fund files its complete schedule of portfolio holdings with the SEC for the first and third quarters of each fiscal year on Form N-Q. Forms N-Q are available on the SEC's web site at http://www.sec.gov. A fund's Forms N-Q may be reviewed and copied at the SEC's Public Reference Room in Washington, DC. Information regarding the operation of the SEC's Public Reference Room may be obtained by calling 1-800-SEC-0330. For a complete list of a fund's portfolio holdings, view the most recent holdings listing, semiannual report, or annual report on Fidelity's web site at http://www.fidelity.com, http://www.advisor.fidelity.com, or http://www.401k.com, as applicable.
NOT FDIC INSURED • MAY LOSE VALUE • NO BANK GUARANTEE
Neither the fund nor Fidelity Distributors Corporation is a bank.
Annual Report
Shareholder Expense Example
As a shareholder of the Fund, you incur two types of costs: (1) transaction costs, and (2) ongoing costs, including management fees and other Fund expenses. This Example is intended to help you understand your ongoing costs (in dollars) of investing in the Fund and to compare these costs with the ongoing costs of investing in other mutual funds.
The actual expense Example is based on an investment of $1,000 invested at the beginning of the period and held for the entire period (December 6, 2012 to December 31, 2012). The hypothetical expense Example is based on an investment of $1,000 invested for the one-half year period (July 1, 2012 to December 31, 2012).
Actual Expenses
The first line of the accompanying table provides information about actual account values and actual expenses. You may use the information in this line, together with the amount you invested, to estimate the expenses that you paid over the period. Simply divide your account value by $1,000.00 (for example, an $8,600 account value divided by $1,000.00 = 8.6), then multiply the result by the number in the first line under the heading entitled "Expenses Paid During Period" to estimate the expenses you paid on your account during this period. In addition, the Fund, as a shareholder in the underlying Fidelity Central Funds, will indirectly bear its pro-rata share of the fees and expenses incurred by the underlying Fidelity Central Funds. These fees and expenses are not included in the Fund's annualized expense ratio used to calculate the expense estimate in the table below.
Hypothetical Example for Comparison Purposes
The second line of the accompanying table provides information about hypothetical account values and hypothetical expenses based on the Fund's actual expense ratio and an assumed rate of return of 5% per year before expenses, which is not the Fund's actual return. The hypothetical account values and expenses may not be used to estimate the actual ending account balance or expenses you paid for the period. You may use this information to compare the ongoing costs of investing in the Fund and other funds. To do so, compare this 5% hypothetical example with the 5% hypothetical examples that appear in the shareholder reports of the other funds. In addition, the Fund, as a shareholder in the underlying Fidelity Central Funds, will indirectly bear its pro-rata share of the fees and expenses incurred by the underlying Fidelity Central Funds. These fees and expenses are not included in the Fund's annualized expense ratio used to calculate the expense estimate in the table below.
Please note that the expenses shown in the table are meant to highlight your ongoing costs only and do not reflect any transaction costs. Therefore, the second line of the table is useful in comparing ongoing costs only, and will not help you determine the relative total costs of owning different funds.
Annual Report
Shareholder Expense Example - continued
| Annualized Expense Ratio | Beginning
Account Value | Ending
Account Value
December 31, 2012 | Expenses Paid
During Period |
Actual | 1.18% | $ 1,000.00 | $ 1,005.40 | $ .84 A |
Hypothetical (5% return per year before expenses) | | $ 1,000.00 | $ 1,019.20 | $ 5.99 B |
A Actual expenses are equal to the Fund's annualized expense ratio, multiplied by the average account value over the period, multiplied by 26/366 (to reflect the period December 6, 2012 to December 31, 2012).
B Hypothetical expenses are equal to the Fund's annualized expense ratio, multiplied by the average account value over the period, multiplied by 184/366 (to reflect the one-half year period).
Annual Report
Investment Summary (Unaudited)
Top Ten Stocks as of December 31, 2012 |
| % of fund's
net assets |
Google, Inc. Class A | 4.9 |
Facebook, Inc. Class A | 4.8 |
Apple, Inc. | 4.4 |
Gilead Sciences, Inc. | 3.9 |
MasterCard, Inc. Class A | 3.6 |
Berkshire Hathaway, Inc. Class A | 3.1 |
EOG Resources, Inc. | 3.1 |
Amazon.com, Inc. | 3.0 |
Biogen Idec, Inc. | 2.4 |
Intuitive Surgical, Inc. | 1.8 |
| 35.0 |
Top Five Market Sectors as of December 31, 2012 |
| % of fund's
net assets |
Information Technology | 33.5 |
Health Care | 17.3 |
Consumer Discretionary | 16.3 |
Financials | 8.4 |
Industrials | 6.3 |
Asset Allocation (% of fund's net assets) |
As of December 31, 2012* | |
 | Stocks 98.0% | |  | | |
 | Convertible
Securities 0.2% | | | | |
 | Short-Term
Investments and
Net Other Assets (Liabilities) 1.8% | | | | |
* Foreign investments | 9.2% | | | | |

Annual Report
Investments December 31, 2012
Showing Percentage of Net Assets
Common Stocks - 98.0% |
| Shares | | Value |
CONSUMER DISCRETIONARY - 16.3% |
Hotels, Restaurants & Leisure - 1.8% |
Chipotle Mexican Grill, Inc. (a) | 8,900 | | $ 2,647,394 |
Panera Bread Co. Class A (a) | 15,100 | | 2,398,333 |
Starbucks Corp. | 66,700 | | 3,576,454 |
| | 8,622,181 |
Household Durables - 0.8% |
Lennar Corp. Class A | 97,600 | | 3,774,192 |
Internet & Catalog Retail - 4.7% |
Amazon.com, Inc. (a) | 56,500 | | 14,189,410 |
priceline.com, Inc. (a) | 7,200 | | 4,472,640 |
TripAdvisor, Inc. | 92,800 | | 3,893,888 |
| | 22,555,938 |
Leisure Equipment & Products - 1.0% |
Polaris Industries, Inc. | 59,600 | | 5,015,340 |
Media - 3.6% |
Comcast Corp. Class A | 128,800 | | 4,814,544 |
Discovery Communications, Inc. (a) | 39,100 | | 2,482,068 |
Liberty Global, Inc. Class A (a) | 79,500 | | 5,007,705 |
Liberty Media Corp. Capital Series A (a) | 43,600 | | 5,058,036 |
| | 17,362,353 |
Specialty Retail - 2.9% |
Foot Locker, Inc. | 67,700 | | 2,174,524 |
Home Depot, Inc. | 74,000 | | 4,576,900 |
PetSmart, Inc. | 33,900 | | 2,316,726 |
TJX Companies, Inc. | 54,900 | | 2,330,505 |
Urban Outfitters, Inc. (a) | 63,900 | | 2,515,104 |
| | 13,913,759 |
Textiles, Apparel & Luxury Goods - 1.5% |
lululemon athletica, Inc. (a) | 32,900 | | 2,507,967 |
Michael Kors Holdings Ltd. | 46,200 | | 2,357,586 |
NIKE, Inc. Class B | 48,400 | | 2,497,440 |
| | 7,362,993 |
TOTAL CONSUMER DISCRETIONARY | | 78,606,756 |
CONSUMER STAPLES - 5.8% |
Beverages - 1.7% |
Anheuser-Busch InBev SA NV ADR | 27,200 | | 2,377,552 |
Common Stocks - continued |
| Shares | | Value |
CONSUMER STAPLES - continued |
Beverages - continued |
Boston Beer Co., Inc. Class A (a) | 16,531 | | $ 2,222,593 |
The Coca-Cola Co. | 94,900 | | 3,440,125 |
| | 8,040,270 |
Food & Staples Retailing - 1.9% |
Costco Wholesale Corp. | 48,400 | | 4,780,468 |
Wal-Mart Stores, Inc. | 66,000 | | 4,503,180 |
| | 9,283,648 |
Food Products - 0.5% |
Associated British Foods PLC | 100,300 | | 2,562,498 |
Household Products - 0.7% |
Colgate-Palmolive Co. | 33,000 | | 3,449,820 |
Personal Products - 1.0% |
Estee Lauder Companies, Inc. Class A | 78,700 | | 4,710,982 |
TOTAL CONSUMER STAPLES | | 28,047,218 |
ENERGY - 5.1% |
Oil, Gas & Consumable Fuels - 5.1% |
EOG Resources, Inc. | 122,000 | | 14,736,380 |
Murphy Oil Corp. | 85,200 | | 5,073,660 |
Phillips 66 | 91,200 | | 4,842,720 |
| | 24,652,760 |
FINANCIALS - 8.4% |
Commercial Banks - 2.3% |
HDFC Bank Ltd. sponsored ADR | 56,500 | | 2,300,680 |
M&T Bank Corp. | 36,700 | | 3,613,849 |
Wells Fargo & Co. | 143,600 | | 4,908,248 |
| | 10,822,777 |
Insurance - 5.0% |
ACE Ltd. | 29,500 | | 2,354,100 |
Berkshire Hathaway, Inc. Class A (a) | 111 | | 14,880,660 |
Marsh & McLennan Companies, Inc. | 68,000 | | 2,343,960 |
The Chubb Corp. | 30,800 | | 2,319,856 |
The Travelers Companies, Inc. | 32,500 | | 2,334,150 |
| | 24,232,726 |
Real Estate Investment Trusts - 0.5% |
American Tower Corp. | 31,600 | | 2,441,732 |
Common Stocks - continued |
| Shares | | Value |
FINANCIALS - continued |
Real Estate Management & Development - 0.6% |
Realogy Holdings Corp. | 63,300 | | $ 2,656,068 |
TOTAL FINANCIALS | | 40,153,303 |
HEALTH CARE - 17.1% |
Biotechnology - 9.6% |
Alexion Pharmaceuticals, Inc. (a) | 26,100 | | 2,448,441 |
Amgen, Inc. | 81,000 | | 6,991,920 |
Biogen Idec, Inc. (a) | 78,800 | | 11,557,596 |
Gilead Sciences, Inc. (a) | 258,200 | | 18,964,790 |
Onyx Pharmaceuticals, Inc. (a) | 25,000 | | 1,888,250 |
Regeneron Pharmaceuticals, Inc. (a) | 26,400 | | 4,516,248 |
| | 46,367,245 |
Health Care Equipment & Supplies - 3.3% |
Baxter International, Inc. | 73,300 | | 4,886,178 |
Covidien PLC | 41,000 | | 2,367,340 |
Intuitive Surgical, Inc. (a) | 17,340 | | 8,503,016 |
| | 15,756,534 |
Health Care Providers & Services - 1.7% |
Catamaran Corp. (a) | 48,300 | | 2,275,413 |
DaVita, Inc. (a) | 33,600 | | 3,713,808 |
Henry Schein, Inc. (a) | 29,900 | | 2,405,754 |
| | 8,394,975 |
Health Care Technology - 0.5% |
Cerner Corp. (a) | 30,500 | | 2,368,020 |
Life Sciences Tools & Services - 1.0% |
Mettler-Toledo International, Inc. (a) | 11,955 | | 2,310,902 |
Waters Corp. (a) | 27,900 | | 2,430,648 |
| | 4,741,550 |
Pharmaceuticals - 1.0% |
Mylan, Inc. (a) | 87,600 | | 2,407,248 |
Novo Nordisk A/S Series B sponsored ADR | 14,800 | | 2,415,508 |
| | 4,822,756 |
TOTAL HEALTH CARE | | 82,451,080 |
INDUSTRIALS - 6.3% |
Building Products - 0.5% |
Fortune Brands Home & Security, Inc. (a) | 82,400 | | 2,407,728 |
Common Stocks - continued |
| Shares | | Value |
INDUSTRIALS - continued |
Electrical Equipment - 1.0% |
Generac Holdings, Inc. | 72,400 | | $ 2,484,044 |
Roper Industries, Inc. | 21,400 | | 2,385,672 |
| | 4,869,716 |
Industrial Conglomerates - 0.5% |
Danaher Corp. | 44,600 | | 2,493,140 |
Machinery - 0.8% |
Deere & Co. | 41,900 | | 3,620,998 |
Professional Services - 1.0% |
Verisk Analytics, Inc. (a) | 96,400 | | 4,916,400 |
Road & Rail - 2.5% |
Canadian Pacific | 48,300 | | 4,899,437 |
Hertz Global Holdings, Inc. (a) | 148,200 | | 2,411,214 |
Union Pacific Corp. | 38,500 | | 4,840,220 |
| | 12,150,871 |
TOTAL INDUSTRIALS | | 30,458,853 |
INFORMATION TECHNOLOGY - 33.5% |
Communications Equipment - 0.5% |
Motorola Solutions, Inc. | 43,700 | | 2,433,216 |
Computers & Peripherals - 5.8% |
3D Systems Corp. (a) | 52,300 | | 2,790,205 |
Apple, Inc. | 40,300 | | 21,481,109 |
Stratasys Ltd. (a) | 49,100 | | 3,935,365 |
| | 28,206,679 |
Electronic Equipment & Components - 0.5% |
Amphenol Corp. Class A | 38,700 | | 2,503,890 |
Internet Software & Services - 14.1% |
eBay, Inc. (a) | 69,200 | | 3,530,584 |
Facebook, Inc. Class A | 867,400 | | 23,098,862 |
Google, Inc. Class A (a) | 33,100 | | 23,480,146 |
LinkedIn Corp. (a) | 43,500 | | 4,994,670 |
Rackspace Hosting, Inc. (a) | 70,900 | | 5,265,743 |
Yahoo!, Inc. (a) | 372,600 | | 7,414,740 |
| | 67,784,745 |
IT Services - 6.8% |
Accenture PLC Class A | 51,500 | | 3,424,750 |
Alliance Data Systems Corp. (a) | 200 | | 28,952 |
Fidelity National Information Services, Inc. | 132,000 | | 4,594,920 |
Common Stocks - continued |
| Shares | | Value |
INFORMATION TECHNOLOGY - continued |
IT Services - continued |
MasterCard, Inc. Class A | 35,100 | | $ 17,243,928 |
Visa, Inc. Class A | 48,200 | | 7,306,156 |
| | 32,598,706 |
Semiconductors & Semiconductor Equipment - 2.6% |
ARM Holdings PLC sponsored ADR | 130,900 | | 4,951,947 |
ASML Holding NV | 37,600 | | 2,421,816 |
Samsung Electronics Co. Ltd. | 3,485 | | 5,039,897 |
| | 12,413,660 |
Software - 3.2% |
CommVault Systems, Inc. (a) | 72,200 | | 5,033,062 |
Concur Technologies, Inc. (a) | 38,600 | | 2,606,272 |
NetSuite, Inc. (a) | 40,100 | | 2,698,730 |
ServiceNow, Inc. | 81,400 | | 2,444,442 |
Ultimate Software Group, Inc. (a) | 25,900 | | 2,445,219 |
| | 15,227,725 |
TOTAL INFORMATION TECHNOLOGY | | 161,168,621 |
MATERIALS - 5.5% |
Chemicals - 4.4% |
Ecolab, Inc. | 65,600 | | 4,716,640 |
Monsanto Co. | 78,900 | | 7,467,885 |
PPG Industries, Inc. | 29,500 | | 3,992,825 |
Sherwin-Williams Co. | 32,000 | | 4,922,240 |
| | 21,099,590 |
Containers & Packaging - 0.5% |
Ball Corp. | 54,000 | | 2,416,500 |
Metals & Mining - 0.6% |
Franco-Nevada Corp. | 52,300 | | 2,985,417 |
TOTAL MATERIALS | | 26,501,507 |
TOTAL COMMON STOCKS (Cost $471,946,760) | 472,040,098 |
Convertible Preferred Stocks - 0.2% |
| Shares | | Value |
HEALTH CARE - 0.2% |
Health Care Equipment & Supplies - 0.2% |
Alere, Inc. 3.00% (Cost $728,086) | 3,700 | | $ 685,018 |
| |
Money Market Funds - 2.5% |
| | | |
Fidelity Cash Central Fund, 0.18% (b)
(Cost $12,206,885) | 12,206,885 | | 12,206,885 |
TOTAL INVESTMENT PORTFOLIO - 100.7% (Cost $484,881,731) | | 484,932,001 |
NET OTHER ASSETS (LIABILITIES) - (0.7)% | | (3,454,663) |
NET ASSETS - 100% | $ 481,477,338 |
Legend |
(a) Non-income producing |
(b) Affiliated fund that is available only to investment companies and other accounts managed by Fidelity Investments. The rate quoted is the annualized seven-day yield of the fund at period end. A complete unaudited listing of the fund's holdings as of its most recent quarter end is available upon request. In addition, each Fidelity Central Fund's financial statements, which are not covered by the Fund's Report of Independent Registered Public Accounting Firm, are available on the SEC's website or upon request. |
Affiliated Central Funds |
Information regarding fiscal year to date income earned by the Fund from investments in Fidelity Central Funds is as follows: |
Fund | Income earned |
Fidelity Cash Central Fund | $ 2,316 |
Other Information |
The following is a summary of the inputs used, as of December 31, 2012, involving the Fund's assets and liabilities carried at fair value. The inputs or methodology used for valuing securities may not be an indication of the risk associated with investing in those securities. For more information on valuation inputs, and their aggregation into the levels used in the table below, please refer to the Investment Valuation section in the accompanying Notes to Financial Statements. |
Valuation Inputs at Reporting Date: |
Description | Total | Level 1 | Level 2 | Level 3 |
Investments in Securities: | | | | |
Equities: | | | | |
Consumer Discretionary | $ 78,606,756 | $ 78,606,756 | $ - | $ - |
Consumer Staples | 28,047,218 | 25,484,720 | 2,562,498 | - |
Energy | 24,652,760 | 24,652,760 | - | - |
Financials | 40,153,303 | 40,153,303 | - | - |
Health Care | 83,136,098 | 83,136,098 | - | - |
Industrials | 30,458,853 | 30,458,853 | - | - |
Information Technology | 161,168,621 | 156,128,724 | 5,039,897 | - |
Materials | 26,501,507 | 26,501,507 | - | - |
Money Market Funds | 12,206,885 | 12,206,885 | - | - |
Total Investments in Securities: | $ 484,932,001 | $ 477,329,606 | $ 7,602,395 | $ - |
See accompanying notes which are an integral part of the financial statements.
Annual Report
Statement of Assets and Liabilities
| December 31, 2012 |
| | |
Assets | | |
Investment in securities, at value - See accompanying schedule: Unaffiliated issuers (cost $472,674,846) | $ 472,725,116 | |
Fidelity Central Funds (cost $12,206,885) | 12,206,885 | |
Total Investments (cost $484,881,731) | | $ 484,932,001 |
Foreign currency held at value (cost $5,033) | | 5,017 |
Receivable for investments sold | | 192,894 |
Receivable for fund shares sold | | 10,510 |
Dividends receivable | | 103,990 |
Distributions receivable from Fidelity Central Funds | | 2,316 |
Other receivables | | 3,816 |
Total assets | | 485,250,544 |
| | |
Liabilities | | |
Payable to custodian bank | $ 256,500 | |
Payable for investments purchased | 7,657 | |
Payable for fund shares redeemed | 3,151,299 | |
Accrued management fee | 168,269 | |
Other affiliated payables | 71,612 | |
Other payables and accrued expenses | 117,869 | |
Total liabilities | | 3,773,206 |
| | |
Net Assets | | $ 481,477,338 |
Net Assets consist of: | | |
Paid in capital | | $ 479,113,108 |
Accumulated undistributed net realized gain (loss) on investments and foreign currency transactions | | 2,313,868 |
Net unrealized appreciation (depreciation) on investments and assets and liabilities in foreign currencies | | 50,362 |
Net Assets, for 47,912,758 shares outstanding | | $ 481,477,338 |
Net Asset Value, offering price and redemption price per share ($481,477,338 ÷ 47,912,758 shares) | | $ 10.05 |
See accompanying notes which are an integral part of the financial statements.
Annual Report
Statement of Operations
For the period December 6, 2012
(commencement of operations)
to December 31, 2012 |
| | |
Investment Income | | |
Dividends | | $ 363,008 |
Interest | | 11 |
Income from Fidelity Central Funds | | 2,316 |
Total income | | 365,335 |
| | |
Expenses | | |
Management fee | $ 168,269 | |
Transfer agent fees | 59,837 | |
Accounting fees and expenses | 11,775 | |
Custodian fees and expenses | 24,040 | |
Registration fees | 57,249 | |
Audit | 36,579 | |
Total expenses before reductions | 357,749 | |
Expense reductions | (3,816) | 353,933 |
Net investment income (loss) | | 11,402 |
Realized and Unrealized Gain (Loss) Net realized gain (loss) on: | | |
Investment securities: | | |
Unaffiliated issuers | 2,489,493 | |
Foreign currency transactions | 5,797 | |
Total net realized gain (loss) | | 2,495,290 |
Change in net unrealized appreciation (depreciation) on: Investment securities | 50,270 | |
Assets and liabilities in foreign currencies | 92 | |
Total change in net unrealized appreciation (depreciation) | | 50,362 |
Net gain (loss) | | 2,545,652 |
Net increase (decrease) in net assets resulting from operations | | $ 2,557,054 |
See accompanying notes which are an integral part of the financial statements.
Annual Report
Financial Statements - continued
Statement of Changes in Net Assets
| For the period
December 6, 2012
(commencement of operations) to
December 31, 2012 |
Increase (Decrease) in Net Assets | |
Operations | |
Net investment income (loss) | $ 11,402 |
Net realized gain (loss) | 2,495,290 |
Change in net unrealized appreciation (depreciation) | 50,362 |
Net increase (decrease) in net assets resulting
from operations | 2,557,054 |
Distributions to shareholders from net investment income | (192,824) |
Share transactions
Proceeds from sales of shares | 482,071,583 |
Reinvestment of distributions | 192,824 |
Cost of shares redeemed | (3,151,299) |
Net increase (decrease) in net assets resulting from share transactions | 479,113,108 |
Total increase (decrease) in net assets | 481,477,338 |
| |
Net Assets | |
Beginning of period | - |
End of period | $ 481,477,338 |
Other Information Shares | |
Sold | 48,207,153 |
Issued in reinvestment of distributions | 19,167 |
Redeemed | (313,562) |
Net increase (decrease) | 47,912,758 |
See accompanying notes which are an integral part of the financial statements.
Annual Report
Financial Highlights
Period ended December 31, | 2012 G |
Selected Per-Share Data | |
Net asset value, beginning of period | $ 10.00 |
Income from Investment Operations | |
Net investment (loss) D | - I |
Net realized and unrealized gain (loss) | .05 |
Total from investment operations | .05 |
Distributions from net investment income | - I |
Net asset value, end of period | $ 10.05 |
Total Return B,C | .54% |
Ratios to Average Net Assets E,H | |
Expenses before reductions | 1.18% A |
Expenses net of fee waivers, if any | 1.18% A |
Expenses net of all reductions | 1.17% A |
Net investment income (loss) | .04% A |
Supplemental Data | |
Net assets, end of period (000 omitted) | $ 481,477 |
Portfolio turnover rate F | 68% J |
A Annualized
B Total returns for periods of less than one year are not annualized.
C Total returns would have been lower if certain expenses had not been reduced during the applicable periods shown.
D Calculated based on average shares outstanding during the period.
E Fees and expenses of any underlying Fidelity Central Funds are not included in the Fund's expense ratio. The Fund indirectly bears its proportionate share of the expenses of any underlying Fidelity Central Funds.
F Amount does not include the portfolio activity of any underlying Fidelity Central Funds.
G For the period December 6, 2012 (commencement of operations) to December 31, 2012.
H Expense ratios reflect operating expenses of the Fund. Expenses before reductions do not reflect amounts reimbursed by the investment adviser or reductions from brokerage service arrangements or reductions from other expense offset arrangements and do not represent the amount paid by the Fund during periods when reimbursements or reductions occur. Expense ratios before reductions for start-up periods may not be representative of longer term operating periods. Expenses net of fee waivers reflect expenses after reimbursement by the investment adviser but prior to reductions from brokerage service arrangements or other expense offset arrangements. Expenses net of all reductions represent the net expenses paid by the Fund.
I Amount represents less than $.01 per share.
J Amount not annualized.
See accompanying notes which are an integral part of the financial statements.
Annual Report
Notes to Financial Statements
For the period ended December 31, 2012
1. Organization.
Fidelity® Advisor Series Opportunistic Insights Fund (the Fund) is a fund of Fidelity Contrafund (the Trust) and is authorized to issue an unlimited number of shares. Shares of the Fund are only available for purchase by mutual funds for which Fidelity Management & Research Company (FMR) or an affiliate serves as an investment manager. The Trust is registered under the Investment Company Act of 1940, as amended (the 1940 Act), as an open-end management investment company organized as a Massachusetts business trust.
2. Investments in Fidelity Central Funds.
The Fund invests in Fidelity Central Funds, which are open-end investment companies available only to other investment companies and accounts managed by FMR and its affiliates. The Fund's Schedule of Investments lists each of the Fidelity Central Funds held as of period end, if any, as an investment of the Fund, but does not include the underlying holdings of each Fidelity Central Fund. As an Investing Fund, the Fund indirectly bears its proportionate share of the expenses of the underlying Fidelity Central Funds.
The Money Market Central Funds seek preservation of capital and current income and are managed by Fidelity Investments Money Management, Inc. (FIMM), an affiliate of FMR.
A complete unaudited list of holdings for each Fidelity Central Fund is available upon request or at the Securities and Exchange Commission (the SEC) website at www.sec.gov. In addition, the financial statements of the Fidelity Central Funds, which are not covered by the Fund's Report of Independent Registered Public Accounting Firm, are available on the SEC website or upon request.
3. Significant Accounting Policies.
The financial statements have been prepared in conformity with accounting principles generally accepted in the United States of America (GAAP), which require management to make certain estimates and assumptions at the date of the financial statements. Actual results could differ from those estimates. Subsequent events, if any, through the date that the financial statements were issued have been evaluated in the preparation of the financial statements. The following summarizes the significant accounting policies of the Fund:
Investment Valuation. Investments are valued as of 4:00 p.m. Eastern time on the last calendar day of the period. In accordance with valuation policies and procedures approved by the Board of Trustees (the Board), the Fund attempts to obtain prices from one or more third party pricing vendors or brokers to value its investments. When current market prices, quotations or rates are not readily available or reliable, investments will be fair valued in good faith by the FMR Fair Value Committee (the
Annual Report
3. Significant Accounting Policies - continued
Investment Valuation - continued
Committee), in accordance with procedures adopted by the Fund's Board. Factors used in determining fair value vary by investment type and may include market or investment specific events. The frequency with which these procedures are used cannot be predicted and they may be utilized to a significant extent. The Committee oversees the Fund's valuation policies and procedures and is responsible for approving and reporting to the Board all fair value determinations.
The Fund categorizes the inputs to valuation techniques used to value its investments into a disclosure hierarchy consisting of three levels as shown below:
Level 1 - quoted prices in active markets for identical investments
Level 2 - other significant observable inputs (including quoted prices for similar investments, interest rates, prepayment speeds, etc.)
Level 3 - unobservable inputs (including the Fund's own assumptions based on the best information available)
Valuation techniques used to value the Fund's investments by major category are as follows:
Equity securities, including restricted securities, for which market quotations are readily available, are valued at the last reported sale price or official closing price as reported by a third party pricing vendor on the primary market or exchange on which they are traded and are categorized as Level 1 in the hierarchy. In the event there were no sales during the day or closing prices are not available, securities are valued at the last quoted bid price or may be valued using the last available price and are generally categorized as Level 2 in the hierarchy. For foreign equity securities, when significant market or security specific events arise, comparisons to the valuation of American Depositary Receipts (ADRs), futures contracts, Exchange-Traded Funds (ETFs) and certain indexes as well as quoted prices for similar securities are used and are categorized as Level 2 in the hierarchy. Utilizing these techniques may result in transfers between Level 1 and Level 2.
Investments in open-end mutual funds, including the Fidelity Central Funds, are valued at their closing net asset value (NAV) each business day and are categorized as Level 1 in the hierarchy.
Changes in valuation techniques may result in transfers in or out of an assigned level within the disclosure hierarchy. The aggregate value of investments by input level, as of December 31, 2012, is included at the end of the Fund's Schedule of Investments.
Annual Report
Notes to Financial Statements - continued
3. Significant Accounting Policies - continued
Foreign Currency. The Fund may use foreign currency contracts to facilitate transactions in foreign-denominated securities. Gains and losses from these transactions may arise from changes in the value of the foreign currency or if the counterparties do not perform under the contracts' terms.
Foreign-denominated assets, including investment securities, and liabilities are translated into U.S. dollars at the exchange rates at period end. Purchases and sales of investment securities, income and dividends received and expenses denominated in foreign currencies are translated into U.S. dollars at the exchange rate in effect on the transaction date.
The effects of exchange rate fluctuations on investments are included with the net realized and unrealized gain (loss) on investment securities. Other foreign currency transactions resulting in realized and unrealized gain (loss) are disclosed separately.
Investment Transactions and Income. For financial reporting purposes, the Fund's investment holdings and NAV include trades executed through the end of the last business day of the period. The NAV per share for processing shareholder transactions is calculated as of the close of business of the New York Stock Exchange (NYSE), normally 4:00 p.m. Eastern time and includes trades executed through the end of the prior business day. Gains and losses on securities sold are determined on the basis of identified cost. Dividend income is recorded on the ex-dividend date, except for certain dividends from foreign securities where the ex-dividend date may have passed, which are recorded as soon as the Fund is informed of the ex-dividend date. Non-cash dividends included in dividend income, if any, are recorded at the fair market value of the securities received. Distributions received on securities that represent a return of capital or capital gain are recorded as a reduction of cost of investments and/or as a realized gain. The Fund estimates the components of distributions received that may be considered return of capital distributions or capital gain distributions. Interest income and distributions from the Fidelity Central Funds are accrued as earned. Interest income includes coupon interest and amortization of premium and accretion of discount on debt securities. Investment income is recorded net of foreign taxes withheld where recovery of such taxes is uncertain.
Expenses. Expenses directly attributable to a fund are charged to that fund. Expenses attributable to more than one fund are allocated among the respective funds on the basis of relative net assets or other appropriate methods. Expense estimates are accrued in the period to which they relate and adjustments are made when actual amounts are known.
Annual Report
3. Significant Accounting Policies - continued
Income Tax Information and Distributions to Shareholders. Each year, the Fund intends to qualify as a regulated investment company under Subchapter M of the Internal Revenue Code, including distributing substantially all of its taxable income and realized gains. As a result, no provision for income taxes is required. As of December 31, 2012, the Fund did not have any unrecognized tax benefits in the financial statements; nor is the Fund aware of any tax positions for which it is reasonably possible that the total amounts of unrecognized tax benefits will significantly change in the next twelve months. The Fund files a U.S. federal tax return, in addition to state and local tax returns as required. A fund's federal income tax returns are subject to examination by the Internal Revenue Service (IRS) for a period of three fiscal years after they are filed. State and local tax returns may be subject to examination for an additional fiscal year depending on the jurisdiction. Foreign taxes are provided for based on the Fund's understanding of the tax rules and rates that exist in the foreign markets in which it invests.
Distributions are declared and recorded on the ex-dividend date. Income and capital gain distributions are determined in accordance with income tax regulations, which may differ from GAAP.
Capital accounts within the financial statements are adjusted for permanent book-tax differences. These adjustments have no impact on net assets or the results of operations. Temporary book-tax differences will reverse in a subsequent period.
Book-tax differences are primarily due to foreign currency transactions, passive foreign investment companies (PFIC), equity-debt classifications and losses deferred due to wash sales.
The federal tax cost of investment securities and unrealized appreciation (depreciation) as of period end were as follows:
Gross unrealized appreciation | $ 6,228,770 |
Gross unrealized depreciation | (6,286,755) |
Net unrealized appreciation (depreciation) on securities and other investments | $ (57,985) |
| |
Tax Cost | $ 484,989,986 |
The tax-based components of distributable earnings as of period end were as follows:
Undistributed ordinary income | $ 2,422,122 |
Net unrealized appreciation (depreciation) | $ (57,893) |
The tax character of distributions paid was as follows:
| December 31, 2012 |
Ordinary Income | $ 192,824 |
Annual Report
Notes to Financial Statements - continued
4. Purchases and Sales of Investments.
Purchases and sales of securities, other than short-term securities, aggregated $785,374,328 and $315,178,987, respectively.
5. Fees and Other Transactions with Affiliates.
Management Fee. FMR and its affiliates provide the Fund with investment management related services for which the Fund pays a monthly management fee. The management fee is the sum of an individual fund fee rate that is based on an annual rate of .30% of the Fund's average net assets and an annualized group fee rate that averaged .26% during the period. The group fee rate is based upon the average net assets of all the mutual funds advised by FMR. The group fee rate decreases as assets under management increase and increases as assets under management decrease. In addition, the management fee is subject to a performance adjustment (up to a maximum of ± .20% of the Fund's average net assets over a 36 month performance period). The upward or downward adjustment to the management fee is based on the Fund's relative investment performance as compared to an appropriate benchmark index. The Fund's performance adjustment will not take effect until December 1, 2013. Subsequent months will be added until the performance period includes 36 months. For the period, the total annualized management fee rate was ..56% of the Fund's average net assets.
Transfer Agent Fees. Fidelity Investments Institutional Operations Company, Inc. (FIIOC), an affiliate of FMR, is the Fund's transfer, dividend disbursing and shareholder servicing agent. FIIOC receives account fees and asset-based fees that vary according to account size and type of account. FIIOC pays for typesetting, printing and mailing of shareholder reports, except proxy statements. For the period, the transfer agent fees were equivalent to an annualized rate of .20% of average net assets.
Accounting Fees. Fidelity Service Company, Inc.(FSC), an affiliate of FMR, maintains the Fund's accounting records. The fee is based on the level of average net assets for each month.
Brokerage Commissions. The Fund placed a portion of its portfolio transactions with brokerage firms which are affiliates of the investment adviser. The commissions paid to these affiliated firms were $6,335 for the period.
Exchanges In-Kind. During the period, certain investment companies managed by FMR or its affiliates (Investing Funds) completed exchanges in-kind with the Fund. The Investing Funds delivered cash and securities valued at $482,061,053 in exchange for 48,206,105 shares of the Fund. The amount of in-kind exchanges is included in share transactions in the accompanying Statement of Changes in Net Assets. The Fund recognized no gain or loss for federal income tax purposes.
Annual Report
6. Expense Reductions.
Many of the brokers with whom FMR places trades on behalf of the Fund provided services to the Fund in addition to trade execution. These services included payments of certain expenses on behalf of the Fund totaling $3,816 for the period.
7. Other.
The Fund's organizational documents provide former and current trustees and officers with a limited indemnification against liabilities arising in connection with the performance of their duties to the Fund. In the normal course of business, the Fund may also enter into contracts that provide general indemnifications. The Fund's maximum exposure under these arrangements is unknown as this would be dependent on future claims that may be made against the Fund. The risk of material loss from such claims is considered remote.
At the end of the period, mutual funds managed by FMR or an FMR affiliate were the owners of record of all of the outstanding shares of the Funds.
Annual Report
To the Trustees of Fidelity Contrafund and the Shareholders of Fidelity Advisor Series Opportunistic Insights Fund:
In our opinion, the accompanying statement of assets and liabilities, including the schedule of investments, and the related statements of operations and of changes in net assets and the financial highlights present fairly, in all material respects, the financial position of Fidelity Advisor Series Opportunistic Insights Fund (a fund of Fidelity Contrafund) at December 31, 2012 and the results of its operations, the changes in its net assets and the financial highlights for the period indicated, in conformity with accounting principles generally accepted in the United States of America. These financial statements and financial highlights (hereafter referred to as "financial statements") are the responsibility of the Fidelity Advisor Series Opportunistic Insights Fund's management. Our responsibility is to express an opinion on these financial statements based on our audit. We conducted our audit of these financial statements in accordance with the standards of the Public Company Accounting Oversight Board (United States). Those standards require that we plan and perform the audit to obtain reasonable assurance about whether the financial statements are free of material misstatement. An audit includes examining, on a test basis, evidence supporting the amounts and disclosures in the financial statements, assessing the accounting principles used and significant estimates made by management, and evaluating the overall financial statement presentation. We believe that our audit, which included confirmation of securities at December 31, 2012 by correspondence with the custodian and brokers, provides a reasonable basis for our opinion.
PricewaterhouseCoopers LLP
Boston, Massachusetts
February 19, 2013
Annual Report
The Trustees, Members of the Advisory Board, and executive officers of the trust and fund, as applicable, are listed below. The Board of Trustees governs the fund and is responsible for protecting the interests of shareholders. The Trustees are experienced executives who meet periodically throughout the year to oversee the fund's activities, review contractual arrangements with companies that provide services to the fund, oversee management of the risks associated with such activities and contractual arrangements, and review the fund's performance. Except for James C. Curvey, each of the Trustees oversees 234 funds advised by FMR or an affiliate. Mr. Curvey oversees 452 funds advised by FMR or an affiliate.
The Trustees hold office without limit in time except that (a) any Trustee may resign; (b) any Trustee may be removed by written instrument, signed by at least two-thirds of the number of Trustees prior to such removal; (c) any Trustee who requests to be retired or who has become incapacitated by illness or injury may be retired by written instrument signed by a majority of the other Trustees; and (d) any Trustee may be removed at any special meeting of shareholders by a two-thirds vote of the outstanding voting securities of the trust. Each Trustee who is not an interested person (as defined in the 1940 Act) (Independent Trustee), shall retire not later than the last day of the calendar year in which his or her 75th birthday occurs. The Independent Trustees may waive this mandatory retirement age policy with respect to individual Trustees. The executive officers and Advisory Board Members hold office without limit in time, except that any officer and Advisory Board Member may resign or may be removed by a vote of a majority of the Trustees at any regular meeting or any special meeting of the Trustees. Except as indicated, each individual has held the office shown or other offices in the same company for the past five years.
Experience, Skills, Attributes, and Qualifications of the Fund's Trustees. The Governance and Nominating Committee has adopted a statement of policy that describes the experience, qualifications, attributes, and skills that are necessary and desirable for potential Independent Trustee candidates (Statement of Policy). The Board believes that each Trustee satisfied at the time he or she was initially elected or appointed a Trustee, and continues to satisfy, the standards contemplated by the Statement of Policy. The Governance and Nominating Committee also engages professional search firms to help identify potential Independent Trustee candidates who have the experience, qualifications, attributes, and skills consistent with the Statement of Policy. From time to time, additional criteria based on the composition and skills of the current Independent Trustees, as well as experience or skills that may be appropriate in light of future changes to board composition, business conditions, and regulatory or other developments, have also been considered by the professional search firms and the Governance and Nominating Committee. In addition, the Board takes into account the Trustees' commitment and participation in Board and committee meetings, as well as their leadership of standing and ad hoc committees throughout their tenure.
In determining that a particular Trustee was and continues to be qualified to serve as a Trustee, the Board has considered a variety of criteria, none of which, in isolation, was controlling. The Board believes that, collectively, the Trustees have balanced and diverse experience, qualifications, attributes, and skills, which allow the Board to operate effectively in governing the fund and protecting the interests of shareholders. Information about the specific experience, skills, attributes, and qualifications of each Trustee, which in each case led to the Board's conclusion that the Trustee should serve (or continue to serve) as a trustee of the fund, is provided below.
Annual Report
Trustees and Officers - continued
Board Structure and Oversight Function. James C. Curvey is an interested person (as defined in the 1940 Act) and currently serves as Chairman. The Trustees have determined that an interested Chairman is appropriate and benefits shareholders because an interested Chairman has a personal and professional stake in the quality and continuity of services provided to the fund. Independent Trustees exercise their informed business judgment to appoint an individual of their choosing to serve as Chairman, regardless of whether the Trustee happens to be independent or a member of management. The Independent Trustees have determined that they can act independently and effectively without having an Independent Trustee serve as Chairman and that a key structural component for assuring that they are in a position to do so is for the Independent Trustees to constitute a substantial majority for the Board. The Independent Trustees also regularly meet in executive session. Ned C. Lautenbach serves as Chairman of the Independent Trustees and as such (i) acts as a liaison between the Independent Trustees and management with respect to matters important to the Independent Trustees and (ii) with management prepares agendas for Board meetings.
Fidelity funds are overseen by different Boards of Trustees. The fund's Board oversees Fidelity's equity and high income funds and another Board oversees Fidelity's investment-grade bond, money market, and asset allocation funds. The asset allocation funds may invest in Fidelity funds overseen by the fund's Board. The use of separate Boards, each with its own committee structure, allows the Trustees of each group of Fidelity funds to focus on the unique issues of the funds they oversee, including common research, investment, and operational issues. On occasion, the separate Boards establish joint committees to address issues of overlapping consequences for the Fidelity funds overseen by each Board.
The Trustees operate using a system of committees to facilitate the timely and efficient consideration of all matters of importance to the Trustees, the fund, and fund shareholders and to facilitate compliance with legal and regulatory requirements and oversight of the fund's activities and associated risks. The Board, acting through its committees, has charged FMR and its affiliates with (i) identifying events or circumstances the occurrence of which could have demonstrably adverse effects on the fund's business and/or reputation; (ii) implementing processes and controls to lessen the possibility that such events or circumstances occur or to mitigate the effects of such events or circumstances if they do occur; and (iii) creating and maintaining a system designed to evaluate continuously business and market conditions in order to facilitate the identification and implementation processes described in (i) and (ii) above. Because the day-to-day operations and activities of the fund are carried out by or through FMR, its affiliates and other service providers, the fund's exposure to risks is mitigated but not eliminated by the processes overseen by the Trustees. While each of the Board's committees has responsibility for overseeing different aspects of the fund's activities, oversight is exercised primarily through the Operations, Audit, and Compliance Committees. In addition, the Independent Trustees have worked with FMR to enhance the Board's oversight of investment and financial risks, legal and regulatory risks, technology risks, and operational risks, including the development of additional risk reporting to the Board. For example, a working group comprised of Independent Trustees and FMR has worked and continues to work to review the Fidelity funds' valuation-related activities, reporting and risk management. Appropriate personnel, including but not limited to the fund's Chief Compliance Officer (CCO), FMR's internal auditor, the independent accountants, the fund's Treasurer and portfolio management personnel, make periodic reports to the Board's committees, as appropriate, including an annual review of FMR's risk management program for the Fidelity funds. The responsibilities of each standing committee, including their oversight responsibilities, are described further under "Standing Committees of the Fund's Trustees."
Annual Report
The fund's Statement of Additional Information (SAI) includes more information about the Trustees. To request a free copy, call Fidelity at 1-877-208-0098.
Interested Trustees*:
Correspondence intended for each Trustee who is an interested person may be sent to Fidelity Investments, 82 Devonshire Street, Boston, Massachusetts 02109.
Name, Age; Principal Occupations and Other Relevant Experience+ |
James C. Curvey (77) |
| Year of Election or Appointment: 2007 Mr. Curvey is Trustee and Chairman of the Board of Trustees of certain Trusts. Mr. Curvey also serves as Trustee (2007-present) of other investment companies advised by FMR. Mr. Curvey is a Director of Fidelity Investments Money Management, Inc. (2009-present), Director of Fidelity Research & Analysis Co. (2009-present) and Director of FMR and FMR Co., Inc. (2007-present). Mr. Curvey is also Vice Chairman (2007-present) and Director of FMR LLC. In addition, Mr. Curvey serves as an Overseer for the Boston Symphony Orchestra and a member of the Trustees of Villanova University. Previously, Mr. Curvey was the Vice Chairman (2006-2007) and Director (2000-2007) of FMR Corp. |
Ronald P. O'Hanley (55) |
| Year of Election or Appointment: 2011 Mr. O'Hanley is Director of FMR Co., Inc. (2010-present), Director of Fidelity Investments Money Management, Inc. (2010-present), Director of Fidelity Research & Analysis Company (2010-present), President of Fidelity Asset Management and Corporate Services and a member of Fidelity's Executive Committee (2010-present). Previously, Mr. O'Hanley served as President and Chief Executive Officer of BNY Mellon Asset Management (2007-2010). Mr. O'Hanley also served as Vice Chairman of Bank New York Mellon Corp. and a member of that firm's Executive Committee. Prior to the 2007 merger of The Bank of New York and Mellon Financial Corporation, he was Vice Chairman of Mellon Financial Corporation and President and Chief Executive Officer of Mellon Asset Management. He joined Mellon in February 1997. Mr. O'Hanley currently serves as Chairman of the Boston Public Library Foundation Board of Directors and sits on the Board of Directors of Beth Israel Deaconess Medical Center, the Board of Trustees of the Marine Biological Laboratory and the Advisory Board of the Maxwell School of Citizenship and Public Administration at Syracuse University. Mr. O'Hanley also chairs the Council on Asset Management for the Financial Services Roundtable and is a member of the Board of Directors of Institutional Investor's U.S. Institute. |
* Trustees have been determined to be "Interested Trustees" by virtue of, among other things, their affiliation with the trust or various entities under common control with FMR.
+ The information above includes each Trustee's principal occupation during the last five years and other information relating to the experience, attributes, and skills relevant to each Trustee's qualifications to serve as a Trustee, which led to the conclusion that each Trustee should serve as a Trustee for the fund.
Annual Report
Independent Trustees:
Correspondence intended for each Independent Trustee (that is, the Trustees other than the Interested Trustees) may be sent to Fidelity Investments, P.O. Box 55235, Boston, Massachusetts 02205-5235.
Name, Age; Principal Occupations and Other Relevant Experience+ |
Dennis J. Dirks (64) |
| Year of Election or Appointment: 2005 Prior to his retirement in May 2003, Mr. Dirks was Chief Operating Officer and a member of the Board of The Depository Trust & Clearing Corporation (DTCC). He also served as President, Chief Operating Officer, and Board member of The Depository Trust Company (DTC) and President and Board member of the National Securities Clearing Corporation (NSCC). In addition, Mr. Dirks served as Chief Executive Officer and Board member of the Government Securities Clearing Corporation, Chief Executive Officer and Board member of the Mortgage-Backed Securities Clearing Corporation, as a Trustee and a member of the Finance Committee of Manhattan College (2005-2008), and as a Trustee and a member of the Finance Committee of AHRC of Nassau County (2006-2008). Mr. Dirks is a member of the Independent Directors Council (IDC) Governing Council (2010-present) and Board of Directors for The Brookville Center for Children's Services, Inc. (2009-present). |
Alan J. Lacy (59) |
| Year of Election or Appointment: 2008 Mr. Lacy serves as Senior Adviser (2007-present) of Oak Hill Capital Partners, L.P. (private equity). Mr. Lacy also served as Chief Executive Officer (2000-2005) and Vice Chairman (2005-2006) of Sears Holdings Corporation and Sears, Roebuck and Co. (retail). In addition, Mr. Lacy serves as a member of the Board of Directors of Dave & Buster's Entertainment, Inc. (restaurant and entertainment complexes, 2010-present), Earth Fare, Inc. (retail grocery, 2012-present), The Hillman Companies, Inc. (hardware wholesalers, 2010-present), and Bristol-Myers Squibb Company (global pharmaceuticals, 2008-present). Mr. Lacy is a member of the Board of Trustees of The National Parks Conservation Association (2006-present). Previously, Mr. Lacy served as Chairman of the Board of Trustees of the National Parks Conservation Association (2008-2011) and as a member of the Board of Directors for the Western Union Company (global money transfer, 2006-2011). |
Ned C. Lautenbach (68) |
| Year of Election or Appointment: 2000 Mr. Lautenbach is Chairman of the Independent Trustees of the Equity and High Income Funds (2006-present). Mr. Lautenbach currently serves as the Lead Director of the Eaton Corporation Board of Directors (diversified industrial, 1997-present). Mr. Lautenbach is Chairman of the Board of Directors of the Philharmonic Center for the Arts in Naples, Florida (2012-present) and a member of the Council on Foreign Relations (1994-present). Previously, Mr. Lautenbach was a Partner/Advisory Partner at Clayton, Dubilier & Rice, LLC (private equity investment, 1998-2010), as well as a Director of Sony Corporation (2006-2007). |
Joseph Mauriello (68) |
| Year of Election or Appointment: 2008 Prior to his retirement in January 2006, Mr. Mauriello served in numerous senior management positions including Deputy Chairman and Chief Operating Officer (2004-2005), and Vice Chairman of Financial Services (2002-2004) of KPMG LLP US (professional services, 1965-2005). Mr. Mauriello currently serves as a member of the Board of Directors of XL Group plc. (global insurance and re-insurance, 2006-present). Previously, Mr. Mauriello served as a Director of the Hamilton Funds of the Bank of New York (2006-2007) and of Arcadia Resources Inc. (health care services and products, 2007-2012). |
Robert W. Selander (62) |
| Year of Election or Appointment: 2011 Previously, Mr. Selander served as a Member of the Advisory Board of Fidelity's Equity and High Income Funds (2011), Executive Vice Chairman (2010), Chief Executive Officer (2009-2010), and President and Chief Executive Officer (1997-2009) of Mastercard, Inc. |
Cornelia M. Small (68) |
| Year of Election or Appointment: 2005 Ms. Small is a member of the Board of Directors (2009-present) and Chair of the Investment Committee (2010-present) of the Teagle Foundation. Ms. Small also serves on the Investment Committee of the Berkshire Taconic Community Foundation (2008-present). Previously, Ms. Small served as Chairperson (2002-2008) and a member of the Investment Committee and Chairperson (2008-2012) and a member of the Board of Trustees of Smith College. In addition, Ms. Small served as Chief Investment Officer, Director of Global Equity Investments, and a member of the Board of Directors of Scudder, Stevens & Clark and Scudder Kemper Investments. |
William S. Stavropoulos (73) |
| Year of Election or Appointment: 2001 Mr. Stavropoulos is Vice Chairman of the Independent Trustees of the Equity and High Income Funds (2006-present). Mr. Stavropoulos serves as President and Founder of the Michigan Baseball Foundation, the Great Lakes Loons (2007-present). Mr. Stavropoulos is Chairman Emeritus of the Board of Directors of The Dow Chemical Company, where he previously served in numerous senior management positions, including President, CEO (1995-2000; 2002-2004), Chairman of the Executive Committee (2000-2006), and as a member of the Board of Directors (1990-2006). Currently, Mr. Stavropoulos is a Director of Univar Inc. (global distributor of commodity and specialty chemicals, Chairman from 2010-May 2012 and Lead Director from May 2012-present), Teradata Corporation (data warehousing and technology solutions, 2008-present), Maersk Inc. (industrial conglomerate), and Tyco International, Ltd. (multinational manufacturing and services, 2007-present), and a member of the Advisory Board for Metalmark Capital LLC (private equity investment, 2005-present). Mr. Stavropoulos is an operating advisor to Clayton, Dubilier & Rice, LLC (private equity investment). In addition, Mr. Stavropoulos is a member of the University of Notre Dame Advisory Council for the College of Science, a Trustee of the Rollin L. Gerstacker Foundation, and a Director of the Naples Philharmonic Center for the Arts. Previously, Mr. Stavropoulos served as a Director of Chemical Financial Corporation (bank holding company, 1993-2012). |
David M. Thomas (63) |
| Year of Election or Appointment: 2008 Previously, Mr. Thomas served as Executive Chairman (2005-2006) and Chairman and Chief Executive Officer (2000-2005) of IMS Health, Inc. (pharmaceutical and healthcare information solutions), and a Director of Fortune Brands, Inc. (consumer products, 2000-2011). In addition, Mr. Thomas serves as Non-Executive Chairman of the Board of Directors of Fortune Brands Home and Security (home and security products, 2011-present), and as a member of the Board of Directors of Interpublic Group of Companies, Inc. (marketing communication, 2004-present). |
Michael E. Wiley (62) |
| Year of Election or Appointment: 2008 Mr. Wiley also serves as a Director of Asia Pacific Exploration Consolidated (international oil and gas exploration and production, 2008-present). Mr. Wiley serves as a Director of Tesoro Corporation (independent oil refiner and marketer, 2005-present), and a Director of Bill Barrett Corporation (exploration and production, 2005-present). In addition, Mr. Wiley also serves as a Director of Post Oak Bank (privately-held bank, 2004-present). Previously, Mr. Wiley served as a member of the Board of Trustees of the University of Tulsa (2000-2006; 2007-2010), as a Senior Energy Advisor of Katzenbach Partners, LLC (consulting, 2006-2007), as an Advisory Director of Riverstone Holdings (private investment), Chairman, President, and CEO of Baker Hughes, Inc. (oilfield services, 2000-2004), and as Director of Spinnaker Exploration Company (exploration and production, 2001-2005). |
+ The information above includes each Trustee's principal occupation during the last five years and other information relating to the experience, attributes, and skills relevant to each Trustee's qualifications to serve as a Trustee, which led to the conclusion that each Trustee should serve as a Trustee for the fund.
Advisory Board Members and Executive Officers:
Correspondence intended for David A. Rosow and Garnett A. Smith may be sent to Fidelity Investments, P.O. Box 55235, Boston, Massachusetts 02205-5235. Correspondence intended for each executive officer and Peter S. Lynch may be sent to Fidelity Investments, 82 Devonshire Street, Boston, Massachusetts 02109.
Name, Age; Principal Occupation |
Peter S. Lynch (68) |
| Year of Election or Appointment: 2003 Member of the Advisory Board of Fidelity's Equity and High Income Funds. Mr. Lynch is Vice Chairman and a Director of FMR and FMR Co., Inc. In addition, Mr. Lynch serves as a Trustee of Boston College and as the Chairman of the Inner-City Scholarship Fund. Previously, Mr. Lynch served on the Special Olympics International Board of Directors (1997-2006). |
David A. Rosow (70) |
| Year of Election or Appointment: 2012 Member of the Advisory Board of Fidelity's Equity and High Income Funds. Chairman and Chief Executive Officer of International Golf Group, Inc. (golf course development, 1989-present). Previously, Mr. Rosow served as Chairman and Chief Executive Officer of Rosow & Company, Inc. (private investment company, 1989-2011), a Lead Director of Hudson United Bancorp (2001-2006) and as a Director of TD Banknorth (1996-2006). In addition, Mr. Rosow is a member (2008-present) and President (2009-present) of the Town Council of Palm Beach, Florida. |
Garnett A. Smith (65) |
| Year of Election or Appointment: 2012 Member of the Advisory Board of Fidelity's Equity and High Income Funds. Prior to Mr. Smith's retirement, he served as Chairman and Chief Executive Officer of Inbrand Corp. (manufacturer of personal absorbent products, 1990-1997). He also served as President (1986-1990) of Inbrand Corp. Prior to his employment with Inbrand Corp., he was employed by a retail fabric chain and North Carolina National Bank. In addition, Mr. Smith is a board member of the Jackson Hole Land Trust (2009-present). |
Kenneth B. Robins (43) |
| Year of Election or Appointment: 2008 President and Treasurer of Fidelity's Equity and High Income Funds. Mr. Robins also serves as President and Treasurer (2010-present) and Assistant Treasurer (2009-present) of other Fidelity funds and is an employee of Fidelity Investments (2004-present). Previously, Mr. Robins served as Deputy Treasurer of the Fidelity funds (2005-2008) and Treasurer and Chief Financial Officer of The North Carolina Capital Management Trust: Cash and Term Portfolios (2006-2008). |
Bruce T. Herring (47) |
| Year of Election or Appointment: 2006 Vice President of certain Equity Funds. Mr. Herring also serves as President of Fidelity Research & Analysis Company (2010-present), Chief Investment Officer and Director of Fidelity Management & Research (U.K.) Inc. (2010-present) and Group Chief Investment Officer of FMR. Previously, Mr. Herring served as Vice President (2005-2006) and Senior Vice President (2006-2007) of Fidelity Management & Research Company, Vice President of FMR Co., Inc. (2001-2007) and as a portfolio manager for Fidelity U.S. Equity Funds. |
Brian B. Hogan (48) |
| Year of Election or Appointment: 2009 Vice President of Equity and High Income Funds. Mr. Hogan also serves as President of FMR's Equity Division (2009-present). Previously, Mr. Hogan served as Senior Vice President, Equity Research of FMR (2006-2009) and as a portfolio manager. |
Scott C. Goebel (44) |
| Year of Election or Appointment: 2008 Secretary and Chief Legal Officer (CLO) of the Fidelity funds. Mr. Goebel also serves as Secretary of Fidelity Investments Money Management, Inc. (FIMM) (2010-present) and Fidelity Research and Analysis Company (FRAC) (2010-present); Secretary and CLO of The North Carolina Capital Management Trust: Cash and Term Portfolios (2008-present); General Counsel, Secretary, and Senior Vice President of FMR (2008-present) and FMR Co., Inc. (2008-present); employed by FMR LLC or an affiliate (2001-present); Chief Legal Officer of Fidelity Management & Research (Hong Kong) Limited (2008-present) and Assistant Secretary of Fidelity Management & Research (Japan) Inc. (2008-present), and Fidelity Management & Research (U.K.) Inc. (2008-present). Previously, Mr. Goebel served as Assistant Secretary of FIMM (2008-2010), FRAC (2008-2010), and the Funds (2007-2008) and as Vice President and Secretary of Fidelity Distributors Corporation (FDC) (2005-2007). |
William C. Coffey (43) |
| Year of Election or Appointment: 2009 Assistant Secretary of Fidelity's Equity and High Income Funds. Mr. Coffey also serves as Senior Vice President and Deputy General Counsel of FMR LLC (2010-present), and is an employee of Fidelity Investments. Previously, Mr. Coffey served as Vice President and Associate General Counsel of FMR LLC (2005-2009). |
Elizabeth Paige Baumann (44) |
| Year of Election or Appointment: 2012 Anti-Money Laundering (AML) Officer of the Fidelity funds. Ms. Baumann also serves as AML Officer of The North Carolina Capital Management Trust: Cash and Term Portfolios (2012-present), Chief AML Officer of FMR LLC (2012-present), and is an employee of Fidelity Investments. Previously, Ms. Baumann served as Vice President and Deputy Anti-Money Laundering Officer (2007-2012). |
Christine Reynolds (54) |
| Year of Election or Appointment: 2008 Chief Financial Officer of the Fidelity funds. Ms. Reynolds became President of Fidelity Pricing and Cash Management Services (FPCMS) in August 2008. Ms. Reynolds served as Chief Operating Officer of FPCMS (2007-2008). Previously, Ms. Reynolds served as President, Treasurer, and Anti-Money Laundering officer of the Fidelity funds (2004-2007). |
Joseph A. Hanlon (44) |
| Year of Election or Appointment: 2012 Chief Compliance Officer of Fidelity's Equity and High Income Funds. Mr. Hanlon serves as Compliance Officer of FMR, FMR Co., Inc., Fidelity Investments Money Management, Inc. (FIMM), Fidelity Research and Analysis Company (FRAC), Fidelity Management & Research (Japan) Inc., Fidelity Management & Research (U.K.) Inc., Fidelity Management & Research (Hong Kong), and Strategic Advisers, Inc. (2009-present), as Senior Vice President of the Fidelity Asset Management Division (2009-present), and is an employee of Fidelity Investments. |
Joseph F. Zambello (55) |
| Year of Election or Appointment: 2011 Deputy Treasurer of the Fidelity funds. Mr. Zambello is an employee of Fidelity Investments. Previously, Mr. Zambello served as Vice President of FMR's Program Management Group (2009-2011) and Vice President of the Transfer Agent Oversight Group (2005-2009). |
Adrien E. Deberghes (45) |
| Year of Election or Appointment: 2008 Deputy Treasurer of Fidelity's Equity and High Income Funds. Mr. Deberghes also serves as Vice President (2011-present) and Assistant Treasurer (2010-present) of other Fidelity funds, and is an employee of Fidelity Investments (2008-present). Previously, Mr. Deberghes served as Senior Vice President of Mutual Fund Administration at State Street Corporation (2007-2008), Senior Director of Mutual Fund Administration at Investors Bank & Trust (2005-2007), and Director of Finance for Dunkin' Brands (2000-2005). |
Stephen Sadoski (41) |
| Year of Election or Appointment: 2012 Deputy Treasurer of Fidelity's Equity and High Income Funds. Mr. Sadoski also serves as Deputy Treasurer of other Fidelity funds (2013-present) and is an employee of Fidelity Investments (2012-present). Previously, Mr. Sadoski served as Assistant Treasurer of Fidelity's Fixed Income and Asset Allocation Funds (2012-2013), an assistant chief accountant in the Division of Investment Management of the Securities and Exchange Commission (SEC) (2009-2012) and as a senior manager at Deloitte & Touche (1997-2009). |
Stacie Smith (38) |
| Year of Election or Appointment: 2013 Deputy Treasurer of Fidelity's Equity and High Income Funds. Ms. Smith is an employee of Fidelity Investments (2009-present). Previously, Ms. Smith served as Senior Audit Manager of Ernst & Young LLP (1996-2009). |
Stephanie J. Dorsey (43) |
| Year of Election or Appointment: 2010 Assistant Treasurer of Fidelity's Equity and High Income Funds. Ms. Dorsey also serves as President and Treasurer (2013-present) and Assistant Treasurer (2012-present) of other Fidelity funds and is an employee of Fidelity Investments (2008-present). Previously, Ms. Dorsey served as Deputy Treasurer of Fidelity's Fixed Income and Asset Allocation Funds (2008-2013), Treasurer (2004-2008) of the JPMorgan Mutual Funds and Vice President (2004-2008) of JPMorgan Chase Bank. |
John R. Hebble (54) |
| Year of Election or Appointment: 2009 Assistant Treasurer of Fidelity's Equity and High Income Funds. Mr. Hebble also serves as President (2011-present), Treasurer, and Chief Financial Officer of The North Carolina Capital Management Trust: Cash and Term Portfolios (2008-present) and is an employee of Fidelity Investments. Previously, Mr. Hebble served as President and Treasurer of Fidelity's Fixed Income and Asset Allocation Funds (2008-2013). |
Gary W. Ryan (54) |
| Year of Election or Appointment: 2005 Assistant Treasurer of the Fidelity funds. Mr. Ryan is an employee of Fidelity Investments. Previously, Mr. Ryan served as Vice President of Fund Reporting in Fidelity Pricing and Cash Management Services (FPCMS) (1999-2005). |
Jonathan Davis (44) |
| Year of Election or Appointment: 2010 Assistant Treasurer of the Fidelity funds. Mr. Davis is also Assistant Treasurer of Fidelity Rutland Square Trust II and Fidelity Commonwealth Trust II. Mr. Davis is an employee of Fidelity Investments. Previously, Mr. Davis served as Vice President and Associate General Counsel of FMR LLC (2003-2010). |
Annual Report
The Board of Trustees of Fidelity Advisor Series Opportunistic Insights Fund voted to pay to shareholders of record at the opening of business on record date, the following distributions per share derived from capital gains realized from sales of portfolio securities:
| Pay Date | Record Date | Capital Gains |
Fidelity Advisor Series
Opportunistic Insights Fund | 02/19/13 | 02/15/13 | $0.053 |
The fund designates 41% of the dividends distributed during the fiscal year as amounts which may be taken into account as a dividend for the purposes of the maximum rate under section 1(h)(11) of the Internal Revenue Code.
The fund designates 43% of the dividends distributed during the fiscal year as qualifying for the dividends-received deduction for corporate shareholders.
The fund will notify shareholders in January 2013 of amounts for use in preparing 2012 income tax returns.
Annual Report
Board Approval of Investment Advisory Contracts and Management Fees
Fidelity Advisor Series Opportunistic Insights Fund
On September 19, 2012, the Board of Trustees, including the Independent Trustees (together, the Board), voted to approve the management contract and sub-advisory agreements (together, the Advisory Contracts) for the fund. The Board, assisted by the advice of fund counsel and Independent Trustees' counsel, considered a broad range of information.
Nature, Extent, and Quality of Services Provided. The Board considered the staffing within the investment adviser, FMR, and the sub-advisers (together, the Investment Advisers), including the backgrounds of the fund's investment personnel, and also considered the fund's investment objective, strategies, and related investment philosophy. The Board considered the structure of the portfolio manager compensation program and whether this structure provides appropriate incentives to act in the best interests of the fund.
Resources Dedicated to Investment Management and Support Services. The Board and the Fund Oversight and Research Committees reviewed the general qualifications and capabilities of the Investment Advisers' investment staff, including its size, education, experience, and resources, as well as the Investment Advisers' approach to recruiting, training, managing, and compensating investment personnel. The Board also noted that FMR has continued to increase the resources devoted to non-U.S. offices, including expansion of Fidelity's global investment organization. The Board noted that Fidelity's analysts have extensive resources, tools and capabilities that allow them to conduct sophisticated quantitative and fundamental analysis, as well as credit analysis of issuers, counterparties and guarantors. The Board also believes that Fidelity's investment professionals have sufficient access to global information and data so as to provide competitive investment results over time, and that those professionals also have access to sophisticated tools that permit them to assess portfolio construction and risk and performance attribution characteristics continuously, as well as to transmit new information and research conclusions rapidly around the world. Additionally, in its deliberations, the Board considered the Investment Advisers' trading and risk management capabilities and resources, which are an integral part of the investment management process.
Shareholder and Administrative Services. The Board considered the nature, extent, quality, and cost of advisory, administrative, and shareholder services to be performed by the Investment Advisers and their affiliates under the Advisory Contracts and under separate agreements covering transfer agency, pricing and bookkeeping, and securities lending services for the fund. The Board also considered the nature and extent of the supervision of third party service providers, principally custodians and subcustodians.
The Board noted that the growth of fund assets over time across the complex allows Fidelity to reinvest in the development of services designed to enhance the value or convenience of the Fidelity funds as investment vehicles. These services include 24-hour access to account information and market information through telephone representatives and over the Internet, investor education materials and asset allocation tools, and the expanded availability of Fidelity Investor Centers.
Annual Report
Board Approval of Investment Advisory Contracts and
Management Fees - continued
Investment Performance. The fund is a new fund and therefore had no historical performance for the Board to review at the time it approved the fund's Advisory Contracts. The Board considered the Investment Advisers' strength in fundamental, research-driven Growth & Capital Appreciation selection, which the Board is familiar with through its supervision of other Fidelity funds that invest in such securities.
Based on its review, the Board concluded that the nature, extent, and quality of services to be provided to the fund under the Advisory Contracts should benefit the fund's shareholders.
Competitiveness of Management Fee and Total Expense Ratio. The Board considered the fund's proposed management fee and the projected total expense ratio of the fund in reviewing the Advisory Contracts. The Board noted that the fund's proposed management fee rate is lower than the median fee rate of funds with similar Lipper investment objective categories and comparable management fee characteristics. The Board also considered that the projected total expense ratios are comparable to those of similar classes and funds that Fidelity offers to shareholders.
Based on its review, the Board concluded that the fund's management fee and projected total expense ratio were reasonable in light of the services that the fund and its shareholders will receive and the other factors considered.
Costs of the Services and Profitability. The fund is a new fund and therefore no revenue, cost, or profitability data was available for the Board to review in respect of the fund at the time it approved the Advisory Contracts. In connection with its future renewal of the fund's Advisory Contracts, the Board will consider the revenues earned and the expenses incurred by Fidelity in conducting the business of developing, marketing, distributing, managing, administering and servicing the fund and its shareholders.
Economies of Scale. The Board will consider economies of scale when there is operating experience to permit assessment thereof. It noted that, notwithstanding the entrepreneurial risk associated with a new fund, the management fee was at a level normally associated, by comparison with competitors, with very high fund net assets, and Fidelity asserted to the Board that the level of the fee anticipated economies of scale at lower asset levels even before, if ever, economies of scale are achieved. The Board also noted that the fund and its shareholders would have access to the very considerable number and variety of services available through Fidelity and its affiliates.
Based on its evaluation of all of the conclusions noted above, and after considering all factors it believed relevant, the Board ultimately concluded that the advisory fee structures are fair and reasonable, and that the fund's Advisory Contracts should be approved.
Annual Report
Investment Adviser
Fidelity Management & Research Company
Boston, MA
Investment Sub-Advisers
FMR Co., Inc.
Fidelity Management & Research (U.K.) Inc.
Fidelity Management & Research (Hong Kong) Limited
Fidelity Management & Research (Japan) Inc.
General Distributor
Fidelity Distributors Corporation
Boston, MA
Transfer and Service Agents
Fidelity Investments Institutional Operations Company, Inc.
Boston, MA
Fidelity Service Company, Inc.
Boston, MA
Custodian
Brown Brothers Harriman & Co.
Boston, MA
(Fidelity Investment logo)(registered trademark)
Corporate Headquarters
82 Devonshire St., Boston, MA 02109
www.fidelity.com
AO1TI-ANN-0213
1.950951.100
Item 2. Code of Ethics
As of the end of the period, December 31, 2012, Fidelity Contrafund (the trust) has adopted a code of ethics, as defined in Item 2 of Form N-CSR, that applies to its President and Treasurer and its Chief Financial Officer. A copy of the code of ethics is filed as an exhibit to this Form N-CSR.
Item 3. Audit Committee Financial Expert
The Board of Trustees of the trust has determined that Joseph Mauriello is an audit committee financial expert, as defined in Item 3 of Form N-CSR. Mr. Mauriello is independent for purposes of Item 3 of Form N-CSR.
Item 4. Principal Accountant Fees and Services
Fees and Services
The following table presents fees billed by PricewaterhouseCoopers LLP ("PwC") in each of the last two fiscal years for services rendered to Fidelity Advisor New Insights Fund, Fidelity Advisor Series Opportunistic Insights Fund, Fidelity Contrafund and Fidelity Series Opportunistic Insights Fund (the "Funds"):
Services Billed by PwC
December 31, 2012 FeesA,B
| Audit Fees | Audit-Related Fees | Tax Fees | All Other Fees |
Fidelity Advisor New Insights Fund | $78,000 | $- | $4,500 | $9,500 |
Fidelity Advisor Series Opportunistic Insights Fund | $39,000 | $- | $4,300 | $- |
Fidelity Contrafund | $215,000 | $- | $4,500 | $31,200 |
Fidelity Series Opportunistic Insights Fund | $42,000 | $- | $4,300 | $- |
December 31, 2011 FeesA,B
| Audit Fees | Audit-Related Fees | Tax Fees | All Other Fees |
Fidelity Advisor New Insights Fund | $70,000 | $- | $9,000 | $8,900 |
Fidelity Advisor Series Opportunistic Insights Fund | $- | $- | $- | $- |
Fidelity Contrafund | $202,000 | $- | $9,000 | $29,400 |
Fidelity Series Opportunistic Insights Fund | $- | $- | $- | $- |
A Amounts may reflect rounding.
B Fidelity Advisor Series Opportunistic Insights Fund and Fidelity Series Opportunistic Insights Fund commenced operations on December 6, 2012.
The following table presents fees billed by PwC that were required to be approved by the Audit Committee for services that relate directly to the operations and financial reporting of the Funds and that are rendered on behalf of Fidelity Management & Research Company ("FMR") and entities controlling, controlled by, or under common control with FMR (not including any sub-adviser whose role is primarily portfolio management and is subcontracted with or overseen by another investment adviser) that provide ongoing services to the Funds ("Fund Service Providers"):
Services Billed by PwC
| December 31, 2012A,B | December 31, 2011 B |
Audit-Related Fees | $4,805,000 | $3,845,000 |
Tax Fees | $- | $- |
All Other Fees | $- | $- |
A Amounts may reflect rounding.
B May include amounts billed prior to the Fidelity Advisor Series Opportunistic Insights Fund and Fidelity Series Opportunistic Insights Fund's commencement of operations.
"Audit-Related Fees" represent fees billed for assurance and related services that are reasonably related to the performance of the fund audit or the review of the fund's financial statements and that are not reported under Audit Fees.
"Tax Fees" represent fees billed for tax compliance, tax advice or tax planning that relate directly to the operations and financial reporting of the fund.
"All Other Fees" represent fees billed for services provided to the fund or Fund Service Provider, a significant portion of which are assurance related, that relate directly to the operations and financial reporting of the fund, excluding those services that are reported under Audit Fees, Audit-Related Fees or Tax Fees.
Assurance services must be performed by an independent public accountant.
* * *
The aggregate non-audit fees billed by PwC for services rendered to the Funds, FMR (not including any sub-adviser whose role is primarily portfolio management and is subcontracted with or overseen by another investment adviser), and any Fund Service Provider for each of the last two fiscal years of the Funds are as follows:
Billed By | December 31, 2012 A,B | December 31, 2011 A,B |
PwC | $5,670,000 | $5,105,000 |
A Amounts may reflect rounding.
B May include amounts billed prior to the Fidelity Advisor Series Opportunistic Insights Fund and Fidelity Series Opportunistic Insights Fund's commencement of operations.
The trust's Audit Committee has considered non-audit services that were not pre-approved that were provided by PwC to Fund Service Providers to be compatible with maintaining the independence of PwC in its audit of the Funds, taking into account representations from PwC, in accordance with Public Company Accounting Oversight Board rules, regarding its independence from the Funds and their related entities and FMR's review of the appropriateness and permissibility under applicable law of such non-audit services prior to their provision to the Fund Service Providers.
Audit Committee Pre-Approval Policies and Procedures
The trust's Audit Committee must pre-approve all audit and non-audit services provided by a fund's independent registered public accounting firm relating to the operations or financial reporting of the fund. Prior to the commencement of any audit or non-audit services to a fund, the Audit Committee reviews the services to determine whether they are appropriate and permissible under applicable law.
The Audit Committee has adopted policies and procedures to, among other purposes, provide a framework for the Committee's consideration of non-audit services by the audit firms that audit the Fidelity funds. The policies and procedures require that any non-audit service provided by a fund audit firm to a Fidelity fund and any non-audit service provided by a fund auditor to a Fund Service Provider that relates directly to the operations and financial reporting of a Fidelity fund ("Covered Service") are subject to approval by the Audit Committee before such service is provided.
All Covered Services must be approved in advance of provision of the service either: (i) by formal resolution of the Audit Committee, or (ii) by oral or written approval of the service by the Chair of the Audit Committee (or if the Chair is unavailable, such other member of the Audit Committee as may be designated by the Chair to act in the Chair's absence). The approval contemplated by (ii) above is permitted where the Treasurer determines that action on such an engagement is necessary before the next meeting of the Audit Committee.
Non-audit services provided by a fund audit firm to a Fund Service Provider that do not relate directly to the operations and financial reporting of a Fidelity fund are reported to the Audit Committee on a periodic basis.
Non-Audit Services Approved Pursuant to Rule 2-01(c)(7)(i)(C) and (ii) of Regulation S-X ("De Minimis Exception")
There were no non-audit services approved or required to be approved by the Audit Committee pursuant to the De Minimis Exception during the Funds' last two fiscal years relating to services provided to (i) the Funds or (ii) any Fund Service Provider that relate directly to the operations and financial reporting of the Funds.
Item 5. Audit Committee of Listed Registrants
Not applicable.
Item 6. Investments
(a) Not applicable.
(b) Not applicable
Item 7. Disclosure of Proxy Voting Policies and Procedures for Closed-End Management Investment Companies
Not applicable.
Item 8. Portfolio Managers of Closed-End Management Investment Companies
Not applicable.
Item 9. Purchase of Equity Securities by Closed-End Management Investment Company and Affiliated Purchasers
Not applicable.
Item 10. Submission of Matters to a Vote of Security Holders
There were no material changes to the procedures by which shareholders may recommend nominees to the trust's Board of Trustees.
Item 11. Controls and Procedures
(a)(i) The President and Treasurer and the Chief Financial Officer have concluded that the trust's disclosure controls and procedures (as defined in Rule 30a-3(c) under the Investment Company Act) provide reasonable assurances that material information relating to the trust is made known to them by the appropriate persons, based on their evaluation of these controls and procedures as of a date within 90 days of the filing date of this report.
(a)(ii) There was no change in the trust's internal control over financial reporting (as defined in Rule 30a-3(d) under the Investment Company Act) that occurred during the second fiscal quarter of the period covered by this report that has materially affected, or is reasonably likely to materially affect, the trust's internal control over financial reporting.
Item 12. Exhibits
(a) | (1) | Code of Ethics pursuant to Item 2 of Form N-CSR is filed and attached hereto as EX-99.CODE ETH. |
(a) | (2) | Certification pursuant to Rule 30a-2(a) under the Investment Company Act of 1940 (17 CFR 270.30a-2(a)) is filed and attached hereto as Exhibit 99.CERT. |
(a) | (3) | Not applicable. |
(b) | | Certification pursuant to Rule 30a-2(b) under the Investment Company Act of 1940 (17 CFR 270.30a-2(b)) is furnished and attached hereto as Exhibit 99.906CERT. |
SIGNATURES
Pursuant to the requirements of the Securities Exchange Act of 1934 and the Investment Company Act of 1940, the registrant has duly caused this report to be signed on its behalf by the undersigned, thereunto duly authorized.
Fidelity Contrafund
By: | /s/Kenneth B. Robins |
| Kenneth B. Robins |
| President and Treasurer |
| |
Date: | February 27, 2013 |
Pursuant to the requirements of the Securities Exchange Act of 1934 and the Investment Company Act of 1940, this report has been signed below by the following persons on behalf of the registrant and in the capacities and on the dates indicated.
By: | /s/Kenneth B. Robins |
| Kenneth B. Robins |
| President and Treasurer |
| |
Date: | February 27, 2013 |
By: | /s/Christine Reynolds |
| Christine Reynolds |
| Chief Financial Officer |
| |
Date: | February 27, 2013 |