UNITED STATES
SECURITIES AND EXCHANGE COMMISSION
Washington, D.C. 20549
FORM N-CSR
CERTIFIED SHAREHOLDER REPORT OF REGISTERED
MANAGEMENT INVESTMENT COMPANIES
Investment Company Act file number 811-01400
Fidelity Contrafund
(Exact name of registrant as specified in charter)
245 Summer St., Boston, MA 02210
(Address of principal executive offices) (Zip code)
Margaret Carey, Secretary
245 Summer St.
Boston, Massachusetts 02210
(Name and address of agent for service)
Registrant's telephone number, including area code:
617-563-7000
| |
Date of fiscal year end: | December 31 |
|
|
Date of reporting period: | June 30, 2023 |
Item 1.
Reports to Stockholders
Fidelity Advisor® New Insights Fund
Semi-Annual Report
June 30, 2023
Contents
To view a fund's proxy voting guidelines and proxy voting record for the 12-month period ended June 30, visit http://www.fidelity.com/proxyvotingresults or visit the Securities and Exchange Commission's (SEC) web site at http://www.sec.gov.
You may also call 1-877-208-0098 to request a free copy of the proxy voting guidelines.
Standard & Poor's, S&P and S&P 500 are registered service marks of The McGraw-Hill Companies, Inc. and have been licensed for use by Fidelity Distributors Corporation.
Other third-party marks appearing herein are the property of their respective owners.
All other marks appearing herein are registered or unregistered trademarks or service marks of FMR LLC or an affiliated company. © 2023 FMR LLC. All rights reserved.
This report and the financial statements contained herein are submitted for the general information of the shareholders of the Fund. This report is not authorized for distribution to prospective investors in the Fund unless preceded or accompanied by an effective prospectus.
A fund files its complete schedule of portfolio holdings with the SEC for the first and third quarters of each fiscal year on Form N-PORT. Forms N-PORT are available on the SEC's web site at http://www.sec.gov. A fund's Forms N-PORT may be reviewed and copied at the SEC's Public Reference Room in Washington, DC. Information regarding the operation of the SEC's Public Reference Room may be obtained by calling 1-800-SEC-0330.
For a complete list of a fund's portfolio holdings, view the most recent holdings listing, semiannual report, or annual report on Fidelity's web site at http://www.fidelity.com, http://www.institutional.fidelity.com, or http://www.401k.com, as applicable.
NOT FDIC INSURED •MAY LOSE VALUE •NO BANK GUARANTEE
Neither the Fund nor Fidelity Distributors Corporation is a bank.
Top Holdings (% of Fund's net assets) |
| |
| Meta Platforms, Inc. Class A | 8.4 | |
| Microsoft Corp. | 7.4 | |
| Alphabet, Inc. Class A | 5.4 | |
| Berkshire Hathaway, Inc. Class A | 4.9 | |
| Amazon.com, Inc. | 4.3 | |
| Apple, Inc. | 4.3 | |
| NVIDIA Corp. | 4.1 | |
| UnitedHealth Group, Inc. | 2.9 | |
| Eli Lilly & Co. | 2.6 | |
| Netflix, Inc. | 1.9 | |
| | 46.2 | |
| |
| Market Sectors (% of Fund's net assets) |
| |
| Information Technology | 24.9 | |
| Communication Services | 17.0 | |
| Health Care | 13.8 | |
| Financials | 12.4 | |
| Consumer Discretionary | 10.1 | |
| Industrials | 9.1 | |
| Energy | 5.1 | |
| Materials | 3.7 | |
| Consumer Staples | 2.3 | |
| Utilities | 0.7 | |
| Real Estate | 0.0 | |
| |
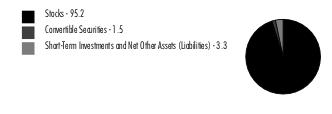
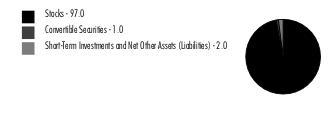
Asset Allocation (% of Fund's net assets) |
|
|
Showing Percentage of Net Assets
| Common Stocks - 97.1% |
| | | Shares | Value ($) (000s) |
| COMMUNICATION SERVICES - 16.8% | | | |
| Entertainment - 2.5% | | | |
| Activision Blizzard, Inc. | | 451,100 | 38,028 |
| Liberty Media Corp. Liberty Formula One Series C (a) | | 416,276 | 31,337 |
| Netflix, Inc. (a) | | 725,190 | 319,439 |
| Sea Ltd. ADR (a) | | 263,700 | 15,305 |
| The Walt Disney Co. (a) | | 8,400 | 750 |
| Universal Music Group NV | | 815,932 | 18,119 |
| | | | 422,978 |
| Interactive Media & Services - 13.9% | | | |
| Alphabet, Inc.: | | | |
| Class A (a) | | 7,670,220 | 918,125 |
| Class C (a) | | 22,900 | 2,770 |
| Bumble, Inc. (a) | | 240,284 | 4,032 |
| Epic Games, Inc. (a)(b)(c) | | 23,900 | 16,825 |
| Meta Platforms, Inc. Class A (a) | | 4,916,816 | 1,411,029 |
| | | | 2,352,781 |
| Media - 0.0% | | | |
| Comcast Corp. Class A | | 24,200 | 1,006 |
| Wireless Telecommunication Services - 0.4% | | | |
| T-Mobile U.S., Inc. (a) | | 489,600 | 68,005 |
TOTAL COMMUNICATION SERVICES | | | 2,844,770 |
| CONSUMER DISCRETIONARY - 10.1% | | | |
| Automobiles - 0.3% | | | |
| BYD Co. Ltd. (H Shares) | | 124,500 | 3,992 |
| General Motors Co. | | 87,640 | 3,379 |
| Harley-Davidson, Inc. | | 46,900 | 1,651 |
| Hyundai Motor Co. Ltd. | | 77,337 | 12,165 |
| Rad Power Bikes, Inc. (a)(b)(c) | | 474,452 | 1,058 |
| Rivian Automotive, Inc. (a) | | 26,456 | 441 |
| Tesla, Inc. (a) | | 88,052 | 23,049 |
| Toyota Motor Corp. | | 541,702 | 8,706 |
| | | | 54,441 |
| Broadline Retail - 4.5% | | | |
| Amazon.com, Inc. (a) | | 5,633,200 | 734,344 |
| Coupang, Inc. Class A (a) | | 902,565 | 15,705 |
| Dollarama, Inc. | | 63,672 | 4,312 |
| Global-e Online Ltd. (a) | | 143,500 | 5,875 |
| MercadoLibre, Inc. (a) | | 6,000 | 7,108 |
| | | | 767,344 |
| Diversified Consumer Services - 0.0% | | | |
| Duolingo, Inc. (a) | | 2,800 | 400 |
| Hotels, Restaurants & Leisure - 1.2% | | | |
| Airbnb, Inc. Class A (a) | | 310,696 | 39,819 |
| Booking Holdings, Inc. (a) | | 3,000 | 8,101 |
| Caesars Entertainment, Inc. (a) | | 270,000 | 13,762 |
| Cava Group, Inc. | | 37,400 | 1,532 |
| Chipotle Mexican Grill, Inc. (a) | | 8,427 | 18,025 |
| Churchill Downs, Inc. | | 17,200 | 2,394 |
| Deliveroo PLC Class A (a)(d) | | 3,535,620 | 5,141 |
| Evolution AB (d) | | 12,200 | 1,545 |
| Hilton Worldwide Holdings, Inc. | | 527,468 | 76,773 |
| Hyatt Hotels Corp. Class A | | 12,900 | 1,478 |
| Las Vegas Sands Corp. (a) | | 31,200 | 1,810 |
| Marriott International, Inc. Class A | | 5,200 | 955 |
| McDonald's Corp. | | 41,200 | 12,294 |
| Restaurant Brands International, Inc. | | 45,100 | 3,497 |
| Starbucks Corp. | | 10,100 | 1,001 |
| Sweetgreen, Inc. Class A (a) | | 247,700 | 3,176 |
| Zomato Ltd. (a) | | 2,766,561 | 2,538 |
| | | | 193,841 |
| Household Durables - 0.3% | | | |
| Blu Investments LLC (a)(b)(c) | | 98,215,581 | 30 |
| D.R. Horton, Inc. | | 158,675 | 19,309 |
| Lennar Corp. Class A | | 264,318 | 33,122 |
| PulteGroup, Inc. | | 3,200 | 249 |
| | | | 52,710 |
| Leisure Products - 0.0% | | | |
| Bandai Namco Holdings, Inc. | | 30,900 | 716 |
| Specialty Retail - 2.7% | | | |
| Academy Sports & Outdoors, Inc. | | 593,806 | 32,095 |
| Auto1 Group SE (a)(d) | | 51,600 | 479 |
| AutoZone, Inc. (a) | | 2,650 | 6,607 |
| Dick's Sporting Goods, Inc. | | 320,045 | 42,307 |
| Fanatics, Inc. Class A (a)(b)(c) | | 372,921 | 28,640 |
| Fast Retailing Co. Ltd. | | 12,300 | 3,155 |
| Floor & Decor Holdings, Inc. Class A (a)(e) | | 217,500 | 22,611 |
| FSN E-Commerce Ventures Private Ltd. | | 10,674 | 19 |
| Lowe's Companies, Inc. | | 387,500 | 87,459 |
| O'Reilly Automotive, Inc. (a) | | 44,271 | 42,292 |
| The Home Depot, Inc. | | 220,413 | 68,469 |
| TJX Companies, Inc. | | 723,403 | 61,337 |
| Ulta Beauty, Inc. (a) | | 49,600 | 23,342 |
| Wayfair LLC Class A (a) | | 96,078 | 6,246 |
| Williams-Sonoma, Inc. | | 246,932 | 30,901 |
| | | | 455,959 |
| Textiles, Apparel & Luxury Goods - 1.1% | | | |
| Brunello Cucinelli SpA | | 753,200 | 66,244 |
| China Hongxing Sports Ltd. (a)(c) | | 5,977,800 | 0 |
| Deckers Outdoor Corp. (a) | | 20,982 | 11,071 |
| Dr. Martens Ltd. | | 96,532 | 150 |
| lululemon athletica, Inc. (a) | | 14,144 | 5,354 |
| LVMH Moet Hennessy Louis Vuitton SE | | 32,800 | 30,928 |
| NIKE, Inc. Class B | | 91,803 | 10,132 |
| On Holding AG (a) | | 597,100 | 19,704 |
| Ralph Lauren Corp. (e) | | 61,500 | 7,583 |
| Samsonite International SA (a)(d) | | 4,331,100 | 12,215 |
| Tapestry, Inc. | | 511,229 | 21,881 |
| | | | 185,262 |
TOTAL CONSUMER DISCRETIONARY | | | 1,710,673 |
| CONSUMER STAPLES - 2.3% | | | |
| Beverages - 1.1% | | | |
| Anheuser-Busch InBev SA NV | | 101,524 | 5,754 |
| Constellation Brands, Inc. Class A (sub. vtg.) | | 17,400 | 4,283 |
| Diageo PLC | | 49,885 | 2,145 |
| PepsiCo, Inc. | | 246,460 | 45,649 |
| The Coca-Cola Co. | | 1,936,818 | 116,635 |
| | | | 174,466 |
| Consumer Staples Distribution & Retail - 0.8% | | | |
| Alimentation Couche-Tard, Inc. Class A (multi-vtg.) | | 167,500 | 8,589 |
| BJ's Wholesale Club Holdings, Inc. (a) | | 107,200 | 6,755 |
| Casey's General Stores, Inc. | | 28,800 | 7,024 |
| Costco Wholesale Corp. | | 179,600 | 96,693 |
| Dollar Tree, Inc. (a) | | 132,300 | 18,985 |
| | | | 138,046 |
| Food Products - 0.1% | | | |
| Lamb Weston Holdings, Inc. | | 24,900 | 2,862 |
| Mondelez International, Inc. | | 223,800 | 16,324 |
| | | | 19,186 |
| Household Products - 0.2% | | | |
| Procter & Gamble Co. | | 233,900 | 35,492 |
| Personal Care Products - 0.1% | | | |
| Kenvue, Inc. | | 144,700 | 3,823 |
| L'Oreal SA (a) | | 29,812 | 13,907 |
| L'Oreal SA | | 1,300 | 606 |
| Olaplex Holdings, Inc. (a) | | 561,746 | 2,090 |
| | | | 20,426 |
TOTAL CONSUMER STAPLES | | | 387,616 |
| ENERGY - 5.0% | | | |
| Energy Equipment & Services - 0.0% | | | |
| Nextier Oilfield Solutions, Inc. (a) | | 606,900 | 5,426 |
| Noble Corp. PLC | | 4,432 | 183 |
| | | | 5,609 |
| Oil, Gas & Consumable Fuels - 5.0% | | | |
| Antero Resources Corp. (a) | | 542,400 | 12,491 |
| Birchcliff Energy Ltd. (e) | | 169,400 | 1,003 |
| Canadian Natural Resources Ltd. | | 1,130,888 | 63,581 |
| Cenovus Energy, Inc. (e) | | 687,700 | 11,677 |
| Cheniere Energy, Inc. | | 697,217 | 106,228 |
| Chevron Corp. | | 265,705 | 41,809 |
| ConocoPhillips Co. | | 657,011 | 68,073 |
| Diamondback Energy, Inc. | | 5,943 | 781 |
| EOG Resources, Inc. | | 258,816 | 29,619 |
| Exxon Mobil Corp. | | 2,201,007 | 236,058 |
| GoviEx Uranium, Inc. (a) | | 642,355 | 63 |
| GoviEx Uranium, Inc. (a)(d) | | 23,200 | 2 |
| GoviEx Uranium, Inc. Class A (a)(d) | | 2,625,135 | 258 |
| Hess Corp. | | 1,185,390 | 161,154 |
| Marathon Petroleum Corp. | | 22,600 | 2,635 |
| Occidental Petroleum Corp. | | 604,361 | 35,536 |
| Ovintiv, Inc. | | 122,600 | 4,667 |
| Pioneer Natural Resources Co. | | 47,565 | 9,855 |
| PrairieSky Royalty Ltd. | | 55,400 | 969 |
| Reliance Industries Ltd. | | 243,531 | 7,589 |
| Suncor Energy, Inc. | | 420,900 | 12,347 |
| Tourmaline Oil Corp. | | 54,500 | 2,568 |
| Valero Energy Corp. | | 231,200 | 27,120 |
| | | | 836,083 |
TOTAL ENERGY | | | 841,692 |
| FINANCIALS - 12.3% | | | |
| Banks - 2.7% | | | |
| AIB Group PLC | | 344,600 | 1,448 |
| Banco Santander SA (Spain) | | 1,348,100 | 4,991 |
| Bank of America Corp. | | 3,685,865 | 105,747 |
| Bank of Ireland Group PLC | | 497,200 | 4,741 |
| East West Bancorp, Inc. | | 75,700 | 3,996 |
| First Citizens Bancshares, Inc. | | 2,200 | 2,824 |
| HDFC Bank Ltd. sponsored ADR | | 643,371 | 44,843 |
| JPMorgan Chase & Co. | | 501,159 | 72,889 |
| Nu Holdings Ltd. (a) | | 1,060,866 | 8,370 |
| Royal Bank of Canada | | 514,460 | 49,133 |
| Starling Bank Ltd. Series D (a)(b)(c) | | 3,787,848 | 14,047 |
| Wells Fargo & Co. | | 3,544,016 | 151,259 |
| | | | 464,288 |
| Capital Markets - 0.5% | | | |
| BlackRock, Inc. Class A | | 790 | 546 |
| Brookfield Asset Management Ltd. Class A | | 5,622 | 184 |
| Brookfield Corp. (Canada) Class A | | 37,400 | 1,259 |
| Goldman Sachs Group, Inc. | | 1,704 | 550 |
| Morgan Stanley | | 492,747 | 42,081 |
| MSCI, Inc. | | 35,419 | 16,622 |
| TulCo LLC (a)(b)(c)(f) | | 17,377 | 15,123 |
| | | | 76,365 |
| Consumer Finance - 0.2% | | | |
| American Express Co. | | 163,808 | 28,535 |
| Capital One Financial Corp. | | 33,900 | 3,708 |
| | | | 32,243 |
| Financial Services - 6.5% | | | |
| Adyen BV (a)(d) | | 844 | 1,462 |
| Berkshire Hathaway, Inc. Class A (a) | | 1,588 | 822,282 |
| Dlocal Ltd. (a) | | 633,300 | 7,729 |
| Fiserv, Inc. (a) | | 106,000 | 13,372 |
| MasterCard, Inc. Class A | | 475,700 | 187,093 |
| Remitly Global, Inc. (a) | | 202,100 | 3,804 |
| Visa, Inc. Class A | | 287,300 | 68,228 |
| | | | 1,103,970 |
| Insurance - 2.4% | | | |
| American International Group, Inc. | | 537,226 | 30,912 |
| Aon PLC | | 8,770 | 3,027 |
| Arthur J. Gallagher & Co. | | 294,400 | 64,641 |
| Brookfield Asset Management Reinsurance Partners Ltd. | | 889 | 30 |
| Chubb Ltd. | | 513,307 | 98,842 |
| Fairfax Financial Holdings Ltd. (sub. vtg.) | | 45,667 | 34,206 |
| Hartford Financial Services Group, Inc. | | 79,153 | 5,701 |
| Hiscox Ltd. | | 2,665,843 | 36,937 |
| Intact Financial Corp. | | 110,374 | 17,042 |
| Marsh & McLennan Companies, Inc. | | 81,137 | 15,260 |
| Progressive Corp. | | 452,010 | 59,833 |
| The Travelers Companies, Inc. | | 224,838 | 39,045 |
| | | | 405,476 |
TOTAL FINANCIALS | | | 2,082,342 |
| HEALTH CARE - 13.7% | | | |
| Biotechnology - 3.2% | | | |
| Alnylam Pharmaceuticals, Inc. (a) | | 74,522 | 14,155 |
| Argenx SE ADR (a) | | 101,785 | 39,669 |
| Arrowhead Pharmaceuticals, Inc. (a) | | 28,600 | 1,020 |
| Ascendis Pharma A/S sponsored ADR (a) | | 29,200 | 2,606 |
| Biogen, Inc. (a) | | 3,000 | 855 |
| Biohaven Ltd. | | 4,450 | 106 |
| Exact Sciences Corp. (a) | | 23,600 | 2,216 |
| Galapagos NV sponsored ADR (a) | | 181,269 | 7,370 |
| Gilead Sciences, Inc. | | 363,600 | 28,023 |
| Intarcia Therapeutics, Inc. warrants 12/31/24 (a)(c) | | 26,062 | 0 |
| Intellia Therapeutics, Inc. (a) | | 17,114 | 698 |
| Krystal Biotech, Inc. (a) | | 8,300 | 974 |
| Legend Biotech Corp. ADR (a) | | 139,700 | 9,643 |
| Light Sciences Oncology, Inc. (a)(c) | | 2,708,254 | 0 |
| Moderna, Inc. (a) | | 5,700 | 693 |
| Moonlake Immunotherapeutics (a) | | 39,000 | 1,989 |
| Nuvalent, Inc. Class A (a) | | 46,000 | 1,940 |
| Regeneron Pharmaceuticals, Inc. (a) | | 366,699 | 263,488 |
| Roivant Sciences Ltd. (a) | | 217,900 | 2,196 |
| Sarepta Therapeutics, Inc. (a) | | 9,200 | 1,054 |
| Seagen, Inc. (a) | | 5,100 | 982 |
| United Therapeutics Corp. (a) | | 75,294 | 16,621 |
| Vertex Pharmaceuticals, Inc. (a) | | 426,246 | 150,000 |
| Zai Lab Ltd. (a) | | 560,720 | 1,543 |
| | | | 547,841 |
| Health Care Equipment & Supplies - 1.1% | | | |
| Align Technology, Inc. (a) | | 2,800 | 990 |
| Boston Scientific Corp. (a) | | 1,250,208 | 67,624 |
| DexCom, Inc. (a) | | 24,600 | 3,161 |
| Edwards Lifesciences Corp. (a) | | 17,250 | 1,627 |
| Figs, Inc. Class A (a)(e) | | 363,500 | 3,006 |
| GE Healthcare Holding LLC | | 99,634 | 8,094 |
| I-Pulse, Inc. (a)(b)(c) | | 58,562 | 164 |
| Inspire Medical Systems, Inc. (a) | | 3,600 | 1,169 |
| Intuitive Surgical, Inc. (a) | | 169,051 | 57,805 |
| Lantheus Holdings, Inc. (a) | | 10,800 | 906 |
| Penumbra, Inc. (a) | | 3,200 | 1,101 |
| Shockwave Medical, Inc. (a) | | 7,300 | 2,083 |
| Straumann Holding AG | | 25,745 | 4,175 |
| Stryker Corp. | | 16,900 | 5,156 |
| Surgical Science Sweden AB (a) | | 46,500 | 1,040 |
| TransMedics Group, Inc. (a) | | 209,200 | 17,569 |
| | | | 175,670 |
| Health Care Providers & Services - 4.1% | | | |
| 23andMe Holding Co. Class A (a)(e) | | 589,099 | 1,031 |
| agilon health, Inc. (a) | | 945,500 | 16,395 |
| AmerisourceBergen Corp. | | 31,420 | 6,046 |
| Cardinal Health, Inc. | | 40,000 | 3,783 |
| Centene Corp. (a) | | 574,000 | 38,716 |
| Cigna Group | | 387,500 | 108,733 |
| Elevance Health, Inc. | | 22,115 | 9,825 |
| HCA Holdings, Inc. | | 46,057 | 13,977 |
| Henry Schein, Inc. (a) | | 11,200 | 908 |
| P3 Health Partners, Inc. Class A (a) | | 193,779 | 579 |
| UnitedHealth Group, Inc. | | 1,027,708 | 493,958 |
| | | | 693,951 |
| Health Care Technology - 0.0% | | | |
| Doximity, Inc. (a) | | 61,500 | 2,092 |
| Schrodinger, Inc. (a)(e) | | 53,761 | 2,684 |
| | | | 4,776 |
| Life Sciences Tools & Services - 0.9% | | | |
| Danaher Corp. | | 458,889 | 110,133 |
| Mettler-Toledo International, Inc. (a) | | 14,754 | 19,352 |
| Olink Holding AB ADR (a) | | 162,700 | 3,051 |
| Seer, Inc. (a) | | 59,354 | 253 |
| Thermo Fisher Scientific, Inc. | | 27,408 | 14,300 |
| Veterinary Emergency Group LLC Class A (a)(b)(c)(f) | | 176,934 | 9,542 |
| | | | 156,631 |
| Pharmaceuticals - 4.4% | | | |
| AstraZeneca PLC: | | | |
| (United Kingdom) | | 270,800 | 38,820 |
| sponsored ADR | | 70,800 | 5,067 |
| DICE Therapeutics, Inc. (a) | | 83,800 | 3,893 |
| Eli Lilly & Co. | | 917,483 | 430,281 |
| Euroapi SASU (a) | | 23,468 | 269 |
| Intra-Cellular Therapies, Inc. (a) | | 77,017 | 4,877 |
| Johnson & Johnson | | 110,928 | 18,361 |
| Merck & Co., Inc. | | 765,392 | 88,319 |
| Novo Nordisk A/S Series B | | 19,600 | 3,166 |
| Nuvation Bio, Inc. (a) | | 212,427 | 382 |
| Roche Holding AG (participation certificate) | | 183,833 | 56,155 |
| Royalty Pharma PLC | | 897,050 | 27,575 |
| Sanofi SA | | 539,800 | 58,113 |
| Structure Therapeutics, Inc. ADR | | 63,100 | 2,623 |
| UCB SA | | 15,667 | 1,388 |
| Ventyx Biosciences, Inc. (a) | | 26,200 | 859 |
| Verona Pharma PLC ADR (a) | | 35,300 | 746 |
| Zoetis, Inc. Class A | | 16,400 | 2,824 |
| | | | 743,718 |
TOTAL HEALTH CARE | | | 2,322,587 |
| INDUSTRIALS - 7.7% | | | |
| Aerospace & Defense - 3.2% | | | |
| BWX Technologies, Inc. | | 47,900 | 3,428 |
| Lockheed Martin Corp. | | 122,514 | 56,403 |
| Northrop Grumman Corp. | | 309,986 | 141,292 |
| Space Exploration Technologies Corp.: | | | |
| Class A (a)(b)(c) | | 2,573,450 | 208,449 |
| Class C (a)(b)(c) | | 45,460 | 3,682 |
| The Boeing Co. (a) | | 237,800 | 50,214 |
| TransDigm Group, Inc. | | 81,962 | 73,288 |
| Woodward, Inc. | | 80,700 | 9,596 |
| | | | 546,352 |
| Air Freight & Logistics - 0.4% | | | |
| Delhivery Private Ltd. (a) | | 444,255 | 2,066 |
| GXO Logistics, Inc. (a) | | 416,470 | 26,163 |
| United Parcel Service, Inc. Class B | | 201,482 | 36,116 |
| Zipline International, Inc. (a)(b)(c) | | 74,930 | 3,012 |
| | | | 67,357 |
| Building Products - 0.2% | | | |
| Carrier Global Corp. | | 64,400 | 3,201 |
| Toto Ltd. | | 409,376 | 12,378 |
| Trane Technologies PLC | | 71,500 | 13,675 |
| | | | 29,254 |
| Commercial Services & Supplies - 0.2% | | | |
| Cintas Corp. | | 33,112 | 16,459 |
| Clean Harbors, Inc. (a) | | 73,944 | 12,159 |
| Clean TeQ Water Pty Ltd. (a) | | 3,189 | 1 |
| GFL Environmental, Inc. | | 30,600 | 1,188 |
| Republic Services, Inc. | | 20,600 | 3,155 |
| Waste Connections, Inc. (United States) | | 6,800 | 972 |
| | | | 33,934 |
| Construction & Engineering - 0.0% | | | |
| Bowman Consulting Group Ltd. (a) | | 231,800 | 7,390 |
| Larsen & Toubro Ltd. | | 35,900 | 1,085 |
| | | | 8,475 |
| Electrical Equipment - 0.7% | | | |
| AMETEK, Inc. | | 6,500 | 1,052 |
| Eaton Corp. PLC | | 323,200 | 64,996 |
| Hubbell, Inc. Class B | | 68,200 | 22,612 |
| Nextracker, Inc. Class A (e) | | 25,600 | 1,019 |
| nVent Electric PLC | | 74,125 | 3,830 |
| Prysmian SpA | | 25,000 | 1,044 |
| Regal Rexnord Corp. | | 130,700 | 20,115 |
| | | | 114,668 |
| Ground Transportation - 0.9% | | | |
| Canadian Pacific Kansas City Ltd. | | 992,664 | 80,177 |
| J.B. Hunt Transport Services, Inc. | | 51,456 | 9,315 |
| Old Dominion Freight Lines, Inc. | | 55,600 | 20,558 |
| RXO, Inc. | | 428,170 | 9,707 |
| Uber Technologies, Inc. (a) | | 722,400 | 31,186 |
| Vamos Locacao de Caminhoes Maquinas e Equipamentos SA | | 23,600 | 60 |
| | | | 151,003 |
| Industrial Conglomerates - 0.5% | | | |
| General Electric Co. | | 753,203 | 82,739 |
| Machinery - 0.8% | | | |
| Caterpillar, Inc. | | 37,300 | 9,178 |
| Crane Nxt Co. | | 8,200 | 463 |
| Deere & Co. | | 85,798 | 34,764 |
| Fortive Corp. | | 73,200 | 5,473 |
| Indutrade AB | | 42,800 | 964 |
| Ingersoll Rand, Inc. | | 109,100 | 7,131 |
| PACCAR, Inc. | | 395,642 | 33,095 |
| Parker Hannifin Corp. | | 99,100 | 38,653 |
| | | | 129,721 |
| Passenger Airlines - 0.1% | | | |
| Copa Holdings SA Class A | | 18,000 | 1,990 |
| Ryanair Holdings PLC sponsored ADR (a) | | 88,200 | 9,755 |
| | | | 11,745 |
| Professional Services - 0.4% | | | |
| CACI International, Inc. Class A (a) | | 81,000 | 27,608 |
| KBR, Inc. | | 336,600 | 21,899 |
| Science Applications International Corp. | | 140,400 | 15,792 |
| Thomson Reuters Corp. | | 12,798 | 1,728 |
| Verisk Analytics, Inc. | | 32,000 | 7,233 |
| | | | 74,260 |
| Trading Companies & Distributors - 0.3% | | | |
| United Rentals, Inc. | | 21,500 | 9,575 |
| W.W. Grainger, Inc. | | 43,300 | 34,146 |
| | | | 43,721 |
TOTAL INDUSTRIALS | | | 1,293,229 |
| INFORMATION TECHNOLOGY - 24.8% | | | |
| Communications Equipment - 0.3% | | | |
| Arista Networks, Inc. (a) | | 257,553 | 41,739 |
| Motorola Solutions, Inc. | | 10,900 | 3,197 |
| | | | 44,936 |
| Electronic Equipment, Instruments & Components - 1.1% | | | |
| Amphenol Corp. Class A | | 1,975,438 | 167,813 |
| CDW Corp. | | 37,179 | 6,822 |
| Jabil, Inc. | | 59,400 | 6,411 |
| | | | 181,046 |
| IT Services - 0.8% | | | |
| Accenture PLC Class A | | 268,411 | 82,826 |
| ASAC II LP (a)(b)(c) | | 9,408,021 | 1,581 |
| Cloudflare, Inc. (a) | | 800 | 52 |
| Gartner, Inc. (a) | | 73,500 | 25,748 |
| MongoDB, Inc. Class A (a) | | 13,000 | 5,343 |
| Okta, Inc. (a) | | 47,200 | 3,273 |
| Shopify, Inc. Class A (a) | | 86,108 | 5,565 |
| X Holdings Corp. Class A (c) | | 97,100 | 3,760 |
| | | | 128,148 |
| Semiconductors & Semiconductor Equipment - 7.5% | | | |
| Advanced Micro Devices, Inc. (a) | | 1,086,834 | 123,801 |
| Advantest Corp. | | 21,000 | 2,828 |
| AEHR Test Systems (a) | | 87,709 | 3,618 |
| Allegro MicroSystems LLC (a) | | 73,300 | 3,309 |
| Analog Devices, Inc. | | 227,092 | 44,240 |
| Applied Materials, Inc. | | 348,800 | 50,416 |
| ASML Holding NV: | | | |
| (depository receipt) | | 5,500 | 3,986 |
| (Netherlands) | | 32,900 | 23,863 |
| Broadcom, Inc. | | 23,900 | 20,732 |
| First Solar, Inc. (a) | | 53,300 | 10,132 |
| Lam Research Corp. | | 65,500 | 42,107 |
| Lattice Semiconductor Corp. (a) | | 237,705 | 22,836 |
| Marvell Technology, Inc. | | 762,400 | 45,576 |
| Microchip Technology, Inc. | | 12,300 | 1,102 |
| Monolithic Power Systems, Inc. | | 40,732 | 22,005 |
| NVIDIA Corp. | | 1,629,686 | 689,390 |
| NXP Semiconductors NV | | 194,513 | 39,813 |
| ON Semiconductor Corp. (a) | | 552,900 | 52,293 |
| Qualcomm, Inc. | | 135,504 | 16,130 |
| SolarEdge Technologies, Inc. (a) | | 23,300 | 6,269 |
| Synaptics, Inc. (a) | | 15,444 | 1,319 |
| Taiwan Semiconductor Manufacturing Co. Ltd. sponsored ADR | | 522,900 | 52,771 |
| | | | 1,278,536 |
| Software - 10.4% | | | |
| Adobe, Inc. (a) | | 373,956 | 182,861 |
| Agilysys, Inc. (a) | | 36,800 | 2,526 |
| ANSYS, Inc. (a) | | 2,700 | 892 |
| Autodesk, Inc. (a) | | 42,631 | 8,723 |
| Cadence Design Systems, Inc. (a) | | 241,957 | 56,744 |
| Check Point Software Technologies Ltd. (a) | | 46,023 | 5,781 |
| Clear Secure, Inc. (e) | | 189,900 | 4,400 |
| Dynatrace, Inc. (a) | | 142,400 | 7,329 |
| Fortinet, Inc. (a) | | 298,565 | 22,569 |
| HashiCorp, Inc. (a) | | 7,000 | 183 |
| HubSpot, Inc. (a) | | 6,800 | 3,618 |
| Intuit, Inc. | | 69,962 | 32,056 |
| Magic Leap, Inc.: | | | |
| Class A (a)(c) | | 30,863 | 191 |
| warrants (a)(c) | | 46,794 | 290 |
| Microsoft Corp. | | 3,690,115 | 1,256,632 |
| Palo Alto Networks, Inc. (a) | | 41,800 | 10,680 |
| Roper Technologies, Inc. | | 2,200 | 1,058 |
| Salesforce, Inc. (a) | | 568,893 | 120,184 |
| Samsara, Inc. (a) | | 9,214 | 255 |
| ServiceNow, Inc. (a) | | 22,799 | 12,812 |
| Stripe, Inc. Class B (a)(b)(c) | | 83,200 | 1,675 |
| Synopsys, Inc. (a) | | 34,900 | 15,196 |
| Tanium, Inc. Class B (a)(b)(c) | | 1,259,978 | 9,954 |
| Tenable Holdings, Inc. (a) | | 168,800 | 7,351 |
| Volue A/S (a) | | 365,396 | 615 |
| | | | 1,764,575 |
| Technology Hardware, Storage & Peripherals - 4.7% | | | |
| Apple, Inc. | | 3,775,110 | 732,258 |
| Dell Technologies, Inc. | | 22,471 | 1,216 |
| Samsung Electronics Co. Ltd. | | 1,252,410 | 68,966 |
| | | | 802,440 |
TOTAL INFORMATION TECHNOLOGY | | | 4,199,681 |
| MATERIALS - 3.7% | | | |
| Chemicals - 0.6% | | | |
| Air Products & Chemicals, Inc. | | 27,400 | 8,207 |
| CF Industries Holdings, Inc. | | 185,600 | 12,884 |
| Corteva, Inc. | | 525,800 | 30,128 |
| Linde PLC | | 9,000 | 3,430 |
| Sherwin-Williams Co. | | 147,269 | 39,103 |
| Westlake Corp. | | 70,287 | 8,397 |
| | | | 102,149 |
| Construction Materials - 0.0% | | | |
| Vulcan Materials Co. | | 14,300 | 3,224 |
| Metals & Mining - 3.1% | | | |
| Agnico Eagle Mines Ltd. (Canada) | | 16,800 | 839 |
| B2Gold Corp. | | 13,305,579 | 47,407 |
| Barrick Gold Corp. (Canada) | | 235,269 | 3,980 |
| Cleveland-Cliffs, Inc. (a) | | 334,200 | 5,601 |
| Franco-Nevada Corp. | | 1,043,236 | 148,687 |
| Freeport-McMoRan, Inc. | | 2,265,600 | 90,624 |
| Glencore PLC | | 700,400 | 3,971 |
| Ivanhoe Electric, Inc. | | 76,997 | 1,004 |
| Ivanhoe Mines Ltd. (a) | | 8,031,618 | 73,359 |
| Lundin Gold, Inc. | | 4,100 | 49 |
| Newcrest Mining Ltd. | | 55,849 | 996 |
| Newmont Corp. | | 115,500 | 4,927 |
| Novagold Resources, Inc. (a) | | 3,196,709 | 12,669 |
| Nucor Corp. | | 386,525 | 63,382 |
| Orla Mining Ltd. (a) | | 1,082,800 | 4,545 |
| POSCO sponsored ADR (e) | | 5,275 | 390 |
| Steel Dynamics, Inc. | | 301,696 | 32,864 |
| Wheaton Precious Metals Corp. | | 706,000 | 30,532 |
| | | | 525,826 |
TOTAL MATERIALS | | | 631,199 |
| REAL ESTATE - 0.0% | | | |
| Equity Real Estate Investment Trusts (REITs) - 0.0% | | | |
| Equity Commonwealth | | 176,424 | 3,574 |
| Gaming & Leisure Properties | | 4,888 | 237 |
| | | | 3,811 |
| UTILITIES - 0.7% | | | |
| Electric Utilities - 0.7% | | | |
| Constellation Energy Corp. | | 516,293 | 47,267 |
| NextEra Energy, Inc. | | 159,700 | 11,850 |
| PG&E Corp. (a) | | 2,425,200 | 41,907 |
| Southern Co. | | 316,300 | 22,220 |
| | | | 123,244 |
| TOTAL COMMON STOCKS (Cost $7,291,596) | | | 16,440,844 |
| | | | |
| Preferred Stocks - 2.0% |
| | | Shares | Value ($) (000s) |
| Convertible Preferred Stocks - 1.8% | | | |
| COMMUNICATION SERVICES - 0.2% | | | |
| Interactive Media & Services - 0.2% | | | |
| ByteDance Ltd. Series E1 (a)(b)(c) | | 130,945 | 29,573 |
| Reddit, Inc.: | | | |
| Series E(a)(b)(c) | | 30,200 | 1,045 |
| Series F(a)(b)(c) | | 127,549 | 4,412 |
| | | | 35,030 |
| CONSUMER DISCRETIONARY - 0.0% | | | |
| Automobiles - 0.0% | | | |
| Rad Power Bikes, Inc.: | | | |
| Series A(a)(b)(c) | | 61,855 | 138 |
| Series C(a)(b)(c) | | 243,394 | 543 |
| Series D(a)(b)(c) | | 411,659 | 918 |
| | | | 1,599 |
| Hotels, Restaurants & Leisure - 0.0% | | | |
| Discord, Inc. Series I (a)(b)(c) | | 2,800 | 861 |
| | | | |
| Textiles, Apparel & Luxury Goods - 0.0% | | | |
| Bolt Threads, Inc.: | | | |
| Series D(a)(b)(c) | | 1,324,673 | 79 |
| Series E(a)(b)(c) | | 627,820 | 44 |
| | | | 123 |
TOTAL CONSUMER DISCRETIONARY | | | 2,583 |
| | | | |
| CONSUMER STAPLES - 0.0% | | | |
| Consumer Staples Distribution & Retail - 0.0% | | | |
| GoBrands, Inc.: | | | |
| Series G(a)(b)(c) | | 8,102 | 734 |
| Series H(a)(b)(c) | | 10,223 | 926 |
| | | | 1,660 |
| Food Products - 0.0% | | | |
| Bowery Farming, Inc. Series C1 (a)(b)(c) | | 82,543 | 710 |
| | | | |
TOTAL CONSUMER STAPLES | | | 2,370 |
| | | | |
| FINANCIALS - 0.0% | | | |
| Financial Services - 0.0% | | | |
| Circle Internet Financial Ltd. Series F (a)(b)(c) | | 68,639 | 1,651 |
| | | | |
| HEALTH CARE - 0.1% | | | |
| Biotechnology - 0.0% | | | |
| ElevateBio LLC Series C (a)(b)(c) | | 594,600 | 2,521 |
| Intarcia Therapeutics, Inc. Series CC (a)(b)(c) | | 516,522 | 0 |
| | | | 2,521 |
| Health Care Providers & Services - 0.1% | | | |
| Lyra Health, Inc.: | | | |
| Series E(a)(b)(c) | | 270,000 | 4,514 |
| Series F(a)(b)(c) | | 10,070 | 168 |
| Somatus, Inc. Series E (a)(b)(c) | | 2,206 | 2,235 |
| | | | 6,917 |
TOTAL HEALTH CARE | | | 9,438 |
| | | | |
| INDUSTRIALS - 1.4% | | | |
| Aerospace & Defense - 1.3% | | | |
| Relativity Space, Inc. Series E (a)(b)(c) | | 308,359 | 5,424 |
| Space Exploration Technologies Corp.: | | | |
| Series G(a)(b)(c) | | 145,254 | 117,656 |
| Series H(a)(b)(c) | | 42,094 | 34,096 |
| Series N(a)(b)(c) | | 66,208 | 53,628 |
| | | | 210,804 |
| Air Freight & Logistics - 0.1% | | | |
| Zipline International, Inc.: | | | |
| Series E(a)(b)(c) | | 208,789 | 8,393 |
| Series F(c) | | 79,020 | 3,177 |
| | | | 11,570 |
| Construction & Engineering - 0.0% | | | |
| Beta Technologies, Inc. Series B, 6.00% (a)(b)(c) | | 52,096 | 5,648 |
| | | | |
TOTAL INDUSTRIALS | | | 228,022 |
| | | | |
| INFORMATION TECHNOLOGY - 0.1% | | | |
| Software - 0.1% | | | |
| Moloco, Inc. Series A (b)(c) | | 39,638 | 2,378 |
| Nuro, Inc.: | | | |
| Series C(a)(b)(c) | | 491,080 | 3,118 |
| Series D(a)(b)(c) | | 94,265 | 599 |
| Stripe, Inc.: | | | |
| Series H(a)(b)(c) | | 34,900 | 703 |
| Series I(b)(c) | | 611,900 | 12,318 |
| Tenstorrent, Inc. Series C1 (a)(b)(c) | | 36,600 | 2,159 |
| | | | 21,275 |
| TOTAL CONVERTIBLE PREFERRED STOCKS | | | 300,369 |
| Nonconvertible Preferred Stocks - 0.2% | | | |
| ENERGY - 0.1% | | | |
| Oil, Gas & Consumable Fuels - 0.1% | | | |
| Petroleo Brasileiro SA - Petrobras sponsored ADR | | 953,047 | 13,181 |
| | | | |
| FINANCIALS - 0.1% | | | |
| Financial Services - 0.1% | | | |
| Circle Internet Financial Ltd. Series E (a)(b)(c) | | 615,508 | 14,803 |
| | | | |
| INFORMATION TECHNOLOGY - 0.0% | | | |
| Software - 0.0% | | | |
| Magic Leap, Inc. Series AA (a)(c) | | 325,855 | 3,741 |
| | | | |
| TOTAL NONCONVERTIBLE PREFERRED STOCKS | | | 31,725 |
| TOTAL PREFERRED STOCKS (Cost $201,172) | | | 332,094 |
| | | | |
| Preferred Securities - 0.0% |
| | | Principal Amount (g) (000s) | Value ($) (000s) |
| HEALTH CARE - 0.0% | | | |
| Biotechnology - 0.0% | | | |
| Intarcia Therapeutics, Inc. 6% (b)(c)(h)(i) | | 2,280 | 0 |
| INFORMATION TECHNOLOGY - 0.0% | | | |
| Software - 0.0% | | | |
| Tenstorrent, Inc. 0% (b)(c)(i) | | 2,040 | 2,024 |
| TOTAL PREFERRED SECURITIES (Cost $4,320) | | | 2,024 |
| | | | |
| Money Market Funds - 1.3% |
| | | Shares | Value ($) (000s) |
| Fidelity Cash Central Fund 5.14% (j) | | 182,874,812 | 182,911 |
| Fidelity Securities Lending Cash Central Fund 5.14% (j)(k) | | 41,561,794 | 41,566 |
| TOTAL MONEY MARKET FUNDS (Cost $224,477) | | | 224,477 |
| | | | |
| TOTAL INVESTMENT IN SECURITIES - 100.4% (Cost $7,721,565) | 16,999,439 |
NET OTHER ASSETS (LIABILITIES) - (0.4)% | (61,283) |
| NET ASSETS - 100.0% | 16,938,156 |
| | |
Any values shown as $0 in the Schedule of Investments may reflect amounts less than $500.
Legend
| (b) | Restricted securities (including private placements) - Investment in securities not registered under the Securities Act of 1933 (excluding 144A issues). At the end of the period, the value of restricted securities (excluding 144A issues) amounted to $627,801,000 or 3.7% of net assets. |
| (d) | Security exempt from registration under Rule 144A of the Securities Act of 1933. These securities may be resold in transactions exempt from registration, normally to qualified institutional buyers. At the end of the period, the value of these securities amounted to $21,102,000 or 0.1% of net assets. |
| (e) | Security or a portion of the security is on loan at period end. |
| (f) | Investment is owned by a wholly-owned subsidiary (Subsidiary) that is treated as a corporation for U.S. tax purposes. |
| (g) | Amount is stated in United States dollars unless otherwise noted. |
| (h) | Non-income producing - Security is in default. |
| (i) | Security is perpetual in nature with no stated maturity date. |
| (j) | Affiliated fund that is generally available only to investment companies and other accounts managed by Fidelity Investments. The rate quoted is the annualized seven-day yield of the fund at period end. A complete unaudited listing of the fund's holdings as of its most recent quarter end is available upon request. In addition, each Fidelity Central Fund's financial statements are available on the SEC's website or upon request. |
| (k) | Investment made with cash collateral received from securities on loan. |
| Additional information on each restricted holding is as follows: |
| Security | Acquisition Date | Acquisition Cost ($) (000s) |
| ASAC II LP | 10/10/13 | 725 |
| | | |
| Beta Technologies, Inc. Series B, 6.00% | 4/04/22 | 5,375 |
| | | |
| Blu Investments LLC | 5/21/20 | 170 |
| | | |
| Bolt Threads, Inc. Series D | 12/13/17 | 21,247 |
| | | |
| Bolt Threads, Inc. Series E | 2/07/20 | 9,657 |
| | | |
| Bowery Farming, Inc. Series C1 | 5/18/21 | 4,973 |
| | | |
| ByteDance Ltd. Series E1 | 11/18/20 | 14,348 |
| | | |
| Circle Internet Financial Ltd. Series E | 5/11/21 | 9,990 |
| | | |
| Circle Internet Financial Ltd. Series F | 5/09/22 | 2,892 |
| | | |
| Discord, Inc. Series I | 9/15/21 | 1,542 |
| | | |
| ElevateBio LLC Series C | 3/09/21 | 2,494 |
| | | |
| Epic Games, Inc. | 7/13/20 - 7/30/20 | 13,743 |
| | | |
| Fanatics, Inc. Class A | 8/13/20 - 12/15/21 | 12,264 |
| | | |
| GoBrands, Inc. Series G | 3/02/21 | 2,023 |
| | | |
| GoBrands, Inc. Series H | 7/22/21 | 3,972 |
| | | |
| I-Pulse, Inc. | 3/18/10 | 81 |
| | | |
| Intarcia Therapeutics, Inc. Series CC | 11/14/12 | 7,040 |
| | | |
| Intarcia Therapeutics, Inc. 6% | 1/03/20 | 2,280 |
| | | |
| Lyra Health, Inc. Series E | 1/14/21 | 2,472 |
| | | |
| Lyra Health, Inc. Series F | 6/04/21 | 158 |
| | | |
| Moloco, Inc. Series A | 6/26/23 | 2,378 |
| | | |
| Nuro, Inc. Series C | 10/30/20 | 6,411 |
| | | |
| Nuro, Inc. Series D | 10/29/21 | 1,965 |
| | | |
| Rad Power Bikes, Inc. | 1/21/21 | 2,289 |
| | | |
| Rad Power Bikes, Inc. Series A | 1/21/21 | 298 |
| | | |
| Rad Power Bikes, Inc. Series C | 1/21/21 | 1,174 |
| | | |
| Rad Power Bikes, Inc. Series D | 9/17/21 | 3,945 |
| | | |
| Reddit, Inc. Series E | 5/18/21 | 1,283 |
| | | |
| Reddit, Inc. Series F | 8/11/21 | 7,882 |
| | | |
| Relativity Space, Inc. Series E | 5/27/21 | 7,041 |
| | | |
| Somatus, Inc. Series E | 1/31/22 | 1,925 |
| | | |
| Space Exploration Technologies Corp. Class A | 10/16/15 - 2/16/21 | 29,628 |
| | | |
| Space Exploration Technologies Corp. Class C | 9/11/17 | 614 |
| | | |
| Space Exploration Technologies Corp. Series G | 1/20/15 | 11,251 |
| | | |
| Space Exploration Technologies Corp. Series H | 8/04/17 | 5,683 |
| | | |
| Space Exploration Technologies Corp. Series N | 8/04/20 | 17,876 |
| | | |
| Starling Bank Ltd. Series D | 6/18/21 - 4/05/22 | 7,252 |
| | | |
| Stripe, Inc. Class B | 5/18/21 | 3,339 |
| | | |
| Stripe, Inc. Series H | 3/15/21 | 1,400 |
| | | |
| Stripe, Inc. Series I | 3/20/23 - 5/12/23 | 12,320 |
| | | |
| Tanium, Inc. Class B | 4/21/17 - 9/18/20 | 9,907 |
| | | |
| Tenstorrent, Inc. Series C1 | 4/23/21 | 2,176 |
| | | |
| Tenstorrent, Inc. 0% | 4/23/21 | 2,040 |
| | | |
| TulCo LLC | 8/24/17 | 5,885 |
| | | |
| Veterinary Emergency Group LLC Class A | 9/16/21 - 12/16/22 | 6,613 |
| | | |
| Zipline International, Inc. | 10/12/21 | 2,697 |
| | | |
| Zipline International, Inc. Series E | 12/21/20 | 6,813 |
| | | |
Affiliated Central Funds
Fiscal year to date information regarding the Fund's investments in Fidelity Central Funds, including the ownership percentage, is presented below.
| Affiliate (Amounts in thousands) | Value, beginning of period ($) | Purchases ($) | Sales Proceeds ($) | Dividend Income ($) | Realized Gain (loss) ($) | Change in Unrealized appreciation (depreciation) ($) | Value, end of period ($) | % ownership, end of period |
| Fidelity Cash Central Fund 5.14% | 68,583 | 1,783,339 | 1,669,011 | 5,358 | - | - | 182,911 | 0.5% |
| Fidelity Securities Lending Cash Central Fund 5.14% | 52,379 | 370,767 | 381,580 | 50 | - | - | 41,566 | 0.1% |
| Total | 120,962 | 2,154,106 | 2,050,591 | 5,408 | - | - | 224,477 | |
| | | | | | | | | |
Amounts in the dividend income column in the above table include any capital gain distributions from underlying funds, which are presented in the corresponding line item in the Statement of Operations, if applicable.
Amounts in the dividend income column for Fidelity Securities Lending Cash Central Fund represents the income earned on investing cash collateral, less rebates paid to borrowers and any lending agent fees associated with the loan, plus any premium payments received for lending certain types of securities.
Amounts included in the purchases and sales proceeds columns may include in-kind transactions, if applicable.
Investment Valuation
The following is a summary of the inputs used, as of June 30, 2023, involving the Fund's assets and liabilities carried at fair value. The inputs or methodology used for valuing securities may not be an indication of the risk associated with investing in those securities. For more information on valuation inputs, and their aggregation into the levels used below, please refer to the Investment Valuation section in the accompanying Notes to Financial Statements.
| Valuation Inputs at Reporting Date: |
Description (Amounts in thousands) | Total ($) | Level 1 ($) | Level 2 ($) | Level 3 ($) |
Investments in Securities: | | | | |
|
| Equities: | | | | |
Communication Services | 2,879,800 | 2,827,945 | - | 51,855 |
Consumer Discretionary | 1,713,256 | 1,618,726 | 62,219 | 32,311 |
Consumer Staples | 389,986 | 365,204 | 22,412 | 2,370 |
Energy | 854,873 | 847,284 | 7,589 | - |
Financials | 2,098,796 | 2,046,719 | 6,453 | 45,624 |
Health Care | 2,332,025 | 2,155,084 | 157,797 | 19,144 |
Industrials | 1,521,251 | 1,062,556 | 15,530 | 443,165 |
Information Technology | 4,224,697 | 4,086,573 | 95,657 | 42,467 |
Materials | 631,199 | 626,232 | 4,967 | - |
Real Estate | 3,811 | 3,811 | - | - |
Utilities | 123,244 | 123,244 | - | - |
|
| Preferred Securities | 2,024 | - | - | 2,024 |
|
| Money Market Funds | 224,477 | 224,477 | - | - |
| Total Investments in Securities: | 16,999,439 | 15,987,855 | 372,624 | 638,960 |
The following is a reconciliation of Investments in Securities for which Level 3 inputs were used in determining value:
| (Amounts in thousands) | |
| Investments in Securities: | |
| Industrials | | | |
| Beginning Balance | $ | 412,312 | |
| Net Realized Gain (Loss) on Investment Securities | | - | |
| Net Unrealized Gain (Loss) on Investment Securities | | 27,677 | |
| Cost of Purchases | | 3,176 | |
| Proceeds of Sales | | - | |
| Amortization/Accretion | | - | |
| Transfers into Level 3 | | - | |
| Transfers out of Level 3 | | - | |
| Ending Balance | $ | 443,165 | |
| The change in unrealized gain (loss) for the period attributable to Level 3 securities held at June 30, 2023 | $ | 27,677 | |
| Other Investments in Securities | | | |
| Beginning Balance | $ | 199,630 | |
| Net Realized Gain (Loss) on Investment Securities | | - | |
| Net Unrealized Gain (Loss) on Investment Securities | | (18,556) | |
| Cost of Purchases | | 14,721 | |
| Proceeds of Sales | | - | |
| Amortization/Accretion | | - | |
| Transfers into Level 3 | | - | |
| Transfers out of Level 3 | | - | |
| Ending Balance | $ | 195,795 | |
| The change in unrealized gain (loss) for the period attributable to Level 3 securities held at June 30, 2023 | $ | (18,556) | |
| The information used in the above reconciliation represents fiscal year to date activity for any Investments in Securities identified as using Level 3 inputs at either the beginning or the end of the current fiscal period. Cost of purchases and proceeds of sales may include securities received and/or delivered through in-kind transactions, corporate actions or exchanges. Transfers into Level 3 were attributable to a lack of observable market data resulting from decreases in market activity, decreases in liquidity, security restructurings or corporate actions. Transfers out of Level 3 were attributable to observable market data becoming available for those securities. Transfers in or out of Level 3 represent the beginning value of any Security or Instrument where a change in the pricing level occurred from the beginning to the end of the period. Realized and unrealized gains (losses) disclosed in the reconciliation are included in Net Gain (Loss) on the Fund's Statement of Operations. | |
| Statement of Assets and Liabilities |
| Amounts in thousands (except per-share amounts) | | | | June 30, 2023 (Unaudited) |
| | | | | |
| Assets | | | | |
| Investment in securities, at value (including securities loaned of $41,012) - See accompanying schedule: | | | | |
Unaffiliated issuers (cost $7,497,088) | $ | 16,774,962 | | |
Fidelity Central Funds (cost $224,477) | | 224,477 | | |
| | | | | |
| | | | | |
| Total Investment in Securities (cost $7,721,565) | | | $ | 16,999,439 |
| Cash | | | | 34 |
| Restricted cash | | | | 141 |
| Foreign currency held at value (cost $1,091) | | | | 1,091 |
| Receivable for investments sold | | | | 7,019 |
| Receivable for fund shares sold | | | | 17,151 |
| Dividends receivable | | | | 9,303 |
| Distributions receivable from Fidelity Central Funds | | | | 954 |
| Other receivables | | | | 889 |
Total assets | | | | 17,036,021 |
| Liabilities | | | | |
| Payable for investments purchased | $ | 31,711 | | |
| Payable for fund shares redeemed | | 13,349 | | |
| Accrued management fee | | 3,639 | | |
| Distribution and service plan fees payable | | 2,376 | | |
| Other affiliated payables | | 2,164 | | |
| Other payables and accrued expenses | | 3,090 | | |
| Collateral on securities loaned | | 41,536 | | |
| Total Liabilities | | | | 97,865 |
| Net Assets | | | $ | 16,938,156 |
| Net Assets consist of: | | | | |
| Paid in capital | | | $ | 7,016,075 |
| Total accumulated earnings (loss) | | | | 9,922,081 |
| Net Assets | | | $ | 16,938,156 |
| | | | | |
| Net Asset Value and Maximum Offering Price | | | | |
| Class A : | | | | |
Net Asset Value and redemption price per share ($5,945,580 ÷ 192,693 shares) (a) | | | $ | 30.86 |
| Maximum offering price per share (100/94.25 of $30.86) | | | $ | 32.74 |
| Class M : | | | | |
Net Asset Value and redemption price per share ($1,459,793 ÷ 50,706 shares) (a) | | | $ | 28.79 |
| Maximum offering price per share (100/96.50 of $28.79) | | | $ | 29.83 |
| Class C : | | | | |
Net Asset Value and offering price per share ($682,224 ÷ 29,300 shares) (a) | | | $ | 23.28 |
| Class I : | | | | |
Net Asset Value , offering price and redemption price per share ($7,453,822 ÷ 231,201 shares) | | | $ | 32.24 |
| Class Z : | | | | |
Net Asset Value , offering price and redemption price per share ($1,396,737 ÷ 43,126 shares) | | | $ | 32.39 |
(a)Redemption price per share is equal to net asset value less any applicable contingent deferred sales charge. |
| Statement of Operations |
| Amounts in thousands | | | | Six months ended June 30, 2023 (Unaudited) |
| Investment Income | | | | |
| Dividends | | | $ | 78,575 |
| Income from Fidelity Central Funds (including $50 from security lending) | | | | 5,408 |
| Total Income | | | | 83,983 |
| Expenses | | | | |
| Management fee | | | | |
| Basic fee | $ | 41,293 | | |
| Performance adjustment | | (22,239) | | |
| Transfer agent fees | | 11,953 | | |
| Distribution and service plan fees | | 13,559 | | |
| Accounting fees | | 699 | | |
| Custodian fees and expenses | | 122 | | |
| Independent trustees' fees and expenses | | 56 | | |
| Registration fees | | 127 | | |
| Audit | | 75 | | |
| Legal | | 14 | | |
| Miscellaneous | | 50 | | |
| Total expenses before reductions | | 45,709 | | |
| Expense reductions | | (357) | | |
| Total expenses after reductions | | | | 45,352 |
| Net Investment income (loss) | | | | 38,631 |
| Realized and Unrealized Gain (Loss) | | | | |
| Net realized gain (loss) on: | | | | |
| Investment Securities: | | | | |
| Unaffiliated issuers | | 731,387 | | |
| Foreign currency transactions | | (81) | | |
| Total net realized gain (loss) | | | | 731,306 |
| Change in net unrealized appreciation (depreciation) on: | | | | |
| Investment Securities: | | | | |
| Unaffiliated issuers(net of increase in deferred foreign taxes of $171) | | 2,472,497 | | |
| Unfunded commitments | | 1,477 | | |
| Assets and liabilities in foreign currencies | | 30 | | |
| Total change in net unrealized appreciation (depreciation) | | | | 2,474,004 |
| Net gain (loss) | | | | 3,205,310 |
| Net increase (decrease) in net assets resulting from operations | | | $ | 3,243,941 |
| Statement of Changes in Net Assets |
| |
| Amount in thousands | | Six months ended June 30, 2023 (Unaudited) | | Year ended December 31, 2022 |
| Increase (Decrease) in Net Assets | | | | |
| Operations | | | | |
| Net investment income (loss) | $ | 38,631 | $ | 78,687 |
| Net realized gain (loss) | | 731,306 | | 2,614,201 |
| Change in net unrealized appreciation (depreciation) | | 2,474,004 | | (9,619,706) |
| Net increase (decrease) in net assets resulting from operations | | 3,243,941 | | (6,926,818) |
| Distributions to shareholders | | (227,200) | | (2,142,096) |
| | | | | |
| Share transactions - net increase (decrease) | | (923,262) | | (2,521,800) |
| Total increase (decrease) in net assets | | 2,093,479 | | (11,590,714) |
| | | | | |
| Net Assets | | | | |
| Beginning of period | | 14,844,677 | | 26,435,391 |
| End of period | $ | 16,938,156 | $ | 14,844,677 |
| | | | | |
| | | | | |
| Fidelity Advisor® New Insights Fund Class A |
| |
| | Six months ended (Unaudited) June 30, 2023 | | Years ended December 31, 2022 | | 2021 | | 2020 | | 2019 | | 2018 |
Selected Per-Share Data | | | | | | | | | | | | |
| Net asset value, beginning of period | $ | 25.50 | $ | 40.22 | $ | 36.57 | $ | 32.08 | $ | 26.50 | $ | 31.38 |
| Income from Investment Operations | | | | | | | | | | | | |
Net investment income (loss) A,B | | .06 | | .10 | | (.16) | | (.10) | | .06 | | .03 |
| Net realized and unrealized gain (loss) | | 5.70 | | (10.99) | | 8.90 | | 7.57 | | 7.60 | | (1.26) |
| Total from investment operations | | 5.76 | | (10.89) | | 8.74 | | 7.47 | | 7.66 | | (1.23) |
| Distributions from net investment income | | - C | | (.12) | | - | | - C | | (.04) | | - |
| Distributions from net realized gain | | (.40) | | (3.71) | | (5.09) | | (2.97) | | (2.04) | | (3.65) |
| Total distributions | | (.40) | | (3.83) | | (5.09) | | (2.98) D | | (2.08) | | (3.65) |
| Net asset value, end of period | $ | 30.86 | $ | 25.50 | $ | 40.22 | $ | 36.57 | $ | 32.08 | $ | 26.50 |
Total Return E,F,G | | 22.77% | | (27.48)% | | 24.30% | | 23.64% | | 29.15% | | (4.42)% |
Ratios to Average Net Assets B,H,I | | | | | | | | | | | | |
| Expenses before reductions | | .67% J | | .70% | | .93% | | 1.10% | | 1.08% | | 1.04% |
| Expenses net of fee waivers, if any | | .66% J | | .70% | | .93% | | 1.10% | | 1.08% | | 1.04% |
| Expenses net of all reductions | | .66% J | | .70% | | .93% | | 1.10% | | 1.07% | | 1.04% |
| Net investment income (loss) | | .40% J | | .32% | | (.40)% | | (.30)% | | .20% | | .08% |
| Supplemental Data | | | | | | | | | | | | |
| Net assets, end of period (in millions) | $ | 5,946 | $ | 5,101 | $ | 8,124 | $ | 6,753 | $ | 6,156 | $ | 4,747 |
Portfolio turnover rate K | | 17% J | | 32% L | | 29% | | 53% | | 27% L | | 36% |
A Calculated based on average shares outstanding during the period.
B Net investment income (loss) is affected by the timing of the declaration of dividends by any underlying mutual funds or exchange-traded funds (ETFs). Net investment income (loss) of any mutual funds or ETFs is not included in the Fund's net investment income (loss) ratio.
C Amount represents less than $.005 per share.
D Total distributions per share do not sum due to rounding.
E Total returns for periods of less than one year are not annualized.
F Total returns would have been lower if certain expenses had not been reduced during the applicable periods shown.
G Total returns do not include the effect of the sales charges.
H Fees and expenses of any underlying mutual funds or exchange-traded funds (ETFs) are not included in the Fund's expense ratio. The Fund indirectly bears its proportionate share of these expenses. For additional expense information related to investments in Fidelity Central Funds, please refer to the "Investments in Fidelity Central Funds" note found in the Notes to Financial Statements section of the most recent Annual or Semi-Annual report.
I Expense ratios reflect operating expenses of the class. Expenses before reductions do not reflect amounts reimbursed, waived, or reduced through arrangements with the investment adviser, brokerage services, or other offset arrangements, if applicable, and do not represent the amount paid by the class during periods when reimbursements, waivers or reductions occur.
J Annualized.
K Amount does not include the portfolio activity of any underlying mutual funds or exchange-traded funds (ETFs).
L Portfolio turnover rate excludes securities received or delivered in-kind.
| Fidelity Advisor® New Insights Fund Class M |
| |
| | Six months ended (Unaudited) June 30, 2023 | | Years ended December 31, 2022 | | 2021 | | 2020 | | 2019 | | 2018 |
Selected Per-Share Data | | | | | | | | | | | | |
| Net asset value, beginning of period | $ | 23.85 | $ | 37.93 | $ | 34.81 | $ | 30.73 | $ | 25.49 | $ | 30.39 |
| Income from Investment Operations | | | | | | | | | | | | |
Net investment income (loss) A,B | | .02 | | .02 | | (.25) | | (.17) | | (.01) | | (.05) |
| Net realized and unrealized gain (loss) | | 5.32 | | (10.34) | | 8.46 | | 7.22 | | 7.29 | | (1.20) |
| Total from investment operations | | 5.34 | | (10.32) | | 8.21 | | 7.05 | | 7.28 | | (1.25) |
| Distributions from net investment income | | - C | | (.05) | | - | | - | | - | | - |
| Distributions from net realized gain | | (.40) | | (3.71) | | (5.09) | | (2.97) | | (2.04) | | (3.65) |
| Total distributions | | (.40) | | (3.76) | | (5.09) | | (2.97) | | (2.04) | | (3.65) |
| Net asset value, end of period | $ | 28.79 | $ | 23.85 | $ | 37.93 | $ | 34.81 | $ | 30.73 | $ | 25.49 |
Total Return D,E,F | | 22.59% | | (27.64)% | | 24.00% | | 23.33% | | 28.79% | | (4.64)% |
Ratios to Average Net Assets B,G,H | | | | | | | | | | | | |
| Expenses before reductions | | .92% I | | .95% | | 1.18% | | 1.35% | | 1.32% | | 1.29% |
| Expenses net of fee waivers, if any | | .91% I | | .94% | | 1.18% | | 1.35% | | 1.32% | | 1.29% |
| Expenses net of all reductions | | .91% I | | .94% | | 1.18% | | 1.35% | | 1.32% | | 1.29% |
| Net investment income (loss) | | .15% I | | .07% | | (.65)% | | (.54)% | | (.05)% | | (.17)% |
| Supplemental Data | | | | | | | | | | | | |
| Net assets, end of period (in millions) | $ | 1,460 | $ | 1,254 | $ | 2,027 | $ | 1,856 | $ | 1,844 | $ | 1,638 |
Portfolio turnover rate J | | 17% I | | 32% K | | 29% | | 53% | | 27% K | | 36% |
A Calculated based on average shares outstanding during the period.
B Net investment income (loss) is affected by the timing of the declaration of dividends by any underlying mutual funds or exchange-traded funds (ETFs). Net investment income (loss) of any mutual funds or ETFs is not included in the Fund's net investment income (loss) ratio.
C Amount represents less than $.005 per share.
D Total returns would have been lower if certain expenses had not been reduced during the applicable periods shown.
E Total returns for periods of less than one year are not annualized.
F Total returns do not include the effect of the sales charges.
G Fees and expenses of any underlying mutual funds or exchange-traded funds (ETFs) are not included in the Fund's expense ratio. The Fund indirectly bears its proportionate share of these expenses. For additional expense information related to investments in Fidelity Central Funds, please refer to the "Investments in Fidelity Central Funds" note found in the Notes to Financial Statements section of the most recent Annual or Semi-Annual report.
H Expense ratios reflect operating expenses of the class. Expenses before reductions do not reflect amounts reimbursed, waived, or reduced through arrangements with the investment adviser, brokerage services, or other offset arrangements, if applicable, and do not represent the amount paid by the class during periods when reimbursements, waivers or reductions occur.
I Annualized.
J Amount does not include the portfolio activity of any underlying mutual funds or exchange-traded funds (ETFs).
K Portfolio turnover rate excludes securities received or delivered in-kind.
| Fidelity Advisor® New Insights Fund Class C |
| |
| | Six months ended (Unaudited) June 30, 2023 | | Years ended December 31, 2022 | | 2021 | | 2020 | | 2019 | | 2018 |
Selected Per-Share Data | | | | | | | | | | | | |
| Net asset value, beginning of period | $ | 19.41 | $ | 31.89 | $ | 30.09 | $ | 27.03 | $ | 22.73 | $ | 27.63 |
| Income from Investment Operations | | | | | | | | | | | | |
Net investment income (loss) A,B | | (.04) | | (.11) | | (.38) | | (.29) | | (.15) | | (.19) |
| Net realized and unrealized gain (loss) | | 4.31 | | (8.66) | | 7.27 | | 6.32 | | 6.49 | | (1.06) |
| Total from investment operations | | 4.27 | | (8.77) | | 6.89 | | 6.03 | | 6.34 | | (1.25) |
| Distributions from net investment income | | - C | | - | | - | | - | | - | | - |
| Distributions from net realized gain | | (.40) | | (3.71) | | (5.09) | | (2.97) | | (2.04) | | (3.65) |
| Total distributions | | (.40) | | (3.71) | | (5.09) | | (2.97) | | (2.04) | | (3.65) |
| Net asset value, end of period | $ | 23.28 | $ | 19.41 | $ | 31.89 | $ | 30.09 | $ | 27.03 | $ | 22.73 |
Total Return D,E,F | | 22.23% | | (28.02)% | | 23.36% | | 22.74% | | 28.15% | | (5.11)% |
Ratios to Average Net Assets B,G,H | | | | | | | | | | | | |
| Expenses before reductions | | 1.43% I | | 1.46% | | 1.70% | | 1.86% | | 1.83% | | 1.79% |
| Expenses net of fee waivers, if any | | 1.43% I | | 1.46% | | 1.69% | | 1.86% | | 1.83% | | 1.79% |
| Expenses net of all reductions | | 1.43% I | | 1.46% | | 1.69% | | 1.86% | | 1.83% | | 1.79% |
| Net investment income (loss) | | (.36)% I | | (.45)% | | (1.17)% | | (1.05)% | | (.55)% | | (.67)% |
| Supplemental Data | | | | | | | | | | | | |
| Net assets, end of period (in millions) | $ | 682 | $ | 672 | $ | 1,376 | $ | 1,973 | $ | 2,228 | $ | 2,932 |
Portfolio turnover rate J | | 17% I | | 32% K | | 29% | | 53% | | 27% K | | 36% |
A Calculated based on average shares outstanding during the period.
B Net investment income (loss) is affected by the timing of the declaration of dividends by any underlying mutual funds or exchange-traded funds (ETFs). Net investment income (loss) of any mutual funds or ETFs is not included in the Fund's net investment income (loss) ratio.
C Amount represents less than $.005 per share.
D Total returns for periods of less than one year are not annualized.
E Total returns would have been lower if certain expenses had not been reduced during the applicable periods shown.
F Total returns do not include the effect of the contingent deferred sales charge.
G Fees and expenses of any underlying mutual funds or exchange-traded funds (ETFs) are not included in the Fund's expense ratio. The Fund indirectly bears its proportionate share of these expenses. For additional expense information related to investments in Fidelity Central Funds, please refer to the "Investments in Fidelity Central Funds" note found in the Notes to Financial Statements section of the most recent Annual or Semi-Annual report.
H Expense ratios reflect operating expenses of the class. Expenses before reductions do not reflect amounts reimbursed, waived, or reduced through arrangements with the investment adviser, brokerage services, or other offset arrangements, if applicable, and do not represent the amount paid by the class during periods when reimbursements, waivers or reductions occur.
I Annualized.
J Amount does not include the portfolio activity of any underlying mutual funds or exchange-traded funds (ETFs).
K Portfolio turnover rate excludes securities received or delivered in-kind.
| Fidelity Advisor® New Insights Fund Class I |
| |
| | Six months ended (Unaudited) June 30, 2023 | | Years ended December 31, 2022 | | 2021 | | 2020 | | 2019 | | 2018 |
Selected Per-Share Data | | | | | | | | | | | | |
| Net asset value, beginning of period | $ | 26.60 | $ | 41.73 | $ | 37.69 | $ | 32.90 | $ | 27.14 | $ | 32.03 |
| Income from Investment Operations | | | | | | | | | | | | |
Net investment income (loss) A,B | | .10 | | .19 | | (.06) | | (.01) | | .15 | | .11 |
| Net realized and unrealized gain (loss) | | 5.94 | | (11.41) | | 9.19 | | 7.78 | | 7.77 | | (1.27) |
| Total from investment operations | | 6.04 | | (11.22) | | 9.13 | | 7.77 | | 7.92 | | (1.16) |
| Distributions from net investment income | | - C | | (.20) | | - | | - C | | (.12) | | (.07) |
| Distributions from net realized gain | | (.40) | | (3.71) | | (5.09) | | (2.97) | | (2.04) | | (3.65) |
| Total distributions | | (.40) | | (3.91) | | (5.09) | | (2.98) D | | (2.16) | | (3.73) D |
| Net asset value, end of period | $ | 32.24 | $ | 26.60 | $ | 41.73 | $ | 37.69 | $ | 32.90 | $ | 27.14 |
Total Return E,F | | 22.89% | | (27.28)% | | 24.62% | | 23.96% | | 29.42% | | (4.14)% |
Ratios to Average Net Assets B,G,H | | | | | | | | | | | | |
| Expenses before reductions | | .42% I | | .45% | | .68% | | .85% | | .82% | | .79% |
| Expenses net of fee waivers, if any | | .41% I | | .44% | | .68% | | .85% | | .82% | | .79% |
| Expenses net of all reductions | | .41% I | | .44% | | .68% | | .84% | | .82% | | .78% |
| Net investment income (loss) | | .66% I | | .57% | | (.15)% | | (.04)% | | .46% | | .33% |
| Supplemental Data | | | | | | | | | | | | |
| Net assets, end of period (in millions) | $ | 7,454 | $ | 6,585 | $ | 12,335 | $ | 12,219 | $ | 13,870 | $ | 12,581 |
Portfolio turnover rate J | | 17% I | | 32% K | | 29% | | 53% | | 27% K | | 36% |
A Calculated based on average shares outstanding during the period.
B Net investment income (loss) is affected by the timing of the declaration of dividends by any underlying mutual funds or exchange-traded funds (ETFs). Net investment income (loss) of any mutual funds or ETFs is not included in the Fund's net investment income (loss) ratio.
C Amount represents less than $.005 per share.
D Total distributions per share do not sum due to rounding.
E Total returns for periods of less than one year are not annualized.
F Total returns would have been lower if certain expenses had not been reduced during the applicable periods shown.
G Fees and expenses of any underlying mutual funds or exchange-traded funds (ETFs) are not included in the Fund's expense ratio. The Fund indirectly bears its proportionate share of these expenses. For additional expense information related to investments in Fidelity Central Funds, please refer to the "Investments in Fidelity Central Funds" note found in the Notes to Financial Statements section of the most recent Annual or Semi-Annual report.
H Expense ratios reflect operating expenses of the class. Expenses before reductions do not reflect amounts reimbursed, waived, or reduced through arrangements with the investment adviser, brokerage services, or other offset arrangements, if applicable, and do not represent the amount paid by the class during periods when reimbursements, waivers or reductions occur.
I Annualized.
J Amount does not include the portfolio activity of any underlying mutual funds or exchange-traded funds (ETFs).
K Portfolio turnover rate excludes securities received or delivered in-kind.
| Fidelity Advisor® New Insights Fund Class Z |
| |
| | Six months ended (Unaudited) June 30, 2023 | | Years ended December 31, 2022 | | 2021 | | 2020 | | 2019 | | 2018 |
Selected Per-Share Data | | | | | | | | | | | | |
| Net asset value, beginning of period | $ | 26.70 | $ | 41.89 | $ | 37.77 | $ | 32.93 | $ | 27.16 | $ | 32.06 |
| Income from Investment Operations | | | | | | | | | | | | |
Net investment income (loss) A,B | | .11 | | .23 | | (.01) | | .03 | | .18 | | .15 |
| Net realized and unrealized gain (loss) | | 5.98 | | (11.47) | | 9.22 | | 7.79 | | 7.79 | | (1.28) |
| Total from investment operations | | 6.09 | | (11.24) | | 9.21 | | 7.82 | | 7.97 | | (1.13) |
| Distributions from net investment income | | - C | | (.24) | | - | | - C | | (.17) | | (.12) |
| Distributions from net realized gain | | (.40) | | (3.71) | | (5.09) | | (2.97) | | (2.04) | | (3.65) |
| Total distributions | | (.40) | | (3.95) | | (5.09) | | (2.98) D | | (2.20) D | | (3.77) |
| Net asset value, end of period | $ | 32.39 | $ | 26.70 | $ | 41.89 | $ | 37.77 | $ | 32.93 | $ | 27.16 |
Total Return E,F | | 22.99% | | (27.21)% | | 24.79% | | 24.09% | | 29.60% | | (4.03)% |
Ratios to Average Net Assets B,G,H | | | | | | | | | | | | |
| Expenses before reductions | | .30% I | | .33% | | .56% | | .73% | | .70% | | .66% |
| Expenses net of fee waivers, if any | | .29% I | | .32% | | .56% | | .73% | | .70% | | .66% |
| Expenses net of all reductions | | .29% I | | .32% | | .56% | | .72% | | .70% | | .66% |
| Net investment income (loss) | | .77% I | | .69% | | (.03)% | | .08% | | .58% | | .46% |
| Supplemental Data | | | | | | | | | | | | |
| Net assets, end of period (in millions) | $ | 1,397 | $ | 1,233 | $ | 2,572 | $ | 2,101 | $ | 2,306 | $ | 1,741 |
Portfolio turnover rate J | | 17% I | | 32% K | | 29% | | 53% | | 27% K | | 36% |
A Calculated based on average shares outstanding during the period.
B Net investment income (loss) is affected by the timing of the declaration of dividends by any underlying mutual funds or exchange-traded funds (ETFs). Net investment income (loss) of any mutual funds or ETFs is not included in the Fund's net investment income (loss) ratio.
C Amount represents less than $.005 per share.
D Total distributions per share do not sum due to rounding.
E Total returns for periods of less than one year are not annualized.
F Total returns would have been lower if certain expenses had not been reduced during the applicable periods shown.
G Fees and expenses of any underlying mutual funds or exchange-traded funds (ETFs) are not included in the Fund's expense ratio. The Fund indirectly bears its proportionate share of these expenses. For additional expense information related to investments in Fidelity Central Funds, please refer to the "Investments in Fidelity Central Funds" note found in the Notes to Financial Statements section of the most recent Annual or Semi-Annual report.
H Expense ratios reflect operating expenses of the class. Expenses before reductions do not reflect amounts reimbursed, waived, or reduced through arrangements with the investment adviser, brokerage services, or other offset arrangements, if applicable, and do not represent the amount paid by the class during periods when reimbursements, waivers or reductions occur.
I Annualized.
J Amount does not include the portfolio activity of any underlying mutual funds or exchange-traded funds (ETFs).
K Portfolio turnover rate excludes securities received or delivered in-kind.
For the period ended June 30, 2023
( Amounts in thousands except percentages)
1. Organization.
Fidelity Advisor New Insights Fund (the Fund) is a fund of Fidelity Contrafund (the Trust) and is authorized to issue an unlimited number of shares. The Trust is registered under the Investment Company Act of 1940, as amended (the 1940 Act), as an open-end management investment company organized as a Massachusetts business trust. The Fund offers Class A, Class M, Class C, Class I and Class Z shares, each of which has equal rights as to assets and voting privileges. Class A, Class M, Class C, Class I and Class Z are Fidelity Advisor classes. Each class has exclusive voting rights with respect to matters that affect that class. Class C shares will automatically convert to Class A shares after a holding period of eight years from the initial date of purchase, with certain exceptions.
2. Investments in Fidelity Central Funds.
Funds may invest in Fidelity Central Funds, which are open-end investment companies generally available only to other investment companies and accounts managed by the investment adviser and its affiliates. The Schedule of Investments lists any Fidelity Central Funds held as an investment as of period end, but does not include the underlying holdings of each Fidelity Central Fund. An investing fund indirectly bears its proportionate share of the expenses of the underlying Fidelity Central Funds.
Based on its investment objective, each Fidelity Central Fund may invest or participate in various investment vehicles or strategies that are similar to those of the investing fund. These strategies are consistent with the investment objectives of the investing fund and may involve certain economic risks which may cause a decline in value of each of the Fidelity Central Funds and thus a decline in the value of the investing fund.
| Fidelity Central Fund | Investment Manager | Investment Objective | Investment Practices | Expense Ratio A |
| Fidelity Money Market Central Funds | Fidelity Management & Research Company LLC (FMR) | Each fund seeks to obtain a high level of current income consistent with the preservation of capital and liquidity. | Short-term Investments | Less than .005% |
A Expenses expressed as a percentage of average net assets and are as of each underlying Central Fund's most recent annual or semi-annual shareholder report.
A complete unaudited list of holdings for each Fidelity Central Fund is available upon request or at the Securities and Exchange Commission website at www.sec.gov. In addition, the financial statements of the Fidelity Central Funds which contain the significant accounting policies (including investment valuation policies) of those funds, and are not covered by the Report of Independent Registered Public Accounting Firm, are available on the Securities and Exchange Commission website or upon request.
3. Significant Accounting Policies.
The Fund is an investment company and applies the accounting and reporting guidance of the Financial Accounting Standards Board (FASB) Accounting Standards Codification Topic 946 Financial Services - Investment Companies . The financial statements have been prepared in conformity with accounting principles generally accepted in the United States of America (GAAP), which require management to make certain estimates and assumptions at the date of the financial statements. Actual results could differ from those estimates. Subsequent events, if any, through the date that the financial statements were issued have been evaluated in the preparation of the financial statements. The Fund's Schedule of Investments lists any underlying mutual funds or exchange-traded funds (ETFs) but does not include the underlying holdings of these funds. The following summarizes the significant accounting policies of the Fund:
Investment Valuation. Investments are valued as of 4:00 p.m. Eastern time on the last calendar day of the period. The Board of Trustees (the Board) has designated the Fund's investment adviser as the valuation designee responsible for the fair valuation function and performing fair value determinations as needed. The investment adviser has established a Fair Value Committee (the Committee) to carry out the day-to-day fair valuation responsibilities and has adopted policies and procedures to govern the fair valuation process and the activities of the Committee. In accordance with these fair valuation policies and procedures, which have been approved by the Board, the Fund attempts to obtain prices from one or more third party pricing services or brokers to value its investments. When current market prices, quotations or currency exchange rates are not readily available or reliable, investments will be fair valued in good faith by the Committee, in accordance with the policies and procedures. Factors used in determining fair value vary by investment type and may include market or investment specific events, transaction data, estimated cash flows, and market observations of comparable investments. The frequency that the fair valuation procedures are used cannot be predicted and they may be utilized to a significant extent. The Committee manages the Fund's fair valuation practices and maintains the fair valuation policies and procedures. The Fund's investment adviser reports to the Board information regarding the fair valuation process and related material matters.
The Fund categorizes the inputs to valuation techniques used to value its investments into a disclosure hierarchy consisting of three levels as shown below:
Level 1 - unadjusted quoted prices in active markets for identical investments
Level 2 - other significant observable inputs (including quoted prices for similar investments, interest rates, prepayment speeds, etc.)
Level 3 - unobservable inputs (including the Fund's own assumptions based on the best information available)
Valuation techniques used to value the Fund's investments by major category are as follows:
Equity securities, including restricted securities, for which market quotations are readily available, are valued at the last reported sale price or official closing price as reported by a third party pricing service on the primary market or exchange on which they are traded and are categorized as Level 1 in the hierarchy. In the event there were no sales during the day or closing prices are not available, securities are valued at the last quoted bid price or may be valued using the last available price and are generally categorized as Level 2 in the hierarchy. For foreign equity securities, when market or security specific events arise, comparisons to the valuation of American Depositary Receipts (ADRs), futures contracts, ETFs and certain indexes as well as quoted prices for similar securities may be used and would be categorized as Level 2 in the hierarchy. For equity securities, including restricted securities, where observable inputs are limited, assumptions about market activity and risk are used and these securities may be categorized as Level 3 in the hierarchy. Securities, including private placements or other restricted securities, for which observable inputs are not available are valued using alternate valuation approaches, including the market approach, the income approach and cost approach, and are categorized as Level 3 in the hierarchy. The market approach considers factors including the price of recent investments in the same or a similar security or financial metrics of comparable securities. The income approach considers factors including expected future cash flows, security specific risks and corresponding discount rates. The cost approach considers factors including the value of the security's underlying assets and liabilities.
Debt securities, including restricted securities, are valued based on evaluated prices received from third party pricing services or from brokers who make markets in such securities. Preferred securities are valued by pricing services who utilize matrix pricing which considers yield or price of bonds of comparable quality, coupon, maturity and type or by broker-supplied prices. When independent prices are unavailable or unreliable, debt securities may be valued utilizing pricing methodologies which consider similar factors that would be used by third party pricing services. Debt securities are generally categorized as Level 2 in the hierarchy but may be Level 3 depending on the circumstances.
Investments in open-end mutual funds, including the Fidelity Central Funds, are valued at their closing net asset value (NAV) each business day and are categorized as Level 1 in the hierarchy.
The following provides information on Level 3 securities held by the Fund that were valued at period end based on unobservable inputs. These amounts exclude valuations provided by a broker.
| Asset Type | Fair Value | Valuation Technique(s) | Unobservable Input | Amount or Range/Weighted Average | Impact to Valuation from an Increase in Input A |
| Equities | $636,936 | Market comparable | Enterprise value/EBITDA multiple (EV/EBITDA) | 6.0 - 22.0 / 15.0 | Increase |
| | | | Enterprise value/Revenue multiple (EV/R) | 0.6 - 43.7 / 9.3 | Increase |
| | | | Enterprise value/Net income multiple (EV/NI) | 14.5 | Increase |
| | | Recovery value | Recovery value | $0.00 - $0.17 / $0.15 | Increase |
| | | Market approach | Transaction price | $59.45 - $60.00 / $59.74 | Increase |
| | | | Premium rate | 10.0% | Increase |
| | | Discounted cash flow | Weighted average cost of capital (WACC) | 29.0% | Decrease |
| | | | Exit multiple | 1.8 | Increase |
| | | Black scholes | Discount rate | 4.0% - 4.7% / 4.2% | Increase |
| | | | Volatility | 70.0% - 80.0% / 74.6% | Increase |
| | | | Term | 2.0 - 5.0 / 3.7 | Increase |
| Preferred Securities | $2,024 | Recovery value | Recovery value | $0.00 | Increase |
| | | Market approach | Transaction price | $59.45 | Increase |
| | | | Premium rate | 10.0% | Increase |
| | | Black scholes | Discount rate | 4.7% | Increase |
| | | | Volatility | 70.0% | Increase |
| | | | Term | 2.0 | Increase |
A Represents the directional change in the fair value of the Level 3 investments that could have resulted from an increase in the corresponding input as of period end. A decrease to the unobservable input would have had the opposite effect. Significant changes in these inputs may have resulted in a significantly higher or lower fair value measurement at period end.
Changes in valuation techniques may result in transfers in or out of an assigned level within the disclosure hierarchy. The aggregate value of investments by input level as of June 30, 2023, as well as a roll forward of Level 3 investments, is included at the end of the Fund's Schedule of Investments.
Foreign Currency. Certain Funds may use foreign currency contracts to facilitate transactions in foreign-denominated securities. Gains and losses from these transactions may arise from changes in the value of the foreign currency or if the counterparties do not perform under the contracts' terms.
Foreign-denominated assets, including investment securities, and liabilities are translated into U.S. dollars at the exchange rates at period end. Purchases and sales of investment securities, income and dividends received, and expenses denominated in foreign currencies are translated into U.S. dollars at the exchange rate in effect on the transaction date.
The effects of exchange rate fluctuations on investments are included with the net realized and unrealized gain (loss) on investment securities. Other foreign currency transactions resulting in realized and unrealized gain (loss) are disclosed separately.
Investment Transactions and Income. For financial reporting purposes, the Fund's investment holdings and NAV include trades executed through the end of the last business day of the period. The NAV per share for processing shareholder transactions is calculated as of the close of business of the New York Stock Exchange (NYSE), normally 4:00 p.m. Eastern time and includes trades executed through the end of the prior business day. Gains and losses on securities sold are determined on the basis of identified cost and include proceeds received from litigation. Commissions paid to certain brokers with whom the investment adviser, or its affiliates, places trades on behalf of a fund include an amount in addition to trade execution, which may be rebated back to a fund. Any such rebates are included in net realized gain (loss) on investments in the Statement of Operations. Dividend income is recorded on the ex-dividend date, except for certain dividends from foreign securities where the ex-dividend date may have passed, which are recorded as soon as the Fund is informed of the ex-dividend date. Non-cash dividends included in dividend income, if any, are recorded at the fair market value of the securities received. Income and capital gain distributions from Fidelity Central Funds, if any, are recorded on the ex-dividend date. Certain distributions received by the Fund represent a return of capital or capital gain. The Fund determines the components of these distributions subsequent to the ex-dividend date, based upon receipt of tax filings or other correspondence relating to the underlying investment. These distributions are recorded as a reduction of cost of investments and/or as a realized gain. Interest income is accrued as earned and includes coupon interest and amortization of premium and accretion of discount on debt securities as applicable. Investment income is recorded net of foreign taxes withheld where recovery of such taxes is uncertain. Funds may file withholding tax reclaims in certain jurisdictions to recover a portion of amounts previously withheld. Any withholding tax reclaims income is included in the Statement of Operations in dividends. Any receivables for withholding tax reclaims are included in the Statement of Assets and Liabilities in dividends receivable.
Class Allocations and Expenses. Investment income, realized and unrealized capital gains and losses, common expenses of a fund, and certain fund-level expense reductions, if any, are allocated daily on a pro-rata basis to each class based on the relative net assets of each class to the total net assets of a fund. Each class differs with respect to transfer agent and distribution and service plan fees incurred, as applicable. Certain expense reductions may also differ by class, if applicable. For the reporting period, the allocated portion of income and expenses to each class as a percent of its average net assets may vary due to the timing of recording these transactions in relation to fluctuating net assets of the classes. Expenses directly attributable to a fund are charged to that fund. Expenses attributable to more than one fund are allocated among the respective funds on the basis of relative net assets or other appropriate methods. Expenses included in the accompanying financial statements reflect the expenses of that fund and do not include any expenses associated with any underlying mutual funds or exchange-traded funds (ETFs). Although not included in a fund's expenses, a fund indirectly bears its proportionate share of these expenses through the net asset value of each underlying mutual fund or exchange-traded fund (ETF). Expense estimates are accrued in the period to which they relate and adjustments are made when actual amounts are known.
Deferred Trustee Compensation. Under a Deferred Compensation Plan (the Plan) for certain Funds, certain independent Trustees have elected to defer receipt of a portion of their annual compensation. Deferred amounts are invested in affiliated mutual funds, are marked-to-market and remain in a fund until distributed in accordance with the Plan. The investment of deferred amounts and the offsetting payable to the Trustees presented below are included in the accompanying Statement of Assets and Liabilities in other receivables and other payables and accrued expenses, as applicable.
| Fidelity Advisor New Insights Fund | $748 |
Income Tax Information and Distributions to Shareholders. Each year, the Fund intends to qualify as a regulated investment company under Subchapter M of the Internal Revenue Code, including distributing substantially all of its taxable income and realized gains. As a result, no provision for U.S. Federal income taxes is required. The Fund files a U.S. federal tax return, in addition to state and local tax returns as required. The Fund's federal income tax returns are subject to examination by the Internal Revenue Service (IRS) for a period of three fiscal years after they are filed. State and local tax returns may be subject to examination for an additional fiscal year depending on the jurisdiction. Foreign taxes are provided for based on the Fund's understanding of the tax rules and rates that exist in the foreign markets in which it invests. The Fund is subject to a tax imposed on capital gains by certain countries in which it invests. An estimated deferred tax liability for net unrealized appreciation on the applicable securities is included in Other payables and accrued expenses on the Statement of Assets & Liabilities.
Distributions are declared and recorded on the ex-dividend date. Income and capital gain distributions are declared separately for each class. Income and capital gain distributions are determined in accordance with income tax regulations, which may differ from GAAP.
Capital accounts within the financial statements are adjusted for permanent book-tax differences. These adjustments have no impact on net assets or the results of operations. Capital accounts are not adjusted for temporary book-tax differences which will reverse in a subsequent period.
Book-tax differences are primarily due to foreign currency transactions, certain foreign taxes, passive foreign investment companies (PFIC), redemptions in-kind, partnerships, deferred Trustees compensation and losses deferred due to wash sales.
As of period end, the cost and unrealized appreciation (depreciation) in securities, and derivatives if applicable, for federal income tax purposes were as follows:
| Gross unrealized appreciation | $9,483,662 |
| Gross unrealized depreciation | (296,904) |
| Net unrealized appreciation (depreciation) | $9,186,758 |
| Tax cost | $7,812,681 |
Restricted Securities (including Private Placements). Funds may invest in securities that are subject to legal or contractual restrictions on resale. These securities generally may be resold in transactions exempt from registration or to the public if the securities are registered. Disposal of these securities may involve time-consuming negotiations and expense, and prompt sale at an acceptable price may be difficult. Information regarding restricted securities held at period end is included at the end of the Schedule of Investments, if applicable.
Consolidated Subsidiary. The Funds included in the table below hold certain investments through a wholly-owned subsidiary ("Subsidiary"), which may be subject to federal and state taxes upon disposition.
As of period end, investments in Subsidiaries were as follows:
| | $ Amount | % of Net Assets |
| Fidelity Advisor New Insights Fund | 24,806 | .15 |
The financial statements have been consolidated to include the Subsidiary accounts where applicable. Accordingly, all inter-company transactions and balances have been eliminated.
At period end, any estimated tax liability for these investments is presented as "Deferred taxes" in the Statement of Assets and Liabilities and included in "Change in net unrealized appreciation (depreciation) on investment securities" in the Statement of Operations. The tax liability incurred may differ materially depending on conditions when these investments are disposed. Any cash held by a Subsidiary is restricted as to its use and is presented as "Restricted cash" in the Statement of Assets and Liabilities, if applicable.
New Accounting Pronouncement. In June 2022, the Financial Accounting Standards Board (FASB) issued Accounting Standards Update (ASU) 2022-03 Fair Value Measurement (Topic 820): Fair Value Measurement of Equity Securities Subject to Contractual Sale Restrictions. The amendments in this ASU clarify that a contractual restriction on the sale of an equity security is not considered part of the unit of account of the equity security and, therefore, is not considered in measuring fair value. They also clarify that an entity cannot, as a separate unit of account, recognize and measure a contractual sale restriction. They also require additional disclosures for equity securities subject to contractual sale restrictions. ASU 2022-03 will be effective for fiscal years, including interim periods within those fiscal years, beginning after December 15, 2023, and allows for early adoption. ASU 2022-03 will only be applicable to an equity security in which the contractual arrangement that restricts its sale is executed or modified on or after the adoption date. Management is currently evaluating the potential impact of ASU 2022-03 to the financial statements.
4. Purchases and Sales of Investments.
Purchases and sales of securities, other than short-term securities and in-kind transactions, as applicable, are noted in the table below.
| | Purchases ($) | Sales ($) |
| Fidelity Advisor New Insights Fund | 1,317,425 | 2,548,978 |
Prior Fiscal Year Unaffiliated Redemptions In-Kind. Shares that were redeemed in-kind for investments, including accrued interest and cash, if any, are shown in the table below; along with realized gain or loss on investments delivered through in-kind redemptions. The amount of the in-kind redemptions is included in share transactions in the accompanying Statement of Changes in Net Assets. There was no gain or loss for federal income tax purposes.
| | Shares | Total net realized gain or loss ($) | Total Proceeds ($) | Participating classes |
| Fidelity Advisor New Insights Fund | 7,454 | 226,546 | 257,752 | Class I |
5. Fees and Other Transactions with Affiliates.
Management Fee. Fidelity Management & Research Company LLC (the investment adviser) and its affiliates provide the Fund with investment management related services for which the Fund pays a monthly management fee. The management fee is the sum of an individual fund fee rate that is based on an annual rate of .30% of the Fund's average net assets and an annualized group fee rate that averaged .23% during the period. The group fee rate is based upon the monthly average net assets of a group of registered investment companies with which the investment adviser has management contracts. The group fee rate decreases as assets under management increase and increases as assets under management decrease. In addition, the management fee is subject to a performance adjustment (up to a maximum of +/- .20% of the Fund's average net assets over a 36 month performance period). The upward or downward adjustment to the management fee is based on the relative investment performance of Class I as compared to its benchmark index, the S&P 500 Index, over the same 36 month performance period. For the reporting period, the total annualized management fee rate, including the performance adjustment, was .24% of the Fund's average net assets. The performance adjustment included in the management fee rate may be higher or lower than the maximum performance adjustment rate due to the difference between the average net assets for the reporting and performance periods.
Distribution and Service Plan Fees. In accordance with Rule 12b-1 of the 1940 Act, the Fund has adopted separate Distribution and Service Plans for each class of shares. Certain classes pay Fidelity Distributors Company LLC (FDC), an affiliate of the investment adviser, separate Distribution and Service Fees, each of which is based on an annual percentage of each class' average net assets. In addition, FDC may pay financial intermediaries for selling shares of the Fund and providing shareholder support services. For the period, the Distribution and Service Fee rates, total fees and amounts retained by FDC were as follows:
| | Distribution Fee | Service Fee | Total Fees | Retained by FDC |
| Class A | - % | .25% | $6,839 | $76 |
| Class M | .25% | .25% | 3,363 | 31 |
| Class C | .75% | .25% | 3,357 | 182 |
| | | | $13,559 | $289 |
Sales Load. FDC may receive a front-end sales charge of up to 5.75% for selling Class A shares and 3.50% for selling Class M shares, some of which is paid to financial intermediaries for selling shares of the Fund. Depending on the holding period, FDC may receive contingent deferred sales charges levied on Class A, Class M and Class C redemptions. The deferred sales charges are 1.00% for Class C shares, 1.00% for certain purchases of Class A shares and .25% for certain purchases of Class M shares.
For the period, sales charge amounts retained by FDC were as follows:
| | Retained by FDC |
| Class A | $841 |
| Class M | 48 |
Class C A | 77 |
| | $966 |
A When Class C shares are initially sold, FDC pays commissions from its own resources to financial intermediaries through which the sales are made.
Transfer Agent Fees. Fidelity Investments Institutional Operations Company LLC (FIIOC), an affiliate of the investment adviser, is the transfer, dividend disbursing and shareholder servicing agent for each class of the Fund. FIIOC receives account fees and asset-based fees that vary according to the account size and type of account of the shareholders of the respective classes of the Fund, except for Class Z. FIIOC receives an asset-based fee of Class Z's average net assets. FIIOC pays for typesetting, printing and mailing of shareholder reports, except proxy statements.
For the period, transfer agent fees for each class were as follows:
| | Amount | % of Class-Level Average Net Assets A |
| Class A | $4,450 | .16 |
| Class M | 1,083 | .16 |
| Class C | 590 | .18 |
| Class I | 5,557 | .16 |
| Class Z | 273 | .04 |
| | $11,953 | |
A Annualized
Accounting Fees. Fidelity Service Company, Inc. (FSC), an affiliate of the investment adviser, maintains the Fund's accounting records. The accounting fee is based on the level of average net assets for each month. For the period, the fees were equivalent to the following annualized rates:
| | % of Average Net Assets |
| Fidelity Advisor New Insights Fund | .01 |
Brokerage Commissions. A portion of portfolio transactions were placed with brokerage firms which are affiliates of the investment adviser. Brokerage commissions are included in net realized gain (loss) and change in net unrealized appreciation (depreciation) in the Statement of Operations. The commissions paid to these affiliated firms were as follows:
| | Amount |
| Fidelity Advisor New Insights Fund | $29 |
Interfund Trades. Funds may purchase from or sell securities to other Fidelity Funds under procedures adopted by the Board. The procedures have been designed to ensure these interfund trades are executed in accordance with Rule 17a-7 of the 1940 Act. Any interfund trades are included within the respective purchases and sales amounts shown in the Purchases and Sales of Investments note. Interfund trades during the period are noted in the table below.
| | Purchases ($) | Sales ($) | Realized Gain (Loss) ($) |
| Fidelity Advisor New Insights Fund | 49,171 | 298,820 | 171,394 |
6. Committed Line of Credit.
Certain Funds participate with other funds managed by the investment adviser or an affiliate in a $4.25 billion credit facility (the "line of credit") to be utilized for temporary or emergency purposes to fund shareholder redemptions or for other short-term liquidity purposes. The participating funds have agreed to pay commitment fees on their pro-rata portion of the line of credit, which are reflected in Miscellaneous expenses on the Statement of Operations, and are listed below. During the period, there were no borrowings on this line of credit.
| | Amount |
| Fidelity Advisor New Insights Fund | $16 |
7. Security Lending.
Funds lend portfolio securities from time to time in order to earn additional income. Lending agents are used, including National Financial Services (NFS), an affiliate of the investment adviser. Pursuant to a securities lending agreement, NFS will receive a fee, which is capped at 9.9% of a fund's daily lending revenue, for its services as lending agent. A fund may lend securities to certain qualified borrowers, including NFS. On the settlement date of the loan, a fund receives collateral (in the form of U.S. Treasury obligations, letters of credit and/or cash) against the loaned securities and maintains collateral in an amount not less than 100% of the market value of the loaned securities during the period of the loan. The market value of the loaned securities is determined at the close of business of a fund and any additional required collateral is delivered to a fund on the next business day. A fund or borrower may terminate the loan at any time, and if the borrower defaults on its obligation to return the securities loaned because of insolvency or other reasons, a fund may apply collateral received from the borrower against the obligation. A fund may experience delays and costs in recovering the securities loaned. Any cash collateral received is invested in the Fidelity Securities Lending Cash Central Fund. Any loaned securities are identified as such in the Schedule of Investments, and the value of loaned securities and cash collateral at period end, as applicable, are presented in the Statement of Assets and Liabilities. Security lending income represents the income earned on investing cash collateral, less rebates paid to borrowers and any lending agent fees associated with the loan, plus any premium payments received for lending certain types of securities. Security lending income is presented in the Statement of Operations as a component of income from Fidelity Central Funds. Affiliated security lending activity, if any, was as follows:
| | Total Security Lending Fees Paid to NFS | Security Lending Income From Securities Loaned to NFS | Value of Securities Loaned to NFS at Period End |
| Fidelity Advisor New Insights Fund | $5 | $- A | $- |
A In the amount of less than five hundred dollars.
8. Expense Reductions.
During the period the investment adviser or an affiliate reimbursed and/or waived a portion of fund-level operating expenses in the amount of $357.
9. Distributions to Shareholders.
Distributions to shareholders of each class were as follows:
| | Six months ended June 30, 2023 | Year ended December 31, 2022 |
| Fidelity Advisor New Insights Fund | | |
| Distributions to shareholders | | |
| Class A | $78,682 | $711,262 |
| Class M | 20,661 | 180,873 |
| Class C | 13,284 | 122,166 |
| Class I | 96,510 | 949,674 |
| Class Z | 18,063 | 178,121 |
Total | $227,200 | $2,142,096 |
10. Share Transactions.
Share transactions for each class were as follows and may contain in-kind transactions, automatic conversions between classes or exchanges between affiliated funds:
| | Shares | Shares | Dollars | Dollars |
| | Six months ended June 30, 2023 | Year ended December 31, 2022 | Six months ended June 30, 2023 | Year ended December 31, 2022 |
| Fidelity Advisor New Insights Fund | | | | |
| Class A | | | | |
| Shares sold | 6,676 | 14,534 | $184,758 | $453,687 |
| Reinvestment of distributions | 2,710 | 24,711 | 74,254 | 668,926 |
| Shares redeemed | (16,742) | (41,188) | (463,073) | (1,253,113) |
| Net increase (decrease) | (7,356) | (1,943) | $(204,061) | $(130,500) |
| Class M | | | | |
| Shares sold | 1,115 | 2,238 | $28,815 | $66,425 |
| Reinvestment of distributions | 790 | 6,959 | 20,204 | 176,641 |
| Shares redeemed | (3,785) | (10,054) | (98,107) | (289,096) |
| Net increase (decrease) | (1,880) | (857) | $(49,088) | $(46,030) |
| Class C | | | | |
| Shares sold | 936 | 2,448 | $19,602 | $60,323 |
| Reinvestment of distributions | 630 | 5,756 | 13,071 | 120,314 |
| Shares redeemed | (6,901) | (16,733) | (144,232) | (408,395) |
| Net increase (decrease) | (5,335) | (8,529) | $(111,559) | $(227,758) |
| Class I | | | | |
| Shares sold | 11,049 | 33,193 | $318,858 | $1,080,944 |
| Reinvestment of distributions | 3,100 | 30,686 | 88,670 | 869,015 |
| Shares redeemed | (30,533) | (111,868) | (879,368) | (3,533,622) |
| Net increase (decrease) | (16,384) | (47,989) | $(471,840) | $(1,583,663) |
| Class Z | | | | |
| Shares sold | 3,024 | 7,855 | $87,573 | $262,400 |
| Reinvestment of distributions | 532 | 5,259 | 15,278 | 149,168 |
| Shares redeemed | (6,593) | (28,356) | (189,565) | (945,417) |
| Net increase (decrease) | (3,037) | (15,242) | $(86,714) | $(533,849) |
11. Other.
A fund's organizational documents provide former and current trustees and officers with a limited indemnification against liabilities arising in connection with the performance of their duties to the fund. In the normal course of business, a fund may also enter into contracts that provide general indemnifications. A fund's maximum exposure under these arrangements is unknown as this would be dependent on future claims that may be made against a fund. The risk of material loss from such claims is considered remote.
12. Risk and Uncertainties.
Many factors affect a fund's performance. Developments that disrupt global economies and financial markets, such as pandemics, epidemics, outbreaks of infectious diseases, war, terrorism, and environmental disasters, may significantly affect a fund's investment performance. The effects of these developments to a fund will be impacted by the types of securities in which a fund invests, the financial condition, industry, economic sector, and geographic location of an issuer, and a fund's level of investment in the securities of that issuer. Significant concentrations in security types, issuers, industries, sectors, and geographic locations may magnify the factors that affect a fund's performance.
As a shareholder, you incur two types of costs: (1) transaction costs, which may include sales charges (loads) on purchase payments or redemption proceeds, as applicable and (2) ongoing costs, which generally include management fees, distribution and/or service (12b-1) fees and other Fund expenses. This Example is intended to help you understand your ongoing costs (in dollars) of investing in a fund and to compare these costs with the ongoing costs of investing in other mutual funds.
| The Example is based on an investment of $1,000 invested at the beginning of the period and held for the entire period (January 1, 2023 to June 30, 2023). |
Actual Expenses
The first line of the accompanying table provides information about actual account values and actual expenses. You may use the information in this line, together with the amount you invested, to estimate the expenses that you paid over the period. Simply divide your account value by $1,000.00 (for example, an $8,600 account value divided by $1,000.00 = 8.6), then multiply the result by the number in the first line for a class/Fund under the heading entitled "Expenses Paid During Period" to estimate the expenses you paid on your account during this period. If any fund is a shareholder of any underlying mutual funds or exchange-traded funds (ETFs) (the Underlying Funds), such fund indirectly bears its proportional share of the expenses of the Underlying Funds in addition to the direct expenses incurred presented in the table. These fees and expenses are not included in the annualized expense ratio used to calculate the expense estimate in the table below.
Hypothetical Example for Comparison Purposes
The second line of the accompanying table provides information about hypothetical account values and hypothetical expenses based on the actual expense ratio and an assumed rate of return of 5% per year before expenses, which is not the actual return. The hypothetical account values and expenses may not be used to estimate the actual ending account balance or expenses you paid for the period. You may use this information to compare the ongoing costs of investing in the Fund and other funds. To do so, compare this 5% hypothetical example with the 5% hypothetical examples that appear in the shareholder reports of the other funds. If any fund is a shareholder of any Underlying Funds, such fund indirectly bears its proportional share of the expenses of the Underlying Funds in addition to the direct expenses as presented in the table. These fees and expenses are not included in the annualized expense ratio used to calculate the expense estimate in the table below.
Please note that the expenses shown in the table are meant to highlight your ongoing costs only and do not reflect any transaction costs. Therefore, the second line of the table is useful in comparing ongoing costs only, and will not help you determine the relative total costs of owning different funds. In addition, if these transactional costs were included, your costs would have been higher.
| | | | | Annualized Expense Ratio- A | | Beginning Account Value January 1, 2023 | | Ending Account Value June 30, 2023 | | Expenses Paid During Period- C January 1, 2023 to June 30, 2023 |
| Fidelity Advisor® New Insights Fund | | | | | | | | | | |
| Class A | | | | .66% | | | | | | |
| Actual | | | | | | $ 1,000 | | $ 1,227.70 | | $ 3.65 |
Hypothetical- B | | | | | | $ 1,000 | | $ 1,021.52 | | $ 3.31 |
| Class M | | | | .91% | | | | | | |
| Actual | | | | | | $ 1,000 | | $ 1,225.90 | | $ 5.02 |
Hypothetical- B | | | | | | $ 1,000 | | $ 1,020.28 | | $ 4.56 |
| Class C | | | | 1.43% | | | | | | |
| Actual | | | | | | $ 1,000 | | $ 1,222.30 | | $ 7.88 |
Hypothetical- B | | | | | | $ 1,000 | | $ 1,017.70 | | $ 7.15 |
| Class I | | | | .41% | | | | | | |
| Actual | | | | | | $ 1,000 | | $ 1,228.90 | | $ 2.27 |
Hypothetical- B | | | | | | $ 1,000 | | $ 1,022.76 | | $ 2.06 |
| Class Z | | | | .29% | | | | | | |
| Actual | | | | | | $ 1,000 | | $ 1,229.90 | | $ 1.60 |
Hypothetical- B | | | | | | $ 1,000 | | $ 1,023.36 | | $ 1.45 |
| |
A Annualized expense ratio reflects expenses net of applicable fee waivers.
B 5% return per year before expenses
C Expenses are equal to the annualized expense ratio, multiplied by the average account value over the period, multiplied by 181/ 365 (to reflect the one-half year period). The fees and expenses of any Underlying Funds are not included in each annualized expense ratio.
Board Approval of Investment Advisory Contracts
Fidelity Advisor New Insights Fund
At its May 2023 meeting, the Board of Trustees, including the Independent Trustees (together, the Board), voted to continue the management contract with Fidelity Management & Research Company LLC (FMR), and the sub-advisory agreements and sub-subadvisory agreements, in each case, where applicable (together, the Advisory Contracts) for the fund for two months from June 1, 2023 through July 31, 2023. The Board determined that it will consider the annual renewal of the fund's Advisory Contracts for a full one year period in July 2023, following its review of additional materials provided by FMR.
The Board considered that the approval of the fund's Advisory Contracts will not result in any changes in (i) the investment process or strategies employed in the management of the fund's assets; (ii) the fees and expenses paid by shareholders; (iii) the nature, extent or quality of services provided under the fund's Advisory Contracts; or (iv) the day-to-day management of the fund or the persons primarily responsible for such management. The Board also considered that since its last approval of the fund's Advisory Contracts, FMR had provided additional information on the fund in support of the annual contract renewal process, including competitive analyses on total expenses and management fees and in-depth reviews of fund performance and fund profitability information. The Board concluded that the fund's Advisory Contracts are fair and reasonable, and that the fund's Advisory Contracts should be renewed, without modification, through July 31, 2023, with the understanding that the Board will consider the annual renewal for a full one year period in July 2023.
In connection with its consideration of future renewals of the fund's Advisory Contracts, the Board will consider: (i) the nature, extent and quality of services provided to the fund, including shareholder and administrative services and investment performance; (ii) the competitiveness of the management fee and total expenses for the fund; (iii) the costs of the services and profitability, including the revenues earned and the expenses incurred in conducting the business of developing, marketing, distributing, managing, administering, and servicing the fund and its shareholders, to the extent applicable; and (iv) whether there have been economies of scale in respect of the Fidelity funds, whether the Fidelity funds (including the fund) have appropriately benefited from any such economies of scale, and whether there is the potential for realization of any further economies.
Based on its evaluation of all of the conclusions noted above, and after considering all factors it believed relevant, the Board ultimately concluded that the fund's management fee structure is fair and reasonable, and that the continuation of the fund's Advisory Contracts should be approved for two months from June 1, 2023 through July 31, 2023.
The Securities and Exchange Commission adopted Rule 22e-4 under the Investment Company Act of 1940 (the Liquidity Rule) to promote effective liquidity risk management throughout the open-end investment company industry, thereby reducing the risk that funds will be unable to meet their redemption obligations and mitigating dilution of the interests of fund shareholders.
The Fund has adopted and implemented a liquidity risk management program (the Program) reasonably designed to assess and manage the Fund's liquidity risk and to comply with the requirements of the Liquidity Rule. The Fund's Board of Trustees (the Board) has designated the Fund's investment adviser as administrator of the Program. The Fidelity advisers have established a Liquidity Risk Management Committee (the LRM Committee) to manage the Program for each of the Fidelity Funds. The LRM Committee monitors the adequacy and effectiveness of implementation of the Program and on a periodic basis assesses each Fund's liquidity risk based on a variety of factors including (1) the Fund's investment strategy, (2) portfolio liquidity and cash flow projections during normal and reasonably foreseeable stressed conditions, (3) shareholder redemptions, (4) borrowings and other funding sources and (5) certain factors specific to ETFs including the effect of the Fund's prices and spreads, market participants, and basket compositions on the overall liquidity of the Fund's portfolio, as applicable.
In accordance with the Program, each of the Fund's portfolio investments is classified into one of four defined liquidity categories based on a determination of a reasonable expectation for how long it would take to convert the investment to cash (or sell or dispose of the investment) without significantly changing its market value.
- Highly liquid investments - cash or convertible to cash within three business days or less
- Moderately liquid investments - convertible to cash in three to seven calendar days
- Less liquid investments - can be sold or disposed of, but not settled, within seven calendar days
- Illiquid investments - cannot be sold or disposed of within seven calendar days
Liquidity classification determinations take into account a variety of factors including various market, trading and investment-specific considerations, as well as market depth, and generally utilize analysis from a third-party liquidity metrics service.
The Liquidity Rule places a 15% limit on a fund's illiquid investments and requires funds that do not primarily hold assets that are highly liquid investments to determine and maintain a minimum percentage of the fund's net assets to be invested in highly liquid investments (highly liquid investment minimum or HLIM). The Program includes provisions reasonably designed to comply with the 15% limit on illiquid investments and for determining, periodically reviewing and complying with the HLIM requirement as applicable.
At a recent meeting of the Fund's Board of Trustees, the LRM Committee provided a written report to the Board pertaining to the operation, adequacy, and effectiveness of the Program for the period December 1, 2021 through November 30, 2022. The report concluded that the Program is operating effectively and is reasonably designed to assess and manage the Fund's liquidity risk.
1.803542.119
ANIF-SANN-0823
Fidelity® Contrafund® K6
Semi-Annual Report
June 30, 2023
Contents
To view a fund's proxy voting guidelines and proxy voting record for the 12-month period ended June 30, visit http://www.fidelity.com/proxyvotingresults or visit the Securities and Exchange Commission's (SEC) web site at http://www.sec.gov.
You may also call 1-800-835-5092 to request a free copy of the proxy voting guidelines.
Standard & Poor's, S&P and S&P 500 are registered service marks of The McGraw-Hill Companies, Inc. and have been licensed for use by Fidelity Distributors Corporation.
Other third-party marks appearing herein are the property of their respective owners.
All other marks appearing herein are registered or unregistered trademarks or service marks of FMR LLC or an affiliated company. © 2023 FMR LLC. All rights reserved.
This report and the financial statements contained herein are submitted for the general information of the shareholders of the Fund. This report is not authorized for distribution to prospective investors in the Fund unless preceded or accompanied by an effective prospectus.
A fund files its complete schedule of portfolio holdings with the SEC for the first and third quarters of each fiscal year on Form N-PORT. Forms N-PORT are available on the SEC's web site at http://www.sec.gov. A fund's Forms N-PORT may be reviewed and copied at the SEC's Public Reference Room in Washington, DC. Information regarding the operation of the SEC's Public Reference Room may be obtained by calling 1-800-SEC-0330.
For a complete list of a fund's portfolio holdings, view the most recent holdings listing, semiannual report, or annual report on Fidelity's web site at http://www.fidelity.com, http://www.institutional.fidelity.com, or http://www.401k.com, as applicable.
NOT FDIC INSURED •MAY LOSE VALUE •NO BANK GUARANTEE
Neither the Fund nor Fidelity Distributors Corporation is a bank.
This report and the financial statements contained herein are submitted for the general information of the shareholders of the Fund. This report is not authorized for distribution to prospective investors in the Fund unless preceded or accompanied by an effective prospectus.
A fund files its complete schedule of portfolio holdings with the SEC for the first and third quarters of each fiscal year on Form N-PORT. Forms N-PORT are available on the SEC's web site at http://www.sec.gov. A fund's Forms N-PORT may be reviewed and copied at the SEC's Public Reference Room in Washington, DC. Information regarding the operation of the SEC's Public Reference Room may be obtained by calling 1-800-SEC-0330.
For a complete list of a fund's portfolio holdings, view the most recent holdings listing, semiannual report, or annual report on Fidelity's web site at http://www.fidelity.com, http://www.institutional.fidelity.com, or http://www.401k.com, as applicable.
NOT FDIC INSURED •MAY LOSE VALUE •NO BANK GUARANTEE
Neither the Fund nor Fidelity Distributors Corporation is a bank.
Top Holdings (% of Fund's net assets) |
| |
| Meta Platforms, Inc. Class A | 10.2 | |
| Berkshire Hathaway, Inc. Class A | 8.2 | |
| Microsoft Corp. | 6.6 | |
| Apple, Inc. | 5.1 | |
| Amazon.com, Inc. | 5.0 | |
| NVIDIA Corp. | 4.0 | |
| UnitedHealth Group, Inc. | 3.7 | |
| Eli Lilly & Co. | 2.6 | |
| Alphabet, Inc. Class A | 2.5 | |
| Alphabet, Inc. Class C | 2.2 | |
| | 50.1 | |
| |
| Market Sectors (% of Fund's net assets) |
| |
| Information Technology | 24.9 | |
| Communication Services | 17.6 | |
| Financials | 14.9 | |
| Health Care | 13.5 | |
| Consumer Discretionary | 9.4 | |
| Industrials | 5.7 | |
| Energy | 4.4 | |
| Materials | 2.9 | |
| Consumer Staples | 2.7 | |
| Utilities | 0.3 | |
| Real Estate | 0.0 | |
| |
Asset Allocation (% of Fund's net assets) |
|
|
Showing Percentage of Net Assets
| Common Stocks - 95.6% |
| | | Shares | Value ($) |
| COMMUNICATION SERVICES - 17.5% | | | |
| Entertainment - 2.4% | | | |
| Activision Blizzard, Inc. | | 317,710 | 26,782,953 |
| Liberty Media Corp. Liberty Formula One Series C (a) | | 853,255 | 64,233,036 |
| Netflix, Inc. (a) | | 1,055,179 | 464,795,798 |
| The Walt Disney Co. (a) | | 35,928 | 3,207,652 |
| Universal Music Group NV | | 1,773,619 | 39,384,842 |
| | | | 598,404,281 |
| Interactive Media & Services - 15.0% | | | |
| Alphabet, Inc.: | | | |
| Class A (a) | | 5,212,149 | 623,894,235 |
| Class C (a) | | 4,443,212 | 537,495,356 |
| Bumble, Inc. (a)(b) | | 438,262 | 7,354,036 |
| Epic Games, Inc. (a)(c)(d) | | 14,010 | 9,862,480 |
| Meta Platforms, Inc. Class A (a) | | 8,798,577 | 2,525,015,615 |
| | | | 3,703,621,722 |
| Media - 0.0% | | | |
| Comcast Corp. Class A | | 59,294 | 2,463,666 |
| Wireless Telecommunication Services - 0.1% | | | |
| T-Mobile U.S., Inc. (a) | | 196,130 | 27,242,457 |
TOTAL COMMUNICATION SERVICES | | | 4,331,732,126 |
| CONSUMER DISCRETIONARY - 9.4% | | | |
| Automobiles - 0.3% | | | |
| BYD Co. Ltd. (H Shares) | | 310,181 | 9,945,848 |
| General Motors Co. | | 186,565 | 7,193,946 |
| Harley-Davidson, Inc. | | 104,680 | 3,685,783 |
| Hyundai Motor Co. Ltd. | | 155,010 | 24,383,676 |
| Rad Power Bikes, Inc. (a)(c)(d) | | 331,574 | 739,410 |
| Rivian Automotive, Inc. (a) | | 104,766 | 1,745,402 |
| Tesla, Inc. (a) | | 35,575 | 9,312,468 |
| Toyota Motor Corp. | | 1,011,025 | 16,249,284 |
| | | | 73,255,817 |
| Broadline Retail - 5.3% | | | |
| Amazon.com, Inc. (a) | | 9,507,963 | 1,239,458,057 |
| Coupang, Inc. Class A (a) | | 2,297,748 | 39,980,815 |
| Dollarama, Inc. | | 131,721 | 8,920,935 |
| MercadoLibre, Inc. (a) | | 14,784 | 17,513,126 |
| | | | 1,305,872,933 |
| Hotels, Restaurants & Leisure - 1.1% | | | |
| Airbnb, Inc. Class A (a) | | 856,874 | 109,816,972 |
| Booking Holdings, Inc. (a) | | 7,453 | 20,125,559 |
| Cava Group, Inc. (b) | | 56,400 | 2,309,580 |
| Chipotle Mexican Grill, Inc. (a) | | 15,758 | 33,706,362 |
| Churchill Downs, Inc. | | 30,877 | 4,297,152 |
| Deliveroo PLC Class A (a)(e) | | 8,895,740 | 12,935,740 |
| Doordash, Inc. (a) | | 309 | 23,614 |
| Evolution AB (e) | | 27,250 | 3,450,797 |
| Hilton Worldwide Holdings, Inc. | | 291,302 | 42,399,006 |
| Hyatt Hotels Corp. Class A (b) | | 24,062 | 2,757,024 |
| Las Vegas Sands Corp. (a) | | 77,142 | 4,474,236 |
| Marriott International, Inc. Class A | | 12,797 | 2,350,681 |
| McDonald's Corp. | | 96,851 | 28,901,307 |
| Restaurant Brands International, Inc. | | 106,275 | 8,239,672 |
| Starbucks Corp. | | 25,300 | 2,506,218 |
| | | | 278,293,920 |
| Household Durables - 0.3% | | | |
| D.R. Horton, Inc. | | 115,528 | 14,058,602 |
| Lennar Corp. Class A | | 461,013 | 57,769,539 |
| PulteGroup, Inc. | | 4,653 | 361,445 |
| | | | 72,189,586 |
| Leisure Products - 0.0% | | | |
| Bandai Namco Holdings, Inc. | | 44,802 | 1,037,494 |
| Specialty Retail - 2.0% | | | |
| Academy Sports & Outdoors, Inc. | | 818,087 | 44,217,602 |
| AutoZone, Inc. (a) | | 9,388 | 23,407,664 |
| Dick's Sporting Goods, Inc. | | 600,712 | 79,408,119 |
| Fanatics, Inc. Class A (a)(c)(d) | | 332,480 | 25,534,464 |
| Fast Retailing Co. Ltd. | | 38,806 | 9,952,761 |
| O'Reilly Automotive, Inc. (a) | | 86,864 | 82,981,179 |
| The Home Depot, Inc. | | 245,268 | 76,190,052 |
| TJX Companies, Inc. | | 364,331 | 30,891,625 |
| Ulta Beauty, Inc. (a) | | 110,459 | 51,981,453 |
| Wayfair LLC Class A (a) | | 11,402 | 741,244 |
| Williams-Sonoma, Inc. (b) | | 500,353 | 62,614,174 |
| | | | 487,920,337 |
| Textiles, Apparel & Luxury Goods - 0.4% | | | |
| Deckers Outdoor Corp. (a) | | 23,298 | 12,293,423 |
| Dr. Martens Ltd. | | 216,050 | 335,571 |
| lululemon athletica, Inc. (a) | | 16,931 | 6,408,384 |
| NIKE, Inc. Class B | | 355,288 | 39,213,137 |
| On Holding AG (a) | | 1,401,042 | 46,234,386 |
| Ralph Lauren Corp. (b) | | 20,316 | 2,504,963 |
| Tapestry, Inc. | | 165,947 | 7,102,532 |
| | | | 114,092,396 |
TOTAL CONSUMER DISCRETIONARY | | | 2,332,662,483 |
| CONSUMER STAPLES - 2.7% | | | |
| Beverages - 1.0% | | | |
| Anheuser-Busch InBev SA NV | | 219,664 | 12,449,995 |
| Constellation Brands, Inc. Class A (sub. vtg.) | | 40,501 | 9,968,511 |
| Diageo PLC | | 72,671 | 3,124,199 |
| PepsiCo, Inc. | | 626,882 | 116,111,084 |
| The Coca-Cola Co. | | 1,732,864 | 104,353,070 |
| | | | 246,006,859 |
| Consumer Staples Distribution & Retail - 1.3% | | | |
| Alimentation Couche-Tard, Inc. Class A (multi-vtg.) | | 362,403 | 18,583,156 |
| Casey's General Stores, Inc. | | 63,191 | 15,411,021 |
| Costco Wholesale Corp. | | 534,480 | 287,753,342 |
| Walmart, Inc. | | 309 | 48,569 |
| | | | 321,796,088 |
| Food Products - 0.2% | | | |
| Lamb Weston Holdings, Inc. | | 60,314 | 6,933,094 |
| Mondelez International, Inc. | | 522,591 | 38,117,788 |
| | | | 45,050,882 |
| Personal Care Products - 0.2% | | | |
| Estee Lauder Companies, Inc. Class A | | 117,879 | 23,149,078 |
| L'Oreal SA | | 1,900 | 886,305 |
| L'Oreal SA (a) | | 56,282 | 26,254,207 |
| Olaplex Holdings, Inc. (a) | | 748,152 | 2,783,125 |
| | | | 53,072,715 |
TOTAL CONSUMER STAPLES | | | 665,926,544 |
| ENERGY - 4.3% | | | |
| Oil, Gas & Consumable Fuels - 4.3% | | | |
| Birchcliff Energy Ltd. (b) | | 222,518 | 1,316,883 |
| Canadian Natural Resources Ltd. | | 1,243,339 | 69,902,917 |
| Cheniere Energy, Inc. | | 273,048 | 41,601,593 |
| Chevron Corp. | | 730,911 | 115,008,846 |
| ConocoPhillips Co. | | 1,623,399 | 168,200,370 |
| Diamondback Energy, Inc. | | 51,615 | 6,780,146 |
| EOG Resources, Inc. | | 554,505 | 63,457,552 |
| Exxon Mobil Corp. | | 2,869,735 | 307,779,079 |
| Hess Corp. | | 719,600 | 97,829,620 |
| Marathon Petroleum Corp. | | 52,307 | 6,098,996 |
| Occidental Petroleum Corp. (b) | | 1,303,384 | 76,638,979 |
| Pioneer Natural Resources Co. | | 130,115 | 26,957,226 |
| PrairieSky Royalty Ltd. | | 139,600 | 2,440,563 |
| Reliance Industries Ltd. | | 77,582 | 2,417,763 |
| Suncor Energy, Inc. | | 169,734 | 4,978,949 |
| Tourmaline Oil Corp. (b) | | 126,670 | 5,968,478 |
| Valero Energy Corp. | | 505,133 | 59,252,101 |
| | | | 1,056,630,061 |
| FINANCIALS - 14.9% | | | |
| Banks - 2.3% | | | |
| AIB Group PLC | | 774,600 | 3,254,188 |
| Banco Santander SA (Spain) | | 3,659,711 | 13,548,755 |
| Bank of America Corp. | | 5,425,420 | 155,655,300 |
| Bank of Ireland Group PLC | | 1,111,297 | 10,596,112 |
| East West Bancorp, Inc. | | 180,423 | 9,524,530 |
| First Citizens Bancshares, Inc. | | 7,149 | 9,175,384 |
| JPMorgan Chase & Co. | | 1,342,412 | 195,240,401 |
| Nu Holdings Ltd. (a) | | 2,221,202 | 17,525,284 |
| Royal Bank of Canada | | 1,081,082 | 103,248,533 |
| Starling Bank Ltd. Series D (a)(c)(d) | | 4,139,223 | 15,349,895 |
| Wells Fargo & Co. | | 888,106 | 37,904,364 |
| | | | 571,022,746 |
| Capital Markets - 0.4% | | | |
| BlackRock, Inc. Class A | | 2,558 | 1,767,936 |
| Brookfield Asset Management Ltd. Class A | | 13,030 | 425,301 |
| Brookfield Corp. (Canada) Class A | | 91,575 | 3,083,031 |
| Coinbase Global, Inc. (a) | | 309 | 22,109 |
| Goldman Sachs Group, Inc. | | 5,122 | 1,652,050 |
| Morgan Stanley | | 1,088,462 | 92,954,655 |
| MSCI, Inc. | | 8,806 | 4,132,568 |
| TulCo LLC (a)(c)(d)(f) | | 1,552 | 1,350,706 |
| | | | 105,388,356 |
| Consumer Finance - 0.2% | | | |
| American Express Co. | | 254,579 | 44,347,662 |
| Financial Services - 10.1% | | | |
| Adyen BV (a)(e) | | 4,051 | 7,014,986 |
| Berkshire Hathaway, Inc. Class A (a) | | 3,940 | 2,040,171,400 |
| MasterCard, Inc. Class A | | 110,665 | 43,524,545 |
| Visa, Inc. Class A | | 1,709,041 | 405,863,057 |
| | | | 2,496,573,988 |
| Insurance - 1.9% | | | |
| American International Group, Inc. | | 1,165,063 | 67,037,725 |
| Aon PLC | | 21,289 | 7,348,963 |
| Arthur J. Gallagher & Co. | | 167,359 | 36,747,016 |
| Brookfield Asset Management Reinsurance Partners Ltd. | | 1,943 | 65,737 |
| Chubb Ltd. | | 347,339 | 66,883,598 |
| Fairfax Financial Holdings Ltd. (sub. vtg.) | | 40,313 | 30,196,027 |
| Hartford Financial Services Group, Inc. | | 124,267 | 8,949,709 |
| Intact Financial Corp. | | 192,555 | 29,730,289 |
| Marsh & McLennan Companies, Inc. | | 178,299 | 33,534,476 |
| Progressive Corp. | | 865,313 | 114,541,482 |
| The Travelers Companies, Inc. | | 417,254 | 72,460,330 |
| | | | 467,495,352 |
TOTAL FINANCIALS | | | 3,684,828,104 |
| HEALTH CARE - 13.4% | | | |
| Biotechnology - 3.8% | | | |
| Alnylam Pharmaceuticals, Inc. (a) | | 128,193 | 24,348,978 |
| Argenx SE ADR (a) | | 72,185 | 28,132,660 |
| Arrowhead Pharmaceuticals, Inc. (a) | | 72,200 | 2,574,652 |
| Biogen, Inc. (a) | | 7,500 | 2,136,375 |
| Biohaven Ltd. | | 5,818 | 139,167 |
| Exact Sciences Corp. (a)(b) | | 59,116 | 5,550,992 |
| Galapagos NV sponsored ADR (a) | | 323,505 | 13,153,713 |
| Gilead Sciences, Inc. | | 299,369 | 23,072,369 |
| Intellia Therapeutics, Inc. (a) | | 46,601 | 1,900,389 |
| Krystal Biotech, Inc. (a) | | 12,213 | 1,433,806 |
| Legend Biotech Corp. ADR (a) | | 280,208 | 19,342,758 |
| Moderna, Inc. (a) | | 11,186 | 1,359,099 |
| Moonlake Immunotherapeutics (a) | | 95,100 | 4,850,100 |
| Nuvalent, Inc. Class A (a) | | 61,110 | 2,577,009 |
| Regeneron Pharmaceuticals, Inc. (a) | | 653,778 | 469,765,644 |
| Roivant Sciences Ltd. (a) | | 418,508 | 4,218,561 |
| Sarepta Therapeutics, Inc. (a) | | 22,872 | 2,619,301 |
| Seagen, Inc. (a) | | 12,487 | 2,403,248 |
| United Therapeutics Corp. (a) | | 139,193 | 30,726,855 |
| Vertex Pharmaceuticals, Inc. (a) | | 825,776 | 290,598,832 |
| Zai Lab Ltd. (a) | | 878,491 | 2,417,054 |
| | | | 933,321,562 |
| Health Care Equipment & Supplies - 0.9% | | | |
| Align Technology, Inc. (a) | | 10,274 | 3,633,297 |
| Boston Scientific Corp. (a) | | 615,656 | 33,300,833 |
| DexCom, Inc. (a) | | 57,152 | 7,344,604 |
| Edwards Lifesciences Corp. (a) | | 17,110 | 1,613,986 |
| GE Healthcare Holding LLC | | 122,578 | 9,958,237 |
| Inspire Medical Systems, Inc. (a) | | 12,840 | 4,168,378 |
| Intuitive Surgical, Inc. (a) | | 367,888 | 125,795,623 |
| Lantheus Holdings, Inc. (a) | | 26,865 | 2,254,511 |
| Penumbra, Inc. (a) | | 11,569 | 3,980,430 |
| Shockwave Medical, Inc. (a) | | 25,275 | 7,213,738 |
| Straumann Holding AG | | 54,319 | 8,808,897 |
| Stryker Corp. | | 46,917 | 14,313,908 |
| Surgical Science Sweden AB (a) | | 89,200 | 1,994,839 |
| | | | 224,381,281 |
| Health Care Providers & Services - 4.0% | | | |
| 23andMe Holding Co. Class A (a) | | 558,254 | 976,945 |
| agilon health, Inc. (a) | | 194,065 | 3,365,087 |
| AmerisourceBergen Corp. | | 45,075 | 8,673,782 |
| Cardinal Health, Inc. | | 86,112 | 8,143,612 |
| Elevance Health, Inc. | | 37,078 | 16,473,385 |
| HCA Holdings, Inc. | | 101,877 | 30,917,632 |
| Henry Schein, Inc. (a) | | 27,695 | 2,246,065 |
| P3 Health Partners, Inc. Class A (a) | | 307,680 | 919,963 |
| UnitedHealth Group, Inc. | | 1,919,104 | 922,398,147 |
| | | | 994,114,618 |
| Health Care Technology - 0.0% | | | |
| Doximity, Inc. (a)(b) | | 140,600 | 4,783,212 |
| Schrodinger, Inc. (a)(b) | | 77,891 | 3,888,319 |
| | | | 8,671,531 |
| Life Sciences Tools & Services - 0.6% | | | |
| Danaher Corp. | | 229,362 | 55,046,880 |
| Lonza Group AG | | 22 | 13,111 |
| Mettler-Toledo International, Inc. (a) | | 44,020 | 57,738,393 |
| Thermo Fisher Scientific, Inc. | | 62,801 | 32,766,422 |
| Veterinary Emergency Group LLC Class A (a)(c)(d)(f) | | 185,166 | 9,986,002 |
| | | | 155,550,808 |
| Pharmaceuticals - 4.1% | | | |
| AstraZeneca PLC sponsored ADR | | 159,016 | 11,380,775 |
| Bristol-Myers Squibb Co. | | 316,240 | 20,223,548 |
| DICE Therapeutics, Inc. (a)(b) | | 214,324 | 9,957,493 |
| Eli Lilly & Co. | | 1,361,267 | 638,406,998 |
| Intra-Cellular Therapies, Inc. (a) | | 134,745 | 8,532,053 |
| Johnson & Johnson | | 238,467 | 39,471,058 |
| Merck & Co., Inc. | | 1,897,134 | 218,910,292 |
| Novo Nordisk A/S Series B | | 47,750 | 7,713,528 |
| Nuvation Bio, Inc. (a) | | 2,064,621 | 3,716,318 |
| Royalty Pharma PLC | | 1,517,848 | 46,658,648 |
| Structure Therapeutics, Inc. ADR | | 91,828 | 3,817,290 |
| Ventyx Biosciences, Inc. (a) | | 38,622 | 1,266,802 |
| Verona Pharma PLC ADR (a) | | 85,613 | 1,809,859 |
| Zoetis, Inc. Class A | | 40,579 | 6,988,110 |
| | | | 1,018,852,772 |
TOTAL HEALTH CARE | | | 3,334,892,572 |
| INDUSTRIALS - 5.4% | | | |
| Aerospace & Defense - 1.2% | | | |
| Lockheed Martin Corp. | | 309,550 | 142,510,629 |
| Northrop Grumman Corp. | | 283,705 | 129,312,739 |
| Space Exploration Technologies Corp. Class A (a)(c)(d) | | 73,000 | 5,913,000 |
| TransDigm Group, Inc. | | 30,615 | 27,375,015 |
| | | | 305,111,383 |
| Air Freight & Logistics - 0.5% | | | |
| United Parcel Service, Inc. Class B | | 732,124 | 131,233,227 |
| Zipline International, Inc. (a)(c)(d) | | 87,466 | 3,516,133 |
| | | | 134,749,360 |
| Building Products - 0.1% | | | |
| Carrier Global Corp. (b) | | 160,700 | 7,988,397 |
| Toto Ltd. | | 215,189 | 6,506,543 |
| Trane Technologies PLC | | 87,707 | 16,774,841 |
| | | | 31,269,781 |
| Commercial Services & Supplies - 0.2% | | | |
| Aurora Innovation, Inc. (a) | | 330,839 | 972,667 |
| Cintas Corp. | | 37,617 | 18,698,658 |
| Clean Harbors, Inc. (a)(b) | | 149,648 | 24,606,621 |
| Clean TeQ Water Pty Ltd. (a)(b) | | 326,711 | 52,196 |
| GFL Environmental, Inc. | | 74,689 | 2,900,171 |
| Republic Services, Inc. | | 51,000 | 7,811,670 |
| Waste Connections, Inc. (United States) | | 16,615 | 2,374,782 |
| | | | 57,416,765 |
| Construction & Engineering - 0.0% | | | |
| Larsen & Toubro Ltd. | | 88,800 | 2,684,476 |
| Electrical Equipment - 0.5% | | | |
| AMETEK, Inc. | | 15,987 | 2,587,976 |
| Eaton Corp. PLC | | 352,515 | 70,890,767 |
| Hubbell, Inc. Class B | | 151,726 | 50,306,273 |
| nVent Electric PLC | | 167,843 | 8,672,448 |
| Prysmian SpA | | 63,000 | 2,631,582 |
| | | | 135,089,046 |
| Ground Transportation - 0.6% | | | |
| Canadian Pacific Kansas City Ltd. | | 743,982 | 60,091,394 |
| J.B. Hunt Transport Services, Inc. | | 97,496 | 17,649,701 |
| Old Dominion Freight Lines, Inc. | | 119,673 | 44,249,092 |
| Uber Technologies, Inc. (a) | | 396,662 | 17,123,899 |
| Vamos Locacao de Caminhoes Maquinas e Equipamentos SA | | 30,800 | 77,897 |
| | | | 139,191,983 |
| Industrial Conglomerates - 0.7% | | | |
| General Electric Co. | | 1,503,742 | 165,186,059 |
| Machinery - 0.9% | | | |
| Caterpillar, Inc. | | 100,322 | 24,684,228 |
| Crane Nxt Co. | | 15,917 | 898,355 |
| Deere & Co. | | 211,198 | 85,575,318 |
| Fortive Corp. | | 173,492 | 12,971,997 |
| Indutrade AB | | 95,175 | 2,143,464 |
| PACCAR, Inc. | | 888,559 | 74,327,960 |
| Parker Hannifin Corp. | | 32,845 | 12,810,864 |
| | | | 213,412,186 |
| Passenger Airlines - 0.2% | | | |
| Copa Holdings SA Class A | | 45,199 | 4,998,105 |
| Ryanair Holdings PLC sponsored ADR (a) | | 324,100 | 35,845,460 |
| | | | 40,843,565 |
| Professional Services - 0.1% | | | |
| Thomson Reuters Corp. | | 26,308 | 3,551,952 |
| Verisk Analytics, Inc. | | 86,063 | 19,452,820 |
| | | | 23,004,772 |
| Trading Companies & Distributors - 0.4% | | | |
| United Rentals, Inc. | | 53,932 | 24,019,695 |
| W.W. Grainger, Inc. | | 99,857 | 78,746,232 |
| | | | 102,765,927 |
TOTAL INDUSTRIALS | | | 1,350,725,303 |
| INFORMATION TECHNOLOGY - 24.8% | | | |
| Communications Equipment - 0.4% | | | |
| Arista Networks, Inc. (a) | | 577,746 | 93,629,517 |
| Motorola Solutions, Inc. | | 32,171 | 9,435,111 |
| | | | 103,064,628 |
| Electronic Equipment, Instruments & Components - 1.9% | | | |
| Amphenol Corp. Class A | | 5,155,216 | 437,935,599 |
| CDW Corp. | | 98,583 | 18,089,981 |
| Jabil, Inc. | | 143,153 | 15,450,503 |
| | | | 471,476,083 |
| IT Services - 1.0% | | | |
| Accenture PLC Class A | | 639,309 | 197,277,971 |
| Cloudflare, Inc. (a) | | 143,969 | 9,411,254 |
| Gartner, Inc. (a) | | 33,479 | 11,728,028 |
| MongoDB, Inc. Class A (a) | | 36,887 | 15,160,188 |
| Okta, Inc. (a) | | 108,174 | 7,501,867 |
| Shopify, Inc. Class A (a) | | 193,648 | 12,515,676 |
| X Holdings Corp. Class A (d) | | 102,340 | 3,962,605 |
| | | | 257,557,589 |
| Semiconductors & Semiconductor Equipment - 7.1% | | | |
| Advanced Micro Devices, Inc. (a) | | 1,658,479 | 188,917,343 |
| Advantest Corp. | | 52,409 | 7,058,654 |
| Allegro MicroSystems LLC (a) | | 101,031 | 4,560,539 |
| Analog Devices, Inc. | | 579,128 | 112,819,926 |
| Applied Materials, Inc. | | 71,360 | 10,314,374 |
| ASML Holding NV (depository receipt) | | 13,800 | 10,001,550 |
| Broadcom, Inc. | | 57,803 | 50,140,056 |
| First Solar, Inc. (a) | | 140,207 | 26,651,949 |
| Lattice Semiconductor Corp. (a) | | 478,487 | 45,968,246 |
| Microchip Technology, Inc. | | 30,768 | 2,756,505 |
| Monolithic Power Systems, Inc. | | 50,232 | 27,136,833 |
| NVIDIA Corp. | | 2,331,029 | 986,071,888 |
| ON Semiconductor Corp. (a) | | 1,221,171 | 115,498,353 |
| Qualcomm, Inc. | | 1,059,894 | 126,169,782 |
| Synaptics, Inc. (a) | | 25,981 | 2,218,258 |
| Taiwan Semiconductor Manufacturing Co. Ltd. sponsored ADR | | 403,677 | 40,739,083 |
| | | | 1,757,023,339 |
| Software - 9.3% | | | |
| Adobe, Inc. (a) | | 257,597 | 125,962,357 |
| ANSYS, Inc. (a) | | 4,024 | 1,329,006 |
| Cadence Design Systems, Inc. (a) | | 534,676 | 125,392,216 |
| Check Point Software Technologies Ltd. (a) | | 99,318 | 12,476,327 |
| Clear Secure, Inc. (b) | | 357,040 | 8,272,617 |
| Dynatrace, Inc. (a) | | 351,300 | 18,081,411 |
| Fortinet, Inc. (a) | | 649,030 | 49,060,178 |
| HubSpot, Inc. (a) | | 20,188 | 10,741,833 |
| Intuit, Inc. | | 15,310 | 7,014,889 |
| Microsoft Corp. | | 4,795,577 | 1,633,085,792 |
| Palo Alto Networks, Inc. (a)(b) | | 102,670 | 26,233,212 |
| Roper Technologies, Inc. | | 5,500 | 2,644,400 |
| Salesforce, Inc. (a) | | 1,051,554 | 222,151,298 |
| Samsara, Inc. (a) | | 20,465 | 567,085 |
| ServiceNow, Inc. (a) | | 26,785 | 15,052,366 |
| Stripe, Inc. Class B (a)(c)(d) | | 75,100 | 1,511,763 |
| Synopsys, Inc. (a) | | 83,574 | 36,388,955 |
| Tanium, Inc. Class B (a)(c)(d) | | 449,538 | 3,551,350 |
| ZenPayroll, Inc. (a)(c)(d) | | 50,300 | 1,583,947 |
| | | | 2,301,101,002 |
| Technology Hardware, Storage & Peripherals - 5.1% | | | |
| Apple, Inc. | | 6,525,105 | 1,265,674,617 |
| Dell Technologies, Inc. | | 49,344 | 2,670,004 |
| Samsung Electronics Co. Ltd. | | 46,510 | 2,561,149 |
| | | | 1,270,905,770 |
TOTAL INFORMATION TECHNOLOGY | | | 6,161,128,411 |
| MATERIALS - 2.9% | | | |
| Chemicals - 0.3% | | | |
| Air Products & Chemicals, Inc. | | 69,325 | 20,764,917 |
| Corteva, Inc. | | 110,017 | 6,303,974 |
| Linde PLC | | 24,633 | 9,387,144 |
| Sherwin-Williams Co. | | 39,143 | 10,393,249 |
| Westlake Corp. | | 150,699 | 18,004,010 |
| | | | 64,853,294 |
| Construction Materials - 0.0% | | | |
| Vulcan Materials Co. | | 35,400 | 7,980,576 |
| Metals & Mining - 2.6% | | | |
| Agnico Eagle Mines Ltd. (Canada) | | 41,865 | 2,090,485 |
| B2Gold Corp. | | 10,786,934 | 38,433,160 |
| Barrick Gold Corp. (Canada) | | 467,905 | 7,915,268 |
| Cleveland-Cliffs, Inc. (a) | | 649,160 | 10,879,922 |
| Franco-Nevada Corp. | | 985,176 | 140,412,214 |
| Freeport-McMoRan, Inc. | | 2,552,487 | 102,099,480 |
| Glencore PLC | | 1,655,709 | 9,387,681 |
| Ivanhoe Electric, Inc. | | 606,613 | 7,910,234 |
| Ivanhoe Mines Ltd. (a) | | 9,531,892 | 87,062,384 |
| Ivanhoe Mines Ltd. (a)(e) | | 1,400,665 | 12,793,392 |
| Lundin Gold, Inc. | | 5,800 | 69,394 |
| Newcrest Mining Ltd. | | 136,903 | 2,442,132 |
| Novagold Resources, Inc. (a) | | 1,659,560 | 6,576,856 |
| Nucor Corp. (b) | | 798,559 | 130,947,705 |
| POSCO sponsored ADR (b) | | 6,907 | 510,773 |
| Steel Dynamics, Inc. | | 602,745 | 65,657,013 |
| Sunrise Energy Metals Ltd. (a) | | 635,031 | 449,639 |
| Wheaton Precious Metals Corp. | | 381,793 | 16,510,980 |
| | | | 642,148,712 |
TOTAL MATERIALS | | | 714,982,582 |
| REAL ESTATE - 0.0% | | | |
| Equity Real Estate Investment Trusts (REITs) - 0.0% | | | |
| Equity Commonwealth | | 333,302 | 6,752,699 |
| UTILITIES - 0.3% | | | |
| Electric Utilities - 0.3% | | | |
| Constellation Energy Corp. | | 453,492 | 41,517,193 |
| PG&E Corp. (a) | | 1,597,208 | 27,599,754 |
| | | | 69,116,947 |
| TOTAL COMMON STOCKS (Cost $16,167,457,313) | | | 23,709,377,832 |
| | | | |
| Preferred Stocks - 0.7% |
| | | Shares | Value ($) |
| Convertible Preferred Stocks - 0.6% | | | |
| COMMUNICATION SERVICES - 0.1% | | | |
| Interactive Media & Services - 0.1% | | | |
| ByteDance Ltd. Series E1 (a)(c)(d) | | 80,736 | 18,233,418 |
| Reddit, Inc.: | | | |
| Series E(a)(c)(d) | | 27,300 | 944,307 |
| Series F(a)(c)(d) | | 149,136 | 5,158,614 |
| | | | 24,336,339 |
| CONSUMER DISCRETIONARY - 0.0% | | | |
| Automobiles - 0.0% | | | |
| Rad Power Bikes, Inc.: | | | |
| Series A(a)(c)(d) | | 43,228 | 96,398 |
| Series C(a)(c)(d) | | 170,098 | 379,319 |
| Series D(a)(c)(d) | | 404,900 | 902,927 |
| | | | 1,378,644 |
| Hotels, Restaurants & Leisure - 0.0% | | | |
| Discord, Inc. Series I (a)(c)(d) | | 2,700 | 830,061 |
| | | | |
TOTAL CONSUMER DISCRETIONARY | | | 2,208,705 |
| | | | |
| CONSUMER STAPLES - 0.0% | | | |
| Consumer Staples Distribution & Retail - 0.0% | | | |
| GoBrands, Inc.: | | | |
| Series G(a)(c)(d) | | 8,352 | 756,775 |
| Series H(a)(c)(d) | | 11,788 | 1,068,111 |
| | | | 1,824,886 |
| Food Products - 0.0% | | | |
| Bowery Farming, Inc. Series C1 (a)(c)(d) | | 37,316 | 320,918 |
| | | | |
TOTAL CONSUMER STAPLES | | | 2,145,804 |
| | | | |
| FINANCIALS - 0.0% | | | |
| Financial Services - 0.0% | | | |
| Acrisure Holdings, Inc. Series B (a)(c)(d) | | 57,282 | 1,603,323 |
| Circle Internet Financial Ltd. Series F (a)(c)(d) | | 118,667 | 2,853,941 |
| | | | 4,457,264 |
| HEALTH CARE - 0.1% | | | |
| Biotechnology - 0.0% | | | |
| ElevateBio LLC Series C (a)(c)(d) | | 486,500 | 2,062,760 |
| | | | |
| Health Care Providers & Services - 0.1% | | | |
| Lyra Health, Inc.: | | | |
| Series E(a)(c)(d) | | 190,800 | 3,190,176 |
| Series F(a)(c)(d) | | 11,519 | 192,598 |
| Somatus, Inc. Series E (a)(c)(d) | | 2,766 | 2,802,677 |
| | | | 6,185,451 |
TOTAL HEALTH CARE | | | 8,248,211 |
| | | | |
| INDUSTRIALS - 0.3% | | | |
| Aerospace & Defense - 0.2% | | | |
| Relativity Space, Inc.: | | | |
| Series D(a)(c)(d) | | 207,384 | 3,133,572 |
| Series E(a)(c)(d) | | 143,887 | 2,530,972 |
| Space Exploration Technologies Corp. Series N (a)(c)(d) | | 49,490 | 40,086,900 |
| | | | 45,751,444 |
| Air Freight & Logistics - 0.1% | | | |
| Zipline International, Inc.: | | | |
| Series E(a)(c)(d) | | 178,019 | 7,156,364 |
| Series F(d) | | 286,824 | 11,530,325 |
| | | | 18,686,689 |
| Construction & Engineering - 0.0% | | | |
| Beta Technologies, Inc. Series B, 6.00% (a)(c)(d) | | 47,990 | 5,202,596 |
| | | | |
TOTAL INDUSTRIALS | | | 69,640,729 |
| | | | |
| INFORMATION TECHNOLOGY - 0.1% | | | |
| Software - 0.1% | | | |
| ASAPP, Inc. Series C (a)(c)(d) | | 204,122 | 626,655 |
| Carbon, Inc.: | | | |
| Series D(a)(c)(d) | | 9,678 | 95,038 |
| Series E(a)(c)(d) | | 7,351 | 86,080 |
| Moloco, Inc. Series A (c)(d) | | 95,881 | 5,752,860 |
| Nuro, Inc.: | | | |
| Series C(a)(c)(d) | | 405,967 | 2,577,890 |
| Series D(a)(c)(d) | | 114,603 | 727,729 |
| Stripe, Inc.: | | | |
| Series H(a)(c)(d) | | 29,000 | 583,770 |
| Series I(c)(d) | | 321,951 | 6,480,874 |
| Tenstorrent, Inc. Series C1 (a)(c)(d) | | 33,000 | 1,946,340 |
| ZenPayroll, Inc.: | | | |
| Series D(a)(c)(d) | | 184,203 | 5,800,552 |
| Series E(a)(c)(d) | | 28,063 | 883,704 |
| | | | 25,561,492 |
| MATERIALS - 0.0% | | | |
| Metals & Mining - 0.0% | | | |
| High Power Exploration, Inc. Series A (a)(c)(d) | | 1,289,012 | 5,400,960 |
| | | | |
| TOTAL CONVERTIBLE PREFERRED STOCKS | | | 141,999,504 |
| Nonconvertible Preferred Stocks - 0.1% | | | |
| ENERGY - 0.1% | | | |
| Oil, Gas & Consumable Fuels - 0.1% | | | |
| Petroleo Brasileiro SA - Petrobras sponsored ADR | | 2,041,109 | 28,228,537 |
| | | | |
| FINANCIALS - 0.0% | | | |
| Financial Services - 0.0% | | | |
| Circle Internet Financial Ltd. Series E (a)(c)(d) | | 175,323 | 4,216,518 |
| | | | |
| TOTAL NONCONVERTIBLE PREFERRED STOCKS | | | 32,445,055 |
| TOTAL PREFERRED STOCKS (Cost $154,029,316) | | | 174,444,559 |
| | | | |
| Preferred Securities - 0.0% |
| | | Principal Amount (g) | Value ($) |
| INFORMATION TECHNOLOGY - 0.0% | | | |
| Software - 0.0% | | | |
Tenstorrent, Inc. 0% (c)(d)(h) (Cost $1,840,000) | | 1,840,000 | 1,825,280 |
| | | | |
| Money Market Funds - 4.4% |
| | | Shares | Value ($) |
| Fidelity Cash Central Fund 5.14% (i) | | 946,547,310 | 946,736,619 |
| Fidelity Securities Lending Cash Central Fund 5.14% (i)(j) | | 146,152,966 | 146,167,581 |
| TOTAL MONEY MARKET FUNDS (Cost $1,092,903,207) | | | 1,092,904,200 |
| | | | |
| TOTAL INVESTMENT IN SECURITIES - 100.7% (Cost $17,416,229,836) | 24,978,551,871 |
NET OTHER ASSETS (LIABILITIES) - (0.7)% | (162,856,186) |
| NET ASSETS - 100.0% | 24,815,695,685 |
| | |
Legend
| (b) | Security or a portion of the security is on loan at period end. |
| (c) | Restricted securities (including private placements) - Investment in securities not registered under the Securities Act of 1933 (excluding 144A issues). At the end of the period, the value of restricted securities (excluding 144A issues) amounted to $215,410,127 or 0.9% of net assets. |
| (e) | Security exempt from registration under Rule 144A of the Securities Act of 1933. These securities may be resold in transactions exempt from registration, normally to qualified institutional buyers. At the end of the period, the value of these securities amounted to $36,194,915 or 0.1% of net assets. |
| (f) | Investment is owned by a wholly-owned subsidiary (Subsidiary) that is treated as a corporation for U.S. tax purposes. |
| (g) | Amount is stated in United States dollars unless otherwise noted. |
| (h) | Security is perpetual in nature with no stated maturity date. |
| (i) | Affiliated fund that is generally available only to investment companies and other accounts managed by Fidelity Investments. The rate quoted is the annualized seven-day yield of the fund at period end. A complete unaudited listing of the fund's holdings as of its most recent quarter end is available upon request. In addition, each Fidelity Central Fund's financial statements are available on the SEC's website or upon request. |
| (j) | Investment made with cash collateral received from securities on loan. |
| Additional information on each restricted holding is as follows: |
| Security | Acquisition Date | Acquisition Cost ($) |
| Acrisure Holdings, Inc. Series B | 3/22/21 | 1,043,678 |
| | | |
| ASAPP, Inc. Series C | 4/30/21 | 1,346,613 |
| | | |
| Beta Technologies, Inc. Series B, 6.00% | 4/04/22 | 4,951,128 |
| | | |
| Bowery Farming, Inc. Series C1 | 5/18/21 | 2,248,263 |
| | | |
| ByteDance Ltd. Series E1 | 11/18/20 | 8,846,581 |
| | | |
| Carbon, Inc. Series D | 12/15/17 | 225,990 |
| | | |
| Carbon, Inc. Series E | 3/22/19 | 205,787 |
| | | |
| Circle Internet Financial Ltd. Series E | 5/11/21 | 2,845,500 |
| | | |
| Circle Internet Financial Ltd. Series F | 5/09/22 | 5,000,627 |
| | | |
| Discord, Inc. Series I | 9/15/21 | 1,486,686 |
| | | |
| ElevateBio LLC Series C | 3/09/21 | 2,040,868 |
| | | |
| Epic Games, Inc. | 7/13/20 - 7/30/20 | 8,055,750 |
| | | |
| Fanatics, Inc. Class A | 8/13/20 - 12/15/21 | 12,844,485 |
| | | |
| GoBrands, Inc. Series G | 3/02/21 | 2,085,639 |
| | | |
| GoBrands, Inc. Series H | 7/22/21 | 4,579,527 |
| | | |
| High Power Exploration, Inc. Series A | 11/15/19 - 3/04/21 | 6,793,094 |
| | | |
| Lyra Health, Inc. Series E | 1/14/21 | 1,747,079 |
| | | |
| Lyra Health, Inc. Series F | 6/04/21 | 180,899 |
| | | |
| Moloco, Inc. Series A | 6/26/23 | 5,752,860 |
| | | |
| Nuro, Inc. Series C | 10/30/20 | 5,299,737 |
| | | |
| Nuro, Inc. Series D | 10/29/21 | 2,388,982 |
| | | |
| Rad Power Bikes, Inc. | 1/21/21 | 1,599,460 |
| | | |
| Rad Power Bikes, Inc. Series A | 1/21/21 | 208,525 |
| | | |
| Rad Power Bikes, Inc. Series C | 1/21/21 | 820,526 |
| | | |
| Rad Power Bikes, Inc. Series D | 9/17/21 | 3,880,481 |
| | | |
| Reddit, Inc. Series E | 5/18/21 | 1,159,546 |
| | | |
| Reddit, Inc. Series F | 8/11/21 | 9,215,770 |
| | | |
| Relativity Space, Inc. Series D | 11/20/20 | 3,095,642 |
| | | |
| Relativity Space, Inc. Series E | 5/27/21 | 3,285,674 |
| | | |
| Somatus, Inc. Series E | 1/31/22 | 2,413,708 |
| | | |
| Space Exploration Technologies Corp. Class A | 2/16/21 | 3,065,927 |
| | | |
| Space Exploration Technologies Corp. Series N | 8/04/20 | 13,362,300 |
| | | |
| Starling Bank Ltd. Series D | 6/18/21 - 4/05/22 | 8,226,276 |
| | | |
| Stripe, Inc. Class B | 5/18/21 | 3,013,641 |
| | | |
| Stripe, Inc. Series H | 3/15/21 | 1,163,625 |
| | | |
| Stripe, Inc. Series I | 3/20/23 - 5/12/23 | 6,482,206 |
| | | |
| Tanium, Inc. Class B | 9/18/20 | 5,122,575 |
| | | |
| Tenstorrent, Inc. Series C1 | 4/23/21 | 1,961,992 |
| | | |
| Tenstorrent, Inc. 0% | 4/23/21 | 1,840,000 |
| | | |
| TulCo LLC | 8/24/17 - 9/07/18 | 651,224 |
| | | |
| Veterinary Emergency Group LLC Class A | 9/16/21 - 12/16/22 | 7,182,374 |
| | | |
| ZenPayroll, Inc. | 10/01/21 | 1,448,054 |
| | | |
| ZenPayroll, Inc. Series D | 7/16/19 | 2,452,184 |
| | | |
| ZenPayroll, Inc. Series E | 7/13/21 | 852,984 |
| | | |
| Zipline International, Inc. | 10/12/21 | 3,148,776 |
| | | |
| Zipline International, Inc. Series E | 12/21/20 | 5,808,653 |
| | | |
Affiliated Central Funds
Fiscal year to date information regarding the Fund's investments in Fidelity Central Funds, including the ownership percentage, is presented below.
| Affiliate | Value, beginning of period ($) | Purchases ($) | Sales Proceeds ($) | Dividend Income ($) | Realized Gain (loss) ($) | Change in Unrealized appreciation (depreciation) ($) | Value, end of period ($) | % ownership, end of period |
| Fidelity Cash Central Fund 5.14% | 962,008,110 | 2,157,717,579 | 2,172,989,070 | 18,219,986 | - | - | 946,736,619 | 2.4% |
| Fidelity Securities Lending Cash Central Fund 5.14% | 120,547,595 | 726,164,130 | 700,544,144 | 94,887 | - | - | 146,167,581 | 0.5% |
| Total | 1,082,555,705 | 2,883,881,709 | 2,873,533,214 | 18,314,873 | - | - | 1,092,904,200 | |
| | | | | | | | | |
Amounts in the dividend income column in the above table include any capital gain distributions from underlying funds, which are presented in the corresponding line item in the Statement of Operations, if applicable.
Amounts in the dividend income column for Fidelity Securities Lending Cash Central Fund represents the income earned on investing cash collateral, less rebates paid to borrowers and any lending agent fees associated with the loan, plus any premium payments received for lending certain types of securities.
Amounts included in the purchases and sales proceeds columns may include in-kind transactions, if applicable.
Investment Valuation
The following is a summary of the inputs used, as of June 30, 2023, involving the Fund's assets and liabilities carried at fair value. The inputs or methodology used for valuing securities may not be an indication of the risk associated with investing in those securities. For more information on valuation inputs, and their aggregation into the levels used below, please refer to the Investment Valuation section in the accompanying Notes to Financial Statements.
| Valuation Inputs at Reporting Date: |
| Description | Total ($) | Level 1 ($) | Level 2 ($) | Level 3 ($) |
Investments in Securities: | | | | |
|
| Equities: | | | | |
Communication Services | 4,356,068,465 | 4,321,869,646 | - | 34,198,819 |
Consumer Discretionary | 2,334,871,188 | 2,244,819,546 | 61,569,063 | 28,482,579 |
Consumer Staples | 668,072,348 | 623,211,838 | 42,714,706 | 2,145,804 |
Energy | 1,084,858,598 | 1,082,440,835 | 2,417,763 | - |
Financials | 3,693,501,886 | 3,647,563,762 | 20,563,741 | 25,374,383 |
Health Care | 3,343,140,783 | 3,314,775,988 | 10,130,582 | 18,234,213 |
Industrials | 1,420,366,032 | 1,332,052,955 | 9,243,215 | 79,069,862 |
Information Technology | 6,186,689,903 | 6,140,898,943 | 9,619,803 | 36,171,157 |
Materials | 720,383,542 | 702,703,130 | 12,279,452 | 5,400,960 |
Real Estate | 6,752,699 | 6,752,699 | - | - |
Utilities | 69,116,947 | 69,116,947 | - | - |
|
| Preferred Securities | 1,825,280 | - | - | 1,825,280 |
|
| Money Market Funds | 1,092,904,200 | 1,092,904,200 | - | - |
| Total Investments in Securities: | 24,978,551,871 | 24,579,110,489 | 168,538,325 | 230,903,057 |
| Statement of Assets and Liabilities |
| | | | June 30, 2023 (Unaudited) |
| | | | | |
| Assets | | | | |
| Investment in securities, at value (including securities loaned of $143,974,020) - See accompanying schedule: | | | | |
Unaffiliated issuers (cost $16,323,326,629) | $ | 23,885,647,671 | | |
Fidelity Central Funds (cost $1,092,903,207) | | 1,092,904,200 | | |
| | | | | |
| | | | | |
| Total Investment in Securities (cost $17,416,229,836) | | | $ | 24,978,551,871 |
| Restricted cash | | | | 14,557 |
| Foreign currency held at value (cost $2,765,524) | | | | 2,764,812 |
| Receivable for investments sold | | | | 2,452,621 |
| Receivable for fund shares sold | | | | 15,667,562 |
| Dividends receivable | | | | 10,526,399 |
| Distributions receivable from Fidelity Central Funds | | | | 4,534,832 |
| Other receivables | | | | 153,556 |
Total assets | | | | 25,014,666,210 |
| Liabilities | | | | |
| Payable for investments purchased | $ | 30,616,117 | | |
| Payable for fund shares redeemed | | 12,947,668 | | |
| Accrued management fee | | 9,051,370 | | |
| Other payables and accrued expenses | | 187,440 | | |
| Collateral on securities loaned | | 146,167,930 | | |
| Total Liabilities | | | | 198,970,525 |
| Net Assets | | | $ | 24,815,695,685 |
| Net Assets consist of: | | | | |
| Paid in capital | | | $ | 17,962,531,377 |
| Total accumulated earnings (loss) | | | | 6,853,164,308 |
| Net Assets | | | $ | 24,815,695,685 |
Net Asset Value , offering price and redemption price per share ($24,815,695,685 ÷ 1,189,950,620 shares) | | | $ | 20.85 |
| Statement of Operations |
| | | | Six months ended June 30, 2023 (Unaudited) |
| Investment Income | | | | |
| Dividends | | | $ | 105,888,127 |
| Income from Fidelity Central Funds (including $94,887 from security lending) | | | | 18,314,873 |
| Total Income | | | | 124,203,000 |
| Expenses | | | | |
| Management fee | $ | 48,489,938 | | |
| Independent trustees' fees and expenses | | 68,388 | | |
| Total expenses before reductions | | 48,558,326 | | |
| Expense reductions | | (13,870) | | |
| Total expenses after reductions | | | | 48,544,456 |
| Net Investment income (loss) | | | | 75,658,544 |
| Realized and Unrealized Gain (Loss) | | | | |
| Net realized gain (loss) on: | | | | |
| Investment Securities: | | | | |
| Unaffiliated issuers | | (167,398,870) | | |
| Foreign currency transactions | | (125,599) | | |
| Total net realized gain (loss) | | | | (167,524,469) |
| Change in net unrealized appreciation (depreciation) on: | | | | |
| Investment Securities: | | | | |
| Unaffiliated issuers(net of increase in deferred foreign taxes of $79,006) | | 4,778,656,648 | | |
| Unfunded commitments | | 777,124 | | |
| Assets and liabilities in foreign currencies | | (6,691) | | |
| Total change in net unrealized appreciation (depreciation) | | | | 4,779,427,081 |
| Net gain (loss) | | | | 4,611,902,612 |
| Net increase (decrease) in net assets resulting from operations | | | $ | 4,687,561,156 |
| Statement of Changes in Net Assets |
| |
| | Six months ended June 30, 2023 (Unaudited) | | Year ended December 31, 2022 |
| Increase (Decrease) in Net Assets | | | | |
| Operations | | | | |
| Net investment income (loss) | $ | 75,658,544 | $ | 134,044,290 |
| Net realized gain (loss) | | (167,524,469) | | (161,744,148) |
| Change in net unrealized appreciation (depreciation) | | 4,779,427,081 | | (7,153,578,023) |
| Net increase (decrease) in net assets resulting from operations | | 4,687,561,156 | | (7,181,277,881) |
| Distributions to shareholders | | (16,982,185) | | (224,884,344) |
| | | | | |
| Share transactions | | | | |
| Proceeds from sales of shares | | 3,036,476,128 | | 5,373,501,397 |
| Reinvestment of distributions | | 16,953,405 | | 224,688,774 |
| Cost of shares redeemed | | (1,992,542,915) | | (5,254,427,380) |
| | | | | |
Net increase (decrease) in net assets resulting from share transactions | | 1,060,886,618 | | 343,762,791 |
| Total increase (decrease) in net assets | | 5,731,465,589 | | (7,062,399,434) |
| | | | | |
| Net Assets | | | | |
| Beginning of period | | 19,084,230,096 | | 26,146,629,530 |
| End of period | $ | 24,815,695,685 | $ | 19,084,230,096 |
| | | | | |
| Other Information | | | | |
| Shares | | | | |
| Sold | | 161,586,504 | | 285,619,497 |
| Issued in reinvestment of distributions | | 933,556 | | 12,078,442 |
| Redeemed | | (106,744,063) | | (283,595,105) |
| Net increase (decrease) | | 55,775,997 | | 14,102,834 |
| | | | | |
| | Six months ended (Unaudited) June 30, 2023 | | Years ended December 31, 2022 | | 2021 | | 2020 | | 2019 | | 2018 |
Selected Per-Share Data | | | | | | | | | | | | |
| Net asset value, beginning of period | $ | 16.83 | $ | 23.34 | $ | 18.89 | $ | 14.47 | $ | 11.08 | $ | 11.36 |
| Income from Investment Operations | | | | | | | | | | | | |
Net investment income (loss) A,B | | .07 | | .12 | | .03 | | .03 | | .05 | | .05 |
| Net realized and unrealized gain (loss) | | 3.97 | | (6.43) | | 4.53 | | 4.43 | | 3.38 | | (.29) |
| Total from investment operations | | 4.04 | | (6.31) | | 4.56 | | 4.46 | | 3.43 | | (.24) |
| Distributions from net investment income | | (.02) | | (.11) | | (.05) | | (.04) | | (.04) | | (.04) |
| Distributions from net realized gain | | - | | (.09) | | (.06) | | - | | - | | - |
| Total distributions | | (.02) | | (.20) | | (.11) | | (.04) | | (.04) | | (.04) |
| Net asset value, end of period | $ | 20.85 | $ | 16.83 | $ | 23.34 | $ | 18.89 | $ | 14.47 | $ | 11.08 |
Total Return C,D | | 23.99% | | (27.12)% | | 24.14% | | 30.83% | | 31.00% | | (2.15)% |
Ratios to Average Net Assets B,E,F | | | | | | | | | | | | |
| Expenses before reductions | | .45% G | | .45% | | .45% | | .45% | | .45% | | .45% |
| Expenses net of fee waivers, if any | | .45% G | | .45% | | .45% | | .45% | | .45% | | .45% |
| Expenses net of all reductions | | .45% G | | .45% | | .45% | | .45% | | .45% | | .45% |
| Net investment income (loss) | | .70% G | | .64% | | .12% | | .18% | | .39% | | .39% |
| Supplemental Data | | | | | | | | | | | | |
| Net assets, end of period (000 omitted) | $ | 24,815,696 | $ | 19,084,230 | $ | 26,146,630 | $ | 17,402,109 | $ | 11,849,878 | $ | 5,278,087 |
Portfolio turnover rate H | | 32% G,I | | 38% I | | 40% I | | 45% I | | 39% I | | 54% I |
A Calculated based on average shares outstanding during the period.
B Net investment income (loss) is affected by the timing of the declaration of dividends by any underlying mutual funds or exchange-traded funds (ETFs). Net investment income (loss) of any mutual funds or ETFs is not included in the Fund's net investment income (loss) ratio.
C Total returns for periods of less than one year are not annualized.
D Total returns would have been lower if certain expenses had not been reduced during the applicable periods shown.
E Fees and expenses of any underlying mutual funds or exchange-traded funds (ETFs) are not included in the Fund's expense ratio. The Fund indirectly bears its proportionate share of these expenses. For additional expense information related to investments in Fidelity Central Funds, please refer to the "Investments in Fidelity Central Funds" note found in the Notes to Financial Statements section of the most recent Annual or Semi-Annual report.
F Expense ratios reflect operating expenses of the class. Expenses before reductions do not reflect amounts reimbursed, waived, or reduced through arrangements with the investment adviser, brokerage services, or other offset arrangements, if applicable, and do not represent the amount paid by the class during periods when reimbursements, waivers or reductions occur.
G Annualized.
H Amount does not include the portfolio activity of any underlying mutual funds or exchange-traded funds (ETFs).
I Portfolio turnover rate excludes securities received or delivered in-kind.
For the period ended June 30, 2023
1. Organization.
Fidelity Contrafund K6 (the Fund) is a fund of Fidelity Contrafund (the Trust) and is authorized to issue an unlimited number of shares. Share transactions on the Statement of Changes in Net Assets may contain exchanges between affiliated funds. The Trust is registered under the Investment Company Act of 1940, as amended (the 1940 Act), as an open-end management investment company organized as a Massachusetts business trust. Shares generally are available only to employer-sponsored retirement plans that are recordkept by Fidelity, or to certain employer-sponsored retirement plans that are not recordkept by Fidelity.
2. Investments in Fidelity Central Funds.
Funds may invest in Fidelity Central Funds, which are open-end investment companies generally available only to other investment companies and accounts managed by the investment adviser and its affiliates. The Schedule of Investments lists any Fidelity Central Funds held as an investment as of period end, but does not include the underlying holdings of each Fidelity Central Fund. An investing fund indirectly bears its proportionate share of the expenses of the underlying Fidelity Central Funds.
Based on its investment objective, each Fidelity Central Fund may invest or participate in various investment vehicles or strategies that are similar to those of the investing fund. These strategies are consistent with the investment objectives of the investing fund and may involve certain economic risks which may cause a decline in value of each of the Fidelity Central Funds and thus a decline in the value of the investing fund.
| Fidelity Central Fund | Investment Manager | Investment Objective | Investment Practices | Expense Ratio A |
| Fidelity Money Market Central Funds | Fidelity Management & Research Company LLC (FMR) | Each fund seeks to obtain a high level of current income consistent with the preservation of capital and liquidity. | Short-term Investments | Less than .005% |
A Expenses expressed as a percentage of average net assets and are as of each underlying Central Fund's most recent annual or semi-annual shareholder report.
A complete unaudited list of holdings for each Fidelity Central Fund is available upon request or at the Securities and Exchange Commission website at www.sec.gov. In addition, the financial statements of the Fidelity Central Funds which contain the significant accounting policies (including investment valuation policies) of those funds, and are not covered by the Report of Independent Registered Public Accounting Firm, are available on the Securities and Exchange Commission website or upon request.
3. Significant Accounting Policies.
The Fund is an investment company and applies the accounting and reporting guidance of the Financial Accounting Standards Board (FASB) Accounting Standards Codification Topic 946 Financial Services - Investment Companies . The financial statements have been prepared in conformity with accounting principles generally accepted in the United States of America (GAAP), which require management to make certain estimates and assumptions at the date of the financial statements. Actual results could differ from those estimates. Subsequent events, if any, through the date that the financial statements were issued have been evaluated in the preparation of the financial statements. The Fund's Schedule of Investments lists any underlying mutual funds or exchange-traded funds (ETFs) but does not include the underlying holdings of these funds. The following summarizes the significant accounting policies of the Fund:
Investment Valuation. Investments are valued as of 4:00 p.m. Eastern time on the last calendar day of the period. The Board of Trustees (the Board) has designated the Fund's investment adviser as the valuation designee responsible for the fair valuation function and performing fair value determinations as needed. The investment adviser has established a Fair Value Committee (the Committee) to carry out the day-to-day fair valuation responsibilities and has adopted policies and procedures to govern the fair valuation process and the activities of the Committee. In accordance with these fair valuation policies and procedures, which have been approved by the Board, the Fund attempts to obtain prices from one or more third party pricing services or brokers to value its investments. When current market prices, quotations or currency exchange rates are not readily available or reliable, investments will be fair valued in good faith by the Committee, in accordance with the policies and procedures. Factors used in determining fair value vary by investment type and may include market or investment specific events, transaction data, estimated cash flows, and market observations of comparable investments. The frequency that the fair valuation procedures are used cannot be predicted and they may be utilized to a significant extent. The Committee manages the Fund's fair valuation practices and maintains the fair valuation policies and procedures. The Fund's investment adviser reports to the Board information regarding the fair valuation process and related material matters.
The Fund categorizes the inputs to valuation techniques used to value its investments into a disclosure hierarchy consisting of three levels as shown below:
Level 1 - unadjusted quoted prices in active markets for identical investments
Level 2 - other significant observable inputs (including quoted prices for similar investments, interest rates, prepayment speeds, etc.)
Level 3 - unobservable inputs (including the Fund's own assumptions based on the best information available)
Valuation techniques used to value the Fund's investments by major category are as follows:
Equity securities, including restricted securities, for which market quotations are readily available, are valued at the last reported sale price or official closing price as reported by a third party pricing service on the primary market or exchange on which they are traded and are categorized as Level 1 in the hierarchy. In the event there were no sales during the day or closing prices are not available, securities are valued at the last quoted bid price or may be valued using the last available price and are generally categorized as Level 2 in the hierarchy. For foreign equity securities, when market or security specific events arise, comparisons to the valuation of American Depositary Receipts (ADRs), futures contracts, ETFs and certain indexes as well as quoted prices for similar securities may be used and would be categorized as Level 2 in the hierarchy. For equity securities, including restricted securities, where observable inputs are limited, assumptions about market activity and risk are used and these securities may be categorized as Level 3 in the hierarchy.
Debt securities, including restricted securities, are valued based on evaluated prices received from third party pricing services or from brokers who make markets in such securities. Preferred securities are valued by pricing services who utilize matrix pricing which considers yield or price of bonds of comparable quality, coupon, maturity and type or by broker-supplied prices. When independent prices are unavailable or unreliable, debt securities may be valued utilizing pricing methodologies which consider similar factors that would be used by third party pricing services. Debt securities are generally categorized as Level 2 in the hierarchy but may be Level 3 depending on the circumstances.
Investments in open-end mutual funds, including the Fidelity Central Funds, are valued at their closing net asset value (NAV) each business day and are categorized as Level 1 in the hierarchy.
Changes in valuation techniques may result in transfers in or out of an assigned level within the disclosure hierarchy. The aggregate value of investments by input level as of June 30, 2023 is included at the end of the Fund's Schedule of Investments.
Foreign Currency. Certain Funds may use foreign currency contracts to facilitate transactions in foreign-denominated securities. Gains and losses from these transactions may arise from changes in the value of the foreign currency or if the counterparties do not perform under the contracts' terms.
Foreign-denominated assets, including investment securities, and liabilities are translated into U.S. dollars at the exchange rates at period end. Purchases and sales of investment securities, income and dividends received, and expenses denominated in foreign currencies are translated into U.S. dollars at the exchange rate in effect on the transaction date.
The effects of exchange rate fluctuations on investments are included with the net realized and unrealized gain (loss) on investment securities. Other foreign currency transactions resulting in realized and unrealized gain (loss) are disclosed separately.
Investment Transactions and Income. For financial reporting purposes, the Fund's investment holdings and NAV include trades executed through the end of the last business day of the period. The NAV per share for processing shareholder transactions is calculated as of the close of business of the New York Stock Exchange (NYSE), normally 4:00 p.m. Eastern time and includes trades executed through the end of the prior business day. Gains and losses on securities sold are determined on the basis of identified cost and include proceeds received from litigation. Commissions paid to certain brokers with whom the investment adviser, or its affiliates, places trades on behalf of a fund include an amount in addition to trade execution, which may be rebated back to a fund. Any such rebates are included in net realized gain (loss) on investments in the Statement of Operations. Dividend income is recorded on the ex-dividend date, except for certain dividends from foreign securities where the ex-dividend date may have passed, which are recorded as soon as the Fund is informed of the ex-dividend date. Non-cash dividends included in dividend income, if any, are recorded at the fair market value of the securities received. Income and capital gain distributions from Fidelity Central Funds, if any, are recorded on the ex-dividend date. Certain distributions received by the Fund represent a return of capital or capital gain. The Fund determines the components of these distributions subsequent to the ex-dividend date, based upon receipt of tax filings or other correspondence relating to the underlying investment. These distributions are recorded as a reduction of cost of investments and/or as a realized gain. Investment income is recorded net of foreign taxes withheld where recovery of such taxes is uncertain. Funds may file withholding tax reclaims in certain jurisdictions to recover a portion of amounts previously withheld. Any withholding tax reclaims income is included in the Statement of Operations in dividends. Any receivables for withholding tax reclaims are included in the Statement of Assets and Liabilities in dividends receivable.
Expenses. Expenses directly attributable to a fund are charged to that fund. Expenses attributable to more than one fund are allocated among the respective funds on the basis of relative net assets or other appropriate methods. Expenses included in the accompanying financial statements reflect the expenses of that fund and do not include any expenses associated with any underlying mutual funds or exchange-traded funds. Although not included in a fund's expenses, a fund indirectly bears its proportionate share of these expenses through the net asset value of each underlying mutual fund or exchange-traded fund. Expense estimates are accrued in the period to which they relate and adjustments are made when actual amounts are known.
Income Tax Information and Distributions to Shareholders. Each year, the Fund intends to qualify as a regulated investment company under Subchapter M of the Internal Revenue Code, including distributing substantially all of its taxable income and realized gains. As a result, no provision for U.S. Federal income taxes is required. The Fund files a U.S. federal tax return, in addition to state and local tax returns as required. The Fund's federal income tax returns are subject to examination by the Internal Revenue Service (IRS) for a period of three fiscal years after they are filed. State and local tax returns may be subject to examination for an additional fiscal year depending on the jurisdiction. Foreign taxes are provided for based on the Fund's understanding of the tax rules and rates that exist in the foreign markets in which it invests. The Fund is subject to a tax imposed on capital gains by certain countries in which it invests.
Distributions are declared and recorded on the ex-dividend date. Income and capital gain distributions are determined in accordance with income tax regulations, which may differ from GAAP.
Capital accounts within the financial statements are adjusted for permanent book-tax differences. These adjustments have no impact on net assets or the results of operations. Capital accounts are not adjusted for temporary book-tax differences which will reverse in a subsequent period.
Book-tax differences are primarily due to foreign currency transactions, certain foreign taxes, passive foreign investment companies (PFIC), redemptions in-kind, partnerships, capital loss carryforwards and losses deferred due to wash sales.
As of period end, the cost and unrealized appreciation (depreciation) in securities, and derivatives if applicable, for federal income tax purposes were as follows:
| Gross unrealized appreciation | $7,770,538,080 |
| Gross unrealized depreciation | (283,169,644) |
| Net unrealized appreciation (depreciation) | $7,487,368,436 |
| Tax cost | $17,491,183,435 |
Capital loss carryforwards are only available to offset future capital gains of the Fund to the extent provided by regulations and may be limited. The capital loss carryforward information presented below, including any applicable limitation, is estimated as of prior fiscal period end and is subject to adjustment.
Restricted Securities (including Private Placements). Funds may invest in securities that are subject to legal or contractual restrictions on resale. These securities generally may be resold in transactions exempt from registration or to the public if the securities are registered. Disposal of these securities may involve time-consuming negotiations and expense, and prompt sale at an acceptable price may be difficult. Information regarding restricted securities held at period end is included at the end of the Schedule of Investments, if applicable.
Consolidated Subsidiary. The Funds included in the table below hold certain investments through a wholly-owned subsidiary ("Subsidiary"), which may be subject to federal and state taxes upon disposition.
As of period end, investments in Subsidiaries were as follows:
| | $ Amount | % of Net Assets |
| Fidelity Contrafund K6 | 11,351,265 | .05 |
The financial statements have been consolidated to include the Subsidiary accounts where applicable. Accordingly, all inter-company transactions and balances have been eliminated.
At period end, any estimated tax liability for these investments is presented as "Deferred taxes" in the Statement of Assets and Liabilities and included in "Change in net unrealized appreciation (depreciation) on investment securities" in the Statement of Operations. The tax liability incurred may differ materially depending on conditions when these investments are disposed. Any cash held by a Subsidiary is restricted as to its use and is presented as "Restricted cash" in the Statement of Assets and Liabilities, if applicable.
New Accounting Pronouncement. In June 2022, the Financial Accounting Standards Board (FASB) issued Accounting Standards Update (ASU) 2022-03 Fair Value Measurement (Topic 820): Fair Value Measurement of Equity Securities Subject to Contractual Sale Restrictions. The amendments in this ASU clarify that a contractual restriction on the sale of an equity security is not considered part of the unit of account of the equity security and, therefore, is not considered in measuring fair value. They also clarify that an entity cannot, as a separate unit of account, recognize and measure a contractual sale restriction. They also require additional disclosures for equity securities subject to contractual sale restrictions. ASU 2022-03 will be effective for fiscal years, including interim periods within those fiscal years, beginning after December 15, 2023, and allows for early adoption. ASU 2022-03 will only be applicable to an equity security in which the contractual arrangement that restricts its sale is executed or modified on or after the adoption date. Management is currently evaluating the potential impact of ASU 2022-03 to the financial statements.
4. Purchases and Sales of Investments.
Purchases and sales of securities, other than short-term securities and in-kind transactions, as applicable, are noted in the table below.
| | Purchases ($) | Sales ($) |
| Fidelity Contrafund K6 | 3,695,538,451 | 3,342,868,066 |
Unaffiliated Exchanges In-Kind. Shares that were exchanged for investments, including accrued interest and cash, if any, are shown in the table below. The amount of in-kind exchanges is included in share transactions in the accompanying Statement of Changes in Net Assets.
| | Shares | Total Proceeds ($) |
| Fidelity Contrafund K6 | 43,028,081 | 787,276,717 |
Prior Fiscal Year Unaffiliated Redemptions In-Kind. Shares that were redeemed in-kind for investments, including accrued interest and cash, if any, are shown in the table below; along with realized gain or loss on investments delivered through in-kind redemptions. The amount of the in-kind redemptions is included in share transactions in the accompanying Statement of Changes in Net Assets. There was no gain or loss for federal income tax purposes.
| | Shares | Total net realized gain or loss ($) | Total Proceeds ($) |
| Fidelity Contrafund K6 | 55,666,002 | 367,380,483 | 992,024,707 |
Prior Fiscal Year Unaffiliated Exchanges In-Kind. Shares that were exchanged for investments, including accrued interest and cash, if any, are shown in the table below. The amount of in-kind exchanges is included in share transactions in the accompanying Statement of Changes in Net Assets.
| | Shares | Total Proceeds ($) |
| Fidelity Contrafund K6 | 44,817,858 | 914,186,580 |
5. Fees and Other Transactions with Affiliates.
Management Fee. Fidelity Management & Research Company LLC (the investment adviser) and its affiliates provide the Fund with investment management related services for which the Fund pays a monthly management fee that is based on an annual rate of .45% of average net assets. Under the management contract, the investment adviser or an affiliate pays all other expenses of the Fund, excluding fees and expenses of the independent Trustees, and certain miscellaneous expenses such as proxy and shareholder meeting expenses.
Brokerage Commissions. A portion of portfolio transactions were placed with brokerage firms which are affiliates of the investment adviser. Brokerage commissions are included in net realized gain (loss) and change in net unrealized appreciation (depreciation) in the Statement of Operations. The commissions paid to these affiliated firms were as follows:
| | Amount |
| Fidelity Contrafund K6 | $49,419 |
Interfund Trades. Funds may purchase from or sell securities to other Fidelity Funds under procedures adopted by the Board. The procedures have been designed to ensure these interfund trades are executed in accordance with Rule 17a-7 of the 1940 Act. Any interfund trades are included within the respective purchases and sales amounts shown in the Purchases and Sales of Investments note. Interfund trades during the period are noted in the table below.
| | Purchases ($) | Sales ($) | Realized Gain (Loss) ($) |
| Fidelity Contrafund K6 | 359,442,164 | 230,327,619 | (2,754,569) |
6. Committed Line of Credit.
Certain Funds participate with other funds managed by the investment adviser or an affiliate in a $4.25 billion credit facility (the "line of credit") to be utilized for temporary or emergency purposes to fund shareholder redemptions or for other short-term liquidity purposes. The commitment fees on the pro-rata portion of the line of credit are borne by the investment adviser. During the period, there were no borrowings on this line of credit.
7. Security Lending.
Funds lend portfolio securities from time to time in order to earn additional income. Lending agents are used, including National Financial Services (NFS), an affiliate of the investment adviser. Pursuant to a securities lending agreement, NFS will receive a fee, which is capped at 9.9% of a fund's daily lending revenue, for its services as lending agent. A fund may lend securities to certain qualified borrowers, including NFS. On the settlement date of the loan, a fund receives collateral (in the form of U.S. Treasury obligations, letters of credit and/or cash) against the loaned securities and maintains collateral in an amount not less than 100% of the market value of the loaned securities during the period of the loan. The market value of the loaned securities is determined at the close of business of a fund and any additional required collateral is delivered to a fund on the next business day. A fund or borrower may terminate the loan at any time, and if the borrower defaults on its obligation to return the securities loaned because of insolvency or other reasons, a fund may apply collateral received from the borrower against the obligation. A fund may experience delays and costs in recovering the securities loaned. Any cash collateral received is invested in the Fidelity Securities Lending Cash Central Fund. Any loaned securities are identified as such in the Schedule of Investments, and the value of loaned securities and cash collateral at period end, as applicable, are presented in the Statement of Assets and Liabilities. Security lending income represents the income earned on investing cash collateral, less rebates paid to borrowers and any lending agent fees associated with the loan, plus any premium payments received for lending certain types of securities. Security lending income is presented in the Statement of Operations as a component of income from Fidelity Central Funds. Affiliated security lending activity, if any, was as follows:
| | Total Security Lending Fees Paid to NFS | Security Lending Income From Securities Loaned to NFS | Value of Securities Loaned to NFS at Period End |
| Fidelity Contrafund K6 | $10,201 | $1 | $- |
8. Expense Reductions.
Through arrangements with the Fund's custodian, credits realized as a result of certain uninvested cash balances were used to reduce the Fund's expenses by $13,870.
9. Other.
A fund's organizational documents provide former and current trustees and officers with a limited indemnification against liabilities arising in connection with the performance of their duties to the fund. In the normal course of business, a fund may also enter into contracts that provide general indemnifications. A fund's maximum exposure under these arrangements is unknown as this would be dependent on future claims that may be made against a fund. The risk of material loss from such claims is considered remote.
10. Risk and Uncertainties.
Many factors affect a fund's performance. Developments that disrupt global economies and financial markets, such as pandemics, epidemics, outbreaks of infectious diseases, war, terrorism, and environmental disasters, may significantly affect a fund's investment performance. The effects of these developments to a fund will be impacted by the types of securities in which a fund invests, the financial condition, industry, economic sector, and geographic location of an issuer, and a fund's level of investment in the securities of that issuer. Significant concentrations in security types, issuers, industries, sectors, and geographic locations may magnify the factors that affect a fund's performance.
As a shareholder, you incur two types of costs: (1) transaction costs, which may include sales charges (loads) on purchase payments or redemption proceeds, as applicable and (2) ongoing costs, which generally include management fees, distribution and/or service (12b-1) fees and other Fund expenses. This Example is intended to help you understand your ongoing costs (in dollars) of investing in a fund and to compare these costs with the ongoing costs of investing in other mutual funds.
| The Example is based on an investment of $1,000 invested at the beginning of the period and held for the entire period (January 1, 2023 to June 30, 2023). |
Actual Expenses
The first line of the accompanying table provides information about actual account values and actual expenses. You may use the information in this line, together with the amount you invested, to estimate the expenses that you paid over the period. Simply divide your account value by $1,000.00 (for example, an $8,600 account value divided by $1,000.00 = 8.6), then multiply the result by the number in the first line for a class/Fund under the heading entitled "Expenses Paid During Period" to estimate the expenses you paid on your account during this period. If any fund is a shareholder of any underlying mutual funds or exchange-traded funds (ETFs) (the Underlying Funds), such fund indirectly bears its proportional share of the expenses of the Underlying Funds in addition to the direct expenses incurred presented in the table. These fees and expenses are not included in the annualized expense ratio used to calculate the expense estimate in the table below.
Hypothetical Example for Comparison Purposes
The second line of the accompanying table provides information about hypothetical account values and hypothetical expenses based on the actual expense ratio and an assumed rate of return of 5% per year before expenses, which is not the actual return. The hypothetical account values and expenses may not be used to estimate the actual ending account balance or expenses you paid for the period. You may use this information to compare the ongoing costs of investing in the Fund and other funds. To do so, compare this 5% hypothetical example with the 5% hypothetical examples that appear in the shareholder reports of the other funds. If any fund is a shareholder of any Underlying Funds, such fund indirectly bears its proportional share of the expenses of the Underlying Funds in addition to the direct expenses as presented in the table. These fees and expenses are not included in the annualized expense ratio used to calculate the expense estimate in the table below.
Please note that the expenses shown in the table are meant to highlight your ongoing costs only and do not reflect any transaction costs. Therefore, the second line of the table is useful in comparing ongoing costs only, and will not help you determine the relative total costs of owning different funds. In addition, if these transactional costs were included, your costs would have been higher.
| | | | | Annualized Expense Ratio- A | | Beginning Account Value January 1, 2023 | | Ending Account Value June 30, 2023 | | Expenses Paid During Period- C January 1, 2023 to June 30, 2023 |
| | | | | | | | | | |
| Fidelity® Contrafund® K6 | | | | .45% | | | | | | |
| Actual | | | | | | $ 1,000 | | $ 1,239.90 | | $ 2.50 |
Hypothetical- B | | | | | | $ 1,000 | | $ 1,022.56 | | $ 2.26 |
| |
A Annualized expense ratio reflects expenses net of applicable fee waivers.
B 5% return per year before expenses
C Expenses are equal to the annualized expense ratio, multiplied by the average account value over the period, multiplied by 181/ 365 (to reflect the one-half year period). The fees and expenses of any Underlying Funds are not included in each annualized expense ratio.
Board Approval of Investment Advisory Contracts
Fidelity Contrafund K6
At its May 2023 meeting, the Board of Trustees, including the Independent Trustees (together, the Board), voted to continue the management contract with Fidelity Management & Research Company LLC (FMR), and the sub-advisory agreements and sub-subadvisory agreements, in each case, where applicable (together, the Advisory Contracts) for the fund for two months from June 1, 2023 through July 31, 2023. The Board determined that it will consider the annual renewal of the fund's Advisory Contracts for a full one year period in July 2023, following its review of additional materials provided by FMR.
The Board considered that the approval of the fund's Advisory Contracts will not result in any changes in (i) the investment process or strategies employed in the management of the fund's assets; (ii) the fees and expenses paid by shareholders; (iii) the nature, extent or quality of services provided under the fund's Advisory Contracts; or (iv) the day-to-day management of the fund or the persons primarily responsible for such management. The Board also considered that since its last approval of the fund's Advisory Contracts, FMR had provided additional information on the fund in support of the annual contract renewal process, including competitive analyses on total expenses and management fees and in-depth reviews of fund performance and fund profitability information. The Board concluded that the fund's Advisory Contracts are fair and reasonable, and that the fund's Advisory Contracts should be renewed, without modification, through July 31, 2023, with the understanding that the Board will consider the annual renewal for a full one year period in July 2023.
In connection with its consideration of future renewals of the fund's Advisory Contracts, the Board will consider: (i) the nature, extent and quality of services provided to the fund, including shareholder and administrative services and investment performance; (ii) the competitiveness of the management fee and total expenses for the fund; (iii) the costs of the services and profitability, including the revenues earned and the expenses incurred in conducting the business of developing, marketing, distributing, managing, administering, and servicing the fund and its shareholders, to the extent applicable; and (iv) whether there have been economies of scale in respect of the Fidelity funds, whether the Fidelity funds (including the fund) have appropriately benefited from any such economies of scale, and whether there is the potential for realization of any further economies.
Based on its evaluation of all of the conclusions noted above, and after considering all factors it believed relevant, the Board ultimately concluded that the fund's management fee structure is fair and reasonable, and that the continuation of the fund's Advisory Contracts should be approved for two months from June 1, 2023 through July 31, 2023.
The Securities and Exchange Commission adopted Rule 22e-4 under the Investment Company Act of 1940 (the Liquidity Rule) to promote effective liquidity risk management throughout the open-end investment company industry, thereby reducing the risk that funds will be unable to meet their redemption obligations and mitigating dilution of the interests of fund shareholders.
The Fund has adopted and implemented a liquidity risk management program (the Program) reasonably designed to assess and manage the Fund's liquidity risk and to comply with the requirements of the Liquidity Rule. The Fund's Board of Trustees (the Board) has designated the Fund's investment adviser as administrator of the Program. The Fidelity advisers have established a Liquidity Risk Management Committee (the LRM Committee) to manage the Program for each of the Fidelity Funds. The LRM Committee monitors the adequacy and effectiveness of implementation of the Program and on a periodic basis assesses each Fund's liquidity risk based on a variety of factors including (1) the Fund's investment strategy, (2) portfolio liquidity and cash flow projections during normal and reasonably foreseeable stressed conditions, (3) shareholder redemptions, (4) borrowings and other funding sources and (5) certain factors specific to ETFs including the effect of the Fund's prices and spreads, market participants, and basket compositions on the overall liquidity of the Fund's portfolio, as applicable.
In accordance with the Program, each of the Fund's portfolio investments is classified into one of four defined liquidity categories based on a determination of a reasonable expectation for how long it would take to convert the investment to cash (or sell or dispose of the investment) without significantly changing its market value.
- Highly liquid investments - cash or convertible to cash within three business days or less
- Moderately liquid investments - convertible to cash in three to seven calendar days
- Less liquid investments - can be sold or disposed of, but not settled, within seven calendar days
- Illiquid investments - cannot be sold or disposed of within seven calendar days
Liquidity classification determinations take into account a variety of factors including various market, trading and investment-specific considerations, as well as market depth, and generally utilize analysis from a third-party liquidity metrics service.
The Liquidity Rule places a 15% limit on a fund's illiquid investments and requires funds that do not primarily hold assets that are highly liquid investments to determine and maintain a minimum percentage of the fund's net assets to be invested in highly liquid investments (highly liquid investment minimum or HLIM). The Program includes provisions reasonably designed to comply with the 15% limit on illiquid investments and for determining, periodically reviewing and complying with the HLIM requirement as applicable.
At a recent meeting of the Fund's Board of Trustees, the LRM Committee provided a written report to the Board pertaining to the operation, adequacy, and effectiveness of the Program for the period December 1, 2021 through November 30, 2022. The report concluded that the Program is operating effectively and is reasonably designed to assess and manage the Fund's liquidity risk.
1.9883978.106
CONK6-SANN-0823
Fidelity® Contrafund®
Semi-Annual Report
June 30, 2023
Contents
To view a fund's proxy voting guidelines and proxy voting record for the 12-month period ended June 30, visit http://www.fidelity.com/proxyvotingresults or visit the Securities and Exchange Commission's (SEC) web site at http://www.sec.gov.
You may also call 1-800-544-8544 if you're an individual investing directly with Fidelity, call 1-800-835-5092 if you're a plan sponsor or participant with Fidelity as your recordkeeper or call 1-877-208-0098 on institutional accounts or if you're an advisor or invest through one to request a free copy of the proxy voting guidelines.
Standard & Poor's, S&P and S&P 500 are registered service marks of The McGraw-Hill Companies, Inc. and have been licensed for use by Fidelity Distributors Corporation.
Other third-party marks appearing herein are the property of their respective owners.
All other marks appearing herein are registered or unregistered trademarks or service marks of FMR LLC or an affiliated company. © 2023 FMR LLC. All rights reserved.
This report and the financial statements contained herein are submitted for the general information of the shareholders of the Fund. This report is not authorized for distribution to prospective investors in the Fund unless preceded or accompanied by an effective prospectus.
A fund files its complete schedule of portfolio holdings with the SEC for the first and third quarters of each fiscal year on Form N-PORT. Forms N-PORT are available on the SEC's web site at http://www.sec.gov. A fund's Forms N-PORT may be reviewed and copied at the SEC's Public Reference Room in Washington, DC. Information regarding the operation of the SEC's Public Reference Room may be obtained by calling 1-800-SEC-0330.
For a complete list of a fund's portfolio holdings, view the most recent holdings listing, semiannual report, or annual report on Fidelity's web site at http://www.fidelity.com, http://www.institutional.fidelity.com, or http://www.401k.com, as applicable.
NOT FDIC INSURED •MAY LOSE VALUE •NO BANK GUARANTEE
Neither the Fund nor Fidelity Distributors Corporation is a bank.
This report and the financial statements contained herein are submitted for the general information of the shareholders of the Fund. This report is not authorized for distribution to prospective investors in the Fund unless preceded or accompanied by an effective prospectus.
A fund files its complete schedule of portfolio holdings with the SEC for the first and third quarters of each fiscal year on Form N-PORT. Forms N-PORT are available on the SEC's web site at http://www.sec.gov. A fund's Forms N-PORT may be reviewed and copied at the SEC's Public Reference Room in Washington, DC. Information regarding the operation of the SEC's Public Reference Room may be obtained by calling 1-800-SEC-0330.
For a complete list of a fund's portfolio holdings, view the most recent holdings listing, semiannual report, or annual report on Fidelity's web site at http://www.fidelity.com, http://www.institutional.fidelity.com, or http://www.401k.com, as applicable.
NOT FDIC INSURED •MAY LOSE VALUE •NO BANK GUARANTEE
Neither the Fund nor Fidelity Distributors Corporation is a bank.
Top Holdings (% of Fund's net assets) |
| |
| Meta Platforms, Inc. Class A | 11.0 | |
| Berkshire Hathaway, Inc. Class A | 9.0 | |
| Microsoft Corp. | 6.8 | |
| Amazon.com, Inc. | 5.8 | |
| Apple, Inc. | 4.9 | |
| UnitedHealth Group, Inc. | 4.0 | |
| NVIDIA Corp. | 3.9 | |
| Alphabet, Inc. Class A | 2.4 | |
| Eli Lilly & Co. | 2.4 | |
| Alphabet, Inc. Class C | 2.1 | |
| | 52.3 | |
| |
| Market Sectors (% of Fund's net assets) |
| |
| Information Technology | 24.3 | |
| Communication Services | 18.1 | |
| Financials | 15.3 | |
| Health Care | 12.8 | |
| Consumer Discretionary | 10.1 | |
| Industrials | 6.3 | |
| Energy | 4.0 | |
| Materials | 2.9 | |
| Consumer Staples | 2.6 | |
| Utilities | 0.3 | |
| Real Estate | 0.0 | |
| |
Asset Allocation (% of Fund's net assets) |
|
|
Showing Percentage of Net Assets
| Common Stocks - 95.1% |
| | | Shares | Value ($) (000s) |
| COMMUNICATION SERVICES - 17.9% | | | |
| Entertainment - 2.2% | | | |
| Activision Blizzard, Inc. | | 1,295,688 | 109,226 |
| Liberty Media Corp. Liberty Formula One Series C (a) | | 3,478,443 | 261,857 |
| Netflix, Inc. (a) | | 4,061,694 | 1,789,136 |
| The Walt Disney Co. (a) | | 133,451 | 11,915 |
| Universal Music Group NV | | 7,166,647 | 159,142 |
| | | | 2,331,276 |
| Interactive Media & Services - 15.6% | | | |
| Alphabet, Inc.: | | | |
| Class A (a) | | 21,903,320 | 2,621,827 |
| Class C (a) | | 18,670,761 | 2,258,602 |
| Bumble, Inc. (a) | | 1,829,135 | 30,693 |
| Epic Games, Inc. (a)(b)(c) | | 123,700 | 87,080 |
| Meta Platforms, Inc. Class A (a) | | 41,359,091 | 11,869,230 |
| | | | 16,867,432 |
| Media - 0.0% | | | |
| Comcast Corp. Class A | | 249,086 | 10,350 |
| Wireless Telecommunication Services - 0.1% | | | |
| T-Mobile U.S., Inc. (a) | | 743,487 | 103,270 |
TOTAL COMMUNICATION SERVICES | | | 19,312,328 |
| CONSUMER DISCRETIONARY - 10.1% | | | |
| Automobiles - 0.2% | | | |
| BYD Co. Ltd. (H Shares) | | 1,303,455 | 41,795 |
| General Motors Co. | | 499,647 | 19,266 |
| Harley-Davidson, Inc. | | 317,996 | 11,197 |
| Hyundai Motor Co. Ltd. | | 651,600 | 102,499 |
| Rad Power Bikes, Inc. (a)(b)(c) | | 2,588,458 | 5,772 |
| Rivian Automotive, Inc. (a) | | 351,417 | 5,855 |
| Tesla, Inc. (a) | | 105,291 | 27,562 |
| Toyota Motor Corp. | | 3,442,651 | 55,331 |
| | | | 269,277 |
| Broadline Retail - 6.1% | | | |
| Amazon.com, Inc. (a) | | 48,417,620 | 6,311,721 |
| Coupang, Inc. Class A (a) | | 9,532,003 | 165,857 |
| Dollarama, Inc. | | 489,443 | 33,148 |
| MercadoLibre, Inc. (a) | | 58,502 | 69,301 |
| | | | 6,580,027 |
| Hotels, Restaurants & Leisure - 1.1% | | | |
| Airbnb, Inc. Class A (a) | | 3,601,863 | 461,615 |
| Booking Holdings, Inc. (a) | | 29,621 | 79,986 |
| Cava Group, Inc. | | 237,000 | 9,705 |
| Chipotle Mexican Grill, Inc. (a) | | 66,168 | 141,533 |
| Churchill Downs, Inc. | | 129,806 | 18,065 |
| Deliveroo PLC Class A (a)(d) | | 32,996,514 | 47,982 |
| Doordash, Inc. (a) | | 990 | 76 |
| Evolution AB (d) | | 114,485 | 14,498 |
| Hilton Worldwide Holdings, Inc. | | 1,212,328 | 176,454 |
| Hyatt Hotels Corp. Class A | | 101,184 | 11,594 |
| Las Vegas Sands Corp. (a) | | 324,072 | 18,796 |
| Marriott International, Inc. Class A | | 53,955 | 9,911 |
| McDonald's Corp. | | 388,258 | 115,860 |
| Restaurant Brands International, Inc. | | 446,632 | 34,628 |
| Starbucks Corp. | | 106,300 | 10,530 |
| | | | 1,151,233 |
| Household Durables - 0.3% | | | |
| D.R. Horton, Inc. | | 485,704 | 59,105 |
| Lennar Corp. Class A | | 1,941,064 | 243,235 |
| PulteGroup, Inc. | | 19,651 | 1,526 |
| | | | 303,866 |
| Leisure Products - 0.0% | | | |
| Bandai Namco Holdings, Inc. | | 188,369 | 4,362 |
| Specialty Retail - 1.9% | | | |
| Academy Sports & Outdoors, Inc. | | 3,438,920 | 185,874 |
| AutoZone, Inc. (a) | | 29,899 | 74,549 |
| Dick's Sporting Goods, Inc. | | 2,385,244 | 315,305 |
| Fanatics, Inc. Class A (a)(b)(c) | | 2,461,391 | 189,035 |
| Fast Retailing Co. Ltd. | | 128,480 | 32,952 |
| O'Reilly Automotive, Inc. (a) | | 365,331 | 349,001 |
| The Home Depot, Inc. | | 957,271 | 297,367 |
| TJX Companies, Inc. | | 1,535,876 | 130,227 |
| Ulta Beauty, Inc. (a) | | 463,300 | 218,027 |
| Wayfair LLC Class A (a) | | 67,258 | 4,372 |
| Williams-Sonoma, Inc. | | 2,071,510 | 259,229 |
| | | | 2,055,938 |
| Textiles, Apparel & Luxury Goods - 0.5% | | | |
| Deckers Outdoor Corp. (a) | | 113,809 | 60,052 |
| Dr. Martens Ltd. | | 684,065 | 1,062 |
| lululemon athletica, Inc. (a) | | 89,826 | 33,999 |
| NIKE, Inc. Class B | | 1,410,736 | 155,703 |
| On Holding AG (a) | | 8,215,449 | 271,110 |
| Ralph Lauren Corp. (e) | | 85,309 | 10,519 |
| Tapestry, Inc. | | 697,537 | 29,855 |
| | | | 562,300 |
TOTAL CONSUMER DISCRETIONARY | | | 10,927,003 |
| CONSUMER STAPLES - 2.6% | | | |
| Beverages - 0.9% | | | |
| Anheuser-Busch InBev SA NV | | 836,606 | 47,417 |
| Constellation Brands, Inc. Class A (sub. vtg.) | | 136,931 | 33,703 |
| Diageo PLC | | 26,603 | 1,144 |
| PepsiCo, Inc. | | 2,603,145 | 482,155 |
| The Coca-Cola Co. | | 7,283,954 | 438,640 |
| | | | 1,003,059 |
| Consumer Staples Distribution & Retail - 1.2% | | | |
| Alimentation Couche-Tard, Inc. Class A (multi-vtg.) | | 1,530,519 | 78,481 |
| Casey's General Stores, Inc. | | 245,023 | 59,756 |
| Costco Wholesale Corp. | | 2,179,043 | 1,173,153 |
| Walmart, Inc. | | 984 | 155 |
| | | | 1,311,545 |
| Food Products - 0.2% | | | |
| Lamb Weston Holdings, Inc. | | 247,033 | 28,396 |
| Mondelez International, Inc. | | 2,196,552 | 160,217 |
| | | | 188,613 |
| Personal Care Products - 0.3% | | | |
| Estee Lauder Companies, Inc. Class A | | 379,297 | 74,486 |
| L'Oreal SA (a) | | 375,100 | 174,975 |
| L'Oreal SA | | 8,200 | 3,825 |
| Olaplex Holdings, Inc. (a) | | 3,144,844 | 11,699 |
| | | | 264,985 |
TOTAL CONSUMER STAPLES | | | 2,768,202 |
| ENERGY - 3.9% | | | |
| Oil, Gas & Consumable Fuels - 3.9% | | | |
| Birchcliff Energy Ltd. (e) | | 935,234 | 5,535 |
| Canadian Natural Resources Ltd. | | 5,178,969 | 291,172 |
| Cheniere Energy, Inc. | | 1,147,869 | 174,889 |
| Chevron Corp. | | 2,719,223 | 427,870 |
| ConocoPhillips Co. | | 6,413,202 | 664,472 |
| Diamondback Energy, Inc. | | 141,214 | 18,550 |
| EOG Resources, Inc. | | 2,220,019 | 254,059 |
| Exxon Mobil Corp. | | 11,674,685 | 1,252,110 |
| Hess Corp. | | 3,005,761 | 408,633 |
| Marathon Petroleum Corp. | | 174,655 | 20,365 |
| Occidental Petroleum Corp. | | 5,350,347 | 314,600 |
| Pioneer Natural Resources Co. | | 492,143 | 101,962 |
| PrairieSky Royalty Ltd. | | 586,900 | 10,261 |
| Reliance Industries Ltd. | | 172,039 | 5,361 |
| Suncor Energy, Inc. | | 713,253 | 20,922 |
| Tourmaline Oil Corp. (e) | | 431,833 | 20,347 |
| Valero Energy Corp. | | 2,095,878 | 245,846 |
| | | | 4,236,954 |
| FINANCIALS - 15.3% | | | |
| Banks - 2.2% | | | |
| AIB Group PLC | | 3,255,976 | 13,679 |
| Banco Santander SA (Spain) | | 12,950,658 | 47,945 |
| Bank of America Corp. | | 21,637,292 | 620,774 |
| Bank of Ireland Group PLC | | 4,154,101 | 39,609 |
| East West Bancorp, Inc. | | 758,269 | 40,029 |
| First Citizens Bancshares, Inc. | | 23,430 | 30,071 |
| JPMorgan Chase & Co. | | 5,621,122 | 817,536 |
| Nu Holdings Ltd. (a) | | 8,727,329 | 68,859 |
| Royal Bank of Canada (e) | | 4,504,426 | 430,194 |
| Starling Bank Ltd. Series D (a)(b)(c) | | 26,724,113 | 99,104 |
| Wells Fargo & Co. | | 3,566,126 | 152,202 |
| | | | 2,360,002 |
| Capital Markets - 0.5% | | | |
| BlackRock, Inc. Class A | | 7,339 | 5,072 |
| Brookfield Asset Management Ltd. Class A | | 54,679 | 1,785 |
| Brookfield Corp. (Canada) Class A | | 384,783 | 12,954 |
| Coinbase Global, Inc. (a) | | 988 | 71 |
| Goldman Sachs Group, Inc. | | 17,049 | 5,499 |
| Morgan Stanley | | 4,373,325 | 373,482 |
| MSCI, Inc. | | 33,340 | 15,646 |
| TulCo LLC (a)(b)(c)(f) | | 140,771 | 122,513 |
| | | | 537,022 |
| Consumer Finance - 0.1% | | | |
| American Express Co. | | 982,291 | 171,115 |
| Financial Services - 10.7% | | | |
| Adyen BV (a)(d) | | 11,655 | 20,183 |
| Berkshire Hathaway, Inc. Class A (a)(e) | | 18,775 | 9,721,883 |
| MasterCard, Inc. Class A | | 448,270 | 176,305 |
| Rapyd Financial Network 2016 Ltd. (a)(b)(c) | | 340,545 | 25,098 |
| Visa, Inc. Class A (e) | | 6,661,478 | 1,581,968 |
| | | | 11,525,437 |
| Insurance - 1.8% | | | |
| American International Group, Inc. | | 4,706,222 | 270,796 |
| Aon PLC | | 77,814 | 26,861 |
| Arthur J. Gallagher & Co. | | 702,672 | 154,286 |
| Brookfield Asset Management Reinsurance Partners Ltd. (e) | | 7,520 | 254 |
| Chubb Ltd. | | 1,563,994 | 301,163 |
| Fairfax Financial Holdings Ltd. (sub. vtg.) | | 156,380 | 117,135 |
| Hartford Financial Services Group, Inc. | | 382,876 | 27,575 |
| Intact Financial Corp. | | 809,508 | 124,987 |
| Marsh & McLennan Companies, Inc. | | 753,105 | 141,644 |
| Progressive Corp. | | 3,601,342 | 476,710 |
| The Travelers Companies, Inc. | | 1,742,327 | 302,573 |
| | | | 1,943,984 |
TOTAL FINANCIALS | | | 16,537,560 |
| HEALTH CARE - 12.8% | | | |
| Biotechnology - 3.6% | | | |
| Alnylam Pharmaceuticals, Inc. (a) | | 538,999 | 102,377 |
| Argenx SE ADR (a) | | 303,290 | 118,201 |
| Arrowhead Pharmaceuticals, Inc. (a) | | 303,300 | 10,816 |
| Biogen, Inc. (a) | | 31,500 | 8,973 |
| Biohaven Ltd. | | 24,326 | 582 |
| Exact Sciences Corp. (a) | | 248,564 | 23,340 |
| Galapagos NV sponsored ADR (a) | | 1,287,930 | 52,367 |
| Gilead Sciences, Inc. | | 1,258,274 | 96,975 |
| Intarcia Therapeutics, Inc. warrants 12/31/24 (a)(c) | | 105,983 | 0 |
| Intellia Therapeutics, Inc. (a) | | 81,236 | 3,313 |
| Krystal Biotech, Inc. (a) | | 51,510 | 6,047 |
| Legend Biotech Corp. ADR (a) | | 1,122,964 | 77,518 |
| Moderna, Inc. (a) | | 46,965 | 5,706 |
| Moonlake Immunotherapeutics (a) | | 413,900 | 21,109 |
| Nuvalent, Inc. Class A (a) | | 257,047 | 10,840 |
| Regeneron Pharmaceuticals, Inc. (a) | | 2,640,815 | 1,897,531 |
| Roivant Sciences Ltd. (a) | | 1,776,216 | 17,904 |
| Sarepta Therapeutics, Inc. (a) | | 92,764 | 10,623 |
| Seagen, Inc. (a) | | 52,467 | 10,098 |
| United Therapeutics Corp. (a) | | 585,202 | 129,183 |
| Vertex Pharmaceuticals, Inc. (a) | | 3,447,757 | 1,213,300 |
| Zai Lab Ltd. (a) | | 3,692,584 | 10,160 |
| | | | 3,826,963 |
| Health Care Equipment & Supplies - 0.7% | | | |
| Align Technology, Inc. (a) | | 29,400 | 10,397 |
| Boston Scientific Corp. (a) | | 2,399,997 | 129,816 |
| DexCom, Inc. (a) | | 240,199 | 30,868 |
| Edwards Lifesciences Corp. (a) | | 43,702 | 4,122 |
| GE Healthcare Holding LLC | | 409,916 | 33,302 |
| Inspire Medical Systems, Inc. (a) | | 36,927 | 11,988 |
| Intuitive Surgical, Inc. (a) | | 1,244,999 | 425,715 |
| Lantheus Holdings, Inc. (a) | | 112,835 | 9,469 |
| Penumbra, Inc. (a) | | 33,102 | 11,389 |
| Shockwave Medical, Inc. (a) | | 76,358 | 21,793 |
| Straumann Holding AG | | 179,507 | 29,111 |
| Stryker Corp. | | 173,530 | 52,942 |
| Surgical Science Sweden AB (a) | | 388,600 | 8,691 |
| | | | 779,603 |
| Health Care Providers & Services - 4.2% | | | |
| 23andMe Holding Co. Class A (a)(e) | | 3,409,886 | 5,967 |
| agilon health, Inc. (a) | | 872,331 | 15,126 |
| AmerisourceBergen Corp. | | 145,943 | 28,084 |
| Cardinal Health, Inc. | | 310,475 | 29,362 |
| Elevance Health, Inc. | | 110,510 | 49,098 |
| HCA Holdings, Inc. | | 364,051 | 110,482 |
| Henry Schein, Inc. (a) | | 116,402 | 9,440 |
| P3 Health Partners, Inc. Class A (a) | | 1,293,201 | 3,867 |
| UnitedHealth Group, Inc. | | 8,905,730 | 4,280,450 |
| | | | 4,531,876 |
| Health Care Technology - 0.0% | | | |
| Doximity, Inc. (a)(e) | | 590,846 | 20,101 |
| Schrodinger, Inc. (a)(e) | | 328,932 | 16,420 |
| | | | 36,521 |
| Life Sciences Tools & Services - 0.6% | | | |
| Danaher Corp. | | 882,518 | 211,804 |
| Mettler-Toledo International, Inc. (a) | | 172,717 | 226,543 |
| Thermo Fisher Scientific, Inc. | | 217,447 | 113,453 |
| Veterinary Emergency Group LLC Class A (a)(b)(c)(f) | | 1,038,192 | 55,990 |
| | | | 607,790 |
| Pharmaceuticals - 3.7% | | | |
| AstraZeneca PLC sponsored ADR | | 661,826 | 47,367 |
| Bristol-Myers Squibb Co. | | 972,773 | 62,209 |
| DICE Therapeutics, Inc. (a) | | 745,852 | 34,652 |
| Eli Lilly & Co. | | 5,450,021 | 2,555,951 |
| Intra-Cellular Therapies, Inc. (a) | | 503,516 | 31,883 |
| Johnson & Johnson | | 898,272 | 148,682 |
| Merck & Co., Inc. | | 7,269,945 | 838,879 |
| Novo Nordisk A/S Series B | | 200,773 | 32,433 |
| Nuvation Bio, Inc. (a) | | 8,688,470 | 15,639 |
| Royalty Pharma PLC | | 6,236,384 | 191,706 |
| Structure Therapeutics, Inc. ADR | | 387,695 | 16,116 |
| Ventyx Biosciences, Inc. (a) | | 162,141 | 5,318 |
| Verona Pharma PLC ADR (a) | | 359,782 | 7,606 |
| Zoetis, Inc. Class A | | 170,470 | 29,357 |
| | | | 4,017,798 |
TOTAL HEALTH CARE | | | 13,800,551 |
| INDUSTRIALS - 5.3% | | | |
| Aerospace & Defense - 1.4% | | | |
| Lockheed Martin Corp. | | 1,125,114 | 517,980 |
| Northrop Grumman Corp. | | 1,222,364 | 557,154 |
| Space Exploration Technologies Corp.: | | | |
| Class A (a)(b)(c) | | 3,585,070 | 290,391 |
| Class C (a)(b)(c) | | 129,910 | 10,523 |
| TransDigm Group, Inc. | | 124,581 | 111,397 |
| | | | 1,487,445 |
| Air Freight & Logistics - 0.5% | | | |
| United Parcel Service, Inc. Class B | | 2,836,060 | 508,364 |
| Zipline International, Inc. (a)(b)(c) | | 515,816 | 20,736 |
| | | | 529,100 |
| Building Products - 0.1% | | | |
| Carrier Global Corp. | | 683,100 | 33,957 |
| Toto Ltd. | | 817,273 | 24,711 |
| Trane Technologies PLC | | 372,627 | 71,269 |
| | | | 129,937 |
| Commercial Services & Supplies - 0.2% | | | |
| Aurora Innovation, Inc. (a) | | 1,390,942 | 4,089 |
| Cintas Corp. | | 142,283 | 70,726 |
| Clean Harbors, Inc. (a) | | 613,418 | 100,864 |
| Clean TeQ Water Pty Ltd. (a)(e) | | 2,080,985 | 332 |
| GFL Environmental, Inc. | | 313,734 | 12,182 |
| Republic Services, Inc. | | 217,000 | 33,238 |
| Waste Connections, Inc. (United States) | | 69,850 | 9,984 |
| | | | 231,415 |
| Construction & Engineering - 0.0% | | | |
| Larsen & Toubro Ltd. | | 373,200 | 11,282 |
| Electrical Equipment - 0.5% | | | |
| AMETEK, Inc. | | 67,254 | 10,887 |
| Eaton Corp. PLC | | 1,481,636 | 297,957 |
| Hubbell, Inc. Class B | | 637,934 | 211,513 |
| nVent Electric PLC | | 705,534 | 36,455 |
| Prysmian SpA | | 264,700 | 11,057 |
| | | | 567,869 |
| Ground Transportation - 0.5% | | | |
| Canadian Pacific Kansas City Ltd. | | 3,070,843 | 248,032 |
| J.B. Hunt Transport Services, Inc. | | 301,118 | 54,511 |
| Old Dominion Freight Lines, Inc. | | 387,319 | 143,211 |
| Uber Technologies, Inc. (a) | | 1,667,512 | 71,986 |
| Vamos Locacao de Caminhoes Maquinas e Equipamentos SA | | 132,800 | 336 |
| | | | 518,076 |
| Industrial Conglomerates - 0.7% | | | |
| General Electric Co. | | 6,214,417 | 682,654 |
| Machinery - 0.8% | | | |
| Caterpillar, Inc. | | 413,150 | 101,656 |
| Crane Nxt Co. | | 66,965 | 3,780 |
| Deere & Co. | | 844,125 | 342,031 |
| Fortive Corp. | | 660,651 | 49,397 |
| Indutrade AB | | 399,852 | 9,005 |
| PACCAR, Inc. | | 3,726,354 | 311,710 |
| Parker Hannifin Corp. | | 138,233 | 53,916 |
| | | | 871,495 |
| Passenger Airlines - 0.1% | | | |
| Copa Holdings SA Class A | | 190,116 | 21,023 |
| Ryanair Holdings PLC sponsored ADR (a) | | 915,084 | 101,208 |
| | | | 122,231 |
| Professional Services - 0.1% | | | |
| Thomson Reuters Corp. | | 113,509 | 15,325 |
| Verisk Analytics, Inc. | | 334,641 | 75,639 |
| | | | 90,964 |
| Trading Companies & Distributors - 0.4% | | | |
| United Rentals, Inc. | | 224,738 | 100,092 |
| W.W. Grainger, Inc. | | 420,346 | 331,481 |
| | | | 431,573 |
TOTAL INDUSTRIALS | | | 5,674,041 |
| INFORMATION TECHNOLOGY - 24.1% | | | |
| Communications Equipment - 0.4% | | | |
| Arista Networks, Inc. (a) | | 2,431,092 | 393,983 |
| Motorola Solutions, Inc. | | 107,286 | 31,465 |
| | | | 425,448 |
| Electronic Equipment, Instruments & Components - 1.8% | | | |
| Amphenol Corp. Class A | | 21,214,988 | 1,802,213 |
| CDW Corp. | | 352,841 | 64,746 |
| Jabil, Inc. | | 525,224 | 56,687 |
| | | | 1,923,646 |
| IT Services - 1.0% | | | |
| Accenture PLC Class A | | 2,635,597 | 813,293 |
| ASAC II LP (a)(b)(c) | | 39,494,500 | 6,635 |
| Cloudflare, Inc. (a) | | 365,042 | 23,863 |
| Gartner, Inc. (a) | | 119,890 | 41,999 |
| MongoDB, Inc. Class A (a) | | 136,741 | 56,199 |
| Okta, Inc. (a) | | 454,832 | 31,543 |
| Shopify, Inc. Class A (a) | | 813,952 | 52,607 |
| X Holdings Corp. Class A (c) | | 534,690 | 20,703 |
| | | | 1,046,842 |
| Semiconductors & Semiconductor Equipment - 6.7% | | | |
| Advanced Micro Devices, Inc. (a) | | 6,656,329 | 758,222 |
| Advantest Corp. | | 220,296 | 29,670 |
| Allegro MicroSystems LLC (a) | | 424,807 | 19,176 |
| Analog Devices, Inc. | | 1,969,805 | 383,738 |
| Applied Materials, Inc. | | 302,372 | 43,705 |
| ASML Holding NV (depository receipt) | | 58,000 | 42,036 |
| Broadcom, Inc. | | 241,740 | 209,693 |
| First Solar, Inc. (a) | | 580,635 | 110,373 |
| Lattice Semiconductor Corp. (a) | | 1,957,000 | 188,009 |
| Microchip Technology, Inc. | | 129,318 | 11,586 |
| Monolithic Power Systems, Inc. | | 195,734 | 105,741 |
| NVIDIA Corp. | | 9,824,717 | 4,156,052 |
| ON Semiconductor Corp. (a) | | 5,017,005 | 474,508 |
| Qualcomm, Inc. | | 4,065,815 | 483,995 |
| Synaptics, Inc. (a) | | 33,101 | 2,826 |
| Taiwan Semiconductor Manufacturing Co. Ltd. sponsored ADR | | 1,628,095 | 164,307 |
| | | | 7,183,637 |
| Software - 9.3% | | | |
| Adobe, Inc. (a) | | 939,075 | 459,198 |
| ANSYS, Inc. (a) | | 16,985 | 5,610 |
| Cadence Design Systems, Inc. (a) | | 2,034,790 | 477,199 |
| Check Point Software Technologies Ltd. (a) | | 417,366 | 52,430 |
| Clear Secure, Inc. (e) | | 1,332,904 | 30,883 |
| Dynatrace, Inc. (a) | | 1,476,876 | 76,015 |
| Fortinet, Inc. (a) | | 2,732,844 | 206,576 |
| HubSpot, Inc. (a) | | 70,268 | 37,389 |
| Intuit, Inc. | | 58,360 | 26,740 |
| Microsoft Corp. | | 21,656,463 | 7,374,892 |
| Palo Alto Networks, Inc. (a) | | 433,323 | 110,718 |
| Roper Technologies, Inc. | | 23,000 | 11,058 |
| Salesforce, Inc. (a) | | 4,102,461 | 866,686 |
| Samsara, Inc. (a) | | 86,081 | 2,385 |
| ServiceNow, Inc. (a) | | 99,461 | 55,894 |
| Stripe, Inc. Class B (a)(b)(c) | | 455,600 | 9,171 |
| Synopsys, Inc. (a) | | 345,920 | 150,617 |
| Tanium, Inc. Class B (a)(b)(c) | | 6,742,751 | 53,268 |
| ZenPayroll, Inc. (a)(b)(c) | | 289,200 | 9,107 |
| | | | 10,015,836 |
| Technology Hardware, Storage & Peripherals - 4.9% | | | |
| Apple, Inc. | | 27,428,315 | 5,320,270 |
| Dell Technologies, Inc. | | 181,231 | 9,806 |
| Samsung Electronics Co. Ltd. | | 195,500 | 10,766 |
| | | | 5,340,842 |
TOTAL INFORMATION TECHNOLOGY | | | 25,936,251 |
| MATERIALS - 2.8% | | | |
| Chemicals - 0.2% | | | |
| Air Products & Chemicals, Inc. | | 290,316 | 86,958 |
| Corteva, Inc. | | 388,993 | 22,289 |
| Linde PLC | | 85,269 | 32,494 |
| Sherwin-Williams Co. | | 132,625 | 35,215 |
| Westlake Corp. | | 575,476 | 68,752 |
| | | | 245,708 |
| Construction Materials - 0.0% | | | |
| Vulcan Materials Co. | | 150,500 | 33,929 |
| Metals & Mining - 2.6% | | | |
| Agnico Eagle Mines Ltd. (Canada) | | 175,780 | 8,777 |
| B2Gold Corp. | | 45,343,143 | 161,555 |
| Barrick Gold Corp. (Canada) | | 1,247,725 | 21,107 |
| Cleveland-Cliffs, Inc. (a) | | 2,728,614 | 45,732 |
| Franco-Nevada Corp. | | 4,141,381 | 590,250 |
| Freeport-McMoRan, Inc. | | 10,489,528 | 419,581 |
| Glencore PLC | | 6,549,510 | 37,135 |
| Ivanhoe Electric, Inc. (g) | | 4,816,069 | 62,802 |
| Ivanhoe Mines Ltd. (a) | | 41,202,654 | 376,337 |
| Ivanhoe Mines Ltd. (a)(d) | | 11,924,516 | 108,916 |
| Lundin Gold, Inc. | | 23,500 | 281 |
| Newcrest Mining Ltd. | | 575,454 | 10,265 |
| Novagold Resources, Inc. (a) | | 6,976,038 | 27,646 |
| Nucor Corp. | | 3,335,114 | 546,892 |
| POSCO sponsored ADR (e) | | 29,179 | 2,158 |
| Steel Dynamics, Inc. | | 2,491,300 | 271,377 |
| Sunrise Energy Metals Ltd. (a) | | 2,669,366 | 1,890 |
| Wheaton Precious Metals Corp. | | 1,604,667 | 69,395 |
| | | | 2,762,096 |
TOTAL MATERIALS | | | 3,041,733 |
| REAL ESTATE - 0.0% | | | |
| Equity Real Estate Investment Trusts (REITs) - 0.0% | | | |
| Equity Commonwealth | | 1,296,841 | 26,274 |
| UTILITIES - 0.3% | | | |
| Electric Utilities - 0.3% | | | |
| Constellation Energy Corp. | | 1,843,233 | 168,748 |
| PG&E Corp. (a) | | 6,587,403 | 113,830 |
| | | | 282,578 |
| TOTAL COMMON STOCKS (Cost $38,105,374) | | | 102,543,475 |
| | | | |
| Preferred Stocks - 1.6% |
| | | Shares | Value ($) (000s) |
| Convertible Preferred Stocks - 1.5% | | | |
| COMMUNICATION SERVICES - 0.2% | | | |
| Interactive Media & Services - 0.2% | | | |
| ByteDance Ltd. Series E1 (a)(b)(c) | | 653,587 | 147,606 |
| Reddit, Inc.: | | | |
| Series E(a)(b)(c) | | 165,300 | 5,718 |
| Series F(a)(b)(c) | | 878,650 | 30,393 |
| | | | 183,717 |
| CONSUMER DISCRETIONARY - 0.0% | | | |
| Automobiles - 0.0% | | | |
| Rad Power Bikes, Inc.: | | | |
| Series A(a)(b)(c) | | 337,463 | 753 |
| Series C(a)(b)(c) | | 1,327,879 | 2,961 |
| Series D(a)(b)(c) | | 2,329,100 | 5,194 |
| | | | 8,908 |
| Hotels, Restaurants & Leisure - 0.0% | | | |
| Discord, Inc. Series I (a)(b)(c) | | 15,500 | 4,765 |
| | | | |
TOTAL CONSUMER DISCRETIONARY | | | 13,673 |
| | | | |
| CONSUMER STAPLES - 0.0% | | | |
| Consumer Staples Distribution & Retail - 0.0% | | | |
| GoBrands, Inc.: | | | |
| Series G(a)(b)(c) | | 55,517 | 5,030 |
| Series H(a)(b)(c) | | 69,898 | 6,333 |
| | | | 11,363 |
| Food Products - 0.0% | | | |
| Bowery Farming, Inc. Series C1 (a)(b)(c) | | 226,491 | 1,948 |
| | | | |
TOTAL CONSUMER STAPLES | | | 13,311 |
| | | | |
| FINANCIALS - 0.0% | | | |
| Financial Services - 0.0% | | | |
| Acrisure Holdings, Inc. Series B (a)(b)(c) | | 379,681 | 10,627 |
| Circle Internet Financial Ltd. Series F (a)(b)(c) | | 637,828 | 15,340 |
| | | | 25,967 |
| HEALTH CARE - 0.0% | | | |
| Biotechnology - 0.0% | | | |
| ElevateBio LLC Series C (a)(b)(c) | | 3,224,900 | 13,674 |
| Intarcia Therapeutics, Inc. Series CC (a)(b)(c) | | 2,100,446 | 0 |
| | | | 13,674 |
| Health Care Providers & Services - 0.0% | | | |
| Get Heal, Inc. Series B (a)(b)(c) | | 35,877,127 | 39 |
| Lyra Health, Inc.: | | | |
| Series E(a)(b)(c) | | 1,478,100 | 24,714 |
| Series F(a)(b)(c) | | 69,520 | 1,162 |
| Somatus, Inc. Series E (a)(b)(c) | | 15,253 | 15,455 |
| | | | 41,370 |
TOTAL HEALTH CARE | | | 55,044 |
| | | | |
| INDUSTRIALS - 1.0% | | | |
| Aerospace & Defense - 0.9% | | | |
| Relativity Space, Inc.: | | | |
| Series D(a)(b)(c) | | 1,673,085 | 25,280 |
| Series E(a)(b)(c) | | 436,722 | 7,682 |
| Space Exploration Technologies Corp.: | | | |
| Series G(a)(b)(c) | | 558,215 | 452,154 |
| Series H(a)(b)(c) | | 120,282 | 97,428 |
| Series N(a)(b)(c) | | 428,458 | 347,051 |
| | | | 929,595 |
| Air Freight & Logistics - 0.1% | | | |
| Zipline International, Inc.: | | | |
| Series E(a)(b)(c) | | 1,317,166 | 52,950 |
| Series F(c) | | 682,143 | 27,422 |
| | | | 80,372 |
| Construction & Engineering - 0.0% | | | |
| Beta Technologies, Inc. Series B, 6.00% (a)(b)(c) | | 259,581 | 28,141 |
| | | | |
TOTAL INDUSTRIALS | | | 1,038,108 |
| | | | |
| INFORMATION TECHNOLOGY - 0.2% | | | |
| Software - 0.2% | | | |
| ASAPP, Inc. Series C (a)(b)(c) | | 1,300,504 | 3,993 |
| Carbon, Inc.: | | | |
| Series D(a)(b)(c) | | 915,425 | 8,989 |
| Series E(a)(b)(c) | | 81,735 | 957 |
| Delphix Corp. Series D (a)(b)(c) | | 3,712,687 | 15,445 |
| Moloco, Inc. Series A (b)(c) | | 419,608 | 25,176 |
| Nuro, Inc.: | | | |
| Series C(a)(b)(c) | | 3,293,118 | 20,911 |
| Series D(a)(b)(c) | | 643,113 | 4,084 |
| Stripe, Inc.: | | | |
| Series H(a)(b)(c) | | 190,300 | 3,831 |
| Series I(b)(c) | | 2,114,059 | 42,556 |
| Tenstorrent, Inc. Series C1 (a)(b)(c) | | 200,200 | 11,808 |
| ZenPayroll, Inc.: | | | |
| Series D(a)(b)(c) | | 2,436,137 | 76,714 |
| Series E(a)(b)(c) | | 167,099 | 5,262 |
| | | | 219,726 |
| MATERIALS - 0.1% | | | |
| Metals & Mining - 0.1% | | | |
| High Power Exploration, Inc. Series A (a)(b)(c) | | 14,154,085 | 59,306 |
| | | | |
| TOTAL CONVERTIBLE PREFERRED STOCKS | | | 1,608,852 |
| Nonconvertible Preferred Stocks - 0.1% | | | |
| ENERGY - 0.1% | | | |
| Oil, Gas & Consumable Fuels - 0.1% | | | |
| Petroleo Brasileiro SA - Petrobras sponsored ADR | | 8,303,093 | 114,832 |
| | | | |
| FINANCIALS - 0.0% | | | |
| Financial Services - 0.0% | | | |
| Circle Internet Financial Ltd. Series E (a)(b)(c) | | 1,059,433 | 25,479 |
| | | | |
| TOTAL NONCONVERTIBLE PREFERRED STOCKS | | | 140,311 |
| TOTAL PREFERRED STOCKS (Cost $1,087,118) | | | 1,749,163 |
| | | | |
| Preferred Securities - 0.0% |
| | | Principal Amount (h) (000s) | Value ($) (000s) |
| HEALTH CARE - 0.0% | | | |
| Biotechnology - 0.0% | | | |
| Intarcia Therapeutics, Inc. 6% (b)(c)(i)(j) | | 9,273 | 0 |
| INFORMATION TECHNOLOGY - 0.0% | | | |
| Software - 0.0% | | | |
| Tenstorrent, Inc. 0% (b)(c)(j) | | 11,130 | 11,041 |
| TOTAL PREFERRED SECURITIES (Cost $20,403) | | | 11,041 |
| | | | |
| Money Market Funds - 3.7% |
| | | Shares | Value ($) (000s) |
| Fidelity Cash Central Fund 5.14% (k) | | 3,696,065,006 | 3,696,804 |
| Fidelity Securities Lending Cash Central Fund 5.14% (k)(l) | | 340,393,051 | 340,427 |
| TOTAL MONEY MARKET FUNDS (Cost $4,037,230) | | | 4,037,231 |
| | | | |
| TOTAL INVESTMENT IN SECURITIES - 100.4% (Cost $43,250,125) | 108,340,910 |
NET OTHER ASSETS (LIABILITIES) - (0.4)% | (472,836) |
| NET ASSETS - 100.0% | 107,868,074 |
| | |
Any values shown as $0 in the Schedule of Investments may reflect amounts less than $500.
Legend
| (b) | Restricted securities (including private placements) - Investment in securities not registered under the Securities Act of 1933 (excluding 144A issues). At the end of the period, the value of restricted securities (excluding 144A issues) amounted to $2,602,373,000 or 2.4% of net assets. |
| (d) | Security exempt from registration under Rule 144A of the Securities Act of 1933. These securities may be resold in transactions exempt from registration, normally to qualified institutional buyers. At the end of the period, the value of these securities amounted to $191,579,000 or 0.2% of net assets. |
| (e) | Security or a portion of the security is on loan at period end. |
| (f) | Investment is owned by a wholly-owned subsidiary (Subsidiary) that is treated as a corporation for U.S. tax purposes. |
| (h) | Amount is stated in United States dollars unless otherwise noted. |
| (i) | Non-income producing - Security is in default. |
| (j) | Security is perpetual in nature with no stated maturity date. |
| (k) | Affiliated fund that is generally available only to investment companies and other accounts managed by Fidelity Investments. The rate quoted is the annualized seven-day yield of the fund at period end. A complete unaudited listing of the fund's holdings as of its most recent quarter end is available upon request. In addition, each Fidelity Central Fund's financial statements are available on the SEC's website or upon request. |
| (l) | Investment made with cash collateral received from securities on loan. |
| Additional information on each restricted holding is as follows: |
| Security | Acquisition Date | Acquisition Cost ($) (000s) |
| Acrisure Holdings, Inc. Series B | 3/22/21 | 6,918 |
| | | |
| ASAC II LP | 10/10/13 | 3,041 |
| | | |
| ASAPP, Inc. Series C | 4/30/21 | 8,580 |
| | | |
| Beta Technologies, Inc. Series B, 6.00% | 4/04/22 | 26,781 |
| | | |
| Bowery Farming, Inc. Series C1 | 5/18/21 | 13,646 |
| | | |
| ByteDance Ltd. Series E1 | 11/18/20 | 71,616 |
| | | |
| Carbon, Inc. Series D | 12/15/17 | 21,376 |
| | | |
| Carbon, Inc. Series E | 3/22/19 | 2,288 |
| | | |
| Circle Internet Financial Ltd. Series E | 5/11/21 | 17,195 |
| | | |
| Circle Internet Financial Ltd. Series F | 5/09/22 | 26,878 |
| | | |
| Delphix Corp. Series D | 7/10/15 | 33,414 |
| | | |
| Discord, Inc. Series I | 9/15/21 | 8,535 |
| | | |
| ElevateBio LLC Series C | 3/09/21 | 13,528 |
| | | |
| Epic Games, Inc. | 7/13/20 - 7/30/20 | 71,128 |
| | | |
| Fanatics, Inc. Class A | 8/13/20 - 12/15/21 | 82,369 |
| | | |
| Get Heal, Inc. Series B | 1/27/23 | 112 |
| | | |
| GoBrands, Inc. Series G | 3/02/21 | 13,864 |
| | | |
| GoBrands, Inc. Series H | 7/22/21 | 27,155 |
| | | |
| High Power Exploration, Inc. Series A | 11/15/19 - 3/04/21 | 74,592 |
| | | |
| Intarcia Therapeutics, Inc. Series CC | 11/14/12 | 28,629 |
| | | |
| Intarcia Therapeutics, Inc. 6% | 1/03/20 | 9,273 |
| | | |
| Lyra Health, Inc. Series E | 1/14/21 | 13,534 |
| | | |
| Lyra Health, Inc. Series F | 6/04/21 | 1,092 |
| | | |
| Moloco, Inc. Series A | 6/26/23 | 25,176 |
| | | |
| Nuro, Inc. Series C | 10/30/20 | 42,990 |
| | | |
| Nuro, Inc. Series D | 10/29/21 | 13,406 |
| | | |
| Rad Power Bikes, Inc. | 1/21/21 | 12,486 |
| | | |
| Rad Power Bikes, Inc. Series A | 1/21/21 | 1,628 |
| | | |
| Rad Power Bikes, Inc. Series C | 1/21/21 | 6,405 |
| | | |
| Rad Power Bikes, Inc. Series D | 9/17/21 | 22,322 |
| | | |
| Rapyd Financial Network 2016 Ltd. | 3/30/21 | 25,000 |
| | | |
| Reddit, Inc. Series E | 5/18/21 | 7,021 |
| | | |
| Reddit, Inc. Series F | 8/11/21 | 54,296 |
| | | |
| Relativity Space, Inc. Series D | 11/20/20 | 24,974 |
| | | |
| Relativity Space, Inc. Series E | 5/27/21 | 9,973 |
| | | |
| Somatus, Inc. Series E | 1/31/22 | 13,310 |
| | | |
| Space Exploration Technologies Corp. Class A | 10/16/15 - 5/24/22 | 60,159 |
| | | |
| Space Exploration Technologies Corp. Class C | 9/11/17 | 1,754 |
| | | |
| Space Exploration Technologies Corp. Series G | 1/20/15 | 43,239 |
| | | |
| Space Exploration Technologies Corp. Series H | 8/04/17 | 16,238 |
| | | |
| Space Exploration Technologies Corp. Series N | 8/04/20 | 115,684 |
| | | |
| Starling Bank Ltd. Series D | 6/18/21 - 4/05/22 | 52,246 |
| | | |
| Stripe, Inc. Class B | 5/18/21 | 18,282 |
| | | |
| Stripe, Inc. Series H | 3/15/21 | 7,636 |
| | | |
| Stripe, Inc. Series I | 3/20/23 - 5/12/23 | 42,565 |
| | | |
| Tanium, Inc. Class B | 4/21/17 - 9/18/20 | 57,901 |
| | | |
| Tenstorrent, Inc. Series C1 | 4/23/21 | 11,903 |
| | | |
| Tenstorrent, Inc. 0% | 4/23/21 | 11,130 |
| | | |
| TulCo LLC | 8/24/17 - 9/07/18 | 51,985 |
| | | |
| Veterinary Emergency Group LLC Class A | 9/16/21 - 12/16/22 | 39,966 |
| | | |
| ZenPayroll, Inc. | 10/01/21 | 8,326 |
| | | |
| ZenPayroll, Inc. Series D | 7/16/19 | 32,431 |
| | | |
| ZenPayroll, Inc. Series E | 7/13/21 | 5,079 |
| | | |
| Zipline International, Inc. | 10/12/21 | 18,569 |
| | | |
| Zipline International, Inc. Series E | 12/21/20 | 42,978 |
| | | |
Affiliated Central Funds
Fiscal year to date information regarding the Fund's investments in Fidelity Central Funds, including the ownership percentage, is presented below.
| Affiliate (Amounts in thousands) | Value, beginning of period ($) | Purchases ($) | Sales Proceeds ($) | Dividend Income ($) | Realized Gain (loss) ($) | Change in Unrealized appreciation (depreciation) ($) | Value, end of period ($) | % ownership, end of period |
| Fidelity Cash Central Fund 5.14% | 2,285,580 | 5,489,123 | 4,077,899 | 70,447 | - | - | 3,696,804 | 9.4% |
| Fidelity Securities Lending Cash Central Fund 5.14% | 710,703 | 2,132,169 | 2,502,445 | 416 | - | - | 340,427 | 1.2% |
| Total | 2,996,283 | 7,621,292 | 6,580,344 | 70,863 | - | - | 4,037,231 | |
| | | | | | | | | |
Amounts in the dividend income column in the above table include any capital gain distributions from underlying funds, which are presented in the corresponding line item in the Statement of Operations, if applicable.
Amounts in the dividend income column for Fidelity Securities Lending Cash Central Fund represents the income earned on investing cash collateral, less rebates paid to borrowers and any lending agent fees associated with the loan, plus any premium payments received for lending certain types of securities.
Amounts included in the purchases and sales proceeds columns may include in-kind transactions, if applicable.
Other Affiliated Issuers
An affiliated company is a company in which the Fund has ownership of at least 5% of the voting securities. Fiscal year to date transactions with companies which are or were affiliates are presented in the table below. Certain corporate actions, such as mergers, are excluded from the amounts in this table if applicable. A dash in the Value end of period ($) column means either the issuer is no longer held at period end, or the issuer is held at period end but is no longer an affiliate.
| Affiliate (Amounts in thousands) | Value, beginning of period ($) | Purchases ($) | Sales Proceeds ($) | Dividend Income ($) | Realized Gain (loss) ($) | Change in Unrealized appreciation (depreciation) ($) | Value, end of period ($) |
| Ivanhoe Electric, Inc. | 65,377 | - | 6,439 | - | 308 | 3,556 | 62,802 |
| P3 Health Partners, Inc. | 5,033 | - | - | - | - | 22,321 | - |
| Zai Lab Ltd. | 20,591 | - | 9,817 | - | (11,610) | 10,995 | - |
| Total | 91,001 | - | 16,256 | - | (11,302) | 36,872 | 62,802 |
Amounts included in the purchases and sales proceeds columns may include in-kind transactions, if applicable.
Investment Valuation
The following is a summary of the inputs used, as of June 30, 2023, involving the Fund's assets and liabilities carried at fair value. The inputs or methodology used for valuing securities may not be an indication of the risk associated with investing in those securities. For more information on valuation inputs, and their aggregation into the levels used below, please refer to the Investment Valuation section in the accompanying Notes to Financial Statements.
| Valuation Inputs at Reporting Date: |
Description (Amounts in thousands) | Total ($) | Level 1 ($) | Level 2 ($) | Level 3 ($) |
Investments in Securities: | | | | |
|
| Equities: | | | | |
Communication Services | 19,496,045 | 19,225,248 | - | 270,797 |
Consumer Discretionary | 10,940,676 | 10,495,257 | 236,939 | 208,480 |
Consumer Staples | 2,781,513 | 2,540,841 | 227,361 | 13,311 |
Energy | 4,351,786 | 4,346,425 | 5,361 | - |
Financials | 16,589,006 | 16,222,717 | 68,128 | 298,161 |
Health Care | 13,855,595 | 13,701,968 | 42,593 | 111,034 |
Industrials | 6,712,149 | 5,316,066 | 36,325 | 1,359,758 |
Information Technology | 26,155,977 | 25,796,931 | 40,436 | 318,610 |
Materials | 3,101,039 | 2,992,443 | 49,290 | 59,306 |
Real Estate | 26,274 | 26,274 | - | - |
Utilities | 282,578 | 282,578 | - | - |
|
| Preferred Securities | 11,041 | - | - | 11,041 |
|
| Money Market Funds | 4,037,231 | 4,037,231 | - | - |
| Total Investments in Securities: | 108,340,910 | 104,983,979 | 706,433 | 2,650,498 |
The following is a reconciliation of Investments in Securities for which Level 3 inputs were used in determining value:
| (Amounts in thousands) | |
| Investments in Securities: | |
| Industrials | | | |
| Beginning Balance | $ | 1,231,006 | |
| Net Realized Gain (Loss) on Investment Securities | | - | |
| Net Unrealized Gain (Loss) on Investment Securities | | 101,332 | |
| Cost of Purchases | | 27,420 | |
| Proceeds of Sales | | - | |
| Amortization/Accretion | | - | |
| Transfers into Level 3 | | - | |
| Transfers out of Level 3 | | - | |
| Ending Balance | $ | 1,359,758 | |
| The change in unrealized gain (loss) for the period attributable to Level 3 securities held at June 30, 2023 | $ | 101,332 | |
| Other Investments in Securities | | | |
| Beginning Balance | $ | 1,209,666 | |
| Net Realized Gain (Loss) on Investment Securities | | (10,714) | |
| Net Unrealized Gain (Loss) on Investment Securities | | 24,141 | |
| Cost of Purchases | | 67,876 | |
| Proceeds of Sales | | (229) | |
| Amortization/Accretion | | - | |
| Transfers into Level 3 | | - | |
| Transfers out of Level 3 | | - | |
| Ending Balance | $ | 1,290,740 | |
| The change in unrealized gain (loss) for the period attributable to Level 3 securities held at June 30, 2023 | $ | 24,141 | |
| The information used in the above reconciliation represents fiscal year to date activity for any Investments in Securities identified as using Level 3 inputs at either the beginning or the end of the current fiscal period. Cost of purchases and proceeds of sales may include securities received and/or delivered through in-kind transactions, corporate actions or exchanges. Transfers into Level 3 were attributable to a lack of observable market data resulting from decreases in market activity, decreases in liquidity, security restructurings or corporate actions. Transfers out of Level 3 were attributable to observable market data becoming available for those securities. Transfers in or out of Level 3 represent the beginning value of any Security or Instrument where a change in the pricing level occurred from the beginning to the end of the period. Realized and unrealized gains (losses) disclosed in the reconciliation are included in Net Gain (Loss) on the Fund's Statement of Operations. | |
| Statement of Assets and Liabilities |
| Amounts in thousands (except per-share amounts) | | | | June 30, 2023 (Unaudited) |
| | | | | |
| Assets | | | | |
| Investment in securities, at value (including securities loaned of $335,035) - See accompanying schedule: | | | | |
Unaffiliated issuers (cost $39,199,470) | $ | 104,240,877 | | |
Fidelity Central Funds (cost $4,037,230) | | 4,037,231 | | |
Other affiliated issuers (cost $13,425) | | 62,802 | | |
| | | | | |
| | | | | |
| Total Investment in Securities (cost $43,250,125) | | | $ | 108,340,910 |
| Cash | | | | 578 |
| Restricted cash | | | | 1,137 |
| Foreign currency held at value (cost $10,628) | | | | 10,660 |
| Receivable for investments sold | | | | 10,686 |
| Receivable for fund shares sold | | | | 25,084 |
| Dividends receivable | | | | 45,694 |
| Distributions receivable from Fidelity Central Funds | | | | 16,482 |
| Other receivables | | | | 4,175 |
Total assets | | | | 108,455,406 |
| Liabilities | | | | |
| Payable for investments purchased | $ | 144,350 | | |
| Payable for fund shares redeemed | | 45,998 | | |
| Accrued management fee | | 25,951 | | |
| Other affiliated payables | | 9,554 | | |
| Other payables and accrued expenses | | 21,235 | | |
| Collateral on securities loaned | | 340,244 | | |
| Total Liabilities | | | | 587,332 |
| Net Assets | | | $ | 107,868,074 |
| Net Assets consist of: | | | | |
| Paid in capital | | | $ | 40,216,832 |
| Total accumulated earnings (loss) | | | | 67,651,242 |
| Net Assets | | | $ | 107,868,074 |
| | | | | |
| Net Asset Value and Maximum Offering Price | | | | |
| Contrafund : | | | | |
Net Asset Value , offering price and redemption price per share ($98,809,151 ÷ 6,621,389 shares) | | | $ | 14.92 |
| Class K : | | | | |
Net Asset Value , offering price and redemption price per share ($9,058,923 ÷ 604,707 shares) | | | $ | 14.98 |
| Statement of Operations |
| Amounts in thousands | | | | Six months ended June 30, 2023 (Unaudited) |
| Investment Income | | | | |
| Dividends | | | $ | 448,607 |
| Income from Fidelity Central Funds (including $416 from security lending) | | | | 70,863 |
| Total Income | | | | 519,470 |
| Expenses | | | | |
| Management fee | | | | |
| Basic fee | $ | 258,195 | | |
| Performance adjustment | | (118,329) | | |
| Transfer agent fees | | 53,960 | | |
| Accounting fees | | 1,586 | | |
| Custodian fees and expenses | | 361 | | |
| Independent trustees' fees and expenses | | 331 | | |
| Registration fees | | 173 | | |
| Audit | | 148 | | |
| Legal | | 67 | | |
| Miscellaneous | | 282 | | |
| Total expenses before reductions | | 196,774 | | |
| Expense reductions | | (2,190) | | |
| Total expenses after reductions | | | | 194,584 |
| Net Investment income (loss) | | | | 324,886 |
| Realized and Unrealized Gain (Loss) | | | | |
| Net realized gain (loss) on: | | | | |
| Investment Securities: | | | | |
| Unaffiliated issuers (net of foreign taxes of $1,559) | | 2,248,371 | | |
| Redemptions in-kind | | 568,537 | | |
| Affiliated issuers | | (11,302) | | |
| Foreign currency transactions | | (726) | | |
| Total net realized gain (loss) | | | | 2,804,880 |
| Change in net unrealized appreciation (depreciation) on: | | | | |
| Investment Securities: | | | | |
| Unaffiliated issuers (net of decrease in deferred foreign taxes of $1,594) | | 19,058,315 | | |
| Affiliated issuers | | 36,872 | | |
| Unfunded commitments | | 5,103 | | |
| Assets and liabilities in foreign currencies | | 19 | | |
| Total change in net unrealized appreciation (depreciation) | | | | 19,100,309 |
| Net gain (loss) | | | | 21,905,189 |
| Net increase (decrease) in net assets resulting from operations | | | $ | 22,230,075 |
| Statement of Changes in Net Assets |
| |
| Amount in thousands | | Six months ended June 30, 2023 (Unaudited) | | Year ended December 31, 2022 |
| Increase (Decrease) in Net Assets | | | | |
| Operations | | | | |
| Net investment income (loss) | $ | 324,886 | $ | 445,648 |
| Net realized gain (loss) | | 2,804,880 | | 11,425,226 |
| Change in net unrealized appreciation (depreciation) | | 19,100,309 | | (51,437,288) |
| Net increase (decrease) in net assets resulting from operations | | 22,230,075 | | (39,566,414) |
| Distributions to shareholders | | (1,378,547) | | (10,115,716) |
| | | | | |
| Share transactions - net increase (decrease) | | (3,884,328) | | (4,582,140) |
| Total increase (decrease) in net assets | | 16,967,200 | | (54,264,270) |
| | | | | |
| Net Assets | | | | |
| Beginning of period | | 90,900,874 | | 145,165,144 |
| End of period | $ | 107,868,074 | $ | 90,900,874 |
| | | | | |
| | | | | |
| | Six months ended (Unaudited) June 30, 2023 | | Years ended December 31, 2022 | | 2021 | | 2020 | | 2019 | | 2018 A |
Selected Per-Share Data | | | | | | | | | | | | |
| Net asset value, beginning of period | $ | 12.09 | $ | 18.76 | $ | 16.77 | $ | 13.71 | $ | 11.01 | $ | 12.24 |
| Income from Investment Operations | | | | | | | | | | | | |
Net investment income (loss) B,C | | .04 | | .06 | | (.05) | | (.04) | | - D | | - D |
| Net realized and unrealized gain (loss) | | 2.98 | | (5.29) | | 4.07 | | 4.44 | | 3.27 | | (.22) |
| Total from investment operations | | 3.02 | | (5.23) | | 4.02 | | 4.40 | | 3.27 | | (.22) |
| Distributions from net investment income | | - | | (.08) | | - | | - | | - | | - |
| Distributions from net realized gain | | (.19) | | (1.36) | | (2.03) | | (1.34) | | (.57) | | (1.01) |
| Total distributions | | (.19) | | (1.44) | | (2.03) | | (1.34) | | (.57) | | (1.01) |
| Net asset value, end of period | $ | 14.92 | $ | 12.09 | $ | 18.76 | $ | 16.77 | $ | 13.71 | $ | 11.01 |
Total Return E,F | | 25.19% | | (28.26)% | | 24.36% | | 32.58% | | 29.98% | | (2.13)% |
Ratios to Average Net Assets C,G,H | | | | | | | | | | | | |
| Expenses before reductions | | .41% I | | .55% | | .81% | | .86% | | .85% | | .82% |
| Expenses net of fee waivers, if any | | .40% I | | .54% | | .81% | | .86% | | .85% | | .81% |
| Expenses net of all reductions | | .40% I | | .54% | | .81% | | .85% | | .85% | | .81% |
| Net investment income (loss) | | .65% I | | .41% | | (.26)% | | (.23)% | | (.02)% | | .01% |
| Supplemental Data | | | | | | | | | | | | |
| Net assets, end of period (in millions) | $ | 98,809 | $ | 82,279 | $ | 128,577 | $ | 113,100 | $ | 97,098 | $ | 82,628 |
Portfolio turnover rate J | | 16% I | | 25% K | | 27% K | | 32% K | | 26% K | | 32% K |
A Per share amounts have been adjusted to reflect the impact of the 10 for 1 share split that occurred on August 10, 2018.
B Calculated based on average shares outstanding during the period.
C Net investment income (loss) is affected by the timing of the declaration of dividends by any underlying mutual funds or exchange-traded funds (ETFs). Net investment income (loss) of any mutual funds or ETFs is not included in the Fund's net investment income (loss) ratio.
D Amount represents less than $.005 per share.
E Total returns for periods of less than one year are not annualized.
F Total returns would have been lower if certain expenses had not been reduced during the applicable periods shown.
G Fees and expenses of any underlying mutual funds or exchange-traded funds (ETFs) are not included in the Fund's expense ratio. The Fund indirectly bears its proportionate share of these expenses. For additional expense information related to investments in Fidelity Central Funds, please refer to the "Investments in Fidelity Central Funds" note found in the Notes to Financial Statements section of the most recent Annual or Semi-Annual report.
H Expense ratios reflect operating expenses of the class. Expenses before reductions do not reflect amounts reimbursed, waived, or reduced through arrangements with the investment adviser, brokerage services, or other offset arrangements, if applicable, and do not represent the amount paid by the class during periods when reimbursements, waivers or reductions occur.
I Annualized.
J Amount does not include the portfolio activity of any underlying mutual funds or exchange-traded funds (ETFs).
K Portfolio turnover rate excludes securities received or delivered in-kind.
| Fidelity® Contrafund® Class K |
| |
| | Six months ended (Unaudited) June 30, 2023 | | Years ended December 31, 2022 | | 2021 | | 2020 | | 2019 | | 2018 A |
Selected Per-Share Data | | | | | | | | | | | | |
| Net asset value, beginning of period | $ | 12.13 | $ | 18.82 | $ | 16.81 | $ | 13.73 | $ | 11.01 | $ | 12.24 |
| Income from Investment Operations | | | | | | | | | | | | |
Net investment income (loss) B,C | | .05 | | .07 | | (.03) | | (.02) | | .01 | | .01 |
| Net realized and unrealized gain (loss) | | 2.99 | | (5.31) | | 4.07 | | 4.44 | | 3.28 | | (.23) |
| Total from investment operations | | 3.04 | | (5.24) | | 4.04 | | 4.42 | | 3.29 | | (.22) |
| Distributions from net investment income | | - | | (.09) | | - | | - | | - | | - |
| Distributions from net realized gain | | (.19) | | (1.36) | | (2.03) | | (1.34) | | (.57) | | (1.01) |
| Total distributions | | (.19) | | (1.45) | | (2.03) | | (1.34) | | (.57) | | (1.01) |
| Net asset value, end of period | $ | 14.98 | $ | 12.13 | $ | 18.82 | $ | 16.81 | $ | 13.73 | $ | 11.01 |
Total Return D,E | | 25.27% | | (28.22)% | | 24.42% | | 32.68% | | 30.17% | | (2.07)% |
Ratios to Average Net Assets C,F,G | | | | | | | | | | | | |
| Expenses before reductions | | .33% H | | .47% | | .74% | | .78% | | .77% | | .73% |
| Expenses net of fee waivers, if any | | .33% H | | .47% | | .74% | | .78% | | .76% | | .73% |
| Expenses net of all reductions | | .33% H | | .47% | | .74% | | .78% | | .76% | | .72% |
| Net investment income (loss) | | .73% H | | .48% | | (.18)% | | (.16)% | | .06% | | .10% |
| Supplemental Data | | | | | | | | | | | | |
| Net assets, end of period (in millions) | $ | 9,059 | $ | 8,622 | $ | 16,588 | $ | 23,196 | $ | 22,626 | $ | 25,502 |
Portfolio turnover rate I | | 16% H,J | | 25% J | | 27% J | | 32% J | | 26% J | | 32% J |
A Per share amounts have been adjusted to reflect the impact of the 10 for 1 share split that occurred on August 10, 2018.
B Calculated based on average shares outstanding during the period.
C Net investment income (loss) is affected by the timing of the declaration of dividends by any underlying mutual funds or exchange-traded funds (ETFs). Net investment income (loss) of any mutual funds or ETFs is not included in the Fund's net investment income (loss) ratio.
D Total returns for periods of less than one year are not annualized.
E Total returns would have been lower if certain expenses had not been reduced during the applicable periods shown.
F Fees and expenses of any underlying mutual funds or exchange-traded funds (ETFs) are not included in the Fund's expense ratio. The Fund indirectly bears its proportionate share of these expenses. For additional expense information related to investments in Fidelity Central Funds, please refer to the "Investments in Fidelity Central Funds" note found in the Notes to Financial Statements section of the most recent Annual or Semi-Annual report.
G Expense ratios reflect operating expenses of the class. Expenses before reductions do not reflect amounts reimbursed, waived, or reduced through arrangements with the investment adviser, brokerage services, or other offset arrangements, if applicable, and do not represent the amount paid by the class during periods when reimbursements, waivers or reductions occur.
H Annualized.
I Amount does not include the portfolio activity of any underlying mutual funds or exchange-traded funds (ETFs).
J Portfolio turnover rate excludes securities received or delivered in-kind.
For the period ended June 30, 2023
( Amounts in thousands except percentages)
1. Organization.
Fidelity Contrafund (the Fund) is a fund of Fidelity Contrafund (the Trust) and is authorized to issue an unlimited number of shares. The Trust is registered under the Investment Company Act of 1940, as amended (the 1940 Act), as an open-end management investment company organized as a Massachusetts business trust. The Fund offers Contrafund and Class K shares, each of which has equal rights as to assets and voting privileges. Each class has exclusive voting rights with respect to matters that affect that class.
2. Investments in Fidelity Central Funds.
Funds may invest in Fidelity Central Funds, which are open-end investment companies generally available only to other investment companies and accounts managed by the investment adviser and its affiliates. The Schedule of Investments lists any Fidelity Central Funds held as an investment as of period end, but does not include the underlying holdings of each Fidelity Central Fund. An investing fund indirectly bears its proportionate share of the expenses of the underlying Fidelity Central Funds.
Based on its investment objective, each Fidelity Central Fund may invest or participate in various investment vehicles or strategies that are similar to those of the investing fund. These strategies are consistent with the investment objectives of the investing fund and may involve certain economic risks which may cause a decline in value of each of the Fidelity Central Funds and thus a decline in the value of the investing fund.
| Fidelity Central Fund | Investment Manager | Investment Objective | Investment Practices | Expense Ratio A |
| Fidelity Money Market Central Funds | Fidelity Management & Research Company LLC (FMR) | Each fund seeks to obtain a high level of current income consistent with the preservation of capital and liquidity. | Short-term Investments | Less than .005% |
A Expenses expressed as a percentage of average net assets and are as of each underlying Central Fund's most recent annual or semi-annual shareholder report.
A complete unaudited list of holdings for each Fidelity Central Fund is available upon request or at the Securities and Exchange Commission website at www.sec.gov. In addition, the financial statements of the Fidelity Central Funds which contain the significant accounting policies (including investment valuation policies) of those funds, and are not covered by the Report of Independent Registered Public Accounting Firm, are available on the Securities and Exchange Commission website or upon request.
3. Significant Accounting Policies.
The Fund is an investment company and applies the accounting and reporting guidance of the Financial Accounting Standards Board (FASB) Accounting Standards Codification Topic 946 Financial Services - Investment Companies . The financial statements have been prepared in conformity with accounting principles generally accepted in the United States of America (GAAP), which require management to make certain estimates and assumptions at the date of the financial statements. Actual results could differ from those estimates. Subsequent events, if any, through the date that the financial statements were issued have been evaluated in the preparation of the financial statements. The Fund's Schedule of Investments lists any underlying mutual funds or exchange-traded funds (ETFs) but does not include the underlying holdings of these funds. The following summarizes the significant accounting policies of the Fund:
Investment Valuation. Investments are valued as of 4:00 p.m. Eastern time on the last calendar day of the period. The Board of Trustees (the Board) has designated the Fund's investment adviser as the valuation designee responsible for the fair valuation function and performing fair value determinations as needed. The investment adviser has established a Fair Value Committee (the Committee) to carry out the day-to-day fair valuation responsibilities and has adopted policies and procedures to govern the fair valuation process and the activities of the Committee. In accordance with these fair valuation policies and procedures, which have been approved by the Board, the Fund attempts to obtain prices from one or more third party pricing services or brokers to value its investments. When current market prices, quotations or currency exchange rates are not readily available or reliable, investments will be fair valued in good faith by the Committee, in accordance with the policies and procedures. Factors used in determining fair value vary by investment type and may include market or investment specific events, transaction data, estimated cash flows, and market observations of comparable investments. The frequency that the fair valuation procedures are used cannot be predicted and they may be utilized to a significant extent. The Committee manages the Fund's fair valuation practices and maintains the fair valuation policies and procedures. The Fund's investment adviser reports to the Board information regarding the fair valuation process and related material matters.
The Fund categorizes the inputs to valuation techniques used to value its investments into a disclosure hierarchy consisting of three levels as shown below:
Level 1 - unadjusted quoted prices in active markets for identical investments
Level 2 - other significant observable inputs (including quoted prices for similar investments, interest rates, prepayment speeds, etc.)
Level 3 - unobservable inputs (including the Fund's own assumptions based on the best information available)
Valuation techniques used to value the Fund's investments by major category are as follows:
Equity securities, including restricted securities, for which market quotations are readily available, are valued at the last reported sale price or official closing price as reported by a third party pricing service on the primary market or exchange on which they are traded and are categorized as Level 1 in the hierarchy. In the event there were no sales during the day or closing prices are not available, securities are valued at the last quoted bid price or may be valued using the last available price and are generally categorized as Level 2 in the hierarchy. For foreign equity securities, when market or security specific events arise, comparisons to the valuation of American Depositary Receipts (ADRs), futures contracts, ETFs and certain indexes as well as quoted prices for similar securities may be used and would be categorized as Level 2 in the hierarchy. For equity securities, including restricted securities, where observable inputs are limited, assumptions about market activity and risk are used and these securities may be categorized as Level 3 in the hierarchy. Securities, including private placements or other restricted securities, for which observable inputs are not available are valued using alternate valuation approaches, including the market approach, the income approach and cost approach, and are categorized as Level 3 in the hierarchy. The market approach considers factors including the price of recent investments in the same or a similar security or financial metrics of comparable securities. The income approach considers factors including expected future cash flows, security specific risks and corresponding discount rates. The cost approach considers factors including the value of the security's underlying assets and liabilities.
Debt securities, including restricted securities, are valued based on evaluated prices received from third party pricing services or from brokers who make markets in such securities. Preferred securities are valued by pricing services who utilize matrix pricing which considers yield or price of bonds of comparable quality, coupon, maturity and type or by broker-supplied prices. When independent prices are unavailable or unreliable, debt securities may be valued utilizing pricing methodologies which consider similar factors that would be used by third party pricing services. Debt securities are generally categorized as Level 2 in the hierarchy but may be Level 3 depending on the circumstances.
Investments in open-end mutual funds, including the Fidelity Central Funds, are valued at their closing net asset value (NAV) each business day and are categorized as Level 1 in the hierarchy.
The following provides information on Level 3 securities held by the Fund that were valued at period end based on unobservable inputs. These amounts exclude valuations provided by a broker.
| Asset Type | Fair Value | Valuation Technique(s) | Unobservable Input | Amount or Range/Weighted Average | Impact to Valuation from an Increase in Input A |
| Equities | $2,639,457 | Market comparable | Enterprise value/EBITDA multiple (EV/EBITDA) | 6.0 - 22.0 / 14.3 | Increase |
| | | | Enterprise value/Revenue multiple (EV/R) | 1.3 - 43.7 / 10.7 | Increase |
| | | | Enterprise value/Net income multiple (EV/NI) | 14.5 | Increase |
| | | Recovery value | Recovery value | $0.00 - $0.17 / $0.17 | Increase |
| | | Market approach | Transaction price | $59.45 - $60.00 / $59.83 | Increase |
| | | | Discount rate | 10.0% | Decrease |
| | | | Premium rate | 10.0% | Increase |
| | | Book value | Book value multiple | 1.0 | Increase |
| | | Discounted cash flow | Weighted average cost of capital (WACC) | 29.0% | Decrease |
| | | | Exit multiple | 1.8 | Increase |
| | | Black scholes | Discount rate | 4.0% - 5.4% / 4.4% | Increase |
| | | | Volatility | 70.0% - 85.0% / 76.6% | Increase |
| | | | Term | 0.3 - 5.0 / 3.6 | Increase |
| Preferred Securities | $11,041 | Recovery value | Recovery value | $0.00 | Increase |
| | | Market approach | Transaction price | 59.45 | Increase |
| | | | Premium rate | 10.0% | Increase |
| | | Black scholes | Discount rate | 4.7% | Increase |
| | | | Volatility | 70.0% | Increase |
| | | | Term | 2.0 | Increase |
A Represents the directional change in the fair value of the Level 3 investments that could have resulted from an increase in the corresponding input as of period end. A decrease to the unobservable input would have had the opposite effect. Significant changes in these inputs may have resulted in a significantly higher or lower fair value measurement at period end.
Changes in valuation techniques may result in transfers in or out of an assigned level within the disclosure hierarchy. The aggregate value of investments by input level as of June 30, 2023, as well as a roll forward of Level 3 investments, is included at the end of the Fund's Schedule of Investments.
Foreign Currency. Certain Funds may use foreign currency contracts to facilitate transactions in foreign-denominated securities. Gains and losses from these transactions may arise from changes in the value of the foreign currency or if the counterparties do not perform under the contracts' terms.
Foreign-denominated assets, including investment securities, and liabilities are translated into U.S. dollars at the exchange rates at period end. Purchases and sales of investment securities, income and dividends received, and expenses denominated in foreign currencies are translated into U.S. dollars at the exchange rate in effect on the transaction date.
The effects of exchange rate fluctuations on investments are included with the net realized and unrealized gain (loss) on investment securities. Other foreign currency transactions resulting in realized and unrealized gain (loss) are disclosed separately.
Investment Transactions and Income. For financial reporting purposes, the Fund's investment holdings and NAV include trades executed through the end of the last business day of the period. The NAV per share for processing shareholder transactions is calculated as of the close of business of the New York Stock Exchange (NYSE), normally 4:00 p.m. Eastern time and includes trades executed through the end of the prior business day. Gains and losses on securities sold are determined on the basis of identified cost and include proceeds received from litigation. Commissions paid to certain brokers with whom the investment adviser, or its affiliates, places trades on behalf of a fund include an amount in addition to trade execution, which may be rebated back to a fund. Any such rebates are included in net realized gain (loss) on investments in the Statement of Operations. Dividend income is recorded on the ex-dividend date, except for certain dividends from foreign securities where the ex-dividend date may have passed, which are recorded as soon as the Fund is informed of the ex-dividend date. Non-cash dividends included in dividend income, if any, are recorded at the fair market value of the securities received. Income and capital gain distributions from Fidelity Central Funds, if any, are recorded on the ex-dividend date. Certain distributions received by the Fund represent a return of capital or capital gain. The Fund determines the components of these distributions subsequent to the ex-dividend date, based upon receipt of tax filings or other correspondence relating to the underlying investment. These distributions are recorded as a reduction of cost of investments and/or as a realized gain. Investment income is recorded net of foreign taxes withheld where recovery of such taxes is uncertain. Funds may file withholding tax reclaims in certain jurisdictions to recover a portion of amounts previously withheld. Any withholding tax reclaims income is included in the Statement of Operations in dividends. Any receivables for withholding tax reclaims are included in the Statement of Assets and Liabilities in dividends receivable.
Class Allocations and Expenses. Investment income, realized and unrealized capital gains and losses, common expenses of a fund, and certain fund-level expense reductions, if any, are allocated daily on a pro-rata basis to each class based on the relative net assets of each class to the total net assets of a fund. Each class differs with respect to transfer agent and distribution and service plan fees incurred, as applicable. Certain expense reductions may also differ by class, if applicable. For the reporting period, the allocated portion of income and expenses to each class as a percent of its average net assets may vary due to the timing of recording these transactions in relation to fluctuating net assets of the classes. Expenses directly attributable to a fund are charged to that fund. Expenses attributable to more than one fund are allocated among the respective funds on the basis of relative net assets or other appropriate methods. Expenses included in the accompanying financial statements reflect the expenses of that fund and do not include any expenses associated with any underlying mutual funds or exchange-traded funds (ETFs). Although not included in a fund's expenses, a fund indirectly bears its proportionate share of these expenses through the net asset value of each underlying mutual fund or exchange-traded fund (ETF). Expense estimates are accrued in the period to which they relate and adjustments are made when actual amounts are known.
Deferred Trustee Compensation. Under a Deferred Compensation Plan (the Plan) for certain Funds, certain independent Trustees have elected to defer receipt of a portion of their annual compensation. Deferred amounts are invested in affiliated mutual funds, are marked-to-market and remain in a fund until distributed in accordance with the Plan. The investment of deferred amounts and the offsetting payable to the Trustees presented below are included in the accompanying Statement of Assets and Liabilities in other receivables and other payables and accrued expenses, as applicable.
| Fidelity Contrafund | $3,721 |
Income Tax Information and Distributions to Shareholders. Each year, the Fund intends to qualify as a regulated investment company under Subchapter M of the Internal Revenue Code, including distributing substantially all of its taxable income and realized gains. As a result, no provision for U.S. Federal income taxes is required. The Fund files a U.S. federal tax return, in addition to state and local tax returns as required. The Fund's federal income tax returns are subject to examination by the Internal Revenue Service (IRS) for a period of three fiscal years after they are filed. State and local tax returns may be subject to examination for an additional fiscal year depending on the jurisdiction. Foreign taxes are provided for based on the Fund's understanding of the tax rules and rates that exist in the foreign markets in which it invests. The Fund is subject to a tax imposed on capital gains by certain countries in which it invests. An estimated deferred tax liability for net unrealized appreciation on the applicable securities is included in Other payables and accrued expenses on the Statement of Assets & Liabilities.
Distributions are declared and recorded on the ex-dividend date. Income and capital gain distributions are declared separately for each class. Income and capital gain distributions are determined in accordance with income tax regulations, which may differ from GAAP.
Capital accounts within the financial statements are adjusted for permanent book-tax differences. These adjustments have no impact on net assets or the results of operations. Capital accounts are not adjusted for temporary book-tax differences which will reverse in a subsequent period.
Book-tax differences are primarily due to foreign currency transactions, certain foreign taxes, passive foreign investment companies (PFIC), redemptions in-kind, partnerships and losses deferred due to wash sales.
As of period end, the cost and unrealized appreciation (depreciation) in securities, and derivatives if applicable, for federal income tax purposes were as follows:
| Gross unrealized appreciation | $65,710,225 |
| Gross unrealized depreciation | (1,070,305) |
| Net unrealized appreciation (depreciation) | $64,639,920 |
| Tax cost | $43,700,990 |
Restricted Securities (including Private Placements). Funds may invest in securities that are subject to legal or contractual restrictions on resale. These securities generally may be resold in transactions exempt from registration or to the public if the securities are registered. Disposal of these securities may involve time-consuming negotiations and expense, and prompt sale at an acceptable price may be difficult. Information regarding restricted securities held at period end is included at the end of the Schedule of Investments, if applicable.
Consolidated Subsidiary. The Funds included in the table below hold certain investments through a wholly-owned subsidiary ("Subsidiary"), which may be subject to federal and state taxes upon disposition.
As of period end, investments in Subsidiaries were as follows:
| | $ Amount | % of Net Assets |
| Fidelity Contrafund | 179,640 | .17 |
The financial statements have been consolidated to include the Subsidiary accounts where applicable. Accordingly, all inter-company transactions and balances have been eliminated.
At period end, any estimated tax liability for these investments is presented as "Deferred taxes" in the Statement of Assets and Liabilities and included in "Change in net unrealized appreciation (depreciation) on investment securities" in the Statement of Operations. The tax liability incurred may differ materially depending on conditions when these investments are disposed. Any cash held by a Subsidiary is restricted as to its use and is presented as "Restricted cash" in the Statement of Assets and Liabilities, if applicable.
New Accounting Pronouncement. In June 2022, the Financial Accounting Standards Board (FASB) issued Accounting Standards Update (ASU) 2022-03 Fair Value Measurement (Topic 820): Fair Value Measurement of Equity Securities Subject to Contractual Sale Restrictions. The amendments in this ASU clarify that a contractual restriction on the sale of an equity security is not considered part of the unit of account of the equity security and, therefore, is not considered in measuring fair value. They also clarify that an entity cannot, as a separate unit of account, recognize and measure a contractual sale restriction. They also require additional disclosures for equity securities subject to contractual sale restrictions. ASU 2022-03 will be effective for fiscal years, including interim periods within those fiscal years, beginning after December 15, 2023, and allows for early adoption. ASU 2022-03 will only be applicable to an equity security in which the contractual arrangement that restricts its sale is executed or modified on or after the adoption date. Management is currently evaluating the potential impact of ASU 2022-03 to the financial statements.
4. Purchases and Sales of Investments.
Purchases and sales of securities, other than short-term securities and in-kind transactions, as applicable, are noted in the table below.
| | Purchases ($) | Sales ($) |
| Fidelity Contrafund | 7,603,033 | 13,043,231 |
Unaffiliated Redemptions In-Kind. Shares that were redeemed in-kind for investments, including accrued interest and cash, if any, are shown in the table below. The net realized gain or loss on investments delivered through in-kind redemptions is included in the "Net realized gain (loss) on: Redemptions in-kind" line in the accompanying Statement of Operations. The amount of the in-kind redemptions is included in share transactions in the accompanying Statement of Changes in Net Assets. There was no gain or loss for federal income tax purposes.
| | Shares | Total net realized gain or loss ($) | Total Proceeds ($) | Participating classes |
| Fidelity Contrafund | 67,242 | 568,537 | 882,791 | Class K |
Prior Fiscal Year Unaffiliated Redemptions In-Kind. Shares that were redeemed in-kind for investments, including accrued interest and cash, if any, are shown in the table below; along with realized gain or loss on investments delivered through in-kind redemptions. The amount of the in-kind redemptions is included in share transactions in the accompanying Statement of Changes in Net Assets. There was no gain or loss for federal income tax purposes.
| | Shares | Total net realized gain or loss ($) | Total Proceeds ($) | Participating classes |
| Fidelity Contrafund | 103,972 | 964,453 | 1,619,588 | Contrafund, Class K |
5. Fees and Other Transactions with Affiliates.
Management Fee. Fidelity Management & Research Company LLC (the investment adviser) and its affiliates provide the Fund with investment management related services for which the Fund pays a monthly management fee. The management fee is the sum of an individual fund fee rate that is based on an annual rate of .30% of the Fund's average net assets and an annualized group fee rate that averaged .23% during the period. The group fee rate is based upon the monthly average net assets of a group of registered investment companies with which the investment adviser has management contracts. The group fee rate decreases as assets under management increase and increases as assets under management decrease. In addition, the management fee is subject to a performance adjustment (up to a maximum of +/- .20% of the Fund's average net assets over a 36 month performance period). The upward or downward adjustment to the management fee is based on the relative investment performance of Contrafund as compared to its benchmark index, the S&P 500 Index, over the same 36 month performance period. For the reporting period, the total annualized management fee rate, including the performance adjustment, was .28% of the Fund's average net assets. The performance adjustment included in the management fee rate may be higher or lower than the maximum performance adjustment rate due to the difference between the average net assets for the reporting and performance periods.
Transfer Agent Fees. Fidelity Investments Institutional Operations Company LLC (FIIOC), an affiliate of the investment adviser, is the transfer, dividend disbursing and shareholder servicing agent for each class of the Fund. FIIOC receives account fees and asset-based fees that vary according to the account size and type of account of the shareholders of the respective classes of the Fund, except for Class K. FIIOC receives an asset-based fee of Class K's average net assets. FIIOC pays for typesetting, printing and mailing of shareholder reports, except proxy statements.
For the period, transfer agent fees for each class were as follows:
| | Amount | % of Class-Level Average Net Assets A |
| Contrafund | $52,116 | .12 |
| Class K | 1,844 | .04 |
| | $53,960 | |
A Annualized
Accounting Fees. Fidelity Service Company, Inc. (FSC), an affiliate of the investment adviser, maintains the Fund's accounting records. The accounting fee is based on the level of average net assets for each month. For the period, the fees were equivalent to the following annualized rates:
| | % of Average Net Assets |
| Fidelity Contrafund | - A |
A Amount represents less than .005%.
Brokerage Commissions. A portion of portfolio transactions were placed with brokerage firms which are affiliates of the investment adviser. Brokerage commissions are included in net realized gain (loss) and change in net unrealized appreciation (depreciation) in the Statement of Operations. The commissions paid to these affiliated firms were as follows:
| | Amount |
| Fidelity Contrafund | $165 |
Interfund Trades. Funds may purchase from or sell securities to other Fidelity Funds under procedures adopted by the Board. The procedures have been designed to ensure these interfund trades are executed in accordance with Rule 17a-7 of the 1940 Act. Any interfund trades are included within the respective purchases and sales amounts shown in the Purchases and Sales of Investments note. Interfund trades during the period are noted in the table below.
| | Purchases ($) | Sales ($) | Realized Gain (Loss) ($) |
| Fidelity Contrafund | 341,315 | 900,535 | 251,001 |
6. Committed Line of Credit.
Certain Funds participate with other funds managed by the investment adviser or an affiliate in a $4.25 billion credit facility (the "line of credit") to be utilized for temporary or emergency purposes to fund shareholder redemptions or for other short-term liquidity purposes. The participating funds have agreed to pay commitment fees on their pro-rata portion of the line of credit, which are reflected in Miscellaneous expenses on the Statement of Operations, and are listed below. During the period, there were no borrowings on this line of credit.
| | Amount |
| Fidelity Contrafund | $93 |
7. Security Lending.
Funds lend portfolio securities from time to time in order to earn additional income. Lending agents are used, including National Financial Services (NFS), an affiliate of the investment adviser. Pursuant to a securities lending agreement, NFS will receive a fee, which is capped at 9.9% of a fund's daily lending revenue, for its services as lending agent. A fund may lend securities to certain qualified borrowers, including NFS. On the settlement date of the loan, a fund receives collateral (in the form of U.S. Treasury obligations, letters of credit and/or cash) against the loaned securities and maintains collateral in an amount not less than 100% of the market value of the loaned securities during the period of the loan. The market value of the loaned securities is determined at the close of business of a fund and any additional required collateral is delivered to a fund on the next business day. A fund or borrower may terminate the loan at any time, and if the borrower defaults on its obligation to return the securities loaned because of insolvency or other reasons, a fund may apply collateral received from the borrower against the obligation. A fund may experience delays and costs in recovering the securities loaned. Any cash collateral received is invested in the Fidelity Securities Lending Cash Central Fund. Any loaned securities are identified as such in the Schedule of Investments, and the value of loaned securities and cash collateral at period end, as applicable, are presented in the Statement of Assets and Liabilities. Security lending income represents the income earned on investing cash collateral, less rebates paid to borrowers and any lending agent fees associated with the loan, plus any premium payments received for lending certain types of securities. Security lending income is presented in the Statement of Operations as a component of income from Fidelity Central Funds. Affiliated security lending activity, if any, was as follows:
| | Total Security Lending Fees Paid to NFS | Security Lending Income From Securities Loaned to NFS | Value of Securities Loaned to NFS at Period End |
| Fidelity Contrafund | $44 | $- A | $- |
A Amount represents less than five hundred dollars.
8. Expense Reductions.
Through arrangements with the Fund's custodian, credits realized as a result of certain uninvested cash balances were used to reduce the Fund's expenses. During the period, custodian credits reduced the Fund's expenses by $8.
In addition, during the period the investment adviser or an affiliate reimbursed and/or waived a portion of fund-level operating expenses in the amount of $2,182.
9. Distributions to Shareholders.
Distributions to shareholders of each class were as follows:
| | Six months ended June 30, 2023 | Year ended December 31, 2022 |
| Fidelity Contrafund | | |
| Distributions to shareholders | | |
| Contrafund | $1,249,206 | $9,128,177 |
| Class K | 129,341 | 987,539 |
| Total | $1,378,547 | $10,115,716 |
10. Share Transactions.
Share transactions for each class were as follows and may contain in-kind transactions, automatic conversions between classes or exchanges between affiliated funds:
| | Shares | Shares | Dollars | Dollars |
| | Six months ended June 30, 2023 | Year ended December 31, 2022 | Six months ended June 30, 2023 | Year ended December 31, 2022 |
| Fidelity Contrafund | | | | |
| Contrafund | | | | |
| Shares sold | 148,498 | 348,710 | $1,993,786 | $5,094,513 |
| Reinvestment of distributions | 89,917 | 657,388 | 1,159,027 | 8,457,516 |
| Shares redeemed | (425,066) | (1,050,982) | (5,636,012) | (15,394,010) |
| Net increase (decrease) | (186,651) | (44,884) | $(2,483,199) | $(1,841,981) |
| Class K | | | | |
| Shares sold | 46,601 | 63,881 | $631,286 | $958,814 |
| Reinvestment of distributions | 10,003 | 76,064 | 129,337 | 987,511 |
| Shares redeemed | (162,866) | (310,293) | (2,161,752) | (4,686,484) |
| Net increase (decrease) | (106,262) | (170,348) | $(1,401,129) | $(2,740,159) |
11. Other.
A fund's organizational documents provide former and current trustees and officers with a limited indemnification against liabilities arising in connection with the performance of their duties to the fund. In the normal course of business, a fund may also enter into contracts that provide general indemnifications. A fund's maximum exposure under these arrangements is unknown as this would be dependent on future claims that may be made against a fund. The risk of material loss from such claims is considered remote.
12. Risk and Uncertainties.
Many factors affect a fund's performance. Developments that disrupt global economies and financial markets, such as pandemics, epidemics, outbreaks of infectious diseases, war, terrorism, and environmental disasters, may significantly affect a fund's investment performance. The effects of these developments to a fund will be impacted by the types of securities in which a fund invests, the financial condition, industry, economic sector, and geographic location of an issuer, and a fund's level of investment in the securities of that issuer. Significant concentrations in security types, issuers, industries, sectors, and geographic locations may magnify the factors that affect a fund's performance.
As a shareholder, you incur two types of costs: (1) transaction costs, which may include sales charges (loads) on purchase payments or redemption proceeds, as applicable and (2) ongoing costs, which generally include management fees, distribution and/or service (12b-1) fees and other Fund expenses. This Example is intended to help you understand your ongoing costs (in dollars) of investing in a fund and to compare these costs with the ongoing costs of investing in other mutual funds.
| The Example is based on an investment of $1,000 invested at the beginning of the period and held for the entire period (January 1, 2023 to June 30, 2023). |
Actual Expenses
The first line of the accompanying table provides information about actual account values and actual expenses. You may use the information in this line, together with the amount you invested, to estimate the expenses that you paid over the period. Simply divide your account value by $1,000.00 (for example, an $8,600 account value divided by $1,000.00 = 8.6), then multiply the result by the number in the first line for a class/Fund under the heading entitled "Expenses Paid During Period" to estimate the expenses you paid on your account during this period. If any fund is a shareholder of any underlying mutual funds or exchange-traded funds (ETFs) (the Underlying Funds), such fund indirectly bears its proportional share of the expenses of the Underlying Funds in addition to the direct expenses incurred presented in the table. These fees and expenses are not included in the annualized expense ratio used to calculate the expense estimate in the table below.
Hypothetical Example for Comparison Purposes
The second line of the accompanying table provides information about hypothetical account values and hypothetical expenses based on the actual expense ratio and an assumed rate of return of 5% per year before expenses, which is not the actual return. The hypothetical account values and expenses may not be used to estimate the actual ending account balance or expenses you paid for the period. You may use this information to compare the ongoing costs of investing in the Fund and other funds. To do so, compare this 5% hypothetical example with the 5% hypothetical examples that appear in the shareholder reports of the other funds. If any fund is a shareholder of any Underlying Funds, such fund indirectly bears its proportional share of the expenses of the Underlying Funds in addition to the direct expenses as presented in the table. These fees and expenses are not included in the annualized expense ratio used to calculate the expense estimate in the table below.
Please note that the expenses shown in the table are meant to highlight your ongoing costs only and do not reflect any transaction costs. Therefore, the second line of the table is useful in comparing ongoing costs only, and will not help you determine the relative total costs of owning different funds. In addition, if these transactional costs were included, your costs would have been higher.
| | | | | Annualized Expense Ratio- A | | Beginning Account Value January 1, 2023 | | Ending Account Value June 30, 2023 | | Expenses Paid During Period- C January 1, 2023 to June 30, 2023 |
| Fidelity® Contrafund® | | | | | | | | | | |
| Fidelity® Contrafund® | | | | .40% | | | | | | |
| Actual | | | | | | $ 1,000 | | $ 1,251.90 | | $ 2.23 |
Hypothetical- B | | | | | | $ 1,000 | | $ 1,022.81 | | $ 2.01 |
| Class K | | | | .33% | | | | | | |
| Actual | | | | | | $ 1,000 | | $ 1,252.70 | | $ 1.84 |
Hypothetical- B | | | | | | $ 1,000 | | $ 1,023.16 | | $ 1.66 |
| |
A Annualized expense ratio reflects expenses net of applicable fee waivers.
B 5% return per year before expenses
C Expenses are equal to the annualized expense ratio, multiplied by the average account value over the period, multiplied by 181/ 365 (to reflect the one-half year period). The fees and expenses of any Underlying Funds are not included in each annualized expense ratio.
Board Approval of Investment Advisory Contracts
Fidelity Contrafund
At its May 2023 meeting, the Board of Trustees, including the Independent Trustees (together, the Board), voted to continue the management contract with Fidelity Management & Research Company LLC (FMR), and the sub-advisory agreements and sub-subadvisory agreements, in each case, where applicable (together, the Advisory Contracts) for the fund for two months from June 1, 2023 through July 31, 2023. The Board determined that it will consider the annual renewal of the fund's Advisory Contracts for a full one year period in July 2023, following its review of additional materials provided by FMR.
The Board considered that the approval of the fund's Advisory Contracts will not result in any changes in (i) the investment process or strategies employed in the management of the fund's assets; (ii) the fees and expenses paid by shareholders; (iii) the nature, extent or quality of services provided under the fund's Advisory Contracts; or (iv) the day-to-day management of the fund or the persons primarily responsible for such management. The Board also considered that since its last approval of the fund's Advisory Contracts, FMR had provided additional information on the fund in support of the annual contract renewal process, including competitive analyses on total expenses and management fees and in-depth reviews of fund performance and fund profitability information. The Board concluded that the fund's Advisory Contracts are fair and reasonable, and that the fund's Advisory Contracts should be renewed, without modification, through July 31, 2023, with the understanding that the Board will consider the annual renewal for a full one year period in July 2023.
In connection with its consideration of future renewals of the fund's Advisory Contracts, the Board will consider: (i) the nature, extent and quality of services provided to the fund, including shareholder and administrative services and investment performance; (ii) the competitiveness of the management fee and total expenses for the fund; (iii) the costs of the services and profitability, including the revenues earned and the expenses incurred in conducting the business of developing, marketing, distributing, managing, administering, and servicing the fund and its shareholders, to the extent applicable; and (iv) whether there have been economies of scale in respect of the Fidelity funds, whether the Fidelity funds (including the fund) have appropriately benefited from any such economies of scale, and whether there is the potential for realization of any further economies.
Based on its evaluation of all of the conclusions noted above, and after considering all factors it believed relevant, the Board ultimately concluded that the fund's management fee structure is fair and reasonable, and that the continuation of the fund's Advisory Contracts should be approved for two months from June 1, 2023 through July 31, 2023.
The Securities and Exchange Commission adopted Rule 22e-4 under the Investment Company Act of 1940 (the Liquidity Rule) to promote effective liquidity risk management throughout the open-end investment company industry, thereby reducing the risk that funds will be unable to meet their redemption obligations and mitigating dilution of the interests of fund shareholders.
The Fund has adopted and implemented a liquidity risk management program (the Program) reasonably designed to assess and manage the Fund's liquidity risk and to comply with the requirements of the Liquidity Rule. The Fund's Board of Trustees (the Board) has designated the Fund's investment adviser as administrator of the Program. The Fidelity advisers have established a Liquidity Risk Management Committee (the LRM Committee) to manage the Program for each of the Fidelity Funds. The LRM Committee monitors the adequacy and effectiveness of implementation of the Program and on a periodic basis assesses each Fund's liquidity risk based on a variety of factors including (1) the Fund's investment strategy, (2) portfolio liquidity and cash flow projections during normal and reasonably foreseeable stressed conditions, (3) shareholder redemptions, (4) borrowings and other funding sources and (5) certain factors specific to ETFs including the effect of the Fund's prices and spreads, market participants, and basket compositions on the overall liquidity of the Fund's portfolio, as applicable.
In accordance with the Program, each of the Fund's portfolio investments is classified into one of four defined liquidity categories based on a determination of a reasonable expectation for how long it would take to convert the investment to cash (or sell or dispose of the investment) without significantly changing its market value.
- Highly liquid investments - cash or convertible to cash within three business days or less
- Moderately liquid investments - convertible to cash in three to seven calendar days
- Less liquid investments - can be sold or disposed of, but not settled, within seven calendar days
- Illiquid investments - cannot be sold or disposed of within seven calendar days
Liquidity classification determinations take into account a variety of factors including various market, trading and investment-specific considerations, as well as market depth, and generally utilize analysis from a third-party liquidity metrics service.
The Liquidity Rule places a 15% limit on a fund's illiquid investments and requires funds that do not primarily hold assets that are highly liquid investments to determine and maintain a minimum percentage of the fund's net assets to be invested in highly liquid investments (highly liquid investment minimum or HLIM). The Program includes provisions reasonably designed to comply with the 15% limit on illiquid investments and for determining, periodically reviewing and complying with the HLIM requirement as applicable.
At a recent meeting of the Fund's Board of Trustees, the LRM Committee provided a written report to the Board pertaining to the operation, adequacy, and effectiveness of the Program for the period December 1, 2021 through November 30, 2022. The report concluded that the Program is operating effectively and is reasonably designed to assess and manage the Fund's liquidity risk.
1.705711.125
CON-SANN-0823
Fidelity® Series Opportunistic Insights Fund
Semi-Annual Report
June 30, 2023
Contents
To view a fund's proxy voting guidelines and proxy voting record for the 12-month period ended June 30, visit http://www.fidelity.com/proxyvotingresults or visit the Securities and Exchange Commission's (SEC) web site at http://www.sec.gov.
You may also call 1-800-544-8544 to request a free copy of the proxy voting guidelines.
Standard & Poor's, S&P and S&P 500 are registered service marks of The McGraw-Hill Companies, Inc. and have been licensed for use by Fidelity Distributors Corporation.
Other third-party marks appearing herein are the property of their respective owners.
All other marks appearing herein are registered or unregistered trademarks or service marks of FMR LLC or an affiliated company. © 2023 FMR LLC. All rights reserved.
This report and the financial statements contained herein are submitted for the general information of the shareholders of the Fund. This report is not authorized for distribution to prospective investors in the Fund unless preceded or accompanied by an effective prospectus.
A fund files its complete schedule of portfolio holdings with the SEC for the first and third quarters of each fiscal year on Form N-PORT. Forms N-PORT are available on the SEC's web site at http://www.sec.gov. A fund's Forms N-PORT may be reviewed and copied at the SEC's Public Reference Room in Washington, DC. Information regarding the operation of the SEC's Public Reference Room may be obtained by calling 1-800-SEC-0330.
For a complete list of a fund's portfolio holdings, view the most recent holdings listing, semiannual report, or annual report on Fidelity's web site at http://www.fidelity.com, http://www.institutional.fidelity.com, or http://www.401k.com, as applicable.
NOT FDIC INSURED •MAY LOSE VALUE •NO BANK GUARANTEE
Neither the Fund nor Fidelity Distributors Corporation is a bank.
This report and the financial statements contained herein are submitted for the general information of the shareholders of the Fund. This report is not authorized for distribution to prospective investors in the Fund unless preceded or accompanied by an effective prospectus.
A fund files its complete schedule of portfolio holdings with the SEC for the first and third quarters of each fiscal year on Form N-PORT. Forms N-PORT are available on the SEC's web site at http://www.sec.gov. A fund's Forms N-PORT may be reviewed and copied at the SEC's Public Reference Room in Washington, DC. Information regarding the operation of the SEC's Public Reference Room may be obtained by calling 1-800-SEC-0330.
For a complete list of a fund's portfolio holdings, view the most recent holdings listing, semiannual report, or annual report on Fidelity's web site at http://www.fidelity.com, http://www.institutional.fidelity.com, or http://www.401k.com, as applicable.
NOT FDIC INSURED •MAY LOSE VALUE •NO BANK GUARANTEE
Neither the Fund nor Fidelity Distributors Corporation is a bank.
Top Holdings (% of Fund's net assets) |
| |
| Meta Platforms, Inc. Class A | 8.4 | |
| Berkshire Hathaway, Inc. Class A | 5.9 | |
| Microsoft Corp. | 5.4 | |
| Apple, Inc. | 4.5 | |
| NVIDIA Corp. | 4.2 | |
| Amazon.com, Inc. | 3.6 | |
| Exxon Mobil Corp. | 2.6 | |
| Vertex Pharmaceuticals, Inc. | 2.5 | |
| Netflix, Inc. | 2.3 | |
| Eli Lilly & Co. | 2.2 | |
| | 41.6 | |
| |
| Market Sectors (% of Fund's net assets) |
| |
| Information Technology | 25.0 | |
| Communication Services | 15.4 | |
| Health Care | 14.5 | |
| Financials | 12.5 | |
| Consumer Discretionary | 8.7 | |
| Industrials | 8.1 | |
| Energy | 7.3 | |
| Materials | 3.4 | |
| Consumer Staples | 2.9 | |
| Utilities | 0.2 | |
| Real Estate | 0.0 | |
| |
Asset Allocation (% of Fund's net assets) |
|
|
Showing Percentage of Net Assets
| Common Stocks - 96.9% |
| | | Shares | Value ($) |
| COMMUNICATION SERVICES - 15.3% | | | |
| Entertainment - 2.9% | | | |
| Activision Blizzard, Inc. | | 117,300 | 9,888,390 |
| Liberty Media Corp. Liberty Formula One Series C (a) | | 221,698 | 16,689,425 |
| Netflix, Inc. (a) | | 479,809 | 211,351,066 |
| The Walt Disney Co. (a) | | 7,700 | 687,456 |
| Universal Music Group NV | | 1,185,508 | 26,325,296 |
| | | | 264,941,633 |
| Interactive Media & Services - 12.3% | | | |
| Alphabet, Inc.: | | | |
| Class A (a) | | 1,389,912 | 166,372,466 |
| Class C (a) | | 1,407,000 | 170,204,790 |
| Bumble, Inc. (a) | | 94,000 | 1,577,320 |
| Epic Games, Inc. (a)(b)(c) | | 7,100 | 4,998,116 |
| Meta Platforms, Inc. Class A (a) | | 2,642,754 | 758,417,547 |
| | | | 1,101,570,239 |
| Media - 0.0% | | | |
| Comcast Corp. Class A | | 22,300 | 926,565 |
| Wireless Telecommunication Services - 0.1% | | | |
| T-Mobile U.S., Inc. (a) | | 68,400 | 9,500,760 |
TOTAL COMMUNICATION SERVICES | | | 1,376,939,197 |
| CONSUMER DISCRETIONARY - 8.7% | | | |
| Automobiles - 0.5% | | | |
| BYD Co. Ltd. (H Shares) | | 113,500 | 3,639,339 |
| Harley-Davidson, Inc. | | 327,900 | 11,545,359 |
| Hyundai Motor Co. Ltd. | | 86,200 | 13,559,595 |
| Rad Power Bikes, Inc. (a)(b)(c) | | 145,919 | 325,399 |
| Rivian Automotive, Inc. (a) | | 11,042 | 183,960 |
| Tesla, Inc. (a) | | 16,700 | 4,371,559 |
| Toyota Motor Corp. | | 846,100 | 13,598,595 |
| | | | 47,223,806 |
| Broadline Retail - 3.8% | | | |
| Amazon.com, Inc. (a) | | 2,524,040 | 329,033,854 |
| Coupang, Inc. Class A (a) | | 377,926 | 6,575,912 |
| Dollarama, Inc. | | 32,400 | 2,194,322 |
| MercadoLibre, Inc. (a) | | 4,900 | 5,804,540 |
| | | | 343,608,628 |
| Hotels, Restaurants & Leisure - 1.8% | | | |
| Airbnb, Inc. Class A (a) | | 422,500 | 54,147,600 |
| Booking Holdings, Inc. (a) | | 2,400 | 6,480,792 |
| Cava Group, Inc. | | 20,000 | 819,000 |
| Chipotle Mexican Grill, Inc. (a) | | 11,254 | 24,072,306 |
| Churchill Downs, Inc. | | 12,278 | 1,708,729 |
| Deliveroo PLC Class A (a)(d) | | 1,530,738 | 2,225,923 |
| Evolution AB (d) | | 9,100 | 1,152,376 |
| Hilton Worldwide Holdings, Inc. | | 147,513 | 21,470,517 |
| Hyatt Hotels Corp. Class A | | 7,708 | 883,183 |
| Las Vegas Sands Corp. (a) | | 29,200 | 1,693,600 |
| Marriott International, Inc. Class A | | 4,800 | 881,712 |
| McDonald's Corp. | | 136,200 | 40,643,442 |
| Restaurant Brands International, Inc. | | 39,500 | 3,062,499 |
| Starbucks Corp. | | 9,000 | 891,540 |
| | | | 160,133,219 |
| Household Durables - 0.4% | | | |
| Blu Investments LLC (a)(b)(c) | | 21,093,998 | 6,539 |
| D.R. Horton, Inc. | | 42,200 | 5,135,318 |
| Lennar Corp. Class A | | 276,054 | 34,592,327 |
| PulteGroup, Inc. | | 1,800 | 139,824 |
| | | | 39,874,008 |
| Leisure Products - 0.0% | | | |
| Bandai Namco Holdings, Inc. | | 16,500 | 382,096 |
| Specialty Retail - 1.9% | | | |
| Academy Sports & Outdoors, Inc. | | 218,568 | 11,813,600 |
| Dick's Sporting Goods, Inc. | | 218,804 | 28,923,701 |
| Fanatics, Inc. Class A (a)(b)(c) | | 139,938 | 10,747,238 |
| Fast Retailing Co. Ltd. | | 11,500 | 2,949,460 |
| O'Reilly Automotive, Inc. (a) | | 40,846 | 39,020,184 |
| The Home Depot, Inc. | | 366 | 113,694 |
| TJX Companies, Inc. | | 226,900 | 19,238,851 |
| Ulta Beauty, Inc. (a) | | 77,603 | 36,519,584 |
| Wayfair LLC Class A (a) | | 6,160 | 400,462 |
| Williams-Sonoma, Inc. | | 142,114 | 17,784,146 |
| | | | 167,510,920 |
| Textiles, Apparel & Luxury Goods - 0.3% | | | |
| China Hongxing Sports Ltd. (a)(c) | | 22,200 | 0 |
| Deckers Outdoor Corp. (a) | | 13,084 | 6,903,903 |
| Dr. Martens Ltd. | | 24,809 | 38,534 |
| lululemon athletica, Inc. (a) | | 10,834 | 4,100,669 |
| NIKE, Inc. Class B | | 3,900 | 430,443 |
| On Holding AG (a) | | 302,700 | 9,989,100 |
| Ralph Lauren Corp. (e) | | 7,600 | 937,080 |
| Tapestry, Inc. | | 61,000 | 2,610,800 |
| | | | 25,010,529 |
TOTAL CONSUMER DISCRETIONARY | | | 783,743,206 |
| CONSUMER STAPLES - 2.9% | | | |
| Beverages - 1.5% | | | |
| Anheuser-Busch InBev SA NV | | 181,200 | 10,269,953 |
| Constellation Brands, Inc. Class A (sub. vtg.) | | 52,200 | 12,847,986 |
| Diageo PLC | | 1,061 | 45,613 |
| PepsiCo, Inc. | | 389,900 | 72,217,278 |
| The Coca-Cola Co. | | 614,950 | 37,032,289 |
| | | | 132,413,119 |
| Consumer Staples Distribution & Retail - 0.9% | | | |
| Alimentation Couche-Tard, Inc. Class A (multi-vtg.) | | 109,800 | 5,630,280 |
| Casey's General Stores, Inc. | | 20,700 | 5,048,316 |
| Costco Wholesale Corp. | | 128,937 | 69,417,102 |
| | | | 80,095,698 |
| Food Products - 0.4% | | | |
| Lamb Weston Holdings, Inc. | | 194,600 | 22,369,270 |
| Mondelez International, Inc. | | 178,600 | 13,027,084 |
| | | | 35,396,354 |
| Personal Care Products - 0.1% | | | |
| L'Oreal SA (a) | | 25,928 | 12,094,792 |
| L'Oreal SA | | 621 | 289,682 |
| Olaplex Holdings, Inc. (a) | | 228,724 | 850,853 |
| | | | 13,235,327 |
TOTAL CONSUMER STAPLES | | | 261,140,498 |
| ENERGY - 7.2% | | | |
| Oil, Gas & Consumable Fuels - 7.2% | | | |
| Antero Resources Corp. (a) | | 16,900 | 389,207 |
| Birchcliff Energy Ltd. (e) | | 75,900 | 449,184 |
| Canadian Natural Resources Ltd. | | 359,600 | 20,217,406 |
| Cheniere Energy, Inc. | | 96,936 | 14,769,169 |
| Chevron Corp. | | 294,700 | 46,371,045 |
| ConocoPhillips Co. | | 1,069,177 | 110,777,429 |
| Diamondback Energy, Inc. | | 93,246 | 12,248,795 |
| EOG Resources, Inc. | | 275,900 | 31,573,996 |
| Exxon Mobil Corp. | | 2,174,800 | 233,247,300 |
| Hess Corp. | | 466,122 | 63,369,286 |
| Marathon Petroleum Corp. | | 80,400 | 9,374,640 |
| Occidental Petroleum Corp. | | 760,900 | 44,740,920 |
| Pioneer Natural Resources Co. | | 56,700 | 11,747,106 |
| PrairieSky Royalty Ltd. | | 49,600 | 867,134 |
| Suncor Energy, Inc. | | 61,300 | 1,798,164 |
| Tourmaline Oil Corp. (e) | | 32,700 | 1,540,769 |
| Valero Energy Corp. | | 317,900 | 37,289,670 |
| | | | 640,771,220 |
| FINANCIALS - 12.5% | | | |
| Banks - 2.2% | | | |
| AIB Group PLC | | 263,600 | 1,107,415 |
| Banco Santander SA (Spain) | | 1,006,700 | 3,726,942 |
| Bank of America Corp. | | 2,252,362 | 64,620,266 |
| Bank of Ireland Group PLC | | 343,600 | 3,276,194 |
| East West Bancorp, Inc. | | 68,200 | 3,600,278 |
| First Citizens Bancshares, Inc. | | 2,100 | 2,695,245 |
| HDFC Bank Ltd. sponsored ADR | | 64,600 | 4,502,620 |
| JPMorgan Chase & Co. | | 511,424 | 74,381,507 |
| Nu Holdings Ltd. (a) | | 645,700 | 5,094,573 |
| Royal Bank of Canada | | 266,300 | 25,432,932 |
| Starling Bank Ltd. Series D (a)(b)(c) | | 1,611,012 | 5,974,277 |
| Wells Fargo & Co. | | 182,600 | 7,793,368 |
| | | | 202,205,617 |
| Capital Markets - 0.6% | | | |
| BlackRock, Inc. Class A | | 600 | 414,684 |
| Brookfield Asset Management Ltd. Class A | | 4,520 | 147,533 |
| Brookfield Corp. (Canada) Class A | | 34,000 | 1,144,669 |
| Goldman Sachs Group, Inc. | | 2,873 | 926,657 |
| Morgan Stanley | | 505,200 | 43,144,080 |
| MSCI, Inc. | | 1,511 | 709,097 |
| TulCo LLC (a)(b)(c)(f) | | 7,549 | 6,569,895 |
| | | | 53,056,615 |
| Consumer Finance - 0.1% | | | |
| American Express Co. | | 75,100 | 13,082,420 |
| Financial Services - 6.8% | | | |
| Adyen BV (a)(d) | | 1,095 | 1,896,176 |
| Berkshire Hathaway, Inc. Class A (a) | | 1,022 | 529,201,820 |
| MasterCard, Inc. Class A | | 34,000 | 13,372,200 |
| Visa, Inc. Class A | | 267,300 | 63,478,404 |
| | | | 607,948,600 |
| Insurance - 2.8% | | | |
| American International Group, Inc. | | 250,600 | 14,419,524 |
| Aon PLC | | 4,400 | 1,518,880 |
| Arthur J. Gallagher & Co. | | 43,411 | 9,531,753 |
| Brookfield Asset Management Reinsurance Partners Ltd. | | 480 | 16,240 |
| Chubb Ltd. | | 155,768 | 29,994,686 |
| Fairfax Financial Holdings Ltd. (sub. vtg.) | | 29,600 | 22,171,567 |
| Hartford Financial Services Group, Inc. | | 2,700 | 194,454 |
| Intact Financial Corp. | | 104,185 | 16,086,054 |
| Marsh & McLennan Companies, Inc. | | 50,800 | 9,554,464 |
| Progressive Corp. | | 625,800 | 82,837,146 |
| The Travelers Companies, Inc. | | 356,508 | 61,911,179 |
| | | | 248,235,947 |
TOTAL FINANCIALS | | | 1,124,529,199 |
| HEALTH CARE - 14.5% | | | |
| Biotechnology - 5.6% | | | |
| Alnylam Pharmaceuticals, Inc. (a) | | 102,400 | 19,449,856 |
| Argenx SE ADR (a) | | 22,327 | 8,701,502 |
| Arrowhead Pharmaceuticals, Inc. (a) | | 25,600 | 912,896 |
| Biogen, Inc. (a) | | 2,700 | 769,095 |
| Biohaven Ltd. | | 1,466 | 35,067 |
| Exact Sciences Corp. (a) | | 21,800 | 2,047,020 |
| Galapagos NV sponsored ADR (a) | | 82,379 | 3,349,530 |
| Gilead Sciences, Inc. | | 106,500 | 8,207,955 |
| Krystal Biotech, Inc. (a) | | 4,700 | 551,780 |
| Legend Biotech Corp. ADR (a) | | 88,443 | 6,105,220 |
| Moderna, Inc. (a) | | 3,500 | 425,250 |
| Moonlake Immunotherapeutics (a) | | 35,000 | 1,785,000 |
| Nuvalent, Inc. Class A (a) | | 21,700 | 915,089 |
| Regeneron Pharmaceuticals, Inc. (a) | | 277,261 | 199,223,119 |
| Roivant Sciences Ltd. (a) | | 151,200 | 1,524,096 |
| Sarepta Therapeutics, Inc. (a) | | 8,800 | 1,007,776 |
| Seagen, Inc. (a) | | 4,700 | 904,562 |
| United Therapeutics Corp. (a) | | 83,974 | 18,537,261 |
| Vertex Pharmaceuticals, Inc. (a) | | 636,300 | 223,920,333 |
| Zai Lab Ltd. (a) | | 222,960 | 613,446 |
| | | | 498,985,853 |
| Health Care Equipment & Supplies - 1.0% | | | |
| Align Technology, Inc. (a) | | 2,600 | 919,464 |
| Boston Scientific Corp. (a) | | 210,000 | 11,358,900 |
| DexCom, Inc. (a) | | 20,500 | 2,634,455 |
| Edwards Lifesciences Corp. (a) | | 7,347 | 693,043 |
| GE Healthcare Holding LLC | | 17,679 | 1,436,242 |
| Inspire Medical Systems, Inc. (a) | | 3,300 | 1,071,312 |
| Intuitive Surgical, Inc. (a) | | 176,350 | 60,301,119 |
| Lantheus Holdings, Inc. (a) | | 10,100 | 847,592 |
| Penumbra, Inc. (a) | | 2,900 | 997,774 |
| Shockwave Medical, Inc. (a) | | 6,900 | 1,969,329 |
| Straumann Holding AG | | 13,083 | 2,121,666 |
| Stryker Corp. | | 15,500 | 4,728,895 |
| Surgical Science Sweden AB (a) | | 32,800 | 733,528 |
| | | | 89,813,319 |
| Health Care Providers & Services - 2.6% | | | |
| 23andMe Holding Co. Class A (a)(e) | | 144,779 | 253,363 |
| agilon health, Inc. (a) | | 78,241 | 1,356,699 |
| AmerisourceBergen Corp. | | 2,800 | 538,804 |
| Cardinal Health, Inc. | | 92,500 | 8,747,725 |
| Elevance Health, Inc. | | 28,000 | 12,440,120 |
| HCA Holdings, Inc. | | 52,200 | 15,841,656 |
| Henry Schein, Inc. (a) | | 10,400 | 843,440 |
| P3 Health Partners, Inc. Class A (a) | | 57,586 | 172,182 |
| UnitedHealth Group, Inc. | | 392,778 | 188,784,818 |
| | | | 228,978,807 |
| Health Care Technology - 0.0% | | | |
| Doximity, Inc. (a)(e) | | 49,200 | 1,673,784 |
| Schrodinger, Inc. (a)(e) | | 29,595 | 1,477,382 |
| | | | 3,151,166 |
| Life Sciences Tools & Services - 0.6% | | | |
| Danaher Corp. | | 80,435 | 19,304,400 |
| Mettler-Toledo International, Inc. (a) | | 13,756 | 18,042,920 |
| Thermo Fisher Scientific, Inc. | | 24,860 | 12,970,705 |
| Veterinary Emergency Group LLC Class A (a)(b)(c)(f) | | 59,096 | 3,187,047 |
| | | | 53,505,072 |
| Pharmaceuticals - 4.7% | | | |
| AstraZeneca PLC sponsored ADR | | 414,600 | 29,672,922 |
| Bristol-Myers Squibb Co. | | 333,000 | 21,295,350 |
| DICE Therapeutics, Inc. (a) | | 61,197 | 2,843,213 |
| Eli Lilly & Co. | | 427,852 | 200,654,031 |
| Intra-Cellular Therapies, Inc. (a) | | 31,880 | 2,018,642 |
| Johnson & Johnson | | 164,100 | 27,161,832 |
| Merck & Co., Inc. | | 969,000 | 111,812,910 |
| Novo Nordisk A/S Series B | | 17,900 | 2,891,563 |
| Nuvation Bio, Inc. (a) | | 82,324 | 148,183 |
| Royalty Pharma PLC | | 554,200 | 17,036,108 |
| Structure Therapeutics, Inc. ADR | | 34,200 | 1,421,694 |
| Ventyx Biosciences, Inc. (a) | | 14,200 | 465,760 |
| Verona Pharma PLC ADR (a) | | 32,200 | 680,708 |
| Zoetis, Inc. Class A | | 40,500 | 6,974,505 |
| | | | 425,077,421 |
TOTAL HEALTH CARE | | | 1,299,511,638 |
| INDUSTRIALS - 7.3% | | | |
| Aerospace & Defense - 1.7% | | | |
| Lockheed Martin Corp. | | 185,000 | 85,170,300 |
| Northrop Grumman Corp. | | 90,900 | 41,432,220 |
| Space Exploration Technologies Corp.: | | | |
| Class A (a)(b)(c) | | 212,910 | 17,245,710 |
| Class C (a)(b)(c) | | 7,830 | 634,230 |
| TransDigm Group, Inc. | | 10,800 | 9,657,036 |
| | | | 154,139,496 |
| Air Freight & Logistics - 0.5% | | | |
| United Parcel Service, Inc. Class B | | 270,915 | 48,561,514 |
| Zipline International, Inc. (a)(b)(c) | | 28,830 | 1,158,966 |
| | | | 49,720,480 |
| Building Products - 0.3% | | | |
| Carrier Global Corp. | | 57,700 | 2,868,267 |
| Toto Ltd. | | 65,320 | 1,975,042 |
| Trane Technologies PLC | | 103,800 | 19,852,788 |
| | | | 24,696,097 |
| Commercial Services & Supplies - 0.3% | | | |
| Cintas Corp. | | 16,631 | 8,266,937 |
| Clean Harbors, Inc. (a) | | 96,075 | 15,797,612 |
| Clean TeQ Water Pty Ltd. (a) | | 2,653 | 424 |
| GFL Environmental, Inc. | | 27,800 | 1,079,473 |
| Republic Services, Inc. | | 18,300 | 2,803,011 |
| Waste Connections, Inc. (United States) | | 6,239 | 891,740 |
| | | | 28,839,197 |
| Construction & Engineering - 0.0% | | | |
| Larsen & Toubro Ltd. | | 33,200 | 1,003,656 |
| Electrical Equipment - 1.3% | | | |
| AMETEK, Inc. | | 6,000 | 971,280 |
| Eaton Corp. PLC | | 334,100 | 67,187,510 |
| Hubbell, Inc. Class B | | 129,956 | 43,088,211 |
| nVent Electric PLC | | 63,700 | 3,291,379 |
| Prysmian SpA | | 22,400 | 935,673 |
| | | | 115,474,053 |
| Ground Transportation - 0.5% | | | |
| Canadian Pacific Kansas City Ltd. | | 302,600 | 24,440,989 |
| J.B. Hunt Transport Services, Inc. | | 11,678 | 2,114,068 |
| Old Dominion Freight Lines, Inc. | | 24,400 | 9,021,900 |
| Uber Technologies, Inc. (a) | | 146,800 | 6,337,356 |
| Vamos Locacao de Caminhoes Maquinas e Equipamentos SA | | 10,600 | 26,809 |
| | | | 41,941,122 |
| Industrial Conglomerates - 0.9% | | | |
| General Electric Co. | | 705,237 | 77,470,284 |
| Machinery - 0.8% | | | |
| Caterpillar, Inc. | | 42,900 | 10,555,545 |
| Crane Nxt Co. | | 6,100 | 344,284 |
| Deere & Co. | | 58,000 | 23,501,020 |
| Fortive Corp. | | 120,925 | 9,041,562 |
| Indutrade AB | | 34,800 | 783,741 |
| PACCAR, Inc. | | 289,790 | 24,240,934 |
| Parker Hannifin Corp. | | 12,400 | 4,836,496 |
| | | | 73,303,582 |
| Passenger Airlines - 0.3% | | | |
| Copa Holdings SA Class A | | 16,300 | 1,802,454 |
| Ryanair Holdings PLC sponsored ADR (a) | | 233,600 | 25,836,160 |
| | | | 27,638,614 |
| Professional Services - 0.1% | | | |
| Thomson Reuters Corp. | | 9,591 | 1,294,921 |
| Verisk Analytics, Inc. | | 29,300 | 6,622,679 |
| | | | 7,917,600 |
| Trading Companies & Distributors - 0.6% | | | |
| United Rentals, Inc. | | 58,800 | 26,187,756 |
| W.W. Grainger, Inc. | | 35,419 | 27,931,069 |
| | | | 54,118,825 |
TOTAL INDUSTRIALS | | | 656,263,006 |
| INFORMATION TECHNOLOGY - 24.9% | | | |
| Communications Equipment - 0.5% | | | |
| Arista Networks, Inc. (a) | | 257,295 | 41,697,228 |
| Motorola Solutions, Inc. | | 9,500 | 2,786,160 |
| | | | 44,483,388 |
| Electronic Equipment, Instruments & Components - 1.9% | | | |
| Amphenol Corp. Class A | | 1,876,087 | 159,373,591 |
| CDW Corp. | | 61,436 | 11,273,506 |
| Jabil, Inc. | | 44,600 | 4,813,678 |
| | | | 175,460,775 |
| IT Services - 1.1% | | | |
| Accenture PLC Class A | | 266,329 | 82,183,803 |
| ASAC II LP (a)(b)(c) | | 2,013,117 | 338,204 |
| Cloudflare, Inc. (a) | | 508 | 33,208 |
| Gartner, Inc. (a) | | 10,813 | 3,787,902 |
| MongoDB, Inc. Class A (a) | | 11,900 | 4,890,781 |
| Okta, Inc. (a) | | 39,900 | 2,767,065 |
| Shopify, Inc. Class A (a) | | 69,168 | 4,470,401 |
| X Holdings Corp. Class A (c) | | 32,510 | 1,258,787 |
| | | | 99,730,151 |
| Semiconductors & Semiconductor Equipment - 8.0% | | | |
| Advanced Micro Devices, Inc. (a) | | 832,153 | 94,790,548 |
| Advantest Corp. | | 19,500 | 2,626,338 |
| Allegro MicroSystems LLC (a) | | 38,400 | 1,733,376 |
| Analog Devices, Inc. | | 352,200 | 68,612,082 |
| Applied Materials, Inc. | | 25,900 | 3,743,586 |
| ASML Holding NV (depository receipt) | | 4,900 | 3,551,275 |
| Broadcom, Inc. | | 21,400 | 18,563,002 |
| First Solar, Inc. (a) | | 60,600 | 11,519,454 |
| Lattice Semiconductor Corp. (a) | | 281,291 | 27,023,626 |
| Microchip Technology, Inc. | | 11,300 | 1,012,367 |
| Monolithic Power Systems, Inc. | | 33,232 | 17,952,923 |
| NVIDIA Corp. | | 895,260 | 378,712,885 |
| ON Semiconductor Corp. (a) | | 482,200 | 45,606,476 |
| Qualcomm, Inc. | | 144,437 | 17,193,780 |
| Synaptics, Inc. (a) | | 1,931 | 164,869 |
| Taiwan Semiconductor Manufacturing Co. Ltd. sponsored ADR | | 249,200 | 25,149,264 |
| | | | 717,955,851 |
| Software - 8.9% | | | |
| Adobe, Inc. (a) | | 79,266 | 38,760,281 |
| ANSYS, Inc. (a) | | 1,600 | 528,432 |
| Cadence Design Systems, Inc. (a) | | 487,262 | 114,272,684 |
| Check Point Software Technologies Ltd. (a) | | 25,700 | 3,228,434 |
| Clear Secure, Inc. (e) | | 92,332 | 2,139,332 |
| Dynatrace, Inc. (a) | | 234,800 | 12,085,156 |
| Fortinet, Inc. (a) | | 396,327 | 29,958,358 |
| HubSpot, Inc. (a) | | 6,100 | 3,245,749 |
| Intuit, Inc. | | 6,083 | 2,787,170 |
| Magic Leap, Inc.: | | | |
| Class A (a)(c) | | 72,297 | 447,518 |
| warrants (a)(c) | | 39,573 | 244,957 |
| Microsoft Corp. | | 1,419,149 | 483,277,000 |
| Palo Alto Networks, Inc. (a) | | 38,400 | 9,811,584 |
| Roper Technologies, Inc. | | 1,900 | 913,520 |
| Salesforce, Inc. (a) | | 343,894 | 72,651,046 |
| Samsara, Inc. (a) | | 6,900 | 191,199 |
| ServiceNow, Inc. (a) | | 8,700 | 4,889,139 |
| Stripe, Inc. Class B (a)(b)(c) | | 26,700 | 537,471 |
| Synopsys, Inc. (a) | | 31,000 | 13,497,710 |
| Tanium, Inc. Class B (a)(b)(c) | | 408,212 | 3,224,875 |
| | | | 796,691,615 |
| Technology Hardware, Storage & Peripherals - 4.5% | | | |
| Apple, Inc. | | 2,077,600 | 402,992,072 |
| Dell Technologies, Inc. | | 19,519 | 1,056,173 |
| Samsung Electronics Co. Ltd. | | 17,090 | 941,089 |
| | | | 404,989,334 |
TOTAL INFORMATION TECHNOLOGY | | | 2,239,311,114 |
| MATERIALS - 3.4% | | | |
| Chemicals - 0.4% | | | |
| Air Products & Chemicals, Inc. | | 29,500 | 8,836,135 |
| Corteva, Inc. | | 121,100 | 6,939,030 |
| Linde PLC | | 7,000 | 2,667,560 |
| Sherwin-Williams Co. | | 9,634 | 2,558,020 |
| Westlake Corp. | | 88,852 | 10,615,148 |
| | | | 31,615,893 |
| Construction Materials - 0.0% | | | |
| Vulcan Materials Co. | | 12,700 | 2,863,088 |
| Metals & Mining - 3.0% | | | |
| Agnico Eagle Mines Ltd. (Canada) | | 15,400 | 768,983 |
| B2Gold Corp. | | 1,897,333 | 6,760,077 |
| Cleveland-Cliffs, Inc. (a) | | 148,053 | 2,481,368 |
| Franco-Nevada Corp. | | 316,617 | 45,125,839 |
| Freeport-McMoRan, Inc. | | 813,500 | 32,540,000 |
| Glencore PLC | | 452,400 | 2,565,056 |
| Ivanhoe Electric, Inc. | | 46,500 | 606,360 |
| Ivanhoe Mines Ltd. (a) | | 3,410,287 | 31,148,875 |
| Lundin Gold, Inc. | | 2,400 | 28,715 |
| Newcrest Mining Ltd. | | 51,639 | 921,158 |
| Novagold Resources, Inc. (a) | | 493,634 | 1,956,277 |
| Nucor Corp. | | 514,773 | 84,412,477 |
| Orla Mining Ltd. (a) | | 997,300 | 4,185,686 |
| POSCO sponsored ADR (e) | | 2,050 | 151,598 |
| Steel Dynamics, Inc. | | 398,940 | 43,456,534 |
| Wheaton Precious Metals Corp. | | 332,000 | 14,357,637 |
| | | | 271,466,640 |
TOTAL MATERIALS | | | 305,945,621 |
| REAL ESTATE - 0.0% | | | |
| Equity Real Estate Investment Trusts (REITs) - 0.0% | | | |
| Equity Commonwealth | | 67,691 | 1,371,420 |
| UTILITIES - 0.2% | | | |
| Electric Utilities - 0.2% | | | |
| Constellation Energy Corp. | | 131,348 | 12,024,909 |
| PG&E Corp. (a) | | 396,600 | 6,853,248 |
| | | | 18,878,157 |
| TOTAL COMMON STOCKS (Cost $5,032,800,377) | | | 8,708,404,276 |
| | | | |
| Preferred Stocks - 1.1% |
| | | Shares | Value ($) |
| Convertible Preferred Stocks - 1.0% | | | |
| COMMUNICATION SERVICES - 0.1% | | | |
| Interactive Media & Services - 0.1% | | | |
| ByteDance Ltd. Series E1 (a)(b)(c) | | 37,932 | 8,566,563 |
| Reddit, Inc.: | | | |
| Series E(a)(b)(c) | | 9,600 | 332,064 |
| Series F(a)(b)(c) | | 49,896 | 1,725,903 |
| | | | 10,624,530 |
| CONSUMER DISCRETIONARY - 0.0% | | | |
| Automobiles - 0.0% | | | |
| Rad Power Bikes, Inc.: | | | |
| Series A(a)(b)(c) | | 19,024 | 42,424 |
| Series C(a)(b)(c) | | 74,857 | 166,931 |
| Series D(a)(b)(c) | | 127,700 | 284,771 |
| | | | 494,126 |
| Hotels, Restaurants & Leisure - 0.0% | | | |
| Discord, Inc. Series I (a)(b)(c) | | 800 | 245,944 |
| | | | |
TOTAL CONSUMER DISCRETIONARY | | | 740,070 |
| | | | |
| CONSUMER STAPLES - 0.0% | | | |
| Consumer Staples Distribution & Retail - 0.0% | | | |
| GoBrands, Inc.: | | | |
| Series G(a)(b)(c) | | 3,340 | 302,637 |
| Series H(a)(b)(c) | | 3,970 | 359,722 |
| | | | 662,359 |
| Food Products - 0.0% | | | |
| Bowery Farming, Inc. Series C1 (a)(b)(c) | | 13,266 | 114,088 |
| | | | |
TOTAL CONSUMER STAPLES | | | 776,447 |
| | | | |
| FINANCIALS - 0.0% | | | |
| Financial Services - 0.0% | | | |
| Circle Internet Financial Ltd. Series F (a)(b)(c) | | 38,025 | 914,501 |
| | | | |
| HEALTH CARE - 0.0% | | | |
| Biotechnology - 0.0% | | | |
| ElevateBio LLC Series C (a)(b)(c) | | 194,500 | 824,680 |
| | | | |
| Health Care Providers & Services - 0.0% | | | |
| Lyra Health, Inc.: | | | |
| Series E(a)(b)(c) | | 79,800 | 1,334,256 |
| Series F(a)(b)(c) | | 4,099 | 68,535 |
| Somatus, Inc. Series E (a)(b)(c) | | 842 | 853,165 |
| | | | 2,255,956 |
TOTAL HEALTH CARE | | | 3,080,636 |
| | | | |
| INDUSTRIALS - 0.8% | | | |
| Aerospace & Defense - 0.7% | | | |
| Relativity Space, Inc. Series E (a)(b)(c) | | 125,290 | 2,203,851 |
| Space Exploration Technologies Corp.: | | | |
| Series G(a)(b)(c) | | 36,460 | 29,532,600 |
| Series H(a)(b)(c) | | 7,256 | 5,877,360 |
| Series N(a)(b)(c) | | 24,552 | 19,887,120 |
| | | | 57,500,931 |
| Air Freight & Logistics - 0.1% | | | |
| Zipline International, Inc.: | | | |
| Series E(a)(b)(c) | | 66,084 | 2,656,577 |
| Series F(c) | | 129,467 | 5,204,573 |
| | | | 7,861,150 |
| Construction & Engineering - 0.0% | | | |
| Beta Technologies, Inc. Series B, 6.00% (a)(b)(c) | | 15,787 | 1,711,469 |
| | | | |
TOTAL INDUSTRIALS | | | 67,073,550 |
| | | | |
| INFORMATION TECHNOLOGY - 0.1% | | | |
| Software - 0.1% | | | |
| Delphix Corp. Series D (a)(b)(c) | | 232,855 | 968,677 |
| Moloco, Inc. Series A (b)(c) | | 35,442 | 2,126,520 |
| Nuro, Inc.: | | | |
| Series C(a)(b)(c) | | 190,290 | 1,208,342 |
| Series D(a)(b)(c) | | 36,736 | 233,274 |
| Stripe, Inc.: | | | |
| Series H(a)(b)(c) | | 11,500 | 231,495 |
| Series I(b)(c) | | 128,075 | 2,578,150 |
| Tenstorrent, Inc. Series C1 (a)(b)(c) | | 12,300 | 725,454 |
| | | | 8,071,912 |
| TOTAL CONVERTIBLE PREFERRED STOCKS | | | 91,281,646 |
| Nonconvertible Preferred Stocks - 0.1% | | | |
| ENERGY - 0.1% | | | |
| Oil, Gas & Consumable Fuels - 0.1% | | | |
| Petroleo Brasileiro SA - Petrobras sponsored ADR | | 463,600 | 6,411,588 |
| | | | |
| FINANCIALS - 0.0% | | | |
| Financial Services - 0.0% | | | |
| Circle Internet Financial Ltd. Series E (a)(b)(c) | | 61,811 | 1,486,555 |
| | | | |
| INFORMATION TECHNOLOGY - 0.0% | | | |
| Software - 0.0% | | | |
| Magic Leap, Inc. Series AA (a)(c) | | 275,569 | 3,163,532 |
| | | | |
| TOTAL NONCONVERTIBLE PREFERRED STOCKS | | | 11,061,675 |
| TOTAL PREFERRED STOCKS (Cost $62,300,047) | | | 102,343,321 |
| | | | |
| Preferred Securities - 0.0% |
| | | Principal Amount (g) | Value ($) |
| INFORMATION TECHNOLOGY - 0.0% | | | |
| Software - 0.0% | | | |
Tenstorrent, Inc. 0% (b)(c)(h) (Cost $680,000) | | 680,000 | 674,560 |
| | | | |
| Money Market Funds - 3.9% |
| | | Shares | Value ($) |
| Fidelity Cash Central Fund 5.14% (i) | | 340,781,431 | 340,849,587 |
| Fidelity Securities Lending Cash Central Fund 5.14% (i)(j) | | 7,943,009 | 7,943,803 |
| TOTAL MONEY MARKET FUNDS (Cost $348,793,390) | | | 348,793,390 |
| | | | |
| TOTAL INVESTMENT IN SECURITIES - 101.9% (Cost $5,444,573,814) | 9,160,215,547 |
NET OTHER ASSETS (LIABILITIES) - (1.9)% | (170,800,272) |
| NET ASSETS - 100.0% | 8,989,415,275 |
| | |
Legend
| (b) | Restricted securities (including private placements) - Investment in securities not registered under the Securities Act of 1933 (excluding 144A issues). At the end of the period, the value of restricted securities (excluding 144A issues) amounted to $143,186,155 or 1.6% of net assets. |
| (d) | Security exempt from registration under Rule 144A of the Securities Act of 1933. These securities may be resold in transactions exempt from registration, normally to qualified institutional buyers. At the end of the period, the value of these securities amounted to $5,274,475 or 0.1% of net assets. |
| (e) | Security or a portion of the security is on loan at period end. |
| (f) | Investment is owned by a wholly-owned subsidiary (Subsidiary) that is treated as a corporation for U.S. tax purposes. |
| (g) | Amount is stated in United States dollars unless otherwise noted. |
| (h) | Security is perpetual in nature with no stated maturity date. |
| (i) | Affiliated fund that is generally available only to investment companies and other accounts managed by Fidelity Investments. The rate quoted is the annualized seven-day yield of the fund at period end. A complete unaudited listing of the fund's holdings as of its most recent quarter end is available upon request. In addition, each Fidelity Central Fund's financial statements are available on the SEC's website or upon request. |
| (j) | Investment made with cash collateral received from securities on loan. |
| Additional information on each restricted holding is as follows: |
| Security | Acquisition Date | Acquisition Cost ($) |
| ASAC II LP | 10/10/13 | 155,030 |
| | | |
| Beta Technologies, Inc. Series B, 6.00% | 4/04/22 | 1,628,745 |
| | | |
| Blu Investments LLC | 5/21/20 | 36,484 |
| | | |
| Bowery Farming, Inc. Series C1 | 5/18/21 | 799,267 |
| | | |
| ByteDance Ltd. Series E1 | 11/18/20 | 4,156,368 |
| | | |
| Circle Internet Financial Ltd. Series E | 5/11/21 | 1,003,200 |
| | | |
| Circle Internet Financial Ltd. Series F | 5/09/22 | 1,602,374 |
| | | |
| Delphix Corp. Series D | 7/10/15 | 2,095,695 |
| | | |
| Discord, Inc. Series I | 9/15/21 | 440,500 |
| | | |
| ElevateBio LLC Series C | 3/09/21 | 815,928 |
| | | |
| Epic Games, Inc. | 7/13/20 - 7/30/20 | 4,082,500 |
| | | |
| Fanatics, Inc. Class A | 8/13/20 - 12/15/21 | 4,645,244 |
| | | |
| GoBrands, Inc. Series G | 3/02/21 | 834,056 |
| | | |
| GoBrands, Inc. Series H | 7/22/21 | 1,542,308 |
| | | |
| Lyra Health, Inc. Series E | 1/14/21 | 730,697 |
| | | |
| Lyra Health, Inc. Series F | 6/04/21 | 64,372 |
| | | |
| Moloco, Inc. Series A | 6/26/23 | 2,126,520 |
| | | |
| Nuro, Inc. Series C | 10/30/20 | 2,484,160 |
| | | |
| Nuro, Inc. Series D | 10/29/21 | 765,788 |
| | | |
| Rad Power Bikes, Inc. | 1/21/21 | 703,890 |
| | | |
| Rad Power Bikes, Inc. Series A | 1/21/21 | 91,769 |
| | | |
| Rad Power Bikes, Inc. Series C | 1/21/21 | 361,098 |
| | | |
| Rad Power Bikes, Inc. Series D | 9/17/21 | 1,223,851 |
| | | |
| Reddit, Inc. Series E | 5/18/21 | 407,752 |
| | | |
| Reddit, Inc. Series F | 8/11/21 | 3,083,293 |
| | | |
| Relativity Space, Inc. Series E | 5/27/21 | 2,861,010 |
| | | |
| Somatus, Inc. Series E | 1/31/22 | 734,759 |
| | | |
| Space Exploration Technologies Corp. Class A | 10/16/15 - 2/16/21 | 3,185,238 |
| | | |
| Space Exploration Technologies Corp. Class C | 9/11/17 | 105,705 |
| | | |
| Space Exploration Technologies Corp. Series G | 1/20/15 | 2,824,191 |
| | | |
| Space Exploration Technologies Corp. Series H | 8/04/17 | 979,560 |
| | | |
| Space Exploration Technologies Corp. Series N | 8/04/20 | 6,629,040 |
| | | |
| Starling Bank Ltd. Series D | 6/18/21 - 4/05/22 | 3,151,959 |
| | | |
| Stripe, Inc. Class B | 5/18/21 | 1,071,428 |
| | | |
| Stripe, Inc. Series H | 3/15/21 | 461,438 |
| | | |
| Stripe, Inc. Series I | 3/20/23 - 5/12/23 | 2,578,680 |
| | | |
| Tanium, Inc. Class B | 4/21/17 - 9/18/20 | 3,439,433 |
| | | |
| Tenstorrent, Inc. Series C1 | 4/23/21 | 731,288 |
| | | |
| Tenstorrent, Inc. 0% | 4/23/21 | 680,000 |
| | | |
| TulCo LLC | 8/24/17 - 12/14/17 | 2,643,700 |
| | | |
| Veterinary Emergency Group LLC Class A | 9/16/21 - 12/16/22 | 2,307,320 |
| | | |
| Zipline International, Inc. | 10/12/21 | 1,037,880 |
| | | |
| Zipline International, Inc. Series E | 12/21/20 | 2,156,281 |
| | | |
Affiliated Central Funds
Fiscal year to date information regarding the Fund's investments in Fidelity Central Funds, including the ownership percentage, is presented below.
| Affiliate | Value, beginning of period ($) | Purchases ($) | Sales Proceeds ($) | Dividend Income ($) | Realized Gain (loss) ($) | Change in Unrealized appreciation (depreciation) ($) | Value, end of period ($) | % ownership, end of period |
| Fidelity Cash Central Fund 5.14% | 440,690,320 | 1,332,094,349 | 1,431,935,082 | 7,977,501 | - | - | 340,849,587 | 0.9% |
| Fidelity Securities Lending Cash Central Fund 5.14% | 6,128,103 | 149,324,507 | 147,508,807 | 14,223 | - | - | 7,943,803 | 0.0% |
| Total | 446,818,423 | 1,481,418,856 | 1,579,443,889 | 7,991,724 | - | - | 348,793,390 | |
| | | | | | | | | |
Amounts in the dividend income column in the above table include any capital gain distributions from underlying funds, which are presented in the corresponding line item in the Statement of Operations, if applicable.
Amounts in the dividend income column for Fidelity Securities Lending Cash Central Fund represents the income earned on investing cash collateral, less rebates paid to borrowers and any lending agent fees associated with the loan, plus any premium payments received for lending certain types of securities.
Amounts included in the purchases and sales proceeds columns may include in-kind transactions, if applicable.
Investment Valuation
The following is a summary of the inputs used, as of June 30, 2023, involving the Fund's assets and liabilities carried at fair value. The inputs or methodology used for valuing securities may not be an indication of the risk associated with investing in those securities. For more information on valuation inputs, and their aggregation into the levels used below, please refer to the Investment Valuation section in the accompanying Notes to Financial Statements.
| Valuation Inputs at Reporting Date: |
| Description | Total ($) | Level 1 ($) | Level 2 ($) | Level 3 ($) |
Investments in Securities: | | | | |
|
| Equities: | | | | |
Communication Services | 1,387,563,727 | 1,371,941,081 | - | 15,622,646 |
Consumer Discretionary | 784,483,276 | 738,534,945 | 34,129,085 | 11,819,246 |
Consumer Staples | 261,916,945 | 238,440,458 | 22,700,040 | 776,447 |
Energy | 647,182,808 | 647,182,808 | - | - |
Financials | 1,126,930,255 | 1,106,361,909 | 5,623,118 | 14,945,228 |
Health Care | 1,302,592,274 | 1,292,819,582 | 3,505,009 | 6,267,683 |
Industrials | 723,336,556 | 634,244,978 | 2,979,122 | 86,112,456 |
Information Technology | 2,250,546,558 | 2,229,691,875 | 3,567,427 | 17,287,256 |
Materials | 305,945,621 | 302,459,407 | 3,486,214 | - |
Real Estate | 1,371,420 | 1,371,420 | - | - |
Utilities | 18,878,157 | 18,878,157 | - | - |
|
| Preferred Securities | 674,560 | - | - | 674,560 |
|
| Money Market Funds | 348,793,390 | 348,793,390 | - | - |
| Total Investments in Securities: | 9,160,215,547 | 8,930,720,010 | 75,990,015 | 153,505,522 |
The following is a reconciliation of Investments in Securities for which Level 3 inputs were used in determining value:
| |
| Investments in Securities: | |
| Beginning Balance | $ | 138,926,567 | |
| Net Realized Gain (Loss) on Investment Securities | | - | |
| Net Unrealized Gain (Loss) on Investment Securities | | 4,646,518 | |
| Cost of Purchases | | 9,932,437 | |
| Proceeds of Sales | | - | |
| Amortization/Accretion | | - | |
| Transfers into Level 3 | | - | |
| Transfers out of Level 3 | | - | |
| Ending Balance | $ | 153,505,522 | |
| The change in unrealized gain (loss) for the period attributable to Level 3 securities held at June 30, 2023 | $ | 4,646,518 | |
| The information used in the above reconciliation represents fiscal year to date activity for any Investments in Securities identified as using Level 3 inputs at either the beginning or the end of the current fiscal period. Cost of purchases and proceeds of sales may include securities received and/or delivered through in-kind transactions, corporate actions or exchanges. Transfers into Level 3 were attributable to a lack of observable market data resulting from decreases in market activity, decreases in liquidity, security restructurings or corporate actions. Transfers out of Level 3 were attributable to observable market data becoming available for those securities. Transfers in or out of Level 3 represent the beginning value of any Security or Instrument where a change in the pricing level occurred from the beginning to the end of the period. Realized and unrealized gains (losses) disclosed in the reconciliation are included in Net Gain (Loss) on the Fund's Statement of Operations. | |
| Statement of Assets and Liabilities |
| | | | June 30, 2023 (Unaudited) |
| | | | | |
| Assets | | | | |
| Investment in securities, at value (including securities loaned of $7,741,421) - See accompanying schedule: | | | | |
Unaffiliated issuers (cost $5,095,780,424) | $ | 8,811,422,157 | | |
Fidelity Central Funds (cost $348,793,390) | | 348,793,390 | | |
| | | | | |
| | | | | |
| Total Investment in Securities (cost $5,444,573,814) | | | $ | 9,160,215,547 |
| Restricted cash | | | | 61,365 |
| Foreign currency held at value (cost $904,362) | | | | 904,374 |
| Receivable for investments sold | | | | 905,922 |
| Receivable for fund shares sold | | | | 10,116 |
| Dividends receivable | | | | 4,541,527 |
| Distributions receivable from Fidelity Central Funds | | | | 1,282,955 |
| Other receivables | | | | 42,653 |
Total assets | | | | 9,167,964,459 |
| Liabilities | | | | |
| Payable for investments purchased | $ | 24,900,777 | | |
| Payable for fund shares redeemed | | 144,761,899 | | |
| Other payables and accrued expenses | | 945,683 | | |
| Collateral on securities loaned | | 7,940,825 | | |
| Total Liabilities | | | | 178,549,184 |
| Net Assets | | | $ | 8,989,415,275 |
| Net Assets consist of: | | | | |
| Paid in capital | | | $ | 5,290,858,101 |
| Total accumulated earnings (loss) | | | | 3,698,557,174 |
| Net Assets | | | $ | 8,989,415,275 |
Net Asset Value , offering price and redemption price per share ($8,989,415,275 ÷ 523,412,743 shares) | | | $ | 17.17 |
| Statement of Operations |
| | | | Six months ended June 30, 2023 (Unaudited) |
| Investment Income | | | | |
| Dividends | | | $ | 50,387,964 |
| Income from Fidelity Central Funds (including $14,223 from security lending) | | | | 7,991,724 |
| Total Income | | | | 58,379,688 |
| Expenses | | | | |
| Custodian fees and expenses | $ | 66,785 | | |
| Independent trustees' fees and expenses | | 26,336 | | |
| Total expenses before reductions | | 93,121 | | |
| Expense reductions | | (2,073) | | |
| Total expenses after reductions | | | | 91,048 |
| Net Investment income (loss) | | | | 58,288,640 |
| Realized and Unrealized Gain (Loss) | | | | |
| Net realized gain (loss) on: | | | | |
| Investment Securities: | | | | |
| Unaffiliated issuers | | (26,317,143) | | |
| Foreign currency transactions | | (91,879) | | |
| Total net realized gain (loss) | | | | (26,409,022) |
| Change in net unrealized appreciation (depreciation) on: | | | | |
| Investment Securities: | | | | |
| Unaffiliated issuers(net of increase in deferred foreign taxes of $46,673) | | 1,542,623,762 | | |
| Unfunded commitments | | 309,148 | | |
| Assets and liabilities in foreign currencies | | (6,320) | | |
| Total change in net unrealized appreciation (depreciation) | | | | 1,542,926,590 |
| Net gain (loss) | | | | 1,516,517,568 |
| Net increase (decrease) in net assets resulting from operations | | | $ | 1,574,806,208 |
| Statement of Changes in Net Assets |
| |
| | Six months ended June 30, 2023 (Unaudited) | | Year ended December 31, 2022 |
| Increase (Decrease) in Net Assets | | | | |
| Operations | | | | |
| Net investment income (loss) | $ | 58,288,640 | $ | 91,855,692 |
| Net realized gain (loss) | | (26,409,022) | | 321,739,744 |
| Change in net unrealized appreciation (depreciation) | | 1,542,926,590 | | (2,587,093,534) |
| Net increase (decrease) in net assets resulting from operations | | 1,574,806,208 | | (2,173,498,098) |
| Distributions to shareholders | | - | | (568,513,318) |
| | | | | |
| Share transactions | | | | |
| Proceeds from sales of shares | | 464,866,821 | | 3,429,424,120 |
| Reinvestment of distributions | | - | | 568,513,318 |
| Cost of shares redeemed | | (1,118,490,994) | | (1,208,298,984) |
| | | | | |
Net increase (decrease) in net assets resulting from share transactions | | (653,624,173) | | 2,789,638,454 |
| Total increase (decrease) in net assets | | 921,182,035 | | 47,627,038 |
| | | | | |
| Net Assets | | | | |
| Beginning of period | | 8,068,233,240 | | 8,020,606,202 |
| End of period | $ | 8,989,415,275 | $ | 8,068,233,240 |
| | | | | |
| Other Information | | | | |
| Shares | | | | |
| Sold | | 30,225,518 | | 215,811,257 |
| Issued in reinvestment of distributions | | - | | 36,485,463 |
| Redeemed | | (70,539,802) | | (75,287,602) |
| Net increase (decrease) | | (40,314,284) | | 177,009,118 |
| | | | | |
| Fidelity® Series Opportunistic Insights Fund |
| |
| | Six months ended (Unaudited) June 30, 2023 | | Years ended December 31, 2022 | | 2021 | | 2020 | | 2019 | | 2018 |
Selected Per-Share Data | | | | | | | | | | | | |
| Net asset value, beginning of period | $ | 14.31 | $ | 20.74 | $ | 20.25 | $ | 18.10 | $ | 15.18 | $ | 17.32 |
| Income from Investment Operations | | | | | | | | | | | | |
Net investment income (loss) A,B | | .11 | | .20 | | .14 | | .12 | | .15 | | .15 |
| Net realized and unrealized gain (loss) | | 2.75 | | (5.44) | | 4.79 | | 5.36 | | 4.43 | | (.42) |
| Total from investment operations | | 2.86 | | (5.24) | | 4.93 | | 5.48 | | 4.58 | | (.27) |
| Distributions from net investment income | | - | | (.18) | | (.20) | | (.16) | | (.15) | | (.13) |
| Distributions from net realized gain | | - | | (1.00) | | (4.24) | | (3.18) | | (1.51) | | (1.75) |
| Total distributions | | - | | (1.19) C | | (4.44) | | (3.33) C | | (1.66) | | (1.87) C |
| Net asset value, end of period | $ | 17.17 | $ | 14.31 | $ | 20.74 | $ | 20.25 | $ | 18.10 | $ | 15.18 |
Total Return D,E | | 19.99% | | (25.73)% | | 24.81% | | 31.18% | | 30.53% | | (1.87)% |
Ratios to Average Net Assets B,F,G | | | | | | | | | | | | |
| Expenses before reductions | | -% H | | -% | | -% | | -% | | -% | | -% |
| Expenses net of fee waivers, if any | | -% H | | -% | | -% | | -% | | -% | | -% |
| Expenses net of all reductions | | -% H | | -% | | -% | | -% | | -% | | -% |
| Net investment income (loss) | | 1.35% H | | 1.23% | | .61% | | .61% | | .81% | | .80% |
| Supplemental Data | | | | | | | | | | | | |
| Net assets, end of period (000 omitted) | $ | 8,989,415 | $ | 8,068,233 | $ | 8,020,606 | $ | 7,673,290 | $ | 6,899,733 | $ | 6,419,232 |
Portfolio turnover rate I | | 37% H | | 36% | | 43% | | 33% | | 27% J | | 32% K |
A Calculated based on average shares outstanding during the period.
B Net investment income (loss) is affected by the timing of the declaration of dividends by any underlying mutual funds or exchange-traded funds (ETFs). Net investment income (loss) of any mutual funds or ETFs is not included in the Fund's net investment income (loss) ratio.
C Total distributions per share do not sum due to rounding.
D Total returns for periods of less than one year are not annualized.
E Total returns would have been lower if certain expenses had not been reduced during the applicable periods shown.
F Fees and expenses of any underlying mutual funds or exchange-traded funds (ETFs) are not included in the Fund's expense ratio. The Fund indirectly bears its proportionate share of these expenses. For additional expense information related to investments in Fidelity Central Funds, please refer to the "Investments in Fidelity Central Funds" note found in the Notes to Financial Statements section of the most recent Annual or Semi-Annual report.
G Expense ratios reflect operating expenses of the class. Expenses before reductions do not reflect amounts reimbursed, waived, or reduced through arrangements with the investment adviser, brokerage services, or other offset arrangements, if applicable, and do not represent the amount paid by the class during periods when reimbursements, waivers or reductions occur.
H Annualized.
I Amount does not include the portfolio activity of any underlying mutual funds or exchange-traded funds (ETFs).
J Portfolio turnover rate excludes securities received or delivered in-kind.
K The portfolio turnover rate does not include the assets acquired in the merger.
For the period ended June 30, 2023
1. Organization.
Fidelity Series Opportunistic Insights Fund (the Fund) is a fund of Fidelity Contrafund (the Trust) and is authorized to issue an unlimited number of shares. Shares are offered only to certain other Fidelity funds, Fidelity managed 529 plans, and Fidelity managed collective investment trusts. The Trust is registered under the Investment Company Act of 1940, as amended (the 1940 Act), as an open-end management investment company organized as a Massachusetts business trust.
2. Investments in Fidelity Central Funds.
Funds may invest in Fidelity Central Funds, which are open-end investment companies generally available only to other investment companies and accounts managed by the investment adviser and its affiliates. The Schedule of Investments lists any Fidelity Central Funds held as an investment as of period end, but does not include the underlying holdings of each Fidelity Central Fund. An investing fund indirectly bears its proportionate share of the expenses of the underlying Fidelity Central Funds.
Based on its investment objective, each Fidelity Central Fund may invest or participate in various investment vehicles or strategies that are similar to those of the investing fund. These strategies are consistent with the investment objectives of the investing fund and may involve certain economic risks which may cause a decline in value of each of the Fidelity Central Funds and thus a decline in the value of the investing fund.
| Fidelity Central Fund | Investment Manager | Investment Objective | Investment Practices | Expense Ratio A |
| Fidelity Money Market Central Funds | Fidelity Management & Research Company LLC (FMR) | Each fund seeks to obtain a high level of current income consistent with the preservation of capital and liquidity. | Short-term Investments | Less than .005% |
A Expenses expressed as a percentage of average net assets and are as of each underlying Central Fund's most recent annual or semi-annual shareholder report.
A complete unaudited list of holdings for each Fidelity Central Fund is available upon request or at the Securities and Exchange Commission website at www.sec.gov. In addition, the financial statements of the Fidelity Central Funds which contain the significant accounting policies (including investment valuation policies) of those funds, and are not covered by the Report of Independent Registered Public Accounting Firm, are available on the Securities and Exchange Commission website or upon request.
3. Significant Accounting Policies.
The Fund is an investment company and applies the accounting and reporting guidance of the Financial Accounting Standards Board (FASB) Accounting Standards Codification Topic 946 Financial Services - Investment Companies . The financial statements have been prepared in conformity with accounting principles generally accepted in the United States of America (GAAP), which require management to make certain estimates and assumptions at the date of the financial statements. Actual results could differ from those estimates. Subsequent events, if any, through the date that the financial statements were issued have been evaluated in the preparation of the financial statements. The Fund's Schedule of Investments lists any underlying mutual funds or exchange-traded funds (ETFs) but does not include the underlying holdings of these funds. The following summarizes the significant accounting policies of the Fund:
Investment Valuation. Investments are valued as of 4:00 p.m. Eastern time on the last calendar day of the period. The Board of Trustees (the Board) has designated the Fund's investment adviser as the valuation designee responsible for the fair valuation function and performing fair value determinations as needed. The investment adviser has established a Fair Value Committee (the Committee) to carry out the day-to-day fair valuation responsibilities and has adopted policies and procedures to govern the fair valuation process and the activities of the Committee. In accordance with these fair valuation policies and procedures, which have been approved by the Board, the Fund attempts to obtain prices from one or more third party pricing services or brokers to value its investments. When current market prices, quotations or currency exchange rates are not readily available or reliable, investments will be fair valued in good faith by the Committee, in accordance with the policies and procedures. Factors used in determining fair value vary by investment type and may include market or investment specific events, transaction data, estimated cash flows, and market observations of comparable investments. The frequency that the fair valuation procedures are used cannot be predicted and they may be utilized to a significant extent. The Committee manages the Fund's fair valuation practices and maintains the fair valuation policies and procedures. The Fund's investment adviser reports to the Board information regarding the fair valuation process and related material matters.
The Fund categorizes the inputs to valuation techniques used to value its investments into a disclosure hierarchy consisting of three levels as shown below:
Level 1 - unadjusted quoted prices in active markets for identical investments
Level 2 - other significant observable inputs (including quoted prices for similar investments, interest rates, prepayment speeds, etc.)
Level 3 - unobservable inputs (including the Fund's own assumptions based on the best information available)
Valuation techniques used to value the Fund's investments by major category are as follows:
Equity securities, including restricted securities, for which market quotations are readily available, are valued at the last reported sale price or official closing price as reported by a third party pricing service on the primary market or exchange on which they are traded and are categorized as Level 1 in the hierarchy. In the event there were no sales during the day or closing prices are not available, securities are valued at the last quoted bid price or may be valued using the last available price and are generally categorized as Level 2 in the hierarchy. For foreign equity securities, when market or security specific events arise, comparisons to the valuation of American Depositary Receipts (ADRs), futures contracts, ETFs and certain indexes as well as quoted prices for similar securities may be used and would be categorized as Level 2 in the hierarchy. For equity securities, including restricted securities, where observable inputs are limited, assumptions about market activity and risk are used and these securities may be categorized as Level 3 in the hierarchy. Securities, including private placements or other restricted securities, for which observable inputs are not available are valued using alternate valuation approaches, including the market approach, the income approach and cost approach, and are categorized as Level 3 in the hierarchy. The market approach considers factors including the price of recent investments in the same or a similar security or financial metrics of comparable securities. The income approach considers factors including expected future cash flows, security specific risks and corresponding discount rates. The cost approach considers factors including the value of the security's underlying assets and liabilities.
Debt securities, including restricted securities, are valued based on evaluated prices received from third party pricing services or from brokers who make markets in such securities. Preferred securities are valued by pricing services who utilize matrix pricing which considers yield or price of bonds of comparable quality, coupon, maturity and type or by broker-supplied prices. When independent prices are unavailable or unreliable, debt securities may be valued utilizing pricing methodologies which consider similar factors that would be used by third party pricing services. Debt securities are generally categorized as Level 2 in the hierarchy but may be Level 3 depending on the circumstances.
Investments in open-end mutual funds, including the Fidelity Central Funds, are valued at their closing net asset value (NAV) each business day and are categorized as Level 1 in the hierarchy.
The following provides information on Level 3 securities held by the Fund that were valued at period end based on unobservable inputs. These amounts exclude valuations provided by a broker.
| Asset Type | Fair Value | Valuation Technique(s) | Unobservable Input | Amount or Range/Weighted Average | Impact to Valuation from an Increase in Input A |
| Equities | $152,830,962 | Market comparable | Enterprise value/EBITDA multiple (EV/EBITDA) | 6.0 - 22.0 / 14.3 | Increase |
| | | | Enterprise value/Revenue multiple (EV/R) | 1.3 - 43.7 / 11.7 | Increase |
| | | | Enterprise value/Net income multiple (EV/NI) | 14.5 | Increase |
| | | Recovery value | Recovery value | $0.00 - $0.17 / $0.16 | Increase |
| | | Market approach | Transaction price | $59.45 - $60.00 / $59.86 | Increase |
| | | | Premium rate | 10% | Increase |
| | | Discounted cash flow | Weighted average cost of capital (WACC) | 29% | Decrease |
| | | | Exit multiple | 1.8 | Increase |
| | | Black scholes | Discount rate | 4.0% - 4.7% / 4.3% | Increase |
| | | | Volatility | 70.0% - 80.0% / 73.2% | Increase |
| | | | Term | 2.0 - 5.0 / 3.5 | Increase |
| Preferred Securities | $674,560 | Market approach | Transaction price | 59.45 | Increase |
| | | | Premium rate | 10% | Increase |
| | | Black scholes | Discount rate | 4.7% | Increase |
| | | | Volatility | 70% | Increase |
| | | | Term | 2 | Increase |
A Represents the directional change in the fair value of the Level 3 investments that could have resulted from an increase in the corresponding input as of period end. A decrease to the unobservable input would have had the opposite effect. Significant changes in these inputs may have resulted in a significantly higher or lower fair value measurement at period end.
Changes in valuation techniques may result in transfers in or out of an assigned level within the disclosure hierarchy. The aggregate value of investments by input level as of June 30, 2023, as well as a roll forward of Level 3 investments, is included at the end of the Fund's Schedule of Investments.
Foreign Currency. Certain Funds may use foreign currency contracts to facilitate transactions in foreign-denominated securities. Gains and losses from these transactions may arise from changes in the value of the foreign currency or if the counterparties do not perform under the contracts' terms.
Foreign-denominated assets, including investment securities, and liabilities are translated into U.S. dollars at the exchange rates at period end. Purchases and sales of investment securities, income and dividends received, and expenses denominated in foreign currencies are translated into U.S. dollars at the exchange rate in effect on the transaction date.
The effects of exchange rate fluctuations on investments are included with the net realized and unrealized gain (loss) on investment securities. Other foreign currency transactions resulting in realized and unrealized gain (loss) are disclosed separately.
Investment Transactions and Income. For financial reporting purposes, the Fund's investment holdings and NAV include trades executed through the end of the last business day of the period. The NAV per share for processing shareholder transactions is calculated as of the close of business of the New York Stock Exchange (NYSE), normally 4:00 p.m. Eastern time and includes trades executed through the end of the prior business day. Gains and losses on securities sold are determined on the basis of identified cost and include proceeds received from litigation. Commissions paid to certain brokers with whom the investment adviser, or its affiliates, places trades on behalf of a fund include an amount in addition to trade execution, which may be rebated back to a fund. Any such rebates are included in net realized gain (loss) on investments in the Statement of Operations. Dividend income is recorded on the ex-dividend date, except for certain dividends from foreign securities where the ex-dividend date may have passed, which are recorded as soon as the Fund is informed of the ex-dividend date. Non-cash dividends included in dividend income, if any, are recorded at the fair market value of the securities received. Income and capital gain distributions from Fidelity Central Funds, if any, are recorded on the ex-dividend date. Certain distributions received by the Fund represent a return of capital or capital gain. The Fund determines the components of these distributions subsequent to the ex-dividend date, based upon receipt of tax filings or other correspondence relating to the underlying investment. These distributions are recorded as a reduction of cost of investments and/or as a realized gain. Investment income is recorded net of foreign taxes withheld where recovery of such taxes is uncertain. Funds may file withholding tax reclaims in certain jurisdictions to recover a portion of amounts previously withheld. Any withholding tax reclaims income is included in the Statement of Operations in dividends. Any receivables for withholding tax reclaims are included in the Statement of Assets and Liabilities in dividends receivable.
Expenses. Expenses directly attributable to a fund are charged to that fund. Expenses attributable to more than one fund are allocated among the respective funds on the basis of relative net assets or other appropriate methods. Expenses included in the accompanying financial statements reflect the expenses of that fund and do not include any expenses associated with any underlying mutual funds or exchange-traded funds. Although not included in a fund's expenses, a fund indirectly bears its proportionate share of these expenses through the net asset value of each underlying mutual fund or exchange-traded fund. Expense estimates are accrued in the period to which they relate and adjustments are made when actual amounts are known.
Income Tax Information and Distributions to Shareholders. Each year, the Fund intends to qualify as a regulated investment company under Subchapter M of the Internal Revenue Code, including distributing substantially all of its taxable income and realized gains. As a result, no provision for U.S. Federal income taxes is required. The Fund files a U.S. federal tax return, in addition to state and local tax returns as required. The Fund's federal income tax returns are subject to examination by the Internal Revenue Service (IRS) for a period of three fiscal years after they are filed. State and local tax returns may be subject to examination for an additional fiscal year depending on the jurisdiction. Foreign taxes are provided for based on the Fund's understanding of the tax rules and rates that exist in the foreign markets in which it invests. The Fund is subject to a tax imposed on capital gains by certain countries in which it invests. An estimated deferred tax liability for net unrealized appreciation on the applicable securities is included in Other payables and accrued expenses on the Statement of Assets & Liabilities.
Distributions are declared and recorded on the ex-dividend date. Income and capital gain distributions are determined in accordance with income tax regulations, which may differ from GAAP.
Capital accounts within the financial statements are adjusted for permanent book-tax differences. These adjustments have no impact on net assets or the results of operations. Capital accounts are not adjusted for temporary book-tax differences which will reverse in a subsequent period.
Book-tax differences are primarily due to foreign currency transactions, certain foreign taxes, passive foreign investment companies (PFIC), partnerships, and losses deferred due to wash sales and excise tax regulations.
As of period end, the cost and unrealized appreciation (depreciation) in securities, and derivatives if applicable, for federal income tax purposes were as follows:
| Gross unrealized appreciation | $3,815,038,296 |
| Gross unrealized depreciation | (130,817,776) |
| Net unrealized appreciation (depreciation) | $3,684,220,520 |
| Tax cost | $5,475,995,027 |
The Fund elected to defer to its next fiscal year approximately $14,451,235 of capital losses recognized during the period November 1, 2022 to December 31, 2022.
Restricted Securities (including Private Placements). Funds may invest in securities that are subject to legal or contractual restrictions on resale. These securities generally may be resold in transactions exempt from registration or to the public if the securities are registered. Disposal of these securities may involve time-consuming negotiations and expense, and prompt sale at an acceptable price may be difficult. Information regarding restricted securities held at period end is included at the end of the Schedule of Investments, if applicable.
Consolidated Subsidiary. The Funds included in the table below hold certain investments through a wholly-owned subsidiary ("Subsidiary"), which may be subject to federal and state taxes upon disposition.
As of period end, investments in Subsidiaries were as follows:
| | $ Amount | % of Net Assets |
| Fidelity Series Opportunistic Insights Fund | 9,818,307 | .11 |
The financial statements have been consolidated to include the Subsidiary accounts where applicable. Accordingly, all inter-company transactions and balances have been eliminated.
At period end, any estimated tax liability for these investments is presented as "Deferred taxes" in the Statement of Assets and Liabilities and included in "Change in net unrealized appreciation (depreciation) on investment securities" in the Statement of Operations. The tax liability incurred may differ materially depending on conditions when these investments are disposed. Any cash held by a Subsidiary is restricted as to its use and is presented as "Restricted cash" in the Statement of Assets and Liabilities, if applicable.
New Accounting Pronouncement. In June 2022, the Financial Accounting Standards Board (FASB) issued Accounting Standards Update (ASU) 2022-03 Fair Value Measurement (Topic 820): Fair Value Measurement of Equity Securities Subject to Contractual Sale Restrictions. The amendments in this ASU clarify that a contractual restriction on the sale of an equity security is not considered part of the unit of account of the equity security and, therefore, is not considered in measuring fair value. They also clarify that an entity cannot, as a separate unit of account, recognize and measure a contractual sale restriction. They also require additional disclosures for equity securities subject to contractual sale restrictions. ASU 2022-03 will be effective for fiscal years, including interim periods within those fiscal years, beginning after December 15, 2023, and allows for early adoption. ASU 2022-03 will only be applicable to an equity security in which the contractual arrangement that restricts its sale is executed or modified on or after the adoption date. Management is currently evaluating the potential impact of ASU 2022-03 to the financial statements.
4. Purchases and Sales of Investments.
Purchases and sales of securities, other than short-term securities and in-kind transactions, as applicable, are noted in the table below.
| | Purchases ($) | Sales ($) |
| Fidelity Series Opportunistic Insights Fund | 1,530,846,815 | 1,679,265,306 |
5. Fees and Other Transactions with Affiliates.
Management Fee. Fidelity Management & Research Company LLC (the investment adviser) and its affiliates provide the Fund with investment management related services for which the Fund does not pay a management fee. Under the management contract, the investment adviser or an affiliate pays all ordinary operating expenses of the Fund, except custody fees, fees and expenses of the independent Trustees, and certain miscellaneous expenses such as proxy and shareholder meeting expenses.
Brokerage Commissions. A portion of portfolio transactions were placed with brokerage firms which are affiliates of the investment adviser. Brokerage commissions are included in net realized gain (loss) and change in net unrealized appreciation (depreciation) in the Statement of Operations. The commissions paid to these affiliated firms were as follows:
| | Amount |
Fidelity Series Opportunistic Insights Fund | $23,118 |
Interfund Trades. Funds may purchase from or sell securities to other Fidelity Funds under procedures adopted by the Board. The procedures have been designed to ensure these interfund trades are executed in accordance with Rule 17a-7 of the 1940 Act. Any interfund trades are included within the respective purchases and sales amounts shown in the Purchases and Sales of Investments note. Interfund trades during the period are noted in the table below.
| | Purchases ($) | Sales ($) | Realized Gain (Loss) ($) |
| Fidelity Series Opportunistic Insights Fund | 53,651,899 | 79,247,975 | 1,952,435 |
6. Committed Line of Credit.
Certain Funds participate with other funds managed by the investment adviser or an affiliate in a $4.25 billion credit facility (the "line of credit") to be utilized for temporary or emergency purposes to fund shareholder redemptions or for other short-term liquidity purposes. The commitment fees on the pro-rata portion of the line of credit are borne by the investment adviser. During the period, there were no borrowings on this line of credit.
7. Security Lending.
Funds lend portfolio securities from time to time in order to earn additional income. Lending agents are used, including National Financial Services (NFS), an affiliate of the investment adviser. Pursuant to a securities lending agreement, NFS will receive a fee, which is capped at 9.9% of a fund's daily lending revenue, for its services as lending agent. A fund may lend securities to certain qualified borrowers, including NFS. On the settlement date of the loan, a fund receives collateral (in the form of U.S. Treasury obligations, letters of credit and/or cash) against the loaned securities and maintains collateral in an amount not less than 100% of the market value of the loaned securities during the period of the loan. The market value of the loaned securities is determined at the close of business of a fund and any additional required collateral is delivered to a fund on the next business day. A fund or borrower may terminate the loan at any time, and if the borrower defaults on its obligation to return the securities loaned because of insolvency or other reasons, a fund may apply collateral received from the borrower against the obligation. A fund may experience delays and costs in recovering the securities loaned. Any cash collateral received is invested in the Fidelity Securities Lending Cash Central Fund. Any loaned securities are identified as such in the Schedule of Investments, and the value of loaned securities and cash collateral at period end, as applicable, are presented in the Statement of Assets and Liabilities. Security lending income represents the income earned on investing cash collateral, less rebates paid to borrowers and any lending agent fees associated with the loan, plus any premium payments received for lending certain types of securities. Security lending income is presented in the Statement of Operations as a component of income from Fidelity Central Funds. Affiliated security lending activity, if any, was as follows:
| | Total Security Lending Fees Paid to NFS | Security Lending Income From Securities Loaned to NFS | Value of Securities Loaned to NFS at Period End |
| Fidelity Series Opportunistic Insights Fund | $1,488 | $- | $- |
8. Expense Reductions.
Through arrangements with the Fund's custodian, credits realized as a result of certain uninvested cash balances were used to reduce the Fund's expenses by $2,073.
9. Other.
A fund's organizational documents provide former and current trustees and officers with a limited indemnification against liabilities arising in connection with the performance of their duties to the fund. In the normal course of business, a fund may also enter into contracts that provide general indemnifications. A fund's maximum exposure under these arrangements is unknown as this would be dependent on future claims that may be made against a fund. The risk of material loss from such claims is considered remote.
At the end of the period, mutual funds and accounts managed by FMR or its affiliates were the owners of record of all of the outstanding shares of the Fund.
10. Risk and Uncertainties.
Many factors affect a fund's performance. Developments that disrupt global economies and financial markets, such as pandemics, epidemics, outbreaks of infectious diseases, war, terrorism, and environmental disasters, may significantly affect a fund's investment performance. The effects of these developments to a fund will be impacted by the types of securities in which a fund invests, the financial condition, industry, economic sector, and geographic location of an issuer, and a fund's level of investment in the securities of that issuer. Significant concentrations in security types, issuers, industries, sectors, and geographic locations may magnify the factors that affect a fund's performance.
As a shareholder, you incur two types of costs: (1) transaction costs, which may include sales charges (loads) on purchase payments or redemption proceeds, as applicable and (2) ongoing costs, which generally include management fees, distribution and/or service (12b-1) fees and other Fund expenses. This Example is intended to help you understand your ongoing costs (in dollars) of investing in a fund and to compare these costs with the ongoing costs of investing in other mutual funds.
| The Example is based on an investment of $1,000 invested at the beginning of the period and held for the entire period (January 1, 2023 to June 30, 2023). |
Actual Expenses
The first line of the accompanying table provides information about actual account values and actual expenses. You may use the information in this line, together with the amount you invested, to estimate the expenses that you paid over the period. Simply divide your account value by $1,000.00 (for example, an $8,600 account value divided by $1,000.00 = 8.6), then multiply the result by the number in the first line for a class/Fund under the heading entitled "Expenses Paid During Period" to estimate the expenses you paid on your account during this period. If any fund is a shareholder of any underlying mutual funds or exchange-traded funds (ETFs) (the Underlying Funds), such fund indirectly bears its proportional share of the expenses of the Underlying Funds in addition to the direct expenses incurred presented in the table. These fees and expenses are not included in the annualized expense ratio used to calculate the expense estimate in the table below.
Hypothetical Example for Comparison Purposes
The second line of the accompanying table provides information about hypothetical account values and hypothetical expenses based on the actual expense ratio and an assumed rate of return of 5% per year before expenses, which is not the actual return. The hypothetical account values and expenses may not be used to estimate the actual ending account balance or expenses you paid for the period. You may use this information to compare the ongoing costs of investing in the Fund and other funds. To do so, compare this 5% hypothetical example with the 5% hypothetical examples that appear in the shareholder reports of the other funds. If any fund is a shareholder of any Underlying Funds, such fund indirectly bears its proportional share of the expenses of the Underlying Funds in addition to the direct expenses as presented in the table. These fees and expenses are not included in the annualized expense ratio used to calculate the expense estimate in the table below.
Please note that the expenses shown in the table are meant to highlight your ongoing costs only and do not reflect any transaction costs. Therefore, the second line of the table is useful in comparing ongoing costs only, and will not help you determine the relative total costs of owning different funds. In addition, if these transactional costs were included, your costs would have been higher.
| | | | | Annualized Expense Ratio- A | | Beginning Account Value January 1, 2023 | | Ending Account Value June 30, 2023 | | Expenses Paid During Period- C January 1, 2023 to June 30, 2023 |
| | | | | | | | | | |
| Fidelity® Series Opportunistic Insights Fund | | | | -%- D | | | | | | |
| Actual | | | | | | $ 1,000 | | $ 1,199.90 | | $- E |
Hypothetical- B | | | | | | $ 1,000 | | $ 1,024.79 | | $- E |
| |
A Annualized expense ratio reflects expenses net of applicable fee waivers.
B 5% return per year before expenses
C Expenses are equal to the annualized expense ratio, multiplied by the average account value over the period, multiplied by 181/ 365 (to reflect the one-half year period). The fees and expenses of any Underlying Funds are not included in each annualized expense ratio.
D Amount represents less than .005%.
E Amount represents less than $.005.
Board Approval of Investment Advisory Contracts
Fidelity Series Opportunistic Insights Fund
At its May 2023 meeting, the Board of Trustees, including the Independent Trustees (together, the Board), voted to continue the management contract with Fidelity Management & Research Company LLC (FMR), and the sub-advisory agreements and sub-subadvisory agreements, in each case, where applicable (together, the Advisory Contracts) for the fund for two months from June 1, 2023 through July 31, 2023. The Board determined that it will consider the annual renewal of the fund's Advisory Contracts for a full one year period in July 2023, following its review of additional materials provided by FMR.
The Board considered that the approval of the fund's Advisory Contracts will not result in any changes in (i) the investment process or strategies employed in the management of the fund's assets; (ii) the fees and expenses paid by shareholders; (iii) the nature, extent or quality of services provided under the fund's Advisory Contracts; or (iv) the day-to-day management of the fund or the persons primarily responsible for such management. The Board also considered that since its last approval of the fund's Advisory Contracts, FMR had provided additional information on the fund in support of the annual contract renewal process, including competitive analyses on total expenses and management fees and in-depth reviews of fund performance and fund profitability information. The Board concluded that the fund's Advisory Contracts are fair and reasonable, and that the fund's Advisory Contracts should be renewed, without modification, through July 31, 2023, with the understanding that the Board will consider the annual renewal for a full one year period in July 2023.
In connection with its consideration of future renewals of the fund's Advisory Contracts, the Board will consider: (i) the nature, extent and quality of services provided to the fund, including shareholder and administrative services and investment performance; (ii) the competitiveness of the management fee and total expenses for the fund; (iii) the costs of the services and profitability, including the revenues earned and the expenses incurred in conducting the business of developing, marketing, distributing, managing, administering, and servicing the fund and its shareholders, to the extent applicable; and (iv) whether there have been economies of scale in respect of the Fidelity funds, whether the Fidelity funds (including the fund) have appropriately benefited from any such economies of scale, and whether there is the potential for realization of any further economies.
Based on its evaluation of all of the conclusions noted above, and after considering all factors it believed relevant, the Board ultimately concluded that the fund's management fee structure is fair and reasonable, and that the continuation of the fund's Advisory Contracts should be approved for two months from June 1, 2023 through July 31, 2023.
The Securities and Exchange Commission adopted Rule 22e-4 under the Investment Company Act of 1940 (the Liquidity Rule) to promote effective liquidity risk management throughout the open-end investment company industry, thereby reducing the risk that funds will be unable to meet their redemption obligations and mitigating dilution of the interests of fund shareholders.
The Fund has adopted and implemented a liquidity risk management program (the Program) reasonably designed to assess and manage the Fund's liquidity risk and to comply with the requirements of the Liquidity Rule. The Fund's Board of Trustees (the Board) has designated the Fund's investment adviser as administrator of the Program. The Fidelity advisers have established a Liquidity Risk Management Committee (the LRM Committee) to manage the Program for each of the Fidelity Funds. The LRM Committee monitors the adequacy and effectiveness of implementation of the Program and on a periodic basis assesses each Fund's liquidity risk based on a variety of factors including (1) the Fund's investment strategy, (2) portfolio liquidity and cash flow projections during normal and reasonably foreseeable stressed conditions, (3) shareholder redemptions, (4) borrowings and other funding sources and (5) certain factors specific to ETFs including the effect of the Fund's prices and spreads, market participants, and basket compositions on the overall liquidity of the Fund's portfolio, as applicable.
In accordance with the Program, each of the Fund's portfolio investments is classified into one of four defined liquidity categories based on a determination of a reasonable expectation for how long it would take to convert the investment to cash (or sell or dispose of the investment) without significantly changing its market value.
- Highly liquid investments - cash or convertible to cash within three business days or less
- Moderately liquid investments - convertible to cash in three to seven calendar days
- Less liquid investments - can be sold or disposed of, but not settled, within seven calendar days
- Illiquid investments - cannot be sold or disposed of within seven calendar days
Liquidity classification determinations take into account a variety of factors including various market, trading and investment-specific considerations, as well as market depth, and generally utilize analysis from a third-party liquidity metrics service.
The Liquidity Rule places a 15% limit on a fund's illiquid investments and requires funds that do not primarily hold assets that are highly liquid investments to determine and maintain a minimum percentage of the fund's net assets to be invested in highly liquid investments (highly liquid investment minimum or HLIM). The Program includes provisions reasonably designed to comply with the 15% limit on illiquid investments and for determining, periodically reviewing and complying with the HLIM requirement as applicable.
At a recent meeting of the Fund's Board of Trustees, the LRM Committee provided a written report to the Board pertaining to the operation, adequacy, and effectiveness of the Program for the period December 1, 2021 through November 30, 2022. The report concluded that the Program is operating effectively and is reasonably designed to assess and manage the Fund's liquidity risk.
1.951055.110
O1T-SANN-0823
Item 2.
Code of Ethics
Not applicable.
Item 3.
Audit Committee Financial Expert
Not applicable.
Item 4.
Principal Accountant Fees and Services
Not applicable.
Item 5.
Audit Committee of Listed Registrants
Not applicable.
Item 6.
Investments
(a)
Not applicable.
(b)
Not applicable
Item 7.
Disclosure of Proxy Voting Policies and Procedures for Closed-End Management Investment Companies
Not applicable.
Item 8.
Portfolio Managers of Closed-End Management Investment Companies
Not applicable.
Item 9.
Purchase of Equity Securities by Closed-End Management Investment Company and Affiliated Purchasers
Not applicable.
Item 10.
Submission of Matters to a Vote of Security Holders
There were no material changes to the procedures by which shareholders may recommend nominees to the Fidelity Contrafund’s Board of Trustees.
Item 11.
Controls and Procedures
(a)(i) The President and Treasurer and the Chief Financial Officer have concluded that the Fidelity Contrafund’s (the “Trust”) disclosure controls and procedures (as defined in Rule 30a-3(c) under the Investment Company Act) provide reasonable assurances that
material information relating to the Trust is made known to them by the appropriate persons, based on their evaluation of these controls and procedures as of a date within 90 days of the filing date of this report.
(a)(ii) There was no change in the Trust’s internal control over financial reporting (as defined in Rule 30a-3(d) under the Investment Company Act) that occurred during the period covered by this report that has materially affected, or is reasonably likely to materially affect, the Trust’s internal control over financial reporting.
Item 12.
Disclosure of Securities Lending Activities for Closed-End Management
Investment Companies
Not applicable.
Item 13.
Exhibits
SIGNATURES
Pursuant to the requirements of the Securities Exchange Act of 1934 and the Investment Company Act of 1940, the registrant has duly caused this report to be signed on its behalf by the undersigned, thereunto duly authorized.
Fidelity Contrafund
| |
By: | /s/Stacie M. Smith |
| Stacie M. Smith |
| President and Treasurer |
|
|
Date: | August 22, 2023 |
Pursuant to the requirements of the Securities Exchange Act of 1934 and the Investment Company Act of 1940, this report has been signed below by the following persons on behalf of the registrant and in the capacities and on the dates indicated.
| |
By: | /s/Stacie M. Smith |
| Stacie M. Smith |
| President and Treasurer |
|
|
Date: | August 22, 2023 |
| |
By: | /s/John J. Burke III |
| John J. Burke III |
| Chief Financial Officer |
|
|
Date: | August 22, 2023 |