UNITED STATES
SECURITIES AND EXCHANGE COMMISSION
Washington, D.C. 20549
FORM N-CSR
CERTIFIED SHAREHOLDER REPORT OF REGISTERED
MANAGEMENT INVESTMENT COMPANIES
Investment Company Act file number 811-01400
Fidelity Contrafund
(Exact name of registrant as specified in charter)
245 Summer St., Boston, Massachusetts 02210
(Address of principal executive offices) (Zip code)
Nicole Macarchuk, Secretary
245 Summer St.
Boston, Massachusetts 02210
(Name and address of agent for service)
Registrant's telephone number, including area code:
617-563-7000
| |
Date of fiscal year end: | December 31 |
|
|
Date of reporting period: | December 31, 2024 |
Item 1.
Reports to Stockholders
| |
| | ANNUAL SHAREHOLDER REPORT | AS OF DECEMBER 31, 2024 | This report describes changes to the Fund that occurred during the reporting period. |
| | Fidelity Advisor® New Insights Fund Fidelity Advisor® New Insights Fund Class C : FNICX |
| | | |
This annual shareholder report contains information about Fidelity Advisor® New Insights Fund for the period January 1, 2024 to December 31, 2024. You can find additional information about the Fund at fundresearch.fidelity.com/prospectus/sec. You can also request this information by contacting us at 1-877-208-0098 or by sending an e-mail to fidfunddocuments@fidelity.com.
What were your Fund costs for the last year?(based on hypothetical $10,000 investment)
FUND COST (PREVIOUS YEAR)
| | Costs of a $10,000 investment | Costs paid as a percentage of a $10,000 investment | |
| Class C | $ 193 | 1.65% | |
What affected the Fund's performance this period?
•U.S. equities gained in 2024, driven by a sturdy economy, the Federal Reserve's long-anticipated pivot to cutting interest rates and the potential for artificial intelligence to drive transformative change.
•Against this backdrop, security selection was the primary contributor to the fund's performance versus the S&P 500® index for the fiscal year, especially within industrials, where our stock picks in capital goods helped most. Security selection and an overweight in communication services, primarily within the media & entertainment industry, also boosted relative performance. Also helping our relative result were picks in information technology, especially within the semiconductors & semiconductor equipment industry.
•The top individual relative contributor was an overweight in Meta Platforms (+66%), the fund's largest holding. The second-largest relative contributor was an overweight in Nvidia (+171%). The company was among our largest holdings. A non-benchmark stake in Space Exploration Technologies also helped. The company was one of the fund's largest holdings at period end.
•In contrast, the biggest detractor from performance versus the benchmark was an underweight in information technology. Security selection in financials also hampered the fund's result. Also hurting was an overweight in industrials, primarily within the capital goods industry. Lastly, the fund's position in cash detracted.
•The biggest individual relative detractor was an underweight in Broadcom (+110%). A second notable relative detractor was an underweight in Tesla (+63%). An overweight in Regeneron Pharmaceuticals (-19%) also hurt. The stock was among our biggest holdings this period.
•Notable changes in positioning include decreased exposure to the health care sector and a higher allocation to industrials.
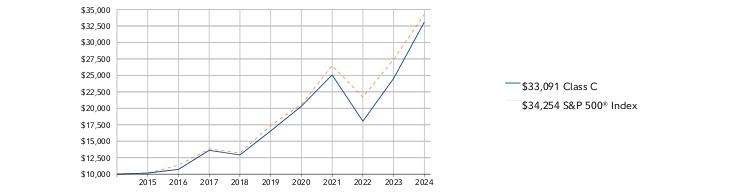
How did the Fund perform over the past 10 years?
CUMULATIVE PERFORMANCE
December 31, 2014 through December 31, 2024.
Initial investment of $10,000.
Class C | $10,000 | $10,163 | $10,721 | $13,614 | $12,918 | $16,554 | $20,319 | $25,065 | $18,043 | $24,529 | $33,091 |
S&P 500® Index | $10,000 | $10,138 | $11,351 | $13,829 | $13,223 | $17,386 | $20,585 | $26,494 | $21,696 | $27,399 | $34,254 |
| | 2014 | 2015 | 2016 | 2017 | 2018 | 2019 | 2020 | 2021 | 2022 | 2023 | 2024 |
AVERAGE ANNUAL TOTAL RETURNS:| | 1 Year | 5 Year | 10 Year |
| Class C (incl. contingent deferred sales charge) | 32.89% | 14.50% | 12.71% |
| Class C | 33.89% | 14.50% | 12.71% |
| S&P 500® Index | 25.02% | 14.53% | 13.10% |
Visit institutional.fidelity.com for more recent performance information. |
The Fund's past performance is not a good predictor of the Fund's future performance. The graph and table do not reflect the deduction of taxes that a shareholder would pay on fund distributions or redemption of fund shares. |
Key Fund Statistics(as of December 31, 2024)
KEY FACTS | | |
| Fund Size | $21,798,939,502 | |
| Number of Holdings | 443 | |
| Total Advisory Fee | $125,752,187 | |
| Portfolio Turnover | 18% | |
What did the Fund invest in?
(as of December 31, 2024)
MARKET SECTORS (% of Fund's net assets) | | |
| Information Technology | 26.0 | |
| Communication Services | 21.4 | |
| Financials | 14.8 | |
| Industrials | 12.3 | |
| Consumer Discretionary | 11.4 | |
| Health Care | 8.3 | |
| Materials | 1.5 | |
| Energy | 1.5 | |
| Utilities | 1.2 | |
| Consumer Staples | 1.2 | |
| Real Estate | 0.0 | |
| |
| Common Stocks | 96.9 |
| Preferred Stocks | 2.7 |
| Preferred Securities | 0.0 |
| Short-Term Investments and Net Other Assets (Liabilities) | 0.4 |
ASSET ALLOCATION (% of Fund's net assets) |
|
| | Common Stocks - 96.9 |
| | Preferred Stocks - 2.7 |
| | Preferred Securities - 0.0 |
| | Short-Term Investments and Net Other Assets (Liabilities) - 0.4 |
| |
| United States | 92.9 |
| Canada | 1.9 |
| Taiwan | 0.7 |
| Netherlands | 0.6 |
| United Kingdom | 0.5 |
| China | 0.4 |
| Italy | 0.4 |
| Congo Democratic Republic Of | 0.4 |
| Korea (South) | 0.4 |
| Others | 1.8 |
GEOGRAPHIC DIVERSIFICATION (% of Fund's net assets) |
|
| | United States - 92.9 |
| | Canada - 1.9 |
| | Taiwan - 0.7 |
| | Netherlands - 0.6 |
| | United Kingdom - 0.5 |
| | China - 0.4 |
| | Italy - 0.4 |
| | Congo Democratic Republic Of - 0.4 |
| | Korea (South) - 0.4 |
| | Others - 1.8 |
| |
TOP HOLDINGS(% of Fund's net assets) | | |
| Meta Platforms Inc Class A | 11.7 | |
| NVIDIA Corp | 8.9 | |
| Microsoft Corp | 6.5 | |
| Alphabet Inc Class A | 6.1 | |
| Amazon.com Inc | 5.8 | |
| Berkshire Hathaway Inc Class A | 5.1 | |
| Apple Inc | 2.6 | |
| Netflix Inc | 2.6 | |
| Space Exploration Technologies Corp | 2.3 | |
| Eli Lilly & Co | 2.2 | |
| | 53.8 | |
How has the Fund changed?
This is a summary of certain changes to the Fund since January 1, 2024. For more complete information, you may review the Fund's next prospectus, which we expect to be available by March 1, 2025 at fundresearch.fidelity.com/prospectus/sec or upon request at 1-877-208-0098 or by sending an e-mail to fidfunddocuments@fidelity.com.
The fees associated with this class changed during the reporting year. The variations in class fees are primarily the result of the following changes:- Management fee
- Operating expenses
- Performance adjustment fee
The fund's transfer agent and pricing & bookkeeping fees were changed to a fixed rate effective December 1, 2023. Effective March 1, 2024, the fund's management contract was amended to incorporate administrative services previously covered under separate services agreements (transfer agent and pricing & bookkeeping). The amended contract incorporates a basic fee rate that may vary by class (subject to a performance adjustment). The Adviser or an affiliate pays certain expenses of managing and operating the fund out of each class's management fee. | |
| Fidelity, the Fidelity Investments Logo and all other Fidelity trademarks or service marks used herein are trademarks or service marks of FMR LLC. Any third-party marks that are used herein are trademarks or service marks of their respective owners. © 2025 FMR LLC. All rights reserved. |
| | For additional information about the Fund; including its prospectus, financial information, holdings and proxy information, scan the QR code or visit fundresearch.fidelity.com/prospectus/sec 1.9914251.100 1279-TSRA-0325 |
| |
| | ANNUAL SHAREHOLDER REPORT | AS OF DECEMBER 31, 2024 | |
| | Fidelity® Series Opportunistic Insights Fund Fidelity® Series Opportunistic Insights Fund : FVWSX |
| | | |
This annual shareholder report contains information about Fidelity® Series Opportunistic Insights Fund for the period January 1, 2024 to December 31, 2024. You can find additional information about the Fund at fundresearch.fidelity.com/prospectus/sec. You can also request this information by contacting us at 1-800-544-8544.
What were your Fund costs for the last year?(based on hypothetical $10,000 investment)
FUND COST (PREVIOUS YEAR)
| | Costs of a $10,000 investment | Costs paid as a percentage of a $10,000 investment | |
| Fidelity® Series Opportunistic Insights Fund | $ 0 A | 0.00%B | |
A Amount represents less than $.50
B Amount represents less than 0.005%
What affected the Fund's performance this period?
•U.S. equities gained in 2024, driven by a sturdy economy, the Federal Reserve's long-anticipated pivot to cutting interest rates and the potential for artificial intelligence to drive transformative change.
•Against this backdrop, security selection was the primary contributor to the fund's performance versus the Russell 3000 Index for the fiscal year, led by information technology, where our stock picks in semiconductors & semiconductor equipment helped most. Stock picks and an overweight in communication services, primarily within the media & entertainment industry, also boosted relative performance. Also bolstering our relative result were picks in industrials, primarily within the capital goods industry.
•The top individual relative contributor was an overweight in Meta Platforms (+66%), the fund's biggest holding. The second-largest relative contributor was an overweight in Nvidia (+171%). The stock was among the fund's biggest holdings. An overweight in Netflix (+83%) also contributed. The stock was one of our largest holdings.
•In contrast, the biggest detractor from performance versus the benchmark was an underweight in information technology. Stock selection in financials, primarily within the financial services industry, also hampered the fund's result. Also hurting was an underweight in consumer discretionary, primarily within the automobiles & components industry. Lastly, the fund's position in cash detracted.
•The biggest individual relative detractor was an overweight in Regeneron Pharmaceuticals (-19%). The second-largest relative detractor was an underweight in Tesla (+63%). An overweight in Vertex Pharmaceuticals (-1%) also detracted. The stock was among our biggest holdings this period.
•Notable changes in positioning include decreased exposure to the energy sector and a higher allocation to financials.
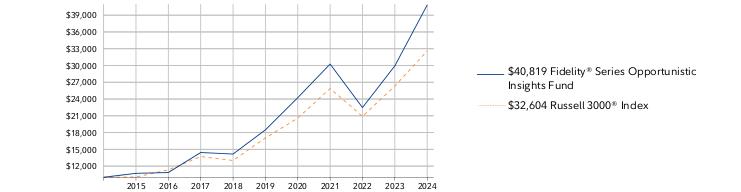
How did the Fund perform over the past 10 years?
CUMULATIVE PERFORMANCE
December 31, 2014 through December 31, 2024.
Initial investment of $10,000.
Fidelity® Series Opportunistic Insights Fund | $10,000 | $10,710 | $10,853 | $14,430 | $14,161 | $18,483 | $24,246 | $30,260 | $22,475 | $29,936 | $40,819 |
Russell 3000® Index | $10,000 | $10,048 | $11,327 | $13,721 | $13,002 | $17,035 | $20,593 | $25,877 | $20,907 | $26,334 | $32,604 |
| | 2014 | 2015 | 2016 | 2017 | 2018 | 2019 | 2020 | 2021 | 2022 | 2023 | 2024 |
AVERAGE ANNUAL TOTAL RETURNS:| | 1 Year | 5 Year | 10 Year |
| Fidelity® Series Opportunistic Insights Fund | 36.35% | 17.17% | 15.10% |
| Russell 3000® Index | 23.81% | 13.86% | 12.55% |
Visit www.fidelity.com for more recent performance information. |
The Fund's past performance is not a good predictor of the Fund's future performance. The graph and table do not reflect the deduction of taxes that a shareholder would pay on fund distributions or redemption of fund shares. |
Key Fund Statistics(as of December 31, 2024)
KEY FACTS | | |
| Fund Size | $11,265,136,609 | |
| Number of Holdings | 372 | |
| Total Advisory Fee | $0 | |
| Portfolio Turnover | 23% | |
What did the Fund invest in?
(as of December 31, 2024)
MARKET SECTORS (% of Fund's net assets) | | |
| Information Technology | 24.6 | |
| Communication Services | 21.4 | |
| Financials | 18.0 | |
| Industrials | 10.3 | |
| Consumer Discretionary | 10.1 | |
| Health Care | 9.0 | |
| Consumer Staples | 1.4 | |
| Materials | 1.1 | |
| Energy | 1.1 | |
| Utilities | 0.7 | |
| Real Estate | 0.2 | |
| |
| Common Stocks | 96.4 |
| Preferred Stocks | 1.5 |
| Preferred Securities | 0.0 |
| Short-Term Investments and Net Other Assets (Liabilities) | 2.1 |
ASSET ALLOCATION (% of Fund's net assets) |
|
| | Common Stocks - 96.4 |
| | Preferred Stocks - 1.5 |
| | Preferred Securities - 0.0 |
| | Short-Term Investments and Net Other Assets (Liabilities) - 2.1 |
| |
| United States | 94.1 |
| Canada | 2.1 |
| Israel | 0.6 |
| Congo Democratic Republic Of | 0.4 |
| Taiwan | 0.4 |
| Korea (South) | 0.3 |
| Brazil | 0.3 |
| United Kingdom | 0.3 |
| Switzerland | 0.2 |
| Others | 1.3 |
GEOGRAPHIC DIVERSIFICATION (% of Fund's net assets) |
|
| | United States - 94.1 |
| | Canada - 2.1 |
| | Israel - 0.6 |
| | Congo Democratic Republic Of - 0.4 |
| | Taiwan - 0.4 |
| | Korea (South) - 0.3 |
| | Brazil - 0.3 |
| | United Kingdom - 0.3 |
| | Switzerland - 0.2 |
| | Others - 1.3 |
| |
TOP HOLDINGS(% of Fund's net assets) | | |
| Meta Platforms Inc Class A | 13.2 | |
| NVIDIA Corp | 9.8 | |
| Berkshire Hathaway Inc Class A | 6.1 | |
| Amazon.com Inc | 5.7 | |
| Microsoft Corp | 4.5 | |
| Netflix Inc | 3.0 | |
| Apple Inc | 2.7 | |
| Eli Lilly & Co | 2.3 | |
| Alphabet Inc Class A | 2.2 | |
| Alphabet Inc Class C | 2.1 | |
| | 51.6 | |
| Fidelity, the Fidelity Investments Logo and all other Fidelity trademarks or service marks used herein are trademarks or service marks of FMR LLC. Any third-party marks that are used herein are trademarks or service marks of their respective owners. © 2025 FMR LLC. All rights reserved. |
| | For additional information about the Fund; including its prospectus, financial information, holdings and proxy information, scan the QR code or visit fundresearch.fidelity.com/prospectus/sec 1.9914351.100 2459-TSRA-0325 |
| |
| | ANNUAL SHAREHOLDER REPORT | AS OF DECEMBER 31, 2024 | This report describes changes to the Fund that occurred during the reporting period. |
| | Fidelity Advisor® New Insights Fund Fidelity Advisor® New Insights Fund Class I : FINSX |
| | | |
This annual shareholder report contains information about Fidelity Advisor® New Insights Fund for the period January 1, 2024 to December 31, 2024. You can find additional information about the Fund at fundresearch.fidelity.com/prospectus/sec. You can also request this information by contacting us at 1-877-208-0098 or by sending an e-mail to fidfunddocuments@fidelity.com.
What were your Fund costs for the last year?(based on hypothetical $10,000 investment)
FUND COST (PREVIOUS YEAR)
| | Costs of a $10,000 investment | Costs paid as a percentage of a $10,000 investment | |
| Class I | $ 76 | 0.65% | |
What affected the Fund's performance this period?
•U.S. equities gained in 2024, driven by a sturdy economy, the Federal Reserve's long-anticipated pivot to cutting interest rates and the potential for artificial intelligence to drive transformative change.
•Against this backdrop, security selection was the primary contributor to the fund's performance versus the S&P 500® index for the fiscal year, especially within industrials, where our stock picks in capital goods helped most. Security selection and an overweight in communication services, primarily within the media & entertainment industry, also boosted relative performance. Also helping our relative result were picks in information technology, especially within the semiconductors & semiconductor equipment industry.
•The top individual relative contributor was an overweight in Meta Platforms (+66%), the fund's largest holding. The second-largest relative contributor was an overweight in Nvidia (+171%). The company was among our largest holdings. A non-benchmark stake in Space Exploration Technologies also helped. The company was one of the fund's largest holdings at period end.
•In contrast, the biggest detractor from performance versus the benchmark was an underweight in information technology. Security selection in financials also hampered the fund's result. Also hurting was an overweight in industrials, primarily within the capital goods industry. Lastly, the fund's position in cash detracted.
•The biggest individual relative detractor was an underweight in Broadcom (+110%). A second notable relative detractor was an underweight in Tesla (+63%). An overweight in Regeneron Pharmaceuticals (-19%) also hurt. The stock was among our biggest holdings this period.
•Notable changes in positioning include decreased exposure to the health care sector and a higher allocation to industrials.
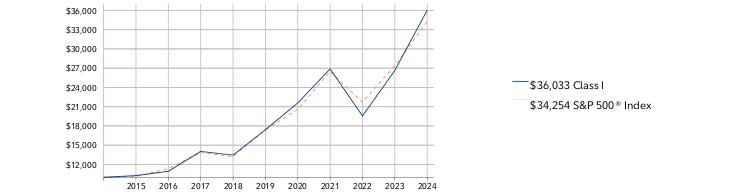
How did the Fund perform over the past 10 years?
CUMULATIVE PERFORMANCE
December 31, 2014 through December 31, 2024.
Initial investment of $10,000.
Class I | $10,000 | $10,264 | $10,937 | $14,032 | $13,451 | $17,409 | $21,581 | $26,894 | $19,557 | $26,648 | $36,033 |
S&P 500® Index | $10,000 | $10,138 | $11,351 | $13,829 | $13,223 | $17,386 | $20,585 | $26,494 | $21,696 | $27,399 | $34,254 |
| | 2014 | 2015 | 2016 | 2017 | 2018 | 2019 | 2020 | 2021 | 2022 | 2023 | 2024 |
AVERAGE ANNUAL TOTAL RETURNS:| | 1 Year | 5 Year | 10 Year |
| Class I | 35.22% | 15.66% | 13.68% |
| S&P 500® Index | 25.02% | 14.53% | 13.10% |
Visit institutional.fidelity.com for more recent performance information. |
The Fund's past performance is not a good predictor of the Fund's future performance. The graph and table do not reflect the deduction of taxes that a shareholder would pay on fund distributions or redemption of fund shares. |
Key Fund Statistics(as of December 31, 2024)
KEY FACTS | | |
| Fund Size | $21,798,939,502 | |
| Number of Holdings | 443 | |
| Total Advisory Fee | $125,752,187 | |
| Portfolio Turnover | 18% | |
What did the Fund invest in?
(as of December 31, 2024)
MARKET SECTORS (% of Fund's net assets) | | |
| Information Technology | 26.0 | |
| Communication Services | 21.4 | |
| Financials | 14.8 | |
| Industrials | 12.3 | |
| Consumer Discretionary | 11.4 | |
| Health Care | 8.3 | |
| Materials | 1.5 | |
| Energy | 1.5 | |
| Utilities | 1.2 | |
| Consumer Staples | 1.2 | |
| Real Estate | 0.0 | |
| |
| Common Stocks | 96.9 |
| Preferred Stocks | 2.7 |
| Preferred Securities | 0.0 |
| Short-Term Investments and Net Other Assets (Liabilities) | 0.4 |
ASSET ALLOCATION (% of Fund's net assets) |
|
| | Common Stocks - 96.9 |
| | Preferred Stocks - 2.7 |
| | Preferred Securities - 0.0 |
| | Short-Term Investments and Net Other Assets (Liabilities) - 0.4 |
| |
| United States | 92.9 |
| Canada | 1.9 |
| Taiwan | 0.7 |
| Netherlands | 0.6 |
| United Kingdom | 0.5 |
| China | 0.4 |
| Italy | 0.4 |
| Congo Democratic Republic Of | 0.4 |
| Korea (South) | 0.4 |
| Others | 1.8 |
GEOGRAPHIC DIVERSIFICATION (% of Fund's net assets) |
|
| | United States - 92.9 |
| | Canada - 1.9 |
| | Taiwan - 0.7 |
| | Netherlands - 0.6 |
| | United Kingdom - 0.5 |
| | China - 0.4 |
| | Italy - 0.4 |
| | Congo Democratic Republic Of - 0.4 |
| | Korea (South) - 0.4 |
| | Others - 1.8 |
| |
TOP HOLDINGS(% of Fund's net assets) | | |
| Meta Platforms Inc Class A | 11.7 | |
| NVIDIA Corp | 8.9 | |
| Microsoft Corp | 6.5 | |
| Alphabet Inc Class A | 6.1 | |
| Amazon.com Inc | 5.8 | |
| Berkshire Hathaway Inc Class A | 5.1 | |
| Apple Inc | 2.6 | |
| Netflix Inc | 2.6 | |
| Space Exploration Technologies Corp | 2.3 | |
| Eli Lilly & Co | 2.2 | |
| | 53.8 | |
How has the Fund changed?
This is a summary of certain changes to the Fund since January 1, 2024. For more complete information, you may review the Fund's next prospectus, which we expect to be available by March 1, 2025 at fundresearch.fidelity.com/prospectus/sec or upon request at 1-877-208-0098 or by sending an e-mail to fidfunddocuments@fidelity.com.
The fees associated with this class changed during the reporting year. The variations in class fees are primarily the result of the following changes:- Management fee
- Operating expenses
- Performance adjustment fee
The fund's transfer agent and pricing & bookkeeping fees were changed to a fixed rate effective December 1, 2023. Effective March 1, 2024, the fund's management contract was amended to incorporate administrative services previously covered under separate services agreements (transfer agent and pricing & bookkeeping). The amended contract incorporates a basic fee rate that may vary by class (subject to a performance adjustment). The Adviser or an affiliate pays certain expenses of managing and operating the fund out of each class's management fee. | |
| Fidelity, the Fidelity Investments Logo and all other Fidelity trademarks or service marks used herein are trademarks or service marks of FMR LLC. Any third-party marks that are used herein are trademarks or service marks of their respective owners. © 2025 FMR LLC. All rights reserved. |
| | For additional information about the Fund; including its prospectus, financial information, holdings and proxy information, scan the QR code or visit fundresearch.fidelity.com/prospectus/sec 1.9914253.100 1281-TSRA-0325 |
| |
| | ANNUAL SHAREHOLDER REPORT | AS OF DECEMBER 31, 2024 | This report describes changes to the Fund that occurred during the reporting period. |
| | Fidelity Advisor® New Insights Fund Fidelity Advisor® New Insights Fund Class Z : FZANX |
| | | |
This annual shareholder report contains information about Fidelity Advisor® New Insights Fund for the period January 1, 2024 to December 31, 2024. You can find additional information about the Fund at fundresearch.fidelity.com/prospectus/sec. You can also request this information by contacting us at 1-877-208-0098 or by sending an e-mail to fidfunddocuments@fidelity.com.
What were your Fund costs for the last year?(based on hypothetical $10,000 investment)
FUND COST (PREVIOUS YEAR)
| | Costs of a $10,000 investment | Costs paid as a percentage of a $10,000 investment | |
| Class Z | $ 63 | 0.54% | |
What affected the Fund's performance this period?
•U.S. equities gained in 2024, driven by a sturdy economy, the Federal Reserve's long-anticipated pivot to cutting interest rates and the potential for artificial intelligence to drive transformative change.
•Against this backdrop, security selection was the primary contributor to the fund's performance versus the S&P 500® index for the fiscal year, especially within industrials, where our stock picks in capital goods helped most. Security selection and an overweight in communication services, primarily within the media & entertainment industry, also boosted relative performance. Also helping our relative result were picks in information technology, especially within the semiconductors & semiconductor equipment industry.
•The top individual relative contributor was an overweight in Meta Platforms (+66%), the fund's largest holding. The second-largest relative contributor was an overweight in Nvidia (+171%). The company was among our largest holdings. A non-benchmark stake in Space Exploration Technologies also helped. The company was one of the fund's largest holdings at period end.
•In contrast, the biggest detractor from performance versus the benchmark was an underweight in information technology. Security selection in financials also hampered the fund's result. Also hurting was an overweight in industrials, primarily within the capital goods industry. Lastly, the fund's position in cash detracted.
•The biggest individual relative detractor was an underweight in Broadcom (+110%). A second notable relative detractor was an underweight in Tesla (+63%). An overweight in Regeneron Pharmaceuticals (-19%) also hurt. The stock was among our biggest holdings this period.
•Notable changes in positioning include decreased exposure to the health care sector and a higher allocation to industrials.
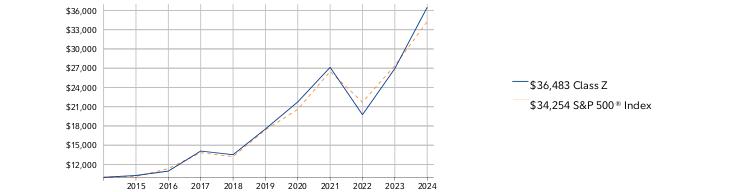
How did the Fund perform over the past 10 years?
CUMULATIVE PERFORMANCE
December 31, 2014 through December 31, 2024.
Initial investment of $10,000.
Class Z | $10,000 | $10,278 | $10,964 | $14,088 | $13,520 | $17,523 | $21,744 | $27,134 | $19,750 | $26,945 | $36,483 |
S&P 500® Index | $10,000 | $10,138 | $11,351 | $13,829 | $13,223 | $17,386 | $20,585 | $26,494 | $21,696 | $27,399 | $34,254 |
| | 2014 | 2015 | 2016 | 2017 | 2018 | 2019 | 2020 | 2021 | 2022 | 2023 | 2024 |
AVERAGE ANNUAL TOTAL RETURNS:| | 1 Year | 5 Year | 10 Year |
| Class Z | 35.40% | 15.80% | 13.82% |
| S&P 500® Index | 25.02% | 14.53% | 13.10% |
Visit institutional.fidelity.com for more recent performance information. |
The Fund's past performance is not a good predictor of the Fund's future performance. The graph and table do not reflect the deduction of taxes that a shareholder would pay on fund distributions or redemption of fund shares. |
Key Fund Statistics(as of December 31, 2024)
KEY FACTS | | |
| Fund Size | $21,798,939,502 | |
| Number of Holdings | 443 | |
| Total Advisory Fee | $125,752,187 | |
| Portfolio Turnover | 18% | |
What did the Fund invest in?
(as of December 31, 2024)
MARKET SECTORS (% of Fund's net assets) | | |
| Information Technology | 26.0 | |
| Communication Services | 21.4 | |
| Financials | 14.8 | |
| Industrials | 12.3 | |
| Consumer Discretionary | 11.4 | |
| Health Care | 8.3 | |
| Materials | 1.5 | |
| Energy | 1.5 | |
| Utilities | 1.2 | |
| Consumer Staples | 1.2 | |
| Real Estate | 0.0 | |
| |
| Common Stocks | 96.9 |
| Preferred Stocks | 2.7 |
| Preferred Securities | 0.0 |
| Short-Term Investments and Net Other Assets (Liabilities) | 0.4 |
ASSET ALLOCATION (% of Fund's net assets) |
|
| | Common Stocks - 96.9 |
| | Preferred Stocks - 2.7 |
| | Preferred Securities - 0.0 |
| | Short-Term Investments and Net Other Assets (Liabilities) - 0.4 |
| |
| United States | 92.9 |
| Canada | 1.9 |
| Taiwan | 0.7 |
| Netherlands | 0.6 |
| United Kingdom | 0.5 |
| China | 0.4 |
| Italy | 0.4 |
| Congo Democratic Republic Of | 0.4 |
| Korea (South) | 0.4 |
| Others | 1.8 |
GEOGRAPHIC DIVERSIFICATION (% of Fund's net assets) |
|
| | United States - 92.9 |
| | Canada - 1.9 |
| | Taiwan - 0.7 |
| | Netherlands - 0.6 |
| | United Kingdom - 0.5 |
| | China - 0.4 |
| | Italy - 0.4 |
| | Congo Democratic Republic Of - 0.4 |
| | Korea (South) - 0.4 |
| | Others - 1.8 |
| |
TOP HOLDINGS(% of Fund's net assets) | | |
| Meta Platforms Inc Class A | 11.7 | |
| NVIDIA Corp | 8.9 | |
| Microsoft Corp | 6.5 | |
| Alphabet Inc Class A | 6.1 | |
| Amazon.com Inc | 5.8 | |
| Berkshire Hathaway Inc Class A | 5.1 | |
| Apple Inc | 2.6 | |
| Netflix Inc | 2.6 | |
| Space Exploration Technologies Corp | 2.3 | |
| Eli Lilly & Co | 2.2 | |
| | 53.8 | |
How has the Fund changed?
This is a summary of certain changes to the Fund since January 1, 2024. For more complete information, you may review the Fund's next prospectus, which we expect to be available by March 1, 2025 at fundresearch.fidelity.com/prospectus/sec or upon request at 1-877-208-0098 or by sending an e-mail to fidfunddocuments@fidelity.com.
The fees associated with this class changed during the reporting year. The variations in class fees are primarily the result of the following changes:- Management fee
- Operating expenses
- Performance adjustment fee
The fund's transfer agent and pricing & bookkeeping fees were changed to a fixed rate effective December 1, 2023. Effective March 1, 2024, the fund's management contract was amended to incorporate administrative services previously covered under separate services agreements (transfer agent and pricing & bookkeeping). The amended contract incorporates a basic fee rate that may vary by class (subject to a performance adjustment). The Adviser or an affiliate pays certain expenses of managing and operating the fund out of each class's management fee. | |
| Fidelity, the Fidelity Investments Logo and all other Fidelity trademarks or service marks used herein are trademarks or service marks of FMR LLC. Any third-party marks that are used herein are trademarks or service marks of their respective owners. © 2025 FMR LLC. All rights reserved. |
| | For additional information about the Fund; including its prospectus, financial information, holdings and proxy information, scan the QR code or visit fundresearch.fidelity.com/prospectus/sec 1.9914254.100 2539-TSRA-0325 |
| |
| | ANNUAL SHAREHOLDER REPORT | AS OF DECEMBER 31, 2024 | This report describes changes to the Fund that occurred during the reporting period. |
| | Fidelity Advisor® New Insights Fund Fidelity Advisor® New Insights Fund Class M : FNITX |
| | | |
This annual shareholder report contains information about Fidelity Advisor® New Insights Fund for the period January 1, 2024 to December 31, 2024. You can find additional information about the Fund at fundresearch.fidelity.com/prospectus/sec. You can also request this information by contacting us at 1-877-208-0098 or by sending an e-mail to fidfunddocuments@fidelity.com.
What were your Fund costs for the last year?(based on hypothetical $10,000 investment)
FUND COST (PREVIOUS YEAR)
| | Costs of a $10,000 investment | Costs paid as a percentage of a $10,000 investment | |
| Class M | $ 135 | 1.15% | |
What affected the Fund's performance this period?
•U.S. equities gained in 2024, driven by a sturdy economy, the Federal Reserve's long-anticipated pivot to cutting interest rates and the potential for artificial intelligence to drive transformative change.
•Against this backdrop, security selection was the primary contributor to the fund's performance versus the S&P 500® index for the fiscal year, especially within industrials, where our stock picks in capital goods helped most. Security selection and an overweight in communication services, primarily within the media & entertainment industry, also boosted relative performance. Also helping our relative result were picks in information technology, especially within the semiconductors & semiconductor equipment industry.
•The top individual relative contributor was an overweight in Meta Platforms (+66%), the fund's largest holding. The second-largest relative contributor was an overweight in Nvidia (+171%). The company was among our largest holdings. A non-benchmark stake in Space Exploration Technologies also helped. The company was one of the fund's largest holdings at period end.
•In contrast, the biggest detractor from performance versus the benchmark was an underweight in information technology. Security selection in financials also hampered the fund's result. Also hurting was an overweight in industrials, primarily within the capital goods industry. Lastly, the fund's position in cash detracted.
•The biggest individual relative detractor was an underweight in Broadcom (+110%). A second notable relative detractor was an underweight in Tesla (+63%). An overweight in Regeneron Pharmaceuticals (-19%) also hurt. The stock was among our biggest holdings this period.
•Notable changes in positioning include decreased exposure to the health care sector and a higher allocation to industrials.
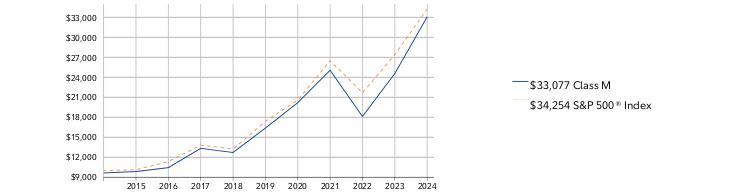
How did the Fund perform over the past 10 years?
CUMULATIVE PERFORMANCE
December 31, 2014 through December 31, 2024.
Initial investment of $10,000 and the current sales charge was paid.
Class M | $9,650 | $9,857 | $10,449 | $13,339 | $12,720 | $16,383 | $20,205 | $25,053 | $18,128 | $24,580 | $33,077 |
S&P 500® Index | $10,000 | $10,138 | $11,351 | $13,829 | $13,223 | $17,386 | $20,585 | $26,494 | $21,696 | $27,399 | $34,254 |
| | 2014 | 2015 | 2016 | 2017 | 2018 | 2019 | 2020 | 2021 | 2022 | 2023 | 2024 |
AVERAGE ANNUAL TOTAL RETURNS:| | 1 Year | 5 Year | 10 Year |
| Class M (incl. 3.50% sales charge) | 29.86% | 14.27% | 12.71% |
| Class M (without 3.50% sales charge) | 34.57% | 15.09% | 13.11% |
| S&P 500® Index | 25.02% | 14.53% | 13.10% |
Visit institutional.fidelity.com for more recent performance information. |
The Fund's past performance is not a good predictor of the Fund's future performance. The graph and table do not reflect the deduction of taxes that a shareholder would pay on fund distributions or redemption of fund shares. |
Key Fund Statistics(as of December 31, 2024)
KEY FACTS | | |
| Fund Size | $21,798,939,502 | |
| Number of Holdings | 443 | |
| Total Advisory Fee | $125,752,187 | |
| Portfolio Turnover | 18% | |
What did the Fund invest in?
(as of December 31, 2024)
MARKET SECTORS (% of Fund's net assets) | | |
| Information Technology | 26.0 | |
| Communication Services | 21.4 | |
| Financials | 14.8 | |
| Industrials | 12.3 | |
| Consumer Discretionary | 11.4 | |
| Health Care | 8.3 | |
| Materials | 1.5 | |
| Energy | 1.5 | |
| Utilities | 1.2 | |
| Consumer Staples | 1.2 | |
| Real Estate | 0.0 | |
| |
| Common Stocks | 96.9 |
| Preferred Stocks | 2.7 |
| Preferred Securities | 0.0 |
| Short-Term Investments and Net Other Assets (Liabilities) | 0.4 |
ASSET ALLOCATION (% of Fund's net assets) |
|
| | Common Stocks - 96.9 |
| | Preferred Stocks - 2.7 |
| | Preferred Securities - 0.0 |
| | Short-Term Investments and Net Other Assets (Liabilities) - 0.4 |
| |
| United States | 92.9 |
| Canada | 1.9 |
| Taiwan | 0.7 |
| Netherlands | 0.6 |
| United Kingdom | 0.5 |
| China | 0.4 |
| Italy | 0.4 |
| Congo Democratic Republic Of | 0.4 |
| Korea (South) | 0.4 |
| Others | 1.8 |
GEOGRAPHIC DIVERSIFICATION (% of Fund's net assets) |
|
| | United States - 92.9 |
| | Canada - 1.9 |
| | Taiwan - 0.7 |
| | Netherlands - 0.6 |
| | United Kingdom - 0.5 |
| | China - 0.4 |
| | Italy - 0.4 |
| | Congo Democratic Republic Of - 0.4 |
| | Korea (South) - 0.4 |
| | Others - 1.8 |
| |
TOP HOLDINGS(% of Fund's net assets) | | |
| Meta Platforms Inc Class A | 11.7 | |
| NVIDIA Corp | 8.9 | |
| Microsoft Corp | 6.5 | |
| Alphabet Inc Class A | 6.1 | |
| Amazon.com Inc | 5.8 | |
| Berkshire Hathaway Inc Class A | 5.1 | |
| Apple Inc | 2.6 | |
| Netflix Inc | 2.6 | |
| Space Exploration Technologies Corp | 2.3 | |
| Eli Lilly & Co | 2.2 | |
| | 53.8 | |
How has the Fund changed?
This is a summary of certain changes to the Fund since January 1, 2024. For more complete information, you may review the Fund's next prospectus, which we expect to be available by March 1, 2025 at fundresearch.fidelity.com/prospectus/sec or upon request at 1-877-208-0098 or by sending an e-mail to fidfunddocuments@fidelity.com.
The fees associated with this class changed during the reporting year. The variations in class fees are primarily the result of the following changes:- Management fee
- Operating expenses
- Performance adjustment fee
The fund's transfer agent and pricing & bookkeeping fees were changed to a fixed rate effective December 1, 2023. Effective March 1, 2024, the fund's management contract was amended to incorporate administrative services previously covered under separate services agreements (transfer agent and pricing & bookkeeping). The amended contract incorporates a basic fee rate that may vary by class (subject to a performance adjustment). The Adviser or an affiliate pays certain expenses of managing and operating the fund out of each class's management fee. | |
| Fidelity, the Fidelity Investments Logo and all other Fidelity trademarks or service marks used herein are trademarks or service marks of FMR LLC. Any third-party marks that are used herein are trademarks or service marks of their respective owners. © 2025 FMR LLC. All rights reserved. |
| | For additional information about the Fund; including its prospectus, financial information, holdings and proxy information, scan the QR code or visit fundresearch.fidelity.com/prospectus/sec 1.9914252.100 1280-TSRA-0325 |
| |
| | ANNUAL SHAREHOLDER REPORT | AS OF DECEMBER 31, 2024 | This report describes changes to the Fund that occurred during the reporting period. |
| | Fidelity® Contrafund® Fidelity® Contrafund® : FCNTX |
| | | |
This annual shareholder report contains information about Fidelity® Contrafund® for the period January 1, 2024 to December 31, 2024. You can find additional information about the Fund at fundresearch.fidelity.com/prospectus/sec. You can also request this information by contacting us at 1-800-544-8544 or by sending an e-mail to fidfunddocuments@fidelity.com.
What were your Fund costs for the last year?(based on hypothetical $10,000 investment)
FUND COST (PREVIOUS YEAR)
| | Costs of a $10,000 investment | Costs paid as a percentage of a $10,000 investment | |
| Fidelity® Contrafund® | $ 74 | 0.63% | |
What affected the Fund's performance this period?
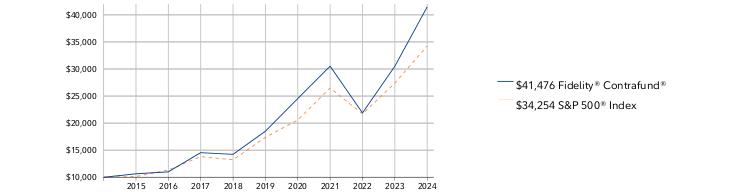
•U.S. equities gained in 2024, driven by a sturdy economy, the Federal Reserve's long-anticipated pivot to cutting interest rates and the potential for artificial intelligence to drive transformative change.
•Against this backdrop, security selection was the primary contributor to the fund's performance versus the S&P 500® index for the fiscal year, especially within communication services, where our picks in media & entertainment helped most. Picks in information technology, primarily within the semiconductors & semiconductor equipment industry, and industrials, primarily within the capital goods industry, also helped.
•The top individual relative contributor was an overweight in Meta Platforms (+66%), the fund's biggest holding. The second-largest relative contributor was an overweight in Nvidia (+171%). The company was among our largest holdings. An overweight in Netflix (+83%) also helped. The company was one of the fund's top holdings.
•In contrast, the biggest detractor from performance versus the benchmark was an underweight in information technology, primarily within the semiconductors & semiconductor equipment industry. Also hurting our result was security selection in financials. Lastly, the fund's position in cash detracted.
•The largest individual relative detractor was an overweight in Regeneron Pharmaceuticals (-19%). A second notable relative detractor was an underweight in Broadcom (+110%). An underweight in Tesla (+63%) also hurt.
•Notable changes in positioning include decreased exposure to the health care sector and a higher allocation to communication services.
How did the Fund perform over the past 10 years?
CUMULATIVE PERFORMANCE
December 31, 2014 through December 31, 2024.
Initial investment of $10,000.
Fidelity® Contrafund® | $10,000 | $10,646 | $11,004 | $14,549 | $14,239 | $18,509 | $24,539 | $30,517 | $21,892 | $30,503 | $41,476 |
S&P 500® Index | $10,000 | $10,138 | $11,351 | $13,829 | $13,223 | $17,386 | $20,585 | $26,494 | $21,696 | $27,399 | $34,254 |
| | 2014 | 2015 | 2016 | 2017 | 2018 | 2019 | 2020 | 2021 | 2022 | 2023 | 2024 |
AVERAGE ANNUAL TOTAL RETURNS:| | 1 Year | 5 Year | 10 Year |
| Fidelity® Contrafund® | 35.97% | 17.51% | 15.29% |
| S&P 500® Index | 25.02% | 14.53% | 13.10% |
Visit www.fidelity.com for more recent performance information. |
The Fund's past performance is not a good predictor of the Fund's future performance. The graph and table do not reflect the deduction of taxes that a shareholder would pay on fund distributions or redemption of fund shares. |
Key Fund Statistics(as of December 31, 2024)
KEY FACTS | | |
| Fund Size | $152,766,525,549 | |
| Number of Holdings | 389 | |
| Total Advisory Fee | $851,690,132 | |
| Portfolio Turnover | 18% | |
What did the Fund invest in?
(as of December 31, 2024)
MARKET SECTORS (% of Fund's net assets) | | |
| Information Technology | 24.4 | |
| Communication Services | 23.6 | |
| Financials | 18.0 | |
| Consumer Discretionary | 10.8 | |
| Health Care | 8.7 | |
| Industrials | 7.9 | |
| Consumer Staples | 1.7 | |
| Energy | 1.2 | |
| Materials | 1.0 | |
| Utilities | 0.7 | |
| Real Estate | 0.1 | |
| |
| Common Stocks | 96.3 |
| Preferred Stocks | 1.8 |
| Preferred Securities | 0.0 |
| Short-Term Investments and Net Other Assets (Liabilities) | 1.9 |
ASSET ALLOCATION (% of Fund's net assets) |
|
| | Common Stocks - 96.3 |
| | Preferred Stocks - 1.8 |
| | Preferred Securities - 0.0 |
| | Short-Term Investments and Net Other Assets (Liabilities) - 1.9 |
| |
| United States | 94.6 |
| Canada | 1.7 |
| Congo Democratic Republic Of | 0.5 |
| Taiwan | 0.4 |
| Switzerland | 0.4 |
| Israel | 0.3 |
| United Kingdom | 0.3 |
| Brazil | 0.3 |
| Netherlands | 0.3 |
| Others | 1.2 |
GEOGRAPHIC DIVERSIFICATION (% of Fund's net assets) |
|
| | United States - 94.6 |
| | Canada - 1.7 |
| | Congo Democratic Republic Of - 0.5 |
| | Taiwan - 0.4 |
| | Switzerland - 0.4 |
| | Israel - 0.3 |
| | United Kingdom - 0.3 |
| | Brazil - 0.3 |
| | Netherlands - 0.3 |
| | Others - 1.2 |
| |
TOP HOLDINGS(% of Fund's net assets) | | |
| Meta Platforms Inc Class A | 15.8 | |
| NVIDIA Corp | 8.5 | |
| Berkshire Hathaway Inc Class A | 8.4 | |
| Amazon.com Inc | 6.8 | |
| Microsoft Corp | 5.4 | |
| Apple Inc | 3.4 | |
| Eli Lilly & Co | 2.6 | |
| Alphabet Inc Class A | 2.5 | |
| Netflix Inc | 2.4 | |
| Alphabet Inc Class C | 2.0 | |
| | 57.8 | |
How has the Fund changed?
This is a summary of certain changes to the Fund since January 1, 2024. For more complete information, you may review the Fund's next prospectus, which we expect to be available by March 1, 2025 at fundresearch.fidelity.com/prospectus/sec or upon request at 1-800-544-8544 or by sending an e-mail to fidfunddocuments@fidelity.com.
The fees associated with this class changed during the reporting year. The variations in class fees are primarily the result of the following changes:- Management fee
- Performance adjustment fee
The fund's transfer agent and pricing & bookkeeping fees were changed to a fixed rate effective December 1, 2023. Effective March 1, 2024, the fund's management contract was amended to incorporate administrative services previously covered under separate services agreements (transfer agent and pricing & bookkeeping). The amended contract incorporates a basic fee rate that may vary by class (subject to a performance adjustment). The Adviser or an affiliate pays certain expenses of managing and operating the fund out of each class's management fee. | |
| Fidelity, the Fidelity Investments Logo and all other Fidelity trademarks or service marks used herein are trademarks or service marks of FMR LLC. Any third-party marks that are used herein are trademarks or service marks of their respective owners. © 2025 FMR LLC. All rights reserved. |
| | For additional information about the Fund; including its prospectus, financial information, holdings and proxy information, scan the QR code or visit fundresearch.fidelity.com/prospectus/sec 1.9914129.100 22-TSRA-0325 |
| |
| | ANNUAL SHAREHOLDER REPORT | AS OF DECEMBER 31, 2024 | |
| | Fidelity® Contrafund® K6 Fidelity® Contrafund® K6 : FLCNX |
| | | |
This annual shareholder report contains information about Fidelity® Contrafund® K6 for the period January 1, 2024 to December 31, 2024. You can find additional information about the Fund at fundresearch.fidelity.com/prospectus/sec. You can also request this information by contacting us at 1-800-835-5092 or by sending an e-mail to fidfunddocuments@fidelity.com.
What were your Fund costs for the last year?(based on hypothetical $10,000 investment)
FUND COST (PREVIOUS YEAR)
| | Costs of a $10,000 investment | Costs paid as a percentage of a $10,000 investment | |
| Fidelity® Contrafund® K6 | $ 53 | 0.45% | |
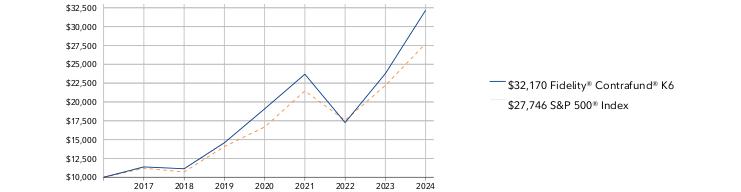
What affected the Fund's performance this period?
•U.S. equities gained in 2024, driven by a sturdy economy, the Federal Reserve's long-anticipated pivot to cutting interest rates and the potential for artificial intelligence to drive transformative change.
•Against this backdrop, security selection was the primary contributor to the fund's performance versus the S&P 500® index for the fiscal year, especially within communication services, where our stock picks in media & entertainment helped most. Picks in information technology, primarily within the semiconductors & semiconductor equipment industry, and industrials, primarily within the capital goods industry, also boosted relative performance.
•The top individual relative contributor was an overweight in Meta Platforms (+66%), the fund's largest holding. A second notable relative contributor was an overweight in Nvidia (+171%). The stock was one of the fund's largest holdings. An overweight in Netflix (+83%) also contributed. The company was one of our largest holdings.
•In contrast, the biggest detractor from performance versus the benchmark was an underweight in information technology, primarily within the semiconductors & semiconductor equipment industry. Also hurting our result was security selection in financials and energy. Lastly, the fund's position in cash detracted.
•The biggest individual relative detractor was an overweight in Regeneron Pharmaceuticals (-19%). A second notable relative detractor was an underweight in Tesla (+63%). An underweight in Broadcom (+110%) also detracted.
•Notable changes in positioning include decreased exposure to the health care sector and a higher allocation to communication services.
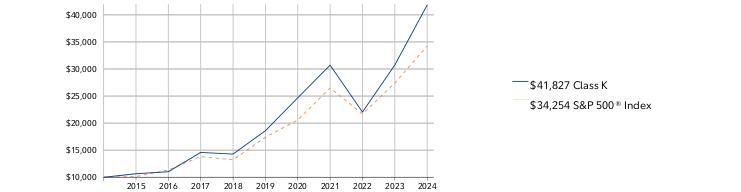
How did the Fund perform over the life of Fund?
CUMULATIVE PERFORMANCE
May 25, 2017 through December 31, 2024.
Initial investment of $10,000.
Fidelity® Contrafund® K6 | $10,000 | $11,377 | $11,132 | $14,584 | $19,080 | $23,685 | $17,262 | $23,764 |
S&P 500® Index | $10,000 | $11,202 | $10,710 | $14,083 | $16,674 | $21,460 | $17,574 | $22,193 |
| | 2017 | 2018 | 2019 | 2020 | 2021 | 2022 | 2023 | 2024 |
AVERAGE ANNUAL TOTAL RETURNS:| | 1 Year | 5 Year | Life of Fund A |
| Fidelity® Contrafund® K6 | 35.37% | 17.14% | 16.60% |
| S&P 500® Index | 25.02% | 14.53% | 14.35% |
A From May 25, 2017
Visit www.401k.com for more recent performance information. |
The Fund's past performance is not a good predictor of the Fund's future performance. The graph and table do not reflect the deduction of taxes that a shareholder would pay on fund distributions or redemption of fund shares. |
Key Fund Statistics(as of December 31, 2024)
KEY FACTS | | |
| Fund Size | $34,782,795,541 | |
| Number of Holdings | 383 | |
| Total Advisory Fee | $152,941,850 | |
| Portfolio Turnover | 19% | |
What did the Fund invest in?
(as of December 31, 2024)
MARKET SECTORS (% of Fund's net assets) | | |
| Information Technology | 26.2 | |
| Communication Services | 22.8 | |
| Financials | 17.8 | |
| Consumer Discretionary | 10.3 | |
| Health Care | 9.2 | |
| Industrials | 7.5 | |
| Consumer Staples | 1.8 | |
| Energy | 1.3 | |
| Materials | 1.1 | |
| Utilities | 0.8 | |
| Real Estate | 0.1 | |
| |
| Common Stocks | 97.8 |
| Preferred Stocks | 1.1 |
| Preferred Securities | 0.0 |
| Short-Term Investments and Net Other Assets (Liabilities) | 1.1 |
ASSET ALLOCATION (% of Fund's net assets) |
|
| | Common Stocks - 97.8 |
| | Preferred Stocks - 1.1 |
| | Preferred Securities - 0.0 |
| | Short-Term Investments and Net Other Assets (Liabilities) - 1.1 |
| |
| United States | 94.4 |
| Canada | 1.9 |
| Congo Democratic Republic Of | 0.5 |
| Taiwan | 0.4 |
| Israel | 0.3 |
| Switzerland | 0.3 |
| Brazil | 0.3 |
| United Kingdom | 0.3 |
| Netherlands | 0.3 |
| Others | 1.3 |
GEOGRAPHIC DIVERSIFICATION (% of Fund's net assets) |
|
| | United States - 94.4 |
| | Canada - 1.9 |
| | Congo Democratic Republic Of - 0.5 |
| | Taiwan - 0.4 |
| | Israel - 0.3 |
| | Switzerland - 0.3 |
| | Brazil - 0.3 |
| | United Kingdom - 0.3 |
| | Netherlands - 0.3 |
| | Others - 1.3 |
| |
TOP HOLDINGS(% of Fund's net assets) | | |
| Meta Platforms Inc Class A | 14.9 | |
| NVIDIA Corp | 9.5 | |
| Berkshire Hathaway Inc Class A | 7.7 | |
| Amazon.com Inc | 6.0 | |
| Microsoft Corp | 5.6 | |
| Apple Inc | 3.5 | |
| Eli Lilly & Co | 2.7 | |
| Alphabet Inc Class A | 2.5 | |
| Netflix Inc | 2.5 | |
| Alphabet Inc Class C | 2.0 | |
| | 56.9 | |
| Fidelity, the Fidelity Investments Logo and all other Fidelity trademarks or service marks used herein are trademarks or service marks of FMR LLC. Any third-party marks that are used herein are trademarks or service marks of their respective owners. © 2025 FMR LLC. All rights reserved. |
| | For additional information about the Fund; including its prospectus, financial information, holdings and proxy information, scan the QR code or visit fundresearch.fidelity.com/prospectus/sec 1.9914366.100 2946-TSRA-0325 |
| |
| | ANNUAL SHAREHOLDER REPORT | AS OF DECEMBER 31, 2024 | This report describes changes to the Fund that occurred during the reporting period. |
| | Fidelity® Contrafund® Fidelity® Contrafund® Class K : FCNKX |
| | | |
This annual shareholder report contains information about Fidelity® Contrafund® for the period January 1, 2024 to December 31, 2024. You can find additional information about the Fund at fundresearch.fidelity.com/prospectus/sec. You can also request this information by contacting us at 1-800-835-5092 or by sending an e-mail to fidfunddocuments@fidelity.com.
What were your Fund costs for the last year?(based on hypothetical $10,000 investment)
FUND COST (PREVIOUS YEAR)
| | Costs of a $10,000 investment | Costs paid as a percentage of a $10,000 investment | |
| Class K | $ 66 | 0.56% | |
What affected the Fund's performance this period?
•U.S. equities gained in 2024, driven by a sturdy economy, the Federal Reserve's long-anticipated pivot to cutting interest rates and the potential for artificial intelligence to drive transformative change.
•Against this backdrop, security selection was the primary contributor to the fund's performance versus the S&P 500® index for the fiscal year, especially within communication services, where our picks in media & entertainment helped most. Picks in information technology, primarily within the semiconductors & semiconductor equipment industry, and industrials, primarily within the capital goods industry, also helped.
•The top individual relative contributor was an overweight in Meta Platforms (+66%), the fund's biggest holding. The second-largest relative contributor was an overweight in Nvidia (+171%). The company was among our largest holdings. An overweight in Netflix (+83%) also helped. The company was one of the fund's top holdings.
•In contrast, the biggest detractor from performance versus the benchmark was an underweight in information technology, primarily within the semiconductors & semiconductor equipment industry. Also hurting our result was security selection in financials. Lastly, the fund's position in cash detracted.
•The largest individual relative detractor was an overweight in Regeneron Pharmaceuticals (-19%). A second notable relative detractor was an underweight in Broadcom (+110%). An underweight in Tesla (+63%) also hurt.
•Notable changes in positioning include decreased exposure to the health care sector and a higher allocation to communication services.
How did the Fund perform over the past 10 years?
CUMULATIVE PERFORMANCE
December 31, 2014 through December 31, 2024.
Initial investment of $10,000.
Class K | $10,000 | $10,655 | $11,026 | $14,592 | $14,290 | $18,601 | $24,681 | $30,709 | $22,043 | $30,743 | $41,827 |
S&P 500® Index | $10,000 | $10,138 | $11,351 | $13,829 | $13,223 | $17,386 | $20,585 | $26,494 | $21,696 | $27,399 | $34,254 |
| | 2014 | 2015 | 2016 | 2017 | 2018 | 2019 | 2020 | 2021 | 2022 | 2023 | 2024 |
AVERAGE ANNUAL TOTAL RETURNS:| | 1 Year | 5 Year | 10 Year |
| Class K | 36.05% | 17.59% | 15.38% |
| S&P 500® Index | 25.02% | 14.53% | 13.10% |
Visit www.401k.com for more recent performance information. |
The Fund's past performance is not a good predictor of the Fund's future performance. The graph and table do not reflect the deduction of taxes that a shareholder would pay on fund distributions or redemption of fund shares. |
Key Fund Statistics(as of December 31, 2024)
KEY FACTS | | |
| Fund Size | $152,766,525,549 | |
| Number of Holdings | 389 | |
| Total Advisory Fee | $851,690,132 | |
| Portfolio Turnover | 18% | |
What did the Fund invest in?
(as of December 31, 2024)
MARKET SECTORS (% of Fund's net assets) | | |
| Information Technology | 24.4 | |
| Communication Services | 23.6 | |
| Financials | 18.0 | |
| Consumer Discretionary | 10.8 | |
| Health Care | 8.7 | |
| Industrials | 7.9 | |
| Consumer Staples | 1.7 | |
| Energy | 1.2 | |
| Materials | 1.0 | |
| Utilities | 0.7 | |
| Real Estate | 0.1 | |
| |
| Common Stocks | 96.3 |
| Preferred Stocks | 1.8 |
| Preferred Securities | 0.0 |
| Short-Term Investments and Net Other Assets (Liabilities) | 1.9 |
ASSET ALLOCATION (% of Fund's net assets) |
|
| | Common Stocks - 96.3 |
| | Preferred Stocks - 1.8 |
| | Preferred Securities - 0.0 |
| | Short-Term Investments and Net Other Assets (Liabilities) - 1.9 |
| |
| United States | 94.6 |
| Canada | 1.7 |
| Congo Democratic Republic Of | 0.5 |
| Taiwan | 0.4 |
| Switzerland | 0.4 |
| Israel | 0.3 |
| United Kingdom | 0.3 |
| Brazil | 0.3 |
| Netherlands | 0.3 |
| Others | 1.2 |
GEOGRAPHIC DIVERSIFICATION (% of Fund's net assets) |
|
| | United States - 94.6 |
| | Canada - 1.7 |
| | Congo Democratic Republic Of - 0.5 |
| | Taiwan - 0.4 |
| | Switzerland - 0.4 |
| | Israel - 0.3 |
| | United Kingdom - 0.3 |
| | Brazil - 0.3 |
| | Netherlands - 0.3 |
| | Others - 1.2 |
| |
TOP HOLDINGS(% of Fund's net assets) | | |
| Meta Platforms Inc Class A | 15.8 | |
| NVIDIA Corp | 8.5 | |
| Berkshire Hathaway Inc Class A | 8.4 | |
| Amazon.com Inc | 6.8 | |
| Microsoft Corp | 5.4 | |
| Apple Inc | 3.4 | |
| Eli Lilly & Co | 2.6 | |
| Alphabet Inc Class A | 2.5 | |
| Netflix Inc | 2.4 | |
| Alphabet Inc Class C | 2.0 | |
| | 57.8 | |
How has the Fund changed?
This is a summary of certain changes to the Fund since January 1, 2024. For more complete information, you may review the Fund's next prospectus, which we expect to be available by March 1, 2025 at fundresearch.fidelity.com/prospectus/sec or upon request at 1-800-835-5092 or by sending an e-mail to fidfunddocuments@fidelity.com.
The fees associated with this class changed during the reporting year. The variations in class fees are primarily the result of the following changes:- Management fee
- Performance adjustment fee
The fund's transfer agent and pricing & bookkeeping fees were changed to a fixed rate effective December 1, 2023. Effective March 1, 2024, the fund's management contract was amended to incorporate administrative services previously covered under separate services agreements (transfer agent and pricing & bookkeeping). The amended contract incorporates a basic fee rate that may vary by class (subject to a performance adjustment). The Adviser or an affiliate pays certain expenses of managing and operating the fund out of each class's management fee. | |
| Fidelity, the Fidelity Investments Logo and all other Fidelity trademarks or service marks used herein are trademarks or service marks of FMR LLC. Any third-party marks that are used herein are trademarks or service marks of their respective owners. © 2025 FMR LLC. All rights reserved. |
| | For additional information about the Fund; including its prospectus, financial information, holdings and proxy information, scan the QR code or visit fundresearch.fidelity.com/prospectus/sec 1.9914128.100 2080-TSRA-0325 |
| |
| | ANNUAL SHAREHOLDER REPORT | AS OF DECEMBER 31, 2024 | This report describes changes to the Fund that occurred during the reporting period. |
| | Fidelity Advisor® New Insights Fund Fidelity Advisor® New Insights Fund Class A : FNIAX |
| | | |
This annual shareholder report contains information about Fidelity Advisor® New Insights Fund for the period January 1, 2024 to December 31, 2024. You can find additional information about the Fund at fundresearch.fidelity.com/prospectus/sec. You can also request this information by contacting us at 1-877-208-0098 or by sending an e-mail to fidfunddocuments@fidelity.com.
What were your Fund costs for the last year?(based on hypothetical $10,000 investment)
FUND COST (PREVIOUS YEAR)
| | Costs of a $10,000 investment | Costs paid as a percentage of a $10,000 investment | |
| Class A | $ 106 | 0.90% | |
What affected the Fund's performance this period?
•U.S. equities gained in 2024, driven by a sturdy economy, the Federal Reserve's long-anticipated pivot to cutting interest rates and the potential for artificial intelligence to drive transformative change.
•Against this backdrop, security selection was the primary contributor to the fund's performance versus the S&P 500® index for the fiscal year, especially within industrials, where our stock picks in capital goods helped most. Security selection and an overweight in communication services, primarily within the media & entertainment industry, also boosted relative performance. Also helping our relative result were picks in information technology, especially within the semiconductors & semiconductor equipment industry.
•The top individual relative contributor was an overweight in Meta Platforms (+66%), the fund's largest holding. The second-largest relative contributor was an overweight in Nvidia (+171%). The company was among our largest holdings. A non-benchmark stake in Space Exploration Technologies also helped. The company was one of the fund's largest holdings at period end.
•In contrast, the biggest detractor from performance versus the benchmark was an underweight in information technology. Security selection in financials also hampered the fund's result. Also hurting was an overweight in industrials, primarily within the capital goods industry. Lastly, the fund's position in cash detracted.
•The biggest individual relative detractor was an underweight in Broadcom (+110%). A second notable relative detractor was an underweight in Tesla (+63%). An overweight in Regeneron Pharmaceuticals (-19%) also hurt. The stock was among our biggest holdings this period.
•Notable changes in positioning include decreased exposure to the health care sector and a higher allocation to industrials.
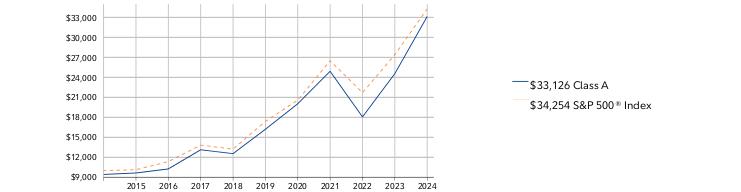
How did the Fund perform over the past 10 years?
CUMULATIVE PERFORMANCE
December 31, 2014 through December 31, 2024.
Initial investment of $10,000 and the current sales charge was paid.
Class A | $9,425 | $9,650 | $10,258 | $13,129 | $12,548 | $16,206 | $20,036 | $24,906 | $18,062 | $24,555 | $33,126 |
S&P 500® Index | $10,000 | $10,138 | $11,351 | $13,829 | $13,223 | $17,386 | $20,585 | $26,494 | $21,696 | $27,399 | $34,254 |
| | 2014 | 2015 | 2016 | 2017 | 2018 | 2019 | 2020 | 2021 | 2022 | 2023 | 2024 |
AVERAGE ANNUAL TOTAL RETURNS:| | 1 Year | 5 Year | 10 Year |
| Class A (incl. 5.75% sales charge) | 27.15% | 14.01% | 12.72% |
| Class A (without 5.75% sales charge) | 34.91% | 15.37% | 13.39% |
| S&P 500® Index | 25.02% | 14.53% | 13.10% |
Visit institutional.fidelity.com for more recent performance information. |
The Fund's past performance is not a good predictor of the Fund's future performance. The graph and table do not reflect the deduction of taxes that a shareholder would pay on fund distributions or redemption of fund shares. |
Key Fund Statistics(as of December 31, 2024)
KEY FACTS | | |
| Fund Size | $21,798,939,502 | |
| Number of Holdings | 443 | |
| Total Advisory Fee | $125,752,187 | |
| Portfolio Turnover | 18% | |
What did the Fund invest in?
(as of December 31, 2024)
MARKET SECTORS (% of Fund's net assets) | | |
| Information Technology | 26.0 | |
| Communication Services | 21.4 | |
| Financials | 14.8 | |
| Industrials | 12.3 | |
| Consumer Discretionary | 11.4 | |
| Health Care | 8.3 | |
| Materials | 1.5 | |
| Energy | 1.5 | |
| Utilities | 1.2 | |
| Consumer Staples | 1.2 | |
| Real Estate | 0.0 | |
| |
| Common Stocks | 96.9 |
| Preferred Stocks | 2.7 |
| Preferred Securities | 0.0 |
| Short-Term Investments and Net Other Assets (Liabilities) | 0.4 |
ASSET ALLOCATION (% of Fund's net assets) |
|
| | Common Stocks - 96.9 |
| | Preferred Stocks - 2.7 |
| | Preferred Securities - 0.0 |
| | Short-Term Investments and Net Other Assets (Liabilities) - 0.4 |
| |
| United States | 92.9 |
| Canada | 1.9 |
| Taiwan | 0.7 |
| Netherlands | 0.6 |
| United Kingdom | 0.5 |
| China | 0.4 |
| Italy | 0.4 |
| Congo Democratic Republic Of | 0.4 |
| Korea (South) | 0.4 |
| Others | 1.8 |
GEOGRAPHIC DIVERSIFICATION (% of Fund's net assets) |
|
| | United States - 92.9 |
| | Canada - 1.9 |
| | Taiwan - 0.7 |
| | Netherlands - 0.6 |
| | United Kingdom - 0.5 |
| | China - 0.4 |
| | Italy - 0.4 |
| | Congo Democratic Republic Of - 0.4 |
| | Korea (South) - 0.4 |
| | Others - 1.8 |
| |
TOP HOLDINGS(% of Fund's net assets) | | |
| Meta Platforms Inc Class A | 11.7 | |
| NVIDIA Corp | 8.9 | |
| Microsoft Corp | 6.5 | |
| Alphabet Inc Class A | 6.1 | |
| Amazon.com Inc | 5.8 | |
| Berkshire Hathaway Inc Class A | 5.1 | |
| Apple Inc | 2.6 | |
| Netflix Inc | 2.6 | |
| Space Exploration Technologies Corp | 2.3 | |
| Eli Lilly & Co | 2.2 | |
| | 53.8 | |
How has the Fund changed?
This is a summary of certain changes to the Fund since January 1, 2024. For more complete information, you may review the Fund's next prospectus, which we expect to be available by March 1, 2025 at fundresearch.fidelity.com/prospectus/sec or upon request at 1-877-208-0098 or by sending an e-mail to fidfunddocuments@fidelity.com.
The fees associated with this class changed during the reporting year. The variations in class fees are primarily the result of the following changes:- Management fee
- Operating expenses
- Performance adjustment fee
The fund's transfer agent and pricing & bookkeeping fees were changed to a fixed rate effective December 1, 2023. Effective March 1, 2024, the fund's management contract was amended to incorporate administrative services previously covered under separate services agreements (transfer agent and pricing & bookkeeping). The amended contract incorporates a basic fee rate that may vary by class (subject to a performance adjustment). The Adviser or an affiliate pays certain expenses of managing and operating the fund out of each class's management fee. | |
| Fidelity, the Fidelity Investments Logo and all other Fidelity trademarks or service marks used herein are trademarks or service marks of FMR LLC. Any third-party marks that are used herein are trademarks or service marks of their respective owners. © 2025 FMR LLC. All rights reserved. |
| | For additional information about the Fund; including its prospectus, financial information, holdings and proxy information, scan the QR code or visit fundresearch.fidelity.com/prospectus/sec 1.9914250.100 1277-TSRA-0325 |
Item 2.
Code of Ethics
As of the end of the period, December 31, 2024, Fidelity Contrafund (the trust) has adopted a code of ethics, as defined in Item 2 of Form N-CSR, that applies to its President and Treasurer and its Chief Financial Officer. A copy of the code of ethics is filed as an exhibit to this Form N-CSR.
Item 3.
Audit Committee Financial Expert
The Board of Trustees of the trust has determined that Donald F. Donahue is an audit committee financial expert, as defined in Item 3 of Form N-CSR. Mr. Donahue is independent for purposes of Item 3 of Form N-CSR.
Item 4.
Principal Accountant Fees and Services
Fees and Services
The following table presents fees billed by PricewaterhouseCoopers LLP (“PwC”) in each of the last two fiscal years for services rendered to Fidelity Advisor New Insights Fund, Fidelity Contrafund, Fidelity Contrafund K6 and Fidelity Series Opportunistic Insights Fund (the “Funds”):
Services Billed by PwC
December 31, 2024 FeesA
| | | | |
| Audit Fees | Audit-Related Fees | Tax Fees | All Other Fees |
Fidelity Advisor New Insights Fund | $72,400 | $6,700 | $14,800 | $2,300 |
Fidelity Contrafund | $120,000 | $7,900 | $17,200 | $2,700 |
Fidelity Contrafund K6 | $99,500 | $5,900 | $28,900 | $2,100 |
Fidelity Series Opportunistic Insights Fund | $68,100 | $6,300 | $12,900 | $2,200 |
|
|
|
|
|
| | | | |
| Audit Fees | Audit-Related Fees | Tax Fees | All Other Fees |
Fidelity Advisor New Insights Fund | $76,000 | $6,600 | $24,900 | $2,200 |
Fidelity Contrafund | $127,600 | $7,700 | $54,600 | $2,600 |
Fidelity Contrafund K6 | $109,400 | $6,200 | $36,800 | $2,100 |
Fidelity Series Opportunistic Insights Fund | $69,200 | $6,200 | $12,900 | $2,100 |
|
|
|
|
|
|
|
|
|
|
A Amounts may reflect rounding.
The following table(s) present(s) fees billed by PwC that were required to be approved by the Audit Committee for services that relate directly to the operations and financial reporting of the Fund(s) and that are rendered on behalf of Fidelity Management & Research Company LLC ("FMR") and entities controlling, controlled by, or under common control with FMR (not including any sub-adviser whose role is primarily portfolio management and is subcontracted with or overseen by another investment adviser) that provide ongoing services to the Fund(s) (“Fund Service Providers”):
Services Billed by PwC
| | |
| December 31, 2024A | December 31, 2023A |
Audit-Related Fees | $9,701,800 | $8,881,200 |
Tax Fees | $61,000 | $1,000 |
All Other Fees | $35,000 | $- |
A Amounts may reflect rounding.
“Audit-Related Fees” represent fees billed for assurance and related services that are reasonably related to the performance of the fund audit or the review of the fund's financial statements and that are not reported under Audit Fees.
“Tax Fees” represent fees billed for tax compliance, tax advice or tax planning that relate directly to the operations and financial reporting of the fund.
“All Other Fees” represent fees billed for services provided to the fund or Fund Service Provider, a significant portion of which are assurance related, that relate directly to the operations and financial reporting of the fund, excluding those services that are reported under Audit Fees, Audit-Related Fees or Tax Fees.
Assurance services must be performed by an independent public accountant.
* * *
The aggregate non-audit fees billed by PwC for services rendered to the Fund(s), FMR (not including any sub-adviser whose role is primarily portfolio management and is subcontracted with or overseen by another investment adviser), and any Fund Service Provider for each of the last two fiscal years of the Fund(s) are as follows:
| | |
Billed By | December 31, 2024A | December 31, 2023A |
PwC | $15,401,000 | $14,501,200 |
A Amounts may reflect rounding.
The trust's Audit Committee has considered non-audit services that were not pre-approved that were provided by PwC to Fund Service Providers to be compatible with maintaining the independence of PwC in its(their) audit of the Fund(s), taking into account representations from PwC, in accordance with Public Company Accounting Oversight Board rules, regarding its independence from the Fund(s) and its(their) related entities and FMR’s review of the appropriateness and permissibility under applicable law of such non-audit services prior to their provision to the Fund(s) Service Providers.
Audit Committee Pre-Approval Policies and Procedures
The trust’s Audit Committee must pre-approve all audit and non-audit services provided by a fund’s independent registered public accounting firm relating to the operations or financial reporting of the fund. Prior to the commencement of any audit or non-audit services to a fund, the Audit Committee reviews the services to determine whether they are appropriate and permissible under applicable law.
The Audit Committee has adopted policies and procedures to, among other purposes, provide a framework for the Committee’s consideration of non-audit services by the audit firms that audit the Fidelity funds. The policies and procedures require that any non-audit service provided by a fund audit firm to a Fidelity fund and any non-audit service provided by a fund auditor to a Fund Service Provider that relates directly to the operations and financial reporting of a Fidelity fund (“Covered Service”) are subject to approval by the Audit Committee before such service is provided.
All Covered Services must be approved in advance of provision of the service either: (i) by formal resolution of the Audit Committee, or (ii) by oral or written approval of the service by the Chair of the Audit Committee (or if the Chair is unavailable, such other member of the Audit Committee as may be designated by the Chair to act in the Chair’s absence). The approval contemplated by (ii) above is permitted where the Treasurer determines that action on such an engagement is necessary before the next meeting of the Audit Committee.
Non-audit services provided by a fund audit firm to a Fund Service Provider that do not relate directly to the operations and financial reporting of a Fidelity fund are reported to the Audit Committee periodically.
Non-Audit Services Approved Pursuant to Rule 2-01(c)(7)(i)(C) and (ii) of Regulation S-X (“De Minimis Exception”)
There were no non-audit services approved or required to be approved by the Audit Committee pursuant to the De Minimis Exception during the Fund’s(s’) last two fiscal years relating to services provided to (i) the Fund(s) or (ii) any Fund Service Provider that relate directly to the operations and financial reporting of the Fund(s).
The Registrant has not retained, for the preparation of the audit report on the financial statements included in the Form N-CSR, a registered public accounting firm that has a branch or office that is located in a foreign jurisdiction and that the Public Company Accounting Oversight Board (the “PCAOB”) has determined that the PCAOB is unable to inspect or investigate completely because of a position taken by an authority in the foreign jurisdiction.
The Registrant is not a “foreign issuer,” as defined in 17 CFR 240.3b-4.
Item 5.
Audit Committee of Listed Registrants
Not applicable.
Item 6.
Investments
(a)
Not applicable.
(b)
Not applicable.
Item 7.
Financial Statements and Financial Highlights for Open-End Management Investment Companies
Fidelity Advisor® New Insights Fund
Annual Report
December 31, 2024
Contents
To view a fund's proxy voting guidelines and proxy voting record for the 12-month period ended June 30, visit http://www.fidelity.com/proxyvotingresults or visit the Securities and Exchange Commission's (SEC) web site at http://www.sec.gov.
You may also call 1-877-208-0098 to request a free copy of the proxy voting guidelines.
Standard & Poor's, S&P and S&P 500 are registered service marks of The McGraw-Hill Companies, Inc. and have been licensed for use by Fidelity Distributors Corporation.
Other third-party marks appearing herein are the property of their respective owners.
All other marks appearing herein are registered or unregistered trademarks or service marks of FMR LLC or an affiliated company. © 2025 FMR LLC. All rights reserved.
This report and the financial statements contained herein are submitted for the general information of the shareholders of the Fund. This report is not authorized for distribution to prospective investors in the Fund unless preceded or accompanied by an effective prospectus.
A fund files its complete schedule of portfolio holdings with the SEC for the first and third quarters of each fiscal year on Form N-PORT. Forms N-PORT are available on the SEC's web site at http://www.sec.gov. A fund's Forms N-PORT may be reviewed and copied at the SEC's Public Reference Room in Washington, DC. Information regarding the operation of the SEC's Public Reference Room may be obtained by calling 1-800-SEC-0330.
For a complete list of a fund's portfolio holdings, view the most recent holdings listing, semiannual report, or annual report on Fidelity's web site at http://www.fidelity.com, http://www.institutional.fidelity.com, or http://www.401k.com, as applicable.
NOT FDIC INSURED •MAY LOSE VALUE •NO BANK GUARANTEE
Neither the Fund nor Fidelity Distributors Corporation is a bank.
Item 7: Consolidated Financial Statements and Consolidated Financial Highlights for Open-End Management Investment Companies (Annual Report)
Fidelity Advisor® New Insights Fund
Consolidated Schedule of Investments December 31, 2024
Showing Percentage of Net Assets
| Common Stocks - 96.9% |
| | | Shares | Value ($) |
| AUSTRALIA - 0.1% | | | |
| Industrials - 0.0% | | | |
| Commercial Services & Supplies - 0.0% | | | |
| Clean TeQ Water Ltd (b) | | 3,189 | 641 |
| Information Technology - 0.1% | | | |
| Software - 0.1% | | | |
| Canva Inc Class A (c)(d) | | 11,950 | 15,297,076 |
| TOTAL AUSTRALIA | | | 15,297,717 |
| BELGIUM - 0.1% | | | |
| Health Care - 0.1% | | | |
| Pharmaceuticals - 0.1% | | | |
| UCB SA | | 134,367 | 26,751,176 |
| BRAZIL - 0.3% | | | |
| Consumer Discretionary - 0.1% | | | |
| Broadline Retail - 0.1% | | | |
| MercadoLibre Inc (b) | | 12,600 | 21,425,544 |
| Financials - 0.1% | | | |
| Banks - 0.1% | | | |
| NU Holdings Ltd/Cayman Islands Class A (b) | | 1,742,566 | 18,052,984 |
| Materials - 0.1% | | | |
| Metals & Mining - 0.1% | | | |
| Wheaton Precious Metals Corp | | 467,900 | 26,336,769 |
| TOTAL BRAZIL | | | 65,815,297 |
| CANADA - 1.9% | | | |
| Communication Services - 0.0% | | | |
| Entertainment - 0.0% | | | |
| Lionsgate Studios Corp | | 192,194 | 1,460,673 |
| Consumer Discretionary - 0.0% | | | |
| Broadline Retail - 0.0% | | | |
| Dollarama Inc | | 64,872 | 6,330,825 |
| Consumer Staples - 0.1% | | | |
| Consumer Staples Distribution & Retail - 0.1% | | | |
| Alimentation Couche-Tard Inc | | 275,300 | 15,267,951 |
| Energy - 0.4% | | | |
| Oil, Gas & Consumable Fuels - 0.4% | | | |
| ARC Resources Ltd | | 66,500 | 1,206,063 |
| Cameco Corp (United States) | | 439,500 | 22,585,905 |
| Canadian Natural Resources Ltd | | 1,741,776 | 53,775,797 |
| Cenovus Energy Inc (United States) | | 687,700 | 10,418,655 |
| GoviEx Uranium Inc (b) | | 642,355 | 22,344 |
| GoviEx Uranium Inc (b)(e) | | 23,200 | 806 |
| GoviEx Uranium Inc Class A (b)(e) | | 2,625,135 | 91,312 |
| PrairieSky Royalty Ltd | | 40,000 | 779,992 |
| Suncor Energy Inc | | 30,600 | 1,092,272 |
| | | | 89,973,146 |
| Financials - 0.7% | | | |
| Banks - 0.1% | | | |
| Royal Bank of Canada | | 170,160 | 20,516,979 |
| Capital Markets - 0.1% | | | |
| Brookfield Asset Management Ltd Class A | | 5,622 | 304,909 |
| Brookfield Asset Management Ltd Class A (United States) | | 286,200 | 15,509,178 |
| Brookfield Corp Class A | | 37,400 | 2,149,631 |
| | | | 17,963,718 |
| Insurance - 0.5% | | | |
| Fairfax Financial Holdings Ltd Subordinate Voting Shares | | 51,267 | 71,330,482 |
| Intact Financial Corp | | 166,212 | 30,263,777 |
| | | | 101,594,259 |
| Health Care - 0.0% | | | |
| Biotechnology - 0.0% | | | |
| Xenon Pharmaceuticals Inc (b) | | 78,500 | 3,077,200 |
| Health Care Equipment & Supplies - 0.0% | | | |
| I-Pulse Inc (b)(c)(d) | | 58,562 | 122,395 |
| I-Pulse Inc (c) | | 58,562 | 82,572 |
| | | | 204,967 |
TOTAL HEALTH CARE | | | 3,282,167 |
| | | | |
| Industrials - 0.2% | | | |
| Commercial Services & Supplies - 0.0% | | | |
| RB Global Inc (United States) | | 47,700 | 4,303,017 |
| Ground Transportation - 0.2% | | | |
| Canadian Pacific Kansas City Ltd | | 295,864 | 21,422,328 |
| Professional Services - 0.0% | | | |
| Thomson Reuters Corp | | 62,498 | 10,035,680 |
TOTAL INDUSTRIALS | | | 35,761,025 |
| | | | |
| Information Technology - 0.2% | | | |
| Electronic Equipment, Instruments & Components - 0.0% | | | |
| Celestica Inc Subordinate Voting Shares (b) | | 70,795 | 6,533,559 |
| IT Services - 0.2% | | | |
| Shopify Inc Class A (b) | | 365,008 | 38,848,360 |
| Software - 0.0% | | | |
| Constellation Software Inc/Canada | | 500 | 1,546,109 |
TOTAL INFORMATION TECHNOLOGY | | | 46,928,028 |
| | | | |
| Materials - 0.3% | | | |
| Metals & Mining - 0.3% | | | |
| Agnico Eagle Mines Ltd/CA | | 51,700 | 4,044,789 |
| Alamos Gold Inc Class A | | 68,300 | 1,260,090 |
| B2Gold Corp | | 7,869,379 | 19,270,384 |
| Franco-Nevada Corp | | 247,536 | 29,088,860 |
| Lundin Gold Inc | | 304,153 | 6,487,412 |
| Novagold Resources Inc (b) | | 635,992 | 2,128,159 |
| Orla Mining Ltd (b) | | 2,103,703 | 11,649,432 |
| | | | 73,929,126 |
| TOTAL CANADA | | | 413,007,897 |
| CHINA - 0.3% | | | |
| Consumer Discretionary - 0.1% | | | |
| Automobiles - 0.0% | | | |
| BYD Co Ltd H Shares | | 222,000 | 7,550,915 |
| Broadline Retail - 0.1% | | | |
| PDD Holdings Inc Class A ADR (b) | | 85,300 | 8,273,247 |
| Hotels, Restaurants & Leisure - 0.0% | | | |
| Meituan B Shares (b)(e)(f) | | 94,600 | 1,839,343 |
| Textiles, Apparel & Luxury Goods - 0.0% | | | |
| China Hongxing Sports Ltd (b)(c) | | 5,977,800 | 43 |
TOTAL CONSUMER DISCRETIONARY | | | 17,663,548 |
| | | | |
| Health Care - 0.0% | | | |
| Biotechnology - 0.0% | | | |
| Zai Lab Ltd ADR (b) | | 53,500 | 1,401,165 |
| Information Technology - 0.2% | | | |
| Semiconductors & Semiconductor Equipment - 0.2% | | | |
| NXP Semiconductors NV | | 192,413 | 39,993,043 |
| TOTAL CHINA | | | 59,057,756 |
| CONGO DEMOCRATIC REPUBLIC OF - 0.4% | | | |
| Materials - 0.4% | | | |
| Metals & Mining - 0.4% | | | |
| Ivanhoe Mine Ltd Class A (b)(g) | | 7,130,418 | 84,625,504 |
| DENMARK - 0.0% | | | |
| Health Care - 0.0% | | | |
| Biotechnology - 0.0% | | | |
| Ascendis Pharma A/S ADR (b) | | 29,200 | 4,019,964 |
| FINLAND - 0.0% | | | |
| Consumer Discretionary - 0.0% | | | |
| Textiles, Apparel & Luxury Goods - 0.0% | | | |
| Amer Sports Inc | | 376,100 | 10,515,756 |
| FRANCE - 0.1% | | | |
| Health Care - 0.1% | | | |
| Health Care Equipment & Supplies - 0.1% | | | |
| EssilorLuxottica SA | | 50,843 | 12,408,044 |
| GERMANY - 0.1% | | | |
| Consumer Discretionary - 0.1% | | | |
| Textiles, Apparel & Luxury Goods - 0.1% | | | |
| adidas AG | | 45,100 | 11,062,547 |
| Birkenstock Holding Plc (b) | | 25,200 | 1,427,832 |
| | | | |
| TOTAL GERMANY | | | 12,490,379 |
| INDIA - 0.2% | | | |
| Consumer Discretionary - 0.0% | | | |
| Hotels, Restaurants & Leisure - 0.0% | | | |
| Zomato Ltd (b) | | 2,766,561 | 8,988,418 |
| Energy - 0.0% | | | |
| Oil, Gas & Consumable Fuels - 0.0% | | | |
| Reliance Industries Ltd | | 448,400 | 6,368,290 |
| Financials - 0.2% | | | |
| Banks - 0.2% | | | |
| HDFC Bank Ltd/Gandhinagar ADR | | 565,571 | 36,117,364 |
| Industrials - 0.0% | | | |
| Air Freight & Logistics - 0.0% | | | |
| Delhivery Ltd (b) | | 444,255 | 1,796,870 |
| TOTAL INDIA | | | 53,270,942 |
| IRELAND - 0.1% | | | |
| Financials - 0.1% | | | |
| Banks - 0.0% | | | |
| AIB Group PLC | | 790,600 | 4,364,966 |
| Bank of Ireland Group PLC | | 357,600 | 3,261,918 |
| | | | 7,626,884 |
| Financial Services - 0.1% | | | |
| Circle Internet Financial LLC (c) | | 615,508 | 18,643,738 |
| Circle Internet Financial LLC (c) | | 68,639 | 2,079,075 |
| | | | 20,722,813 |
| Information Technology - 0.0% | | | |
| IT Services - 0.0% | | | |
| Accenture PLC Class A | | 3,900 | 1,371,981 |
| TOTAL IRELAND | | | 29,721,678 |
| ISRAEL - 0.3% | | | |
| Health Care - 0.2% | | | |
| Pharmaceuticals - 0.2% | | | |
| Teva Pharmaceutical Industries Ltd ADR (b) | | 1,729,247 | 38,112,604 |
| Information Technology - 0.1% | | | |
| IT Services - 0.0% | | | |
| Wix.com Ltd (b) | | 12,699 | 2,724,570 |
| Software - 0.1% | | | |
| Cellebrite DI Ltd (b) | | 468,560 | 10,322,377 |
| Check Point Software Technologies Ltd (b) | | 55,023 | 10,272,794 |
| | | | 20,595,171 |
TOTAL INFORMATION TECHNOLOGY | | | 23,319,741 |
| | | | |
| TOTAL ISRAEL | | | 61,432,345 |
| ITALY - 0.4% | | | |
| Consumer Discretionary - 0.3% | | | |
| Textiles, Apparel & Luxury Goods - 0.3% | | | |
| Brunello Cucinelli SpA | | 692,800 | 75,638,927 |
| Industrials - 0.1% | | | |
| Passenger Airlines - 0.1% | | | |
| Ryanair Holdings PLC ADR | | 286,900 | 12,505,971 |
| TOTAL ITALY | | | 88,144,898 |
| JAPAN - 0.3% | | | |
| Consumer Discretionary - 0.1% | | | |
| Broadline Retail - 0.0% | | | |
| Pan Pacific International Holdings Corp | | 52,300 | 1,434,598 |
| Specialty Retail - 0.1% | | | |
| Fast Retailing Co Ltd | | 25,100 | 8,467,278 |
| Textiles, Apparel & Luxury Goods - 0.0% | | | |
| Asics Corp | | 110,400 | 2,182,109 |
TOTAL CONSUMER DISCRETIONARY | | | 12,083,985 |
| | | | |
| Industrials - 0.2% | | | |
| Industrial Conglomerates - 0.2% | | | |
| Hitachi Ltd | | 939,800 | 23,015,758 |
| Machinery - 0.0% | | | |
| Mitsubishi Heavy Industries Ltd | | 451,600 | 6,297,089 |
| Trading Companies & Distributors - 0.0% | | | |
| ITOCHU Corp | | 82,600 | 4,061,804 |
| Mitsui & Co Ltd | | 105,600 | 2,190,051 |
| | | | 6,251,855 |
TOTAL INDUSTRIALS | | | 35,564,702 |
| | | | |
| Information Technology - 0.0% | | | |
| Semiconductors & Semiconductor Equipment - 0.0% | | | |
| Advantest Corp | | 84,000 | 4,776,143 |
| Materials - 0.0% | | | |
| Chemicals - 0.0% | | | |
| Shin-Etsu Chemical Co Ltd | | 268,200 | 8,833,739 |
| TOTAL JAPAN | | | 61,258,569 |
| KOREA (SOUTH) - 0.4% | | | |
| Consumer Discretionary - 0.2% | | | |
| Automobiles - 0.1% | | | |
| Hyundai Motor Co | | 80,127 | 11,328,750 |
| Broadline Retail - 0.1% | | | |
| Coupang Inc Class A (b) | | 1,198,265 | 26,337,865 |
TOTAL CONSUMER DISCRETIONARY | | | 37,666,615 |
| | | | |
| Information Technology - 0.2% | | | |
| Technology Hardware, Storage & Peripherals - 0.2% | | | |
| Samsung Electronics Co Ltd | | 1,119,060 | 39,770,890 |
| TOTAL KOREA (SOUTH) | | | 77,437,505 |
| NETHERLANDS - 0.6% | | | |
| Communication Services - 0.1% | | | |
| Entertainment - 0.1% | | | |
| Universal Music Group NV | | 788,162 | 20,160,495 |
| Financials - 0.0% | | | |
| Financial Services - 0.0% | | | |
| Adyen NV (b)(e)(f) | | 900 | 1,337,471 |
| Health Care - 0.3% | | | |
| Biotechnology - 0.3% | | | |
| Argenx SE ADR (b) | | 106,532 | 65,517,181 |
| Industrials - 0.0% | | | |
| Professional Services - 0.0% | | | |
| Wolters Kluwer NV | | 71,900 | 11,946,209 |
| Information Technology - 0.2% | | | |
| Semiconductors & Semiconductor Equipment - 0.2% | | | |
| ASM International NV | | 13,600 | 7,872,129 |
| ASML Holding NV | | 32,900 | 23,044,301 |
| BE Semiconductor Industries NV | | 50,000 | 6,852,147 |
| | | | 37,768,577 |
| TOTAL NETHERLANDS | | | 136,729,933 |
| SPAIN - 0.0% | | | |
| Financials - 0.0% | | | |
| Banks - 0.0% | | | |
| Banco Santander SA | | 1,348,100 | 6,236,651 |
| SWEDEN - 0.0% | | | |
| Industrials - 0.0% | | | |
| Machinery - 0.0% | | | |
| Indutrade AB | | 42,800 | 1,071,562 |
| SWITZERLAND - 0.2% | | | |
| Consumer Discretionary - 0.2% | | | |
| Textiles, Apparel & Luxury Goods - 0.2% | | | |
| On Holding AG Class A (b) | | 597,100 | 32,703,167 |
| Financials - 0.0% | | | |
| Capital Markets - 0.0% | | | |
| UBS Group AG | | 407,250 | 12,443,438 |
| TOTAL SWITZERLAND | | | 45,146,605 |
| TAIWAN - 0.7% | | | |
| Information Technology - 0.7% | | | |
| Semiconductors & Semiconductor Equipment - 0.7% | | | |
| Taiwan Semiconductor Manufacturing Co Ltd ADR | | 780,600 | 154,160,694 |
| THAILAND - 0.0% | | | |
| Information Technology - 0.0% | | | |
| Electronic Equipment, Instruments & Components - 0.0% | | | |
| Fabrinet (b) | | 23,900 | 5,255,132 |
| UNITED KINGDOM - 0.5% | | | |
| Consumer Discretionary - 0.0% | | | |
| Hotels, Restaurants & Leisure - 0.0% | | | |
| Deliveroo PLC Class A (b)(e)(f) | | 1,473,420 | 2,617,451 |
| Flutter Entertainment PLC (United Kingdom) (b) | | 22,800 | 5,914,176 |
| | | | 8,531,627 |
| Financials - 0.3% | | | |
| Banks - 0.1% | | | |
| Starling Bank Ltd Class D (b)(c)(d) | | 3,787,848 | 11,997,277 |
| Capital Markets - 0.1% | | | |
| London Stock Exchange Group PLC | | 81,500 | 11,504,130 |
| Insurance - 0.1% | | | |
| Hiscox Ltd | | 2,284,081 | 30,967,746 |
TOTAL FINANCIALS | | | 54,469,153 |
| | | | |
| Health Care - 0.1% | | | |
| Pharmaceuticals - 0.1% | | | |
| Astrazeneca PLC | | 212,900 | 27,757,836 |
| Industrials - 0.1% | | | |
| Aerospace & Defense - 0.1% | | | |
| Rolls-Royce Holdings PLC (b) | | 2,186,900 | 15,508,168 |
| Professional Services - 0.0% | | | |
| RELX PLC | | 262,300 | 11,884,547 |
TOTAL INDUSTRIALS | | | 27,392,715 |
| | | | |
| TOTAL UNITED KINGDOM | | | 118,151,331 |
| UNITED STATES - 89.9% | | | |
| Communication Services - 21.2% | | | |
| Entertainment - 2.9% | | | |
| Electronic Arts Inc | | 26,000 | 3,803,800 |
| Liberty Media Corp-Liberty Formula One Class C (b) | | 368,976 | 34,189,316 |
| Liberty Media Corp-Liberty Live Class C (b) | | 17,816 | 1,212,557 |
| Live Nation Entertainment Inc (b) | | 34,500 | 4,467,750 |
| Netflix Inc (b) | | 631,990 | 563,305,327 |
| ROBLOX Corp Class A (b) | | 102,400 | 5,924,864 |
| Spotify Technology SA (b) | | 35,100 | 15,703,038 |
| Walt Disney Co/The | | 44,200 | 4,921,670 |
| | | | 633,528,322 |
| Interactive Media & Services - 18.2% | | | |
| Alphabet Inc Class A | | 7,040,544 | 1,332,774,979 |
| Epic Games Inc (b)(c)(d) | | 23,900 | 16,216,389 |
| Meta Platforms Inc Class A | | 4,358,516 | 2,551,954,704 |
| Reddit Inc Class A | | 300,152 | 49,056,843 |
| Reddit Inc Class B (b) | | 87,201 | 14,252,131 |
| | | | 3,964,255,046 |
| Media - 0.0% | | | |
| Omnicom Group Inc | | 26,100 | 2,245,644 |
| Trade Desk Inc (The) Class A (b) | | 21,700 | 2,550,401 |
| | | | 4,796,045 |
| Wireless Telecommunication Services - 0.1% | | | |
| T-Mobile US Inc | | 92,900 | 20,505,817 |
TOTAL COMMUNICATION SERVICES | | | 4,623,085,230 |
| | | | |
| Consumer Discretionary - 10.3% | | | |
| Automobiles - 0.2% | | | |
| General Motors Co | | 180,936 | 9,638,461 |
| Rad Power Bikes Inc (b)(c)(d) | | 474,452 | 99,635 |
| Rad Power Bikes Inc warrants 10/6/2033 (b)(c)(d) | | 488,383 | 253,959 |
| Tesla Inc (b) | | 101,600 | 41,030,144 |
| | | | 51,022,199 |
| Broadline Retail - 5.8% | | | |
| Amazon.com Inc (b) | | 5,663,800 | 1,242,581,082 |
| Diversified Consumer Services - 0.1% | | | |
| Duolingo Inc Class A (b) | | 80,062 | 25,958,502 |
| Hotels, Restaurants & Leisure - 1.5% | | | |
| Airbnb Inc Class A (b) | | 265,096 | 34,836,265 |
| Booking Holdings Inc | | 5,000 | 24,842,100 |
| Carnival Corp (b) | | 184,900 | 4,607,708 |
| Cava Group Inc (b) | | 118,300 | 13,344,240 |
| Chipotle Mexican Grill Inc (b) | | 1,089,450 | 65,693,835 |
| Churchill Downs Inc | | 19,100 | 2,550,614 |
| DraftKings Inc Class A (b) | | 675,800 | 25,139,760 |
| Dutch Bros Inc Class A (b) | | 39,400 | 2,063,772 |
| Hilton Worldwide Holdings Inc | | 556,068 | 137,437,767 |
| Royal Caribbean Cruises Ltd | | 13,600 | 3,137,384 |
| Starbucks Corp | | 94,200 | 8,595,750 |
| Texas Roadhouse Inc | | 9,500 | 1,714,085 |
| Viking Holdings Ltd | | 194,400 | 8,565,264 |
| | | | 332,528,544 |
| Household Durables - 0.5% | | | |
| Blu Homes Inc (b)(c)(d) | | 98,215,581 | 30,447 |
| DR Horton Inc | | 177,075 | 24,758,627 |
| Garmin Ltd | | 33,640 | 6,938,586 |
| Lennar Corp Class A | | 158,068 | 21,555,733 |
| PulteGroup Inc | | 398,200 | 43,363,980 |
| TopBuild Corp (b) | | 21,100 | 6,569,274 |
| | | | 103,216,647 |
| Specialty Retail - 1.9% | | | |
| Abercrombie & Fitch Co Class A (b) | | 29,200 | 4,364,524 |
| Chewy Inc Class A (b) | | 42,400 | 1,419,976 |
| Dick's Sporting Goods Inc | | 11,845 | 2,710,610 |
| Fanatics Inc Class A (b)(c)(d) | | 372,921 | 22,375,260 |
| Floor & Decor Holdings Inc Class A (b) | | 127,700 | 12,731,690 |
| Gap Inc/The | | 270,430 | 6,390,261 |
| Group 1 Automotive Inc | | 900 | 379,332 |
| Home Depot Inc/The | | 103,000 | 40,065,970 |
| Lowe's Cos Inc | | 348,000 | 85,886,400 |
| Murphy USA Inc | | 75,800 | 38,032,650 |
| O'Reilly Automotive Inc (b) | | 55,471 | 65,777,512 |
| TJX Cos Inc/The | | 962,903 | 116,328,311 |
| Ulta Beauty Inc (b) | | 20,600 | 8,959,558 |
| Williams-Sonoma Inc | | 72,872 | 13,494,437 |
| | | | 418,916,491 |
| Textiles, Apparel & Luxury Goods - 0.3% | | | |
| Crocs Inc (b) | | 145,300 | 15,914,709 |
| Deckers Outdoor Corp (b) | | 125,692 | 25,526,788 |
| Ralph Lauren Corp Class A | | 43,300 | 10,001,434 |
| Samsonite International SA (e)(f) | | 4,331,100 | 12,045,317 |
| VF Corp (g) | | 193,800 | 4,158,948 |
| | | | 67,647,196 |
TOTAL CONSUMER DISCRETIONARY | | | 2,241,870,661 |
| | | | |
| Consumer Staples - 1.1% | | | |
| Beverages - 0.4% | | | |
| Coca-Cola Co/The | | 1,354,018 | 84,301,161 |
| Consumer Staples Distribution & Retail - 0.7% | | | |
| Casey's General Stores Inc | | 41,600 | 16,483,168 |
| Costco Wholesale Corp | | 132,100 | 121,039,267 |
| Walmart Inc | | 75,000 | 6,776,250 |
| | | | 144,298,685 |
| Food Products - 0.0% | | | |
| Bowery Farming Inc (b)(c) | | 466,405 | 5 |
| Bowery Farming Inc warrants (b)(c)(d) | | 383,862 | 3 |
| | | | 8 |
| Household Products - 0.0% | | | |
| Procter & Gamble Co/The | | 14,200 | 2,380,630 |
| Personal Care Products - 0.0% | | | |
| BellRing Brands Inc (b) | | 6,100 | 459,574 |
TOTAL CONSUMER STAPLES | | | 231,440,058 |
| | | | |
| Energy - 1.1% | | | |
| Energy Equipment & Services - 0.0% | | | |
| Baker Hughes Co Class A | | 58,184 | 2,386,708 |
| Oil, Gas & Consumable Fuels - 1.1% | | | |
| Antero Resources Corp (b) | | 542,400 | 19,011,120 |
| Cheniere Energy Inc | | 175,200 | 37,645,224 |
| Exxon Mobil Corp | | 1,432,407 | 154,084,021 |
| Marathon Petroleum Corp | | 8,800 | 1,227,600 |
| Sable Offshore Corp (d) | | 460,290 | 10,540,641 |
| Shell PLC ADR | | 93,574 | 5,862,411 |
| | | | 228,371,017 |
TOTAL ENERGY | | | 230,757,725 |
| | | | |
| Financials - 13.4% | | | |
| Banks - 2.6% | | | |
| Bank of America Corp | | 1,911,765 | 84,022,072 |
| Citigroup Inc | | 425,200 | 29,929,828 |
| East West Bancorp Inc | | 56,100 | 5,372,135 |
| First Citizens BancShares Inc/NC Class A | | 8,100 | 17,115,462 |
| JPMorgan Chase & Co | | 829,459 | 198,829,617 |
| Wells Fargo & Co | | 3,406,616 | 239,280,708 |
| | | | 574,549,822 |
| Capital Markets - 1.0% | | | |
| Bank of New York Mellon Corp/The | | 355,039 | 27,277,646 |
| Blackstone Inc | | 51,900 | 8,948,598 |
| Blue Owl Capital Inc Class A | | 1,094,900 | 25,467,374 |
| Charles Schwab Corp/The | | 17,300 | 1,280,373 |
| Goldman Sachs Group Inc/The | | 46,800 | 26,798,616 |
| Interactive Brokers Group Inc Class A | | 28,700 | 5,070,429 |
| KKR & Co Inc Class A | | 73,900 | 10,930,549 |
| Moody's Corp | | 37,530 | 17,765,576 |
| Morgan Stanley | | 391,553 | 49,226,044 |
| MSCI Inc | | 50,719 | 30,431,907 |
| Raymond James Financial Inc | | 18,100 | 2,811,473 |
| S&P Global Inc | | 2,600 | 1,294,878 |
| Tulco LLC (b)(c)(d)(h) | | 17,377 | 14,556,018 |
| | | | 221,859,481 |
| Consumer Finance - 0.5% | | | |
| American Express Co | | 274,408 | 81,441,550 |
| Capital One Financial Corp | | 117,400 | 20,934,768 |
| Discover Financial Services | | 71,000 | 12,299,330 |
| | | | 114,675,648 |
| Financial Services - 7.7% | | | |
| Apollo Global Management Inc | | 356,900 | 58,945,604 |
| Berkshire Hathaway Inc Class A (b) | | 1,586 | 1,079,939,120 |
| Block Inc Class A (b) | | 14,300 | 1,215,357 |
| Fiserv Inc (b) | | 326,500 | 67,069,630 |
| Flywire Corp (b) | | 419,800 | 8,656,276 |
| Mastercard Inc Class A | | 343,400 | 180,824,138 |
| Paymentus Holdings Inc Class A (b) | | 24,006 | 784,276 |
| PayPal Holdings Inc (b) | | 235,700 | 20,116,995 |
| Shift4 Payments Inc Class A (b) | | 68,500 | 7,108,930 |
| Toast Inc Class A (b) | | 759,000 | 27,665,550 |
| Visa Inc Class A | | 680,800 | 215,160,032 |
| | | | 1,667,485,908 |
| Insurance - 1.6% | | | |
| American International Group Inc | | 206,226 | 15,013,253 |
| Aon PLC | | 7,300 | 2,621,868 |
| Arthur J Gallagher & Co | | 288,000 | 81,748,800 |
| Chubb Ltd | | 473,807 | 130,912,874 |
| Marsh & McLennan Cos Inc | | 104,937 | 22,289,668 |
| Progressive Corp/The | | 258,910 | 62,037,425 |
| The Travelers Companies, Inc. | | 126,138 | 30,385,383 |
| Willis Towers Watson PLC | | 4,200 | 1,315,608 |
| | | | 346,324,879 |
TOTAL FINANCIALS | | | 2,924,895,738 |
| | | | |
| Health Care - 7.5% | | | |
| Biotechnology - 1.9% | | | |
| Alnylam Pharmaceuticals Inc (b) | | 141,684 | 33,339,662 |
| Apogee Therapeutics Inc (b) | | 39,200 | 1,775,760 |
| Arcellx Inc (b) | | 31,200 | 2,392,728 |
| Avidity Biosciences Inc (b) | | 77,700 | 2,259,516 |
| Celldex Therapeutics Inc (b) | | 88,600 | 2,238,922 |
| Crinetics Pharmaceuticals Inc (b) | | 23,000 | 1,175,990 |
| Cytokinetics Inc (b) | | 42,200 | 1,985,088 |
| Denali Therapeutics Inc (b) | | 114,586 | 2,335,263 |
| Dyne Therapeutics Inc (b) | | 90,800 | 2,139,248 |
| Exelixis Inc (b) | | 38,800 | 1,292,040 |
| Gilead Sciences Inc | | 44,500 | 4,110,465 |
| Insmed Inc (b) | | 30,600 | 2,112,624 |
| Janux Therapeutics Inc (b) | | 68,100 | 3,646,074 |
| Keros Therapeutics Inc (b) | | 68,700 | 1,087,521 |
| Legend Biotech Corp ADR (b) | | 245,500 | 7,988,570 |
| Light Sciences Oncology Inc (b)(c) | | 2,708,254 | 27 |
| Moderna Inc (b) | | 39,000 | 1,621,620 |
| Natera Inc (b) | | 9,000 | 1,424,700 |
| Recursion Pharmaceuticals Inc Class A (b)(g) | | 121,703 | 822,712 |
| Regeneron Pharmaceuticals Inc (b) | | 299,199 | 213,128,424 |
| United Therapeutics Corp (b) | | 29,255 | 10,322,334 |
| Vertex Pharmaceuticals Inc (b) | | 307,646 | 123,889,044 |
| Viking Therapeutics Inc (b) | | 25,900 | 1,042,216 |
| | | | 422,130,548 |
| Health Care Equipment & Supplies - 1.6% | | | |
| Alcon AG (United States) | | 122,700 | 10,416,003 |
| Artivion Inc (b) | | 292,900 | 8,374,011 |
| Boston Scientific Corp (b) | | 1,840,508 | 164,394,175 |
| Cooper Cos Inc/The (b) | | 25,501 | 2,344,307 |
| Glaukos Corp (b) | | 9,800 | 1,469,412 |
| Globus Medical Inc Class A (b) | | 17,100 | 1,414,341 |
| Insulet Corp (b) | | 5,200 | 1,357,563 |
| Intuitive Surgical Inc (b) | | 208,951 | 109,064,064 |
| PROCEPT BioRobotics Corp (b) | | 18,600 | 1,497,672 |
| Stryker Corp | | 95,700 | 34,456,785 |
| TransMedics Group Inc (b) | | 237,800 | 14,826,830 |
| | | | 349,615,163 |
| Health Care Providers & Services - 0.8% | | | |
| BrightSpring Health Services Inc (b) | | 73,698 | 1,255,076 |
| Cigna Group/The | | 113,200 | 31,259,048 |
| HCA Healthcare Inc | | 35,300 | 10,595,295 |
| Tenet Healthcare Corp (b) | | 167,859 | 21,188,842 |
| UnitedHealth Group Inc | | 226,388 | 114,520,634 |
| | | | 178,818,895 |
| Health Care Technology - 0.3% | | | |
| Doximity Inc Class A (b) | | 1,239,600 | 66,182,244 |
| Veeva Systems Inc Class A (b) | | 8,008 | 1,683,682 |
| | | | 67,865,926 |
| Life Sciences Tools & Services - 0.5% | | | |
| Danaher Corp | | 162,539 | 37,310,827 |
| Thermo Fisher Scientific Inc | | 110,632 | 57,554,086 |
| Veterinary Emergency Group (b)(c)(d)(h) | | 184,081 | 11,694,666 |
| | | | 106,559,579 |
| Pharmaceuticals - 2.4% | | | |
| Eli Lilly & Co | | 615,383 | 475,075,677 |
| Intra-Cellular Therapies Inc (b) | | 158,117 | 13,205,932 |
| Merck & Co Inc | | 240,592 | 23,934,092 |
| | | | 512,215,701 |
TOTAL HEALTH CARE | | | 1,637,205,812 |
| | | | |
| Industrials - 9.3% | | | |
| Aerospace & Defense - 3.8% | | | |
| Axon Enterprise Inc (b) | | 46,858 | 27,848,647 |
| Boeing Co (b) | | 22,110 | 3,913,470 |
| BWX Technologies Inc | | 47,900 | 5,335,581 |
| GE Aerospace | | 772,603 | 128,862,454 |
| HEICO Corp | | 3,600 | 855,864 |
| Howmet Aerospace Inc | | 571,000 | 62,450,270 |
| Leonardo DRS Inc (b) | | 87,600 | 2,830,356 |
| Loar Holdings Inc (g) | | 27,200 | 2,010,352 |
| Relativity Space Inc warrants (b)(c)(d) | | 9,464 | 2,461 |
| Rocket Lab USA Inc Class A (b) | | 500 | 12,735 |
| Space Exploration Technologies Corp (b)(c)(d) | | 2,573,450 | 476,088,250 |
| Space Exploration Technologies Corp Class C (b)(c)(d) | | 45,460 | 8,410,100 |
| Standardaero Inc | | 41,500 | 1,027,540 |
| TransDigm Group Inc | | 72,962 | 92,463,283 |
| | | | 812,111,363 |
| Air Freight & Logistics - 0.0% | | | |
| Zipline International Inc (b)(c)(d) | | 74,930 | 3,143,314 |
| Building Products - 1.0% | | | |
| AZEK Co Inc/The Class A (b) | | 503,400 | 23,896,398 |
| Builders FirstSource Inc (b) | | 253,100 | 36,175,583 |
| Carrier Global Corp | | 152,700 | 10,423,302 |
| Tecnoglass Inc | | 463,700 | 36,780,684 |
| Trane Technologies PLC | | 284,500 | 105,080,075 |
| | | | 212,356,042 |
| Commercial Services & Supplies - 0.4% | | | |
| Cintas Corp | | 187,648 | 34,283,290 |
| Clean Harbors Inc (b) | | 76,244 | 17,546,794 |
| GFL Environmental Inc Subordinate Voting Shares | | 491,500 | 21,910,550 |
| Republic Services Inc | | 46,100 | 9,274,398 |
| Veralto Corp | | 69,516 | 7,080,204 |
| | | | 90,095,236 |
| Construction & Engineering - 0.5% | | | |
| Bowman Consulting Group Ltd (b) | | 338,000 | 8,433,100 |
| Comfort Systems USA Inc | | 5,900 | 2,501,954 |
| EMCOR Group Inc | | 68,258 | 30,982,306 |
| MYR Group Inc (b) | | 55,100 | 8,197,227 |
| Quanta Services Inc | | 162,500 | 51,358,125 |
| | | | 101,472,712 |
| Electrical Equipment - 1.4% | | | |
| Eaton Corp PLC | | 340,116 | 112,874,297 |
| GE Vernova Inc | | 389,325 | 128,060,672 |
| Generac Holdings Inc (b) | | 34,632 | 5,369,692 |
| Hubbell Inc | | 79,400 | 33,259,866 |
| Vertiv Holdings Co Class A | | 287,200 | 32,628,792 |
| | | | 312,193,319 |
| Ground Transportation - 0.0% | | | |
| Uber Technologies Inc (b) | | 17,600 | 1,061,631 |
| XPO Inc (b) | | 10,150 | 1,331,173 |
| | | | 2,392,804 |
| Industrial Conglomerates - 0.1% | | | |
| 3M Co | | 222,300 | 28,696,707 |
| Machinery - 1.1% | | | |
| Caterpillar Inc | | 65,200 | 23,651,952 |
| Chart Industries Inc (b) | | 182,800 | 34,885,552 |
| Deere & Co | | 15,200 | 6,440,240 |
| Ingersoll Rand Inc | | 32,000 | 2,894,720 |
| PACCAR Inc | | 251,242 | 26,134,193 |
| Parker-Hannifin Corp | | 182,200 | 115,884,666 |
| Westinghouse Air Brake Technologies Corp | | 148,200 | 28,097,238 |
| | | | 237,988,561 |
| Passenger Airlines - 0.0% | | | |
| Alaska Air Group Inc (b) | | 42,700 | 2,764,825 |
| Professional Services - 0.4% | | | |
| CACI International Inc (b) | | 40,200 | 16,243,212 |
| Dayforce Inc (b) | | 88,400 | 6,421,376 |
| KBR Inc | | 510,300 | 29,561,679 |
| Leidos Holdings Inc | | 6,800 | 979,608 |
| Paycom Software Inc | | 39,300 | 8,055,321 |
| UL Solutions Inc Class A | | 58,900 | 2,937,932 |
| Verisk Analytics Inc | | 74,100 | 20,409,363 |
| | | | 84,608,491 |
| Trading Companies & Distributors - 0.6% | | | |
| FTAI Aviation Ltd | | 105,000 | 15,124,200 |
| United Rentals Inc | | 23,100 | 16,272,564 |
| WW Grainger Inc | | 93,200 | 98,237,460 |
| | | | 129,634,224 |
TOTAL INDUSTRIALS | | | 2,017,457,598 |
| | | | |
| Information Technology - 24.1% | | | |
| Communications Equipment - 0.6% | | | |
| Arista Networks Inc | | 1,159,812 | 128,194,020 |
| Ciena Corp (b) | | 1,300 | 110,253 |
| Motorola Solutions Inc | | 23,700 | 10,954,851 |
| | | | 139,259,124 |
| Electronic Equipment, Instruments & Components - 0.9% | | | |
| Amphenol Corp Class A | | 2,915,060 | 202,450,917 |
| Coherent Corp (b) | | 21,800 | 2,065,114 |
| Sanmina Corp (b) | | 6,767 | 512,059 |
| Zebra Technologies Corp Class A (b) | | 3,500 | 1,351,770 |
| | | | 206,379,860 |
| IT Services - 0.3% | | | |
| Asac II LP (b)(c)(d) | | 9,408,021 | 1,580,548 |
| Cloudflare Inc Class A (b) | | 88,800 | 9,561,984 |
| Gartner Inc (b) | | 60,300 | 29,213,541 |
| GoDaddy Inc Class A (b) | | 25,804 | 5,092,935 |
| Kyndryl Holdings Inc (b) | | 113,611 | 3,930,941 |
| Twilio Inc Class A (b) | | 31,400 | 3,393,712 |
| X Holdings Corp Class A (b)(c)(d) | | 97,100 | 2,964,463 |
| | | | 55,738,124 |
| Semiconductors & Semiconductor Equipment - 10.8% | | | |
| Advanced Micro Devices Inc (b) | | 294,953 | 35,627,373 |
| Analog Devices Inc | | 44,705 | 9,498,024 |
| Applied Materials Inc | | 247,300 | 40,218,399 |
| ARM Holdings PLC ADR (b) | | 62,800 | 7,747,008 |
| Astera Labs Inc (b) | | 190,600 | 25,244,970 |
| Broadcom Inc | | 603,200 | 139,845,889 |
| Lam Research Corp | | 412,000 | 29,758,760 |
| Marvell Technology Inc | | 843,074 | 93,117,523 |
| Micron Technology Inc | | 472,700 | 39,782,432 |
| Monolithic Power Systems Inc | | 3,132 | 1,853,204 |
| NVIDIA Corp | | 14,230,960 | 1,911,075,619 |
| ON Semiconductor Corp (b) | | 69,700 | 4,394,585 |
| | | | 2,338,163,786 |
| Software - 8.9% | | | |
| Adobe Inc (b) | | 234,851 | 104,433,543 |
| Agilysys Inc (b) | | 36,800 | 4,846,928 |
| Alkami Technology Inc (b) | | 8,300 | 304,443 |
| Appfolio Inc Class A (b) | | 5,200 | 1,282,944 |
| Applied Intuition Inc Class A (c)(d) | | 42,935 | 2,661,970 |
| AppLovin Corp Class A (b) | | 4,200 | 1,360,086 |
| Atlassian Corp Class A (b) | | 6,267 | 1,525,262 |
| Cadence Design Systems Inc (b) | | 309,557 | 93,009,496 |
| Clear Secure Inc Class A | | 209,500 | 5,581,080 |
| Coreweave Inc Class A (c)(d) | | 42,712 | 40,142,873 |
| CyberArk Software Ltd (b) | | 48,300 | 16,091,145 |
| Datadog Inc Class A (b) | | 57,984 | 8,285,334 |
| DocuSign Inc (b) | | 113,300 | 10,190,202 |
| Dynatrace Inc (b) | | 22,400 | 1,217,440 |
| Fair Isaac Corp (b) | | 300 | 597,279 |
| Figma Inc Class A (c)(d) | | 159,400 | 4,467,982 |
| Fortinet Inc (b) | | 229,800 | 21,711,504 |
| HubSpot Inc (b) | | 1,800 | 1,254,186 |
| Klaviyo Inc Class A (b) | | 67,264 | 2,773,967 |
| Magic Leap Inc Class A (b)(c)(d) | | 30,863 | 0 |
| Magic Leap Inc warrants (b)(c)(d) | | 46,794 | 1 |
| Microsoft Corp | | 3,290,615 | 1,386,994,223 |
| Monday.com Ltd (b) | | 12,700 | 2,990,088 |
| Onestream Inc Class A | | 63,418 | 1,808,681 |
| OpenAI Global LLC rights (b)(c)(d) | | 9,175,218 | 9,175,218 |
| Oracle Corp | | 6,000 | 999,840 |
| Palo Alto Networks Inc (b) | | 24,600 | 4,476,216 |
| Rubrik Inc Class A (b) | | 61,300 | 4,006,568 |
| Salesforce Inc | | 300,593 | 100,497,258 |
| Samsara Inc Class A (b) | | 317,608 | 13,876,294 |
| Servicenow Inc (b) | | 67,199 | 71,239,004 |
| ServiceTitan Inc Class A (b)(g) | | 10,200 | 1,049,274 |
| Stripe Inc Class B (b)(c)(d) | | 83,200 | 2,288,832 |
| Tanium Inc Class B (b)(c)(d) | | 1,259,978 | 11,579,198 |
| Weave Communications Inc (b) | | 22,600 | 359,792 |
| Zoom Communications Inc Class A (b) | | 109,300 | 8,919,973 |
| | | | 1,941,998,124 |
| Technology Hardware, Storage & Peripherals - 2.6% | | | |
| Apple Inc | | 2,275,010 | 569,708,004 |
| Dell Technologies Inc Class C | | 38,675 | 4,456,907 |
| | | | 574,164,911 |
TOTAL INFORMATION TECHNOLOGY | | | 5,255,703,929 |
| | | | |
| Materials - 0.7% | | | |
| Chemicals - 0.3% | | | |
| Air Products and Chemicals Inc | | 4,300 | 1,247,172 |
| Bolt Projects Holdings Inc Class A (b)(g) | | 57,577 | 27,931 |
| Corteva Inc | | 465,900 | 26,537,664 |
| Sherwin-Williams Co/The | | 96,369 | 32,758,714 |
| | | | 60,571,481 |
| Construction Materials - 0.1% | | | |
| CRH PLC | | 98,300 | 9,094,716 |
| Martin Marietta Materials Inc | | 31,000 | 16,011,500 |
| | | | 25,106,216 |
| Containers & Packaging - 0.0% | | | |
| International Paper Co | | 163,300 | 8,788,806 |
| Silgan Holdings Inc | | 12,500 | 650,625 |
| | | | 9,439,431 |
| Metals & Mining - 0.3% | | | |
| ATI Inc (b) | | 98,100 | 5,399,424 |
| Freeport-McMoRan Inc | | 1,269,200 | 48,331,137 |
| Ivanhoe Electric Inc / US (b) | | 308,097 | 2,326,132 |
| Steel Dynamics Inc | | 36,678 | 4,183,859 |
| | | | 60,240,552 |
TOTAL MATERIALS | | | 155,357,680 |
| | | | |
| Real Estate - 0.0% | | | |
| Health Care REITs - 0.0% | | | |
| Welltower Inc | | 77,500 | 9,767,325 |
| Real Estate Management & Development - 0.0% | | | |
| CBRE Group Inc Class A (b) | | 29,800 | 3,912,441 |
TOTAL REAL ESTATE | | | 13,679,766 |
| | | | |
| Utilities - 1.2% | | | |
| Electric Utilities - 0.6% | | | |
| American Electric Power Co Inc | | 13,000 | 1,198,990 |
| Constellation Energy Corp | | 521,524 | 116,670,134 |
| NRG Energy Inc | | 95,800 | 8,643,076 |
| PG&E Corp | | 229,463 | 4,630,563 |
| Southern Co/The | | 22,400 | 1,843,968 |
| | | | 132,986,731 |
| Independent Power and Renewable Electricity Producers - 0.6% | | | |
| Vistra Corp | | 884,000 | 121,877,080 |
TOTAL UTILITIES | | | 254,863,811 |
| | | | |
| TOTAL UNITED STATES | | | 19,586,318,008 |
| TOTAL COMMON STOCKS (Cost $6,762,477,970) | | | 21,128,325,343 |
| | | | |
| Convertible Preferred Stocks - 2.7% |
| | | Shares | Value ($) |
| AUSTRALIA - 0.0% | | | |
| Information Technology - 0.0% | | | |
| Software - 0.0% | | | |
| Canva Inc Series A (b)(c)(d) | | 2,032 | 2,601,143 |
| Canva Inc Series A2 (b)(c)(d) | | 368 | 471,073 |
| | | | |
| TOTAL AUSTRALIA | | | 3,072,216 |
| CHINA - 0.1% | | | |
| Communication Services - 0.1% | | | |
| Interactive Media & Services - 0.1% | | | |
| ByteDance Ltd Series E1 (b)(c)(d) | | 130,945 | 32,429,839 |
| UNITED STATES - 2.6% | | | |
| Consumer Discretionary - 0.0% | | | |
| Automobiles - 0.0% | | | |
| Rad Power Bikes Inc Series A (b)(c)(d) | | 61,855 | 12,989 |
| Rad Power Bikes Inc Series C (b)(c)(d) | | 243,394 | 138,735 |
| Rad Power Bikes Inc Series D (b)(c)(d) | | 411,659 | 391,076 |
| | | | 542,800 |
| Hotels, Restaurants & Leisure - 0.0% | | | |
| Discord Inc Series I (b)(c)(d) | | 2,800 | 691,656 |
| Consumer Staples - 0.0% | | | |
| Consumer Staples Distribution & Retail - 0.0% | | | |
| GoBrands Inc Series G (b)(c)(d) | | 8,102 | 272,794 |
| GoBrands Inc Series H (b)(c)(d) | | 10,223 | 441,225 |
| | | | 714,019 |
| Financials - 0.0% | | | |
| Financial Services - 0.0% | | | |
| Akeana Series C (c)(d) | | 125,700 | 1,590,105 |
| Tenstorrent Holdings Inc Series C1 (b)(c)(d) | | 70,912 | 5,260,252 |
| | | | 6,850,357 |
| Health Care - 0.0% | | | |
| Biotechnology - 0.0% | | | |
| ElevateBio LLC Series C (b)(c)(d) | | 594,600 | 1,724,340 |
| Intarcia Therapeutics Inc (b)(c)(d) | | 516,522 | 5 |
| | | | 1,724,345 |
| Health Care Providers & Services - 0.0% | | | |
| Lyra Health Inc Series E (b)(c)(d) | | 270,000 | 2,675,700 |
| Lyra Health Inc Series F (b)(c)(d) | | 10,070 | 99,794 |
| Somatus Inc Series E (b)(c)(d) | | 2,206 | 2,440,431 |
| | | | 5,215,925 |
TOTAL HEALTH CARE | | | 6,940,270 |
| | | | |
| Industrials - 2.4% | | | |
| Aerospace & Defense - 2.3% | | | |
| Relativity Space Inc Series E (b)(c)(d) | | 308,359 | 289,858 |
| Relativity Space Inc Series F (b)(c)(d) | | 94,642 | 88,963 |
| Space Exploration Technologies Corp Series G (b)(c)(d) | | 145,254 | 268,719,900 |
| Space Exploration Technologies Corp Series H (b)(c)(d) | | 42,094 | 77,873,900 |
| Space Exploration Technologies Corp Series N (b)(c)(d) | | 66,208 | 122,484,800 |
| | | | 469,457,421 |
| Air Freight & Logistics - 0.1% | | | |
| Zipline International Inc Series E (b)(c)(d) | | 208,789 | 8,758,699 |
| Zipline International Inc Series F (b)(c)(d) | | 79,020 | 3,314,889 |
| Zipline International Inc Series G (c)(d) | | 182,718 | 7,665,020 |
| | | | 19,738,608 |
| Construction & Engineering - 0.0% | | | |
| Beta Technologies Inc Series B, 6% (b)(c)(d) | | 52,096 | 7,010,038 |
TOTAL INDUSTRIALS | | | 496,206,067 |
| | | | |
| Information Technology - 0.2% | | | |
| Software - 0.2% | | | |
| Applied Intuition Inc Series A2 (c)(d) | | 55,889 | 3,465,118 |
| Applied Intuition Inc Series B2 (c)(d) | | 26,948 | 1,670,776 |
| Magic Leap Inc Series AA (b)(c)(d) | | 325,855 | 3 |
| MOLOCO Inc Series A (b)(c)(d) | | 39,638 | 2,588,361 |
| Nuro Inc/CA Series C (b)(c)(d) | | 491,080 | 1,610,742 |
| Nuro Inc/CA Series D (b)(c)(d) | | 94,265 | 391,200 |
| Stripe Inc Series H (b)(c)(d) | | 34,900 | 960,099 |
| Stripe Inc Series I (b)(c)(d) | | 611,900 | 16,833,370 |
| xAI Corp Series C (c)(d) | | 308,769 | 6,684,849 |
| | | | 34,204,518 |
| TOTAL UNITED STATES | | | 546,149,687 |
| TOTAL CONVERTIBLE PREFERRED STOCKS (Cost $158,526,164) | | | 581,651,742 |
| | | | |
| Preferred Securities - 0.0% |
| | | Principal Amount (a) | Value ($) |
| UNITED STATES - 0.0% | | | |
| Consumer Discretionary - 0.0% | | | |
| Automobiles - 0.0% | | | |
| Rad Power Bikes Inc 8% 12/31/2025 (c)(d) | | 488,383 | 637,289 |
| Health Care - 0.0% | | | |
| Biotechnology - 0.0% | | | |
| Intarcia Therapeutics Inc 6% (c)(d)(i)(j) | | 2,280,387 | 0 |
| TOTAL UNITED STATES | | | 637,289 |
| TOTAL PREFERRED SECURITIES (Cost $2,768,769) | | | 637,289 |
| | | | |
| Money Market Funds - 1.7% |
| | | Yield (%) | Shares | Value ($) |
| Fidelity Cash Central Fund (k) | | 4.36 | 283,098,310 | 283,154,929 |
| Fidelity Securities Lending Cash Central Fund (k)(l) | | 4.35 | 85,072,718 | 85,081,225 |
| TOTAL MONEY MARKET FUNDS (Cost $368,236,090) | | | | 368,236,154 |
| | | | | |
| TOTAL INVESTMENT IN SECURITIES - 101.3% (Cost $7,292,008,993) | 22,078,850,528 |
NET OTHER ASSETS (LIABILITIES) - (1.3)% | (279,911,026) |
| NET ASSETS - 100.0% | 21,798,939,502 |
| | |
Legend
| (a) | Amount is stated in United States dollars unless otherwise noted. |
| (d) | Restricted securities (including private placements) - Investment in securities not registered under the Securities Act of 1933 (excluding 144A issues). At the end of the period, the value of restricted securities (excluding 144A issues) amounted to $1,247,978,007 or 5.7% of net assets. |
| (e) | Security exempt from registration under Rule 144A of the Securities Act of 1933. These securities may be resold in transactions exempt from registration, normally to qualified institutional buyers. At the end of the period, the value of these securities amounted to $17,931,700 or 0.1% of net assets. |
| (f) | Security is exempt from registration under Regulation S of the Securities Act of 1933 and may be resold to qualified foreign investors outside of the United States. At the end of the period, the value of securities amounted to $17,839,582 or 0.1% of net assets. |
| (g) | Security or a portion of the security is on loan at period end. |
| (h) | Investment is owned by a wholly-owned subsidiary (Subsidiary) that is treated as a corporation for U.S. tax purposes. |
| (i) | Security is perpetual in nature with no stated maturity date. |
| (j) | Non-income producing - Security is in default. |
| (k) | Affiliated fund that is generally available only to investment companies and other accounts managed by Fidelity Investments. The rate quoted is the annualized seven-day yield of the fund at period end. A complete unaudited listing of the fund's holdings as of its most recent quarter end is available upon request. In addition, each Fidelity Central Fund's financial statements, which are not covered by the Fund's Report of Independent Registered Public Accounting Firm, are available on the SEC's website or upon request. |
| (l) | Investment made with cash collateral received from securities on loan. |
| Additional information on each restricted holding is as follows: |
| Security | Acquisition Date | Acquisition Cost ($) |
| Akeana Series C | 1/23/24 | 1,604,033 |
| | | |
| Applied Intuition Inc Class A | 7/02/24 | 2,563,001 |
| | | |
| Applied Intuition Inc Series A2 | 7/02/24 | 3,336,288 |
| | | |
| Applied Intuition Inc Series B2 | 7/02/24 | 1,608,658 |
| | | |
| Asac II LP | 10/10/13 | 724,512 |
| | | |
| Beta Technologies Inc Series B, 6% | 4/04/22 | 5,374,744 |
| | | |
| Blu Homes Inc | 5/21/20 | 169,874 |
| | | |
| Bowery Farming Inc warrants | 10/25/23 | 0 |
| | | |
| ByteDance Ltd Series E1 | 11/18/20 | 14,348,191 |
| | | |
| Canva Inc Class A | 3/18/24 | 12,746,600 |
| | | |
| Canva Inc Series A | 9/22/23 | 2,167,455 |
| | | |
| Canva Inc Series A2 | 9/22/23 | 392,531 |
| | | |
| Coreweave Inc Class A | 11/29/23 - 10/03/24 | 14,102,241 |
| | | |
| Discord Inc Series I | 9/15/21 | 1,541,748 |
| | | |
| ElevateBio LLC Series C | 3/09/21 | 2,494,347 |
| | | |
| Epic Games Inc | 7/13/20 - 7/30/20 | 13,742,500 |
| | | |
| Fanatics Inc Class A | 8/13/20 - 12/15/21 | 12,263,632 |
| | | |
| Figma Inc Class A | 5/15/24 | 3,696,964 |
| | | |
| GoBrands Inc Series G | 3/02/21 | 2,023,210 |
| | | |
| GoBrands Inc Series H | 7/22/21 | 3,971,539 |
| | | |
| I-Pulse Inc | 3/18/10 | 50,101 |
| | | |
| Intarcia Therapeutics Inc | 11/14/12 | 7,040,195 |
| | | |
| Intarcia Therapeutics Inc 6% | 1/03/20 | 2,280,387 |
| | | |
| Lyra Health Inc Series E | 1/14/21 | 2,472,282 |
| | | |
| Lyra Health Inc Series F | 6/04/21 | 158,143 |
| | | |
| Magic Leap Inc Class A | 10/06/17 | 14,999,526 |
| | | |
| Magic Leap Inc Series AA | 7/07/20 | 5,624,300 |
| | | |
| Magic Leap Inc warrants | 7/07/20 | 0 |
| | | |
| MOLOCO Inc Series A | 6/26/23 | 2,378,280 |
| | | |
| Nuro Inc/CA Series C | 10/30/20 | 6,410,853 |
| | | |
| Nuro Inc/CA Series D | 10/29/21 | 1,965,022 |
| | | |
| OpenAI Global LLC rights | 9/30/24 | 9,175,218 |
| | | |
| Rad Power Bikes Inc | 1/21/21 | 2,288,681 |
| | | |
| Rad Power Bikes Inc 8% 12/31/2025 | 10/06/23 | 488,383 |
| | | |
| Rad Power Bikes Inc Series A | 1/21/21 | 298,379 |
| | | |
| Rad Power Bikes Inc Series C | 1/21/21 | 1,174,094 |
| | | |
| Rad Power Bikes Inc Series D | 9/17/21 | 3,945,258 |
| | | |
| Rad Power Bikes Inc warrants 10/6/2033 | 10/06/23 | 0 |
| | | |
| Relativity Space Inc Series E | 5/27/21 | 7,041,409 |
| | | |
| Relativity Space Inc Series F | 11/14/23 | 2,145,250 |
| | | |
| Relativity Space Inc warrants | 11/14/23 | 0 |
| | | |
| Sable Offshore Corp | 1/16/24 | 4,602,900 |
| | | |
| Somatus Inc Series E | 1/31/22 | 1,925,033 |
| | | |
| Space Exploration Technologies Corp | 10/16/15 - 2/16/21 | 29,627,970 |
| | | |
| Space Exploration Technologies Corp Class C | 9/11/17 | 613,710 |
| | | |
| Space Exploration Technologies Corp Series G | 1/20/15 | 11,251,375 |
| | | |
| Space Exploration Technologies Corp Series H | 8/04/17 | 5,682,690 |
| | | |
| Space Exploration Technologies Corp Series N | 8/04/20 | 17,876,160 |
| | | |
| Starling Bank Ltd Class D | 6/18/21 - 4/05/22 | 7,251,743 |
| | | |
| Stripe Inc Class B | 5/18/21 | 3,338,681 |
| | | |
| Stripe Inc Series H | 3/15/21 | 1,400,363 |
| | | |
| Stripe Inc Series I | 3/20/23 - 5/12/23 | 12,320,080 |
| | | |
| Tanium Inc Class B | 4/21/17 - 9/18/20 | 9,906,875 |
| | | |
| Tenstorrent Holdings Inc Series C1 | 4/23/21 | 4,216,027 |
| | | |
| Tulco LLC | 8/24/17 | 5,868,468 |
| | | |
| Veterinary Emergency Group | 9/16/21 - 11/13/23 | 7,037,189 |
| | | |
| X Holdings Corp Class A | 10/25/22 | 9,710,000 |
| | | |
| xAI Corp Series C | 11/22/24 | 6,684,849 |
| | | |
| Zipline International Inc | 10/12/21 | 2,697,480 |
| | | |
| Zipline International Inc Series E | 12/21/20 | 6,812,660 |
| | | |
| Zipline International Inc Series F | 4/11/23 | 3,176,375 |
| | | |
| Zipline International Inc Series G | 6/07/24 | 7,664,344 |
| | | |
Affiliated Central Funds
Fiscal year to date information regarding the Fund's investments in Fidelity Central Funds, including the ownership percentage, is presented below.
| Affiliate | Value, beginning of period ($) | Purchases ($) | Sales Proceeds ($) | Dividend Income ($) | Realized Gain (loss) ($) | Change in Unrealized appreciation (depreciation) ($) | Value, end of period ($) | Shares, end of period | % ownership, end of period |
| Fidelity Cash Central Fund | 230,569,127 | 4,375,195,767 | 4,322,642,130 | 11,987,403 | 32,165 | - | 283,154,929 | 283,098,310 | 0.6% |
| Fidelity Securities Lending Cash Central Fund | 61,314,709 | 854,280,822 | 830,514,306 | 309,631 | - | - | 85,081,225 | 85,072,718 | 0.4% |
| Total | 291,883,836 | 5,229,476,589 | 5,153,156,436 | 12,297,034 | 32,165 | - | 368,236,154 | 368,171,028 | |
| | | | | | | | | | |
Amounts in the dividend income column in the above table include any capital gain distributions from underlying funds, which are presented in the corresponding line item in the Consolidated Statement of Operations, if applicable.
Amounts in the dividend income column for Fidelity Securities Lending Cash Central Fund represents the income earned on investing cash collateral, less rebates paid to borrowers and any lending agent fees associated with the loan, plus any premium payments received for lending certain types of securities.
Amounts included in the purchases and sales proceeds columns may include in-kind transactions, if applicable.
Investment Valuation
The following is a summary of the inputs used, as of December 31, 2024, involving the Fund's assets and liabilities carried at fair value. The inputs or methodology used for valuing securities may not be an indication of the risk associated with investing in those securities. For more information on valuation inputs, and their aggregation into the levels used below, please refer to the Investment Valuation section in the accompanying Notes to Consolidated Financial Statements.
| Valuation Inputs at Reporting Date: |
| Description | Total ($) | Level 1 ($) | Level 2 ($) | Level 3 ($) |
Investments in Securities: | | | | |
|
| Common Stocks | | | | |
Communication Services | 4,644,706,398 | 4,608,329,514 | 20,160,495 | 16,216,389 |
Consumer Discretionary | 2,485,909,452 | 2,433,963,822 | 29,186,286 | 22,759,344 |
Consumer Staples | 246,708,009 | 246,708,001 | - | 8 |
Energy | 327,099,161 | 327,099,161 | - | - |
Financials | 3,221,977,452 | 3,155,623,092 | 19,078,252 | 47,276,108 |
Health Care | 1,816,455,949 | 1,776,798,453 | 27,757,836 | 11,899,660 |
Industrials | 2,143,497,293 | 1,592,895,751 | 62,957,417 | 487,644,125 |
Information Technology | 5,624,345,234 | 5,466,595,739 | 67,591,334 | 90,158,161 |
Materials | 349,082,818 | 340,249,079 | 8,833,739 | - |
Real Estate | 13,679,766 | 13,679,766 | - | - |
Utilities | 254,863,811 | 254,863,811 | - | - |
|
| Convertible Preferred Stocks | | | | |
Communication Services | 32,429,839 | - | - | 32,429,839 |
Consumer Discretionary | 1,234,456 | - | - | 1,234,456 |
Consumer Staples | 714,019 | - | - | 714,019 |
Financials | 6,850,357 | - | - | 6,850,357 |
Health Care | 6,940,270 | - | - | 6,940,270 |
Industrials | 496,206,067 | - | - | 496,206,067 |
Information Technology | 37,276,734 | - | - | 37,276,734 |
|
| Preferred Securities | | | | |
Consumer Discretionary | 637,289 | - | - | 637,289 |
Health Care | - | - | - | - |
|
| Money Market Funds | 368,236,154 | 368,236,154 | - | - |
| Total Investments in Securities: | 22,078,850,528 | 20,585,042,343 | 235,565,359 | 1,258,242,826 |
The following is a reconciliation of consolidated Investments in Securities for which Level 3 inputs were used in determining value. Beginning balances have been updated to conform to current period presentation, as applicable.
| |
| Investments in Securities: | |
| Beginning Balance | $ | 740,268,662 | |
| Net Realized Gain (Loss) on Investment Securities | | (3) | |
| Net Unrealized Gain (Loss) on Investment Securities | | 473,586,064 | |
| Cost of Purchases | | 50,420,641 | |
| Proceeds of Sales | | - | |
| Amortization/Accretion | | - | |
| Transfers into Level 3 | | - | |
| Transfers out of Level 3 | | (6,032,538) | |
| Ending Balance | $ | 1,258,242,826 | |
| The change in unrealized gain (loss) for the period attributable to Level 3 securities held at December 31, 2024 | $ | 473,586,064 | |
| The information used in the above reconciliation represents fiscal year to date activity for any Investments in Securities identified as using Level 3 inputs at either the beginning or the end of the current fiscal period. Cost of purchases and proceeds of sales may include securities received and/or delivered through in-kind transactions, corporate actions or exchanges. Transfers into Level 3 were attributable to a lack of observable market data resulting from decreases in market activity, decreases in liquidity, security restructurings or corporate actions. Transfers out of Level 3 were attributable to observable market data becoming available for those securities. Transfers in or out of Level 3 represent the beginning value of any Security or Instrument where a change in the pricing level occurred from the beginning to the end of the period. Realized and unrealized gains (losses) disclosed in the reconciliation are included in Net Gain (Loss) on the Fund's consolidated Statement of Operations. | |
Consolidated Financial Statements
| Consolidated Statement of Assets and Liabilities |
As of December 31, 2024 |
| Assets | | | | |
| Investment in securities, at value (including securities loaned of $80,850,695) - See accompanying schedule: | | | | |
Unaffiliated issuers (cost $6,923,772,903) | $ | 21,710,614,374 | | |
Fidelity Central Funds (cost $368,236,090) | | 368,236,154 | | |
| | | | | |
| | | | | |
| Total Investment in Securities (cost $7,292,008,993) | | | $ | 22,078,850,528 |
| Foreign currency held at value (cost $86,704) | | | | 84,693 |
| Receivable for investments sold | | | | 2,471,679 |
| Receivable for fund shares sold | | | | 7,066,226 |
| Dividends receivable | | | | 6,903,533 |
| Distributions receivable from Fidelity Central Funds | | | | 823,769 |
| Prepaid expenses | | | | 18,806 |
| Other receivables | | | | 918,525 |
Total assets | | | | 22,097,137,759 |
| Liabilities | | | | |
| Payable for investments purchased | $ | 51,058 | | |
| Payable for fund shares redeemed | | 193,988,507 | | |
| Distributions payable | | 9,417 | | |
| Accrued management fee | | 13,555,024 | | |
| Distribution and service plan fees payable | | 3,068,393 | | |
| Other payables and accrued expenses | | 2,474,558 | | |
| Collateral on securities loaned | | 85,051,300 | | |
| Total liabilities | | | | 298,198,257 |
| Net Assets | | | $ | 21,798,939,502 |
| Net Assets consist of: | | | | |
| Paid in capital | | | $ | 6,832,898,484 |
| Total accumulated earnings (loss) | | | | 14,966,041,018 |
| Net Assets | | | $ | 21,798,939,502 |
| | | | | |
| Net Asset Value and Maximum Offering Price | | | | |
| Class A : | | | | |
Net Asset Value and redemption price per share ($7,897,637,525 ÷ 190,463,182 shares)(a) | | | $ | 41.47 |
| Maximum offering price per share (100/94.25 of $41.47) | | | $ | 44.00 |
| Class M : | | | | |
Net Asset Value and redemption price per share ($1,892,816,400 ÷ 49,401,114 shares)(a) | | | $ | 38.32 |
| Maximum offering price per share (100/96.50 of $38.32) | | | $ | 39.71 |
| Class C : | | | | |
Net Asset Value and offering price per share ($664,700,800 ÷ 22,251,302 shares)(a) | | | $ | 29.87 |
| Class I : | | | | |
Net Asset Value, offering price and redemption price per share ($9,062,666,110 ÷ 207,842,380 shares) | | | $ | 43.60 |
| Class Z : | | | | |
Net Asset Value, offering price and redemption price per share ($2,281,118,667 ÷ 52,017,901 shares) | | | $ | 43.85 |
(a)Redemption price per share is equal to net asset value less any applicable contingent deferred sales charge. |
| Consolidated Statement of Operations |
| Year ended December 31, 2024 |
| Investment Income | | | | |
| Dividends | | | $ | 127,054,064 |
| Interest | | | | 37,632 |
| Income from Fidelity Central Funds (including $309,631 from security lending) | | | | 12,297,034 |
| Total income | | | | 139,388,730 |
| Expenses | | | | |
| Management fee | | | | |
| Basic fee | $ | 129,526,098 | | |
| Performance adjustment | | (2,945,211) | | |
| Transfer agent fees | | 4,776,701 | | |
| Distribution and service plan fees | | 34,171,357 | | |
| Accounting fees | | 265,480 | | |
| Custodian fees and expenses | | 279,836 | | |
| Independent trustees' fees and expenses | | 87,988 | | |
| Registration fees | | 198,795 | | |
| Audit fees | | 122,292 | | |
| Legal | | 25,101 | | |
| Miscellaneous | | 397,670 | | |
| Total expenses before reductions | | 166,906,107 | | |
| Expense reductions | | (828,700) | | |
| Total expenses after reductions | | | | 166,077,407 |
| Net Investment income (loss) | | | | (26,688,677) |
| Realized and Unrealized Gain (Loss) | | | | |
| Net realized gain (loss) on: | | | | |
| Investment Securities: | | | | |
| Unaffiliated issuers (net of foreign taxes of $200,803) | | 1,604,862,623 | | |
| Redemptions in-kind | | 419,290,241 | | |
| Fidelity Central Funds | | 32,165 | | |
| Foreign currency transactions | | (117,665) | | |
| Futures contracts | | (8,519,184) | | |
| Total net realized gain (loss) | | | | 2,015,548,180 |
| Change in net unrealized appreciation (depreciation) on: | | | | |
| Investment Securities: | | | | |
| Unaffiliated issuers (net of increase in deferred foreign taxes of $870,081) | | 4,055,620,464 | | |
| Unfunded commitments | | 119,160 | | |
| Assets and liabilities in foreign currencies | | (174,812) | | |
| Total change in net unrealized appreciation (depreciation) | | | | 4,055,564,812 |
| Net gain (loss) | | | | 6,071,112,992 |
| Net increase (decrease) in net assets resulting from operations | | | $ | 6,044,424,315 |
| Consolidated Statement of Changes in Net Assets |
| |
| | Year ended December 31, 2024 | | Year ended December 31, 2023 |
| Increase (Decrease) in Net Assets | | | | |
| Operations | | | | |
| Net investment income (loss) | $ | (26,688,677) | $ | 62,781,374 |
| Net realized gain (loss) | | 2,015,548,180 | | 1,041,996,694 |
| Change in net unrealized appreciation (depreciation) | | 4,055,564,812 | | 3,926,099,827 |
| Net increase (decrease) in net assets resulting from operations | | 6,044,424,315 | | 5,030,877,895 |
| Distributions to shareholders | | (1,234,294,863) | | (1,099,712,941) |
| | | | | |
| Share transactions - net increase (decrease) | | (995,341,372) | | (791,690,489) |
| Total increase (decrease) in net assets | | 3,814,788,080 | | 3,139,474,465 |
| | | | | |
| Net Assets | | | | |
| Beginning of period | | 17,984,151,422 | | 14,844,676,957 |
| End of period | $ | 21,798,939,502 | $ | 17,984,151,422 |
| | | | | |
| | | | | |
Consolidated Financial Highlights
Fidelity Advisor® New Insights Fund Class A |
| |
| Years ended December 31, | | 2024 | | 2023 | | 2022 | | 2021 | | 2020 |
Selected Per-Share Data | | | | | | | | | | |
| Net asset value, beginning of period | $ | 32.50 | $ | 25.50 | $ | 40.22 | $ | 36.57 | $ | 32.08 |
| Income from Investment Operations | | | | | | | | | | |
Net investment income (loss) A,B | | (.09) | | .09 | | .10 | | (.16) | | (.10) |
| Net realized and unrealized gain (loss) | | 11.49 | | 8.92 | | (10.99) | | 8.90 | | 7.57 |
| Total from investment operations | | 11.40 | | 9.01 | | (10.89) | | 8.74 | | 7.47 |
| Distributions from net investment income | | (.02) | | (.07) | | (.12) | | - | | - C |
| Distributions from net realized gain | | (2.41) | | (1.94) | | (3.71) | | (5.09) | | (2.97) |
| Total distributions | | (2.43) | | (2.01) | | (3.83) | | (5.09) | | (2.98) D |
| Net asset value, end of period | $ | 41.47 | $ | 32.50 | $ | 25.50 | $ | 40.22 | $ | 36.57 |
Total Return E,F | | | | 35.95% | | (27.48)% | | 24.30% | | 23.64% |
Ratios to Average Net Assets B,G,H | | | | | | | | | | |
| Expenses before reductions | | .90% | | .69% | | .70% | | .93% | | 1.10% |
| Expenses net of fee waivers, if any | | | | .68% | | .70% | | .93% | | 1.10% |
| Expenses net of all reductions | | .90% | | .68% | | .70% | | .93% | | 1.10% |
| Net investment income (loss) | | (.23)% | | .29% | | .32% | | (.40)% | | (.30)% |
| Supplemental Data | | | | | | | | | | |
| Net assets, end of period (000 omitted) | $ | 7,897,638 | $ | 6,311,442 | $ | 5,101,386 | $ | 8,124,425 | $ | 6,752,941 |
Portfolio turnover rate I | | | | 15% | | 32% J | | 29% | | 53% |
ACalculated based on average shares outstanding during the period.
BNet investment income (loss) is affected by the timing of the declaration of dividends by any underlying mutual funds or exchange-traded funds (ETFs). Net investment income (loss) of any mutual funds or ETFs is not included in the Fund's net investment income (loss) ratio.
CAmount represents less than $.005 per share.
DTotal distributions per share do not sum due to rounding.
ETotal returns would have been lower if certain expenses had not been reduced during the applicable periods shown.
FTotal returns do not include the effect of the sales charges.
GFees and expenses of any underlying mutual funds or exchange-traded funds (ETFs) are not included in the Fund's expense ratio. The Fund indirectly bears its proportionate share of these expenses. For additional expense information related to investments in Fidelity Central Funds, please refer to the "Investments in Fidelity Central Funds" note found in the Notes to Consolidated Financial Statements section of the most recent Annual or Semi-Annual report.
HExpense ratios reflect operating expenses of the class. Expenses before reductions do not reflect amounts reimbursed, waived, or reduced through arrangements with the investment adviser, brokerage services, or other offset arrangements, if applicable, and do not represent the amount paid by the class during periods when reimbursements, waivers or reductions occur.
IAmount does not include the portfolio activity of any underlying mutual funds or exchange-traded funds (ETFs), derivatives or securities that mature within one year from acquisition.
JPortfolio turnover rate excludes securities received or delivered in-kind.
Fidelity Advisor® New Insights Fund Class M |
| |
| Years ended December 31, | | 2024 | | 2023 | | 2022 | | 2021 | | 2020 |
Selected Per-Share Data | | | | | | | | | | |
| Net asset value, beginning of period | $ | 30.24 | $ | 23.85 | $ | 37.93 | $ | 34.81 | $ | 30.73 |
| Income from Investment Operations | | | | | | | | | | |
Net investment income (loss) A,B | | (.17) | | .01 | | .02 | | (.25) | | (.17) |
| Net realized and unrealized gain (loss) | | 10.68 | | 8.32 | | (10.34) | | 8.46 | | 7.22 |
| Total from investment operations | | 10.51 | | 8.33 | | (10.32) | | 8.21 | | 7.05 |
| Distributions from net investment income | | (.02) | | - C | | (.05) | | - | | - |
| Distributions from net realized gain | | (2.41) | | (1.94) | | (3.71) | | (5.09) | | (2.97) |
| Total distributions | | (2.43) | | (1.94) | | (3.76) | | (5.09) | | (2.97) |
| Net asset value, end of period | $ | 38.32 | $ | 30.24 | $ | 23.85 | $ | 37.93 | $ | 34.81 |
Total Return D,E | | | | 35.60% | | (27.64)% | | 24.00% | | 23.33% |
Ratios to Average Net Assets B,F,G | | | | | | | | | | |
| Expenses before reductions | | 1.15% | | .94% | | .95% | | 1.18% | | 1.35% |
| Expenses net of fee waivers, if any | | | | .93% | | .94% | | 1.18% | | 1.35% |
| Expenses net of all reductions | | 1.15% | | .93% | | .94% | | 1.18% | | 1.35% |
| Net investment income (loss) | | (.48)% | | .04% | | .07% | | (.65)% | | (.54)% |
| Supplemental Data | | | | | | | | | | |
| Net assets, end of period (000 omitted) | $ | 1,892,816 | $ | 1,537,166 | $ | 1,254,016 | $ | 2,027,325 | $ | 1,855,830 |
Portfolio turnover rate H | | | | 15% | | 32% I | | 29% | | 53% |
ACalculated based on average shares outstanding during the period.
BNet investment income (loss) is affected by the timing of the declaration of dividends by any underlying mutual funds or exchange-traded funds (ETFs). Net investment income (loss) of any mutual funds or ETFs is not included in the Fund's net investment income (loss) ratio.
CAmount represents less than $.005 per share.
DTotal returns would have been lower if certain expenses had not been reduced during the applicable periods shown.
ETotal returns do not include the effect of the sales charges.
FFees and expenses of any underlying mutual funds or exchange-traded funds (ETFs) are not included in the Fund's expense ratio. The Fund indirectly bears its proportionate share of these expenses. For additional expense information related to investments in Fidelity Central Funds, please refer to the "Investments in Fidelity Central Funds" note found in the Notes to Consolidated Financial Statements section of the most recent Annual or Semi-Annual report.
GExpense ratios reflect operating expenses of the class. Expenses before reductions do not reflect amounts reimbursed, waived, or reduced through arrangements with the investment adviser, brokerage services, or other offset arrangements, if applicable, and do not represent the amount paid by the class during periods when reimbursements, waivers or reductions occur.
HAmount does not include the portfolio activity of any underlying mutual funds or exchange-traded funds (ETFs), derivatives or securities that mature within one year from acquisition.
IPortfolio turnover rate excludes securities received or delivered in-kind.
Fidelity Advisor® New Insights Fund Class C |
| |
| Years ended December 31, | | 2024 | | 2023 | | 2022 | | 2021 | | 2020 |
Selected Per-Share Data | | | | | | | | | | |
| Net asset value, beginning of period | $ | 24.08 | $ | 19.41 | $ | 31.89 | $ | 30.09 | $ | 27.03 |
| Income from Investment Operations | | | | | | | | | | |
Net investment income (loss) A,B | | (.28) | | (.11) | | (.11) | | (.38) | | (.29) |
| Net realized and unrealized gain (loss) | | 8.50 | | 6.72 | | (8.66) | | 7.27 | | 6.32 |
| Total from investment operations | | 8.22 | | 6.61 | | (8.77) | | 6.89 | | 6.03 |
| Distributions from net investment income | | (.02) | | - C | | - | | - | | - |
| Distributions from net realized gain | | (2.41) | | (1.94) | | (3.71) | | (5.09) | | (2.97) |
| Total distributions | | (2.43) | | (1.94) | | (3.71) | | (5.09) | | (2.97) |
| Net asset value, end of period | $ | 29.87 | $ | 24.08 | $ | 19.41 | $ | 31.89 | $ | 30.09 |
Total Return D,E | | | | 34.86% | | (28.02)% | | 23.36% | | 22.74% |
Ratios to Average Net Assets B,F,G | | | | | | | | | | |
| Expenses before reductions | | 1.65% | | 1.45% | | 1.46% | | 1.70% | | 1.86% |
| Expenses net of fee waivers, if any | | | | 1.45% | | 1.46% | | 1.69% | | 1.86% |
| Expenses net of all reductions | | 1.65% | | 1.45% | | 1.46% | | 1.69% | | 1.86% |
| Net investment income (loss) | | (.97)% | | (.47)% | | (.45)% | | (1.17)% | | (1.05)% |
| Supplemental Data | | | | | | | | | | |
| Net assets, end of period (000 omitted) | $ | 664,701 | $ | 641,565 | $ | 672,129 | $ | 1,376,480 | $ | 1,973,253 |
Portfolio turnover rate H | | | | 15% | | 32% I | | 29% | | 53% |
ACalculated based on average shares outstanding during the period.
BNet investment income (loss) is affected by the timing of the declaration of dividends by any underlying mutual funds or exchange-traded funds (ETFs). Net investment income (loss) of any mutual funds or ETFs is not included in the Fund's net investment income (loss) ratio.
CAmount represents less than $.005 per share.
DTotal returns would have been lower if certain expenses had not been reduced during the applicable periods shown.
ETotal returns do not include the effect of the contingent deferred sales charge.
FFees and expenses of any underlying mutual funds or exchange-traded funds (ETFs) are not included in the Fund's expense ratio. The Fund indirectly bears its proportionate share of these expenses. For additional expense information related to investments in Fidelity Central Funds, please refer to the "Investments in Fidelity Central Funds" note found in the Notes to Consolidated Financial Statements section of the most recent Annual or Semi-Annual report.
GExpense ratios reflect operating expenses of the class. Expenses before reductions do not reflect amounts reimbursed, waived, or reduced through arrangements with the investment adviser, brokerage services, or other offset arrangements, if applicable, and do not represent the amount paid by the class during periods when reimbursements, waivers or reductions occur.
HAmount does not include the portfolio activity of any underlying mutual funds or exchange-traded funds (ETFs), derivatives or securities that mature within one year from acquisition.
IPortfolio turnover rate excludes securities received or delivered in-kind.
Fidelity Advisor® New Insights Fund Class I |
| |
| Years ended December 31, | | 2024 | | 2023 | | 2022 | | 2021 | | 2020 |
Selected Per-Share Data | | | | | | | | | | |
| Net asset value, beginning of period | $ | 34.00 | $ | 26.60 | $ | 41.73 | $ | 37.69 | $ | 32.90 |
| Income from Investment Operations | | | | | | | | | | |
Net investment income (loss) A,B | | .01 | | .17 | | .19 | | (.06) | | (.01) |
| Net realized and unrealized gain (loss) | | 12.02 | | 9.31 | | (11.41) | | 9.19 | | 7.78 |
| Total from investment operations | | 12.03 | | 9.48 | | (11.22) | | 9.13 | | 7.77 |
| Distributions from net investment income | | (.02) | | (.14) | | (.20) | | - | | - C |
| Distributions from net realized gain | | (2.41) | | (1.94) | | (3.71) | | (5.09) | | (2.97) |
| Total distributions | | (2.43) | | (2.08) | | (3.91) | | (5.09) | | (2.98) D |
| Net asset value, end of period | $ | 43.60 | $ | 34.00 | $ | 26.60 | $ | 41.73 | $ | 37.69 |
Total Return E | | | | 36.26% | | (27.28)% | | 24.62% | | 23.96% |
Ratios to Average Net Assets B,F,G | | | | | | | | | | |
| Expenses before reductions | | .65% | | .44% | | .45% | | .68% | | .85% |
| Expenses net of fee waivers, if any | | | | .43% | | .44% | | .68% | | .85% |
| Expenses net of all reductions | | .65% | | .43% | | .44% | | .68% | | .84% |
| Net investment income (loss) | | .03% | | .54% | | .57% | | (.15)% | | (.04)% |
| Supplemental Data | | | | | | | | | | |
| Net assets, end of period (000 omitted) | $ | 9,062,666 | $ | 7,795,989 | $ | 6,584,612 | $ | 12,335,063 | $ | 12,218,735 |
Portfolio turnover rate H | | | | 15% | | 32% I | | 29% | | 53% |
ACalculated based on average shares outstanding during the period.
BNet investment income (loss) is affected by the timing of the declaration of dividends by any underlying mutual funds or exchange-traded funds (ETFs). Net investment income (loss) of any mutual funds or ETFs is not included in the Fund's net investment income (loss) ratio.
CAmount represents less than $.005 per share.
DTotal distributions per share do not sum due to rounding.
ETotal returns would have been lower if certain expenses had not been reduced during the applicable periods shown.
FFees and expenses of any underlying mutual funds or exchange-traded funds (ETFs) are not included in the Fund's expense ratio. The Fund indirectly bears its proportionate share of these expenses. For additional expense information related to investments in Fidelity Central Funds, please refer to the "Investments in Fidelity Central Funds" note found in the Notes to Consolidated Financial Statements section of the most recent Annual or Semi-Annual report.
GExpense ratios reflect operating expenses of the class. Expenses before reductions do not reflect amounts reimbursed, waived, or reduced through arrangements with the investment adviser, brokerage services, or other offset arrangements, if applicable, and do not represent the amount paid by the class during periods when reimbursements, waivers or reductions occur.
HAmount does not include the portfolio activity of any underlying mutual funds or exchange-traded funds (ETFs), derivatives or securities that mature within one year from acquisition.
IPortfolio turnover rate excludes securities received or delivered in-kind.
Fidelity Advisor® New Insights Fund Class Z |
| |
| Years ended December 31, | | 2024 | | 2023 | | 2022 | | 2021 | | 2020 |
Selected Per-Share Data | | | | | | | | | | |
| Net asset value, beginning of period | $ | 34.14 | $ | 26.70 | $ | 41.89 | $ | 37.77 | $ | 32.93 |
| Income from Investment Operations | | | | | | | | | | |
Net investment income (loss) A,B | | .06 | | .21 | | .23 | | (.01) | | .03 |
| Net realized and unrealized gain (loss) | | 12.08 | | 9.35 | | (11.47) | | 9.22 | | 7.79 |
| Total from investment operations | | 12.14 | | 9.56 | | (11.24) | | 9.21 | | 7.82 |
| Distributions from net investment income | | (.02) | | (.18) | | (.24) | | - | | - C |
| Distributions from net realized gain | | (2.41) | | (1.94) | | (3.71) | | (5.09) | | (2.97) |
| Total distributions | | (2.43) | | (2.12) | | (3.95) | | (5.09) | | (2.98) D |
| Net asset value, end of period | $ | 43.85 | $ | 34.14 | $ | 26.70 | $ | 41.89 | $ | 37.77 |
Total Return E | | | | 36.43% | | (27.21)% | | 24.79% | | 24.09% |
Ratios to Average Net Assets B,F,G | | | | | | | | | | |
| Expenses before reductions | | .54% | | .32% | | .33% | | .56% | | .73% |
| Expenses net of fee waivers, if any | | | | .31% | | .32% | | .56% | | .73% |
| Expenses net of all reductions | | .54% | | .31% | | .32% | | .56% | | .72% |
| Net investment income (loss) | | .14% | | .66% | | .69% | | (.03)% | | .08% |
| Supplemental Data | | | | | | | | | | |
| Net assets, end of period (000 omitted) | $ | 2,281,119 | $ | 1,697,989 | $ | 1,232,534 | $ | 2,572,098 | $ | 2,100,757 |
Portfolio turnover rate H | | | | 15% | | 32% I | | 29% | | 53% |
ACalculated based on average shares outstanding during the period.
BNet investment income (loss) is affected by the timing of the declaration of dividends by any underlying mutual funds or exchange-traded funds (ETFs). Net investment income (loss) of any mutual funds or ETFs is not included in the Fund's net investment income (loss) ratio.
CAmount represents less than $.005 per share.
DTotal distributions per share do not sum due to rounding.
ETotal returns would have been lower if certain expenses had not been reduced during the applicable periods shown.
FFees and expenses of any underlying mutual funds or exchange-traded funds (ETFs) are not included in the Fund's expense ratio. The Fund indirectly bears its proportionate share of these expenses. For additional expense information related to investments in Fidelity Central Funds, please refer to the "Investments in Fidelity Central Funds" note found in the Notes to Consolidated Financial Statements section of the most recent Annual or Semi-Annual report.
GExpense ratios reflect operating expenses of the class. Expenses before reductions do not reflect amounts reimbursed, waived, or reduced through arrangements with the investment adviser, brokerage services, or other offset arrangements, if applicable, and do not represent the amount paid by the class during periods when reimbursements, waivers or reductions occur.
HAmount does not include the portfolio activity of any underlying mutual funds or exchange-traded funds (ETFs), derivatives or securities that mature within one year from acquisition.
IPortfolio turnover rate excludes securities received or delivered in-kind.
Notes to Consolidated Financial Statements
For the period ended December 31, 2024
1. Organization.
Fidelity Advisor New Insights Fund (the Fund) is a fund of Fidelity Contrafund (the Trust) and is authorized to issue an unlimited number of shares. The Trust is registered under the Investment Company Act of 1940, as amended (the 1940 Act), as an open-end management investment company organized as a Massachusetts business trust. The Fund offers Class A, Class M, Class C, Class I and Class Z shares, each of which has equal rights as to assets and voting privileges. Class A, Class M, Class C, Class I and Class Z are Fidelity Advisor classes. Each class has exclusive voting rights with respect to matters that affect that class. Class C shares will automatically convert to Class A shares after a holding period of eight years from the initial date of purchase, with certain exceptions.
2. Investments in Fidelity Central Funds.
Funds may invest in Fidelity Central Funds, which are open-end investment companies generally available only to other investment companies and accounts managed by the investment adviser and its affiliates. The Consolidated Schedule of Investments lists any Fidelity Central Funds held as an investment as of period end, but does not include the underlying holdings of each Fidelity Central Fund. An investing fund indirectly bears its proportionate share of the expenses of the underlying Fidelity Central Funds.
Based on its investment objective, each Fidelity Central Fund may invest or participate in various investment vehicles or strategies that are similar to those of the investing fund. These strategies are consistent with the investment objectives of the investing fund and may involve certain economic risks which may cause a decline in value of each of the Fidelity Central Funds and thus a decline in the value of the investing fund.
| Fidelity Central Fund | Investment Manager | Investment Objective | Investment Practices | Expense RatioA |
| Fidelity Money Market Central Funds | Fidelity Management & Research Company LLC (FMR) | Each fund seeks to obtain a high level of current income consistent with the preservation of capital and liquidity. | Short-term Investments | Less than .005% |
A Expenses expressed as a percentage of average net assets and are as of each underlying Central Fund's most recent annual or semi-annual shareholder report.
A complete unaudited list of holdings for each Fidelity Central Fund is available upon request or at the Securities and Exchange Commission website at www.sec.gov. In addition, the financial statements of the Fidelity Central Funds which contain the significant accounting policies (including investment valuation policies) of those funds, and are not covered by the Report of Independent Registered Public Accounting Firm, are available on the Securities and Exchange Commission website or upon request.
3. Significant Accounting Policies.
The Fund is an investment company and applies the accounting and reporting guidance of the Financial Accounting Standards Board (FASB) Accounting Standards Codification Topic 946 Financial Services - Investment Companies. The consolidated financial statements have been prepared in conformity with accounting principles generally accepted in the United States of America (GAAP), which require management to make certain estimates and assumptions at the date of the consolidated financial statements. Actual results could differ from those estimates. The Fund operates as a single operating segment. The Fund's income, expenses, assets, and performance are regularly monitored and assessed as a whole by the investment adviser and other individuals responsible for oversight functions of the Trust, using the information presented in the financial statements and financial highlights. Subsequent events, if any, through the date that the consolidated financial statements were issued have been evaluated in the preparation of the consolidated financial statements. The Fund's Consolidated Schedule of Investments lists any underlying mutual funds or exchange-traded funds (ETFs) but does not include the underlying holdings of these funds. The following summarizes the significant accounting policies of the Fund:
Investment Valuation. Investments are valued as of 4:00 p.m. Eastern time on the last calendar day of the period. The Board of Trustees (the Board) has designated the Fund's investment adviser as the valuation designee responsible for the fair valuation function and performing fair value determinations as needed. The investment adviser has established a Fair Value Committee (the Committee) to carry out the day-to-day fair valuation responsibilities and has adopted policies and procedures to govern the fair valuation process and the activities of the Committee. In accordance with these fair valuation policies and procedures, which have been approved by the Board, the Fund attempts to obtain prices from one or more third party pricing services or brokers to value its investments. When current market prices, quotations or currency exchange rates are not readily available or reliable, investments will be fair valued in good faith by the Committee, in accordance with the policies and procedures. Factors used in determining fair value vary by investment type and may include market or investment specific events, transaction data, estimated cash flows, and market observations of comparable investments. The frequency that the fair valuation procedures are used cannot be predicted and they may be utilized to a significant extent. The Committee manages the Fund's fair valuation practices and maintains the fair valuation policies and procedures. The Fund's investment adviser reports to the Board information regarding the fair valuation process and related material matters.
The Fund categorizes the inputs to valuation techniques used to value its investments into a disclosure hierarchy consisting of three levels as shown below:
Level 1 - unadjusted quoted prices in active markets for identical investments
Level 2 - other significant observable inputs (including quoted prices for similar investments, interest rates, prepayment speeds, etc.)
Level 3 - unobservable inputs (including the Fund's own assumptions based on the best information available)
Valuation techniques used to value the Fund's investments by major category are as follows:
Equity securities, including restricted securities, for which market quotations are readily available, are valued at the last reported sale price or official closing price as reported by a third party pricing service on the primary market or exchange on which they are traded and are categorized as Level 1 in the hierarchy. In the event there were no sales during the day or closing prices are not available, securities are valued at the last quoted bid price or may be valued using the last available price and are generally categorized as Level 2 in the hierarchy. For foreign equity securities, when market or security specific events arise, comparisons to the valuation of American Depositary Receipts (ADRs), futures contracts, Exchange-Traded Funds (ETFs) and certain indexes as well as quoted prices for similar securities may be used and would be categorized as Level 2 in the hierarchy. For equity securities, including restricted securities, where observable inputs are limited, assumptions about market activity and risk are used and these securities may be categorized as Level 3 in the hierarchy. Securities, including private placements or other restricted securities, for which observable inputs are not available are valued using alternate valuation approaches, including the market approach, the income approach and cost approach, and are categorized as Level 3 in the hierarchy. The market approach considers factors including the price of recent investments in the same or a similar security or financial metrics of comparable securities. The income approach considers factors including expected future cash flows, security specific risks and corresponding discount rates. The cost approach considers factors including the value of the security's underlying assets and liabilities.
Debt securities, including restricted securities, are valued based on evaluated prices received from third party pricing services or from brokers who make markets in such securities. Preferred securities are valued by pricing services who utilize matrix pricing which considers yield or price of bonds of comparable quality, coupon, maturity and type or by broker-supplied prices. When independent prices are unavailable or unreliable, debt securities may be valued utilizing pricing methodologies which consider similar factors that would be used by third party pricing services. Debt securities are generally categorized as Level 2 in the hierarchy but may be Level 3 depending on the circumstances.
Investments in open-end mutual funds, including the Fidelity Central Funds, are valued at their closing net asset value (NAV) each business day and are categorized as Level 1 in the hierarchy.
The following provides information on Level 3 securities held by the Fund that were valued at period end based on unobservable inputs. These amounts exclude valuations provided by a broker.
| Asset Type | Fair Value | Valuation Technique(s) | Unobservable Input | Amount or Range/Weighted Average | Impact to Valuation from an Increase in InputA |
| Common Stocks | $675,953,795 | Market comparable | Enterprise value/Revenue multiple (EV/R) | 1.5 - 61.8 / 12.6 | Increase |
| | | | Enterprise value/EBITDA multiple (EV/EBITDA) | 21.3 - 33.4 / 32.5 | Increase |
| | | | Enterprise value/Net income multiple (EV/NI) | 14.0 | Increase |
| | | Recovery value | Recovery value | $0.00 - $0.17 / $0.14 | Increase |
| | | Black scholes | Discount rate | 4.3% - 4.4% / 4.4% | Increase |
| | | | Term | 1.0 - 5.0 / 2.1 | Increase |
| | | | Volatility | 60.0% - 100.0% / 60.1% | Increase |
| Convertible Preferred Stocks | $581,651,742 | Market comparable | Enterprise value/Revenue multiple (EV/R) | 0.9 - 61.8 / 18.4 | Increase |
| | | | Enterprise value/EBITDA multiple (EV/EBITDA) | 33.4 | Increase |
| | | Market approach | Transaction price | $20.85 | Increase |
| | | | Discount rate | 85.0% | Decrease |
| | | Recovery value | Recovery value | $0.00 | Increase |
| | | Black scholes | Discount rate | 4.3% - 4.4% / 4.3% | Increase |
| | | | Term | 2.0 - 5.0 / 2.8 | Increase |
| | | | Volatility | 60.0% - 80.0% / 76.8% | Increase |
| Preferred Securities | $637,289 | Market comparable | Enterprise value/Revenue multiple (EV/R) | 1.5 | Increase |
| | | Recovery value | Recovery value | $0.00 | Increase |
| | | Black scholes | Discount rate | 4.4% | Increase |
| | | | Term | 2.1 | Increase |
| | | | Volatility | 60.0% | Increase |
A Represents the directional change in the fair value of the Level 3 investments that could have resulted from an increase in the corresponding input as of period end. A decrease to the unobservable input would have had the opposite effect. Significant changes in these inputs may have resulted in a significantly higher or lower fair value measurement at period end.
Changes in valuation techniques may result in transfers in or out of an assigned level within the disclosure hierarchy. The aggregate value of investments by input level as of December 31, 2024, as well as a roll forward of Level 3 investments, is included at the end of the Fund's Consolidated Schedule of Investments.
Foreign Currency. Certain Funds may use foreign currency contracts to facilitate transactions in foreign-denominated securities. Gains and losses from these transactions may arise from changes in the value of the foreign currency or if the counterparties do not perform under the contracts' terms.
Foreign-denominated assets, including investment securities, and liabilities are translated into U.S. dollars at the exchange rates at period end. Purchases and sales of investment securities, income and dividends received, and expenses denominated in foreign currencies are translated into U.S. dollars at the exchange rate in effect on the transaction date.
The effects of exchange rate fluctuations on investments are included with the net realized and unrealized gain (loss) on investment securities. Other foreign currency transactions resulting in realized and unrealized gain (loss) are disclosed separately.
Investment Transactions and Income. For financial reporting purposes, the Fund's investment holdings and NAV include trades executed through the end of the last business day of the period. The NAV per share for processing shareholder transactions is calculated as of the close of business of the New York Stock Exchange (NYSE), normally 4:00 p.m. Eastern time and includes trades executed through the end of the prior business day. Gains and losses on securities sold are determined on the basis of identified cost and include proceeds received from litigation. Commissions paid to certain brokers with whom the investment adviser, or its affiliates, places trades on behalf of a fund include an amount in addition to trade execution, which may be rebated back to a fund. Any such rebates are included in net realized gain (loss) on investments in the Consolidated Statement of Operations. Dividend income is recorded on the ex-dividend date, except for certain dividends from foreign securities where the ex-dividend date may have passed, which are recorded as soon as the Fund is informed of the ex-dividend date. Non-cash dividends included in dividend income, if any, are recorded at the fair market value of the securities received. Income and capital gain distributions from Fidelity Central Funds, if any, are recorded on the ex-dividend date. Certain distributions received by the Fund represent a return of capital or capital gain. The Fund determines the components of these distributions subsequent to the ex-dividend date, based upon receipt of tax filings or other correspondence relating to the underlying investment. These distributions are recorded as a reduction of cost of investments and/or as a realized gain. Interest income is accrued as earned and includes coupon interest and amortization of premium and accretion of discount on debt securities as applicable. Investment income is recorded net of foreign taxes withheld where recovery of such taxes is uncertain. Funds may file withholding tax reclaims in certain jurisdictions to recover a portion of amounts previously withheld. Any withholding tax reclaims income is included in the Consolidated Statement of Operations in dividends. Any receivables for withholding tax reclaims are included in the Consolidated Statement of Assets and Liabilities in dividends receivable.
Class Allocations and Expenses. Investment income, realized and unrealized capital gains and losses, common expenses of a fund, and certain fund-level expense reductions, if any, are allocated daily on a pro-rata basis to each class based on the relative net assets of each class to the total net assets of a fund. Each class differs with respect to transfer agent and distribution and service plan fees incurred, as applicable. Certain expense reductions may also differ by class, if applicable. For the reporting period, the allocated portion of income and expenses to each class as a percent of its average net assets may vary due to the timing of recording these transactions in relation to fluctuating net assets of the classes. Expenses directly attributable to a fund are charged to that fund. Expenses attributable to more than one fund are allocated among the respective funds on the basis of relative net assets or other appropriate methods. Expenses included in the accompanying consolidated financial statements reflect the expenses of that fund and do not include any expenses associated with any underlying mutual funds or exchange-traded funds (ETFs). Although not included in a fund's expenses, a fund indirectly bears its proportionate share of these expenses through the net asset value of each underlying mutual fund or exchange-traded fund (ETF). Expense estimates are accrued in the period to which they relate and adjustments are made when actual amounts are known.
Deferred Trustee Compensation. Under a Deferred Compensation Plan (the Plan) for certain Funds, certain independent Trustees have elected to defer receipt of a portion of their annual compensation. Deferred amounts are invested in affiliated mutual funds, are marked-to-market and remain in a fund until distributed in accordance with the Plan. The investment of deferred amounts and the offsetting payable to the Trustees presented below are included in the accompanying Consolidated Statement of Assets and Liabilities in other receivables and other payables and accrued expenses, as applicable.
| Fidelity Advisor New Insights Fund | $918,532 |
Income Tax Information and Distributions to Shareholders. Each year, the Fund intends to qualify as a regulated investment company under Subchapter M of the Internal Revenue Code, including distributing substantially all of its taxable income and realized gains. As a result, no provision for U.S. Federal income taxes is required. As of December 31, 2024, the Fund did not have any unrecognized tax benefits in the consolidated financial statements; nor is the Fund aware of any tax positions for which it is reasonably possible that the total amounts of unrecognized tax benefits will significantly change in the next twelve months. The Fund files a U.S. federal tax return, in addition to state and local tax returns as required. The Fund's federal income tax returns are subject to examination by the Internal Revenue Service (IRS) for a period of three fiscal years after they are filed. State and local tax returns may be subject to examination for an additional fiscal year depending on the jurisdiction. Foreign taxes are provided for based on the Fund's understanding of the tax rules and rates that exist in the foreign markets in which it invests. The Fund is subject to a tax imposed on capital gains by certain countries in which it invests. An estimated deferred tax liability for net unrealized appreciation on the applicable securities is included in Other payables and accrued expenses on the Consolidated Statement of Assets and Liabilities.
Distributions are declared and recorded on the ex-dividend date. Income and capital gain distributions are declared separately for each class. Income and capital gain distributions are determined in accordance with income tax regulations, which may differ from GAAP. In addition, the Fund claimed a portion of the payment made to redeeming shareholders as a distribution for income tax purposes.
Capital accounts within the consolidated financial statements are adjusted for permanent book-tax differences. These adjustments have no impact on net assets or the results of operations. Capital accounts are not adjusted for temporary book-tax differences which will reverse in a subsequent period.
Book-tax differences are primarily due to foreign currency transactions, certain foreign taxes, passive foreign investment companies (PFIC), redemptions in-kind, partnerships, deferred Trustee compensation, net operating losses and losses deferred due to wash sales.
As of period end, the cost and unrealized appreciation (depreciation) in securities, and derivatives if applicable, for federal income tax purposes were as follows:
| Gross unrealized appreciation | $14,946,749,642 |
| Gross unrealized depreciation | (256,136,816) |
| Net unrealized appreciation (depreciation) | $14,690,612,826 |
| Tax Cost | $7,388,237,702 |
The tax-based components of distributable earnings as of period end were as follows:
| Undistributed long-term capital gain | $277,527,657 | |
| Net unrealized appreciation (depreciation) on securities and other investments | $14,690,541,107 | |
The tax character of distributions paid was as follows:
| | December 31, 2024 | December 31, 2023 |
| Ordinary Income | $8,328,554 | $ 52,265,020 |
| Long-term Capital Gains | 1,225,966,309 | 1,047,447,921 |
| Total | $1,234,294,863 | $ 1,099,712,941 |
Restricted Securities (including Private Placements). Funds may invest in securities that are subject to legal or contractual restrictions on resale. These securities generally may be resold in transactions exempt from registration or to the public if the securities are registered. Disposal of these securities may involve time-consuming negotiations and expense, and prompt sale at an acceptable price may be difficult. Information regarding restricted securities held at period end is included at the end of the Consolidated Schedule of Investments, if applicable.
Special Purpose Acquisition Companies. Funds may invest in stock, warrants, and other securities of special purpose acquisition companies (SPACs) or similar special purpose entities. A SPAC is a publicly traded company that raises investment capital via an initial public offering (IPO) for the purpose of acquiring the equity securities of one or more existing companies via reorganization, business combination, acquisition or other similar transactions within a designated time frame.
Private Investment in Public Equity. Funds may acquire equity securities of an issuer through a private investment in a public equity (PIPE) transaction, including through commitments to purchase securities on a when-issued basis. A PIPE typically involves the purchase of securities directly from a publicly traded company in a private placement transaction. Securities purchased through PIPE transactions will be restricted from trading and considered illiquid until a resale registration statement for the shares is filed and declared effective.
At the current and/or prior period end, the Fund had commitments to purchase when-issued securities through PIPE transactions with SPACs. The commitments are contingent upon the SPACs acquiring the securities of target companies. Unrealized appreciation (depreciation) on any commitments outstanding at period end is separately presented in the Consolidated Statement of Assets and Liabilities as Unrealized appreciation (depreciation) on unfunded commitments, and any change in unrealized appreciation (depreciation) on unfunded commitments during the period is separately presented in the Consolidated Statement of Operations, as applicable.
Consolidated Subsidiary. The Funds included in the table below hold certain investments through a wholly-owned subsidiary ("Subsidiary"), which may be subject to federal and state taxes upon disposition.
As of period end, investments in Subsidiaries were as follows:
| | Amount ($) | % of Net Assets |
| Fidelity Advisor New Insights Fund | 26,250,684 | .12 |
The financial statements have been consolidated to include the Subsidiary accounts where applicable. Accordingly, all inter-company transactions and balances have been eliminated.
At period end, any estimated tax liability for these investments is presented as "Deferred taxes" in the Consolidated Statement of Assets and Liabilities and included in "Change in net unrealized appreciation (depreciation) on investment securities" in the Consolidated Statement of Operations. The tax liability incurred may differ materially depending on conditions when these investments are disposed. Any cash held by a Subsidiary is restricted as to its use and is presented as "Restricted cash" in the Consolidated Statement of Assets and Liabilities, if applicable.
New Accounting Pronouncement. FASB Accounting Standards Update (ASU) 2023-07 Segment Reporting (Topic 280): Improvements to Reportable Segment Disclosures became effective in this reporting period. ASU 2023-07 enhances segment information disclosure in the notes to financial statements.
4. Derivative Instruments.
Risk Exposures and the Use of Derivative Instruments. The Fund's investment objectives allow for various types of derivative instruments, including futures contracts. Derivatives are investments whose value is primarily derived from underlying assets, indices or reference rates and may be transacted on an exchange or over-the-counter (OTC). Derivatives may involve a future commitment to buy or sell a specified asset based on specified terms, to exchange future cash flows at periodic intervals based on a notional principal amount, or for one party to make one or more payments upon the occurrence of specified events in exchange for periodic payments from the other party.
Derivatives were used to increase returns and to manage exposure to certain risks as defined below. The success of any strategy involving derivatives depends on analysis of numerous economic factors, and if the strategies for investment do not work as intended, the objectives may not be achieved.
Derivatives were used to increase or decrease exposure to the following risk(s):
| | |
| Equity Risk | Equity risk relates to the fluctuations in the value of financial instruments as a result of changes in market prices (other than those arising from interest rate risk or foreign exchange risk), whether caused by factors specific to an individual investment, its issuer, or all factors affecting all instruments traded in a market or market segment. |
Funds are also exposed to additional risks from investing in derivatives, such as liquidity risk and counterparty credit risk. Liquidity risk is the risk that a fund will be unable to close out the derivative in the open market in a timely manner. Counterparty credit risk is the risk that the counterparty will not be able to fulfill its obligation to a fund. Counterparty credit risk related to exchange-traded contracts may be mitigated by the protection provided by the exchange on which they trade.
Investing in derivatives may involve greater risks than investing in the underlying assets directly and, to varying degrees, may involve risk of loss in excess of any initial investment and collateral received and amounts recognized in the Consolidated Statement of Assets and Liabilities. In addition, there may be the risk that the change in value of the derivative contract does not correspond to the change in value of the underlying instrument.
Futures Contracts. A futures contract is an agreement between two parties to buy or sell a specified underlying instrument for a fixed price at a specified future date. Futures contracts were used to manage exposure to the stock market.
Upon entering into a futures contract, a fund is required to deposit either cash or securities (initial margin) with a clearing broker in an amount equal to a certain percentage of the face value of the contract. Futures contracts are marked-to-market daily and subsequent daily payments are made or received by a fund depending on the daily fluctuations in the value of the futures contracts and are recorded as unrealized appreciation or (depreciation). This receivable and/or payable, if any, is included in daily variation margin on futures contracts in the Consolidated Statement of Assets and Liabilities. Realized gain or (loss) is recorded upon the expiration or closing of a futures contract. The net realized gain (loss) and change in net unrealized appreciation (depreciation) on futures contracts during the period is presented in the Consolidated Statement of Operations.
Any open futures contracts at period end are presented in the Consolidated Schedule of Investments under the caption "Futures Contracts". The notional amount at value reflects each contract's exposure to the underlying instrument or index at period end, and is representative of volume of activity during the period.
Any securities deposited to meet initial margin requirements are identified in the Consolidated Schedule of Investments. Any cash deposited to meet initial margin requirements is presented as segregated cash with brokers for derivative instruments in the Consolidated Statement of Assets and Liabilities.
5. Purchases and Sales of Investments.
Purchases and sales of securities, other than short-term securities and in-kind transactions, as applicable, are noted in the table below.
| | Purchases ($) | Sales ($) |
| Fidelity Advisor New Insights Fund | 3,726,076,324 | 5,192,696,767 |
Unaffiliated Redemptions In-Kind. Shares that were redeemed in-kind for investments, including accrued interest and cash, if any, are shown in the table below. The net realized gain or loss on investments delivered through in-kind redemptions is included in the "Net realized gain (loss) on: Redemptions in-kind" line in the accompanying Consolidated Statement of Operations. The amount of the in-kind redemptions is included in share transactions in the accompanying Consolidated Statement of Changes in Net Assets. There was no gain or loss for federal income tax purposes.
| | Shares | Total net realized gain or loss ($) | Total Proceeds ($) |
| Fidelity Advisor New Insights Fund | 16,097,862 | 419,290,241 | 649,888,338 |
6. Fees and Other Transactions with Affiliates.
Management Fee. Fidelity Management & Research Company LLC (the investment adviser) and its affiliates provide the Fund with investment management related services for which the Fund pays a monthly management fee.
Effective March 1, 2024, the Fund's management contract was amended to incorporate administrative services previously covered under separate services agreements (Transfer Agent and Accounting agreements). The amended contract incorporates a basic fee rate that may vary by class (subject to a performance adjustment). The investment adviser or an affiliate pays certain expenses of managing and operating the Fund out of each class's management fee. Each class of the Fund pays a management fee to the investment adviser. The management fee is calculated and paid to the investment adviser every month. The management fee is determined by calculating a basic fee and then applying a performance adjustment. When determining a class's basic fee, a mandate rate is calculated based on the monthly average net assets of a group of funds advised by FMR within a designated asset class. A discount rate is subtracted from the mandate rate once the Fund's monthly average net assets reach a certain level. The mandate rate and discount rate may vary by class. The annual basic fee rate for a class of shares of the Fund is the lesser of (1) the class's mandate rate reduced by the class's discount rate (if applicable) or (2) the amount set forth in the following table.
| | Maximum Management Fee Rate % |
| Class A | .66 |
| Class M | .66 |
| Class C | .68 |
| Class I | .66 |
| Class Z | .54 |
One-twelfth of the basic fee rate for a class is applied to the average net assets of the class for the month, giving a dollar amount which is the basic fee for the class for that month. A different management fee rate may be applicable to each class of the Fund. The difference between classes is the result of separate arrangements for class-level services and/or waivers of certain expenses. It is not the result of any difference in advisory or custodial fees or other expenses related to the management of the Fund's assets, which do not vary by class. For the portion of the reporting period on or after March 1, 2024, the total annualized management fee rates were as follows:
| | Total Management Fee Rate % |
| Class A | .66 |
| Class M | .66 |
| Class C | .66 |
| Class I | .66 |
| Class Z | .54 |
Prior to March 1, 2024, the management fee was the sum of an individual fund fee rate that was based on an annual rate of .30% of the Fund's average net assets and an annualized group fee rate that averaged .22% during the period. The group fee rate was based upon the monthly average net assets of a group of registered investment companies with which the investment adviser has management contracts. The group fee rate decreased as assets under management increased and increased as assets under management decreased. For the portion of the reporting period prior to March 1, 2024, the total annualized management fee rate was .52%.
The performance adjustment rate is calculated monthly by comparing over the performance period the Fund's performance to that of the performance adjustment index listed below.
| | Performance Adjustment Index |
| Fidelity Advisor New Insights Fund | S&P 500 Index |
For the purposes of calculating the performance adjustment for the Fund, the Fund's investment performance is based on the performance of Class I. To the extent that other classes of the Fund have higher expenses, this could result in those classes bearing a larger positive performance adjustment and smaller negative performance adjustment than would be the case if each class's own performance were considered. The performance period is the most recent 36 month period. The maximum annualized performance adjustment rate is ±.20% of the Fund's average net assets over the performance period. The performance adjustment rate is divided by twelve and multiplied by the Fund's average net assets over the performance period, and the resulting dollar amount is proportionately added to or subtracted from a class's basic fee. For the entire reporting period, the total annual performance adjustment was (.01) %.
Effective March 1, 2024, the Fund's sub-advisory agreements with FMR Investment Management (UK) Limited, Fidelity Management & Research (Hong Kong) Limited, and Fidelity Management & Research (Japan) Limited were amended to provide that the investment adviser pays each sub-adviser monthly fees equal to 110% of the sub-adviser's costs for providing sub-advisory services.
Distribution and Service Plan Fees. In accordance with Rule 12b-1 of the 1940 Act, the Fund has adopted separate Distribution and Service Plans for each class of shares. Certain classes pay Fidelity Distributors Company LLC (FDC), an affiliate of the investment adviser, separate Distribution and Service Fees, each of which is based on an annual percentage of each class' average net assets. In addition, FDC may pay financial intermediaries for selling shares of the Fund and providing shareholder support services. For the period, the Distribution and Service Fee rates, total fees and amounts retained by FDC were as follows:
| | Distribution Fee | Service Fee | Total Fees ($) | Retained by FDC ($) |
| Class A | - % | .25% | 18,483,650 | 101,686 |
| Class M | .25% | .25% | 8,932,555 | 10,355 |
| Class C | .75% | .25% | 6,755,152 | 471,147 |
| | | | 34,171,357 | 583,188 |
Sales Load. FDC may receive a front-end sales charge of up to 5.75% for selling Class A shares and 3.50% for selling Class M shares, some of which is paid to financial intermediaries for selling shares of the Fund. Depending on the holding period, FDC may receive contingent deferred sales charges levied on Class A, Class M and Class C redemptions. The deferred sales charges are 1.00% for Class C shares, 1.00% for certain purchases of Class A shares and .25% for certain purchases of Class M shares.
For the period, sales charge amounts retained by FDC were as follows:
| | Retained by FDC ($) |
| Class A | 752,331 |
| Class M | 68,551 |
Class CA | 7,894 |
| | 828,776 |
A When Class C shares are initially sold, FDC pays commissions from its own resources to financial intermediaries through which the sales are made.
Transfer Agent Fees. Fidelity Investments Institutional Operations Company LLC (FIIOC), an affiliate of the investment adviser, is the transfer, dividend disbursing and shareholder servicing agent for each class of the Fund. Effective March 1, 2024, the Fund's management contract was amended to incorporate transfer agent services and associated fees previously covered under a separate services agreement. FIIOC pays for typesetting, printing and mailing of shareholder reports, except proxy statements.
During the period January 1, 2024 through February 29, 2024, the transfer agent fees for each class were a fixed annual rate of class-level average net assets as follows:
| | Amount ($) | % of Class-Level Average Net Assets | |
| Class A | 1,798,562 | .1618 | |
| Class M | 431,138 | .1598 | |
| Class C | 194,060 | .1752 | |
| Class I | 2,226,772 | .1627 | |
| Class Z | 126,169 | .0420 | |
| | 4,776,701 | |
| | | | |
Accounting Fees. Fidelity Service Company, Inc. (FSC), an affiliate of the investment adviser, maintains the Fund's accounting records. Effective March 1, 2024, the Fund's management contract was amended to incorporate accounting services and associated fees previously covered under a separate services agreement.
During the period January 1, 2024 through February 29, 2024, the accounting fees were a fixed annual rate of average net assets as follows:
| | % of Average Net Assets |
| Fidelity Advisor New Insights Fund | .0084 |
Brokerage Commissions. A portion of portfolio transactions were placed with brokerage firms which are affiliates of the investment adviser. Brokerage commissions are included in net realized gain (loss) and change in net unrealized appreciation (depreciation) in the Consolidated Statement of Operations. The commissions paid to these affiliated firms were as follows:
| | Amount ($) |
| Fidelity Advisor New Insights Fund | 57,346 |
Interfund Trades. Funds may purchase from or sell securities to other Fidelity Funds under procedures adopted by the Board. The procedures have been designed to ensure these interfund trades are executed in accordance with Rule 17a-7 of the 1940 Act. Any interfund trades are included within the respective purchases and sales amounts shown in the Purchases and Sales of Investments note. Interfund trades during the period are noted in the table below.
| | Purchases ($) | Sales ($) | Realized Gain (Loss) ($) |
| Fidelity Advisor New Insights Fund | 214,739,648 | 371,853,336 | 134,637,003 |
Other. During the period, the investment adviser reimbursed the Fund for certain losses as follows:
| | Amount ($) |
| Fidelity Advisor New Insights Fund | 1,432 |
| | |
7. Committed Line of Credit.
Certain Funds participate with other funds managed by the investment adviser or an affiliate in a $4.25 billion credit facility (the "line of credit") to be utilized for temporary or emergency purposes to fund shareholder redemptions or for other short-term liquidity purposes.
Commitment fees are charged based on the unused amount of the line of credit at an annual rate of .10%, and then allocated to each participating fund based on its pro-rata portion of the line of credit. The commitment fees are reflected in Miscellaneous expenses on the Consolidated Statement of Operations, and are listed below.
Interest is charged to a participating fund based on its borrowings at an annual rate of .75% plus the highest of (i) daily SOFR plus a .10% spread adjustment, (ii) Federal Funds Effective Rate, or (iii) Overnight Bank Funding Rate. During the period, there were no borrowings on this line of credit.
The line of credit agreement will expire in March 2025 unless extended or renewed.
| | Amount ($) |
| Fidelity Advisor New Insights Fund | 31,187 |
| | |
8. Security Lending.
Funds lend portfolio securities from time to time in order to earn additional income. Lending agents are used, including National Financial Services (NFS), an affiliate of the investment adviser. Pursuant to a securities lending agreement, NFS will receive a fee, which is capped at 9.9% of a fund's daily lending revenue, for its services as lending agent. A fund may lend securities to certain qualified borrowers, including NFS. On the settlement date of the loan, a fund receives collateral (in the form of U.S. Treasury obligations, letters of credit and/or cash) against the loaned securities and maintains collateral in an amount not less than 100% of the market value of the loaned securities during the period of the loan. The market value of the loaned securities is determined at the close of business of a fund and any additional required collateral is delivered to a fund on the next business day. A fund or borrower may terminate the loan at any time, and if the borrower defaults on its obligation to return the securities loaned because of insolvency or other reasons, a fund may apply collateral received from the borrower against the obligation. A fund may experience delays and costs in recovering the securities loaned. Any cash collateral received is invested in the Fidelity Securities Lending Cash Central Fund. Any loaned securities are identified as such in the Consolidated Schedule of Investments, and the value of loaned securities and cash collateral at period end, as applicable, are presented in the Consolidated Statement of Assets and Liabilities. Security lending income represents the income earned on investing cash collateral, less rebates paid to borrowers and any lending agent fees associated with the loan, plus any premium payments received for lending certain types of securities. Security lending income is presented in the Consolidated Statement of Operations as a component of income from Fidelity Central Funds. Affiliated security lending activity, if any, was as follows:
| | Total Security Lending Fees Paid to NFS ($) | Security Lending Income From Securities Loaned to NFS ($) | Value of Securities Loaned to NFS at Period End ($) |
| Fidelity Advisor New Insights Fund | 32,726 | 2,352 | - |
9. Expense Reductions.
During the period the investment adviser or an affiliate reimbursed and/or waived a portion of fund-level operating expenses in the amount of $828,700.
10. Distributions to Shareholders.
Distributions to shareholders of each class were as follows:
| | Year ended December 31, 2024 | Year ended December 31, 2023 |
| Fidelity Advisor New Insights Fund | | |
| Distributions to shareholders | | |
| Class A | $444,889,868 | $378,729,823 |
| Class M | 115,171,352 | 95,811,361 |
| Class C | 52,403,157 | 53,086,384 |
| Class I | 494,509,886 | 472,394,959 |
| Class Z | 127,320,600 | 99,690,414 |
Total | $1,234,294,863 | $1,099,712,941 |
11. Share Transactions.
Share transactions for each class were as follows and may contain in-kind transactions, automatic conversions between classes or exchanges between affiliated funds:
| | Shares | Shares | Dollars | Dollars |
| | Year ended December 31, 2024 | Year ended December 31, 2023 | Year ended December 31, 2024 | Year ended December 31, 2023 |
| Fidelity Advisor New Insights Fund | | | | |
| Class A | | | | |
| Shares sold | 11,655,223 | 12,899,491 | $456,328,249 | $381,821,358 |
| Reinvestment of distributions | 9,905,753 | 11,775,998 | 421,256,507 | 358,110,055 |
| Shares redeemed | (25,294,216) | (30,528,497) | (989,115,170) | (898,022,889) |
| Net increase (decrease) | (3,733,240) | (5,853,008) | $(111,530,414) | $(158,091,476) |
| Class M | | | | |
| Shares sold | 2,844,770 | 2,294,145 | $103,036,376 | $63,582,152 |
| Reinvestment of distributions | 2,858,247 | 3,312,319 | 112,384,623 | 93,718,113 |
| Shares redeemed | (7,134,562) | (7,359,727) | (258,927,025) | (203,356,413) |
| Net increase (decrease) | (1,431,545) | (1,753,263) | $(43,506,026) | $(46,056,148) |
| Class C | | | | |
| Shares sold | 2,148,749 | 1,912,643 | $62,178,877 | $42,813,574 |
| Reinvestment of distributions | 1,688,218 | 2,320,690 | 51,766,614 | 52,323,390 |
| Shares redeemed | (8,223,325) | (12,230,884) | (235,053,373) | (271,137,293) |
| Net increase (decrease) | (4,386,358) | (7,997,551) | $(121,107,882) | $(176,000,329) |
| Class I | | | | |
| Shares sold | 38,417,922 | 25,282,080 | $1,576,251,183 | $785,846,570 |
| Reinvestment of distributions | 10,241,097 | 13,705,916 | 457,276,599 | 436,108,435 |
| Shares redeemed | (70,102,386) | (57,287,276) | (2,853,278,625) | (1,762,092,847) |
| Net increase (decrease) | (21,443,367) | (18,299,280) | $(819,750,843) | $(540,137,842) |
| Class Z | | | | |
| Shares sold | 11,959,909 | 12,387,858 | $500,031,493 | $395,001,100 |
| Reinvestment of distributions | 2,333,214 | 2,612,026 | 105,000,054 | 83,691,200 |
| Shares redeemed | (12,004,025) | (11,433,870) | (504,477,754) | (350,096,994) |
| Net increase (decrease) | 2,289,098 | 3,566,014 | $100,553,793 | $128,595,306 |
12. Other.
A fund's organizational documents provide former and current trustees and officers with a limited indemnification against liabilities arising in connection with the performance of their duties to the fund. In the normal course of business, a fund may also enter into contracts that provide general indemnifications. A fund's maximum exposure under these arrangements is unknown as this would be dependent on future claims that may be made against a fund. The risk of material loss from such claims is considered remote.
13. Risk and Uncertainties.
Many factors affect a fund's performance. Developments that disrupt global economies and financial markets, such as pandemics, epidemics, outbreaks of infectious diseases, war, terrorism, and environmental disasters, may significantly affect a fund's investment performance. The effects of these developments to a fund will be impacted by the types of securities in which a fund invests, the financial condition, industry, economic sector, and geographic location of an issuer, and a fund's level of investment in the securities of that issuer. Significant concentrations in security types, issuers, industries, sectors, and geographic locations may magnify the factors that affect a fund's performance.
Report of Independent Registered Public Accounting Firm
To the Board of Trustees of Fidelity Contrafund and Shareholders of Fidelity Advisor New Insights Fund
Opinion on the Financial Statements
We have audited the accompanying consolidated statement of assets and liabilities, including the consolidated schedule of investments, of Fidelity Advisor New Insights Fund and its subsidiaries (one of the funds constituting Fidelity Contrafund, referred to hereafter as the "Fund") as of December 31, 2024, the related consolidated statement of operations for the year ended December 31, 2024, the consolidated statement of changes in net assets for each of the two years in the period ended December 31, 2024, including the related notes, and the consolidated financial highlights for each of the five years in the period ended December 31, 2024 (collectively referred to as the "consolidated financial statements"). In our opinion, the consolidated financial statements present fairly, in all material respects, the financial position of the Fund as of December 31, 2024, the results of its operations for the year then ended, the changes in its net assets for each of the two years in the period ended December 31, 2024 and the financial highlights for each of the five years in the period ended December 31, 2024 in conformity with accounting principles generally accepted in the United States of America.
Basis for Opinion
These consolidated financial statements are the responsibility of the Fund's management. Our responsibility is to express an opinion on the Fund's consolidated financial statements based on our audits. We are a public accounting firm registered with the Public Company Accounting Oversight Board (United States) (PCAOB) and are required to be independent with respect to the Fund in accordance with the U.S. federal securities laws and the applicable rules and regulations of the Securities and Exchange Commission and the PCAOB.
We conducted our audits of these consolidated financial statements in accordance with the standards of the PCAOB. Those standards require that we plan and perform the audit to obtain reasonable assurance about whether the financial statements are free of material misstatement, whether due to error or fraud.
Our audits included performing procedures to assess the risks of material misstatement of the consolidated financial statements, whether due to error or fraud, and performing procedures that respond to those risks. Such procedures included examining, on a test basis, evidence regarding the amounts and disclosures in the consolidated financial statements. Our audits also included evaluating the accounting principles used and significant estimates made by management, as well as evaluating the overall presentation of the consolidated financial statements. Our procedures included confirmation of securities owned as of December 31, 2024 by correspondence with the custodian, issuers of privately offered securities and brokers; when replies were not received from brokers, we performed other auditing procedures. We believe that our audits provide a reasonable basis for our opinion.
/s/ PricewaterhouseCoopers LLP
Boston, Massachusetts
February 11, 2025
We have served as the auditor of one or more investment companies in the Fidelity group of funds since 1932.
Distributions
(Unaudited)The dividend and capital gains distributions for the fund(s) are available on Fidelity.com or Institutional.Fidelity.com.
The fund hereby designates as a capital gain dividend with respect to the taxable year ended December 31, 2024, $1,575,019,596, or, if subsequently determined to be different, the net capital gain of such year.
Class A, Class C, Class M, Class I, and Class Z designate 100% of the dividends distributed during the fiscal year as qualifying for the dividends-received deduction for corporate shareholders.
Class A, Class C, Class M, Class I, and Class Z designate 100% of the dividends distributed during the fiscal year as amounts which may be taken into account as a dividend for the purposes of the maximum rate under section 1(h)(11) of the Internal Revenue Code.
The fund will notify shareholders in January 2025 of amounts for use in preparing 2024 income tax returns.
Item 8: Changes in and Disagreements with Accountants for Open-End Management Investment Companies
(Unaudited)
Note: This is not applicable for any fund included in this document.
Item 9: Proxy Disclosures for Open-End Management Investment Companies
(Unaudited)
| A special meeting of shareholders was held on July 16, 2024. The results of votes taken among shareholders on the proposal before them are reported below. Each vote reported represents one dollar of net asset value held on the record date for the meeting. |
| Proposal 1 |
| To elect a Board of Trustees. |
| | # of Votes | % of Votes |
| Bettina Doulton |
| Affirmative | 107,413,165,703.86 | 95.45 |
| Withheld | 5,115,205,734.52 | 4.55 |
| TOTAL | 112,528,371,438.38 | 100.00 |
| Robert A. Lawrence |
| Affirmative | 106,925,132,614.87 | 95.02 |
| Withheld | 5,603,238,823.51 | 4.98 |
| TOTAL | 112,528,371,438.38 | 100.00 |
| Vijay C. Advani |
| Affirmative | 106,908,299,345.67 | 95.01 |
| Withheld | 5,620,072,092.71 | 4.99 |
| TOTAL | 112,528,371,438.38 | 100.00 |
| Thomas P. Bostick |
| Affirmative | 107,023,189,484.37 | 95.11 |
| Withheld | 5,505,181,954.01 | 4.89 |
| TOTAL | 112,528,371,438.38 | 100.00 |
| Donald F. Donahue |
| Affirmative | 107,148,439,746.95 | 95.22 |
| Withheld | 5,379,931,691.43 | 4.78 |
| TOTAL | 112,528,371,438.38 | 100.00 |
| Vicki L. Fuller |
| Affirmative | 107,159,480,594.93 | 95.23 |
| Withheld | 5,368,890,843.45 | 4.77 |
| TOTAL | 112,528,371,438.38 | 100.00 |
| Patricia L. Kampling |
| Affirmative | 107,220,897,546.66 | 95.28 |
| Withheld | 5,307,473,891.72 | 4.72 |
| TOTAL | 112,528,371,438.38 | 100.00 |
| Thomas A. Kennedy |
| Affirmative | 107,004,892,718.66 | 95.09 |
| Withheld | 5,523,478,719.73 | 4.91 |
| TOTAL | 112,528,371,438.38 | 100.00 |
| Oscar Munoz |
| Affirmative | 106,701,787,976.15 | 94.82 |
| Withheld | 5,826,583,462.23 | 5.18 |
| TOTAL | 112,528,371,438.38 | 100.00 |
| Karen B. Peetz |
| Affirmative | 107,369,162,431.54 | 95.42 |
| Withheld | 5,159,209,006.84 | 4.58 |
| TOTAL | 112,528,371,438.38 | 100.00 |
| David M. Thomas |
| Affirmative | 106,815,962,138.16 | 94.92 |
| Withheld | 5,712,409,300.22 | 5.08 |
| TOTAL | 112,528,371,438.38 | 100.00 |
| Susan Tomasky |
| Affirmative | 107,029,000,908.81 | 95.11 |
| Withheld | 5,499,370,529.58 | 4.89 |
| TOTAL | 112,528,371,438.38 | 100.00 |
| Michael E. Wiley |
| Affirmative | 106,863,215,681.69 | 94.97 |
| Withheld | 5,665,155,756.69 | 5.03 |
| TOTAL | 112,528,371,438.38 | 100.00 |
| | | |
| Proposal 1 reflects trust-wide proposal and voting results. |
Item 10: Remuneration Paid to Directors, Officers, and others of Open-End Management Investment Companies
(Unaudited)
Note: This information is disclosed as part of the consolidated financial statements for each Fund as part of Item 7: Consolidated Financial Statements and Consolidated Financial Highlights for Open-End Management Investment companies.
Item 11: Statement Regarding Basis for Approval of Investment Advisory Contract
(Unaudited)
Note: This is not applicable for any fund included in this document.
1.796407.121
ANIF-ANN-0325
Fidelity® Contrafund®
Annual Report
December 31, 2024
Contents
To view a fund's proxy voting guidelines and proxy voting record for the 12-month period ended June 30, visit http://www.fidelity.com/proxyvotingresults or visit the Securities and Exchange Commission's (SEC) web site at http://www.sec.gov.
You may also call 1-800-544-8544 if you're an individual investing directly with Fidelity, call 1-800-835-5092 if you're a plan sponsor or participant with Fidelity as your recordkeeper or call 1-877-208-0098 on institutional accounts or if you're an advisor or invest through one to request a free copy of the proxy voting guidelines.
Standard & Poor's, S&P and S&P 500 are registered service marks of The McGraw-Hill Companies, Inc. and have been licensed for use by Fidelity Distributors Corporation.
Other third-party marks appearing herein are the property of their respective owners.
All other marks appearing herein are registered or unregistered trademarks or service marks of FMR LLC or an affiliated company. © 2025 FMR LLC. All rights reserved.
This report and the financial statements contained herein are submitted for the general information of the shareholders of the Fund. This report is not authorized for distribution to prospective investors in the Fund unless preceded or accompanied by an effective prospectus.
A fund files its complete schedule of portfolio holdings with the SEC for the first and third quarters of each fiscal year on Form N-PORT. Forms N-PORT are available on the SEC's web site at http://www.sec.gov. A fund's Forms N-PORT may be reviewed and copied at the SEC's Public Reference Room in Washington, DC. Information regarding the operation of the SEC's Public Reference Room may be obtained by calling 1-800-SEC-0330.
For a complete list of a fund's portfolio holdings, view the most recent holdings listing, semiannual report, or annual report on Fidelity's web site at http://www.fidelity.com, http://www.institutional.fidelity.com, or http://www.401k.com, as applicable.
NOT FDIC INSURED •MAY LOSE VALUE •NO BANK GUARANTEE
Neither the Fund nor Fidelity Distributors Corporation is a bank.
Item 7: Consolidated Financial Statements and Consolidated Financial Highlights for Open-End Management Investment Companies (Annual Report)
Consolidated Schedule of Investments December 31, 2024
Showing Percentage of Net Assets
| Common Stocks - 96.3% |
| | | Shares | Value ($) |
| AUSTRALIA - 0.1% | | | |
| Industrials - 0.0% | | | |
| Commercial Services & Supplies - 0.0% | | | |
| Clean TeQ Water Ltd (b) | | 2,096,400 | 421,709 |
| Information Technology - 0.1% | | | |
| Software - 0.1% | | | |
| Canva Inc Class A (c)(d) | | 88,378 | 113,131,794 |
| Materials - 0.0% | | | |
| Metals & Mining - 0.0% | | | |
| Sunrise Energy Metals Ltd (b) | | 2,442,948 | 355,335 |
| TOTAL AUSTRALIA | | | 113,908,838 |
| BELGIUM - 0.0% | | | |
| Health Care - 0.0% | | | |
| Pharmaceuticals - 0.0% | | | |
| UCB SA | | 555,244 | 110,543,734 |
| BRAZIL - 0.3% | | | |
| Consumer Discretionary - 0.2% | | | |
| Broadline Retail - 0.2% | | | |
| MercadoLibre Inc (b) | | 130,011 | 221,075,905 |
| Financials - 0.1% | | | |
| Banks - 0.1% | | | |
| NU Holdings Ltd/Cayman Islands Class A (b) | | 16,353,813 | 169,425,503 |
| Materials - 0.0% | | | |
| Metals & Mining - 0.0% | | | |
| Wheaton Precious Metals Corp | | 724,522 | 40,781,296 |
| TOTAL BRAZIL | | | 431,282,704 |
| CANADA - 1.7% | | | |
| Communication Services - 0.0% | | | |
| Entertainment - 0.0% | | | |
| Lionsgate Studios Corp | | 2,062,963 | 15,678,519 |
| Consumer Discretionary - 0.0% | | | |
| Broadline Retail - 0.0% | | | |
| Dollarama Inc | | 501,164 | 48,908,335 |
| Consumer Staples - 0.0% | | | |
| Consumer Staples Distribution & Retail - 0.0% | | | |
| Alimentation Couche-Tard Inc | | 709,253 | 39,334,689 |
| Energy - 0.3% | | | |
| Oil, Gas & Consumable Fuels - 0.3% | | | |
| ARC Resources Ltd (e) | | 717,637 | 13,015,268 |
| Cameco Corp (United States) | | 1,328,311 | 68,261,902 |
| Canadian Natural Resources Ltd | | 9,577,909 | 295,709,487 |
| Centaurus Energy Inc (b)(c) | | 1 | 1 |
| PrairieSky Royalty Ltd | | 387,222 | 7,550,755 |
| Suncor Energy Inc | | 343,189 | 12,250,184 |
| | | | 396,787,597 |
| Financials - 0.8% | | | |
| Banks - 0.2% | | | |
| Royal Bank of Canada | | 3,053,836 | 368,215,142 |
| Capital Markets - 0.1% | | | |
| Brookfield Asset Management Ltd Class A | | 55,095 | 2,988,073 |
| Brookfield Asset Management Ltd Class A (United States) | | 2,987,705 | 161,903,734 |
| Brookfield Corp Class A | | 388,115 | 22,307,601 |
| | | | 187,199,408 |
| Insurance - 0.5% | | | |
| Fairfax Financial Holdings Ltd Subordinate Voting Shares | | 218,901 | 304,568,507 |
| Intact Financial Corp | | 1,411,085 | 256,929,477 |
| | | | 561,497,984 |
TOTAL FINANCIALS | | | 1,116,912,534 |
| | | | |
| Industrials - 0.1% | | | |
| Commercial Services & Supplies - 0.0% | | | |
| RB Global Inc (United States) (e) | | 530,713 | 47,875,620 |
| Ground Transportation - 0.0% | | | |
| Canadian Pacific Kansas City Ltd | | 153,607 | 11,122,068 |
| Professional Services - 0.1% | | | |
| Thomson Reuters Corp | | 625,878 | 100,500,998 |
TOTAL INDUSTRIALS | | | 159,498,686 |
| | | | |
| Information Technology - 0.3% | | | |
| Electronic Equipment, Instruments & Components - 0.0% | | | |
| Celestica Inc Subordinate Voting Shares (b) | | 738,793 | 68,182,044 |
| IT Services - 0.3% | | | |
| Shopify Inc Class A (b) | | 3,732,381 | 397,243,014 |
| Software - 0.0% | | | |
| Constellation Software Inc/Canada | | 5,032 | 15,560,045 |
TOTAL INFORMATION TECHNOLOGY | | | 480,985,103 |
| | | | |
| Materials - 0.2% | | | |
| Metals & Mining - 0.2% | | | |
| Agnico Eagle Mines Ltd/CA | | 581,540 | 45,497,227 |
| Alamos Gold Inc Class A | | 766,992 | 14,150,494 |
| B2Gold Corp | | 25,456,809 | 62,338,146 |
| Franco-Nevada Corp | | 1,154,688 | 135,691,605 |
| High Power Exploration Inc (b)(c)(d) | | 14,027,051 | 18,515,707 |
| Lundin Gold Inc | | 2,246,454 | 47,915,600 |
| Novagold Resources Inc (b) | | 4,728,395 | 15,822,171 |
| Orla Mining Ltd (b) | | 2,106,194 | 11,663,226 |
| | | | 351,594,176 |
| TOTAL CANADA | | | 2,609,699,639 |
| CHINA - 0.1% | | | |
| Consumer Discretionary - 0.1% | | | |
| Automobiles - 0.1% | | | |
| BYD Co Ltd H Shares | | 2,425,992 | 82,515,581 |
| Hotels, Restaurants & Leisure - 0.0% | | | |
| Meituan B Shares (b)(f)(g) | | 1,062,418 | 20,656,987 |
TOTAL CONSUMER DISCRETIONARY | | | 103,172,568 |
| | | | |
| Health Care - 0.0% | | | |
| Biotechnology - 0.0% | | | |
| Zai Lab Ltd ADR (b) | | 603,000 | 15,792,570 |
| TOTAL CHINA | | | 118,965,138 |
| CONGO DEMOCRATIC REPUBLIC OF - 0.5% | | | |
| Materials - 0.5% | | | |
| Metals & Mining - 0.5% | | | |
| Ivanhoe Mine Ltd (b)(f) | | 11,947,496 | 141,795,737 |
| Ivanhoe Mine Ltd Class A (b) | | 46,181,799 | 548,096,623 |
| | | | |
| TOTAL CONGO DEMOCRATIC REPUBLIC OF | | | 689,892,360 |
| FINLAND - 0.1% | | | |
| Consumer Discretionary - 0.1% | | | |
| Textiles, Apparel & Luxury Goods - 0.1% | | | |
| Amer Sports Inc | | 4,183,641 | 116,974,602 |
| FRANCE - 0.1% | | | |
| Health Care - 0.1% | | | |
| Health Care Equipment & Supplies - 0.1% | | | |
| EssilorLuxottica SA | | 568,909 | 138,840,114 |
| GERMANY - 0.1% | | | |
| Consumer Discretionary - 0.1% | | | |
| Textiles, Apparel & Luxury Goods - 0.1% | | | |
| adidas AG | | 437,127 | 107,222,567 |
| Birkenstock Holding Plc (b) | | 281,200 | 15,932,792 |
| | | | |
| TOTAL GERMANY | | | 123,155,359 |
| IRELAND - 0.2% | | | |
| Financials - 0.1% | | | |
| Banks - 0.1% | | | |
| AIB Group PLC | | 5,524,022 | 30,498,570 |
| Bank of Ireland Group PLC | | 2,681,545 | 24,460,236 |
| | | | 54,958,806 |
| Financial Services - 0.0% | | | |
| Circle Internet Financial LLC (c) | | 1,059,433 | 32,090,226 |
| Circle Internet Financial LLC (c) | | 637,828 | 19,319,810 |
| | | | 51,410,036 |
| Information Technology - 0.1% | | | |
| IT Services - 0.1% | | | |
| Accenture PLC Class A | | 473,733 | 166,654,532 |
| TOTAL IRELAND | | | 273,023,374 |
| ISRAEL - 0.3% | | | |
| Financials - 0.0% | | | |
| Financial Services - 0.0% | | | |
| Rapyd Financial Network 2016 Ltd (b)(c)(d) | | 340,545 | 15,447,121 |
| Health Care - 0.2% | | | |
| Pharmaceuticals - 0.2% | | | |
| Teva Pharmaceutical Industries Ltd ADR (b) | | 17,268,767 | 380,603,625 |
| Information Technology - 0.1% | | | |
| IT Services - 0.0% | | | |
| Wix.com Ltd (b) | | 114,766 | 24,623,045 |
| Software - 0.1% | | | |
| Cellebrite DI Ltd (b) | | 291,352 | 6,418,485 |
| Check Point Software Technologies Ltd (b) | | 503,043 | 93,918,128 |
| | | | 100,336,613 |
TOTAL INFORMATION TECHNOLOGY | | | 124,959,658 |
| | | | |
| TOTAL ISRAEL | | | 521,010,404 |
| ITALY - 0.0% | | | |
| Industrials - 0.0% | | | |
| Passenger Airlines - 0.0% | | | |
| Ryanair Holdings PLC ADR | | 90,343 | 3,938,051 |
| JAPAN - 0.2% | | | |
| Consumer Discretionary - 0.1% | | | |
| Broadline Retail - 0.0% | | | |
| Pan Pacific International Holdings Corp | | 565,534 | 15,512,693 |
| Specialty Retail - 0.1% | | | |
| Fast Retailing Co Ltd | | 270,819 | 91,358,557 |
| Textiles, Apparel & Luxury Goods - 0.0% | | | |
| Asics Corp | | 1,196,910 | 23,657,505 |
TOTAL CONSUMER DISCRETIONARY | | | 130,528,755 |
| | | | |
| Industrials - 0.1% | | | |
| Industrial Conglomerates - 0.0% | | | |
| Hitachi Ltd | | 559,515 | 13,702,555 |
| Machinery - 0.1% | | | |
| Mitsubishi Heavy Industries Ltd | | 5,008,804 | 69,842,525 |
| Trading Companies & Distributors - 0.0% | | | |
| ITOCHU Corp | | 899,945 | 44,254,236 |
| Mitsui & Co Ltd | | 1,155,502 | 23,964,101 |
| | | | 68,218,337 |
TOTAL INDUSTRIALS | | | 151,763,417 |
| | | | |
| Information Technology - 0.0% | | | |
| Semiconductors & Semiconductor Equipment - 0.0% | | | |
| Advantest Corp | | 888,375 | 50,511,976 |
| TOTAL JAPAN | | | 332,804,148 |
| KOREA (SOUTH) - 0.2% | | | |
| Consumer Discretionary - 0.2% | | | |
| Automobiles - 0.0% | | | |
| Hyundai Motor Co | | 670,560 | 94,807,081 |
| Broadline Retail - 0.2% | | | |
| Coupang Inc Class A (b) | | 12,616,598 | 277,312,824 |
| TOTAL KOREA (SOUTH) | | | 372,119,905 |
| NETHERLANDS - 0.3% | | | |
| Communication Services - 0.1% | | | |
| Entertainment - 0.1% | | | |
| Universal Music Group NV | | 6,849,984 | 175,216,602 |
| Financials - 0.0% | | | |
| Financial Services - 0.0% | | | |
| Adyen NV (b)(f)(g) | | 9,862 | 14,655,710 |
| Health Care - 0.2% | | | |
| Biotechnology - 0.2% | | | |
| Argenx SE ADR (b) | | 343,180 | 211,055,700 |
| TOTAL NETHERLANDS | | | 400,928,012 |
| SPAIN - 0.0% | | | |
| Financials - 0.0% | | | |
| Banks - 0.0% | | | |
| Banco Santander SA | | 13,055,838 | 60,399,601 |
| SWEDEN - 0.0% | | | |
| Industrials - 0.0% | | | |
| Machinery - 0.0% | | | |
| Indutrade AB | | 403,553 | 10,103,552 |
| SWITZERLAND - 0.4% | | | |
| Consumer Discretionary - 0.3% | | | |
| Textiles, Apparel & Luxury Goods - 0.3% | | | |
| On Holding AG Class A (b) | | 8,262,197 | 452,520,530 |
| Financials - 0.1% | | | |
| Capital Markets - 0.1% | | | |
| UBS Group AG | | 4,386,822 | 134,038,426 |
| TOTAL SWITZERLAND | | | 586,558,956 |
| TAIWAN - 0.4% | | | |
| Information Technology - 0.4% | | | |
| Semiconductors & Semiconductor Equipment - 0.4% | | | |
| Taiwan Semiconductor Manufacturing Co Ltd ADR | | 2,980,268 | 588,573,127 |
| THAILAND - 0.0% | | | |
| Information Technology - 0.0% | | | |
| Electronic Equipment, Instruments & Components - 0.0% | | | |
| Fabrinet (b) | | 246,735 | 54,252,092 |
| UNITED KINGDOM - 0.3% | | | |
| Consumer Discretionary - 0.1% | | | |
| Hotels, Restaurants & Leisure - 0.1% | | | |
| Deliveroo PLC Class A (b)(f)(g) | | 13,733,571 | 24,396,948 |
| Flutter Entertainment PLC (United Kingdom) (b) | | 256,168 | 66,448,360 |
| | | | 90,845,308 |
| Financials - 0.1% | | | |
| Banks - 0.0% | | | |
| Starling Bank Ltd Class D (b)(c)(d) | | 26,724,113 | 84,643,470 |
| Capital Markets - 0.1% | | | |
| London Stock Exchange Group PLC | | 806,128 | 113,788,969 |
TOTAL FINANCIALS | | | 198,432,439 |
| | | | |
| Industrials - 0.1% | | | |
| Aerospace & Defense - 0.1% | | | |
| Rolls-Royce Holdings PLC (b) | | 23,521,939 | 166,803,321 |
| TOTAL UNITED KINGDOM | | | 456,081,068 |
| UNITED STATES - 91.0% | | | |
| Communication Services - 23.4% | | | |
| Entertainment - 2.7% | | | |
| Electronic Arts Inc | | 292,717 | 42,824,497 |
| Liberty Media Corp-Liberty Formula One Class C (b) | | 2,866,498 | 265,609,705 |
| Liberty Media Corp-Liberty Live Class C (b) | | 150,378 | 10,234,727 |
| Live Nation Entertainment Inc (b) | | 347,040 | 44,941,680 |
| Netflix Inc (b) | | 3,874,044 | 3,453,012,898 |
| ROBLOX Corp Class A (b) | | 1,150,537 | 66,570,071 |
| Spotify Technology SA (b) | | 370,256 | 165,645,129 |
| Walt Disney Co/The | | 477,912 | 53,215,501 |
| | | | 4,102,054,208 |
| Interactive Media & Services - 20.7% | | | |
| Alphabet Inc Class A | | 19,913,646 | 3,769,653,188 |
| Alphabet Inc Class C | | 16,027,945 | 3,052,361,846 |
| Epic Games Inc (b)(c)(d) | | 123,700 | 83,931,687 |
| Meta Platforms Inc Class A | | 41,132,191 | 24,083,309,152 |
| Reddit Inc Class A | | 2,329,437 | 380,723,183 |
| Reddit Inc Class B (b) | | 577,077 | 94,317,465 |
| | | | 31,464,296,521 |
| Media - 0.0% | | | |
| Omnicom Group Inc | | 294,149 | 25,308,579 |
| Trade Desk Inc (The) Class A (b) | | 244,901 | 28,783,215 |
| | | | 54,091,794 |
| Wireless Telecommunication Services - 0.0% | | | |
| T-Mobile US Inc | | 148,653 | 32,812,177 |
TOTAL COMMUNICATION SERVICES | | | 35,653,254,700 |
| | | | |
| Consumer Discretionary - 9.6% | | | |
| Automobiles - 0.2% | | | |
| General Motors Co | | 1,418,060 | 75,540,056 |
| Rad Power Bikes Inc (b)(c)(d) | | 2,588,458 | 543,576 |
| Rad Power Bikes Inc warrants 10/6/2033 (b)(c)(d) | | 2,698,575 | 1,403,259 |
| Tesla Inc (b) | | 679,393 | 274,366,070 |
| | | | 351,852,961 |
| Broadline Retail - 6.8% | | | |
| Amazon.com Inc (b) | | 47,111,720 | 10,335,840,251 |
| Diversified Consumer Services - 0.1% | | | |
| Duolingo Inc Class A (b) | | 746,700 | 242,102,541 |
| Hotels, Restaurants & Leisure - 1.1% | | | |
| Airbnb Inc Class A (b) | | 2,825,172 | 371,255,853 |
| Booking Holdings Inc | | 50,538 | 251,094,010 |
| Carnival Corp (b) | | 2,076,260 | 51,740,399 |
| Cava Group Inc (b) | | 985,874 | 111,206,587 |
| Chipotle Mexican Grill Inc (b) | | 2,320,054 | 139,899,256 |
| Churchill Downs Inc | | 176,505 | 23,570,478 |
| DraftKings Inc Class A (b) | | 387,100 | 14,400,120 |
| Dutch Bros Inc Class A (b) | | 443,258 | 23,217,854 |
| Hilton Worldwide Holdings Inc | | 1,766,501 | 436,608,388 |
| Royal Caribbean Cruises Ltd | | 135,492 | 31,256,649 |
| Starbucks Corp | | 1,061,152 | 96,830,120 |
| Texas Roadhouse Inc | | 96,343 | 17,383,167 |
| Viking Holdings Ltd (e) | | 2,117,437 | 93,294,274 |
| | | | 1,661,757,155 |
| Household Durables - 0.3% | | | |
| DR Horton Inc | | 62,820 | 8,783,492 |
| Garmin Ltd | | 336,755 | 69,459,086 |
| Lennar Corp Class A | | 2,207,906 | 301,092,142 |
| PulteGroup Inc | | 397,660 | 43,305,174 |
| | | | 422,639,894 |
| Specialty Retail - 0.9% | | | |
| Abercrombie & Fitch Co Class A (b) | | 330,443 | 49,391,315 |
| Chewy Inc Class A (b) | | 403,573 | 13,515,660 |
| Dick's Sporting Goods Inc | | 469,858 | 107,522,305 |
| Fanatics Inc Class A (b)(c)(d) | | 2,461,391 | 147,683,460 |
| Gap Inc/The | | 2,041,934 | 48,250,900 |
| Group 1 Automotive Inc | | 5,564 | 2,345,115 |
| O'Reilly Automotive Inc (b) | | 235,214 | 278,916,761 |
| TJX Cos Inc/The | | 4,866,922 | 587,972,847 |
| Williams-Sonoma Inc | | 1,080,456 | 200,078,842 |
| | | | 1,435,677,205 |
| Textiles, Apparel & Luxury Goods - 0.2% | | | |
| Deckers Outdoor Corp (b) | | 685,401 | 139,198,089 |
| Ralph Lauren Corp Class A | | 388,278 | 89,684,452 |
| VF Corp | | 2,003,780 | 43,001,119 |
| | | | 271,883,660 |
TOTAL CONSUMER DISCRETIONARY | | | 14,721,753,667 |
| | | | |
| Consumer Staples - 1.7% | | | |
| Beverages - 0.2% | | | |
| Coca-Cola Co/The | | 4,888,961 | 304,386,712 |
| Consumer Staples Distribution & Retail - 1.5% | | | |
| Casey's General Stores Inc | | 380,040 | 150,583,249 |
| Costco Wholesale Corp | | 2,125,772 | 1,947,781,111 |
| Walmart Inc | | 1,962,866 | 177,344,943 |
| | | | 2,275,709,303 |
| Food Products - 0.0% | | | |
| Bowery Farming Inc (b)(c) | | 349,177 | 3 |
| Bowery Farming Inc warrants (b)(c)(d) | | 122,686 | 1 |
| | | | 4 |
| Household Products - 0.0% | | | |
| Procter & Gamble Co/The | | 160,723 | 26,945,211 |
| Personal Care Products - 0.0% | | | |
| BellRing Brands Inc (b) | | 67,476 | 5,083,642 |
TOTAL CONSUMER STAPLES | | | 2,612,124,872 |
| | | | |
| Energy - 0.9% | | | |
| Energy Equipment & Services - 0.0% | | | |
| Baker Hughes Co Class A | | 542,607 | 22,257,739 |
| Oil, Gas & Consumable Fuels - 0.9% | | | |
| Cheniere Energy Inc | | 70,700 | 15,191,309 |
| Exxon Mobil Corp | | 10,699,764 | 1,150,973,613 |
| Hess Corp | | 77,691 | 10,333,680 |
| Marathon Petroleum Corp | | 99,676 | 13,904,802 |
| Sable Offshore Corp (d) | | 4,367,875 | 100,024,338 |
| Shell PLC ADR | | 1,024,841 | 64,206,289 |
| | | | 1,354,634,031 |
TOTAL ENERGY | | | 1,376,891,770 |
| | | | |
| Financials - 16.8% | | | |
| Banks - 2.6% | | | |
| Bank of America Corp | | 11,559,814 | 508,053,825 |
| Citigroup Inc | | 4,650,656 | 327,359,676 |
| East West Bancorp Inc | | 512,300 | 49,057,847 |
| First Citizens BancShares Inc/NC Class A | | 88,245 | 186,463,450 |
| JPMorgan Chase & Co | | 9,268,950 | 2,221,860,005 |
| Wells Fargo & Co | | 10,637,315 | 747,165,006 |
| | | | 4,039,959,809 |
| Capital Markets - 1.2% | | | |
| Bank of New York Mellon Corp/The | | 3,486,441 | 267,863,262 |
| Blackstone Inc | | 534,620 | 92,179,180 |
| Charles Schwab Corp/The | | 194,900 | 14,424,549 |
| Goldman Sachs Group Inc/The | | 519,807 | 297,651,884 |
| Interactive Brokers Group Inc Class A | | 320,372 | 56,600,121 |
| KKR & Co Inc Class A | | 770,753 | 114,002,076 |
| Moody's Corp | | 379,726 | 179,750,897 |
| Morgan Stanley | | 4,725,898 | 594,139,897 |
| MSCI Inc | | 126,525 | 75,916,265 |
| Raymond James Financial Inc | | 202,813 | 31,502,943 |
| S&P Global Inc | | 29,287 | 14,585,805 |
| Tulco LLC (b)(c)(d)(h) | | 140,771 | 117,918,236 |
| | | | 1,856,535,115 |
| Consumer Finance - 0.8% | | | |
| American Express Co | | 2,816,945 | 836,041,107 |
| Capital One Financial Corp | | 1,298,253 | 231,504,475 |
| Discover Financial Services | | 765,572 | 132,620,037 |
| | | | 1,200,165,619 |
| Financial Services - 10.7% | | | |
| Apollo Global Management Inc | | 90,500 | 14,946,980 |
| Berkshire Hathaway Inc Class A (b) | | 18,764 | 12,776,782,881 |
| Block Inc Class A (b) | | 161,300 | 13,708,887 |
| Fiserv Inc (b) | | 432,501 | 88,844,355 |
| Mastercard Inc Class A | | 1,103,170 | 580,896,227 |
| Paymentus Holdings Inc Class A (b) | | 146,764 | 4,794,780 |
| PayPal Holdings Inc (b) | | 2,562,612 | 218,718,934 |
| Shift4 Payments Inc Class A (b)(e) | | 763,800 | 79,267,164 |
| Toast Inc Class A (b) | | 1,050,565 | 38,293,094 |
| Visa Inc Class A | | 7,590,256 | 2,398,824,507 |
| | | | 16,215,077,809 |
| Insurance - 1.5% | | | |
| American International Group Inc | | 2,978,975 | 216,869,380 |
| Aon PLC | | 81,749 | 29,360,971 |
| Arthur J Gallagher & Co | | 640,002 | 181,664,568 |
| Chubb Ltd | | 1,942,730 | 536,776,299 |
| Marsh & McLennan Cos Inc | | 1,280,541 | 271,999,714 |
| Progressive Corp/The | | 3,095,851 | 741,796,858 |
| The Travelers Companies, Inc. | | 1,368,665 | 329,697,712 |
| Willis Towers Watson PLC | | 47,700 | 14,941,547 |
| | | | 2,323,107,049 |
TOTAL FINANCIALS | | | 25,634,845,401 |
| | | | |
| Health Care - 8.2% | | | |
| Biotechnology - 2.2% | | | |
| Alnylam Pharmaceuticals Inc (b) | | 564,957 | 132,940,032 |
| Apogee Therapeutics Inc (b) | | 261,939 | 11,865,837 |
| Arcellx Inc (b) | | 350,875 | 26,908,604 |
| Avidity Biosciences Inc (b) | | 783,115 | 22,772,984 |
| Crinetics Pharmaceuticals Inc (b) | | 259,395 | 13,262,866 |
| Denali Therapeutics Inc (b) | | 1,198,060 | 24,416,463 |
| Exelixis Inc (b) | | 298,749 | 9,948,342 |
| Gilead Sciences Inc | | 501,345 | 46,309,238 |
| Insmed Inc (b) | | 263,303 | 18,178,439 |
| Janux Therapeutics Inc (b) | | 459,290 | 24,590,387 |
| Moderna Inc (b) | | 402,004 | 16,715,326 |
| Natera Inc (b) | | 101,100 | 16,004,130 |
| Recursion Pharmaceuticals Inc Class A (b)(e) | | 1,101,468 | 7,445,923 |
| Regeneron Pharmaceuticals Inc (b) | | 2,220,585 | 1,581,789,313 |
| United Therapeutics Corp (b) | | 302,096 | 106,591,553 |
| Vertex Pharmaceuticals Inc (b) | | 3,252,098 | 1,309,619,865 |
| Viking Therapeutics Inc (b) | | 216,501 | 8,711,999 |
| | | | 3,378,071,301 |
| Health Care Equipment & Supplies - 1.5% | | | |
| Alcon AG (United States) | | 1,337,063 | 113,503,278 |
| Boston Scientific Corp (b) | | 8,066,311 | 720,482,899 |
| Cooper Cos Inc/The (b) | | 209,830 | 19,289,672 |
| Glaukos Corp (b) | | 94,746 | 14,206,215 |
| Globus Medical Inc Class A (b) | | 193,000 | 15,963,030 |
| Insulet Corp (b) | | 58,200 | 15,194,274 |
| Intuitive Surgical Inc (b) | | 1,840,978 | 960,916,877 |
| PROCEPT BioRobotics Corp (b) | | 129,754 | 10,447,792 |
| Stryker Corp | | 1,042,228 | 375,254,191 |
| | | | 2,245,258,228 |
| Health Care Providers & Services - 1.5% | | | |
| BrightSpring Health Services Inc (b) | | 511,005 | 8,702,415 |
| HCA Healthcare Inc | | 388,395 | 116,576,759 |
| Tenet Healthcare Corp (b) | | 1,784,890 | 225,306,665 |
| UnitedHealth Group Inc | | 3,948,856 | 1,997,568,296 |
| | | | 2,348,154,135 |
| Health Care Technology - 0.0% | | | |
| Doximity Inc Class A (b) | | 828,452 | 44,231,053 |
| Veeva Systems Inc Class A (b) | | 50,613 | 10,641,383 |
| | | | 54,872,436 |
| Life Sciences Tools & Services - 0.0% | | | |
| Veterinary Emergency Group (b)(c)(d)(h) | | 1,114,406 | 70,798,213 |
| Pharmaceuticals - 3.0% | | | |
| Eli Lilly & Co | | 4,877,963 | 3,765,787,436 |
| Intra-Cellular Therapies Inc (b) | | 1,366,209 | 114,105,776 |
| Merck & Co Inc | | 5,331,298 | 530,357,525 |
| | | | 4,410,250,737 |
TOTAL HEALTH CARE | | | 12,507,405,050 |
| | | | |
| Industrials - 6.1% | | | |
| Aerospace & Defense - 1.9% | | | |
| Axon Enterprise Inc (b) | | 498,168 | 296,071,206 |
| Boeing Co (b) | | 248,215 | 43,934,055 |
| GE Aerospace | | 7,587,921 | 1,265,589,345 |
| HEICO Corp | | 24,968 | 5,935,892 |
| Howmet Aerospace Inc | | 2,110,844 | 230,863,008 |
| Leonardo DRS Inc (b) | | 938,057 | 30,308,622 |
| Loar Holdings Inc | | 182,597 | 13,495,744 |
| Relativity Space Inc warrants (b)(c)(d) | | 100,694 | 26,180 |
| Rocket Lab USA Inc Class A (b) | | 505 | 12,862 |
| Space Exploration Technologies Corp (b)(c)(d) | | 3,588,892 | 663,945,020 |
| Space Exploration Technologies Corp Class C (b)(c)(d) | | 160,804 | 29,748,740 |
| TransDigm Group Inc | | 197,718 | 250,564,067 |
| | | | 2,830,494,741 |
| Air Freight & Logistics - 0.0% | | | |
| Zipline International Inc (b)(c)(d) | | 515,816 | 21,638,480 |
| Building Products - 0.4% | | | |
| AZEK Co Inc/The Class A (b) | | 292,100 | 13,865,987 |
| Carrier Global Corp | | 1,618,063 | 110,448,980 |
| Trane Technologies PLC | | 1,474,223 | 544,504,265 |
| | | | 668,819,232 |
| Commercial Services & Supplies - 0.5% | | | |
| Cintas Corp | | 1,164,673 | 212,785,757 |
| Clean Harbors Inc (b) | | 660,086 | 151,912,192 |
| GFL Environmental Inc Subordinate Voting Shares | | 5,185,605 | 231,168,784 |
| Republic Services Inc | | 494,955 | 99,575,047 |
| Veralto Corp | | 752,207 | 76,612,283 |
| | | | 772,054,063 |
| Construction & Engineering - 0.0% | | | |
| Comfort Systems USA Inc | | 66,200 | 28,072,772 |
| EMCOR Group Inc | | 14,944 | 6,783,082 |
| | | | 34,855,854 |
| Electrical Equipment - 1.5% | | | |
| Eaton Corp PLC | | 2,191,464 | 727,281,158 |
| GE Vernova Inc | | 3,287,214 | 1,081,263,301 |
| Generac Holdings Inc (b) | | 311,501 | 48,298,230 |
| Hubbell Inc | | 745,595 | 312,322,290 |
| Vertiv Holdings Co Class A | | 774,717 | 88,015,598 |
| | | | 2,257,180,577 |
| Ground Transportation - 0.0% | | | |
| Uber Technologies Inc (b) | | 825,886 | 49,817,444 |
| XPO Inc (b) | | 70,415 | 9,234,927 |
| | | | 59,052,371 |
| Industrial Conglomerates - 0.2% | | | |
| 3M Co | | 2,463,030 | 317,952,543 |
| Machinery - 0.7% | | | |
| Caterpillar Inc | | 864,469 | 313,594,775 |
| Deere & Co | | 169,444 | 71,793,423 |
| Ingersoll Rand Inc | | 332,831 | 30,107,892 |
| PACCAR Inc | | 2,850,690 | 296,528,774 |
| Parker-Hannifin Corp | | 426,140 | 271,037,824 |
| Westinghouse Air Brake Technologies Corp | | 326,226 | 61,849,187 |
| | | | 1,044,911,875 |
| Passenger Airlines - 0.0% | | | |
| Alaska Air Group Inc (b) | | 425,200 | 27,531,700 |
| Professional Services - 0.3% | | | |
| Dayforce Inc (b)(e) | | 939,489 | 68,244,481 |
| Leidos Holdings Inc | | 62,000 | 8,931,719 |
| Paycom Software Inc | | 407,714 | 83,569,139 |
| UL Solutions Inc Class A | | 657,411 | 32,791,661 |
| Verisk Analytics Inc | | 780,125 | 214,869,829 |
| | | | 408,406,829 |
| Trading Companies & Distributors - 0.6% | | | |
| FTAI Aviation Ltd | | 538,918 | 77,625,748 |
| United Rentals Inc | | 242,172 | 170,595,644 |
| WW Grainger Inc | | 584,237 | 615,815,010 |
| | | | 864,036,402 |
TOTAL INDUSTRIALS | | | 9,306,934,667 |
| | | | |
| Information Technology - 23.2% | | | |
| Communications Equipment - 0.9% | | | |
| Arista Networks Inc | | 11,066,140 | 1,223,140,454 |
| Motorola Solutions Inc | | 237,495 | 109,777,314 |
| | | | 1,332,917,768 |
| Electronic Equipment, Instruments & Components - 1.8% | | | |
| Amphenol Corp Class A | | 39,031,729 | 2,710,753,579 |
| Coherent Corp (b) | | 210,269 | 19,918,782 |
| Sanmina Corp (b) | | 46,207 | 3,496,484 |
| Zebra Technologies Corp Class A (b) | | 39,647 | 15,312,464 |
| | | | 2,749,481,309 |
| IT Services - 0.2% | | | |
| Asac II LP (b)(c)(d) | | 39,494,500 | 6,635,076 |
| Cloudflare Inc Class A (b) | | 997,440 | 107,404,340 |
| Gartner Inc (b) | | 148,872 | 72,124,018 |
| GoDaddy Inc Class A (b) | | 250,601 | 49,461,119 |
| Kyndryl Holdings Inc (b) | | 1,039,404 | 35,963,378 |
| Twilio Inc Class A (b) | | 353,918 | 38,251,457 |
| X Holdings Corp Class A (b)(c)(d) | | 534,690 | 16,324,086 |
| | | | 326,163,474 |
| Semiconductors & Semiconductor Equipment - 9.8% | | | |
| Advanced Micro Devices Inc (b) | | 1,014,843 | 122,582,886 |
| Analog Devices Inc | | 492,926 | 104,727,058 |
| Applied Materials Inc | | 411,638 | 66,944,688 |
| ARM Holdings PLC ADR (b) | | 677,942 | 83,630,925 |
| Astera Labs Inc (b) | | 753,483 | 99,798,823 |
| Broadcom Inc | | 6,452,097 | 1,495,854,169 |
| Marvell Technology Inc | | 850,916 | 93,983,672 |
| Monolithic Power Systems Inc | | 35,033 | 20,729,026 |
| NVIDIA Corp | | 96,469,250 | 12,954,855,584 |
| | | | 15,043,106,831 |
| Software - 7.1% | | | |
| Alkami Technology Inc (b) | | 48,979 | 1,796,549 |
| Appfolio Inc Class A (b) | | 36,664 | 9,045,742 |
| Applied Intuition Inc Class A (c)(d) | | 141,916 | 8,798,792 |
| AppLovin Corp Class A (b) | | 46,700 | 15,122,861 |
| Atlassian Corp Class A (b) | | 43,210 | 10,516,450 |
| Cadence Design Systems Inc (b) | | 550,457 | 165,390,310 |
| Clear Secure Inc Class A | | 1,234,605 | 32,889,877 |
| Coreweave Inc Class A (c)(d) | | 112,102 | 105,359,065 |
| CyberArk Software Ltd (b) | | 486,153 | 161,961,872 |
| Datadog Inc Class A (b) | | 603,982 | 86,302,988 |
| DocuSign Inc (b) | | 1,138,823 | 102,425,741 |
| Dynatrace Inc (b) | | 156,209 | 8,489,959 |
| Fair Isaac Corp (b) | | 949 | 1,889,392 |
| Figma Inc Class A (c)(d) | | 1,076,100 | 30,163,083 |
| Fortinet Inc (b) | | 2,516,453 | 237,754,479 |
| Gusto Inc (b)(c)(d) | | 289,200 | 11,403,156 |
| HubSpot Inc (b) | | 20,700 | 14,423,139 |
| Klaviyo Inc Class A (b) | | 608,920 | 25,111,861 |
| Microsoft Corp | | 19,280,563 | 8,126,757,305 |
| Monday.com Ltd (b) | | 141,185 | 33,240,596 |
| Onestream Inc Class A | | 438,321 | 12,500,915 |
| OpenAI Global LLC rights (b)(c)(d) | | 74,801,903 | 74,801,903 |
| Oracle Corp | | 68,931 | 11,486,662 |
| Palo Alto Networks Inc (b) | | 206,322 | 37,542,351 |
| Rubrik Inc Class A (b) | | 417,470 | 27,285,839 |
| Salesforce Inc | | 1,574,134 | 526,280,220 |
| Samsara Inc Class A (b) | | 2,700,250 | 117,973,923 |
| Servicenow Inc (b) | | 586,282 | 621,529,274 |
| ServiceTitan Inc Class A (b)(e) | | 70,500 | 7,252,335 |
| Stripe Inc Class B (b)(c)(d) | | 455,600 | 12,533,556 |
| Tanium Inc Class B (b)(c)(d) | | 6,742,751 | 61,965,882 |
| Zoom Communications Inc Class A (b) | | 1,196,777 | 97,668,971 |
| | | | 10,797,665,048 |
| Technology Hardware, Storage & Peripherals - 3.4% | | | |
| Apple Inc | | 20,590,392 | 5,156,245,965 |
| Dell Technologies Inc Class C | | 196,989 | 22,701,012 |
| | | | 5,178,946,977 |
TOTAL INFORMATION TECHNOLOGY | | | 35,428,281,407 |
| | | | |
| Materials - 0.3% | | | |
| Chemicals - 0.1% | | | |
| Air Products and Chemicals Inc | | 47,947 | 13,906,547 |
| Sherwin-Williams Co/The | | 374,421 | 127,276,931 |
| | | | 141,183,478 |
| Construction Materials - 0.0% | | | |
| CRH PLC | | 1,060,396 | 98,107,838 |
| Containers & Packaging - 0.1% | | | |
| International Paper Co | | 1,824,869 | 98,214,450 |
| Silgan Holdings Inc | | 85,471 | 4,448,765 |
| | | | 102,663,215 |
| Metals & Mining - 0.1% | | | |
| ATI Inc (b) | | 332,984 | 18,327,439 |
| Freeport-McMoRan Inc | | 2,415,376 | 91,977,519 |
| Ivanhoe Electric Inc / US (b) | | 4,013,602 | 30,302,695 |
| Steel Dynamics Inc | | 417,142 | 47,583,388 |
| | | | 188,191,041 |
TOTAL MATERIALS | | | 530,145,572 |
| | | | |
| Real Estate - 0.1% | | | |
| Health Care REITs - 0.1% | | | |
| Welltower Inc | | 791,200 | 99,714,936 |
| Real Estate Management & Development - 0.0% | | | |
| CBRE Group Inc Class A (b) | | 245,498 | 32,231,432 |
TOTAL REAL ESTATE | | | 131,946,368 |
| | | | |
| Utilities - 0.7% | | | |
| Electric Utilities - 0.5% | | | |
| American Electric Power Co Inc | | 145,332 | 13,403,970 |
| Constellation Energy Corp | | 2,830,414 | 633,191,917 |
| NRG Energy Inc | | 1,025,299 | 92,502,476 |
| PG&E Corp | | 2,203,008 | 44,456,701 |
| Southern Co/The | | 215,338 | 17,726,624 |
| | | | 801,281,688 |
| Independent Power and Renewable Electricity Producers - 0.2% | | | |
| Vistra Corp | | 2,179,030 | 300,422,866 |
TOTAL UTILITIES | | | 1,101,704,554 |
| | | | |
| TOTAL UNITED STATES | | | 139,005,288,028 |
| TOTAL COMMON STOCKS (Cost $40,814,021,506) | | | 147,118,342,806 |
| | | | |
| Convertible Preferred Stocks - 1.8% |
| | | Shares | Value ($) |
| AUSTRALIA - 0.0% | | | |
| Information Technology - 0.0% | | | |
| Software - 0.0% | | | |
| Canva Inc Series A (b)(c)(d) | | 13,120 | 16,794,781 |
| Canva Inc Series A2 (b)(c)(d) | | 2,380 | 3,046,614 |
| | | | |
| TOTAL AUSTRALIA | | | 19,841,395 |
| CANADA - 0.0% | | | |
| Materials - 0.0% | | | |
| Metals & Mining - 0.0% | | | |
| High Power Exploration Inc Series A (b)(c)(d) | | 14,154,085 | 30,997,446 |
| CHINA - 0.1% | | | |
| Communication Services - 0.1% | | | |
| Interactive Media & Services - 0.1% | | | |
| ByteDance Ltd Series E1 (b)(c)(d) | | 653,587 | 161,867,356 |
| UNITED STATES - 1.7% | | | |
| Consumer Discretionary - 0.0% | | | |
| Automobiles - 0.0% | | | |
| Rad Power Bikes Inc Series A (b)(c)(d) | | 337,463 | 70,867 |
| Rad Power Bikes Inc Series C (b)(c)(d) | | 1,327,879 | 756,891 |
| Rad Power Bikes Inc Series D (b)(c)(d) | | 2,329,100 | 2,212,645 |
| | | | 3,040,403 |
| Hotels, Restaurants & Leisure - 0.0% | | | |
| Discord Inc Series I (b)(c)(d) | | 15,500 | 3,828,810 |
| Consumer Staples - 0.0% | | | |
| Consumer Staples Distribution & Retail - 0.0% | | | |
| GoBrands Inc Series G (b)(c)(d) | | 55,517 | 1,869,257 |
| GoBrands Inc Series H (b)(c)(d) | | 69,898 | 3,016,798 |
| | | | 4,886,055 |
| Financials - 0.0% | | | |
| Financial Services - 0.0% | | | |
| Acrisure Holdings Inc Series B1 (b)(c)(d) | | 379,681 | 10,938,610 |
| Tenstorrent Holdings Inc Series C1 (b)(c)(d) | | 387,402 | 28,737,480 |
| | | | 39,676,090 |
| Health Care - 0.0% | | | |
| Biotechnology - 0.0% | | | |
| ElevateBio LLC Series C (b)(c)(d) | | 3,224,900 | 9,352,210 |
| Intarcia Therapeutics Inc (b)(c)(d) | | 2,100,446 | 21 |
| | | | 9,352,231 |
| Health Care Providers & Services - 0.0% | | | |
| Get Credit Healthy Inc Class B (b)(c)(d) | | 35,877,127 | 60,435 |
| Lyra Health Inc Series E (b)(c)(d) | | 1,478,100 | 14,647,971 |
| Lyra Health Inc Series F (b)(c)(d) | | 69,520 | 688,943 |
| Somatus Inc Series E (b)(c)(d) | | 15,253 | 16,873,937 |
| | | | 32,271,286 |
TOTAL HEALTH CARE | | | 41,623,517 |
| | | | |
| Industrials - 1.5% | | | |
| Aerospace & Defense - 1.4% | | | |
| Relativity Space Inc Series D (b)(c)(d) | | 1,673,085 | 1,087,505 |
| Relativity Space Inc Series E (b)(c)(d) | | 436,722 | 410,519 |
| Relativity Space Inc Series F (b)(c)(d) | | 1,006,942 | 946,525 |
| Space Exploration Technologies Corp Series G (b)(c)(d) | | 558,215 | 1,032,697,751 |
| Space Exploration Technologies Corp Series H (b)(c)(d) | | 120,282 | 222,521,700 |
| Space Exploration Technologies Corp Series N (b)(c)(d) | | 428,458 | 792,647,300 |
| | | | 2,050,311,300 |
| Air Freight & Logistics - 0.1% | | | |
| Zipline International Inc Series E (b)(c)(d) | | 1,317,166 | 55,255,114 |
| Zipline International Inc Series F (b)(c)(d) | | 682,143 | 28,615,899 |
| Zipline International Inc Series G (c)(d) | | 772,245 | 32,395,678 |
| | | | 116,266,691 |
| Construction & Engineering - 0.0% | | | |
| Beta Technologies Inc Series B, 6% (b)(c)(d) | | 259,581 | 34,929,219 |
| Beta Technologies Inc Series C, 6% (c)(d) | | 211,900 | 24,491,402 |
| | | | 59,420,621 |
TOTAL INDUSTRIALS | | | 2,225,998,612 |
| | | | |
| Information Technology - 0.2% | | | |
| Software - 0.2% | | | |
| Applied Intuition Inc Series A2 (c)(d) | | 184,736 | 11,453,632 |
| Applied Intuition Inc Series B2 (c)(d) | | 89,079 | 5,522,898 |
| Asapp Inc Series C (b)(c)(d) | | 1,300,504 | 2,731,058 |
| Carbon Inc Series D (b)(c)(d) | | 915,425 | 6,151,656 |
| Carbon Inc Series E (b)(c)(d) | | 81,735 | 657,149 |
| Gusto Inc Series D (b)(c)(d) | | 2,436,137 | 96,056,882 |
| Gusto Inc Series E (b)(c)(d) | | 167,099 | 6,588,714 |
| MOLOCO Inc Series A (b)(c)(d) | | 419,608 | 27,400,402 |
| Nuro Inc/CA Series C (b)(c)(d) | | 3,293,118 | 10,801,427 |
| Nuro Inc/CA Series D (b)(c)(d) | | 643,113 | 2,668,919 |
| Stripe Inc Series H (b)(c)(d) | | 190,300 | 5,235,153 |
| Stripe Inc Series I (b)(c)(d) | | 2,114,059 | 58,157,763 |
| xAI Corp Series C (c)(d) | | 3,464,739 | 75,011,600 |
| | | | 308,437,253 |
| TOTAL UNITED STATES | | | 2,627,490,740 |
| TOTAL CONVERTIBLE PREFERRED STOCKS (Cost $1,010,844,331) | | | 2,840,196,937 |
| | | | |
| Preferred Securities - 0.0% |
| | | Principal Amount (a) | Value ($) |
| UNITED STATES - 0.0% | | | |
| Consumer Discretionary - 0.0% | | | |
| Automobiles - 0.0% | | | |
| Rad Power Bikes Inc 8% 12/31/2025 (c)(d) | | 2,698,575 | 3,521,370 |
| Health Care - 0.0% | | | |
| Biotechnology - 0.0% | | | |
| Intarcia Therapeutics Inc 6% (c)(d)(i)(j) | | 9,273,235 | 1 |
| TOTAL UNITED STATES | | | 3,521,371 |
| TOTAL PREFERRED SECURITIES (Cost $11,971,810) | | | 3,521,371 |
| | | | |
| Money Market Funds - 2.1% |
| | | Yield (%) | Shares | Value ($) |
| Fidelity Cash Central Fund (k) | | 4.36 | 3,054,249,183 | 3,054,860,033 |
| Fidelity Securities Lending Cash Central Fund (k)(l) | | 4.35 | 130,687,354 | 130,700,423 |
| TOTAL MONEY MARKET FUNDS (Cost $3,185,559,065) | | | | 3,185,560,456 |
| | | | | |
| TOTAL INVESTMENT IN SECURITIES - 100.2% (Cost $45,022,396,712) | 153,147,621,570 |
NET OTHER ASSETS (LIABILITIES) - (0.2)% | (381,096,021) |
| NET ASSETS - 100.0% | 152,766,525,549 |
| | |
Legend
| (a) | Amount is stated in United States dollars unless otherwise noted. |
| (d) | Restricted securities (including private placements) - Investment in securities not registered under the Securities Act of 1933 (excluding 144A issues). At the end of the period, the value of restricted securities (excluding 144A issues) amounted to $4,641,102,189 or 3.0% of net assets. |
| (e) | Security or a portion of the security is on loan at period end. |
| (f) | Security exempt from registration under Rule 144A of the Securities Act of 1933. These securities may be resold in transactions exempt from registration, normally to qualified institutional buyers. At the end of the period, the value of these securities amounted to $201,505,382 or 0.1% of net assets. |
| (g) | Security is exempt from registration under Regulation S of the Securities Act of 1933 and may be resold to qualified foreign investors outside of the United States. At the end of the period, the value of securities amounted to $59,709,645 or 0.0% of net assets. |
| (h) | Investment is owned by a wholly-owned subsidiary (Subsidiary) that is treated as a corporation for U.S. tax purposes. |
| (i) | Security is perpetual in nature with no stated maturity date. |
| (j) | Non-income producing - Security is in default. |
| (k) | Affiliated fund that is generally available only to investment companies and other accounts managed by Fidelity Investments. The rate quoted is the annualized seven-day yield of the fund at period end. A complete unaudited listing of the fund's holdings as of its most recent quarter end is available upon request. In addition, each Fidelity Central Fund's financial statements, which are not covered by the Fund's Report of Independent Registered Public Accounting Firm, are available on the SEC's website or upon request. |
| (l) | Investment made with cash collateral received from securities on loan. |
| Additional information on each restricted holding is as follows: |
| Security | Acquisition Date | Acquisition Cost ($) |
| Acrisure Holdings Inc Series B1 | 3/22/21 | 6,917,788 |
| | | |
| Applied Intuition Inc Class A | 7/02/24 | 8,471,661 |
| | | |
| Applied Intuition Inc Series A2 | 7/02/24 | 11,027,797 |
| | | |
| Applied Intuition Inc Series B2 | 7/02/24 | 5,317,562 |
| | | |
| Asac II LP | 10/10/13 | 3,041,471 |
| | | |
| Asapp Inc Series C | 4/30/21 | 8,579,555 |
| | | |
| Beta Technologies Inc Series B, 6% | 4/04/22 | 26,780,972 |
| | | |
| Beta Technologies Inc Series C, 6% | 10/24/24 | 24,256,193 |
| | | |
| Bowery Farming Inc warrants | 10/25/23 | 0 |
| | | |
| ByteDance Ltd Series E1 | 11/18/20 | 71,616,260 |
| | | |
| Canva Inc Class A | 3/18/24 | 94,269,375 |
| | | |
| Canva Inc Series A | 9/22/23 | 13,994,594 |
| | | |
| Canva Inc Series A2 | 9/22/23 | 2,538,653 |
| | | |
| Carbon Inc Series D | 12/15/17 | 21,375,998 |
| | | |
| Carbon Inc Series E | 3/22/19 | 2,288,122 |
| | | |
| Coreweave Inc Class A | 11/29/23 - 10/03/24 | 44,435,299 |
| | | |
| Discord Inc Series I | 9/15/21 | 8,534,678 |
| | | |
| ElevateBio LLC Series C | 3/09/21 | 13,528,456 |
| | | |
| Epic Games Inc | 7/13/20 - 7/30/20 | 71,127,500 |
| | | |
| Fanatics Inc Class A | 8/13/20 - 12/15/21 | 82,369,063 |
| | | |
| Figma Inc Class A | 5/15/24 | 24,957,987 |
| | | |
| Get Credit Healthy Inc Class B | 8/17/23 | 76,544 |
| | | |
| GoBrands Inc Series G | 3/02/21 | 13,863,555 |
| | | |
| GoBrands Inc Series H | 7/22/21 | 27,154,715 |
| | | |
| Gusto Inc | 10/01/21 | 8,325,589 |
| | | |
| Gusto Inc Series D | 7/16/19 | 32,430,830 |
| | | |
| Gusto Inc Series E | 7/13/21 | 5,079,029 |
| | | |
| High Power Exploration Inc | 6/03/24 | 18,515,707 |
| | | |
| High Power Exploration Inc Series A | 11/15/19 - 3/04/21 | 74,592,028 |
| | | |
| Intarcia Therapeutics Inc | 11/14/12 | 28,629,079 |
| | | |
| Intarcia Therapeutics Inc 6% | 1/03/20 | 9,273,235 |
| | | |
| Lyra Health Inc Series E | 1/14/21 | 13,534,370 |
| | | |
| Lyra Health Inc Series F | 6/04/21 | 1,091,770 |
| | | |
| MOLOCO Inc Series A | 6/26/23 | 25,176,480 |
| | | |
| Nuro Inc/CA Series C | 10/30/20 | 42,990,338 |
| | | |
| Nuro Inc/CA Series D | 10/29/21 | 13,406,154 |
| | | |
| OpenAI Global LLC rights | 9/30/24 | 74,801,903 |
| | | |
| Rad Power Bikes Inc | 1/21/21 | 12,486,307 |
| | | |
| Rad Power Bikes Inc 8% 12/31/2025 | 10/06/23 | 2,698,575 |
| | | |
| Rad Power Bikes Inc Series A | 1/21/21 | 1,627,868 |
| | | |
| Rad Power Bikes Inc Series C | 1/21/21 | 6,405,476 |
| | | |
| Rad Power Bikes Inc Series D | 9/17/21 | 22,321,629 |
| | | |
| Rad Power Bikes Inc warrants 10/6/2033 | 10/06/23 | 3 |
| | | |
| Rapyd Financial Network 2016 Ltd | 3/30/21 | 24,999,987 |
| | | |
| Relativity Space Inc Series D | 11/20/20 | 24,974,307 |
| | | |
| Relativity Space Inc Series E | 5/27/21 | 9,972,591 |
| | | |
| Relativity Space Inc Series F | 11/14/23 | 22,824,354 |
| | | |
| Relativity Space Inc warrants | 11/14/23 | 0 |
| | | |
| Sable Offshore Corp | 1/16/24 | 43,678,750 |
| | | |
| Somatus Inc Series E | 1/31/22 | 13,310,300 |
| | | |
| Space Exploration Technologies Corp | 10/16/15 - 7/01/24 | 60,586,875 |
| | | |
| Space Exploration Technologies Corp Class C | 9/11/17 - 7/01/24 | 5,213,913 |
| | | |
| Space Exploration Technologies Corp Series G | 1/20/15 | 43,239,334 |
| | | |
| Space Exploration Technologies Corp Series H | 8/04/17 | 16,238,070 |
| | | |
| Space Exploration Technologies Corp Series N | 8/04/20 | 115,683,660 |
| | | |
| Starling Bank Ltd Class D | 6/18/21 - 4/05/22 | 52,246,529 |
| | | |
| Stripe Inc Class B | 5/18/21 | 18,282,490 |
| | | |
| Stripe Inc Series H | 3/15/21 | 7,635,788 |
| | | |
| Stripe Inc Series I | 3/20/23 - 5/12/23 | 42,564,760 |
| | | |
| Tanium Inc Class B | 4/21/17 - 9/18/20 | 57,901,784 |
| | | |
| Tenstorrent Holdings Inc Series C1 | 4/23/21 | 23,032,751 |
| | | |
| Tulco LLC | 8/24/17 - 9/07/18 | 52,173,293 |
| | | |
| Veterinary Emergency Group | 9/16/21 - 11/13/23 | 44,308,445 |
| | | |
| X Holdings Corp Class A | 10/25/22 | 53,469,000 |
| | | |
| xAI Corp Series C | 11/22/24 | 75,011,599 |
| | | |
| Zipline International Inc | 10/12/21 | 18,569,376 |
| | | |
| Zipline International Inc Series E | 12/21/20 | 42,978,336 |
| | | |
| Zipline International Inc Series F | 4/11/23 | 27,420,170 |
| | | |
| Zipline International Inc Series G | 6/07/24 | 32,392,820 |
| | | |
Affiliated Central Funds
Fiscal year to date information regarding the Fund's investments in Fidelity Central Funds, including the ownership percentage, is presented below.
| Affiliate | Value, beginning of period ($) | Purchases ($) | Sales Proceeds ($) | Dividend Income ($) | Realized Gain (loss) ($) | Change in Unrealized appreciation (depreciation) ($) | Value, end of period ($) | Shares, end of period | % ownership, end of period |
| Fidelity Cash Central Fund | 2,624,918,860 | 13,610,959,193 | 13,181,016,350 | 110,144,382 | (1,670) | - | 3,054,860,033 | 3,054,249,183 | 6.0% |
| Fidelity Securities Lending Cash Central Fund | 559,473,058 | 3,705,039,420 | 4,133,812,055 | 845,487 | - | - | 130,700,423 | 130,687,354 | 0.6% |
| Total | 3,184,391,918 | 17,315,998,613 | 17,314,828,405 | 110,989,869 | (1,670) | - | 3,185,560,456 | 3,184,936,537 | |
| | | | | | | | | | |
Amounts in the dividend income column in the above table include any capital gain distributions from underlying funds, which are presented in the corresponding line item in the Consolidated Statement of Operations, if applicable.
Amounts in the dividend income column for Fidelity Securities Lending Cash Central Fund represents the income earned on investing cash collateral, less rebates paid to borrowers and any lending agent fees associated with the loan, plus any premium payments received for lending certain types of securities.
Amounts included in the purchases and sales proceeds columns may include in-kind transactions, if applicable.
Other Affiliated Issuers
An affiliated company is a company in which the Fund has ownership of at least 5% of the voting securities. Fiscal year to date transactions with companies which are or were affiliates are presented in the table below. Certain corporate actions, such as mergers, are excluded from the amounts in this table if applicable. A dash in the Value end of period ($) column means either the issuer is no longer held at period end, or the issuer is held at period end but is no longer an affiliate.
| Affiliate | Value, beginning of period ($) | Purchases ($) | Sales Proceeds ($) | Dividend Income ($) | Realized Gain (loss) ($) | Change in Unrealized appreciation (depreciation) ($) | Value, end of period ($) | Shares, end of period |
| Sable Offshore Corp | - | 43,678,750 | - | - | - | 56,345,588 | - | 4,367,875 |
| Total | - | 43,678,750 | - | - | - | 56,345,588 | - | 4,367,875 |
Amounts included in the purchases and sales proceeds columns may include in-kind transactions, if applicable.
Investment Valuation
The following is a summary of the inputs used, as of December 31, 2024, involving the Fund's assets and liabilities carried at fair value. The inputs or methodology used for valuing securities may not be an indication of the risk associated with investing in those securities. For more information on valuation inputs, and their aggregation into the levels used below, please refer to the Investment Valuation section in the accompanying Notes to Consolidated Financial Statements.
| Valuation Inputs at Reporting Date: |
| Description | Total ($) | Level 1 ($) | Level 2 ($) | Level 3 ($) |
Investments in Securities: | | | | |
|
| Common Stocks | | | | |
Communication Services | 35,844,149,821 | 35,585,001,532 | 175,216,602 | 83,931,687 |
Consumer Discretionary | 16,381,054,934 | 15,942,086,433 | 289,338,206 | 149,630,295 |
Consumer Staples | 2,651,459,561 | 2,651,459,557 | - | 4 |
Energy | 1,773,679,367 | 1,773,679,366 | - | 1 |
Financials | 27,450,525,577 | 26,992,262,434 | 188,844,280 | 269,418,863 |
Health Care | 13,364,240,793 | 13,293,442,580 | - | 70,798,213 |
Industrials | 9,799,463,403 | 8,765,538,245 | 318,566,738 | 715,358,420 |
Information Technology | 37,007,349,689 | 36,515,721,320 | 50,511,976 | 441,116,393 |
Materials | 1,612,768,739 | 1,594,253,032 | - | 18,515,707 |
Real Estate | 131,946,368 | 131,946,368 | - | - |
Utilities | 1,101,704,554 | 1,101,704,554 | - | - |
|
| Convertible Preferred Stocks | | | | |
Communication Services | 161,867,356 | - | - | 161,867,356 |
Consumer Discretionary | 6,869,213 | - | - | 6,869,213 |
Consumer Staples | 4,886,055 | - | - | 4,886,055 |
Financials | 39,676,090 | - | - | 39,676,090 |
Health Care | 41,623,517 | - | - | 41,623,517 |
Industrials | 2,225,998,612 | - | - | 2,225,998,612 |
Information Technology | 328,278,648 | - | - | 328,278,648 |
Materials | 30,997,446 | - | - | 30,997,446 |
|
| Preferred Securities | | | | |
Consumer Discretionary | 3,521,370 | - | - | 3,521,370 |
Health Care | 1 | - | - | 1 |
|
| Money Market Funds | 3,185,560,456 | 3,185,560,456 | - | - |
| Total Investments in Securities: | 153,147,621,570 | 147,532,655,877 | 1,022,477,802 | 4,592,487,891 |
The following is a reconciliation of consolidated Investments in Securities for which Level 3 inputs were used in determining value. Beginning balances have been updated to conform to current period presentation, as applicable.
| |
| Investments in Securities: | |
| Beginning Balance | $ | 2,960,379,475 | |
| Net Realized Gain (Loss) on Investment Securities | | 16,207 | |
| Net Unrealized Gain (Loss) on Investment Securities | | 1,312,898,025 | |
| Cost of Purchases | | 387,429,877 | |
| Proceeds of Sales | | (33,430,400) | |
| Amortization/Accretion | | - | |
| Transfers into Level 3 | | - | |
| Transfers out of Level 3 | | (34,805,293) | |
| Ending Balance | $ | 4,592,487,891 | |
| The change in unrealized gain (loss) for the period attributable to Level 3 securities held at December 31, 2024 | $ | 1,296,710,699 | |
| The information used in the above reconciliation represents fiscal year to date activity for any Investments in Securities identified as using Level 3 inputs at either the beginning or the end of the current fiscal period. Cost of purchases and proceeds of sales may include securities received and/or delivered through in-kind transactions, corporate actions or exchanges. Transfers into Level 3 were attributable to a lack of observable market data resulting from decreases in market activity, decreases in liquidity, security restructurings or corporate actions. Transfers out of Level 3 were attributable to observable market data becoming available for those securities. Transfers in or out of Level 3 represent the beginning value of any Security or Instrument where a change in the pricing level occurred from the beginning to the end of the period. Realized and unrealized gains (losses) disclosed in the reconciliation are included in Net Gain (Loss) on the Fund's consolidated Statement of Operations. | |
Consolidated Financial Statements
| Consolidated Statement of Assets and Liabilities |
As of December 31, 2024 |
| Assets | | | | |
| Investment in securities, at value (including securities loaned of $127,020,472) - See accompanying schedule: | | | | |
Unaffiliated issuers (cost $41,836,837,647) | $ | 149,962,061,114 | | |
Fidelity Central Funds (cost $3,185,559,065) | | 3,185,560,456 | | |
| | | | | |
| | | | | |
| Total Investment in Securities (cost $45,022,396,712) | | | $ | 153,147,621,570 |
| Foreign currency held at value (cost $480,569) | | | | 469,732 |
| Receivable for investments sold | | | | 21,896,508 |
| Receivable for fund shares sold | | | | 86,004,281 |
| Dividends receivable | | | | 38,551,748 |
| Distributions receivable from Fidelity Central Funds | | | | 8,331,620 |
| Prepaid expenses | | | | 127,445 |
| Other receivables | | | | 4,654,187 |
Total assets | | | | 153,307,657,091 |
| Liabilities | | | | |
| Payable to custodian bank | $ | 1,666 | | |
| Payable for fund shares redeemed | | 315,858,506 | | |
| Distributions payable | | 1,123 | | |
| Accrued management fee | | 89,493,059 | | |
| Other payables and accrued expenses | | 5,259,488 | | |
| Collateral on securities loaned | | 130,517,700 | | |
| Total liabilities | | | | 541,131,542 |
| Net Assets | | | $ | 152,766,525,549 |
| Net Assets consist of: | | | | |
| Paid in capital | | | $ | 43,895,942,159 |
| Total accumulated earnings (loss) | | | | 108,870,583,390 |
| Net Assets | | | $ | 152,766,525,549 |
| | | | | |
| Net Asset Value and Maximum Offering Price | | | | |
| Contrafund : | | | | |
Net Asset Value, offering price and redemption price per share ($140,188,076,406 ÷ 6,665,673,791 shares) | | | $ | 21.03 |
| Class K : | | | | |
Net Asset Value, offering price and redemption price per share ($12,578,449,143 ÷ 596,048,959 shares) | | | $ | 21.10 |
| Consolidated Statement of Operations |
| Year ended December 31, 2024 |
| Investment Income | | | | |
| Dividends | | | $ | 813,917,979 |
| Interest | | | | 1,697 |
| Income from Fidelity Central Funds (including $845,487 from security lending) | | | | 110,989,869 |
| Total income | | | | 924,909,545 |
| Expenses | | | | |
| Management fee | | | | |
| Basic fee | $ | 813,379,791 | | |
| Performance adjustment | | 43,736,569 | | |
| Transfer agent fees | | 22,671,926 | | |
| Accounting fees | | 623,677 | | |
| Custodian fees and expenses | | 964,545 | | |
| Independent trustees' fees and expenses | | 591,902 | | |
| Registration fees | | 813,904 | | |
| Audit fees | | 194,428 | | |
| Legal | | 96,096 | | |
| Miscellaneous | | 1,003,693 | | |
| Total expenses before reductions | | 884,076,531 | | |
| Expense reductions | | (5,446,405) | | |
| Total expenses after reductions | | | | 878,630,126 |
| Net Investment income (loss) | | | | 46,279,419 |
| Realized and Unrealized Gain (Loss) | | | | |
| Net realized gain (loss) on: | | | | |
| Investment Securities: | | | | |
| Unaffiliated issuers (net of foreign taxes of $1,610,706) | | 7,817,007,383 | | |
| Redemptions in-kind | | 980,509,270 | | |
| Fidelity Central Funds | | (1,670) | | |
| Foreign currency transactions | | (814,898) | | |
| Total net realized gain (loss) | | | | 8,796,700,085 |
| Change in net unrealized appreciation (depreciation) on: | | | | |
| Investment Securities: | | | | |
| Unaffiliated issuers (net of decrease in deferred foreign taxes of $1,295,535) | | 32,571,728,610 | | |
| Unfunded commitments | | 1,279,037 | | |
| Assets and liabilities in foreign currencies | | (563,283) | | |
| Total change in net unrealized appreciation (depreciation) | | | | 32,572,444,364 |
| Net gain (loss) | | | | 41,369,144,449 |
| Net increase (decrease) in net assets resulting from operations | | | $ | 41,415,423,868 |
| Consolidated Statement of Changes in Net Assets |
| |
| | Year ended December 31, 2024 | | Year ended December 31, 2023 |
| Increase (Decrease) in Net Assets | | | | |
| Operations | | | | |
| Net investment income (loss) | $ | 46,279,419 | $ | 600,683,825 |
| Net realized gain (loss) | | 8,796,700,085 | | 3,986,916,003 |
| Change in net unrealized appreciation (depreciation) | | 32,572,444,364 | | 29,562,685,122 |
| Net increase (decrease) in net assets resulting from operations | | 41,415,423,868 | | 34,150,284,950 |
| Distributions to shareholders | | (6,201,314,226) | | (4,919,431,733) |
| | | | | |
| Share transactions - net increase (decrease) | | 692,395,316 | | (3,271,706,693) |
| Total increase (decrease) in net assets | | 35,906,504,958 | | 25,959,146,524 |
| | | | | |
| Net Assets | | | | |
| Beginning of period | | 116,860,020,591 | | 90,900,874,067 |
| End of period | $ | 152,766,525,549 | $ | 116,860,020,591 |
| | | | | |
| | | | | |
Consolidated Financial Highlights
| Years ended December 31, | | 2024 | | 2023 | | 2022 | | 2021 | | 2020 |
Selected Per-Share Data | | | | | | | | | | |
| Net asset value, beginning of period | $ | 16.09 | $ | 12.09 | $ | 18.76 | $ | 16.77 | $ | 13.71 |
| Income from Investment Operations | | | | | | | | | | |
Net investment income (loss) A,B | | .01 | | .08 | | .06 | | (.05) | | (.04) |
| Net realized and unrealized gain (loss) | | 5.81 | | 4.61 | | (5.29) | | 4.07 | | 4.44 |
| Total from investment operations | | 5.82 | | 4.69 | | (5.23) | | 4.02 | | 4.40 |
| Distributions from net investment income | | (.02) | | (.08) | | (.08) | | - | | - |
| Distributions from net realized gain | | (.86) | | (.61) | | (1.36) | | (2.03) | | (1.34) |
| Total distributions | | (.88) | | (.69) | | (1.44) | | (2.03) | | (1.34) |
| Net asset value, end of period | $ | 21.03 | $ | 16.09 | $ | 12.09 | $ | 18.76 | $ | 16.77 |
Total Return C | | | | 39.33% | | (28.26)% | | 24.36% | | 32.58% |
Ratios to Average Net Assets B,D,E | | | | | | | | | | |
| Expenses before reductions | | .63% | | .42% | | .55% | | .81% | | .86% |
| Expenses net of fee waivers, if any | | | | .42% | | .54% | | .81% | | .86% |
| Expenses net of all reductions | | .63% | | .42% | | .54% | | .81% | | .85% |
| Net investment income (loss) | | .03% | | .57% | | .41% | | (.26)% | | (.23)% |
| Supplemental Data | | | | | | | | | | |
| Net assets, end of period (000 omitted) | $ | 140,188,076 | $ | 106,981,545 | $ | 82,278,716 | $ | 128,577,225 | $ | 113,099,730 |
Portfolio turnover rate F | | | | 16% G | | 25% G | | 27% G | | 32% G |
ACalculated based on average shares outstanding during the period.
BNet investment income (loss) is affected by the timing of the declaration of dividends by any underlying mutual funds or exchange-traded funds (ETFs). Net investment income (loss) of any mutual funds or ETFs is not included in the Fund's net investment income (loss) ratio.
CTotal returns would have been lower if certain expenses had not been reduced during the applicable periods shown.
DFees and expenses of any underlying mutual funds or exchange-traded funds (ETFs) are not included in the Fund's expense ratio. The Fund indirectly bears its proportionate share of these expenses. For additional expense information related to investments in Fidelity Central Funds, please refer to the "Investments in Fidelity Central Funds" note found in the Notes to Consolidated Financial Statements section of the most recent Annual or Semi-Annual report.
EExpense ratios reflect operating expenses of the class. Expenses before reductions do not reflect amounts reimbursed, waived, or reduced through arrangements with the investment adviser, brokerage services, or other offset arrangements, if applicable, and do not represent the amount paid by the class during periods when reimbursements, waivers or reductions occur.
FAmount does not include the portfolio activity of any underlying mutual funds or exchange-traded funds (ETFs), derivatives or securities that mature within one year from acquisition.
GPortfolio turnover rate excludes securities received or delivered in-kind.
Fidelity® Contrafund® Class K |
| |
| Years ended December 31, | | 2024 | | 2023 | | 2022 | | 2021 | | 2020 |
Selected Per-Share Data | | | | | | | | | | |
| Net asset value, beginning of period | $ | 16.15 | $ | 12.13 | $ | 18.82 | $ | 16.81 | $ | 13.73 |
| Income from Investment Operations | | | | | | | | | | |
Net investment income (loss) A,B | | .02 | | .09 | | .07 | | (.03) | | (.02) |
| Net realized and unrealized gain (loss) | | 5.83 | | 4.63 | | (5.31) | | 4.07 | | 4.44 |
| Total from investment operations | | 5.85 | | 4.72 | | (5.24) | | 4.04 | | 4.42 |
| Distributions from net investment income | | (.04) | | (.09) | | (.09) | | - | | - |
| Distributions from net realized gain | | (.86) | | (.61) | | (1.36) | | (2.03) | | (1.34) |
| Total distributions | | (.90) | | (.70) | | (1.45) | | (2.03) | | (1.34) |
| Net asset value, end of period | $ | 21.10 | $ | 16.15 | $ | 12.13 | $ | 18.82 | $ | 16.81 |
Total Return C | | | | 39.47% | | (28.22)% | | 24.42% | | 32.68% |
Ratios to Average Net Assets B,D,E | | | | | | | | | | |
| Expenses before reductions | | .56% | | .35% | | .47% | | .74% | | .78% |
| Expenses net of fee waivers, if any | | | | .34% | | .47% | | .74% | | .78% |
| Expenses net of all reductions | | .56% | | .34% | | .47% | | .74% | | .78% |
| Net investment income (loss) | | .10% | | .64% | | .48% | | (.18)% | | (.16)% |
| Supplemental Data | | | | | | | | | | |
| Net assets, end of period (000 omitted) | $ | 12,578,449 | $ | 9,878,476 | $ | 8,622,158 | $ | 16,587,919 | $ | 23,195,528 |
Portfolio turnover rate F | | | | 16% G | | 25% G | | 27% G | | 32% G |
ACalculated based on average shares outstanding during the period.
BNet investment income (loss) is affected by the timing of the declaration of dividends by any underlying mutual funds or exchange-traded funds (ETFs). Net investment income (loss) of any mutual funds or ETFs is not included in the Fund's net investment income (loss) ratio.
CTotal returns would have been lower if certain expenses had not been reduced during the applicable periods shown.
DFees and expenses of any underlying mutual funds or exchange-traded funds (ETFs) are not included in the Fund's expense ratio. The Fund indirectly bears its proportionate share of these expenses. For additional expense information related to investments in Fidelity Central Funds, please refer to the "Investments in Fidelity Central Funds" note found in the Notes to Consolidated Financial Statements section of the most recent Annual or Semi-Annual report.
EExpense ratios reflect operating expenses of the class. Expenses before reductions do not reflect amounts reimbursed, waived, or reduced through arrangements with the investment adviser, brokerage services, or other offset arrangements, if applicable, and do not represent the amount paid by the class during periods when reimbursements, waivers or reductions occur.
FAmount does not include the portfolio activity of any underlying mutual funds or exchange-traded funds (ETFs), derivatives or securities that mature within one year from acquisition.
GPortfolio turnover rate excludes securities received or delivered in-kind.
Notes to Consolidated Financial Statements
For the period ended December 31, 2024
1. Organization.
Fidelity Contrafund (the Fund) is a fund of Fidelity Contrafund (the Trust) and is authorized to issue an unlimited number of shares. The Trust is registered under the Investment Company Act of 1940, as amended (the 1940 Act), as an open-end management investment company organized as a Massachusetts business trust. The Fund offers Contrafund and Class K shares, each of which has equal rights as to assets and voting privileges. Each class has exclusive voting rights with respect to matters that affect that class.
2. Investments in Fidelity Central Funds.
Funds may invest in Fidelity Central Funds, which are open-end investment companies generally available only to other investment companies and accounts managed by the investment adviser and its affiliates. The Consolidated Schedule of Investments lists any Fidelity Central Funds held as an investment as of period end, but does not include the underlying holdings of each Fidelity Central Fund. An investing fund indirectly bears its proportionate share of the expenses of the underlying Fidelity Central Funds.
Based on its investment objective, each Fidelity Central Fund may invest or participate in various investment vehicles or strategies that are similar to those of the investing fund. These strategies are consistent with the investment objectives of the investing fund and may involve certain economic risks which may cause a decline in value of each of the Fidelity Central Funds and thus a decline in the value of the investing fund.
| Fidelity Central Fund | Investment Manager | Investment Objective | Investment Practices | Expense RatioA |
| Fidelity Money Market Central Funds | Fidelity Management & Research Company LLC (FMR) | Each fund seeks to obtain a high level of current income consistent with the preservation of capital and liquidity. | Short-term Investments | Less than .005% |
A Expenses expressed as a percentage of average net assets and are as of each underlying Central Fund's most recent annual or semi-annual shareholder report.
A complete unaudited list of holdings for each Fidelity Central Fund is available upon request or at the Securities and Exchange Commission website at www.sec.gov. In addition, the financial statements of the Fidelity Central Funds which contain the significant accounting policies (including investment valuation policies) of those funds, and are not covered by the Report of Independent Registered Public Accounting Firm, are available on the Securities and Exchange Commission website or upon request.
3. Significant Accounting Policies.
The Fund is an investment company and applies the accounting and reporting guidance of the Financial Accounting Standards Board (FASB) Accounting Standards Codification Topic 946 Financial Services - Investment Companies. The consolidated financial statements have been prepared in conformity with accounting principles generally accepted in the United States of America (GAAP), which require management to make certain estimates and assumptions at the date of the consolidated financial statements. Actual results could differ from those estimates. The Fund operates as a single operating segment. The Fund's income, expenses, assets, and performance are regularly monitored and assessed as a whole by the investment adviser and other individuals responsible for oversight functions of the Trust, using the information presented in the consolidated financial statements and consolidated financial highlights. Subsequent events, if any, through the date that the consolidated financial statements were issued have been evaluated in the preparation of the consolidated financial statements. The Fund's Consolidated Schedule of Investments lists any underlying mutual funds or exchange-traded funds (ETFs) but does not include the underlying holdings of these funds. The following summarizes the significant accounting policies of the Fund:
Investment Valuation. Investments are valued as of 4:00 p.m. Eastern time on the last calendar day of the period. The Board of Trustees (the Board) has designated the Fund's investment adviser as the valuation designee responsible for the fair valuation function and performing fair value determinations as needed. The investment adviser has established a Fair Value Committee (the Committee) to carry out the day-to-day fair valuation responsibilities and has adopted policies and procedures to govern the fair valuation process and the activities of the Committee. In accordance with these fair valuation policies and procedures, which have been approved by the Board, the Fund attempts to obtain prices from one or more third party pricing services or brokers to value its investments. When current market prices, quotations or currency exchange rates are not readily available or reliable, investments will be fair valued in good faith by the Committee, in accordance with the policies and procedures. Factors used in determining fair value vary by investment type and may include market or investment specific events, transaction data, estimated cash flows, and market observations of comparable investments. The frequency that the fair valuation procedures are used cannot be predicted and they may be utilized to a significant extent. The Committee manages the Fund's fair valuation practices and maintains the fair valuation policies and procedures. The Fund's investment adviser reports to the Board information regarding the fair valuation process and related material matters.
The Fund categorizes the inputs to valuation techniques used to value its investments into a disclosure hierarchy consisting of three levels as shown below:
Level 1 - unadjusted quoted prices in active markets for identical investments
Level 2 - other significant observable inputs (including quoted prices for similar investments, interest rates, prepayment speeds, etc.)
Level 3 - unobservable inputs (including the Fund's own assumptions based on the best information available)
Valuation techniques used to value the Fund's investments by major category are as follows:
Equity securities, including restricted securities, for which market quotations are readily available, are valued at the last reported sale price or official closing price as reported by a third party pricing service on the primary market or exchange on which they are traded and are categorized as Level 1 in the hierarchy. In the event there were no sales during the day or closing prices are not available, securities are valued at the last quoted bid price or may be valued using the last available price and are generally categorized as Level 2 in the hierarchy. For foreign equity securities, when market or security specific events arise, comparisons to the valuation of American Depositary Receipts (ADRs), futures contracts, Exchange-Traded Funds (ETFs) and certain indexes as well as quoted prices for similar securities may be used and would be categorized as Level 2 in the hierarchy. For equity securities, including restricted securities, where observable inputs are limited, assumptions about market activity and risk are used and these securities may be categorized as Level 3 in the hierarchy. Securities, including private placements or other restricted securities, for which observable inputs are not available are valued using alternate valuation approaches, including the market approach, the income approach and cost approach, and are categorized as Level 3 in the hierarchy. The market approach considers factors including the price of recent investments in the same or a similar security or financial metrics of comparable securities. The income approach considers factors including expected future cash flows, security specific risks and corresponding discount rates. The cost approach considers factors including the value of the security's underlying assets and liabilities.
Debt securities, including restricted securities, are valued based on evaluated prices received from third party pricing services or from brokers who make markets in such securities. Preferred securities are valued by pricing services who utilize matrix pricing which considers yield or price of bonds of comparable quality, coupon, maturity and type or by broker-supplied prices. When independent prices are unavailable or unreliable, debt securities may be valued utilizing pricing methodologies which consider similar factors that would be used by third party pricing services. Debt securities are generally categorized as Level 2 in the hierarchy but may be Level 3 depending on the circumstances.
Investments in open-end mutual funds, including the Fidelity Central Funds, are valued at their closing net asset value (NAV) each business day and are categorized as Level 1 in the hierarchy.
The following provides information on Level 3 securities held by the Fund that were valued at period end based on unobservable inputs. These amounts exclude valuations provided by a broker.
| Asset Type | Fair Value | Valuation Technique(s) | Unobservable Input | Amount or Range/Weighted Average | Impact to Valuation from an Increase in InputA |
| Common Stocks | $ 1,748,769,583 | Market comparable | Enterprise value/Revenue multiple (EV/R) | 1.5 - 61.8 / 11.7 | Increase |
| | | | Enterprise value/EBITDA multiple (EV/EBITDA) | 21.3 - 33.4 / 31.0 | Increase |
| | | | Enterprise value/Net income multiple (EV/NI) | 14.0 | Increase |
| | | Market approach | Transaction price | $1.77 | Increase |
| | | Recovery value | Recovery value | $0.00 - $0.17 / $0.13 | Increase |
| | | Black scholes | Discount rate | 4.3% - 4.4% / 4.4% | Increase |
| | | | Term | 1.0 - 5.0 / 2.2 | Increase |
| | | | Volatility | 60.0% - 100.0% / 60.3% | Increase |
| | | Book value | Book value multiple | 1.0 | Increase |
| Convertible Preferred Stocks | $ 2,840,196,937 | Market comparable | Enterprise value/Revenue multiple (EV/R) | 0.9 - 61.8 / 20.9 | Increase |
| | | | Enterprise value/EBITDA multiple (EV/EBITDA) | 21.3 - 33.4 / 33.3 | Increase |
| | | Market approach | Transaction price | $20.85 | Increase |
| | | | Discount rate | 85.0% | Decrease |
| | | Recovery value | Recovery value | $0.00 | Increase |
| | | Black scholes | Discount rate | 4.3% - 4.4% / 4.3% | Increase |
| | | | Term | 2.0 - 5.0 / 2.6 | Increase |
| | | | Volatility | 60.0% - 80.0% / 75.7% | Increase |
| | | Book value | Book value multiple | 1.0 | Increase |
| Preferred Securities | $ 3,521,371 | Market comparable | Enterprise value/Revenue multiple (EV/R) | 1.5 | Increase |
| | | Recovery value | Recovery value | $0.00 | Increase |
| | | Black scholes | Discount rate | 4.4% | Increase |
| | | | Term | 2.1 | Increase |
| | | | Volatility | 60.0% | Increase |
A Represents the directional change in the fair value of the Level 3 investments that could have resulted from an increase in the corresponding input as of period end. A decrease to the unobservable input would have had the opposite effect. Significant changes in these inputs may have resulted in a significantly higher or lower fair value measurement at period end.
Changes in valuation techniques may result in transfers in or out of an assigned level within the disclosure hierarchy. The aggregate value of investments by input level as of December 31, 2024, as well as a roll forward of Level 3 investments, is included at the end of the Fund's Consolidated Schedule of Investments.
Foreign Currency. Certain Funds may use foreign currency contracts to facilitate transactions in foreign-denominated securities. Gains and losses from these transactions may arise from changes in the value of the foreign currency or if the counterparties do not perform under the contracts' terms.
Foreign-denominated assets, including investment securities, and liabilities are translated into U.S. dollars at the exchange rates at period end. Purchases and sales of investment securities, income and dividends received, and expenses denominated in foreign currencies are translated into U.S. dollars at the exchange rate in effect on the transaction date.
The effects of exchange rate fluctuations on investments are included with the net realized and unrealized gain (loss) on investment securities. Other foreign currency transactions resulting in realized and unrealized gain (loss) are disclosed separately.
Investment Transactions and Income. For financial reporting purposes, the Fund's investment holdings and NAV include trades executed through the end of the last business day of the period. The NAV per share for processing shareholder transactions is calculated as of the close of business of the New York Stock Exchange (NYSE), normally 4:00 p.m. Eastern time and includes trades executed through the end of the prior business day. Gains and losses on securities sold are determined on the basis of identified cost and include proceeds received from litigation. Commissions paid to certain brokers with whom the investment adviser, or its affiliates, places trades on behalf of a fund include an amount in addition to trade execution, which may be rebated back to a fund. Any such rebates are included in net realized gain (loss) on investments in the Consolidated Statement of Operations. Dividend income is recorded on the ex-dividend date, except for certain dividends from foreign securities where the ex-dividend date may have passed, which are recorded as soon as the Fund is informed of the ex-dividend date. Non-cash dividends included in dividend income, if any, are recorded at the fair market value of the securities received. Income and capital gain distributions from Fidelity Central Funds, if any, are recorded on the ex-dividend date. Certain distributions received by the Fund represent a return of capital or capital gain. The Fund determines the components of these distributions subsequent to the ex-dividend date, based upon receipt of tax filings or other correspondence relating to the underlying investment. These distributions are recorded as a reduction of cost of investments and/or as a realized gain. Interest income is accrued as earned and includes coupon interest and amortization of premium and accretion of discount on debt securities as applicable. Investment income is recorded net of foreign taxes withheld where recovery of such taxes is uncertain. Debt obligations may be placed on non-accrual status and related interest income may be reduced by ceasing current accruals and writing off interest receivables when the collection of all or a portion of interest has become doubtful based on consistently applied procedures. A debt obligation is removed from non-accrual status when the issuer resumes interest payments or when collectability of interest is reasonably assured. Funds may file withholding tax reclaims in certain jurisdictions to recover a portion of amounts previously withheld. Any withholding tax reclaims income is included in the Consolidated Statement of Operations in dividends. Any receivables for withholding tax reclaims are included in the Consolidated Statement of Assets and Liabilities in dividends receivable.
Class Allocations and Expenses. Investment income, realized and unrealized capital gains and losses, common expenses of a fund, and certain fund-level expense reductions, if any, are allocated daily on a pro-rata basis to each class based on the relative net assets of each class to the total net assets of a fund. Each class differs with respect to transfer agent and distribution and service plan fees incurred, as applicable. Certain expense reductions may also differ by class, if applicable. For the reporting period, the allocated portion of income and expenses to each class as a percent of its average net assets may vary due to the timing of recording these transactions in relation to fluctuating net assets of the classes. Expenses directly attributable to a fund are charged to that fund. Expenses attributable to more than one fund are allocated among the respective funds on the basis of relative net assets or other appropriate methods. Expenses included in the accompanying consolidated financial statements reflect the expenses of that fund and do not include any expenses associated with any underlying mutual funds or exchange-traded funds (ETFs). Although not included in a fund's expenses, a fund indirectly bears its proportionate share of these expenses through the net asset value of each underlying mutual fund or exchange-traded fund (ETF). Expense estimates are accrued in the period to which they relate and adjustments are made when actual amounts are known.
Deferred Trustee Compensation. Under a Deferred Compensation Plan (the Plan) for certain Funds, certain independent Trustees have elected to defer receipt of a portion of their annual compensation. Deferred amounts are invested in affiliated mutual funds, are marked-to-market and remain in a fund until distributed in accordance with the Plan. The investment of deferred amounts and the offsetting payable to the Trustees presented below are included in the accompanying Consolidated Statement of Assets and Liabilities in other receivables and other payables and accrued expenses, as applicable.
| Fidelity Contrafund | $4,653,941 |
Income Tax Information and Distributions to Shareholders. Each year, the Fund intends to qualify as a regulated investment company under Subchapter M of the Internal Revenue Code, including distributing substantially all of its taxable income and realized gains. As a result, no provision for U.S. Federal income taxes is required. As of December 31, 2024, the Fund did not have any unrecognized tax benefits in the consolidated financial statements; nor is the Fund aware of any tax positions for which it is reasonably possible that the total amounts of unrecognized tax benefits will significantly change in the next twelve months. The Fund files a U.S. federal tax return, in addition to state and local tax returns as required. The Fund's federal income tax returns are subject to examination by the Internal Revenue Service (IRS) for a period of three fiscal years after they are filed. State and local tax returns may be subject to examination for an additional fiscal year depending on the jurisdiction. Foreign taxes are provided for based on the Fund's understanding of the tax rules and rates that exist in the foreign markets in which it invests. The Fund is subject to a tax imposed on capital gains by certain countries in which it invests.
Distributions are declared and recorded on the ex-dividend date. Income and capital gain distributions are declared separately for each class. Income and capital gain distributions are determined in accordance with income tax regulations, which may differ from GAAP. In addition, the Fund claimed a portion of the payment made to redeeming shareholders as a distribution for income tax purposes.
Capital accounts within the consolidated financial statements are adjusted for permanent book-tax differences. These adjustments have no impact on net assets or the results of operations. Capital accounts are not adjusted for temporary book-tax differences which will reverse in a subsequent period.
Book-tax differences are primarily due to foreign currency transactions, certain foreign taxes, passive foreign investment companies (PFIC), redemptions in-kind, partnerships and losses deferred due to wash sales.
As of period end, the cost and unrealized appreciation (depreciation) in securities, and derivatives if applicable, for federal income tax purposes were as follows:
| Gross unrealized appreciation | $108,503,303,078 |
| Gross unrealized depreciation | (886,569,818) |
| Net unrealized appreciation (depreciation) | $107,616,733,260 |
| Tax Cost | $45,530,888,310 |
The tax-based components of distributable earnings as of period end were as follows:
| Undistributed long-term capital gain | $1,254,125,861 |
| Net unrealized appreciation (depreciation) on securities and other investments | $107,616,457,529 |
The tax character of distributions paid was as follows:
| | December 31, 2024 | December 31, 2023 |
| Ordinary Income | $133,551,609 | $ 551,942,573 |
| Long-term Capital Gains | 6,067,762,617 | 4,367,489,160 |
| Total | $6,201,314,226 | $ 4,919,431,733 |
Restricted Securities (including Private Placements). Funds may invest in securities that are subject to legal or contractual restrictions on resale. These securities generally may be resold in transactions exempt from registration or to the public if the securities are registered. Disposal of these securities may involve time-consuming negotiations and expense, and prompt sale at an acceptable price may be difficult. Information regarding restricted securities held at period end is included at the end of the Consolidated Schedule of Investments, if applicable.
Special Purpose Acquisition Companies. Funds may invest in stock, warrants, and other securities of special purpose acquisition companies (SPACs) or similar special purpose entities. A SPAC is a publicly traded company that raises investment capital via an initial public offering (IPO) for the purpose of acquiring the equity securities of one or more existing companies via merger, business combination, acquisition or other similar transactions within a designated time frame.
Private Investment in Public Equity. Funds may acquire equity securities of an issuer through a private investment in a public equity (PIPE) transaction, including through commitments to purchase securities on a when-issued basis. A PIPE typically involves the purchase of securities directly from a publicly traded company in a private placement transaction. Securities purchased through PIPE transactions will be restricted from trading and considered illiquid until a resale registration statement for the shares is filed and declared effective.
At the current and/or prior period end, the Fund had commitments to purchase when-issued securities through PIPE transactions with SPACs. The commitments are contingent upon the SPACs acquiring the securities of target companies. Unrealized appreciation (depreciation) on any commitments outstanding at period end is separately presented in the Consolidated Statement of Assets and Liabilities as Unrealized appreciation (depreciation) on unfunded commitments, and any change in unrealized appreciation (depreciation) on unfunded commitments during the period is separately presented in the Consolidated Statement of Operations, as applicable.
Consolidated Subsidiary. The Funds included in the table below hold certain investments through a wholly-owned subsidiary ("Subsidiary"), which may be subject to federal and state taxes upon disposition.
As of period end, investments in Subsidiaries were as follows:
| | Amount ($) | % of Net Assets |
| Fidelity Contrafund | 188,716,449 | .12 |
The financial statements have been consolidated to include the Subsidiary accounts where applicable. Accordingly, all inter-company transactions and balances have been eliminated.
At period end, any estimated tax liability for these investments is presented as "Deferred taxes" in the Consolidated Statement of Assets and Liabilities and included in "Change in net unrealized appreciation (depreciation) on investment securities" in the Consolidated Statement of Operations. The tax liability incurred may differ materially depending on conditions when these investments are disposed. Any cash held by a Subsidiary is restricted as to its use and is presented as "Restricted cash" in the Consolidated Statement of Assets and Liabilities, if applicable.
New Accounting Pronouncement. FASB Accounting Standards Update (ASU) 2023-07 Segment Reporting (Topic 280): Improvements to Reportable Segment Disclosures became effective in this reporting period. ASU 2023-07 enhances segment information disclosure in the notes to consolidated financial statements.
4. Purchases and Sales of Investments.
Purchases and sales of securities, other than short-term securities and in-kind transactions, as applicable, are noted in the table below.
| | Purchases ($) | Sales ($) |
| Fidelity Contrafund | 24,679,332,434 | 29,705,732,138 |
Unaffiliated Redemptions In-Kind. Shares that were redeemed in-kind for investments, including accrued interest and cash, if any, are shown in the table below. The net realized gain or loss on investments delivered through in-kind redemptions is included in the "Net realized gain (loss) on: Redemptions in-kind" line in the accompanying Consolidated Statement of Operations. The amount of the in-kind redemptions is included in share transactions in the accompanying Consolidated Statement of Changes in Net Assets. There was no gain or loss for federal income tax purposes.
| | Shares | Total net realized gain or loss ($) | Total Proceeds ($) |
| Fidelity Contrafund | 62,272,337 | 980,509,270 | 1,145,842,701 |
Unaffiliated Exchanges In-Kind. Shares that were exchanged for investments, including accrued interest and cash, if any, are shown in the table below. The amount of in-kind exchanges is included in share transactions in the accompanying Consolidated Statement of Changes in Net Assets.
| | Shares | Total Proceeds ($) |
| Fidelity Contrafund | 25,337,009 | 540,760,933 |
Prior Fiscal Year Unaffiliated Redemptions In-Kind. Shares that were redeemed in-kind for investments, including accrued interest and cash, if any, are shown in the table below; along with realized gain or loss on investments delivered through in-kind redemptions. The amount of the in-kind redemptions is included in share transactions in the accompanying Consolidated Statement of Changes in Net Assets. There was no gain or loss for federal income tax purposes.
| | Shares | Total net realized gain or loss ($) | Total Proceeds ($) |
| Fidelity Contrafund | 70,791,655 | 598,966,894 | 935,465,870 |
Prior Year Unaffiliated Exchanges In-Kind. Shares that were exchanged for investments, including accrued interest and cash, if any, are shown in the table below. The amount of in-kind exchanges is included in share transactions in the accompanying Consolidated Statement of Changes in Net Assets.
| | Shares | Total Proceeds ($) |
| Fidelity Contrafund | 21,380,092 | 341,440,072 |
5. Fees and Other Transactions with Affiliates.
Management Fee. Fidelity Management & Research Company LLC (the investment adviser) and its affiliates provide the Fund with investment management related services for which the Fund pays a monthly management fee.
Effective March 1, 2024, the Fund's management contract was amended to incorporate administrative services previously covered under separate services agreements (Transfer Agent and Accounting agreements). The amended contract incorporates a basic fee rate that may vary by class (subject to a performance adjustment). The investment adviser or an affiliate pays certain expenses of managing and operating the Fund out of each class's management fee. Each class of the Fund pays a management fee to the investment adviser. The management fee is calculated and paid to the investment adviser every month. The management fee is determined by calculating a basic fee and then applying a performance adjustment. When determining a class's basic fee, a mandate rate is calculated based on the monthly average net assets of a group of funds advised by FMR within a designated asset class. A discount rate is subtracted from the mandate rate once the Fund's monthly average net assets reach a certain level. The mandate rate and discount rate may vary by class. The annual basic fee rate for a class of shares of the Fund is the lesser of (1) the class's mandate rate reduced by the class's discount rate (if applicable) or (2) the amount set forth in the following table.
| | Maximum Management Fee Rate % |
| Contrafund | .61 |
| Class K | .54 |
One-twelfth of the basic fee rate for a class is applied to the average net assets of the class for the month, giving a dollar amount which is the basic fee for the class for that month. A different management fee rate may be applicable to each class of the Fund. The difference between classes is the result of separate arrangements for class-level services and/or waivers of certain expenses. It is not the result of any difference in advisory or custodial fees or other expenses related to the management of the Fund's assets, which do not vary by class. For the portion of the reporting period on or after March 1, 2024, the total annualized management fee rates were as follows:
| | Total Management Fee Rate % |
| Contrafund | .59 |
| Class K | .52 |
Prior to March 1, 2024, the management fee was the sum of an individual fund fee rate that was based on an annual rate of .30% of the Fund's average net assets and an annualized group fee rate that averaged .22% during the period. The group fee rate was based upon the monthly average net assets of a group of registered investment companies with which the investment adviser has management contracts. The group fee rate decreased as assets under management increased and increased as assets under management decreased. For the portion of the reporting period prior to March 1, 2024, the total annualized management fee rate was .52%.
The performance adjustment rate is calculated monthly by comparing over the performance period the Fund's performance to that of the performance adjustment index listed below.
| | Performance Adjustment Index |
| Fidelity Contrafund | S&P 500 Index |
For the purposes of calculating the performance adjustment for the Fund, the Fund's investment performance is based on the performance of Contrafund. To the extent that other classes of the Fund have higher expenses, this could result in those classes bearing a larger positive performance adjustment and smaller negative performance adjustment than would be the case if each class's own performance were considered. The performance period is the most recent 36 month period. The maximum annualized performance adjustment rate is ± .20% of the Fund's average net assets over the performance period. The performance adjustment rate is divided by twelve and multiplied by the Fund's average net assets over the performance period, and the resulting dollar amount is proportionately added to or subtracted from a class's basic fee. For the entire reporting period, the total annual performance adjustment was .03%.
Effective March 1, 2024, the Fund's sub-advisory agreements with FMR Investment Management (UK) Limited, Fidelity Management & Research (Hong Kong) Limited, and Fidelity Management & Research (Japan) Limited were amended to provide that the investment adviser pays each sub-adviser monthly fees equal to 110% of the sub-adviser's costs for providing sub-advisory services.
Transfer Agent Fees. Fidelity Investments Institutional Operations Company LLC (FIIOC), an affiliate of the investment adviser, is the transfer, dividend disbursing and shareholder servicing agent for each class of the Fund. Effective March 1, 2024, the Fund's management contract was amended to incorporate transfer agent services and associated fees previously covered under a separate services agreement. FIIOC pays for typesetting, printing and mailing of shareholder reports, except proxy statements.
During the period January 1, 2024 through February 29, 2024, the transfer agent fees for each class were a fixed annual rate of class-level average net assets as follows:
| | Amount ($) | % of Class-Level Average Net Assets | |
| Contrafund | 21,933,979 | .1152 | |
| Class K | 737,947 | .0420 | |
| | 22,671,926 | |
| | | | |
Accounting Fees. Fidelity Service Company, Inc. (FSC), an affiliate of the investment adviser, maintains the Fund's accounting records. Effective March 1, 2024, the Fund's management contract was amended to incorporate accounting services and associated fees previously covered under a separate services agreement.
During the period January 1, 2024 through February 29, 2024, the accounting fees were a fixed annual rate of average net assets as follows:
| | % of Average Net Assets |
| Fidelity Contrafund | .0030 |
Brokerage Commissions. A portion of portfolio transactions were placed with brokerage firms which are affiliates of the investment adviser. Brokerage commissions are included in net realized gain (loss) and change in net unrealized appreciation (depreciation) in the Consolidated Statement of Operations. The commissions paid to these affiliated firms were as follows:
| | Amount ($) |
| Fidelity Contrafund | 338,693 |
Interfund Trades. Funds may purchase from or sell securities to other Fidelity Funds under procedures adopted by the Board. The procedures have been designed to ensure these interfund trades are executed in accordance with Rule 17a-7 of the 1940 Act. Any interfund trades are included within the respective purchases and sales amounts shown in the Purchases and Sales of Investments note. Interfund trades during the period are noted in the table below.
| | Purchases ($) | Sales ($) | Realized Gain (Loss) ($) |
| Fidelity Contrafund | 1,067,755,344 | 1,816,575,304 | 582,620,446 |
Other. During the period, the investment adviser reimbursed the Fund for certain losses as follows:
| | Amount ($) |
| Fidelity Contrafund | 9,730 |
6. Committed Line of Credit.
Certain Funds participate with other funds managed by the investment adviser or an affiliate in a $4.25 billion credit facility (the "line of credit") to be utilized for temporary or emergency purposes to fund shareholder redemptions or for other short-term liquidity purposes.
Commitment fees are charged based on the unused amount of the line of credit at an annual rate of .10%, and then allocated to each participating fund based on its pro-rata portion of the line of credit. The commitment fees are reflected in Miscellaneous expenses on the Consolidated Statement of Operations, and are listed below.
Interest is charged to a participating fund based on its borrowings at an annual rate of .75% plus the highest of (i) daily SOFR plus a .10% spread adjustment, (ii) Federal Funds Effective Rate, or (iii) Overnight Bank Funding Rate. During the period, there were no borrowings on this line of credit.
The line of credit agreement will expire in March 2025 unless extended or renewed.
| | Amount ($) |
| Fidelity Contrafund | 207,297 |
7. Security Lending.
Funds lend portfolio securities from time to time in order to earn additional income. Lending agents are used, including National Financial Services (NFS), an affiliate of the investment adviser. Pursuant to a securities lending agreement, NFS will receive a fee, which is capped at 9.9% of a fund's daily lending revenue, for its services as lending agent. A fund may lend securities to certain qualified borrowers, including NFS. On the settlement date of the loan, a fund receives collateral (in the form of U.S. Treasury obligations, letters of credit and/or cash) against the loaned securities and maintains collateral in an amount not less than 100% of the market value of the loaned securities during the period of the loan. The market value of the loaned securities is determined at the close of business of a fund and any additional required collateral is delivered to a fund on the next business day. A fund or borrower may terminate the loan at any time, and if the borrower defaults on its obligation to return the securities loaned because of insolvency or other reasons, a fund may apply collateral received from the borrower against the obligation. A fund may experience delays and costs in recovering the securities loaned. Any cash collateral received is invested in the Fidelity Securities Lending Cash Central Fund. Any loaned securities are identified as such in the Consolidated Schedule of Investments, and the value of loaned securities and cash collateral at period end, as applicable, are presented in the Consolidated Statement of Assets and Liabilities. Security lending income represents the income earned on investing cash collateral, less rebates paid to borrowers and any lending agent fees associated with the loan, plus any premium payments received for lending certain types of securities. Security lending income is presented in the Consolidated Statement of Operations as a component of income from Fidelity Central Funds. Affiliated security lending activity, if any, was as follows:
| | Total Security Lending Fees Paid to NFS ($) | Security Lending Income From Securities Loaned to NFS ($) | Value of Securities Loaned to NFS at Period End ($) |
| Fidelity Contrafund | 87,988 | 25,485 | 19,604 |
8. Expense Reductions.
Through arrangements with the Fund's custodian, credits realized as a result of certain uninvested cash balances were used to reduce the Fund's expenses. During the period, custodian credits reduced the Fund's expenses by $20,177.
In addition, during the period the investment adviser or an affiliate reimbursed and/or waived a portion of fund-level operating expenses in the amount of $5,426,228.
9. Distributions to Shareholders.
Distributions to shareholders of each class were as follows:
| | Year ended December 31, 2024 | Year ended December 31, 2023 |
| Fidelity Contrafund | | |
| Distributions to shareholders | | |
| Contrafund | $5,688,411,620 | $4,485,639,497 |
| Class K | 512,902,606 | 433,792,236 |
Total | $6,201,314,226 | $4,919,431,733 |
10. Share Transactions.
Share transactions for each class were as follows and may contain in-kind transactions, automatic conversions between classes or exchanges between affiliated funds:
| | Shares | Shares | Dollars | Dollars |
| | Year ended December 31, 2024 | Year ended December 31, 2023 | Year ended December 31, 2024 | Year ended December 31, 2023 |
| Fidelity Contrafund | | | | |
| Contrafund | | | | |
| Shares sold | 654,256,321 | 340,492,207 | $12,881,374,721 | $4,969,609,353 |
| Reinvestment of distributions | 239,167,390 | 281,456,094 | 5,230,176,005 | 4,141,294,481 |
| Shares redeemed | (878,296,183) | (779,441,714) | (17,168,956,862) | (11,096,644,283) |
| Net increase (decrease) | 15,127,528 | (157,493,413) | $942,593,864 | $(1,985,740,449) |
| Class K | | | | |
| Shares sold | 111,750,962 | 103,349,879 | $2,199,280,649 | $1,509,223,115 |
| Reinvestment of distributions | 23,408,561 | 29,492,179 | 512,077,649 | 433,760,122 |
| Shares redeemed | (150,953,959) | (231,967,422) | (2,961,556,846) | (3,228,949,481) |
| Net increase (decrease) | (15,794,436) | (99,125,364) | $(250,198,548) | $(1,285,966,244) |
11. Other.
A fund's organizational documents provide former and current trustees and officers with a limited indemnification against liabilities arising in connection with the performance of their duties to the fund. In the normal course of business, a fund may also enter into contracts that provide general indemnifications. A fund's maximum exposure under these arrangements is unknown as this would be dependent on future claims that may be made against a fund. The risk of material loss from such claims is considered remote.
12. Risk and Uncertainties.
Many factors affect a fund's performance. Developments that disrupt global economies and financial markets, such as pandemics, epidemics, outbreaks of infectious diseases, war, terrorism, and environmental disasters, may significantly affect a fund's investment performance. The effects of these developments to a fund will be impacted by the types of securities in which a fund invests, the financial condition, industry, economic sector, and geographic location of an issuer, and a fund's level of investment in the securities of that issuer. Significant concentrations in security types, issuers, industries, sectors, and geographic locations may magnify the factors that affect a fund's performance.
Report of Independent Registered Public Accounting Firm
To the Board of Trustees of Fidelity Contrafund and Shareholders of Fidelity Contrafund
Opinion on the Financial Statements
We have audited the accompanying consolidated statement of assets and liabilities, including the consolidated schedule of investments, of Fidelity Contrafund and its subsidiaries (one of the funds constituting Fidelity Contrafund, referred to hereafter as the "Fund") as of December 31, 2024, the related consolidated statement of operations for the year ended December 31, 2024, the consolidated statement of changes in net assets for each of the two years in the period ended December 31, 2024, including the related notes, and the consolidated financial highlights for each of the five years in the period ended December 31, 2024 (collectively referred to as the "consolidated financial statements"). In our opinion, the consolidated financial statements present fairly, in all material respects, the financial position of the Fund as of December 31, 2024, the results of its operations for the year then ended, the changes in its net assets for each of the two years in the period ended December 31, 2024 and the financial highlights for each of the five years in the period ended December 31, 2024 in conformity with accounting principles generally accepted in the United States of America.
Basis for Opinion
These consolidated financial statements are the responsibility of the Fund's management. Our responsibility is to express an opinion on the Fund's consolidated financial statements based on our audits. We are a public accounting firm registered with the Public Company Accounting Oversight Board (United States) (PCAOB) and are required to be independent with respect to the Fund in accordance with the U.S. federal securities laws and the applicable rules and regulations of the Securities and Exchange Commission and the PCAOB.
We conducted our audits of these consolidated financial statements in accordance with the standards of the PCAOB. Those standards require that we plan and perform the audit to obtain reasonable assurance about whether the consolidated financial statements are free of material misstatement, whether due to error or fraud.
Our audits included performing procedures to assess the risks of material misstatement of the consolidated financial statements, whether due to error or fraud, and performing procedures that respond to those risks. Such procedures included examining, on a test basis, evidence regarding the amounts and disclosures in the consolidated financial statements. Our audits also included evaluating the accounting principles used and significant estimates made by management, as well as evaluating the overall presentation of the consolidated financial statements. Our procedures included confirmation of securities owned as of December 31, 2024 by correspondence with the custodian, issuers of privately offered securities and brokers. We believe that our audits provide a reasonable basis for our opinion.
/s/ PricewaterhouseCoopers LLP
Boston, Massachusetts
February 11, 2025
We have served as the auditor of one or more investment companies in the Fidelity group of funds since 1932.
Distributions
(Unaudited)The dividend and capital gains distributions for the fund(s) are available on Fidelity.com or Institutional.Fidelity.com.
The fund hereby designates as a capital gain dividend with respect to the taxable year ended December 31, 2024, $7,777,074,813, or, if subsequently determined to be different, the net capital gain of such year.
Retail Class and Class K designate 100% of each dividend distributed during the fiscal year as qualifying for the dividends-received deduction for corporate shareholders.
Retail Class and Class K designate 100% of each dividend distributed during the fiscal year as amounts which may be taken into account as a dividend for purposes of the maximum rate under section 1(h)(11) of the Internal Revenue Code.
The fund will notify shareholders in January 2025 of amounts for use in preparing 2024 income tax returns.
Item 8: Changes in and Disagreements with Accountants for Open-End Management Investment Companies
(Unaudited)
Note: This is not applicable for any fund included in this document.
Item 9: Proxy Disclosures for Open-End Management Investment Companies
(Unaudited)
| A special meeting of shareholders was held on July 16, 2024. The results of votes taken among shareholders on the proposal before them are reported below. Each vote reported represents one dollar of net asset value held on the record date for the meeting. |
| Proposal 1 |
| To elect a Board of Trustees. |
| | # of Votes | % of Votes |
| Bettina Doulton |
| Affirmative | 107,413,165,703.86 | 95.45 |
| Withheld | 5,115,205,734.52 | 4.55 |
| TOTAL | 112,528,371,438.38 | 100.00 |
| Robert A. Lawrence |
| Affirmative | 106,925,132,614.87 | 95.02 |
| Withheld | 5,603,238,823.51 | 4.98 |
| TOTAL | 112,528,371,438.38 | 100.00 |
| Vijay C. Advani |
| Affirmative | 106,908,299,345.67 | 95.01 |
| Withheld | 5,620,072,092.71 | 4.99 |
| TOTAL | 112,528,371,438.38 | 100.00 |
| Thomas P. Bostick |
| Affirmative | 107,023,189,484.37 | 95.11 |
| Withheld | 5,505,181,954.01 | 4.89 |
| TOTAL | 112,528,371,438.38 | 100.00 |
| Donald F. Donahue |
| Affirmative | 107,148,439,746.95 | 95.22 |
| Withheld | 5,379,931,691.43 | 4.78 |
| TOTAL | 112,528,371,438.38 | 100.00 |
| Vicki L. Fuller |
| Affirmative | 107,159,480,594.93 | 95.23 |
| Withheld | 5,368,890,843.45 | 4.77 |
| TOTAL | 112,528,371,438.38 | 100.00 |
| Patricia L. Kampling |
| Affirmative | 107,220,897,546.66 | 95.28 |
| Withheld | 5,307,473,891.72 | 4.72 |
| TOTAL | 112,528,371,438.38 | 100.00 |
| Thomas A. Kennedy |
| Affirmative | 107,004,892,718.66 | 95.09 |
| Withheld | 5,523,478,719.73 | 4.91 |
| TOTAL | 112,528,371,438.38 | 100.00 |
| Oscar Munoz |
| Affirmative | 106,701,787,976.15 | 94.82 |
| Withheld | 5,826,583,462.23 | 5.18 |
| TOTAL | 112,528,371,438.38 | 100.00 |
| Karen B. Peetz |
| Affirmative | 107,369,162,431.54 | 95.42 |
| Withheld | 5,159,209,006.84 | 4.58 |
| TOTAL | 112,528,371,438.38 | 100.00 |
| David M. Thomas |
| Affirmative | 106,815,962,138.16 | 94.92 |
| Withheld | 5,712,409,300.22 | 5.08 |
| TOTAL | 112,528,371,438.38 | 100.00 |
| Susan Tomasky |
| Affirmative | 107,029,000,908.81 | 95.11 |
| Withheld | 5,499,370,529.58 | 4.89 |
| TOTAL | 112,528,371,438.38 | 100.00 |
| Michael E. Wiley |
| Affirmative | 106,863,215,681.69 | 94.97 |
| Withheld | 5,665,155,756.69 | 5.03 |
| TOTAL | 112,528,371,438.38 | 100.00 |
| | | |
| Proposal 1 reflects trust-wide proposal and voting results. |
Item 10: Remuneration Paid to Directors, Officers, and others of Open-End Management Investment Companies
(Unaudited)
Note: This information is disclosed as part of the consolidated financial statements for each Fund as part of Item 7: Consolidated Financial Statements and Consolidated Financial Highlights for Open-End Management Investment companies.
Item 11: Statement Regarding Basis for Approval of Investment Advisory Contract
(Unaudited)
Note: This is not applicable for any fund included in this document.
1.540009.127
CON-ANN-0325
Fidelity® Contrafund® K6
Annual Report
December 31, 2024
Contents
To view a fund's proxy voting guidelines and proxy voting record for the 12-month period ended June 30, visit http://www.fidelity.com/proxyvotingresults or visit the Securities and Exchange Commission's (SEC) web site at http://www.sec.gov.
You may also call 1-800-835-5092 to request a free copy of the proxy voting guidelines.
Standard & Poor's, S&P and S&P 500 are registered service marks of The McGraw-Hill Companies, Inc. and have been licensed for use by Fidelity Distributors Corporation.
Other third-party marks appearing herein are the property of their respective owners.
All other marks appearing herein are registered or unregistered trademarks or service marks of FMR LLC or an affiliated company. © 2025 FMR LLC. All rights reserved.
This report and the financial statements contained herein are submitted for the general information of the shareholders of the Fund. This report is not authorized for distribution to prospective investors in the Fund unless preceded or accompanied by an effective prospectus.
A fund files its complete schedule of portfolio holdings with the SEC for the first and third quarters of each fiscal year on Form N-PORT. Forms N-PORT are available on the SEC's web site at http://www.sec.gov. A fund's Forms N-PORT may be reviewed and copied at the SEC's Public Reference Room in Washington, DC. Information regarding the operation of the SEC's Public Reference Room may be obtained by calling 1-800-SEC-0330.
For a complete list of a fund's portfolio holdings, view the most recent holdings listing, semiannual report, or annual report on Fidelity's web site at http://www.fidelity.com, http://www.institutional.fidelity.com, or http://www.401k.com, as applicable.
NOT FDIC INSURED •MAY LOSE VALUE •NO BANK GUARANTEE
Neither the Fund nor Fidelity Distributors Corporation is a bank.
Item 7: Consolidated Financial Statements and Consolidated Financial Highlights for Open-End Management Investment Companies (Annual Report)
Consolidated Schedule of Investments December 31, 2024
Showing Percentage of Net Assets
| Common Stocks - 97.8% |
| | | Shares | Value ($) |
| AUSTRALIA - 0.1% | | | |
| Industrials - 0.0% | | | |
| Commercial Services & Supplies - 0.0% | | | |
| Clean TeQ Water Ltd (b) | | 476,541 | 95,860 |
| Information Technology - 0.1% | | | |
| Software - 0.1% | | | |
| Canva Inc Class A (c)(d) | | 21,800 | 27,905,963 |
| Materials - 0.0% | | | |
| Metals & Mining - 0.0% | | | |
| Sunrise Energy Metals Ltd (b) | | 611,319 | 88,918 |
| TOTAL AUSTRALIA | | | 28,090,741 |
| BELGIUM - 0.0% | | | |
| Health Care - 0.0% | | | |
| Pharmaceuticals - 0.0% | | | |
| UCB SA | | 126,449 | 25,174,778 |
| BRAZIL - 0.3% | | | |
| Consumer Discretionary - 0.2% | | | |
| Broadline Retail - 0.2% | | | |
| MercadoLibre Inc (b) | | 30,393 | 51,681,473 |
| Financials - 0.1% | | | |
| Banks - 0.1% | | | |
| NU Holdings Ltd/Cayman Islands Class A (b) | | 3,806,769 | 39,438,127 |
| Materials - 0.0% | | | |
| Metals & Mining - 0.0% | | | |
| Wheaton Precious Metals Corp | | 165,596 | 9,320,931 |
| TOTAL BRAZIL | | | 100,440,531 |
| CANADA - 1.9% | | | |
| Communication Services - 0.0% | | | |
| Entertainment - 0.0% | | | |
| Lionsgate Studios Corp | | 506,676 | 3,850,738 |
| Consumer Discretionary - 0.0% | | | |
| Broadline Retail - 0.0% | | | |
| Dollarama Inc | | 117,005 | 11,418,457 |
| Consumer Staples - 0.0% | | | |
| Consumer Staples Distribution & Retail - 0.0% | | | |
| Alimentation Couche-Tard Inc | | 172,138 | 9,546,656 |
| Energy - 0.3% | | | |
| Oil, Gas & Consumable Fuels - 0.3% | | | |
| ARC Resources Ltd (e) | | 161,703 | 2,932,691 |
| Cameco Corp (United States) (e) | | 304,516 | 15,649,077 |
| Canadian Natural Resources Ltd | | 2,251,593 | 69,515,948 |
| PrairieSky Royalty Ltd | | 86,319 | 1,683,204 |
| Suncor Energy Inc | | 79,147 | 2,825,164 |
| | | | 92,606,084 |
| Financials - 1.0% | | | |
| Banks - 0.3% | | | |
| Royal Bank of Canada | | 729,721 | 87,985,839 |
| Capital Markets - 0.1% | | | |
| Brookfield Asset Management Ltd Class A | | 12,593 | 682,980 |
| Brookfield Asset Management Ltd Class A (United States) | | 691,439 | 37,469,080 |
| Brookfield Corp Class A | | 102,612 | 5,897,807 |
| | | | 44,049,867 |
| Insurance - 0.6% | | | |
| Fairfax Financial Holdings Ltd Subordinate Voting Shares | | 72,220 | 100,483,495 |
| Intact Financial Corp | | 350,951 | 63,900,939 |
| | | | 164,384,434 |
TOTAL FINANCIALS | | | 296,420,140 |
| | | | |
| Industrials - 0.1% | | | |
| Commercial Services & Supplies - 0.0% | | | |
| RB Global Inc (United States) | | 121,744 | 10,982,526 |
| Ground Transportation - 0.0% | | | |
| Canadian Pacific Kansas City Ltd | | 64,684 | 4,683,509 |
| Professional Services - 0.1% | | | |
| Thomson Reuters Corp | | 161,247 | 25,892,402 |
TOTAL INDUSTRIALS | | | 41,558,437 |
| | | | |
| Information Technology - 0.3% | | | |
| Electronic Equipment, Instruments & Components - 0.0% | | | |
| Celestica Inc Subordinate Voting Shares (b) | | 169,125 | 15,608,280 |
| IT Services - 0.3% | | | |
| Shopify Inc Class A (b) | | 894,359 | 95,187,996 |
| Software - 0.0% | | | |
| Constellation Software Inc/Canada | | 1,116 | 3,450,916 |
TOTAL INFORMATION TECHNOLOGY | | | 114,247,192 |
| | | | |
| Materials - 0.2% | | | |
| Metals & Mining - 0.2% | | | |
| Agnico Eagle Mines Ltd/CA | | 133,291 | 10,428,123 |
| Alamos Gold Inc Class A | | 176,906 | 3,263,798 |
| B2Gold Corp | | 7,104,728 | 17,397,922 |
| Franco-Nevada Corp | | 261,291 | 30,705,261 |
| High Power Exploration Inc (b)(c)(d) | | 2,010,004 | 2,653,205 |
| Lundin Gold Inc | | 516,775 | 11,022,520 |
| Novagold Resources Inc (b) | | 1,155,991 | 3,868,181 |
| Orla Mining Ltd (b) | | 484,516 | 2,683,048 |
| | | | 82,022,058 |
| TOTAL CANADA | | | 651,669,762 |
| CHINA - 0.1% | | | |
| Consumer Discretionary - 0.1% | | | |
| Automobiles - 0.1% | | | |
| BYD Co Ltd H Shares | | 578,434 | 19,674,351 |
| Hotels, Restaurants & Leisure - 0.0% | | | |
| Meituan B Shares (b)(f)(g) | | 244,127 | 4,746,652 |
TOTAL CONSUMER DISCRETIONARY | | | 24,421,003 |
| | | | |
| Health Care - 0.0% | | | |
| Biotechnology - 0.0% | | | |
| Zai Lab Ltd ADR (b) | | 139,374 | 3,650,205 |
| TOTAL CHINA | | | 28,071,208 |
| CONGO DEMOCRATIC REPUBLIC OF - 0.5% | | | |
| Materials - 0.5% | | | |
| Metals & Mining - 0.5% | | | |
| Ivanhoe Mine Ltd (b)(f) | | 1,332,254 | 15,811,508 |
| Ivanhoe Mine Ltd Class A (b)(e) | | 12,803,137 | 151,950,689 |
| | | | |
| TOTAL CONGO DEMOCRATIC REPUBLIC OF | | | 167,762,197 |
| FINLAND - 0.1% | | | |
| Consumer Discretionary - 0.1% | | | |
| Textiles, Apparel & Luxury Goods - 0.1% | | | |
| Amer Sports Inc | | 958,857 | 26,809,642 |
| FRANCE - 0.1% | | | |
| Health Care - 0.1% | | | |
| Health Care Equipment & Supplies - 0.1% | | | |
| EssilorLuxottica SA | | 130,161 | 31,765,305 |
| GERMANY - 0.1% | | | |
| Consumer Discretionary - 0.1% | | | |
| Textiles, Apparel & Luxury Goods - 0.1% | | | |
| adidas AG | | 98,880 | 24,254,204 |
| Birkenstock Holding Plc (b) | | 64,257 | 3,640,802 |
| | | | |
| TOTAL GERMANY | | | 27,895,006 |
| IRELAND - 0.2% | | | |
| Financials - 0.1% | | | |
| Banks - 0.1% | | | |
| AIB Group PLC | | 1,311,607 | 7,241,488 |
| Bank of Ireland Group PLC | | 636,782 | 5,808,531 |
| | | | 13,050,019 |
| Financial Services - 0.0% | | | |
| Circle Internet Financial LLC (c) | | 175,323 | 5,310,534 |
| Circle Internet Financial LLC (c) | | 118,667 | 3,594,423 |
| | | | 8,904,957 |
| Information Technology - 0.1% | | | |
| IT Services - 0.1% | | | |
| Accenture PLC Class A | | 108,758 | 38,259,977 |
| TOTAL IRELAND | | | 60,214,953 |
| ISRAEL - 0.3% | | | |
| Health Care - 0.3% | | | |
| Pharmaceuticals - 0.3% | | | |
| Teva Pharmaceutical Industries Ltd ADR (b) | | 3,991,496 | 87,972,572 |
| Information Technology - 0.0% | | | |
| IT Services - 0.0% | | | |
| Wix.com Ltd (b) | | 26,393 | 5,662,618 |
| Software - 0.0% | | | |
| Cellebrite DI Ltd (b) | | 68,122 | 1,500,727 |
| Check Point Software Technologies Ltd (b)(e) | | 118,888 | 22,196,390 |
| | | | 23,697,117 |
TOTAL INFORMATION TECHNOLOGY | | | 29,359,735 |
| | | | |
| TOTAL ISRAEL | | | 117,332,307 |
| ITALY - 0.0% | | | |
| Industrials - 0.0% | | | |
| Passenger Airlines - 0.0% | | | |
| Ryanair Holdings PLC ADR | | 85,094 | 3,709,247 |
| JAPAN - 0.2% | | | |
| Consumer Discretionary - 0.1% | | | |
| Broadline Retail - 0.0% | | | |
| Pan Pacific International Holdings Corp | | 128,397 | 3,521,951 |
| Specialty Retail - 0.1% | | | |
| Fast Retailing Co Ltd | | 65,937 | 22,243,304 |
| Textiles, Apparel & Luxury Goods - 0.0% | | | |
| Asics Corp | | 269,837 | 5,333,459 |
TOTAL CONSUMER DISCRETIONARY | | | 31,098,714 |
| | | | |
| Industrials - 0.1% | | | |
| Industrial Conglomerates - 0.0% | | | |
| Hitachi Ltd | | 127,948 | 3,133,454 |
| Machinery - 0.1% | | | |
| Mitsubishi Heavy Industries Ltd | | 1,147,234 | 15,996,976 |
| Trading Companies & Distributors - 0.0% | | | |
| ITOCHU Corp | | 204,087 | 10,035,852 |
| Mitsui & Co Ltd | | 262,654 | 5,447,214 |
| | | | 15,483,066 |
TOTAL INDUSTRIALS | | | 34,613,496 |
| | | | |
| Information Technology - 0.0% | | | |
| Semiconductors & Semiconductor Equipment - 0.0% | | | |
| Advantest Corp | | 220,017 | 12,509,912 |
| TOTAL JAPAN | | | 78,222,122 |
| KOREA (SOUTH) - 0.3% | | | |
| Consumer Discretionary - 0.3% | | | |
| Automobiles - 0.1% | | | |
| Hyundai Motor Co | | 184,170 | 26,038,863 |
| Broadline Retail - 0.2% | | | |
| Coupang Inc Class A (b) | | 3,130,312 | 68,804,258 |
| TOTAL KOREA (SOUTH) | | | 94,843,121 |
| NETHERLANDS - 0.3% | | | |
| Communication Services - 0.1% | | | |
| Entertainment - 0.1% | | | |
| Universal Music Group NV | | 1,701,634 | 43,526,310 |
| Financials - 0.0% | | | |
| Financial Services - 0.0% | | | |
| Adyen NV (b)(f)(g) | | 2,215 | 3,291,665 |
| Health Care - 0.2% | | | |
| Biotechnology - 0.2% | | | |
| Argenx SE ADR (b) | | 78,929 | 48,541,335 |
| TOTAL NETHERLANDS | | | 95,359,310 |
| SPAIN - 0.0% | | | |
| Financials - 0.0% | | | |
| Banks - 0.0% | | | |
| Banco Santander SA | | 3,214,489 | 14,871,037 |
| SWEDEN - 0.0% | | | |
| Industrials - 0.0% | | | |
| Machinery - 0.0% | | | |
| Indutrade AB | | 114,755 | 2,873,063 |
| SWITZERLAND - 0.3% | | | |
| Consumer Discretionary - 0.2% | | | |
| Textiles, Apparel & Luxury Goods - 0.2% | | | |
| On Holding AG Class A (b) | | 1,344,060 | 73,614,166 |
| Financials - 0.1% | | | |
| Capital Markets - 0.1% | | | |
| UBS Group AG | | 1,008,240 | 30,806,562 |
| TOTAL SWITZERLAND | | | 104,420,728 |
| TAIWAN - 0.4% | | | |
| Information Technology - 0.4% | | | |
| Semiconductors & Semiconductor Equipment - 0.4% | | | |
| Taiwan Semiconductor Manufacturing Co Ltd ADR | | 704,587 | 139,148,887 |
| THAILAND - 0.0% | | | |
| Information Technology - 0.0% | | | |
| Electronic Equipment, Instruments & Components - 0.0% | | | |
| Fabrinet (b) | | 56,481 | 12,419,042 |
| UNITED KINGDOM - 0.3% | | | |
| Consumer Discretionary - 0.1% | | | |
| Hotels, Restaurants & Leisure - 0.1% | | | |
| Deliveroo PLC Class A (b)(f)(g) | | 3,384,320 | 6,012,062 |
| Flutter Entertainment PLC (United Kingdom) (b) | | 58,832 | 15,260,649 |
| | | | 21,272,711 |
| Financials - 0.1% | | | |
| Banks - 0.0% | | | |
| Starling Bank Ltd Class D (b)(c)(d) | | 4,139,223 | 13,110,189 |
| Capital Markets - 0.1% | | | |
| London Stock Exchange Group PLC | | 189,906 | 26,806,175 |
TOTAL FINANCIALS | | | 39,916,364 |
| | | | |
| Industrials - 0.1% | | | |
| Aerospace & Defense - 0.1% | | | |
| Rolls-Royce Holdings PLC (b) | | 5,356,305 | 37,983,666 |
| TOTAL UNITED KINGDOM | | | 99,172,741 |
| UNITED STATES - 92.3% | | | |
| Communication Services - 22.6% | | | |
| Entertainment - 2.9% | | | |
| Electronic Arts Inc | | 67,154 | 9,824,630 |
| Liberty Media Corp-Liberty Formula One Class C (b)(e) | | 879,159 | 81,462,873 |
| Liberty Media Corp-Liberty Live Class C (b) | | 46,891 | 3,191,401 |
| Live Nation Entertainment Inc (b) | | 79,864 | 10,342,388 |
| Netflix Inc (b) | | 937,865 | 835,937,833 |
| ROBLOX Corp Class A (b) | | 263,746 | 15,260,344 |
| Spotify Technology SA (b) | | 84,767 | 37,923,060 |
| Walt Disney Co/The | | 137,607 | 15,322,539 |
| | | | 1,009,265,068 |
| Interactive Media & Services - 19.7% | | | |
| Alphabet Inc Class A | | 4,514,139 | 854,526,513 |
| Alphabet Inc Class C | | 3,647,994 | 694,723,977 |
| Epic Games Inc (b)(c)(d) | | 14,010 | 9,505,925 |
| Meta Platforms Inc Class A | | 8,857,577 | 5,186,199,910 |
| Reddit Inc Class A | | 502,972 | 82,205,744 |
| Reddit Inc Class B (b) | | 97,531 | 15,940,466 |
| | | | 6,843,102,535 |
| Media - 0.0% | | | |
| Omnicom Group Inc (e) | | 67,476 | 5,805,635 |
| Trade Desk Inc (The) Class A (b) | | 56,183 | 6,603,188 |
| | | | 12,408,823 |
| Wireless Telecommunication Services - 0.0% | | | |
| T-Mobile US Inc | | 34,175 | 7,543,447 |
TOTAL COMMUNICATION SERVICES | | | 7,872,319,873 |
| | | | |
| Consumer Discretionary - 9.1% | | | |
| Automobiles - 0.2% | | | |
| General Motors Co | | 370,853 | 19,755,339 |
| Rad Power Bikes Inc (b)(c)(d) | | 331,574 | 69,631 |
| Rad Power Bikes Inc warrants 10/6/2033 (b)(c)(d) | | 389,358 | 202,466 |
| Tesla Inc (b) | | 155,749 | 62,897,676 |
| | | | 82,925,112 |
| Broadline Retail - 6.0% | | | |
| Amazon.com Inc (b) | | 9,556,161 | 2,096,526,162 |
| Diversified Consumer Services - 0.1% | | | |
| Duolingo Inc Class A (b) | | 172,677 | 55,987,064 |
| Hotels, Restaurants & Leisure - 1.3% | | | |
| Airbnb Inc Class A (b) | | 598,903 | 78,701,843 |
| Booking Holdings Inc | | 18,686 | 92,839,896 |
| Carnival Corp (b) | | 474,719 | 11,829,997 |
| Cava Group Inc (b) | | 238,550 | 26,908,440 |
| Chipotle Mexican Grill Inc (b) | | 1,088,188 | 65,617,736 |
| Churchill Downs Inc | | 40,203 | 5,368,709 |
| DraftKings Inc Class A (b) | | 88,466 | 3,290,935 |
| Dutch Bros Inc Class A (b) | | 101,409 | 5,311,803 |
| Hilton Worldwide Holdings Inc | | 426,873 | 105,505,932 |
| Royal Caribbean Cruises Ltd | | 30,857 | 7,118,401 |
| Starbucks Corp | | 243,413 | 22,211,436 |
| Texas Roadhouse Inc | | 22,150 | 3,996,525 |
| Viking Holdings Ltd (e) | | 483,348 | 21,296,313 |
| | | | 449,997,966 |
| Household Durables - 0.3% | | | |
| DR Horton Inc | | 17,907 | 2,503,756 |
| Garmin Ltd | | 77,183 | 15,919,766 |
| Lennar Corp Class A | | 508,245 | 69,309,371 |
| PulteGroup Inc | | 91,501 | 9,964,459 |
| | | | 97,697,352 |
| Specialty Retail - 1.0% | | | |
| Abercrombie & Fitch Co Class A (b) | | 75,567 | 11,294,999 |
| Chewy Inc Class A (b) | | 92,911 | 3,111,589 |
| Dick's Sporting Goods Inc | | 104,571 | 23,930,028 |
| Fanatics Inc Class A (b)(c)(d) | | 332,480 | 19,948,800 |
| Gap Inc/The (e) | | 588,942 | 13,916,699 |
| Group 1 Automotive Inc | | 1,581 | 666,360 |
| O'Reilly Automotive Inc (b) | | 77,906 | 92,380,935 |
| TJX Cos Inc/The | | 1,115,487 | 134,761,985 |
| Williams-Sonoma Inc | | 233,945 | 43,321,935 |
| | | | 343,333,330 |
| Textiles, Apparel & Luxury Goods - 0.2% | | | |
| Deckers Outdoor Corp (b) | | 122,731 | 24,925,439 |
| Ralph Lauren Corp Class A | | 91,685 | 21,177,401 |
| VF Corp (e) | | 462,429 | 9,923,726 |
| | | | 56,026,566 |
TOTAL CONSUMER DISCRETIONARY | | | 3,182,493,552 |
| | | | |
| Consumer Staples - 1.8% | | | |
| Beverages - 0.2% | | | |
| Coca-Cola Co/The | | 1,006,760 | 62,680,878 |
| Consumer Staples Distribution & Retail - 1.6% | | | |
| Casey's General Stores Inc | | 89,419 | 35,430,490 |
| Costco Wholesale Corp | | 515,921 | 472,722,935 |
| Walmart Inc | | 501,479 | 45,308,628 |
| | | | 553,462,053 |
| Food Products - 0.0% | | | |
| Bowery Farming Inc (b)(c) | | 57,529 | 1 |
| Bowery Farming Inc warrants (b)(c)(d) | | 20,213 | 0 |
| | | | 1 |
| Household Products - 0.0% | | | |
| Procter & Gamble Co/The | | 36,813 | 6,171,699 |
| Personal Care Products - 0.0% | | | |
| BellRing Brands Inc (b) | | 9,728 | 732,907 |
TOTAL CONSUMER STAPLES | | | 623,047,538 |
| | | | |
| Energy - 1.0% | | | |
| Energy Equipment & Services - 0.0% | | | |
| Baker Hughes Co Class A | | 124,923 | 5,124,341 |
| Oil, Gas & Consumable Fuels - 1.0% | | | |
| Cheniere Energy Inc | | 16,239 | 3,489,274 |
| Exxon Mobil Corp | | 2,538,224 | 273,036,756 |
| Hess Corp | | 147,457 | 19,613,256 |
| Marathon Petroleum Corp | | 22,340 | 3,116,430 |
| Sable Offshore Corp (d) | | 1,076,300 | 24,647,270 |
| Shell PLC ADR | | 235,491 | 14,753,511 |
| | | | 338,656,497 |
TOTAL ENERGY | | | 343,780,838 |
| | | | |
| Financials - 16.4% | | | |
| Banks - 2.7% | | | |
| Bank of America Corp | | 2,465,393 | 108,354,022 |
| Citigroup Inc | | 1,060,191 | 74,626,844 |
| East West Bancorp Inc | | 117,266 | 11,229,392 |
| First Citizens BancShares Inc/NC Class A | | 20,542 | 43,405,657 |
| JPMorgan Chase & Co | | 2,211,965 | 530,230,131 |
| Wells Fargo & Co | | 2,420,247 | 169,998,149 |
| | | | 937,844,195 |
| Capital Markets - 1.2% | | | |
| Bank of New York Mellon Corp/The | | 801,279 | 61,562,266 |
| Blackstone Inc | | 121,517 | 20,951,961 |
| Charles Schwab Corp/The | | 44,572 | 3,298,774 |
| Goldman Sachs Group Inc/The | | 118,519 | 67,866,350 |
| Interactive Brokers Group Inc Class A (e) | | 73,338 | 12,956,624 |
| KKR & Co Inc Class A | | 174,198 | 25,765,626 |
| Moody's Corp | | 87,297 | 41,323,781 |
| Morgan Stanley | | 1,281,556 | 161,117,220 |
| MSCI Inc | | 26,264 | 15,758,663 |
| Raymond James Financial Inc | | 46,209 | 7,177,644 |
| S&P Global Inc | | 6,758 | 3,365,687 |
| Tulco LLC (b)(c)(d)(h) | | 1,552 | 1,300,048 |
| | | | 422,444,644 |
| Consumer Finance - 0.8% | | | |
| American Express Co | | 664,052 | 197,083,993 |
| Capital One Financial Corp | | 297,031 | 52,966,568 |
| Discover Financial Services | | 174,871 | 30,292,903 |
| | | | 280,343,464 |
| Financial Services - 10.1% | | | |
| Apollo Global Management Inc | | 20,821 | 3,438,796 |
| Berkshire Hathaway Inc Class A (b) | | 3,938 | 2,681,462,961 |
| Block Inc Class A (b) | | 37,060 | 3,149,729 |
| Fiserv Inc (b) | | 99,397 | 20,418,132 |
| Mastercard Inc Class A | | 262,546 | 138,248,847 |
| Paymentus Holdings Inc Class A (b) | | 36,562 | 1,194,481 |
| PayPal Holdings Inc (b) | | 594,620 | 50,750,817 |
| Shift4 Payments Inc Class A (b)(e) | | 174,813 | 18,142,093 |
| Toast Inc Class A (b) | | 239,454 | 8,728,098 |
| Visa Inc Class A | | 1,833,223 | 579,371,797 |
| | | | 3,504,905,751 |
| Insurance - 1.6% | | | |
| American International Group Inc | | 751,714 | 54,724,779 |
| Aon PLC | | 18,601 | 6,680,735 |
| Arthur J Gallagher & Co | | 162,674 | 46,175,015 |
| Chubb Ltd | | 463,674 | 128,113,126 |
| Marsh & McLennan Cos Inc | | 312,731 | 66,427,192 |
| Progressive Corp/The | | 748,917 | 179,448,003 |
| The Travelers Companies, Inc. | | 333,017 | 80,220,465 |
| Willis Towers Watson PLC | | 10,959 | 3,432,797 |
| | | | 565,222,112 |
TOTAL FINANCIALS | | | 5,710,760,166 |
| | | | |
| Health Care - 8.6% | | | |
| Biotechnology - 2.3% | | | |
| Alnylam Pharmaceuticals Inc (b) | | 130,368 | 30,676,894 |
| Apogee Therapeutics Inc (b) | | 59,026 | 2,673,878 |
| Arcellx Inc (b) | | 80,192 | 6,149,924 |
| Avidity Biosciences Inc (b) | | 180,021 | 5,235,011 |
| Crinetics Pharmaceuticals Inc (b) | | 59,363 | 3,035,230 |
| Denali Therapeutics Inc (b) | | 272,851 | 5,560,703 |
| Exelixis Inc (b) | | 68,632 | 2,285,446 |
| Gilead Sciences Inc | | 114,808 | 10,604,815 |
| Insmed Inc (b) | | 60,458 | 4,174,020 |
| Janux Therapeutics Inc (b) | | 104,754 | 5,608,529 |
| Moderna Inc (b) | | 87,153 | 3,623,822 |
| Natera Inc (b) | | 23,412 | 3,706,120 |
| Recursion Pharmaceuticals Inc Class A (b)(e) | | 291,853 | 1,972,926 |
| Regeneron Pharmaceuticals Inc (b) | | 528,034 | 376,134,460 |
| United Therapeutics Corp (b) | | 69,408 | 24,489,919 |
| Vertex Pharmaceuticals Inc (b) | | 784,046 | 315,735,324 |
| Viking Therapeutics Inc (b) | | 49,235 | 1,981,216 |
| | | | 803,648,237 |
| Health Care Equipment & Supplies - 1.6% | | | |
| Alcon AG (United States) | | 302,416 | 25,672,094 |
| Boston Scientific Corp (b) | | 1,951,038 | 174,266,714 |
| Cooper Cos Inc/The (b) | | 46,898 | 4,311,333 |
| Glaukos Corp (b) | | 22,089 | 3,312,025 |
| Globus Medical Inc Class A (b)(e) | | 44,177 | 3,653,880 |
| Insulet Corp (b) | | 13,313 | 3,475,625 |
| Intuitive Surgical Inc (b) | | 455,054 | 237,519,986 |
| PROCEPT BioRobotics Corp (b) | | 29,645 | 2,387,015 |
| Stryker Corp | | 246,374 | 88,706,959 |
| | | | 543,305,631 |
| Health Care Providers & Services - 1.5% | | | |
| BrightSpring Health Services Inc (b) | | 116,607 | 1,985,817 |
| HCA Healthcare Inc | | 89,673 | 26,915,351 |
| Tenet Healthcare Corp (b) | | 410,088 | 51,765,408 |
| UnitedHealth Group Inc | | 886,550 | 448,470,183 |
| | | | 529,136,759 |
| Health Care Technology - 0.0% | | | |
| Doximity Inc Class A (b) | | 190,498 | 10,170,688 |
| Veeva Systems Inc Class A (b) | | 11,758 | 2,472,119 |
| | | | 12,642,807 |
| Life Sciences Tools & Services - 0.0% | | | |
| Veterinary Emergency Group (b)(c)(d)(h) | | 248,592 | 15,793,050 |
| Pharmaceuticals - 3.2% | | | |
| Eli Lilly & Co | | 1,206,908 | 931,732,976 |
| Intra-Cellular Therapies Inc (b) | | 312,976 | 26,139,756 |
| Merck & Co Inc | | 1,250,261 | 124,375,964 |
| | | | 1,082,248,696 |
TOTAL HEALTH CARE | | | 2,986,775,180 |
| | | | |
| Industrials - 6.3% | | | |
| Aerospace & Defense - 1.9% | | | |
| Axon Enterprise Inc (b) | | 113,954 | 67,725,141 |
| Boeing Co (b) | | 57,166 | 10,118,382 |
| GE Aerospace | | 1,832,202 | 305,592,972 |
| HEICO Corp | | 5,890 | 1,400,289 |
| Howmet Aerospace Inc | | 479,218 | 52,412,073 |
| Leonardo DRS Inc (b) | | 215,208 | 6,953,370 |
| Loar Holdings Inc (e) | | 41,790 | 3,088,699 |
| Relativity Space Inc warrants (b)(c)(d) | | 24,482 | 6,365 |
| Rocket Lab USA Inc Class A (b) | | 485 | 12,353 |
| Space Exploration Technologies Corp (b)(c)(d) | | 505,154 | 93,453,490 |
| Space Exploration Technologies Corp Class C (b)(c)(d) | | 149,787 | 27,710,595 |
| TransDigm Group Inc | | 57,549 | 72,930,697 |
| | | | 641,404,426 |
| Air Freight & Logistics - 0.0% | | | |
| Zipline International Inc (b)(c)(d) | | 87,466 | 3,669,199 |
| Building Products - 0.4% | | | |
| AZEK Co Inc/The Class A (b) | | 67,047 | 3,182,721 |
| Carrier Global Corp | | 381,532 | 26,043,374 |
| Trane Technologies PLC | | 333,301 | 123,104,725 |
| | | | 152,330,820 |
| Commercial Services & Supplies - 0.5% | | | |
| Cintas Corp | | 290,408 | 53,057,542 |
| Clean Harbors Inc (b) | | 155,279 | 35,735,909 |
| GFL Environmental Inc Subordinate Voting Shares | | 1,198,223 | 53,415,513 |
| Republic Services Inc | | 116,280 | 23,393,210 |
| Veralto Corp | | 175,983 | 17,923,869 |
| | | | 183,526,043 |
| Construction & Engineering - 0.0% | | | |
| Comfort Systems USA Inc | | 15,164 | 6,430,446 |
| EMCOR Group Inc | | 3,441 | 1,561,870 |
| | | | 7,992,316 |
| Electrical Equipment - 1.6% | | | |
| Eaton Corp PLC | | 531,616 | 176,427,402 |
| GE Vernova Inc | | 774,796 | 254,853,648 |
| Generac Holdings Inc (b) | | 70,418 | 10,918,311 |
| Hubbell Inc | | 182,816 | 76,579,794 |
| Vertiv Holdings Co Class A | | 177,519 | 20,167,934 |
| | | | 538,947,089 |
| Ground Transportation - 0.0% | | | |
| Uber Technologies Inc (b) | | 197,303 | 11,901,317 |
| XPO Inc (b) | | 16,223 | 2,127,646 |
| | | | 14,028,963 |
| Industrial Conglomerates - 0.2% | | | |
| 3M Co | | 563,164 | 72,698,841 |
| Machinery - 0.8% | | | |
| Caterpillar Inc | | 206,968 | 75,079,712 |
| Deere & Co | | 38,783 | 16,432,357 |
| Ingersoll Rand Inc | | 80,822 | 7,311,157 |
| PACCAR Inc | | 705,579 | 73,394,328 |
| Parker-Hannifin Corp | | 98,720 | 62,788,882 |
| Westinghouse Air Brake Technologies Corp | | 74,224 | 14,072,128 |
| | | | 249,078,564 |
| Passenger Airlines - 0.0% | | | |
| Alaska Air Group Inc (b) | | 97,133 | 6,289,362 |
| Professional Services - 0.3% | | | |
| Dayforce Inc (b)(e) | | 215,741 | 15,671,426 |
| Leidos Holdings Inc | | 14,273 | 2,056,168 |
| Paycom Software Inc | | 94,207 | 19,309,609 |
| UL Solutions Inc Class A | | 150,005 | 7,482,249 |
| Verisk Analytics Inc | | 193,092 | 53,183,330 |
| | | | 97,702,782 |
| Trading Companies & Distributors - 0.6% | | | |
| FTAI Aviation Ltd | | 123,287 | 17,758,259 |
| United Rentals Inc | | 61,490 | 43,316,016 |
| WW Grainger Inc | | 141,326 | 148,964,670 |
| | | | 210,038,945 |
TOTAL INDUSTRIALS | | | 2,177,707,350 |
| | | | |
| Information Technology - 25.2% | | | |
| Communications Equipment - 0.9% | | | |
| Arista Networks Inc | | 2,552,545 | 282,132,799 |
| Motorola Solutions Inc | | 57,654 | 26,649,408 |
| | | | 308,782,207 |
| Electronic Equipment, Instruments & Components - 1.9% | | | |
| Amphenol Corp Class A | | 9,399,081 | 652,766,176 |
| Coherent Corp (b) | | 48,121 | 4,558,502 |
| Sanmina Corp (b) | | 10,608 | 802,707 |
| Zebra Technologies Corp Class A (b) | | 9,001 | 3,476,366 |
| | | | 661,603,751 |
| IT Services - 0.2% | | | |
| Cloudflare Inc Class A (b) | | 228,983 | 24,656,890 |
| Gartner Inc (b) | | 35,478 | 17,188,027 |
| GoDaddy Inc Class A (b) | | 57,519 | 11,352,525 |
| Kyndryl Holdings Inc (b) | | 239,977 | 8,303,204 |
| Twilio Inc Class A (b) | | 81,353 | 8,792,632 |
| X Holdings Corp Class A (b)(c)(d) | | 102,340 | 3,124,440 |
| | | | 73,417,718 |
| Semiconductors & Semiconductor Equipment - 11.2% | | | |
| Advanced Micro Devices Inc (b) | | 318,238 | 38,439,968 |
| Analog Devices Inc | | 130,972 | 27,826,311 |
| Applied Materials Inc | | 112,647 | 18,319,782 |
| ARM Holdings PLC ADR (b)(e) | | 164,420 | 20,282,851 |
| Astera Labs Inc (b) | | 172,211 | 22,809,347 |
| Broadcom Inc | | 1,720,831 | 398,957,459 |
| Marvell Technology Inc | | 194,950 | 21,532,228 |
| Monolithic Power Systems Inc | | 7,787 | 4,607,568 |
| NVIDIA Corp | | 24,721,610 | 3,319,865,007 |
| | | | 3,872,640,521 |
| Software - 7.5% | | | |
| Alkami Technology Inc (b) | | 12,135 | 445,112 |
| Appfolio Inc Class A (b) | | 9,652 | 2,381,341 |
| Applied Intuition Inc Class A (c)(d) | | 34,979 | 2,168,698 |
| AppLovin Corp Class A (b) | | 10,660 | 3,452,028 |
| Atlassian Corp Class A (b) | | 9,946 | 2,420,657 |
| Cadence Design Systems Inc (b) | | 198,024 | 59,498,291 |
| Clear Secure Inc Class A (e) | | 308,209 | 8,210,688 |
| Coreweave Inc Class A (c)(d) | | 27,074 | 25,445,499 |
| CyberArk Software Ltd (b) | | 112,314 | 37,417,409 |
| Datadog Inc Class A (b) | | 156,434 | 22,352,854 |
| DocuSign Inc (b) | | 261,106 | 23,483,874 |
| Dynatrace Inc (b) | | 35,865 | 1,949,263 |
| Fair Isaac Corp (b) | | 460 | 915,828 |
| Figma Inc Class A (c)(d) | | 264,700 | 7,419,541 |
| Fortinet Inc (b) | | 578,491 | 54,655,830 |
| Gusto Inc (b)(c)(d) | | 50,300 | 1,983,329 |
| HubSpot Inc (b) | | 4,782 | 3,331,954 |
| Klaviyo Inc Class A (b) | | 139,888 | 5,768,981 |
| Microsoft Corp | | 4,643,520 | 1,957,243,681 |
| Monday.com Ltd (b) | | 32,160 | 7,571,750 |
| Onestream Inc Class A | | 100,756 | 2,873,561 |
| OpenAI Global LLC rights (b)(c)(d) | | 17,923,644 | 17,923,644 |
| Oracle Corp | | 15,742 | 2,623,247 |
| Palo Alto Networks Inc (b) | | 72,925 | 13,269,433 |
| Rubrik Inc Class A (b)(e) | | 94,718 | 6,190,768 |
| Salesforce Inc | | 406,773 | 135,996,417 |
| Samsara Inc Class A (b)(e) | | 624,813 | 27,298,080 |
| Servicenow Inc (b) | | 142,700 | 151,279,124 |
| ServiceTitan Inc Class A (b)(e) | | 16,139 | 1,660,219 |
| Stripe Inc Class B (b)(c)(d) | | 75,100 | 2,066,001 |
| Tanium Inc Class B (b)(c)(d) | | 449,538 | 4,131,254 |
| Zoom Communications Inc Class A (b) | | 272,415 | 22,231,788 |
| | | | 2,615,660,144 |
| Technology Hardware, Storage & Peripherals - 3.5% | | | |
| Apple Inc | | 4,858,968 | 1,216,782,767 |
| Dell Technologies Inc Class C | | 46,997 | 5,415,934 |
| | | | 1,222,198,701 |
TOTAL INFORMATION TECHNOLOGY | | | 8,754,303,042 |
| | | | |
| Materials - 0.4% | | | |
| Chemicals - 0.1% | | | |
| Air Products and Chemicals Inc | | 10,928 | 3,169,557 |
| Sherwin-Williams Co/The | | 96,970 | 32,963,012 |
| | | | 36,132,569 |
| Construction Materials - 0.0% | | | |
| CRH PLC | | 242,062 | 22,395,576 |
| Containers & Packaging - 0.1% | | | |
| International Paper Co | | 417,490 | 22,469,312 |
| Silgan Holdings Inc | | 20,146 | 1,048,599 |
| | | | 23,517,911 |
| Metals & Mining - 0.2% | | | |
| ATI Inc (b) | | 74,521 | 4,101,636 |
| Freeport-McMoRan Inc | | 1,338,050 | 50,952,944 |
| Ivanhoe Electric Inc / US (b) | | 958,362 | 7,235,633 |
| Steel Dynamics Inc | | 96,151 | 10,967,945 |
| | | | 73,258,158 |
TOTAL MATERIALS | | | 155,304,214 |
| | | | |
| Real Estate - 0.1% | | | |
| Health Care REITs - 0.1% | | | |
| Welltower Inc | | 182,241 | 22,967,833 |
| Real Estate Management & Development - 0.0% | | | |
| CBRE Group Inc Class A (b) | | 56,787 | 7,455,565 |
TOTAL REAL ESTATE | | | 30,423,398 |
| | | | |
| Utilities - 0.8% | | | |
| Electric Utilities - 0.6% | | | |
| American Electric Power Co Inc | | 33,595 | 3,098,467 |
| Constellation Energy Corp | | 685,323 | 153,313,608 |
| NRG Energy Inc | | 233,326 | 21,050,672 |
| PG&E Corp | | 505,375 | 10,198,468 |
| Southern Co/The | | 49,407 | 4,067,184 |
| | | | 191,728,399 |
| Independent Power and Renewable Electricity Producers - 0.2% | | | |
| Vistra Corp | | 511,425 | 70,510,164 |
TOTAL UTILITIES | | | 262,238,563 |
| | | | |
| TOTAL UNITED STATES | | | 32,099,153,714 |
| TOTAL COMMON STOCKS (Cost $16,117,299,049) | | | 34,009,419,442 |
| | | | |
| Convertible Preferred Stocks - 1.1% |
| | | Shares | Value ($) |
| AUSTRALIA - 0.0% | | | |
| Information Technology - 0.0% | | | |
| Software - 0.0% | | | |
| Canva Inc Series A (b)(c)(d) | | 3,132 | 4,009,242 |
| Canva Inc Series A2 (b)(c)(d) | | 568 | 727,091 |
| | | | |
| TOTAL AUSTRALIA | | | 4,736,333 |
| CANADA - 0.0% | | | |
| Materials - 0.0% | | | |
| Metals & Mining - 0.0% | | | |
| High Power Exploration Inc Series A (b)(c)(d) | | 1,289,012 | 2,822,936 |
| CHINA - 0.1% | | | |
| Communication Services - 0.1% | | | |
| Interactive Media & Services - 0.1% | | | |
| ByteDance Ltd Series E1 (b)(c)(d) | | 80,736 | 19,995,078 |
| UNITED STATES - 1.0% | | | |
| Consumer Discretionary - 0.0% | | | |
| Automobiles - 0.0% | | | |
| Rad Power Bikes Inc Series A (b)(c)(d) | | 43,228 | 9,078 |
| Rad Power Bikes Inc Series C (b)(c)(d) | | 170,098 | 96,956 |
| Rad Power Bikes Inc Series D (b)(c)(d) | | 404,900 | 384,655 |
| | | | 490,689 |
| Hotels, Restaurants & Leisure - 0.0% | | | |
| Discord Inc Series I (b)(c)(d) | | 2,700 | 666,954 |
| Consumer Staples - 0.0% | | | |
| Consumer Staples Distribution & Retail - 0.0% | | | |
| GoBrands Inc Series G (b)(c)(d) | | 8,352 | 281,212 |
| GoBrands Inc Series H (b)(c)(d) | | 11,788 | 508,770 |
| | | | 789,982 |
| Financials - 0.0% | | | |
| Financial Services - 0.0% | | | |
| Acrisure Holdings Inc Series B1 (b)(c)(d) | | 57,282 | 1,650,294 |
| Tenstorrent Holdings Inc Series C1 (b)(c)(d) | | 63,948 | 4,743,663 |
| | | | 6,393,957 |
| Health Care - 0.0% | | | |
| Biotechnology - 0.0% | | | |
| ElevateBio LLC Series C (b)(c)(d) | | 486,500 | 1,410,850 |
| Health Care Providers & Services - 0.0% | | | |
| Lyra Health Inc Series E (b)(c)(d) | | 190,800 | 1,890,828 |
| Lyra Health Inc Series F (b)(c)(d) | | 11,519 | 114,153 |
| Somatus Inc Series E (b)(c)(d) | | 2,766 | 3,059,943 |
| | | | 5,064,924 |
TOTAL HEALTH CARE | | | 6,475,774 |
| | | | |
| Industrials - 0.9% | | | |
| Aerospace & Defense - 0.8% | | | |
| Relativity Space Inc Series D (b)(c)(d) | | 207,384 | 134,799 |
| Relativity Space Inc Series E (b)(c)(d) | | 143,887 | 135,254 |
| Relativity Space Inc Series F (b)(c)(d) | | 244,823 | 230,134 |
| Space Exploration Technologies Corp Series G (b)(c)(d) | | 11,832 | 21,889,200 |
| Space Exploration Technologies Corp Series J (b)(c)(d) | | 79,868 | 147,755,800 |
| Space Exploration Technologies Corp Series N (b)(c)(d) | | 49,490 | 91,556,500 |
| | | | 261,701,687 |
| Air Freight & Logistics - 0.1% | | | |
| Zipline International Inc Series E (b)(c)(d) | | 178,019 | 7,467,897 |
| Zipline International Inc Series F (b)(c)(d) | | 286,824 | 12,032,267 |
| Zipline International Inc Series G (c)(d) | | 190,338 | 7,984,679 |
| | | | 27,484,843 |
| Construction & Engineering - 0.0% | | | |
| Beta Technologies Inc Series B, 6% (b)(c)(d) | | 47,990 | 6,457,534 |
| Beta Technologies Inc Series C, 6% (c)(d) | | 50,200 | 5,802,116 |
| | | | 12,259,650 |
TOTAL INDUSTRIALS | | | 301,446,180 |
| | | | |
| Information Technology - 0.1% | | | |
| Software - 0.1% | | | |
| Applied Intuition Inc Series A2 (c)(d) | | 45,533 | 2,823,046 |
| Applied Intuition Inc Series B2 (c)(d) | | 21,955 | 1,361,210 |
| Asapp Inc Series C (b)(c)(d) | | 204,122 | 428,656 |
| Carbon Inc Series D (b)(c)(d) | | 9,678 | 65,036 |
| Carbon Inc Series E (b)(c)(d) | | 7,351 | 59,102 |
| Gusto Inc Series D (b)(c)(d) | | 184,203 | 7,263,124 |
| Gusto Inc Series E (b)(c)(d) | | 28,063 | 1,106,524 |
| MOLOCO Inc Series A (b)(c)(d) | | 95,881 | 6,261,029 |
| Nuro Inc/CA Series C (b)(c)(d) | | 405,967 | 1,331,572 |
| Nuro Inc/CA Series D (b)(c)(d) | | 114,603 | 475,602 |
| Stripe Inc Series H (b)(c)(d) | | 29,000 | 797,790 |
| Stripe Inc Series I (b)(c)(d) | | 321,951 | 8,856,873 |
| xAI Corp Series C (c)(d) | | 820,996 | 17,774,564 |
| | | | 48,604,128 |
| TOTAL UNITED STATES | | | 364,867,664 |
| TOTAL CONVERTIBLE PREFERRED STOCKS (Cost $226,386,039) | | | 392,422,011 |
| | | | |
| Preferred Securities - 0.0% |
| | | Principal Amount (a) | Value ($) |
| UNITED STATES - 0.0% | | | |
| Consumer Discretionary - 0.0% | | | |
| Automobiles - 0.0% | | | |
Rad Power Bikes Inc 8% 12/31/2025 (c)(d) (Cost $389,358) | | 389,358 | 508,072 |
| | | | |
| Money Market Funds - 2.1% |
| | | Yield (%) | Shares | Value ($) |
| Fidelity Cash Central Fund (i) | | 4.36 | 589,573,854 | 589,691,769 |
| Fidelity Securities Lending Cash Central Fund (i)(j) | | 4.35 | 151,584,905 | 151,600,063 |
| TOTAL MONEY MARKET FUNDS (Cost $741,290,839) | | | | 741,291,832 |
| | | | | |
| TOTAL INVESTMENT IN SECURITIES - 101.0% (Cost $17,085,365,285) | 35,143,641,357 |
NET OTHER ASSETS (LIABILITIES) - (1.0)% | (360,845,816) |
| NET ASSETS - 100.0% | 34,782,795,541 |
| | |
Legend
| (a) | Amount is stated in United States dollars unless otherwise noted. |
| (d) | Restricted securities (including private placements) - Investment in securities not registered under the Securities Act of 1933 (excluding 144A issues). At the end of the period, the value of restricted securities (excluding 144A issues) amounted to $697,168,685 or 2.0% of net assets. |
| (e) | Security or a portion of the security is on loan at period end. |
| (f) | Security exempt from registration under Rule 144A of the Securities Act of 1933. These securities may be resold in transactions exempt from registration, normally to qualified institutional buyers. At the end of the period, the value of these securities amounted to $29,861,887 or 0.1% of net assets. |
| (g) | Security is exempt from registration under Regulation S of the Securities Act of 1933 and may be resold to qualified foreign investors outside of the United States. At the end of the period, the value of securities amounted to $14,050,379 or 0.0% of net assets. |
| (h) | Investment is owned by a wholly-owned subsidiary (Subsidiary) that is treated as a corporation for U.S. tax purposes. |
| (i) | Affiliated fund that is generally available only to investment companies and other accounts managed by Fidelity Investments. The rate quoted is the annualized seven-day yield of the fund at period end. A complete unaudited listing of the fund's holdings as of its most recent quarter end is available upon request. In addition, each Fidelity Central Fund's financial statements, which are not covered by the Fund's Report of Independent Registered Public Accounting Firm, are available on the SEC's website or upon request. |
| (j) | Investment made with cash collateral received from securities on loan. |
| Additional information on each restricted holding is as follows: |
| Security | Acquisition Date | Acquisition Cost ($) |
| Acrisure Holdings Inc Series B1 | 3/22/21 | 1,043,678 |
| | | |
| Applied Intuition Inc Class A | 7/02/24 | 2,088,068 |
| | | |
| Applied Intuition Inc Series A2 | 7/02/24 | 2,718,088 |
| | | |
| Applied Intuition Inc Series B2 | 7/02/24 | 1,310,602 |
| | | |
| Asapp Inc Series C | 4/30/21 | 1,346,613 |
| | | |
| Beta Technologies Inc Series B, 6% | 4/04/22 | 4,951,128 |
| | | |
| Beta Technologies Inc Series C, 6% | 10/24/24 | 5,746,394 |
| | | |
| Bowery Farming Inc warrants | 10/25/23 | 0 |
| | | |
| ByteDance Ltd Series E1 | 11/18/20 | 8,846,581 |
| | | |
| Canva Inc Class A | 3/18/24 | 23,253,212 |
| | | |
| Canva Inc Series A | 9/22/23 | 3,340,783 |
| | | |
| Canva Inc Series A2 | 9/22/23 | 605,864 |
| | | |
| Carbon Inc Series D | 12/15/17 | 225,990 |
| | | |
| Carbon Inc Series E | 3/22/19 | 205,787 |
| | | |
| Coreweave Inc Class A | 11/29/23 - 10/03/24 | 10,716,344 |
| | | |
| Discord Inc Series I | 9/15/21 | 1,486,686 |
| | | |
| ElevateBio LLC Series C | 3/09/21 | 2,040,868 |
| | | |
| Epic Games Inc | 7/13/20 - 7/30/20 | 8,055,750 |
| | | |
| Fanatics Inc Class A | 8/13/20 - 12/15/21 | 12,844,485 |
| | | |
| Figma Inc Class A | 5/15/24 | 6,139,187 |
| | | |
| GoBrands Inc Series G | 3/02/21 | 2,085,639 |
| | | |
| GoBrands Inc Series H | 7/22/21 | 4,579,527 |
| | | |
| Gusto Inc | 10/01/21 | 1,448,054 |
| | | |
| Gusto Inc Series D | 7/16/19 | 2,452,184 |
| | | |
| Gusto Inc Series E | 7/13/21 | 852,984 |
| | | |
| High Power Exploration Inc | 6/03/24 | 2,653,205 |
| | | |
| High Power Exploration Inc Series A | 11/15/19 - 3/04/21 | 6,793,093 |
| | | |
| Lyra Health Inc Series E | 1/14/21 | 1,747,079 |
| | | |
| Lyra Health Inc Series F | 6/04/21 | 180,899 |
| | | |
| MOLOCO Inc Series A | 6/26/23 | 5,752,860 |
| | | |
| Nuro Inc/CA Series C | 10/30/20 | 5,299,737 |
| | | |
| Nuro Inc/CA Series D | 10/29/21 | 2,388,982 |
| | | |
| OpenAI Global LLC rights | 9/30/24 | 17,923,644 |
| | | |
| Rad Power Bikes Inc | 1/21/21 | 1,599,460 |
| | | |
| Rad Power Bikes Inc 8% 12/31/2025 | 10/06/23 | 389,358 |
| | | |
| Rad Power Bikes Inc Series A | 1/21/21 | 208,525 |
| | | |
| Rad Power Bikes Inc Series C | 1/21/21 | 820,526 |
| | | |
| Rad Power Bikes Inc Series D | 9/17/21 | 3,880,481 |
| | | |
| Rad Power Bikes Inc warrants 10/6/2033 | 10/06/23 | 0 |
| | | |
| Relativity Space Inc Series D | 11/20/20 | 3,095,642 |
| | | |
| Relativity Space Inc Series E | 5/27/21 | 3,285,674 |
| | | |
| Relativity Space Inc Series F | 11/14/23 | 5,549,403 |
| | | |
| Relativity Space Inc warrants | 11/14/23 | 0 |
| | | |
| Sable Offshore Corp | 1/16/24 | 10,763,000 |
| | | |
| Somatus Inc Series E | 1/31/22 | 2,413,708 |
| | | |
| Space Exploration Technologies Corp | 2/16/21 - 7/01/24 | 45,025,815 |
| | | |
| Space Exploration Technologies Corp Class C | 4/02/24 - 7/01/24 | 14,860,344 |
| | | |
| Space Exploration Technologies Corp Series G | 9/07/23 | 9,583,920 |
| | | |
| Space Exploration Technologies Corp Series J | 9/07/23 | 64,693,080 |
| | | |
| Space Exploration Technologies Corp Series N | 8/04/20 | 13,362,300 |
| | | |
| Starling Bank Ltd Class D | 6/18/21 - 4/05/22 | 8,226,276 |
| | | |
| Stripe Inc Class B | 5/18/21 | 3,013,641 |
| | | |
| Stripe Inc Series H | 3/15/21 | 1,163,625 |
| | | |
| Stripe Inc Series I | 3/20/23 - 5/12/23 | 6,482,207 |
| | | |
| Tanium Inc Class B | 9/18/20 | 5,122,575 |
| | | |
| Tenstorrent Holdings Inc Series C1 | 4/23/21 | 3,801,992 |
| | | |
| Tulco LLC | 8/24/17 - 9/07/18 | 651,224 |
| | | |
| Veterinary Emergency Group | 9/16/21 - 10/02/24 | 11,147,486 |
| | | |
| X Holdings Corp Class A | 10/25/22 | 10,234,000 |
| | | |
| xAI Corp Series C | 11/22/24 | 17,774,563 |
| | | |
| Zipline International Inc | 10/12/21 | 3,148,776 |
| | | |
| Zipline International Inc Series E | 12/21/20 | 5,808,653 |
| | | |
| Zipline International Inc Series F | 4/11/23 | 11,529,493 |
| | | |
| Zipline International Inc Series G | 6/07/24 | 7,983,975 |
| | | |
Affiliated Central Funds
Fiscal year to date information regarding the Fund's investments in Fidelity Central Funds, including the ownership percentage, is presented below.
| Affiliate | Value, beginning of period ($) | Purchases ($) | Sales Proceeds ($) | Dividend Income ($) | Realized Gain (loss) ($) | Change in Unrealized appreciation (depreciation) ($) | Value, end of period ($) | Shares, end of period | % ownership, end of period |
| Fidelity Cash Central Fund | 1,100,128,067 | 3,514,630,412 | 4,025,060,973 | 35,933,158 | (5,737) | - | 589,691,769 | 589,573,854 | 1.2% |
| Fidelity Securities Lending Cash Central Fund | 251,076,876 | 1,696,613,796 | 1,796,090,609 | 426,824 | - | - | 151,600,063 | 151,584,905 | 0.6% |
| Total | 1,351,204,943 | 5,211,244,208 | 5,821,151,582 | 36,359,982 | (5,737) | - | 741,291,832 | 741,158,759 | |
| | | | | | | | | | |
Amounts in the dividend income column in the above table include any capital gain distributions from underlying funds, which are presented in the corresponding line item in the Consolidated Statement of Operations, if applicable.
Amounts in the dividend income column for Fidelity Securities Lending Cash Central Fund represents the income earned on investing cash collateral, less rebates paid to borrowers and any lending agent fees associated with the loan, plus any premium payments received for lending certain types of securities.
Amounts included in the purchases and sales proceeds columns may include in-kind transactions, if applicable.
Investment Valuation
The following is a summary of the inputs used, as of December 31, 2024, involving the Fund's assets and liabilities carried at fair value. The inputs or methodology used for valuing securities may not be an indication of the risk associated with investing in those securities. For more information on valuation inputs, and their aggregation into the levels used below, please refer to the Investment Valuation section in the accompanying Notes to Consolidated Financial Statements.
| Valuation Inputs at Reporting Date: |
| Description | Total ($) | Level 1 ($) | Level 2 ($) | Level 3 ($) |
Investments in Securities: | | | | |
|
| Common Stocks | | | | |
Communication Services | 7,919,696,921 | 7,866,664,686 | 43,526,310 | 9,505,925 |
Consumer Discretionary | 3,545,547,845 | 3,452,623,778 | 72,703,170 | 20,220,897 |
Consumer Staples | 632,594,194 | 632,594,193 | - | 1 |
Energy | 436,386,922 | 436,386,922 | - | - |
Financials | 6,157,459,037 | 6,089,174,966 | 44,968,877 | 23,315,194 |
Health Care | 3,183,879,375 | 3,168,086,325 | - | 15,793,050 |
Industrials | 2,298,541,119 | 2,101,104,308 | 72,597,162 | 124,839,649 |
Information Technology | 9,128,153,750 | 9,023,475,469 | 12,509,912 | 92,168,369 |
Materials | 414,498,318 | 411,845,113 | - | 2,653,205 |
Real Estate | 30,423,398 | 30,423,398 | - | - |
Utilities | 262,238,563 | 262,238,563 | - | - |
|
| Convertible Preferred Stocks | | | | |
Communication Services | 19,995,078 | - | - | 19,995,078 |
Consumer Discretionary | 1,157,643 | - | - | 1,157,643 |
Consumer Staples | 789,982 | - | - | 789,982 |
Financials | 6,393,957 | - | - | 6,393,957 |
Health Care | 6,475,774 | - | - | 6,475,774 |
Industrials | 301,446,180 | - | - | 301,446,180 |
Information Technology | 53,340,461 | - | - | 53,340,461 |
Materials | 2,822,936 | - | - | 2,822,936 |
|
| Preferred Securities | | | | |
Consumer Discretionary | 508,072 | - | - | 508,072 |
|
| Money Market Funds | 741,291,832 | 741,291,832 | - | - |
| Total Investments in Securities: | 35,143,641,357 | 34,215,909,553 | 246,305,431 | 681,426,373 |
The following is a reconciliation of consolidated Investments in Securities for which Level 3 inputs were used in determining value. Beginning balances have been updated to conform to current period presentation, as applicable.
| |
| Investments in Securities: | |
| Beginning Balance | $ | 348,573,502 | |
| Net Realized Gain (Loss) on Investment Securities | | - | |
| Net Unrealized Gain (Loss) on Investment Securities | | 187,900,870 | |
| Cost of Purchases | | 150,834,377 | |
| Proceeds of Sales | | - | |
| Amortization/Accretion | | - | |
| Transfers into Level 3 | | - | |
| Transfers out of Level 3 | | (5,882,376) | |
| Ending Balance | $ | 681,426,373 | |
| The change in unrealized gain (loss) for the period attributable to Level 3 securities held at December 31, 2024 | $ | 188,305,640 | |
| The information used in the above reconciliation represents fiscal year to date activity for any Investments in Securities identified as using Level 3 inputs at either the beginning or the end of the current fiscal period. Cost of purchases and proceeds of sales may include securities received and/or delivered through in-kind transactions, corporate actions or exchanges. Transfers into Level 3 were attributable to a lack of observable market data resulting from decreases in market activity, decreases in liquidity, security restructurings or corporate actions. Transfers out of Level 3 were attributable to observable market data becoming available for those securities. Transfers in or out of Level 3 represent the beginning value of any Security or Instrument where a change in the pricing level occurred from the beginning to the end of the period. Realized and unrealized gains (losses) disclosed in the reconciliation are included in Net Gain (Loss) on the Fund's consolidated Statement of Operations. | |
Consolidated Financial Statements
| Consolidated Statement of Assets and Liabilities |
As of December 31, 2024 |
| Assets | | | | |
| Investment in securities, at value (including securities loaned of $145,881,647) - See accompanying schedule: | | | | |
Unaffiliated issuers (cost $16,344,074,446) | $ | 34,402,349,525 | | |
Fidelity Central Funds (cost $741,290,839) | | 741,291,832 | | |
| | | | | |
| | | | | |
| Total Investment in Securities (cost $17,085,365,285) | | | $ | 35,143,641,357 |
| Foreign currency held at value (cost $260,388) | | | | 260,384 |
| Receivable for investments sold | | | | 3,670,773 |
| Receivable for fund shares sold | | | | 26,063,736 |
| Dividends receivable | | | | 8,941,654 |
| Distributions receivable from Fidelity Central Funds | | | | 1,774,258 |
| Other receivables | | | | 49 |
Total assets | | | | 35,184,352,211 |
| Liabilities | | | | |
| Payable to custodian bank | $ | 92 | | |
| Payable for fund shares redeemed | | 236,303,868 | | |
| Accrued management fee | | 13,517,553 | | |
| Other payables and accrued expenses | | 134,744 | | |
| Collateral on securities loaned | | 151,600,413 | | |
| Total liabilities | | | | 401,556,670 |
| Commitments and contingent liabilities (see Significant Accounting Policies note) | | | | |
| Net Assets | | | $ | 34,782,795,541 |
| Net Assets consist of: | | | | |
| Paid in capital | | | $ | 16,743,641,624 |
| Total accumulated earnings (loss) | | | | 18,039,153,917 |
| Net Assets | | | $ | 34,782,795,541 |
Net Asset Value, offering price and redemption price per share ($34,782,795,541 ÷ 1,118,926,535 shares) | | | $ | 31.09 |
| Consolidated Statement of Operations |
| Year ended December 31, 2024 |
| Investment Income | | | | |
| Dividends | | | $ | 207,183,662 |
| Income from Fidelity Central Funds (including $426,824 from security lending) | | | | 36,359,982 |
| Total income | | | | 243,543,644 |
| Expenses | | | | |
| Management fee | $ | 152,941,850 | | |
| Independent trustees' fees and expenses | | 144,309 | | |
| Miscellaneous | | 156,362 | | |
| Total expenses before reductions | | 153,242,521 | | |
| Expense reductions | | (19,439) | | |
| Total expenses after reductions | | | | 153,223,082 |
| Net Investment income (loss) | | | | 90,320,562 |
| Realized and Unrealized Gain (Loss) | | | | |
| Net realized gain (loss) on: | | | | |
| Investment Securities: | | | | |
| Unaffiliated issuers (net of foreign taxes of $117,617) | | 815,003,299 | | |
| Redemptions in-kind | | 949,854,244 | | |
| Fidelity Central Funds | | (5,737) | | |
| Foreign currency transactions | | (309,555) | | |
| Total net realized gain (loss) | | | | 1,764,542,251 |
| Change in net unrealized appreciation (depreciation) on: | | | | |
| Investment Securities: | | | | |
| Unaffiliated issuers (net of decrease in deferred foreign taxes of $27,757) | | 8,078,241,408 | | |
| Unfunded commitments | | 315,279 | | |
| Assets and liabilities in foreign currencies | | (69,978) | | |
| Total change in net unrealized appreciation (depreciation) | | | | 8,078,486,709 |
| Net gain (loss) | | | | 9,843,028,960 |
| Net increase (decrease) in net assets resulting from operations | | | $ | 9,933,349,522 |
| Consolidated Statement of Changes in Net Assets |
| |
| | Year ended December 31, 2024 | | Year ended December 31, 2023 |
| Increase (Decrease) in Net Assets | | | | |
| Operations | | | | |
| Net investment income (loss) | $ | 90,320,562 | $ | 152,378,140 |
| Net realized gain (loss) | | 1,764,542,251 | | 175,763,351 |
| Change in net unrealized appreciation (depreciation) | | 8,078,486,709 | | 7,196,866,404 |
| Net increase (decrease) in net assets resulting from operations | | 9,933,349,522 | | 7,525,007,895 |
| Distributions to shareholders | | (128,644,731) | | (138,038,744) |
| | | | | |
| Share transactions | | | | |
| Proceeds from sales of shares | | 5,467,753,064 | | 6,872,796,883 |
| Reinvestment of distributions | | 128,442,337 | | 137,821,339 |
| Cost of shares redeemed | | (9,377,731,333) | | (4,722,190,787) |
| | | | | |
Net increase (decrease) in net assets resulting from share transactions | | (3,781,535,932) | | 2,288,427,435 |
| Total increase (decrease) in net assets | | 6,023,168,859 | | 9,675,396,586 |
| | | | | |
| Net Assets | | | | |
| Beginning of period | | 28,759,626,682 | | 19,084,230,096 |
| End of period | $ | 34,782,795,541 | $ | 28,759,626,682 |
| | | | | |
| Other Information | | | | |
| Shares | | | | |
| Sold | | 196,198,514 | | 339,925,449 |
| Issued in reinvestment of distributions | | 4,219,336 | | 6,351,213 |
| Redeemed | | (329,360,175) | | (232,582,425) |
| Net increase (decrease) | | (128,942,325) | | 113,694,237 |
| | | | | |
Consolidated Financial Highlights
| Years ended December 31, | | 2024 | | 2023 | | 2022 | | 2021 | | 2020 |
Selected Per-Share Data | | | | | | | | | | |
| Net asset value, beginning of period | $ | 23.05 | $ | 16.83 | $ | 23.34 | $ | 18.89 | $ | 14.47 |
| Income from Investment Operations | | | | | | | | | | |
Net investment income (loss) A,B | | .08 | | .13 | | .12 | | .03 | | .03 |
| Net realized and unrealized gain (loss) | | 8.07 | | 6.20 | | (6.43) | | 4.53 | | 4.43 |
| Total from investment operations | | 8.15 | | 6.33 | | (6.31) | | 4.56 | | 4.46 |
| Distributions from net investment income | | (.11) | | (.11) | | (.11) | | (.05) | | (.04) |
| Distributions from net realized gain | | - | | - | | (.09) | | (.06) | | - |
| Total distributions | | (.11) | | (.11) | | (.20) | | (.11) | | (.04) |
| Net asset value, end of period | $ | 31.09 | $ | 23.05 | $ | 16.83 | $ | 23.34 | $ | 18.89 |
Total Return C | | | | 37.67% | | (27.12)% | | 24.14% | | 30.83% |
Ratios to Average Net Assets B,D,E | | | | | | | | | | |
| Expenses before reductions | | .45% | | .45% | | .45% | | .45% | | .45% |
| Expenses net of fee waivers, if any | | | | .45% | | .45% | | .45% | | .45% |
| Expenses net of all reductions | | .45% | | .45% | | .45% | | .45% | | .45% |
| Net investment income (loss) | | .27% | | .63% | | .64% | | .12% | | .18% |
| Supplemental Data | | | | | | | | | | |
| Net assets, end of period (000 omitted) | $ | 34,782,796 | $ | 28,759,627 | $ | 19,084,230 | $ | 26,146,630 | $ | 17,402,109 |
Portfolio turnover rate F | | | | 25% G | | 38% G | | 40% G | | 45% G |
ACalculated based on average shares outstanding during the period.
BNet investment income (loss) is affected by the timing of the declaration of dividends by any underlying mutual funds or exchange-traded funds (ETFs). Net investment income (loss) of any mutual funds or ETFs is not included in the Fund's net investment income (loss) ratio.
CTotal returns would have been lower if certain expenses had not been reduced during the applicable periods shown.
DFees and expenses of any underlying mutual funds or exchange-traded funds (ETFs) are not included in the Fund's expense ratio. The Fund indirectly bears its proportionate share of these expenses. For additional expense information related to investments in Fidelity Central Funds, please refer to the "Investments in Fidelity Central Funds" note found in the Notes to Consolidated Financial Statements section of the most recent Annual or Semi-Annual report.
EExpense ratios reflect operating expenses of the class. Expenses before reductions do not reflect amounts reimbursed, waived, or reduced through arrangements with the investment adviser, brokerage services, or other offset arrangements, if applicable, and do not represent the amount paid by the class during periods when reimbursements, waivers or reductions occur.
FAmount does not include the portfolio activity of any underlying mutual funds or exchange-traded funds (ETFs), derivatives or securities that mature within one year from acquisition.
GPortfolio turnover rate excludes securities received or delivered in-kind.
Notes to Consolidated Financial Statements
For the period ended December 31, 2024
1. Organization.
Fidelity Contrafund K6 (the Fund) is a fund of Fidelity Contrafund (the Trust) and is authorized to issue an unlimited number of shares. Share transactions on the Consolidated Statement of Changes in Net Assets may contain exchanges between affiliated funds. The Trust is registered under the Investment Company Act of 1940, as amended (the 1940 Act), as an open-end management investment company organized as a Massachusetts business trust. Shares generally are available only to employer-sponsored retirement plans that are recordkept by Fidelity, or to certain employer-sponsored retirement plans that are not recordkept by Fidelity.
2. Investments in Fidelity Central Funds.
Funds may invest in Fidelity Central Funds, which are open-end investment companies generally available only to other investment companies and accounts managed by the investment adviser and its affiliates. The Consolidated Schedule of Investments lists any Fidelity Central Funds held as an investment as of period end, but does not include the underlying holdings of each Fidelity Central Fund. An investing fund indirectly bears its proportionate share of the expenses of the underlying Fidelity Central Funds.
Based on its investment objective, each Fidelity Central Fund may invest or participate in various investment vehicles or strategies that are similar to those of the investing fund. These strategies are consistent with the investment objectives of the investing fund and may involve certain economic risks which may cause a decline in value of each of the Fidelity Central Funds and thus a decline in the value of the investing fund.
| Fidelity Central Fund | Investment Manager | Investment Objective | Investment Practices | Expense RatioA |
| Fidelity Money Market Central Funds | Fidelity Management & Research Company LLC (FMR) | Each fund seeks to obtain a high level of current income consistent with the preservation of capital and liquidity. | Short-term Investments | Less than .005% |
A Expenses expressed as a percentage of average net assets and are as of each underlying Central Fund's most recent annual or semi-annual shareholder report.
A complete unaudited list of holdings for each Fidelity Central Fund is available upon request or at the Securities and Exchange Commission website at www.sec.gov. In addition, the financial statements of the Fidelity Central Funds which contain the significant accounting policies (including investment valuation policies) of those funds, and are not covered by the Report of Independent Registered Public Accounting Firm, are available on the Securities and Exchange Commission website or upon request.
3. Significant Accounting Policies.
The Fund is an investment company and applies the accounting and reporting guidance of the Financial Accounting Standards Board (FASB) Accounting Standards Codification Topic 946 Financial Services - Investment Companies. The consolidated financial statements have been prepared in conformity with accounting principles generally accepted in the United States of America (GAAP), which require management to make certain estimates and assumptions at the date of the consolidated financial statements. Actual results could differ from those estimates. The Fund operates as a single operating segment. The Fund's income, expenses, assets, and performance are regularly monitored and assessed as a whole by the investment adviser and other individuals responsible for oversight functions of the Trust, using the information presented in the consolidated financial statements and consolidated financial highlights. Subsequent events, if any, through the date that the consolidated financial statements were issued have been evaluated in the preparation of the consolidated financial statements. The Fund's Consolidated Schedule of Investments lists any underlying mutual funds or exchange-traded funds (ETFs) but does not include the underlying holdings of these funds. The following summarizes the significant accounting policies of the Fund:
Investment Valuation. Investments are valued as of 4:00 p.m. Eastern time on the last calendar day of the period. The Board of Trustees (the Board) has designated the Fund's investment adviser as the valuation designee responsible for the fair valuation function and performing fair value determinations as needed. The investment adviser has established a Fair Value Committee (the Committee) to carry out the day-to-day fair valuation responsibilities and has adopted policies and procedures to govern the fair valuation process and the activities of the Committee. In accordance with these fair valuation policies and procedures, which have been approved by the Board, the Fund attempts to obtain prices from one or more third party pricing services or brokers to value its investments. When current market prices, quotations or currency exchange rates are not readily available or reliable, investments will be fair valued in good faith by the Committee, in accordance with the policies and procedures. Factors used in determining fair value vary by investment type and may include market or investment specific events, transaction data, estimated cash flows, and market observations of comparable investments. The frequency that the fair valuation procedures are used cannot be predicted and they may be utilized to a significant extent. The Committee manages the Fund's fair valuation practices and maintains the fair valuation policies and procedures. The Fund's investment adviser reports to the Board information regarding the fair valuation process and related material matters.
The Fund categorizes the inputs to valuation techniques used to value its investments into a disclosure hierarchy consisting of three levels as shown below:
Level 1 - unadjusted quoted prices in active markets for identical investments
Level 2 - other significant observable inputs (including quoted prices for similar investments, interest rates, prepayment speeds, etc.)
Level 3 - unobservable inputs (including the Fund's own assumptions based on the best information available)
Valuation techniques used to value the Fund's investments by major category are as follows:
Equity securities, including restricted securities, for which market quotations are readily available, are valued at the last reported sale price or official closing price as reported by a third party pricing service on the primary market or exchange on which they are traded and are categorized as Level 1 in the hierarchy. In the event there were no sales during the day or closing prices are not available, securities are valued at the last quoted bid price or may be valued using the last available price and are generally categorized as Level 2 in the hierarchy. For foreign equity securities, when market or security specific events arise, comparisons to the valuation of American Depositary Receipts (ADRs), futures contracts, Exchange-Traded Funds (ETFs) and certain indexes as well as quoted prices for similar securities may be used and would be categorized as Level 2 in the hierarchy. For equity securities, including restricted securities, where observable inputs are limited, assumptions about market activity and risk are used and these securities may be categorized as Level 3 in the hierarchy. Securities, including private placements or other restricted securities, for which observable inputs are not available are valued using alternate valuation approaches, including the market approach, the income approach and cost approach, and are categorized as Level 3 in the hierarchy. The market approach considers factors including the price of recent investments in the same or a similar security or financial metrics of comparable securities. The income approach considers factors including expected future cash flows, security specific risks and corresponding discount rates. The cost approach considers factors including the value of the security's underlying assets and liabilities.
Debt securities, including restricted securities, are valued based on evaluated prices received from third party pricing services or from brokers who make markets in such securities. Preferred securities are valued by pricing services who utilize matrix pricing which considers yield or price of bonds of comparable quality, coupon, maturity and type or by broker-supplied prices. When independent prices are unavailable or unreliable, debt securities may be valued utilizing pricing methodologies which consider similar factors that would be used by third party pricing services. Debt securities are generally categorized as Level 2 in the hierarchy but may be Level 3 depending on the circumstances.
Investments in open-end mutual funds, including the Fidelity Central Funds, are valued at their closing net asset value (NAV) each business day and are categorized as Level 1 in the hierarchy.
The following provides information on Level 3 securities held by the Fund that were valued at period end based on unobservable inputs. These amounts exclude valuations provided by a broker.
| Asset Type | Fair Value | Valuation Technique(s) | Unobservable Input | Amount or Range/Weighted Average | Impact to Valuation from an Increase in InputA |
| Common Stocks | $ 288,496,290 | Market comparable | Enterprise value/Revenue multiple (EV/R) | 1.5 - 61.8 / 13.0 | Increase |
| | | | Enterprise value/EBITDA multiple (EV/EBITDA) | 21.3 - 33.4 / 32.4 | Increase |
| | | | Enterprise value/Net income multiple (EV/NI) | 14.0 | Increase |
| | | Recovery value | Recovery value | $0.00 | Increase |
| | | Black scholes | Discount rate | 4.3% - 4.4% / 4.4% | Increase |
| | | | Term | 1.0 - 5.0 / 2.2 | Increase |
| | | | Volatility | 60.0% - 100.0% / 60.5% | Increase |
| | | Book value | Book value multiple | 1.0 | Increase |
| Convertible Preferred Stocks | $ 392,422,011 | Market comparable | Enterprise value/Revenue multiple (EV/R) | 0.9 - 61.8 / 26.0 | Increase |
| | | | Enterprise value/EBITDA multiple (EV/EBITDA) | 21.3 - 33.4 / 33.3 | Increase |
| | | Market approach | Transaction price | $20.85 | Increase |
| | | | Discount rate | 85.0% | Decrease |
| | | Recovery value | Recovery value | $0.00 | Increase |
| | | Black scholes | Discount rate | 4.3% - 4.4% / 4.3% | Increase |
| | | | Term | 2.0 - 5.0 / 2.6 | Increase |
| | | | Volatility | 60.0% - 80.0% / 76.3% | Increase |
| | | Book value | Book value multiple | 1.0 | Increase |
| Preferred Securities | $ 508,072 | Market comparable | Enterprise value/Revenue multiple (EV/R) | 1.5 | Increase |
| | | Recovery value | Recovery value | $0.00 | Increase |
| | | Black scholes | Discount rate | 4.4% | Increase |
| | | | Term | 2.1 | Increase |
| | | | Volatility | 60.0% | Increase |
A Represents the directional change in the fair value of the Level 3 investments that could have resulted from an increase in the corresponding input as of period end. A decrease to the unobservable input would have had the opposite effect. Significant changes in these inputs may have resulted in a significantly higher or lower fair value measurement at period end.
Changes in valuation techniques may result in transfers in or out of an assigned level within the disclosure hierarchy. The aggregate value of investments by input level as of December 31, 2024, as well as a roll forward of Level 3 investments, is included at the end of the Fund's Consolidated Schedule of Investments.
Foreign Currency. Certain Funds may use foreign currency contracts to facilitate transactions in foreign-denominated securities. Gains and losses from these transactions may arise from changes in the value of the foreign currency or if the counterparties do not perform under the contracts' terms.
Foreign-denominated assets, including investment securities, and liabilities are translated into U.S. dollars at the exchange rates at period end. Purchases and sales of investment securities, income and dividends received, and expenses denominated in foreign currencies are translated into U.S. dollars at the exchange rate in effect on the transaction date.
The effects of exchange rate fluctuations on investments are included with the net realized and unrealized gain (loss) on investment securities. Other foreign currency transactions resulting in realized and unrealized gain (loss) are disclosed separately.
Investment Transactions and Income. For financial reporting purposes, the Fund's investment holdings and NAV include trades executed through the end of the last business day of the period. The NAV per share for processing shareholder transactions is calculated as of the close of business of the New York Stock Exchange (NYSE), normally 4:00 p.m. Eastern time and includes trades executed through the end of the prior business day. Gains and losses on securities sold are determined on the basis of identified cost and include proceeds received from litigation. Commissions paid to certain brokers with whom the investment adviser, or its affiliates, places trades on behalf of a fund include an amount in addition to trade execution, which may be rebated back to a fund. Any such rebates are included in net realized gain (loss) on investments in the Consolidated Statement of Operations. Dividend income is recorded on the ex-dividend date, except for certain dividends from foreign securities where the ex-dividend date may have passed, which are recorded as soon as the Fund is informed of the ex-dividend date. Non-cash dividends included in dividend income, if any, are recorded at the fair market value of the securities received. Income and capital gain distributions from Fidelity Central Funds, if any, are recorded on the ex-dividend date. Certain distributions received by the Fund represent a return of capital or capital gain. The Fund determines the components of these distributions subsequent to the ex-dividend date, based upon receipt of tax filings or other correspondence relating to the underlying investment. These distributions are recorded as a reduction of cost of investments and/or as a realized gain. Investment income is recorded net of foreign taxes withheld where recovery of such taxes is uncertain. Funds may file withholding tax reclaims in certain jurisdictions to recover a portion of amounts previously withheld. Any withholding tax reclaims income is included in the Consolidated Statement of Operations in dividends. Any receivables for withholding tax reclaims are included in the Consolidated Statement of Assets and Liabilities in dividends receivable.
Expenses. Expenses directly attributable to a fund are charged to that fund. Expenses attributable to more than one fund are allocated among the respective funds on the basis of relative net assets or other appropriate methods. Expenses included in the accompanying consolidated financial statements reflect the expenses of that fund and do not include any expenses associated with any underlying mutual funds or exchange-traded funds. Although not included in a fund's expenses, a fund indirectly bears its proportionate share of these expenses through the net asset value of each underlying mutual fund or exchange-traded fund. Expense estimates are accrued in the period to which they relate and adjustments are made when actual amounts are known.
Income Tax Information and Distributions to Shareholders. Each year, the Fund intends to qualify as a regulated investment company under Subchapter M of the Internal Revenue Code, including distributing substantially all of its taxable income and realized gains. As a result, no provision for U.S. Federal income taxes is required. As of December 31, 2024, the Fund did not have any unrecognized tax benefits in the consolidated financial statements; nor is the Fund aware of any tax positions for which it is reasonably possible that the total amounts of unrecognized tax benefits will significantly change in the next twelve months. The Fund files a U.S. federal tax return, in addition to state and local tax returns as required. The Fund's federal income tax returns are subject to examination by the Internal Revenue Service (IRS) for a period of three fiscal years after they are filed. State and local tax returns may be subject to examination for an additional fiscal year depending on the jurisdiction. Foreign taxes are provided for based on the Fund's understanding of the tax rules and rates that exist in the foreign markets in which it invests. The Fund is subject to a tax imposed on capital gains by certain countries in which it invests.
Distributions are declared and recorded on the ex-dividend date. Income and capital gain distributions are determined in accordance with income tax regulations, which may differ from GAAP.
Capital accounts within the consolidated financial statements are adjusted for permanent book-tax differences. These adjustments have no impact on net assets or the results of operations. Capital accounts are not adjusted for temporary book-tax differences which will reverse in a subsequent period.
Book-tax differences are primarily due to foreign currency transactions, certain foreign taxes, passive foreign investment companies (PFIC), redemptions in-kind, partnerships, capital loss carryforwards and losses deferred due to wash sales.
As of period end, the cost and unrealized appreciation (depreciation) in securities, and derivatives if applicable, for federal income tax purposes were as follows:
| Gross unrealized appreciation | $18,169,016,690 |
| Gross unrealized depreciation | (180,895,648) |
| Net unrealized appreciation (depreciation) | $17,988,121,042 |
| Tax Cost | $17,155,520,315 |
The tax-based components of distributable earnings as of period end were as follows:
| Undistributed long-term capital gain | $51,059,479 |
| Net unrealized appreciation (depreciation) on securities and other investments | $17,988,094,439 |
The tax character of distributions paid was as follows:
| | December 31, 2024 | December 31, 2023 |
| Ordinary Income | $128,644,731 | $ 138,038,744 |
Restricted Securities (including Private Placements). Funds may invest in securities that are subject to legal or contractual restrictions on resale. These securities generally may be resold in transactions exempt from registration or to the public if the securities are registered. Disposal of these securities may involve time-consuming negotiations and expense, and prompt sale at an acceptable price may be difficult. Information regarding restricted securities held at period end is included at the end of the Consolidated Schedule of Investments, if applicable.
Commitments. A commitment is an agreement to acquire an investment at a future date (subject to conditions) in connection with a potential public or non-public offering. Commitments outstanding at period end are presented in the table below. Unrealized appreciation (depreciation) on any commitments outstanding at period end is separately presented in the Consolidated Statement of Assets and Liabilities as Unrealized appreciation (depreciation) on unfunded commitments, and any change in unrealized appreciation (depreciation) on unfunded commitments during the period is separately presented in the Consolidated Statement of Operations, as applicable based on contractual conditions of each commitment.
| | Investment to be Acquired | Commitment Amount ($) | Unrealized Appreciation (Depreciation)($) |
| Fidelity Contrafund K6 | Space Exploration Technologies Corp. Class A | 123,395 | - |
| Fidelity Contrafund K6 | Space Exploration Technologies Corp. Class C | 2,707,105 | - |
Special Purpose Acquisition Companies. Funds may invest in stock, warrants, and other securities of special purpose acquisition companies (SPACs) or similar special purpose entities. A SPAC is a publicly traded company that raises investment capital via an initial public offering (IPO) for the purpose of acquiring the equity securities of one or more existing companies via merger, business combination, acquisition or other similar transactions within a designated time frame.
Private Investment in Public Equity. Funds may acquire equity securities of an issuer through a private investment in a public equity (PIPE) transaction, including through commitments to purchase securities on a when-issued basis. A PIPE typically involves the purchase of securities directly from a publicly traded company in a private placement transaction. Securities purchased through PIPE transactions will be restricted from trading and considered illiquid until a resale registration statement for the shares is filed and declared effective.
At the current and/or prior period end, the Fund had commitments to purchase when-issued securities through PIPE transactions with SPACs. The commitments are contingent upon the SPACs acquiring the securities of target companies. Unrealized appreciation (depreciation) on any commitments outstanding at period end is separately presented in the Consolidated Statement of Assets and Liabilities as Unrealized appreciation (depreciation) on unfunded commitments, and any change in unrealized appreciation (depreciation) on unfunded commitments during the period is separately presented in the Consolidated Statement of Operations, as applicable.
Consolidated Subsidiary. The Funds included in the table below hold certain investments through a wholly-owned subsidiary ("Subsidiary"), which may be subject to federal and state taxes upon disposition.
As of period end, investments in Subsidiaries were as follows:
| | Amount ($) | % of Net Assets |
| Fidelity Contrafund K6 | 17,093,098 | .05 |
The financial statements have been consolidated to include the Subsidiary accounts where applicable. Accordingly, all inter-company transactions and balances have been eliminated.
At period end, any estimated tax liability for these investments is presented as "Deferred taxes" in the Consolidated Statement of Assets and Liabilities and included in "Change in net unrealized appreciation (depreciation) on investment securities" in the Consolidated Statement of Operations. The tax liability incurred may differ materially depending on conditions when these investments are disposed. Any cash held by a Subsidiary is restricted as to its use and is presented as "Restricted cash" in the Consolidated Statement of Assets and Liabilities, if applicable.
New Accounting Pronouncement. FASB Accounting Standards Update (ASU) 2023-07 Segment Reporting (Topic 280): Improvements to Reportable Segment Disclosures became effective in this reporting period. ASU 2023-07 enhances segment information disclosure in the notes to consolidated financial statements.
4. Purchases and Sales of Investments.
Purchases and sales of securities, other than short-term securities and in-kind transactions, as applicable, are noted in the table below.
| | Purchases ($) | Sales ($) |
| Fidelity Contrafund K6 | 6,307,850,814 | 7,821,678,820 |
Unaffiliated Redemptions In-Kind. Shares that were redeemed in-kind for investments, including accrued interest and cash, if any, are shown in the table below. The net realized gain or loss on investments delivered through in-kind redemptions is included in the "Net realized gain (loss) on: Redemptions in-kind" line in the accompanying Consolidated Statement of Operations. The amount of the in-kind redemptions is included in share transactions in the accompanying Consolidated Statement of Changes in Net Assets. There was no gain or loss for federal income tax purposes.
| | Shares | Total net realized gain or loss ($) | Total Proceeds ($) |
| Fidelity Contrafund K6 | 59,443,527 | 949,854,244 | 1,721,247,201 |
Unaffiliated Exchanges In-Kind. Shares that were exchanged for investments, including accrued interest and cash, if any, are shown in the table below. The amount of in-kind exchanges is included in share transactions in the accompanying Consolidated Statement of Changes in Net Assets.
| | Shares | Total Proceeds ($) |
| Fidelity Contrafund K6 | 2,577,029 | 70,327,132 |
Prior Fiscal Year Unaffiliated Redemptions In-Kind. Shares that were redeemed in-kind for investments, including accrued interest and cash, if any, are shown in the table below; along with realized gain or loss on investments delivered through in-kind redemptions. The amount of the in-kind redemptions is included in share transactions in the accompanying Consolidated Statement of Changes in Net Assets. There was no gain or loss for federal income tax purposes.
| | Shares | Total net realized gain or loss ($) | Total Proceeds ($) |
| Fidelity Contrafund K6 | 36,779,822 | 396,537,801 | 806,748,004 |
Prior Year Unaffiliated Exchanges In-Kind. Shares that were exchanged for investments, including accrued interest and cash, if any, are shown in the table below. The amount of in-kind exchanges is included in share transactions in the accompanying Consolidated Statement of Changes in Net Assets.
| | Shares | Total Proceeds ($) |
| Fidelity Contrafund K6 | 43,028,081 | 787,276,717 |
5. Fees and Other Transactions with Affiliates.
Management Fee. Fidelity Management & Research Company LLC (the investment adviser) and its affiliates provide the Fund with investment management related services for which the Fund pays a monthly management fee that is based on an annual rate of .45% of average net assets. Under the management contract, the investment adviser or an affiliate pays all other expenses of the Fund, excluding fees and expenses of the independent Trustees, and certain miscellaneous expenses such as proxy and shareholder meeting expenses.
Brokerage Commissions. A portion of portfolio transactions were placed with brokerage firms which are affiliates of the investment adviser. Brokerage commissions are included in net realized gain (loss) and change in net unrealized appreciation (depreciation) in the Consolidated Statement of Operations. The commissions paid to these affiliated firms were as follows:
| | Amount ($) |
| Fidelity Contrafund K6 | 87,060 |
Interfund Trades. Funds may purchase from or sell securities to other Fidelity Funds under procedures adopted by the Board. The procedures have been designed to ensure these interfund trades are executed in accordance with Rule 17a-7 of the 1940 Act. Any interfund trades are included within the respective purchases and sales amounts shown in the Purchases and Sales of Investments note. Interfund trades during the period are noted in the table below.
| | Purchases ($) | Sales ($) | Realized Gain (Loss) ($) |
| Fidelity Contrafund K6 | 265,511,859 | 467,244,029 | 71,453,393 |
Sub-Advisory Arrangements. Effective March 1, 2024, the Fund's sub-advisory agreements with FMR Investment Management (UK) Limited, Fidelity Management & Research (Hong Kong) Limited, and Fidelity Management & Research (Japan) Limited were amended to provide that the investment adviser pays each sub-adviser monthly fees equal to 110% of the sub-adviser's costs for providing sub-advisory services.
Other. During the period, the investment adviser reimbursed the Fund for certain losses as follows:
| | Amount ($) |
| Fidelity Contrafund K6 | 2,379 |
6. Committed Line of Credit.
Certain Funds participate with other funds managed by the investment adviser or an affiliate in a $4.25 billion credit facility (the "line of credit") to be utilized for temporary or emergency purposes to fund shareholder redemptions or for other short-term liquidity purposes.
Commitment fees are charged based on the unused amount of the line of credit at an annual rate of .10%, and then allocated to each participating fund based on its pro-rata portion of the line of credit. The commitment fees are borne by the investment adviser.
Interest is charged to a participating fund based on its borrowings at an annual rate of .75% plus the highest of (i) daily SOFR plus a .10% spread adjustment, (ii) Federal Funds Effective Rate, or (iii) Overnight Bank Funding Rate. During the period, there were no borrowings on this line of credit.
The line of credit agreement will expire in March 2025 unless extended or renewed.
7. Security Lending.
Funds lend portfolio securities from time to time in order to earn additional income. Lending agents are used, including National Financial Services (NFS), an affiliate of the investment adviser. Pursuant to a securities lending agreement, NFS will receive a fee, which is capped at 9.9% of a fund's daily lending revenue, for its services as lending agent. A fund may lend securities to certain qualified borrowers, including NFS. On the settlement date of the loan, a fund receives collateral (in the form of U.S. Treasury obligations, letters of credit and/or cash) against the loaned securities and maintains collateral in an amount not less than 100% of the market value of the loaned securities during the period of the loan. The market value of the loaned securities is determined at the close of business of a fund and any additional required collateral is delivered to a fund on the next business day. A fund or borrower may terminate the loan at any time, and if the borrower defaults on its obligation to return the securities loaned because of insolvency or other reasons, a fund may apply collateral received from the borrower against the obligation. A fund may experience delays and costs in recovering the securities loaned. Any cash collateral received is invested in the Fidelity Securities Lending Cash Central Fund. Any loaned securities are identified as such in the Consolidated Schedule of Investments, and the value of loaned securities and cash collateral at period end, as applicable, are presented in the Consolidated Statement of Assets and Liabilities. Security lending income represents the income earned on investing cash collateral, less rebates paid to borrowers and any lending agent fees associated with the loan, plus any premium payments received for lending certain types of securities. Security lending income is presented in the Consolidated Statement of Operations as a component of income from Fidelity Central Funds. Affiliated security lending activity, if any, was as follows:
| | Total Security Lending Fees Paid to NFS ($) | Security Lending Income From Securities Loaned to NFS ($) | Value of Securities Loaned to NFS at Period End ($) |
| Fidelity Contrafund K6 | 45,825 | 9,785 | - |
8. Expense Reductions.
Through arrangements with the Fund's custodian, credits realized as a result of certain uninvested cash balances were used to reduce the Fund's expenses by $19,439.
9. Other.
A fund's organizational documents provide former and current trustees and officers with a limited indemnification against liabilities arising in connection with the performance of their duties to the fund. In the normal course of business, a fund may also enter into contracts that provide general indemnifications. A fund's maximum exposure under these arrangements is unknown as this would be dependent on future claims that may be made against a fund. The risk of material loss from such claims is considered remote.
10. Risk and Uncertainties.
Many factors affect a fund's performance. Developments that disrupt global economies and financial markets, such as pandemics, epidemics, outbreaks of infectious diseases, war, terrorism, and environmental disasters, may significantly affect a fund's investment performance. The effects of these developments to a fund will be impacted by the types of securities in which a fund invests, the financial condition, industry, economic sector, and geographic location of an issuer, and a fund's level of investment in the securities of that issuer. Significant concentrations in security types, issuers, industries, sectors, and geographic locations may magnify the factors that affect a fund's performance.
Report of Independent Registered Public Accounting Firm
To the Board of Trustees of Fidelity Contrafund and Shareholders of Fidelity Contrafund K6
Opinion on the Financial Statements
We have audited the accompanying consolidated statement of assets and liabilities, including the consolidated schedule of investments, of Fidelity Contrafund K6 and its subsidiaries (one of the funds constituting Fidelity Contrafund, referred to hereafter as the "Fund") as of December 31, 2024, the related consolidated statement of operations for the year ended December 31, 2024, the consolidated statement of changes in net assets for each of the two years in the period ended December 31, 2024, including the related notes, and the consolidated financial highlights for each of the five years in the period ended December 31, 2024 (collectively referred to as the "consolidated financial statements"). In our opinion, the consolidated financial statements present fairly, in all material respects, the financial position of the Fund as of December 31, 2024, the results of its operations for the year then ended, the changes in its net assets for each of the two years in the period ended December 31, 2024 and the financial highlights for each of the five years in the period ended December 31, 2024 in conformity with accounting principles generally accepted in the United States of America.
Basis for Opinion
These consolidated financial statements are the responsibility of the Fund's management. Our responsibility is to express an opinion on the Fund's consolidated financial statements based on our audits. We are a public accounting firm registered with the Public Company Accounting Oversight Board (United States) (PCAOB) and are required to be independent with respect to the Fund in accordance with the U.S. federal securities laws and the applicable rules and regulations of the Securities and Exchange Commission and the PCAOB.
We conducted our audits of these consolidated financial statements in accordance with the standards of the PCAOB. Those standards require that we plan and perform the audit to obtain reasonable assurance about whether the consolidated financial statements are free of material misstatement, whether due to error or fraud.
Our audits included performing procedures to assess the risks of material misstatement of the consolidated financial statements, whether due to error or fraud, and performing procedures that respond to those risks. Such procedures included examining, on a test basis, evidence regarding the amounts and disclosures in the consolidated financial statements. Our audits also included evaluating the accounting principles used and significant estimates made by management, as well as evaluating the overall presentation of the consolidated financial statements. Our procedures included confirmation of securities owned as of December 31, 2024 by correspondence with the custodian, issuers of privately offered securities and brokers. We believe that our audits provide a reasonable basis for our opinion.
/s/ PricewaterhouseCoopers LLP
Boston, Massachusetts
February 11, 2025
We have served as the auditor of one or more investment companies in the Fidelity group of funds since 1932.
Distributions
(Unaudited)
The dividend and capital gains distributions for the fund(s) are available on Fidelity.com or Institutional.Fidelity.com.
The fund hereby designates as a capital gain dividend with respect to the taxable year ended December 31, 2024, $53,318,822, or, if subsequently determined to be different, the net capital gain of such year.
A total of 2.84% of the dividends distributed during the fiscal year was derived from interest on U.S. Government securities which is generally exempt from state income tax.
The fund designates 100% of the dividends distributed during the fiscal year as qualifying for the dividends-received deduction for corporate shareholders.
The fund designates 100% of the dividends distributed during the fiscal year as amounts which may be taken into account as a dividend for the purposes of the maximum rate under section 1(h)(11) of the Internal Revenue Code.
The fund will notify shareholders in January 2025 of amounts for use in preparing 2024 income tax returns.
Item 8: Changes in and Disagreements with Accountants for Open-End Management Investment Companies
(Unaudited)
Note: This is not applicable for any fund included in this document.
Item 9: Proxy Disclosures for Open-End Management Investment Companies
(Unaudited)
| A special meeting of shareholders was held on July 16, 2024. The results of votes taken among shareholders on the proposal before them are reported below. Each vote reported represents one dollar of net asset value held on the record date for the meeting. |
| Proposal 1 |
| To elect a Board of Trustees. |
| | # of Votes | % of Votes |
| Bettina Doulton |
| Affirmative | 107,413,165,703.86 | 95.45 |
| Withheld | 5,115,205,734.52 | 4.55 |
| TOTAL | 112,528,371,438.38 | 100.00 |
| Robert A. Lawrence |
| Affirmative | 106,925,132,614.87 | 95.02 |
| Withheld | 5,603,238,823.51 | 4.98 |
| TOTAL | 112,528,371,438.38 | 100.00 |
| Vijay C. Advani |
| Affirmative | 106,908,299,345.67 | 95.01 |
| Withheld | 5,620,072,092.71 | 4.99 |
| TOTAL | 112,528,371,438.38 | 100.00 |
| Thomas P. Bostick |
| Affirmative | 107,023,189,484.37 | 95.11 |
| Withheld | 5,505,181,954.01 | 4.89 |
| TOTAL | 112,528,371,438.38 | 100.00 |
| Donald F. Donahue |
| Affirmative | 107,148,439,746.95 | 95.22 |
| Withheld | 5,379,931,691.43 | 4.78 |
| TOTAL | 112,528,371,438.38 | 100.00 |
| Vicki L. Fuller |
| Affirmative | 107,159,480,594.93 | 95.23 |
| Withheld | 5,368,890,843.45 | 4.77 |
| TOTAL | 112,528,371,438.38 | 100.00 |
| Patricia L. Kampling |
| Affirmative | 107,220,897,546.66 | 95.28 |
| Withheld | 5,307,473,891.72 | 4.72 |
| TOTAL | 112,528,371,438.38 | 100.00 |
| Thomas A. Kennedy |
| Affirmative | 107,004,892,718.66 | 95.09 |
| Withheld | 5,523,478,719.73 | 4.91 |
| TOTAL | 112,528,371,438.38 | 100.00 |
| Oscar Munoz |
| Affirmative | 106,701,787,976.15 | 94.82 |
| Withheld | 5,826,583,462.23 | 5.18 |
| TOTAL | 112,528,371,438.38 | 100.00 |
| Karen B. Peetz |
| Affirmative | 107,369,162,431.54 | 95.42 |
| Withheld | 5,159,209,006.84 | 4.58 |
| TOTAL | 112,528,371,438.38 | 100.00 |
| David M. Thomas |
| Affirmative | 106,815,962,138.16 | 94.92 |
| Withheld | 5,712,409,300.22 | 5.08 |
| TOTAL | 112,528,371,438.38 | 100.00 |
| Susan Tomasky |
| Affirmative | 107,029,000,908.81 | 95.11 |
| Withheld | 5,499,370,529.58 | 4.89 |
| TOTAL | 112,528,371,438.38 | 100.00 |
| Michael E. Wiley |
| Affirmative | 106,863,215,681.69 | 94.97 |
| Withheld | 5,665,155,756.69 | 5.03 |
| TOTAL | 112,528,371,438.38 | 100.00 |
| | | |
| Proposal 1 reflects trust-wide proposal and voting results. |
Item 10: Remuneration Paid to Directors, Officers, and others of Open-End Management Investment Companies
(Unaudited)
Note: This information is disclosed as part of the consolidated financial statements for each Fund as part of Item 7: Consolidated Financial Statements and Consolidated Financial Highlights for Open-End Management Investment companies.
Item 11: Statement Regarding Basis for Approval of Investment Advisory Contract
(Unaudited)
Note: This is not applicable for any fund included in this document.
1.9883979.107
CONK6-ANN-0325
Fidelity® Series Opportunistic Insights Fund
Annual Report
December 31, 2024
Contents
To view a fund's proxy voting guidelines and proxy voting record for the 12-month period ended June 30, visit http://www.fidelity.com/proxyvotingresults or visit the Securities and Exchange Commission's (SEC) web site at http://www.sec.gov.
You may also call 1-800-544-8544 to request a free copy of the proxy voting guidelines.
Standard & Poor's, S&P and S&P 500 are registered service marks of The McGraw-Hill Companies, Inc. and have been licensed for use by Fidelity Distributors Corporation.
Other third-party marks appearing herein are the property of their respective owners.
All other marks appearing herein are registered or unregistered trademarks or service marks of FMR LLC or an affiliated company. © 2025 FMR LLC. All rights reserved.
This report and the financial statements contained herein are submitted for the general information of the shareholders of the Fund. This report is not authorized for distribution to prospective investors in the Fund unless preceded or accompanied by an effective prospectus.
A fund files its complete schedule of portfolio holdings with the SEC for the first and third quarters of each fiscal year on Form N-PORT. Forms N-PORT are available on the SEC's web site at http://www.sec.gov. A fund's Forms N-PORT may be reviewed and copied at the SEC's Public Reference Room in Washington, DC. Information regarding the operation of the SEC's Public Reference Room may be obtained by calling 1-800-SEC-0330.
For a complete list of a fund's portfolio holdings, view the most recent holdings listing, semiannual report, or annual report on Fidelity's web site at http://www.fidelity.com, http://www.institutional.fidelity.com, or http://www.401k.com, as applicable.
NOT FDIC INSURED •MAY LOSE VALUE •NO BANK GUARANTEE
Neither the Fund nor Fidelity Distributors Corporation is a bank.
Item 7: Consolidated Financial Statements and Consolidated Financial Highlights for Open-End Management Investment Companies (Annual Report)
Fidelity® Series Opportunistic Insights Fund
Consolidated Schedule of Investments December 31, 2024
Showing Percentage of Net Assets
| Common Stocks - 96.4% |
| | | Shares | Value ($) |
| AUSTRALIA - 0.1% | | | |
| Industrials - 0.0% | | | |
| Commercial Services & Supplies - 0.0% | | | |
| Clean TeQ Water Ltd (b) | | 2,653 | 534 |
| Information Technology - 0.1% | | | |
| Software - 0.1% | | | |
| Canva Inc Class A (c)(d) | | 6,900 | 8,832,621 |
| TOTAL AUSTRALIA | | | 8,833,155 |
| BELGIUM - 0.1% | | | |
| Health Care - 0.1% | | | |
| Pharmaceuticals - 0.1% | | | |
| UCB SA | | 42,294 | 8,420,328 |
| BRAZIL - 0.3% | | | |
| Consumer Discretionary - 0.2% | | | |
| Broadline Retail - 0.2% | | | |
| MercadoLibre Inc (b) | | 10,300 | 17,514,532 |
| Financials - 0.1% | | | |
| Banks - 0.1% | | | |
| NU Holdings Ltd/Cayman Islands Class A (b) | | 1,229,900 | 12,741,764 |
| Materials - 0.0% | | | |
| Metals & Mining - 0.0% | | | |
| Wheaton Precious Metals Corp | | 55,400 | 3,118,310 |
| TOTAL BRAZIL | | | 33,374,606 |
| CANADA - 2.1% | | | |
| Communication Services - 0.0% | | | |
| Entertainment - 0.0% | | | |
| Lionsgate Studios Corp | | 165,588 | 1,258,468 |
| Consumer Discretionary - 0.0% | | | |
| Broadline Retail - 0.0% | | | |
| Dollarama Inc | | 33,300 | 3,249,730 |
| Consumer Staples - 0.0% | | | |
| Consumer Staples Distribution & Retail - 0.0% | | | |
| Alimentation Couche-Tard Inc | | 45,900 | 2,545,583 |
| Energy - 0.3% | | | |
| Oil, Gas & Consumable Fuels - 0.3% | | | |
| ARC Resources Ltd | | 55,700 | 1,010,191 |
| Cameco Corp (United States) | | 110,400 | 5,673,456 |
| Canadian Natural Resources Ltd | | 757,700 | 23,393,319 |
| PrairieSky Royalty Ltd | | 37,400 | 729,293 |
| Suncor Energy Inc | | 26,600 | 949,491 |
| | | | 31,755,750 |
| Financials - 1.0% | | | |
| Banks - 0.2% | | | |
| Royal Bank of Canada | | 156,900 | 18,918,159 |
| Capital Markets - 0.1% | | | |
| Brookfield Asset Management Ltd Class A | | 4,520 | 245,142 |
| Brookfield Asset Management Ltd Class A (United States) | | 236,200 | 12,799,678 |
| Brookfield Corp Class A | | 34,000 | 1,954,210 |
| | | | 14,999,030 |
| Insurance - 0.7% | | | |
| Fairfax Financial Holdings Ltd Subordinate Voting Shares | | 34,400 | 47,862,535 |
| Intact Financial Corp | | 149,685 | 27,254,552 |
| | | | 75,117,087 |
TOTAL FINANCIALS | | | 109,034,276 |
| | | | |
| Industrials - 0.2% | | | |
| Commercial Services & Supplies - 0.0% | | | |
| RB Global Inc (United States) | | 41,300 | 3,725,673 |
| Ground Transportation - 0.0% | | | |
| Canadian Pacific Kansas City Ltd | | 73,298 | 5,307,215 |
| Professional Services - 0.2% | | | |
| Thomson Reuters Corp | | 50,391 | 8,091,586 |
TOTAL INDUSTRIALS | | | 17,124,474 |
| | | | |
| Information Technology - 0.3% | | | |
| Electronic Equipment, Instruments & Components - 0.0% | | | |
| Celestica Inc Subordinate Voting Shares (b) | | 56,200 | 5,186,610 |
| IT Services - 0.3% | | | |
| Shopify Inc Class A (b) | | 304,268 | 32,383,708 |
| Software - 0.0% | | | |
| Constellation Software Inc/Canada | | 400 | 1,236,887 |
TOTAL INFORMATION TECHNOLOGY | | | 38,807,205 |
| | | | |
| Materials - 0.3% | | | |
| Metals & Mining - 0.3% | | | |
| Agnico Eagle Mines Ltd/CA | | 44,800 | 3,504,962 |
| Alamos Gold Inc Class A | | 59,500 | 1,097,736 |
| B2Gold Corp | | 322,433 | 789,568 |
| Franco-Nevada Corp | | 89,917 | 10,566,476 |
| Lundin Gold Inc | | 171,700 | 3,662,264 |
| Novagold Resources Inc (b) | | 333,834 | 1,117,076 |
| Orla Mining Ltd (b) | | 1,774,200 | 9,824,781 |
| | | | 30,562,863 |
| TOTAL CANADA | | | 234,338,349 |
| CHINA - 0.1% | | | |
| Consumer Discretionary - 0.1% | | | |
| Automobiles - 0.1% | | | |
| BYD Co Ltd H Shares | | 202,000 | 6,870,653 |
| Hotels, Restaurants & Leisure - 0.0% | | | |
| Meituan B Shares (b)(e)(f) | | 82,000 | 1,594,356 |
| Textiles, Apparel & Luxury Goods - 0.0% | | | |
| China Hongxing Sports Ltd (b)(c) | | 22,200 | 0 |
TOTAL CONSUMER DISCRETIONARY | | | 8,465,009 |
| | | | |
| Health Care - 0.0% | | | |
| Biotechnology - 0.0% | | | |
| Zai Lab Ltd ADR (b) | | 45,600 | 1,194,264 |
| TOTAL CHINA | | | 9,659,273 |
| CONGO DEMOCRATIC REPUBLIC OF - 0.4% | | | |
| Materials - 0.4% | | | |
| Metals & Mining - 0.4% | | | |
| Ivanhoe Mine Ltd Class A (b) | | 3,814,089 | 45,266,519 |
| FINLAND - 0.1% | | | |
| Consumer Discretionary - 0.1% | | | |
| Textiles, Apparel & Luxury Goods - 0.1% | | | |
| Amer Sports Inc | | 318,800 | 8,913,648 |
| FRANCE - 0.1% | | | |
| Health Care - 0.1% | | | |
| Health Care Equipment & Supplies - 0.1% | | | |
| EssilorLuxottica SA | | 43,503 | 10,616,744 |
| GERMANY - 0.1% | | | |
| Consumer Discretionary - 0.1% | | | |
| Textiles, Apparel & Luxury Goods - 0.1% | | | |
| adidas AG | | 34,000 | 8,339,836 |
| Birkenstock Holding Plc (b) | | 21,400 | 1,212,524 |
| | | | |
| TOTAL GERMANY | | | 9,552,360 |
| IRELAND - 0.2% | | | |
| Financials - 0.1% | | | |
| Banks - 0.1% | | | |
| AIB Group PLC | | 448,300 | 2,475,101 |
| Bank of Ireland Group PLC | | 225,600 | 2,057,854 |
| | | | 4,532,955 |
| Financial Services - 0.0% | | | |
| Circle Internet Financial LLC (c) | | 61,811 | 1,872,255 |
| Circle Internet Financial LLC (c) | | 38,025 | 1,151,777 |
| | | | 3,024,032 |
| Information Technology - 0.1% | | | |
| IT Services - 0.1% | | | |
| Accenture PLC Class A | | 36,329 | 12,780,179 |
| TOTAL IRELAND | | | 20,337,166 |
| ISRAEL - 0.6% | | | |
| Health Care - 0.5% | | | |
| Pharmaceuticals - 0.5% | | | |
| Teva Pharmaceutical Industries Ltd ADR (b) | | 2,505,325 | 55,217,363 |
| Information Technology - 0.1% | | | |
| IT Services - 0.0% | | | |
| Wix.com Ltd (b) | | 8,935 | 1,917,004 |
| Software - 0.1% | | | |
| Cellebrite DI Ltd (b) | | 23,437 | 516,317 |
| Check Point Software Technologies Ltd (b) | | 32,073 | 5,988,029 |
| | | | 6,504,346 |
TOTAL INFORMATION TECHNOLOGY | | | 8,421,350 |
| | | | |
| TOTAL ISRAEL | | | 63,638,713 |
| ITALY - 0.0% | | | |
| Industrials - 0.0% | | | |
| Passenger Airlines - 0.0% | | | |
| Ryanair Holdings PLC ADR | | 186,619 | 8,134,722 |
| JAPAN - 0.2% | | | |
| Consumer Discretionary - 0.1% | | | |
| Broadline Retail - 0.0% | | | |
| Pan Pacific International Holdings Corp | | 44,000 | 1,206,927 |
| Specialty Retail - 0.1% | | | |
| Fast Retailing Co Ltd | | 22,700 | 7,657,658 |
| Textiles, Apparel & Luxury Goods - 0.0% | | | |
| Asics Corp | | 93,200 | 1,842,143 |
TOTAL CONSUMER DISCRETIONARY | | | 10,706,728 |
| | | | |
| Industrials - 0.1% | | | |
| Industrial Conglomerates - 0.0% | | | |
| Hitachi Ltd | | 42,500 | 1,040,827 |
| Machinery - 0.1% | | | |
| Mitsubishi Heavy Industries Ltd | | 385,000 | 5,368,422 |
| Trading Companies & Distributors - 0.0% | | | |
| ITOCHU Corp | | 70,300 | 3,456,959 |
| Mitsui & Co Ltd | | 90,400 | 1,874,817 |
| | | | 5,331,776 |
TOTAL INDUSTRIALS | | | 11,741,025 |
| | | | |
| Information Technology - 0.0% | | | |
| Semiconductors & Semiconductor Equipment - 0.0% | | | |
| Advantest Corp | | 78,000 | 4,434,990 |
| TOTAL JAPAN | | | 26,882,743 |
| KOREA (SOUTH) - 0.3% | | | |
| Consumer Discretionary - 0.3% | | | |
| Automobiles - 0.1% | | | |
| Hyundai Motor Co | | 88,700 | 12,540,844 |
| Broadline Retail - 0.2% | | | |
| Coupang Inc Class A (b) | | 982,526 | 21,595,921 |
| TOTAL KOREA (SOUTH) | | | 34,136,765 |
| NETHERLANDS - 0.2% | | | |
| Communication Services - 0.1% | | | |
| Entertainment - 0.1% | | | |
| Universal Music Group NV | | 368,866 | 9,435,270 |
| Financials - 0.0% | | | |
| Financial Services - 0.0% | | | |
| Adyen NV (b)(e)(f) | | 800 | 1,188,863 |
| Health Care - 0.1% | | | |
| Biotechnology - 0.1% | | | |
| Argenx SE ADR (b) | | 26,000 | 15,990,000 |
| TOTAL NETHERLANDS | | | 26,614,133 |
| SPAIN - 0.0% | | | |
| Financials - 0.0% | | | |
| Banks - 0.0% | | | |
| Banco Santander SA | | 1,006,700 | 4,657,248 |
| SWEDEN - 0.0% | | | |
| Industrials - 0.0% | | | |
| Machinery - 0.0% | | | |
| Indutrade AB | | 34,800 | 871,270 |
| SWITZERLAND - 0.2% | | | |
| Consumer Discretionary - 0.1% | | | |
| Textiles, Apparel & Luxury Goods - 0.1% | | | |
| On Holding AG Class A (b) | | 302,700 | 16,578,879 |
| Financials - 0.1% | | | |
| Capital Markets - 0.1% | | | |
| UBS Group AG | | 349,350 | 10,674,316 |
| TOTAL SWITZERLAND | | | 27,253,195 |
| TAIWAN - 0.4% | | | |
| Information Technology - 0.4% | | | |
| Semiconductors & Semiconductor Equipment - 0.4% | | | |
| Taiwan Semiconductor Manufacturing Co Ltd ADR | | 201,700 | 39,833,733 |
| THAILAND - 0.0% | | | |
| Information Technology - 0.0% | | | |
| Electronic Equipment, Instruments & Components - 0.0% | | | |
| Fabrinet (b) | | 19,300 | 4,243,684 |
| UNITED KINGDOM - 0.3% | | | |
| Consumer Discretionary - 0.0% | | | |
| Hotels, Restaurants & Leisure - 0.0% | | | |
| Deliveroo PLC Class A (b)(e)(f) | | 25,184 | 44,738 |
| Flutter Entertainment PLC (United Kingdom) (b) | | 19,800 | 5,135,995 |
| | | | 5,180,733 |
| Financials - 0.2% | | | |
| Banks - 0.0% | | | |
| Starling Bank Ltd Class D (b)(c)(d) | | 1,611,012 | 5,102,569 |
| Capital Markets - 0.2% | | | |
| London Stock Exchange Group PLC | | 63,800 | 9,005,687 |
TOTAL FINANCIALS | | | 14,108,256 |
| | | | |
| Industrials - 0.1% | | | |
| Aerospace & Defense - 0.1% | | | |
| Rolls-Royce Holdings PLC (b) | | 1,817,600 | 12,889,317 |
| TOTAL UNITED KINGDOM | | | 32,178,306 |
| UNITED STATES - 90.6% | | | |
| Communication Services - 21.2% | | | |
| Entertainment - 3.4% | | | |
| Electronic Arts Inc | | 22,200 | 3,247,860 |
| Liberty Media Corp-Liberty Formula One Class C (b) | | 240,698 | 22,303,077 |
| Liberty Media Corp-Liberty Live Class C (b) | | 9,488 | 645,753 |
| Live Nation Entertainment Inc (b) | | 27,100 | 3,509,450 |
| Netflix Inc (b) | | 365,609 | 325,874,614 |
| ROBLOX Corp Class A (b) | | 87,500 | 5,062,750 |
| Spotify Technology SA (b) | | 28,264 | 12,644,748 |
| Walt Disney Co/The | | 39,100 | 4,353,785 |
| | | | 377,642,037 |
| Interactive Media & Services - 17.8% | | | |
| Alphabet Inc Class A | | 1,276,512 | 241,643,722 |
| Alphabet Inc Class C | | 1,257,800 | 239,535,432 |
| Epic Games Inc (b)(c)(d) | | 7,100 | 4,817,421 |
| Meta Platforms Inc Class A | | 2,535,454 | 1,484,533,672 |
| Reddit Inc Class A | | 170,156 | 27,810,297 |
| Reddit Inc Class B (b) | | 32,888 | 5,375,214 |
| | | | 2,003,715,758 |
| Media - 0.0% | | | |
| Omnicom Group Inc | | 22,500 | 1,935,900 |
| Trade Desk Inc (The) Class A (b) | | 18,600 | 2,186,058 |
| | | | 4,121,958 |
| Wireless Telecommunication Services - 0.0% | | | |
| T-Mobile US Inc | | 11,400 | 2,516,322 |
TOTAL COMMUNICATION SERVICES | | | 2,387,996,075 |
| | | | |
| Consumer Discretionary - 9.1% | | | |
| Automobiles - 0.2% | | | |
| General Motors Co | | 75,100 | 4,000,577 |
| Rad Power Bikes Inc (b)(c)(d) | | 145,919 | 30,643 |
| Rad Power Bikes Inc warrants 10/6/2033 (b)(c)(d) | | 150,652 | 78,339 |
| Tesla Inc (b) | | 51,900 | 20,959,296 |
| | | | 25,068,855 |
| Broadline Retail - 5.7% | | | |
| Amazon.com Inc (b) | | 2,868,440 | 629,307,052 |
| Diversified Consumer Services - 0.2% | | | |
| Duolingo Inc Class A (b) | | 58,467 | 18,956,755 |
| Hotels, Restaurants & Leisure - 1.5% | | | |
| Airbnb Inc Class A (b) | | 271,800 | 35,717,238 |
| Booking Holdings Inc | | 4,300 | 21,364,206 |
| Carnival Corp (b) | | 157,700 | 3,929,884 |
| Cava Group Inc (b) | | 79,774 | 8,998,507 |
| Chipotle Mexican Grill Inc (b) | | 490,700 | 29,589,210 |
| Churchill Downs Inc | | 13,334 | 1,780,622 |
| DraftKings Inc Class A (b) | | 29,400 | 1,093,680 |
| Dutch Bros Inc Class A (b) | | 33,700 | 1,765,206 |
| Hilton Worldwide Holdings Inc | | 191,413 | 47,309,637 |
| Royal Caribbean Cruises Ltd | | 10,217 | 2,356,960 |
| Starbucks Corp | | 81,300 | 7,418,625 |
| Texas Roadhouse Inc | | 7,200 | 1,299,096 |
| Viking Holdings Ltd (g) | | 163,100 | 7,186,186 |
| | | | 169,809,057 |
| Household Durables - 0.3% | | | |
| Blu Homes Inc (b)(c)(d) | | 21,093,998 | 6,539 |
| DR Horton Inc | | 19,011 | 2,658,118 |
| Garmin Ltd | | 26,412 | 5,447,739 |
| Lennar Corp Class A | | 125,348 | 17,093,707 |
| PulteGroup Inc | | 118,645 | 12,920,441 |
| | | | 38,126,544 |
| Specialty Retail - 1.0% | | | |
| Abercrombie & Fitch Co Class A (b) | | 25,100 | 3,751,697 |
| Chewy Inc Class A (b) | | 31,111 | 1,041,907 |
| Dick's Sporting Goods Inc | | 29,004 | 6,637,275 |
| Fanatics Inc Class A (b)(c)(d) | | 139,938 | 8,396,280 |
| Gap Inc/The | | 166,032 | 3,923,336 |
| Group 1 Automotive Inc | | 300 | 126,444 |
| O'Reilly Automotive Inc (b) | | 30,246 | 35,865,707 |
| TJX Cos Inc/The | | 468,400 | 56,587,405 |
| | | | 116,330,051 |
| Textiles, Apparel & Luxury Goods - 0.2% | | | |
| Deckers Outdoor Corp (b) | | 78,304 | 15,902,759 |
| Ralph Lauren Corp Class A | | 31,200 | 7,206,576 |
| VF Corp | | 153,200 | 3,287,672 |
| | | | 26,397,007 |
TOTAL CONSUMER DISCRETIONARY | | | 1,023,995,321 |
| | | | |
| Consumer Staples - 1.4% | | | |
| Beverages - 0.1% | | | |
| Coca-Cola Co/The | | 267,850 | 16,676,341 |
| Consumer Staples Distribution & Retail - 1.3% | | | |
| Casey's General Stores Inc | | 31,223 | 12,371,489 |
| Costco Wholesale Corp | | 117,137 | 107,329,120 |
| Walmart Inc | | 154,500 | 13,959,075 |
| | | | 133,659,684 |
| Food Products - 0.0% | | | |
| Bowery Farming Inc (b)(c) | | 20,452 | 0 |
| Bowery Farming Inc warrants (b)(c)(d) | | 7,186 | 0 |
| | | | 0 |
| Household Products - 0.0% | | | |
| Procter & Gamble Co/The | | 12,300 | 2,062,095 |
| Personal Care Products - 0.0% | | | |
| BellRing Brands Inc (b) | | 3,106 | 234,006 |
TOTAL CONSUMER STAPLES | | | 152,632,126 |
| | | | |
| Energy - 0.8% | | | |
| Energy Equipment & Services - 0.2% | | | |
| Baker Hughes Co Class A | | 590,138 | 24,207,461 |
| Oil, Gas & Consumable Fuels - 0.6% | | | |
| Antero Resources Corp (b) | | 16,900 | 592,345 |
| Cheniere Energy Inc | | 5,400 | 1,160,298 |
| Exxon Mobil Corp | | 450,400 | 48,449,528 |
| Marathon Petroleum Corp | | 7,600 | 1,060,200 |
| Sable Offshore Corp (d) | | 352,000 | 8,060,800 |
| Shell PLC ADR | | 79,000 | 4,949,350 |
| | | | 64,272,521 |
TOTAL ENERGY | | | 88,479,982 |
| | | | |
| Financials - 16.5% | | | |
| Banks - 3.0% | | | |
| Bank of America Corp | | 1,001,262 | 44,005,465 |
| Citigroup Inc | | 365,600 | 25,734,584 |
| East West Bancorp Inc | | 39,606 | 3,792,671 |
| First Citizens BancShares Inc/NC Class A | | 7,100 | 15,002,442 |
| JPMorgan Chase & Co | | 792,824 | 190,047,841 |
| Wells Fargo & Co | | 823,900 | 57,870,736 |
| | | | 336,453,739 |
| Capital Markets - 1.7% | | | |
| Bank of New York Mellon Corp/The | | 268,500 | 20,628,855 |
| Blackstone Inc | | 41,900 | 7,224,398 |
| Charles Schwab Corp/The | | 14,800 | 1,095,348 |
| Goldman Sachs Group Inc/The | | 80,300 | 45,981,386 |
| Interactive Brokers Group Inc Class A | | 24,700 | 4,363,749 |
| KKR & Co Inc Class A | | 60,500 | 8,948,555 |
| Moody's Corp | | 72,304 | 34,226,544 |
| Morgan Stanley | | 432,400 | 54,361,329 |
| MSCI Inc | | 8,911 | 5,346,689 |
| Raymond James Financial Inc | | 15,400 | 2,392,082 |
| S&P Global Inc | | 2,200 | 1,095,666 |
| Tulco LLC (b)(c)(d)(h) | | 7,549 | 6,323,495 |
| | | | 191,988,096 |
| Consumer Finance - 0.9% | | | |
| American Express Co | | 256,197 | 76,036,708 |
| Capital One Financial Corp | | 99,300 | 17,707,176 |
| Discover Financial Services | | 58,971 | 10,215,545 |
| | | | 103,959,429 |
| Financial Services - 8.9% | | | |
| Apollo Global Management Inc | | 6,900 | 1,139,604 |
| Berkshire Hathaway Inc Class A (b) | | 1,004 | 683,643,680 |
| Block Inc Class A (b) | | 12,300 | 1,045,377 |
| Fiserv Inc (b) | | 158,000 | 32,456,360 |
| Mastercard Inc Class A | | 85,500 | 45,021,735 |
| Paymentus Holdings Inc Class A (b) | | 13,813 | 451,271 |
| PayPal Holdings Inc (b) | | 510,600 | 43,579,710 |
| Shift4 Payments Inc Class A (b)(g) | | 57,900 | 6,008,862 |
| Toast Inc Class A (b) | | 81,200 | 2,959,740 |
| Visa Inc Class A | | 598,600 | 189,181,544 |
| | | | 1,005,487,883 |
| Insurance - 2.0% | | | |
| American International Group Inc | | 248,100 | 18,061,680 |
| Aon PLC | | 6,200 | 2,226,792 |
| Arthur J Gallagher & Co | | 110,111 | 31,255,007 |
| Chubb Ltd | | 182,268 | 50,360,648 |
| Marsh & McLennan Cos Inc | | 183,800 | 39,040,958 |
| Progressive Corp/The | | 241,500 | 57,865,816 |
| The Travelers Companies, Inc. | | 108,108 | 26,042,136 |
| Willis Towers Watson PLC | | 3,600 | 1,127,664 |
| | | | 225,980,701 |
TOTAL FINANCIALS | | | 1,863,869,848 |
| | | | |
| Health Care - 8.2% | | | |
| Biotechnology - 3.0% | | | |
| Alnylam Pharmaceuticals Inc (b) | | 42,900 | 10,094,799 |
| Apogee Therapeutics Inc (b) | | 20,200 | 915,060 |
| Arcellx Inc (b) | | 26,700 | 2,047,623 |
| Avidity Biosciences Inc (b) | | 60,952 | 1,772,484 |
| Crinetics Pharmaceuticals Inc (b) | | 19,800 | 1,012,374 |
| Denali Therapeutics Inc (b) | | 88,440 | 1,802,407 |
| Exelixis Inc (b) | | 22,700 | 755,910 |
| Gilead Sciences Inc | | 38,300 | 3,537,771 |
| Insmed Inc (b) | | 20,600 | 1,422,224 |
| Janux Therapeutics Inc (b) | | 35,600 | 1,906,024 |
| Moderna Inc (b) | | 32,400 | 1,347,192 |
| Natera Inc (b) | | 7,700 | 1,218,910 |
| Recursion Pharmaceuticals Inc Class A (b)(g) | | 89,600 | 605,696 |
| Regeneron Pharmaceuticals Inc (b) | | 174,961 | 124,629,969 |
| United Therapeutics Corp (b) | | 23,300 | 8,221,172 |
| Vertex Pharmaceuticals Inc (b) | | 407,800 | 164,221,061 |
| Viking Therapeutics Inc (b) | | 16,900 | 680,056 |
| | | | 326,190,732 |
| Health Care Equipment & Supplies - 2.1% | | | |
| Alcon AG (United States) | | 320,100 | 27,173,289 |
| Boston Scientific Corp (b) | | 656,400 | 58,629,648 |
| Cooper Cos Inc/The (b) | | 17,204 | 1,581,564 |
| Glaukos Corp (b) | | 7,772 | 1,165,334 |
| Globus Medical Inc Class A (b) | | 14,600 | 1,207,566 |
| Insulet Corp (b) | | 4,400 | 1,148,708 |
| Intuitive Surgical Inc (b) | | 222,250 | 116,005,610 |
| PROCEPT BioRobotics Corp (b) | | 9,900 | 797,147 |
| Stryker Corp | | 83,100 | 29,920,155 |
| | | | 237,629,021 |
| Health Care Providers & Services - 0.5% | | | |
| BrightSpring Health Services Inc (b) | | 39,709 | 676,244 |
| HCA Healthcare Inc | | 66,300 | 19,899,945 |
| Tenet Healthcare Corp (b) | | 273,602 | 34,536,781 |
| | | | 55,112,970 |
| Health Care Technology - 0.0% | | | |
| Doximity Inc Class A (b) | | 63,800 | 3,406,282 |
| Veeva Systems Inc Class A (b) | | 4,245 | 892,511 |
| | | | 4,298,793 |
| Life Sciences Tools & Services - 0.0% | | | |
| Veterinary Emergency Group (b)(c)(d)(h) | | 80,233 | 5,097,202 |
| Pharmaceuticals - 2.6% | | | |
| Eli Lilly & Co | | 328,352 | 253,487,744 |
| Intra-Cellular Therapies Inc (b) | | 98,405 | 8,218,786 |
| Merck & Co Inc | | 304,300 | 30,271,764 |
| | | | 291,978,294 |
TOTAL HEALTH CARE | | | 920,307,012 |
| | | | |
| Industrials - 8.6% | | | |
| Aerospace & Defense - 2.3% | | | |
| Axon Enterprise Inc (b) | | 38,800 | 23,059,616 |
| Boeing Co (b) | | 19,320 | 3,419,640 |
| GE Aerospace | | 719,837 | 120,061,613 |
| HEICO Corp | | 1,900 | 451,706 |
| Howmet Aerospace Inc | | 379,000 | 41,451,230 |
| Leonardo DRS Inc (b) | | 71,340 | 2,304,995 |
| Loar Holdings Inc | | 14,700 | 1,086,477 |
| Relativity Space Inc warrants (b)(c)(d) | | 8,037 | 2,090 |
| Space Exploration Technologies Corp (b)(c)(d) | | 213,857 | 39,563,545 |
| Space Exploration Technologies Corp Class C (b)(c)(d) | | 15,483 | 2,864,355 |
| TransDigm Group Inc | | 16,400 | 20,783,392 |
| | | | 255,048,659 |
| Air Freight & Logistics - 0.0% | | | |
| Zipline International Inc (b)(c)(d) | | 28,830 | 1,209,418 |
| Building Products - 1.0% | | | |
| AZEK Co Inc/The Class A (b) | | 22,200 | 1,053,834 |
| Carrier Global Corp | | 131,300 | 8,962,538 |
| Trane Technologies PLC | | 284,600 | 105,117,010 |
| | | | 115,133,382 |
| Commercial Services & Supplies - 0.8% | | | |
| Cintas Corp | | 113,324 | 20,704,295 |
| Clean Harbors Inc (b) | | 185,075 | 42,593,161 |
| GFL Environmental Inc Subordinate Voting Shares | | 403,400 | 17,983,145 |
| Republic Services Inc | | 11,600 | 2,333,688 |
| Veralto Corp | | 63,151 | 6,431,929 |
| | | | 90,046,218 |
| Construction & Engineering - 0.0% | | | |
| Comfort Systems USA Inc | | 5,100 | 2,162,706 |
| EMCOR Group Inc | | 1,200 | 544,680 |
| | | | 2,707,386 |
| Electrical Equipment - 2.3% | | | |
| Eaton Corp PLC | | 315,113 | 104,576,551 |
| GE Vernova Inc | | 303,834 | 99,940,118 |
| Generac Holdings Inc (b) | | 25,100 | 3,891,755 |
| Hubbell Inc | | 97,856 | 40,990,900 |
| Vertiv Holdings Co Class A | | 59,100 | 6,714,351 |
| | | | 256,113,675 |
| Ground Transportation - 0.1% | | | |
| Uber Technologies Inc (b) | | 82,047 | 4,949,075 |
| XPO Inc (b) | | 5,600 | 734,440 |
| | | | 5,683,515 |
| Industrial Conglomerates - 0.4% | | | |
| 3M Co | | 349,600 | 45,129,864 |
| Machinery - 0.6% | | | |
| Caterpillar Inc | | 53,300 | 19,335,108 |
| Deere & Co | | 12,800 | 5,423,360 |
| Ingersoll Rand Inc | | 27,500 | 2,487,650 |
| PACCAR Inc | | 162,390 | 16,891,808 |
| Parker-Hannifin Corp | | 34,900 | 22,197,447 |
| Westinghouse Air Brake Technologies Corp | | 25,200 | 4,777,668 |
| | | | 71,113,041 |
| Passenger Airlines - 0.0% | | | |
| Alaska Air Group Inc (b)(g) | | 32,200 | 2,084,950 |
| Professional Services - 0.3% | | | |
| Dayforce Inc (b)(g) | | 71,598 | 5,200,879 |
| Leidos Holdings Inc | | 4,781 | 688,750 |
| Paycom Software Inc | | 31,349 | 6,425,605 |
| UL Solutions Inc Class A | | 50,700 | 2,528,916 |
| Verisk Analytics Inc | | 64,900 | 17,875,407 |
| | | | 32,719,557 |
| Trading Companies & Distributors - 0.8% | | | |
| FTAI Aviation Ltd | | 42,100 | 6,064,084 |
| United Rentals Inc | | 52,500 | 36,983,100 |
| WW Grainger Inc | | 48,419 | 51,036,047 |
| | | | 94,083,231 |
TOTAL INDUSTRIALS | | | 971,072,896 |
| | | | |
| Information Technology - 23.5% | | | |
| Communications Equipment - 1.3% | | | |
| Arista Networks Inc | | 1,229,796 | 135,929,352 |
| Motorola Solutions Inc | | 19,700 | 9,105,931 |
| | | | 145,035,283 |
| Electronic Equipment, Instruments & Components - 1.7% | | | |
| Amphenol Corp Class A | | 2,685,162 | 186,484,501 |
| Coherent Corp (b) | | 15,900 | 1,506,207 |
| Sanmina Corp (b) | | 3,600 | 272,412 |
| Zebra Technologies Corp Class A (b) | | 3,000 | 1,158,660 |
| | | | 189,421,780 |
| IT Services - 0.2% | | | |
| Asac II LP (b)(c)(d) | | 2,013,117 | 338,204 |
| Cloudflare Inc Class A (b) | | 76,000 | 8,183,680 |
| Gartner Inc (b) | | 13,013 | 6,304,408 |
| GoDaddy Inc Class A (b) | | 19,406 | 3,830,162 |
| Kyndryl Holdings Inc (b) | | 81,580 | 2,822,668 |
| Twilio Inc Class A (b) | | 26,900 | 2,907,352 |
| X Holdings Corp Class A (b)(c)(d) | | 32,510 | 992,530 |
| | | | 25,379,004 |
| Semiconductors & Semiconductor Equipment - 11.2% | | | |
| Advanced Micro Devices Inc (b) | | 18,553 | 2,241,017 |
| Analog Devices Inc | | 39,400 | 8,370,924 |
| Applied Materials Inc | | 8,500 | 1,382,354 |
| ARM Holdings PLC ADR (b) | | 52,010 | 6,415,954 |
| Astera Labs Inc (b) | | 57,966 | 7,677,597 |
| Broadcom Inc | | 530,900 | 123,083,856 |
| Marvell Technology Inc | | 64,617 | 7,136,948 |
| Monolithic Power Systems Inc | | 3,532 | 2,089,884 |
| NVIDIA Corp | | 8,241,000 | 1,106,683,890 |
| | | | 1,265,082,424 |
| Software - 6.4% | | | |
| Alkami Technology Inc (b) | | 4,800 | 176,063 |
| Appfolio Inc Class A (b) | | 3,800 | 937,536 |
| Applied Intuition Inc Class A (c)(d) | | 10,963 | 679,706 |
| AppLovin Corp Class A (b) | | 3,500 | 1,133,405 |
| Atlassian Corp Class A (b) | | 3,300 | 803,154 |
| Cadence Design Systems Inc (b) | | 122,262 | 36,734,841 |
| Clear Secure Inc Class A | | 87,918 | 2,342,136 |
| Coreweave Inc Class A (c)(d) | | 8,948 | 8,409,778 |
| CyberArk Software Ltd (b) | | 37,951 | 12,643,376 |
| Datadog Inc Class A (b) | | 47,747 | 6,822,569 |
| DocuSign Inc (b) | | 87,849 | 7,901,139 |
| Dynatrace Inc (b) | | 12,000 | 652,200 |
| Fair Isaac Corp (b) | | 200 | 398,185 |
| Figma Inc Class A (c)(d) | | 84,800 | 2,376,944 |
| Fortinet Inc (b) | | 192,989 | 18,233,601 |
| HubSpot Inc (b) | | 1,600 | 1,114,832 |
| Klaviyo Inc Class A (b) | | 46,857 | 1,932,383 |
| Magic Leap Inc Class A (b)(c)(d) | | 72,297 | 1 |
| Magic Leap Inc warrants (b)(c)(d) | | 39,573 | 0 |
| Microsoft Corp | | 1,168,549 | 492,543,404 |
| Monday.com Ltd (b) | | 10,900 | 2,566,296 |
| Onestream Inc Class A | | 33,011 | 941,474 |
| OpenAI Global LLC rights (b)(c)(d) | | 5,771,073 | 5,771,073 |
| Oracle Corp | | 5,400 | 899,856 |
| Palo Alto Networks Inc (b) | | 27,000 | 4,912,920 |
| Rubrik Inc Class A (b) | | 32,400 | 2,117,664 |
| Salesforce Inc | | 99,094 | 33,130,097 |
| Samsara Inc Class A (b) | | 213,505 | 9,328,033 |
| Servicenow Inc (b) | | 46,800 | 49,613,616 |
| ServiceTitan Inc Class A (b)(g) | | 5,000 | 514,350 |
| Stripe Inc Class B (b)(c)(d) | | 26,700 | 734,517 |
| Tanium Inc Class B (b)(c)(d) | | 408,212 | 3,751,468 |
| Zoom Communications Inc Class A (b) | | 92,800 | 7,573,408 |
| | | | 717,690,025 |
| Technology Hardware, Storage & Peripherals - 2.7% | | | |
| Apple Inc | | 1,197,700 | 299,928,034 |
| Dell Technologies Inc Class C | | 22,419 | 2,583,566 |
| | | | 302,511,600 |
TOTAL INFORMATION TECHNOLOGY | | | 2,645,120,116 |
| | | | |
| Materials - 0.4% | | | |
| Chemicals - 0.1% | | | |
| Air Products and Chemicals Inc | | 3,600 | 1,044,144 |
| Sherwin-Williams Co/The | | 29,091 | 9,888,904 |
| | | | 10,933,048 |
| Construction Materials - 0.1% | | | |
| CRH PLC | | 84,300 | 7,799,435 |
| Containers & Packaging - 0.1% | | | |
| International Paper Co | | 140,700 | 7,572,474 |
| Silgan Holdings Inc | | 7,000 | 364,350 |
| | | | 7,936,824 |
| Metals & Mining - 0.1% | | | |
| ATI Inc (b) | | 27,850 | 1,532,864 |
| Freeport-McMoRan Inc | | 323,000 | 12,299,840 |
| Ivanhoe Electric Inc / US (b) | | 262,700 | 1,983,385 |
| Steel Dynamics Inc | | 6,139 | 700,276 |
| | | | 16,516,365 |
TOTAL MATERIALS | | | 43,185,672 |
| | | | |
| Real Estate - 0.2% | | | |
| Health Care REITs - 0.0% | | | |
| Welltower Inc | | 60,900 | 7,675,227 |
| Real Estate Management & Development - 0.2% | | | |
| CBRE Group Inc Class A (b) | | 199,624 | 26,208,635 |
TOTAL REAL ESTATE | | | 33,883,862 |
| | | | |
| Utilities - 0.7% | | | |
| Electric Utilities - 0.5% | | | |
| American Electric Power Co Inc | | 10,900 | 1,005,307 |
| Constellation Energy Corp | | 180,848 | 40,457,506 |
| NRG Energy Inc | | 79,800 | 7,199,556 |
| PG&E Corp | | 168,400 | 3,398,312 |
| Southern Co/The | | 16,500 | 1,358,280 |
| | | | 53,418,961 |
| Independent Power and Renewable Electricity Producers - 0.2% | | | |
| Vistra Corp | | 169,957 | 23,431,972 |
TOTAL UTILITIES | | | 76,850,933 |
| | | | |
| TOTAL UNITED STATES | | | 10,207,393,843 |
| TOTAL COMMON STOCKS (Cost $4,033,730,873) | | | 10,865,150,503 |
| | | | |
| Convertible Preferred Stocks - 1.5% |
| | | Shares | Value ($) |
| CHINA - 0.1% | | | |
| Communication Services - 0.1% | | | |
| Interactive Media & Services - 0.1% | | | |
| ByteDance Ltd Series E1 (b)(c)(d) | | 37,932 | 9,394,239 |
| UNITED STATES - 1.4% | | | |
| Consumer Discretionary - 0.0% | | | |
| Automobiles - 0.0% | | | |
| Rad Power Bikes Inc Series A (b)(c)(d) | | 19,024 | 3,995 |
| Rad Power Bikes Inc Series C (b)(c)(d) | | 74,857 | 42,668 |
| Rad Power Bikes Inc Series D (b)(c)(d) | | 127,700 | 121,316 |
| | | | 167,979 |
| Hotels, Restaurants & Leisure - 0.0% | | | |
| Discord Inc Series I (b)(c)(d) | | 800 | 197,616 |
TOTAL CONSUMER DISCRETIONARY | | | 365,595 |
| | | | |
| Consumer Staples - 0.0% | | | |
| Consumer Staples Distribution & Retail - 0.0% | | | |
| GoBrands Inc Series G (b)(c)(d) | | 3,340 | 112,457 |
| GoBrands Inc Series H (b)(c)(d) | | 3,970 | 171,345 |
| | | | 283,802 |
| Financials - 0.0% | | | |
| Financial Services - 0.0% | | | |
| Tenstorrent Holdings Inc Series C1 (b)(c)(d) | | 23,737 | 1,760,811 |
| Health Care - 0.0% | | | |
| Biotechnology - 0.0% | | | |
| ElevateBio LLC Series C (b)(c)(d) | | 194,500 | 564,050 |
| Health Care Providers & Services - 0.0% | | | |
| Lyra Health Inc Series E (b)(c)(d) | | 79,800 | 790,818 |
| Lyra Health Inc Series F (b)(c)(d) | | 4,099 | 40,621 |
| Somatus Inc Series E (b)(c)(d) | | 842 | 931,479 |
| | | | 1,762,918 |
TOTAL HEALTH CARE | | | 2,326,968 |
| | | | |
| Industrials - 1.3% | | | |
| Aerospace & Defense - 1.2% | | | |
| Relativity Space Inc Series E (b)(c)(d) | | 125,290 | 117,773 |
| Relativity Space Inc Series F (b)(c)(d) | | 80,375 | 75,552 |
| Space Exploration Technologies Corp Series G (b)(c)(d) | | 36,460 | 67,451,000 |
| Space Exploration Technologies Corp Series H (b)(c)(d) | | 7,256 | 13,423,600 |
| Space Exploration Technologies Corp Series N (b)(c)(d) | | 24,552 | 45,421,200 |
| | | | 126,489,125 |
| Air Freight & Logistics - 0.1% | | | |
| Zipline International Inc Series E (b)(c)(d) | | 66,084 | 2,772,224 |
| Zipline International Inc Series F (b)(c)(d) | | 129,467 | 5,431,141 |
| Zipline International Inc Series G (c)(d) | | 59,655 | 2,502,527 |
| | | | 10,705,892 |
| Construction & Engineering - 0.0% | | | |
| Beta Technologies Inc Series B, 6% (b)(c)(d) | | 15,787 | 2,124,299 |
| Beta Technologies Inc Series C, 6% (c)(d) | | 16,200 | 1,872,396 |
| | | | 3,996,695 |
TOTAL INDUSTRIALS | | | 141,191,712 |
| | | | |
| Information Technology - 0.1% | | | |
| Software - 0.1% | | | |
| Applied Intuition Inc Series A2 (c)(d) | | 14,271 | 884,802 |
| Applied Intuition Inc Series B2 (c)(d) | | 6,881 | 426,622 |
| Magic Leap Inc Series AA (b)(c)(d) | | 275,569 | 2 |
| MOLOCO Inc Series A (b)(c)(d) | | 35,442 | 2,314,363 |
| Nuro Inc/CA Series C (b)(c)(d) | | 190,290 | 624,152 |
| Nuro Inc/CA Series D (b)(c)(d) | | 36,736 | 152,454 |
| Stripe Inc Series H (b)(c)(d) | | 11,500 | 316,365 |
| Stripe Inc Series I (b)(c)(d) | | 128,075 | 3,523,343 |
| xAI Corp Series C (c)(d) | | 264,240 | 5,720,796 |
| | | | 13,962,899 |
| TOTAL UNITED STATES | | | 159,891,787 |
| TOTAL CONVERTIBLE PREFERRED STOCKS (Cost $61,025,008) | | | 169,286,026 |
| | | | |
| Preferred Securities - 0.0% |
| | | Principal Amount (a) | Value ($) |
| UNITED STATES - 0.0% | | | |
| Consumer Discretionary - 0.0% | | | |
| Automobiles - 0.0% | | | |
Rad Power Bikes Inc 8% 12/31/2025 (c)(d) (Cost $150,651) | | 150,652 | 196,585 |
| | | | |
| Money Market Funds - 4.8% |
| | | Yield (%) | Shares | Value ($) |
| Fidelity Cash Central Fund (i) | | 4.36 | 517,220,879 | 517,324,323 |
| Fidelity Securities Lending Cash Central Fund (i)(j) | | 4.35 | 18,527,150 | 18,529,003 |
| TOTAL MONEY MARKET FUNDS (Cost $535,853,326) | | | | 535,853,326 |
| | | | | |
| TOTAL INVESTMENT IN SECURITIES - 102.7% (Cost $4,630,759,858) | 11,570,486,440 |
NET OTHER ASSETS (LIABILITIES) - (2.7)% | (305,349,831) |
| NET ASSETS - 100.0% | 11,265,136,609 |
| | |
Legend
| (a) | Amount is stated in United States dollars unless otherwise noted. |
| (d) | Restricted securities (including private placements) - Investment in securities not registered under the Securities Act of 1933 (excluding 144A issues). At the end of the period, the value of restricted securities (excluding 144A issues) amounted to $282,922,149 or 2.5% of net assets. |
| (e) | Security exempt from registration under Rule 144A of the Securities Act of 1933. These securities may be resold in transactions exempt from registration, normally to qualified institutional buyers. At the end of the period, the value of these securities amounted to $2,827,957 or 0.0% of net assets. |
| (f) | Security is exempt from registration under Regulation S of the Securities Act of 1933 and may be resold to qualified foreign investors outside of the United States. At the end of the period, the value of securities amounted to $2,827,957 or 0.0% of net assets. |
| (g) | Security or a portion of the security is on loan at period end. |
| (h) | Investment is owned by a wholly-owned subsidiary (Subsidiary) that is treated as a corporation for U.S. tax purposes. |
| (i) | Affiliated fund that is generally available only to investment companies and other accounts managed by Fidelity Investments. The rate quoted is the annualized seven-day yield of the fund at period end. A complete unaudited listing of the fund's holdings as of its most recent quarter end is available upon request. In addition, each Fidelity Central Fund's financial statements, which are not covered by the Fund's Report of Independent Registered Public Accounting Firm, are available on the SEC's website or upon request. |
| (j) | Investment made with cash collateral received from securities on loan. |
| Additional information on each restricted holding is as follows: |
| Security | Acquisition Date | Acquisition Cost ($) |
| Applied Intuition Inc Class A | 7/02/24 | 654,435 |
| | | |
| Applied Intuition Inc Series A2 | 7/02/24 | 851,906 |
| | | |
| Applied Intuition Inc Series B2 | 7/02/24 | 410,761 |
| | | |
| Asac II LP | 10/10/13 | 155,030 |
| | | |
| Beta Technologies Inc Series B, 6% | 4/04/22 | 1,628,745 |
| | | |
| Beta Technologies Inc Series C, 6% | 10/24/24 | 1,854,414 |
| | | |
| Blu Homes Inc | 5/21/20 | 36,484 |
| | | |
| Bowery Farming Inc warrants | 10/25/23 | 0 |
| | | |
| ByteDance Ltd Series E1 | 11/18/20 | 4,156,368 |
| | | |
| Canva Inc Class A | 3/18/24 | 7,359,962 |
| | | |
| Coreweave Inc Class A | 11/29/23 - 10/03/24 | 3,521,059 |
| | | |
| Discord Inc Series I | 9/15/21 | 440,500 |
| | | |
| ElevateBio LLC Series C | 3/09/21 | 815,928 |
| | | |
| Epic Games Inc | 7/13/20 - 7/30/20 | 4,082,500 |
| | | |
| Fanatics Inc Class A | 8/13/20 - 12/15/21 | 4,645,245 |
| | | |
| Figma Inc Class A | 5/15/24 | 1,966,766 |
| | | |
| GoBrands Inc Series G | 3/02/21 | 834,056 |
| | | |
| GoBrands Inc Series H | 7/22/21 | 1,542,308 |
| | | |
| Lyra Health Inc Series E | 1/14/21 | 730,697 |
| | | |
| Lyra Health Inc Series F | 6/04/21 | 64,372 |
| | | |
| Magic Leap Inc Class A | 10/17/14 - 10/06/17 | 35,136,390 |
| | | |
| Magic Leap Inc Series AA | 7/07/20 | 4,756,362 |
| | | |
| Magic Leap Inc warrants | 7/07/20 | 0 |
| | | |
| MOLOCO Inc Series A | 6/26/23 | 2,126,520 |
| | | |
| Nuro Inc/CA Series C | 10/30/20 | 2,484,160 |
| | | |
| Nuro Inc/CA Series D | 10/29/21 | 765,788 |
| | | |
| OpenAI Global LLC rights | 9/30/24 | 5,771,073 |
| | | |
| Rad Power Bikes Inc | 1/21/21 | 703,890 |
| | | |
| Rad Power Bikes Inc 8% 12/31/2025 | 10/06/23 | 150,652 |
| | | |
| Rad Power Bikes Inc Series A | 1/21/21 | 91,769 |
| | | |
| Rad Power Bikes Inc Series C | 1/21/21 | 361,098 |
| | | |
| Rad Power Bikes Inc Series D | 9/17/21 | 1,223,851 |
| | | |
| Rad Power Bikes Inc warrants 10/6/2033 | 10/06/23 | 0 |
| | | |
| Relativity Space Inc Series E | 5/27/21 | 2,861,010 |
| | | |
| Relativity Space Inc Series F | 11/14/23 | 1,821,860 |
| | | |
| Relativity Space Inc warrants | 11/14/23 | 0 |
| | | |
| Sable Offshore Corp | 1/16/24 | 3,520,000 |
| | | |
| Somatus Inc Series E | 1/31/22 | 734,759 |
| | | |
| Space Exploration Technologies Corp | 10/16/15 - 7/01/24 | 3,291,302 |
| | | |
| Space Exploration Technologies Corp Class C | 9/11/17 - 7/01/24 | 962,841 |
| | | |
| Space Exploration Technologies Corp Series G | 1/20/15 | 2,824,192 |
| | | |
| Space Exploration Technologies Corp Series H | 8/04/17 | 979,560 |
| | | |
| Space Exploration Technologies Corp Series N | 8/04/20 | 6,629,040 |
| | | |
| Starling Bank Ltd Class D | 6/18/21 - 4/05/22 | 3,151,960 |
| | | |
| Stripe Inc Class B | 5/18/21 | 1,071,428 |
| | | |
| Stripe Inc Series H | 3/15/21 | 461,438 |
| | | |
| Stripe Inc Series I | 3/20/23 - 5/12/23 | 2,578,680 |
| | | |
| Tanium Inc Class B | 4/21/17 - 9/18/20 | 3,439,433 |
| | | |
| Tenstorrent Holdings Inc Series C1 | 4/23/21 | 1,411,288 |
| | | |
| Tulco LLC | 8/24/17 - 12/14/17 | 2,643,700 |
| | | |
| Veterinary Emergency Group | 9/16/21 - 10/02/24 | 3,668,762 |
| | | |
| X Holdings Corp Class A | 10/25/22 | 3,251,000 |
| | | |
| xAI Corp Series C | 11/22/24 | 5,720,796 |
| | | |
| Zipline International Inc | 10/12/21 | 1,037,880 |
| | | |
| Zipline International Inc Series E | 12/21/20 | 2,156,281 |
| | | |
| Zipline International Inc Series F | 4/11/23 | 5,204,198 |
| | | |
| Zipline International Inc Series G | 6/07/24 | 2,502,307 |
| | | |
Affiliated Central Funds
Fiscal year to date information regarding the Fund's investments in Fidelity Central Funds, including the ownership percentage, is presented below.
| Affiliate | Value, beginning of period ($) | Purchases ($) | Sales Proceeds ($) | Dividend Income ($) | Realized Gain (loss) ($) | Change in Unrealized appreciation (depreciation) ($) | Value, end of period ($) | Shares, end of period | % ownership, end of period |
| Fidelity Cash Central Fund | 252,115,689 | 2,937,442,419 | 2,672,233,117 | 12,027,472 | (668) | - | 517,324,323 | 517,220,879 | 1.0% |
| Fidelity Securities Lending Cash Central Fund | 29,369,645 | 267,647,212 | 278,487,854 | 66,428 | - | - | 18,529,003 | 18,527,150 | 0.1% |
| Total | 281,485,334 | 3,205,089,631 | 2,950,720,971 | 12,093,900 | (668) | - | 535,853,326 | 535,748,029 | |
| | | | | | | | | | |
Amounts in the dividend income column in the above table include any capital gain distributions from underlying funds, which are presented in the corresponding line item in the Consolidated Statement of Operations, if applicable.
Amounts in the dividend income column for Fidelity Securities Lending Cash Central Fund represents the income earned on investing cash collateral, less rebates paid to borrowers and any lending agent fees associated with the loan, plus any premium payments received for lending certain types of securities.
Amounts included in the purchases and sales proceeds columns may include in-kind transactions, if applicable.
Investment Valuation
The following is a summary of the inputs used, as of December 31, 2024, involving the Fund's assets and liabilities carried at fair value. The inputs or methodology used for valuing securities may not be an indication of the risk associated with investing in those securities. For more information on valuation inputs, and their aggregation into the levels used below, please refer to the Investment Valuation section in the accompanying Notes to Consolidated Financial Statements.
| Valuation Inputs at Reporting Date: |
| Description | Total ($) | Level 1 ($) | Level 2 ($) | Level 3 ($) |
Investments in Securities: | | | | |
|
| Common Stocks | | | | |
Communication Services | 2,398,689,813 | 2,384,437,122 | 9,435,270 | 4,817,421 |
Consumer Discretionary | 1,138,293,705 | 1,101,118,393 | 28,663,511 | 8,511,801 |
Consumer Staples | 155,177,709 | 155,177,709 | - | - |
Energy | 120,235,732 | 120,235,732 | - | - |
Financials | 2,023,831,558 | 1,994,529,664 | 14,851,798 | 14,450,096 |
Health Care | 1,011,745,711 | 1,006,648,509 | - | 5,097,202 |
Industrials | 1,021,834,238 | 953,564,488 | 24,630,342 | 43,639,408 |
Information Technology | 2,762,473,878 | 2,726,152,046 | 4,434,990 | 31,886,842 |
Materials | 122,133,364 | 122,133,364 | - | - |
Real Estate | 33,883,862 | 33,883,862 | - | - |
Utilities | 76,850,933 | 76,850,933 | - | - |
|
| Convertible Preferred Stocks | | | | |
Communication Services | 9,394,239 | - | - | 9,394,239 |
Consumer Discretionary | 365,595 | - | - | 365,595 |
Consumer Staples | 283,802 | - | - | 283,802 |
Financials | 1,760,811 | - | - | 1,760,811 |
Health Care | 2,326,968 | - | - | 2,326,968 |
Industrials | 141,191,712 | - | - | 141,191,712 |
Information Technology | 13,962,899 | - | - | 13,962,899 |
|
| Preferred Securities | | | | |
Consumer Discretionary | 196,585 | - | - | 196,585 |
|
| Money Market Funds | 535,853,326 | 535,853,326 | - | - |
| Total Investments in Securities: | 11,570,486,440 | 11,210,585,148 | 82,015,911 | 277,885,381 |
The following is a reconciliation of consolidated Investments in Securities for which Level 3 inputs were used in determining value. Beginning balances have been updated to conform to current period presentation, as applicable.
| |
| Investments in Securities: | |
| Beginning Balance | $ | 169,023,837 | |
| Net Realized Gain (Loss) on Investment Securities | | - | |
| Net Unrealized Gain (Loss) on Investment Securities | | 82,745,539 | |
| Cost of Purchases | | 30,195,297 | |
| Proceeds of Sales | | (2,095,695) | |
| Amortization/Accretion | | - | |
| Transfers into Level 3 | | - | |
| Transfers out of Level 3 | | (1,983,597) | |
| Ending Balance | $ | 277,885,381 | |
| The change in unrealized gain (loss) for the period attributable to Level 3 securities held at December 31, 2024 | $ | 81,730,291 | |
| The information used in the above reconciliation represents fiscal year to date activity for any Investments in Securities identified as using Level 3 inputs at either the beginning or the end of the current fiscal period. Cost of purchases and proceeds of sales may include securities received and/or delivered through in-kind transactions, corporate actions or exchanges. Transfers into Level 3 were attributable to a lack of observable market data resulting from decreases in market activity, decreases in liquidity, security restructurings or corporate actions. Transfers out of Level 3 were attributable to observable market data becoming available for those securities. Transfers in or out of Level 3 represent the beginning value of any Security or Instrument where a change in the pricing level occurred from the beginning to the end of the period. Realized and unrealized gains (losses) disclosed in the reconciliation are included in Net Gain (Loss) on the Fund's consolidated Statement of Operations. | |
Consolidated Financial Statements
| Consolidated Statement of Assets and Liabilities |
As of December 31, 2024 |
| Assets | | | | |
| Investment in securities, at value (including securities loaned of $18,071,736) - See accompanying schedule: | | | | |
Unaffiliated issuers (cost $4,094,906,532) | $ | 11,034,633,114 | | |
Fidelity Central Funds (cost $535,853,326) | | 535,853,326 | | |
| | | | | |
| | | | | |
| Total Investment in Securities (cost $4,630,759,858) | | | $ | 11,570,486,440 |
| Cash | | | | 8,128 |
| Foreign currency held at value (cost $28,042) | | | | 27,375 |
| Receivable for investments sold | | | | 4,687,099 |
| Receivable for fund shares sold | | | | 7,219 |
| Dividends receivable | | | | 2,746,878 |
| Distributions receivable from Fidelity Central Funds | | | | 1,233,611 |
| Other receivables | | | | 16 |
Total assets | | | | 11,579,196,766 |
| Liabilities | | | | |
| Payable for fund shares redeemed | $ | 295,493,762 | | |
| Other payables and accrued expenses | | 40,370 | | |
| Collateral on securities loaned | | 18,526,025 | | |
| Total liabilities | | | | 314,060,157 |
| Commitments and contingent liabilities (see Significant Accounting Policies note) | | | | |
| Net Assets | | | $ | 11,265,136,609 |
| Net Assets consist of: | | | | |
| Paid in capital | | | $ | 4,263,679,192 |
| Total accumulated earnings (loss) | | | | 7,001,457,417 |
| Net Assets | | | $ | 11,265,136,609 |
Net Asset Value, offering price and redemption price per share ($11,265,136,609 ÷ 465,690,504 shares) | | | $ | 24.19 |
| Consolidated Statement of Operations |
| Year ended December 31, 2024 |
| Investment Income | | | | |
| Dividends | | | $ | 64,377,090 |
| Income from Fidelity Central Funds (including $66,428 from security lending) | | | | 12,093,900 |
| Total income | | | | 76,470,990 |
| Expenses | | | | |
| Custodian fees and expenses | $ | 147,630 | | |
| Independent trustees' fees and expenses | | 46,142 | | |
| Miscellaneous | | 54 | | |
| Total expenses before reductions | | 193,826 | | |
| Expense reductions | | (6,096) | | |
| Total expenses after reductions | | | | 187,730 |
| Net Investment income (loss) | | | | 76,283,260 |
| Realized and Unrealized Gain (Loss) | | | | |
| Net realized gain (loss) on: | | | | |
| Investment Securities: | | | | |
| Unaffiliated issuers (net of foreign taxes of $90,459) | | 854,353,889 | | |
| Fidelity Central Funds | | (668) | | |
| Foreign currency transactions | | (69,926) | | |
| Total net realized gain (loss) | | | | 854,283,295 |
| Change in net unrealized appreciation (depreciation) on: | | | | |
| Investment Securities: | | | | |
| Unaffiliated issuers (net of decrease in deferred foreign taxes of $88,787) | | 2,343,970,829 | | |
| Unfunded commitments | | 102,665 | | |
| Assets and liabilities in foreign currencies | | (31,598) | | |
| Total change in net unrealized appreciation (depreciation) | | | | 2,344,041,896 |
| Net gain (loss) | | | | 3,198,325,191 |
| Net increase (decrease) in net assets resulting from operations | | | $ | 3,274,608,451 |
| Consolidated Statement of Changes in Net Assets |
| |
| | Year ended December 31, 2024 | | Year ended December 31, 2023 |
| Increase (Decrease) in Net Assets | | | | |
| Operations | | | | |
| Net investment income (loss) | $ | 76,283,260 | $ | 102,703,707 |
| Net realized gain (loss) | | 854,283,295 | | (9,905,289) |
| Change in net unrealized appreciation (depreciation) | | 2,344,041,896 | | 2,422,989,554 |
| Net increase (decrease) in net assets resulting from operations | | 3,274,608,451 | | 2,515,787,972 |
| Distributions to shareholders | | (718,744,210) | | (95,371,154) |
| | | | | |
| Share transactions | | | | |
| Proceeds from sales of shares | | 1,933,282,136 | | 874,791,955 |
| Reinvestment of distributions | | 718,744,208 | | 95,371,154 |
| Cost of shares redeemed | | (3,328,013,195) | | (2,073,553,948) |
| | | | | |
Net increase (decrease) in net assets resulting from share transactions | | (675,986,851) | | (1,103,390,839) |
| Total increase (decrease) in net assets | | 1,879,877,390 | | 1,317,025,979 |
| | | | | |
| Net Assets | | | | |
| Beginning of period | | 9,385,259,219 | | 8,068,233,240 |
| End of period | $ | 11,265,136,609 | $ | 9,385,259,219 |
| | | | | |
| Other Information | | | | |
| Shares | | | | |
| Sold | | 83,422,935 | | 53,382,549 |
| Issued in reinvestment of distributions | | 28,521,596 | | 5,254,609 |
| Redeemed | | (143,983,858) | | (124,634,354) |
| Net increase (decrease) | | (32,039,327) | | (65,997,196) |
| | | | | |
Consolidated Financial Highlights
Fidelity® Series Opportunistic Insights Fund |
| |
| Years ended December 31, | | 2024 | | 2023 | | 2022 | | 2021 | | 2020 |
Selected Per-Share Data | | | | | | | | | | |
| Net asset value, beginning of period | $ | 18.86 | $ | 14.31 | $ | 20.74 | $ | 20.25 | $ | 18.10 |
| Income from Investment Operations | | | | | | | | | | |
Net investment income (loss) A,B | | .16 | | .19 | | .20 | | .14 | | .12 |
| Net realized and unrealized gain (loss) | | 6.76 | | 4.55 | | (5.44) | | 4.79 | | 5.36 |
| Total from investment operations | | 6.92 | | 4.74 | | (5.24) | | 4.93 | | 5.48 |
| Distributions from net investment income | | (.18) | | (.19) | | (.18) | | (.20) | | (.16) |
| Distributions from net realized gain | | (1.42) | | - | | (1.00) | | (4.24) | | (3.18) |
| Total distributions | | (1.59) C | | (.19) | | (1.19) C | | (4.44) | | (3.33) C |
| Net asset value, end of period | $ | 24.19 | $ | 18.86 | $ | 14.31 | $ | 20.74 | $ | 20.25 |
Total Return D | | | | 33.20% | | (25.73)% | | 24.81% | | 31.18% |
Ratios to Average Net Assets B,E,F | | | | | | | | | | |
Expenses before reductions G | | -% | | -% | | -% | | -% | | -% |
Expenses net of fee waivers, if any G | | | | -% | | -% | | -% | | -% |
Expenses net of all reductions G | | -% | | -% | | -% | | -% | | -% |
| Net investment income (loss) | | .70% | | 1.17% | | 1.23% | | .61% | | .61% |
| Supplemental Data | | | | | | | | | | |
| Net assets, end of period (000 omitted) | $ | 11,265,137 | $ | 9,385,259 | $ | 8,068,233 | $ | 8,020,606 | $ | 7,673,290 |
Portfolio turnover rate H | | | | 29% | | 36% | | 43% | | 33% |
ACalculated based on average shares outstanding during the period.
BNet investment income (loss) is affected by the timing of the declaration of dividends by any underlying mutual funds or exchange-traded funds (ETFs). Net investment income (loss) of any mutual funds or ETFs is not included in the Fund's net investment income (loss) ratio.
CTotal distributions per share do not sum due to rounding.
DTotal returns would have been lower if certain expenses had not been reduced during the applicable periods shown.
EFees and expenses of any underlying mutual funds or exchange-traded funds (ETFs) are not included in the Fund's expense ratio. The Fund indirectly bears its proportionate share of these expenses. For additional expense information related to investments in Fidelity Central Funds, please refer to the "Investments in Fidelity Central Funds" note found in the Notes to Consolidated Financial Statements section of the most recent Annual or Semi-Annual report.
FExpense ratios reflect operating expenses of the class. Expenses before reductions do not reflect amounts reimbursed, waived, or reduced through arrangements with the investment adviser, brokerage services, or other offset arrangements, if applicable, and do not represent the amount paid by the class during periods when reimbursements, waivers or reductions occur.
GAmount represents less than .005%.
HAmount does not include the portfolio activity of any underlying mutual funds or exchange-traded funds (ETFs), derivatives or securities that mature within one year from acquisition.
Notes to Consolidated Financial Statements
For the period ended December 31, 2024
1. Organization.
Fidelity Series Opportunistic Insights Fund (the Fund) is a fund of Fidelity Contrafund (the Trust) and is authorized to issue an unlimited number of shares. Shares are offered only to certain other Fidelity funds, Fidelity managed 529 plans, and Fidelity managed collective investment trusts. The Trust is registered under the Investment Company Act of 1940, as amended (the 1940 Act), as an open-end management investment company organized as a Massachusetts business trust.
2. Investments in Fidelity Central Funds.
Funds may invest in Fidelity Central Funds, which are open-end investment companies generally available only to other investment companies and accounts managed by the investment adviser and its affiliates. The Consolidated Schedule of Investments lists any Fidelity Central Funds held as an investment as of period end, but does not include the underlying holdings of each Fidelity Central Fund. An investing fund indirectly bears its proportionate share of the expenses of the underlying Fidelity Central Funds.
Based on its investment objective, each Fidelity Central Fund may invest or participate in various investment vehicles or strategies that are similar to those of the investing fund. These strategies are consistent with the investment objectives of the investing fund and may involve certain economic risks which may cause a decline in value of each of the Fidelity Central Funds and thus a decline in the value of the investing fund.
| Fidelity Central Fund | Investment Manager | Investment Objective | Investment Practices | Expense RatioA |
| Fidelity Money Market Central Funds | Fidelity Management & Research Company LLC (FMR) | Each fund seeks to obtain a high level of current income consistent with the preservation of capital and liquidity. | Short-term Investments | Less than .005% |
A Expenses expressed as a percentage of average net assets and are as of each underlying Central Fund's most recent annual or semi-annual shareholder report.
A complete unaudited list of holdings for each Fidelity Central Fund is available upon request or at the Securities and Exchange Commission website at www.sec.gov. In addition, the financial statements of the Fidelity Central Funds which contain the significant accounting policies (including investment valuation policies) of those funds, and are not covered by the Report of Independent Registered Public Accounting Firm, are available on the Securities and Exchange Commission website or upon request.
3. Significant Accounting Policies.
The Fund is an investment company and applies the accounting and reporting guidance of the Financial Accounting Standards Board (FASB) Accounting Standards Codification Topic 946 Financial Services - Investment Companies. The consolidated financial statements have been prepared in conformity with accounting principles generally accepted in the United States of America (GAAP), which require management to make certain estimates and assumptions at the date of the consolidated financial statements. Actual results could differ from those estimates. The Fund operates as a single operating segment. The Fund's income, expenses, assets, and performance are regularly monitored and assessed as a whole by the investment adviser and other individuals responsible for oversight functions of the Trust, using the information presented in the financial statements and financial highlights. Subsequent events, if any, through the date that the consolidated financial statements were issued have been evaluated in the preparation of the consolidated financial statements. The Fund's Consolidated Schedule of Investments lists any underlying mutual funds or exchange-traded funds (ETFs) but does not include the underlying holdings of these funds. The following summarizes the significant accounting policies of the Fund:
Investment Valuation. Investments are valued as of 4:00 p.m. Eastern time on the last calendar day of the period. The Board of Trustees (the Board) has designated the Fund's investment adviser as the valuation designee responsible for the fair valuation function and performing fair value determinations as needed. The investment adviser has established a Fair Value Committee (the Committee) to carry out the day-to-day fair valuation responsibilities and has adopted policies and procedures to govern the fair valuation process and the activities of the Committee. In accordance with these fair valuation policies and procedures, which have been approved by the Board, the Fund attempts to obtain prices from one or more third party pricing services or brokers to value its investments. When current market prices, quotations or currency exchange rates are not readily available or reliable, investments will be fair valued in good faith by the Committee, in accordance with the policies and procedures. Factors used in determining fair value vary by investment type and may include market or investment specific events, transaction data, estimated cash flows, and market observations of comparable investments. The frequency that the fair valuation procedures are used cannot be predicted and they may be utilized to a significant extent. The Committee manages the Fund's fair valuation practices and maintains the fair valuation policies and procedures. The Fund's investment adviser reports to the Board information regarding the fair valuation process and related material matters.
The Fund categorizes the inputs to valuation techniques used to value its investments into a disclosure hierarchy consisting of three levels as shown below:
Level 1 - unadjusted quoted prices in active markets for identical investments
Level 2 - other significant observable inputs (including quoted prices for similar investments, interest rates, prepayment speeds, etc.)
Level 3 - unobservable inputs (including the Fund's own assumptions based on the best information available)
Valuation techniques used to value the Fund's investments by major category are as follows:
Equity securities, including restricted securities, for which market quotations are readily available, are valued at the last reported sale price or official closing price as reported by a third party pricing service on the primary market or exchange on which they are traded and are categorized as Level 1 in the hierarchy. In the event there were no sales during the day or closing prices are not available, securities are valued at the last quoted bid price or may be valued using the last available price and are generally categorized as Level 2 in the hierarchy. For foreign equity securities, when market or security specific events arise, comparisons to the valuation of American Depositary Receipts (ADRs), futures contracts, Exchange-Traded Funds (ETFs) and certain indexes as well as quoted prices for similar securities may be used and would be categorized as Level 2 in the hierarchy. For equity securities, including restricted securities, where observable inputs are limited, assumptions about market activity and risk are used and these securities may be categorized as Level 3 in the hierarchy. Securities, including private placements or other restricted securities, for which observable inputs are not available are valued using alternate valuation approaches, including the market approach, the income approach and cost approach, and are categorized as Level 3 in the hierarchy. The market approach considers factors including the price of recent investments in the same or a similar security or financial metrics of comparable securities. The income approach considers factors including expected future cash flows, security specific risks and corresponding discount rates. The cost approach considers factors including the value of the security's underlying assets and liabilities.
Debt securities, including restricted securities, are valued based on evaluated prices received from third party pricing services or from brokers who make markets in such securities. Preferred securities are valued by pricing services who utilize matrix pricing which considers yield or price of bonds of comparable quality, coupon, maturity and type or by broker-supplied prices. When independent prices are unavailable or unreliable, debt securities may be valued utilizing pricing methodologies which consider similar factors that would be used by third party pricing services. Debt securities are generally categorized as Level 2 in the hierarchy but may be Level 3 depending on the circumstances.
Investments in open-end mutual funds, including the Fidelity Central Funds, are valued at their closing net asset value (NAV) each business day and are categorized as Level 1 in the hierarchy.
The following provides information on Level 3 securities held by the Fund that were valued at period end based on unobservable inputs. These amounts exclude valuations provided by a broker.
| Asset Type | Fair Value | Valuation Technique(s) | Unobservable Input | Amount or Range/Weighted Average | Impact to Valuation from an Increase in InputA |
| Common Stocks | $108,402,770 | Market comparable | Enterprise value/Revenue multiple (EV/R) | 1.5 - 61.8 / 12.3 | Increase |
| | | | Enterprise value/EBITDA multiple (EV/EBITDA) | 21.3 - 33.4 / 31.2 | Increase |
| | | | Enterprise value/Net income multiple (EV/NI) | 14.0 | Increase |
| | | Recovery value | Recovery value | $0.00 - $0.17 / $0.13 | Increase |
| | | Black scholes | Discount rate | 4.3% - 4.4% / 4.4% | Increase |
| | | | Term | 1.0 - 5.0 / 2.2 | Increase |
| | | | Volatility | 60.0% - 100.0% / 60.4% | Increase |
| Convertible Preferred Stocks | $169,286,026 | Market comparable | Enterprise value/Revenue multiple (EV/R) | 0.9 - 61.8 / 26.2 | Increase |
| | | | Enterprise value/EBITDA multiple (EV/EBITDA) | 33.4 | Increase |
| | | Market approach | Transaction price | $20.85 | Increase |
| | | | Discount rate | 85.0% | Decrease |
| | | Recovery value | Recovery value | $0.00 | Increase |
| | | Black scholes | Discount rate | 4.3% - 4.4% / 4.3% | Increase |
| | | | Term | 2.0 - 5.0 / 2.7 | Increase |
| | | | Volatility | 60.0% - 80.0% / 77.2% | Increase |
| Preferred Securities | $196,585 | Market comparable | Enterprise value/Revenue multiple (EV/R) | 1.5 | Increase |
| | | Recovery value | Recovery value | $0.00 | Increase |
| | | Black scholes | Discount rate | 4.4% | Increase |
| | | | Term | 2.1 | Increase |
| | | | Volatility | 60.0% | Increase |
| | | | | | |
A Represents the directional change in the fair value of the Level 3 investments that could have resulted from an increase in the corresponding input as of period end. A decrease to the unobservable input would have had the opposite effect. Significant changes in these inputs may have resulted in a significantly higher or lower fair value measurement at period end.
Changes in valuation techniques may result in transfers in or out of an assigned level within the disclosure hierarchy. The aggregate value of investments by input level as of December 31, 2024, as well as a roll forward of Level 3 investments, is included at the end of the Fund's Consolidated Schedule of Investments.
Foreign Currency. Certain Funds may use foreign currency contracts to facilitate transactions in foreign-denominated securities. Gains and losses from these transactions may arise from changes in the value of the foreign currency or if the counterparties do not perform under the contracts' terms.
Foreign-denominated assets, including investment securities, and liabilities are translated into U.S. dollars at the exchange rates at period end. Purchases and sales of investment securities, income and dividends received, and expenses denominated in foreign currencies are translated into U.S. dollars at the exchange rate in effect on the transaction date.
The effects of exchange rate fluctuations on investments are included with the net realized and unrealized gain (loss) on investment securities. Other foreign currency transactions resulting in realized and unrealized gain (loss) are disclosed separately.
Investment Transactions and Income. For financial reporting purposes, the Fund's investment holdings and NAV include trades executed through the end of the last business day of the period. The NAV per share for processing shareholder transactions is calculated as of the close of business of the New York Stock Exchange (NYSE), normally 4:00 p.m. Eastern time and includes trades executed through the end of the prior business day. Gains and losses on securities sold are determined on the basis of identified cost and include proceeds received from litigation. Commissions paid to certain brokers with whom the investment adviser, or its affiliates, places trades on behalf of a fund include an amount in addition to trade execution, which may be rebated back to a fund. Any such rebates are included in net realized gain (loss) on investments in the Consolidated Statement of Operations. Dividend income is recorded on the ex-dividend date, except for certain dividends from foreign securities where the ex-dividend date may have passed, which are recorded as soon as the Fund is informed of the ex-dividend date. Non-cash dividends included in dividend income, if any, are recorded at the fair market value of the securities received. Income and capital gain distributions from Fidelity Central Funds, if any, are recorded on the ex-dividend date. Certain distributions received by the Fund represent a return of capital or capital gain. The Fund determines the components of these distributions subsequent to the ex-dividend date, based upon receipt of tax filings or other correspondence relating to the underlying investment. These distributions are recorded as a reduction of cost of investments and/or as a realized gain. Investment income is recorded net of foreign taxes withheld where recovery of such taxes is uncertain. Funds may file withholding tax reclaims in certain jurisdictions to recover a portion of amounts previously withheld. Any withholding tax reclaims income is included in the Consolidated Statement of Operations in dividends. Any receivables for withholding tax reclaims are included in the Consolidated Statement of Assets and Liabilities in dividends receivable.
Expenses. Expenses directly attributable to a fund are charged to that fund. Expenses attributable to more than one fund are allocated among the respective funds on the basis of relative net assets or other appropriate methods. Expenses included in the accompanying consolidated financial statements reflect the expenses of that fund and do not include any expenses associated with any underlying mutual funds or exchange-traded funds. Although not included in a fund's expenses, a fund indirectly bears its proportionate share of these expenses through the net asset value of each underlying mutual fund or exchange-traded fund. Expense estimates are accrued in the period to which they relate and adjustments are made when actual amounts are known.
Income Tax Information and Distributions to Shareholders. Each year, the Fund intends to qualify as a regulated investment company under Subchapter M of the Internal Revenue Code, including distributing substantially all of its taxable income and realized gains. As a result, no provision for U.S. Federal income taxes is required. As of December 31, 2024, the Fund did not have any unrecognized tax benefits in the consolidated financial statements; nor is the Fund aware of any tax positions for which it is reasonably possible that the total amounts of unrecognized tax benefits will significantly change in the next twelve months. The Fund files a U.S. federal tax return, in addition to state and local tax returns as required. The Fund's federal income tax returns are subject to examination by the Internal Revenue Service (IRS) for a period of three fiscal years after they are filed. State and local tax returns may be subject to examination for an additional fiscal year depending on the jurisdiction. Foreign taxes are provided for based on the Fund's understanding of the tax rules and rates that exist in the foreign markets in which it invests. The Fund is subject to a tax imposed on capital gains by certain countries in which it invests.
Distributions are declared and recorded on the ex-dividend date. Income and capital gain distributions are determined in accordance with income tax regulations, which may differ from GAAP. The Fund claimed a portion of the payment made to redeeming shareholders as a distribution for income tax purposes.
Capital accounts within the consolidated financial statements are adjusted for permanent book-tax differences. These adjustments have no impact on net assets or the results of operations. Capital accounts are not adjusted for temporary book-tax differences which will reverse in a subsequent period.
Book-tax differences are primarily due to foreign currency transactions, certain foreign taxes, passive foreign investment companies (PFIC), partnerships, capital loss carryforwards and losses deferred due to wash sales.
As of period end, the cost and unrealized appreciation (depreciation) in securities, and derivatives if applicable, for federal income tax purposes were as follows:
| Gross unrealized appreciation | $7,014,581,426 |
| Gross unrealized depreciation | (106,211,159) |
| Net unrealized appreciation (depreciation) | $6,908,370,267 |
| Tax Cost | $4,662,116,173 |
The tax-based components of distributable earnings as of period end were as follows:
| Undistributed long-term capital gain | $93,109,955 |
| Net unrealized appreciation (depreciation) on securities and other investments | $6,908,347,464 |
The tax character of distributions paid was as follows:
| | December 31, 2024 | December 31, 2023 |
| Ordinary Income | $79,107,068 | $95,371,154 |
| Long-term Capital Gains | 639,637,142 | - |
| Total | $718,744,210 | $95,371,154 |
Restricted Securities (including Private Placements). Funds may invest in securities that are subject to legal or contractual restrictions on resale. These securities generally may be resold in transactions exempt from registration or to the public if the securities are registered. Disposal of these securities may involve time-consuming negotiations and expense, and prompt sale at an acceptable price may be difficult. Information regarding restricted securities held at period end is included at the end of the Consolidated Schedule of Investments, if applicable.
Commitments. A commitment is an agreement to acquire an investment at a future date (subject to conditions) in connection with a potential public or non-public offering. Commitments outstanding at period end are presented in the table below. Unrealized appreciation (depreciation) on any commitments outstanding at period end is separately presented in the Consolidated Statement of Assets and Liabilities as Unrealized appreciation (depreciation) on unfunded commitments, and any change in unrealized appreciation (depreciation) on unfunded commitments during the period is separately presented in the Consolidated Statement of Operations, as applicable based on contractual conditions of each commitment.
| | Investment to be Acquired | Commitment Amount ($) | Unrealized Appreciation (Depreciation)($) |
| Fidelity Series Opportunistic Insights Fund | Space Exploration Technologies Corp. Class A | 41,070 | - |
| Fidelity Series Opportunistic Insights Fund | Space Exploration Technologies Corp. Class C | 902,430 | - |
Special Purpose Acquisition Companies. Funds may invest in stock, warrants, and other securities of special purpose acquisition companies (SPACs) or similar special purpose entities. A SPAC is a publicly traded company that raises investment capital via an initial public offering (IPO) for the purpose of acquiring the equity securities of one or more existing companies via merger, business combination, acquisition or other similar transactions within a designated time frame.
Private Investment in Public Equity. Funds may acquire equity securities of an issuer through a private investment in a public equity (PIPE) transaction, including through commitments to purchase securities on a when-issued basis. A PIPE typically involves the purchase of securities directly from a publicly traded company in a private placement transaction. Securities purchased through PIPE transactions will be restricted from trading and considered illiquid until a resale registration statement for the shares is filed and declared effective.
At the current and/or prior period end, the Fund had commitments to purchase when-issued securities through PIPE transactions with SPACs. The commitments are contingent upon the SPACs acquiring the securities of target companies. Unrealized appreciation (depreciation) on any commitments outstanding at period end is separately presented in the Consolidated Statement of Assets and Liabilities as Unrealized appreciation (depreciation) on unfunded commitments, and any change in unrealized appreciation (depreciation) on unfunded commitments during the period is separately presented in the Consolidated Statement of Operations, as applicable.
Consolidated Subsidiary. The Funds included in the table below hold certain investments through a wholly-owned subsidiary ("Subsidiary"), which may be subject to federal and state taxes upon disposition.
As of period end, investments in Subsidiaries were as follows:
| | Amount ($) | % of Net Assets |
| Fidelity Series Opportunistic Insights Fund | 11,420,697 | .10 |
The financial statements have been consolidated to include the Subsidiary accounts where applicable. Accordingly, all inter-company transactions and balances have been eliminated.
At period end, any estimated tax liability for these investments is presented as "Deferred taxes" in the Consolidated Statement of Assets and Liabilities and included in "Change in net unrealized appreciation (depreciation) on investment securities" in the Consolidated Statement of Operations. The tax liability incurred may differ materially depending on conditions when these investments are disposed. Any cash held by a Subsidiary is restricted as to its use and is presented as "Restricted cash" in the Consolidated Statement of Assets and Liabilities, if applicable.
New Accounting Pronouncement. FASB Accounting Standards Update (ASU) 2023-07 Segment Reporting (Topic 280): Improvements to Reportable Segment Disclosures became effective in this reporting period. ASU 2023-07 enhances segment information disclosure in the notes to financial statements.
4. Purchases and Sales of Investments.
Purchases and sales of securities, other than short-term securities and in-kind transactions, as applicable, are noted in the table below.
| | Purchases ($) | Sales ($) |
| Fidelity Series Opportunistic Insights Fund | 2,465,022,672 | 3,777,908,890 |
5. Fees and Other Transactions with Affiliates.
Management Fee. Fidelity Management & Research Company LLC (the investment adviser) and its affiliates provide the Fund with investment management related services for which the Fund does not pay a management fee. Under the management contract, the investment adviser or an affiliate pays all ordinary operating expenses of the Fund, except custody fees, fees and expenses of the independent Trustees, and certain miscellaneous expenses such as proxy and shareholder meeting expenses.
Brokerage Commissions. A portion of portfolio transactions were placed with brokerage firms which are affiliates of the investment adviser. Brokerage commissions are included in net realized gain (loss) and change in net unrealized appreciation (depreciation) in the Consolidated Statement of Operations. The commissions paid to these affiliated firms were as follows:
| | Amount ($) |
| Fidelity Series Opportunistic Insights Fund | 37,869 |
Interfund Trades. Funds may purchase from or sell securities to other Fidelity Funds under procedures adopted by the Board. The procedures have been designed to ensure these interfund trades are executed in accordance with Rule 17a-7 of the 1940 Act. Any interfund trades are included within the respective purchases and sales amounts shown in the Purchases and Sales of Investments note. Interfund trades during the period are noted in the table below.
| | Purchases ($) | Sales ($) | Realized Gain (Loss) ($) |
| Fidelity Series Opportunistic Insights Fund | 99,323,105 | 223,597,853 | 71,050,177 |
Sub-Advisory Arrangements. Effective March 1, 2024, the Fund's sub-advisory agreements with FMR Investment Management (UK) Limited, Fidelity Management & Research (Hong Kong) Limited, and Fidelity Management & Research (Japan) Limited were amended to provide that the investment adviser pays each sub-adviser monthly fees equal to 110% of the sub-adviser's costs for providing sub-advisory services.
6. Committed Line of Credit.
Certain Funds participate with other funds managed by the investment adviser or an affiliate in a $4.25 billion credit facility (the "line of credit") to be utilized for temporary or emergency purposes to fund shareholder redemptions or for other short-term liquidity purposes.
Commitment fees are charged based on the unused amount of the line of credit at an annual rate of .10%, and then allocated to each participating fund based on its pro-rata portion of the line of credit. The commitment fees are borne by the investment adviser.
Interest is charged to a participating fund based on its borrowings at an annual rate of .75% plus the highest of (i) daily SOFR plus a .10% spread adjustment, (ii) Federal Funds Effective Rate, or (iii) Overnight Bank Funding Rate. During the period, there were no borrowings on this line of credit.
The line of credit agreement will expire in March 2025 unless extended or renewed.
7. Security Lending.
Funds lend portfolio securities from time to time in order to earn additional income. Lending agents are used, including National Financial Services (NFS), an affiliate of the investment adviser. Pursuant to a securities lending agreement, NFS will receive a fee, which is capped at 9.9% of a fund's daily lending revenue, for its services as lending agent. A fund may lend securities to certain qualified borrowers, including NFS. On the settlement date of the loan, a fund receives collateral (in the form of U.S. Treasury obligations, letters of credit and/or cash) against the loaned securities and maintains collateral in an amount not less than 100% of the market value of the loaned securities during the period of the loan. The market value of the loaned securities is determined at the close of business of a fund and any additional required collateral is delivered to a fund on the next business day. A fund or borrower may terminate the loan at any time, and if the borrower defaults on its obligation to return the securities loaned because of insolvency or other reasons, a fund may apply collateral received from the borrower against the obligation. A fund may experience delays and costs in recovering the securities loaned. Any cash collateral received is invested in the Fidelity Securities Lending Cash Central Fund. Any loaned securities are identified as such in the Consolidated Schedule of Investments, and the value of loaned securities and cash collateral at period end, as applicable, are presented in the Consolidated Statement of Assets and Liabilities. Security lending income represents the income earned on investing cash collateral, less rebates paid to borrowers and any lending agent fees associated with the loan, plus any premium payments received for lending certain types of securities. Security lending income is presented in the Consolidated Statement of Operations as a component of income from Fidelity Central Funds. Affiliated security lending activity, if any, was as follows:
| | Total Security Lending Fees Paid to NFS ($) | Security Lending Income From Securities Loaned to NFS ($) | Value of Securities Loaned to NFS at Period End ($) |
| Fidelity Series Opportunistic Insights Fund | 6,875 | - | - |
8. Expense Reductions.
Through arrangements with the Fund's custodian, credits realized as a result of certain uninvested cash balances were used to reduce the Fund's expenses by $6,096.
9. Other.
A fund's organizational documents provide former and current trustees and officers with a limited indemnification against liabilities arising in connection with the performance of their duties to the fund. In the normal course of business, a fund may also enter into contracts that provide general indemnifications. A fund's maximum exposure under these arrangements is unknown as this would be dependent on future claims that may be made against a fund. The risk of material loss from such claims is considered remote.
At the end of the period, mutual funds and accounts managed by FMR or its affiliates were the owners of record of all of the outstanding shares of the Fund.
10. Risk and Uncertainties.
Many factors affect a fund's performance. Developments that disrupt global economies and financial markets, such as pandemics, epidemics, outbreaks of infectious diseases, war, terrorism, and environmental disasters, may significantly affect a fund's investment performance. The effects of these developments to a fund will be impacted by the types of securities in which a fund invests, the financial condition, industry, economic sector, and geographic location of an issuer, and a fund's level of investment in the securities of that issuer. Significant concentrations in security types, issuers, industries, sectors, and geographic locations may magnify the factors that affect a fund's performance.
Report of Independent Registered Public Accounting Firm
To the Board of Trustees of Fidelity Contrafund and Shareholders of Fidelity Series Opportunistic Insights Fund
Opinion on the Financial Statements
We have audited the accompanying consolidated statement of assets and liabilities, including the consolidated schedule of investments, of Fidelity Series Opportunistic Insights Fund and its subsidiaries (one of the funds constituting Fidelity Contrafund, referred to hereafter as the "Fund") as of December 31, 2024, the related consolidated statement of operations for the year ended December 31, 2024, the consolidated statement of changes in net assets for each of the two years in the period ended December 31, 2024, including the related notes, and the consolidated financial highlights for each of the five years in the period ended December 31, 2024 (collectively referred to as the "consolidated financial statements"). In our opinion, the consolidated financial statements present fairly, in all material respects, the financial position of the Fund as of December 31, 2024, the results of its operations for the year then ended, the changes in its net assets for each of the two years in the period ended December 31, 2024 and the financial highlights for each of the five years in the period ended December 31, 2024 in conformity with accounting principles generally accepted in the United States of America.
Basis for Opinion
These consolidated financial statements are the responsibility of the Fund's management. Our responsibility is to express an opinion on the Fund's consolidated financial statements based on our audits. We are a public accounting firm registered with the Public Company Accounting Oversight Board (United States) (PCAOB) and are required to be independent with respect to the Fund in accordance with the U.S. federal securities laws and the applicable rules and regulations of the Securities and Exchange Commission and the PCAOB.
We conducted our audits of these consolidated financial statements in accordance with the standards of the PCAOB. Those standards require that we plan and perform the audit to obtain reasonable assurance about whether the consolidated financial statements are free of material misstatement, whether due to error or fraud.
Our audits included performing procedures to assess the risks of material misstatement of the consolidated financial statements, whether due to error or fraud, and performing procedures that respond to those risks. Such procedures included examining, on a test basis, evidence regarding the amounts and disclosures in the consolidated financial statements. Our audits also included evaluating the accounting principles used and significant estimates made by management, as well as evaluating the overall presentation of the consolidated financial statements. Our procedures included confirmation of securities owned as of December 31, 2024 by correspondence with the custodian, issuers of privately offered securities and brokers. We believe that our audits provide a reasonable basis for our opinion.
/s/ PricewaterhouseCoopers LLP
Boston, Massachusetts
February 13, 2025
We have served as the auditor of one or more investment companies in the Fidelity group of funds since 1932.
Distributions
(Unaudited)
The dividend and capital gains distributions for the fund(s) are available on Fidelity.com or Institutional.Fidelity.com.
The fund hereby designates as a capital gain dividend with respect to the taxable year ended December 31, 2024, $826,123,454, or, if subsequently determined to be different, the net capital gain of such year.
The fund designates $12,000,229 of distributions paid during the fiscal year ended 2024 as qualifying to be taxed as section 163(j) interest dividends.
The fund designates 66% of the dividends distributed during the fiscal year as qualifying for the dividends-received deduction for corporate shareholders.
The fund designates 81.31% of the dividend distributed during the fiscal year as amounts which may be taken into account as a dividend for the purposes of the maximum rate under section 1(h)(11) of the Internal Revenue Code.
The fund will notify shareholders in January 2025 of amounts for use in preparing 2024 income tax returns.
Item 8: Changes in and Disagreements with Accountants for Open-End Management Investment Companies
(Unaudited)
Note: This is not applicable for any fund included in this document.
Item 9: Proxy Disclosures for Open-End Management Investment Companies
(Unaudited)
| A special meeting of shareholders was held on July 16, 2024. The results of votes taken among shareholders on the proposal before them are reported below. Each vote reported represents one dollar of net asset value held on the record date for the meeting. |
| Proposal 1 |
| To elect a Board of Trustees. |
| | # of Votes | % of Votes |
| Bettina Doulton |
| Affirmative | 107,413,165,703.86 | 95.45 |
| Withheld | 5,115,205,734.52 | 4.55 |
| TOTAL | 112,528,371,438.38 | 100.00 |
| Robert A. Lawrence |
| Affirmative | 106,925,132,614.87 | 95.02 |
| Withheld | 5,603,238,823.51 | 4.98 |
| TOTAL | 112,528,371,438.38 | 100.00 |
| Vijay C. Advani |
| Affirmative | 106,908,299,345.67 | 95.01 |
| Withheld | 5,620,072,092.71 | 4.99 |
| TOTAL | 112,528,371,438.38 | 100.00 |
| Thomas P. Bostick |
| Affirmative | 107,023,189,484.37 | 95.11 |
| Withheld | 5,505,181,954.01 | 4.89 |
| TOTAL | 112,528,371,438.38 | 100.00 |
| Donald F. Donahue |
| Affirmative | 107,148,439,746.95 | 95.22 |
| Withheld | 5,379,931,691.43 | 4.78 |
| TOTAL | 112,528,371,438.38 | 100.00 |
| Vicki L. Fuller |
| Affirmative | 107,159,480,594.93 | 95.23 |
| Withheld | 5,368,890,843.45 | 4.77 |
| TOTAL | 112,528,371,438.38 | 100.00 |
| Patricia L. Kampling |
| Affirmative | 107,220,897,546.66 | 95.28 |
| Withheld | 5,307,473,891.72 | 4.72 |
| TOTAL | 112,528,371,438.38 | 100.00 |
| Thomas A. Kennedy |
| Affirmative | 107,004,892,718.66 | 95.09 |
| Withheld | 5,523,478,719.73 | 4.91 |
| TOTAL | 112,528,371,438.38 | 100.00 |
| Oscar Munoz |
| Affirmative | 106,701,787,976.15 | 94.82 |
| Withheld | 5,826,583,462.23 | 5.18 |
| TOTAL | 112,528,371,438.38 | 100.00 |
| Karen B. Peetz |
| Affirmative | 107,369,162,431.54 | 95.42 |
| Withheld | 5,159,209,006.84 | 4.58 |
| TOTAL | 112,528,371,438.38 | 100.00 |
| David M. Thomas |
| Affirmative | 106,815,962,138.16 | 94.92 |
| Withheld | 5,712,409,300.22 | 5.08 |
| TOTAL | 112,528,371,438.38 | 100.00 |
| Susan Tomasky |
| Affirmative | 107,029,000,908.81 | 95.11 |
| Withheld | 5,499,370,529.58 | 4.89 |
| TOTAL | 112,528,371,438.38 | 100.00 |
| Michael E. Wiley |
| Affirmative | 106,863,215,681.69 | 94.97 |
| Withheld | 5,665,155,756.69 | 5.03 |
| TOTAL | 112,528,371,438.38 | 100.00 |
| | | |
| Proposal 1 reflects trust-wide proposal and voting results. |
Item 10: Remuneration Paid to Directors, Officers, and others of Open-End Management Investment Companies
(Unaudited)
Note: This information is disclosed as part of the consolidated financial statements for each Fund as part of Item 7: Consolidated Financial Statements and Consolidated Financial Highlights for Open-End Management Investment companies.
Item 11: Statement Regarding Basis for Approval of Investment Advisory Contract
(Unaudited)
Note: This is not applicable for any fund included in this document.
1.951052.112
O1T-ANN-0325
Item 8.
Changes in and Disagreements with Accountants for Open-End Management Investment Companies
See Item 7.
Item 9.
Proxy Disclosures for Open-End Management Investment Companies
See Item 7.
Item 10.
Remuneration Paid to Directors, Officers, and Others of Open-End Management Investment Companies
See Item 7.
Item 11.
Statement Regarding Basis for Approval of Investment Advisory Contract
See Item 7.
Item 12.
Disclosure of Proxy Voting Policies and Procedures for Closed-End Management Investment Companies
Not applicable.
Item 13.
Portfolio Managers of Closed-End Management Investment Companies
Not applicable.
Item 14.
Purchase of Equity Securities by Closed-End Management Investment Company and Affiliated Purchasers
Not applicable.
Item 15.
Submission of Matters to a Vote of Security Holders
There were no material changes to the procedures by which shareholders may recommend nominees to the trust’s Board of Trustees.
Item 16.
Controls and Procedures
(a)(i) The President and Treasurer and the Chief Financial Officer have concluded that the trust’s disclosure controls and procedures (as defined in Rule 30a-3(c) under the Investment Company Act) provide reasonable assurances that material information relating to the trust is made known to them by the appropriate persons, based on their evaluation of these controls and procedures as of a date within 90 days of the filing date of this report.
(a)(ii) There was no change in the trust’s internal control over financial reporting (as defined in Rule 30a-3(d) under the Investment Company Act) that occurred during the period covered by this report that has materially affected, or is reasonably likely to materially affect, the trust’s internal control over financial reporting.
Item 17.
Disclosure of Securities Lending Activities for Closed-End Management Investment Companies
Not applicable.
Item 18.
Recovery of Erroneously Awarded Compensation
(a)
Not applicable.
(b)
Not applicable.
Item 19.
Exhibits
SIGNATURES
Pursuant to the requirements of the Securities Exchange Act of 1934 and the Investment Company Act of 1940, the registrant has duly caused this report to be signed on its behalf by the undersigned, thereunto duly authorized.
Fidelity Contrafund
|
By: | /s/Stacie M. Smith |
| Stacie M. Smith |
| President and Treasurer (Principal Executive Officer) |
|
|
Date: | February 21, 2025 |
Pursuant to the requirements of the Securities Exchange Act of 1934 and the Investment Company Act of 1940, this report has been signed below by the following persons on behalf of the registrant and in the capacities and on the dates indicated.
|
By: | /s/Stacie M. Smith |
| Stacie M. Smith |
| President and Treasurer (Principal Executive Officer) |
|
|
Date: | February 21, 2025 |
|
By: | /s/Stephanie Caron |
| Stephanie Caron |
| Chief Financial Officer (Principal Financial Officer) |
|
|
Date: | February 21, 2025 |