March 3, 2014
Safe Harbor Statement T his presentation contains what the Company believes are forward - looking statements related to future financial results and business operations for Cooper Tire & Rubber Company. Actual results may differ materially from current management forecasts and projections as a result of factors over which the Company may have limited or no control. Information on certain of these risk factors and additional information on forward - looking statements are included in the Company’s reports on file with the Securities and Exchange Commission and set forth at the end of this presentation. 2
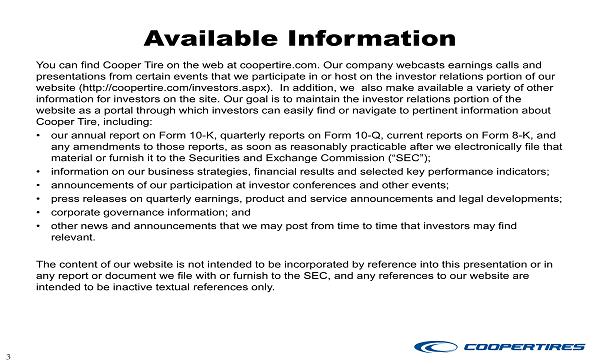
Available Information You can find Cooper Tire on the web at coopertire.com. Our company webcasts earnings calls and presentations from certain events that we participate in or host on the investor relations portion of our website (http://coopertire.com/investors.aspx). In addition, we also make available a variety of other information for investors on the site. Our goal is to maintain the investor relations portion of the website as a portal through which investors can easily find or navigate to pertinent information about Cooper Tire, including: • our annual report on Form 10 - K, quarterly reports on Form 10 - Q, current reports on Form 8 - K, and any amendments to those reports, as soon as reasonably practicable after we electronically file that material or furnish it to the Securities and Exchange Commission (“SEC”); • information on our business strategies, financial results and selected key performance indicators; • announcements of our participation at investor conferences and other events; • press releases on quarterly earnings, product and service announcements and legal developments; • corporate governance information; and • other news and announcements that we may post from time to time that investors may find relevant. The content of our website is not intended to be incorporated by reference into this presentation or in any report or document we file with or furnish to the SEC, and any references to our website are intended to be inactive textual references only. 3
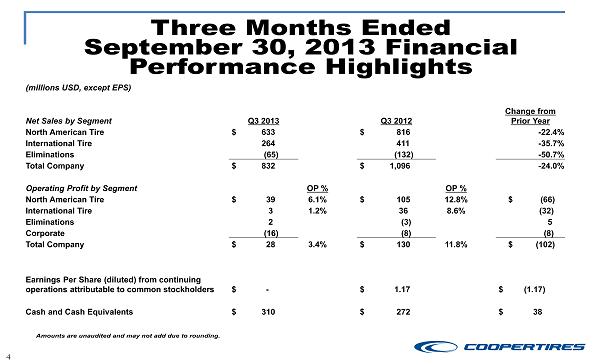
Three Months Ended September 30, 2013 Financial Performance Highlights 4 Amounts are unaudited and may not add due to rounding. (millions USD, except EPS) Net Sales by Segment Q3 2013 Q3 2012 Change from Prior Year North American Tire $ 633 $ 816 - 22.4% International Tire 264 411 - 35.7% Eliminations (65) (132) - 50.7% Total Company $ 832 $ 1,096 - 24.0% Operating Profit by Segment OP % OP % North American Tire $ 39 6.1% $ 105 12.8% $ (66) International Tire 3 1.2% 36 8.6% (32) Eliminations 2 (3) 5 Corporate (16) (8) (8) Total Company $ 28 3.4% $ 130 11.8% $ (102) Earnings Per Share (diluted) from continuing operations attributable to common stockholders $ - $ 1.17 $ (1.17) Cash and Cash Equivalents $ 310 $ 272 $ 38
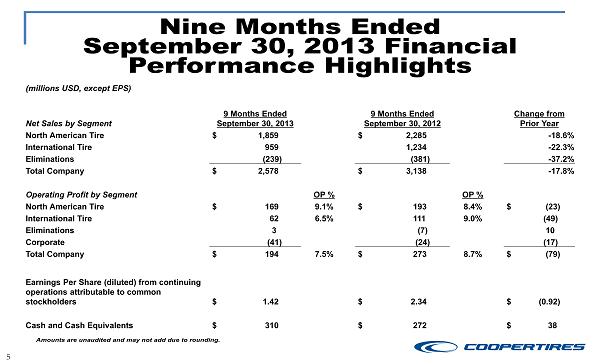
Nine Months Ended September 30, 2013 Financial Performance Highlights 5 Amounts are unaudited and may not add due to rounding. (millions USD, except EPS) Net Sales by Segment 9 Months Ended September 30, 2013 9 Months Ended September 30, 2012 Change from Prior Year North American Tire $ 1,859 $ 2,285 - 18.6% International Tire 959 1,234 - 22.3% Eliminations (239) (381) - 37.2% Total Company $ 2,578 $ 3,138 - 17.8% Operating Profit by Segment OP % OP % North American Tire $ 169 9.1% $ 193 8.4% $ (23) International Tire 62 6.5% 111 9.0% (49) Eliminations 3 (7) 10 Corporate (41) (24) (17) Total Company $ 194 7.5% $ 273 8.7% $ (79) Earnings Per Share (diluted) from continuing operations attributable to common stockholders $ 1.42 $ 2.34 $ (0.92) Cash and Cash Equivalents $ 310 $ 272 $ 38
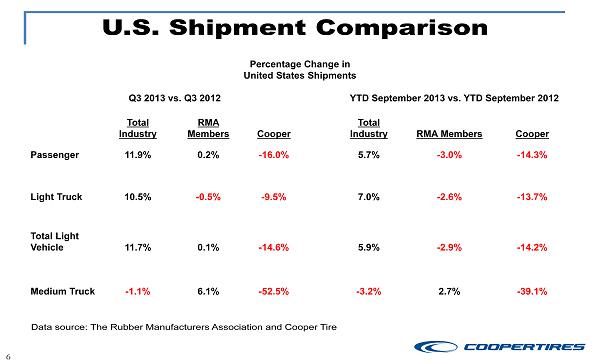
U.S. Shipment Comparison 6 Data source: The Rubber Manufacturers Association and Cooper Tire Percentage Change in United States Shipments Q3 2013 vs. Q3 2012 YTD September 2013 vs. YTD September 2012 Total Industry RMA Members Cooper Total Industry RMA Members Cooper Passenger 11.9% 0.2% - 16.0% 5.7% - 3.0% - 14.3% Light Truck 10.5% - 0.5% - 9.5% 7.0% - 2.6% - 13.7% Total Light Vehicle 11.7% 0.1% - 14.6% 5.9% - 2.9% - 14.2% Medium Truck - 1.1% 6.1% - 52.5% - 3.2% 2.7% - 39.1%
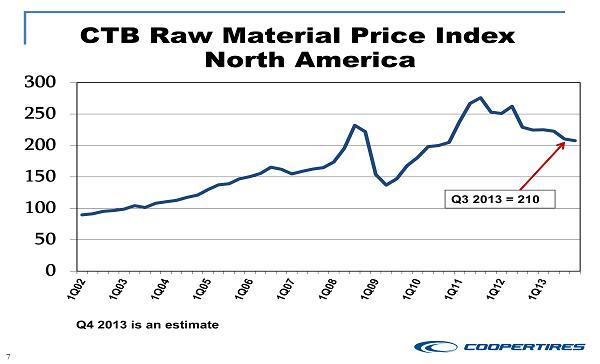
7 CTB Raw Material Price Index North America 0 50 100 150 200 250 300 Q3 2013 = 210 Q4 2013 is an estimate
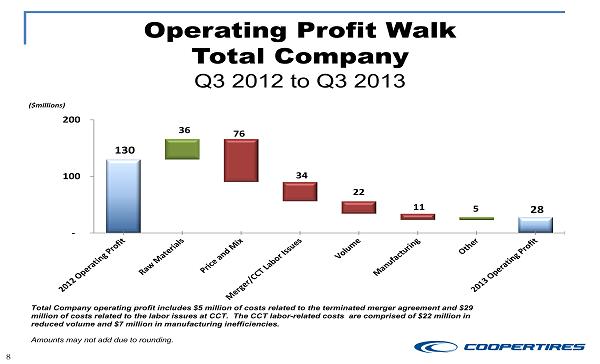
Operating Profit Walk Total Company Q3 2012 to Q3 2013 Amounts may not add due to rounding. 8 36 5 130 28 76 34 22 11 - 100 200 ($millions) ($millions) Total Company operating profit includes $5 million of costs related to the terminated merger agreement and $29 million of costs related to the labor issues at CCT . The CCT labor - related costs are comprised of $22 million in reduced volume and $7 million in manufacturing inefficiencies.
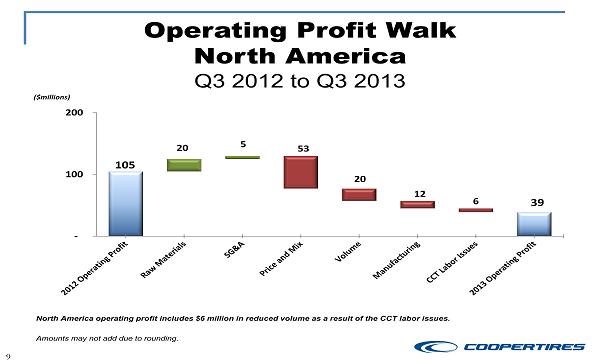
Operating Profit Walk North America Q3 2012 to Q3 2013 Amounts may not add due to rounding. 9 20 5 105 39 53 20 12 6 - 100 200 ($millions) ($millions) North America operating profit includes $6 million in reduced volume as a result of the CCT labor issues.
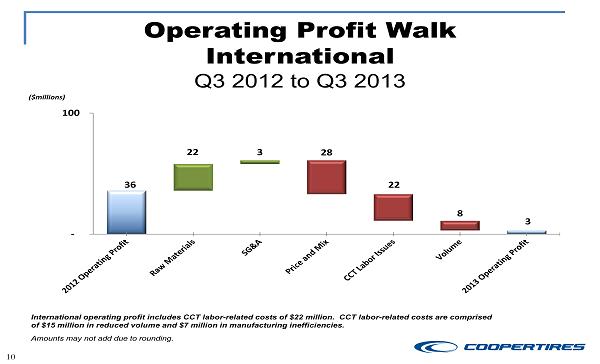
Operating Profit Walk International Q3 2012 to Q3 2013 Amounts may not add due to rounding. 10 22 3 36 3 28 22 8 - 100 ($millions) ($millions) International operating profit includes CCT labor - related costs of $ 22 million. CCT labor - related costs are comprised of $15 million in reduced volume and $7 million in manufacturing inefficiencies.
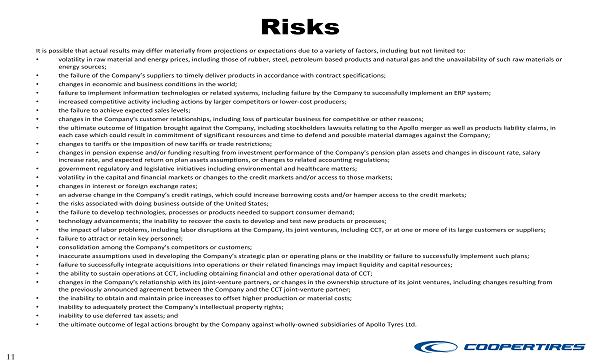
Risks It is possible that actual results may differ materially from projections or expectations due to a variety of factors, includ ing but not limited to: • volatility in raw material and energy prices, including those of rubber, steel, petroleum based products and natural gas and the unavailability of such raw materials or energy sources; • the failure of the Company’s suppliers to timely deliver products in accordance with contract specifications; • changes in economic and business conditions in the world; • failure to implement information technologies or related systems, including failure by the Company to successfully implement an ERP s yst em; • increased competitive activity including actions by larger competitors or lower - cost producers; • the failure to achieve expected sales levels; • changes in the Company’s customer relationships, including loss of particular business for competitive or other reasons; • the ultimate outcome of litigation brought against the Company, including stockholders lawsuits relating to the Apollo merger as wel l as products liability claims, in each case which could result in commitment of significant resources and time to defend and possible material damages against the C omp any; • changes to tariffs or the imposition of new tariffs or trade restrictions; • changes in pension expense and/or funding resulting from investment performance of the Company’s pension plan assets and changes in d isc ount rate, salary increase rate, and expected return on plan assets assumptions, or changes to related accounting regulations; • government regulatory and legislative initiatives including environmental and healthcare matters; • volatility in the capital and financial markets or changes to the credit markets and/or access to those markets; • changes in interest or foreign exchange rates; • an adverse change in the Company’s credit ratings, which could increase borrowing costs and/or hamper access to the credit marke ts; • the risks associated with doing business outside of the United States; • the failure to develop technologies, processes or products needed to support consumer demand; • technology advancements; the inability to recover the costs to develop and test new products or processes; • the impact of labor problems, including labor disruptions at the Company, its joint ventures, including CCT, or at one or more of it s large customers or suppliers; • failure to attract or retain key personnel; • consolidation among the Company’s competitors or customers; • inaccurate assumptions used in developing the Company’s strategic plan or operating plans or the inability or failure to successfully im ple ment such plans; • failure to successfully integrate acquisitions into operations or their related financings may impact liquidity and capital r eso urces; • the ability to sustain operations at CCT, including obtaining financial and other operational data of CCT; • changes in the Company’s relationship with its joint - venture partners, or changes in the ownership structure of its joint ventures, incl uding changes resulting from the previously announced agreement between the Company and the CCT joint - venture partner; • the inability to obtain and maintain price increases to offset higher production or material costs; • inability to adequately protect the Company’s intellectual property rights; • inability to use deferred tax assets; and • the ultimate outcome of legal actions brought by the Company against wholly - owned subsidiaries of Apollo Tyres Ltd. 11
March 3,