Q1 EARNINGS - MAY 2, 2018 1
FORWARD LOOKING STATEMENTS This presentation includes estimates or projections that constitute “forward-looking statements” within the meaning of the U.S. federal securities laws. Generally, the words “believe,” “expect,” “intend,” “anticipate,” “project,” “will,” and similar expressions identify forward-looking statements, which generally are not historic in nature. Although the Company believes that the assumptions upon which its forward-looking statements are based are reasonable, it can give no assurance that these assumptions will prove to be correct. Important factors that could cause actual results to differ materially from the Company’s historical experience, and present projections and expectations are disclosed in the Company’s filings with the Securities and Exchange Commission (“SEC”). These factors include, among others, our ability to successfully integrate the acquisition of MillerCoors; our ability to achieve expected tax benefits, accretion and cost savings and synergies; impact of increased competition resulting from further consolidation of brewers, competitive pricing and product pressures; health of the beer industry and our brands in our markets; economic conditions in our markets; additional impairment charges; our ability to maintain manufacturer/distribution agreements; changes in our supply chain system; availability or increase in the cost of packaging materials; success of our joint ventures; risks relating to operations in developing and emerging markets; changes in legal and regulatory requirements, including the regulation of distribution systems; fluctuations in foreign currency exchange rates; increase in the cost of commodities used in the business; the impact of climate change and the availability and quality of water; loss or closure of a major brewery or other key facility; our ability to implement our strategic initiatives, including executing and realizing cost savings; our ability to successfully integrate newly acquired businesses; pension plan and other post retirement benefit costs; failure to comply with debt covenants or deterioration in our credit rating; our ability to maintain good labor relations; our ability to maintain brand image, reputation and product quality; and other risks discussed in our filings with the SEC, including our most recent Annual Report on Form 10-K and our Quarterly Reports on Form 10-Q. All forward-looking statements in this presentation are expressly qualified by such cautionary statements and by reference to the underlying assumptions. You should not place undue reliance on forward looking statements, which speak only as of the date they are made. We do not undertake to update forward-looking statements, whether as a result of new information, future events or otherwise. Non-GAAP Information Please see our most recent earnings release or visit the investor relations page of ourSTABILIZE website BELOW – www.molsoncoors.com PREMIUM – to find disclosure and applicable reconciliations of non-GAAP financial measures discussed in this presentation. 2
INVESTORS PRESENTATION - NEW YORK, JUNE 6, 2018 M A R K H U N T E R , C E O , M O L S O N C O O R S Corporate Overview and Strategic Focus G A V I N H AT T E R S L E Y, C E O , M I L L E R C O O R S US Context and Strategy T R A C E Y J O U B E R T, C F O , M O L S O N C O O R S Strategies to grow profit, cash, total shareholder return C L O S I N G R E M A R K S Q & A R E C E P T I O N
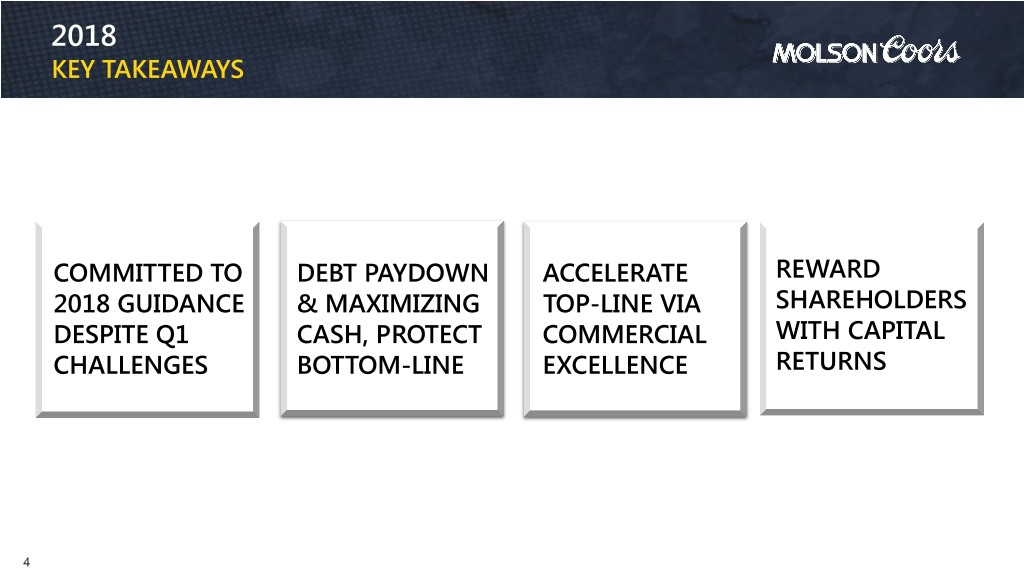
2018 KEY TAKEAWAYS COMMITTED TO DEBT PAYDOWN ACCELERATE REWARD 2018 GUIDANCE & MAXIMIZING TOP-LINE VIA SHAREHOLDERS DESPITE Q1 CASH, PROTECT COMMERCIAL WITH CAPITAL CHALLENGES BOTTOM-LINE EXCELLENCE RETURNS 4
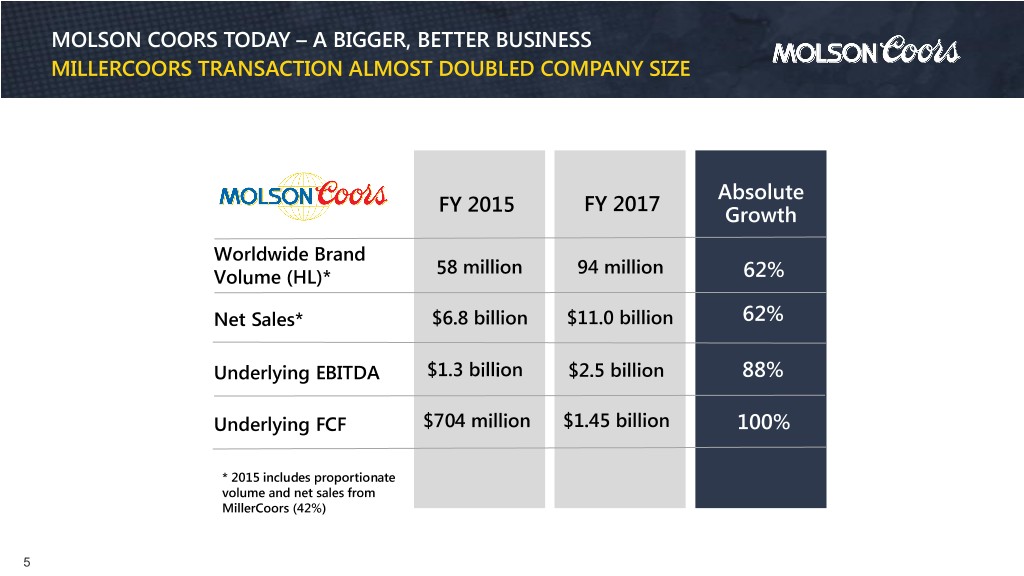
MOLSON COORS TODAY – A BIGGER, BETTER BUSINESS MILLERCOORS TRANSACTION ALMOST DOUBLED COMPANY SIZE Absolute FY 2017 FY 2015 Growth Worldwide Brand 58 million 94 million Volume (HL)* 62% Net Sales* $6.8 billion $11.0 billion 62% Underlying EBITDA $1.3 billion $2.5 billion 88% Underlying FCF $704 million $1.45 billion 100% * 2015 includes proportionate volume and net sales from MillerCoors (42%) 5
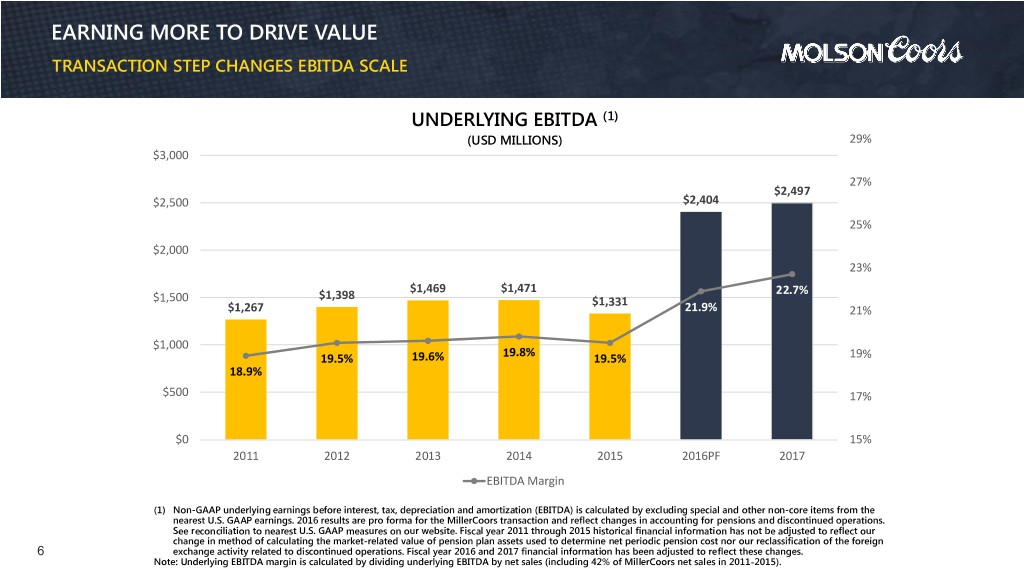
EARNING MORE TO DRIVE VALUE TRANSACTION STEP CHANGES EBITDA SCALE UNDERLYING EBITDA (1) (USD MILLIONS) 29% $3,000 27% $2,497 $2,500 $2,404 25% $2,000 23% $1,469 $1,471 22.7% $1,500 $1,398 $1,331 $1,267 21.9% 21% $1,000 19.8% 19.5% 19.6% 19.5% 19% 18.9% $500 17% $0 15% 2011 2012 2013 2014 2015 2016PF 2017 EBITDA Margin (1) Non-GAAP underlying earnings before interest, tax, depreciation and amortization (EBITDA) is calculated by excluding special and other non-core items from the nearest U.S. GAAP earnings. 2016 results are pro forma for the MillerCoors transaction and reflect changes in accounting for pensions and discontinued operations. See reconciliation to nearest U.S. GAAP measures on our website. Fiscal year 2011 through 2015 historical financial information has not be adjusted to reflect our change in method of calculating the market-related value of pension plan assets used to determine net periodic pension cost nor our reclassification of the foreign 6 exchange activity related to discontinued operations. Fiscal year 2016 and 2017 financial information has been adjusted to reflect these changes. Note: Underlying EBITDA margin is calculated by dividing underlying EBITDA by net sales (including 42% of MillerCoors net sales in 2011-2015).
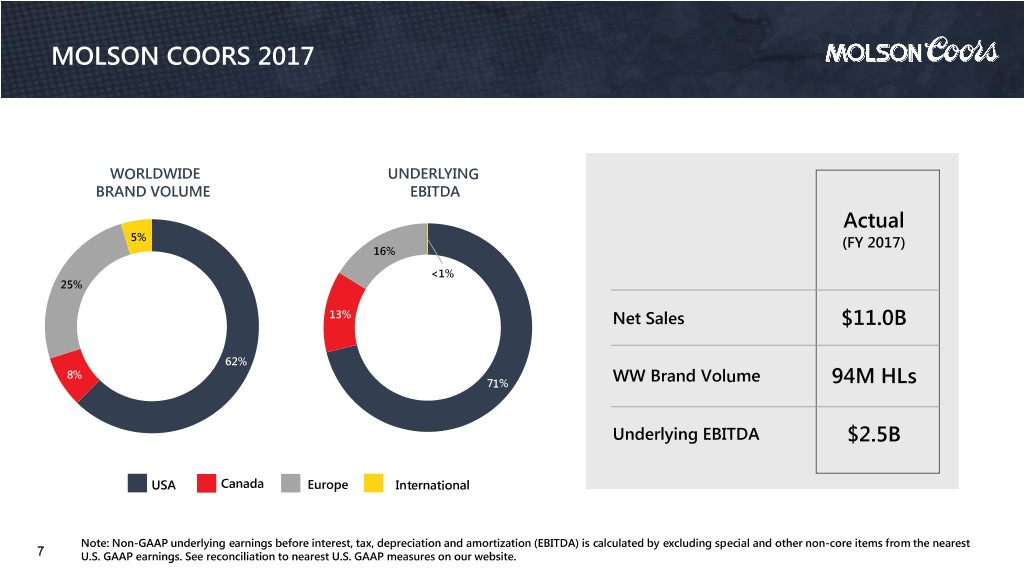
MOLSON COORS 2017 WORLDWIDE UNDERLYING BRAND VOLUME EBITDA Actual 5% (FY 2017) 16% <1% 25% 13% Net Sales $11.0B 62% 8% 71% WW Brand Volume 94M HLs Underlying EBITDA $2.5B USA Canada Europe International Note: Non-GAAP underlying earnings before interest, tax, depreciation and amortization (EBITDA) is calculated by excluding special and other non-core items from the nearest 7 U.S. GAAP earnings. See reconciliation to nearest U.S. GAAP measures on our website.
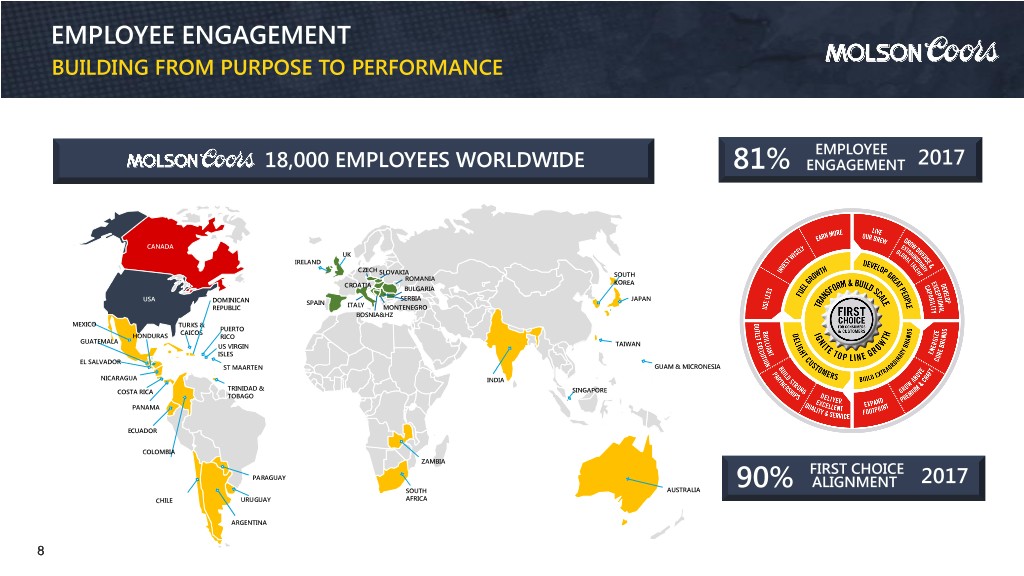
EMPLOYEE ENGAGEMENT BUILDING FROM PURPOSE TO PERFORMANCE EMPLOYEE 18,000 EMPLOYEES WORLDWIDE 81% ENGAGEMENT 2017 CANADA UK IRELAND CZECH SLOVAKIA SOUTH ROMANIA CROATIA KOREA BULGARIA USA SERBIA JAPAN DOMINICAN SPAIN REPUBLIC ITALY MONTENEGRO BOSNIA&HZ MEXICO TURKS & PUERTO CAICOS HONDURAS RICO GUATEMALA US VIRGIN TAIWAN ISLES EL SALVADOR ST MAARTEN GUAM & MICRONESIA NICARAGUA INDIA TRINIDAD & COSTA RICA SINGAPORE TOBAGO PANAMA ECUADOR COLOMBIA ZAMBIA FIRST CHOICE PARAGUAY ALIGNMENT 2017 AUSTRALIA 90% SOUTH CHILE URUGUAY AFRICA ARGENTINA 8
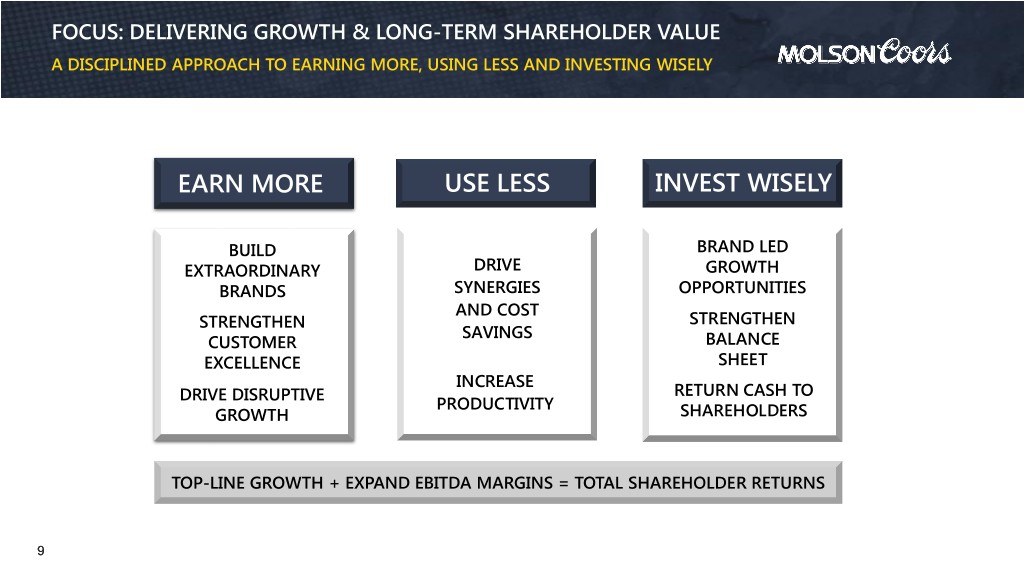
FOCUS: DELIVERING GROWTH & LONG-TERM SHAREHOLDER VALUE A DISCIPLINED APPROACH TO EARNING MORE, USING LESS AND INVESTING WISELY EARN MORE USE LESS INVEST WISELY BUILD BRAND LED EXTRAORDINARY DRIVE GROWTH BRANDS SYNERGIES OPPORTUNITIES AND COST STRENGTHEN STRENGTHEN SAVINGS CUSTOMER BALANCE EXCELLENCE SHEET INCREASE DRIVE DISRUPTIVE RETURN CASH TO PRODUCTIVITY GROWTH SHAREHOLDERS TOP-LINE GROWTH + EXPAND EBITDA MARGINS = TOTAL SHAREHOLDER RETURNS 9
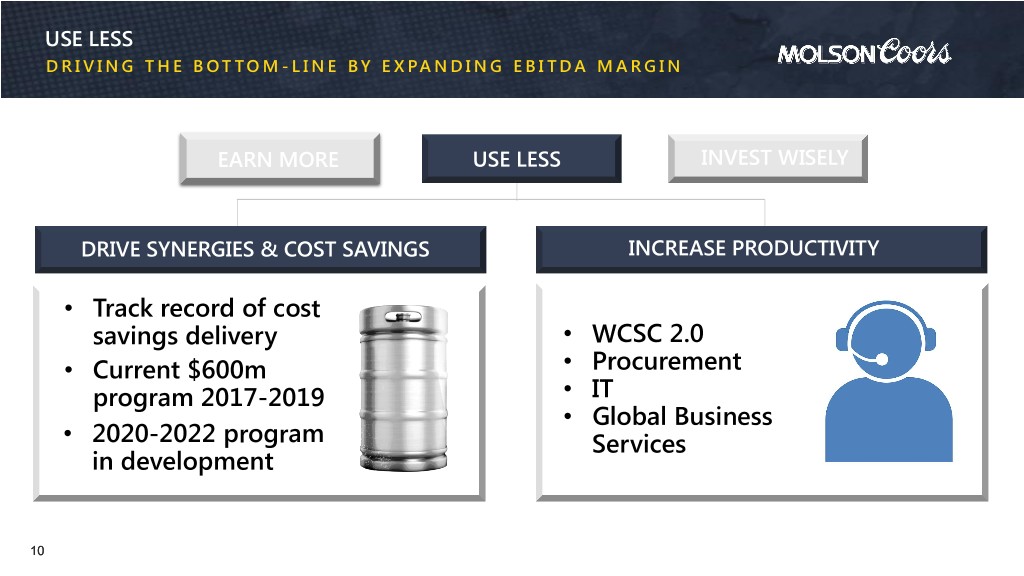
USE LESS D R I V I N G T H E B O T T O M - L I N E B Y E X PA N D I N G E B I T D A M A R G I N E N H A N C E D C O M M E R C I A L C A P A B I L I T I E S W I L L D R I V E T O P & B O T T O M L I N E EARN MORE USE LESS INVEST WISELY DRIVE SYNERGIES & COST SAVINGS INCREASE PRODUCTIVITY • Track record of cost savings delivery • WCSC 2.0 • Current $600m • Procurement program 2017-2019 • IT • Global Business • 2020-2022 program Services in development 10
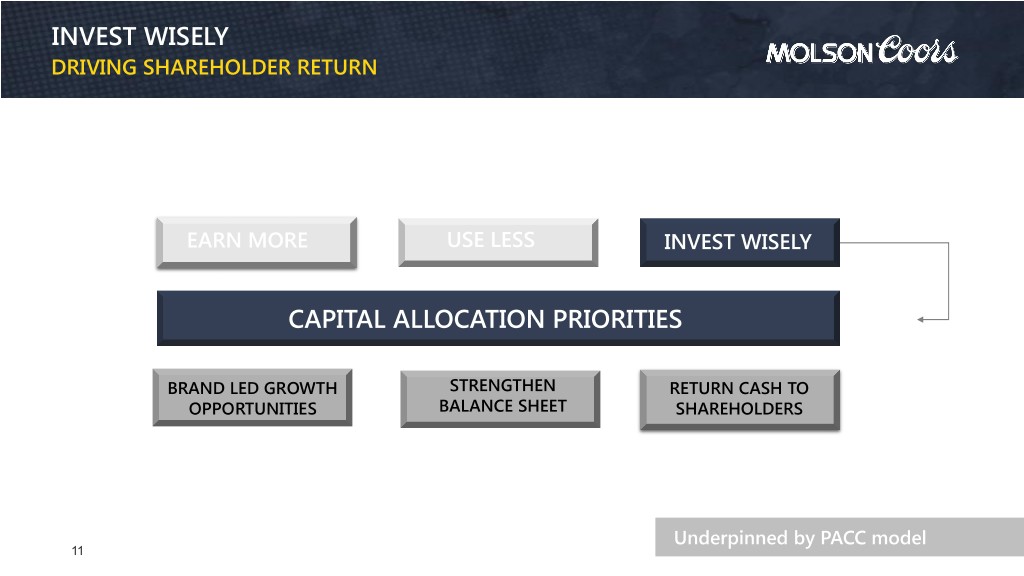
INVEST WISELY DRIVING SHAREHOLDER RETURN EARN MORE USE LESS INVEST WISELY CAPITAL ALLOCATION PRIORITIES BRAND LED GROWTH STRENGTHEN RETURN CASH TO OPPORTUNITIES BALANCE SHEET SHAREHOLDERS Underpinned by PACC model 11
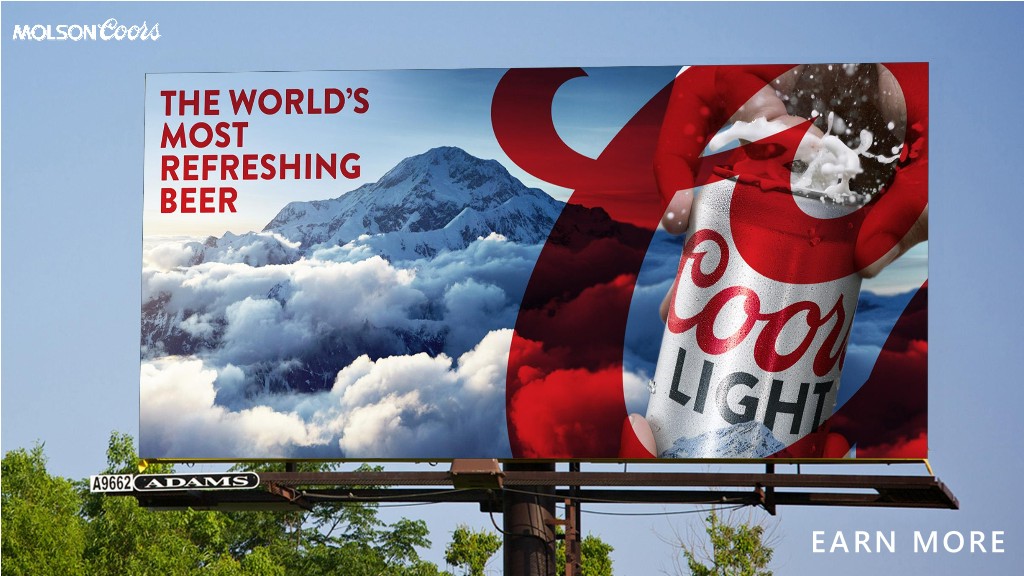
EARN MORE
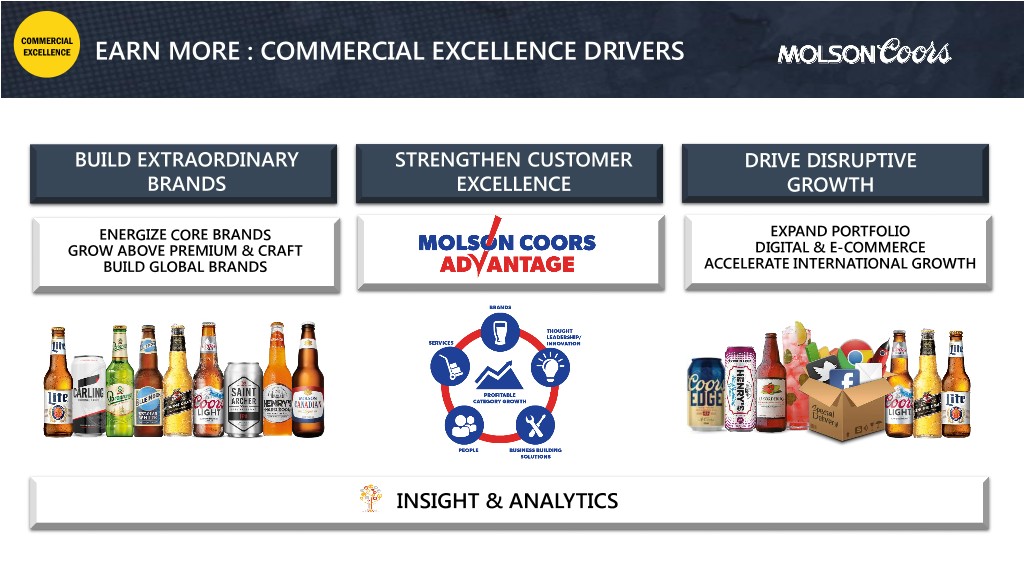
COMMERCIAL EXCELLENCE EARN MORE : COMMERCIAL EXCELLENCE DRIVERS E N H A N C E D C O M M E R C I A L C A P A B I L I T I E S W I L L D R I V E T O P & B O T T O M L I N E BUILD EXTRAORDINARY STRENGTHEN CUSTOMER DRIVE DISRUPTIVE BRANDS EXCELLENCE GROWTH ENERGIZE CORE BRANDS EXPAND PORTFOLIO GROW ABOVE PREMIUM & CRAFT DIGITAL & E-COMMERCE BUILD GLOBAL BRANDS ACCELERATE INTERNATIONAL GROWTH INSIGHT & ANALYTICS
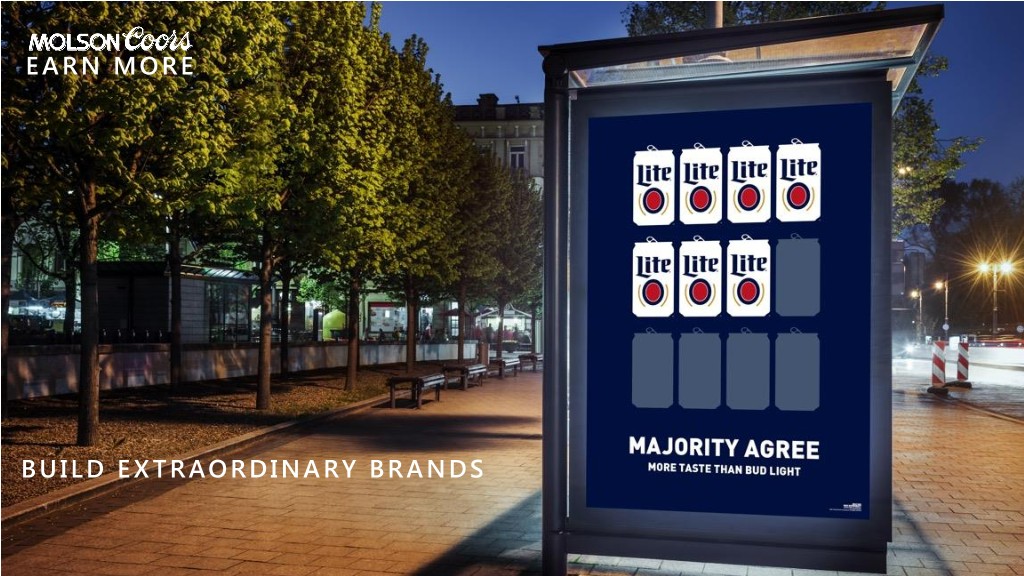
E ARN MORE BUILD E X TRAORDINARY BRANDS
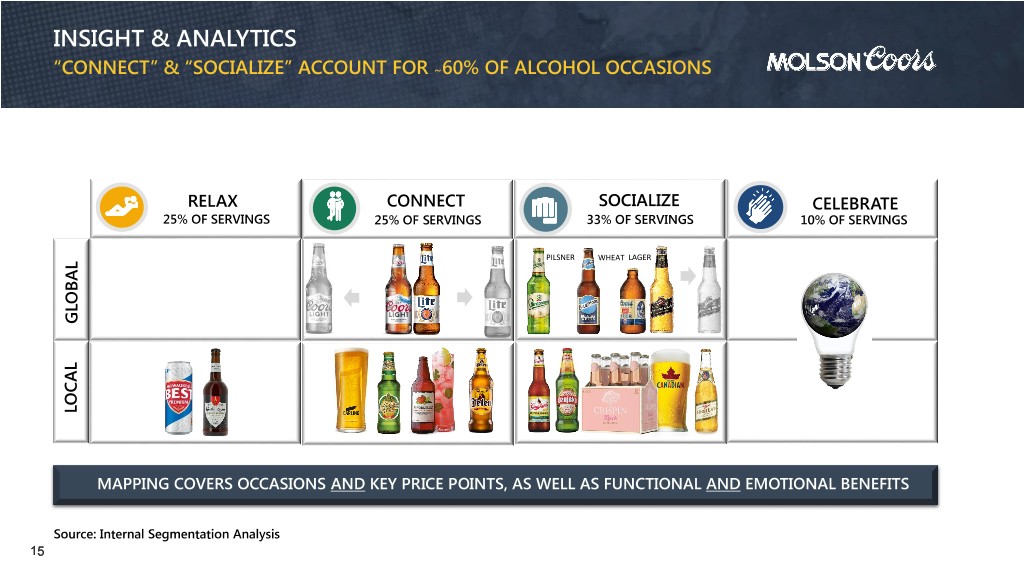
INSIGHT & ANALYTICS “CONNECT” & “SOCIALIZE” ACCOUNT FOR ~60% OF ALCOHOL OCCASIONS RELAX CONNECT SOCIALIZE CELEBRATE 25% OF SERVINGS 25% OF SERVINGS 33% OF SERVINGS 10% OF SERVINGS PILSNER WHEAT LAGER GLOBAL LOCAL MAPPING COVERS OCCASIONS AND KEY PRICE POINTS, AS WELL AS FUNCTIONAL AND EMOTIONAL BENEFITS Source: Internal Segmentation Analysis 15
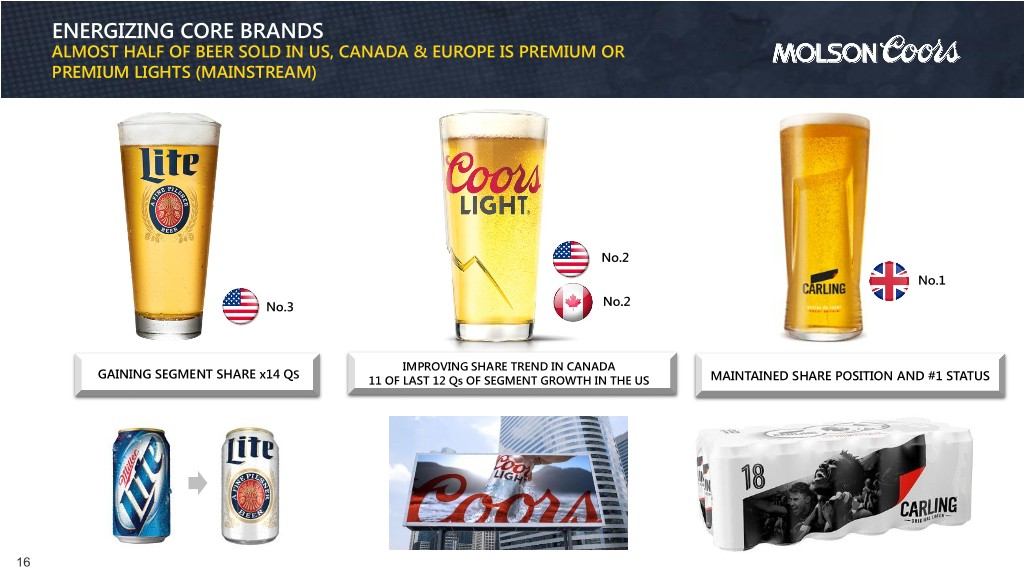
ENERGIZING CORE BRANDS ALMOST HALF OF BEER SOLD IN US, CANADA & EUROPE IS PREMIUM OR PREMIUM LIGHTS (MAINSTREAM) No.2 No.1 No.3 No.2 IMPROVING SHARE TREND IN CANADA GAINING SEGMENT SHARE x14 QS 11 OF LAST 12 Qs OF SEGMENT GROWTH IN THE US MAINTAINED SHARE POSITION AND #1 STATUS 16
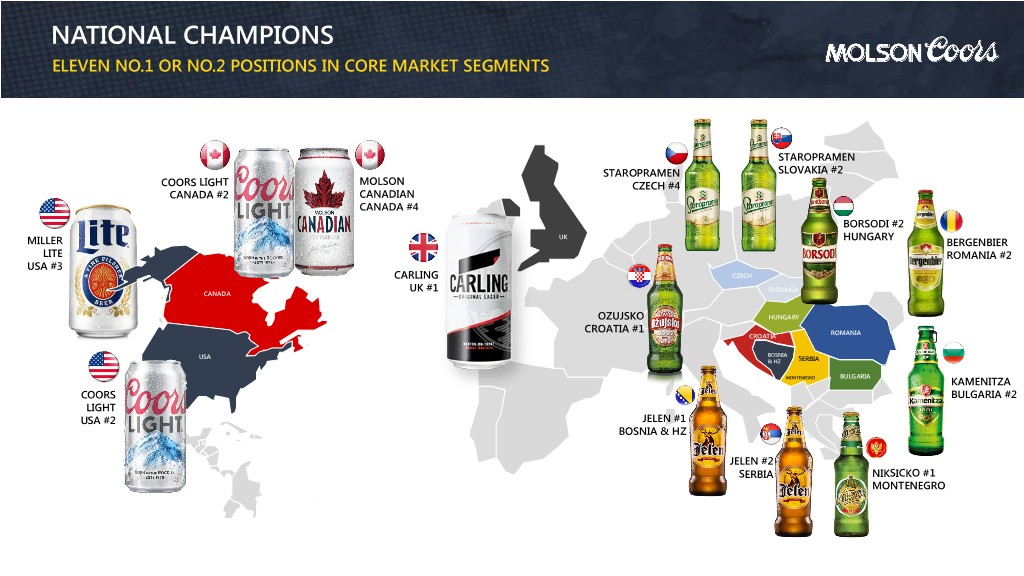
NATIONAL CHAMPIONS ELEVEN NO.1 OR NO.2 POSITIONS IN CORE MARKET SEGMENTS STAROPRAMEN STAROPRAMEN SLOVAKIA #2 COORS LIGHT MOLSON CZECH #4 CANADA #2 CANADIAN CANADA #4 BORSODI #2 UK HUNGARY MILLER BERGENBIER LITE ROMANIA #2 USA #3 CARLING CZECH UK #1 SLOVAKIA CANADA OZUJSKO HUNGARY CROATIA #1 ROMANIA CROATIA USA BOSNIA & HZ SERBIA BULGARIA MONTENEGRO KAMENITZA COORS BULGARIA #2 LIGHT USA #2 JELEN #1 BOSNIA & HZ JELEN #2 SERBIA NIKSICKO #1 MONTENEGRO
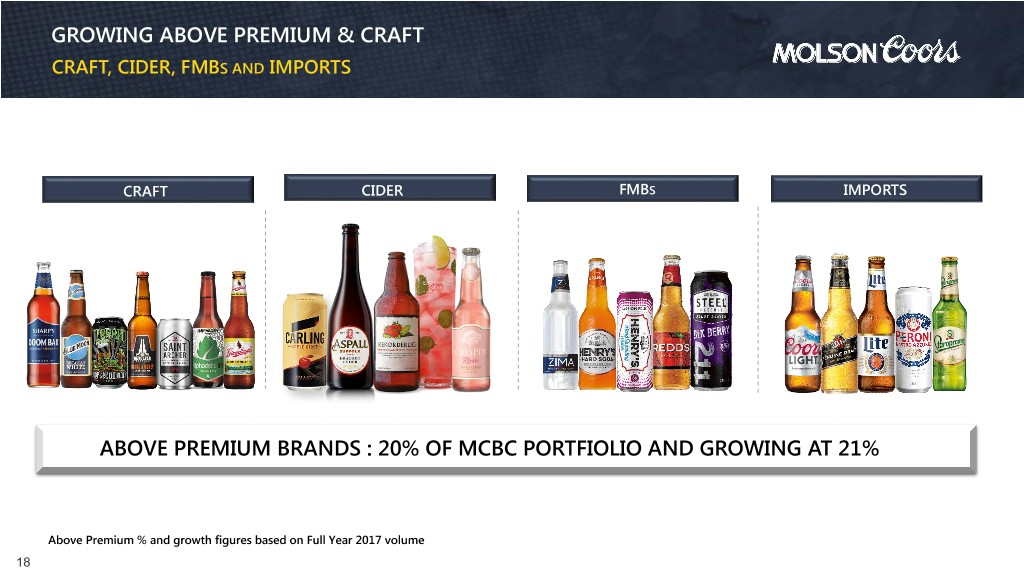
GROWING ABOVE PREMIUM & CRAFT CRAFT, CIDER, FMBS AND IMPORTS CRAFT CIDER FMBS IMPORTS ABOVE PREMIUM BRANDS : 20% OF MCBC PORTFIOLIO AND GROWING AT 21% MCI 82% PORTFOLIO Above Premium % and growth figures based on Full Year 2017 volume 18
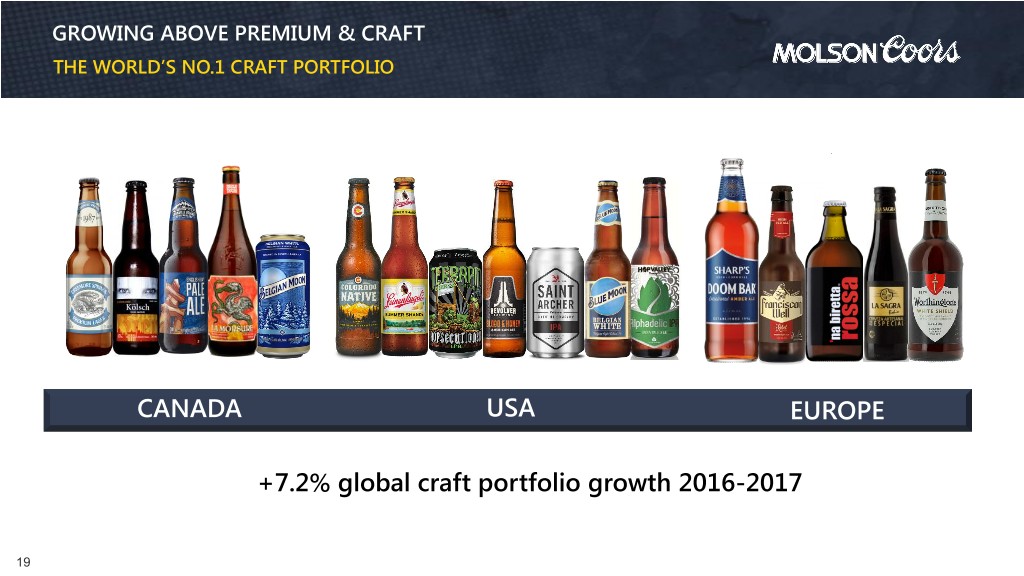
GROWING ABOVE PREMIUM & CRAFT THE WORLD’S NO.1 CRAFT PORTFOLIO CANADA USA EUROPE +7.2% global craft portfolio growth 2016-2017 19
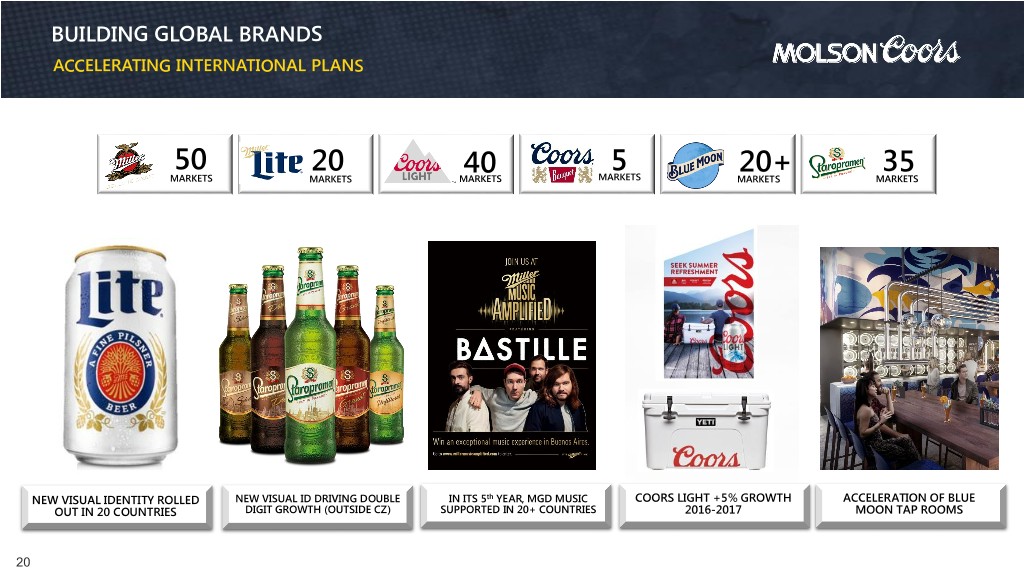
BUILDING GLOBAL BRANDS ACCELERATING INTERNATIONAL PLANS 50 20 40 5 20+ 35 MARKETS MARKETS MARKETS MARKETS MARKETS MARKETS NEW VISUAL IDENTITY ROLLED NEW VISUAL ID DRIVING DOUBLE IN ITS 5th YEAR, MGD MUSIC COORS LIGHT +5% GROWTH ACCELERATION OF BLUE OUT IN 20 COUNTRIES DIGIT GROWTH (OUTSIDE CZ) SUPPORTED IN 20+ COUNTRIES 2016-2017 MOON TAP ROOMS 20

CUSTOMER EXCELLENCE
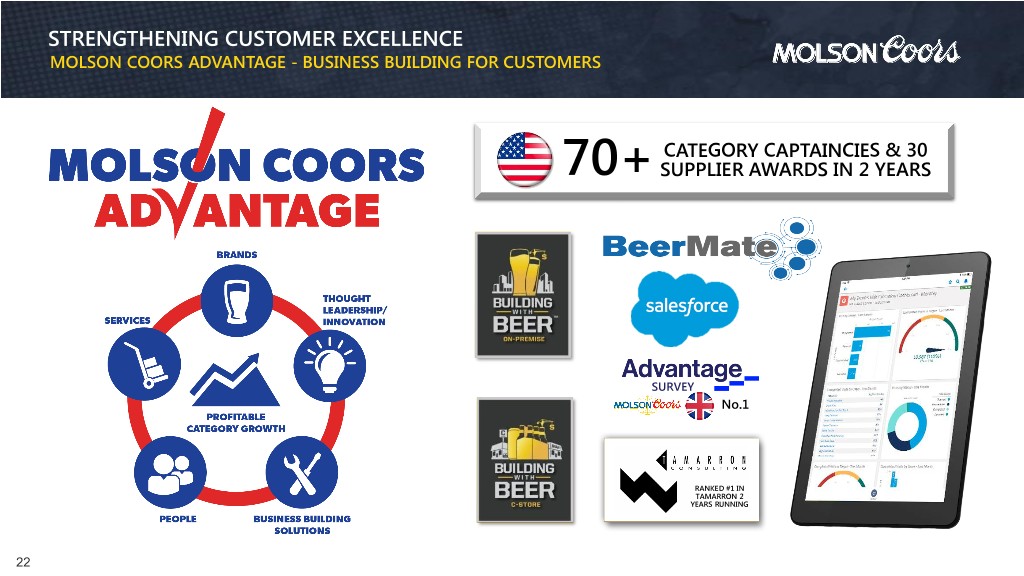
STRENGTHENING CUSTOMER EXCELLENCE MOLSON COORS ADVANTAGE - BUSINESS BUILDING FOR CUSTOMERS CATEGORY CAPTAINCIES & 30 70+ SUPPLIER AWARDS IN 2 YEARS SURVEY No.1 RANKED #1 IN TAMARRON 2 YEARS RUNNING 22
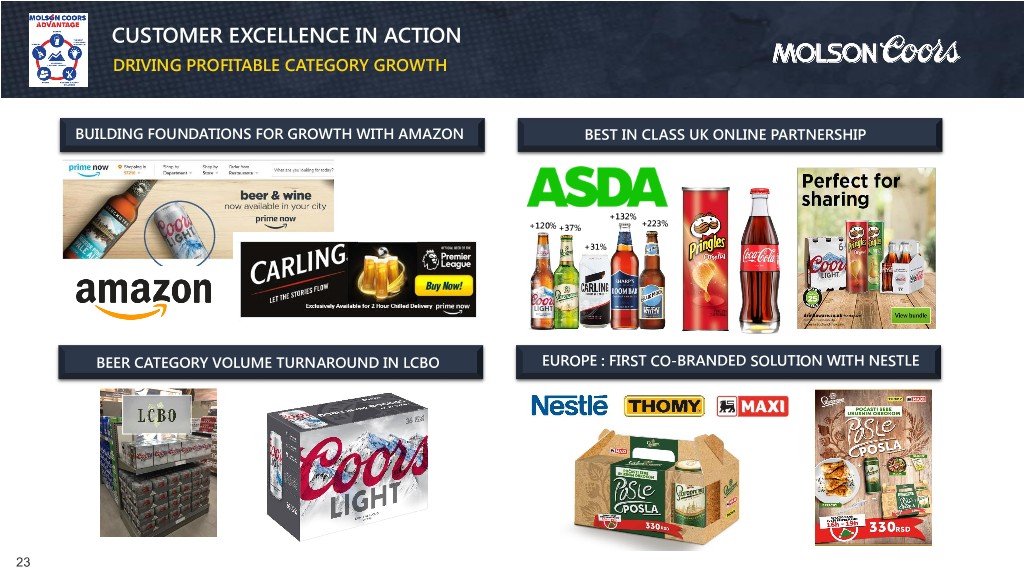
CUSTOMER EXCELLENCE IN ACTION DRIVING PROFITABLE CATEGORY GROWTH BUILDING FOUNDATIONS FOR GROWTH WITH AMAZON BEST IN CLASS UK ONLINE PARTNERSHIP +132% +223% +120% +37% +31% BEER CATEGORY VOLUME TURNAROUND IN LCBO EUROPE : FIRST CO-BRANDED SOLUTION WITH NESTLE 23
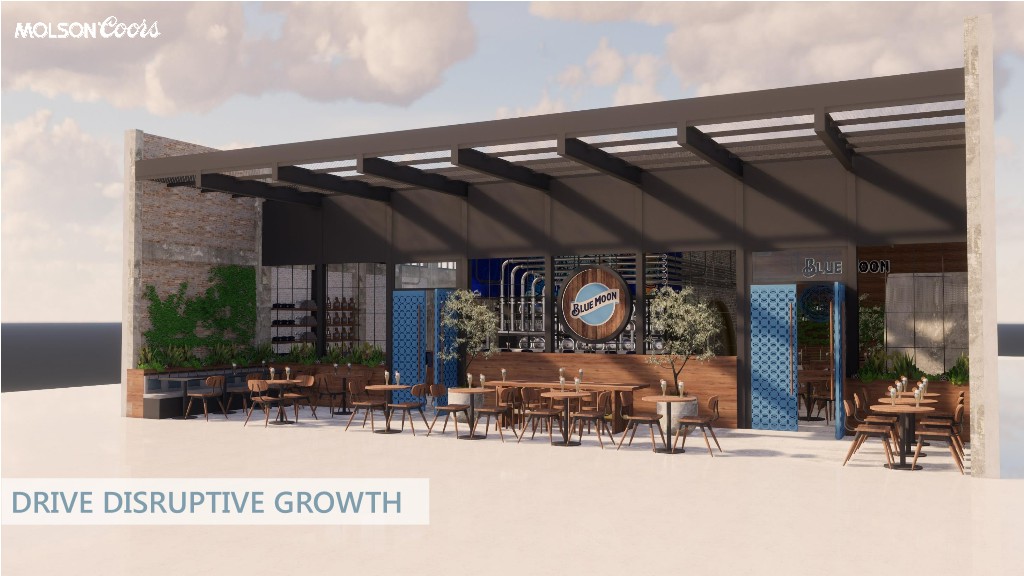
DRIVE DISRUPTIVE GROWTH
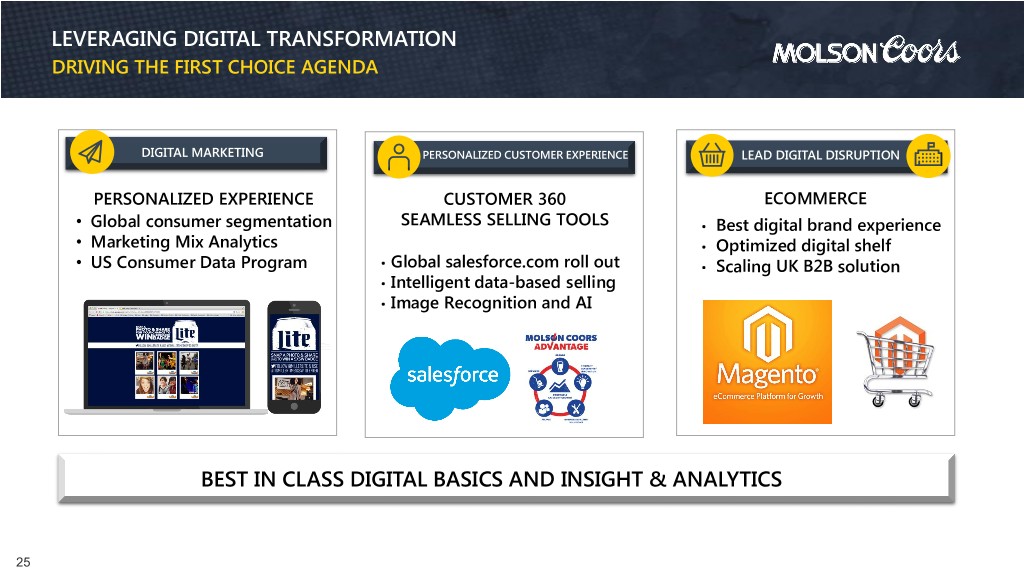
LEVERAGING DIGITAL TRANSFORMATION DRIVING THE FIRST CHOICE AGENDA DIGITAL MARKETING PERSONALIZED CUSTOMER EXPERIENCE LEAD DIGITAL DISRUPTION PERSONALIZED EXPERIENCE CUSTOMER 360 ECOMMERCE • Global consumer segmentation SEAMLESS SELLING TOOLS • Best digital brand experience • Marketing Mix Analytics • Optimized digital shelf • US Consumer Data Program • Global salesforce.com roll out • Scaling UK B2B solution • Intelligent data-based selling • Image Recognition and AI BEST IN CLASS DIGITAL BASICS AND INSIGHT & ANALYTICS 25
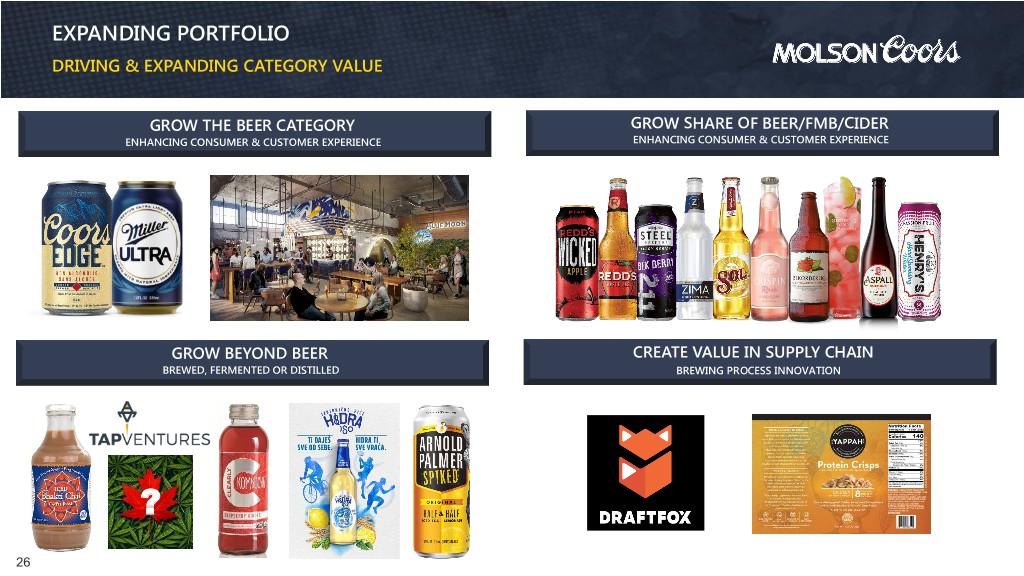
EXPANDING PORTFOLIO DRIVING & EXPANDING CATEGORY VALUE GROW THE BEER CATEGORY GROW SHARE OF BEER/FMB/CIDER ENHANCING CONSUMER & CUSTOMER EXPERIENCE ENHANCING CONSUMER & CUSTOMER EXPERIENCE GROW BEYOND BEER CREATE VALUE IN SUPPLY CHAIN BREWED, FERMENTED OR DISTILLED BREWING PROCESS INNOVATION ? 26
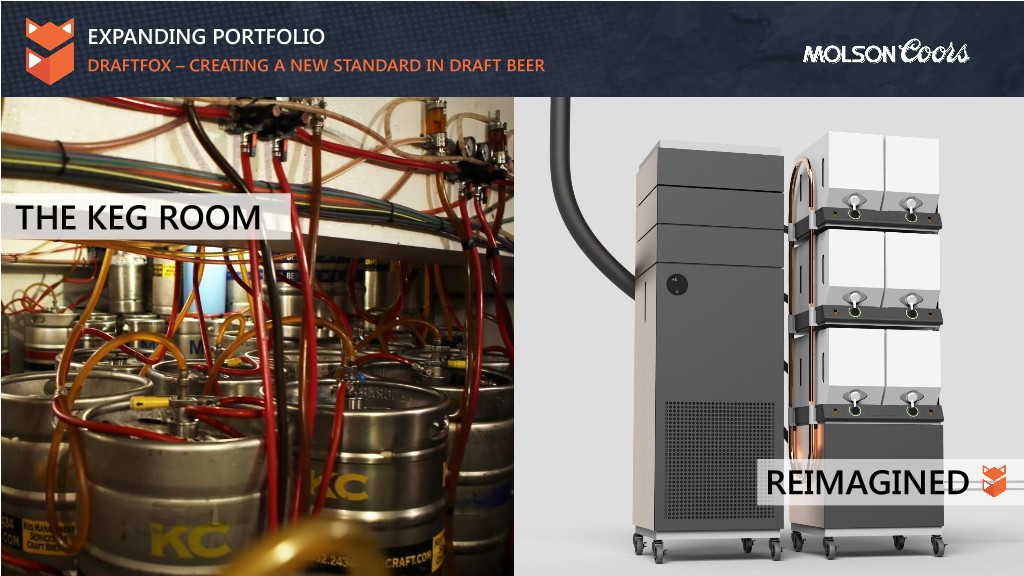
EXPANDING PORTFOLIO DRAFTFOX – CREATING A NEW STANDARD IN DRAFT BEER THE KEG ROOM REIMAGINED 27
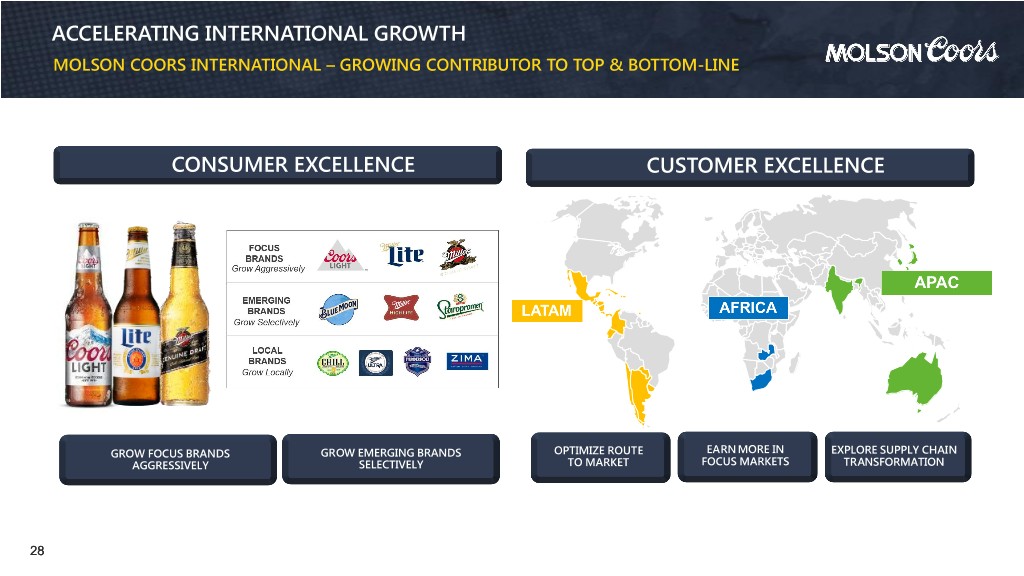
ACCELERATING INTERNATIONAL GROWTH MOLSON COORS INTERNATIONAL – GROWING CONTRIBUTOR TO TOP & BOTTOM-LINE CONSUMER EXCELLENCE CUSTOMER EXCELLENCE GROW FOCUS BRANDS GROW EMERGING BRANDS OPTIMIZEOPTIMIZE ROUTE ROUTE TO EARN MORE IN EXPLORE SUPPLY CHAIN AGGRESSIVELY SELECTIVELY TO MARKETMARKET FOCUS MARKETS TRANSFORMATION 28
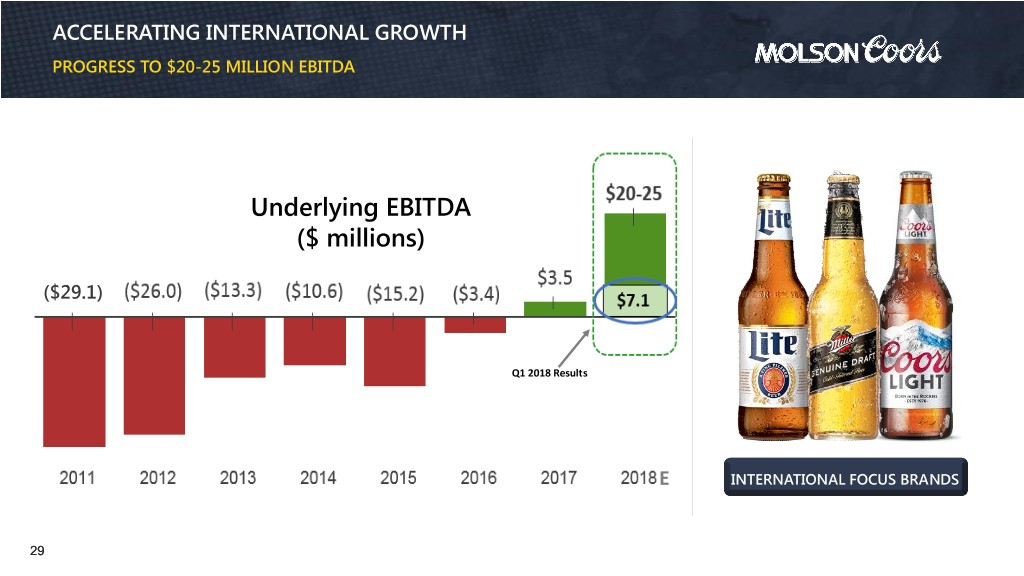
ACCELERATING INTERNATIONAL GROWTH PROGRESS TO $20-25 MILLION EBITDA Underlying EBITDA ($ millions) ($29.1) Q1 2018 Results E INTERNATIONAL FOCUS BRANDS 29
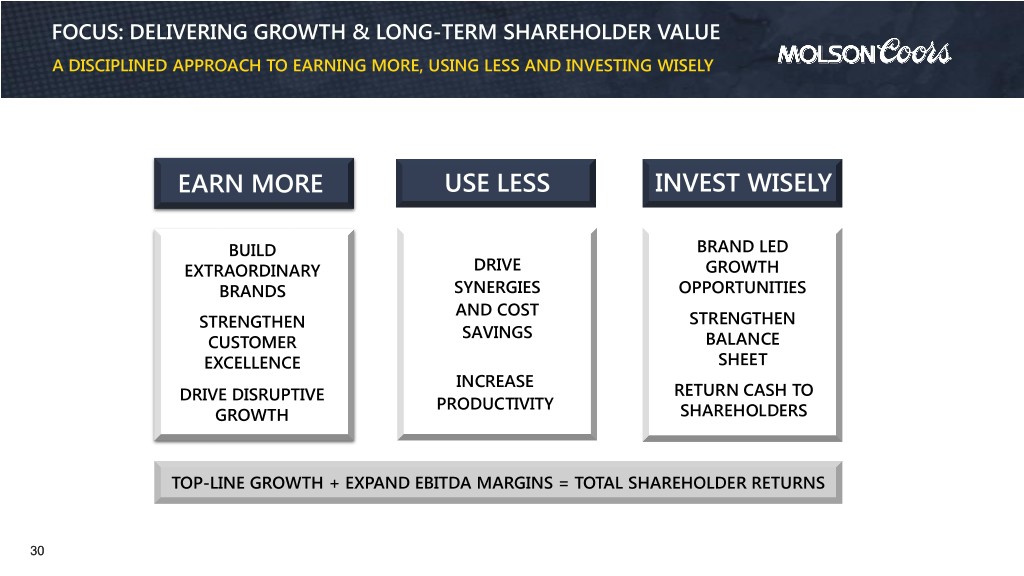
FOCUS: DELIVERING GROWTH & LONG-TERM SHAREHOLDER VALUE A DISCIPLINED APPROACH TO EARNING MORE, USING LESS AND INVESTING WISELY EARN MORE USE LESS INVEST WISELY BUILD BRAND LED EXTRAORDINARY DRIVE GROWTH BRANDS SYNERGIES OPPORTUNITIES AND COST STRENGTHEN STRENGTHEN SAVINGS CUSTOMER BALANCE EXCELLENCE SHEET INCREASE DRIVE DISRUPTIVE RETURN CASH TO PRODUCTIVITY GROWTH SHAREHOLDERS TOP-LINE GROWTH + EXPAND EBITDA MARGINS = TOTAL SHAREHOLDER RETURNS 30
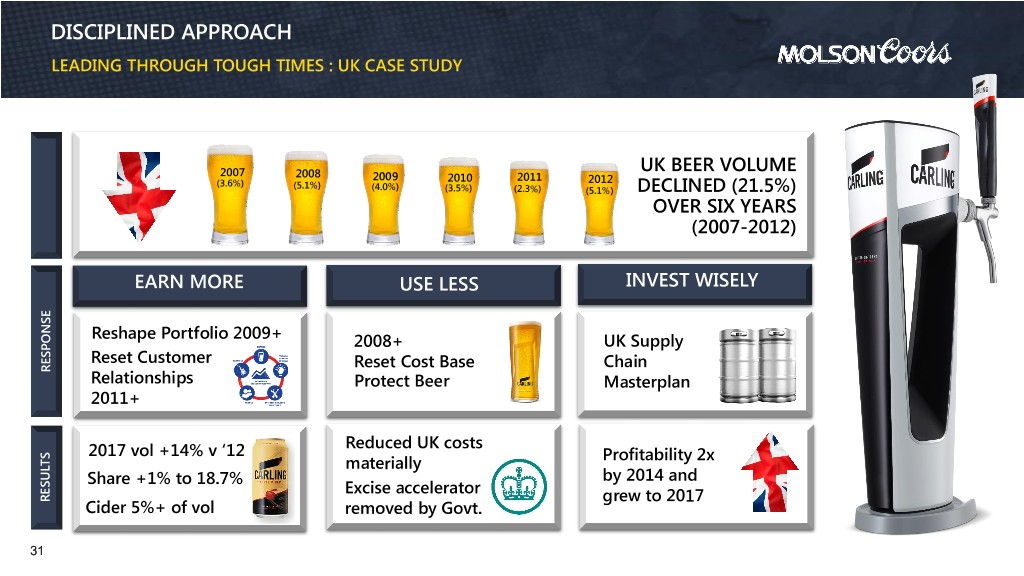
DISCIPLINED APPROACH LEADING THROUGH TOUGH TIMES : UK CASE STUDY 2007 UK BEER VOLUME 2008 2009 2010 2011 2012 (3.6%) (5.1%) (4.0%) (3.5%) (2.3%) (5.1%) DECLINED (21.5%) OVER SIX YEARS SITUATION (2007-2012) EARN MORE USE LESS INVEST WISELY Reshape Portfolio 2009+ 2008+ UK Supply Reset Customer Reset Cost Base Chain RESPONSE Relationships Protect Beer Masterplan 2011+ 2017 vol +14% v ‘12 Reduced UK costs materially Profitability 2x Share +1% to 18.7% by 2014 and Excise accelerator RESULTS grew to 2017 Cider 5%+ of vol removed by Govt. 31

DISCIPLINED APPROACH LEADING THROUGH TOUGH TIMES : UK CASE STUDY BEFOREBEFORE AFTER 32
Q1 EARNINGS - MAY 2, 2018 GAVIN HATTERSLEY C E O , M i l l e r C o o r s 33
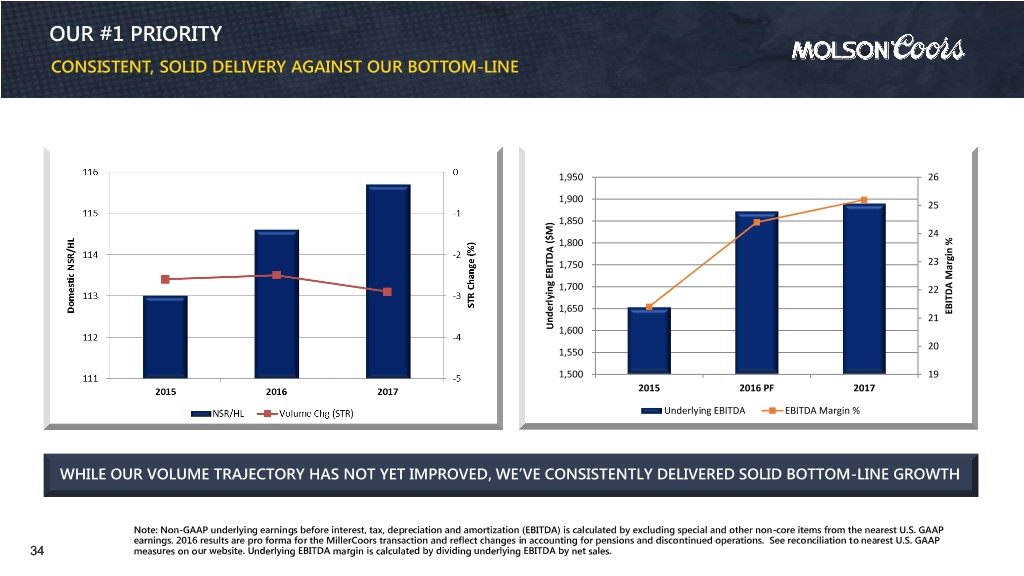
OUR #1 PRIORITY CONSISTENT, SOLID DELIVERY AGAINST OUR BOTTOM-LINE 1,950 26 1,900 25 1,850 24 1,800 1,750 23 1,700 22 1,650 EBITDA Margin% 21 Underlying Underlying EBITDA ($M) 1,600 20 1,550 1,500 19 2015 2016 PF 2017 Underlying EBITDA EBITDA Margin % WHILE OUR VOLUME TRAJECTORY HAS NOT YET IMPROVED, WE’VE CONSISTENTLY DELIVERED SOLID BOTTOM-LINE GROWTH Note: Non-GAAP underlying earnings before interest, tax, depreciation and amortization (EBITDA) is calculated by excluding special and other non-core items from the nearest U.S. GAAP earnings. 2016 results are pro forma for the MillerCoors transaction and reflect changes in accounting for pensions and discontinued operations. See reconciliation to nearest U.S. GAAP 34 measures on our website. Underlying EBITDA margin is calculated by dividing underlying EBITDA by net sales.
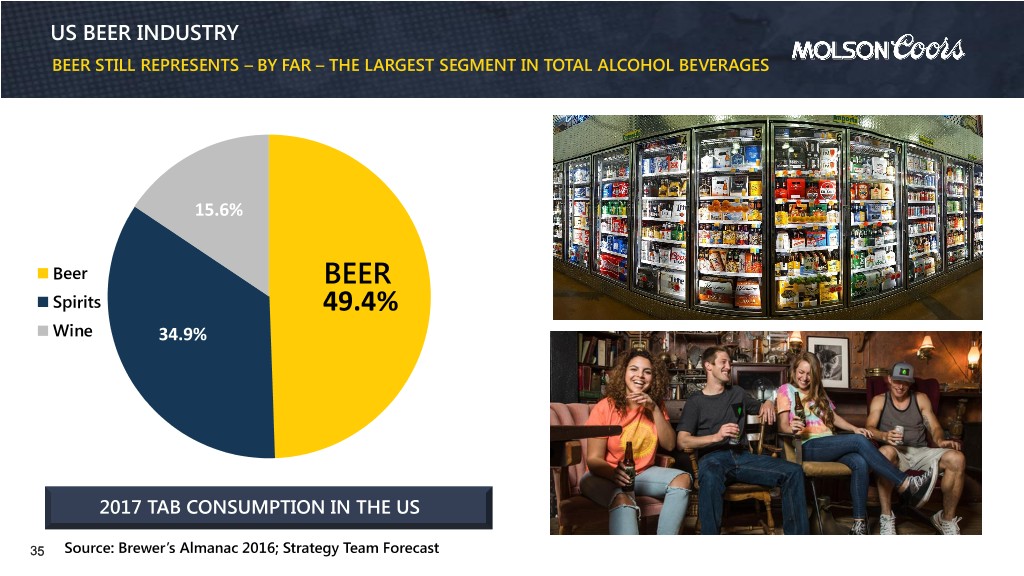
US BEER INDUSTRY BEER STILL REPRESENTS – BY FAR – THE LARGEST SEGMENT IN TOTAL ALCOHOL BEVERAGES 15.6% Beer BEER Spirits 49.4% Wine 34.9% 2017 TAB CONSUMPTION IN THE US 35 Source: Brewer’s Almanac 2016; Strategy Team Forecast
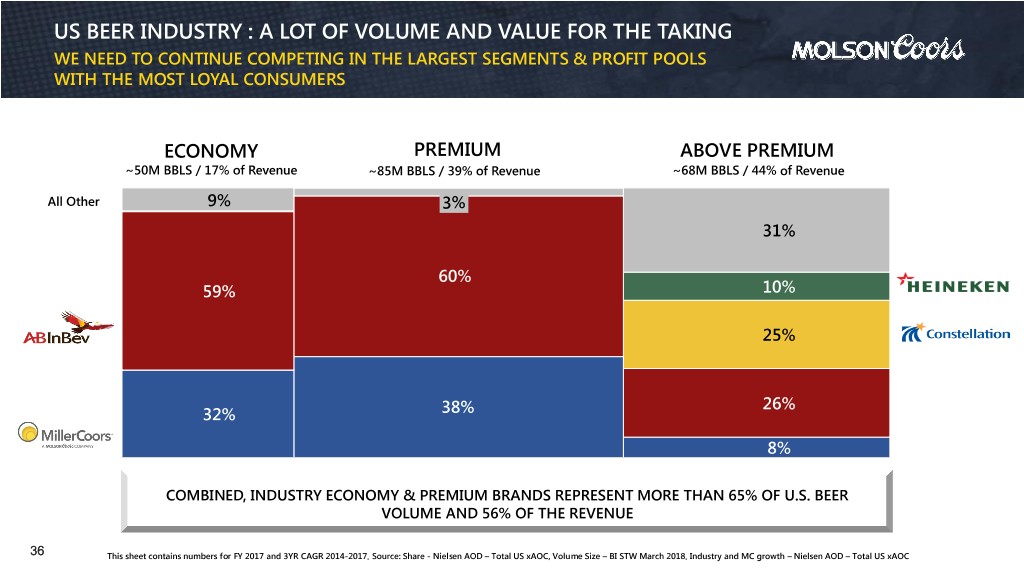
US BEER INDUSTRY : A LOT OF VOLUME AND VALUE FOR THE TAKING WE NEED TO CONTINUE COMPETING IN THE LARGEST SEGMENTS & PROFIT POOLS WITH THE MOST LOYAL CONSUMERS ECONOMY PREMIUM ABOVE PREMIUM ~50M BBLS / 17% of Revenue ~85M BBLS / 39% of Revenue ~68M BBLS / 44% of Revenue All Other 9% 3% 31% 60% 59% 10% 25% 26% 32% 38% 8% COMBINED, INDUSTRY ECONOMY & PREMIUM BRANDS REPRESENT MORE THAN 65% OF U.S. BEER VOLUME AND 56% OF THE REVENUE 36 This sheet contains numbers for FY 2017 and 3YR CAGR 2014-2017. Source: Share - Nielsen AOD – Total US xAOC, Volume Size – BI STW March 2018. Industry and MC growth – Nielsen AOD – Total US xAOC
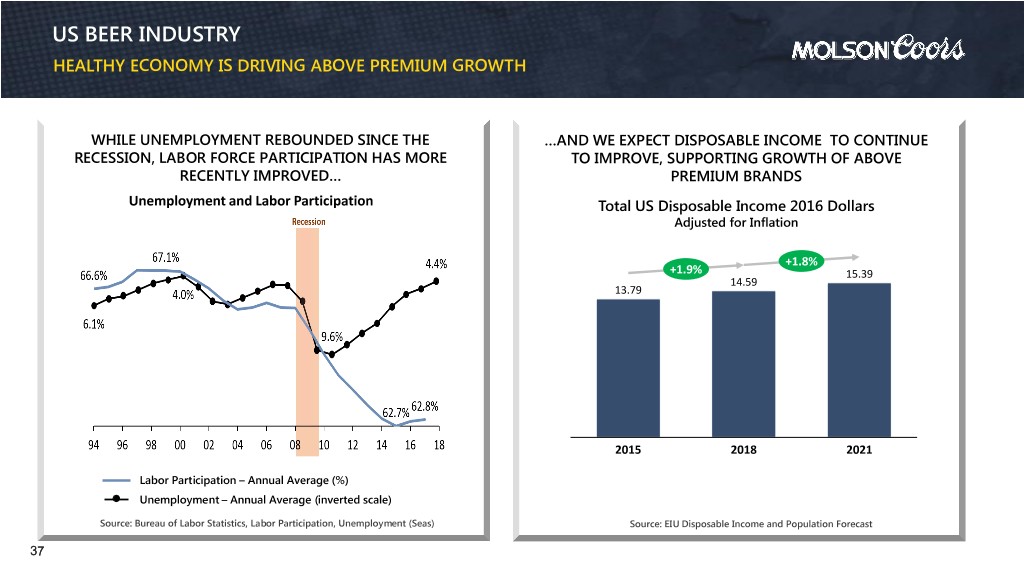
US BEER INDUSTRY HEALTHY ECONOMY IS DRIVING ABOVE PREMIUM GROWTH WHILE UNEMPLOYMENT REBOUNDED SINCE THE …AND WE EXPECT DISPOSABLE INCOME TO CONTINUE RECESSION, LABOR FORCE PARTICIPATION HAS MORE TO IMPROVE, SUPPORTING GROWTH OF ABOVE RECENTLY IMPROVED… PREMIUM BRANDS Unemployment and Labor Participation Total US Disposable Income 2016 Dollars Adjusted for Inflation +1.8% +1.9% 15.39 14.59 13.79 2015 2018 2021 Labor Participation – Annual Average (%) Unemployment – Annual Average (inverted scale) Source: Bureau of Labor Statistics, Labor Participation, Unemployment (Seas) Source: EIU Disposable Income and Population Forecast 37
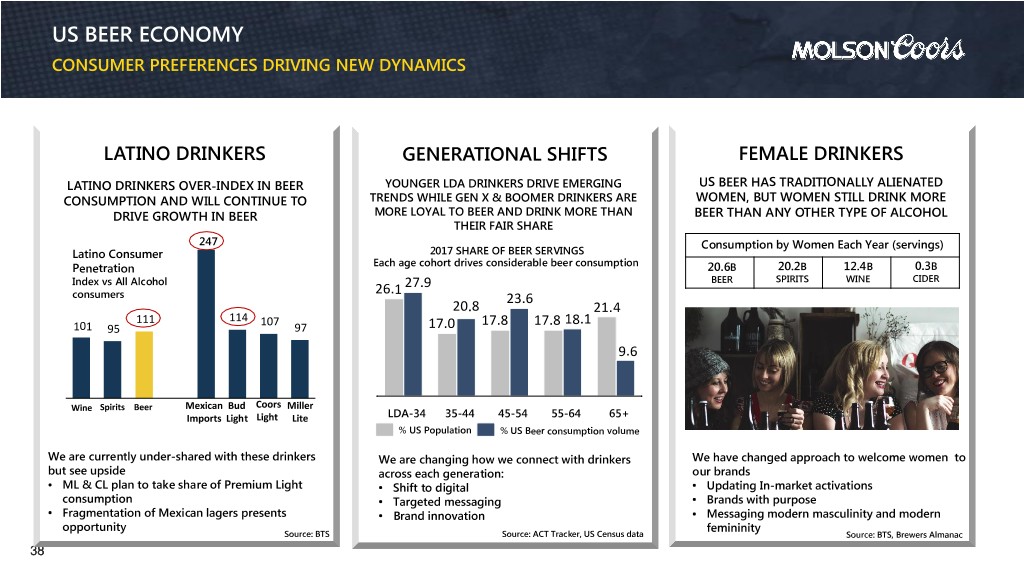
US BEER ECONOMY CONSUMER PREFERENCES DRIVING NEW DYNAMICS LATINO DRINKERS GENERATIONAL SHIFTS FEMALE DRINKERS LATINO DRINKERS OVER-INDEX IN BEER YOUNGER LDA DRINKERS DRIVE EMERGING US BEER HAS TRADITIONALLY ALIENATED CONSUMPTION AND WILL CONTINUE TO TRENDS WHILE GEN X & BOOMER DRINKERS ARE WOMEN, BUT WOMEN STILL DRINK MORE DRIVE GROWTH IN BEER MORE LOYAL TO BEER AND DRINK MORE THAN BEER THAN ANY OTHER TYPE OF ALCOHOL THEIR FAIR SHARE 247 Consumption by Women Each Year (servings) Latino Consumer 2017 SHARE OF BEER SERVINGS Penetration Each age cohort drives considerable beer consumption 20.6B 20.2B 12.4B 0.3B Index vs All Alcohol BEER SPIRITS WINE CIDER 26.1 27.9 consumers 23.6 20.8 21.4 111 114 107 17.8 17.8 18.1 101 95 97 17.0 9.6 Wine Spirits Beer Mexican Bud Coors Miller Imports Light Light Lite LDA-34 35-44 45-54 55-64 65+ % US Population % US Beer consumption volume We are currently under-shared with these drinkers We are changing how we connect with drinkers We have changed approach to welcome women to but see upside across each generation: our brands • ML & CL plan to take share of Premium Light • Shift to digital • Updating In-market activations consumption • Targeted messaging • Brands with purpose • Fragmentation of Mexican lagers presents • Brand innovation • Messaging modern masculinity and modern opportunity femininity Source: BTS Source: ACT Tracker, US Census data Source: BTS, Brewers Almanac 38
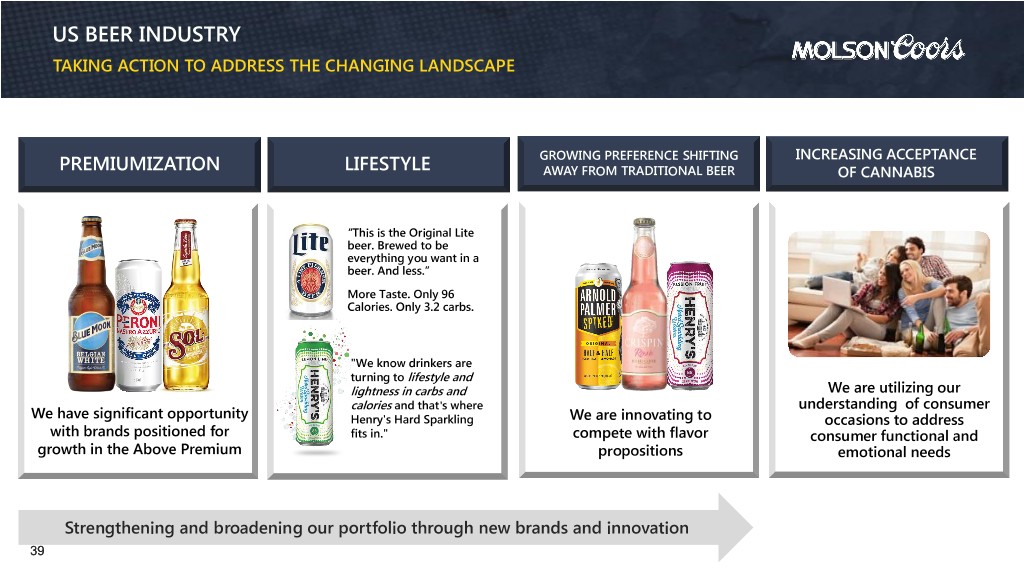
US BEER INDUSTRY TAKING ACTION TO ADDRESS THE CHANGING LANDSCAPE GROWING PREFERENCE SHIFTING INCREASING ACCEPTANCE PREMIUMIZATION LIFESTYLE AWAY FROM TRADITIONAL BEER OF CANNABIS “This is the Original Lite beer. Brewed to be everything you want in a beer. And less.” More Taste. Only 96 Calories. Only 3.2 carbs. "We know drinkers are turning to lifestyle and lightness in carbs and We are utilizing our calories and that's where understanding of consumer We have significant opportunity Henry's Hard Sparkling We are innovating to occasions to address with brands positioned for fits in." compete with flavor consumer functional and growth in the Above Premium propositions emotional needs Strengthening and broadening our portfolio through new brands and innovation 39
DELIVERING GROWTH & LONG-TERM SHAREHOLDER VALUE A DISCIPLINED APPROACH TO EARNING MORE, USING LESS AND INVESTING WISELY EARN USE INVEST MORE LESS WISELY 40

EARN MORE CONSISTENT, SOLID DELIVERY AGAINST OUR BOTTOM-LINE US UNDERLYING EBITDA ($M) 1,950 26 1,900 25 1,850 24 1,800 1,750 23 1,700 22 Despite Q1 weather and EBITDA EBITDA Margin% 1,650 Underlying Underlying EBITDA ($M) Golden inventory challenges, 21 1,600 we expect our volume and 20 margin to ramp up in the 1,550 second half – and our May 1,500 19 2015 2016 PF 2017 performance supports that Underlying EBITDA EBITDA Margin % expectation Note: Non-GAAP underlying earnings before interest, tax, depreciation and amortization (EBITDA) is calculated by excluding special and other non-core items from the nearest U.S. GAAP 41 earnings. 2016 results are pro forma for the MillerCoors transaction and reflect changes in accounting for pensions and discontinued operations. See reconciliation to nearest U.S. GAAP measures on our website. Underlying EBITDA margin is calculated by dividing underlying EBITDA by net sales.
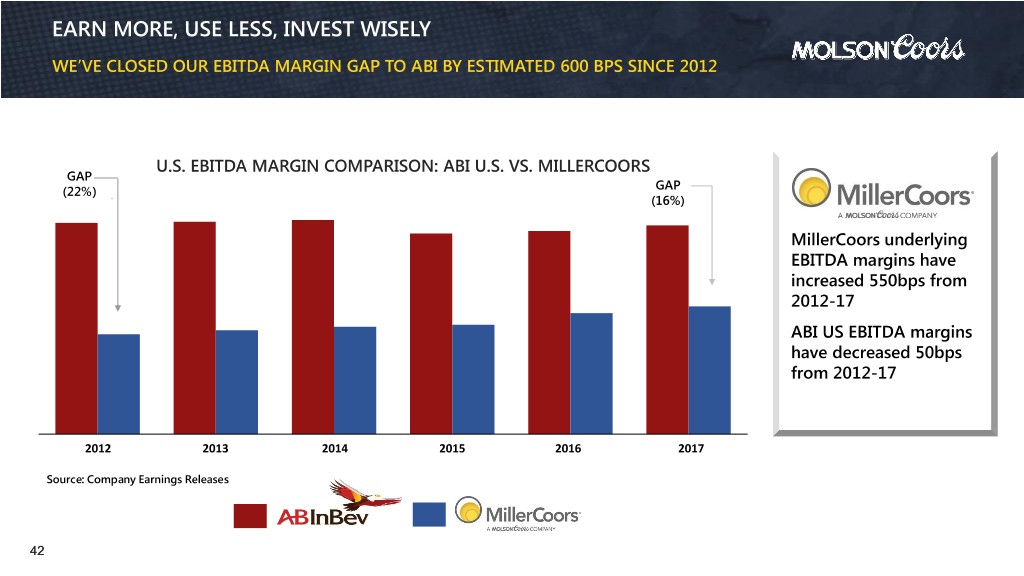
EARN MORE, USE LESS, INVEST WISELY WE’VE CLOSED OUR EBITDA MARGIN GAP TO ABI BY ESTIMATED 600 BPS SINCE 2012 U.S. EBITDA MARGIN COMPARISON: ABI U.S. VS. MILLERCOORS GAP GAP (22%) (16%) MillerCoors underlying EBITDA margins have increased 550bps from 2012-17 ABI US EBITDA margins have decreased 50bps from 2012-17 2012 2013 2014 2015 2016 2017 Source: Company Earnings Releases 42
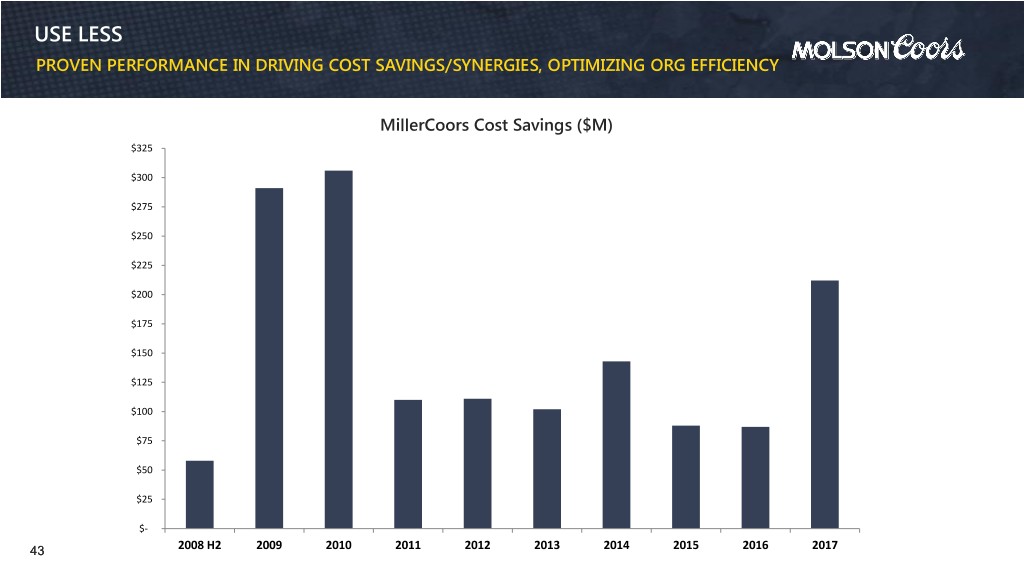
USE LESS PROVEN PERFORMANCE IN DRIVING COST SAVINGS/SYNERGIES, OPTIMIZING ORG EFFICIENCY MillerCoors Cost Savings ($M) $325 $300 $275 $250 $225 $200 $175 $150 $125 $100 $75 $50 $25 $- 43 2008 H2 2009 2010 2011 2012 2013 2014 2015 2016 2017
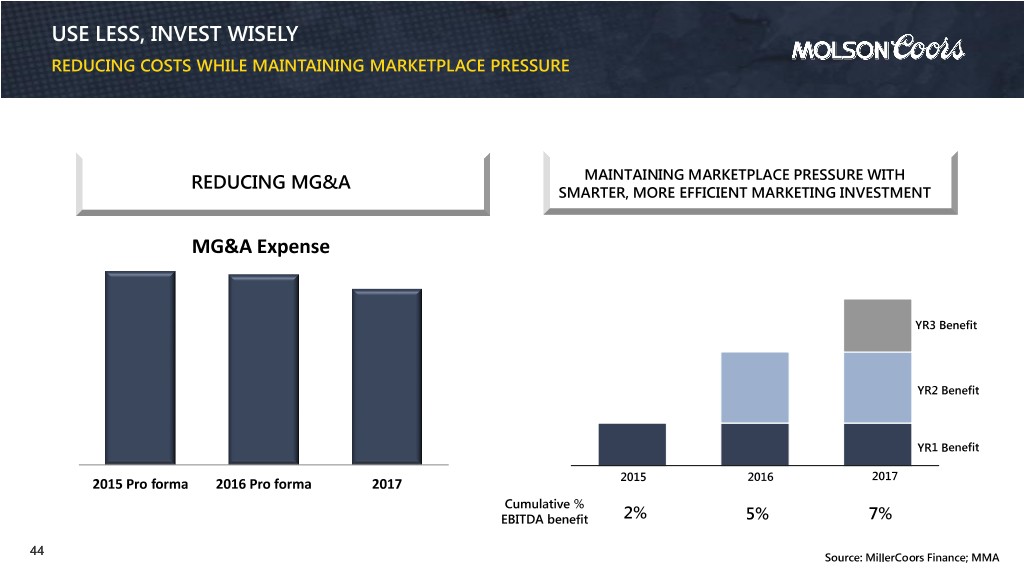
USE LESS, INVEST WISELY REDUCING COSTS WHILE MAINTAINING MARKETPLACE PRESSURE REDUCING MG&A MAINTAINING MARKETPLACE PRESSURE WITH SMARTER, MORE EFFICIENT MARKETING INVESTMENT MG&A Expense YR3 Benefit YR2 Benefit YR1 Benefit 2017 2015 Pro forma 2016 Pro forma 2017 2015 2016 Cumulative % EBITDA benefit 2% 5% 7% 44 Source: MillerCoors Finance; MMA
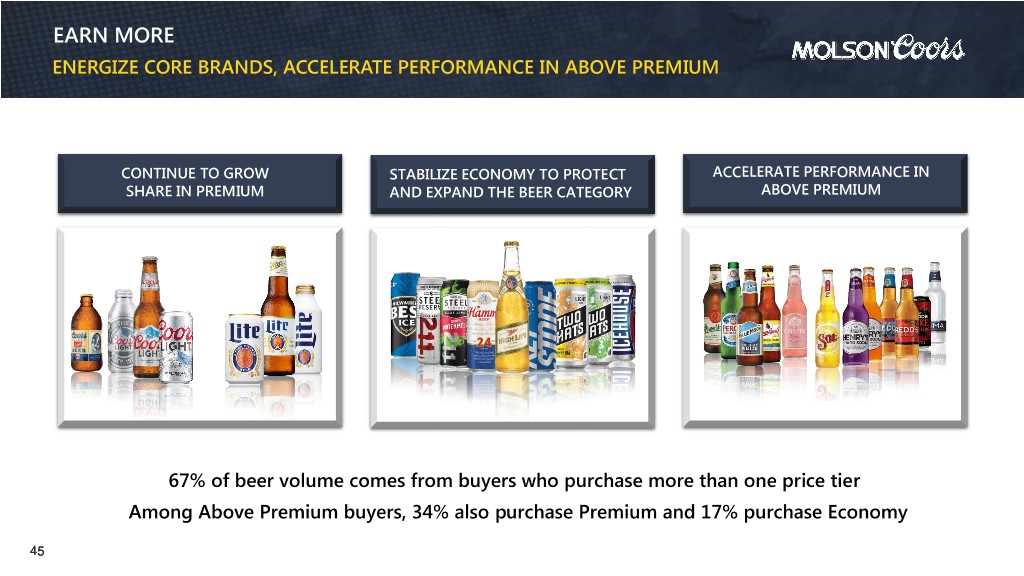
EARN MORE ENERGIZE CORE BRANDS, ACCELERATE PERFORMANCE IN ABOVE PREMIUM CONTINUE TO GROW STABILIZE ECONOMY TO PROTECT ACCELERATE PERFORMANCE IN SHARE IN PREMIUM AND EXPAND THE BEER CATEGORY ABOVE PREMIUM 67% of beer volume comes from buyers who purchase more than one price tier Among Above Premium buyers, 34% also purchase Premium and 17% purchase Economy 45
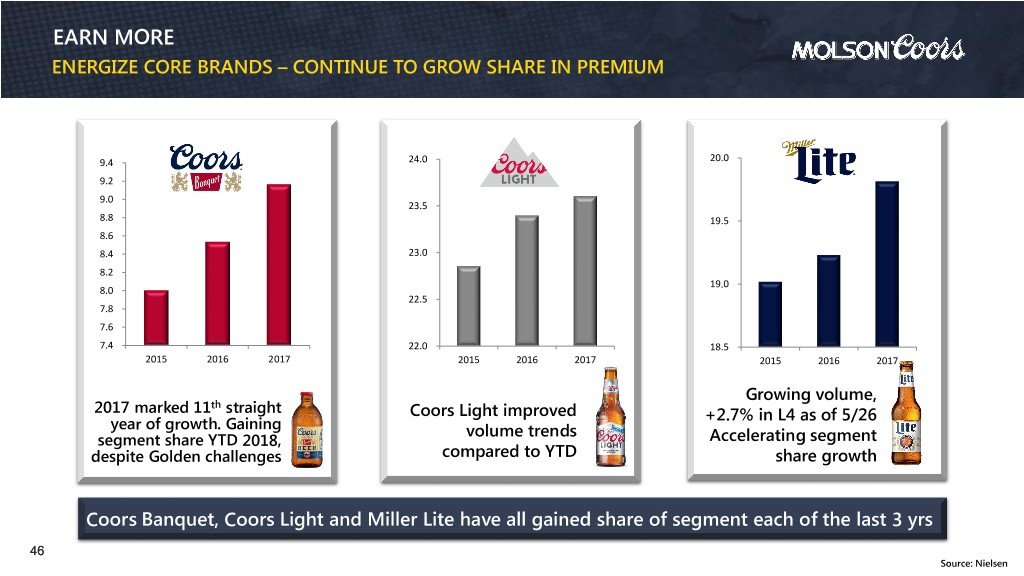
EARN MORE ENERGIZE CORE BRANDS – CONTINUE TO GROW SHARE IN PREMIUM 9.4 24.0 20.0 9.2 9.0 23.5 8.8 19.5 8.6 8.4 23.0 8.2 19.0 8.0 22.5 7.8 7.6 7.4 22.0 18.5 2015 2016 2017 2015 2016 2017 2015 2016 2017 Growing volume, th 2017 marked 11 straight Coors Light improved +2.7% in L4 as of 5/26 year of growth. Gaining volume trends segment share YTD 2018, Accelerating segment despite Golden challenges compared to YTD share growth Coors Banquet, Coors Light and Miller Lite have all gained share of segment each of the last 3 yrs 46 Source: Nielsen
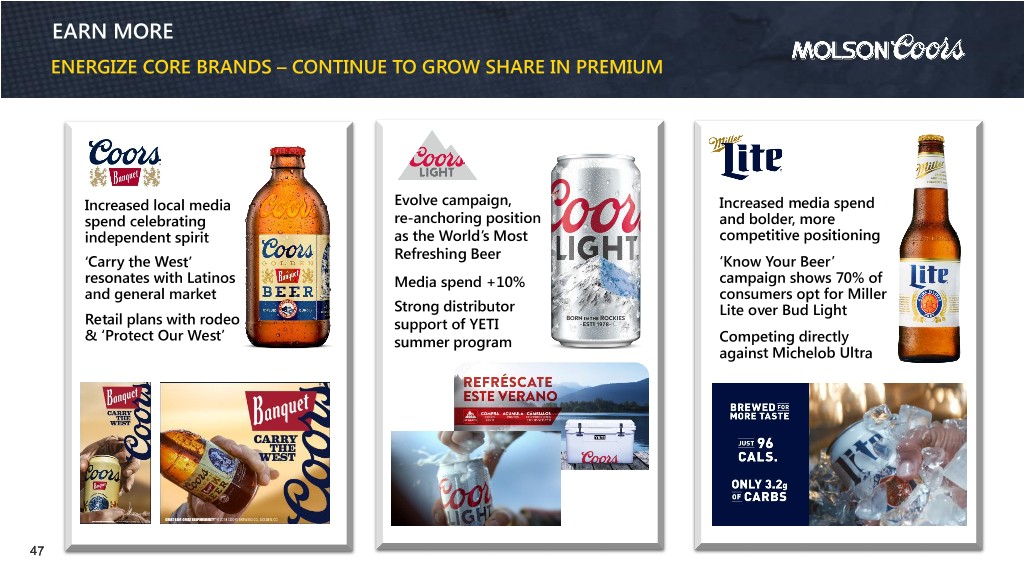
EARN MORE ENERGIZE CORE BRANDS – CONTINUE TO GROW SHARE IN PREMIUM Increased local media Evolve campaign, Increased media spend spend celebrating re-anchoring position and bolder, more independent spirit as the World’s Most competitive positioning Refreshing Beer ‘Carry the West’ ‘Know Your Beer’ resonates with Latinos Media spend +10% campaign shows 70% of and general market consumers opt for Miller Strong distributor Lite over Bud Light Retail plans with rodeo support of YETI & ‘Protect Our West’ summer program Competing directly against Michelob Ultra 47
AD SPOTS 48
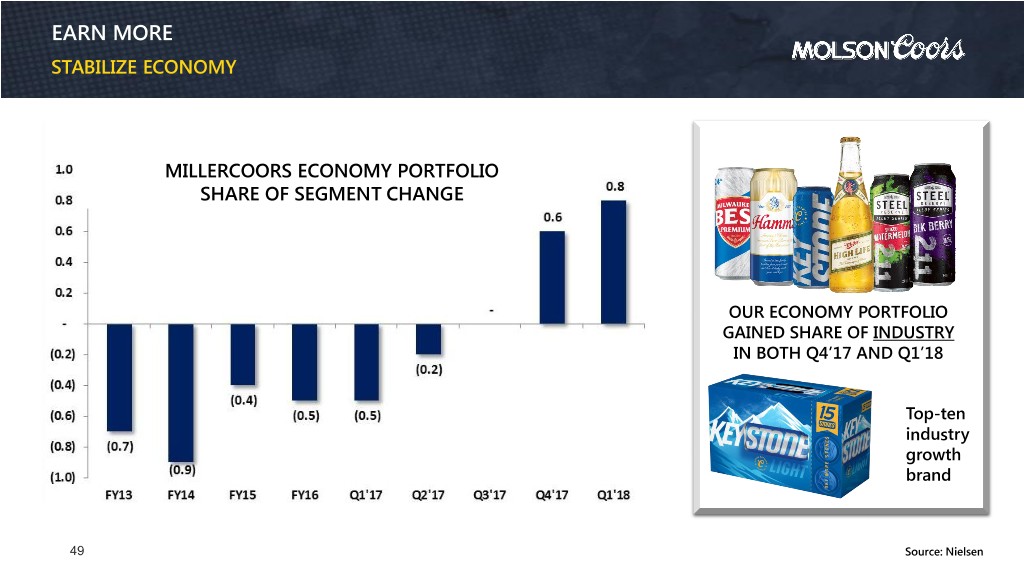
EARN MORE STABILIZE ECONOMY MILLERCOORS ECONOMY PORTFOLIO SHARE OF SEGMENT CHANGE OUR ECONOMY PORTFOLIO GAINED SHARE OF INDUSTRY IN BOTH Q4’17 AND Q1’18 Top-ten industry growth brand 49 Source: Nielsen
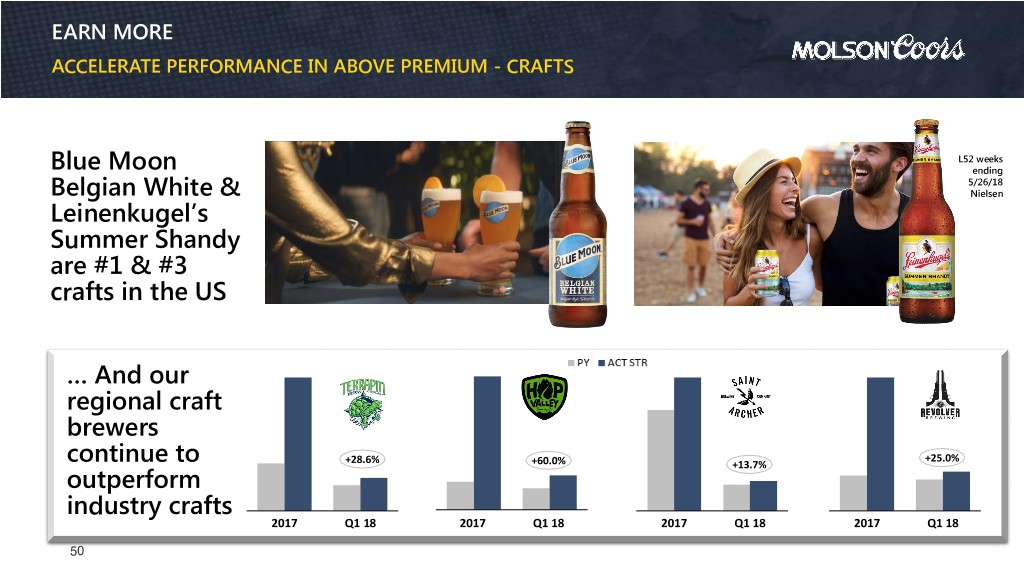
EARN MORE ACCELERATE PERFORMANCE IN ABOVE PREMIUM - CRAFTS L52 weeks Blue Moon ending 5/26/18 Belgian White & Nielsen Leinenkugel’s Summer Shandy are #1 & #3 crafts in the US … And our regional craft brewers +25.0% continue to +28.6% +60.0% +13.7% outperform industry crafts 2017 Q1 18 2017 Q1 18 2017 Q1 18 2017 Q1 18 50
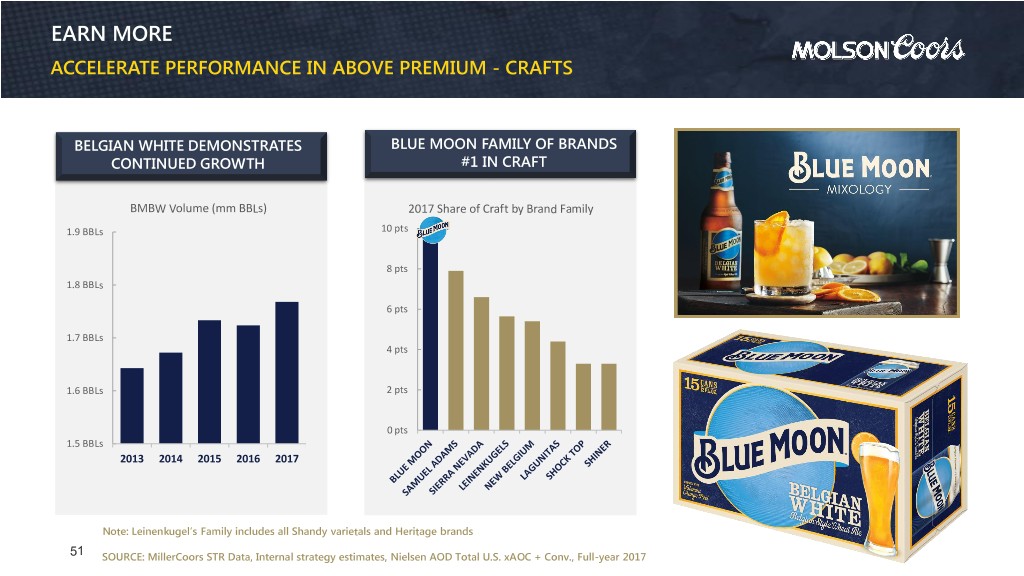
EARN MORE ACCELERATE PERFORMANCE IN ABOVE PREMIUM - CRAFTS BELGIAN WHITE DEMONSTRATES BLUE MOON FAMILY OF BRANDS CONTINUED GROWTH #1 IN CRAFT BMBW Volume (mm BBLs) 2017 Share of Craft by Brand Family 1.9 BBLs 10 pts 8 pts 1.8 BBLs 6 pts 1.7 BBLs 4 pts 1.6 BBLs 2 pts 0 pts 1.5 BBLs 2013 2014 2015 2016 2017 Note: Leinenkugel’s Family includes all Shandy varietals and Heritage brands 51 SOURCE: MillerCoors STR Data, Internal strategy estimates, Nielsen AOD Total U.S. xAOC + Conv., Full-year 2017
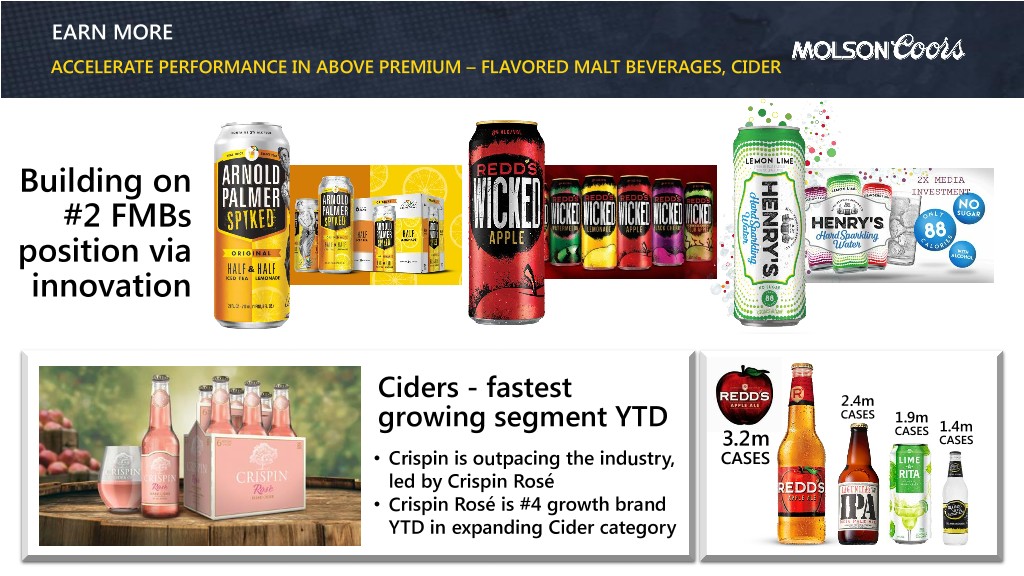
EARN MORE ACCELERATE PERFORMANCE IN ABOVE PREMIUM – FLAVORED MALT BEVERAGES, CIDER Building on #2 FMBs position via innovation Ciders - fastest 2.4m CASES 1.9m growing segment YTD CASES 1.4m 3.2m CASES • Crispin is outpacing the industry, CASES led by Crispin Rosé • Crispin Rosé is #4 growth brand YTD in expanding Cider category 52
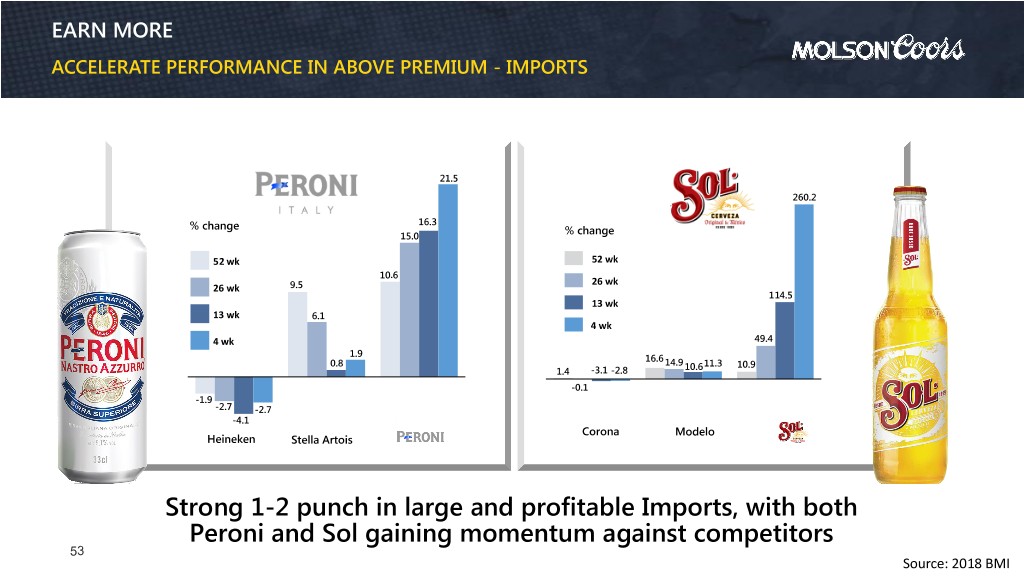
EARN MORE ACCELERATE PERFORMANCE IN ABOVE PREMIUM - IMPORTS 21.5 260.2 % change 16.3 15.0 % change 52 wk 52 wk 10.6 26 wk 26 wk 9.5 114.5 13 wk 13 wk 6.1 4 wk 4 wk 49.4 1.9 16.6 0.8 14.9 11.3 10.9 1.4 -3.1 -2.8 10.6 -0.1 -1.9 -2.7 -2.7 -4.1 Corona Modelo Heineken Stella Artois Strong 1-2 punch in large and profitable Imports, with both Peroni and Sol gaining momentum against competitors 53 Source: 2018 BMI
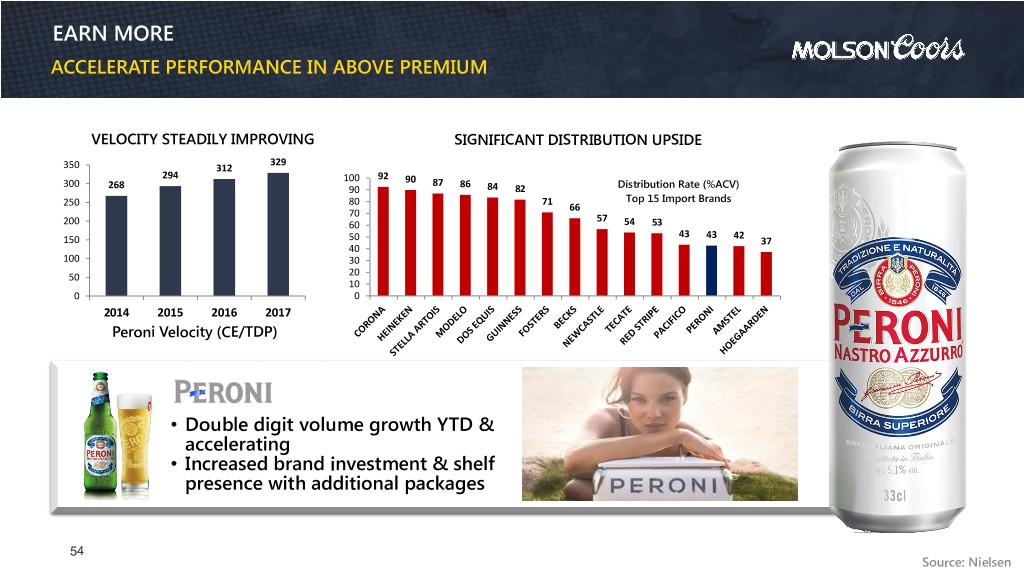
EARN MORE ACCELERATE PERFORMANCE IN ABOVE PREMIUM VELOCITY STEADILY IMPROVING SIGNIFICANT DISTRIBUTION UPSIDE 329 350 312 294 100 92 300 90 87 86 Distribution Rate (%ACV) 268 90 84 82 80 71 Top 15 Import Brands 250 66 70 57 200 60 54 53 43 43 42 150 50 37 40 100 30 50 20 10 0 0 2014 2015 2016 2017 Peroni Velocity (CE/TDP) • Double digit volume growth YTD & accelerating • Increased brand investment & shelf presence with additional packages 54 Source: Nielsen
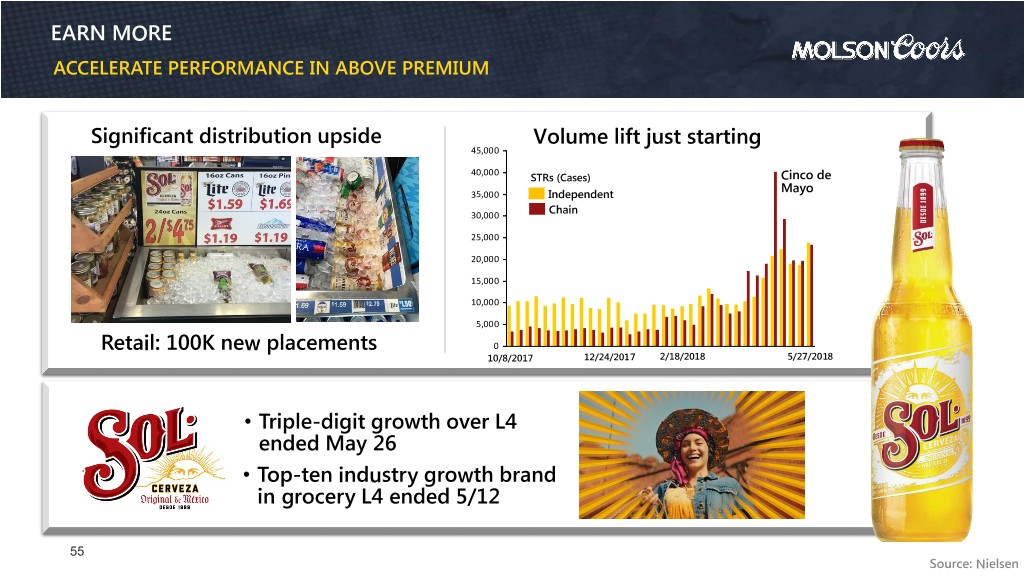
EARN MORE ACCELERATE PERFORMANCE IN ABOVE PREMIUM Significant distribution upside Volume lift just starting 45,000 40,000 STRs (Cases) Cinco de Mayo 35,000 Independent Chain 30,000 25,000 20,000 15,000 10,000 5,000 Retail: 100K new placements 0 10/8/2017 12/24/2017 2/18/2018 5/27/2018 • Triple-digit growth over L4 ended May 26 • Top-ten industry growth brand in grocery L4 ended 5/12 55 Source: Nielsen
SOL AD SPOT 56
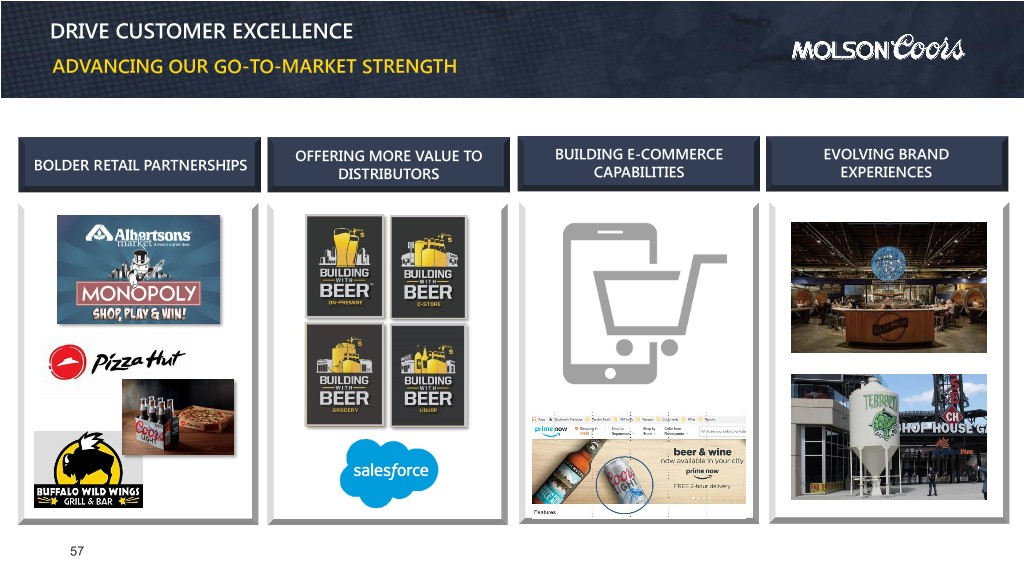
DRIVE CUSTOMER EXCELLENCE ADVANCING OUR GO-TO-MARKET STRENGTH OFFERING MORE VALUE TO BUILDING E-COMMERCE EVOLVING BRAND BOLDER RETAIL PARTNERSHIPS DISTRIBUTORS CAPABILITIES EXPERIENCES 57
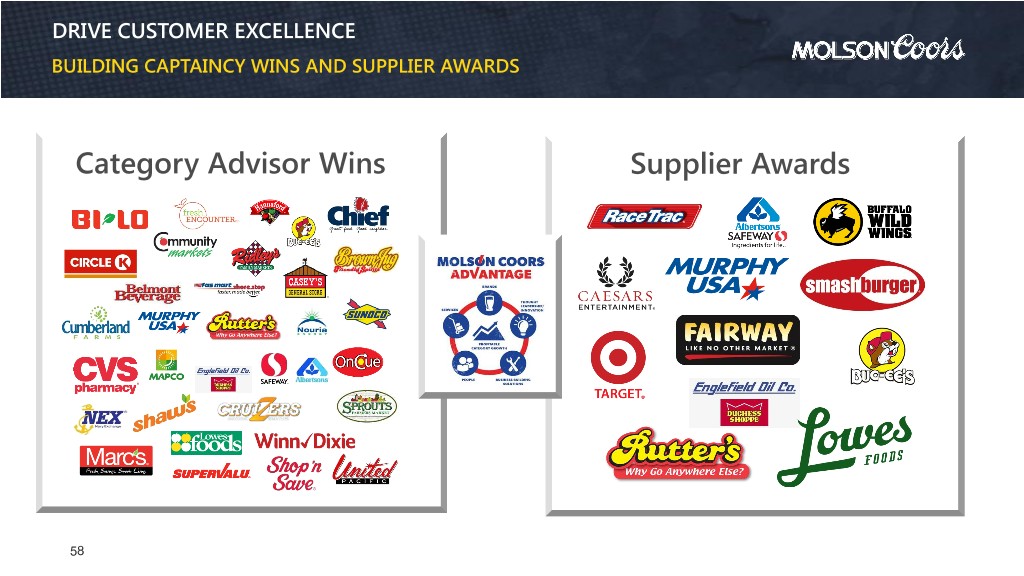
DRIVE CUSTOMER EXCELLENCE BUILDING CAPTAINCY WINS AND SUPPLIER AWARDS Category Advisor Wins Supplier Awards 58
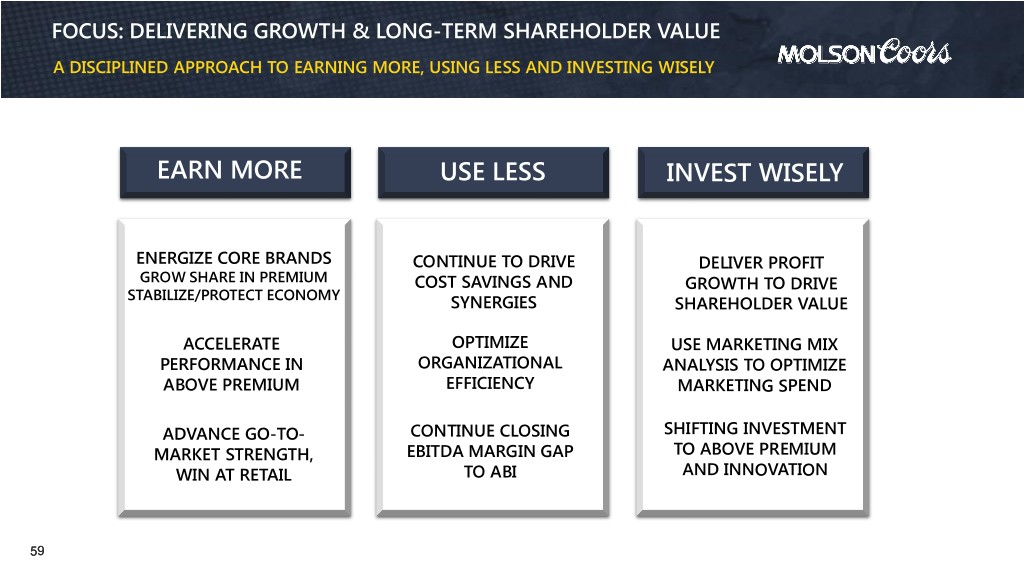
FOCUS: DELIVERING GROWTH & LONG-TERM SHAREHOLDER VALUE A DISCIPLINED APPROACH TO EARNING MORE, USING LESS AND INVESTING WISELY EARN MORE USE LESS INVEST WISELY ENERGIZE CORE BRANDS CONTINUE TO DRIVE DELIVER PROFIT GROW SHARE IN PREMIUM COST SAVINGS AND GROWTH TO DRIVE STABILIZE/PROTECT ECONOMY SYNERGIES SHAREHOLDER VALUE ACCELERATE OPTIMIZE USE MARKETING MIX PERFORMANCE IN ORGANIZATIONAL ANALYSIS TO OPTIMIZE ABOVE PREMIUM EFFICIENCY MARKETING SPEND ADVANCE GO-TO- CONTINUE CLOSING SHIFTING INVESTMENT MARKET STRENGTH, EBITDA MARGIN GAP TO ABOVE PREMIUM WIN AT RETAIL TO ABI AND INNOVATION 59
Q1 EARNINGS - MAY 2, 2018 TRACEY JOUBERT C F O , M O L S O N C O O R S 60
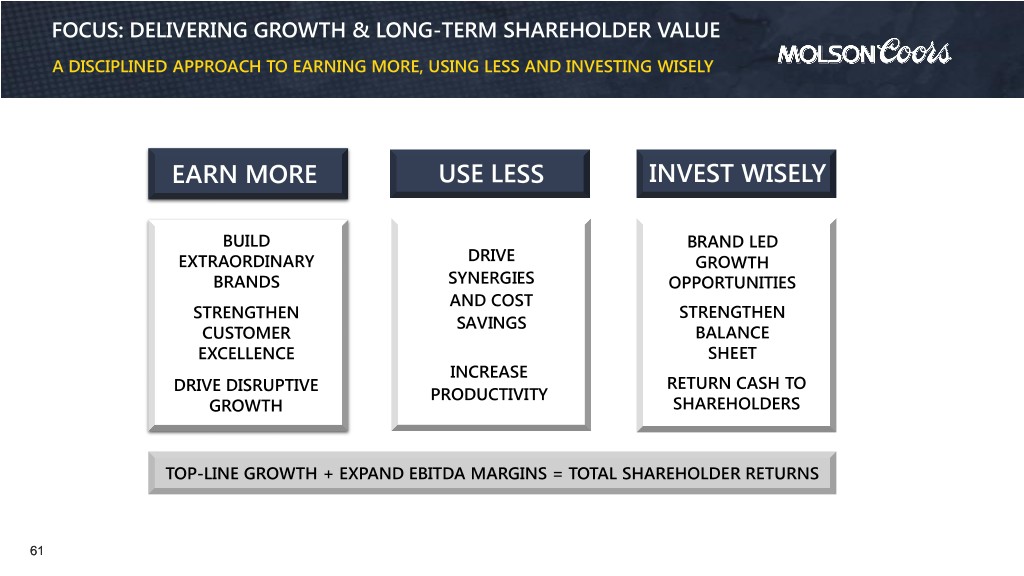
FOCUS: DELIVERING GROWTH & LONG-TERM SHAREHOLDER VALUE A DISCIPLINED APPROACH TO EARNING MORE, USING LESS AND INVESTING WISELY EARN MORE USE LESS INVEST WISELY BUILD BRAND LED EXTRAORDINARY DRIVE GROWTH BRANDS SYNERGIES OPPORTUNITIES AND COST STRENGTHEN STRENGTHEN SAVINGS CUSTOMER BALANCE EXCELLENCE SHEET INCREASE DRIVE DISRUPTIVE RETURN CASH TO PRODUCTIVITY GROWTH SHAREHOLDERS TOP-LINE GROWTH + EXPAND EBITDA MARGINS = TOTAL SHAREHOLDER RETURNS 61
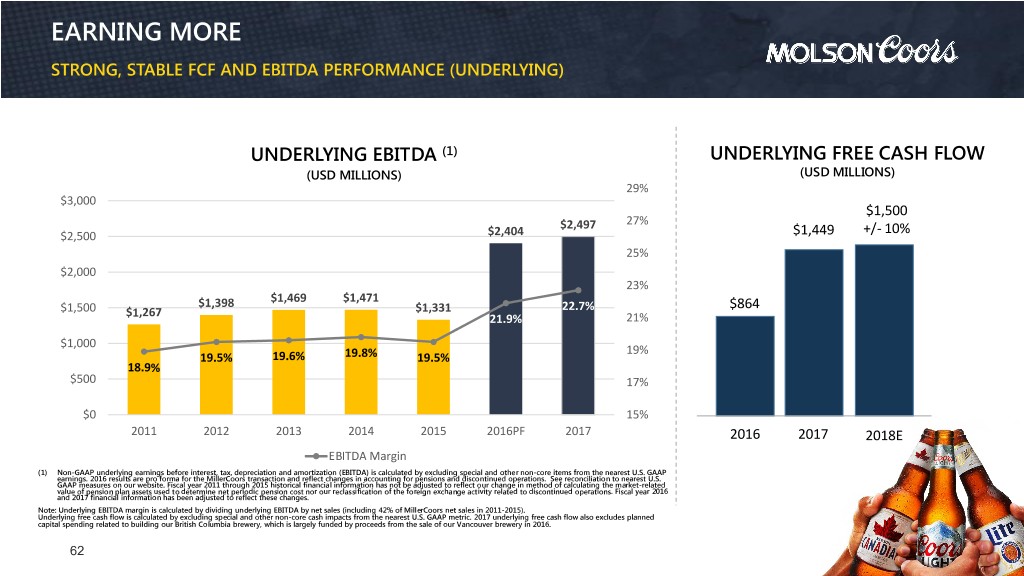
EARNING MORE STRONG, STABLE FCF AND EBITDA PERFORMANCE (UNDERLYING) UNDERLYING EBITDA (1) UNDERLYING FREE CASH FLOW (USD MILLIONS) (USD MILLIONS) 29% $3,000 $1,500 27% $2,497 +/- 10% $2,500 $2,404 $1,449 25% $2,000 23% $1,398 $1,469 $1,471 $864 $1,500 $1,267 $1,331 22.7% 21.9% 21% $1,000 19% 19.5% 19.6% 19.8% 19.5% 18.9% $500 17% $0 15% 2011 2012 2013 2014 2015 2016PF 2017 2016 2017 2018E EBITDA Margin (1) Non-GAAP underlying earnings before interest, tax, depreciation and amortization (EBITDA) is calculated by excluding special and other non-core items from the nearest U.S. GAAP earnings. 2016 results are pro forma for the MillerCoors transaction and reflect changes in accounting for pensions and discontinued operations. See reconciliation to nearest U.S. GAAP measures on our website. Fiscal year 2011 through 2015 historical financial information has not be adjusted to reflect our change in method of calculating the market-related value of pension plan assets used to determine net periodic pension cost nor our reclassification of the foreign exchange activity related to discontinued operations. Fiscal year 2016 and 2017 financial information has been adjusted to reflect these changes. Note: Underlying EBITDA margin is calculated by dividing underlying EBITDA by net sales (including 42% of MillerCoors net sales in 2011-2015). Underlying free cash flow is calculated by excluding special and other non-core cash impacts from the nearest U.S. GAAP metric. 2017 underlying free cash flow also excludes planned capital spending related to building our British Columbia brewery, which is largely funded by proceeds from the sale of our Vancouver brewery in 2016. 62
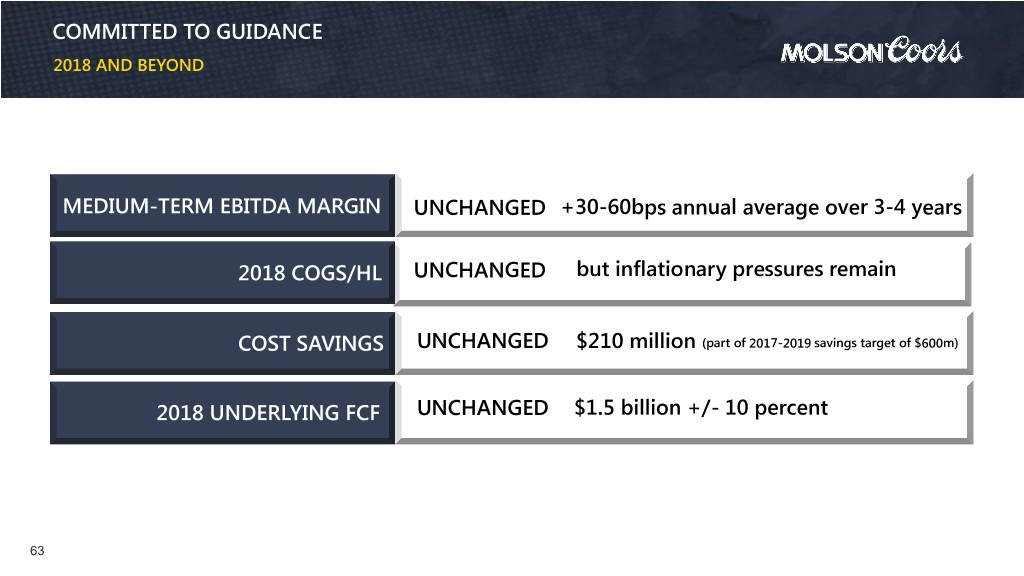
COMMITTED TO GUIDANCE 2018 AND BEYOND MEDIUM-TERM EBITDA MARGIN UNCHANGED +30-60bps annual average over 3-4 years 2018 COGS/HL UNCHANGED but inflationary pressures remain COST SAVINGS UNCHANGED $210 million (part of 2017-2019 savings target of $600m) 2018 UNDERLYING FCF UNCHANGED $1.5 billion +/- 10 percent 63
USE LESS
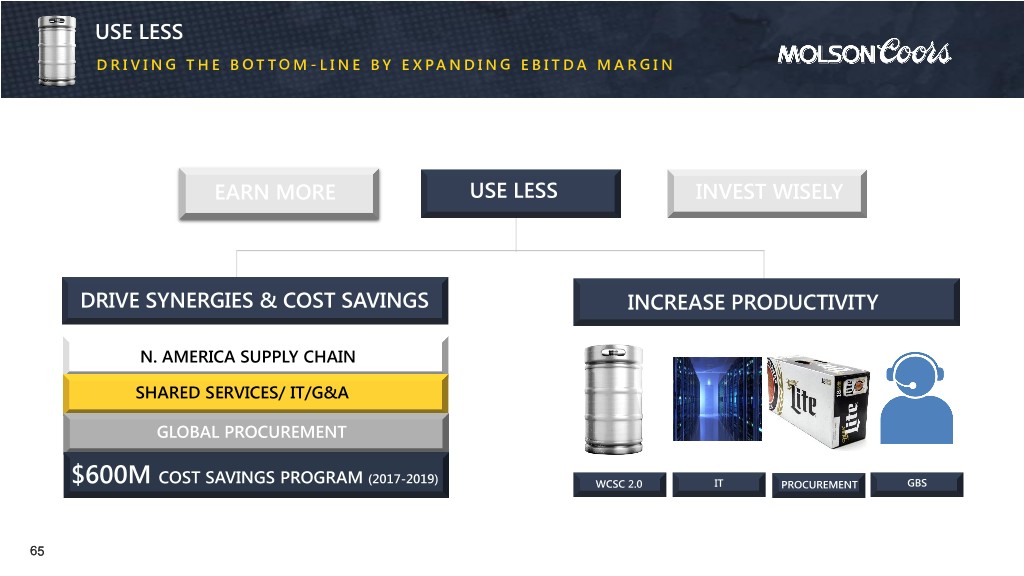
USE LESS D R I V I N G T H E B O T T O M - L I N E B Y E X P A N D I N G E B I T D A M A R G I N E N H A N C E D C O M M E R C I A L C A P A B I L I T I E S W I L L D R I V E T O P & B O T T O M L I N E EARN MORE USE LESS INVEST WISELY DRIVE SYNERGIES & COST SAVINGS INCREASE PRODUCTIVITY N. AMERICA SUPPLY CHAIN SHARED SERVICES/ IT/G&A GLOBAL PROCUREMENT $600M COST SAVINGS PROGRAM (2017-2019) WCSC 2.0 IT PROCUREMENT GBS 65
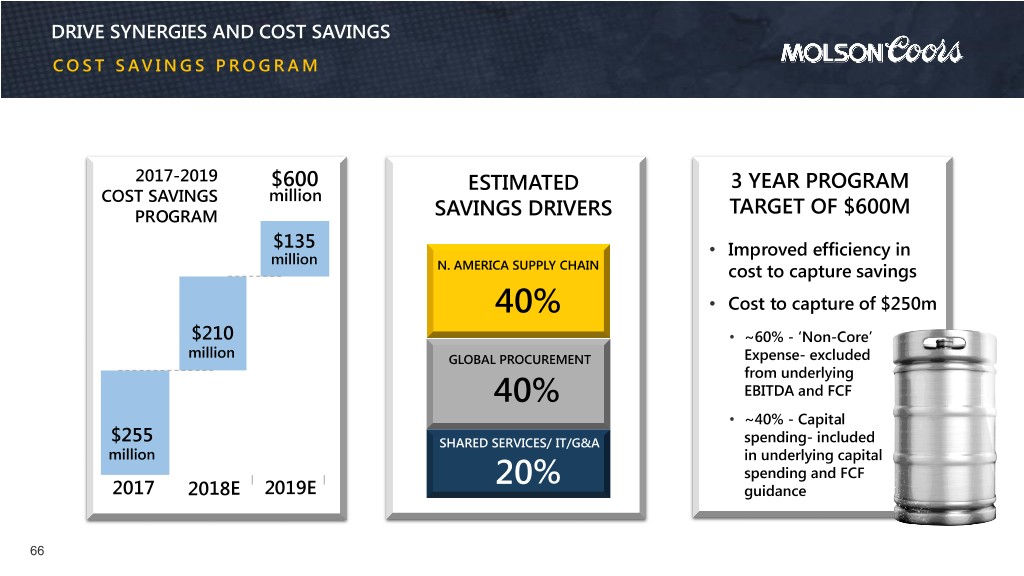
DRIVE SYNERGIES AND COST SAVINGS C O S T S A V I N G S P R O G R A M 2017-2019 $600 ESTIMATED 3 YEAR PROGRAM COST SAVINGS million PROGRAM SAVINGS DRIVERS TARGET OF $600M $135 • Improved efficiency in million N. AMERICA SUPPLY CHAIN cost to capture savings • Cost to capture of $250m 2018E 40% $210 • ~60% - ‘Non-Core’ million GLOBAL PROCUREMENT Expense- excluded from underlying 40% EBITDA and FCF • ~40% - Capital $255 SHARED SERVICES/ IT/G&A spending- included million in underlying capital 20% spending and FCF 2017 2018E 2019E guidance 66
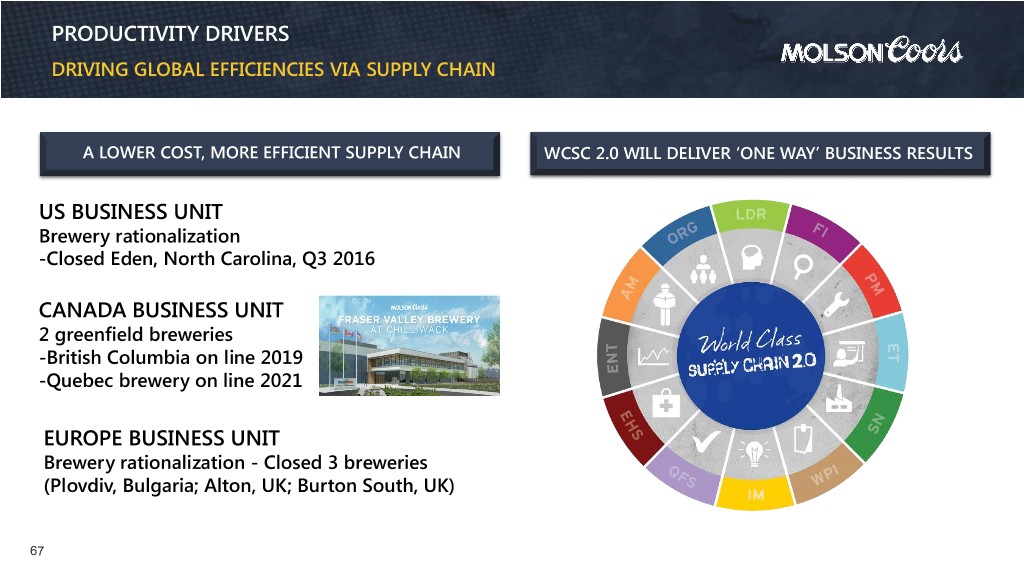
PRODUCTIVITY DRIVERS DRIVING GLOBAL EFFICIENCIES VIA SUPPLY CHAIN A LOWER COST, MORE EFFICIENT SUPPLY CHAIN WCSC 2.0 WILL DELIVER ‘ONE WAY’ BUSINESS RESULTS US BUSINESS UNIT Brewery rationalization -Closed Eden, North Carolina, Q3 2016 CANADA BUSINESS UNIT 2 greenfield breweries -British Columbia on line 2019 -Quebec brewery on line 2021 EUROPE BUSINESS UNIT Brewery rationalization - Closed 3 breweries (Plovdiv, Bulgaria; Alton, UK; Burton South, UK) 67
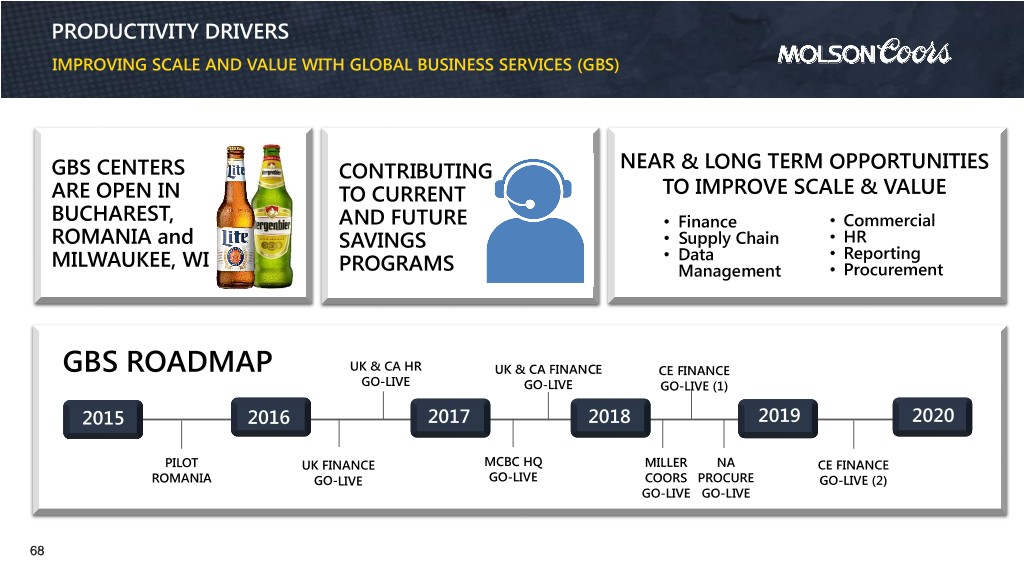
PRODUCTIVITY DRIVERS IMPROVING SCALE AND VALUE WITH GLOBAL BUSINESS SERVICES (GBS) GBS CENTERS CONTRIBUTING NEAR & LONG TERM OPPORTUNITIES ARE OPEN IN TO CURRENT TO IMPROVE SCALE & VALUE BUCHAREST, AND FUTURE • Finance • Commercial ROMANIA and SAVINGS • Supply Chain • HR MILWAUKEE, WI • Data • Reporting PROGRAMS Management • Procurement GBS ROADMAP UK & CA HR UK & CA FINANCE CE FINANCE GO-LIVE GO-LIVE GO-LIVE (1) 2015 2016 2017 2018 2019 2020 PILOT UK FINANCE MCBC HQ MILLER NA CE FINANCE ROMANIA GO-LIVE GO-LIVE COORS PROCURE SlideGO 10-LIVE (2) GO-LIVE GO-LIVE 68
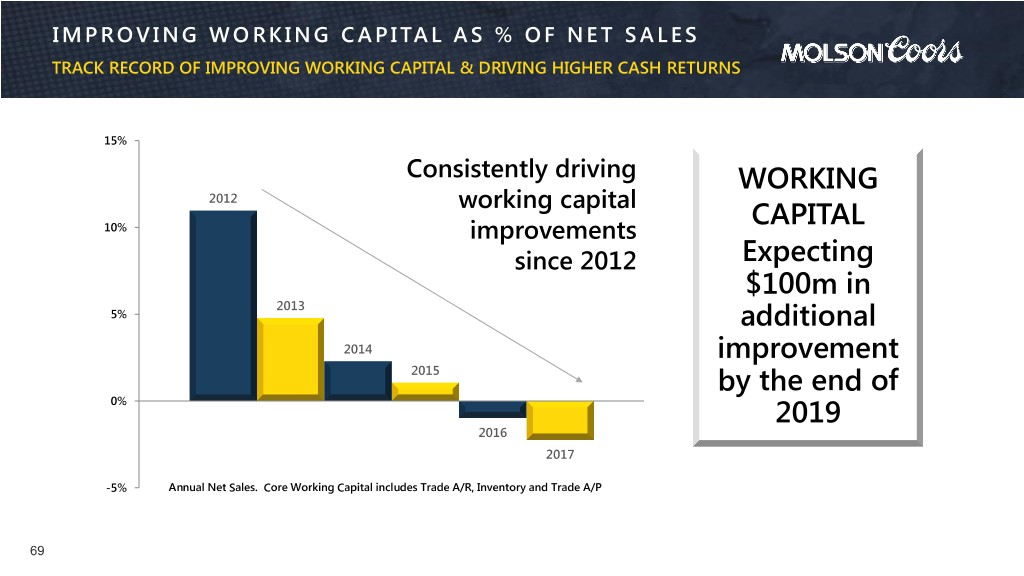
I M P R O V I N G W O R K I N G C A P I TA L A S % O F N E T S A L E S TRACK RECORD OF IMPROVING WORKING CAPITAL & DRIVING HIGHER CASH RETURNS 15% Consistently driving WORKING 2012 working capital CAPITAL 10% improvements since 2012 Expecting $100m in 2013 5% additional 2014 improvement 2015 by the end of 0% 2019 2016 2017 -5% Annual Net Sales. Core Working Capital includes Trade A/R, Inventory and Trade A/P 69
I N V E S T W I S E LY CAPITAL ALLOCATION

INVEST WISELY DRIVING SHAREHOLDER RETURN EARN MORE USE LESS INVEST WISELY CAPITAL ALLOCATION PRIORITIES BRAND LED GROWTH STRENGTHEN RETURN CASH TO OPPORTUNITIES BALANCE SHEET SHAREHOLDERS Underpinned by PACC model 71
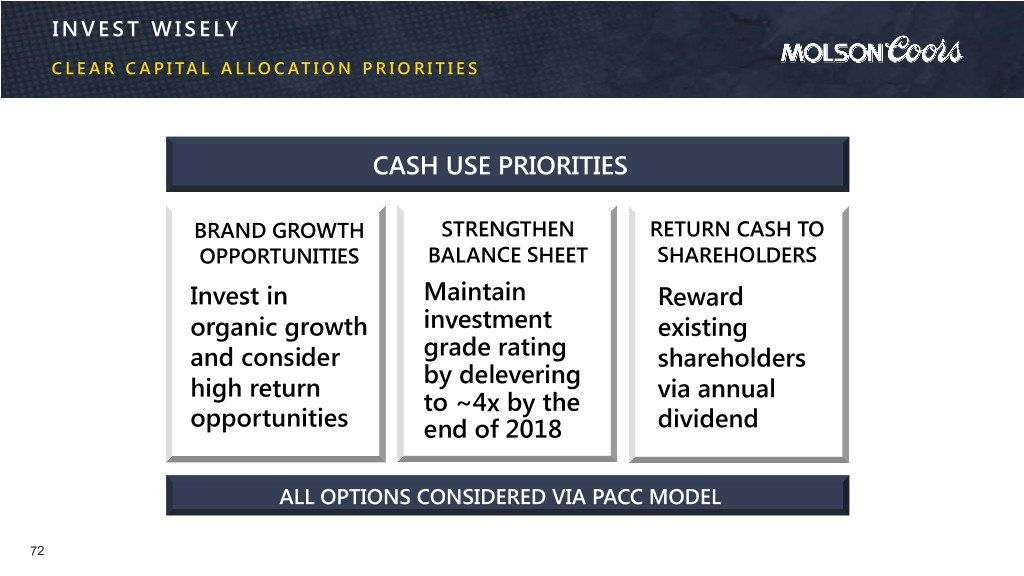
I N V E S T W I S E LY C L E A R C A P I TA L A L L O C AT I O N P R I O R I T I E S CASH USE PRIORITIES USE LESS INVEST WISELY BRAND GROWTH STRENGTHEN RETURN CASH TO OPPORTUNITIES BALANCE SHEET SHAREHOLDERS Invest in Maintain Reward organic growth investment existing and consider grade rating shareholders by delevering high return via annual to ~4x by the opportunities end of 2018 dividend ALL OPTIONS CONSIDERED VIA PACC MODEL 72
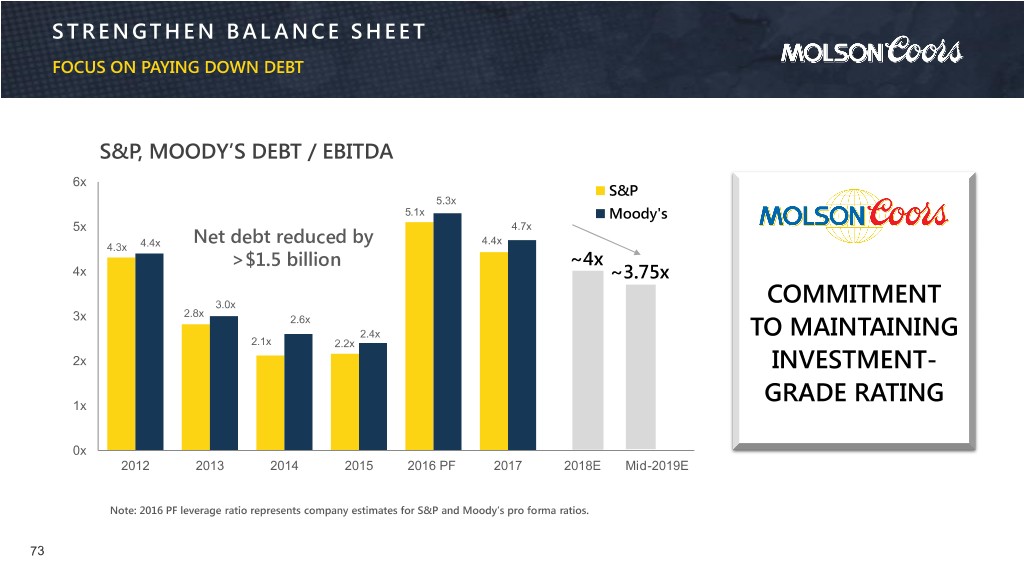
S T R E N GT H E N B A L A N C E S H E E T FOCUS ON PAYING DOWN DEBT S&P, MOODY’S DEBT / EBITDA 6x S&P 5.3x 5.1x Moody's 5x 4.7x Net debt reduced by 4.4x 4.3x 4.4x >$1.5 billion ~4x 4x ~3.75x 3.0x COMMITMENT 2.8x 3x 2.6x 2.4x TO MAINTAINING 2.1x 2.2x 2x INVESTMENT- 1x GRADE RATING 0x 2012 2013 2014 2015 2016 PF 2017 2018E Mid-2019E Note: 2016 PF leverage ratio represents company estimates for S&P and Moody’s pro forma ratios. 73
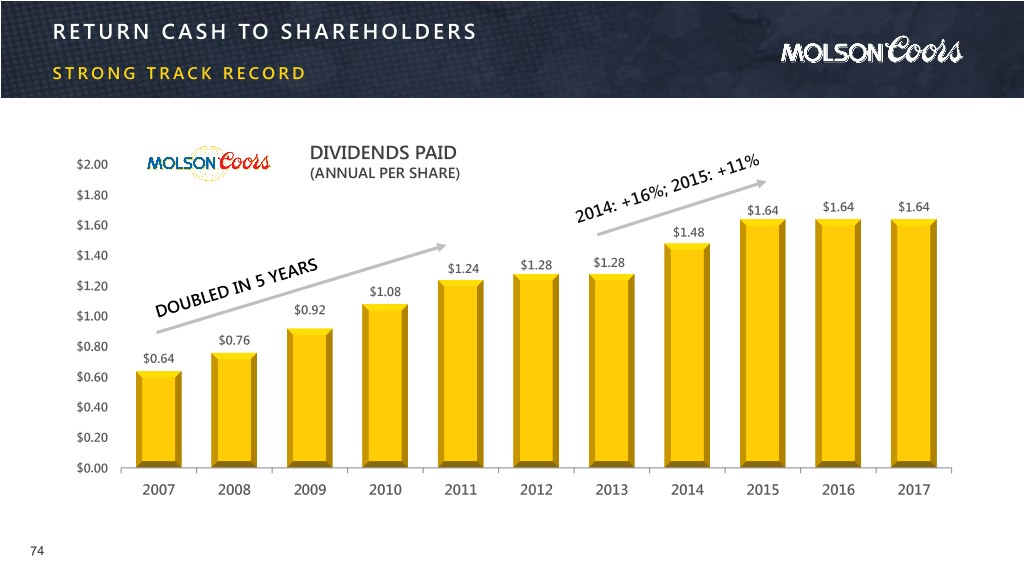
R E T U R N C A S H TO S H A R E H O L D E R S S T R O N G T R A C K R E C O R D DIVIDENDS PAID $2.00 (ANNUAL PER SHARE) $1.80 $1.64 $1.64 $1.64 $1.60 $1.48 $1.40 $1.24 $1.28 $1.28 $1.20 $1.08 $1.00 $0.92 $0.80 $0.76 $0.64 $0.60 $0.40 $0.20 $0.00 2007 2008 2009 2010 2011 2012 2013 2014 2015 2016 2017 74
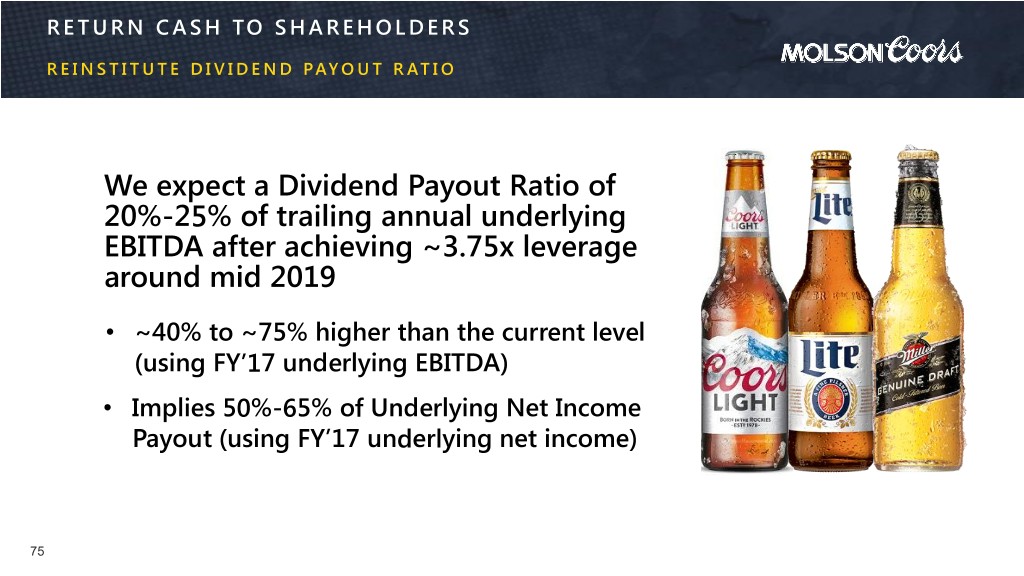
R E T U R N C A S H TO S H A R E H O L D E R S R E I N S T I T U T E D I V I D E N D PAY O U T R AT I O We expect a Dividend Payout Ratio of 20%-25% of trailing annual underlying EBITDA after achieving ~3.75x leverage around mid 2019 • ~40% to ~75% higher than the current level (using FY’17 underlying EBITDA) • Implies 50%-65% of Underlying Net Income Payout (using FY’17 underlying net income) 75
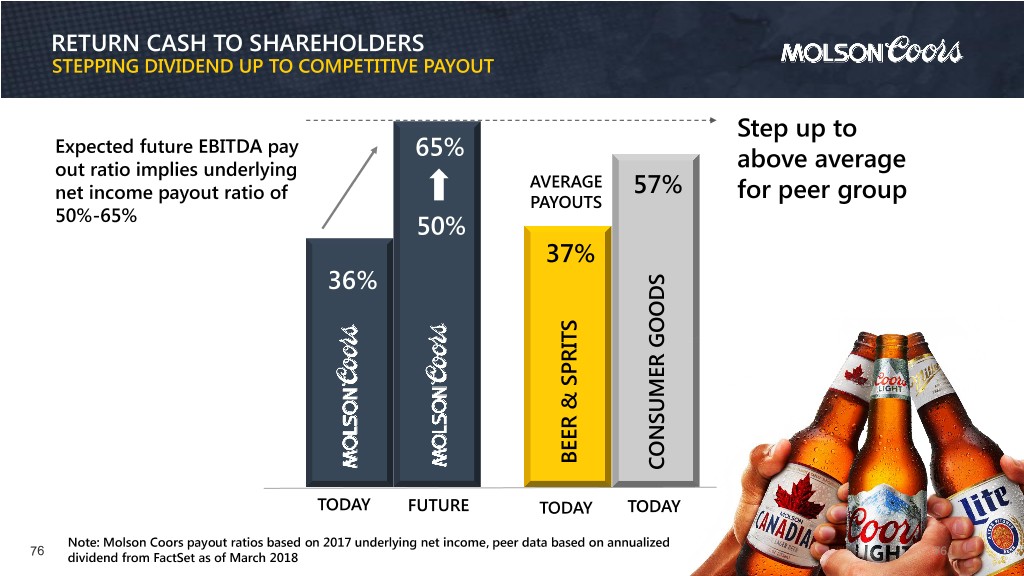
RETURN CASH TO SHAREHOLDERS STEPPING DIVIDEND UP TO COMPETITIVE PAYOUT Step up to Expected future EBITDA pay 65% out ratio implies underlying above average AVERAGE net income payout ratio of 57% PAYOUTS for peer group 50%-65% 50% 37% 36% BEER SPRITS & BEER CONSUMER GOODS CONSUMER TODAY FUTURE TODAY TODAY Note: Molson Coors payout ratios based on 2017 underlying net income, peer data based on annualized 76 76 dividend from FactSet as of March 2018
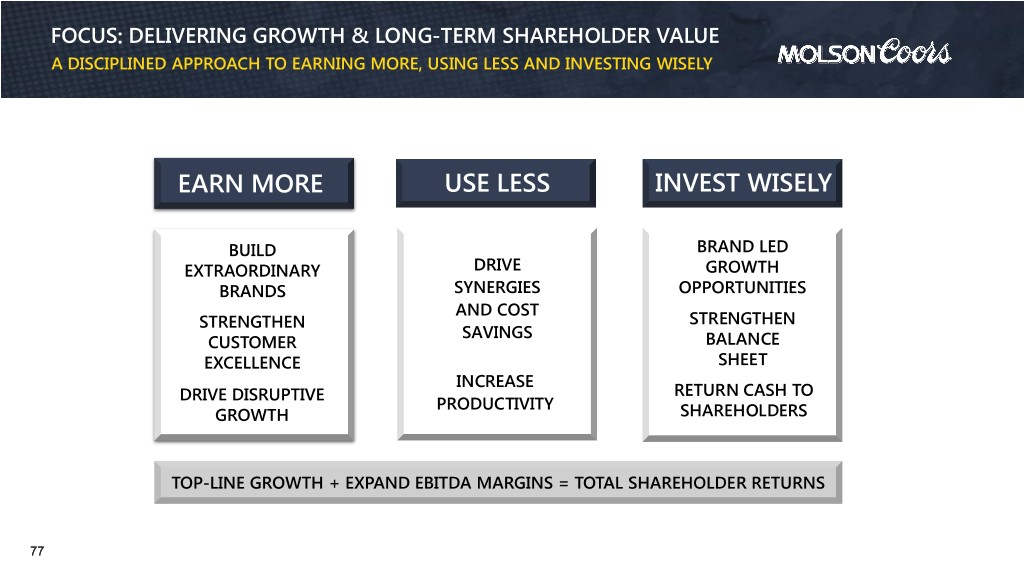
FOCUS: DELIVERING GROWTH & LONG-TERM SHAREHOLDER VALUE A DISCIPLINED APPROACH TO EARNING MORE, USING LESS AND INVESTING WISELY EARN MORE USE LESS INVEST WISELY BUILD BRAND LED EXTRAORDINARY DRIVE GROWTH BRANDS SYNERGIES OPPORTUNITIES AND COST STRENGTHEN STRENGTHEN SAVINGS CUSTOMER BALANCE EXCELLENCE SHEET INCREASE DRIVE DISRUPTIVE RETURN CASH TO PRODUCTIVITY GROWTH SHAREHOLDERS TOP-LINE GROWTH + EXPAND EBITDA MARGINS = TOTAL SHAREHOLDER RETURNS 77
Q1 EARNINGS - MAY 2, 2018 MARK HUNTER C E O , M O L S O N C O O R S 78
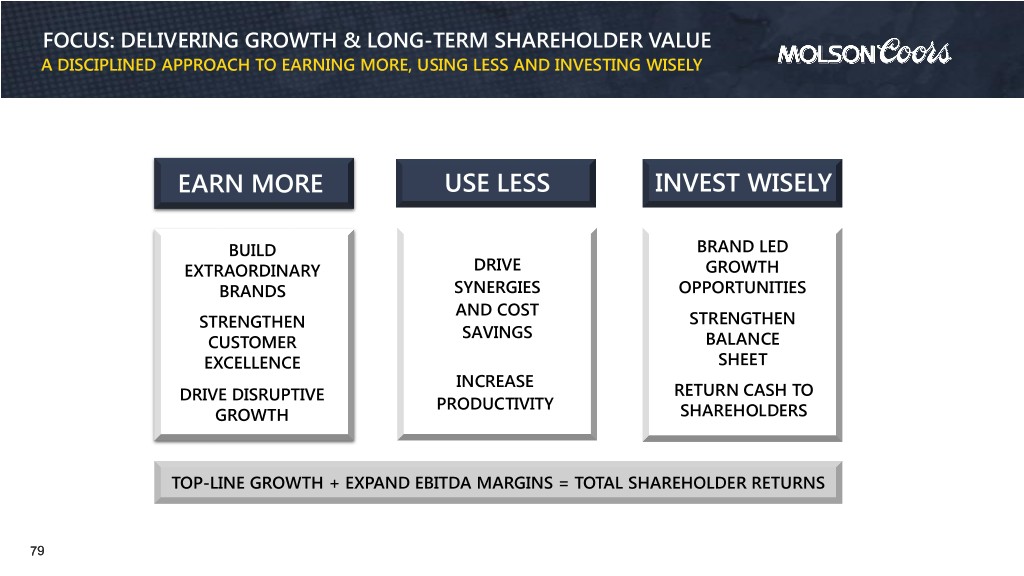
FOCUS: DELIVERING GROWTH & LONG-TERM SHAREHOLDER VALUE A DISCIPLINED APPROACH TO EARNING MORE, USING LESS AND INVESTING WISELY EARN MORE USE LESS INVEST WISELY BUILD BRAND LED EXTRAORDINARY DRIVE GROWTH BRANDS SYNERGIES OPPORTUNITIES AND COST STRENGTHEN STRENGTHEN SAVINGS CUSTOMER BALANCE EXCELLENCE SHEET INCREASE DRIVE DISRUPTIVE RETURN CASH TO PRODUCTIVITY GROWTH SHAREHOLDERS TOP-LINE GROWTH + EXPAND EBITDA MARGINS = TOTAL SHAREHOLDER RETURNS 79

2018 KEY TAKEAWAYS COMMITTED TO DEBT PAYDOWN IMPROVE THE REWARD 2018 GUIDANCE & MAXIMIZING TOP-LINE VIA SHAREHOLDERS DESPITE Q1 CASH, PROTECT COMMERCIAL WITH CAPITAL CHALLENGES BOTTOM-LINE EXCELLENCE RETURNS 80
Q1 EARNINGS - MAY 2, 2018 Q&A 81


