Exhibit 99.1
Smarter Choice
Financials
AMD’s and ATI’s reporting periods have been aligned as follows: AMD’s Q3FY06, as reported, has been combined with ATI’s Q4FY06: AMD’s Q2FY06, as reported, has been combined with ATI’s Q3FY06, as reported, etc. Last four quarters = AMD’s Q4FY05 – Q3FY06; ATI’s Q1FY06 – Q4FY06. AMD’s financials, as reported, exclude the Memory Products segment. Historical ATI financials have been conformed to US GAAP.
December 2006
2006 AMD Analyst Day
1
Smarter Choice
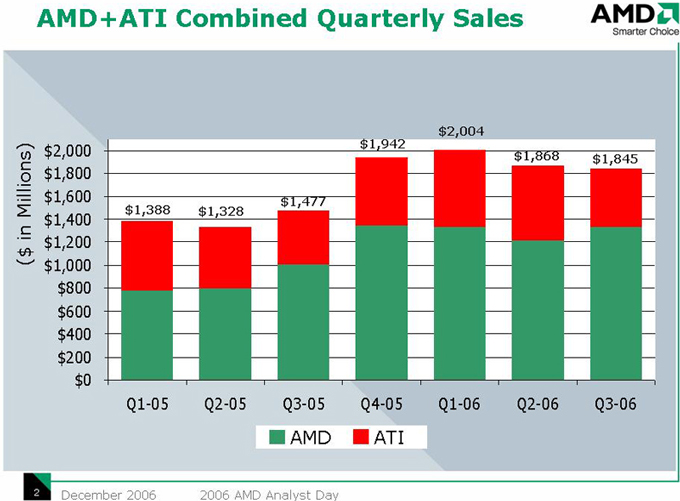
AMD+ATI Combined Quarterly Sales
($ in Millions) $2,000$1,800 $1,600 in $1,400 $1,200$ $ 1,000 $800 $600 $400 $200 $0
$1,477 $1,388 $1,328
$2,004 $1,942 $1,868 $1,845
Q1-05-05 Q2-05-05 Q3-05-05 Q4-05-05 Q1-06-06 Q2-06-06 Q3-06 -06
December 2006
2006 AMD Analyst Day
2
Smarter Choice
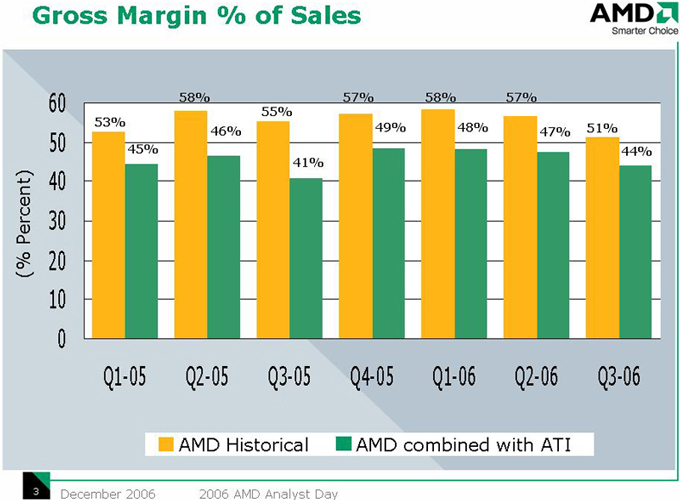
Gross Margin % of Sales
(% Percent)
60 50 40 30 20 10 0
58% 57% 58% 57% 55%
46% 49% 48% 47% 45% 44% 41%
Q1-05 Q2-05 Q3-05 Q4-05 Q1-06 Q2-06 Q3-06
AMD Historical AMD combined with ATI
December 2006 2006 AMD Analyst Day
3
Smarter Choice
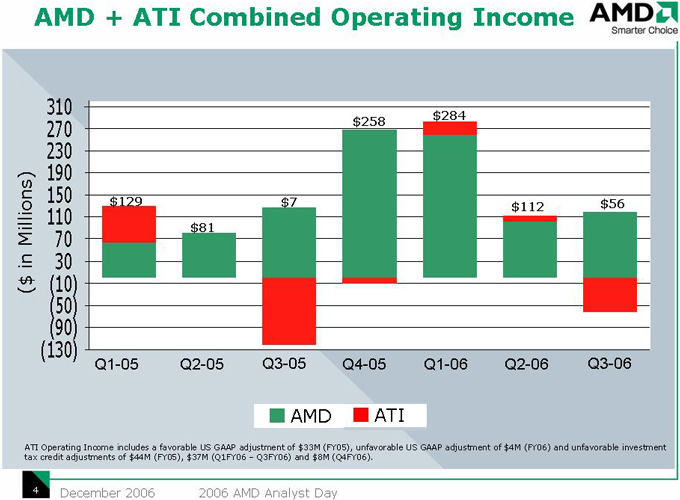
AMD + ATI Combined Operating Income
($ in Millions)
310 270 230 190 150 110 70 (10) 30 (50) (90) (130)
$284 $258 $129 $7 $112 $56 $81
Q1-05 Q2-05 Q3-05 Q4-05 Q1-06 Q2-06 Q3-06
AMD ATI
ATI Operating Income includes a favorable US GAAP adjustment of $33M (FY05), unfavorable US GAAP adjustment of $4M (FY06) and unfavorable investment tax credit adjustments of $44M (FY05), $37M (Q1FY06 – Q3FY06) and $8M (Q4FY06).
December 2006 2006 AMD Analyst Day
4