Crawford & Company First Quarter 2012 Earnings Conference Call May 8, 2012
Crawford & Company FORWARD-LOOKING STATEMENTS, SEGMENT OPERATING EARNINGS, AND ADDITIONAL INFORMATION 2 Forward-looking statements –This presentation contains forward-looking statements, including statements about the future financial condition, results of operations and earnings outlook of Crawford & Company. Statements, both qualitative and quantitative, that are not statements of historical fact may be “forward-looking statements” as defined in the Private Securities Litigation Reform Act of 1995 and other securities laws. Forward-looking statements involve a number of risks and uncertainties that could cause actual results to differ materially from historical experience or Crawford & Company’s present expectations. Accordingly, no one should place undue reliance on forward-looking statements, which speak only as of the date on which they are made. Crawford & Company does not undertake to update forward-looking statements to reflect the impact of circumstances or events that may arise or not arise after the date the forward-looking statements are made. Results for any interim period presented herein are not necessarily indicative of results to be expected for the full year or for any other future period. For further information regarding Crawford & Company, and the risks and uncertainties involved in forward-looking statements, please read Crawford & Company’s reports filed with the United States Securities and Exchange Commission and available at www.sec.gov or in the Investor Relations section of Crawford & Company’s website at www.crawfordandcompany.com. Revenues Before Reimbursements (“Revenues”) –Revenues Before Reimbursements are referred to as “Revenues” in both consolidated and segment charts, bullets and tables throughout this presentation. Segment Operating Earnings –Under the Financial Accounting Standards Board’s Accounting Standards Codification Topic 280, “Segment Reporting,” the Company has defined segment operating earnings as the primary measure used by the Company to evaluate the results of each of its four operating segments. Operating earnings represent segment earnings (loss) before certain unallocated corporate and shared costs and credits, net corporate interest expense, stock option expense, amortization of customer-relationship intangible assets, special charges, income taxes, and net income or loss attributable to non-controlling interests. Earnings Per Share –In certain periods, the Company has paid a higher dividend on CRDA than on CRDB. This may result in a different earnings per share ("EPS") for each class of stock due to the two-class method of computing EPS as required by the guidance in Accounting Standards Codification Topic 260 - "Earnings Per Share". The two-class method is an earnings allocation method under which EPS is calculated for each class of common stock considering both dividends declared and participation rights in undistributed earnings as if all such earnings had been distributed during the period. Further references to EPS in this presentation will generally be only for CRDB, as that is the more dilutive measure. Non-GAAP Financial Information –For additional information about certain non-GAAP financial information presented herein, see the Appendix following this presentation.
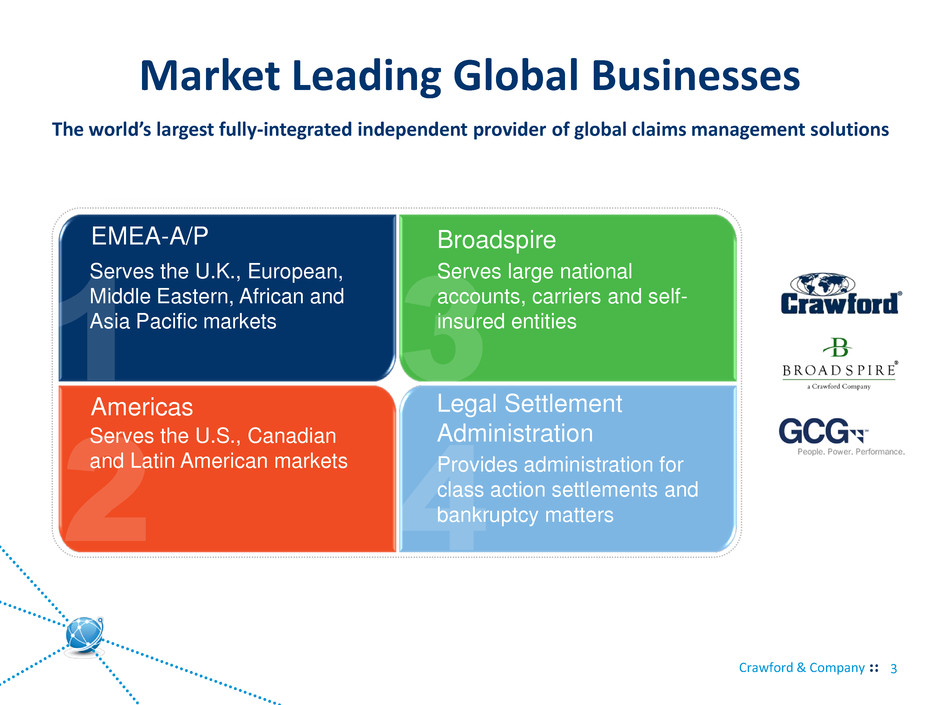
Crawford & Company Market Leading Global Businesses The world’s largest fully-integrated independent provider of global claims management solutions 3 EMEA-A/P Americas Broadspire Legal Settlement Administration Serves the U.K., European, Middle Eastern, African and Asia Pacific markets Serves the U.S., Canadian and Latin American markets Serves large national accounts, carriers and self- insured entities Provides administration for class action settlements and bankruptcy matters
Today’s Agenda Welcome and Opening Comments First Quarter 2012 Financial Review First Quarter 2012 Operational Review Guidance and Future Operational Focus
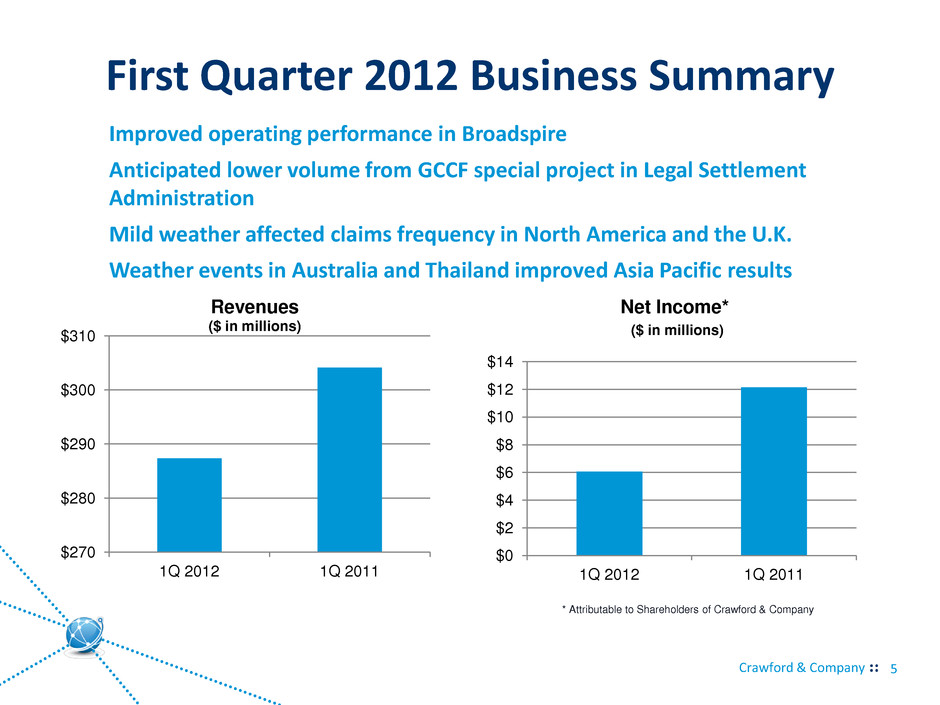
Crawford & Company First Quarter 2012 Business Summary $270 $280 $290 $300 $310 1Q 2012 1Q 2011 Revenues ($ in millions) 5 Improved operating performance in Broadspire Anticipated lower volume from GCCF special project in Legal Settlement Administration Mild weather affected claims frequency in North America and the U.K. Weather events in Australia and Thailand improved Asia Pacific results $0 $2 $4 $6 $8 $10 $12 $14 1Q 2012 1Q 2011 Net Income* ($ in millions) * Attributable to Shareholders of Crawford & Company
First Quarter 2012 Financial Review
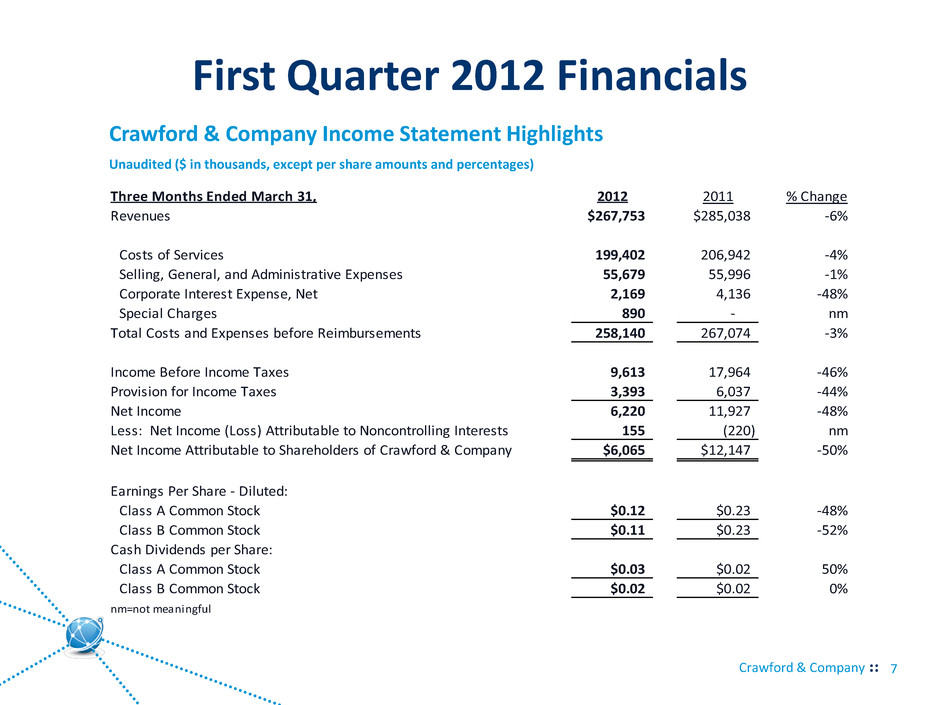
Crawford & Company First Quarter 2012 Financials 7 Crawford & Company Income Statement Highlights Unaudited ($ in thousands, except per share amounts and percentages) Three Months Ended March 31, 2012 2011 % Change Revenues $267,753 $285,038 -6% Costs of Services 199,402 206,942 -4% Selling, General, and Administrative Expenses 55,679 55,996 -1% Corporate Interest Expense, Net 2,169 4,136 -48% Special Charges 890 - nm Total Costs and Expenses before Reimbursements 258,140 267,074 -3% Income Before Income Taxes 9,613 17,964 -46% Provision for Income Taxes 3,393 6,037 -44% Net Income 6,220 11,927 -48% Less: Net Income (Loss) Attributable to Noncontrolling Interests 155 (220) nm Net Income Attributable to Shareholders of Crawford & Company $6,065 $12,147 -50% Earnings Per Share - Diluted: Class A Common Stock $0.12 $0.23 -48% Class B Common Stock $0.11 $0.23 -52% Cash Dividends per Share: Class A Common Stock $0.03 $0.02 50% Class B Common Stock $0.02 $0.02 0% nm=not meaningful
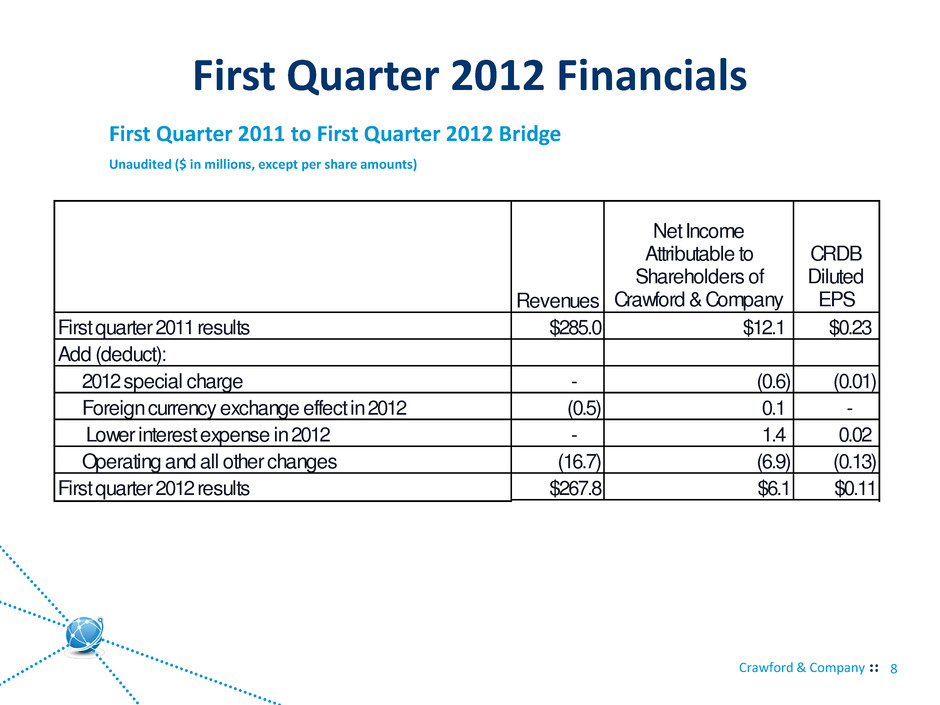
Crawford & Company First Quarter 2012 Financials 8 First Quarter 2011 to First Quarter 2012 Bridge Unaudited ($ in millions, except per share amounts) Revenues Net Income Attributable to Shareholders of Crawford & Company CRDB Diluted EPS First quarter 2011 results $285.0 $12.1 $0.23 A d (deduct): 2012 special charge - (0.6) (0.01) Foreign currency exchange effect in 2012 (0.5) 0.1 - Lower interest expense in 2012 - 1.4 0.02 Operating and all other changes (16.7) (6.9) (0.13) First quarter 2012 results $267.8 $6.1 $0.11
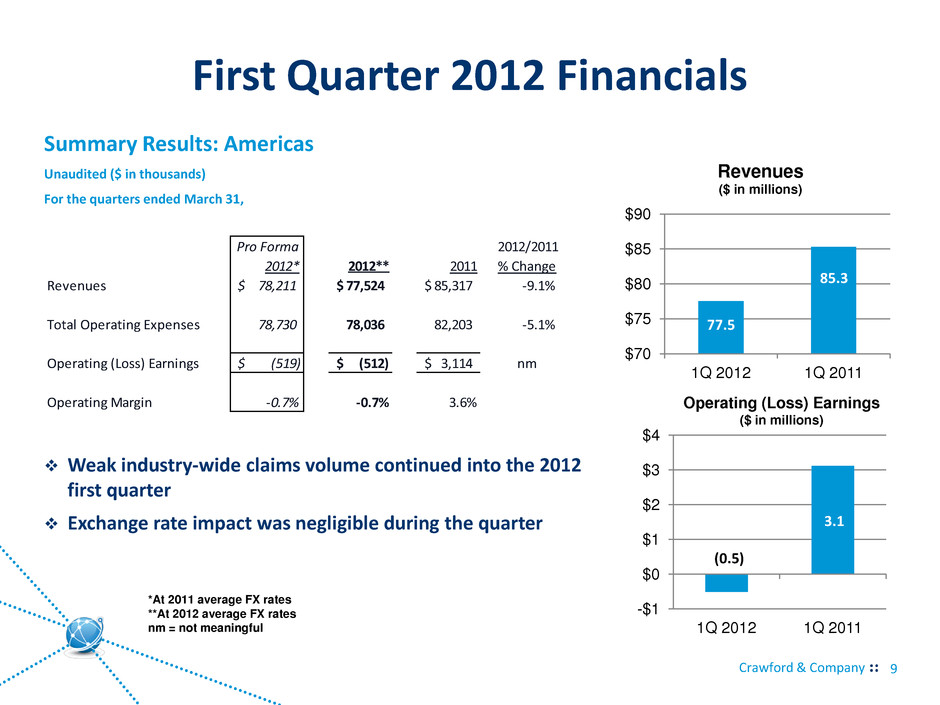
Crawford & Company First Quarter 2012 Financials 9 Summary Results: Americas Unaudited ($ in thousands) For the quarters ended March 31, Weak industry-wide claims volume continued into the 2012 first quarter Exchange rate impact was negligible during the quarter Pro Forma 2012/2011 2012* 2012** 2011 % Change Revenues 78,211$ 77,524$ 85,317$ -9.1% Total Operating Expenses 78,730 78,036 82,203 -5.1% Operating (Loss) Earnings (519)$ (512)$ 3,114$ nm Operating Margin -0.7% -0.7% 3.6% $70 $75 $80 $85 $90 1Q 2012 1Q 2011 Revenues ($ in millions) -$1 $0 $1 $2 $3 $4 1Q 2012 1Q 2011 85.3 77.5 3.1 (0.5) Operating (Loss) Earnings ($ in millions) *At 2011 average FX rates **At 2012 average FX rates nm = not meaningful
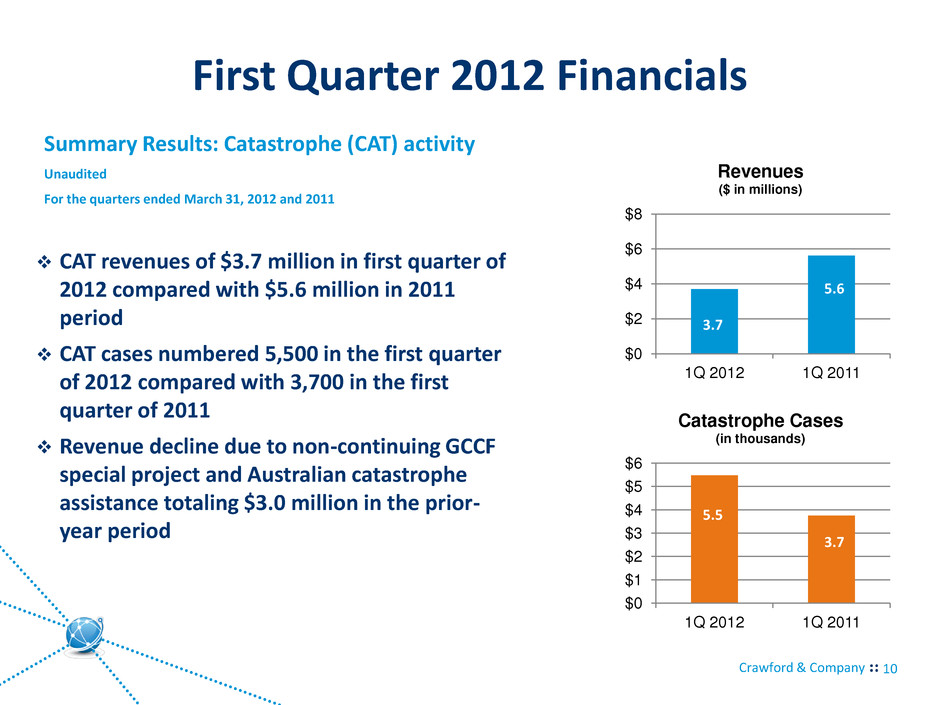
Crawford & Company First Quarter 2012 Financials 10 Summary Results: Catastrophe (CAT) activity Unaudited For the quarters ended March 31, 2012 and 2011 CAT revenues of $3.7 million in first quarter of 2012 compared with $5.6 million in 2011 period CAT cases numbered 5,500 in the first quarter of 2012 compared with 3,700 in the first quarter of 2011 Revenue decline due to non-continuing GCCF special project and Australian catastrophe assistance totaling $3.0 million in the prior- year period $0 $2 $4 $6 $8 1Q 2012 1Q 2011 Revenues ($ in millions) $0 $1 $2 $3 $4 $5 $6 1Q 2012 1Q 2011 Catastrophe Cases (in thousands) 5.6 3.7 3.7 5.5
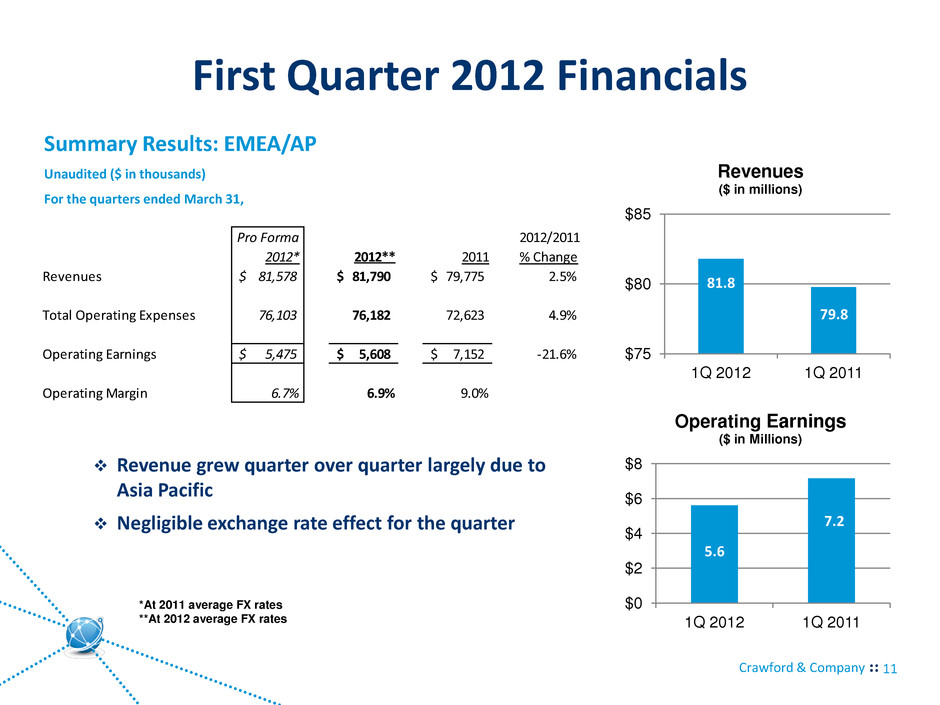
Crawford & Company First Quarter 2012 Financials 11 Summary Results: EMEA/AP Unaudited ($ in thousands) For the quarters ended March 31, Revenue grew quarter over quarter largely due to Asia Pacific Negligible exchange rate effect for the quarter $75 $80 $85 1Q 2012 1Q 2011 Revenues ($ in millions) $0 $2 $4 $6 $8 1Q 2012 1Q 2011 Operating Earnings ($ in Millions) 79.8 81.8 7.2 5.6 Pro Forma 2012/2011 2012* 2012** 2011 % Change Revenues 81,578$ 81,790$ 79,775$ 2.5% Total Operating Expenses 76,103 76,182 72,623 4.9% Operating Earnings 5,475$ 5,608$ 7,152$ -21.6% Operating Margin 6.7% 6.9% 9.0% *At 2011 average FX rates **At 2012 average FX rates
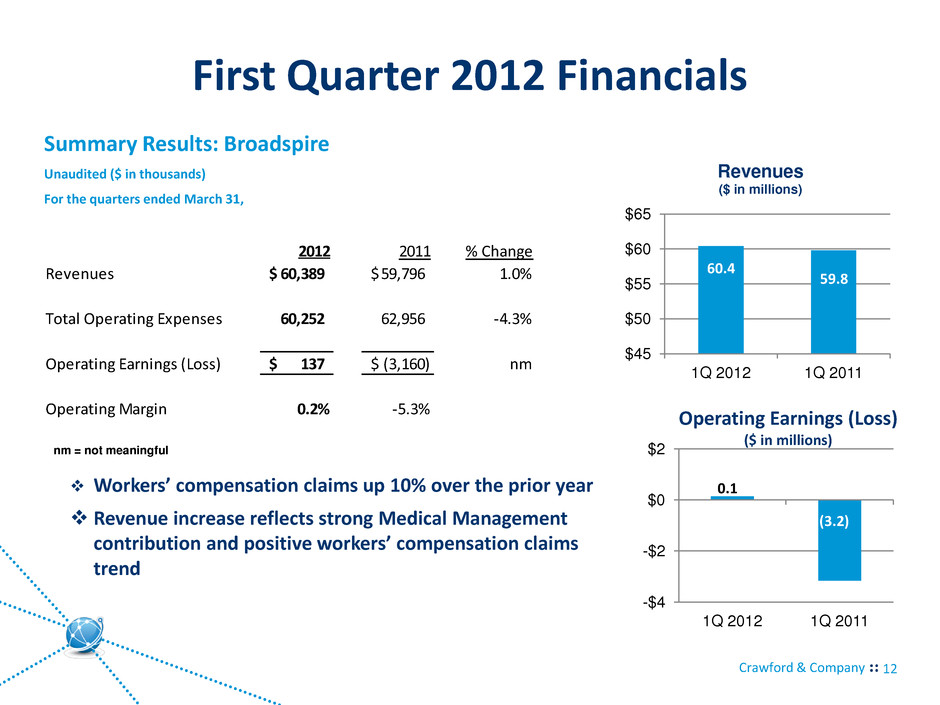
Crawford & Company First Quarter 2012 Financials 12 Summary Results: Broadspire Unaudited ($ in thousands) For the quarters ended March 31, Workers’ compensation claims up 10% over the prior year Revenue increase reflects strong Medical Management contribution and positive workers’ compensation claims trend $45 $50 $55 $60 $65 1Q 2012 1Q 2011 Revenues ($ in millions) -$4 -$2 $0 $2 1Q 2012 1Q 2011 59.8 60.4 (3.2) 0.1 2012 2011 % Change Revenues 60,389$ 59,796$ 1.0% Total Operating Expenses 60,252 62,956 -4.3% Operating Earnings (Loss) 137$ (3,160)$ nm Operating Margin 0.2% -5.3% Operating Earnings (Loss) ($ in millions) nm = not meaningful
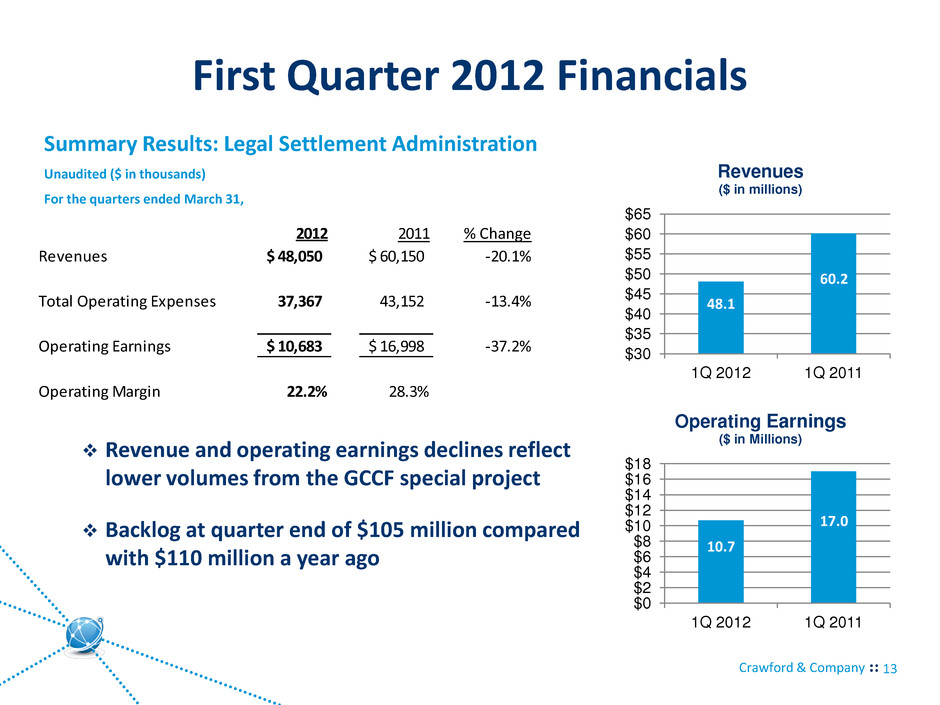
Crawford & Company First Quarter 2012 Financials 13 Summary Results: Legal Settlement Administration Unaudited ($ in thousands) For the quarters ended March 31, $30 $35 $40 $45 $50 $55 $60 $65 1Q 2012 1Q 2011 Revenues ($ in millions) $0 $2 $4 $6 $8 $10 $12 $14 $16 $18 1Q 2012 1Q 2011 Operating Earnings ($ in Millions) 60.2 48.1 17.0 10.7 2012 2011 % Change Revenues 48,050$ 60,150$ -20.1% Total Operating Expenses 37,367 43,152 -13.4% Operating Earnings 10,683$ 16,998$ -37.2% Operating Margin 22.2% 28.3% Revenue and operating earnings declines reflect lower volumes from the GCCF special project Backlog at quarter end of $105 million compared with $110 million a year ago
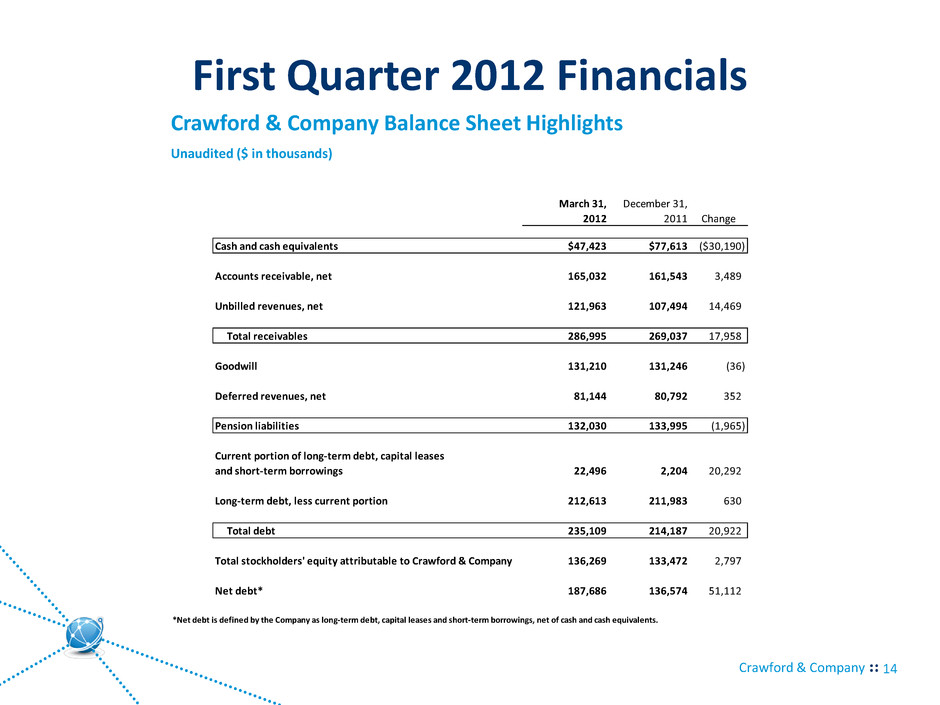
Crawford & Company First Quarter 2012 Financials 14 Crawford & Company Balance Sheet Highlights Unaudited ($ in thousands) March 31, December 31, 2012 2011 Change Cash and cash equivalents $47,423 $77,613 ($30,190) Accounts receivable, net 165,032 161,543 3,489 Unbilled revenues, net 121,963 107,494 14,469 Total receivables 286,995 269,037 17,958 Goodwill 131,210 131,246 (36) Deferred revenues, net 81,144 80,792 352 Pension liabilities 132,030 133,995 (1,965) Current portion of long-term debt, capital leases and short-term borrowings 22,496 2,204 20,292 Long-term debt, less current portion 212,613 211,983 630 Total debt 235,109 214,187 20,922 Total stockholders' equity attributable to Crawford & Company 136,269 133,472 2,797 Net debt* 187,686 136,574 51,112 *Net debt is defined by the Company as long-term debt, capital leases and short-term borrowings, net of cash and cash equivalents.
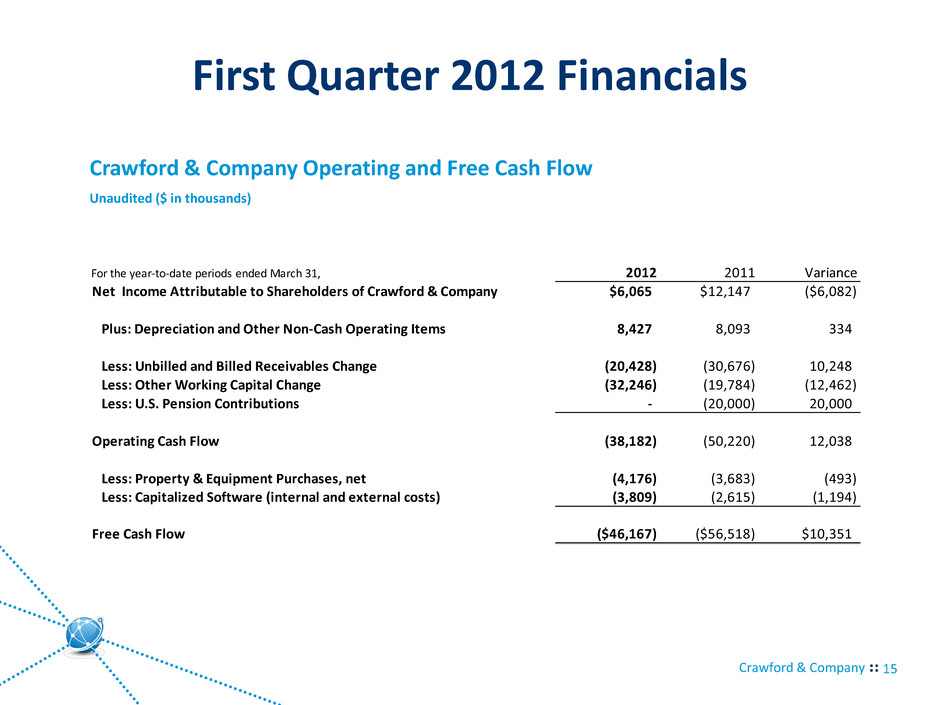
Crawford & Company First Quarter 2012 Financials 15 Crawford & Company Operating and Free Cash Flow Unaudited ($ in thousands) For the year-to-date periods ended March 31, 2012 2011 Variance Net Income Attributable to Shareholders of Crawford & Company $6,065 $12,147 ($6,082) Plus: Depreciation and Other Non-Cash Operating Items 8,427 8,093 334 Less: Unbilled and Billed Receivables Change (20,428) (30,676) 10,248 Less: Other Working Capital Change (32,246) (19,784) (12,462) Less: U.S. Pension Contributions - (20,000) 20,000 Operating Cash Flow (38,182) (50,220) 12,038 Less: Property & Equipment Purchases, net (4,176) (3,683) (493) Less: Capitalized Software (internal and external costs) (3,809) (2,615) (1,194) Free Cash Flow ($46,167) ($56,518) $10,351
First Quarter 2012 Operational Review
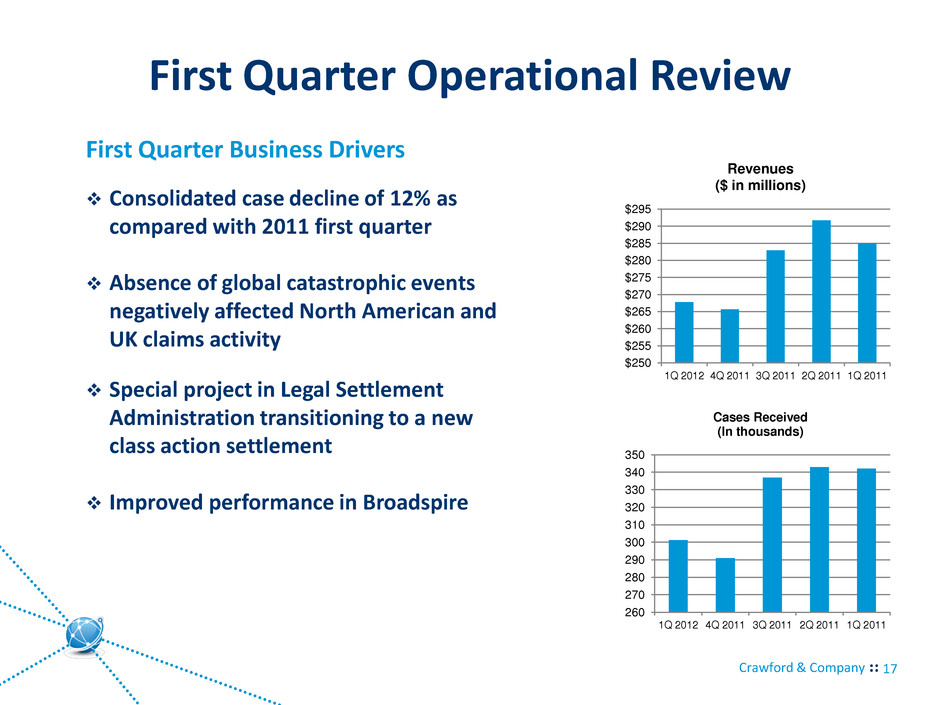
Crawford & Company First Quarter Operational Review 17 First Quarter Business Drivers $250 $255 $260 $265 $270 $275 $280 $285 $290 $295 1Q 2012 4Q 2011 3Q 2011 2Q 2011 1Q 2011 Revenues ($ in millions) 260 270 280 290 300 310 320 330 340 350 1Q 2012 4Q 2011 3Q 2011 2Q 2011 1Q 2011 Cases Received (In thousands) Consolidated case decline of 12% as compared with 2011 first quarter Absence of global catastrophic events negatively affected North American and UK claims activity Special project in Legal Settlement Administration transitioning to a new class action settlement Improved performance in Broadspire
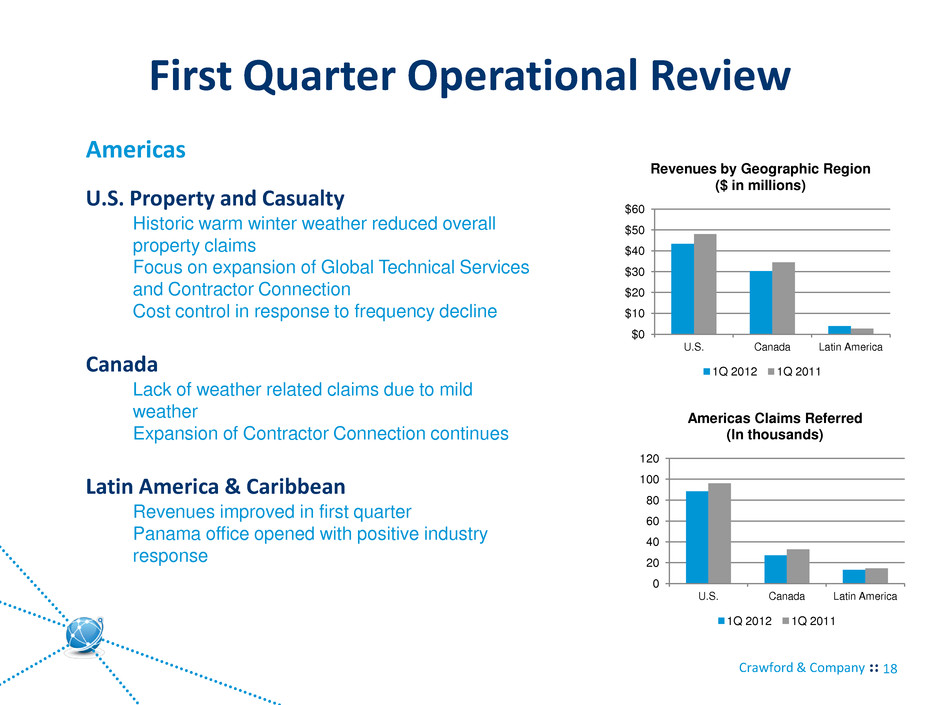
Crawford & Company First Quarter Operational Review 18 Americas $0 $10 $20 $30 $40 $50 $60 U.S. Canada Latin America Revenues by Geographic Region ($ in millions) 1Q 2012 1Q 2011 U.S. Property and Casualty Historic warm winter weather reduced overall property claims Focus on expansion of Global Technical Services and Contractor Connection Cost control in response to frequency decline Canada Lack of weather related claims due to mild weather Expansion of Contractor Connection continues Latin America & Caribbean Revenues improved in first quarter Panama office opened with positive industry response 0 20 40 60 80 100 120 U.S. Canada Latin America Americas Claims Referred (In thousands) 1Q 2012 1Q 2011
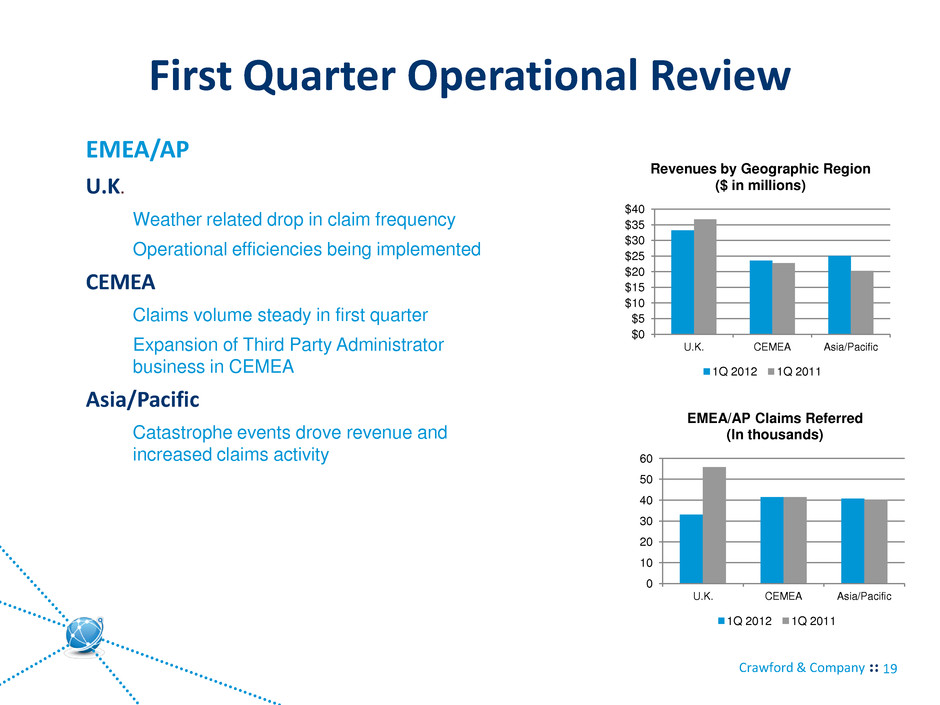
Crawford & Company First Quarter Operational Review 19 EMEA/AP $0 $5 $10 $15 $20 $25 $30 $35 $40 U.K. CEMEA Asia/Pacific Revenues by Geographic Region ($ in millions) 1Q 2012 1Q 2011 U.K. Weather related drop in claim frequency Operational efficiencies being implemented CEMEA Claims volume steady in first quarter Expansion of Third Party Administrator business in CEMEA Asia/Pacific Catastrophe events drove revenue and increased claims activity 0 10 20 30 40 50 60 U.K. CEMEA Asia/Pacific EMEA/AP Claims Referred (In thousands) 1Q 2012 1Q 2011
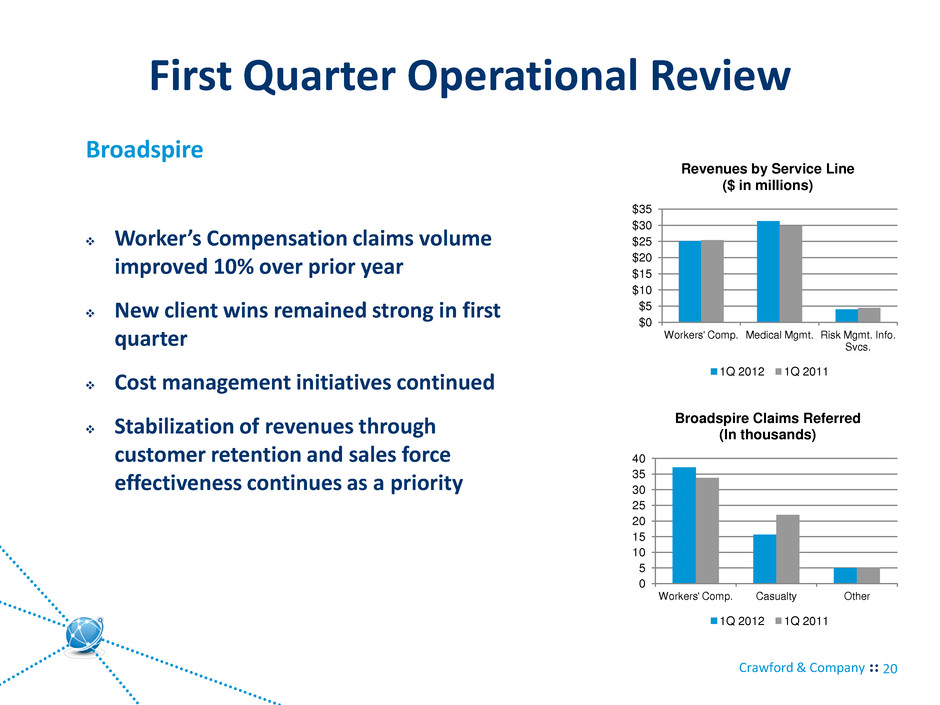
Crawford & Company First Quarter Operational Review 20 Broadspire $0 $5 $10 $15 $20 $25 $30 $35 Workers' Comp. Medical Mgmt. Risk Mgmt. Info. Svcs. Revenues by Service Line ($ in millions) 1Q 2012 1Q 2011 Worker’s Compensation claims volume improved 10% over prior year New client wins remained strong in first quarter Cost management initiatives continued Stabilization of revenues through customer retention and sales force effectiveness continues as a priority 0 5 10 15 20 25 30 35 40 Workers' Comp. Casualty Other Broadspire Claims Referred (In thousands) 1Q 2012 1Q 2011
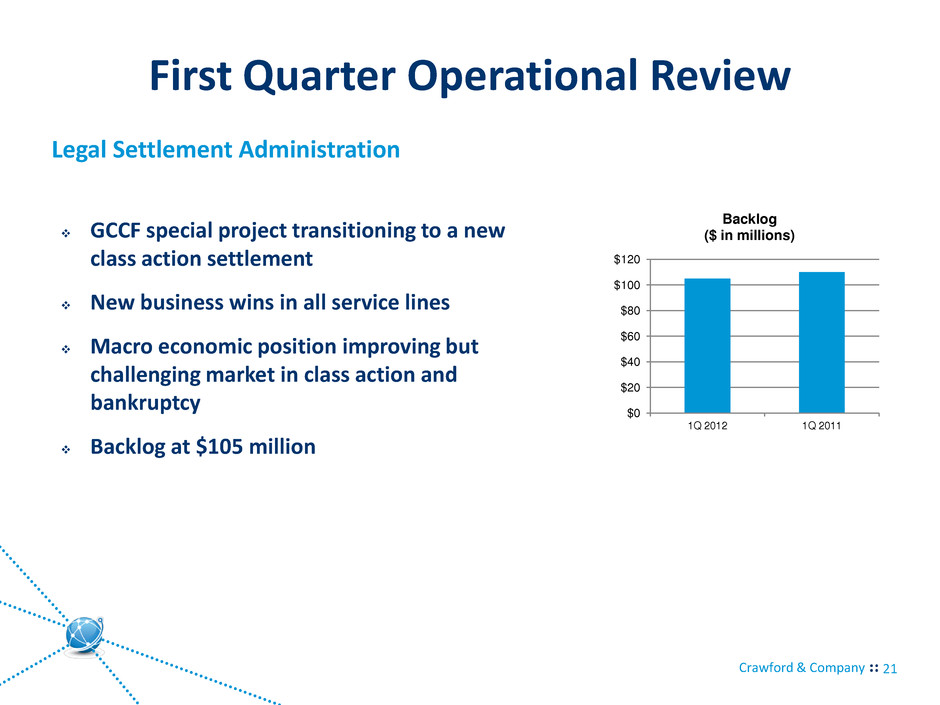
Crawford & Company First Quarter Operational Review 21 Legal Settlement Administration $0 $20 $40 $60 $80 $100 $120 1Q 2012 1Q 2011 Backlog ($ in millions) GCCF special project transitioning to a new class action settlement New business wins in all service lines Macro economic position improving but challenging market in class action and bankruptcy Backlog at $105 million
Crawford & Company 2012 Guidance 22 Crawford’s business is dependent, to a significant extent, on case volumes. The Company cannot predict the future trend of case volumes for a number of reasons, including the fact that the frequency and severity of weather-related claims and the occurrence of natural and man-made disasters, which are a significant source of claims and revenue for the Company, are generally not subject to accurate forecasting. Crawford & Company is reaffirming guidance as follows: Consolidated revenues before reimbursements between $990 million and $1.03 billion Consolidated operating earnings between $63.0 million and $70.0 million Consolidated cash provided by operating activities between $30.0 million and $35.0 million After reflecting stock-based compensation expense, net corporate interest expense, customer-relationship intangible asset amortization expense, special charges, and income taxes, net income attributable to shareholders of Crawford & Company on a GAAP basis between $30.5 million and $35.0 million, or $0.52 to $0.62 diluted earnings per CRDB share
Crawford & Company Operational Focus 23 Bring Broadspire to an acceptable earnings profile Significant debt reduction Continue to grow revenue and operating earnings Capitalize on global opportunities Enhance shareholder returns
First Quarter 2012 Appendix
Crawford & Company Appendix: Non-GAAP Financial Information 25 Measurements of financial performance not calculated in accordance with GAAP should be considered as supplements to, and not substitutes for, performance measurements calculated or derived in accordance with GAAP. Any such measures are not necessarily comparable to other similarly-titled measurements employed by other companies. Reimbursements for Out-of-Pocket Expenses In the normal course of our business, our operating segments incur certain out-of-pocket expenses that are thereafter reimbursed by our clients. Under GAAP, these out-of-pocket expenses and associated reimbursements are required to be included when reporting expenses and revenues, respectively, in our consolidated results of operations. In this presentation, we do not believe it is informative to include the GAAP-required gross up of our revenues and expenses for these pass-through reimbursed expenses. The amounts of reimbursed expenses and related revenues offset each other in our consolidated results of operations with no impact to our net income or operating earnings (loss). Unless noted in this presentation, revenue and expense amounts exclude reimbursements for out-of-pocket expenses. Net debt Net debt is computed as the sum of long-term debt, capital leases and short-term borrowings less cash and cash equivalents. Management believes that net debt is useful because it provides investors with an estimate of what the Company’s debt would be if all available cash was used to pay down the debt of the Company. The measure is not meant to imply that management plans to use all available cash to pay down debt. Deferred Revenues, net Deferred Revenues, net is computed as the sum of the current and noncurrent deferred revenues as reported on our Consolidated Balance Sheets less the sum of the current receivable held in trust to be released to us as payment to service these revenues. The current receivable held in trust is reported as a component of Accounts Receivable in our Consolidated Balance Sheets. The funds represented by the amount of the receivable held in trust are released to the Company over time to partially offset the costs of servicing the deferred revenues. Management believes that subtracting the receivable held in trust from deferred revenues provides investors with a snapshot of what the net cash costs will be to service the deferred revenues in the future. Free Cash Flow Management believes free cash flow is useful to investors as it presents the amount of cash the Company has generated that can be used for other purposes, including additional contributions to the Company’s defined benefit pension plans, discretionary prepayments of outstanding borrowings under our credit agreement, and return of capital to shareholders, among other purposes. It does not represent the residual cash flow of the Company available for discretionary expenditures.
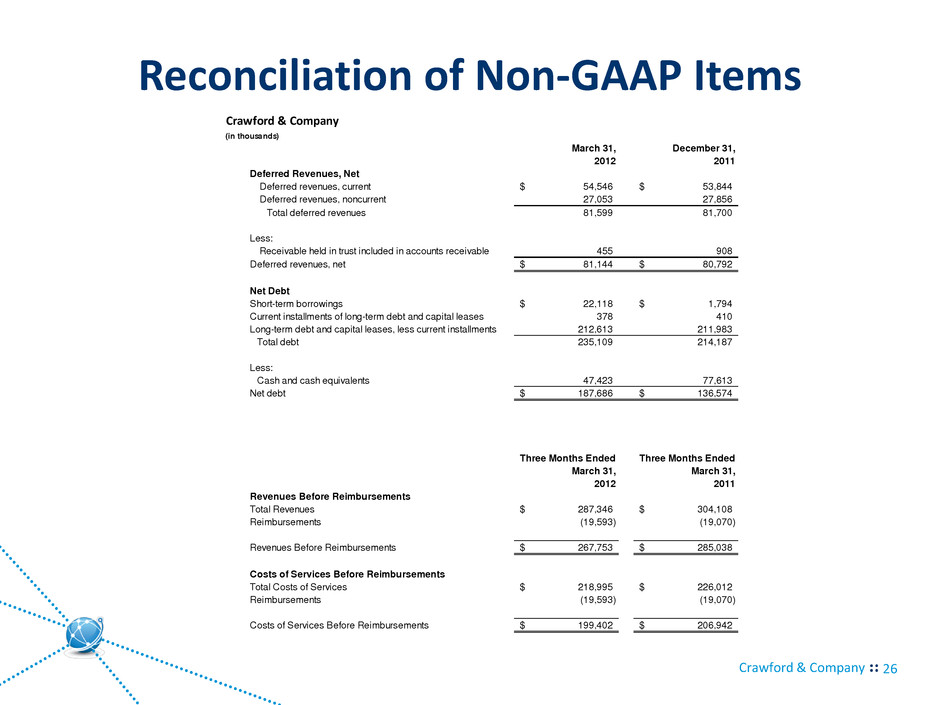
Crawford & Company Reconciliation of Non-GAAP Items 26 Crawford & Company (in thousands) March 31, December 31, 2012 2011 Deferred Revenues, Net Deferred revenues, current 54,546$ 53,844$ Deferred revenues, noncurrent 27,053 27,856 Total deferred revenues 81,599 81,700 Less: Receivable held in trust included in accounts receivable 455 908 Deferred revenues, net 81,144$ 80,792$ Net Debt Short-term borrowings 22,118$ 1,794$ Current installments of long-term debt and capital leases 378 410 Long-term debt and capital leases, less current installments 212,613 211,983 Total debt 235,109 214,187 Less: Cash and cash equivalents 47,423 77,613 Net debt 187,686$ 136,574$ Three Months Ended Three Months Ended March 31, March 31, 2012 2011 Revenues Before Reimbursements Total Revenues 287,346$ 304,108$ Reimbursements (19,593) (19,070) Revenues Before Reimbursements 267,753$ 285,038$ Costs of Services Before Reimbursements Total Costs of Services 218,995$ 226,012$ Reimbursements (19,593) (19,070) Costs of Services Before Reimbursements 199,402$ 206,942$


