Crawford & Company Third Quarter 2012 Earnings Conference Call November 5, 2012
Crawford & Company FORWARD-LOOKING STATEMENTS, SEGMENT OPERATING EARNINGS, AND ADDITIONAL INFORMATION 2 Forward-looking statements –This presentation contains forward-looking statements, including statements about the future financial condition, results of operations and earnings outlook of Crawford & Company. Statements, both qualitative and quantitative, that are not statements of historical fact may be “forward-looking statements” as defined in the Private Securities Litigation Reform Act of 1995 and other securities laws. Forward-looking statements involve a number of risks and uncertainties that could cause actual results to differ materially from historical experience or Crawford & Company’s present expectations. Accordingly, no one should place undue reliance on forward-looking statements, which speak only as of the date on which they are made. Crawford & Company does not undertake to update forward-looking statements to reflect the impact of circumstances or events that may arise or not arise after the date the forward-looking statements are made. Results for any interim period presented herein are not necessarily indicative of results to be expected for the full year or for any other future period. For further information regarding Crawford & Company, and the risks and uncertainties involved in forward-looking statements, please read Crawford & Company’s reports filed with the United States Securities and Exchange Commission and available at www.sec.gov or in the Investor Relations section of Crawford & Company’s website at www.crawfordandcompany.com. –Crawford’s business is dependent, to a significant extent, on case volumes. The Company cannot predict the future trend of case volumes for a number of reasons, including the fact that the frequency and severity of weather-related claims and the occurrence of natural and man-made disasters, which are a significant source of claims and revenue for the Company, are generally not subject to accurate forecasting. Revenues Before Reimbursements (“Revenues”) –Revenues Before Reimbursements are referred to as “Revenues” in both consolidated and segment charts, bullets and tables throughout this presentation. Segment Operating Earnings –Under the Financial Accounting Standards Board’s Accounting Standards Codification Topic 280, “Segment Reporting,” the Company has defined segment operating earnings as the primary measure used by the Company to evaluate the results of each of its four operating segments. Segment operating earnings exclude income taxes, interest expense, amortization of customer-relationship intangible assets, stock option expense, earnings or loss attributable to non-controlling interests, certain unallocated corporate and shared costs, and special charges and credits. Earnings Per Share –In certain periods, the Company has paid a higher dividend on CRDA than on CRDB. This may result in a different earnings per share ("EPS") for each class of stock due to the two-class method of computing EPS as required by the guidance in Accounting Standards Codification Topic 260 - "Earnings Per Share". The two-class method is an earnings allocation method under which EPS is calculated for each class of common stock considering both dividends declared and participation rights in undistributed earnings as if all such earnings had been distr ibuted during the period. Further references to EPS in this presentation will generally be only for CRDB, as that is the more dilutive measure. Non-GAAP Financial Information –For additional information about certain non-GAAP financial information presented herein, see the Appendix following this presentation.
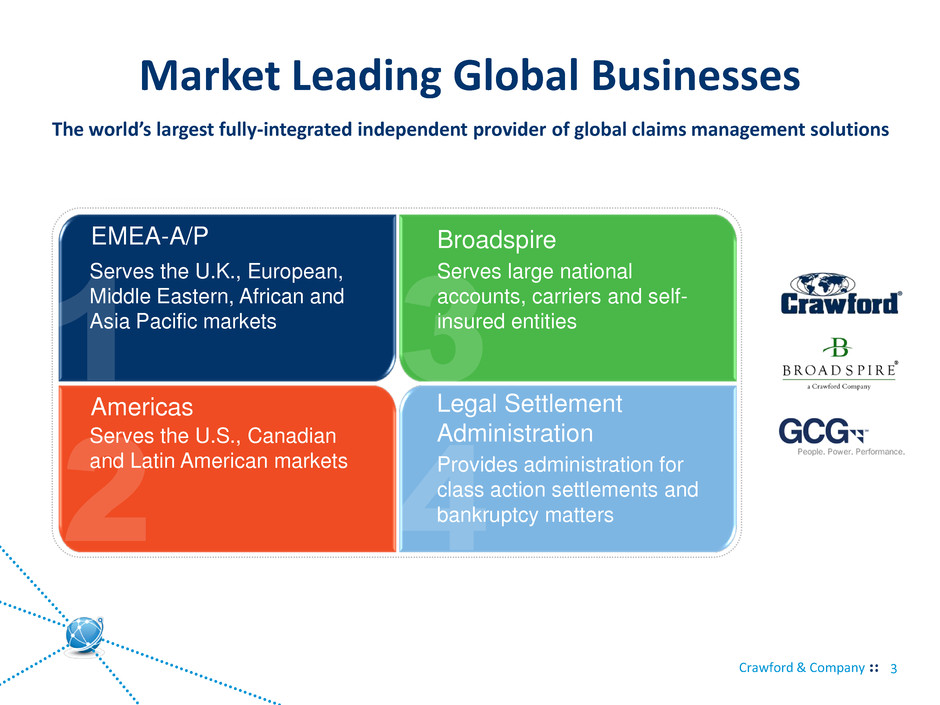
Crawford & Company Market Leading Global Businesses The world’s largest fully-integrated independent provider of global claims management solutions 3 EMEA-A/P Americas Broadspire Legal Settlement Administration Serves the U.K., European, Middle Eastern, African and Asia Pacific markets Serves the U.S., Canadian and Latin American markets Serves large national accounts, carriers and self- insured entities Provides administration for class action settlements and bankruptcy matters
Today’s Agenda Welcome and Opening Comments Third Quarter 2012 Financial Review Third Quarter 2012 Operational Review Guidance and Future Operational Focus
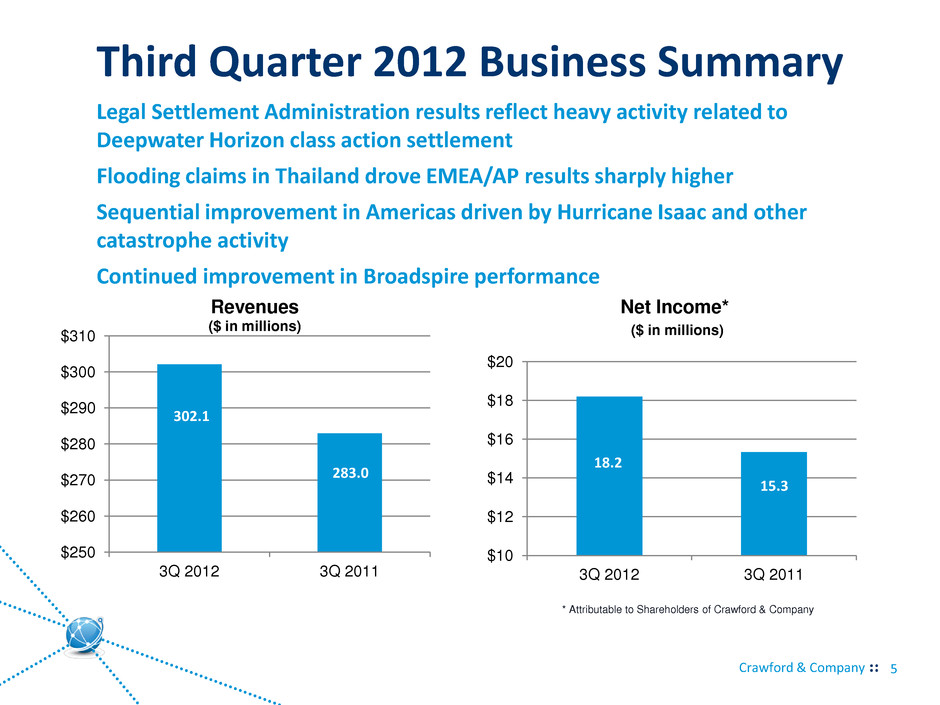
Crawford & Company Third Quarter 2012 Business Summary $250 $260 $270 $280 $290 $300 $310 3Q 2012 3Q 2011 Revenues ($ in millions) 5 Legal Settlement Administration results reflect heavy activity related to Deepwater Horizon class action settlement Flooding claims in Thailand drove EMEA/AP results sharply higher Sequential improvement in Americas driven by Hurricane Isaac and other catastrophe activity Continued improvement in Broadspire performance $10 $12 $14 $16 $18 $20 3Q 2012 3Q 2011 Net Income* ($ in millions) * Attributable to Shareholders of Crawford & Company 302.1 283.0 18.2 15.3
Third Quarter 2012 Financial Review
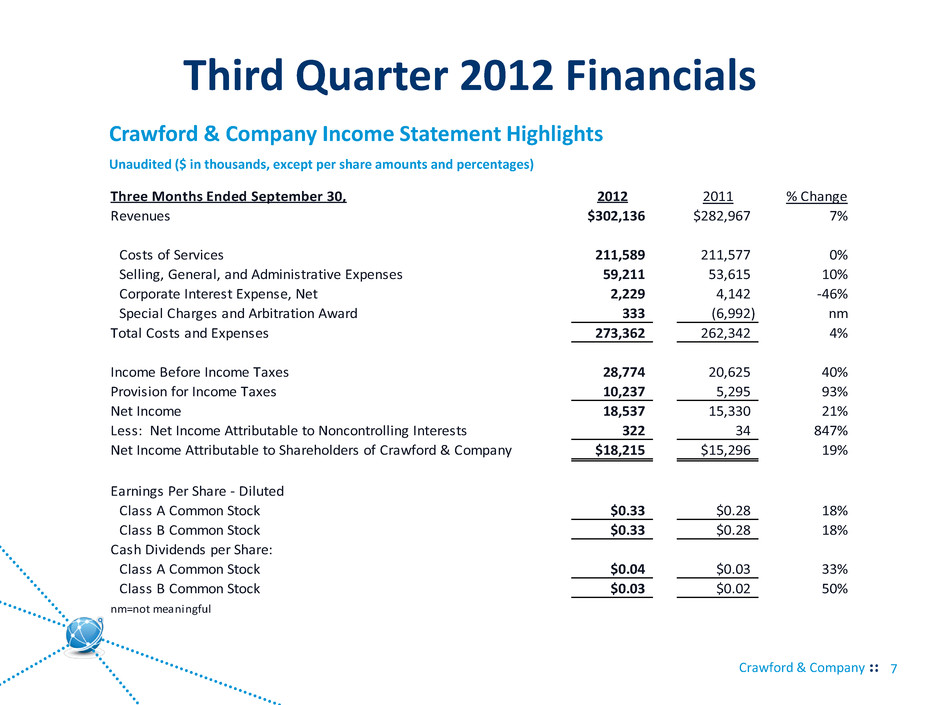
Crawford & Company Third Quarter 2012 Financials 7 Crawford & Company Income Statement Highlights Unaudited ($ in thousands, except per share amounts and percentages) Three Months Ended September 30, 2012 2011 % Change Revenues $302,136 $282,967 7% Costs of Services 211,589 211,577 0% Selling, General, and Administrative Expenses 59,211 53,615 10% Corporate Interest Expense, Net 2,229 4,142 -46% Special Charges and Arbitration Award 333 (6,992) nm Total Costs and Expenses 273,362 262,342 4% Income Before Income Taxes 28,774 20,625 40% Provision for Income Taxes 10,237 5,295 93% Net Income 18,537 15,330 21% Less: Net Income Attributable to Noncontrolling Interests 322 34 847% Net Income Attributable to Shareholders of Crawford & Company $18,215 $15,296 19% Earnings Per Share - Diluted Class A Common Stock $0.33 $0.28 18% Class B Common Stock $0.33 $0.28 18% Cash Dividends per Share: Class A Common Stock $0.04 $0.03 33% Class B Common Stock $0.03 $0.02 50% nm=not meaningful
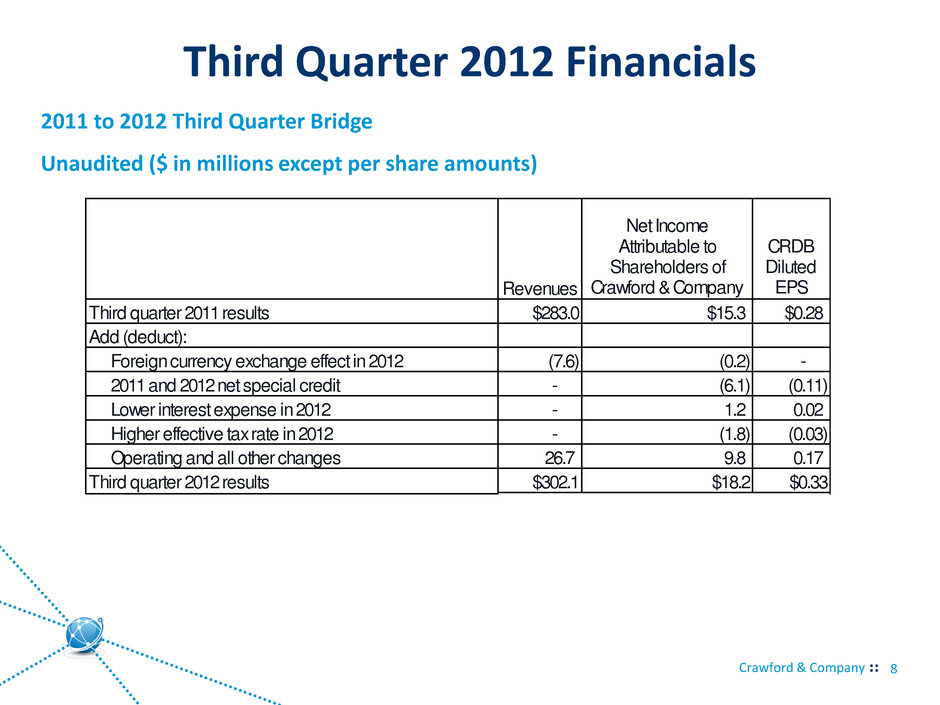
Crawford & Company Third Quarter 2012 Financials 8 2011 to 2012 Third Quarter Bridge Unaudited ($ in millions except per share amounts) Revenues Net Income Attributable to Shareholders of Crawford & Company CRDB Diluted EPS Third quarter 2011 results $283.0 $15.3 $0.28 Add (deduct): Fo eign currency exchange effect in 2012 (7.6) (0.2) - 2011 and 2012 net special credit - (6.1) (0.11) Lower interest expense in 2012 - 1.2 0.02 Higher effective tax rate in 2012 - (1.8) (0.03) Operating and all other changes 26.7 9.8 0.17 Third quarter 2012 results $302.1 $18.2 $0.33
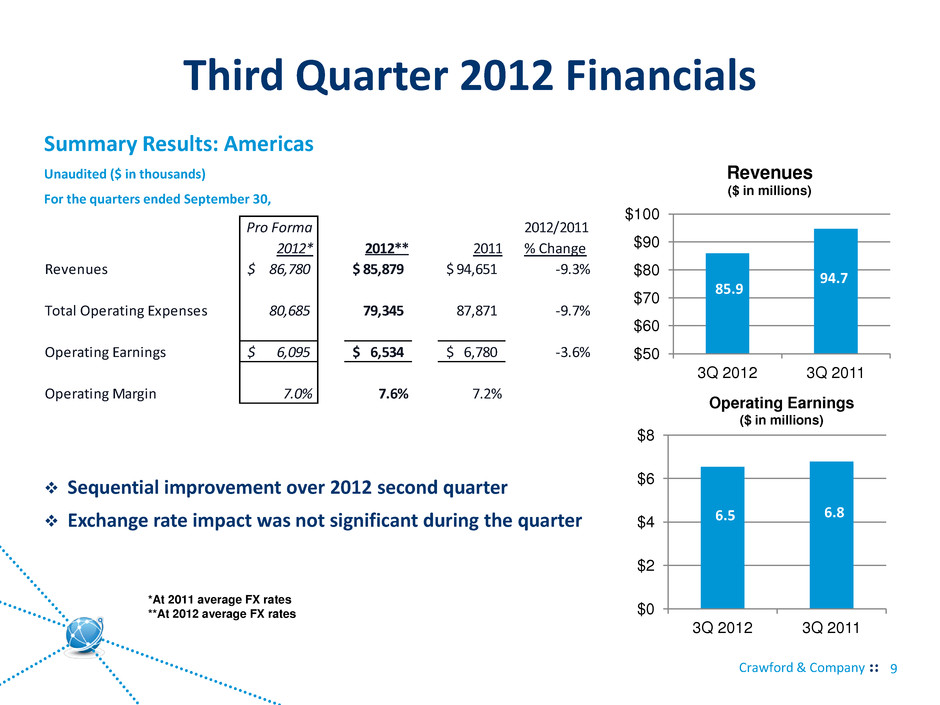
Crawford & Company Third Quarter 2012 Financials 9 Summary Results: Americas Unaudited ($ in thousands) For the quarters ended September 30, Sequential improvement over 2012 second quarter Exchange rate impact was not significant during the quarter $50 $60 $70 $80 $90 $100 3Q 2012 3Q 2011 Revenues ($ in millions) $0 $2 $4 $6 $8 3Q 2012 3Q 2011 94.7 85.9 6.8 6.5 Operating Earnings ($ in millions) *At 2011 average FX rates **At 2012 average FX rates Pro Forma 2012/2011 2012* 2012** 2011 % Change Revenues 86,780$ 85,879$ 94,651$ -9.3% Total Operating Expenses 80,685 79,345 87,871 -9.7% Operating Earnings 6,095$ 6,534$ 6,780$ -3.6% Operating Margin 7.0% 7.6% 7.2%
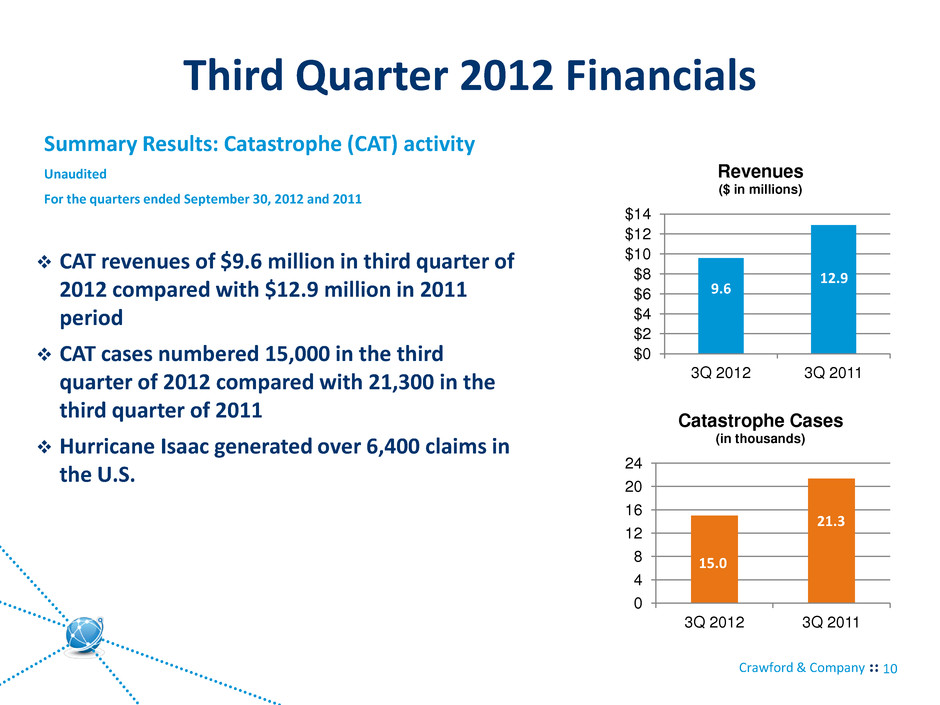
Crawford & Company Third Quarter 2012 Financials 10 Summary Results: Catastrophe (CAT) activity Unaudited For the quarters ended September 30, 2012 and 2011 CAT revenues of $9.6 million in third quarter of 2012 compared with $12.9 million in 2011 period CAT cases numbered 15,000 in the third quarter of 2012 compared with 21,300 in the third quarter of 2011 Hurricane Isaac generated over 6,400 claims in the U.S. $0 $2 $4 $6 $8 $10 $12 $14 3Q 2012 3Q 2011 Revenues ($ in millions) 0 4 8 12 16 20 24 3Q 2012 3Q 2011 Catastrophe Cases (in thousands) 12.9 9.6 21.3 15.0
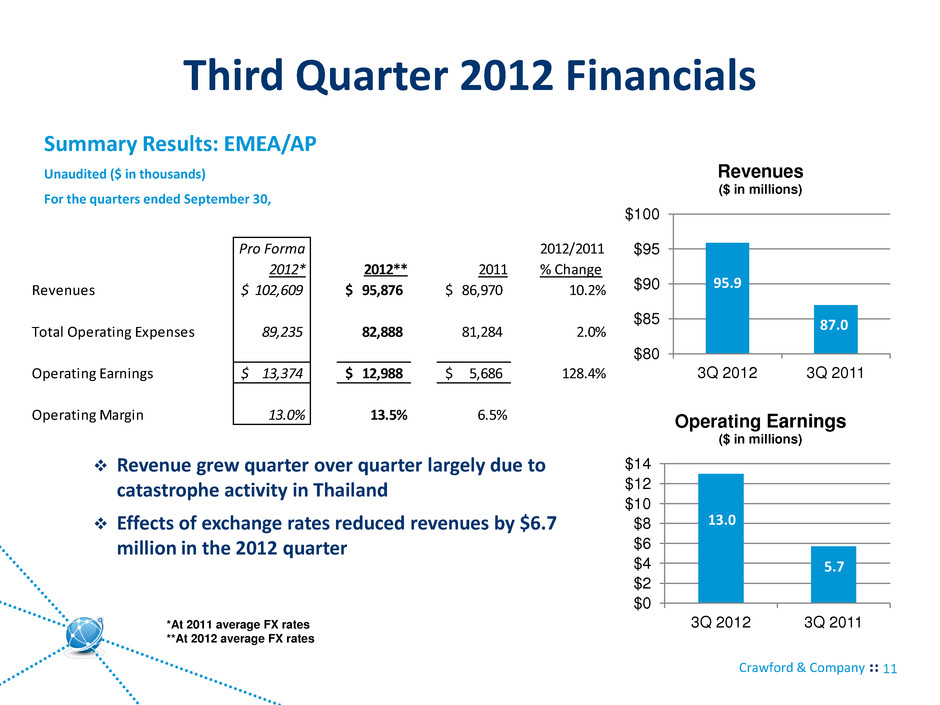
Crawford & Company Third Quarter 2012 Financials 11 Summary Results: EMEA/AP Unaudited ($ in thousands) For the quarters ended September 30, Revenue grew quarter over quarter largely due to catastrophe activity in Thailand Effects of exchange rates reduced revenues by $6.7 million in the 2012 quarter $80 $85 $90 $95 $100 3Q 2012 3Q 2011 Revenues ($ in millions) $0 $2 $4 $6 $8 $10 $12 $14 3Q 2012 3Q 2011 Operating Earnings ($ in millions) 87.0 95.9 5.7 13.0 *At 2011 average FX rates **At 2012 average FX rates Pro Forma 2012/2011 2012* 2012** 2011 % Change Revenues 102,609$ 95,876$ 86,970$ 10.2% Total Operating Expenses 89,235 82,888 81,284 2.0% Operating Earnings 13,374$ 12,988$ 5,686$ 128.4% Operating Margin 13.0% 13.5% 6.5%
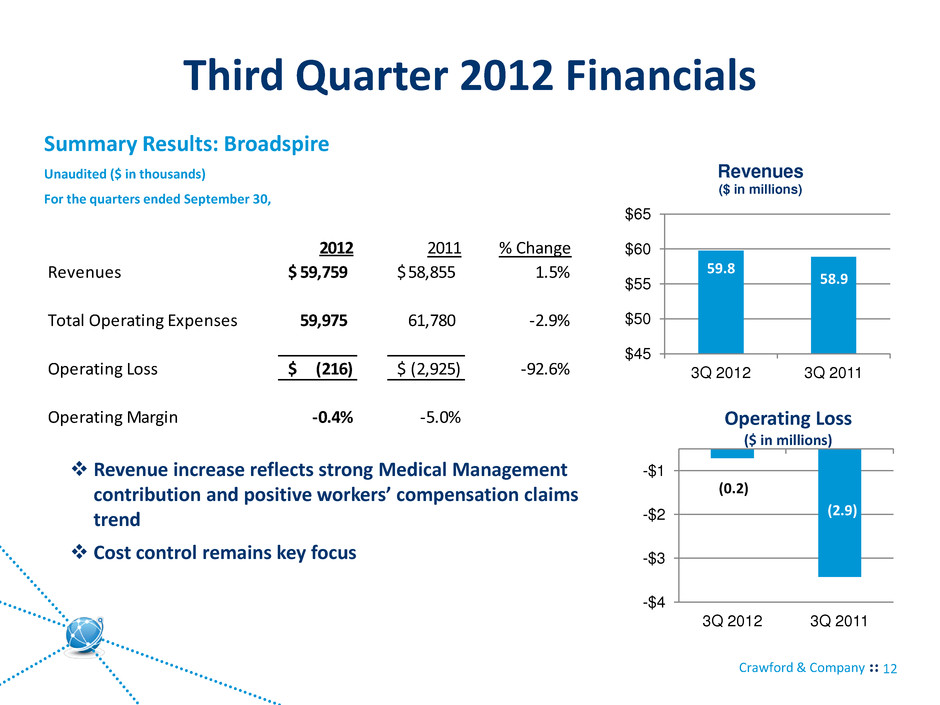
Crawford & Company Third Quarter 2012 Financials 12 Summary Results: Broadspire Unaudited ($ in thousands) For the quarters ended September 30, Revenue increase reflects strong Medical Management contribution and positive workers’ compensation claims trend Cost control remains key focus $45 $50 $55 $60 $65 3Q 2012 3Q 2011 Revenues ($ in millions) -$4 -$3 -$2 -$1 3Q 2012 3Q 2011 58.9 59.8 (2.9) (0.2) Operating Loss ($ in millions) 2012 2011 % Change Revenues 59,759$ 58,855$ 1.5% Total Operating Expenses 59,975 61,780 -2.9% Operating Loss (216)$ (2,925)$ -92.6% Operating Margin -0.4% -5.0%
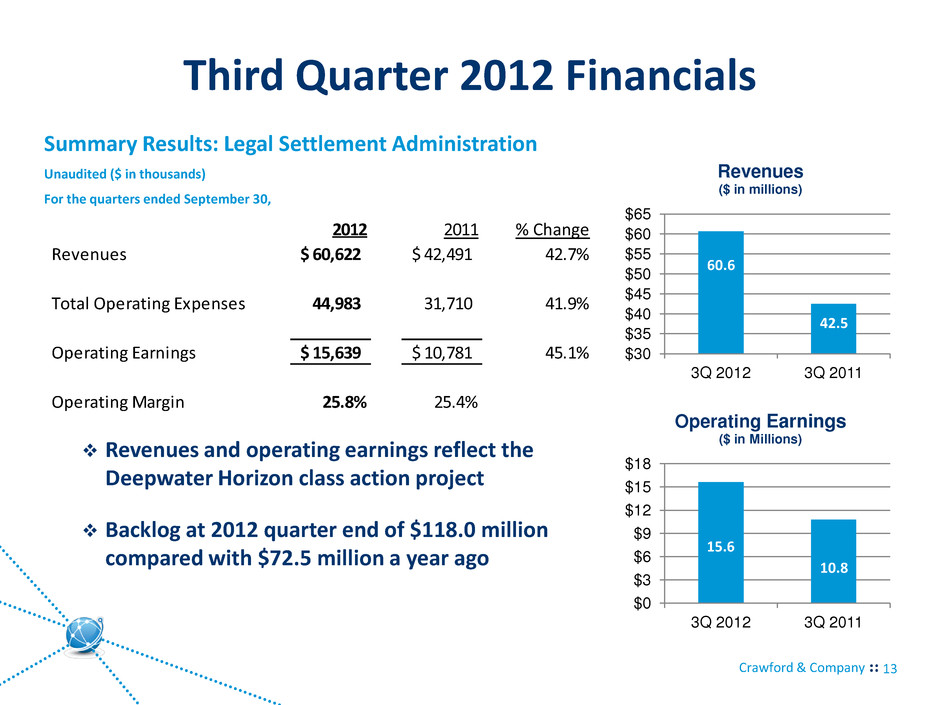
Crawford & Company Third Quarter 2012 Financials 13 Summary Results: Legal Settlement Administration Unaudited ($ in thousands) For the quarters ended September 30, $30 $35 $40 $45 $50 $55 $60 $65 3Q 2012 3Q 2011 Revenues ($ in millions) $0 $3 $6 $9 $12 $15 $18 3Q 2012 3Q 2011 Operating Earnings ($ in Millions) 42.5 60.6 10.8 15.6 Revenues and operating earnings reflect the Deepwater Horizon class action project Backlog at 2012 quarter end of $118.0 million compared with $72.5 million a year ago 2012 2011 % Change Revenues 60,622$ 42,491$ 42.7% Total Operating Expenses 44,983 31,710 41.9% Operating Earnings 15,639$ 10,781$ 45.1% Operating Margin 25.8% 25.4%
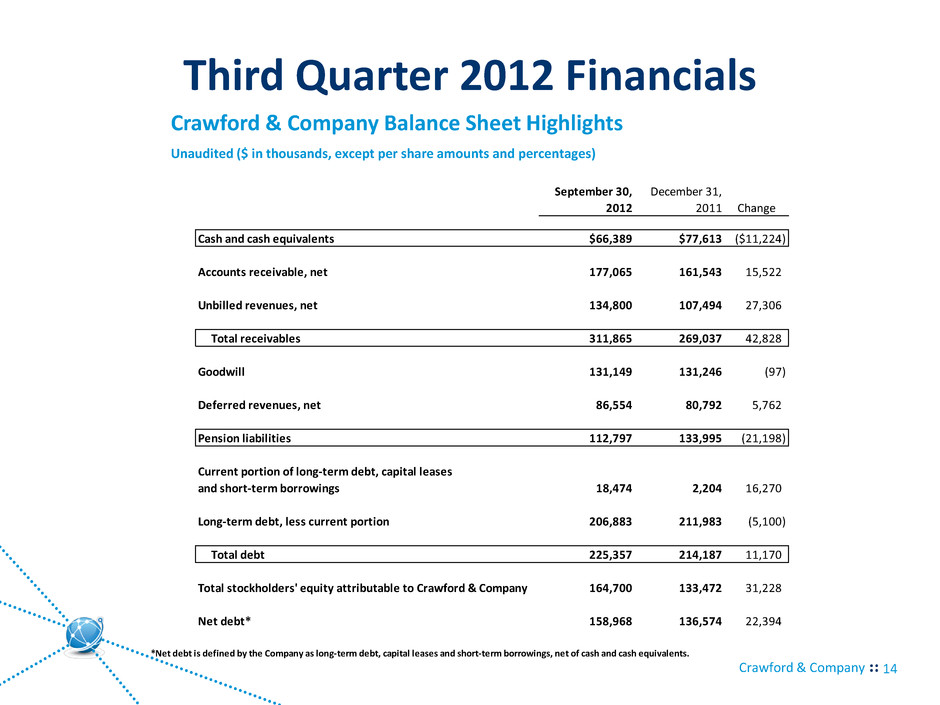
Crawford & Company Third Quarter 2012 Financials 14 Crawford & Company Balance Sheet Highlights Unaudited ($ in thousands, except per share amounts and percentages) September 30, December 31, 2012 2011 Change Cash and cash equivalents $66,389 $77,613 ($11,224) Accounts receivable, net 177,065 161,543 15,522 Unbilled revenues, net 134,800 107,494 27,306 Total receivables 311,865 269,037 42,828 Goodwill 131,149 131,246 (97) Deferred revenues, net 86,554 80,792 5,762 Pension liabilities 112,797 133,995 (21,198) Current portion of long-term debt, capital leases and short-term borrowings 18,474 2,204 16,270 Long-term debt, less current portion 206,883 211,983 (5,100) Total debt 225,357 214,187 11,170 Total stockholders' equity attributable to Crawford & Company 164,700 133,472 31,228 Net debt* 158,968 136,574 22,394 *Net debt is defined by the Company as long-term debt, capital leases and short-term borrowings, net of cash and cash equivalents.
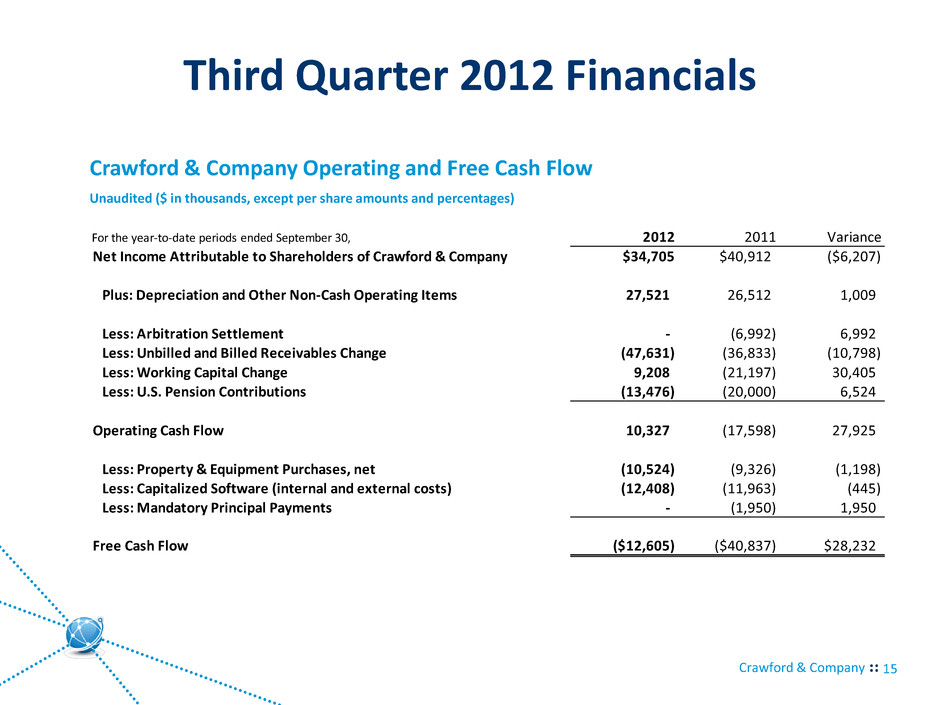
Crawford & Company Third Quarter 2012 Financials 15 Crawford & Company Operating and Free Cash Flow Unaudited ($ in thousands, except per share amounts and percentages) For the year-to-date periods ended September 30, 2012 2011 Variance Net Income Attributable to Shareholders of Crawford & Company $34,705 $40,912 ($6,207) Plus: Depreciation and Other Non-Cash Operating Items 27,521 26,512 1,009 Less: Arbitration Settlement - (6,992) 6,992 Less: Unbilled and Billed Receivables Change (47,631) (36,833) (10,798) Less: Working Capital Change 9,208 (21,197) 30,405 Less: U.S. Pension Contributions (13,476) (20,000) 6,524 Operating Cash Flow 10,327 (17,598) 27,925 Less: Property & Equipment Purchases, net (10,524) (9,326) (1,198) L ss: Capitalized Software (internal and external costs) (12,408) (11,963) (445) Less: Mandatory Principal Payments - (1,950) 1,950 Free Cash Flow ($12,605) ($40,837) $28,232
Third Quarter 2012 Operational Review
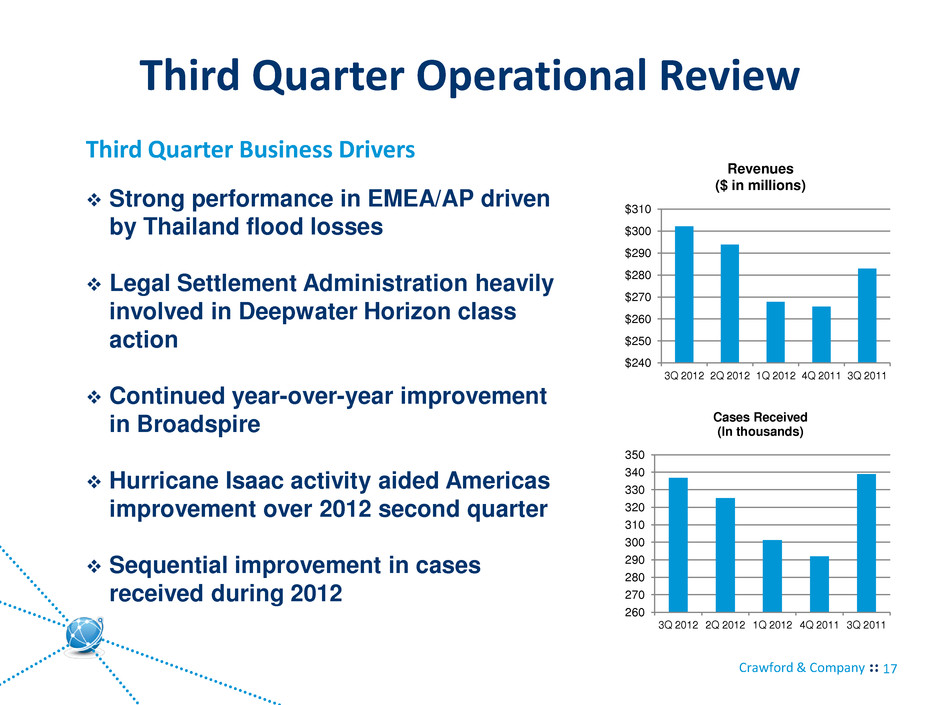
Crawford & Company Third Quarter Operational Review 17 Third Quarter Business Drivers $240 $250 $260 $270 $280 $290 $300 $310 3Q 2012 2Q 2012 1Q 2012 4Q 2011 3Q 2011 Revenues ($ in millions) 260 270 280 290 300 310 320 330 340 350 3Q 2012 2Q 2012 1Q 2012 4Q 2011 3Q 2011 Cases Received (In thousands) Strong performance in EMEA/AP driven by Thailand flood losses Legal Settlement Administration heavily involved in Deepwater Horizon class action Continued year-over-year improvement in Broadspire Hurricane Isaac activity aided Americas improvement over 2012 second quarter Sequential improvement in cases received during 2012
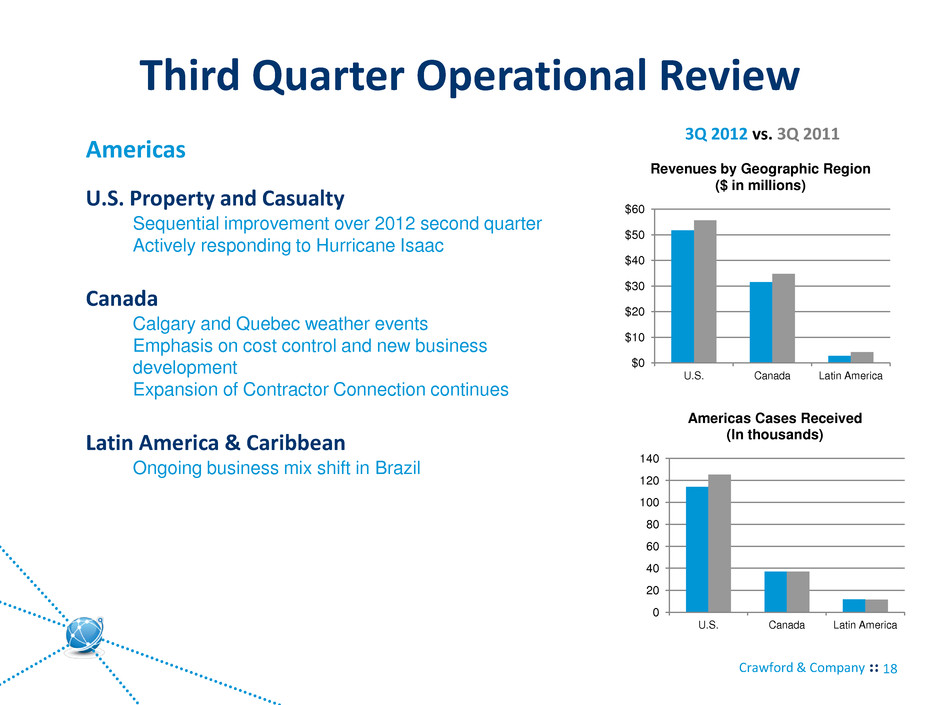
Crawford & Company Third Quarter Operational Review 18 Americas $0 $10 $20 $30 $40 $50 $60 U.S. Canada Latin America Revenues by Geographic Region ($ in millions) U.S. Property and Casualty Sequential improvement over 2012 second quarter Actively responding to Hurricane Isaac Canada Calgary and Quebec weather events Emphasis on cost control and new business development Expansion of Contractor Connection continues Latin America & Caribbean Ongoing business mix shift in Brazil 3Q 2012 vs. 3Q 2011 0 20 40 60 80 100 120 140 U.S. Canada Latin America Americas Cases Received (In thousands)
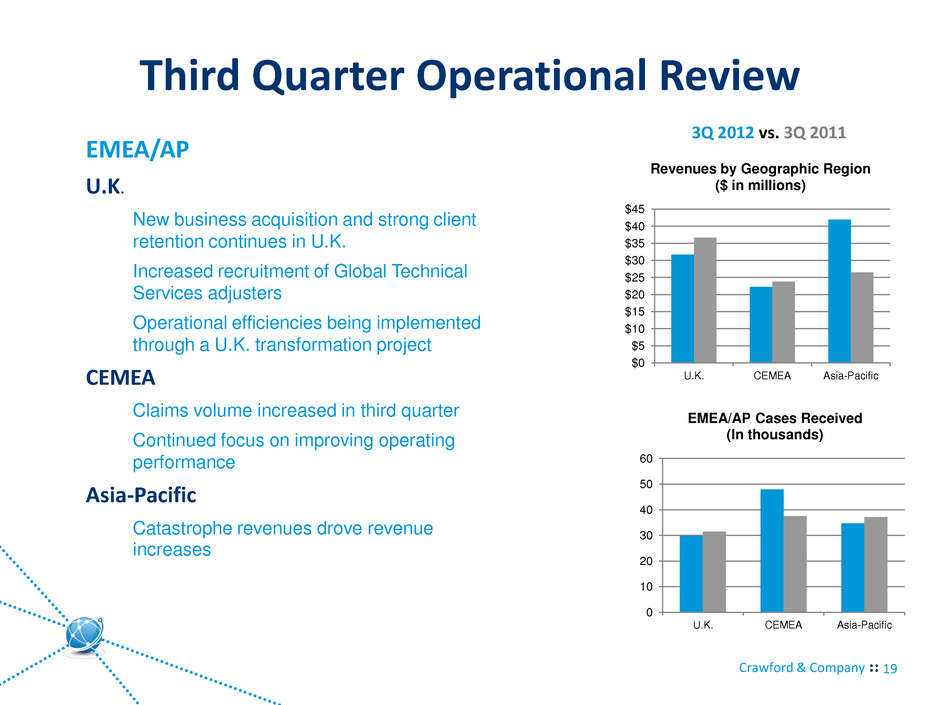
Crawford & Company Third Quarter Operational Review 19 EMEA/AP $0 $5 $10 $15 $20 $25 $30 $35 $40 $45 U.K. CEMEA Asia-Pacific Revenues by Geographic Region ($ in millions) U.K. New business acquisition and strong client retention continues in U.K. Increased recruitment of Global Technical Services adjusters Operational efficiencies being implemented through a U.K. transformation project CEMEA Claims volume increased in third quarter Continued focus on improving operating performance Asia-Pacific Catastrophe revenues drove revenue increases 0 10 20 30 40 50 60 U.K. CEMEA Asia-Pacific EMEA/AP Cases Received (In thousands) 3Q 2012 vs. 3Q 2011
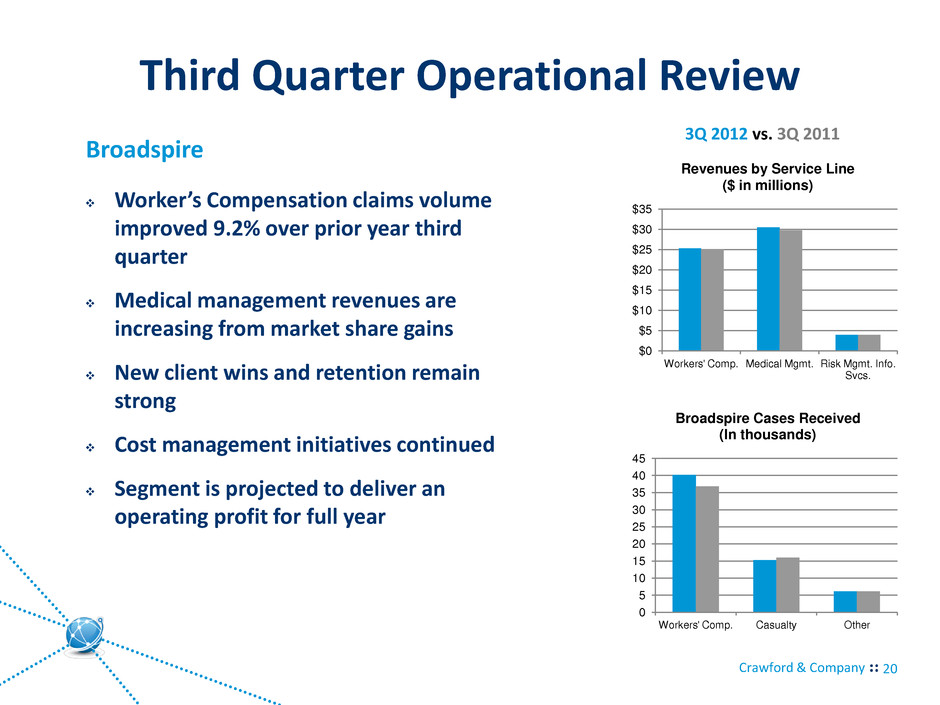
Crawford & Company Third Quarter Operational Review 20 Broadspire $0 $5 $10 $15 $20 $25 $30 $35 Workers' Comp. Medical Mgmt. Risk Mgmt. Info. Svcs. Revenues by Service Line ($ in millions) Worker’s Compensation claims volume improved 9.2% over prior year third quarter Medical management revenues are increasing from market share gains New client wins and retention remain strong Cost management initiatives continued Segment is projected to deliver an operating profit for full year 0 5 10 15 20 25 30 35 40 45 Workers' Comp. Casualty Other Broadspire Cases Received (In thousands) 3Q 2012 vs. 3Q 2011
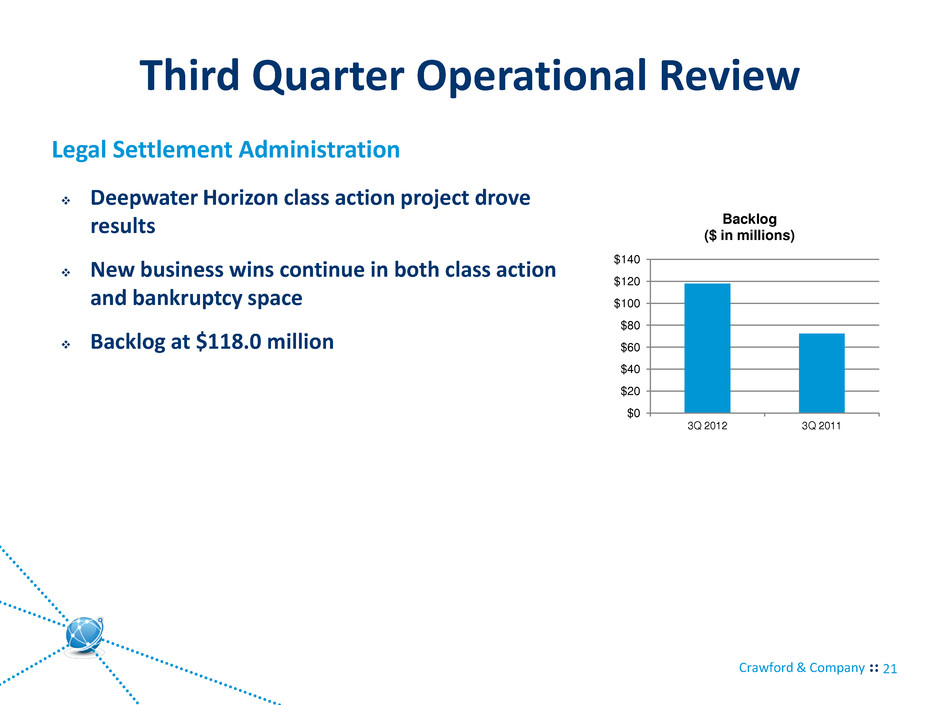
Crawford & Company Third Quarter Operational Review 21 Legal Settlement Administration $0 $20 $40 $60 $80 $100 $120 $140 3Q 2012 3Q 2011 Backlog ($ in millions) Deepwater Horizon class action project drove results New business wins continue in both class action and bankruptcy space Backlog at $118.0 million
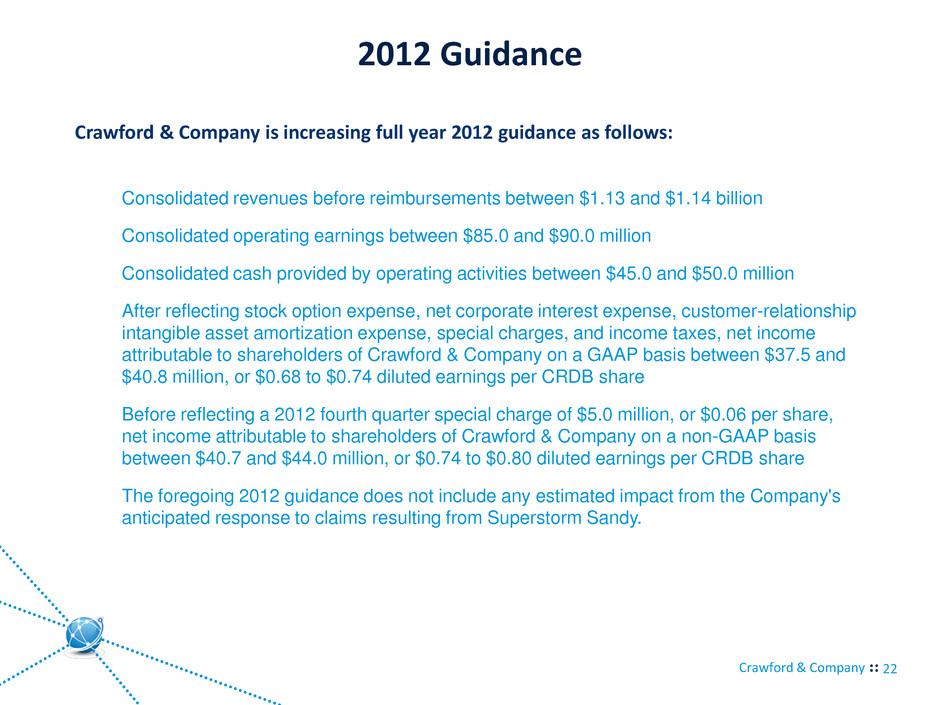
Crawford & Company 2012 Guidance 22 Crawford & Company is increasing full year 2012 guidance as follows: Consolidated revenues before reimbursements between $1.13 and $1.14 billion Consolidated operating earnings between $85.0 and $90.0 million Consolidated cash provided by operating activities between $45.0 and $50.0 million After reflecting stock option expense, net corporate interest expense, customer-relationship intangible asset amortization expense, special charges, and income taxes, net income attributable to shareholders of Crawford & Company on a GAAP basis between $37.5 and $40.8 million, or $0.68 to $0.74 diluted earnings per CRDB share Before reflecting a 2012 fourth quarter special charge of $5.0 million, or $0.06 per share, net income attributable to shareholders of Crawford & Company on a non-GAAP basis between $40.7 and $44.0 million, or $0.74 to $0.80 diluted earnings per CRDB share The foregoing 2012 guidance does not include any estimated impact from the Company's anticipated response to claims resulting from Superstorm Sandy.
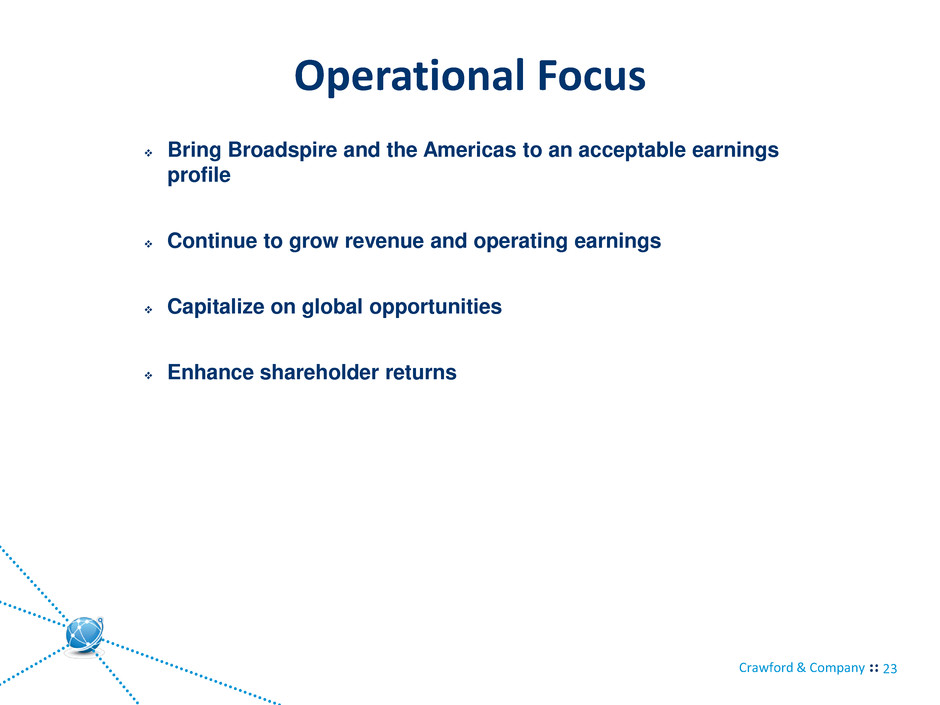
Crawford & Company Operational Focus 23 Bring Broadspire and the Americas to an acceptable earnings profile Continue to grow revenue and operating earnings Capitalize on global opportunities Enhance shareholder returns
Third Quarter 2012 Appendix
Crawford & Company Appendix: Non-GAAP Financial Information 25 Measurements of financial performance not calculated in accordance with GAAP should be considered as supplements to, and not substitutes for, performance measurements calculated or derived in accordance with GAAP. Any such measures are not necessarily comparable to other similarly-titled measurements employed by other companies. Reimbursements for Out-of-Pocket Expenses In the normal course of our business, our operating segments incur certain out-of-pocket expenses that are thereafter reimbursed by our clients. Under GAAP, these out-of-pocket expenses and associated reimbursements are required to be included when reporting expenses and revenues, respectively, in our consolidated results of operations. In this presentation, we do not believe it is informative to include the GAAP-required gross up of our revenues and expenses for these pass-through reimbursed expenses. The amounts of reimbursed expenses and related revenues offset each other in our consolidated results of operations with no impact to our net income or operating earnings (loss). Unless noted in this presentation, revenue and expense amounts exclude reimbursements for out-of-pocket expenses. Net debt Net debt is computed as the sum of long-term debt, capital leases and short-term borrowings less cash and cash equivalents. Management believes that net debt is useful because it provides investors with an estimate of what the Company’s debt would be if all available cash was used to pay down the debt of the Company. The measure is not meant to imply that management plans to use all available cash to pay down debt. Deferred Revenues, net Deferred Revenues, net is computed as the sum of the current and noncurrent deferred revenues as reported on our Consolidated Balance Sheets less the sum of the current receivable held in trust to be released to us as payment to service these revenues. The current receivable held in trust is reported as a component of Accounts Receivable in our Consolidated Balance Sheets. The funds represented by the amount of the receivable held in trust are released to the Company over time to partially offset the costs of servicing the deferred revenues. Management believes that subtracting the receivable held in trust from deferred revenues provides investors with a snapshot of what the net cash costs will be to service the deferred revenues in the future. Free Cash Flow Management believes free cash flow is useful to investors as it presents the amount of cash the Company has generated that can be used for other purposes, including additional contributions to the Company’s defined benefit pension plans, discretionary prepayments of outstanding borrowings under our credit agreement, and return of capital to shareholders, among other purposes. It does not represent the residual cash flow of the Company available for discretionary expenditures.
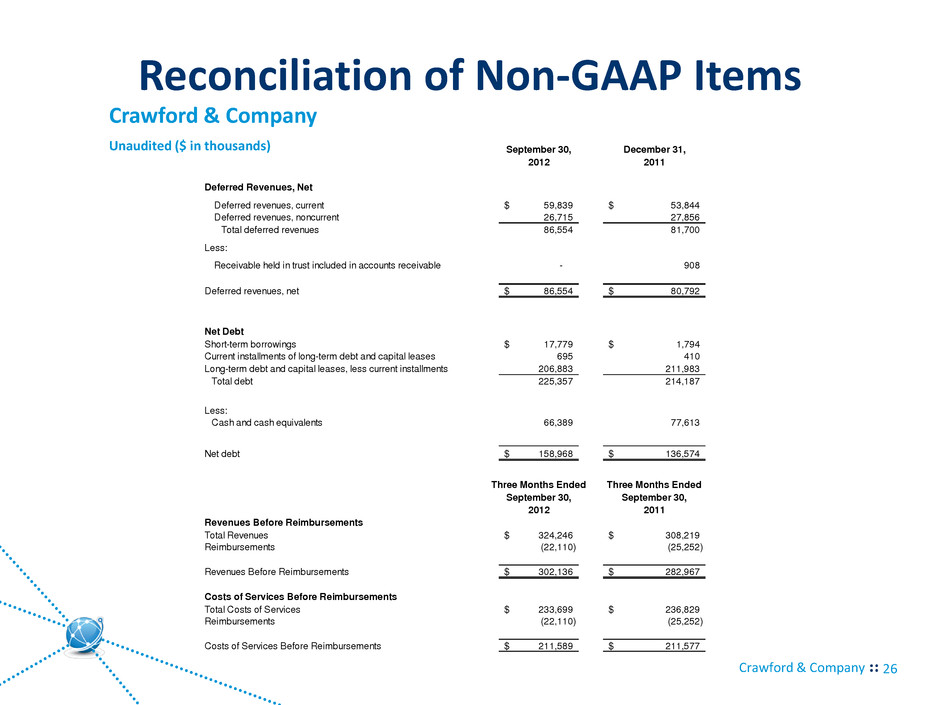
Crawford & Company Reconciliation of Non-GAAP Items 26 Crawford & Company Unaudited ($ in thousands) September 30, December 31, 2012 2011 Deferred Revenues, Net Deferred revenues, current 59,839$ 53,844$ Deferred revenues, noncurrent 26,715 27,856 Total deferred revenues 86,554 81,700 Less: Receivable held in trust included in accounts receivable - 908 Deferred revenues, net 86,554$ 80,792$ Net Debt Short-term borrowings 17,779$ 1,794$ Current installments of long-term debt and capital leases 695 410 Long-term debt and capital leases, less current installments 206,883 211,983 Total debt 225,357 214,187 Less: Cash and cash equivalents 66,389 77,613 Net debt 158,968$ 136,574$ Three Months Ended Three Months Ended September 30, September 30, 2012 2011 Revenues Before Reimbursements Total Revenues 324,246$ 308,219$ Reimbursements (22,110) (25,252) Revenues Before Reimbursements 302,136$ 282,967$ Costs of Services Before Reimbursements Total Costs of Services 233,699$ 236,829$ Reimbursements (22,110) (25,252) Costs of Services Before Reimbursements 211,589$ 211,577$
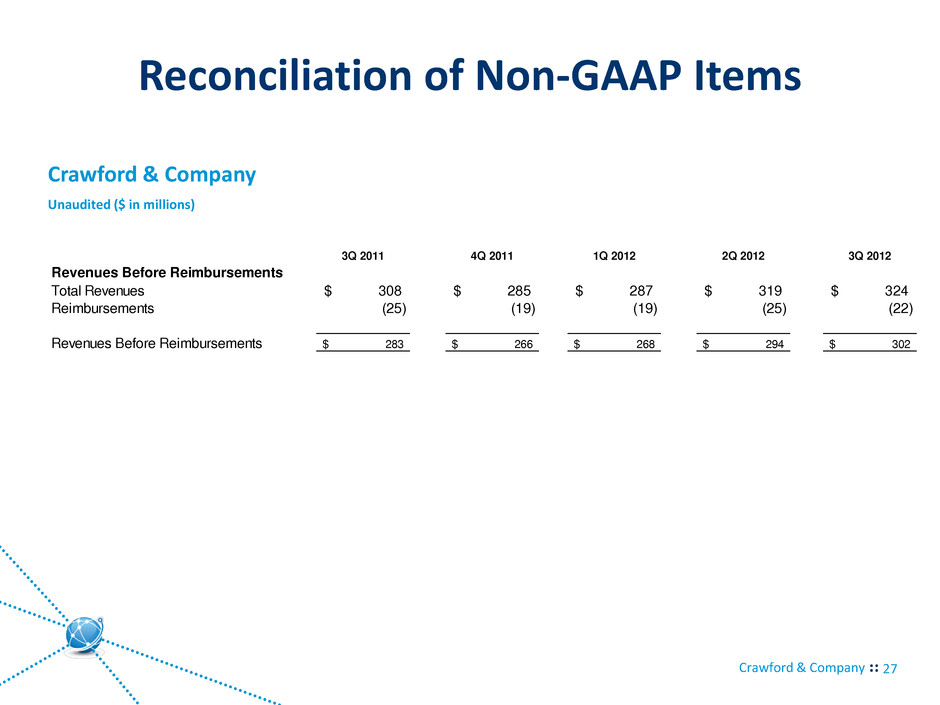
Crawford & Company Reconciliation of Non-GAAP Items 27 Crawford & Company Unaudited ($ in millions) 3Q 2011 4Q 2011 1Q 2012 2Q 2012 3Q 2012 Revenues Before Reimbursements Total Revenu s 308$ 285$ 287$ 319$ 324$ Reimburs ments (25) (19) (19) (25) ( 2) Revenues Before Reimbursements 283$ 266$ 268$ 294$ 302$


