
Crawford & Company FIRST QUARTER 2014 EARNINGS CONFERENCE CALL May 5, 2014
• Forward-Looking Statements —This presentation contains forward-looking statements, including statements about the future financial condition, results of operations and earnings outlook of Crawford & Company. Statements, both qualitative and quantitative, that are not statements of historical fact may be “forward-looking statements” as defined in the Private Securities Litigation Reform Act of 1995 and other securities laws. Forward-looking statements involve a number of risks and uncertainties that could cause actual results to differ materially from historical experience or Crawford & Company’s present expectations. Accordingly, no one should place undue reliance on forward-looking statements, which speak only as of the date on which they are made. Crawford & Company does not undertake to update forward-looking statements to reflect the impact of circumstances or events that may arise or not arise after the date the forward-looking statements are made. Results for any interim period presented herein are not necessarily indicative of results to be expected for the full year or for any other future period. For further information regarding Crawford & Company, and the risks and uncertainties involved in forward-looking statements, please read Crawford & Company’s reports filed with the United States Securities and Exchange Commission and available at www.sec.gov or in the Investor Relations section of Crawford & Company’s website at www.crawfordandcompany.com. —Crawford’s business is dependent, to a significant extent, on case volumes. The Company cannot predict the future trend of case volumes for a number of reasons, including the fact that the frequency and severity of weather-related claims and the occurrence of natural and man-made disasters, which are a significant source of claims and revenue for the Company, are generally not subject to accurate forecasting. —In recent periods the Company has derived a material portion of its revenues and operating earnings from a limited number of client engagements and special projects within its Legal Settlement Administration and EMEA/AP segments, specifically their work on the gulf-related class action settlement and Thailand flooding claims. These projects continue to wind down and management expects revenues, and related operating earnings from these projects, to continue to be at a reduced rate through the remainder of 2014 as compared to 2013 levels. No assurances of timing of the project end dates and, therefore, continued revenues or operating earnings, can be provided. In the event the Company is unable to replace revenues and related operating earnings from these projects as they wind down, or upon the termination or other expiration thereof, with revenues and operating earnings from new projects and customers within this or other segments, there could be a material adverse effect on the Company's results of operations. • Revenues Before Reimbursements (“Revenues”) —Revenues Before Reimbursements are referred to as “Revenues” in both consolidated and segment charts, bullets and tables throughout this presentation. • Segment and Consolidated Operating Earnings —Under the Financial Accounting Standards Board’s Accounting Standards Codification ("ASC") Topic 280, “Segment Reporting,” the Company has defined segment operating earnings as the primary measure used by the Company to evaluate the results of each of its four operating segments. Segment operating earnings exclude income taxes, interest expense, amortization of customer-relationship intangible assets, stock option expense, earnings or loss attributable to non-controlling interests, and certain unallocated corporate and shared costs and credits. Consolidated operating earnings is the total of segment operating earnings and certain unallocated and shared costs and credits. • Earnings Per Share —The Company's two classes of stock are substantially identical, except with respect to voting rights and the Company's ability to pay greater cash dividends on the non-voting Class A Common Stock than on the voting Class B Common Stock, subject to certain limitations. In addition, with respect to mergers or similar transactions, holders of Class A Common Stock must receive the same type and amount of consideration as holders of Class B Common Stock, unless different consideration is approved by the holders of 75% of the Class A Common Stock, voting as a class. —In certain periods, the Company has paid a higher dividend on CRDA than on CRDB. This may result in a different earnings per share ("EPS") for each class of stock due to the two-class method of computing EPS as required by the guidance in ASC Topic 260 - "Earnings Per Share". The two- class method is an earnings allocation method under which EPS is calculated for each class of common stock considering both dividends declared and participation rights in undistributed earnings as if all such earnings had been distributed during the period. • Non-GAAP Financial Information —For additional information about certain non-GAAP financial information presented herein, see the Appendix following this presentation. 2 FORWARD-LOOKING STATEMENTS AND ADDITIONAL INFORMATION
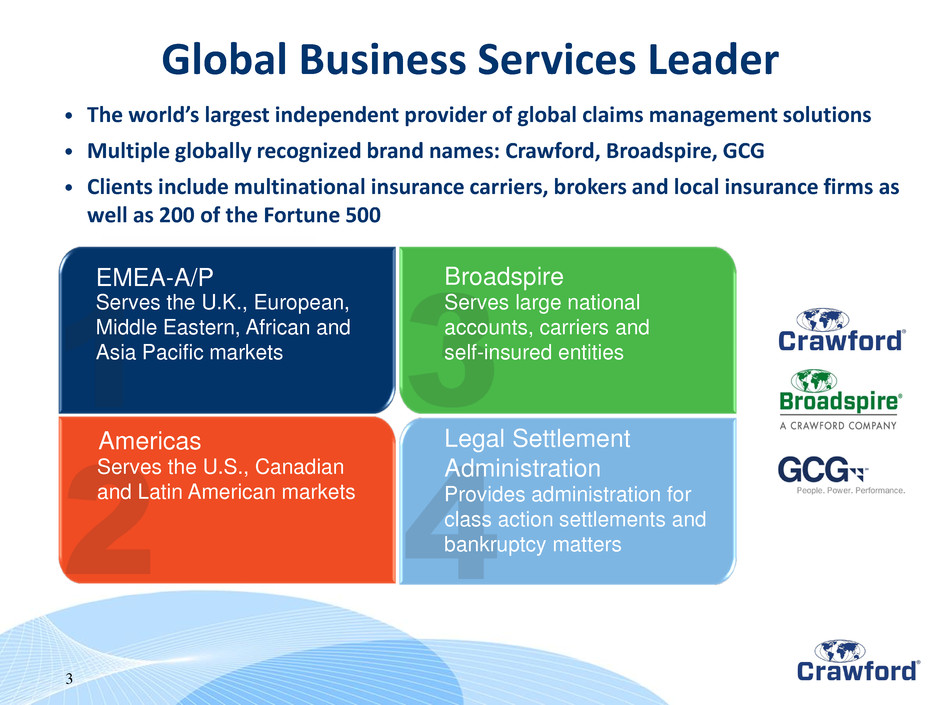
3 • The world’s largest independent provider of global claims management solutions • Multiple globally recognized brand names: Crawford, Broadspire, GCG • Clients include multinational insurance carriers, brokers and local insurance firms as well as 200 of the Fortune 500 EMEA-A/P Broadspire Legal Settlement Administration Americas Serves large national accounts, carriers and self-insured entities Serves the U.K., European, Middle Eastern, African and Asia Pacific markets Serves the U.S., Canadian and Latin American markets Provides administration for class action settlements and bankruptcy matters Global Business Services Leader
Today’s Agenda Welcome and Opening Comments First Quarter 2014 Financial Review First Quarter 2014 Review and Outlook Guidance and Future Operational Focus
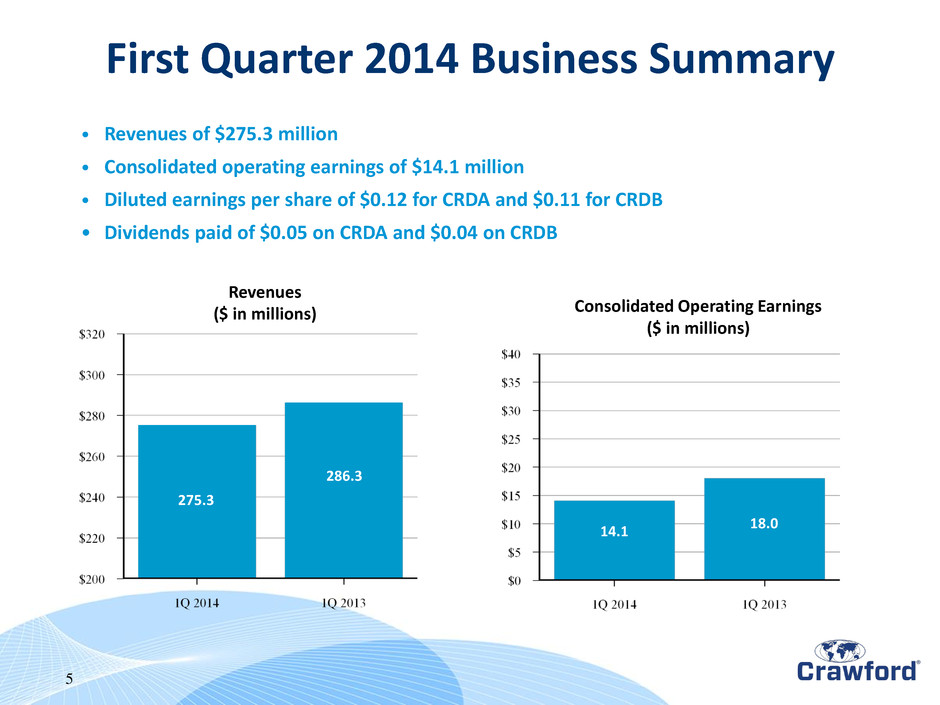
275.3 286.3 14.1 18.0 5 Revenues ($ in millions) Consolidated Operating Earnings ($ in millions) First Quarter 2014 Business Summary • Revenues of $275.3 million • Consolidated operating earnings of $14.1 million • Diluted earnings per share of $0.12 for CRDA and $0.11 for CRDB • Dividends paid of $0.05 on CRDA and $0.04 on CRDB
First Quarter 2014 Financial Review
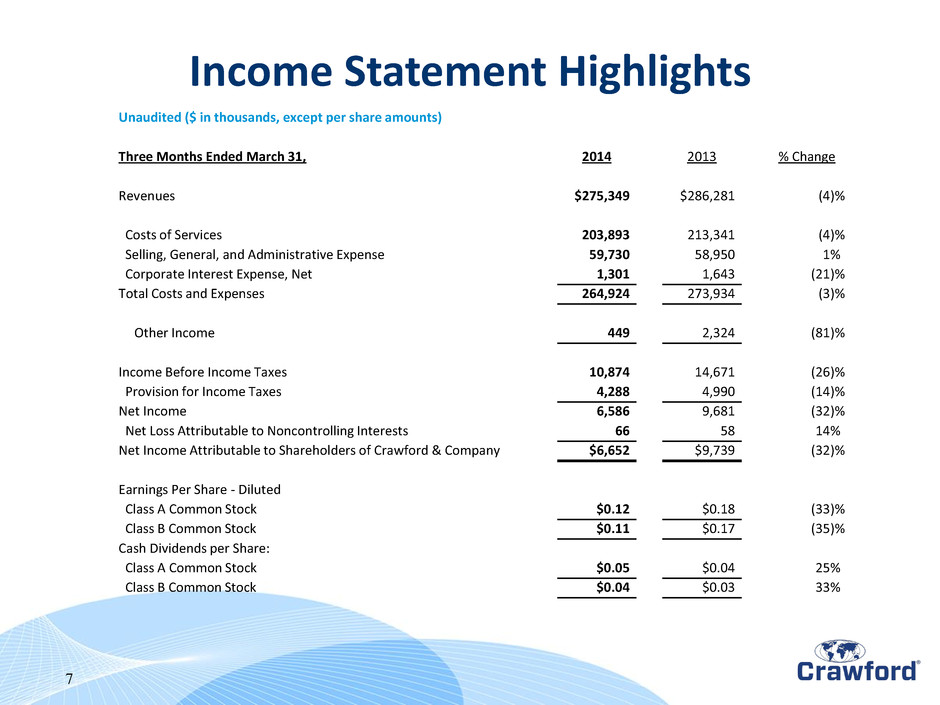
Unaudited ($ in thousands, except per share amounts) Three Months Ended March 31, 2014 2013 % Change Revenues $275,349 $286,281 (4 )% Costs of Services 203,893 213,341 (4 )% Selling, General, and Administrative Expense 59,730 58,950 1 % Corporate Interest Expense, Net 1,301 1,643 (21 )% Total Costs and Expenses 264,924 273,934 (3 )% Other Income 449 2,324 (81 )% Income Before Income Taxes 10,874 14,671 (26 )% Provision for Income Taxes 4,288 4,990 (14 )% Net Income 6,586 9,681 (32 )% Net Loss Attributable to Noncontrolling Interests 66 58 14 % Net Income Attributable to Shareholders of Crawford & Company $6,652 $9,739 (32 )% Earnings Per Share - Diluted Class A Common Stock $0.12 $0.18 (33 )% Class B Common Stock $0.11 $0.17 (35 )% Cash Dividends per Share: Class A Common Stock $0.05 $0.04 25 % Class B Common Stock $0.04 $0.03 33 % 7 Income Statement Highlights
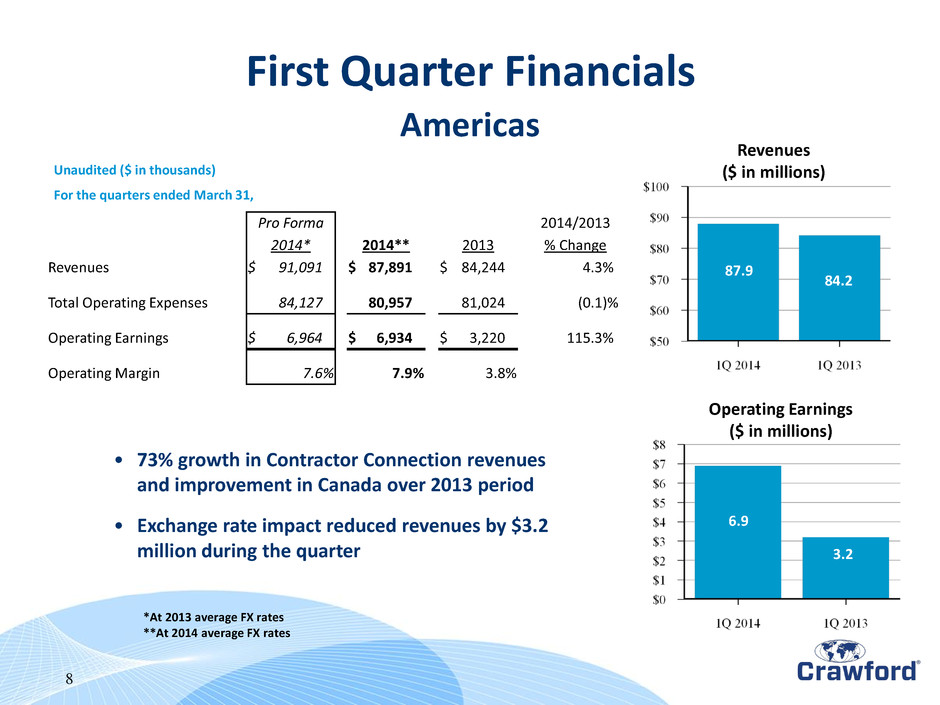
Pro Forma 2014/2013 2014* 2014** 2013 % Change Revenues $ 91,091 $ 87,891 $ 84,244 4.3 % Total Operating Expenses 84,127 80,957 81,024 (0.1 )% Operating Earnings $ 6,964 $ 6,934 $ 3,220 115.3 % Operating Margin 7.6 % 7.9 % 3.8 % 85 .9 6. 5 95 .9 87.9 84.2 3.2 8 Revenues ($ in millions) Operating Earnings ($ in millions) Unaudited ($ in thousands) For the quarters ended March 31, *At 2013 average FX rates **At 2014 average FX rates Americas First Quarter Financials 6.9 • 73% growth in Contractor Connection revenues and improvement in Canada over 2013 period • Exchange rate impact reduced revenues by $3.2 million during the quarter
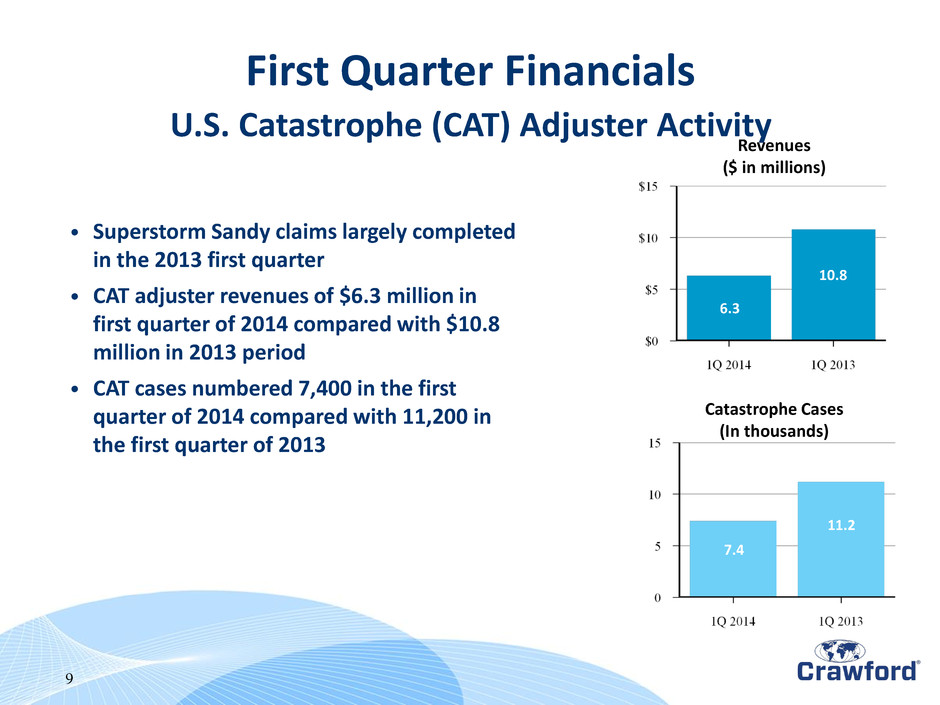
9. 1 85 .9 6. 5 6.3 10.8 11.2 9 Revenues ($ in millions) Catastrophe Cases (In thousands) • Superstorm Sandy claims largely completed in the 2013 first quarter • CAT adjuster revenues of $6.3 million in first quarter of 2014 compared with $10.8 million in 2013 period • CAT cases numbered 7,400 in the first quarter of 2014 compared with 11,200 in the first quarter of 2013 U.S. Catastrophe (CAT) Adjuster Activity First Quarter Financials 7.4
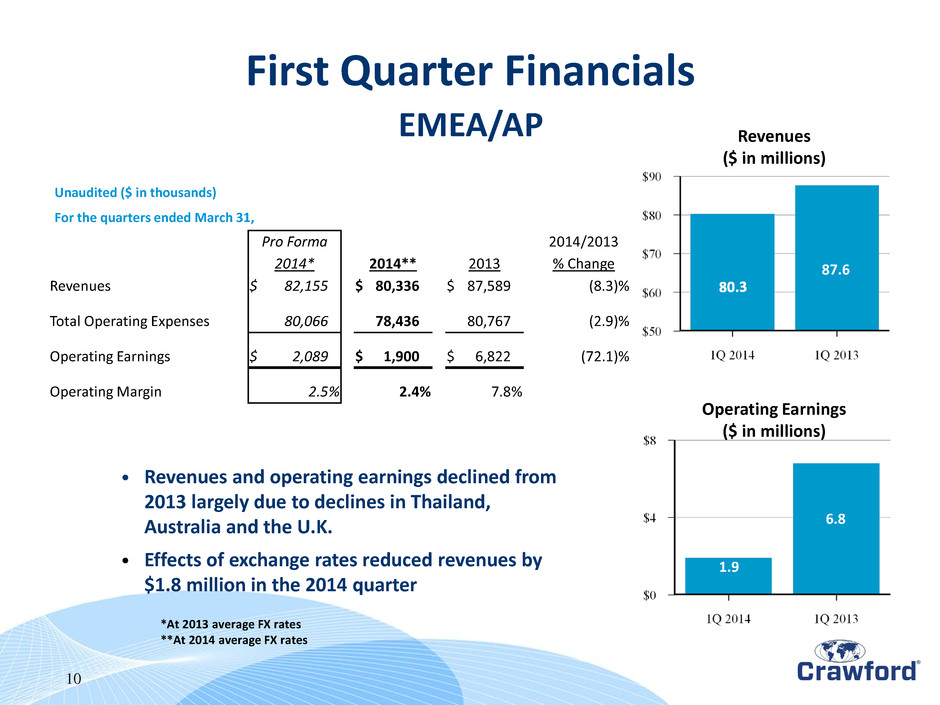
87.6 6.8 Pro Forma 2014/2013 2014* 2014** 2013 % Change Revenues $ 82,155 $ 80,336 $ 87,589 (8.3 )% Total Operating Expenses 80,066 78,436 80,767 (2.9 )% Operating Earnings $ 2,089 $ 1,900 $ 6,822 (72.1 )% Operating Margin 2.5 % 2.4 % 7.8 % 10 Operating Earnings ($ in millions) Revenues ($ in millions) Unaudited ($ in thousands) For the quarters ended March 31, • Revenues and operating earnings declined from 2013 largely due to declines in Thailand, Australia and the U.K. • Effects of exchange rates reduced revenues by $1.8 million in the 2014 quarter *At 2013 average FX rates **At 2014 average FX rates EMEA/AP First Quarter Financials 1.9
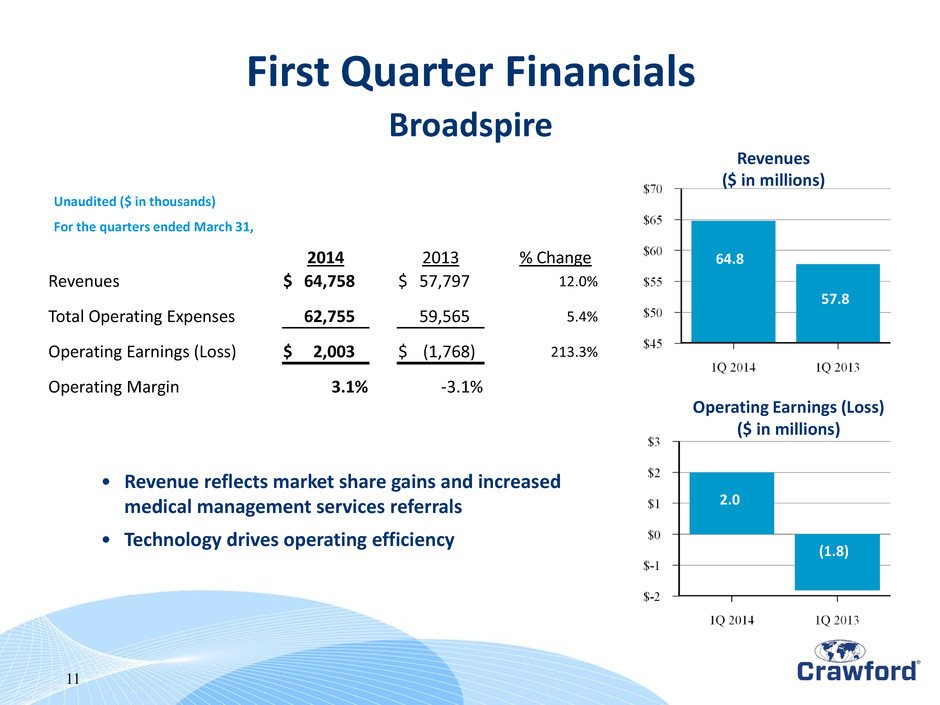
64.8 57.8 2.0 2014 2013 % Change Revenues $ 64,758 $ 57,797 12.0 % Total Operating Expenses 62,755 59,565 5.4 % Operating Earnings (Loss) $ 2,003 $ (1,768 ) 213.3 % Operating Margin 3.1 % -3.1 % 11 Revenues ($ in millions) Operating Earnings (Loss) ($ in millions) Unaudited ($ in thousands) For the quarters ended March 31, • Revenue reflects market share gains and increased medical management services referrals • Technology drives operating efficiency Broadspire First Quarter Financials (1.8)
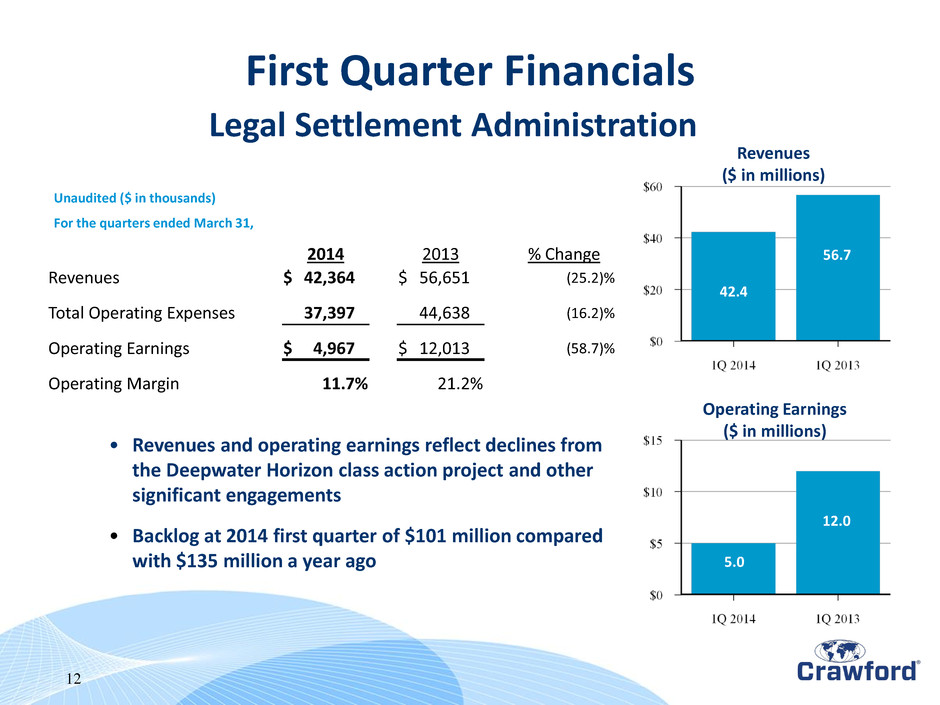
42.4 56.7 12.0 2014 2013 % Change Revenues $ 42,364 $ 56,651 (25.2 )% Total Operating Expenses 37,397 44,638 (16.2 )% Operating Earnings $ 4,967 $ 12,013 (58.7 )% Operating Margin 11.7 % 21.2 % 5.0 12 Revenues ($ in millions) Operating Earnings ($ in millions) Unaudited ($ in thousands) For the quarters ended March 31, • Revenues and operating earnings reflect declines from the Deepwater Horizon class action project and other significant engagements • Backlog at 2014 first quarter of $101 million compared with $135 million a year ago Legal Settlement Administration First Quarter Financials
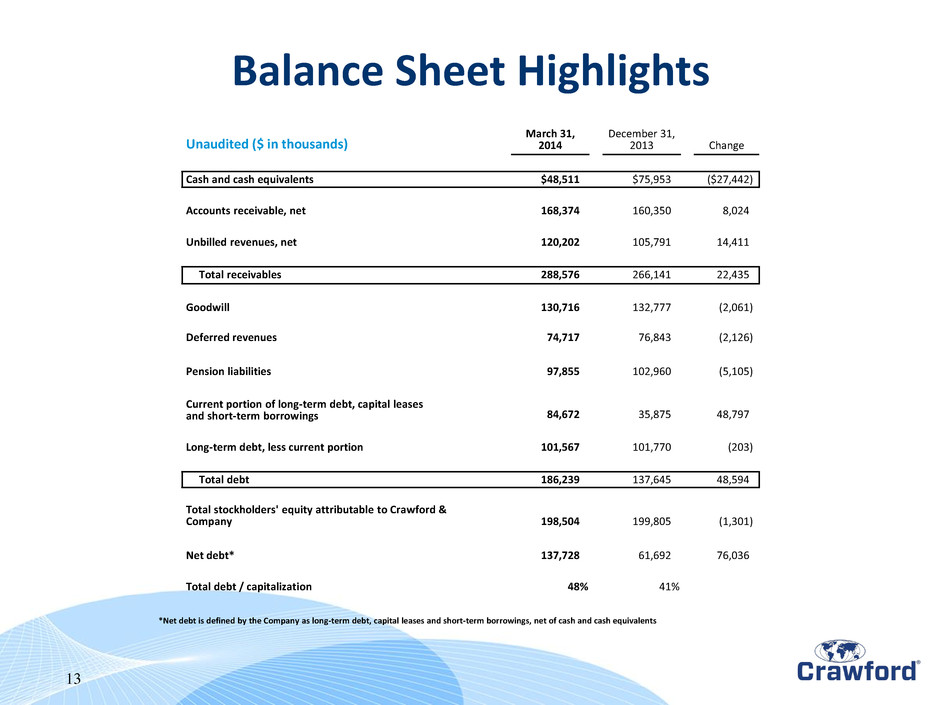
13 Unaudited ($ in thousands) March 31, 2014 December 31, 2013 Change Cash and cash equivalents $48,511 $75,953 ($27,442 ) Accounts receivable, net 168,374 160,350 8,024 Unbilled revenues, net 120,202 105,791 14,411 Total receivables 288,576 266,141 22,435 Goodwill 130,716 132,777 (2,061 ) Deferred revenues 74,717 76,843 (2,126 ) Pension liabilities 97,855 102,960 (5,105 ) Current portion of long-term debt, capital leases and short-term borrowings 84,672 35,875 48,797 Long-term debt, less current portion 101,567 101,770 (203 ) Total debt 186,239 137,645 48,594 Total stockholders' equity attributable to Crawford & Company 198,504 199,805 (1,301 ) Net debt* 137,728 61,692 76,036 Total debt / capitalization 48 % 41 % *Net debt is defined by the Company as long-term debt, capital leases and short-term borrowings, net of cash and cash equivalents Balance Sheet Highlights
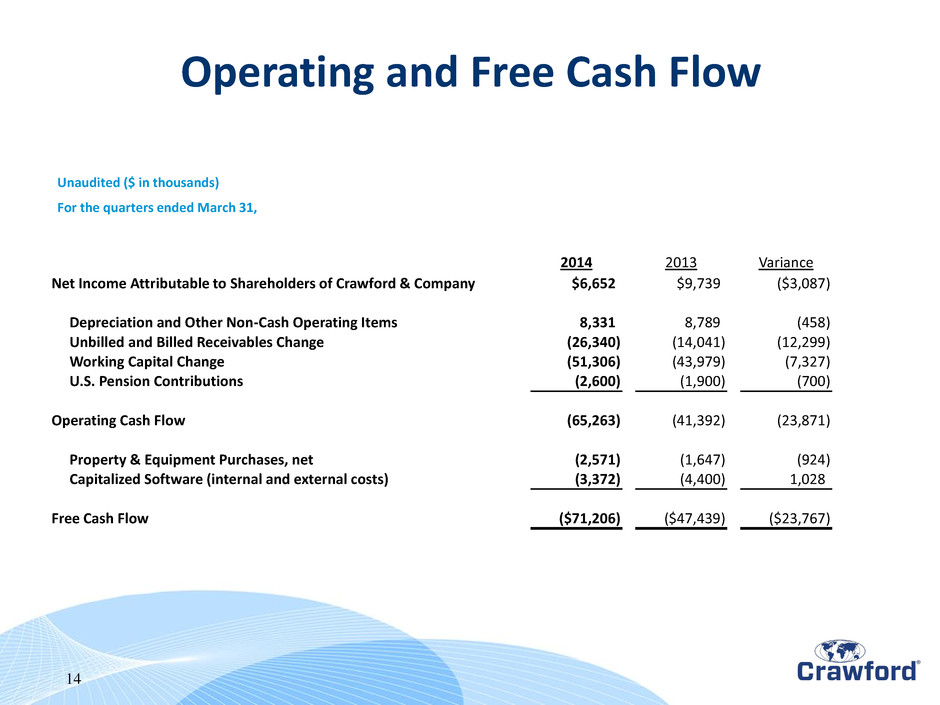
14 2014 2013 Variance Net Income Attributable to Shareholders of Crawford & Company $6,652 $9,739 ($3,087 ) Depreciation and Other Non-Cash Operating Items 8,331 8,789 (458 ) Unbilled and Billed Receivables Change (26,340 ) (14,041 ) (12,299 ) Working Capital Change (51,306 ) (43,979 ) (7,327 ) U.S. Pension Contributions (2,600 ) (1,900 ) (700 ) Operating Cash Flow (65,263 ) (41,392 ) (23,871 ) Property & Equipment Purchases, net (2,571 ) (1,647 ) (924 ) Capitalized Software (internal and external costs) (3,372 ) (4,400 ) 1,028 Free Cash Flow ($71,206 ) ($47,439 ) ($23,767 ) Unaudited ($ in thousands) For the quarters ended March 31, Operating and Free Cash Flow
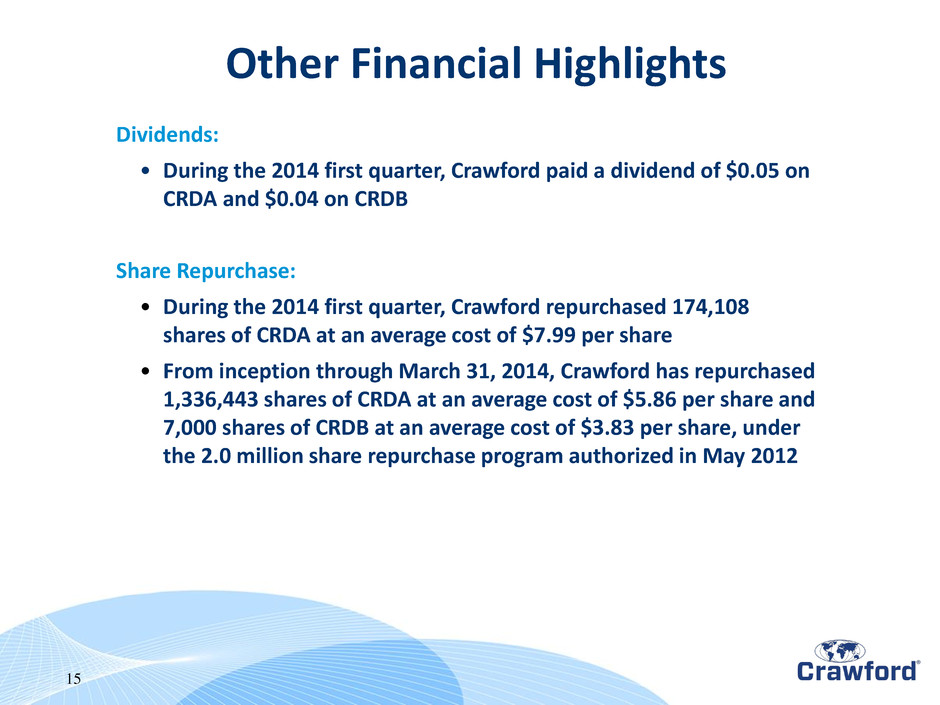
15 Dividends: • During the 2014 first quarter, Crawford paid a dividend of $0.05 on CRDA and $0.04 on CRDB Share Repurchase: • During the 2014 first quarter, Crawford repurchased 174,108 shares of CRDA at an average cost of $7.99 per share • From inception through March 31, 2014, Crawford has repurchased 1,336,443 shares of CRDA at an average cost of $5.86 per share and 7,000 shares of CRDB at an average cost of $3.83 per share, under the 2.0 million share repurchase program authorized in May 2012 Other Financial Highlights
First Quarter 2014 Review and Outlook
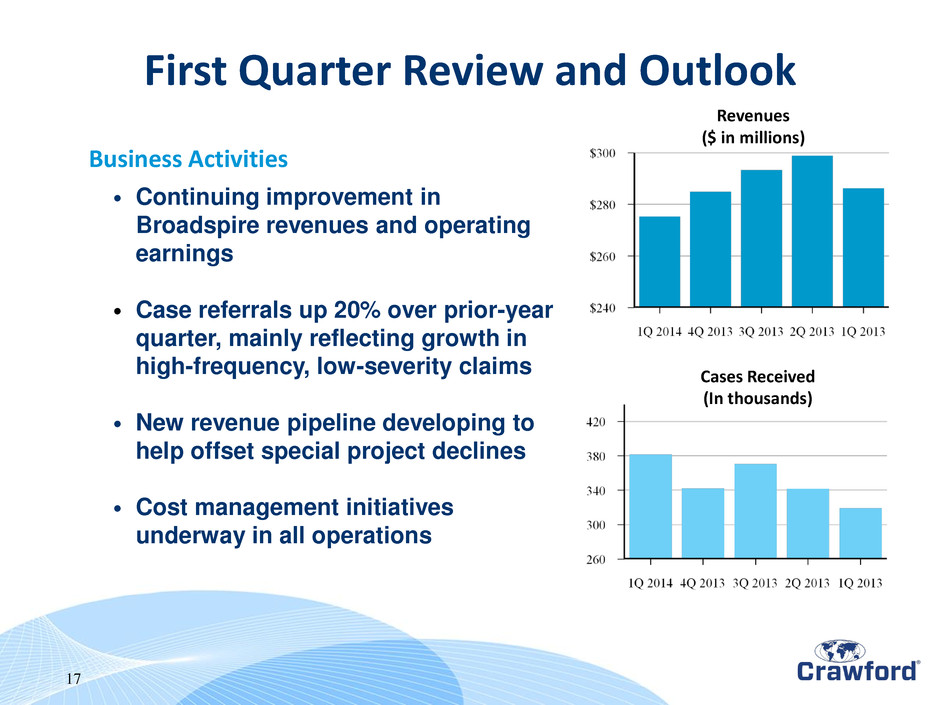
17 Revenues ($ in millions) Cases Received (In thousands) • Continuing improvement in Broadspire revenues and operating earnings • Case referrals up 20% over prior-year quarter, mainly reflecting growth in high-frequency, low-severity claims • New revenue pipeline developing to help offset special project declines • Cost management initiatives underway in all operations Business Activities First Quarter Review and Outlook
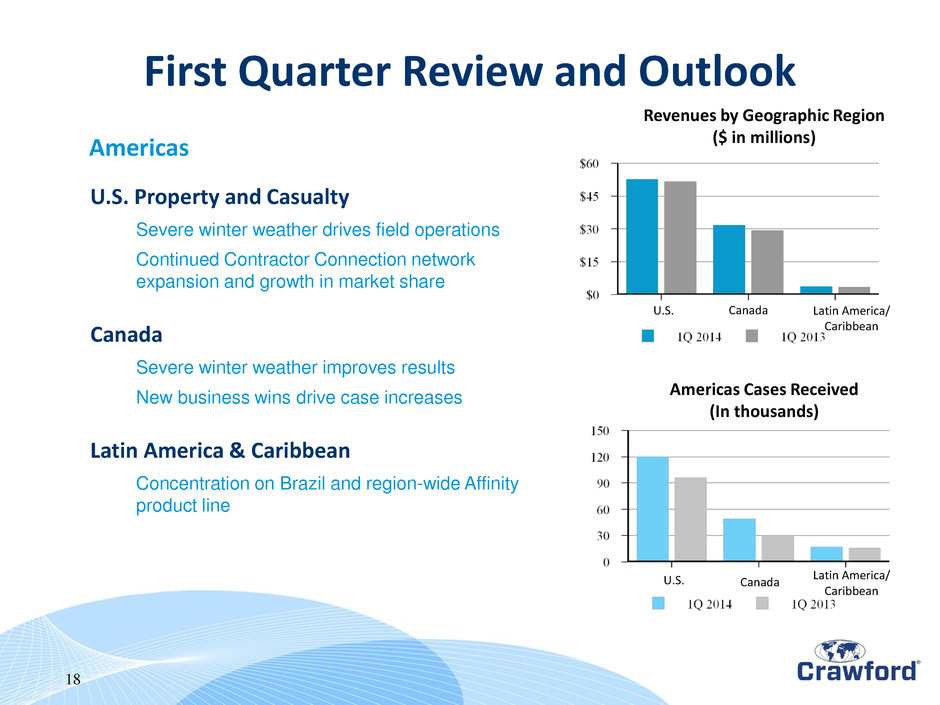
18 U.S. Canada Latin America/ Caribbean Revenues by Geographic Region ($ in millions) Americas Cases Received (In thousands) U.S. Canada Latin America/ Caribbean U.S. Property and Casualty Severe winter weather drives field operations Continued Contractor Connection network expansion and growth in market share Canada Severe winter weather improves results New business wins drive case increases Latin America & Caribbean Concentration on Brazil and region-wide Affinity product line Americas First Quarter Review and Outlook
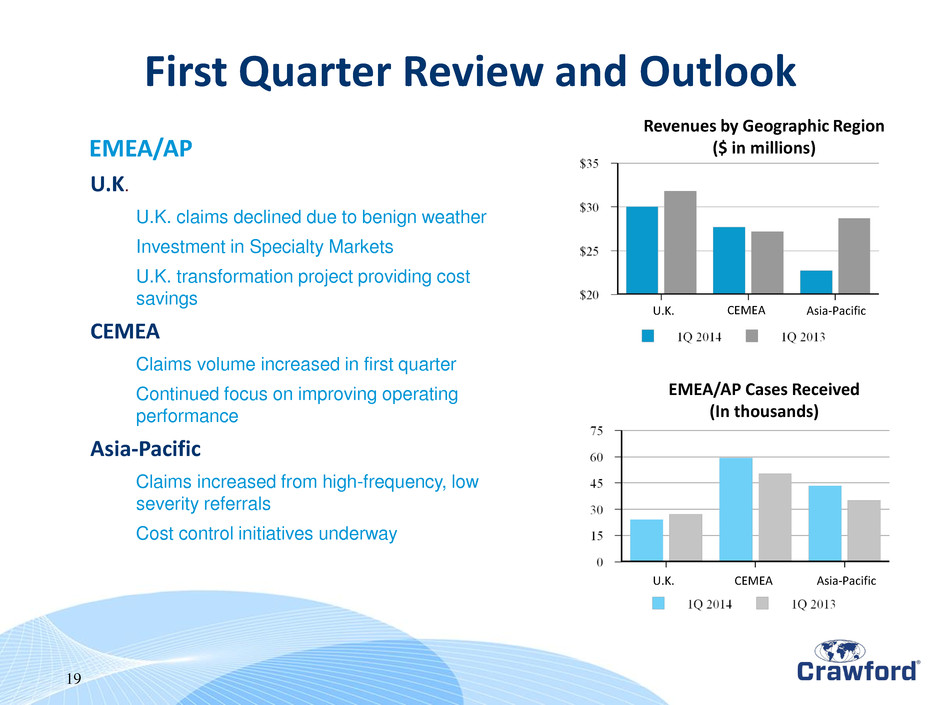
19 U.K. CEMEA U.K. Asia-Pacific Asia-Pacific CEMEA Revenues by Geographic Region ($ in millions) EMEA/AP Cases Received (In thousands) EMEA/AP U.K. U.K. claims declined due to benign weather Investment in Specialty Markets U.K. transformation project providing cost savings CEMEA Claims volume increased in first quarter Continued focus on improving operating performance Asia-Pacific Claims increased from high-frequency, low severity referrals Cost control initiatives underway First Quarter Review and Outlook
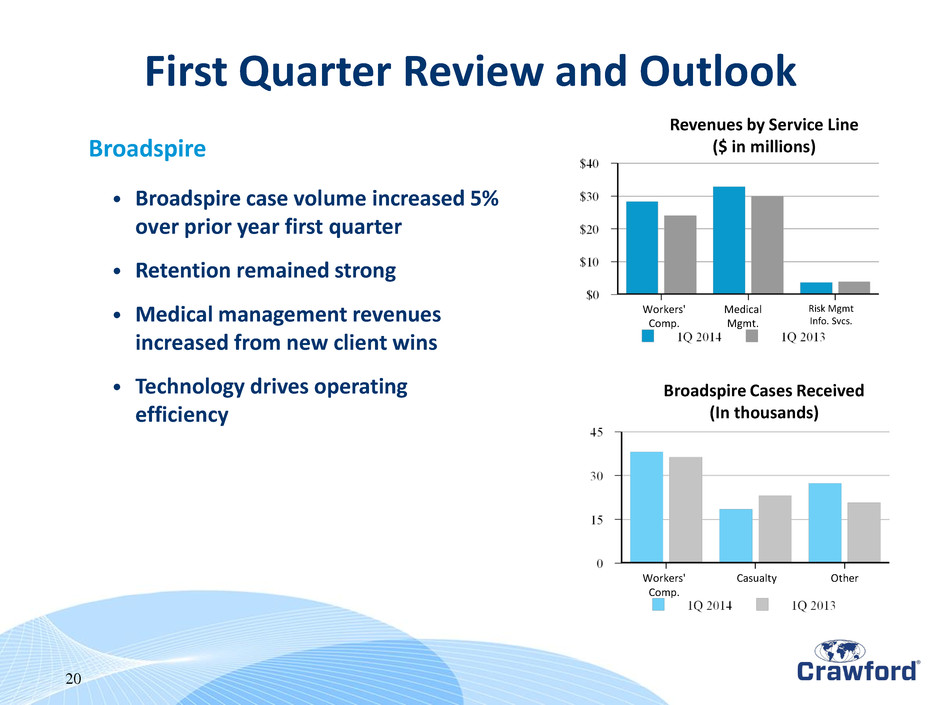
20 Revenues by Service Line ($ in millions) Broadspire Cases Received (In thousands) Risk Mgmt Info. Svcs. Other Medical Mgmt. Casualty Workers' Comp. Workers' Comp. Broadspire • Broadspire case volume increased 5% over prior year first quarter • Retention remained strong • Medical management revenues increased from new client wins • Technology drives operating efficiency First Quarter Review and Outlook
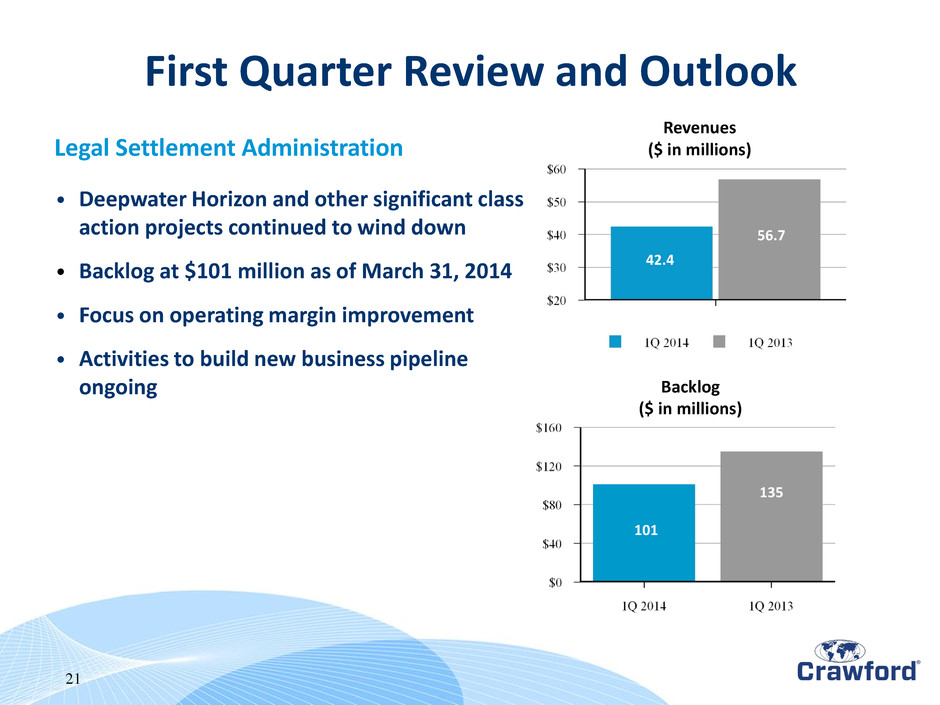
21 Backlog ($ in millions) Legal Settlement Administration • Deepwater Horizon and other significant class action projects continued to wind down • Backlog at $101 million as of March 31, 2014 • Focus on operating margin improvement • Activities to build new business pipeline ongoing First Quarter Review and Outlook Revenues ($ in millions) 56.7 42.4 101 135
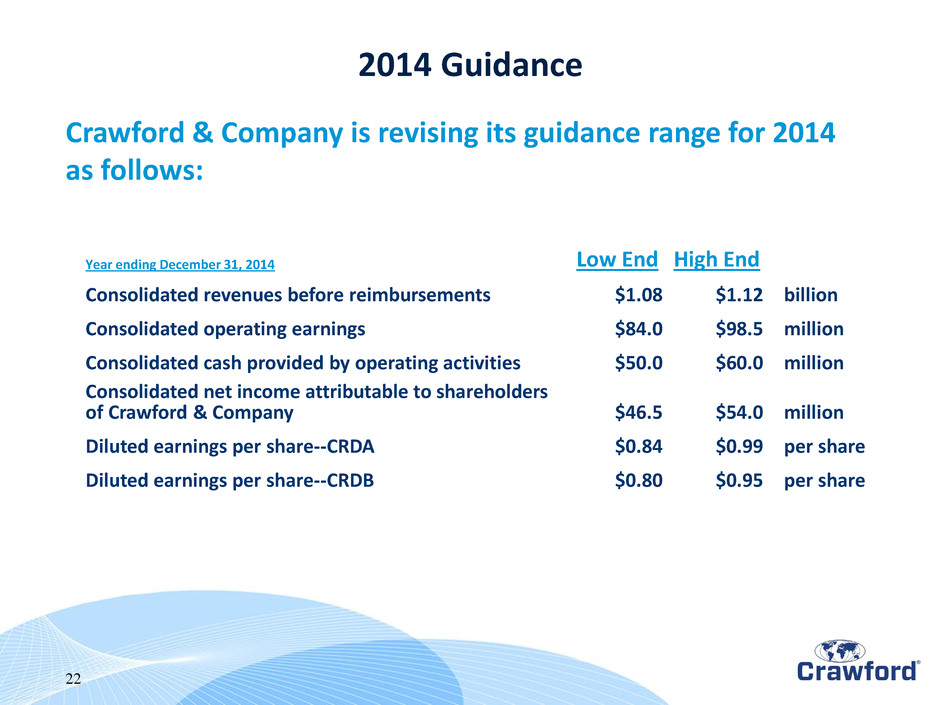
22 Crawford & Company is revising its guidance range for 2014 as follows: Year ending December 31, 2014 Low End High End Consolidated revenues before reimbursements $1.08 $1.12 billion Consolidated operating earnings $84.0 $98.5 million Consolidated cash provided by operating activities $50.0 $60.0 million Consolidated net income attributable to shareholders of Crawford & Company $46.5 $54.0 million Diluted earnings per share--CRDA $0.84 $0.99 per share Diluted earnings per share--CRDB $0.80 $0.95 per share 2014 Guidance
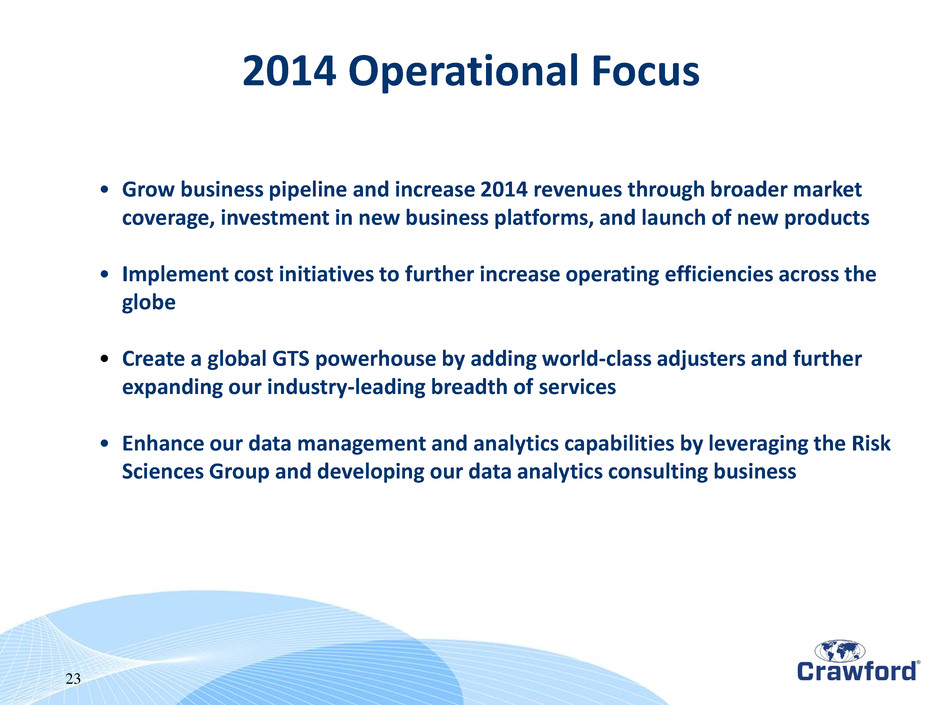
23 • Grow business pipeline and increase 2014 revenues through broader market coverage, investment in new business platforms, and launch of new products • Implement cost initiatives to further increase operating efficiencies across the globe • Create a global GTS powerhouse by adding world-class adjusters and further expanding our industry-leading breadth of services • Enhance our data management and analytics capabilities by leveraging the Risk Sciences Group and developing our data analytics consulting business 2014 Operational Focus
First Quarter 2014 Appendix
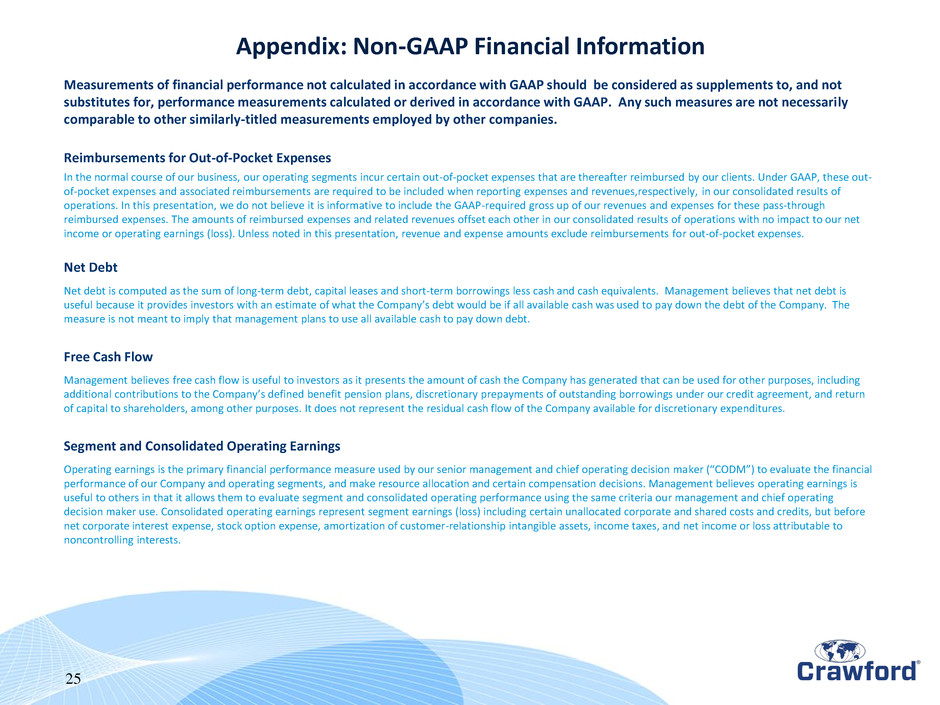
25 Measurements of financial performance not calculated in accordance with GAAP should be considered as supplements to, and not substitutes for, performance measurements calculated or derived in accordance with GAAP. Any such measures are not necessarily comparable to other similarly-titled measurements employed by other companies. Reimbursements for Out-of-Pocket Expenses In the normal course of our business, our operating segments incur certain out-of-pocket expenses that are thereafter reimbursed by our clients. Under GAAP, these out- of-pocket expenses and associated reimbursements are required to be included when reporting expenses and revenues,respectively, in our consolidated results of operations. In this presentation, we do not believe it is informative to include the GAAP-required gross up of our revenues and expenses for these pass-through reimbursed expenses. The amounts of reimbursed expenses and related revenues offset each other in our consolidated results of operations with no impact to our net income or operating earnings (loss). Unless noted in this presentation, revenue and expense amounts exclude reimbursements for out-of-pocket expenses. Net Debt Net debt is computed as the sum of long-term debt, capital leases and short-term borrowings less cash and cash equivalents. Management believes that net debt is useful because it provides investors with an estimate of what the Company’s debt would be if all available cash was used to pay down the debt of the Company. The measure is not meant to imply that management plans to use all available cash to pay down debt. Free Cash Flow Management believes free cash flow is useful to investors as it presents the amount of cash the Company has generated that can be used for other purposes, including additional contributions to the Company’s defined benefit pension plans, discretionary prepayments of outstanding borrowings under our credit agreement, and return of capital to shareholders, among other purposes. It does not represent the residual cash flow of the Company available for discretionary expenditures. Segment and Consolidated Operating Earnings Operating earnings is the primary financial performance measure used by our senior management and chief operating decision maker (“CODM”) to evaluate the financial performance of our Company and operating segments, and make resource allocation and certain compensation decisions. Management believes operating earnings is useful to others in that it allows them to evaluate segment and consolidated operating performance using the same criteria our management and chief operating decision maker use. Consolidated operating earnings represent segment earnings (loss) including certain unallocated corporate and shared costs and credits, but before net corporate interest expense, stock option expense, amortization of customer-relationship intangible assets, income taxes, and net income or loss attributable to noncontrolling interests. Appendix: Non-GAAP Financial Information
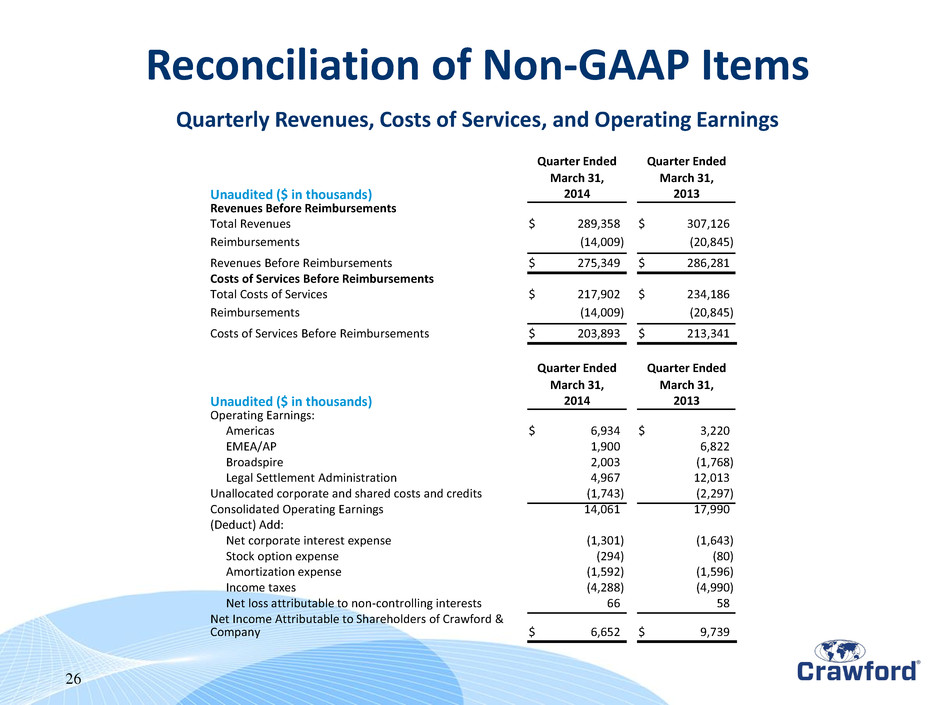
Quarter Ended Quarter Ended March 31, March 31, Unaudited ($ in thousands) 2014 2013 Revenues Before Reimbursements Total Revenues $ 289,358 $ 307,126 Reimbursements (14,009 ) (20,845 ) Revenues Before Reimbursements $ 275,349 $ 286,281 Costs of Services Before Reimbursements Total Costs of Services $ 217,902 $ 234,186 Reimbursements (14,009 ) (20,845 ) Costs of Services Before Reimbursements $ 203,893 $ 213,341 26 Quarterly Revenues, Costs of Services, and Operating Earnings Quarter Ended Quarter Ended March 31, March 31, Unaudited ($ in thousands) 2014 2013 Operating Earnings: Americas $ 6,934 $ 3,220 EMEA/AP 1,900 6,822 Broadspire 2,003 (1,768 ) Legal Settlement Administration 4,967 12,013 Unallocated corporate and shared costs and credits (1,743 ) (2,297 ) Consolidated Operating Earnings 14,061 17,990 (Deduct) Add: Net corporate interest expense (1,301 ) (1,643 ) Stock option expense (294 ) (80 ) Amortization expense (1,592 ) (1,596 ) Income taxes (4,288 ) (4,990 ) Net loss attributable to non-controlling interests 66 58 Net Income Attributable to Shareholders of Crawford & Company $ 6,652 $ 9,739 Reconciliation of Non-GAAP Items
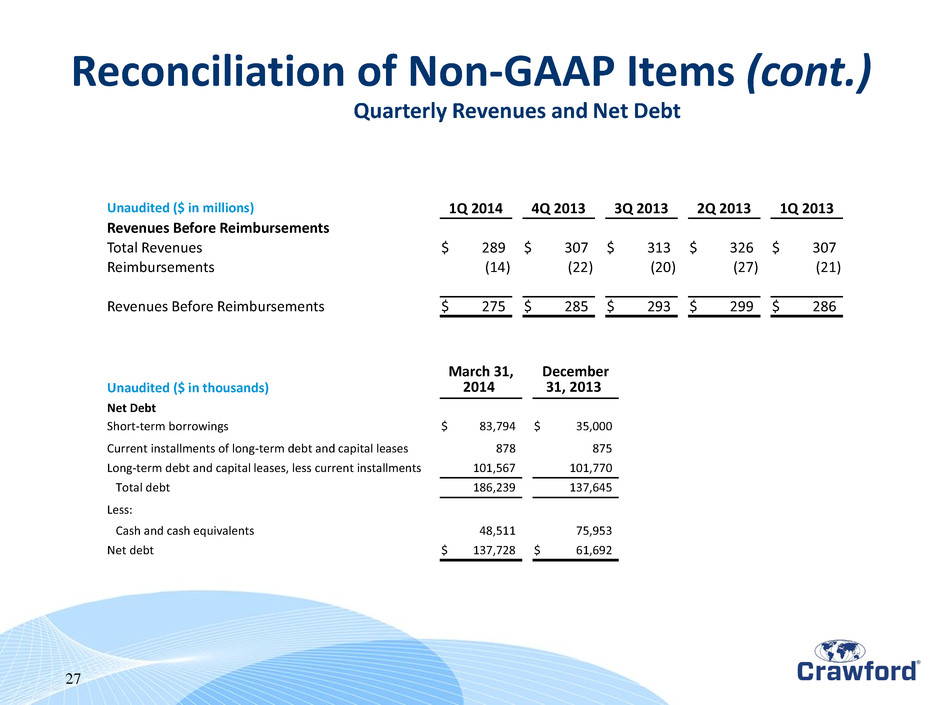
Reconciliation of Non-GAAP Items (cont.) 27 Quarterly Revenues and Net Debt Unaudited ($ in millions) 1Q 2014 4Q 2013 3Q 2013 2Q 2013 1Q 2013 Revenues Before Reimbursements Total Revenues $ 289 $ 307 $ 313 $ 326 $ 307 Reimbursements (14 ) (22 ) (20 ) (27 ) (21 ) Revenues Before Reimbursements $ 275 $ 285 $ 293 $ 299 $ 286 Unaudited ($ in thousands) March 31, 2014 December 31, 2013 Net Debt Short-term borrowings $ 83,794 $ 35,000 Current installments of long-term debt and capital leases 878 875 Long-term debt and capital leases, less current installments 101,567 101,770 Total debt 186,239 137,645 Less: Cash and cash equivalents 48,511 75,953 Net debt $ 137,728 $ 61,692


