Exhibit 99.1

23rd Annual Needham Virtual Growth Conference January 13, 2021 CRD - A & CRD - B (NYSE)
2 Forward - Looking Statements and Additional Information Forward - Looking Statements This presentation contains forward - looking statements, including statements about the expected future financial condition, resul ts of operations and earnings outlook of Crawford & Company. Statements, both qualitative and quantitative, that are not statements of historical fact may be "forward - looking statements" as defined in the Private Securitie s Litigation Reform Act of 1995 and other securities laws. Forward - looking statements involve a number of risks and uncertainties that could cause actual results to differ materially from historical experience or Crawford & Company's pre sen t expectations. Accordingly, no one should place undue reliance on forward - looking statements, which speak only as of the date on which they are made. Crawford & Company does not undertake to update forward - looking statements to reflec t the impact of circumstances or events that may arise or not arise after the date the forward - looking statements are made. Results for any interim period presented herein are not necessarily indicative of results to be expected fo r the full year or for any other future period. For further information regarding Crawford & Company, and the risks and uncertainties involved in forward - looking statements, please read Crawford & Company's reports filed with the Securiti es and Exchange Commission and available at www.sec.gov or in the Investor Relations section of Crawford & Company's website at www.crawco.com. Crawford's business is dependent, to a significant extent, on case volumes. The Company cannot predict the future trend of ca se volumes for a number of reasons, including the fact that the frequency and severity of weather - related claims and the occurrence of natural and man - made disasters, which are a significant source of cases and revenue for the Company , are generally not subject to accurate forecasting. Revenues Before Reimbursements ("Revenues") Revenues Before Reimbursements are referred to as "Revenues" in both consolidated and segment charts, bullets and tables thro ugh out this presentation. Segment and Consolidated Operating Earnings Under the Financial Accounting Standards Board's Accounting Standards Codification ("ASC") Topic 280, "Segment Reporting," th e C ompany has defined segment operating earnings as the primary measure used by the Company to evaluate the results of each of its three operating segments. Segment operating earnings represent segment earnings, includin g t he direct and indirect costs of certain administrative functions required to operate our business, but excludes unallocated corporate and shared costs and credits, net corporate interest expense, stock option expense, amortizati on of customer - relationship intangible assets, goodwill impairment, restructuring costs, gain on disposition of businesses, arbitration and claim settlements, income taxes and net income or loss attributable to noncontrolling interests a nd redeemable noncontrolling interests. Earnings Per Share The Company's two classes of stock are substantially identical, except with respect to voting rights and the Company's abilit y t o pay greater cash dividends on the non - voting Class A Common Stock than on the voting Class B Common Stock, subject to certain limitations. In addition, with respect to mergers or similar transactions, holders of Class A Commo n S tock must receive the same type and amount of consideration as holders of Class B Common Stock, unless different consideration is approved by the holders of 75% of the Class A Common Stock, voting as a class. In certain periods, the Company has paid a higher dividend on CRD - A than on CRD - B. This may result in a different earnings per s hare ("EPS") for each class of stock due to the two - class method of computing EPS as required by ASC Topic 260 - "Earnings Per Share". The two - class method is an earnings allocation method under which EPS is calculated for each class o f common stock considering both dividends declared and participation rights in undistributed earnings as if all such earnings had been distributed during the period. Segment Gross Profit Segment gross profit is defined as revenues, less direct costs, which exclude indirect centralized administrative support cos ts allocated to the business. Indirect expenses consist of centralized administrative support costs, regional and local shared services that are allocated to each segment based on usage. Non - GAAP Financial Information For additional information about certain non - GAAP financial information presented herein, see the Appendix following this presen tation.

3 Strategic Pillars Our Purpose Restoring and enhancing lives, businesses and communities. Our Values Our purpose is embedded in our values – to RESTORE is part of everything we do. espect mpowerment ustainability raining ne Crawford ecognition ntrepreneurial Spirit
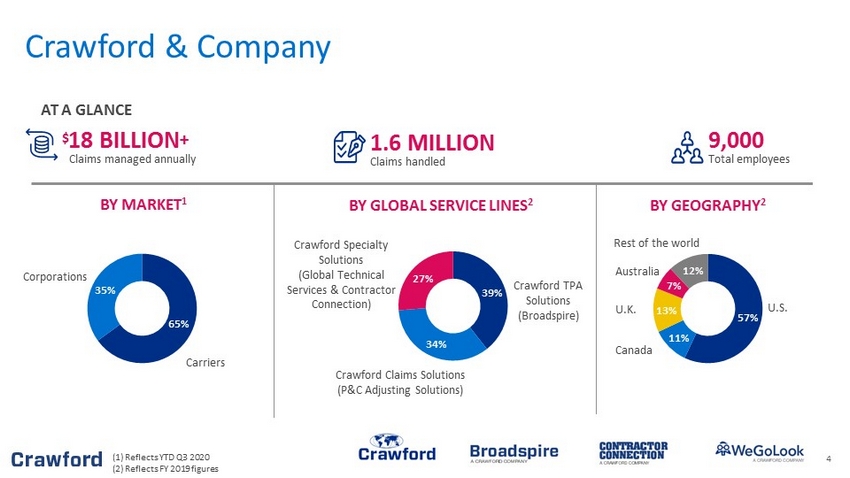
4 65% 35% Crawford & Company 57% 11% 13% 7% 12% Canada U.K. Australia Rest of the world BY GLOBAL SERVICE LINES 2 BY GEOGRAPHY 2 Crawford TPA Solutions (Broadspire) U.S. 39% 34% 27% Crawford Specialty Solutions (Global Technical Services & Contractor Connection) Crawford Claims Solutions (P&C Adjusting Solutions) AT A GLANCE $ 18 BILLION + Claims managed annually 1.6 MILLION Claims handled 9,000 Total employees BY MARKET 1 Corporations Carriers (1) Reflects YTD Q3 2020 (2) Reflects FY 2019 figures
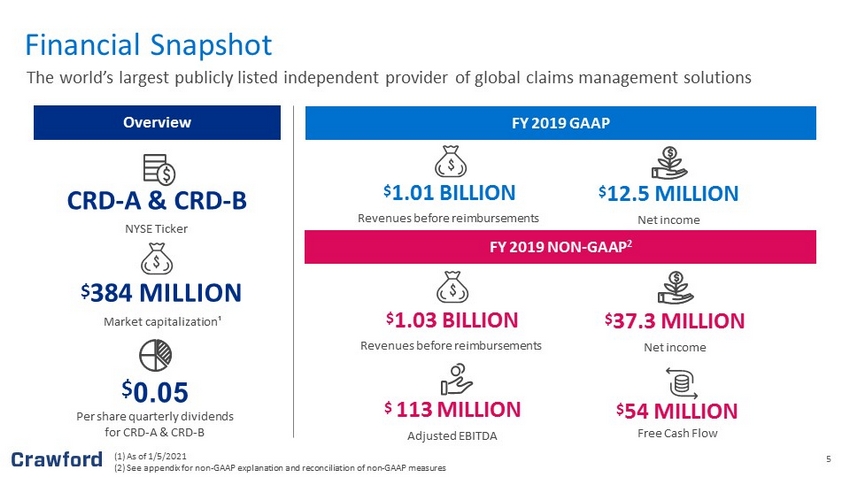
5 (1) As of 1/5/2021 ( 2 ) See appendix for non - GAAP explanation and reconciliation of non - GAAP measures Overview FY 2019 GAAP FY 2019 NON - GAAP 2 $ 384 MILLION Market capitalization¹ Financial Snapshot The world’s largest publicly listed independent provider of global claims management solutions $ 1.03 BILLION Revenues before reimbursements $ 54 MILLION Free Cash Flow $ 37.3 MILLION Net income $ 1.01 BILLION Revenues before reimbursements $ 12.5 MILLION Net income $ 113 MILLION Adjusted EBITDA $ 0.05 Per share quarterly dividends for CRD - A & CRD - B CRD - A & CRD - B NYSE Ticker
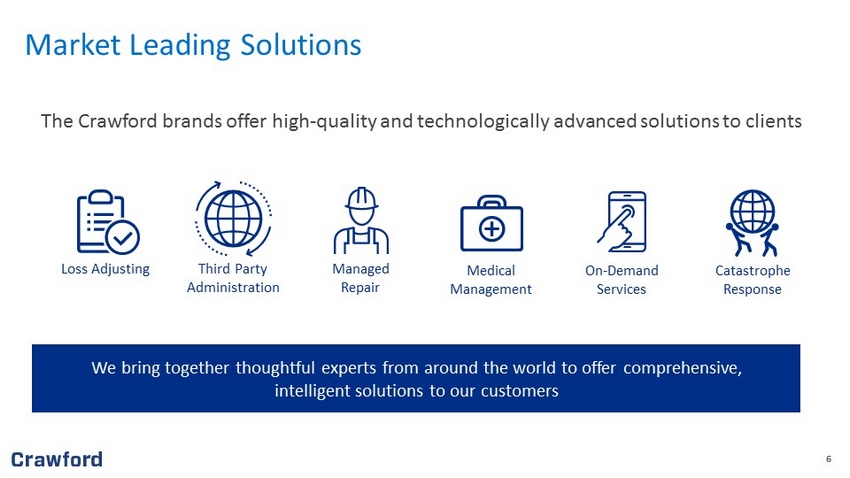
6 6 Loss Adjusting Third Party Administration Managed Repair Medical Management On - Demand Services Catastrophe Response We bring together thoughtful experts from around the world to offer comprehensive, intelligent solutions to our customers The Crawford brands offer high - quality and technologically advanced solutions to clients Market Leading Solutions
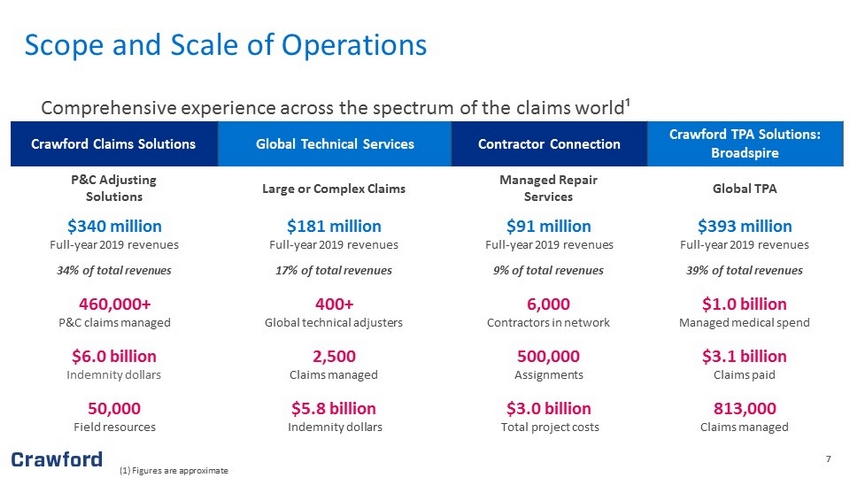
7 7 Comprehensive experience across the spectrum of the claims world¹ Crawford Claims Solutions Global Technical Services Contractor Connection Crawford TPA Solutions: Broadspire P&C Adjusting Solutions Large or Complex Claims Managed Repair Services Global TPA $340 million Full - year 2019 revenues $181 million Full - year 2019 revenues $91 million Full - year 2019 revenues $393 million Full - year 2019 revenues 34% of total revenues 17% of total revenues 9% of total revenues 39% of total revenues 460,000+ P&C claims managed 400+ Global technical adjusters 6,000 Contractors in network $1.0 billion Managed medical spend $6.0 billion Indemnity dollars 2,500 Claims managed 500,000 Assignments $3.1 billion Claims paid 50,000 Field resources $5.8 billion Indemnity dollars $3.0 billion Total project costs 813,000 Claims managed (1) Figures are approximate Scope and Scale of Operations
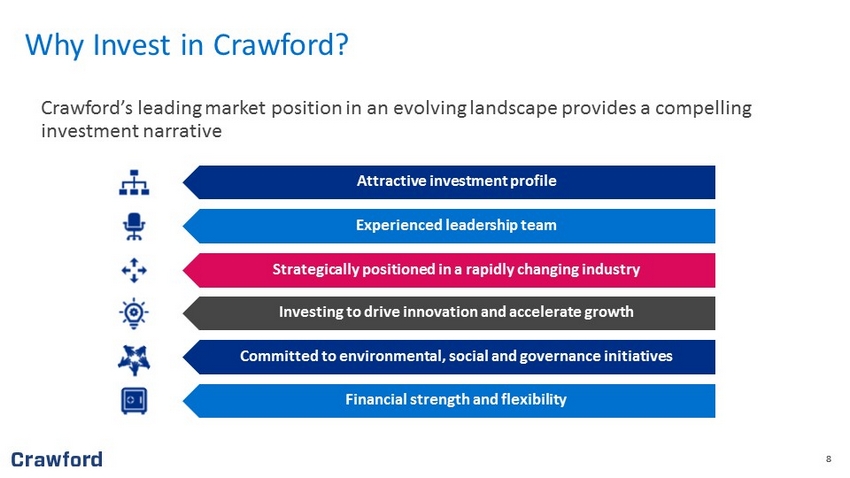
8 8 Crawford’s leading market position in an evolving landscape provides a compelling investment narrative Attractive investment profile Experienced leadership team Strategically positioned in a rapidly changing industry Investing to drive innovation and accelerate growth Committed to environmental, social and governance initiatives Financial strength and flexibility Why Invest in Crawford?
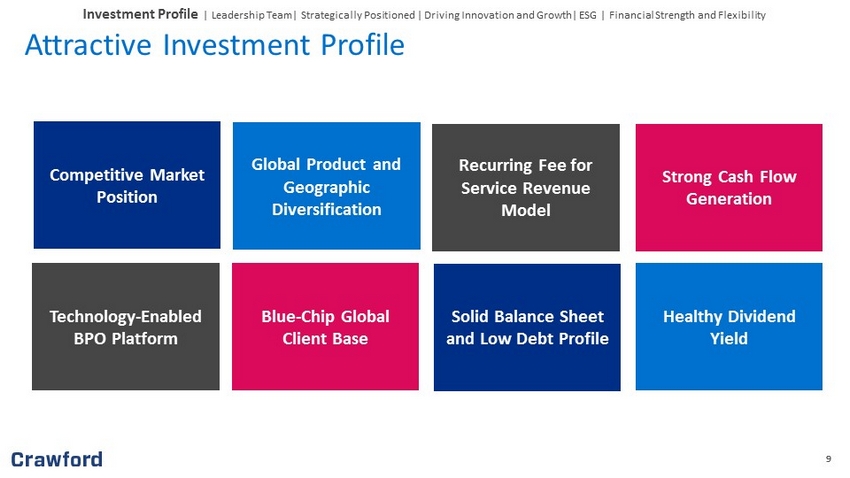
9 9 Attractive Investment Profile Investment Profile | Leadership Team| Strategically Positioned | Driving Innovation and Growth| ESG | Financial Strength and Flexibility Technology - Enabled BPO Platform Strong Cash Flow Generation Recurring Fee for Service Revenue Model Blue - Chip Global Client Base Solid Balance Sheet and Low Debt Profile Healthy Dividend Yield Global Product and Geographic Diversification Competitive Market Position
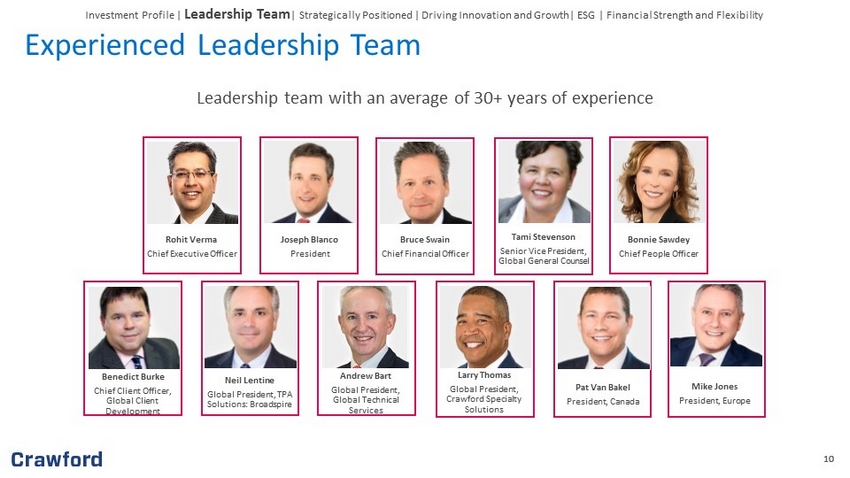
10 10 Rohit Verma Chief Executive Officer Joseph Blanco President Bruce Swain Chief Financial Officer Tami Stevenson Senior Vice President, Global General Counsel Bonnie Sawdey Chief People Officer Mike Jones President, Europe Neil Lentine Global President, TPA Solutions: Broadspire Pat Van Bakel President, Canada Larry Thomas Global President, Crawford Specialty Solutions Andrew Bart Global President, Global Technical Services Benedict Burke Chief Client Officer, Global Client Development Leadership team with an average of 30+ years of experience Experienced Leadership Team Investment Profile | Leadership Team | Strategically Positioned | Driving Innovation and Growth| ESG | Financial Strength and Flexibility

11 11 2021 Change in Business Segments Investment Profile | Leadership Team| Strategically Positioned | Driving Innovation and Growth| ESG | Financial Strength and Flexibility Loss Adjusting • CCS and GTS services combined into a single Loss Adjusting (“LA”) segment • Team approach to LA gives an unprecedented span of expertise and resources across all levels TPA • TPA segment largely unchanged; continuation of strong execution on current growth strategies • Specialized approach to markets that transcends borders and develops integrated claim solutions Platforms • Platforms segment encompasses Contractor Connection and our new Networks businesses • Networks will include WeGoLook , Simply Crawford, Crawford Workforce Advantage and U.S. Catastrophe Services • Network aggregation capability allows customer to outsource work that is extremely transactional but requires precise execution, capitalizing on Crawford’s disruptive technology offering New Structure Goals • Provide the best claim solutions to our customers through superior customer service, unique combined solutions, and efficiencies no other company can offer • Demonstrate agility when responding to specific client needs, market trends and regulatory challenges • Promote One Crawford solution while being mindful of each market’s unique geographic complexities
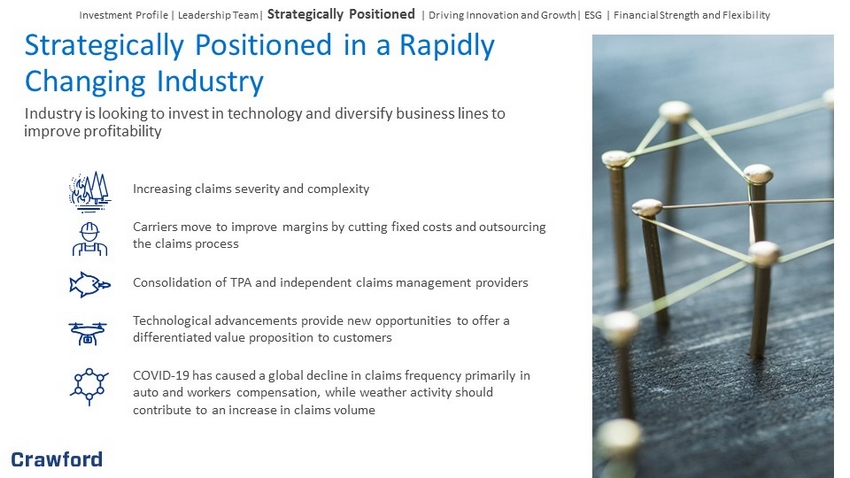
12 12 Industry is looking to invest in technology and diversify business lines to improve profitability Increasing claims severity and complexity Carriers move to improve margins by cutting fixed costs and outsourcing the claims process Consolidation of TPA and independent claims management providers Technological advancements provide new opportunities to offer a differentiated value proposition to customers COVID - 19 has caused a global decline in claims frequency primarily in auto and workers compensation, while weather activity should contribute to an increase in claims volume Strategically Positioned in a Rapidly Changing Industry Investment Profile | Leadership Team| Strategically Positioned | Driving Innovation and Growth| ESG | Financial Strength and Flexibility

13 13 More Frequent and Destructive CAT Events Leading to Heightened Insured Losses Catastrophe - related insured losses (1970 - 2020) 1 (1) SwissRe Investment Profile | Leadership Team| Strategically Positioned | Driving Innovation and Growth| ESG | Financial Strength and Flexibility
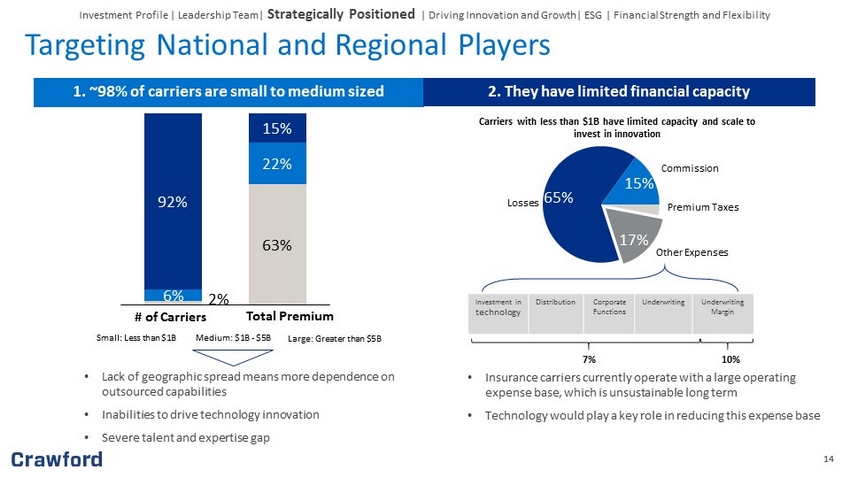
14 14 2 % 63 % 6% 22% 92% 15% # of Carriers Total Premium Medium: $1B - $5B Small: Less than $1B Large: Greater than $5B 1. ~98% of carriers are small to medium sized 2. They have limited financial capacity • Insurance carriers currently operate with a large operating expense base, which is unsustainable long term • Technology would play a key role in reducing this expense base 65% 15% 17% Losses Commission Premium Taxes Other Expenses Investment in technology Distribution Corporate Functions Underwriting Underwriting Margin Carriers with less than $1B have limited capacity and scale to invest in innovation 10% 7% • Lack of geographic spread means more dependence on outsourced capabilities • Inabilities to drive technology innovation • Severe talent and expertise gap Targeting National and Regional Players Investment Profile | Leadership Team| Strategically Positioned | Driving Innovation and Growth| ESG | Financial Strength and Flexibility

15 15 Investing to Drive Innovation and Accelerate Growth Investment Profile | Leadership Team| Strategically Positioned | Driving Innovation and Growth | ESG | Financial Strength and Flexibility At the forefront of technological disruption while maintaining industry leadership position (1) YouGoLook ¹
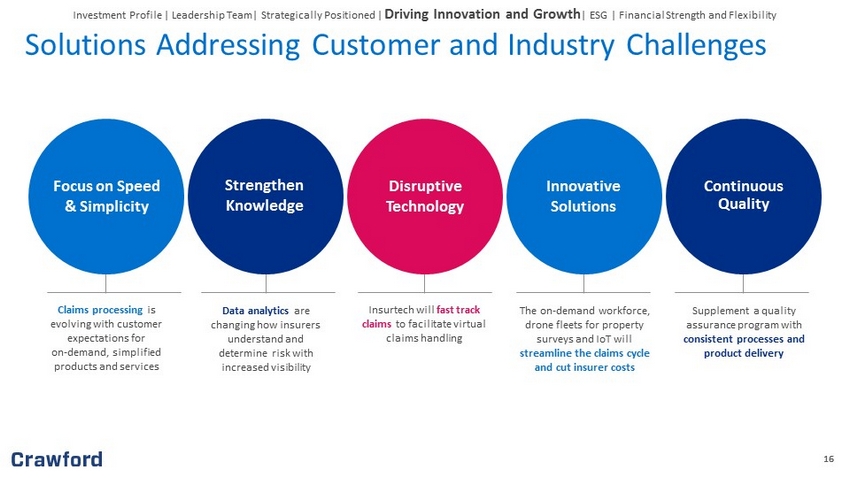
16 16 Solutions Addressing Customer and Industry Challenges Focus on Speed & Simplicity Strengthen Knowledge Disruptive Technology Innovative Solutions Continuous Quality Claims processing is evolving with customer expectations for on - demand, simplified products and services Data analytics are changing how insurers understand and determine risk with increased visibility Insurtech will fast track claims to facilitate virtual claims handling The on - demand workforce, drone fleets for property surveys and IoT will streamline the claims cycle and cut insurer costs Supplement a quality assurance program with consistent processes and product delivery Investment Profile | Leadership Team| Strategically Positioned | Driving Innovation and Growth | ESG | Financial Strength and Flexibility
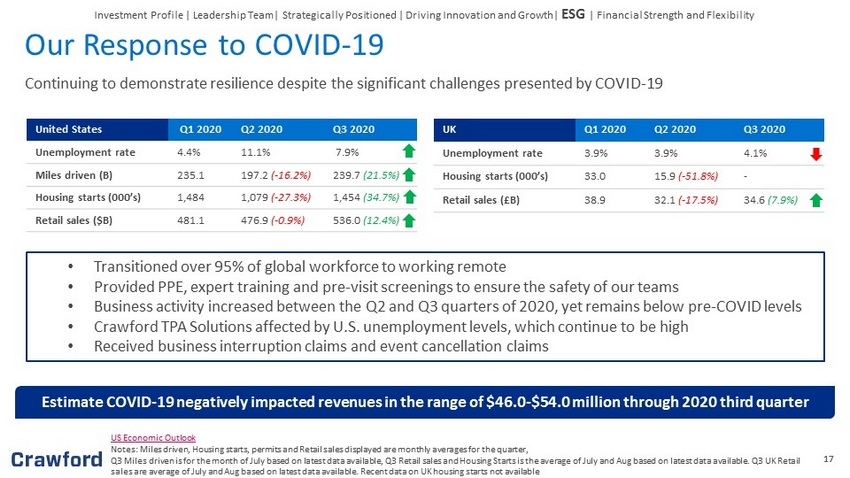
17 17 United States Q1 2020 Q2 2020 Q3 2020 Unemployment rate 4.4% 11.1% 7.9% Miles driven (B) 235.1 197.2 ( - 16.2%) 239.7 (21.5%) Housing starts (000’s) 1,484 1,079 ( - 27.3%) 1,454 (34.7%) Retail sales ($B) 481.1 476.9 ( - 0.9%) 536.0 (12.4%) UK Q1 2020 Q2 2020 Q3 2020 Unemployment rate 3.9% 3.9% 4.1% Housing starts (000’s) 33.0 15.9 ( - 51.8%) - Retail sales (£B) 38.9 32.1 ( - 17.5%) 34.6 (7.9%) US Economic Outlook Notes: Miles driven, Housing starts, permits and Retail sales displayed are monthly averages for the quarter, Q3 Miles driven is for the month of July based on latest data available, Q3 Retail sales and Housing Starts is the average of Ju ly and Aug based on latest data available. Q3 UK Retail sales are average of July and Aug based on latest data available. Recent data on UK housing starts not available • Transitioned over 95% of global workforce to working remote • Provided PPE, expert training and pre - visit screenings to ensure the safety of our teams • Business activity increased between the Q2 and Q3 quarters of 2020, yet remains below pre - COVID levels • Crawford TPA Solutions affected by U.S. unemployment levels, which continue to be high • Received business interruption claims and event cancellation claims Estimate COVID - 19 negatively impacted revenues in the range of $46.0 - $54.0 million through 2020 third quarter Our Response to COVID - 19 Continuing to demonstrate resilience despite the significant challenges presented by COVID - 19 Investment Profile | Leadership Team| Strategically Positioned | Driving Innovation and Growth| ESG | Financial Strength and Flexibility
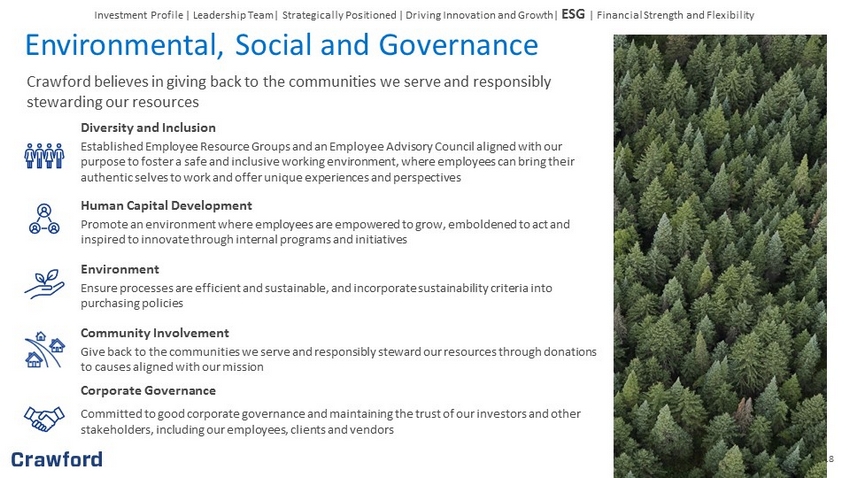
18 Diversity and Inclusion Established Employee Resource Groups and an Employee Advisory Council aligned with our purpose to foster a safe and inclusive working environment, where employees can bring their authentic selves to work and offer unique experiences and perspectives Human Capital Development Promote an environment where employees are empowered to grow, emboldened to act and inspired to innovate through internal programs and initiatives Environment Ensure processes are efficient and sustainable, and incorporate sustainability criteria into purchasing policies Community Involvement Give back to the communities we serve and responsibly steward our resources through donations to causes aligned with our mission Corporate Governance Committed to good corporate governance and maintaining the trust of our investors and other stakeholders, including our employees, clients and vendors Crawford believes in giving back to the communities we serve and responsibly stewarding our resources Environmental, Social and Governance Investment Profile | Leadership Team| Strategically Positioned | Driving Innovation and Growth| ESG | Financial Strength and Flexibility
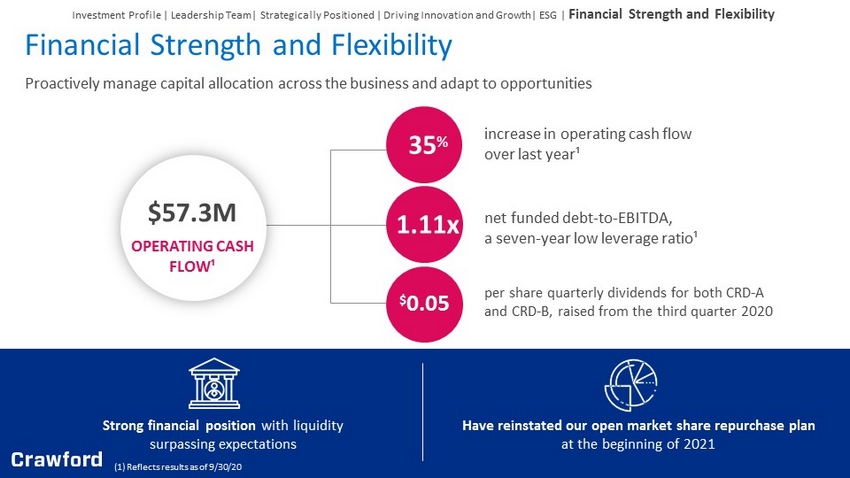
19 35 % 1.11x $ 0.05 Proactively manage capital allocation across the business and adapt to opportunities increase in operating cash flow over last year¹ net funded debt - to - EBITDA, a seven - year low leverage ratio¹ OPERATING CASH FLOW¹ $57.3M Strong financial position with liquidity surpassing expectations Have reinstated our open market share repurchase plan at the beginning of 2021 per share quarterly dividends for both CRD - A and CRD - B, raised from the third quarter 2020 Financial Strength and Flexibility Investment Profile | Leadership Team| Strategically Positioned | Driving Innovation and Growth| ESG | Financial Strength and Flexibility (1) Reflects results as of 9/30/20
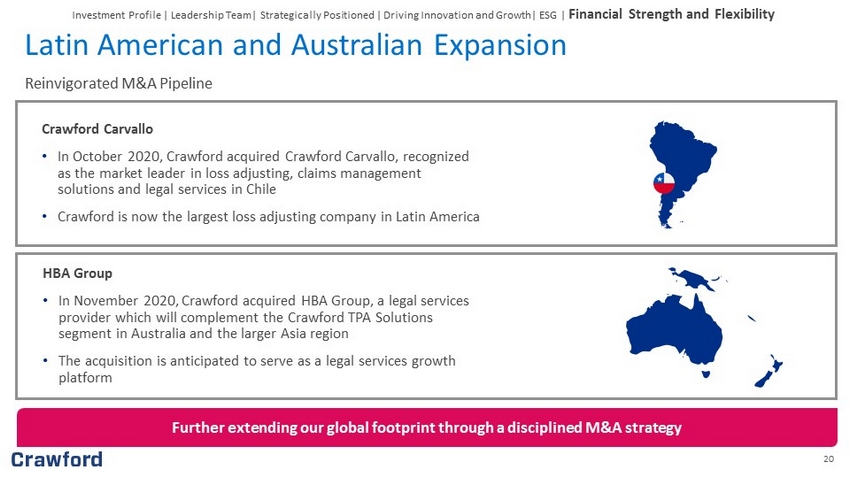
20 Investment Profile | Leadership Team| Strategically Positioned | Driving Innovation and Growth| ESG | Financial Strength and Flexibility Reinvigorated M&A Pipeline Latin American and Australian Expansion Crawford Carvallo • In October 2020, Crawford acquired Crawford Carvallo , recognized as the market leader in loss adjusting, claims management solutions and legal services in Chile • Crawford is now the largest loss adjusting company in Latin America Further extending our global footprint through a disciplined M&A strategy HBA Group • In November 2020, Crawford acquired HBA Group, a legal services provider which will complement the Crawford TPA Solutions segment in Australia and the larger Asia region • The acquisition is anticipated to serve as a legal services growth platform

21 Third Quarter YTD 2020 Financial Summary (1) See appendix for non - GAAP explanation and reconciliation of non - GAAP measures. Nine Months Ended September 30 , September 30 , ($ in millions, except per share amounts) 20 20 201 9 % Change Revenues $ 725.1 $ 758.6 ( 4%) Non - GAAP Revenues excluding foreign exchange fluctuations (1) $ 734.3 $ 758.6 (3%) Net Income Attributable to Shareholders of Crawford & Company $ 18.9 $ 19.8 (5%) Diluted Earnings per Share CRD - A $0. 36 $0. 39 (8%) CRD - B $0. 34 $0. 33 3% Non - GAAP Diluted Earnings per Share 1 CRD - A $0. 48 $0. 56 (14%) CRD - B $0. 46 $0. 50 (8%) Adjusted Operating Earnings 1 $ 53.9 $ 60.9 (11%) Adjusted Operating Margin 1 7.3 % 8.0 % (70b ps ) Adjusted EBITDA 1 $ 77.7 $ 84.5 (8%) Adjusted EBITDA Margin 1 10.6 % 11.1 % (50b ps )
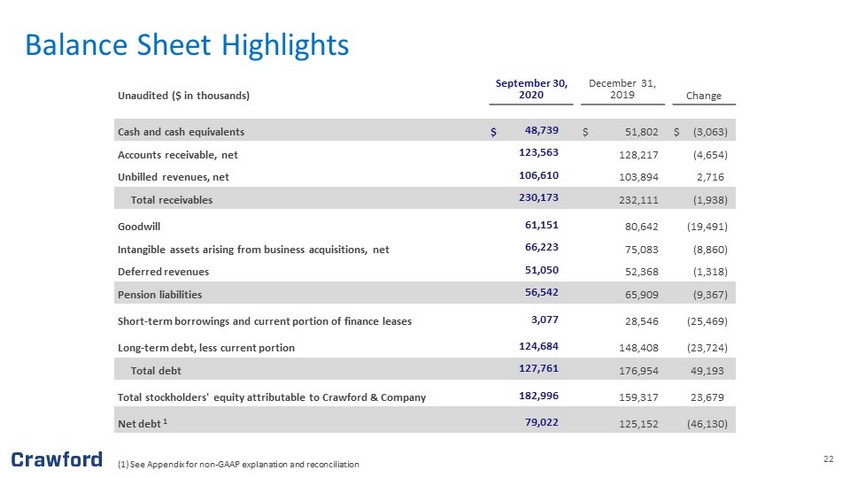
22 (1) See Appendix for non - GAAP explanation and reconciliation Unaudited ($ in thousands) September 30 , 20 20 December 31, 201 9 Change Cash and cash equivalents $ 48,739 $ 51,802 $ (3,063 ) Accounts receivable, net 123,563 128,217 ( 4,654 ) Unbilled revenues, net 106,610 103,894 2,716 Total receivables 230,173 232,111 ( 1,938 ) Goodwill 61,151 80,642 ( 19,491 ) Intangible assets arising from business acquisitions, net 66,223 75,083 ( 8,860 ) Deferred revenues 51,050 5 2,368 (1,318 ) Pension liabilities 56,542 65,909 ( 9,367 ) Short - term borrowings and current portion of finance leases 3,077 28,546 (25,469 ) Long - term debt, less current portion 124,684 148,408 (23,724 ) Total debt 127,761 1 76,954 49,193 Total stockholders' equity attributable to Crawford & Company 182,996 1 59,317 23,679 Net debt 1 79,022 1 25,152 (46,130 ) Balance Sheet Highlights
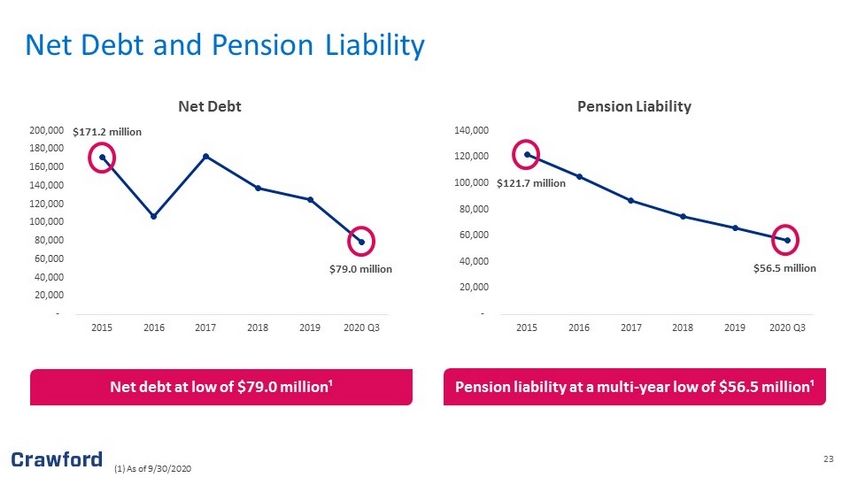
23 Net Debt and Pension Liability - 20,000 40,000 60,000 80,000 100,000 120,000 140,000 160,000 180,000 200,000 2015 2016 2017 2018 2019 2020 Q3 Net Debt - 20,000 40,000 60,000 80,000 100,000 120,000 140,000 2015 2016 2017 2018 2019 2020 Q3 Pension Liability $79.0 million $56.5 million Net debt at low of $79.0 million¹ Pension liability at a multi - year low of $56.5 million¹ $171.2 million $121.7 million (1) As of 9/30/2020
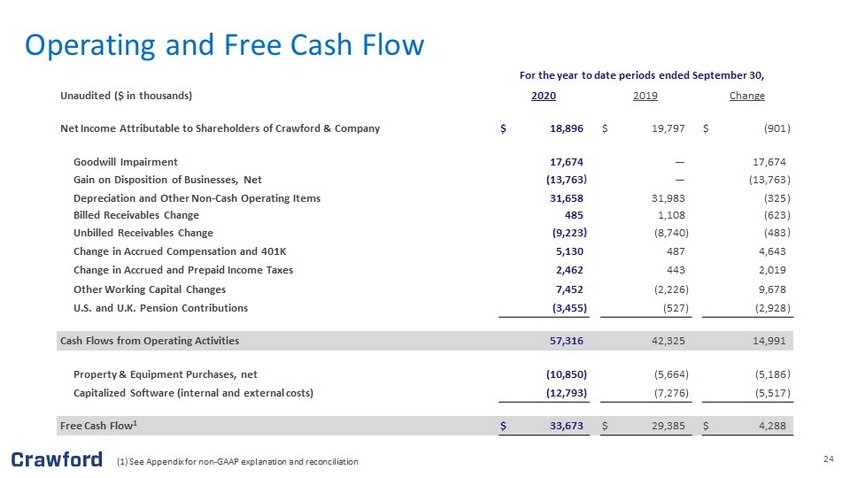
24 (1) See Appendix for non - GAAP explanation and reconciliation Operating and Free Cash Flow Unaudited ($ in thousands) 20 20 201 9 Change Net Income Attributable to Shareholders of Crawford & Company $ 18,896 $ 19,797 $ ( 901 ) Goodwill Impairment 17,674 — 17,674 Gain on Disposition of Businesses, Net (13,763 ) — (13,763 ) Depreciation and Other Non - Cash Operating Items 31,658 31,983 (325 ) Billed Receivables Change 485 1,108 (623 ) Unbilled Receivables Change (9,223 ) (8,740 ) (483 ) Change in Accrued Compensation and 401K 5,130 487 4,643 Change in Accrued and Prepaid Income Taxes 2,462 443 2,019 Other Working Capital Changes 7,452 ( 2,226 ) 9,678 U.S. and U.K. Pension Contributions ( 3,455 ) ( 527 ) (2,928 ) Cash Flows from Operating Activities 57,316 42,325 14,991 Property & Equipment Purchases, net ( 10,850 ) ( 5,664 ) (5,186 ) Capitalized Software (internal and external costs) ( 12,793 ) (7,276 ) (5,517 ) Free Cash Flow 1 $ 33,673 $ 29,385 $ 4,288 For the year to date periods ended September 3 0,
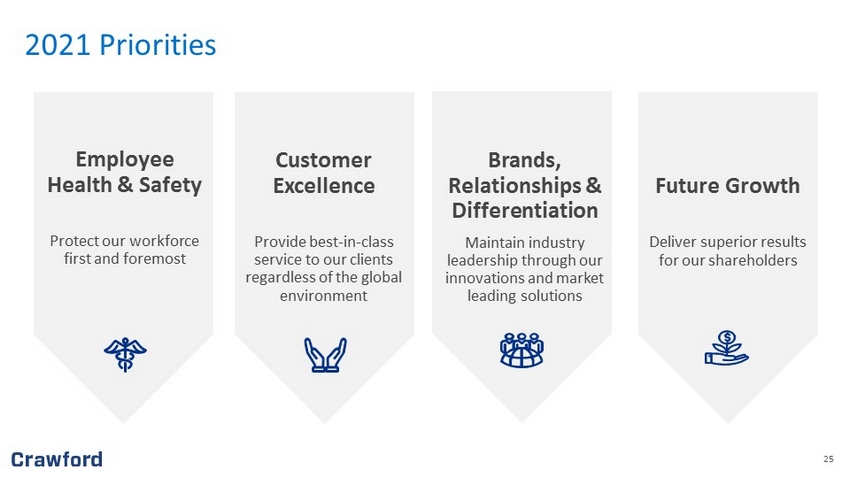
25 Employee Health & Safety Protect our workforce first and foremost Customer Excellence Provide best - in - class service to our clients regardless of the global environment Brands, Relationships & Differentiation Maintain industry leadership through our innovations and market leading solutions Future Growth Deliver superior results for our shareholders 2021 Priorities
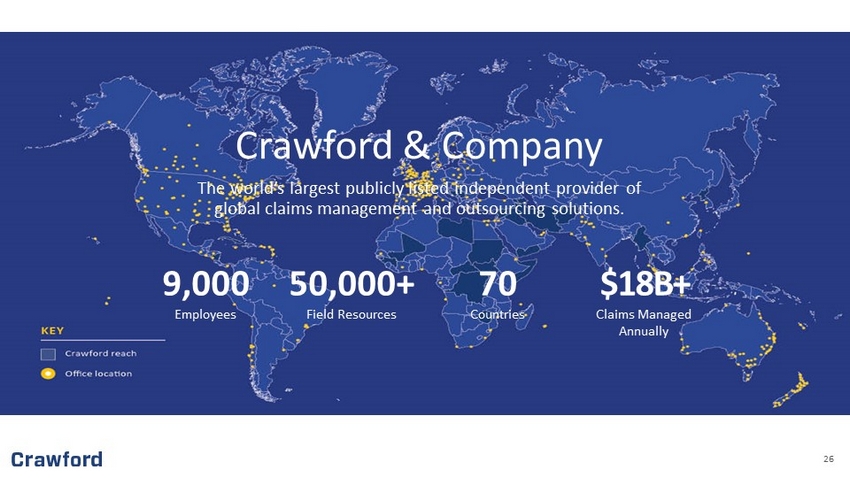
26 9,000 50,000+ 70 $18B+ Employees Field Resources Countries Claims Managed Annually Crawford & Company The world’s largest publicly listed independent provider of global claims management and outsourcing solutions.

27 Appendix A: Global Service Lines & Third Quarter 2020 Segment Results 27
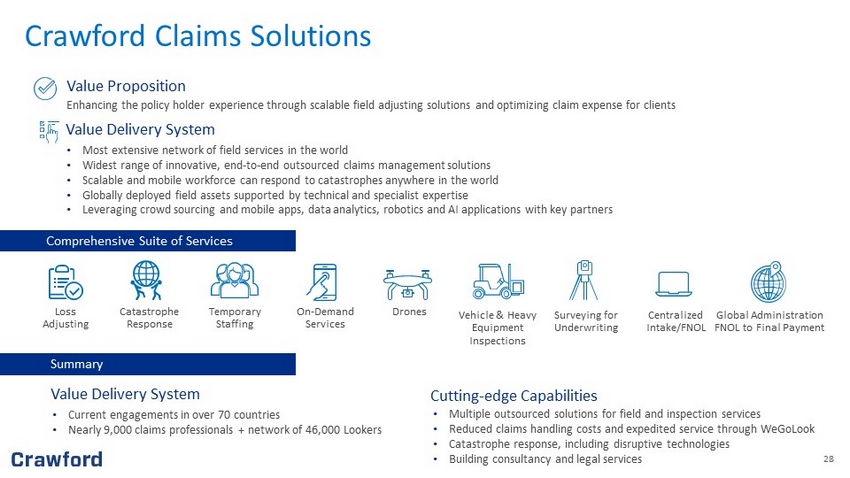
28 Value Proposition • Most extensive network of field services in the world • Widest range of innovative, end - to - end outsourced claims management solutions • Scalable and mobile workforce can respond to catastrophes anywhere in the world • Globally deployed field assets supported by technical and specialist expertise • Leveraging crowd sourcing and mobile apps, data analytics, robotics and AI applications with key partners Enhancing the policy holder experience through scalable field adjusting solutions and optimizing claim expense for clients Vehicle & Heavy Equipment Inspections Surveying for Underwriting Centralized Intake/FNOL Global Administration FNOL to Final Payment Summary Value Delivery System • Current engagements in over 70 countries • Nearly 9,000 claims professionals + network of 46,000 Lookers Cutting - edge Capabilities • Multiple outsourced solutions for field and inspection services • Reduced claims handling costs and expedited service through WeGoLook • Catastrophe response, including disruptive technologies • Building consultancy and legal services Temporary Staffing On - Demand Services Drones Catastrophe Response Comprehensive Suite of Services Loss Adjusting Value Delivery System Crawford Claims Solutions
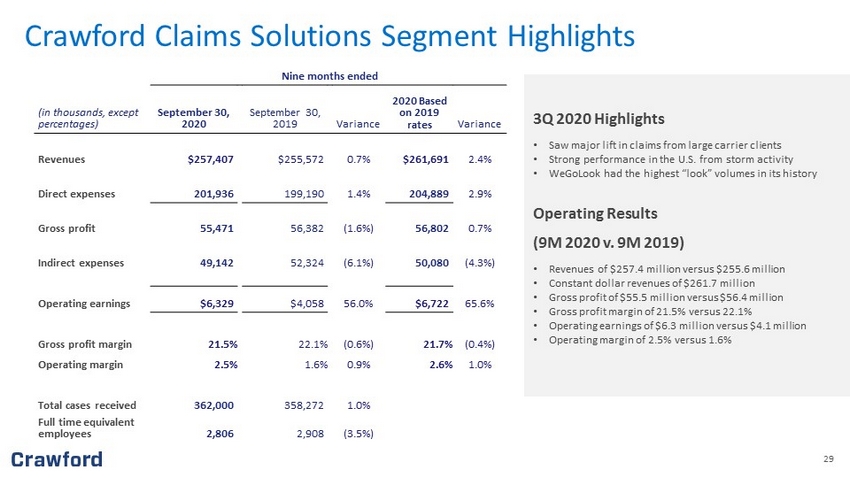
29 Crawford Claims Solutions Segment Highlights 3Q 2020 Highlights • Saw major lift in claims from large carrier clients • Strong performance in the U.S. from storm activity • WeGoLook had the highest “look” volumes in its history Operating Results (9M 2020 v. 9M 2019) • Revenues of $257.4 million versus $255.6 million • Constant dollar revenues of $261.7 million • Gross profit of $55.5 million versus $56.4 million • Gross profit margin of 21.5% versus 22.1% • Operating earnings of $6.3 million versus $4.1 million • Operating margin of 2.5% versus 1.6% Nine months ended (in thousands, except percentages) September 30, 2020 September 30 , 201 9 Variance 20 20 Based on 201 9 rates Variance Revenues $ 257,407 $ 255,572 0.7 % $ 261,691 2.4 % Direct expenses 201,936 199,190 1.4 % 204,889 2.9 % Gross profit 55,471 56,382 (1.6%) 56,802 0.7% Indirect expenses 49,142 52,324 (6.1 % ) 50,080 (4.3 % ) Operating earnings $ 6,329 $4,058 56.0% $ 6,722 65.6% Gross profit margin 21.5% 22.1% (0.6 % ) 21.7% (0.4%) Operating margin 2.5% 1.6% 0.9 % 2.6% 1.0 % Total cases received 362,000 358,272 1.0 % Full time equivalent employees 2 , 806 2 , 908 ( 3.5 %)
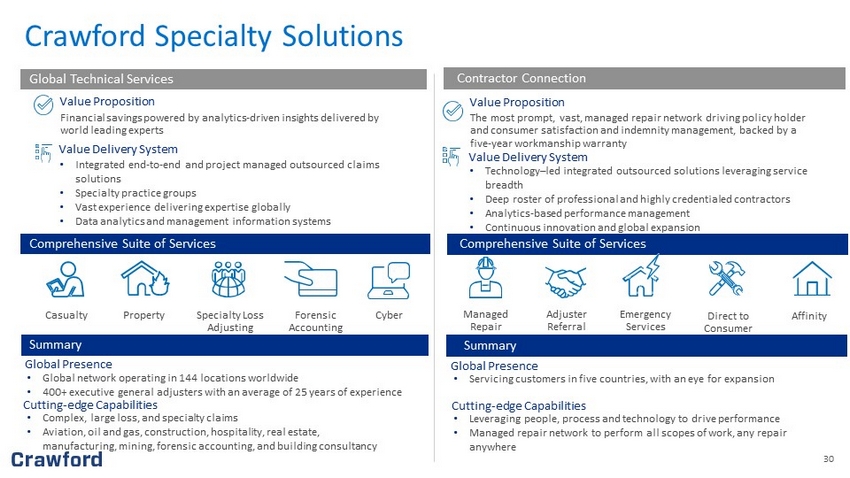
30 • Technology – led integrated outsourced solutions leveraging service breadth • Deep roster of professional and highly credentialed contractors • Analytics - based performance management • Continuous innovation and global expansion Value Proposition Financial savings powered by analytics - driven insights delivered by world leading experts Value Delivery System • Integrated end - to - end and project managed outsourced claims solutions • Specialty practice groups • Vast experience delivering expertise globally • Data analytics and management information systems Value Proposition The most prompt, vast, managed repair network driving policy holder and consumer satisfaction and indemnity management, backed by a five - year workmanship warranty Value Delivery System Global Technical Services Contractor Connection Casualty Property Specialty Loss Adjusting Forensic Accounting Cyber Managed Repair Adjuster Referral Emergency Services Direct to Consumer Affinity Comprehensive Suite of Services Comprehensive Suite of Services Summary Global Presence • Global network operating in 144 locations worldwide • 400+ executive general adjusters with an average of 25 years of experience Cutting - edge Capabilities • Complex, large loss, and specialty claims • Aviation, oil and gas, construction, hospitality, real estate, manufacturing, mining, forensic accounting, and building consultancy Summary Global Presence • Servicing customers in five countries, with an eye for expansion Cutting - edge Capabilities • Leveraging people, process and technology to drive performance • Managed repair network to perform all scopes of work, any repair anywhere Crawford Specialty Solutions
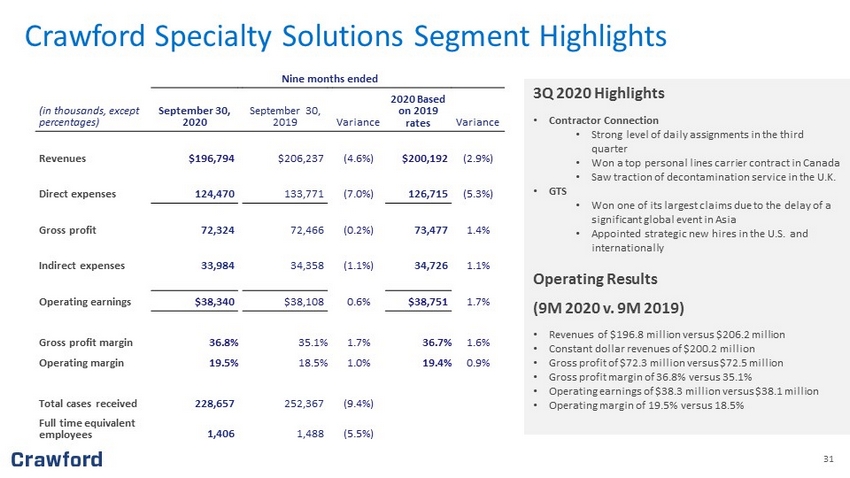
31 3Q 2020 Highlights • Contractor Connection • Strong level of daily assignments in the third quarter • Won a top personal lines carrier contract in Canada • Saw traction of decontamination service in the U.K. • GTS • Won one of its largest claims due to the delay of a significant global event in Asia • Appointed strategic new hires in the U.S. and internationally Operating Results (9M 2020 v. 9M 2019) • Revenues of $196.8 million versus $206.2 million • Constant dollar revenues of $200.2 million • Gross profit of $72.3 million versus $72.5 million • Gross profit margin of 36.8% versus 35.1% • Operating earnings of $38.3 million versus $38.1 million • Operating margin of 19.5% versus 18.5% Crawford Specialty Solutions Segment Highlights Nine months ended (in thousands, except percentages) September 30, 2020 September 3 0 , 201 9 Variance 20 20 Based on 201 9 rates Variance Revenues $ 196,794 $ 206 , 237 ( 4.6 %) $200,192 ( 2.9 %) Direct expenses 124 , 470 133,771 (7.0 % ) 126,715 (5.3 % ) Gross profit 72,324 72 , 466 (0.2 % ) 73,477 1.4% Indirect expenses 33,984 34,358 (1.1 % ) 34,726 1.1 % Operating earnings $ 38,340 $ 38,108 0.6 % $ 38,751 1.7 % Gross profit margin 36.8% 35.1% 1.7 % 36.7% 1.6 % Operating margin 19.5% 18.5% 1.0 % 19.4% 0.9 % Total cases received 228 , 657 252,367 (9.4 % ) Full time equivalent employees 1 , 406 1 , 488 ( 5.5 %)
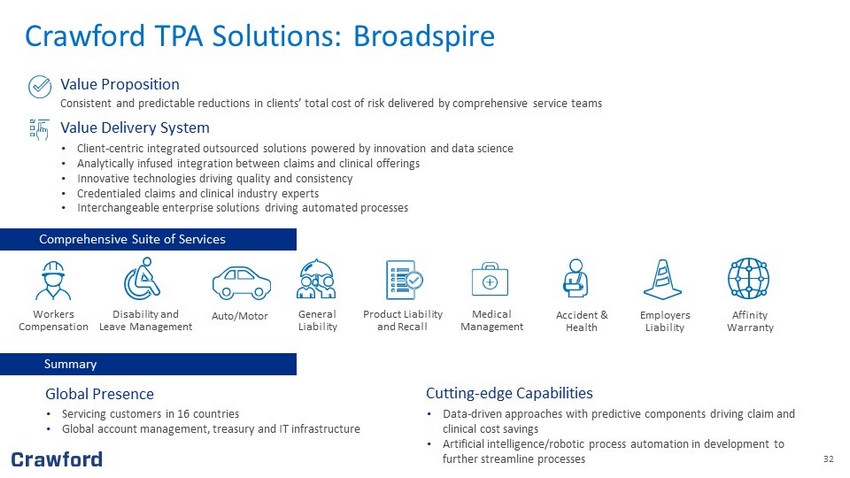
32 Affinity Warranty Summary Employers Liability Global Presence • Servicing customers in 16 countries • Global account management, treasury and IT infrastructure Cutting - edge Capabilities • Data - driven approaches with predictive components driving claim and clinical cost savings • Artificial intelligence/robotic process automation in development to further streamline processes Accident & Health Product Liability and Recall Medical Management Value Proposition Consistent and predictable reductions in clients’ total cost of risk delivered by comprehensive service teams Value Delivery System • Client - centric integrated outsourced solutions powered by innovation and data science • Analytically infused integration between claims and clinical offerings • Innovative technologies driving quality and consistency • Credentialed claims and clinical industry experts • Interchangeable enterprise solutions driving automated processes Comprehensive Suite of Services Workers Compensation Disability and Leave Management Auto/Motor General Liability Crawford TPA Solutions: Broadspire

33 Crawford TPA Solutions Segment Highlights 3Q 2020 Highlights • Renewed 96% of U.S. business year - to - date • Continued robust traction in the pipeline • Onboarded users to advanced technology solutions Operating Results (9M 2020 v. 9M 2019) • Revenues of $270.9 million versus $296.8 million • Constant dollar revenues of $272.4 million • Gross profit of $63.3 million versus $75.9 million • Gross profit margin of 23.4% versus 25.6% • Operating earnings of $13.9 million versus $21.1 million • Operating margin of 5.1% versus 7.1% Nine months ended (in thousands, except percentages) September 30, 2020 September 30 , 201 9 Variance 20 20 Based on 201 9 rates Variance Revenues $ 270,870 $ 296,807 ( 8.7 %) $ 272,409 ( 8.2 %) Direct expenses 207,594 220 , 956 (6.0 % ) 208,638 (5.6 % ) Gross profit 63,276 75,851 ( 16.6 %) 63,771 ( 15.9%) Indirect expenses 49,406 54 , 745 (9.8%) 49,785 (9.1 % ) Operating earnings $ 13,870 $ 21,106 ( 34.3 %) $ 13,986 ( 33.7 %) Gross profit margin 23.4% 25.6% ( 2.2 %) 23.4% ( 2.2 %) Operating margin 5.1% 7.1% (2.0 % ) 5.1% ( 2.0% ) Total cases received 581 , 254 611 , 735 (5.0 % ) Full time equivalent employees 3,085 3 , 176 (2.9 % )

34 Appendix B: Non - GAAP Financial Information 34
35 35 Measurements of financial performance not calculated in accordance with GAAP should be considered as supplements to, and not sub stitutes for, performance measurements calculated or derived in accordance with GAAP. Any such measures are not necessarily comparable to other similarly - titled measur ements employed by other companies. Reimbursements for Out - of - Pocket Expenses In the normal course of our business, our operating segments incur certain out - of - pocket expenses that are thereafter reimbursed by our clients. Under GAAP, these out - of - pocket expenses and associated reimbursements are required to be included when reporting expenses and revenues, respectively, in our co nsolidated results of operations. In this presentation, we do not believe it is informative to include in reported revenues the amounts of reimbursed expenses and related revenues, as they offset each other in our consolidated results of operations with no impact to our net income or operating earnings. As a result, unless noted in this presentation, revenue an d e xpense amounts exclude reimbursements for out - of - pocket expenses. Net Debt Net debt is computed as the sum of long - term debt, capital leases and short - term borrowings less cash and cash equivalents. Man agement believes that net debt is useful because it provides investors with an estimate of what the Company's debt would be if all available cash was used to pay down the debt o f t he Company. The measure is not meant to imply that management plans to use all available cash to pay down debt . Free Cash Flow Management believes free cash flow is useful to investors as it presents the amount of cash the Company has generated that ca n b e used for other purposes, including additional contributions to the Company's defined benefit pension plans, discretionary prepayments of outstanding borrowings under our c red it agreement, and return of capital to shareholders, among other purposes. It does not represent the residual cash flow of the Company available for discretionary expenditures. Segment and Consolidated Operating Earnings Operating earnings is the primary financial performance measure used by our senior management and chief operating decision ma ker to evaluate the financial performance of our Company and operating segments, and make resource allocation and certain compensation decisions. Management believes operatin g e arnings is useful to others in that it allows them to evaluate segment and consolidated operating performance using the same criteria our management and chief operating decision m ake r use. Consolidated operating earnings represent segment earnings including certain unallocated corporate and shared costs and credits, but before net corporate interest expe nse , stock option expense, amortization of customer - relationship intangible assets, goodwill impairment, restructuring costs, gain on disposition of businesses, arbitration and cla im settlements, income taxes and net income or loss attributable to noncontrolling interests. Appendix: Non - GAAP Financial Information
36 36 Segment and Consolidated Gross Profit Gross profit is defined as revenues less direct expenses which exclude indirect overhead expenses allocated to the business. Ind irect expenses consist of centralized administrative support costs, regional and local shared services that are allocated to each segment based on usage. Adjusted EBITDA Adjusted EBITDA is used by management to evaluate, assess and benchmark our operational results and the Company believes that ad justed EBITDA is relevant and useful information widely used by analysts, investors and other interested parties. Adjusted EBITDA is defined as net income attributable to sh are holders of the Company with recurring adjustments for depreciation and amortization, net corporate interest expense, income taxes and stock - based compensation expense and foreign exc hange fluctuations. Additionally, adjustments for non - recurring expenses for goodwill impairment, restructuring costs, gain on disposition of businesses, and arbitration and clai m settlements have been included in the calculation of adjusted EBITDA. Adjusted EBITDA is not a term defined by GAAP and as a result our measure of adjusted EBITDA might not be co mpa rable to similarly titled measures used by other companies. Adjusted Revenue, Operating Earnings, Pretax Earnings, Net Income, Diluted Earnings per Share and EBITDA Included in non - GAAP adjusted measurements as an add back or subtraction to GAAP measurements, are impacts of the goodwill impai rment, restructuring costs, loss on disposition of business, arbitration and claim settlements, and foreign exchange impacts, which arise from non - core items not directly related to our normal business or operations, or our future performance. Management believes it is useful to exclude these charges when comparing net income and diluted earnings per sha re across periods, as these charges are not from ordinary operations. Appendix: Non - GAAP Financial Information (cont.)
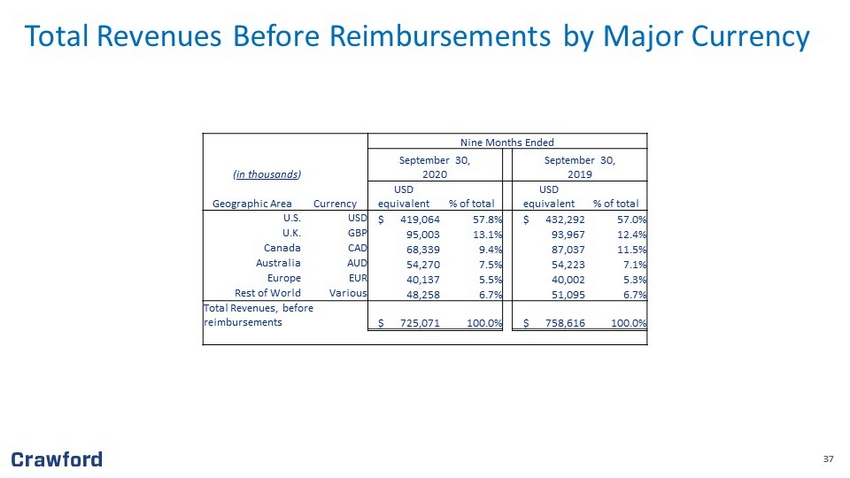
37 37 Total Revenues Before Reimbursements by Major Currency Nine Months Ended ( in thousands ) September 30, 2020 September 30, 2019 Geographic Area Currency USD equivalent % of total USD equivalent % of total U.S. USD $ 419,064 57.8% $ 432,292 57.0% U.K. GBP 95,003 13.1% 93,967 12.4% Canada CAD 68,339 9.4% 87,037 11.5% Australia AUD 54,270 7.5% 54,223 7.1% Europe EUR 40,137 5.5% 40,002 5.3% Rest of World Various 48,258 6.7% 51,095 6.7% Total Revenues, before reimbursements $ 725,071 100.0% $ 758,616 100.0%

38 38 Revenues, Costs of Services Provided, and Operating Earnings Reconciliation of Non - GAAP Items Nine Months Ended Nine Months Ended Unaudited ($ in thousands) September 3 0 , 2020 September 30 , 2019 Revenues Before Reimbursements Total Revenues $ 750,590 $ 790,065 Reimbursements ( 25,519 ) ( 31,449 ) Revenues Before Reimbursements 725 , 071 758 , 616 Costs of Services Provided, Before Reimbursements Total Costs of Services 543 , 782 565 , 113 Reimbursements (25,519 ) (31,449 ) Costs of Services Provided, Before Reimbursements $ 518 , 263 $ 533,664 Nine Months Ended Nine Months Ended Unaudited ($ in thousands) September 30 , 2020 September 3 0 , 2019 Operating Earnings: Crawford Claims Solutions $ 6,329 $ 4,058 Crawford Specialty Solutions 38,340 38,108 Crawford TPA Solutions 13,870 21,106 Unallocated corporate and shared costs and credits, net ( 5,227 ) (2,393 ) Consolidated Operating Earnings 53,312 60,879 (Deduct) Add: Net corporate interest expense ( 6 , 275 ) ( 8 , 346 ) Stock option expense ( 1,033 ) ( 1,348 ) Amortization expense ( 9 , 153 ) ( 8 , 429 ) Goodwill impairment ( 17 , 674 ) — Restructuring costs ( 5 , 714 ) — Arbitration and claim settlements — ( 12 , 552 ) Gain on disposition of businesses 13 , 763 — Income tax provision ( 9 , 554 ) ( 11 , 120 ) Net loss attributable to noncontrolling interests and redeemable noncontrolling interests 1,224 713 Net Income Attributable to Shareholders of Crawford & Company $ 18,896 $ 19,797
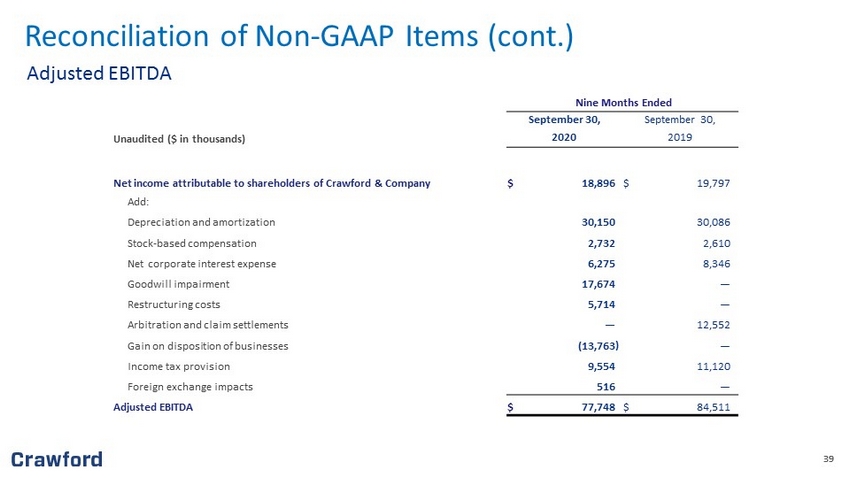
39 39 Adjusted EBITDA Reconciliation of Non - GAAP Items (cont.) Nine Months Ended September 30 , September 3 0 , Unaudited ($ in thousands) 20 20 201 9 Net income attributable to shareholders of Crawford & Company $ 18,896 $ 19,797 Add: Depreciation and amortization 30,150 30,086 Stock - based compensation 2,732 2,610 Net corporate interest expense 6 , 275 8 , 346 Goodwill impairment 17 , 674 — Restructuring costs 5 , 714 — Arbitration and claim settlements — 12,552 Gain on disposition of businesses (13,763 ) — Income tax provision 9,554 11,120 Foreign exchange impacts 516 — Adjusted EBITDA $ 77,748 $ 84,511
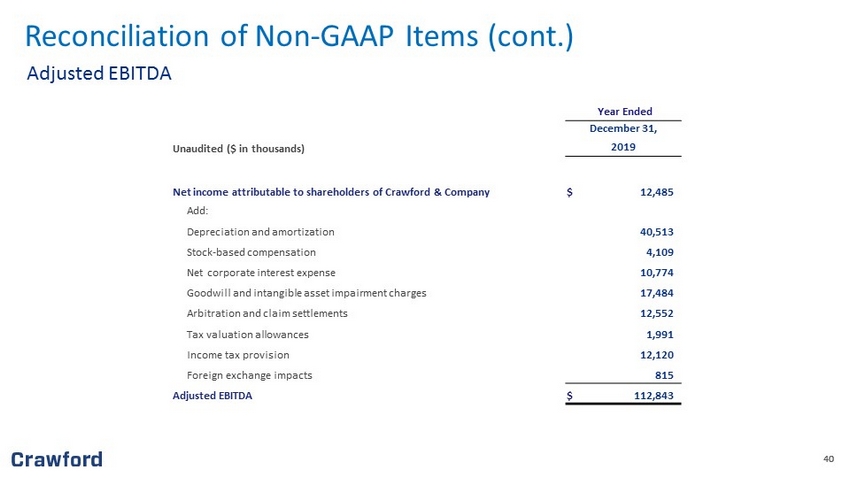
40 40 Adjusted EBITDA Year Ended December 31 , Unaudited ($ in thousands) 20 19 Net income attributable to shareholders of Crawford & Company $ 12,485 Add: Depreciation and amortization 40,513 Stock - based compensation 4,109 Net corporate interest expense 10 , 774 Goodwill and intangible asset impairment charges 17,484 Arbitration and claim settlements 12,552 Tax valuation allowances 1,991 Income tax provision 12,120 Foreign exchange impacts 815 Adjusted EBITDA $ 112,843 Reconciliation of Non - GAAP Items (cont.)
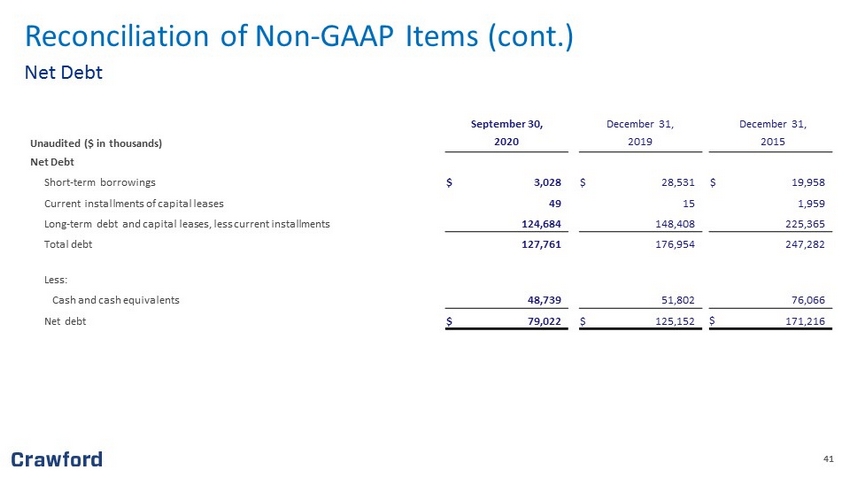
41 41 Net Debt Reconciliation of Non - GAAP Items (cont.) September 30 , December 31, December 31, Unaudited ($ in thousands) 20 20 201 9 2015 Net Debt Short - term borrowings $ 3,028 $ 2 8,531 $ 19,958 Current installments of capital leases 49 15 1,959 Long - term debt and capital leases, less current installments 124,684 1 48 , 408 225 , 365 Total debt 127,761 1 76 , 954 247 , 282 Less: Cash and cash equivalents 48,739 51,802 76,066 Net debt $ 79,022 $ 125,152 $ 171,216
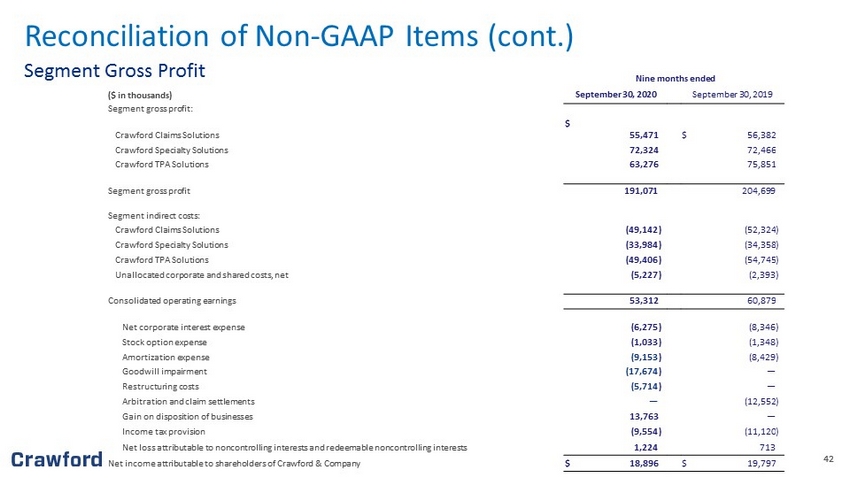
42 42 Segment Gross Profit Reconciliation of Non - GAAP Items (cont.) Nine months ended ( $ in thousands) September 30 , 20 20 September 30 , 201 9 Segment gross profit: Crawford Claims Solutions $ 55 , 471 $ 56,382 Crawford Specialty Solutions 72 , 324 72,466 Crawford TPA Solutions 63,276 75,851 Segment gross profit 191 , 071 204,699 Segment indirect costs: Crawford Claims Solutions ( 49,142 ) ( 52 , 324 ) Crawford Specialty Solutions ( 33,984 ) ( 34 , 358 ) Crawford TPA Solutions (49 , 406 ) ( 54 , 745 ) Unallocated corporate and shared costs, net (5,227 ) (2,393 ) Consolidated operating earnings 53,312 60,879 Net corporate interest expense ( 6 , 275 ) ( 8 , 346 ) Stock option expense ( 1,033 ) ( 1,348 ) Amortization expense ( 9 , 153 ) ( 8 , 429 ) Goodwill impairment ( 17 , 674 ) — Restructuring costs ( 5 , 714 ) — Arbitration and claim settlements — (12,552 ) Gain on disposition of businesses 13,763 — Income tax provision (9,554 ) ( 11,120 ) Net loss attributable to noncontrolling interests and redeemable noncontrolling interests 1,224 713 Net income attributable to shareholders of Crawford & Company $ 18,896 $ 19,797
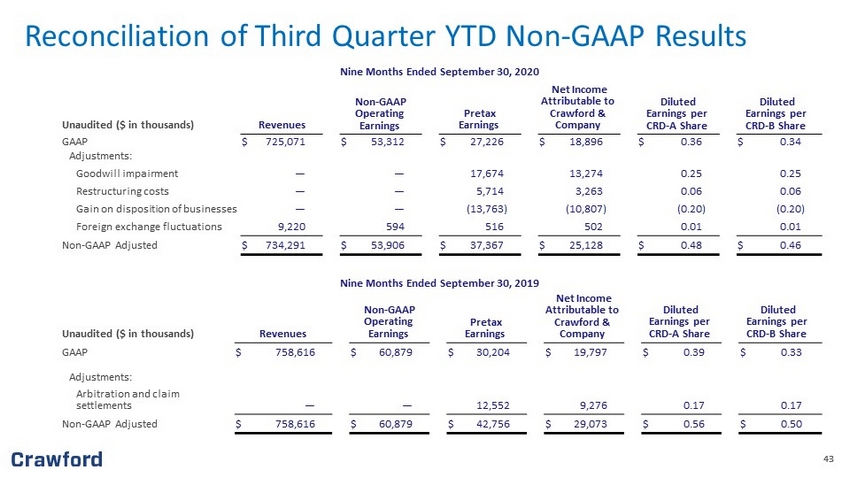
43 43 Reconciliation of Third Quarter YTD Non - GAAP Results Nine Months Ended September 3 0 , 201 9 Unaudited ($ in thousands) Revenues Non - GAAP Operating Earnings Pretax Earnings Net Income Attributable to Crawford & Company Diluted Earnings per CRD - A Share Diluted Earnings per CRD - B Share GAAP $ 758,616 $ 60,879 $ 30,204 $ 19,797 $ 0. 39 $ 0. 33 Adjustments: Arbitration and claim settlements — — 12,552 9,276 0.17 0.17 Non - GAAP Adjusted $ 758,616 $ 60,879 $ 42,756 $ 29,073 $ 0. 56 $ 0.50 Nine Months Ended September 3 0 , 20 20 Unaudited ($ in thousands) Revenues Non - GAAP Operating Earnings Pretax Earnings Net Income Attributable to Crawford & Company Diluted Earnings per CRD - A Share Diluted Earnings per CRD - B Share GAAP $ 725,071 $ 53,312 $ 27,226 $ 18,896 $ 0. 36 $ 0. 34 Adjustments: G oodwill impairment — — 17,674 13,274 0. 25 0. 25 Restructuring costs — — 5,714 3,263 0. 06 0. 06 Gain on disposition of businesses — — (13,763 ) (10,807 ) (0.20 ) (0.20 ) Foreign exchange fluctuations 9,220 594 516 502 0.01 0.01 Non - GAAP Adjusted $ 734,291 $ 53 , 906 $ 37,367 $ 25,128 $ 0. 48 $ 0. 46
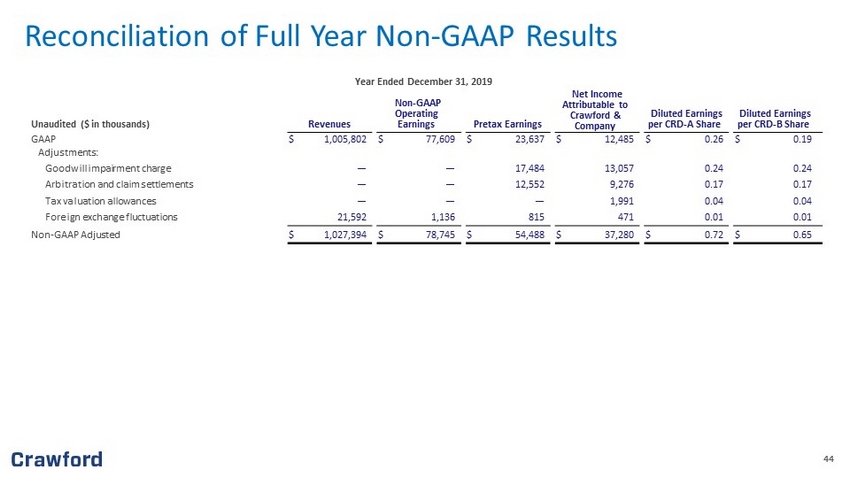
44 44 Reconciliation of Full Year Non - GAAP Results Year Ended December 31, 2019 Unaudited ($ in thousands) Revenues Non - GAAP Operating Earnings Pretax Earnings Net Income Attributable to Crawford & Company Diluted Earnings per CRD - A Share Diluted Earnings per CRD - B Share GAAP $ 1,005,802 $ 77,609 $ 23,637 $ 12,485 $ 0.26 $ 0.19 Adjustments: Goodwill impairment charge — — 17,484 13,057 0.24 0.24 Arbitration and claim settlements — — 12,552 9,276 0.17 0.17 Tax valuation allowances — — — 1,991 0.04 0.04 Foreign exchange fluctuations 21,592 1,136 815 471 0.01 0.01 Non - GAAP Adjusted $ 1,027,394 $ 78,745 $ 54,488 $ 37,280 $ 0.72 $ 0.65