Exhibit 99.1

CRD - A & CRD - B (NYSE) Investor Presentation April 2022
2 Forward - Looking Statements and Additional Information Forward - Looking Statements This presentation contains forward - looking statements, including statements about the expected future financial condition, resul ts of operations and earnings outlook of Crawford & Company. Statements, both qualitative and quantitative, that are not statements of historical fact may be "forward - looking statements" as defined in the Private Securitie s Litigation Reform Act of 1995 and other securities laws. Forward - looking statements involve a number of risks and uncertainties that could cause actual results to differ materially from historical experience or Crawford & Company 's present expectations. Accordingly, no one should place undue reliance on forward - looking statements, which speak only as of the date on which they are made. Crawford & Company does not undertake to update forward - looking statements to reflect the impact of circumstances or events that may arise or not arise after the date the forward - looking statements are made. Results for any interim period presented herein are not necessarily indicative of results to be exp ected for the full year or for any other future period. For further information regarding Crawford & Company, and the risks and uncertainties involved in forward - looking statements, please read Crawford & Company's reports filed with the Securities and Exchange Commission and available at www.sec.gov or in the Investor Relations portion of Crawford & Company's website at https://ir.crawco.com. Crawford's business is dependent, to a significant extent, on case volumes. The Company cannot predict the future trend of ca se volumes for a number of reasons, including the fact that the frequency and severity of weather - related claims and the occurrence of natural and man - made disasters, which are a significant source of cases and revenue for the Company , are generally not subject to accurate forecasting. Revenues Before Reimbursements ("Revenues") Revenues Before Reimbursements are referred to as "Revenues" in both consolidated and segment charts, bullets and tables thro ugh out this presentation. Segment and Consolidated Operating Earnings Under the Financial Accounting Standards Board's Accounting Standards Codification ("ASC") Topic 280, "Segment Reporting," th e C ompany has defined segment operating earnings as the primary measure used by the Company to evaluate the results of each of its three operating segments. Segment operating earnings represent segment earnings, includin g t he direct and indirect costs of certain administrative functions required to operate our business, but excludes unallocated corporate and shared costs and credits, net corporate interest expense, stock option expense, amortizati on of customer - relationship intangible assets, income taxes and net income or loss attributable to noncontrolling interests. Earnings Per Share The Company's two classes of stock are substantially identical, except with respect to voting rights and the Company's abilit y t o pay greater cash dividends on the non - voting Class A Common Stock than on the voting Class B Common Stock, subject to certain limitations. In addition, with respect to mergers or similar transactions, holders of Class A Commo n S tock must receive the same type and amount of consideration as holders of Class B Common Stock, unless different consideration is approved by the holders of 75% of the Class A Common Stock, voting as a class. In certain periods, the Company has paid a higher dividend on CRD - A than on CRD - B. This may result in a different earnings per s hare ("EPS") for each class of stock due to the two - class method of computing EPS as required by ASC Topic 260 - "Earnings Per Share". The two - class method is an earnings allocation method under which EPS is calculated for each class o f common stock considering both dividends declared and participation rights in undistributed earnings as if all such earnings had been distributed during the period. Segment Gross Profit Segment gross profit is defined as revenues, less direct costs, which exclude indirect centralized administrative support cos ts allocated to the business. Indirect expenses consist of centralized administrative support costs, regional and local shared services that are allocated to each segment based on usage. Non - GAAP Financial Information For additional information about certain non - GAAP financial information presented herein, see the Appendix following this presen tation.
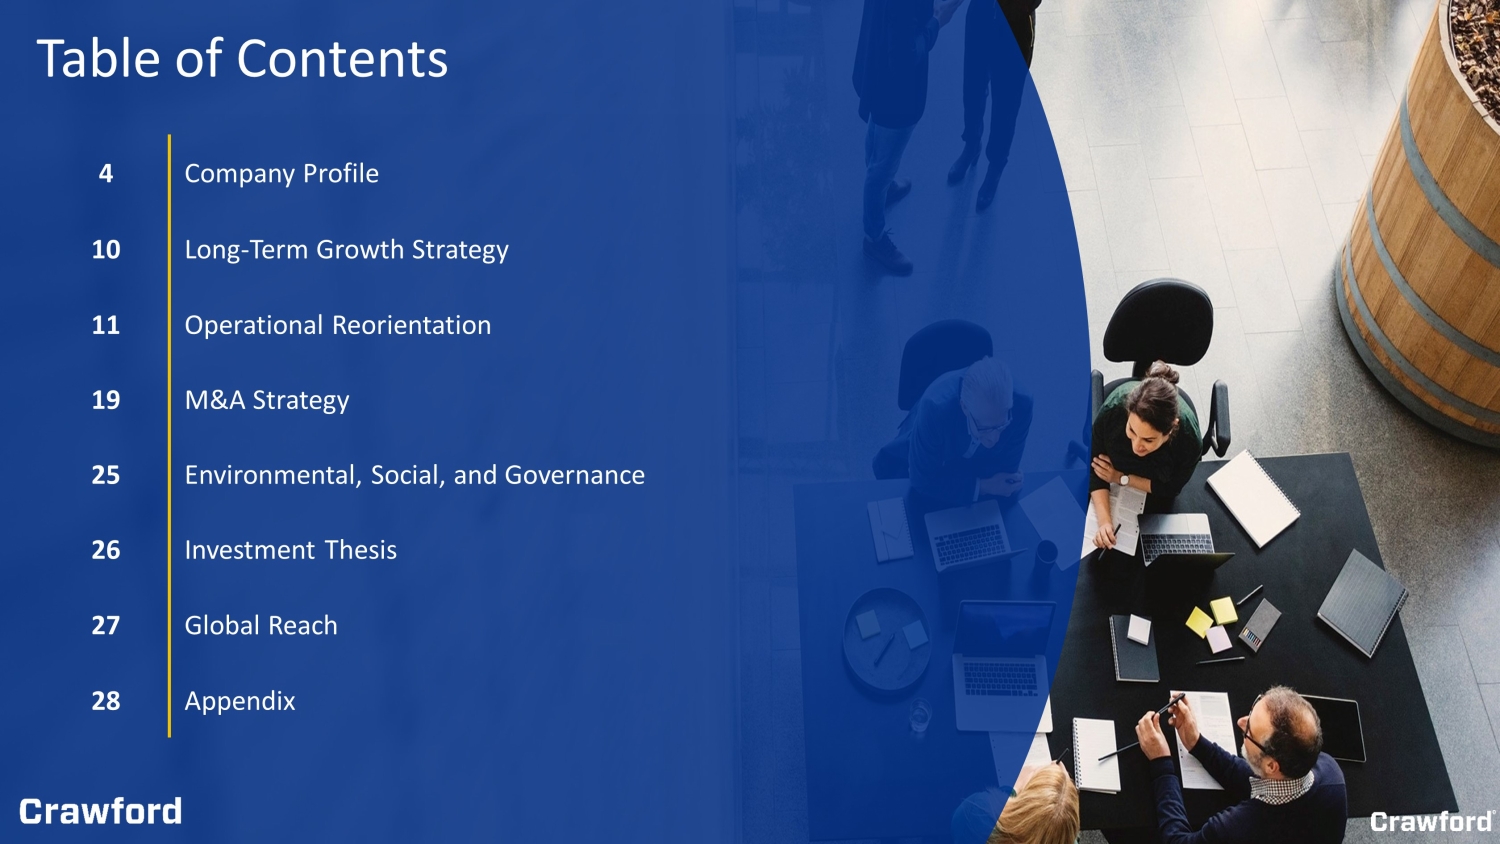
3 3 4 Company Profile 10 Long - Term Growth Strategy 11 Operational Reorientation 19 M&A Strategy 25 Environmental, Social, and Governance 26 Investment Thesis 27 Global Reach 28 Appendix Table of Contents
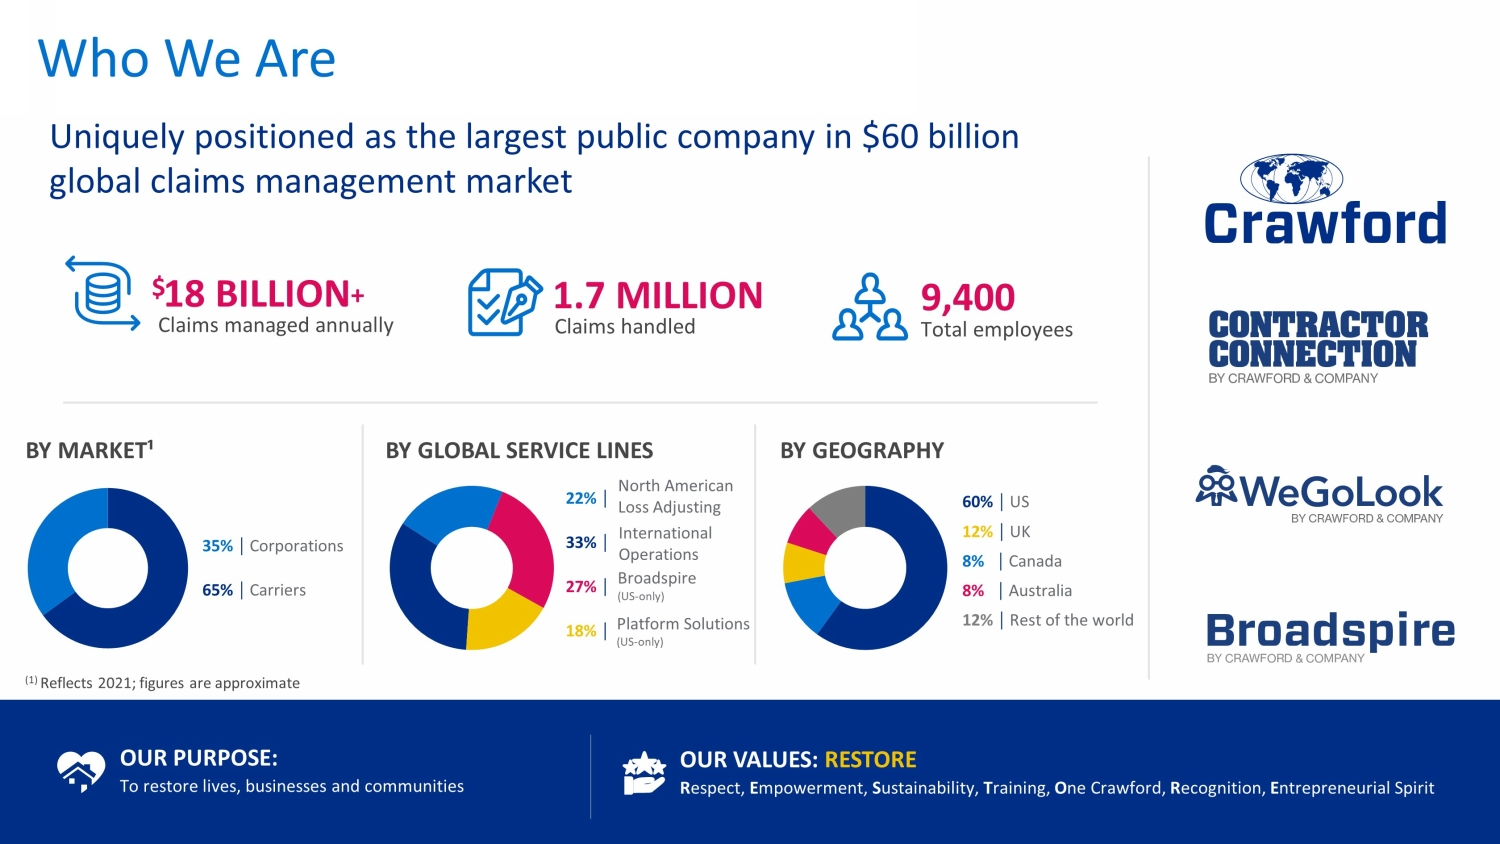
4 4 $ 18 BILLION + Claims managed annually 1.7 MILLION Claims handled BY GLOBAL SERVICE LINES BY GEOGRAPHY 22% ⎹ 33% ⎹ 27% ⎹ 18% ⎹ 60% ⎹ US 12% ⎹ UK 8% ⎹ Canada 8% ⎹ Australia 12% ⎹ Rest of the world OUR PURPOSE: To restore lives, businesses and communities OUR VALUES: RESTORE R espect, E mpowerment, S ustainability, T raining, O ne Crawford, R ecognition, E ntrepreneurial Spirit 9,400 Total employees BY MARKET ¹ (1) Reflects 2021; figures are approximate 35% ⎹ Corporations 65% ⎹ Carriers Who We Are Uniquely positioned as the largest public company in $60 billion global claims management market N orth American Loss Adjusting International Operations Broadspire (US - only) Platform Solutions (US - only)
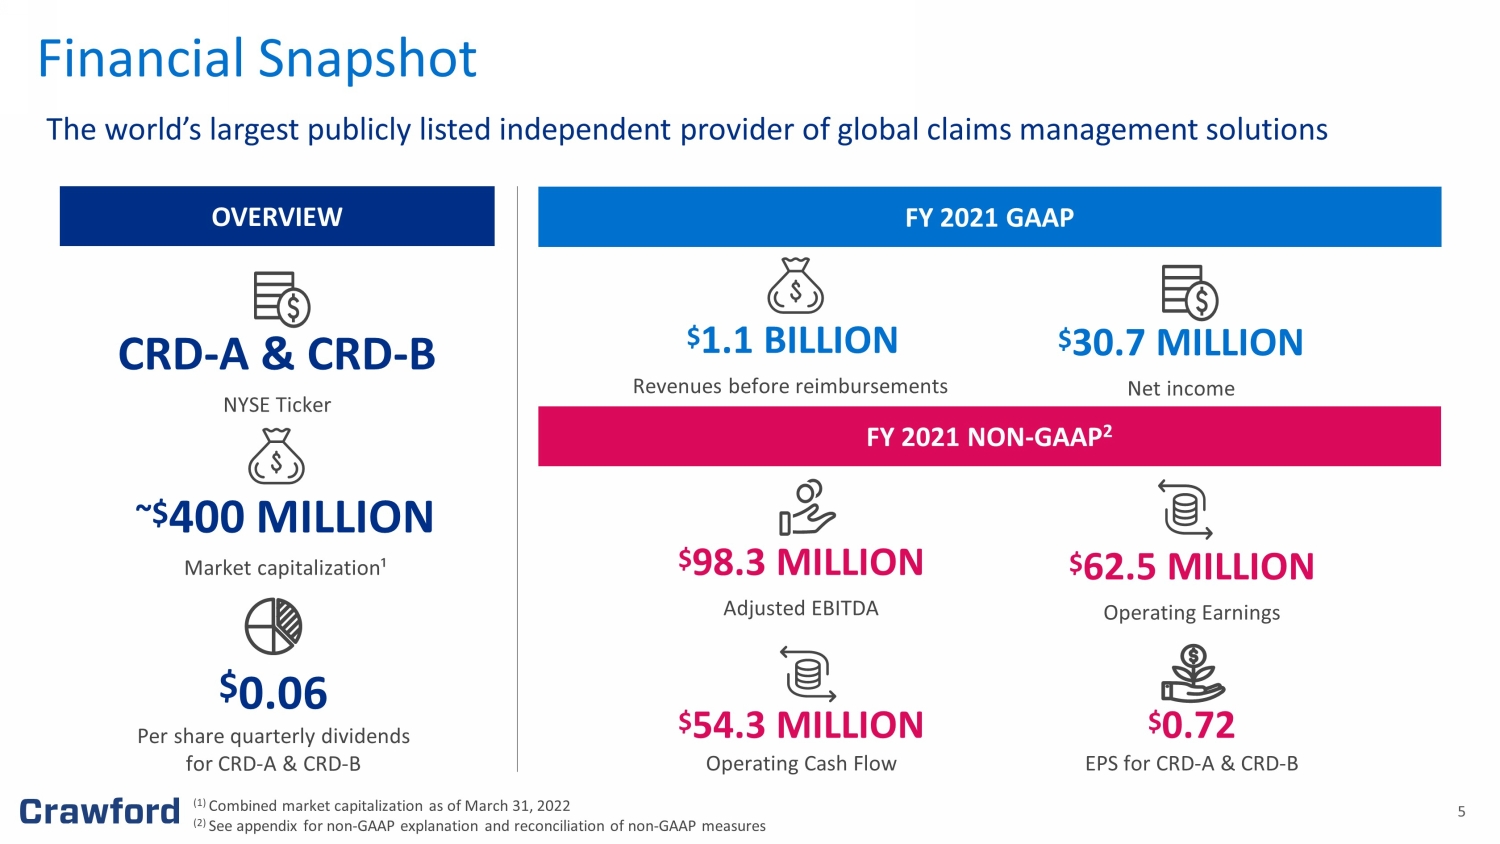
5 (1) Combined market capitalization as of March 31, 2022 (2) See appendix for non - GAAP explanation and reconciliation of non - GAAP measures OVERVIEW FY 2021 GAAP FY 2021 NON - GAAP 2 ~$ 400 MILLION Market capitalization¹ The world’s largest publicly listed independent provider of global claims management solutions $ 54.3 MILLION Operating Cash Flow $ 62.5 MILLION Operating Earnings $ 1.1 BILLION Revenues before reimbursements $ 30.7 MILLION Net income $ 98.3 MILLION Adjusted EBITDA CRD - A & CRD - B NYSE Ticker $ 0.06 Per share quarterly dividends for CRD - A & CRD - B $ 0.72 EPS for CRD - A & CRD - B Financial Snapshot

6 6 80 - Year - Old Brand Trusted by Key Customers Crawford’s customer base includes the largest global insurance carriers as well as Fortune 1000 companies
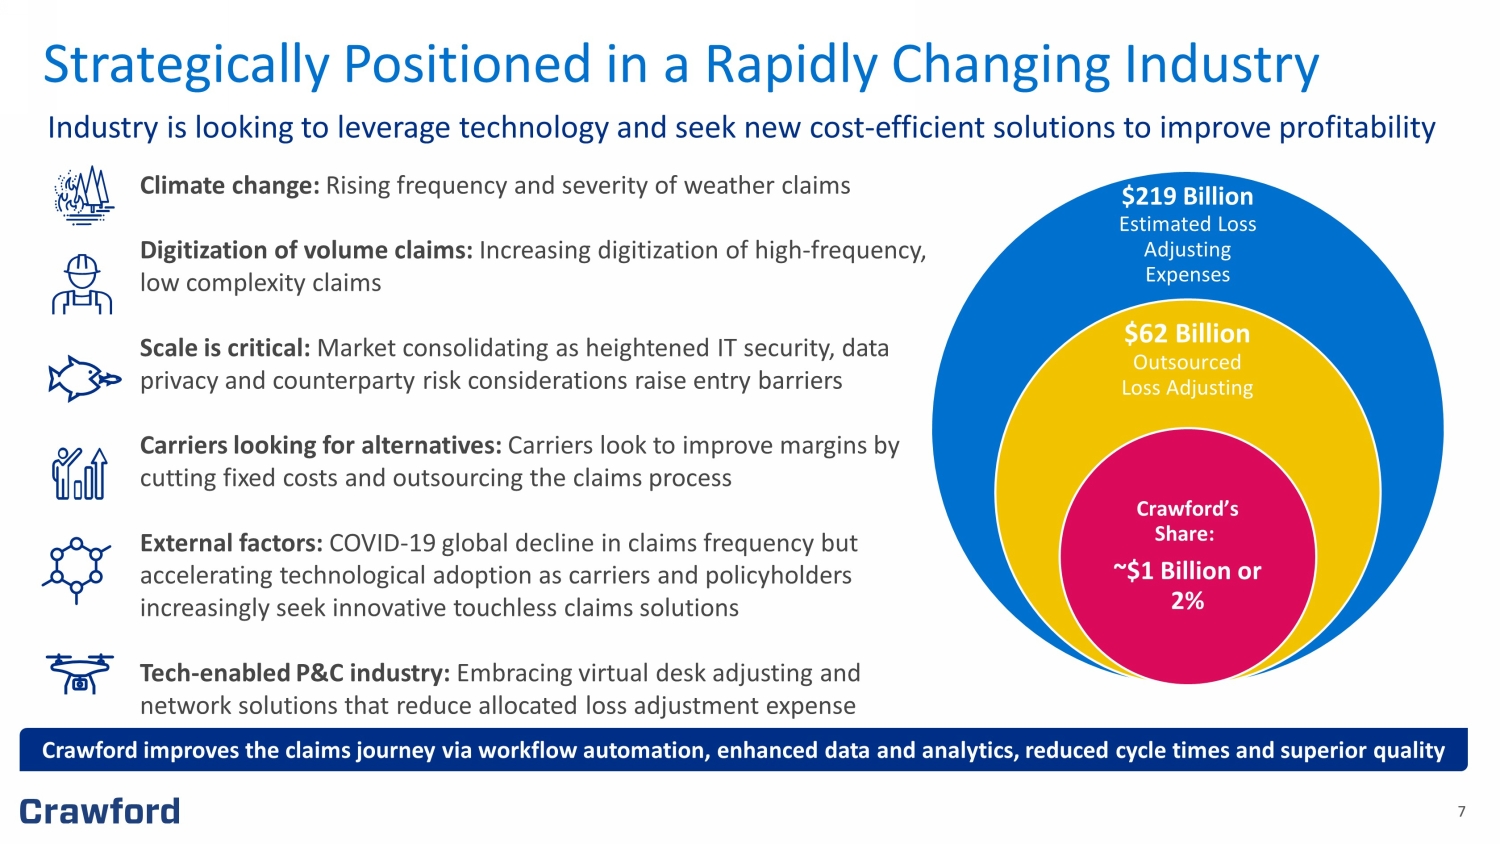
7 7 Industry is looking to leverage technology and seek new cost - efficient solutions to improve profitability Climate change: Rising frequency and severity of weather claims Digitization of volume claims: Increasing digitization of high - frequency, low complexity claims Scale is critical: Market consolidating as heightened IT security, data privacy and counterparty risk considerations raise entry barriers Carriers looking for alternatives: Carriers look to improve margins by cutting fixed costs and outsourcing the claims process External factors: COVID - 19 global decline in claims frequency but accelerating technological adoption as carriers and policyholders increasingly seek innovative touchless claims solutions Tech - enabled P&C industry: Embracing virtual desk adjusting and network solutions that reduce allocated loss adjustment expense Crawford improves the claims journey via workflow automation, enhanced data and analytics, reduced cycle times and superior q ual ity $219B+ Est. Loss Adjusting Expenses (LAE) Strategically Positioned in a Rapidly Changing Industry $219 Billion Estimated Loss Adjusting Expenses $62 Billion Outsourced Loss Adjusting Crawford’s Share: ~$1 Billion or 2%
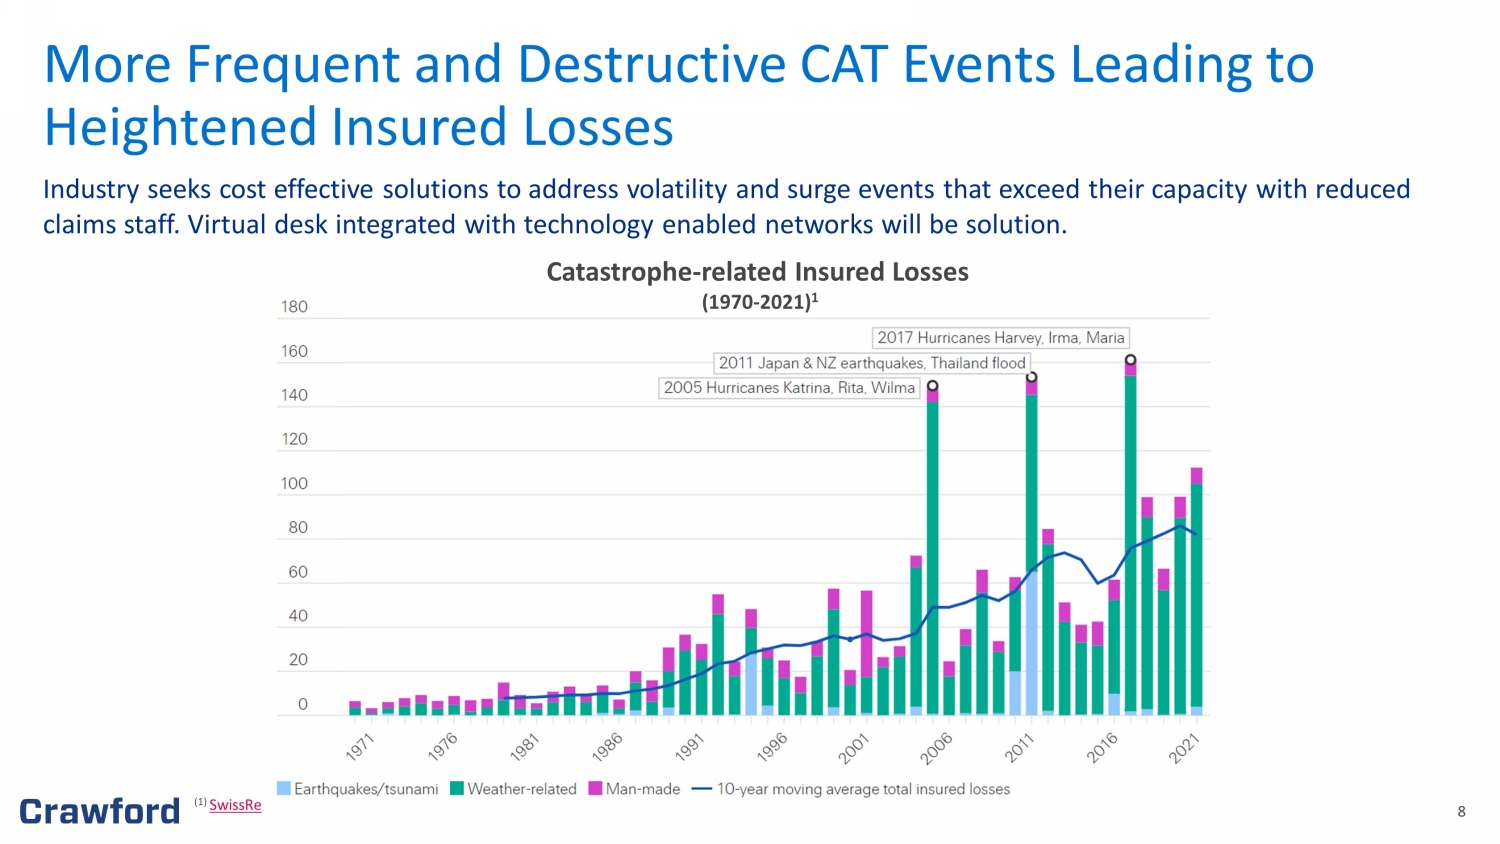
8 8 Industry seeks cost effective solutions to address volatility and surge events that exceed their capacity with reduced claims staff. Virtual desk integrated with technology enabled networks will be solution. Catastrophe - related Insured Losses (1970 - 2021) 1 More Frequent and Destructive CAT Events Leading to Heightened Insured Losses (1) SwissRe
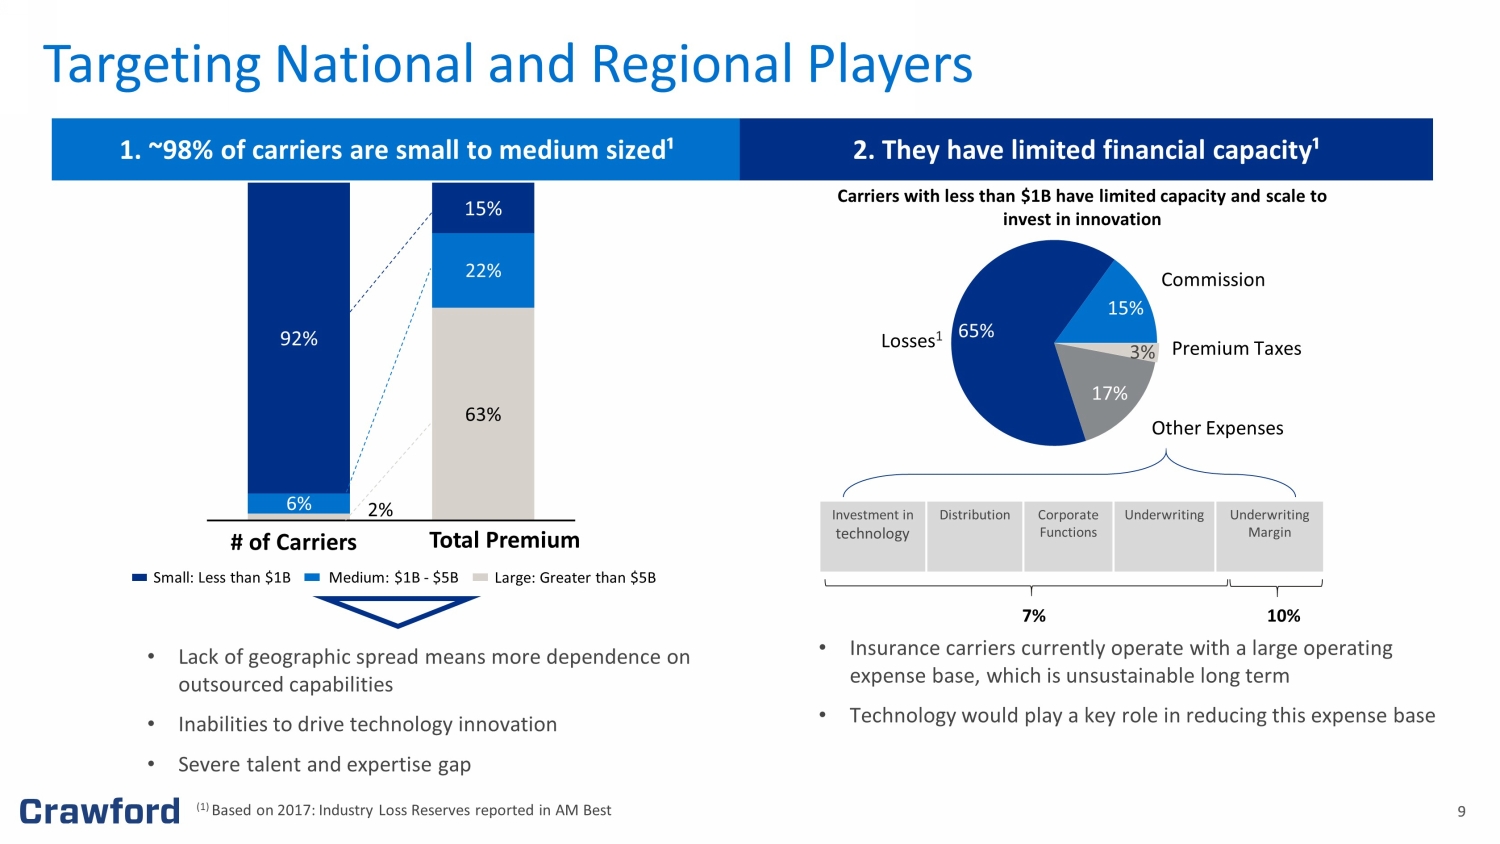
9 9 2 % 63 % 6% 22% 92% 15% # of Carriers Total Premium Medium: $1B - $5B Small: Less than $1B Large: Greater than $5B 1. ~98% of carriers are small to medium sized¹ 2. They have limited financial capacity¹ • Insurance carriers currently operate with a large operating expense base, which is unsustainable long term • Technology would play a key role in reducing this expense base 65% 15% 17% Losses 1 Commission Premium Taxes Other Expenses Investment in technology Distribution Corporate Functions Underwriting Underwriting Margin Carriers with less than $1B have limited capacity and scale to invest in innovation 10% 7% • Lack of geographic spread means more dependence on outsourced capabilities • Inabilities to drive technology innovation • Severe talent and expertise gap (1) Based on 2017: Industry Loss Reserves reported in AM Best 3% Targeting National and Regional Players
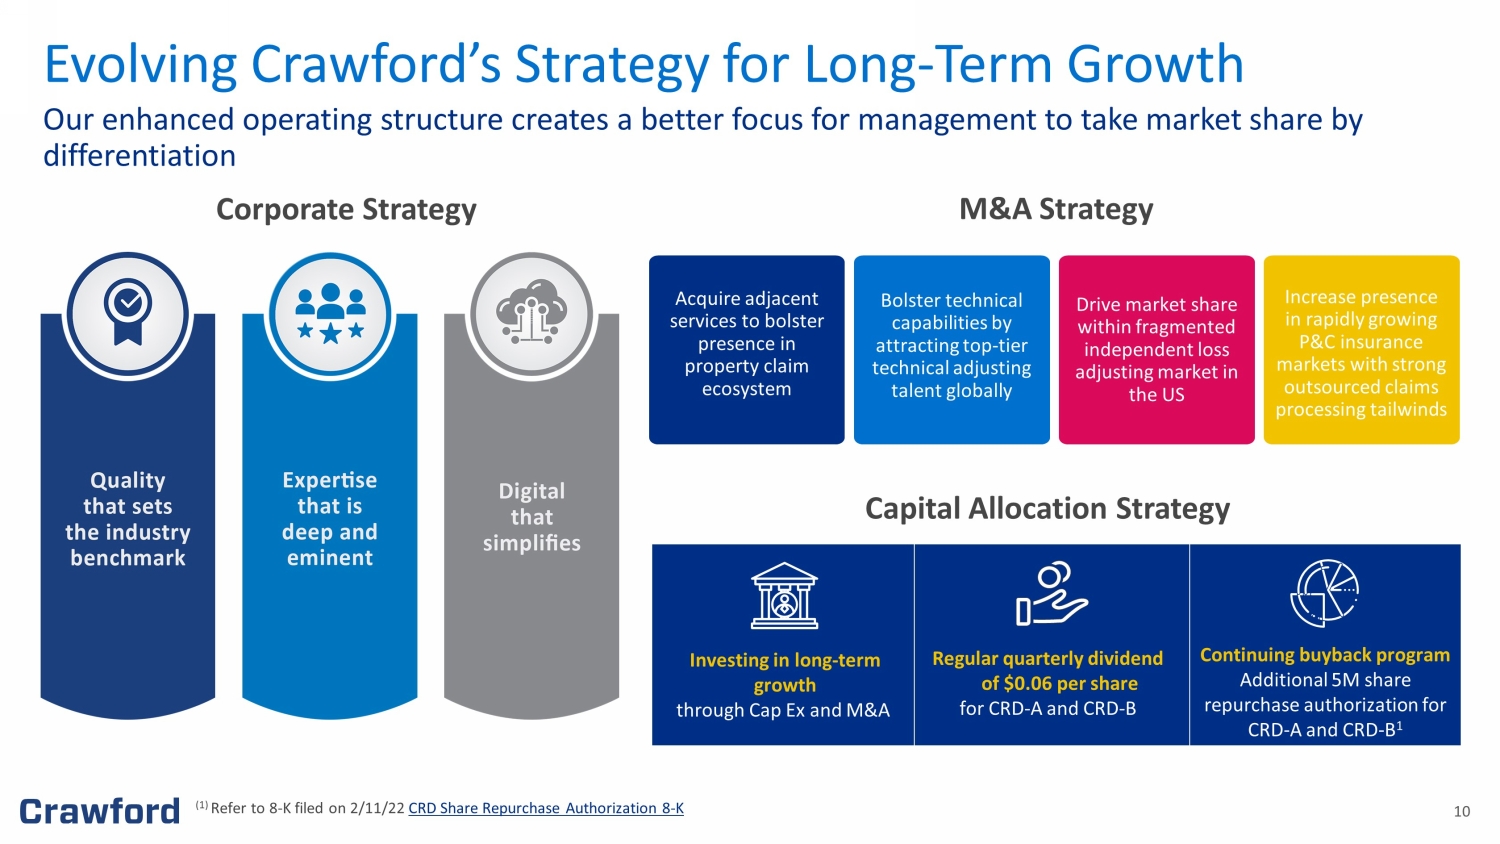
10 Our enhanced operating structure creates a better focus for management to take market share by differentiation Evolving Crawford’s Strategy for Long - Term Growth Corporate Strategy (1) Refer to 8 - K filed on 2/11/22 CRD Share Repurchase Authorization 8 - K Acquire adjacent services to bolster presence in property claim ecosystem Bolster technical capabilities by attracting top - tier technical adjusting talent globally Drive market share within fragmented independent loss adjusting market in the US Increase presence in rapidly growing P&C insurance markets with strong outsourced claims processing tailwinds M&A Strategy Investing in long - term growth through Cap Ex and M&A Continuing buyback program Additional 5M share repurchase authorization for CRD - A and CRD - B 1 Regular quarterly dividend of $0.06 per share for CRD - A and CRD - B Capital Allocation Strategy
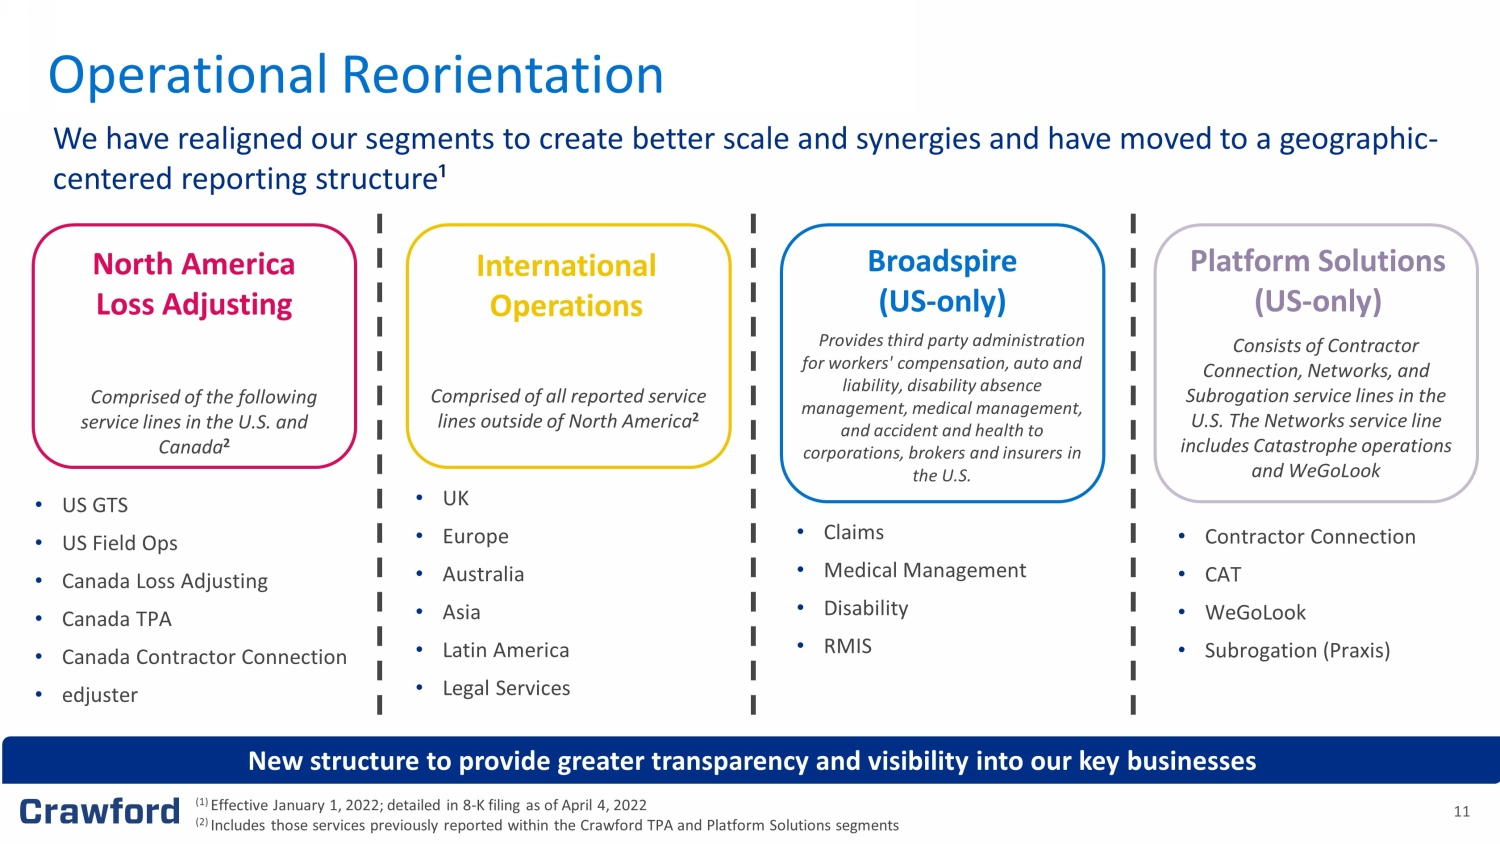
11 We have realigned our segments to create better scale and synergies and have moved to a geographic - centered reporting structure ¹ Operational Reorientation North America Loss Adjusting Broadspire (US - only) International Operations Platform Solutions (US - only) Comprised of the following service lines in the U.S. and Canada 2 Comprised of all reported service lines outside of North America 2 Provides third party administration for workers' compensation, auto and liability, disability absence management, medical management, and accident and health to corporations, brokers and insurers in the U.S. Consists of Contractor Connection, Networks, and Subrogation service lines in the U.S. The Networks service line includes Catastrophe operations and WeGoLook • US GTS • US Field Ops • Canada Loss Adjusting • Canada TPA • Canada Contractor Connection • edjuster • UK • Europe • Australia • Asia • Latin America • Legal Services • Claims • Medical Management • Disability • RMIS • Contractor Connection • CAT • WeGoLook • Subrogation (Praxis) New structure to provide greater transparency and visibility into our key businesses (1) Effective January 1, 2022; detailed in 8 - K filing as of April 4, 2022 (2) Includes those services previously reported within the Crawford TPA and Platform Solutions segments

12 For clients seeking to increase policyholder satisfaction across the full spectrum of loss adjusting needs, Crawford is the one - stop - shop delivering efficiency and savings through unmatched experience, specialized expertise and digitally - enabled solutions. North America Loss Adjusting and International Operations (1) First Notice of Loss Property Casualty Catastrophe Equipment Inspections Subrogation Centralized Intake/FNOL¹ Cyber Forensic Accounting Energy Marine Global Admin (FNOL¹ to Final Payment) Field Adjusting Construction Clients Scope & Scale Strategy • Carriers of all sizes • MGAs • Lloyds • Brokers • Corporations • Claims sizes vary from $500 - $5B+ • 300K+ Claims managed annually, $10B+ indemnity dollars • Nearly 2,500 claims professionals • 700+ executive general adjusters with an average of 25 years of experience Gain market share through digital simplification, setting quality benchmarks and investing in expertise Figures are approximate

13 13 Adding experts for major and complex claims Creating digitally enabled solutions Setting benchmark of quality Major and Complex Claims • Grow organically by creating differentiation to gain market share by expanding expertise and increasing nominations through brokers Volume Claims • Dr ive differentiation and enable margin enhancement using a combination of quality and digital simplification Long - term strategy focused on becoming the industry benchmark in quality and expertise 0 50 100 150 200 250 FY 2021 Medium Term Focused Hiring of Major and Complex Loss Adjusting Experts Aiming for +200 Expert hires in three to four years 86 200+ North America Loss Adjusting and International Operations
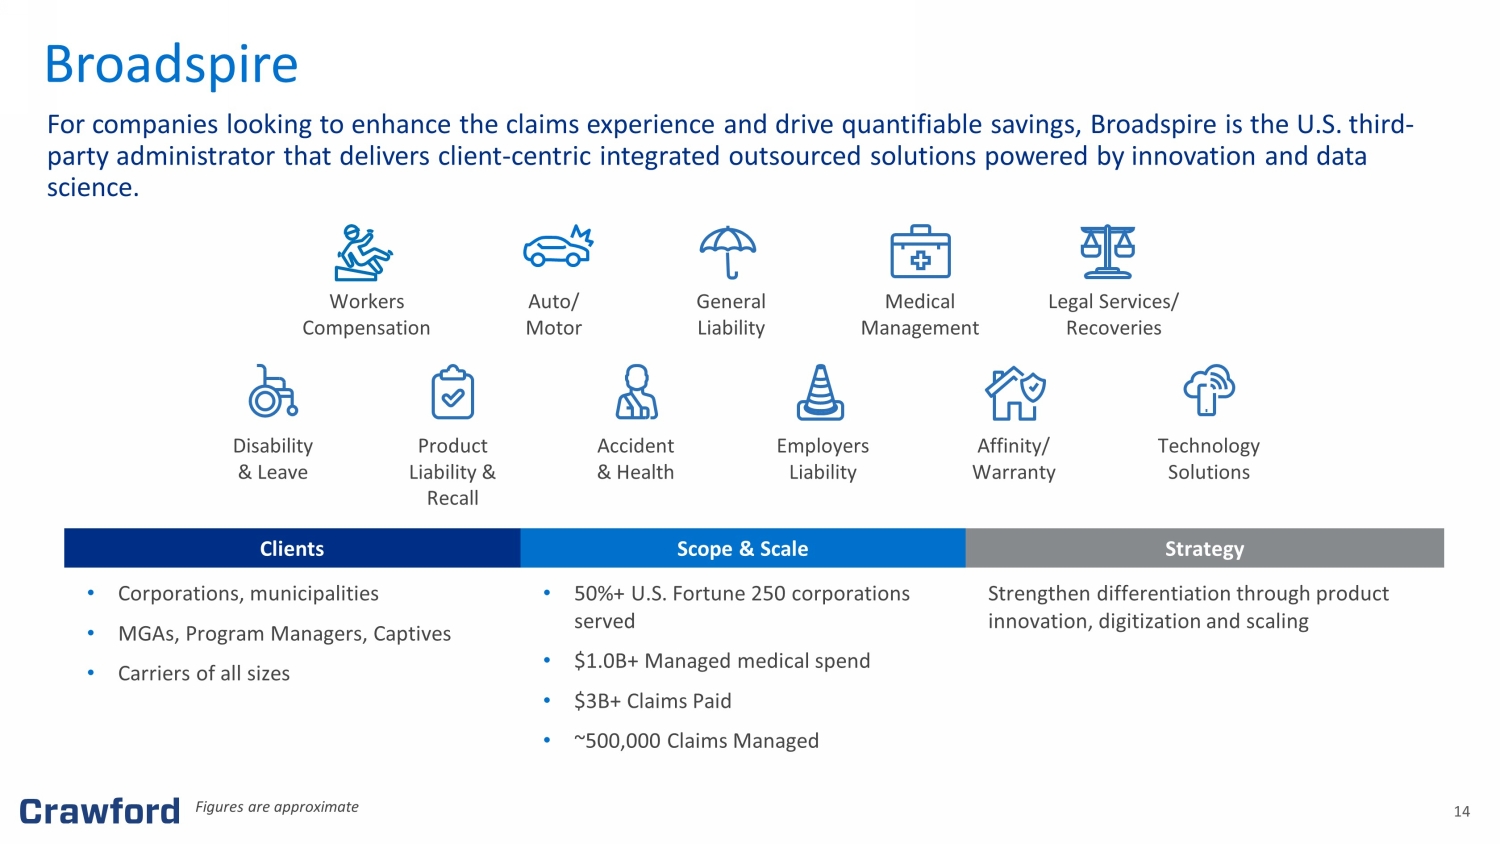
14 For companies looking to enhance the claims experience and drive quantifiable savings, Broadspire is the U.S. third - party administrator that delivers client - centric integrated outsourced solutions powered by innovation and data science. Broadspire Workers Compensation Auto/ Motor Accident & Health Affinity/ Warranty General Liability Product Liability & Recall Employers Liability Medical Management Legal Services/ Recoveries Disability & Leave Technology Solutions Clients Scope & Scale Strategy • Corporations, municipalities • MGAs, Program Managers, Captives • Carriers of all sizes • 50%+ U.S. Fortune 250 corporations served • $1.0B+ Managed medical spend • $3B+ Claims Paid • ~500,000 Claims Managed Strengthen differentiation through product innovation, digitization and scaling Figures are approximate
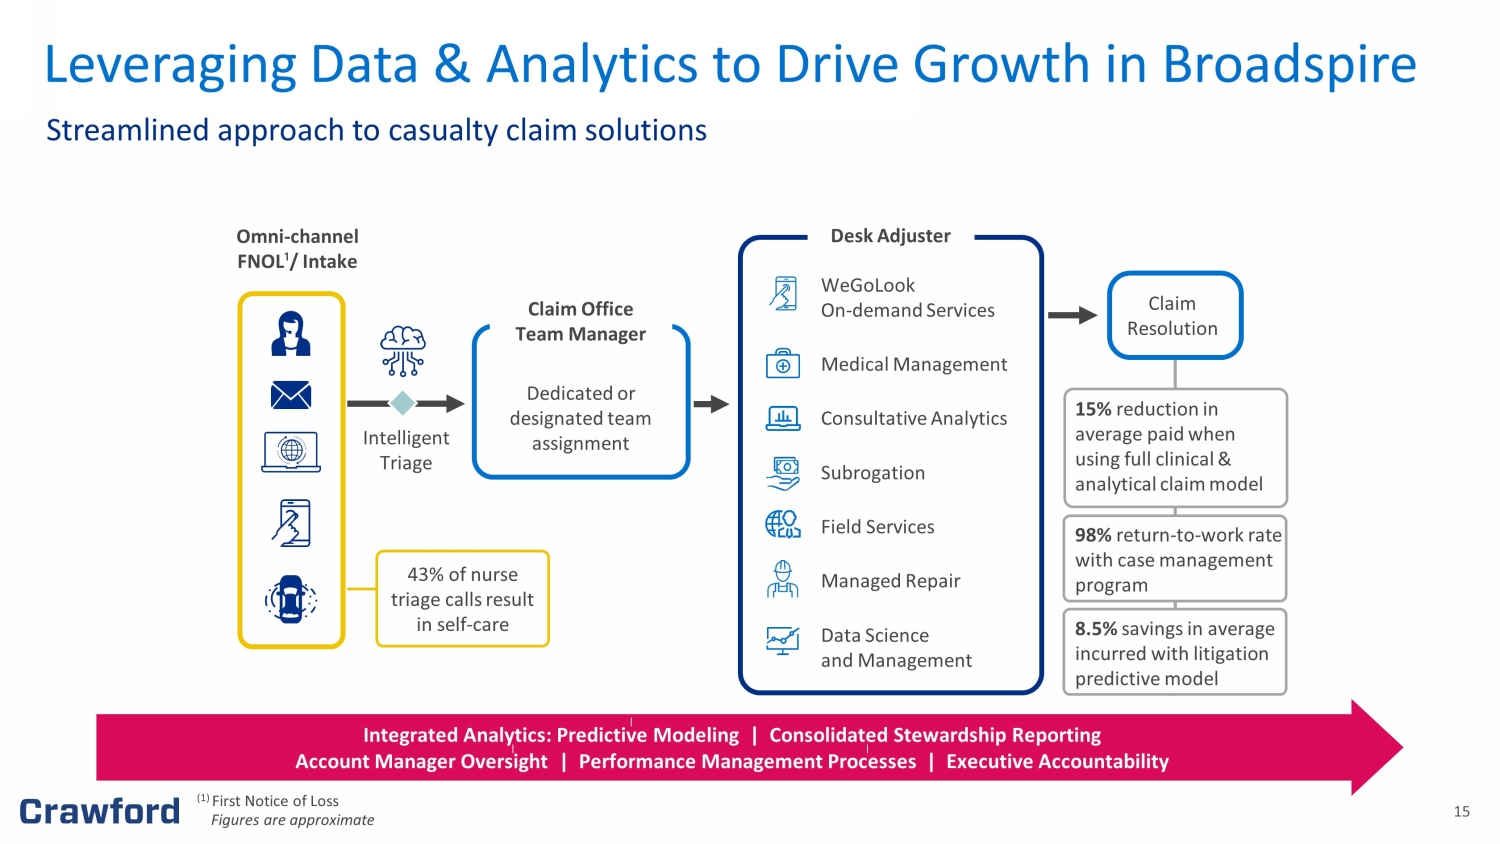
15 15% reduction in average paid when using full clinical & analytical claim model 98% return - to - work rate with case management program 8.5% savings in average incurred with litigation predictive model Claim Resolution Desk Adjuster Omni - channel FNOL ¹ / Intake Intelligent Triage WeGoLook On - demand Services Medical Management Consultative Analytics Subrogation Field Services Managed Repair Data Science and Management Dedicated or designated team assignment Claim Office Team Manager Integrated Analytics: Predictive Modeling | Consolidated Stewardship Reporting Account Manager Oversight | Performance Management Processes | Executive Accountability 43% of nurse triage calls result in self - care Streamlined approach to casualty claim solutions Leveraging Data & Analytics to Drive Growth in Broadspire (1) First Notice of Loss Figures are approximate
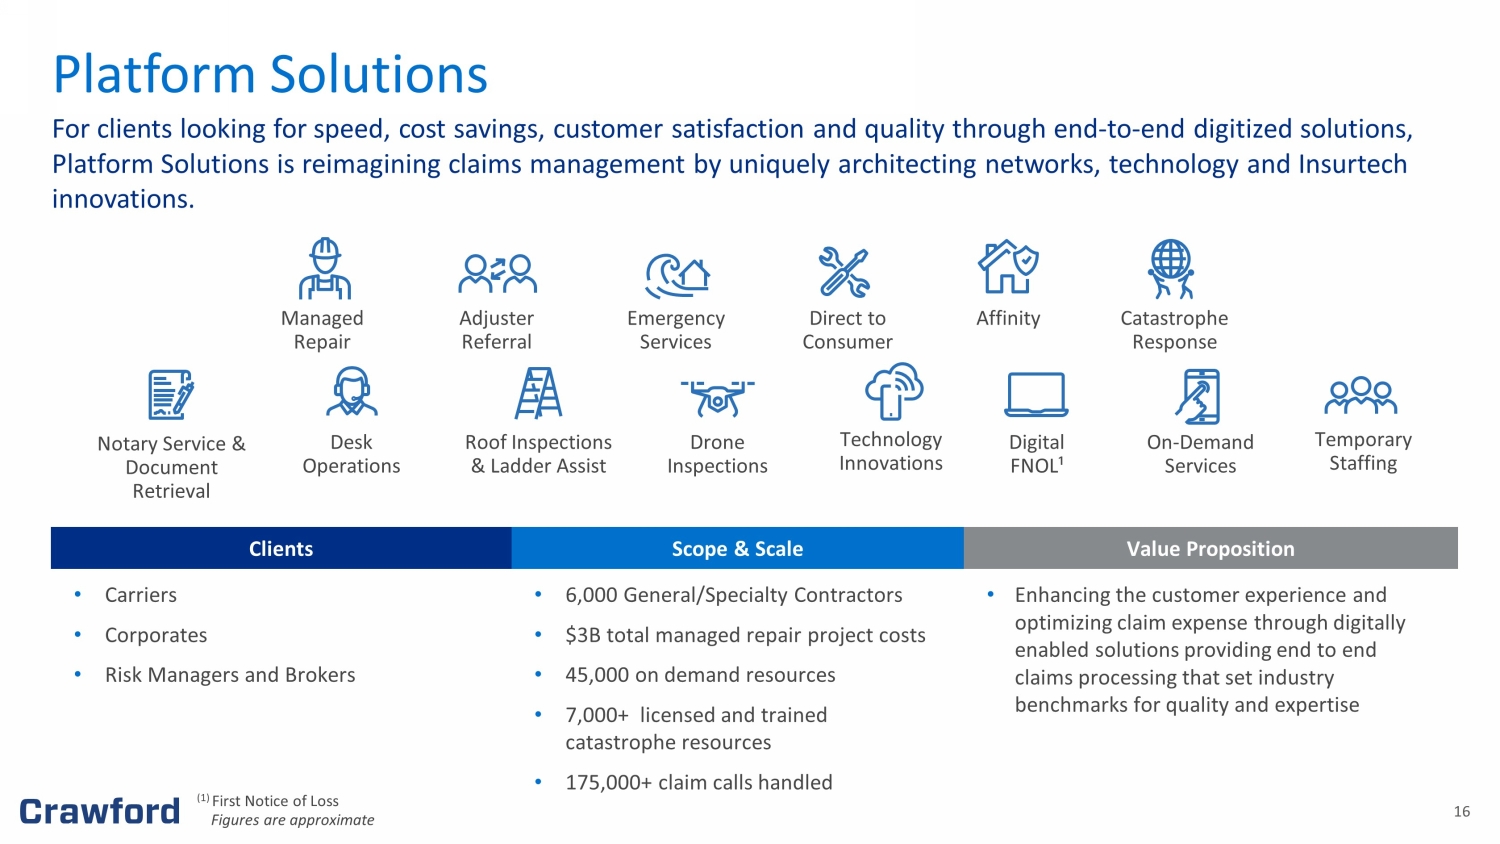
16 Clients Scope & Scale Value Proposition • Carriers • Corporates • Risk Managers and Brokers • 6,000 General/Specialty Contractors • $3B total managed repair project costs • 45,000 on demand resources • 7,000+ licensed and trained catastrophe resources • 175,000+ claim calls handled • Enhancing the customer experience and optimizing claim expense through digitally enabled solutions providing end to end claims processing that set industry benchmarks for quality and expertise Managed Repair Adjuster Referral Emergency Services Affinity Direct to Consumer Catastrophe Response Drone Inspections Desk Operations Roof Inspections & Ladder Assist On - Demand Services Digital FNOL¹ Technology Innovations Notary Service & Document Retrieval Temporary Staffing Platform Solutions For clients looking for speed, cost savings, customer satisfaction and quality through end - to - end digitized solutions, Platform Solutions is reimagining claims management by uniquely architecting networks, technology and Insurtech innovations. (1) First Notice of Loss Figures are approximate
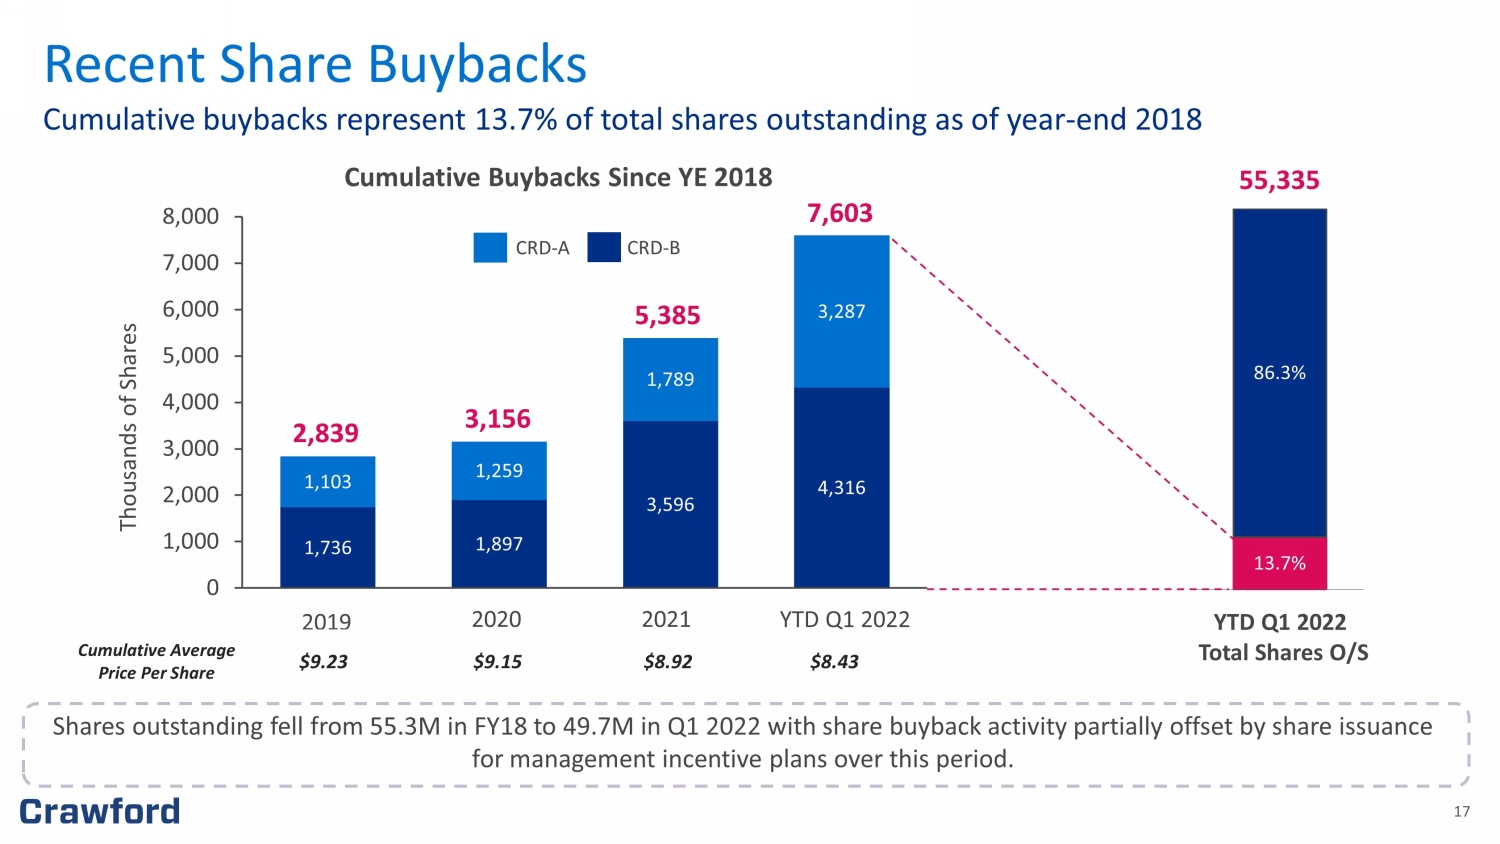
17 Cumulative buybacks represent 13.7% of total shares outstanding as of year - end 2018 Recent Share Buybacks 1,736 1,897 3,596 4,316 1,103 1,259 1,789 3,287 0 1,000 2,000 3,000 4,000 5,000 6,000 7,000 8,000 2019 5,385 YTD Q1 2022 2020 2021 2,839 3,156 7,603 Cumulative Average Price Per Share $9.23 $9.15 $8.92 $8.43 CRD - A CRD - B Thousands of Shares 13.7% 86.3% 55,335 Cumulative Buybacks Since YE 2018 YTD Q1 2022 Total Shares O/S Shares outstanding fell from 55.3M in FY18 to 49.7M in Q1 2022 with share buyback activity partially offset by share issuance for management incentive plans over this period.
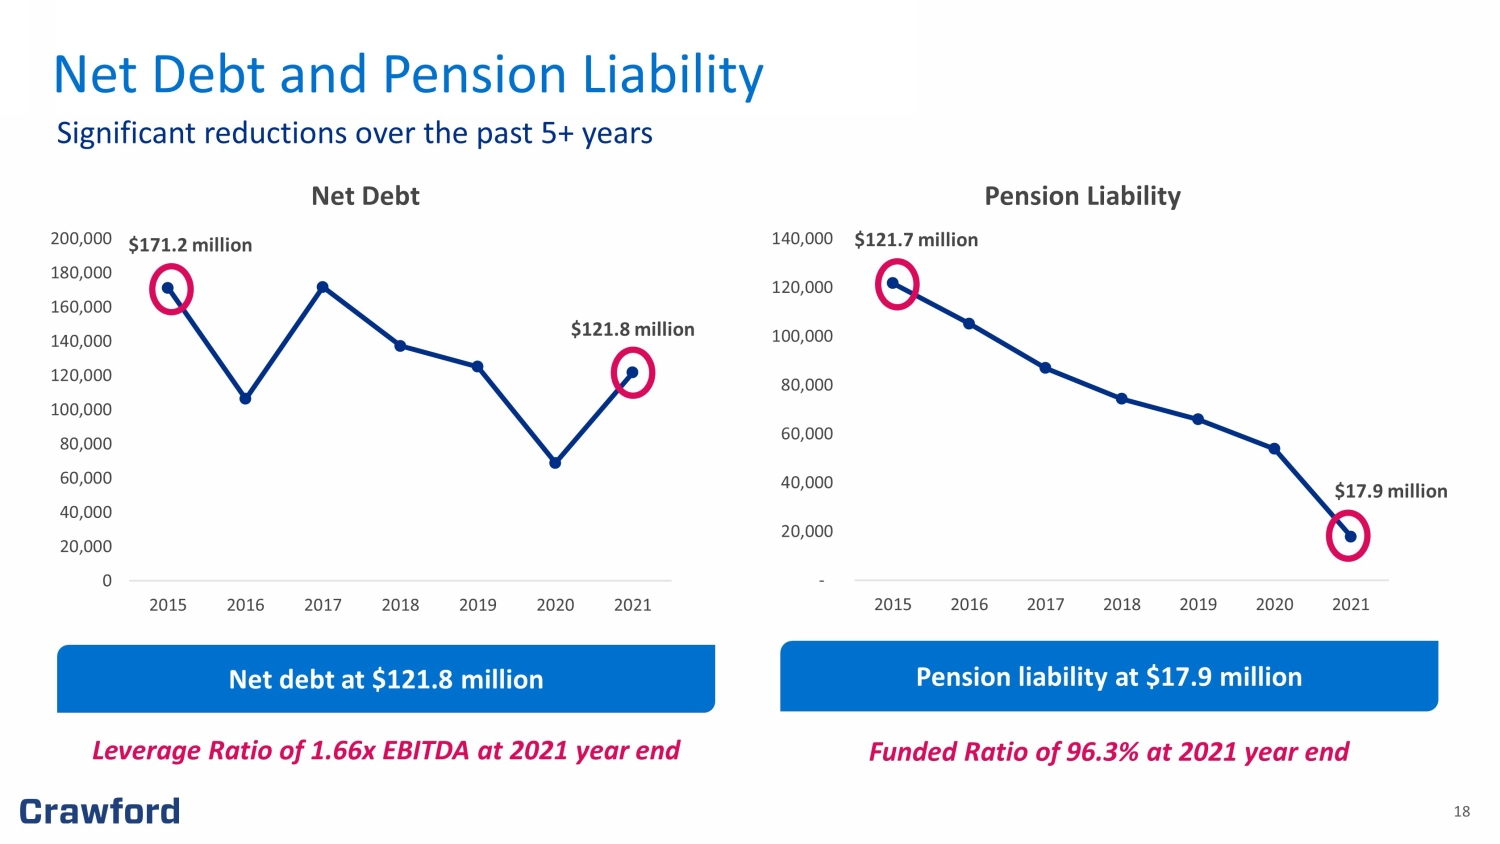
18 Net Debt and Pension Liability Significant reductions over the past 5+ years 0 20,000 40,000 60,000 80,000 100,000 120,000 140,000 160,000 180,000 200,000 2015 2016 2017 2018 2019 2020 2021 Net Debt - 20,000 40,000 60,000 80,000 100,000 120,000 140,000 2015 2016 2017 2018 2019 2020 2021 Pension Liability $121.8 million $17.9 million Net debt at $121.8 million Pension liability at $17.9 million $171.2 million $121.7 million Leverage Ratio of 1.66x EBITDA at 2021 year end Funded Ratio of 96.3% at 2021 year end

19 19 Our M&A Strategy 19
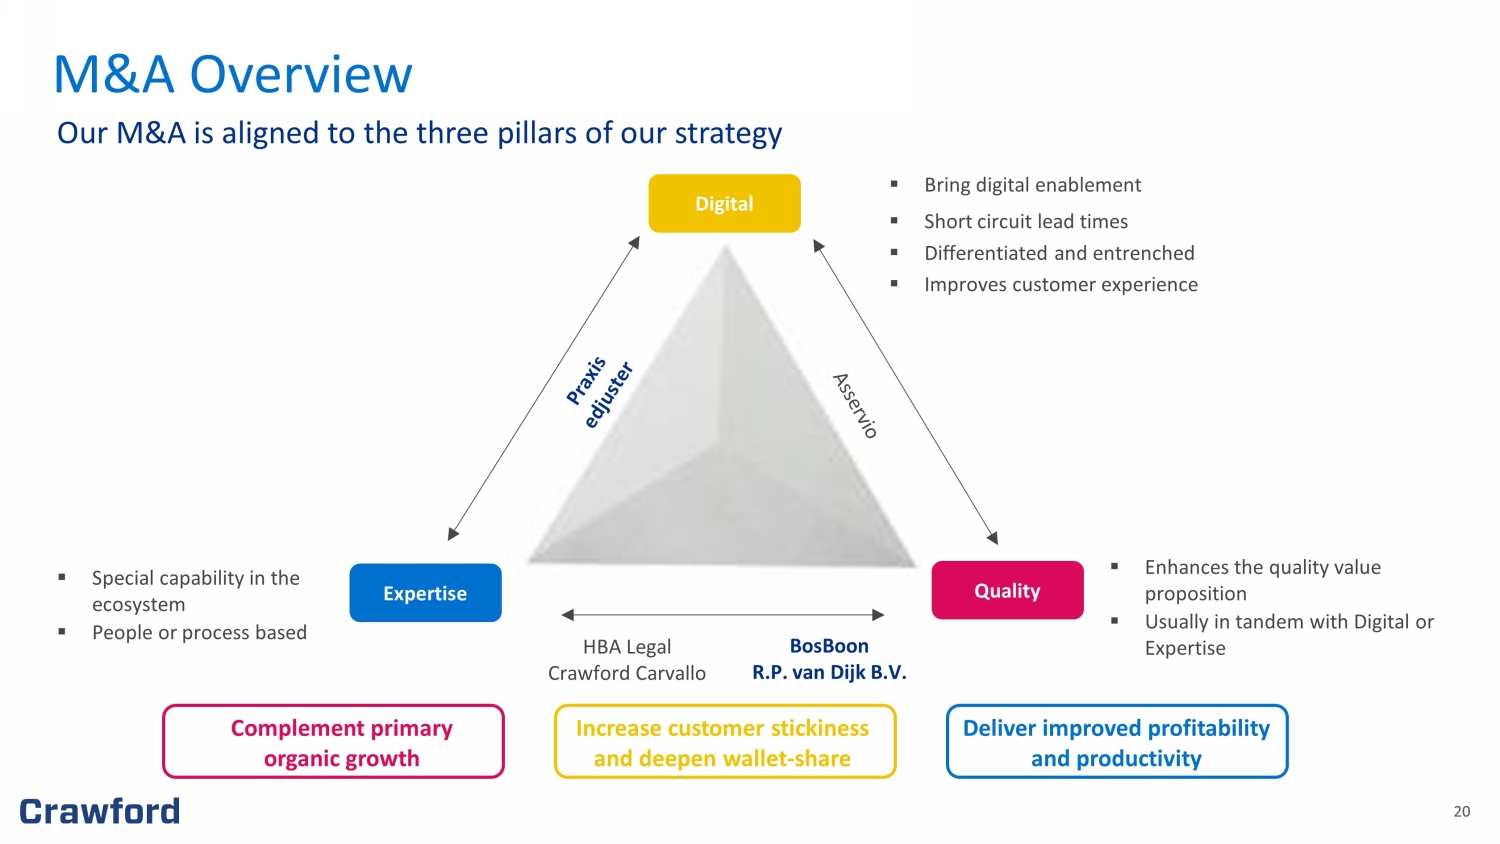
20 20 M&A Overview Our M&A is aligned to the three pillars of our strategy Digital Expertise Quality ▪ Bring digital enablement ▪ Short circuit lead times ▪ Di f ferentiated and entrenched ▪ Improves customer experience ▪ Enhances the quality value proposition ▪ Usually in tandem with Digital or Expertise ▪ Special capability in the ecosystem ▪ People or process based HBA Legal Crawford Carvallo Complement primary organic growth Deliver improved profitability and productivity Increase customer stickiness and deepen wallet - share BosBoon R.P. van Dijk B.V.
21 In August 2021, Crawford acquired 100% of edjuster , the c ontents valuation leader in North America Total purchase price of $34.6 million, consisting of $20.9 million initial payment, $0.4 million working capital adjustment, and $13.3 million maximum earnout Offers on - site contents inventory services, desktop - based and digital services that operate on a proprietary contents management platform that offers a full - featured, easy - to - use SaaS contents valuation solution Rapidly growing U.S. presence and opportunity to expand in the $500 million North American contents market benefitting from secular adoption of content - inclusive home insurance policies Supports our strategic pillar — digital that simplifies — and aligns with our purpose and envisioned future Significant opportunity to leverage Crawford’s client base and accelerate edjuster’s growth edjuster FY2020 revenues: $14.0 million Two decades of recognized experience in the industry and a blue - chip carrier client base edjuster
22 In October 2021, Crawford acquired the assets of Praxis Consulting, Inc. — the leading provider of outsourced subrogation claims management and recovery services in the United States Total purchase price of $52.3 million, consisting of $21.5 million initial payment, $20.7 million deferred payment, and $10 m ill ion maximum earnout Enhances presence and market share in an area of the insurance claims ecosystem where Crawford is underpenetrated Formal entry point into $1.0 billion subrogation recovery market by acquiring a reputable brand, execution capability and lon gst anding client relationships to offer proven service offering to Crawford customers Supports our strategic pillar — service expertise — and aligns with our purpose and envisioned future Significant opportunity to leverage Crawford’s client base and accelerate Praxis Consulting’s growth Praxis Consulting FY2020 revenues: $14.3 million Leader in the subrogation claims market with over 20 years of recognized experience and proven results Praxis Consulting, Inc.
23 In October 2021, Crawford acquired 100% of BosBoon Expertise Group B.V., a reputable specialist loss adjusting company based in The Netherlands Total purchase price of $3.9 million, consisting of $2.1 million initial payment and $1.9 million maximum earnout Primarily offers expert loss adjusting services for construction, engineering, liability, bodily injury, marine and property lin es, and provides third party administration services Adding specialist loss adjusters takes Crawford Netherlands’ talent strength to 100+ adjusters Significant opportunity to cross - sell expertise and to utilize adjuster capacity Supports our strategic pillar — expertise that is deep and eminent — and aligns with our purpose and envisioned future Strengthens position of Crawford Global Technical Services® in the Benelux region to Top 5 by bolstering construction and lia bil ity book of business and adding scale to marine and high - growth bodily injury services BosBoon FY2020 revenues: $3.4 million More than two decades of specialist loss adjusting experience and a blue - chip client base BosBoon
24 R.P. van Dijk B.V. Transforms Crawford into a leading BI player in the Netherlands In April 2022, Crawford purchased assets associated with R.P. van Dijk B.V., a bodily injury (“BI”) loss adjusting company ba sed in the Netherlands Total purchase price of $6.6 million, structured as an upfront payment of $4.4 million in cash with the balance in an earnout ov er a two - year period Expands Crawford’s Netherlands network and strengthens BI service offering by adding a highly qualified team of adjusters experienced in managing complex loss events resulting in injury or death, as well as handling medical liability claims Niche BI segment is high margin with stable growth and secular tailwinds Opportunity to cross - sell expertise, improve workload allocation and gain operational synergies Supports our strategic pillar: expertise that is deep and eminent R.P. van Dijk B.V. FY2021 revenues: $2.8 million More than 30 years of personal injury loss adjusting experience in the Netherlands (1) FX at 1.183 average EUR/USD rate for 2021
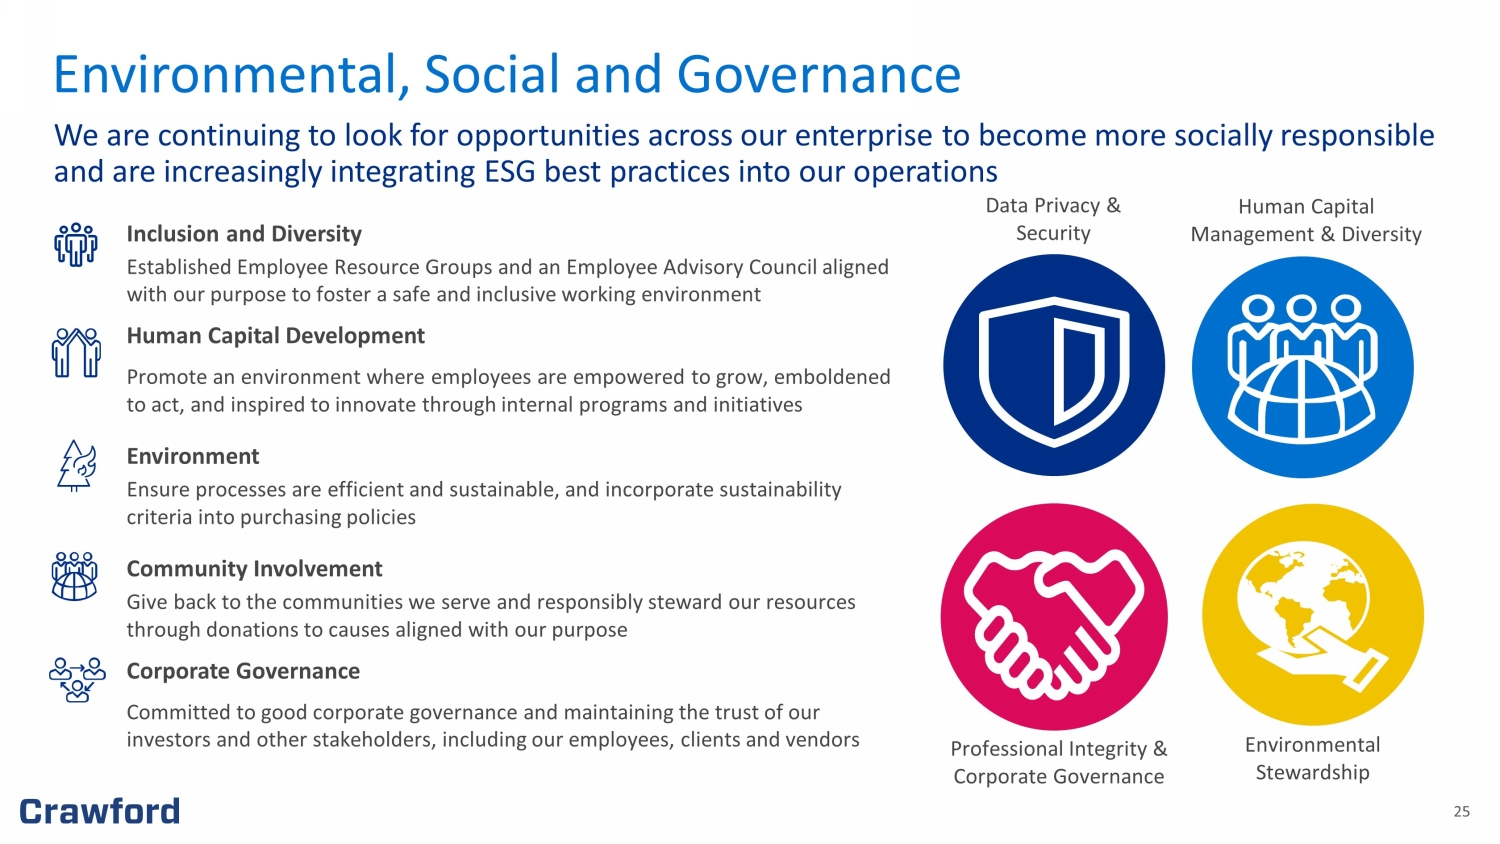
25 Inclusion and Diversity Established Employee Resource Groups and an Employee Advisory Council aligned with our purpose to foster a safe and inclusive working environment Human Capital Development Promote an environment where employees are empowered to grow, emboldened to act, and inspired to innovate through internal programs and initiatives Environment Ensure processes are efficient and sustainable, and incorporate sustainability criteria into purchasing policies Community Involvement Give back to the communities we serve and responsibly steward our resources through donations to causes aligned with our purpose Corporate Governance Committed to good corporate governance and maintaining the trust of our investors and other stakeholders, including our employees, clients and vendors Data Privacy & Security Human Capital Management & Diversity Professional Integrity & Corporate Governance Environmental Stewardship Environmental, Social and Governance We are continuing to look for opportunities across our enterprise to become more socially responsible and are increasingly integrating ESG best practices into our operations

26 26 Attractive investment profile Strategically positioned in a rapidly changing industry Investing to drive innovation and accelerate growth Committed to environmental, social and governance initiatives Financial strength and flexibility Experienced leadership team Why Invest in Crawford? Crawford’s leading market position in an evolving landscape provides a compelling investment narrative
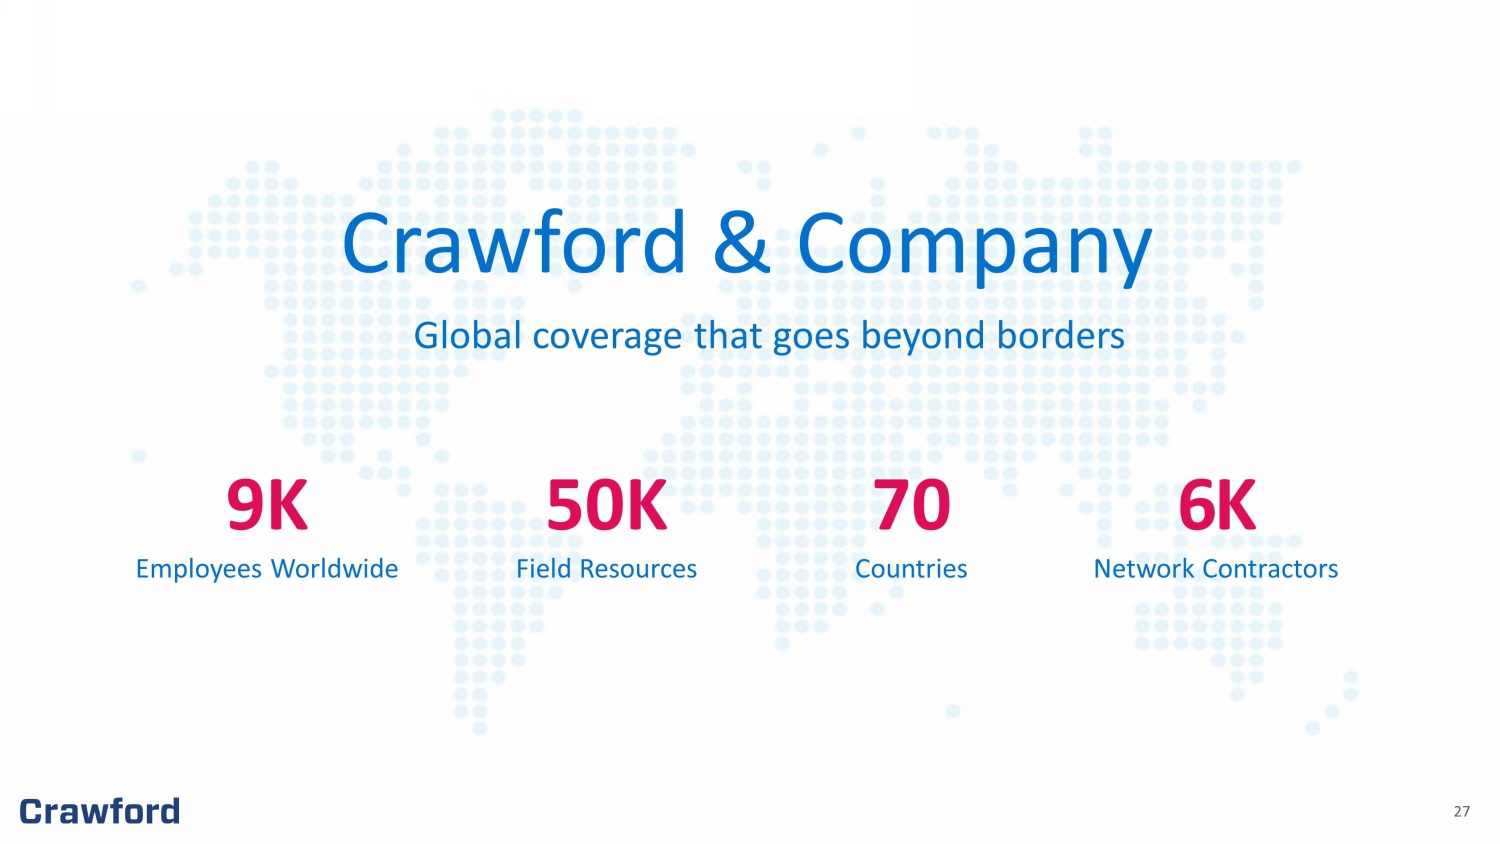
27 9K 50K 70 6K Employees Worldwide Field Resources Countries Network Contractors Crawford & Company Global coverage that goes beyond borders 27

28 28 28 Appendix A: Reimagining the Claims Process: Crawford Platform Solutions
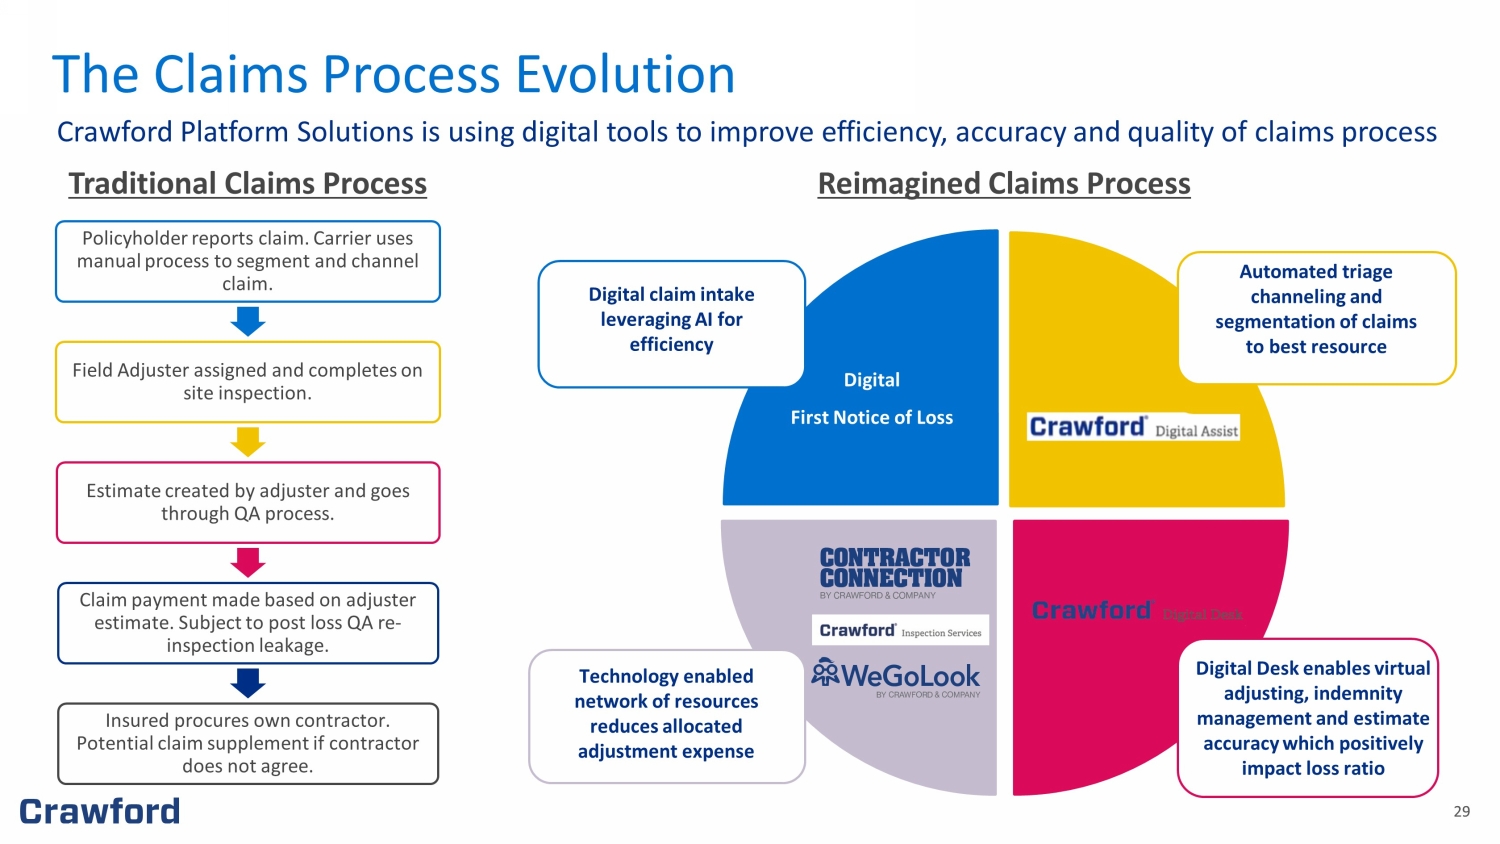
29 29 Policyholder reports claim. Carrier uses manual process to segment and channel claim. Field Adjuster assigned and completes on site inspection. Estimate created by adjuster and goes through QA process. Claim payment made based on adjuster estimate. Subject to post loss QA re - inspection leakage. Insured procures own contractor. Potential claim supplement if contractor does not agree. Traditional Claims Process The Claims Process Evolution Crawford Platform Solutions is using digital tools to improve efficiency, accuracy and quality of claims process Reimagined Claims Process Digital claim intake leveraging AI for efficiency Automated triage channeling and segmentation of claims to best resource Technology enabled network of resources reduces allocated adjustment expense Digital Desk enables virtual adjusting, indemnity management and estimate accuracy which positively impact loss ratio Digital First Notice of Loss
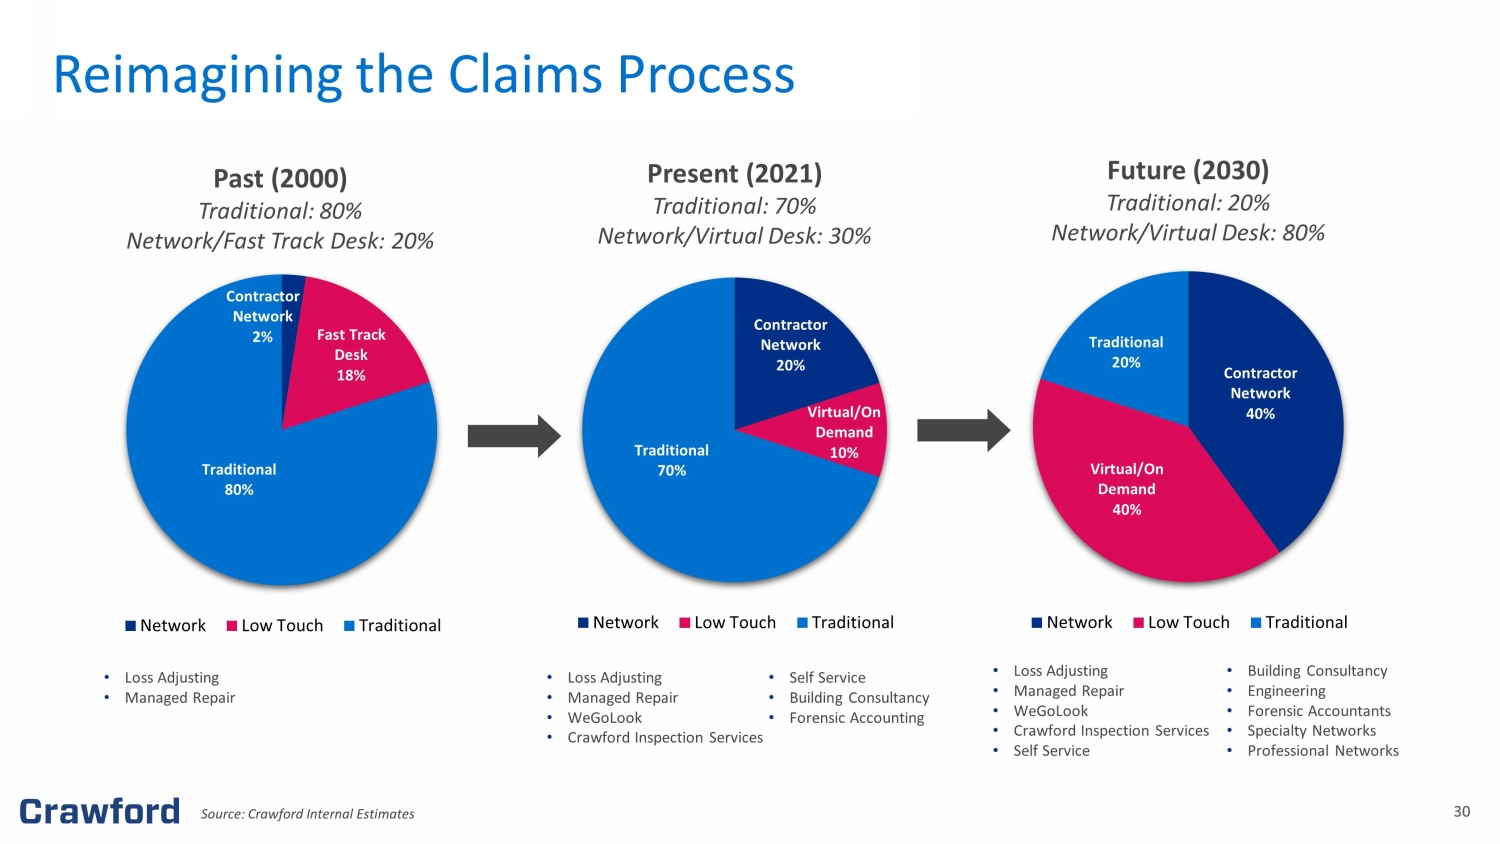
30 30 Contractor Network 2% Fast Track Desk 18% Traditional 80% Network Low Touch Traditional Past (2000) Traditional: 80% Network/Fast Track Desk: 20% • Loss Adjusting • Managed Repair Contractor Network 20% Virtual/On Demand 10% Traditional 70% Network Low Touch Traditional Present (2021) Traditional: 70% Network/Virtual Desk: 30% Contractor Network 40% Virtual/On Demand 40% Traditional 20% Network Low Touch Traditional Future (2030) Traditional: 20% Network/Virtual Desk: 80% • Loss Adjusting • Managed Repair • WeGoLook • Crawford Inspection Services • Self Service • Building Consultancy • Forensic Accounting • Loss Adjusting • Managed Repair • WeGoLook • Crawford Inspection Services • Self Service • Building Consultancy • Engineering • Forensic Accountants • Specialty Networks • Professional Networks Source: Crawford Internal Estimates Reimagining the Claims Process
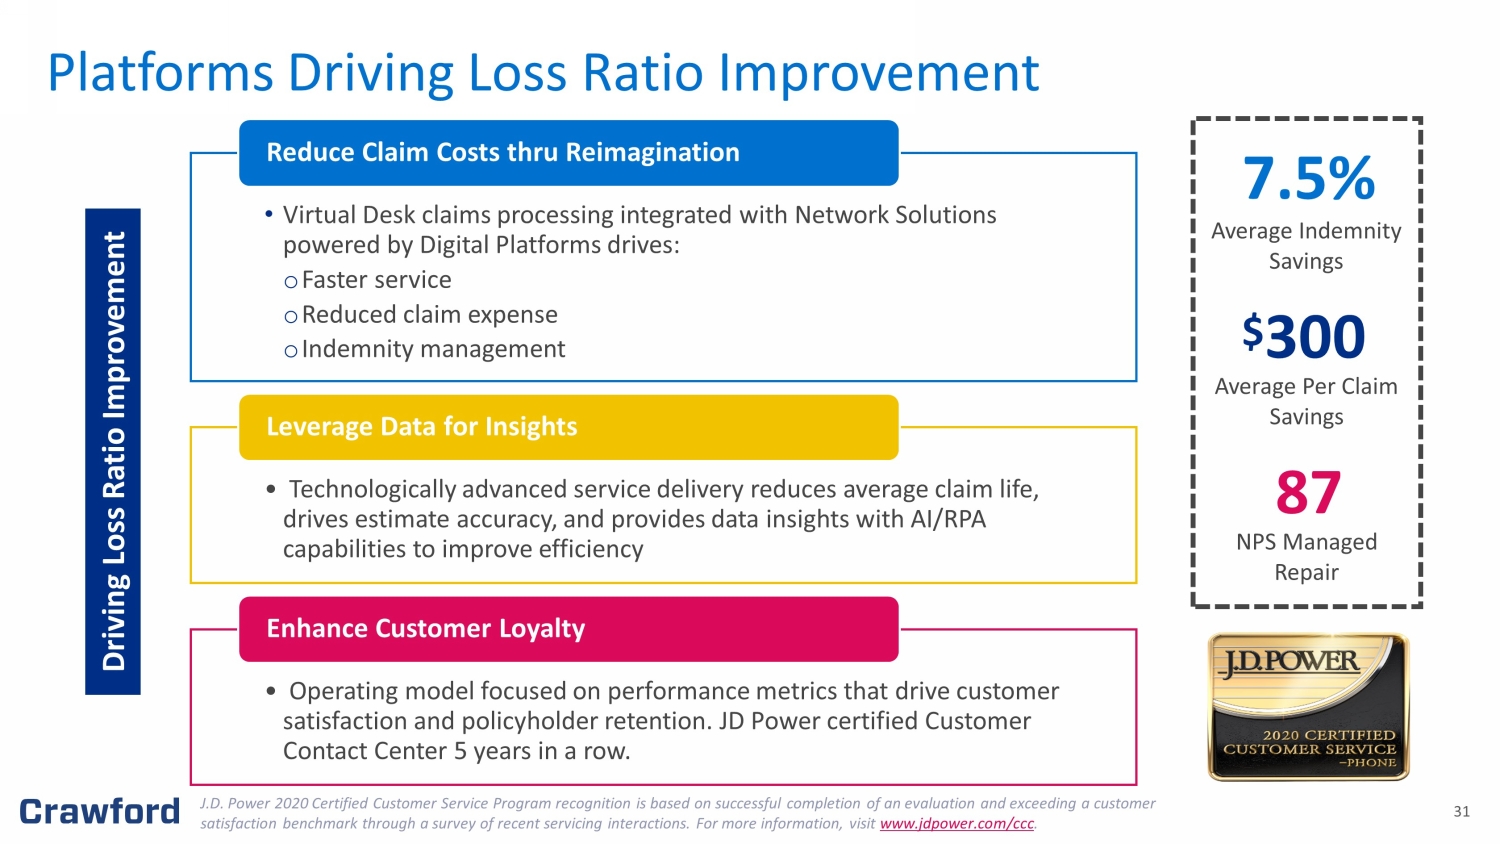
31 Driving Loss Ratio Improvement Platforms Driving Loss Ratio Improvement J.D. Power 2020 Certified Customer Service Program recognition is based on successful completion of an evaluation and exceedi ng a customer satisfaction benchmark through a survey of recent servicing interactions. For more information, visit www.jdpower.com/ccc . • Virtual Desk claims processing integrated with Network Solutions powered by Digital Platforms drives: o Faster service o Reduced claim expense o Indemnity management Reduce Claim Costs thru Reimagination • Technologically advanced service delivery reduces average claim life, drives estimate accuracy, and provides data insights with AI/RPA capabilities to improve efficiency Leverage Data for Insights • Operating model focused on performance metrics that drive customer satisfaction and policyholder retention. JD Power certified Customer Contact Center 5 years in a row. Enhance Customer Loyalty 7.5% Average Indemnity Savings $ 300 Average Per Claim Savings NPS Managed Repair 87
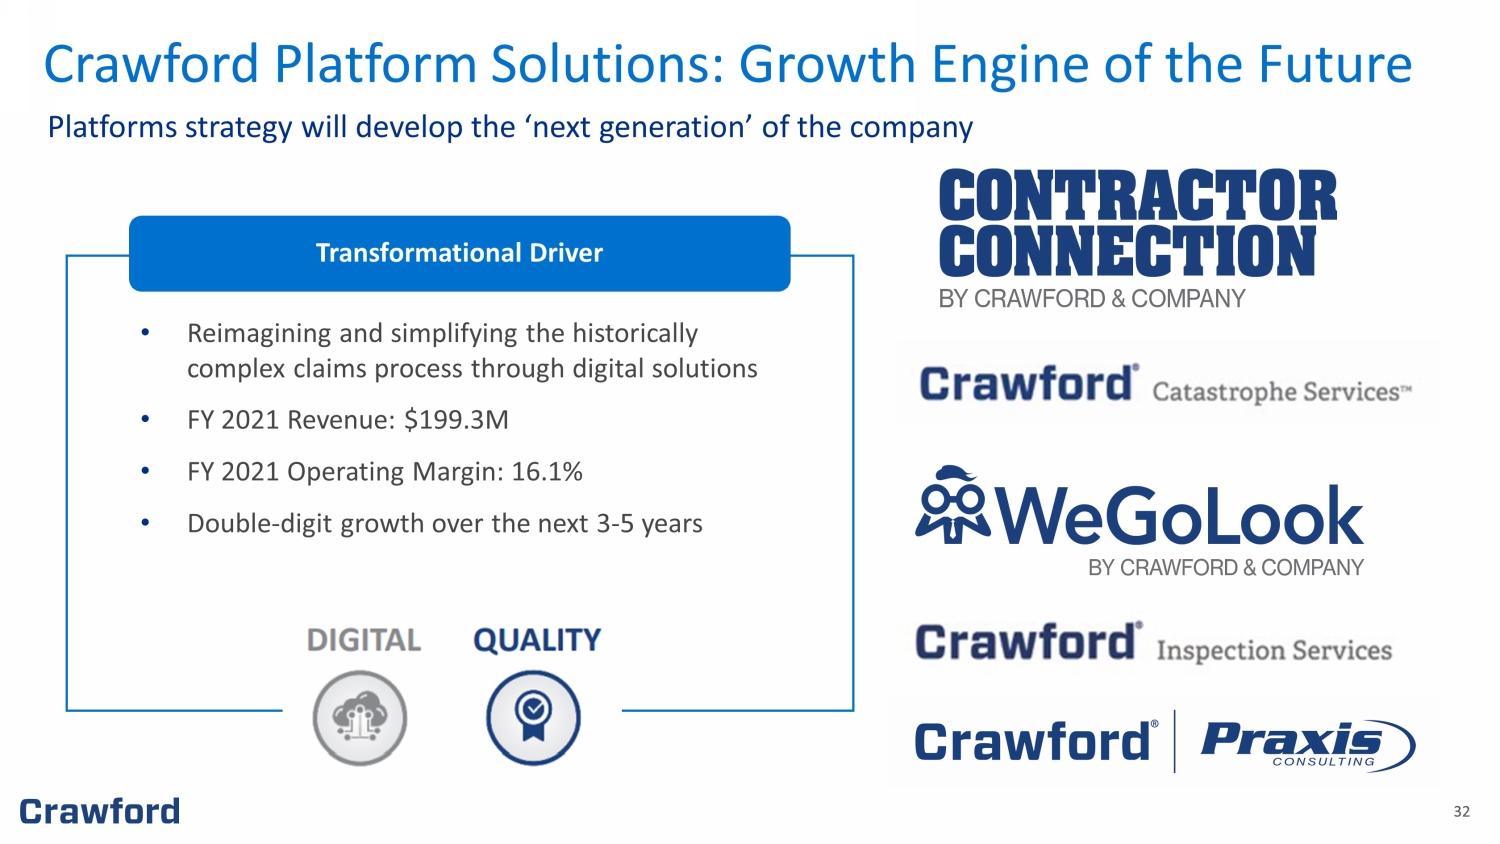
32 32 • Reimagining and simplifying the historically complex claims process through digital solutions • FY 2021 Revenue: $199.3M • FY 2021 Operating Margin: 16.1% • Double - digit growth over the next 3 - 5 years Transformational Driver Crawford Platform Solutions: Growth Engine of the Future Platforms strategy will develop the ‘next generation’ of the company
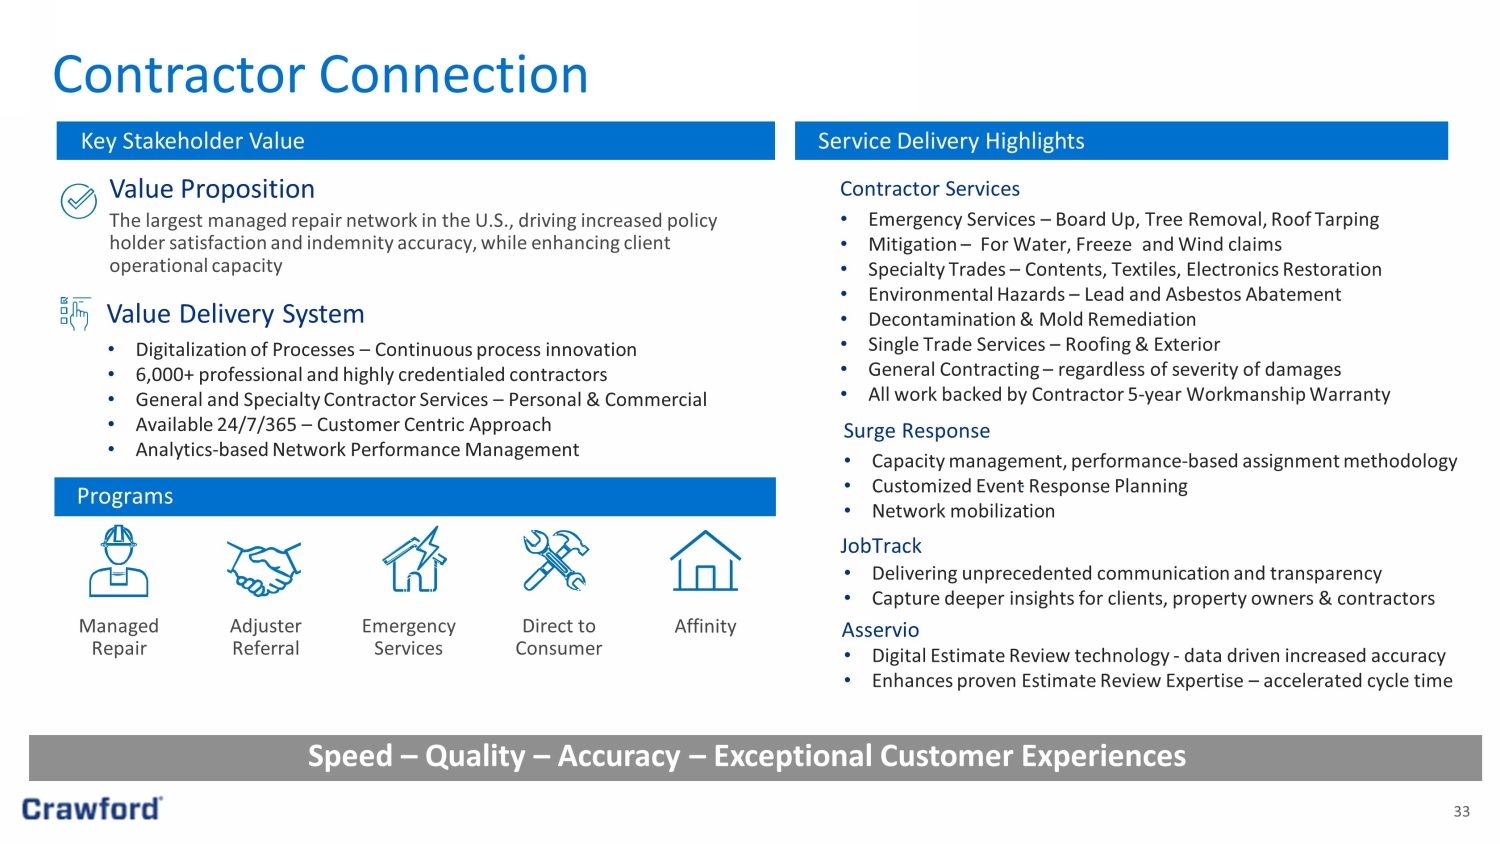
33 Summary Speed – Quality – Accuracy – Exceptional Customer Experiences The largest managed repair network in the U.S., driving increased policy holder satisfaction and indemnity accuracy, while enhancing client operational capacity Value Proposition • Digitalization of Processes – Continuous process innovation • 6,000+ professional and highly credentialed contractors ��� General and Specialty Contractor Services – Personal & Commercial • Available 24/7/365 – Customer Centric Approach • Analytics - based Network Performance Management Value Delivery System Programs Managed Repair Adjuster Referral Emergency Services Direct to Consumer Affinity Key Stakeholder Value Service Delivery Highlights Contractor Services • Emergency Services – Board Up, Tree Removal, Roof Tarping • Mitigation – For Water, Freeze and Wind claims • Specialty Trades – Contents, Textiles, Electronics Restoration • Environmental Hazards – Lead and Asbestos Abatement • Decontamination & Mold Remediation • Single Trade Services – Roofing & Exterior • General Contracting – regardless of severity of damages • All work backed by Contractor 5 - year Workmanship Warranty JobTrack • Delivering unprecedented communication and transparency • Capture deeper insights for clients, property owners & contractors Asservio • Digital Estimate Review technology - data driven increased accuracy • Enhances proven Estimate Review Expertise – accelerated cycle time Surge Response • Capacity management, performance - based assignment methodology • Customized Event Response Planning • Network mobilization Contractor Connection
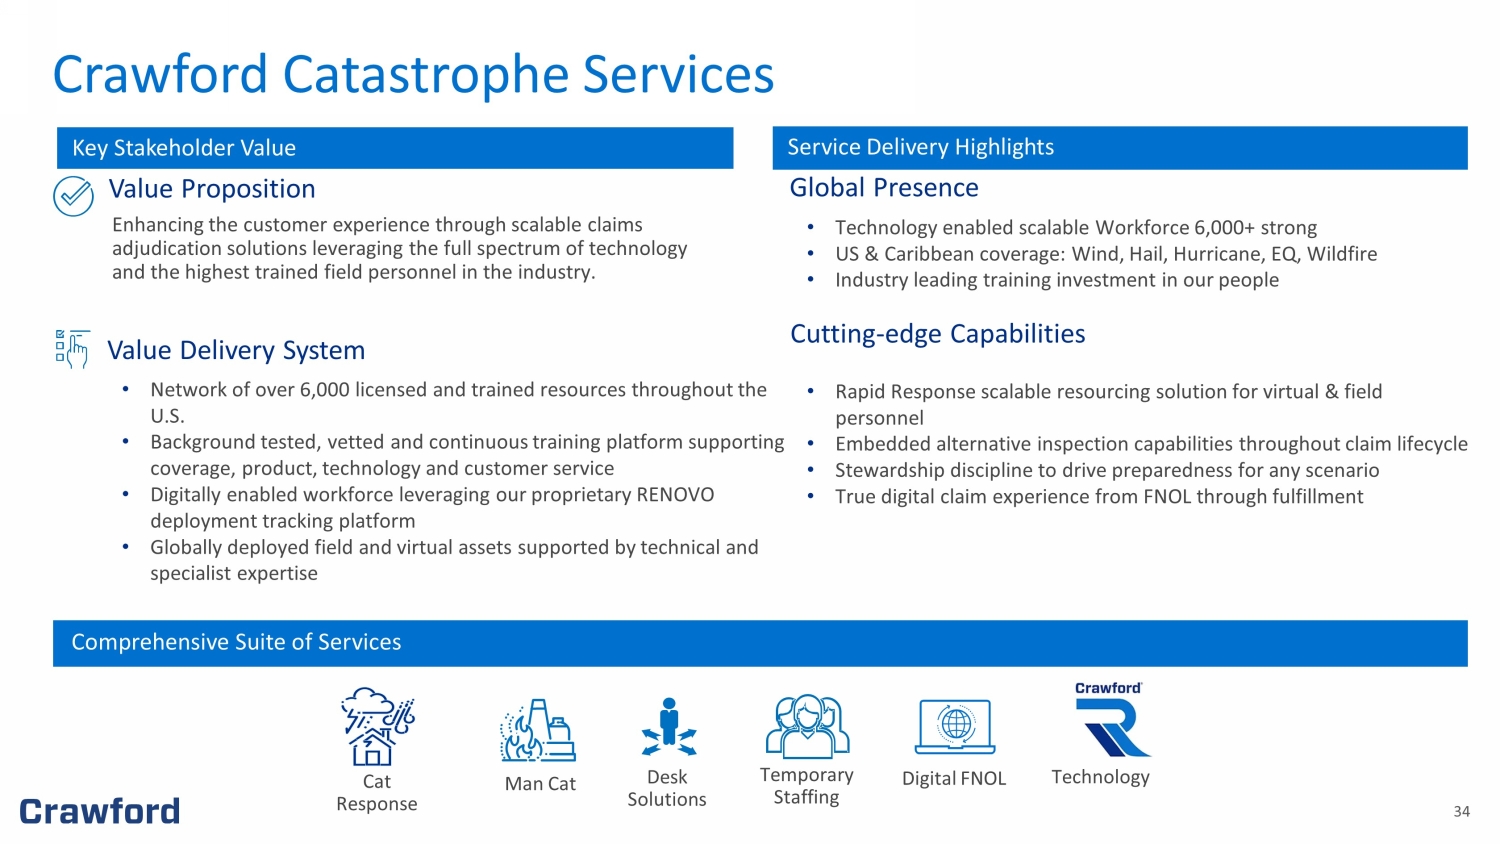
34 Enhancing the customer experience through scalable claims adjudication solutions leveraging the full spectrum of technology and the highest trained field personnel in the industry. Value Proposition Value Delivery System • Network of over 6,000 licensed and trained resources throughout the U.S. • Background tested, vetted and continuous training platform supporting coverage, product, technology and customer service • Digitally enabled workforce leveraging our proprietary RENOVO deployment tracking platform • Globally deployed field and virtual assets supported by technical and specialist expertise Comprehensive Suite of Services Global Presence Cutting - edge Capabilities • Technology enabled scalable Workforce 6,000+ strong • US & Caribbean coverage: Wind, Hail, Hurricane, EQ, Wildfire • Industry leading training investment in our people • Rapid Response scalable resourcing solution for virtual & field personnel • Embedded alternative inspection capabilities throughout claim lifecycle • Stewardship discipline to drive preparedness for any scenario • True digital claim experience from FNOL through fulfillment Technology Man Cat Desk Solutions Temporary Staffing Digital FNOL Cat Response Key Stakeholder Value Service Delivery Highlights Crawford Catastrophe Services
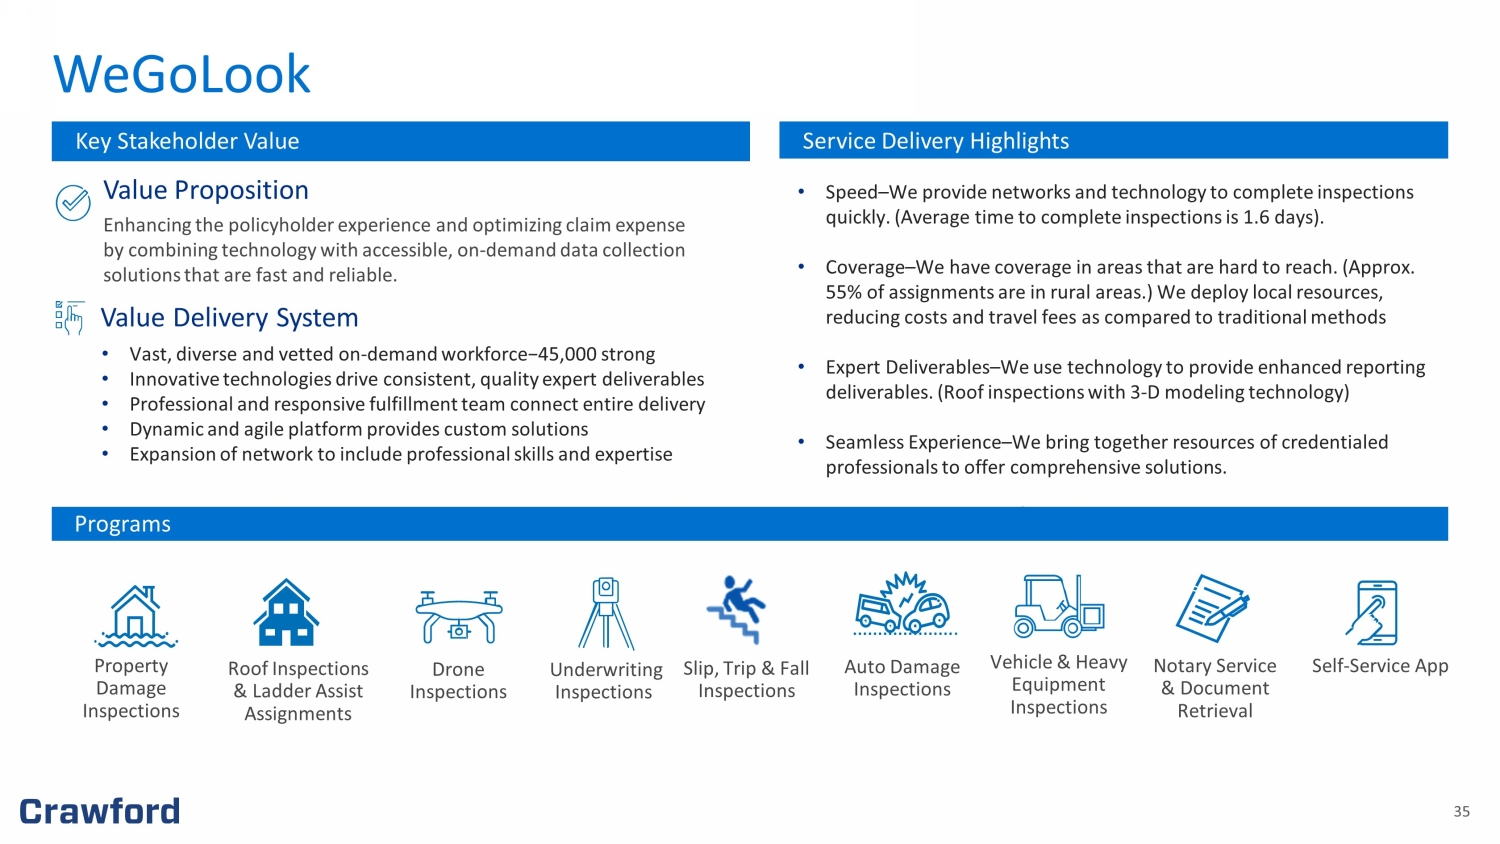
35 Enhancing the policyholder experience and optimizing claim expense by combining technology with accessible, on - demand data collection solutions that are fast and reliable. Value Proposition • Vast, diverse and vetted on - demand workforce−45,000 strong • Innovative technologies drive consistent, quality expert deliverables • Professional and responsive fulfillment team connect entire delivery • Dynamic and agile platform provides custom solutions • Expansion of network to include professional skills and expertise Value Delivery System Key Stakeholder Value Service Delivery Highlights • Speed – We provide networks and technology to complete inspections quickly. (Average time to complete inspections is 1.6 days). • Coverage – We have coverage in areas that are hard to reach. (Approx. 55% of assignments are in rural areas.) We deploy local resources, reducing costs and travel fees as compared to traditional methods • Expert Deliverables – We use technology to provide enhanced reporting deliverables. (Roof inspections with 3 - D modeling technology) • Seamless Experience – We bring together resources of credentialed professionals to offer comprehensive solutions. Programs Property Damage Inspections Auto Damage Inspections Vehicle & Heavy Equipment Inspections Slip, Trip & Fall Inspections Roof Inspections & Ladder Assist Assignments Drone Inspections Underwriting Inspections Notary Service & Document Retrieval Self - Service App WeGoLook
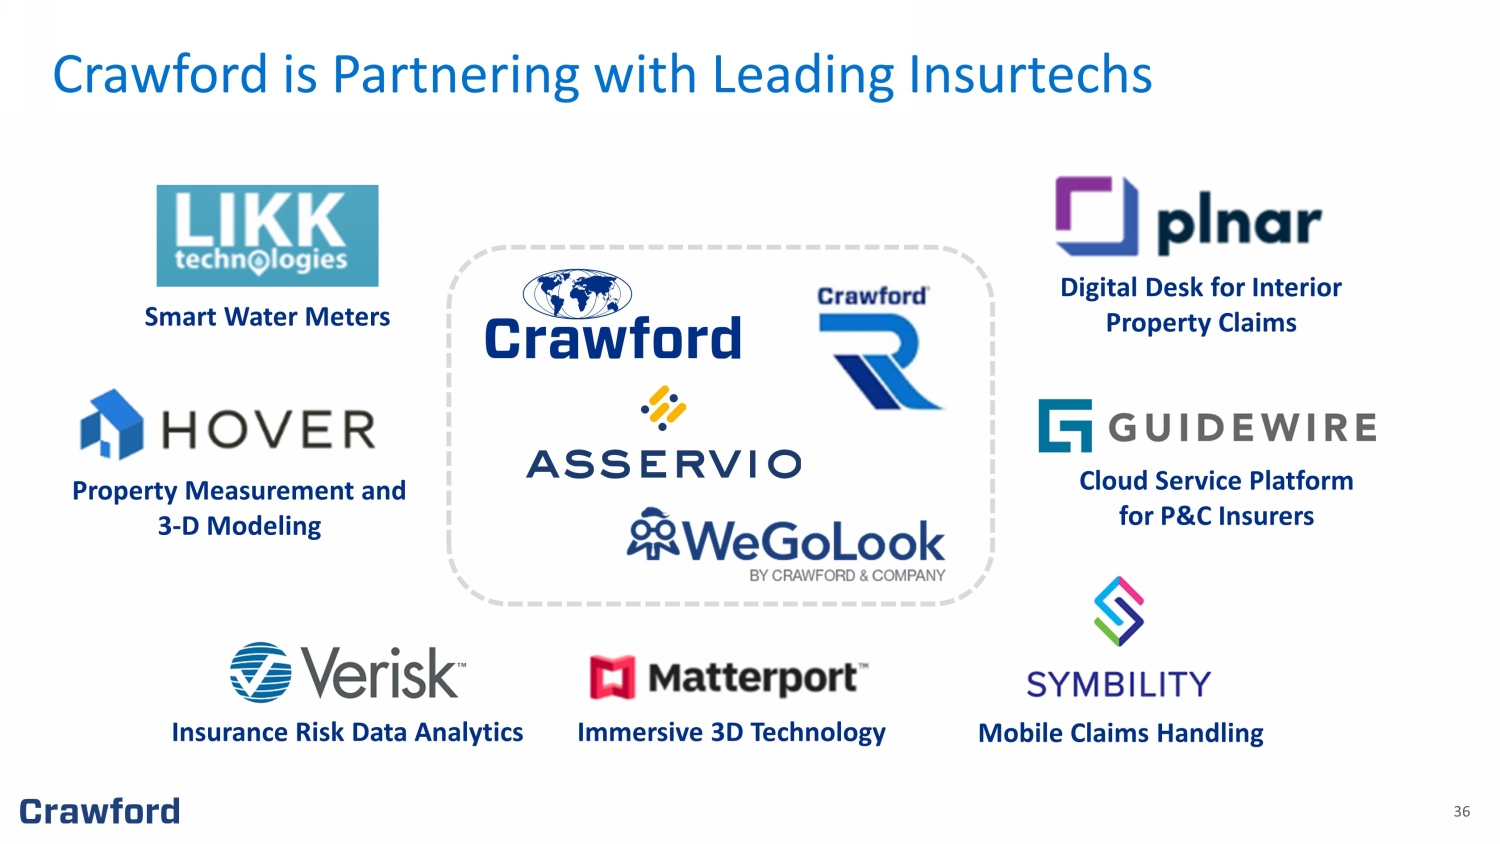
36 Smart Water Meters Property Measurement and 3 - D Modeling Digital Desk for Interior Property Claims Immersive 3D Technology Cloud Service Platform for P&C Insurers Mobile Claims Handling Insurance Risk Data Analytics Crawford is Partnering with Leading Insurtechs
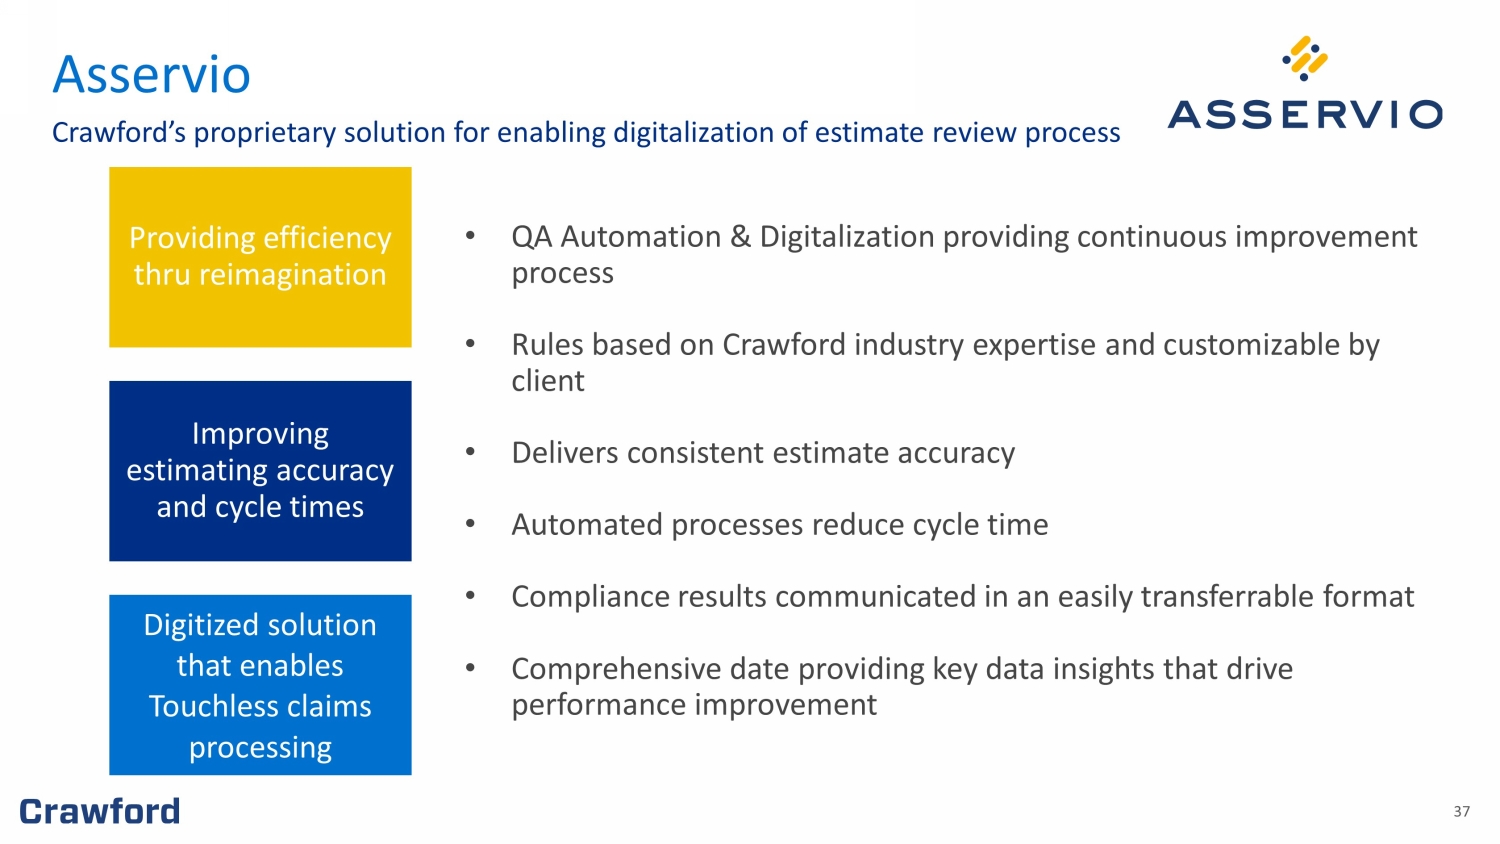
37 • QA Automation & Digitalization providing continuous improvement process • Rules based on Crawford industry expertise and customizable by client • Delivers consistent estimate accuracy • Automated processes reduce cycle time • Compliance results communicated in an easily transferrable format • Comprehensive date providing key data insights that drive performance improvement Providing efficiency thru reimagination Improving estimating accuracy and cycle times Digitized solution that enables Touchless claims processing Crawford’s proprietary solution for enabling digitalization of estimate review process Asservio

38 38 Appendix B: Non - GAAP Financial Information 38
39 Measurements of financial performance not calculated in accordance with GAAP should be considered as supplements to, and not sub stitutes for, performance measurements calculated or derived in accordance with GAAP. Any such measures are not necessarily comparable to other similar ly - titled measurements employed by other companies. Reimbursements for Out - of - Pocket Expenses In the normal course of our business, our operating segments incur certain out - of - pocket expenses that are thereafter reimbursed by our clients. Under GAAP, these out - of - pocket expenses and associated reimbursements are required to be included when reporting expenses and revenues, respectively, in our co nsolidated results of operations. In this presentation, we do not believe it is informative to include in reported revenues the amounts of reimbursed expenses and rela ted revenues, as they offset each other in our consolidated results of operations with no impact to our net income or operating earnings. As a result, unless noted in this pre sentation, revenue and expense amounts exclude reimbursements for out - of - pocket expenses. Net Debt Net debt is computed as the sum of long - term debt, capital leases and short - term borrowings less cash and cash equivalents. Man agement believes that net debt is useful because it provides investors with an estimate of what the Company's debt would be if all available cash was used to pay down the debt o f t he Company. The measure is not meant to imply that management plans to use all available cash to pay down debt . Free Cash Flow Management believes free cash flow is useful to investors as it presents the amount of cash the Company has generated that ca n b e used for other purposes, including additional contributions to the Company's defined benefit pension plans, discretionary prepayments of outstanding borrowings under our c red it agreement, and return of capital to shareholders, among other purposes. It does not represent the residual cash flow of the Company available for discretionary expenditures. Segment and Consolidated Operating Earnings Operating earnings is the primary financial performance measure used by our senior management and chief operating decision ma ker to evaluate the financial performance of our Company and operating segments and make resource allocation and certain compensation decisions. Management believes operating ea rnings is useful to others in that it allows them to evaluate segment and consolidated operating performance using the same criteria our management and chief operating decisio n m aker use. Consolidated operating earnings represent segment earnings including certain unallocated corporate and shared costs and credits, but before net corporate int ere st expense, stock option expense, amortization of customer - relationship intangible assets, goodwill impairment, restructuring and other costs, gain on disposition of businesses, income taxes and net income or loss attributable to noncontrolling interests and redeemable noncontrolling interests. Appendix: Non - GAAP Financial Information
40 Segment and Consolidated Gross Profit Gross profit is defined as revenues less direct expenses which exclude indirect overhead expenses allocated to the business. Ind irect expenses consist of centralized administrative support costs, regional and local shared services that are allocated to each segment based on usage. Adjusted EBITDA Adjusted EBITDA is used by management to evaluate, assess and benchmark our operational results and the Company believes that ad justed EBITDA is relevant and useful information widely used by analysts, investors and other interested parties. Adjusted EBITDA is defined as net income attributable to sh are holders of the Company with recurring adjustments for depreciation and amortization, net corporate interest expense, income taxes and stock - based compensation expense. Additionally, adjustments for non - recurring expenses for goodwill impairment, restructuring and other costs, and gain on disposition of businesses have been included in the calculation of adj ust ed EBITDA. Adjusted EBITDA is not a term defined by GAAP and as a result our measure of adjusted EBITDA might not be comparable to similarly titled measures used by other compan ies . Adjusted Revenue, Operating Earnings, Pretax Earnings, Net Income, Diluted Earnings per Share and EBITDA Included in non - GAAP adjusted measurements as an add back or subtraction to GAAP measurements, are impacts of amortization of cu stomer - relationship intangible assets, the goodwill impairment and loss on disposition of business, which arise from non - core items not directly related to our normal busi ness or operations, or our future performance. Management believes it is useful to exclude these charges when comparing net income and diluted earnings per share across per iod s, as these charges are not from ordinary operations. Appendix: Non - GAAP Financial Information (cont.)
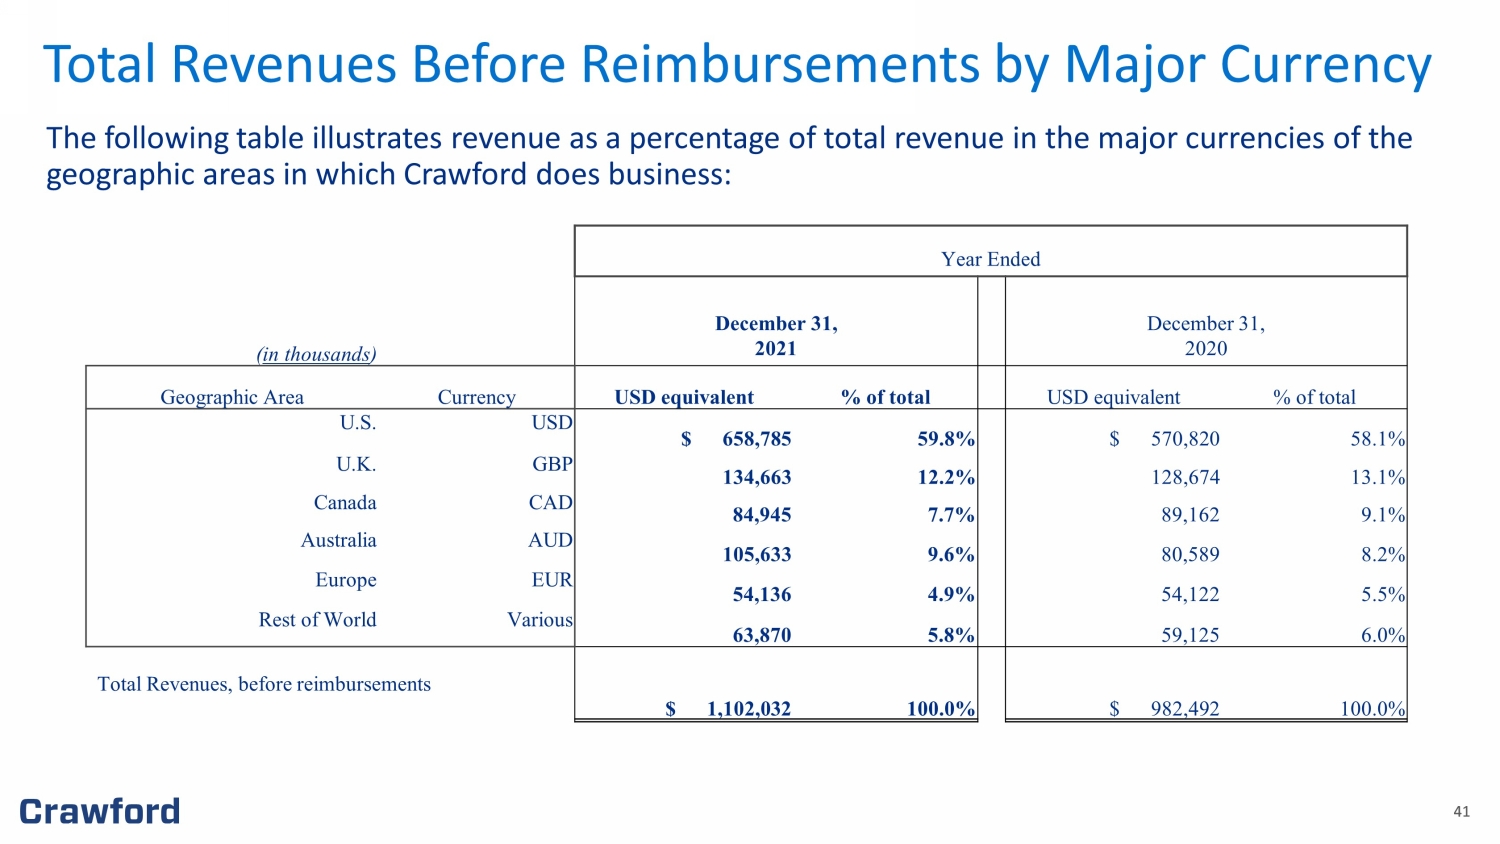
41 41 Total Revenues Before Reimbursements by Major Currency The following table illustrates revenue as a percentage of total revenue in the major currencies of the geographic areas in which Crawford does business: Year Ended ( in thousands ) December 31, 2021 December 31, 2020 Geographic Area Currency USD equivalent % of total USD equivalent % of total U.S. USD $ 658,785 59.8% $ 570,820 58.1% U.K. GBP 134,663 12.2% 128,674 13.1% Canada CAD 84,945 7.7% 89,162 9.1% Australia AUD 105,633 9.6% 80,589 8.2% Europe EUR 54,136 4.9% 54,122 5.5% Rest of World Various 63,870 5.8% 59,125 6.0% Total Revenues, before reimbursements $ 1,102,032 100.0% $ 982,492 100.0%
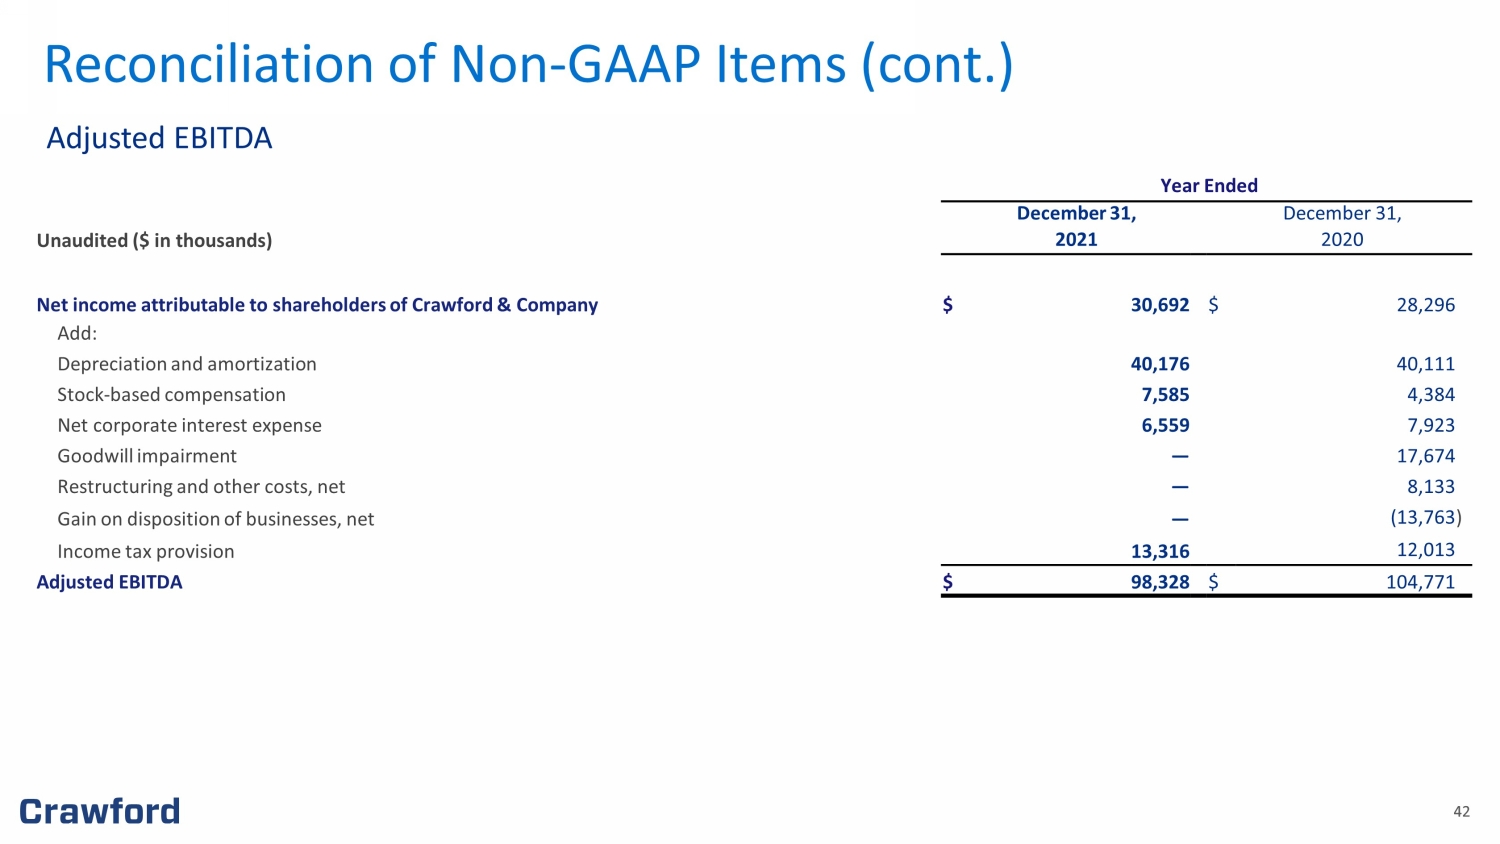
42 42 Reconciliation of Non - GAAP Items (cont.) Adjusted EBITDA ) Year Ended December 31 , December 3 1 , Unaudited ($ in thousands) 20 21 20 20 Net income attributable to shareholders of Crawford & Company $ 30,692 $ 28,296 Add: Depreciation and amortization 40,176 40,111 Stock - based compensation 7,585 4,384 Net corporate interest expense 6,559 7,923 Goodwill impairment — 17,674 Restructuring and other costs, net — 8,133 Gain on disposition of businesses, net — (13,763 ) Income tax provision 13,316 12,013 Adjusted EBITDA $ 98,328 $ 104,771
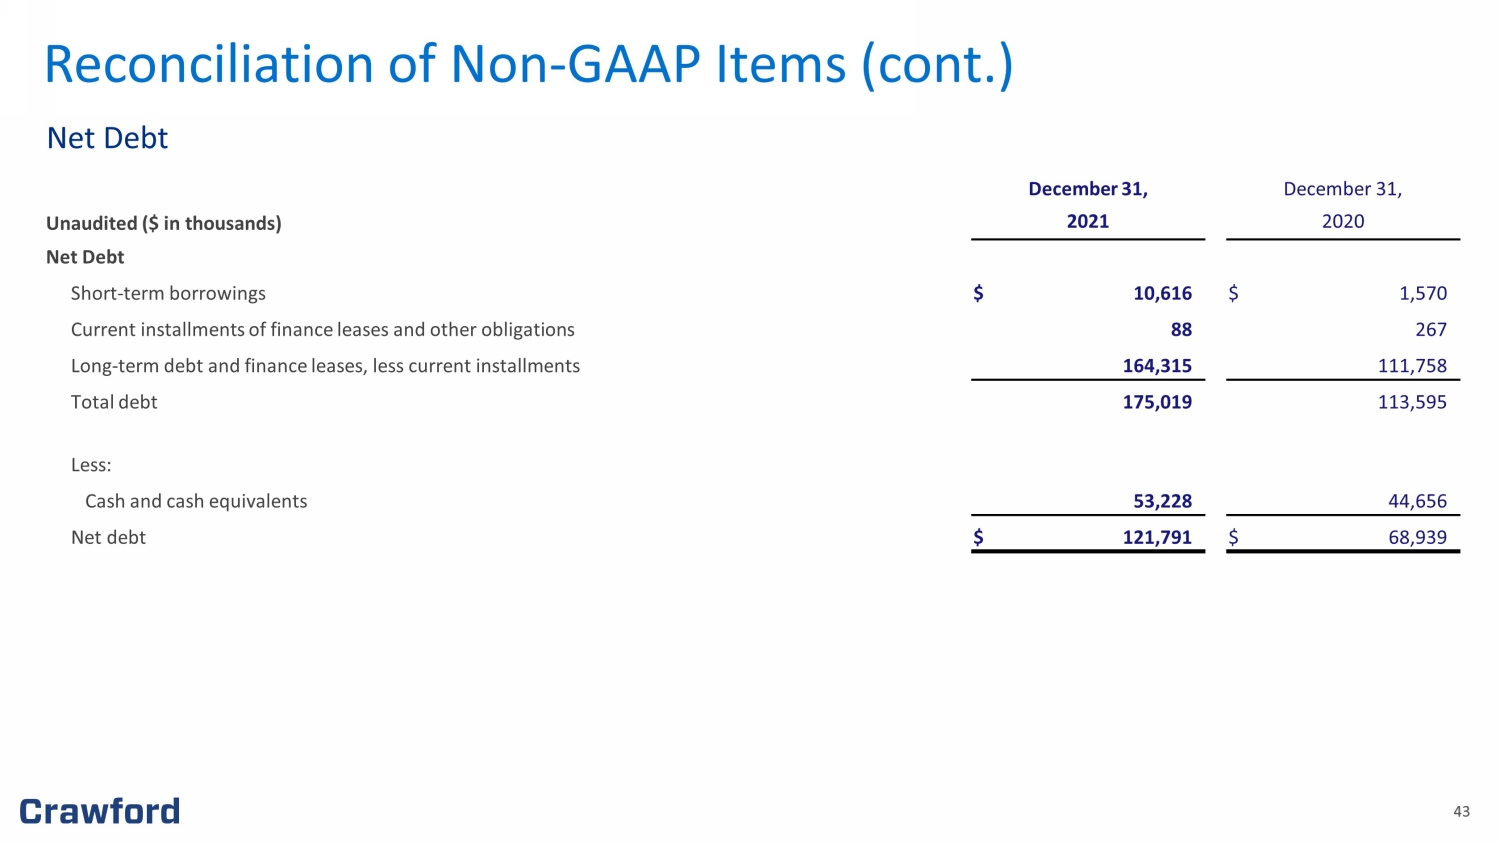
43 43 Reconciliation of Non - GAAP Items (cont.) Net Debt December 31 , December 31, Unaudited ($ in thousands) 20 21 20 20 Net Debt Short - term borrowings $ 10,616 $ 1,570 Current installments of finance leases and other obligations 88 267 Long - term debt and finance leases, less current installments 164,315 1 11 , 758 Total debt 175,019 1 13 , 595 Less: Cash and cash equivalents 53,228 44,656 Net debt $ 121,791 $ 68,939
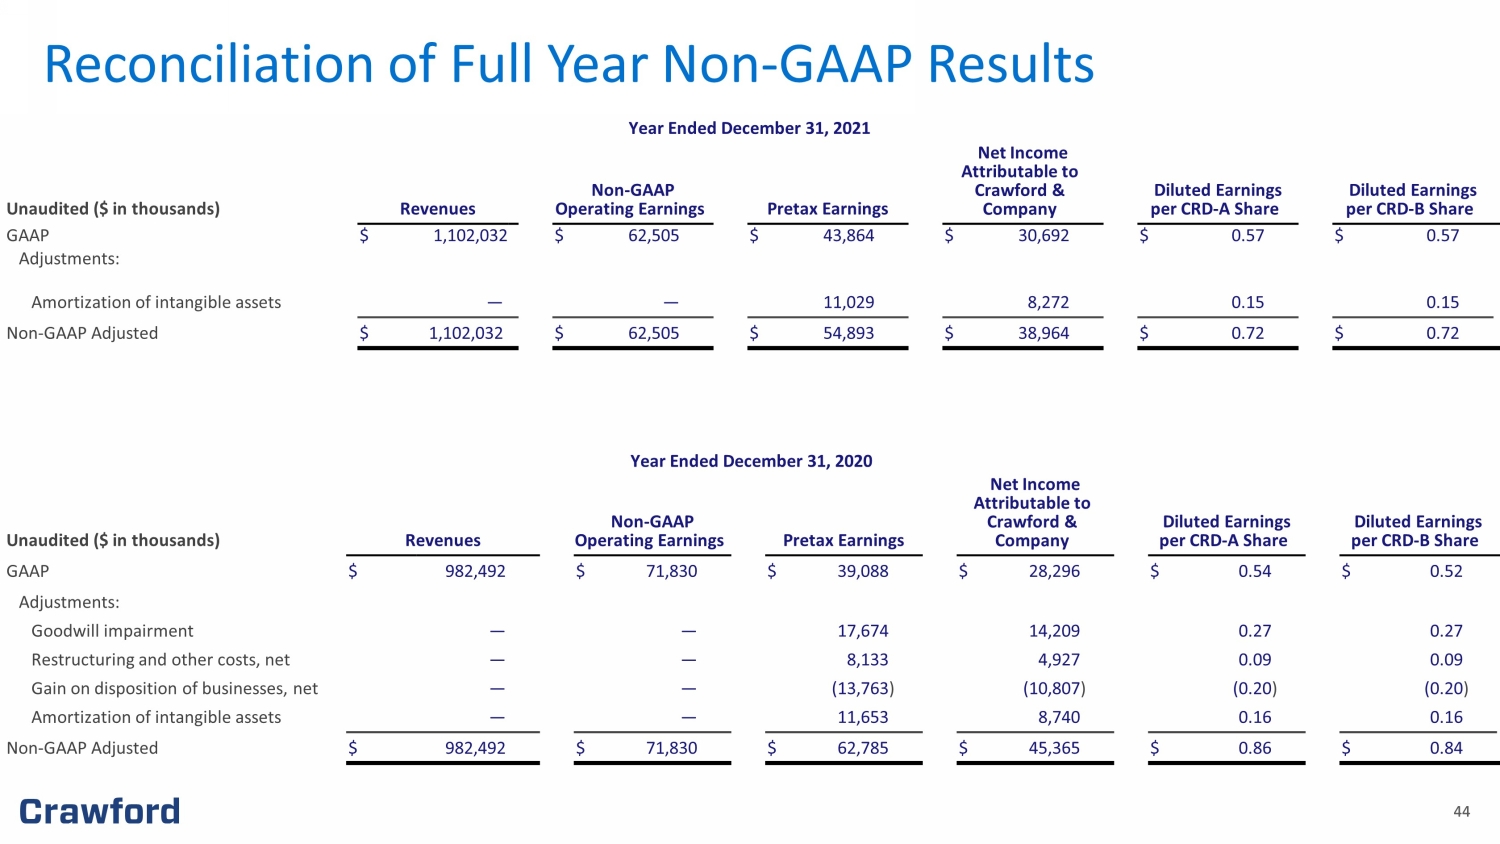
44 44 Reconciliation of Full Year Non - GAAP Results Year Ended December 3 1 , 20 21 Unaudited ($ in thousands) Revenues Non - GAAP Operating Earnings Pretax Earnings Net Income Attributable to Crawford & Company Diluted Earnings per CRD - A Share Diluted Earnings per CRD - B Share GAAP $ 1,102,032 $ 62,505 $ 43,864 $ 30,692 $ 0. 57 $ 0. 57 Adjustments: Amortization of intangible assets — — 11,029 8,272 0. 15 0. 15 Non - GAAP Adjusted $ 1,102,032 $ 62,505 $ 54,893 $ 38,964 $ 0. 72 $ 0. 72 Year Ended December 3 1 , 20 20 Unaudited ($ in thousands) Revenues Non - GAAP Operating Earnings Pretax Earnings Net Income Attributable to Crawford & Company Diluted Earnings per CRD - A Share Diluted Earnings per CRD - B Share GAAP $ 982,492 $ 71,830 $ 39,088 $ 28,296 $ 0.54 $ 0.52 Adjustments: Goodwill impairment — — 17,674 14,209 0.27 0.27 Restructuring and other costs, net — — 8,133 4,927 0.09 0.09 Gain on disposition of businesses, net — — (13,763 ) (10,807 ) (0.20 ) (0.20 ) Amortization of intangible assets — — 11,653 8,740 0.16 0.16 Non - GAAP Adjusted $ 982,492 $ 71,830 $ 62,785 $ 45,365 $ 0. 86 $ 0.84