 the STRENGTH of WORKING TOGETHER SM Exhibit 99.1 Analyst Day New York Stock Exchange November 21, 2008 |
 2 Forward-looking Statements and Segment Operating Earnings Forward Looking Statements: This presentation contains forward-looking statements, including statements about the future financial condition, results of operations and earnings outlook of Crawford & Company. Statements, both qualitative and quantitative, that are not historical facts may be “forward-looking” statements as defined in the Private Securities Litigation Reform Act of 1995. Forward-looking statements involve a number of risks and uncertainties that could cause actual results to differ materially from historical experience or Crawford & Company’s present expectations. Accordingly, no one should place undue reliance on forward-looking statements, which speak only as of the date on which they are made. Crawford & Company does not undertake to update forward-looking statements to reflect the impact of circumstances or events that may arise or not arise after the date the forward-looking statements are made. For further information regarding Crawford & Company, and the risks and uncertainties involved in forward- looking statements, please read Crawford & Company’s reports filed with the United States Securities and Exchange Commission and available at www.sec.gov or in the Investor Relations section of Crawford & Company’s website at www.crawfordandcompany.com. Consolidated Operating Earnings: Consolidated operating earnings, a non-GAAP measurement, represent earnings before net corporate interest expense, amortization of customer-relationship intangible assets, stock option expense, income tax expense, gains on asset sales and certain other expenses. Segment Operating Earnings: Under Statement of Financial Accounting Standards Number 131, Disclosures about Segments of an Enterprise and Related Information, segment operating earnings is the primary measure used by the company to evaluate the results of each of its four operating segments. Segment operating earnings exclude income taxes, interest expense, amortization of customer-relationship intangible assets, and certain other nonrecurring gains and expenses. On January 1, 2008 the Company’s Strategic Warranty Services unit was moved from the Legal Settlement Administration segment to the U.S. Property & Casualty segment. Prior period results for both segments have been restated to reflect this transfer. Subsequent to March 31, 2007, the Company changed its method of allocating certain corporate overhead costs to each of its operating segments. Prior period results have been restated to reflect the current allocation method. Reimbursements for Out-of-Pocket Expenses: All amounts included herein for consolidated revenues and consolidated operating margin as well as segment revenues, segment operating expenses and segment operating margin are based on amounts that exclude reimbursements for out-of-pocket expenses. The Strength of Working Together SM |
 the STRENGTH of WORKING TOGETHER SM Overview Jeffrey T. Bowman President and Chief Executive Officer November 21, 2008 |
 4 Agenda • Overview • Financials • International Operations • U.S. Property & Casualty • Broadspire • Legal Settlement Administration • Summary The Strength of Working Together SM |
 5 Crawford is “Positioned for Growth” • Access to growing global markets • Increasing market share both domestically and internationally • Crawford expects to benefit from global consolidation of TPA vendors • Diverse, high quality customer base • High customer retention rates • Emphasis on quality and value provided sustains client confidence • Disciplined management • Improving financial performance • Consolidated revenues, earnings, margins, and cash flows improving in 2008 • Investment in enhanced technology in all divisions The Strength of Working Together SM |
 6 Crawford & Company • World’s largest fully-integrated independent provider of global claims management solutions. • Four reporting segments: – International Operations • Serves the global insurance industry and multi-national corporations – U.S. Property & Casualty • Serves the U.S. insurance company market – Broadspire • Serves large national accounts, carriers and self- insured entities – Legal Settlement Administration • Provides administration for class action settlements, bankruptcy matters, and product performance. OUR MARKET- LEADING GLOBAL BUSINESS The Strength of Working Together SM |
 7 Class Actions Administration & Bankruptcy Warranty CAT Marine & Transport TPA Workers Compensation Medical and Case Management (Broadspire) Property Casualty Motor & Auto What we do…Our Global Products and Services The Crawford System of Claims Solutions Contractor Connection The Strength of Working Together SM |
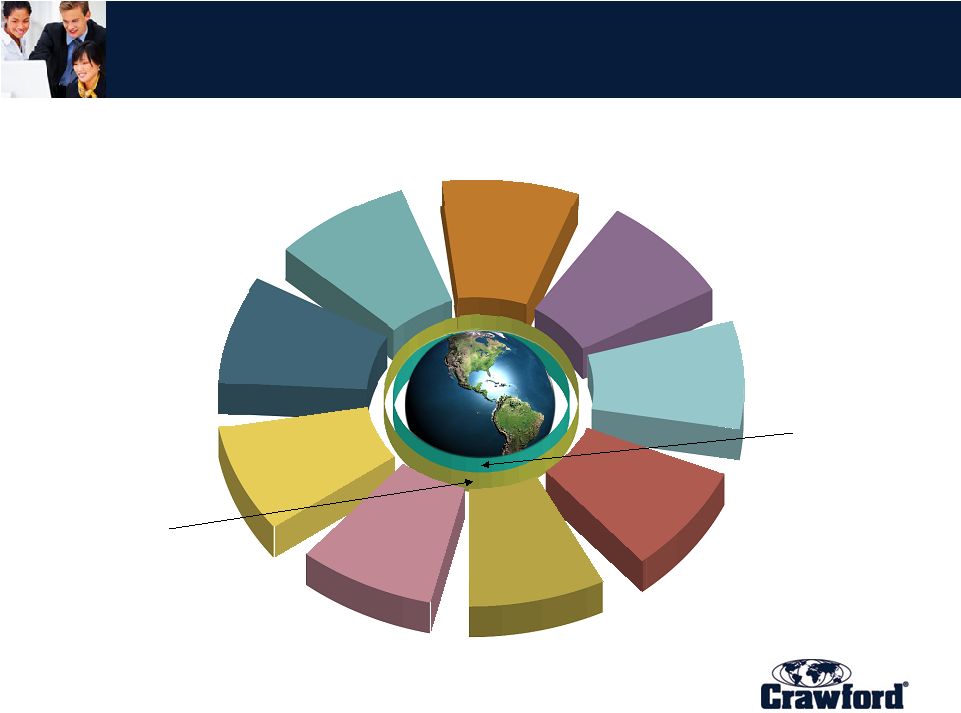
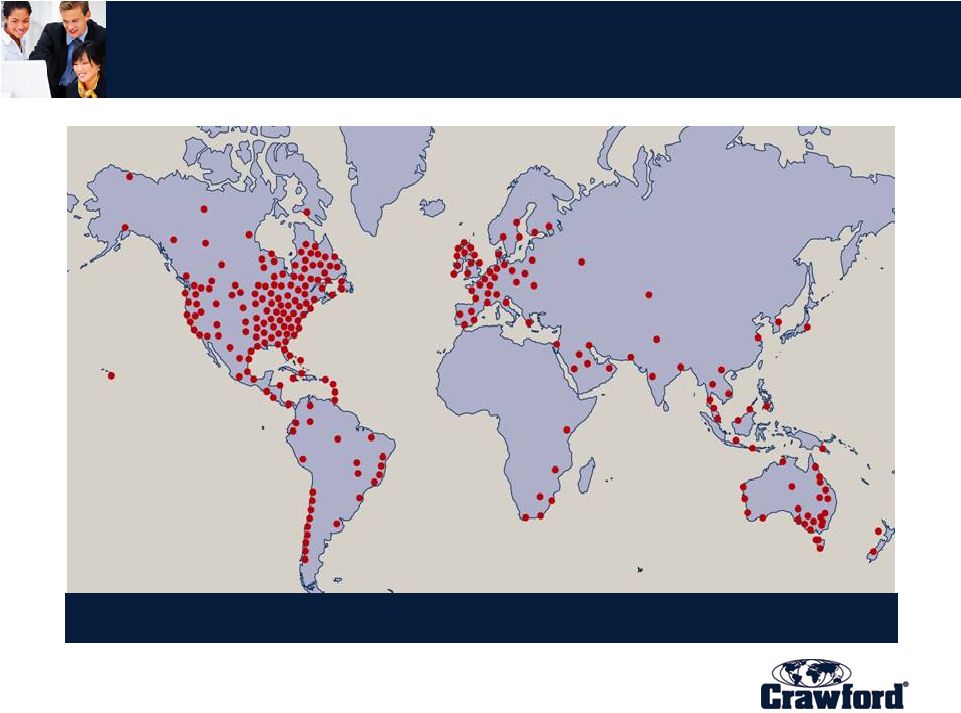 8 Where We Do It : Locations Across a Global Economy More than 700 locations in 63 countries The Strength of Working Together SM |
 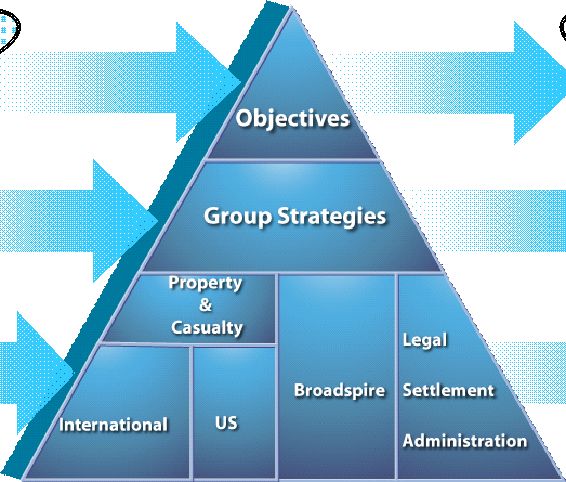   9 The Strength of Working Together Improved Financial Results Sustainable Performance Improvement Business Unit Strategies Improved Financial Contribution Across all Business Units Target Driven Changes to Achieve Group Objectives The Strength of Working Together SM |
 10 Strategies to Meet the Demands of our Clients, Employees and Shareholders • Brand and reputation through quality • Global footprint • Broad product offering • Industry experts • Building a performance driven workplace • Executing a sound business strategy Strong Demand The Strength of Working Together SM |
 11 Non-Life Premium Income Analysis “a Major Driver’ Global segmentation in the Non-Life Premium Income market drives our strategy • U.S. largest market • Potential to increase penetration of clients in Europe • Growing market in Asia Pacific Source: Crawford & Company The Strength of Working Together SM % to total Market 2006 Total 99.3% * U.S.: 42.0% International: 57.3% includes: CEMEA: 29.9% Asia Pacific: 14.3% U.K.: 7.1% Americas (non U.S.) 6.0% *Percent of total global market served by Crawford |
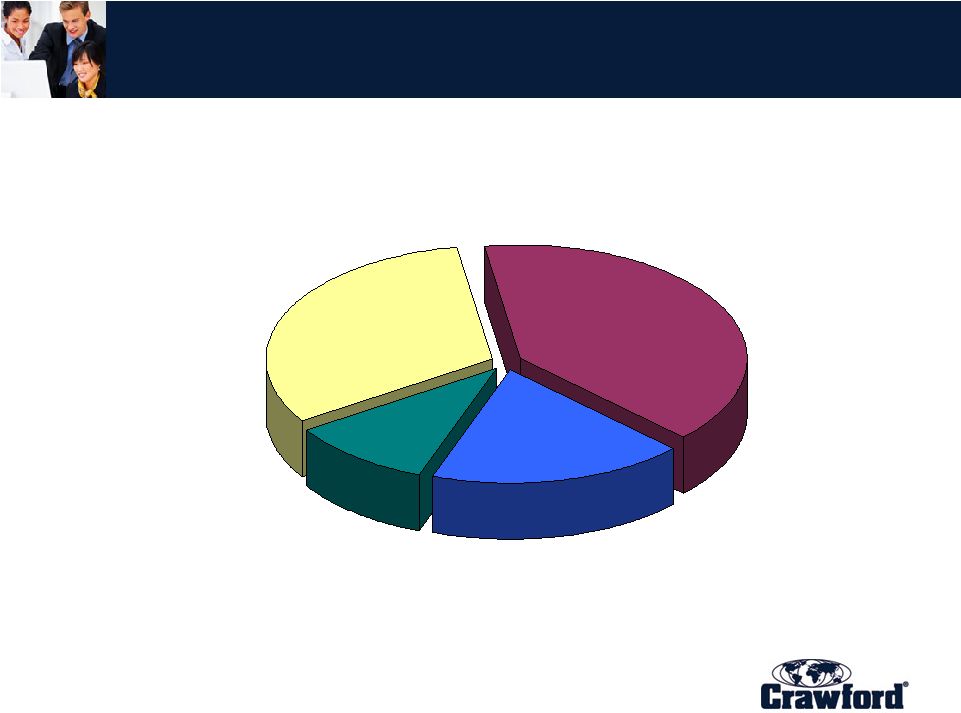 12 A Diversified Portfolio of Business 2008 Revenues before Reimbursements of $786 Million for nine months ended September 30, 2008 • Property and Casualty Services • Global Technical Services • Global Marine and Transportation • Global Markets 42.7% 30.0% 7.3% International Ops. U.S. Property & Casualty • Property and Casualty Services • Catastrophe Management Services • Auto Appraisal Services • Centralized Claim Administration • Strategic Warranty Services 20.0% Legal Settlement Administration • Class Actions – Securities – Product Liability • Bankruptcy Administration Broadspire • Workers’ Compensation and Liability Claims Administration • Medical and Case Management • Long-Term Care Services • Integrated Disability Management • Risk Management Information Systems (RSG) • Claim Triage Solution (e-Triage) The Strength of Working Together SM |
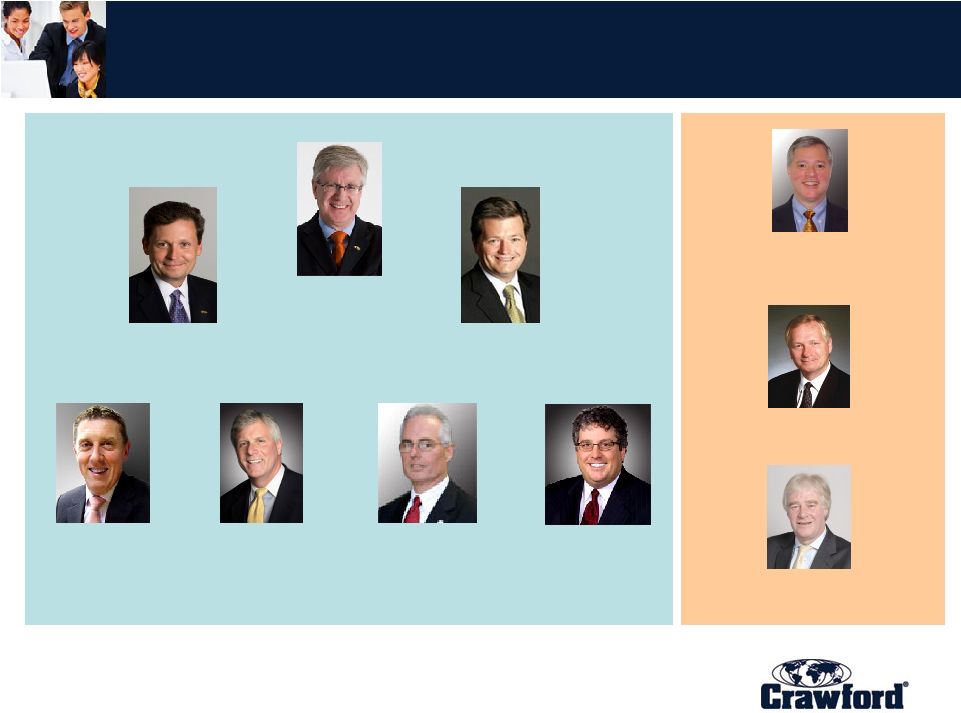 13 Global Executive Management Team Bruce Swain Chief Financial Officer Jeffrey T. Bowman President & CEO Ian Muress Property & Casualty EMEA & Asia Pacific Kevin Frawley Property & Casualty Americas David Isaac Legal Settlement Administration Allen W. Nelson General Counsel, Corporate Secretary and Chief Administrative Officer Ken Martino Broadspire Mike Reeves Global Markets Brian Flynn Information & Communication Technology Glenn Gibson Strategy, Projects & Development The Strength of Working Together SM |
 the STRENGTH of WORKING TOGETHER SM Financial Review Bruce Swain Chief Financial Officer November 21, 2008 |
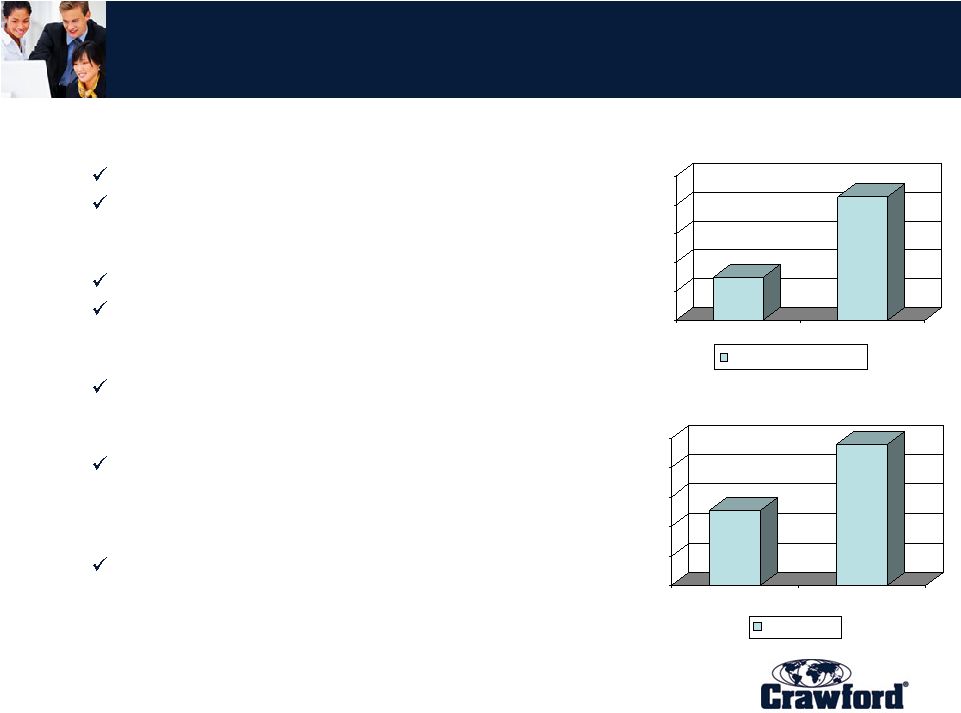
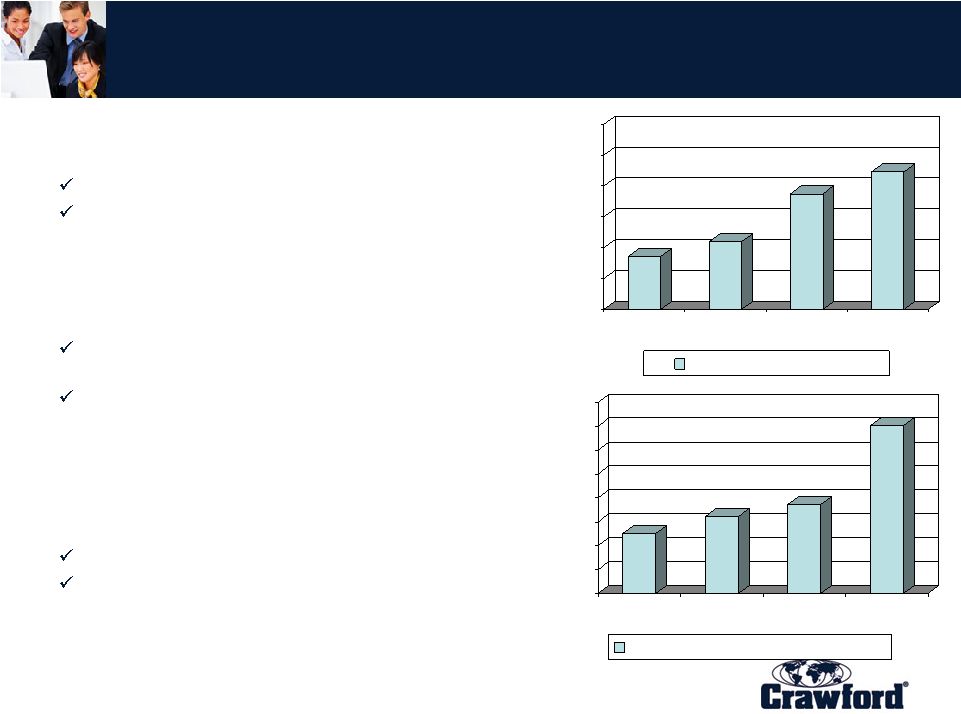 15 Four year Crawford Financial Performance • Improving performance in a difficult operating environment Revenue CAGR of 10.6% from 2005 to 2008 Operating earnings CAGR of 41.0% from 2005 to 2008 • Strong revenue growth internationally aided by impact of Broadspire acquisition International growth (before currency effects) of 8.7% Fourth quarter 2006 acquisition of Broadspire Services Inc. added approximately $200 million in 2007 revenue • Focus on cost control drives incremental margin Continued margin expansion internationally Turnaround in U.S. Property & Casualty $600 $700 $800 $900 $1,000 $1,100 $1,200 2005 2006 2007 2008* Consolidated Revenue $ in millions $0 $10 $20 $30 $40 $50 $60 $70 $80 2005 2006 2007 2008* Consolidated Operating Earnings $ in millions 772 •Full year estimate based on midpoint of 2008 guidance provided Nov. 3, 2008 820 975 1,045 25 32 37 70 The Strength of Working Together SM |
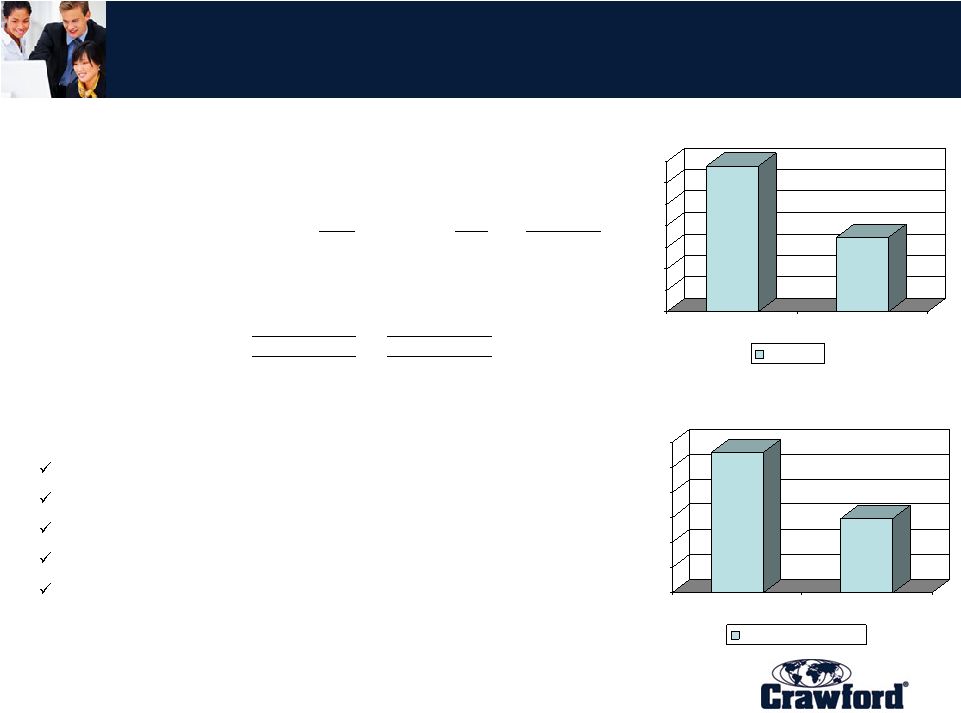
 16 Financial Overview for the nine months ended September 30, 2008 • Strong performance for the year to date... Revenue growth of 7.6% Net income up 86.7% • Led by operational improvements... Operating earnings up over 100% Operating margin up 320 basis points • And cost control initiatives... SG&A down 140 basis points as a percent of sales • Have produced solid earnings/share growth... EPS performance of $0.47 compared with $0.14 before gains on asset sales in 2007 • And supporting strong cash flow. Cash flow from operations improved year over year by $29 million for the nine month period ended September 30, 2008 $700 $720 $740 $760 $780 $800 YTD 2007 YTD 2008 Consolidated Revenue $ in millions $ in millions $785.7 $729.9 $23.9 $12.8 The Strength of Working Together SM $0 $5 $10 $15 $20 $25 YTD 2007 YTD 2008 Net Income |
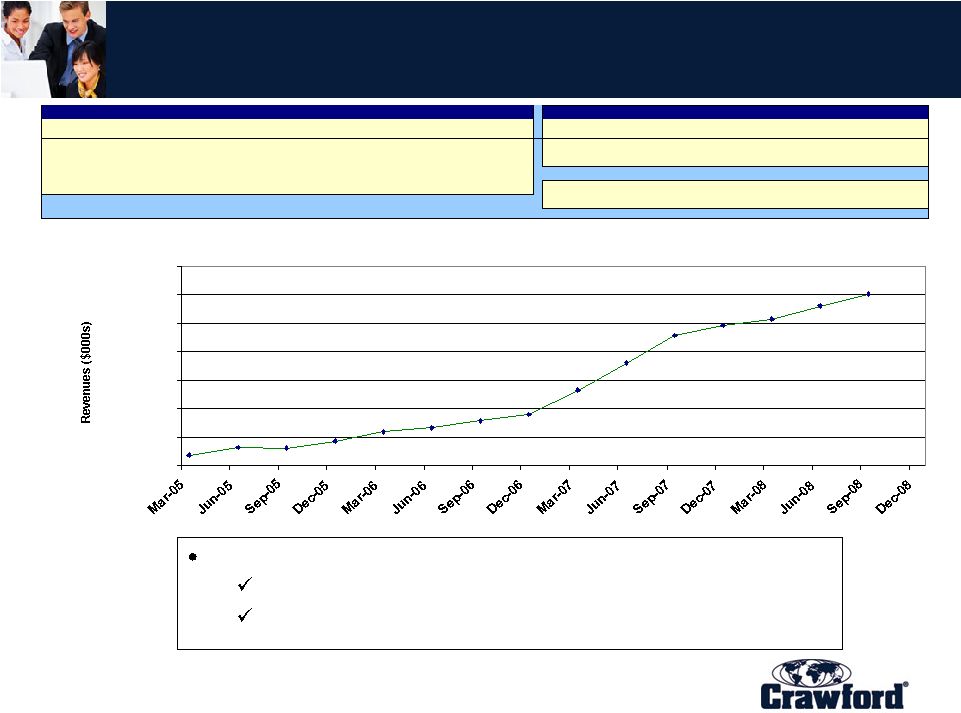 17 Consolidated Revenue (Trailing 12 months) The Strength of Working Together SM As of September 2008 ($000s) 2008 Actual 2007 Actual 2006 Actual 2005 Actual 2008/2007 2007/2006 2006/2005 1st Quarter 987,046 861,524 789,255 748,046 As of September 30 8% 19% 6% 2nd Quarter 1,009,775 909,458 795,856 762,033 FULL YEAR 19% 6% 3rd Quarter 1,030,917 958,174 808,194 760,882 4th Quarter 975,143 819,522 771,983 NOTES: Revenues are measured as total revenue before reimbursements for client expenses. 12-Month Moving Total Revenue Average Annual Rate of Change - 12 Month Moving Total 12-Month Moving Revenue 730,000 780,000 830,000 880,000 930,000 980,000 1,030,000 1,080,000 Growth led by: Strong organic growth internationally Incremental revenues from Broadspire acquisition |
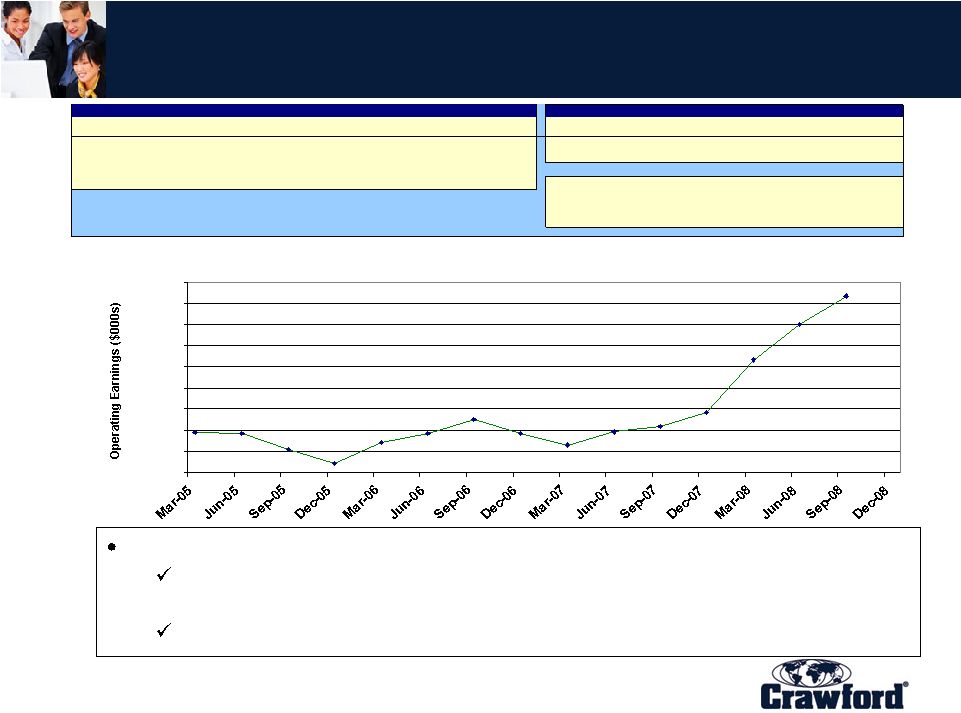 18 Consolidated Operating Earnings (Trailing 12 months) The Strength of Working Together SM As of September 2008 ($000s) 2008 Actual 2007 Actual 2006 Actual 2005 Actual 2008/2007 2007/2006 2006/2005 1st Quarter 49,540 29,399 30,221 32,473 As of September 30 91% 20% 27% 2nd Quarter 57,963 32,617 32,233 32,248 FULL YEAR 48% 28% 3rd Quarter 64,616 33,845 35,667 28,132 4th Quarter 37,230 32,195 25,085 NOTES: Operating earnings (loss) is defined as earnings before special charges/credits, net corporate interest, income taxes, stock option expense, and amortization of acquisition related intangible assets. 12-Month Moving Operating Earnings Average Annual Rate of Change - 12 Month Moving Total 12-Month Moving Operating Earnings 23,000 28,000 33,000 38,000 43,000 48,000 53,000 58,000 63,000 68,000 Operating earnings improvement generated through: Leverage of cost base in International Operations and U.S. Property & Casualty Post acquisition synergies from Broadspire |
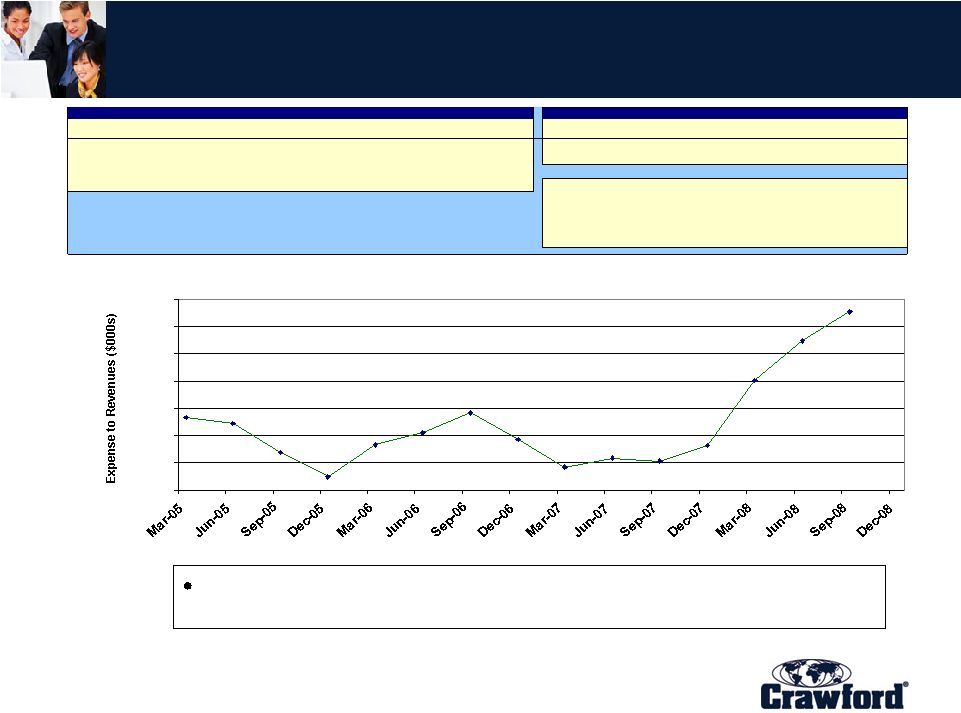 19 Consolidated Operating Margin (Trailing 12 Months) The Strength of Working Together SM As of September 2008 ($000s) 2008 Actual 2007 Actual 2006 Actual 2005 Actual 2008/2007 2007/2006 2006/2005 1st Quarter 5.02% 3.42% 3.83% 4.34% As of September 30 2.74% -0.88% 0.72% 2nd Quarter 5.74% 3.59% 4.05% 4.23% FULL YEAR -0.11% 0.68% 3rd Quarter 6.27% 3.53% 4.41% 3.70% 4th Quarter 3.82% 3.93% 3.25% NOTES: Operating earnings (loss) is defined as earnings before special charges/credits, net corporate interest, income taxes, stock option expense, and amortization of acquisition related intangible assets. Revenues are measured as total revenue before reimbursements for client expenses. 12-Month Moving Total Ratio Average Annual Rate of Change - 12 Month Moving Total 12-Month Moving Ratio 3.00% 3.50% 4.00% 4.50% 5.00% 5.50% 6.00% 6.50% Over 300 basis point improvement from year end 2005 |
 20 September 30, 2008) net of cash and cash equivalents. ($50,855 at December 31, 2007 and $56,819 at September 30, 2008). September 30, 2008 Balance Sheet The Strength of Working Together SM Crawford & Company Consolidated Balance Sheet Highlights As of September 30, 2008 and December 31, 2007 In thousands, except percentages Unaudited September 30, December 31, 2008 2007 Change Cash and cash equivalents $56,819 $50,855 $5,964 Accounts receivable, net 178,429 178,528 (99) Unbilled revenues 131,752 136,652 (4,900) Total receivables 310,181 315,180 (4,999) Deferred revenues, net 99,567 111,036 (11,469) Accrued pension liabilities 52,190 76,977 (24,787) Current portion of long-term debt, capital leases and short-term borrowings 30,199 31,864 (1,665) Long-term debt 181,790 183,449 (1,659) Total debt 211,989 215,313 (3,324) Total sharehoholders' equity 281,822 254,215 27,607 Net debt* 155,170 164,458 (9,288) Total debt / capitalization 43% 46% *Net debt, a non-GAAP measure, is defined by the Company as total debt ($215,313 at December 31, 2007 and $211,989 at |
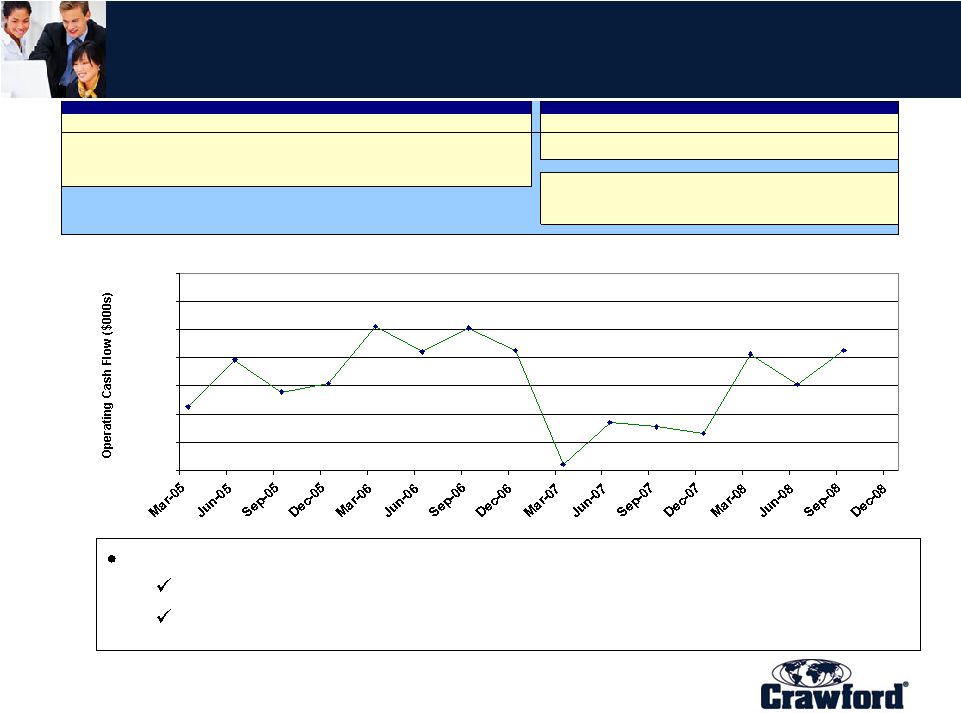 21 Consolidated Operating Cash Flow (Trailing 12 Months) The Strength of Working Together SM As of September 2008 ($000s) 2008 Actual 2007 Actual 2006 Actual 2005 Actual 2008/2007 2007/2006 2006/2005 1st Quarter 51,372 11,989 61,066 32,526 As of September 30 105% -58% 2nd Quarter 40,619 27,204 52,017 49,173 FULL YEAR -56% 29% 3rd Quarter 52,537 25,585 60,539 37,936 4th Quarter 23,284 52,717 40,761 NOTES: Operating cash flow is defined as consolidated cash flows from operations. 12-Month Moving Operating Cash Flow Average Annual Rate of Change - 12 Month Moving Total 12-Month Moving Operating Cash Flow 10,000 20,000 30,000 40,000 50,000 60,000 70,000 80,000 Operating cash flow improved through: Focus on working capital management Reduction in Days Sales Outstanding (DSO) |
 the STRENGTH of WORKING TOGETHER SM International Operations Ian V. Muress Chief Executive Officer, Property & Casualty - EMEA & Asia-Pacific |
 23 $200 $220 $240 $260 $280 $300 $320 $340 YTD 2008 YTD 2007 Revenue $0 $5 $10 $15 $20 $25 $30 YTD 2008 YTD 2007 Operating Earnings $ in millions $ in millions $335.5 $269.3 $28.0 $14.8 An expanding business, the growth engine of Crawford Revenue up 16.8% on a constant dollar basis YTD 42% of consolidated revenues in 2008 YTD Increased operating margin and sustained earnings growth YTD Strength in UK, Canada, and Asia Pacific Year-to-Date International Operations Results The Strength of Working Together SM Summary Results, International Operations For the nine months ended September 30, 2008 and 2007 in Thousands Except Percentages Unaudited 2008 2007 % Change Revenues 335,505 $ 269,330 $ 24.6% Total Operating Expenses 307,478 254,520 20.8% Operating Earnings 28,027 $ 14,810 $ 89.2% Operating Margin 8.4% 5.5% |
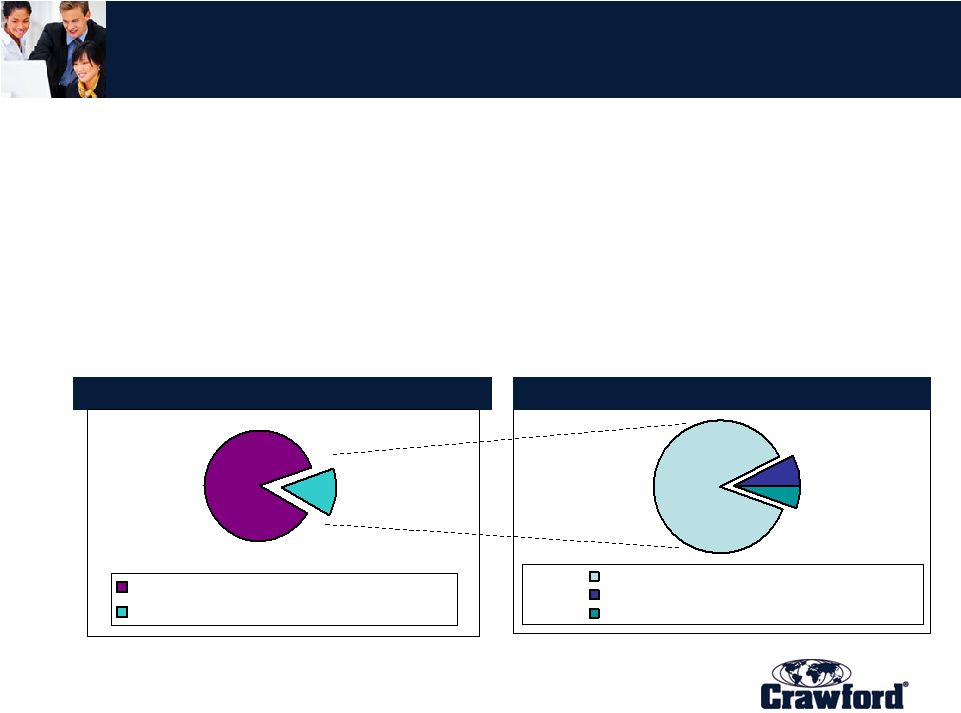
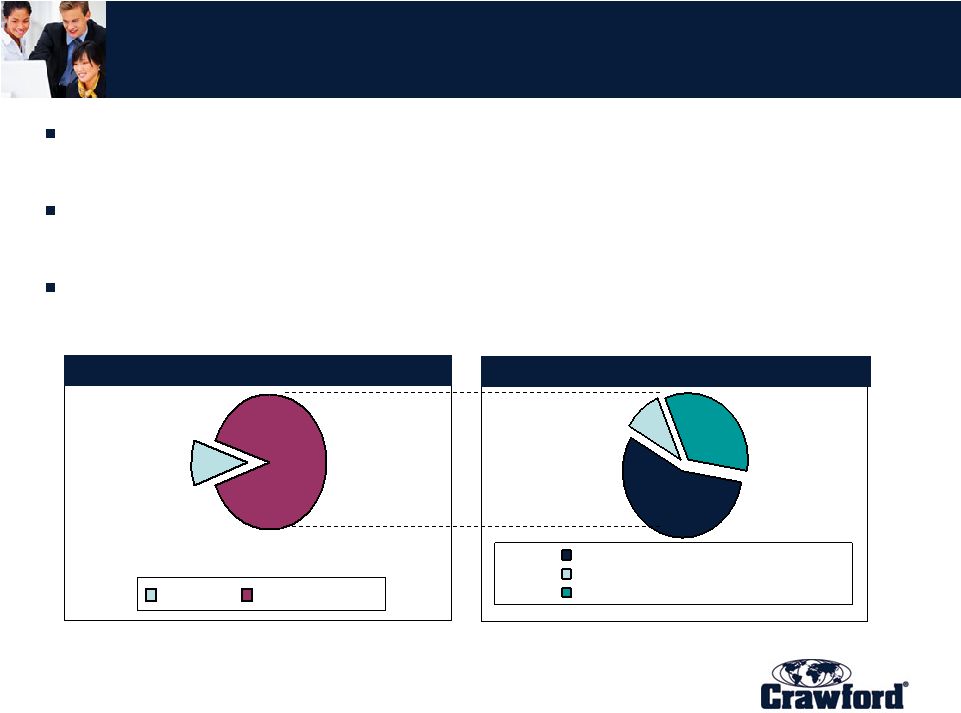
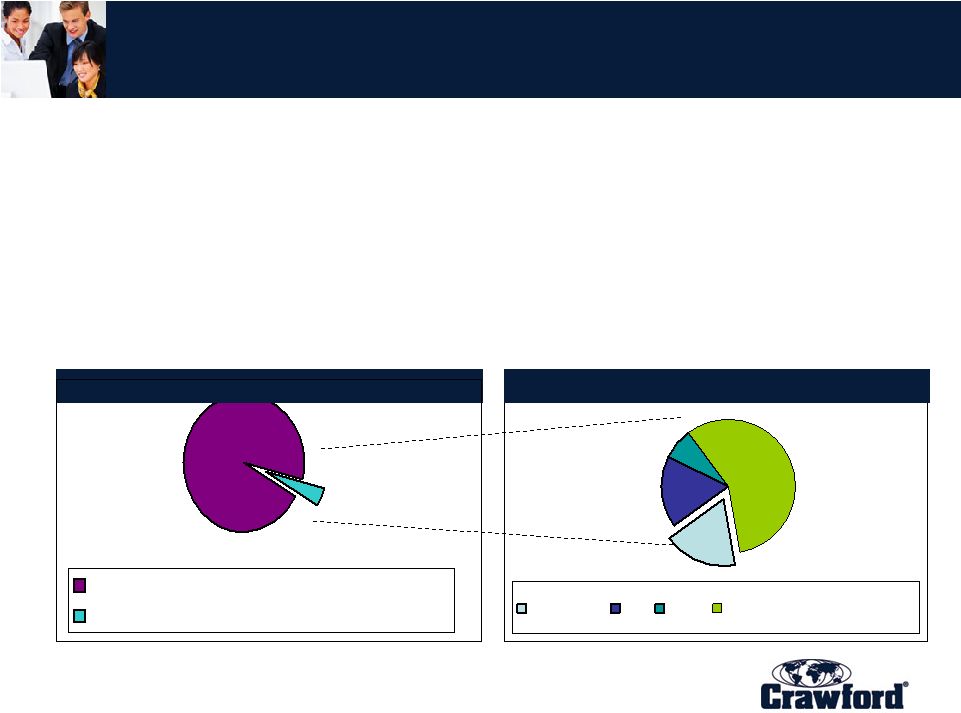 24 International Property & Casualty Insurance Market (excluding U.S.) Crawford CL GAB Regional/Local Providers ROW Unallocated Loss Adjusting Expenses $41.1 Billion 95.6% $1.9 Billion 4.4% $1.053 Billion 55.6% $140 Million 7.3% ROW Outsourced Loss Adjusting Expenses $377 Million 19.8% Source: Crawford & Company $330 Million 17.3% • Only 4.4% of dollars spent by rest of world (ROW) carriers on claims are outsourced to third party independent adjusters • Very few global claims providers • As ROW insurance carriers look to consolidate claims services vendors, small firms lose market share The Strength of Working Together SM Insurance Carrier Internal Claims Dept. Outsourced |
 25 Global Three-Tiered International Operations Significant opportunity for cross leverage & synergy Tier Area Market Regulatory/Compliance Business Culture 1 2 3 Transition Transition U.K. Canada Australia Asia select Europe Latin America Brazil Scandinavia Holland Mature Sophisticated Variable Developing Robust Emerging Emerging Cohesive Diverse Diverse The Strength of Working Together SM |
 26 Products and Services Global Technical Services Gen Insurance Volume Markets Specialty Markets Third Party Administration Property Casualty - Public Liability - Employer’s Liability Professional Indemnity Product Recall CAT Response Major Loss IT & Telecommunications Banking & Finance Energy; Mining Construction & Engineering Natural Resources Marine & Transportation Pharmaceuticals Motor Healthcare Travel Warranty Claims Management Services Counter Fraud Solutions Lloyd’s & London Market Supply Chain Management Repair Networks Procurement Services The Strength of Working Together SM |
 27 Key International Trends INDUSTRY TREND... SUPPORTS... •Regulation •Service/Data •Catastrophe Management •Outsourcing •Best practice technology and business process •Capacity/capability •Global reach and local/technical credentials •Trusted, experienced partners The Strength of Working Together SM |
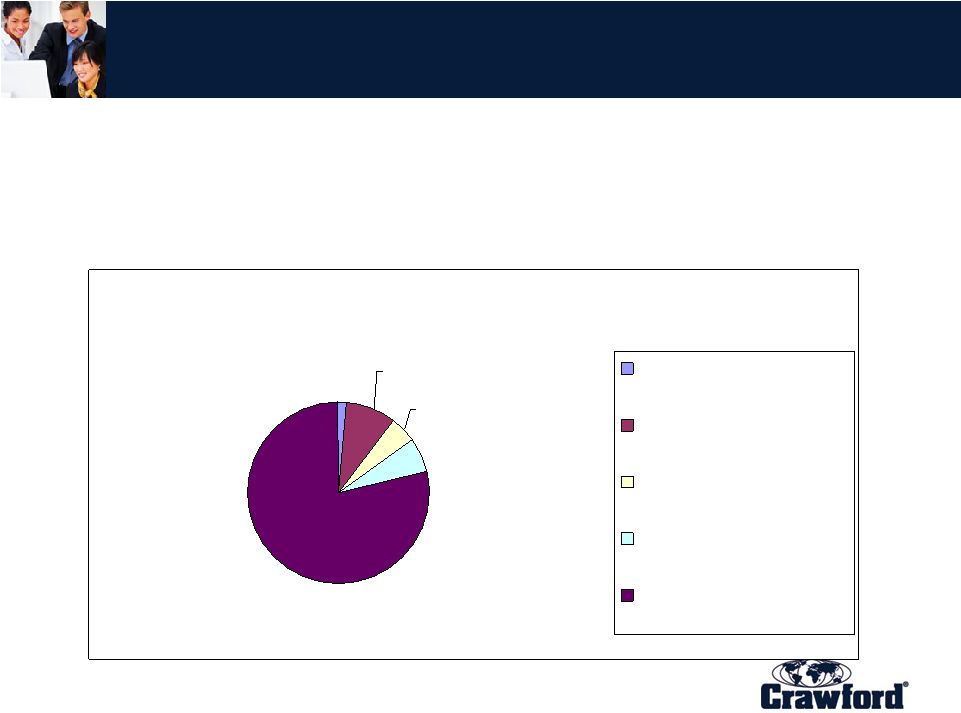
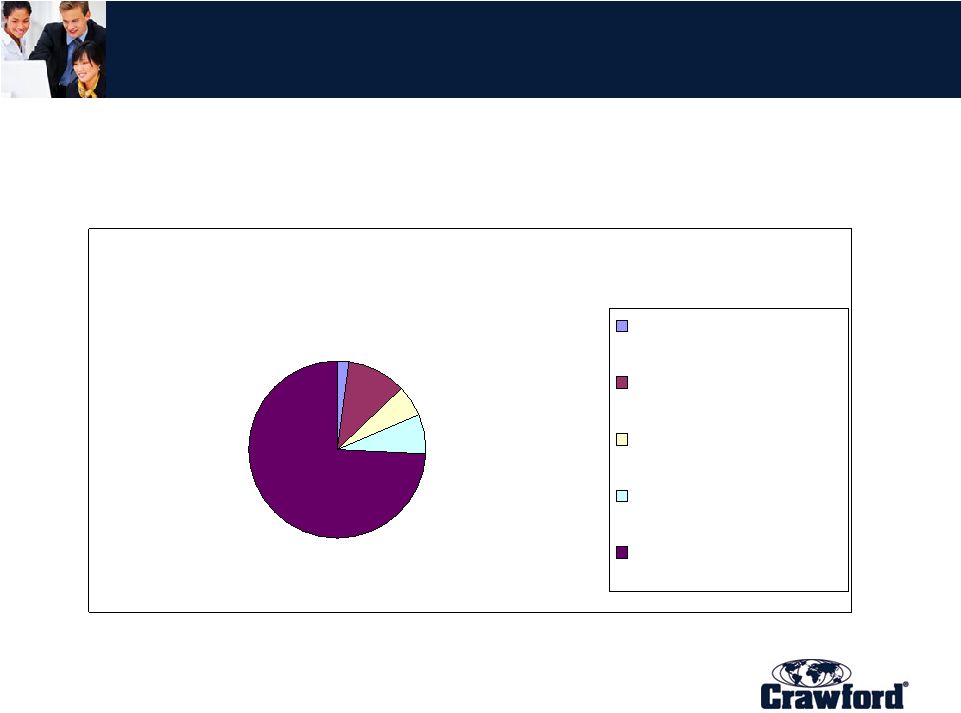 28 International Property & Casualty Key Customers (excluding U.S.) • Top 100 International Clients represent 83% of annual fees invoiced Percentage by number of clients in USD categories based on YTD September 2008 fees invoiced, annualized 2% 10% 6% 7% 74% Over $1,000,000 $100,000 up to $999,999 $50,000 up to $99,999 $25,000 up to $49,999 Under $25,000 The Strength of Working Together SM |
 29 International Growth Opportunities • Revenue/Claims growth from: – Increased penetration of Tier One markets – Leveraging into Tier Two and Tier Three markets – Global clients seeking global partners • Operational gains from: – Exporting best practices – Leading edge technology – Process efficiency – Management with science The Strength of Working Together SM |
 the STRENGTH of WORKING TOGETHER SM U.S. Property & Casualty Kevin Frawley Chief Executive Officer, Property & Casualty - Americas |
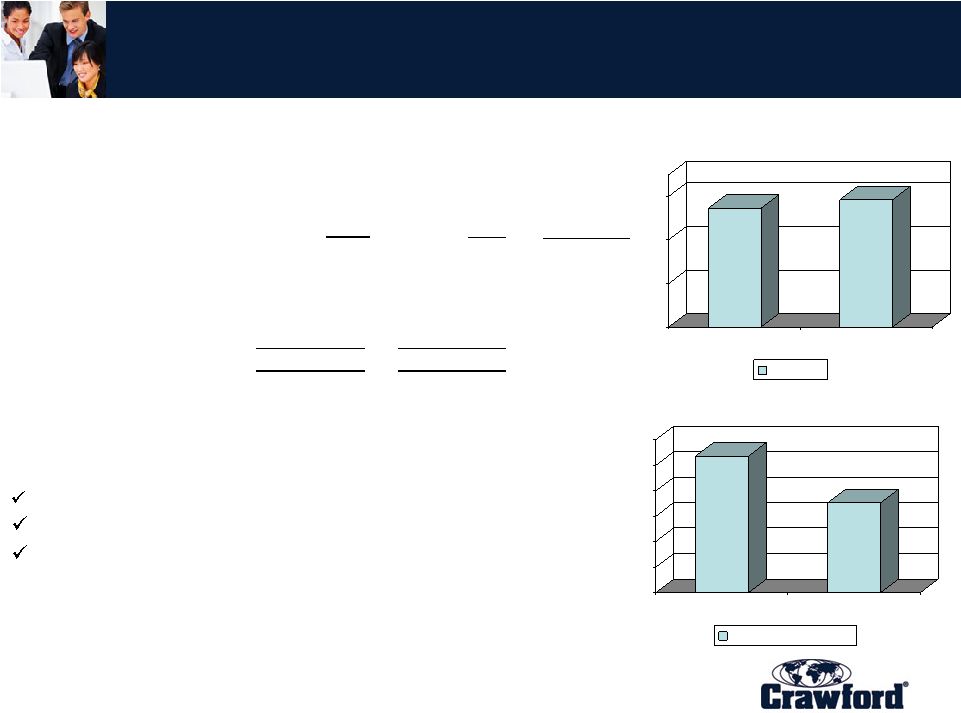
 31 $130 $140 $150 $160 $170 YTD 2008 YTD 2007 Revenue $0 $5 $10 $15 $20 YTD 2008 YTD 2007 Operating Earnings $ in millions $ in millions $148.7 $156.9 $8.1 $17.8 Revenue improvement complemented by strong cost control with enhanced technology Improved operating earnings and margin Catastrophe revenue up $5.1 million from 2007 to 2008 Growth in a difficult operating environment YTD U.S. Property & Casualty Results The Strength of Working Together SM Summary Results, U.S. Property & Casualty For the nine months ended September 30, 2008 and 2007 in Thousands Except Percentages Unaudited 2008 2007 % Change Revenues 156,935 $ 148,727 $ 5.5% Total Operating Expenses 139,113 140,640 -1.1% Operating Earnings 17,822 $ 8,087 $ 120.4% Operating Margin 11.4% 5.4% |
 32 US Property & Casualty Services Tech Services Liability Services Crawford Central Educational Services Marine & Transportation A System of Claims Solutions SWS Casualty Auto Property CAT Services Contractor Connection The Strength of Working Together SM |
 33 4,000+ Local & Regional Providers National Providers Crawford U.S. Unallocated Loss Adjusting Expenses $21.7 Billion 86.1% $3.5 Billion 13.9% $3 Billion 86% $280 Million 8% U.S. Outsourced Loss Adjusting Expenses $193 Million 6% Source: Cochran, Caronia & Co. and Crawford & Company • Approximately 14% of dollars spent by U.S. carriers on claims services are outsourced to third parties. – High propensity to outsource non-core lines and/or non-core states • Outsourced claims service provider market is highly fragmented – Crawford is the market leader with approximately 6% • As insurance carriers look to consolidate claims services vendors, small firms lose market share. – Most U.S. carriers are dramatically reducing the number of vendors on “approved lists” U.S. Insurance Market The Strength of Working Together SM Insurance Carrier Internal Claims Dept. Outsourced |
 34 U.S. Property & Casualty Key Customers • Top 250 Clients represent approximately 80% of annual revenue • Key accounts – National in scope • Historically – many regional/local accounts • Carriers and Crawford were organized on regional basis • Marketplace evolving Percentage by number of clients in USD categories 2% 9% 5% 6% 78% Over $1,000,000 $100,000 up to $999,999 $50,000 up to $99,999 $25,000 up to $49,999 Under $25,000 The Strength of Working Together SM |
 35 Key Industry Trends • Challenging Trends – Claims as commodities – Carriers in-sourcing claims handling • Positive Trends – Consolidation of independent adjusters by major Carriers – Carriers focus on speed and enhanced communication – Increased importance of technology including more work from remote locations The Strength of Working Together SM |
 36 Key opportunities • U.S Property & Casualty focus: – New revenue – restructure and grow our sales force – Program business – deliver end to end claims processing to national and regional carriers – Middle market – seek greater outsourcing of internal claims • Cross-sell existing customer base – High end losses – continue recruitment and development of highly-skilled adjustors – Contractor Connection TM – expand relationships with carriers and general contractors The Strength of Working Together SM |
 37 U.S. Property & Casualty Strategic Plan Future success expected to come from: • Expanded application of technology to enhance effectiveness and reduce cost • Revenue growth from increased market share in national and regional accounts • Shift to program business model The Strength of Working Together SM |
 the STRENGTH of WORKING TOGETHER SM Broadspire Ken Martino President & Chief Executive Officer, Broadspire |
 39 $100 $150 $200 $250 YTD 2008 YTD 2007 Revenue $0 $1 $2 $3 $4 $5 $6 YTD 2008 YTD 2007 Operating Earnings $ in millions $ in millions $236.3 $246.1 $5.4 Improved margin through strong cost management High client retention Building sales momentum $3.5 Year-to-Date Broadspire Results The Strength of Working Together SM Summary Results, Broadspire For the nine months ended September 30, 2008 and 2007 in Thousands Except Percentages Unaudited 2008 2007 % Change Revenues 236,289 $ 246,092 $ -4.0% Total Operating Expenses 230,923 242,563 -4.8% Operating Earnings 5,366 $ 3,529 $ 52.1% Operating Margin 2.3% 1.4% |
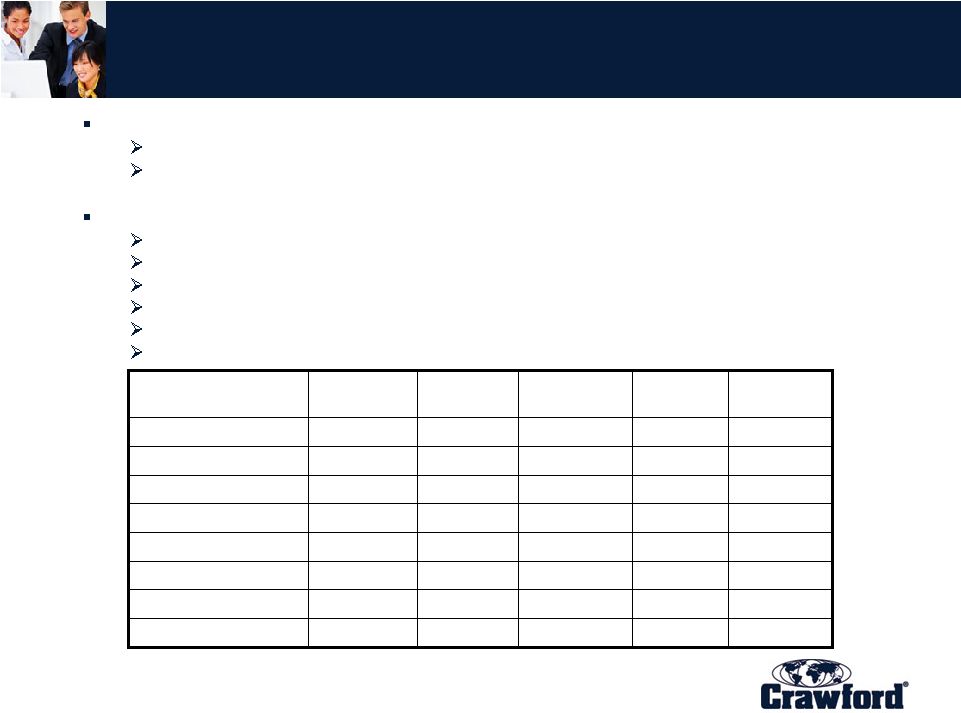 40 Broadspire Fourth Largest TPA in Workers’ Compensation/Liability Market FY2007 Revenue: $321.3 million Fifth Largest Medical Management Firm Products and Services: Workers’ Compensation Claims Services Auto and General Liability Claims Services Medical and Disability Management Services Long-Term Care Services Risk Management Information Systems (Risk Sciences Group) Claim Triage Solution (e-Triage) X Long Term Care X Claim Triage X Peer Review X FCM X X TCM/UM X X Med Bill Review X X X X X RMIS X X X X X Claim ESIS SRS Sedgwick Gallagher Basset Broadspire The Strength of Working Together SM |
 41 U.S. TPA Market Opportunities Self-Insureds, Large Accounts and Captives outsource most of their claim services Market stable in terms of claim counts – lower frequency offset by economic expansion Outsourced claim services are fragmented but consolidating 9 Largest Providers Broadspire Local and Regional Providers $0.4 Billion $3.2 Billion Outsourced Loss Adjusting Expenses $1.8 Billion 55.9% $1.1 Billion 34.1% $321 Million 10.0% Source: Cochran, Caronia & Co. and Crawford & Company The Strength of Working Together SM Internal Outsourced Unallocated Loss Adjusting Expenses |
 42 Key Industry Trends Positive Trends Workers’ Compensation legislative changes and cost increases Litigious nature of our society Focus on health and productivity More data – More metrics Challenges Declining frequency of Workers’ Compensation claims Current market turmoil has risk managers distracted Government regulation Talent war - finding qualified experienced staff in the marketplace The Strength of Working Together SM |
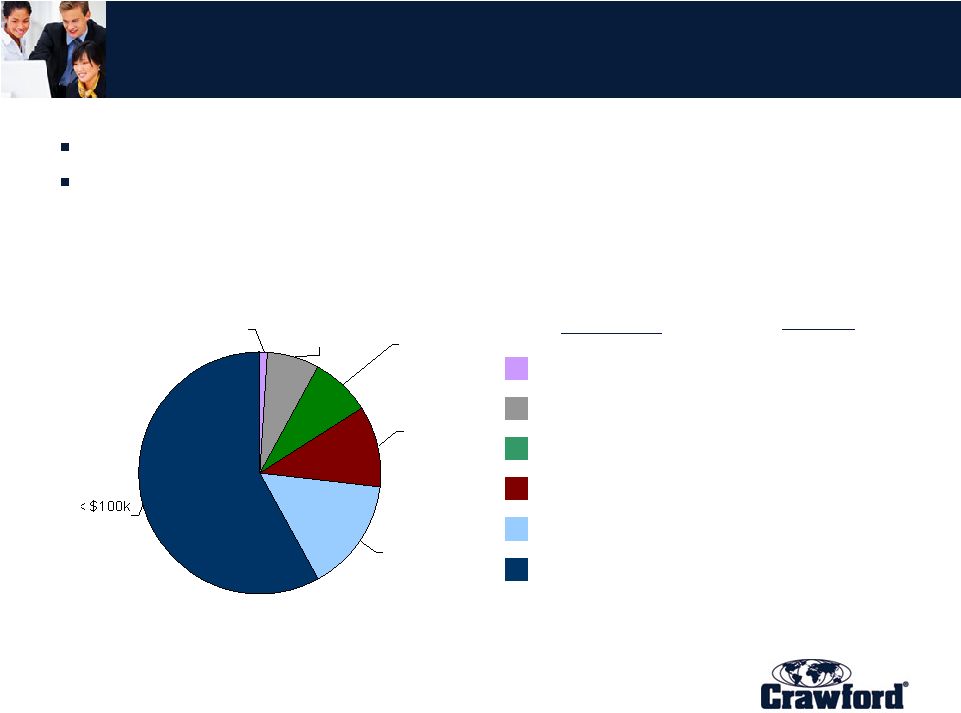 43 Broadspire Key Customers Client retention rate 93%+ Leveraging our relationships – locking in multi-year deals The chart below details Broadspire’s broad based market appeal: > $5 m $1 m - $4.9 m $500 k - $999 k $250 k - $499 k $100 k - $249 k < $100 k Account Size Number of Accounts 9 43 46 65 89 344 58% $100k - $249k 15% $250k - $499k 11% $500k - $999k 8% $1m - $4.9m 7% > $5m 1% The Strength of Working Together SM |
 44 Broadspire’s Focus Implementation of RiskTech November 2008 Claims inventory management Grow TPA & standalone Leverage existing products and services Dedicated sales team Grow existing accounts Brand globalization Investment in staff The Strength of Working Together SM |
 the STRENGTH of WORKING TOGETHER SM Legal Settlement Administration David Isaac Chief Executive Officer, The Garden City Group, Inc. (GCG) |
 46 Products and Services • The Garden City Group, Inc. (GCG) provides these core services: – GCG Class Action Services provides technology-intensive administrative services for plaintiff and defense counsel and corporate defendants to expedite high-volume class action settlements. • GCG Class Action Services has administered a diverse portfolio of litigation settlements, including: – sensitive and high-profile consumer, employee-related, human rights, mass tort, antitrust, product and securities cases. – GCG Bankruptcy Services offers cost-effective, end-to-end solutions for managing the administration of bankruptcy under Chapter 11. – GCG Communications specializes in legal notice programs for successful case administration. We offer a range of complementary services for developing and implementing effective legal notice programs worldwide. The Strength of Working Together SM |
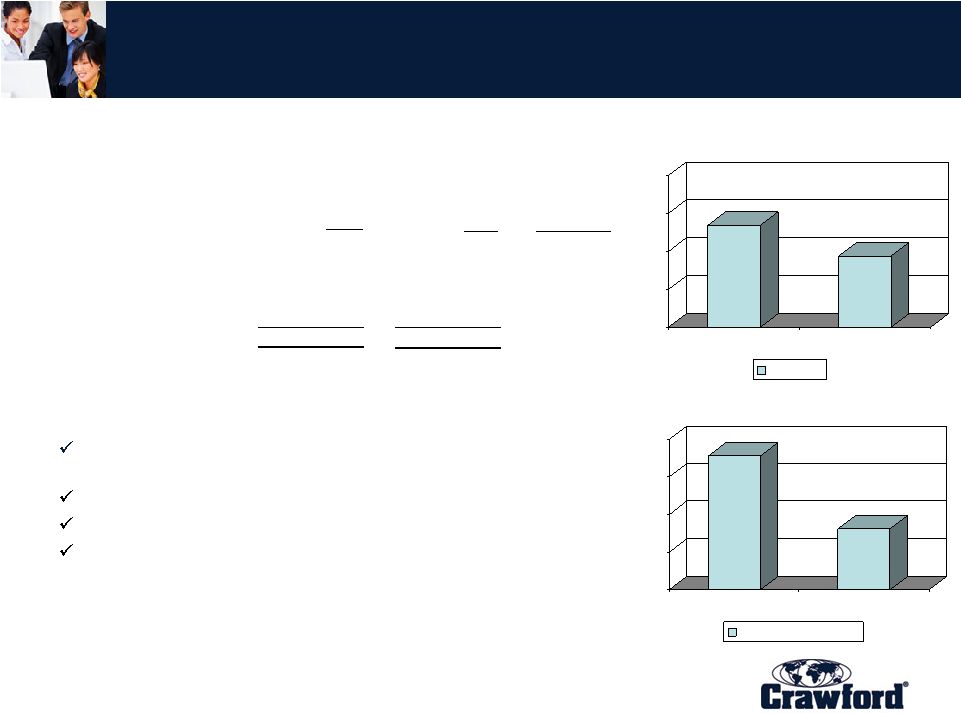
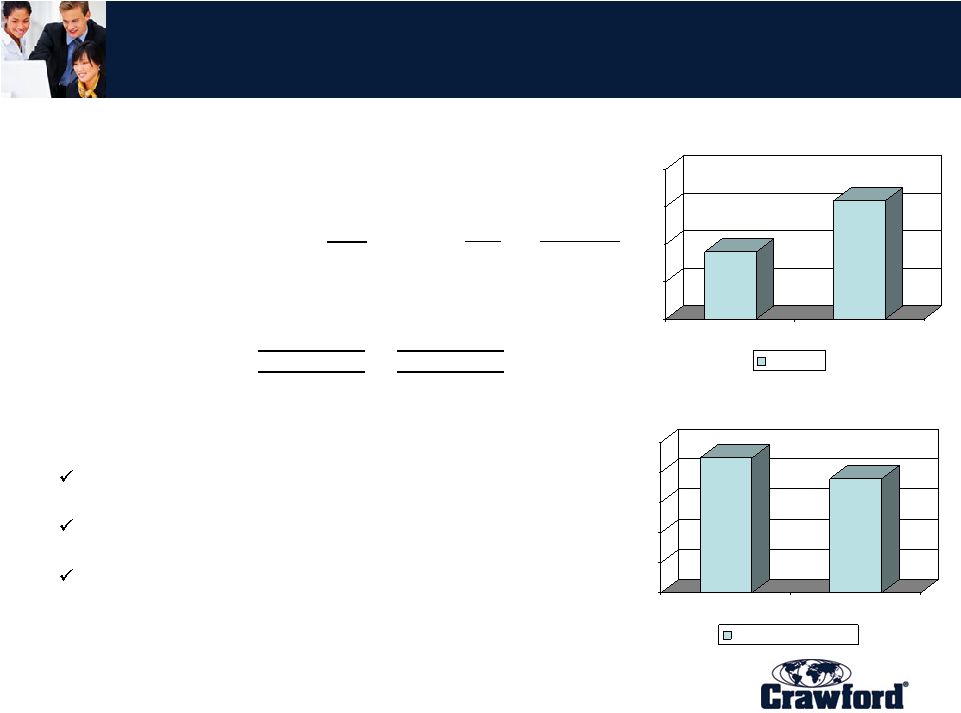 47 $50 $55 $60 $65 $70 YTD 2008 YTD 2007 Revenue $4 $5 $6 $7 $8 $9 YTD 2008 YTD 2007 Operating Earnings $ in millions $ in millions $57.0 $65.8 $7.8 $8.5 Revenue decline due in part to cyclical nature of business Operating earnings increase due to cost control management Backlog of $43.5 million Legal Settlement Administration Results The Strength of Working Together SM Summary Results, Legal Settlement Administration For the nine months ended September 30, 2008 and 2007 in Thousands Except Percentages Unaudited 2008 2007 % Change Revenues 56,964 $ 65,770 $ -13.4% Total Operating Expenses 48,472 57,975 -16.4% Operating Earnings 8,492 $ 7,795 $ 8.9% Operating Margin 14.9% 11.9% |
 48 Market Overview and Position • GCG is a nationwide leader in class action administration and is increasing its position in bankruptcy administration. • Principal publicly-traded competitors are Epiq (Nasdaq: Epiq), Administar (AUS: CPU) and U.S. Bancorp (NYSE:USB). • Market size is not well defined and highly fragmented. – Top class action competitors • Rust Consulting/Complete Claims Solutions • Epiq Systems • Gilardi and Company – Top bankruptcy competitors • Epiq Systems • KCC The Strength of Working Together SM |
 49 Competitive Strengths – Largest securities class action administrator in the U.S. September 30, 2008] • Comprehensive class action administrative services with nearly 25 years experience in both securities and consumer cases. • Senior executives are former class action litigation attorneys, Chapter 11 business reorganization specialists and general counsels for large corporations. • Top-tier technology for communications, digital processing, and data management. • State-of-the-art contact center with interactive, automated and live service manned 24 hours a day, 7 days a week. • Deep expertise in mega-case settlements. – Representative engagements • Antitrust: $3.2B Visa/MasterCard Settlement • Consumer: $1.0B Contact Lens Settlement • Securities: $6.2B WorldCom Securities Litigation • Mass Tort: $700M Engle Tobacco Trust Fund The Strength of Working Together SM [RiskMetrics, |
 50 0 5 10 15 20 25 30 35 AB Data, Ltd. Berdon LLP Complete Claims Solutions Heffer Radetich & Saitra LLP Gilardi and Co., LLC Garden City Group Securities Class Action Cases Source: RiskMetrics Group (SCAS Top 100, September 30, 2008) 4 4 4 11 26 33 The Strength of Working Together SM |
 51 Securities Class Action Administration Most Frequent Claims Administrators – Class Action GCG has been selected to administer 6 of the ten largest securities class action settlements since the passage of the PSLRA in 1995. Rank Case Name Settlement (MMs) Year Claims Agent 1 Enron Corp. $7,231 2007 Gilardi & Co. LLC 2 World Com, Inc. $6,156 2005 Garden City Group 3 Tyco International, Ltd. $3,200 2007 Garden City Group 4 Cendant Corp. $3,187 2000 Heffler Radetich & Saitta 5 AOL TimeWarner, Inc. $2,500 2006 Gilardi & Co. LLC 6 Nortel Networks Corp. I $1,143 2006 Garden City Group 7 Royal Ahold, N.V. $1,100 2006 Garden City Group 8 Nortel Networks Corp. II $1,074 2006 Garden City Group 9 McKesson HBOC Inc. $1,043 2008 Analytics Inc. 10 Lucent Technologies, Inc. $ 667 2003 Garden City Group Source: RiskMetrics Group (SCAS Top 100, September 30, 2008) The Strength of Working Together SM |
 52 Key Industry Trends • Commoditization of the industry creates price competitive environment • Sustaining organic growth in face of declining numbers of class action settlements – Settlement scope and size; fewer mega cases settled since tech bubble of early 2000’s – Subprime cases are being filed but remain distant from settlement – Near term outlook is challenging due to economic crisis • Consolidation trend emerging in the industry • Legal environment not as favorable to class actions The Strength of Working Together SM |
 53 Long Term Growth Opportunities • Bankruptcy market • Potential opportunity in filing of major class actions • Diversification of services • Capitalizing on reputation for quality in a consolidating market • Strong deep management team with unmatched experience in core services The Strength of Working Together SM |
 the STRENGTH of WORKING TOGETHER SM Summary Jeffrey T. Bowman President and Chief Executive Officer |
 55 “The Strength of Working Together” “The Strength of Working Together” is unifying the Company around consistent goals: Adaptive leadership team responding to changing economic conditions Increasing emphasis on sources of additional revenue growth – Selling Crawford services into the existing client base through key account management – Multidisciplinary approach Driving technology forward – Creating operational efficiencies – Global economies of scale Being a target-driven organization – Setting medium term goals for 2009 to 2011 The Strength of Working Together SM |
 56 2008 Year To Date Performance • Strong performance for the 2008 nine months year to date... – Revenue growth of 7.6% – Net income up 86.7% • Led by operational improvements... – Operating earnings up over 100% – Operating margin up 320 basis points • And cost control initiatives... – SG&A down 140 basis points as a percent of sales • Lead to solid earnings per share growth... – Solid EPS performance of $0.47 compared with $0.14 before gains on asset sales in 2007 • And supporting strong cash flow. – Cash flow from operations improved by $29 million year over year for the nine month period ended September 30, 2008 The Strength of Working Together SM |
 57 57 Medium Term Goals • Medium Term Financial Goals: – Grow revenues organically by 5% CAGR through 2010 – Achieve a 10% EBIT margin by 2010 – Target debt as a percentage of total capital at 25% to 30% – Continued commitment to sound financial management and maximizing shareholder value The Strength of Working Together SM |
 58 Crawford is “Positioned for Growth” • Access to growing global markets • Increasing market share both domestic and internationally • Crawford expects to benefit from global consolidation of TPA vendors • Diverse, high quality customer base • High customer retention rates • Emphasis on quality and value provided sustains client confidence • Disciplined management • Improving financial performance • Consolidated revenues, earnings, margins, and cash flows improving in 2008 • Investment in enhanced technology in all divisions The Strength of Working Together SM |
 59 The Strength of Working Together “Crawford & Company will be known as a target driven corporation that meets its promises to clients and shareholders.” Jeffrey T. Bowman President and CEO The Strength of Working Together SM |
 the STRENGTH of WORKING TOGETHER SM Analyst Day New York Stock Exchange November 21, 2008 |