 WORKING TOGETHER: the Crawford Difference Fox-Pitt Kelton Cochran Caronia Waller Bank and Insurance Conference June 18, 2009 Exhibit 99.1 |
 2 WORKING TOGETHER: the Crawford Difference Forward-looking Statements, Segment Operating Earnings and Non-GAAP Financial Information Forward Looking Statements: This presentation contains forward-looking statements, including statements about the future financial condition, results of operations and earnings outlook of Crawford & Company. Statements, both qualitative and quantitative, that are not historical may be “forward-looking” statements as defined in the Private Securities Litigation Reform Act of 1995. Forward-looking statements involve a number of risks and uncertainties that could cause actual results to differ materially from historical experience or Crawford & Company’s present expectations. Accordingly, no one should place undue reliance on forward-looking statements, which speak only as of the date on which they are made. Crawford & Company does not undertake to update forward-looking statements to reflect the impact of circumstances or events that may arise or not arise after the date the forward-looking statements are made. Results for any interim period presented herein are not necessarily indicative of results to be expected for the full year or for any other future period. For further information regarding Crawford & Company, and the risks and uncertainties involved in forward-looking statements, please read Crawford & Company’s reports filed with the United States Securities and Exchange Commission and available at www.sec.gov or in the Investor Relations section of Crawford & Company’s website at www.crawfordandcompany.com. Segment Operating Earnings: Under Statement of Financial Accounting Standards Number 131, Disclosures about Segments of an Enterprise and Related Information, segment operating earnings is the primary measure used by the Company to evaluate the results of each of its four operating segments. Segment operating earnings exclude income taxes, interest expense, amortization of customer-relationship intangible assets, stock option expense, earnings or loss attributable to non-controlling interests, and certain other nonrecurring gains and expenses. Non-GAAP Financial Information: For additional information about the Non-GAAP financial information presented herein, see the Appendix beginning on slide 32. |
 3 WORKING TOGETHER: the Crawford Difference • World’s largest fully-integrated independent provider of global claims management solutions. • Four reporting segments: – International Operations • Serves the global insurance industry and multi-national corporations – U.S. Property & Casualty • Serves the U.S. insurance company market – Broadspire • Serves large national accounts, carriers and self- insured entities – Legal Settlement Administration • Provides administration for class action settlements and bankruptcy matters Our Market Leading Global Businesses |
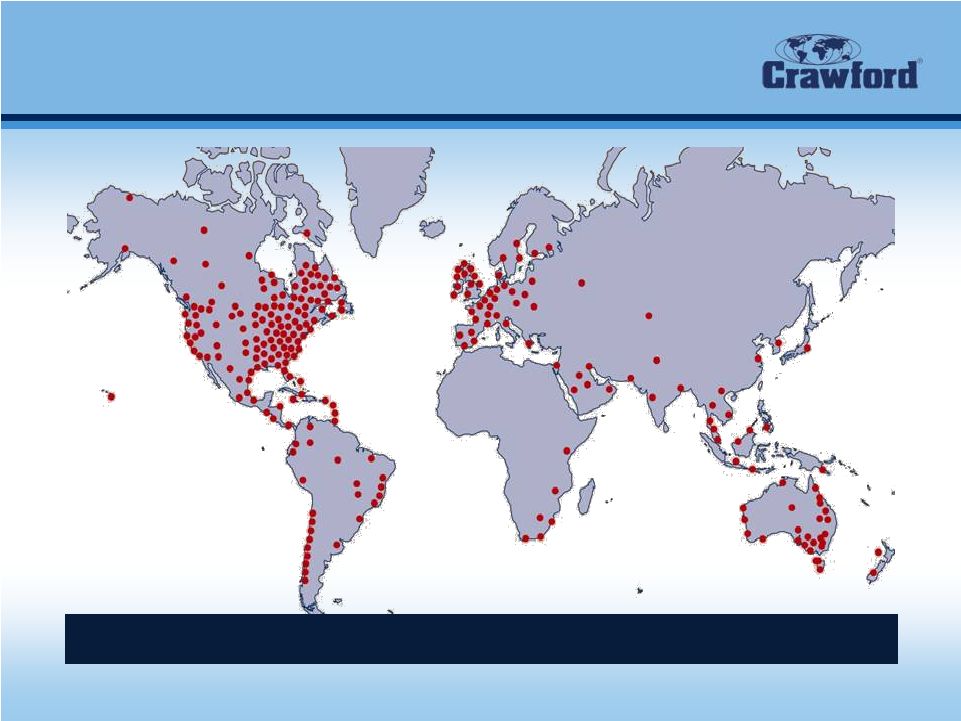 4 WORKING TOGETHER: the Crawford Difference Positioned for a Global Economy More than 700 locations in 63 countries |
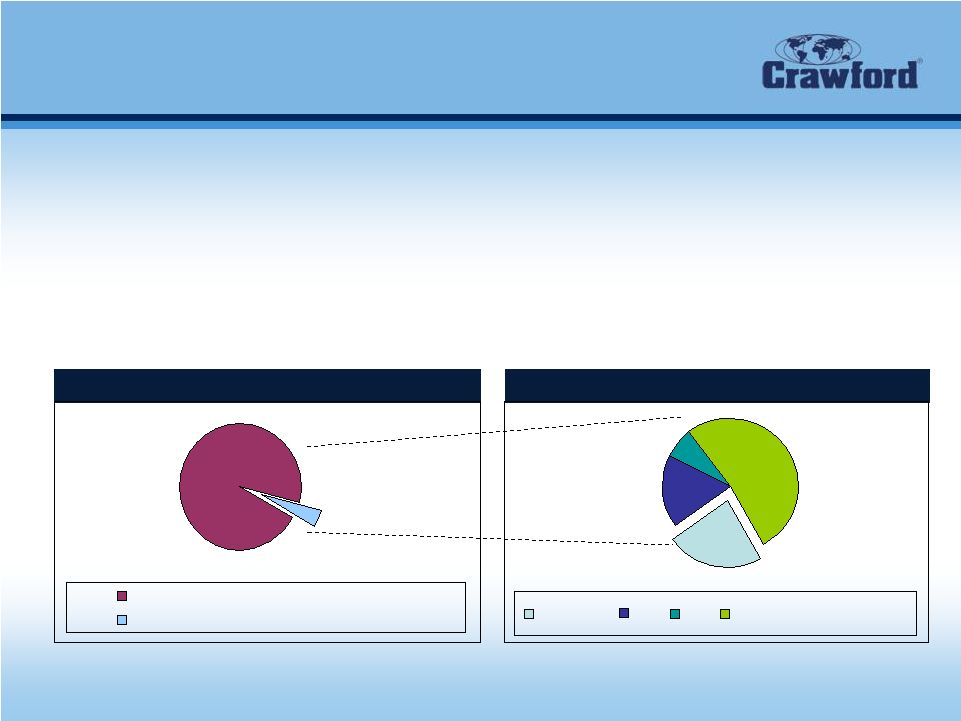
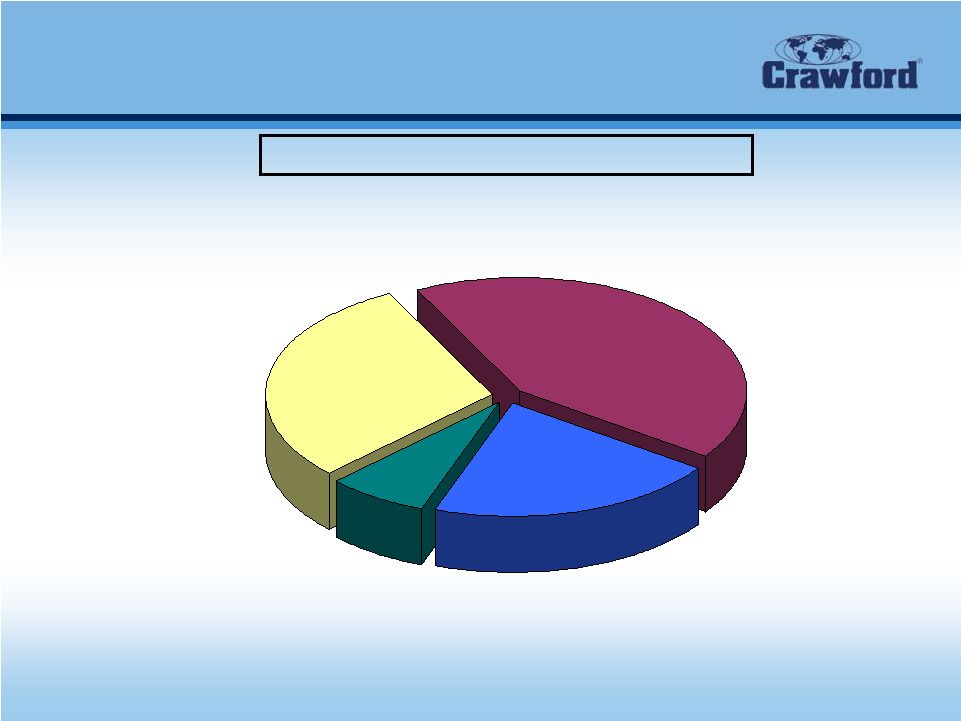 5 WORKING TOGETHER: the Crawford Difference Diversified Business and Clients Fiscal 2008 Revenues of $1.05 Billion • Property and Casualty Services • Global Technical Services • Global Marine and Transportation • Global Markets 42.4% 29.7% 7.1% International Operations U.S. Property & Casualty • Property and Casualty Services • Catastrophe Management Services • Auto Appraisal Services • Centralized Claim Administration • Strategic Warranty Services 20.7% Legal Settlement Administration • Class Actions – Securities – Product Liability • Bankruptcy Administration Broadspire • Workers’ Compensation and Liability Claims Administration • Medical and Case Management • Long-Term Care Services • Integrated Disability Management • Risk Management Information Systems (RSG) • Claim Triage Solution (e-Triage) • No single client over 6% of total revenue • Top 20 Clients represent 34.7% of total revenue • Top 50 Clients represent 48.5% of total revenue |
 6 WORKING TOGETHER: the Crawford Difference Goals: 2009 - 2011 •Leverage and grow Crawford & Company’s position as the world’s largest independent provider of claims solutions. –Expand Key Account Management to improve sales and marketing initiatives to win more business. •Further improve working capital management. – Accounts receivable, DSO, cash flow. •Implement innovative, value-added solutions that drive quality and improve operating results. –Execute global launch of The Crawford System of Claims Solutions SM to dramatize our competitive advantages, reinforce our industry leadership, and clarify our portfolio of businesses. –Implement Information and Communications Technology strategies to leverage technology gains to maximize operating efficiencies and improve data management. •Become a premier employer. –Ensure that our pay-for-performance culture builds a results-oriented business. |
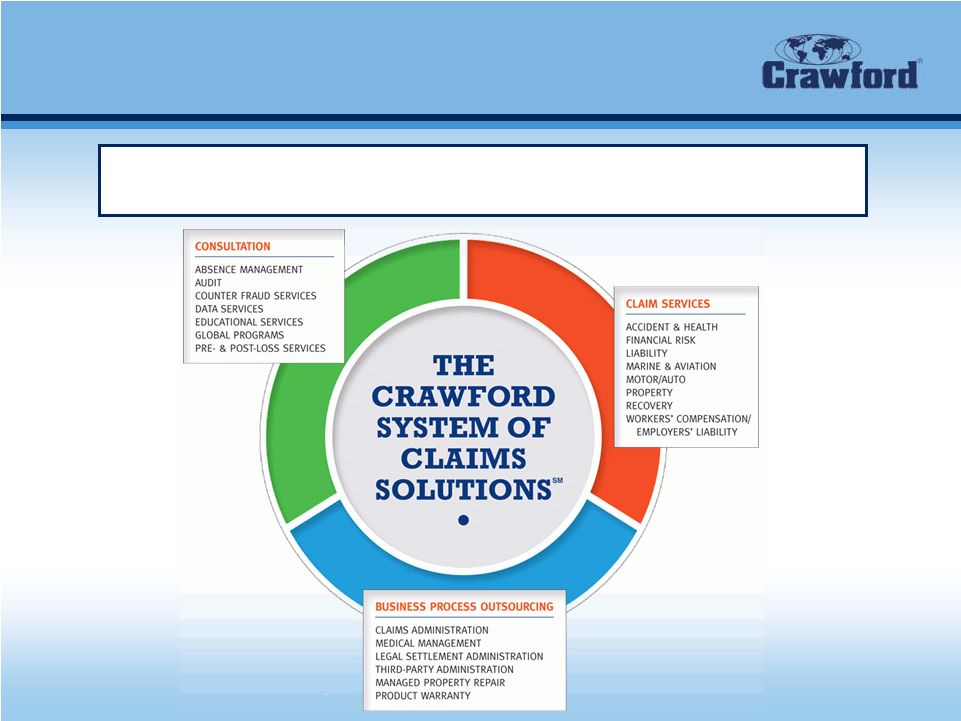 7 The Crawford System of Claims Solutions SM The System is the most comprehensive global, integrated solution for all corporate, insurer, and re-insurer claims administration. WORKING TOGETHER: the Crawford Difference |
 WORKING TOGETHER: the Crawford Difference Financial Review |
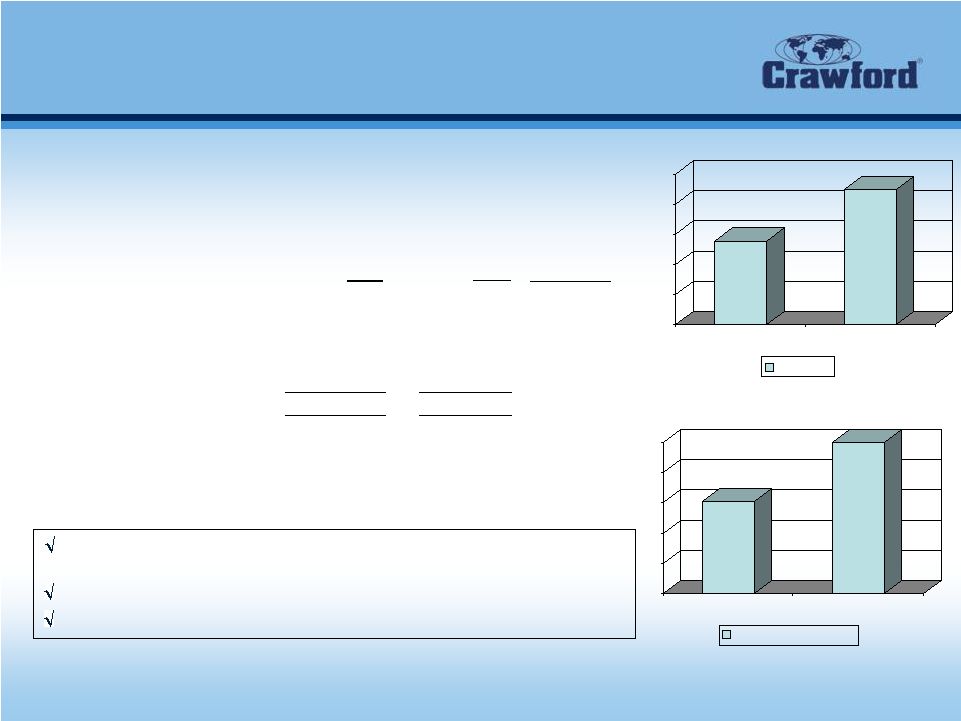
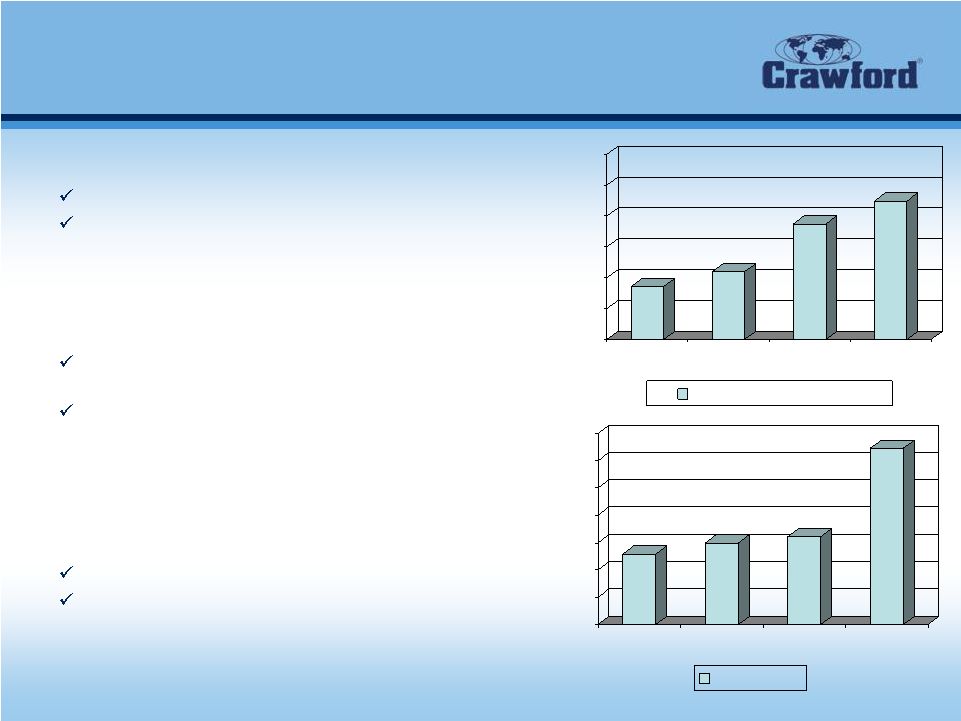 9 WORKING TOGETHER: the Crawford Difference Four-year Crawford Financial Performance • Improving performance in a difficult operating environment Revenue CAGR of 10.6% from 2005 to 2008 Operating earnings CAGR of 41.0% from 2005 to 2008 • Strong revenue growth internationally aided by impact of Broadspire acquisition International growth (before currency effects) of 8.7% Fourth quarter 2006 acquisition of Broadspire Services Inc. added approximately $200 million in 2007 revenue • Focus on cost control drives incremental margin Continued margin expansion internationally Turnaround in U.S. Property & Casualty $600 $700 $800 $900 $1,000 $1,100 $1,200 2005 2006 2007 2008 Consolidated Revenue $ in millions $0 $5 $10 $15 $20 $25 $30 $35 2005 2006 2007 2008 Net Income $ in millions 772 820 975 1,049 13 15 16 32 |
 10 WORKING TOGETHER: the Crawford Difference Fiscal 2008 Financials CONDENSED CONSOLIDATED STATEMENTS OF INCOME* Unaudited (In Thousands, Except Earnings Per Share and Percentages) Year Ended December 31 2008 2007 % Change Revenues: Revenues Before Reimbursements $1,048,582 $975,143 8% Reimbursements 87,334 76,135 15% Total Revenues 1,135,916 1,051,278 8% Costs and Expenses: Cost of Services Provided, Before Reimbursements 770,724 733,392 5% Reimbursements 87,334 76,135 15% Total Cost of Services 858,058 809,527 6% Selling, General, and Administrative Expenses 215,625 211,737 2% Corporate Interest Expense, Net 17,622 17,326 2% Restructuring Costs 3,300 - nm Total Costs and Expenses 1,094,605 1,038,590 5% Gain on Sale of Former Corporate Headquarters - 4,844 nm Gains on Sales of Businesses 2,512 3,980 -37% Income Before Income Taxes 43,823 21,512 104% Provision for Income Taxes 11,564 5,396 114% Net Income $32,259 $16,116 100% Earnings Per Share: Basic $0.64 $0.32 98% Diluted $0.62 $0.32 94% nm = not meaningful * does not reflect accounting principles adopted in fiscal 2009 |
 11 WORKING TOGETHER: the Crawford Difference Fiscal 2008 Financials Crawford & Company Balance Sheet Highlights* As of December 31, 2008 and December 31, 2007 in thousands, except percentages December 31, December 31, 2008 2007 Change Cash and cash equivalents $73,124 $50,855 $22,269 Accounts receivable, net 157,430 178,528 (21,098) Work in process 99,115 136,652 (37,537) Total receivables 256,545 315,180 (58,635) Deferred revenues, net 95,670 111,036 (15,366) Pension liabilities 179,542 76,977 102,565 Current portion of long-term debt, capital leases and short-term borrowings 15,650 31,864 (16,214) Long-term debt 181,206 183,449 (2,243) Total debt 196,856 215,313 (18,457) Total stockholders' equity 175,551 254,215 (78,664) Net debt 123,732 164,458 (40,726) Total debt / capitalization 53% 46% *Does not reflect accounting principles adopted in fiscal 2009 |
 12 WORKING TOGETHER: the Crawford Difference Fiscal 2008 Financials Crawford & Company Free Cash Flow (non-GAAP) For the years ended December 31, 2008 and 2007 In Thousands 2008 2007 Variance Net Income $32,259 $16,116 $16,143 Plus: Depreciation / Non-Cash Items 38,923 31,692 7,231 Less: Special Credits (2,512) (8,824) 6,312 Less: Working Capital Growth 20,221 (15,151) 35,372 Less: U.S. Pension Contributions (17,916) (549) (17,367) Operating Cash Flow 70,975 23,284 47,691 Less: Capital Expenditures (19,336) (21,553) 2,217 Less: Internally Developed Software (12,675) (6,556) (6,119) Less: Mandatory Principal Payments (2,100) (2,100) - Free Cash Flow (non-GAAP) $36,864 ($6,925) $43,789 |
 WORKING TOGETHER: the Crawford Difference 13 First Quarter 2009 Financials Quarter Ended March 31 2009 2008 % Change Revenues: Revenues Before Reimbursements $236,083 $255,512 -8% Reimbursements 14,200 19,161 -26% Total Revenues 250,283 274,673 -9% Costs and Expenses: Cost of Services Before Reimbursements 175,162 186,953 -6% Reimbursements 14,200 19,161 -26% Total Cost of Services 189,362 206,114 -8% Selling, General, and Administrative 51,488 50,503 2% Corporate Interest Expense, Net 3,485 4,416 -21% Restructuring Costs 1,815 - nm Total Costs and Expenses 246,150 261,033 -6% Income Before Income Taxes 4,133 13,640 -70% Provision for Income Taxes 1,120 4,644 -76% Net Income 3,013 8,996 -67% Add: Net Loss Attributable to Noncontrolling Interests 69 72 -4% Net Income Attributable to Crawford & Company $3,082 $9,068 -66% Earnings Per Share - Basic and Diluted $0.06 $0.18 -67% nm = not meaningful CRAWFORD & COMPANY CONDENSED CONSOLIDATED STATEMENTS OF INCOME Unaudited (In Thousands, Except Earnings Per Share Amounts and Percentages) |
 WORKING TOGETHER: the Crawford Difference 14 Revenue and Earnings Per Share Bridge 1 st Quarter 2008 to 2009 In millions, except per share amounts Revenues before Reimbursements Net Income attributable to Crawford & Company Diluted EPS 1 st quarter 2008 results $255.5 $9.1 $0.18 (Less)/Add: Foreign currency impact in 2009 (23.4) (1.4) (0.03) Increase in pension expense in 2009 - (2.3) (0.05) Restructuring costs in 2009 - (1.2) (0.02) Bad debt recovery in 2008 - (0.9) (0.02) Operating changes 4.0 (0.2) ( - ) 1 st quarter 2009 results $236.1 $3.1 $0.06 |
 WORKING TOGETHER: the Crawford Difference Operating Segments |
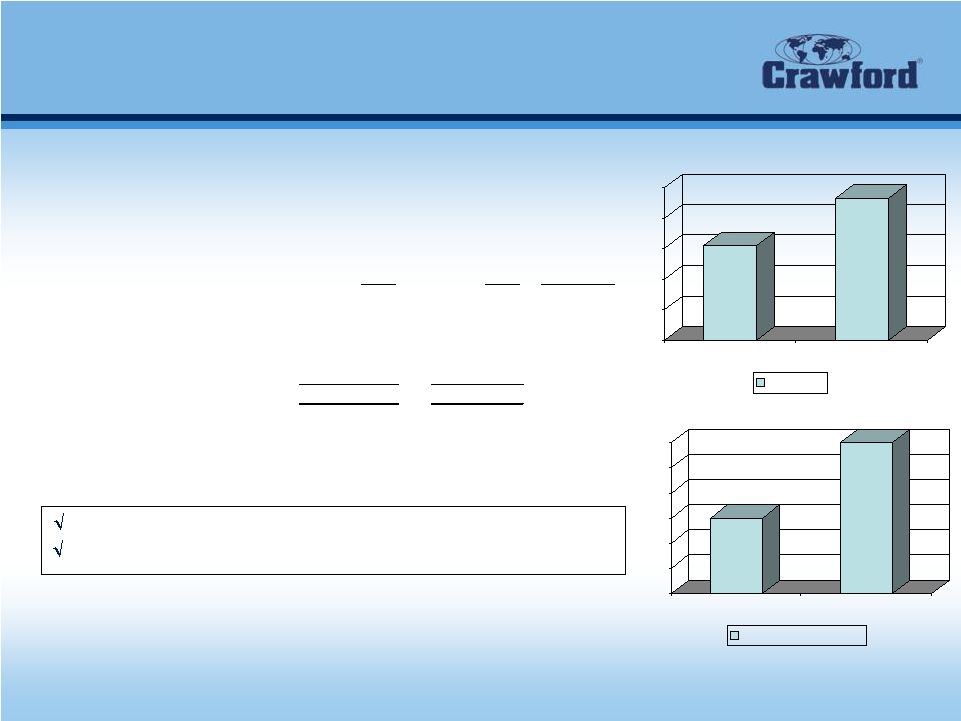 16 WORKING TOGETHER: the Crawford Difference $ in millions $ in millions First Quarter 2009 Financials $90.9 $106.7 $7.5 $9.0 Revenues down $23.4 million due to strong U.S. dollar Revenues increased 7.0% on a constant dollar basis Summary Results, International Operations For the quarters ended March 31, 2009 and 2008 in thousands except percentages Unaudited 2009 2008 % Change Revenues 90,872 $ 106,710 $ -14.8% Total Operating Expenses 83,407 97,723 -14.6% Operating Earnings 7,465 $ 8,987 $ -16.9% Operating Margin 8.2% 8.4% 60 70 80 90 100 110 1Q 2009 1Q 2008 Revenue 6 6.5 7 7.5 8 8.5 9 1Q 2009 1Q 2008 Operating Earnings |
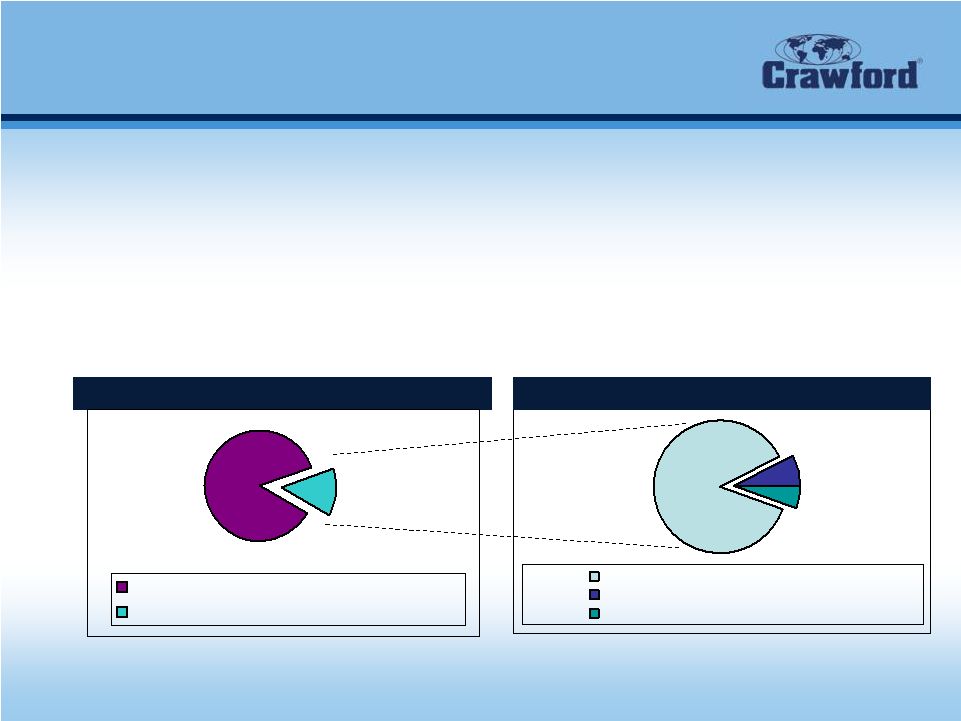
 WORKING TOGETHER: the Crawford Difference 17 International (excluding U.S.) Property & Casualty Insurance Market • Only 4.4% of dollars spent by rest of world (ROW) carriers on claims are outsourced to third party independent adjusters. • Very few global claims providers – Crawford is the largest • As ROW insurance carriers look to consolidate claims services vendors, small firms lose market share. ROW Unallocated Loss Adjusting Expenses $41.1 Billion 95.6% $1.9 Billion 4.4% $985 Million 51.8% $140 Million 7.4% ROW Outsourced Loss Adjusting Expenses $445 Million 23.4% Source: Crawford & Company (estimate) $330 Million 17.4% Insurance Carrier Internal Claims Dept. Outsourced Crawford #2 #3 Regional/Local Providers |
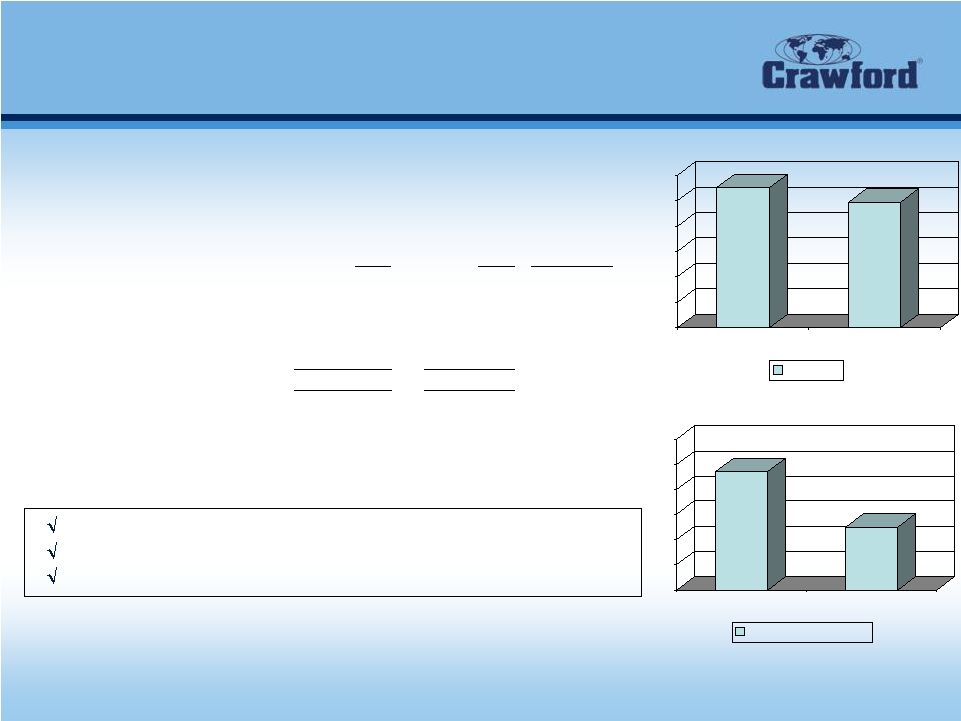 18 WORKING TOGETHER: the Crawford Difference $ in millions $ in millions $49.5 $55.1 $5.9 $6.2 Catastrophe revenues up $3.0 million due to severe weather Cases up nearly 7% in 2009 quarter Prior year period includes bad debt recovery of $389,000 First Quarter 2009 Financials 0 10 20 30 40 50 60 1Q 2009 1Q 2008 Revenue Summary Results, U.S. Property & Casualty For the quarters ended March 31, 2009 and 2008 in thousands except percentages Unaudited 2009 2008 % Change Revenues 55,052 $ 49,510 $ 11.2% Total Operating Expenses 48,882 43,561 12.2% Operating Earnings 6,170 $ 5,949 $ 3.7% Operating Margin 11.2% 12.0% 5.7 5.8 5.9 6.0 6.1 6.2 6.3 1Q 2009 1Q 2008 Operating Earnings |
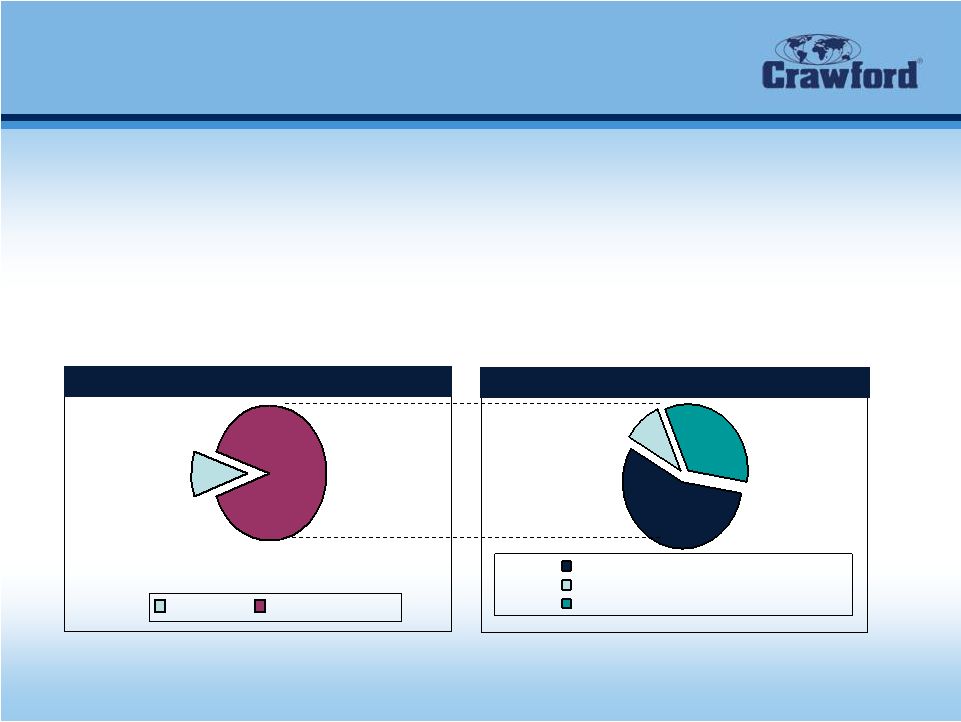
 WORKING TOGETHER: the Crawford Difference 19 4,000+ Local & Regional Providers National Providers Crawford U.S. Unallocated Loss Adjusting Expenses $21.7 Billion 86.1% $3.5 Billion 13.9% $3 Billion 86% $280 Million 8% U.S. Outsourced Loss Adjusting Expenses $216 Million 6% Source: Cochran, Caronia & Co. and Crawford & Company • Approximately 14% of dollars spent by U.S. carriers on claims services are outsourced to third parties – High propensity to outsource non-core lines and/or non-core states • Outsourced claims service provider market is highly fragmented – Crawford is the market leader with approximately 6% • As insurance carriers look to consolidate claims services vendors, small firms lose market share – Most U.S. carriers are dramatically reducing the number of vendors on “approved lists” U.S. Insurance Market Insurance Carrier Internal Claims Dept. Outsourced |
 20 WORKING TOGETHER: the Crawford Difference U.S. and International Property & Casualty Growth Opportunities • Strategic Growth – Target large insurers who are consolidating their vendor lists and strive to ensure Crawford is named an approved vendor • Continuous quality improvement • Efforts toward training and product development – Target markets • Small and mid-market carriers • Managing general agents (London Market) • Non-standard insurers • Property & casualty programs run by self-insured entities • Organic Growth – Key account plans for top clients – Account managers for each major client |
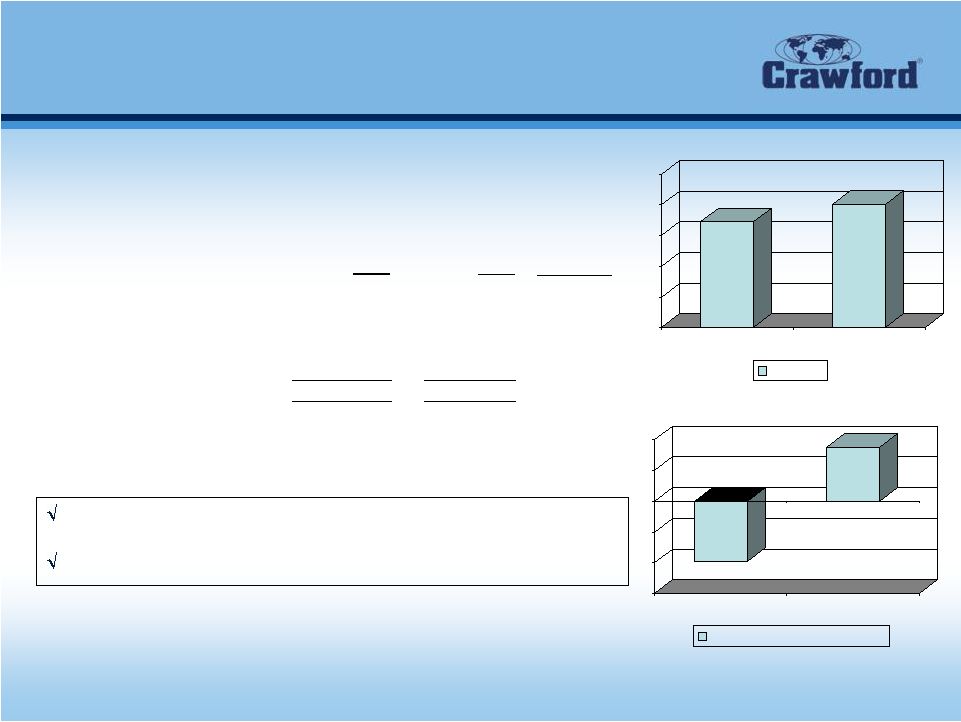 21 WORKING TOGETHER: the Crawford Difference 40 50 60 70 80 90 1Q 2009 1Q 2008 Revenue $ in millions $ in millions $74.6 $80.3 $1.7 ($2.0) Revenues and earnings declined due to lower workers’ compensation claim referrals Impact of economic crisis being felt most by this segment First Quarter 2009 Financials -3 -2 -1 0 1 2 1Q 2009 1Q 2008 Operating Earnings (Loss) Summary Results, Broadspire For the quarters ended March 31, 2009 and 2008 in thousands except percentages Unaudited 2009 2008 % Change Revenues 74,601 $ 80,313 $ -7.1% Total Operating Expenses 76,555 78,566 -2.6% Operating Earnings (Loss) (1,954) $ 1,747 $ nm Operating Margin -2.6% 2.2% |
 22 WORKING TOGETHER: the Crawford Difference 9 Largest Providers Broadspire Local and Regional Providers $0.4 Billion $3.2 Billion Unallocated Loss Adjusting Expenses Outsourced Loss Adjusting Expenses $1.8 Billion 55.9% $1.1 Billion 34.1% $312 Million 10.0% U.S. TPA Market Opportunities • Self-insured entities and captives outsource practically all of their claims services • Outsourced total claims management is fragmented • Local and regional providers unable to leverage technology investment Source: Cochran, Caronia & Co. and Crawford & Company Internal Outsourced |
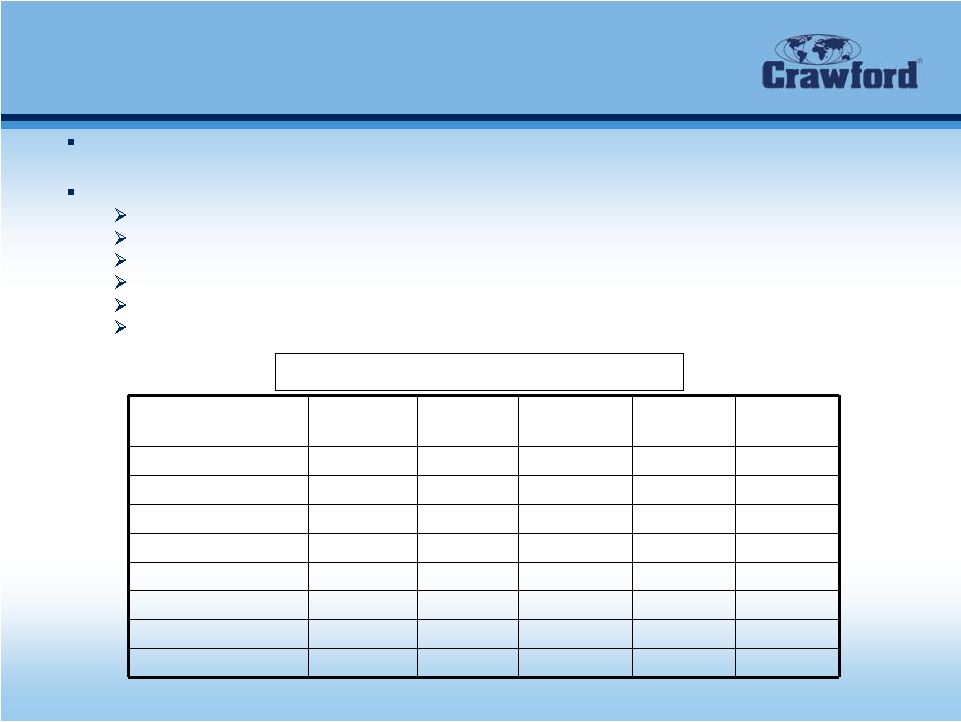 23 WORKING TOGETHER: the Crawford Difference Broadspire Positioning Third Largest TPA in Workers’ Compensation/Liability Market Products and Services: Workers’ Compensation Claims Services Auto and General Liability Claims Services Medical and Disability Management Services Long-Term Care Services Risk Management Information Systems (Risk Sciences Group) Claim Triage Solution (e-Triage) Broadspire Competitor A Competitor B Competitor C Competitor D Claim X X X X X RMIS X X X X X Med Bill Review X X TCM/UM X X FCM X Peer Review X Claim Triage X Long Term Care X Comparison of Service Providers |
 24 WORKING TOGETHER: the Crawford Difference $ in millions $ in millions $15.6 $19.0 $2.5 $1.5 Revenues and operating earnings decrease reflects ongoing slowdown in class action settlements Bankruptcy-related revenues increasing Backlog of $39.0 million First Quarter 2009 Financials Summary Results, Legal Settlement Administration For the quarters ended March 31, 2009 and 2008 in thousands except percentages Unaudited 2009 2008 % Change Revenues 15,558 $ 18,979 $ -18.0% Total Operating Expenses 14,031 16,482 -14.9% Operating Earnings 1,527 $ 2,497 $ -38.8% Operating Margin 9.8% 13.2% 0.0 0.5 1.0 1.5 2.0 2.5 1Q 2009 1Q 2008 Operating Earnings 10.0 12.0 14.0 16.0 18.0 20.0 1Q 2008 Revenue 1Q 2009 |
 WORKING TOGETHER: the Crawford Difference 25 Products and Services • The Garden City Group, Inc. (GCG) provides these core services: – GCG Class Action Services provides technology-intensive administrative services for plaintiff and defense counsel and corporate defendants to expedite high-volume class action settlements. – GCG Bankruptcy Services offers cost-effective, end-to-end solutions for managing the administration of bankruptcy cases under Chapter 11. – GCG Communications specializes in legal notice programs for successful case administration. GCG Communications offers a range of complementary services for developing and implementing effective legal notice programs worldwide. |
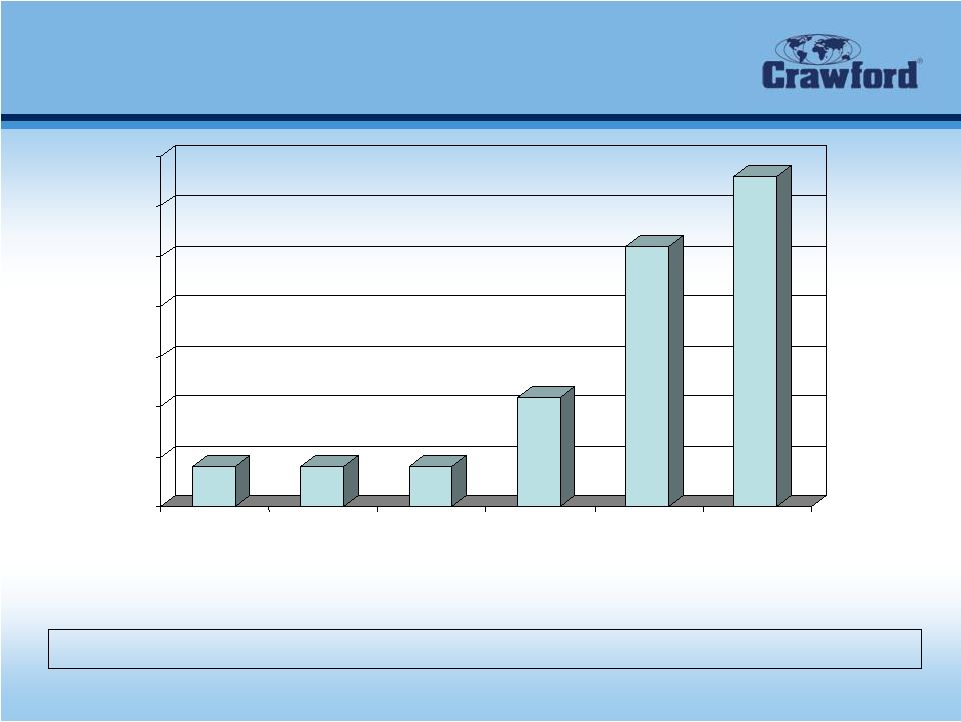 WORKING TOGETHER: the Crawford Difference 26 0 5 10 15 20 25 30 35 AB Data, Ltd. Berdon LLP Complete Claims Solutions, LLC Heffler Radetich & Saitra LLP Gilardi and Co., LLC Garden City Group Securities Class Action Cases Source: RiskMetrics Group (SCAS Top 100 since 1995, September 30, 2008) 4 4 4 11 26 33 GCG has handled one-third of the largest 100 securities class action cases |
 WORKING TOGETHER: the Crawford Difference Summary |
 28 WORKING TOGETHER: the Crawford Difference Crawford is “Positioned for Growth” • Access to growing global markets • Increasing market share both domestic and internationally • Crawford expects to benefit from global consolidation of TPA vendors • Diverse customer base • High customer retention rates • Emphasis on quality and value provided sustains client confidence • Disciplined management • Improved financial performance • Consolidated revenues, earnings, margins, and cash flows improved in 2008 • Investment in enhanced technology in all business units |
 WORKING TOGETHER: the Crawford Difference 29 Execution Strategy • Relentless dedication to outstanding execution • Each strategic action and intention translated into monthly, measurable, objectives and outcomes • Systematic tracking of interim milestones better enables leadership control and proactive decision making • Reinforce accountability, results orientation and strategic success throughout the year • Provide an effective and more detailed map for the enterprise and each business unit to achieve 2009 objectives |
 30 WORKING TOGETHER: the Crawford Difference 2009 Guidance • Reaffirming Full Year 2009 Guidance: – Consolidated revenue before reimbursements between $960 million and $980 million – Consolidated operating earnings between $50.5 million and $55.8 million – After reflecting stock-based compensation expense, net corporate interest expense, customer-relationship intangible amortization expense, special items and income taxes, net income attributed to Crawford & Company on a GAAP basis between $22.0 million and $25.0 million – Earnings per share of $.41 to $.47 |
 WORKING TOGETHER: the Crawford Difference 31 WORKING TOGETHER: the Crawford Difference “Crawford & Company will be known as a target driven corporation that meets its promises to clients and shareholders.” Jeffrey T. Bowman President and CEO |
 WORKING TOGETHER: the Crawford Difference 32 Appendix: Non-GAAP Financial Information Reimbursements for Out-of-Pocket Expenses In the normal course of our business, we sometimes pay for certain out-of-pocket expenses that are reimbursed by our clients. Under GAAP, these out-of-pocket expenses and associated reimbursements are reported as revenues and expenses in our Consolidated Statement of Income. In this presentation, we do not believe it is informative to include the GAAP-required gross up of our revenues and expenses for these pass-through reimbursed expenses. The amounts of reimbursed expenses and related revenues offset each other in our Consolidated Statement of Income with no impact to our net income. Unless noted in this presentation, revenue and expense amounts exclude reimbursements for out-of-pocket expenses. Net debt Management believes that net debt is useful because it provides investors with an estimate of what the Company’s debt would be if all available cash was used to pay down the debt of the Company. The measure is not meant to imply that management plans to use all available cash to pay down debt. Deferred Revenues, net Deferred Revenues, net is computed as the sum of the current and noncurrent deferred revenue as reported on our consolidated balance sheet less the sum of the current and noncurrent receivable held in trust to be released to us as payment to service this revenue. The current portion of the receivable held in trust is reported as a component of Accounts receivable and the noncurrent portion is reported as a component of Other Noncurrent Assets in our consolidated balance sheet. The funds represented by the amount of the receivable held in trust are released to the Company over time to partially offset the costs of servicing the deferred revenue. Management believes that subtracting the receivable held in trust from deferred revenue provides investors with a snapshot of what the net cash costs will be to service the deferred revenue in the future. Free Cash Flow Management believes free cash flow is useful to investors as it presents the amount of cash the Company has generated that can be used for other purposes, including additional contributions to the Company’s defined benefit pension plans, discretionary prepayments of outstanding borrowings under our credit agreement, and return of capital to shareholders, among other purposes. It does not represent the residual cash flow of the Company available for discretionary expenditures. |
 WORKING TOGETHER: the Crawford Difference 33 Appendix: Non-GAAP Financial Information (in $000's) December 31, December 31, 2008 2007 Deferred Revenues, Net Deferred revenues, current 59,679 $ 64,363 $ Deferrend revenues, noncurrent 42,795 58,925 Total deferred revenues 102,474 123,288 Less: Receivable held in trust included in accounts receivable 2,121 4,693 Receivable held in trust included in other noncurrent assets 4,683 7,559 Deferred revenues, net 95,670 $ 111,036 $ Net debt Short-term borrowings 13,366 $ 29,389 $ Current installments of long-term debt and capital leases 2,284 2,475 Long-term debt and capital leases, less current installments 181,206 183,449 Total debt 196,856 215,313 Less: Cash and cash equivalents 73,124 50,855 Net debt 123,732 $ 164,458 $ |
 WORKING TOGETHER: the Crawford Difference Fox-Pitt Kelton Cochran Caronia Waller Bank and Insurance Conference June 18, 2009 |