 WORKING TOGETHER: the Difference Crawford Second Quarter 2009 Earnings Conference Call Monday, August 10, 2009 Exhibit 99.2 |
 WORKING TOGETHER: the Crawford Difference 2 Second Quarter Earnings Review August 10, 2009 • Founded in 1941, Crawford is the largest independent global provider of claims management solutions and a fully integrated global provider of these solutions for the growing multi-national market. • Crawford is divided into four operating segments that support the strategic positioning of the Company in a changing market place: – U.S. Property & Casualty • Serves the U.S. insurance company market – International Operations • Serves the global insurance industry and multinational corporations – Broadspire • Serves large national accounts, carriers and self-insured entities – Legal Settlement Administration • Provides administration for class action settlements and bankruptcy matters • Crawford’s independence, global presence and diversified business lines are key competitive advantages which set the Company apart from its competitors. |
 WORKING TOGETHER: the Crawford Difference 3 Forward-looking Statements and Segment Operating Earnings Forward Looking Statements: This presentation contains forward-looking statements, including statements about the future financial condition, results of operations and earnings outlook of Crawford & Company. Statements, both qualitative and quantitative, that are not historical may be “forward-looking” statements as defined in the Private Securities Litigation Reform Act of 1995. Forward-looking statements involve a number of risks and uncertainties that could cause actual results to differ materially from historical experience or Crawford & Company’s present expectations. Accordingly, no one should place undue reliance on forward-looking statements, which speak only as of the date on which they are made. Crawford & Company does not undertake to update forward-looking statements to reflect the impact of circumstances or events that may arise or not arise after the date the forward-looking statements are made. Results for any interim period presented herein are not necessarily indicative of results to be expected for the full year or for any other future period. For further information regarding Crawford & Company, and the risks and uncertainties involved in forward-looking statements, please read Crawford & Company’s reports filed with the United States Securities and Exchange Commission and available at www.sec.gov or in the Investor Relations section of Crawford & Company’s website at www.crawfordandcompany.com. Segment Operating Earnings: Under Statement of Financial Accounting Standards Number 131, Disclosures about Segments of an Enterprise and Related Information, segment operating earnings is the primary measure used by the Company to evaluate the results of each of its four operating segments. Segment operating earnings exclude income taxes, interest expense, amortization of customer-relationship intangible assets, stock option expense, earnings or loss attributable to non- controlling interests, and certain other nonrecuring gains and expenses. Non-GAAP Financial Information: For additional information about the non-GAAP financial information presented herein, see the Investor Relations section of Crawford & Company’s website at www.crawfordandcompany.com under the heading Presentations. |
 WORKING TOGETHER: the Crawford Difference Working Together – The Crawford Difference Agenda: • Welcome and Opening Comments • Crawford System of Claims Solutions • Overview of 2009 Second Quarter • 2009 Second Quarter Financial Review • Segment Operating Highlights • Outlook for Fiscal 2009 4 |
 WORKING TOGETHER: the Crawford Difference Opening Comments • Our Performance and Opening Comments • Economic Outlook • Market Trends and Discussion • Expansion of Broadspire Services Brand in the U.K. 5 |
 The Crawford System of Claims Solutions SM The Crawford System is the most comprehensive global, integrated solution for corporate, insurer, and re-insurer claims administration. WORKING TOGETHER: the Crawford Difference |
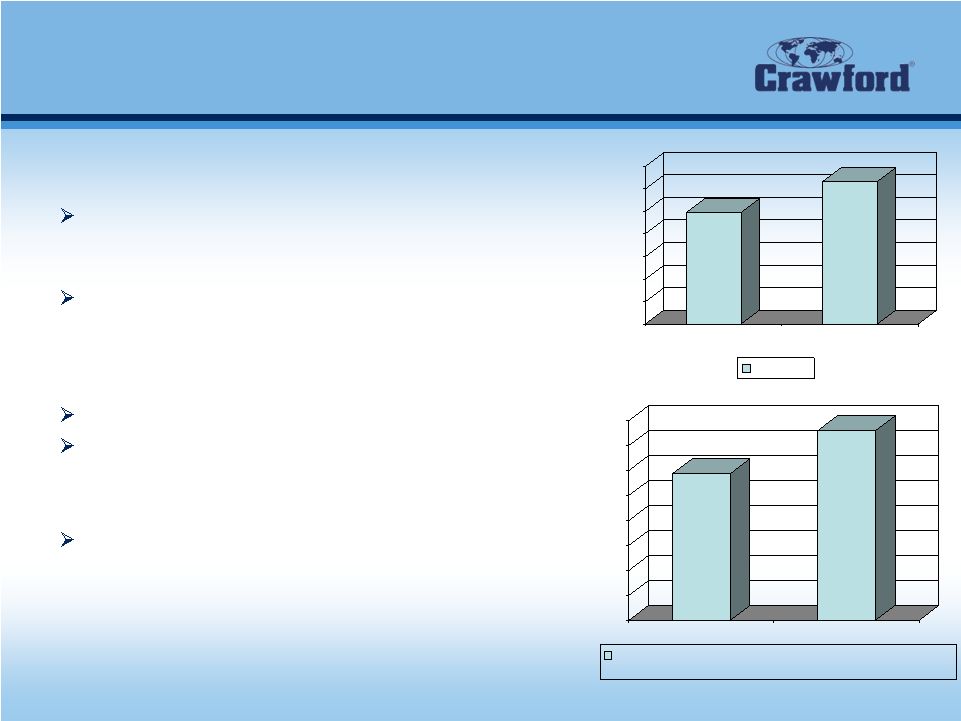 WORKING TOGETHER: the Crawford Difference 7 Second Quarter Overview • Encouraging financial performance in a difficult operating environment Second quarter consolidated revenue decline of 5.2% as a strong U.S. dollar negatively affected revenues by $24.3 million $94 million non-cash impairment of goodwill related to the Broadspire segment reduced earnings per share by $1.81 • Growth in U.S. Property & Casualty U.S. Property & Casualty revenue up 6.5% Cases increased 2.6% • International Operations revenue grew 6.1% on a constant dollar basis Improvements in Canada and Asia Pacific • Large projects benefited Legal Settlement Administration • Broadspire revenue down 7.6% 200 210 220 230 240 250 260 270 2Q 2009 2Q 2008 Revenue $ in millions 0 1 2 3 4 5 6 7 8 2Q 2009 2Q 2008 Net Income Attributable to Crawford & Company before Goodwill Impairment $ in millions $249.7 $263.3 $5.9 $7.9 |
 Revenue and Earnings Per Share Bridge 2 Quarter 2008 to 2009 8 In millions, except per share amounts Revenues Before Reimbursements Net Income (Loss) Attributable to Crawford & Company EPS 2nd quarter 2008 results $263.3 $7.9 $0.16 (Less)/Add: Foreign currency impact in 2009 (24.3) (1.5) (0.03) Increase in pension expense in 2009 - (3.0) (0.06) Preliminary goodwill impairment charge in 2009 - (94.0) (1.81) All other operating changes 10.7 2.5 0.04 2nd quarter 2009 results $249.7 ($88.1) ($1.70) nd WORKING TOGETHER: the Crawford Difference |
 WORKING TOGETHER: the Difference Crawford Second Quarter 2009 Financial Review |
 WORKING TOGETHER: the Crawford Difference 10 Second Quarter 2009 Financials CRAWFORD & COMPANY CONDENSED CONSOLIDATED STATEMENTS OF OPERATIONS Unaudited (In Thousands, Except Earnings Per Share Amounts and Percentages) Three Months Ended June 30 2009 2008 % Change Revenues: Revenues Before Reimbursements $249,664 $263,265 -5% Reimbursements 21,979 26,001 -15% Total Revenues 271,643 289,266 -6% Costs and Expenses: Costs of Services Before Reimbursements 183,884 189,461 -3% Reimbursements 21,979 26,001 -15% Total Cost of Services 205,863 215,462 -4% Selling, General, and Administrative 54,414 56,204 -3% Corporate Interest Expense, Net 3,640 4,656 -22% Goodwill Impairment Charge 94,000 - nm Total Costs and Expenses 357,917 276,322 30% (Loss) Income Before Income Taxes (86,274) 12,944 nm Provision for Income Taxes 1,615 4,786 -66% Net (Loss) Income (87,889) 8,158 nm Less: Net Income Attributable to Noncontrolling Interests (235) (226) 4% Net (Loss) Income Attributable to Crawford & Company ($88,124) $7,932 nm (Loss) Earnings Per Share - Basic and Diluted ($1.70) $0.16 nm |
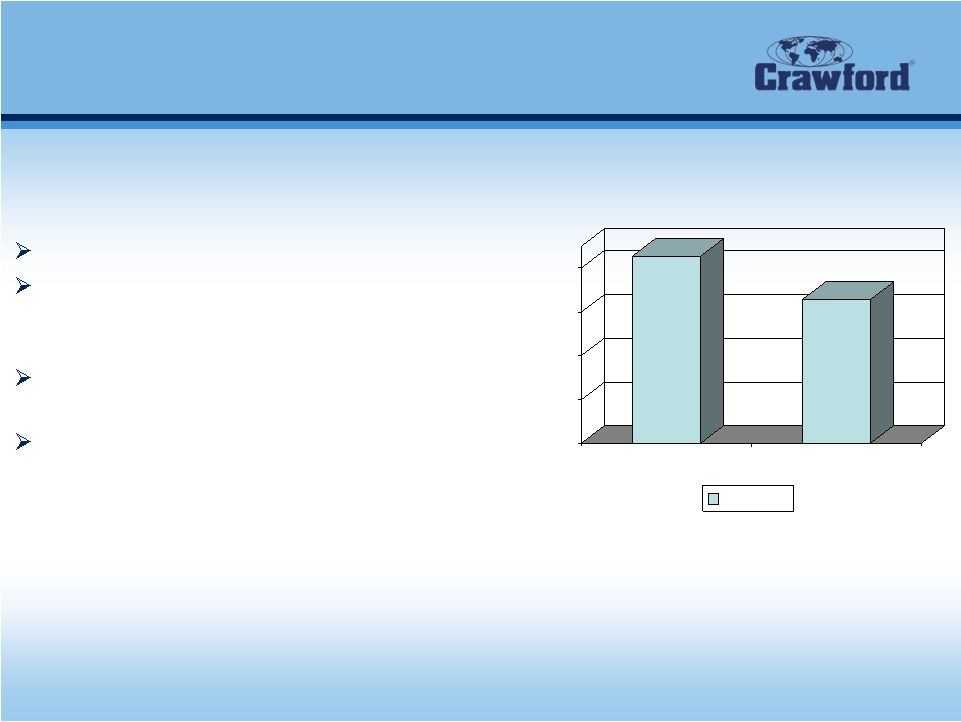
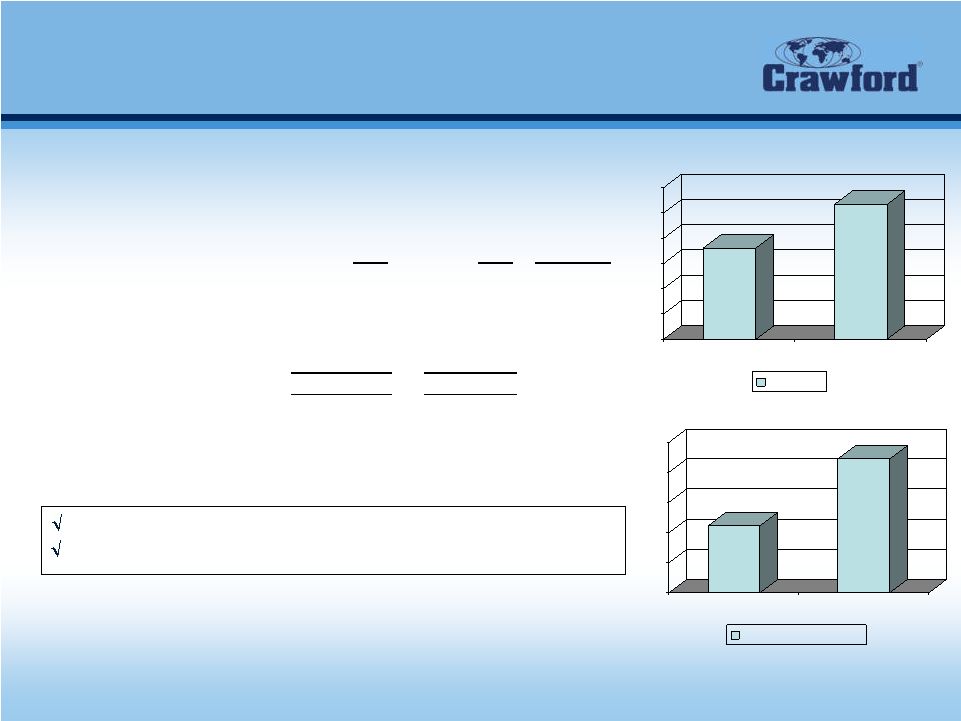 WORKING TOGETHER: the Crawford Difference 11 60 70 80 90 100 110 120 2Q 2009 2Q 2008 Revenue 6 7 8 9 10 11 2Q 2009 2Q 2008 Operating Earnings $ in millions $ in millions Second Quarter 2009 Financials $96.1 $113.4 $8.2 $10.4 Summary Results, International Operations For the quarters ended June 30, 2009 and 2008 in thousands except percentages Unaudited 2009 2008 % Change Revenues 96,127 $ 113,433 $ -15.3% Total Operating Expenses 87,907 102,987 -14.6% Operating Earnings 8,220 $ 10,446 $ -21.3% Operating Margin 8.6% 9.2% Revenues down $24.3 million due to strong U.S. dollar Revenue increased 6.1% on a constant dollar basis |
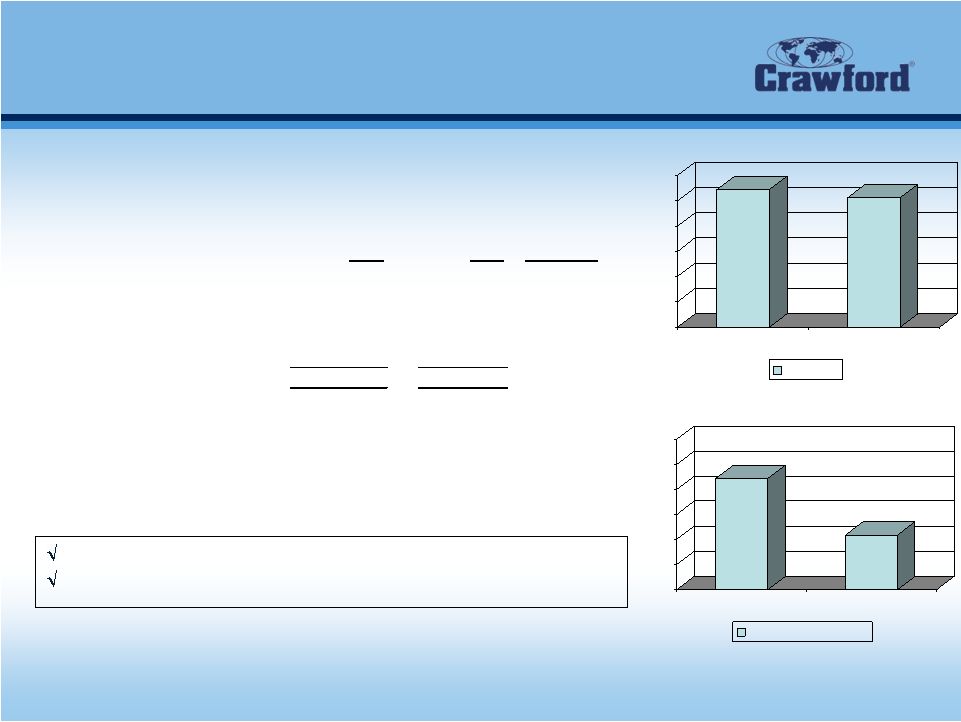 WORKING TOGETHER: the Crawford Difference 12 0 10 20 30 40 50 60 2Q 2009 2Q 2008 Revenue 4.0 4.5 5.0 5.5 6.0 6.5 7.0 2Q 2009 2Q 2008 Operating Earnings $ in millions $ in millions $51.2 $54.5 $5.1 $6.2 Catastrophe revenue up $3.7 million due to severe weather Double-digit operating margin Second Quarter 2009 Financials Summary Results, U.S. Property & Casualty For the quarters ended June 30, 2009 and 2008 in thousands except percentages Unaudited 2009 2008 % Change Revenues 54,547 $ 51,198 $ 6.5% Total Operating Expenses 48,329 46,106 4.8% Operating Earnings 6,218 $ 5,092 $ 22.1% Operating Margin 11.4% 9.9% |
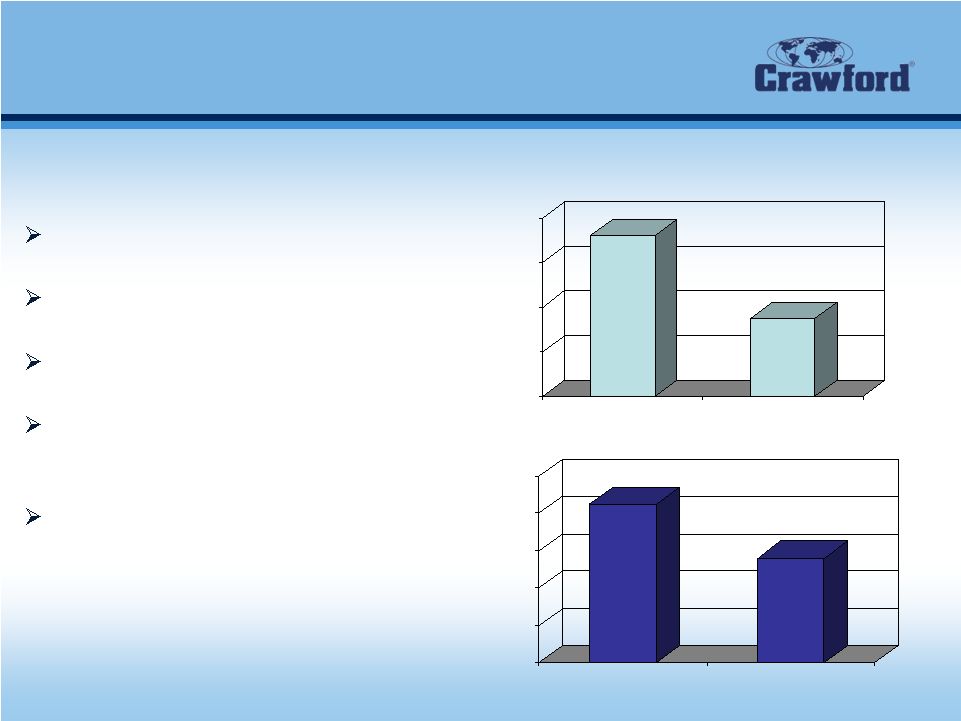
 WORKING TOGETHER: the Crawford Difference 13 40 50 60 70 80 90 2Q 2009 2Q 2008 Revenue $ in millions $ in millions $73.1 $79.1 $2.5 ($0.6) Revenues and earnings decline due to lower workers’ compensation claim referrals Impact of economic crisis being felt most by this segment Goodwill impairment charge due primarily to declining U.S. employment levels and declines in stock price Second Quarter 2009 Financials Summary Results, Broadspire For the quarters ended June 30, 2009 and 2008 in thousands except percentages Unaudited 2009 2008 % Change Revenues 73,056 $ 79,065 $ -7.6% Total Operating Expenses 73,662 76,525 -3.7% Operating Earnings (Loss) (606) $ 2,540 $ nm Operating Margin -0.8% 3.2% -1 - 0.5 0 0.5 1 1.5 2 2.5 3 2Q 2009 2Q 2008 Operating Earnings (Loss) |
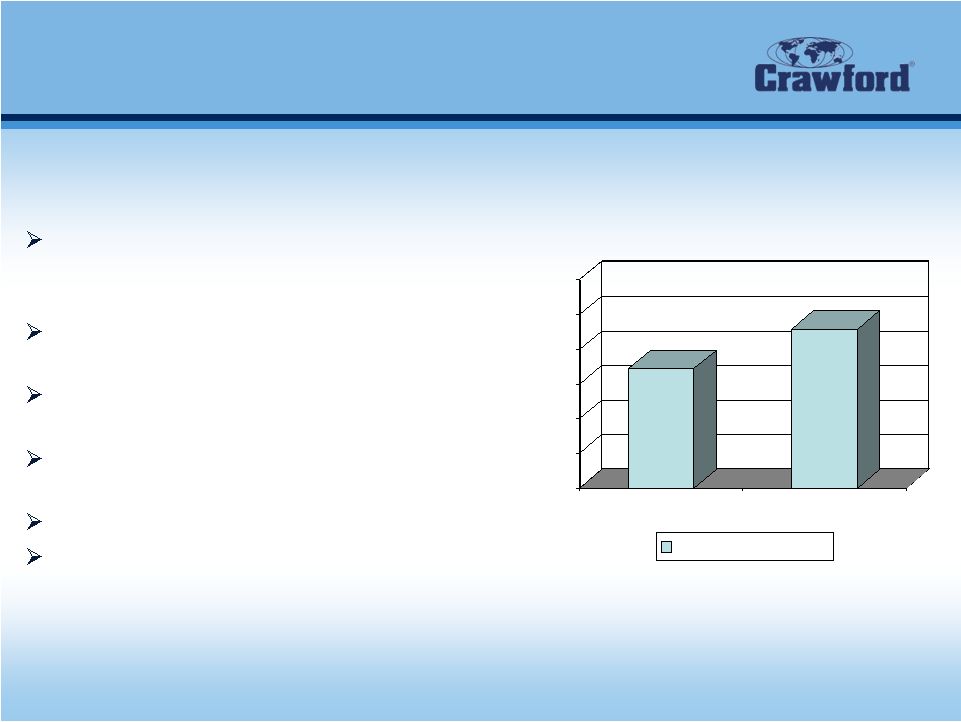
 WORKING TOGETHER: the Crawford Difference 14 15.0 17.0 19.0 21.0 23.0 25.0 27.0 29.0 2Q 2009 2Q 2008 Revenue 0.0 1.0 2.0 3.0 4.0 5.0 2Q 2009 2Q 2008 Operating Earnings $ in millions $ in millions $25.9 $19.6 $3.1 $4.3 Revenue and operating earnings increase reflects benefit of significant bankruptcy and securities class action administration cases awarded in 2009 Record backlog of $62.8 million Second Quarter 2009 Financials Summary Results, Legal Settlement Administration For the quarters ended June 30, 2009 and 2008 in thousands except percentages Unaudited 2009 2008 % Change Revenues 25,934 $ 19,569 $ 32.5% Total Operating Expenses 21,647 16,427 31.8% Operating Earnings 4,287 $ 3,142 $ 36.4% Operating Margin 16.5% 16.1% |
 WORKING TOGETHER: the Crawford Difference 15 Second Quarter 2009 Financials Crawford & Company Balance Sheet Highlights As of June 30, 2009 and December 31, 2008 (in thousands) June 30 December 31, 2009 2008 Change Cash and cash equivalents $58,100 $73,124 ($15,024) Accounts receivable, net 149,099 157,430 (8,331) Work in process 101,393 99,115 2,278 Total receivables 250,492 256,545 (6,053) Deferred revenues, net 90,462 95,670 (5,208) Pension liabilities 176,150 179,542 (3,392) Current portion of long-term debt, capital leases and short-term borrowings 15,021 15,650 (629) Long-term debt, less current portion 180,066 181,206 (1,140) Total debt 195,087 196,856 (1,769) Total stockholders' equity* 95,559 180,359 (84,800) Net debt** 136,987 123,732 13,255 Total debt / capitalization 67% 52% *Reflects retroactive adoption of SFAS 160, "Noncontrolling Interests in Consolidated Financial Statements" **Net debt is defined by the Company as long-term debt, capital leases and short-term borrowings, net of cash and cash equivalents |
 WORKING TOGETHER: the Crawford Difference 16 Second Quarter 2009 Financials Crawford & Company Free Cash Flow For the year-to-date periods ended June 30, 2009 and 2008 (In Thousands) June 30, June 30, 2009 2008 Variance Net (Loss) Income Attributable to Crawford & Company ($85,042) $17,000 ($102,042) Plus: Non-Cash Preliminary Goodwill Impairment Charge 94,000 - nm Plus: Depreciation and Other Non-Cash Operating Items 19,039 18,200 839 Less: Working Capital Change (19,221) (21,235) 2,014 Less: U.S. Pension Contributions (5,100) (2,900) (2,200) Operating Cash Flow 3,676 11,065 (7,389) Less: Capital Expenditures (5,744) (7,288) 1,544 Less: Internally Developed Software (5,666) (5,949) 283 Less: Mandatory Principal Payments (1,050) (1,050) - Free Cash Flow ($8,784) ($3,222) ($5,562) |
 Second Quarter 2009 Segment Highlights WORKING TOGETHER: the Crawford Difference |
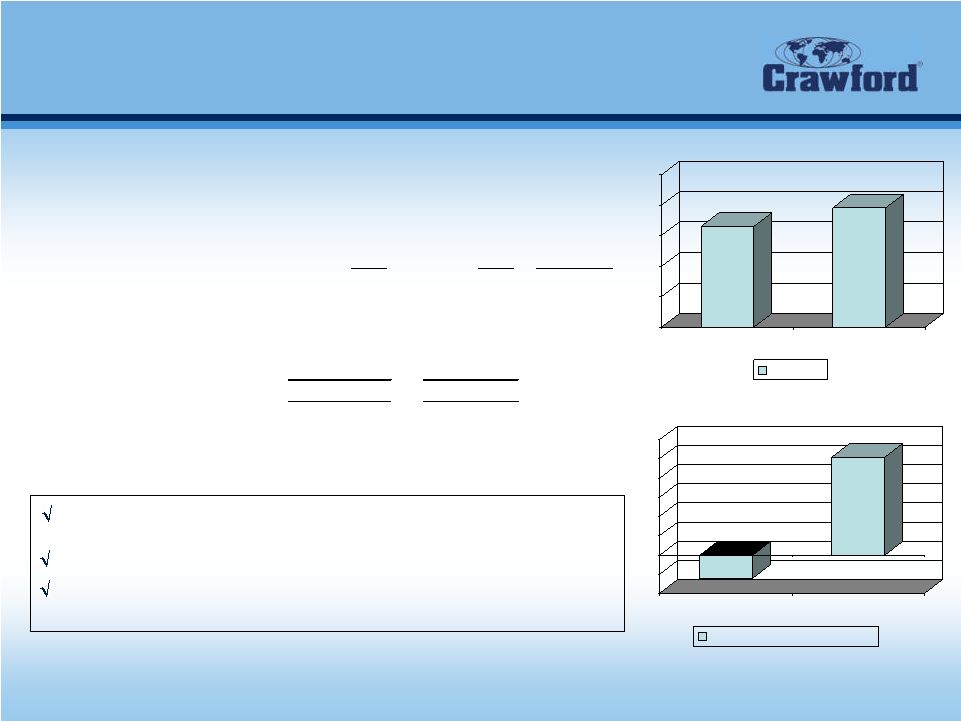
 WORKING TOGETHER: the Crawford Difference 18 Second Quarter 2009 Financials 110 120 130 140 150 160 2Q 2009 2Q 2008 International Claims Claims referred in 000s 139.5 150.7 International Operations Global revenue growth of 6.1% before currency impacts FX impact on second quarter revenues was negative 21.4%, or $24.3 million Improvements in Canada and Asia Pacific Operating margin decreased to 8.6% from 9.2% Claims referred decreased 7.5% as weather affected claims in U.K. and Canada saw fewer auto claims |
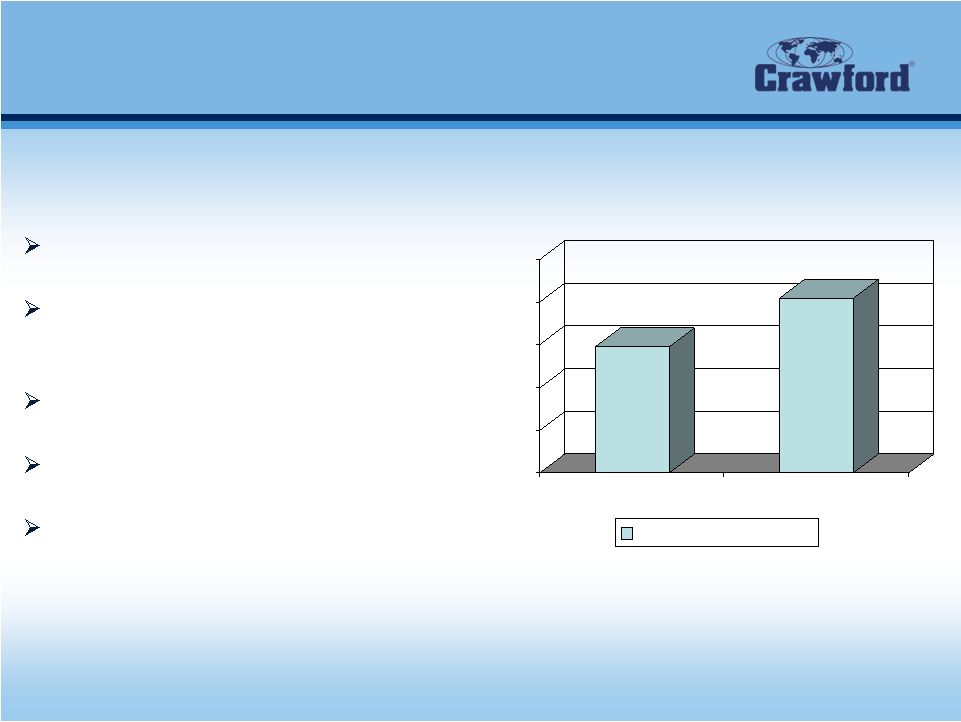
 WORKING TOGETHER: the Crawford Difference 19 Second Quarter 2009 Financials U.S. Property & Casualty Revenue growth of 6.5% Operating margin of 11.4%, up from 9.9% in 2008 second quarter Technology-driven efficiencies continue to be realized Claims referred increased 2.6% due to increases in property and CAT-related claims 75 85 95 105 115 125 2Q 2009 2Q 2008 U.S. P&C Claims Claims referred in 000s 116.7 113.7 |
 WORKING TOGETHER: the Crawford Difference 20 U.S. Catastrophe (CAT) Activity 0 2 4 6 8 10 2Q 2009 2Q 2008 8.5 5.6 0 2 4 6 8 2Q 2009 2Q 2008 $7.2 $3.5 $ in millions Quarter Ended June 30: Revenues In 000s U.S. Catastrophe Catastrophe revenue up to $7.2 million from $3.5 million CAT events totaled 18 in the 2009 period compared to 25 in 2008 2009 reflects benefit due to severe weather in first and second quarter Strong incremental margins generated from CAT adjuster revenues Technology and process improvements Cases |
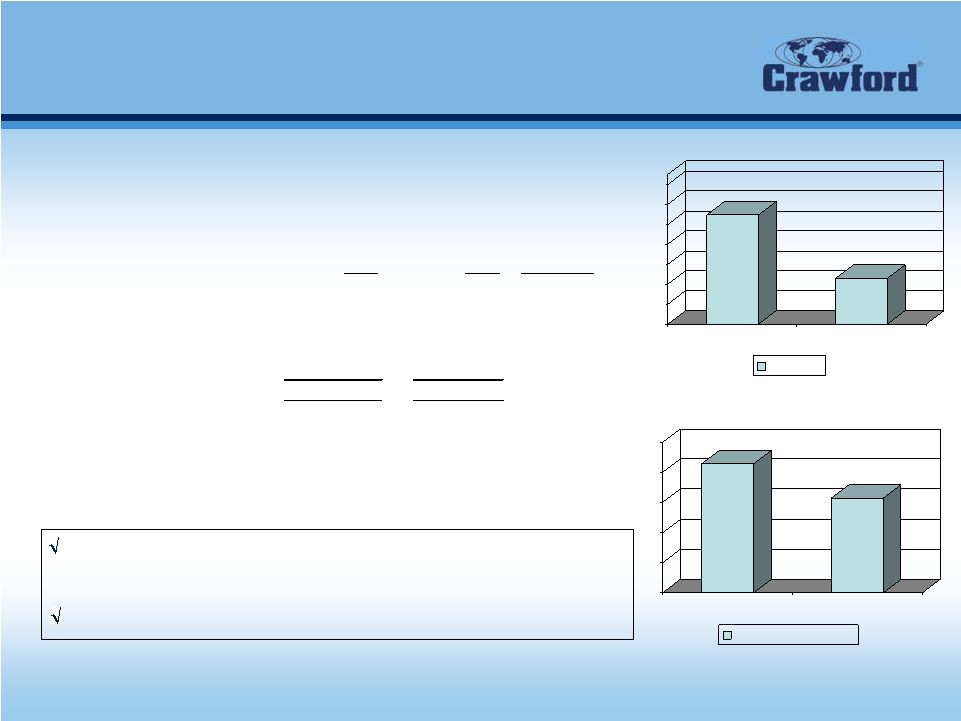
 WORKING TOGETHER: the Crawford Difference 21 Second Quarter 2009 Highlights Claims referred in 000s 57.2 62.9 Broadspire Workers’ Compensation market remains challenging due to rising U.S. unemployment levels Revenue decrease of 7.6% on 9.1% decline in claims Claim volume stabilizing in 2009 second quarter compared to 2009 first quarter Operating loss of $606,000 in the 2009 2 quarter Cost control program ongoing RiskTech implementation continues 40 45 50 55 60 65 70 2Q 2009 2Q 2008 Broadspire Claims nd |
 WORKING TOGETHER: the Crawford Difference 22 Second Quarter 2009 Highlights Legal Settlement Administration Revenue increased 32.5% Increase in bankruptcy related revenues led by several major cases awarded in 2009 Continued slowdown in securities class actions Record backlog of $62.8 million 20 30 40 50 60 2Q 2009 2Q 2008 Backlog Backlog in millions $62.8 $52.8 |
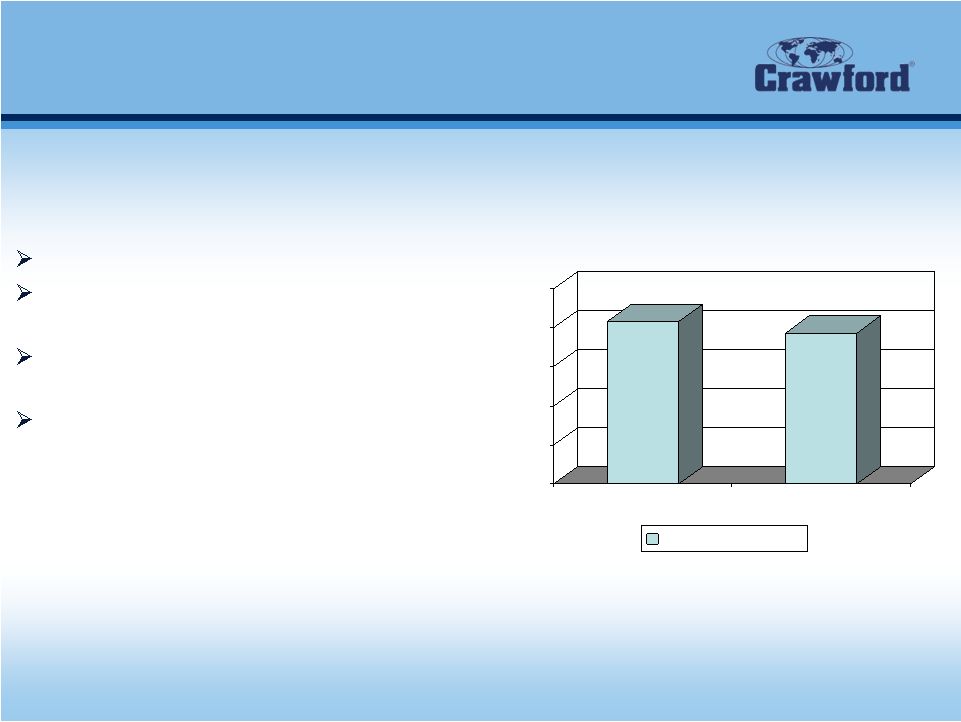
 WORKING TOGETHER: the Crawford Difference 23 2009 Guidance • Full Year 2009 Guidance: – Consolidated revenue before reimbursements between $960 million and $980 million – Consolidated operating earnings between $52.5 million and $57.8 million – Consolidated cash provided by operating activities between $35 and $40 million. – After reflecting stock-based compensation expense, net corporate interest expense, customer-relationship intangible amortization expense, special credits and charges and income taxes, net loss attributable to Crawford & Company on a GAAP basis between ($72.0) million and ($69.0) million – Loss per share of ($1.40) to ($1.34) – Before reflecting the special charge related to the preliminary goodwill impairment, net income attributable to Crawford & Company on a non-GAAP basis between $22.0 million and $25.0 million, or $0.41 to $0.47 diluted earnings per share |
 WORKING TOGETHER: the Crawford Difference Second Quarter 2009 Earnings Conference Call Monday, August 10, 2009 |