 Keefe, Bruyette & Woods 2011 Insurance Conference September 8, 2011 Exhibit 99.1 |
 Forward-looking Statements, Segment Operating Earnings and non-GAAP Financial Information Forward Looking Statements and Interim Results: This presentation contains forward-looking statements, including statements about the future financial condition, results of operations and earnings outlook of Crawford & Company. Statements, both qualitative and quantitative, that are not statements of historical fact may be “forward-looking” statements as defined in the Private Securities Litigation Reform Act of 1995 and other securities laws. Forward-looking statements involve a number of risks and uncertainties that could cause actual results to differ materially from historical experience or Crawford & Company’s present expectations. Accordingly, no one should place undue reliance on forward-looking statements, which speak only as of the date on which they are made. Crawford & Company does not undertake to update forward-looking statements to reflect the impact of circumstances or events that may arise or not arise after the date the forward-looking statements are made. Results for any interim period presented herein are not necessarily indicative of results to be expected for the full year or for any other future period. For further information regarding Crawford & Company, and the risks and uncertainties involved in forward-looking statements, please read Crawford & Company’s reports filed with the United States Securities and Exchange Commission and available at www.sec.gov or in the Investor Relations section of Crawford & Company’s website at www.crawfordandcompany.com. Segment Operating Earnings: Under the Financial Accounting Standards Board’s Accounting Standards Codification Topic 280, “Segment Reporting,” the Company has defined segment operating earnings as the primary measure used by the Company to evaluate the results of each of its four operating segments. Segment operating earnings exclude income taxes, interest expense, amortization of customer-relationship intangible assets, stock option expense, earnings or loss attributable to non- controlling interests, certain unallocated corporate and shared costs, and certain other nonrecurring gains and expenses. Non-GAAP Financial Information: For additional information about certain non-GAAP financial information presented herein, see the Appendix following this presentation. 2 |
         Market-Leading Global Businesses The world’s largest fully-integrated independent provider of global claims management solutions. EMEA-A/P Americas Broadspire Legal Settlement Administration Serves the U.K., European, Middle Eastern, African and Asia Pacific markets Serves the U.S., Canadian, Caribbean and Latin American markets Serves large national accounts, carriers and self- insured entities Provides administration for class action settlements and bankruptcy matters 3 |
 4 Crawford’s Award-Winning Performance Service Provider of the Year Crawford & Company With an unprecedented level of natural catastrophes across the world in 2010 and 2011, Crawford seized the opportunity to prove its global capabilities and has been recognized as Service Provider of the Year for its efforts. The British Insurance Awards 2011 Loss Adjuster of the Year Crawford & Company Australia Australia and New Zealand Insurance Industry Best Claims Administrator GCG The New York Law Journal - Best Vendors of 2010 Risk Innovator of the Year Risk and Insurance magazine Loss Adjuster of the Year Crawford & Company UK London Market Leaders Order of Merit 2010 - Global Broker & Underwriters' Annual London Market Readers Survey InfoWeek 500 2011 Award Winner Top 100 Insurance Industry Finalist Annual listing of the nation's most innovative users of Business Technology InformationWeek magazine Loss Adjuster of the Year Crawford & Company Australia Australia and New Zealand Insurance Industry |
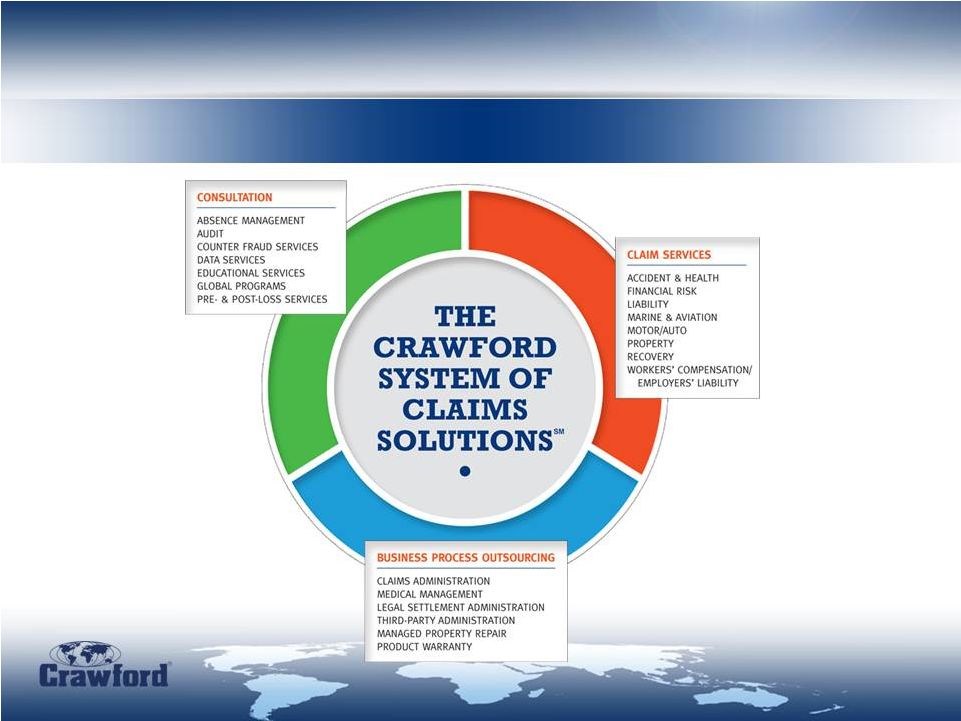 The Crawford System of Claims Solutions SM The Crawford System is the most comprehensive global, integrated solution for all corporate, insurer, and re-insurer claims administration. 5 |
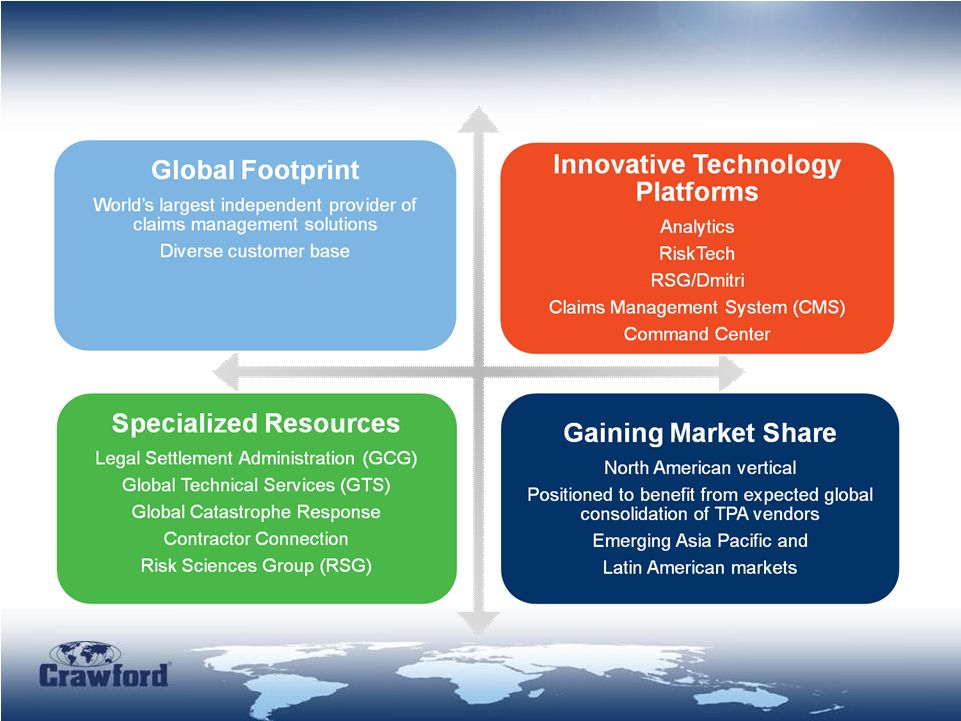 Crawford is uniquely positioned for global growth 6 |
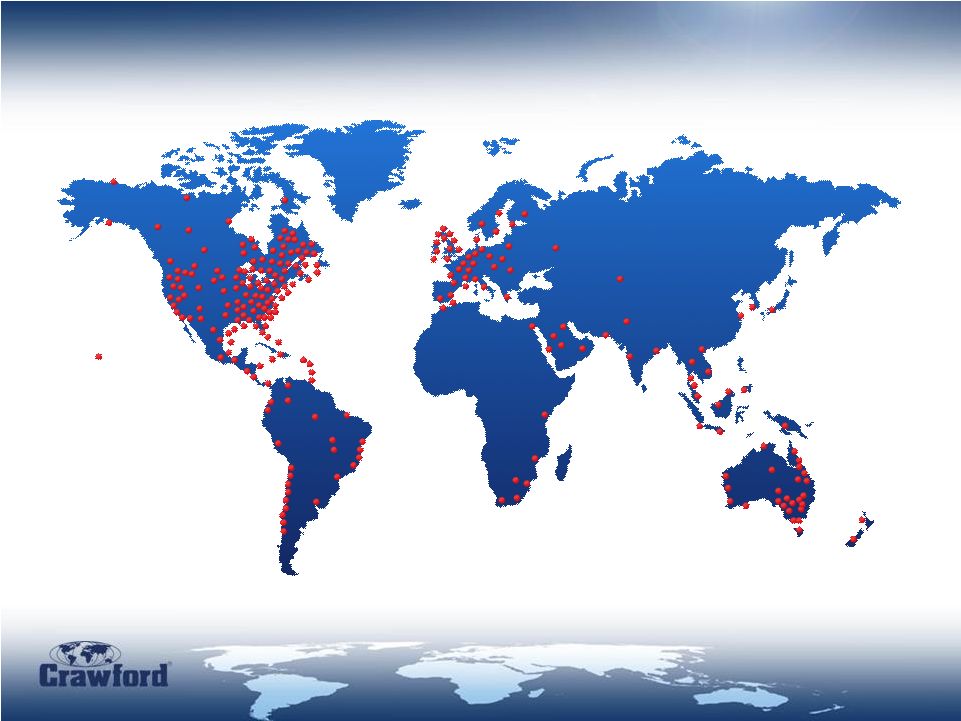 Our Global Strength $1 Billion Revenue Company 700 Locations 70+ Countries 8,900 Employees 7 |
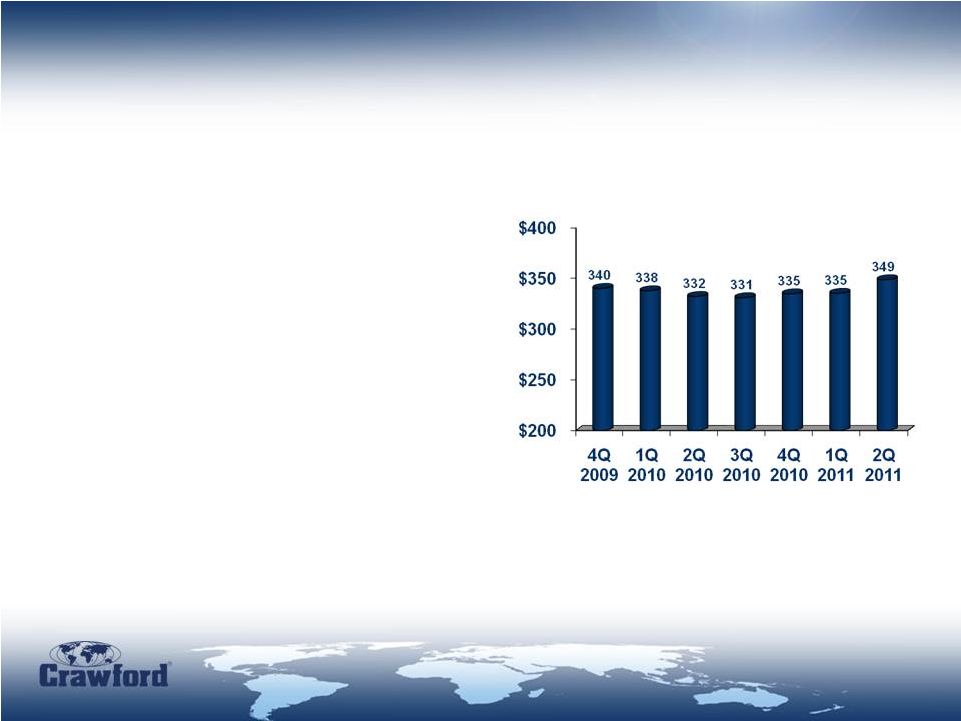 Americas • U.S. Property and Casualty • Market leader • Technology innovation • Benefit from U.S. market consolidation • Canada • Strong relationships with top insurers • End to end solutions • Innovation and technology • Latin America & Caribbean • Latin American emerging markets GDP growth on average 5% • Targeting markets in Brazil and Mexico • Focus on GTS growth Trailing 12 Months (“TTM”) Revenues (in $ millions) 8 |
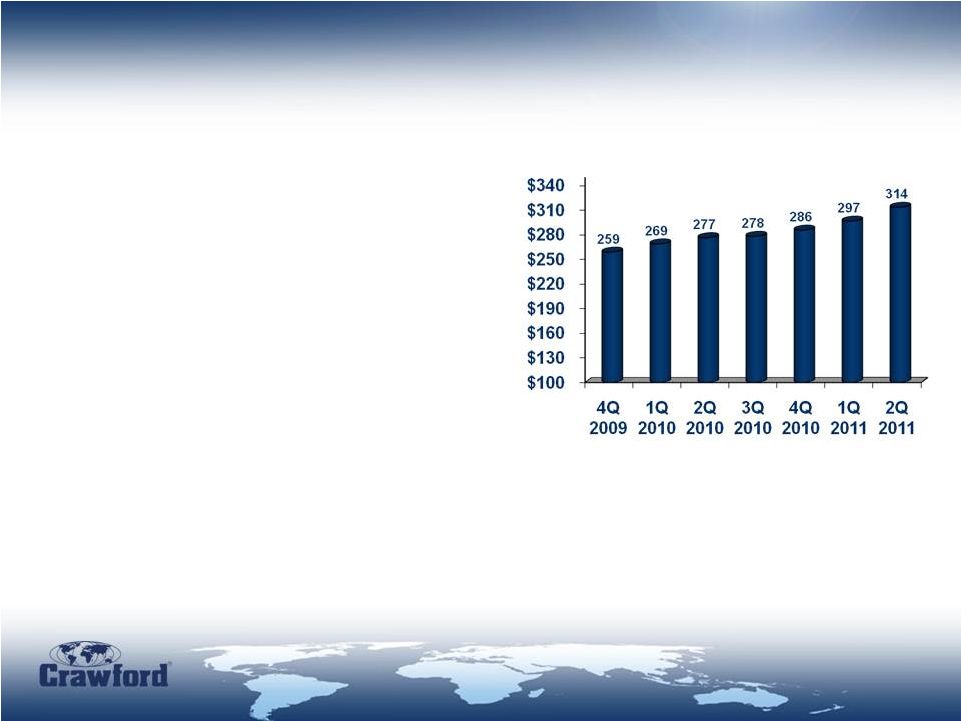 • United Kingdom • EMEA/AP’s largest market • Recruitment of GTS adjusters continues • Strong commercial presence • CEMEA • Expansion of TPA offerings • Claims volume increasing • Opportunity to grow market share • Asia/Pacific • Catastrophe revenues should continue for the balance of this year • New market opportunities TTM Revenues (in $ millions) EMEA/AP 9 |
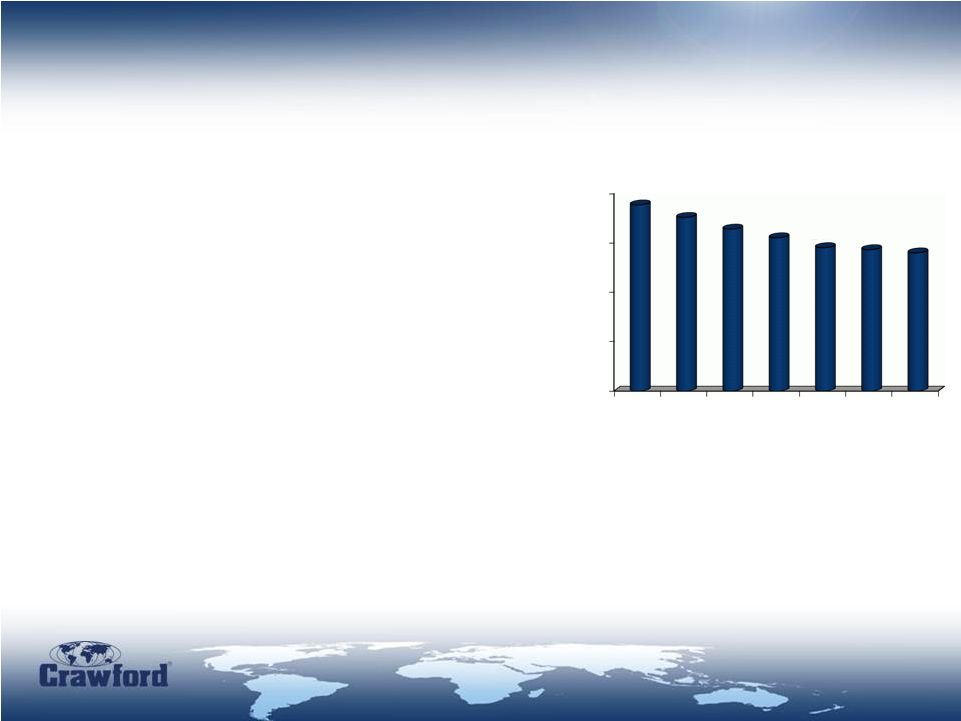 • Fully integrated service model • Improved outcomes by teaming claims and medical management • Superior outcomes measurement • Quantifiable measurements gauging our performance and providing insight for continued program improvement • Exceptional medical protocols • Shorter durations and focused strategy drive early, successful return to work and increased productivity • Technology • Single source claim and data management of complete program history ��� Analytics • Differentiator in the market TTM Revenues (in $ millions) Broadspire 10 $100 $150 $200 $250 $300 4Q 2009 1Q 2010 2Q 2010 3Q 2010 4Q 2010 1Q 2011 2Q 2011 289 276 264 255 245 243 240 |
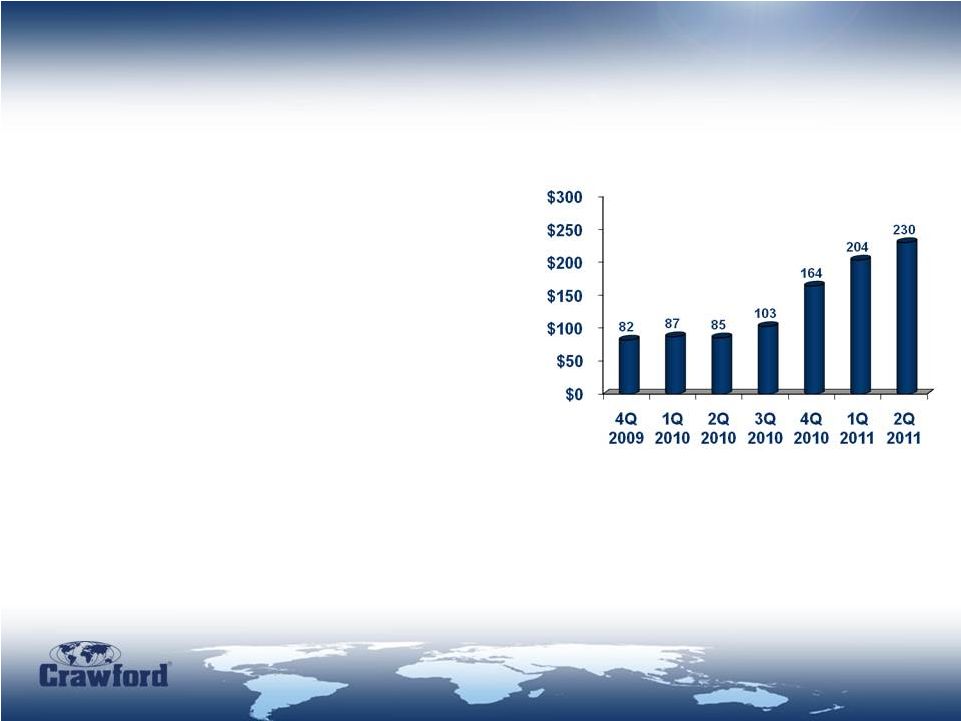 • Core services: • GCG Class Action Services provides administrative services to expedite high-volume class action settlements • GCG Bankruptcy Services manages the administration of bankruptcy cases under Chapter 11 • GCG Communications specializes in legal notice programs for case administration worldwide • Special project pace is expected to slow going forward but should contribute to revenues and operating earnings throughout 2011 • Backlog of $75.2 million at June 30, 2011 TTM Revenues (in $ millions) Legal Settlement Administration 11 |
 High Profile Specialized Resources: Worldwide Catastrophe Response Global Technical Services (GTS) Contractor Connection Garden City Group (GCG) |
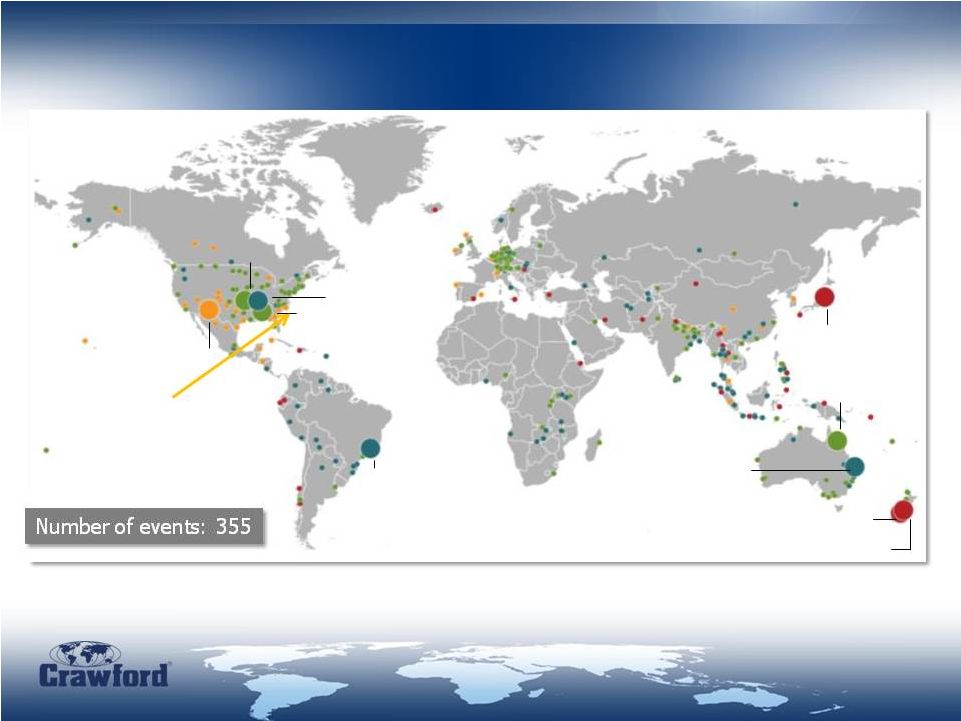 Crawford’s customer response to the unprecedented number of global catastrophes has been rapid, nimble and innovative Earthquake, tsunami Japan, 11 March Earthquake New Zealand, 22 Feb Cyclone Yasi Australia, 2 Feb Landslides, flash floods Brazil, 12-16 Jan Floods, flash floods Australia, Dec 2010-Jan 2011 Severe storms, tornadoes USA, 22–28 April Severe storms, tornadoes USA, 20–25 May Wildfires USA, May–June Earthquake New Zealand, 13 June Floods USA, April–June Source: MR NatCatSERVICE Yet to come: Hurricane Irene 13 |
 14 Global Technical Services • The definitive solution for large, complex claims, providing the highest level of world-class talent and the industry’s largest network to strategically manage large complex losses anywhere on the globe • Combining regional and local adjusting strengths to leverage scale and capabilities as a global provider • Currently tracking over 10,000 losses representing $35 billion in reserves • 425 fully accredited International Executive General Adjusters and Executive General Adjusters deployed in 45 countries • Advanced analytics based on segmentation of assignments in 12 Industry losses, 7 product lines and 35 perils • Consolidated aggregation of data for trend analysis and strategic planning Noteworthy large losses (reserves values) 2011 Australia, $1.0 billion 2010 UK, $650 million 2010 Chile $633 million 2011 South Africa $213 million 2010 UK, $180 million |
 Contractor Connection – Managed Repair Solutions • Dominant insurance industry leader • 3,500 contractors in the U.S. & Canada • Projected $1 billion in estimate dollars • Average 20% revenue growth over the last five years • Partner with 50% of top 25 carriers • Expanding into consumer services, real estate, and financial markets • Expansion opportunities in Australia |
 – Largest securities class action administrator in the country • Deep expertise in mega-case settlements • GCG has been entrusted with more billion dollar+ securities settlements than all competitors combined • No one handled more of the top 100 securities cases than GCG • More than 500 associates in 12 offices nationwide GCG Best Claims Administrator – 2010 New York Law Journal – Representative engagements: • Antitrust: Visa/MasterCard Settlement • Consumer: Contact Lens Settlement • Securities: WorldCom Securities Litigation • Mass Tort: Engle Tobacco Trust Fund • Bankruptcy: General Motors • Special Projects: Gulf Coast Claims Facility |
 Financial Review |
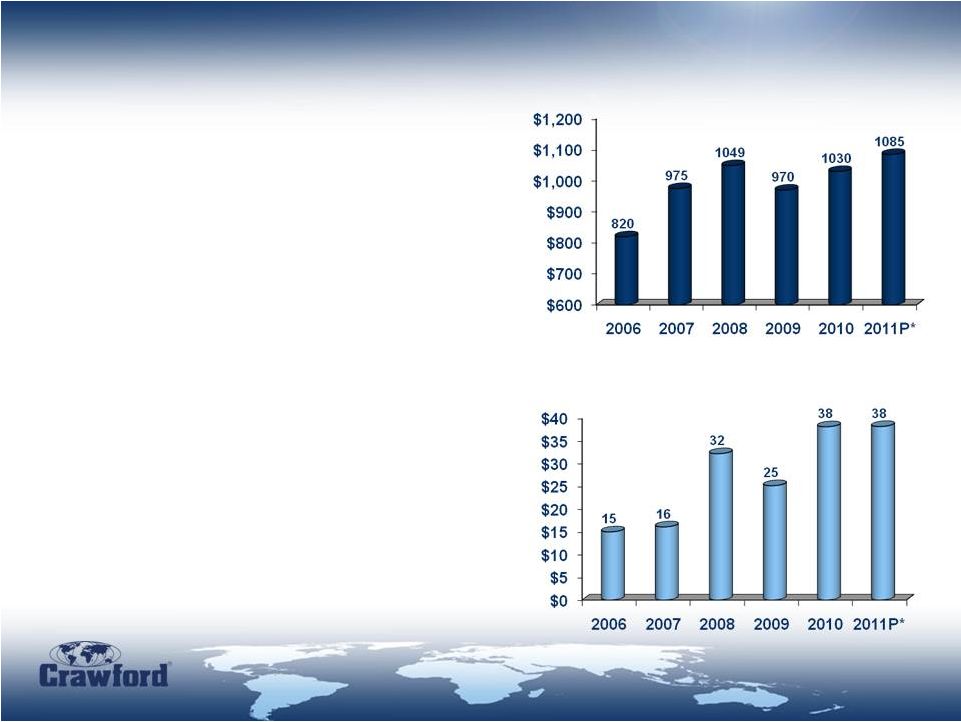 Crawford Financial Performance • Revenue CAGR of 5.8% from 2006 to projected 2011 • Strong performance in Legal Settlement Administration, organic growth in EMEA/AP, and acquisitions drove revenue growth • Before a special credit in 2011, CAGR of non-GAAP adjusted net income attributable to shareholders of Crawford & Company of 20.4% from 2006 to projected 2011* • Strong cash generation from 2006 to 2010 • Dividend reinstated in first quarter 2011 at $0.02 per share * Based on the midpoint of the Company’s guidance as of August 8, 2011 Consolidated Revenues (in $ millions) Non-GAAP Adjusted Net Income Attributable to Shareholders of Crawford & Company (in $ millions) 18 |
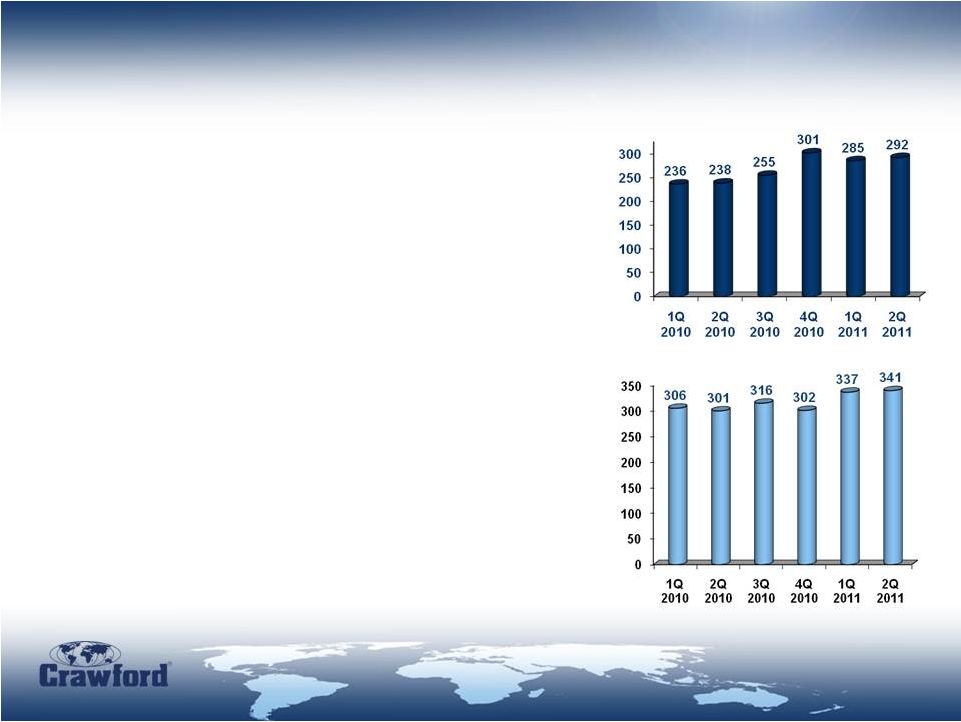 First Half 2011 Business Drivers • Revenues and earnings reflected continued strong performance in Legal Settlement Administration, due to a special project • Americas’ rebound assisted by U.S. catastrophe activity • Organic growth in EMEA/AP primarily due to weather-related claims in Australia and the U.K. • Group claims increased 11.7% over the prior year period • Diluted earnings per share were $0.48, compared with non-GAAP diluted earnings per share of $0.14 in the 2010 period, excluding a goodwill impairment charge of $0.13 Revenues (in $ millions) Cases (in 000’s) 19 |
 First Half 2011 Financials 20 Income Statement Highlights Six months ended 2011 2010 % Change Revenues $576,751 $474,417 22% Costs of Services 417,715 352,970 18% Selling, General, and Administrative Expenses 113,159 99,378 14% Corporate Interest Expense, Net 8,254 7,809 6% Restructuring and Other Costs - 4,650 nm Goodwill Impairment Charge - 7,303 nm Total Costs and Expenses before Reimbursements 539,128 472,110 14% Income Before Income Taxes 37,623 2,307 nm Provision for Income Taxes 12,042 1,758 585% Net Income 25,581 549 nm Less: Net Income (Loss) Attributable to Noncontrolling Interests (35) 22 -259% Net Income Attributable to Shareholders of Crawford & Company $25,616 $527 nm Basic and Diluted Earnings Per Share $0.48 $0.01 nm Cash Dividends per Share: Class A and Class B Common Stock $0.04 -- nm nm=not meaningful CRAWFORD & COMPANY Unaudited (In Thousands, Except Earnings and Dividend Per Share Amounts and Percentages) |
 First Half 2011 Financials 21 Crawford & Company Balance Sheet Highlights Unaudited As of June 30, 2011 and December 31, 2010 June 30, December 31, 2011 2010 Change Cash and cash equivalents $37,206 $93,540 ($56,334) Accounts receivable, net 185,026 142,521 42,505 Unbilled revenues, net 136,726 122,933 13,793 Total receivables 321,752 265,454 56,298 Goodwill 129,872 125,764 4,108 Deferred revenues, net 78,889 75,526 3,363 Pension liabilities 139,045 165,030 (25,985) Current portion of long-term debt, capital leases and short-term borrowings 3,426 2,891 535 Long-term debt, less current portion 217,589 220,437 (2,848) Total debt 221,015 223,328 (2,313) Total stockholders' equity attributable to Crawford & Company 126,317 89,516 36,801 Net debt* 183,809 129,788 54,021 Total debt/capitalization 64% 71% *Net debt is defined by the Company as long-term debt, capital leases and short-term borrowings, net of cash and cash equivalents. (In Thousands, except percentages) |
 2011 Focus and Outlook |
 2011 Operational Focus • Key account management/cross-selling through the Crawford System of Claims Solutions • Continue to grow Business Process Outsourcing • Further expansion of Global Technical Services (GTS) and Contractor Connection • International expansion of TPA offerings • Improve margins through cost control in all business segments 23 |
 2011 Guidance • Full Year 2011 Guidance as of August 8, 2011 is affirmed: – Consolidated revenues before reimbursements between $1.07 billion and $1.10 billion – Consolidated operating earnings between $75.0 million and $83.0 million – Consolidated cash provided by operating activities between $30.0 million and $35.0 million – After reflecting stock-based compensation expense, net corporate interest expense, customer-relationship intangible asset amortization expense, special credits, and income taxes, net income attributable to shareholders of Crawford & Company on a GAAP basis between $41.0 million and $46.5 million, or $0.75 to $0.85 diluted earnings per share – Before reflecting the special credit of $5.8 million net of tax, or $0.11 per share, related to an arbitration award, net income attributable to shareholders of Crawford & Company on a non-GAAP basis between $35.5 million and $41.0 million, or $0.65 to $0.75 diluted earnings per share 24 |
 Keefe, Bruyette & Woods 2011 Insurance Conference September 8, 2011 |
 Appendix: Non-GAAP Financial Information Measurements of financial performance not calculated in accordance with GAAP should be considered as supplements to, and not substitutes for, performance measurements calculated or derived in accordance with GAAP. Any such measures are not necessarily comparable to other similarly-titled measurements employed by other companies. Reimbursements for Out-of-Pocket Expenses In the normal course of our business, we sometimes pay for certain out-of-pocket expenses that are reimbursed by our clients. Under GAAP, these out-of-pocket expenses and associated reimbursements are reported as revenues and expenses in our Consolidated Statements of Operations. In this presentation, we do not believe it is informative to include the GAAP-required gross up of our revenues and expenses for these pass-through reimbursed expenses. The amounts of reimbursed expenses and related revenues offset each other in our Consolidated Statements of Operations with no impact to our net income or loss. Unless noted in this presentation, revenue and expense amounts exclude reimbursements for out-of-pocket expenses. Net debt Net debt is computed as the sum of long-term debt, capital leases and short-term borrowings less cash and cash equivalents. Management believes that net debt is useful because it provides investors with an estimate of what the Company’s debt would be if all available cash was used to pay down the debt of the Company. The measure is not meant to imply that management plans to use all available cash to pay down debt. Deferred Revenues, net Deferred Revenues, net is computed as the sum of the current and noncurrent deferred revenues as reported on our Consolidated Balance Sheets less the sum of the current and noncurrent receivable held in trust to be released to us as payment to service these revenues. The current portion of the receivable held in trust is reported as a component of Accounts Receivable and the noncurrent portion is reported as a component of Other Noncurrent Assets in our Consolidated Balance Sheets. The funds represented by the amount of the receivable held in trust are released to the Company over time to partially offset the costs of servicing the deferred revenues. Management believes that subtracting the receivable held in trust from deferred revenues provides investors with a snapshot of what the net cash costs will be to service the deferred revenues in the future. Non-GAAP Adjusted Net Income Attributable to Shareholders of Crawford & Company Non-GAAP adjusted net income attributable to shareholders of Crawford & Company excludes Broadspire acquisition-related goodwill impairment charges and a related credit for a purchase price arbitration award. Management believes this is useful to investors as it presents a measure that can be more easily compared to other periods that do not have such charges. 26 |
 27 Reconciliation of Non-GAAP Items (in $000's) 2006 2007 2008 Revenues Before Reimbursements Total Revenues 900 $ 1,051 $ 1,136 $ 1,048 $ 1,110 $ 1,172 $ Reimbursements (80) (76) (87) (78) (80) (87) Revenues Before Reimbursements 820 $ 975 $ 1,049 $ 970 $ 1,030 $ 1,085 $ Non-GAAP Adjusted Net Income Attributable to Shareholders of Crawford & Company Net Income (Loss) Attributable to Shareholders of Crawford & Company 15,011 $ 16,116 $ 32,259 $ (115,683) $ 28,328 $ 43,840 $ Goodwill Impairment Charge/(Special Credit) 140,945 $ 10,788 $ (6,967) $ Tax Impact of Goodwill Impairment Charge/(Special Credit) - - - - 140,945 (948) 9,840 1,127 (5,480) Non-GAAP Adjusted Net Income Attributable to Shareholders of Crawford & Company 15,011 $ 16,116 $ 32,259 $ 25,262 $ 38,168 $ 38,000 $ *Midpoint of Company guidance as of August 8, 2011 2010 2011 Projected* 2009 |
 28 Reconciliation of Non-GAAP Items (cont.) Net Income (Loss) Attributable Net to Shareholders Earnings Income (Loss) Tax Income of Crawford (Loss) Per Before Taxes Expense (Loss) & Company Share As reported 2,307 $ 1,758 $ 549 $ 527 $ 0.01 $ Add: Goodwill impairment charge 7,303 462 6,841 6,841 0.13 Non-GAAP adjusted 9,610 $ 2,220 $ 7,390 $ 7,374 $ 0.14 Crawford & Company Reconciliation of Net Income Attributable to Shareholders of Crawford & Company and Earnings Per Share to Non-GAAP Adjusted Net Income Attributable to Shareholders and Earnings Per Share of Crawford & Company For the Six Months Ended June 30, 2010 |
 Reconciliation of Non-GAAP Items 29 Crawford & Company (in $000's) June 30, December 31, 2011 2010 Deferred Revenues, Net Deferred revenues, current 51,605 $ 48,198 $ Deferred revenues, noncurrent 29,098 30,048 Total deferred revenues 80,703 78,246 Less: Receivable held in trust included in accounts receivable 1,661 1,661 Receivable held in trust included in other noncurrent assets 153 1,059 Deferred revenues, net 78,889 $ 75,526 $ Net Debt Short-term borrowings 484 $ - $ Current installments of long-term debt and capital leases 2,942 2,891 Long-term debt and capital leases, less current installments 217,589 220,437 Total debt 221,015 223,328 Less: Cash and cash equivalents 37,206 93,540 Net debt 183,809 $ 129,788 $ Six Months Ended Six Months Ended June 30, June 30, 2011 2010 Revenues Before Reimbursements Total Revenues 618,190 $ 508,039 $ Reimbursements (41,439) (33,622) Revenues Before Reimbursements 576,751 $ 474,417 $ Costs of Services Before Reimbursements Total Costs of Services 459,154 $ 386,592 $ Reimbursements (41,439) (33,622) Costs of Services Before Reimbursements 417,715 $ 352,970 $ |