Exhibit 99.1
|
Crawford & Company
Boston Investor Meetings
March 4, 2013
|
FORWARD-LOOKING STATEMENTS AND ADDITIONAL INFORMATION
Forward-looking Statements
–This presentation contains forward-looking statements, including statements about the future financial condition, results of operations and earnings outlook of Crawford & Company. Statements, both qualitative and quantitative, that are not statements of historical fact may be “forward-looking statements” as defined in the Private Securities Litigation Reform Act of 1995 and other securities laws. Forward-looking statements involve a number of risks and uncertainties that could cause actual results to differ materially from historical experience or Crawford & Company’s present expectations. Accordingly, no one should place undue reliance on forward-looking statements, which speak only as of the date on which they are made. Crawford & Company does not undertake to update forward-looking statements to reflect the impact of circumstances or events that may arise or not arise after the date the forward-looking statements are made. Results for any interim period presented herein are not necessarily indicative of results to be expected for the full year or for any other future period. For further information regarding Crawford & Company, and the risks and uncertainties involved in forward-looking statements, please read Crawford & Company’s reports filed with the United States Securities and Exchange Commission and available at www.sec.gov or in the Investor Relations section of Crawford & Company’s website at www.crawfordandcompany.com.
–Crawford’s business is dependent, to a significant extent, on case volumes. The Company cannot predict the future trend of case volumes for a number of reasons, including the fact that the frequency and severity of weather-related claims and the occurrence of natural and man-made disasters, which are a significant source of claims and revenue for the Company, are generally not subject to accurate forecasting.
Revenues Before Reimbursements (“Revenues”)
–Revenues Before Reimbursements are referred to as “Revenues” in both consolidated and segment charts, bullets and tables throughout this presentation.
Segment and Consolidated Operating Earnings
–Under the Financial Accounting Standards Board’s Accounting Standards Codification Topic 280, “Segment Reporting,” the Company has defined segment operating earnings as the primary measure used by the Company to evaluate the results of each of its four operating segments. Segment operating earnings exclude income taxes, interest expense, amortization of customer-relationship intangible assets, stock option expense, earnings or loss attributable to non-controlling interests, certain unallocated corporate and shared costs and credits, and special charges and credits. Consolidated operating earnings is the total of segment operating earnings and certain unallocated and shared costs and credits.
Earnings Per Share
–In certain periods, the Company has paid a higher dividend on CRDA than on CRDB. This may result in a different earnings per share (“EPS”) for each class of stock due to the two-class method of computing EPS as required by the guidance in Accounting Standards Codification Topic 260 -“Earnings Per Share”. The two-class method is an earnings allocation method under which EPS is calculated for each class of common stock considering both dividends declared and participation rights in undistributed earnings as if all such earnings had been distributed during the period. Further references to EPS in this presentation will generally be only for CRDB, as that is the more dilutive measure.
Non-GAAP Financial Information
–For additional information about certain non-GAAP financial information presented herein, see the Appendix following this presentation.
Crawford & Company 2
|
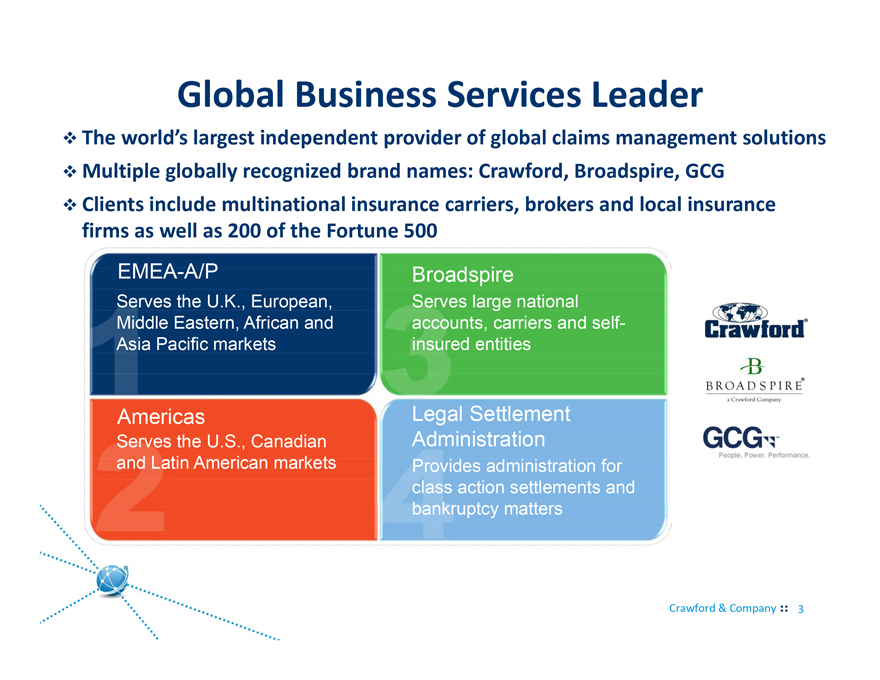
Global Business Services Leader
The world’s largest independent provider of global claims management solutions
Multiple globally recognized brand names: Crawford, Broadspire, GCG
Clients include multinational insurance carriers, brokers and local insurance firms as well as 200 of the Fortune 500
EMEA-A/P
Serves the U.K., European, Middle Eastern, African and Asia Pacific markets
Broadspire
Serves large national accounts, carriers and self-insured entities
Americas
Serves the U.S., Canadian and Latin American markets
Legal Settlement Administration
Provides administration for class action settlements and bankruptcy matters
Crawford & Company 3
|
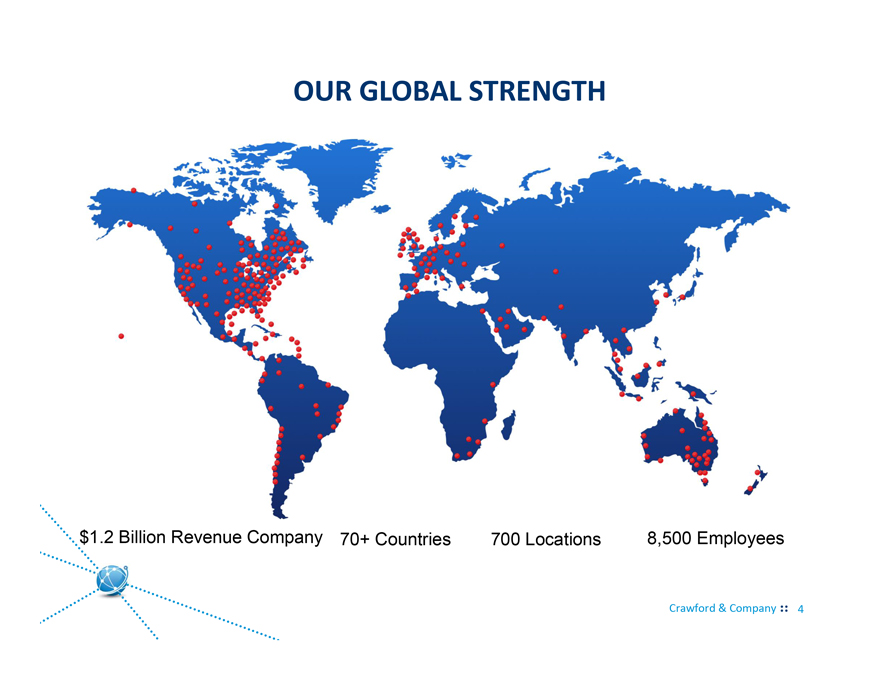
OUR GLOBAL STRENGTH
$1.2 Billion Revenue Company 70+ Countries 700 Locations 8,500 Employees
Crawford & Company 4
|
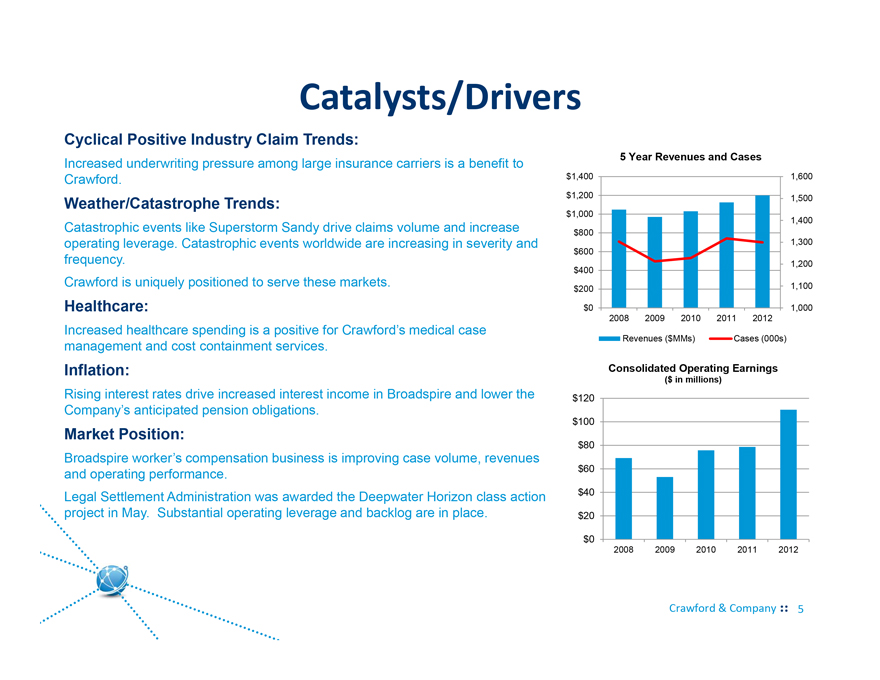
Catalysts/Drivers
Cyclical Positive Industry Claim Trends:
Increased underwriting pressure among large insurance carriers is a benefit to Crawford.
Weather/Catastrophe Trends:
Catastrophic events like Superstorm Sandy drive claims volume and increase operating leverage. Catastrophic events worldwide are increasing in severity and frequency.
Crawford is uniquely positioned to serve these markets.
Healthcare:
Increased healthcare spending is a positive for Crawford’s medical case management and cost containment services.
Inflation:
Rising interest rates drive increased interest income in Broadspire and lower the Company’s anticipated pension obligations.
Market Position:
Broadspire worker’s compensation business is improving case volume, revenues and operating performance.
Legal Settlement Administration was awarded the Deepwater Horizon class action project in May. Substantial operating leverage and backlog are in place.
$1,400 $1,200 $1,000 $800 $600 $400 $200 $0
5 Year Revenues and Cases
1,600 1,500 1,400 1,300 1,200 1,100 1,000
2008 2009 2010 2011 2012
Revenues ($MMs)
Cases (000s)
Consolidated Operating Earnings
($ in millions)
$120 $100 $80 $60 $40 $20 $0
2008 2009 2010 2011 2012
Crawford & Company 5
|
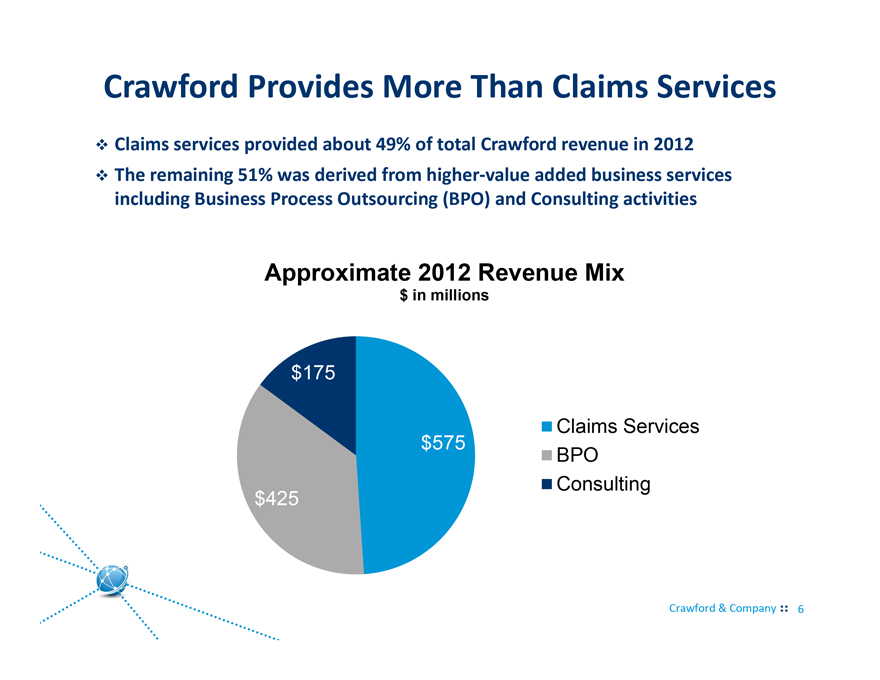
Crawford Provides More Than Claims Services
Claims services provided about 49% of total Crawford revenue in 2012
The remaining 51% was derived from highervalue added business services including Business Process Outsourcing (BPO) and Consulting activities
Approximate 2012 Revenue Mix
$ in millions
$175
$425
$575
Claims Services BPO
Consulting
Crawford & Company 6
|
Business Services Complement Claims Services
$575 million in P&C outsourced claims services – historic base of the business
–Claims services is a mature business in most geographies
• Crawford is experiencing growth, particularly in the EMEA/AP markets
–Competitors in the claims service arena are divided first into insourced and outsourced business
–Revenues are driven by claims volume, which is affected by
• Regional economies, economic growth
• Severe weather and natural disasters can produce swings in volatility
–Technical Services
• Global leader in mega-claims, reflecting our experience and resources
$600 million in other activities, services – growth, margins more attractive
–BPO
• Third Party Administration
• Network services
• Legal Settlement Administration
–Consulting
• Medical Management
• Analytics
Crawford & Company 7
|
Crawford’s Expertise
Claims Services: Thai Flooding Catastrophe Response Business Process Outsourcing: Deepwater Horizon Consulting: Medical Management
|
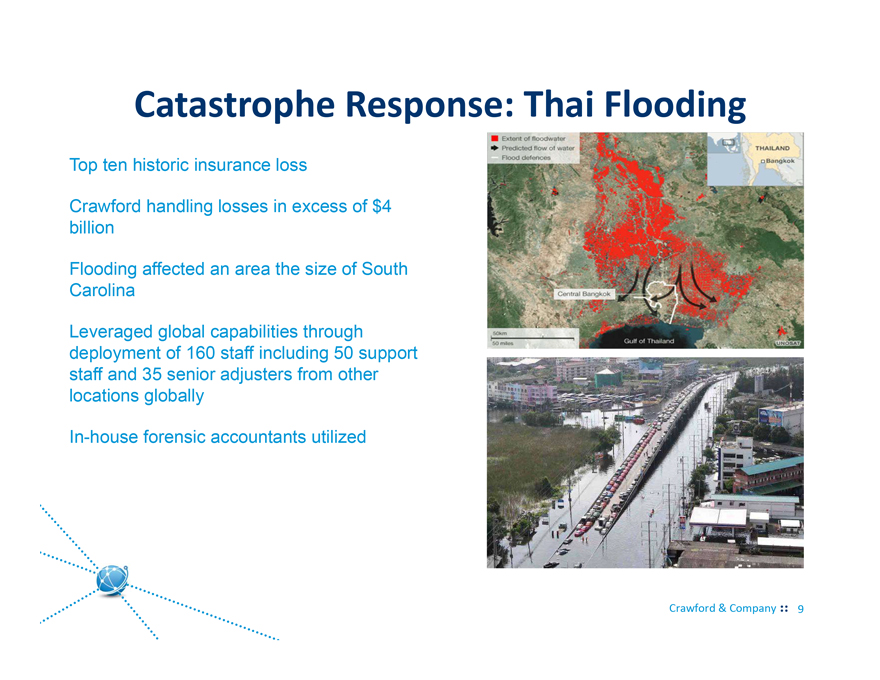
Catastrophe Response: Thai Flooding
Top ten historic insurance loss
Crawford handling losses in excess of $4 billion
Flooding affected an area the size of South Carolina
Leveraged global capabilities through deployment of 160 staff including 50 support staff and 35 senior adjusters from other locations globally
In-house forensic accountants utilized
Crawford & Company 9
|
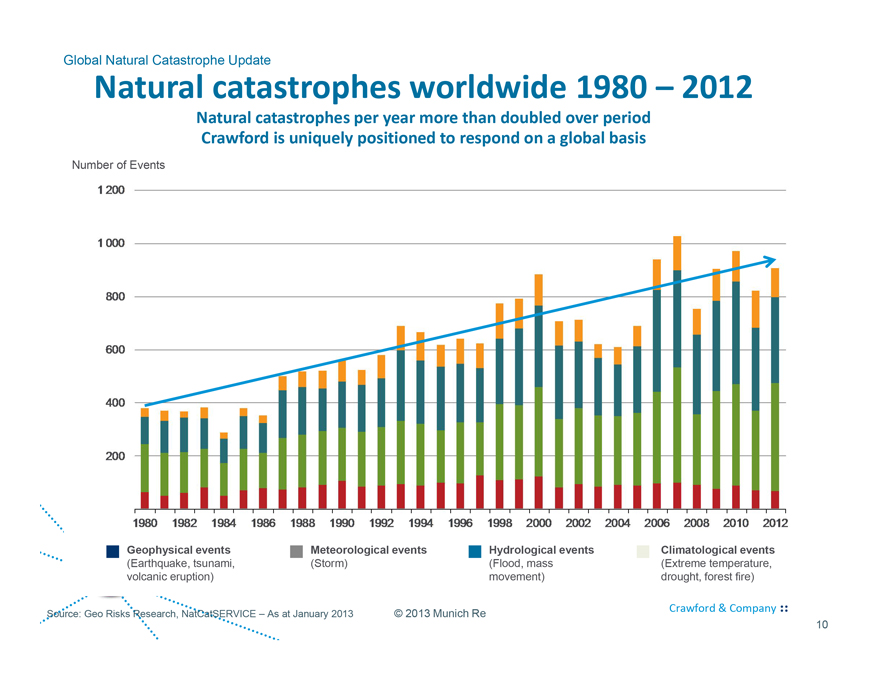
Global Natural Catastrophe Update
Natural catastrophes worldwide 1980 – 2012
Natural catastrophes per year more than doubled over period Crawford is uniquely positioned to respond on a global basis
Number of Events
1200
1000
800
600
400
200
1980
1982
1984
1986
1988
1990
1992
1994
1996
1998
2000
2002
2004
2006
2008
2010
2012
Geophysical events
(Earthquake, tsunami, volcanic eruption)
Meteorological events
(Storm)
Hydrological events
(Flood, mass movement)
Climatological events
(Extreme temperature, drought, forest fire)
Source: Geo Risks Research, NatCatSERVICE – As at January 2013
© 2013 Munich Re
Crawford & Company
10
|
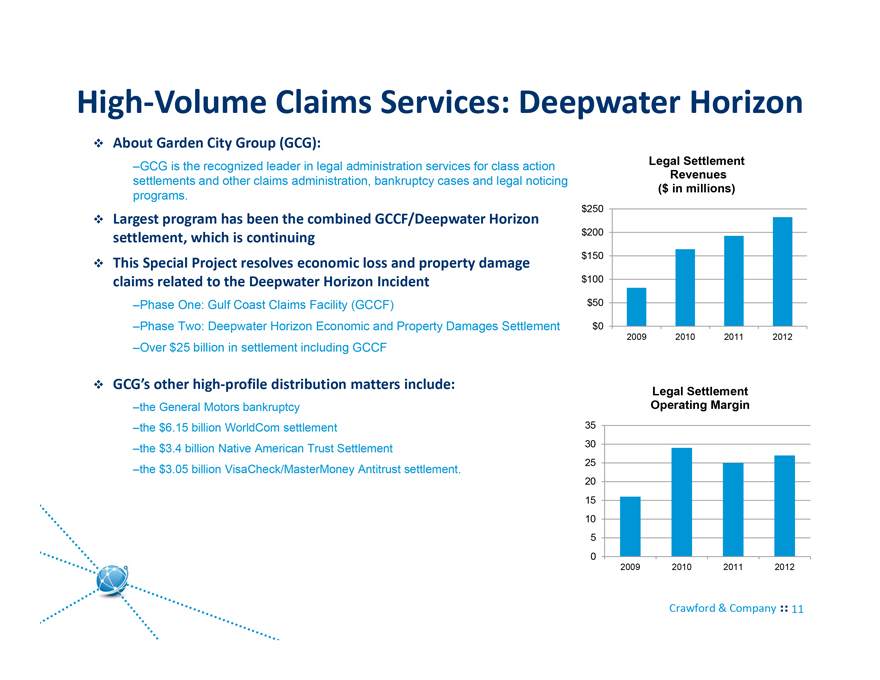
HighVolume Claims Services: Deepwater Horizon
About Garden City Group (GCG):
–GCG is the recognized leader in legal administration services for class action settlements and other claims administration, bankruptcy cases and legal noticing programs.
Largest program has been the combined GCCF/Deepwater Horizon settlement, which is continuing This Special Project resolves economic loss and property damage claims related to the Deepwater Horizon Incident
–Phase One: Gulf Coast Claims Facility (GCCF)
–Phase Two: Deepwater Horizon Economic and Property Damages Settlement
–Over $25 billion in settlement including GCCF
GCG’s other highprofile distribution matters include:
–the General Motors bankruptcy –the $6.15 billion WorldCom settlement
–the $3.4 billion Native American Trust Settlement
–the $3.05 billion VisaCheck/MasterMoney Antitrust settlement.
Legal Settlement Revenues ($ in millions)
$250 $200 $150 $100 $50 $0
2009 2010 2011 2012
Legal Settlement Operating Margin
35 30 25 20 15 10 5 0
2009 2010 2011 2012
Crawford & Company 11
|
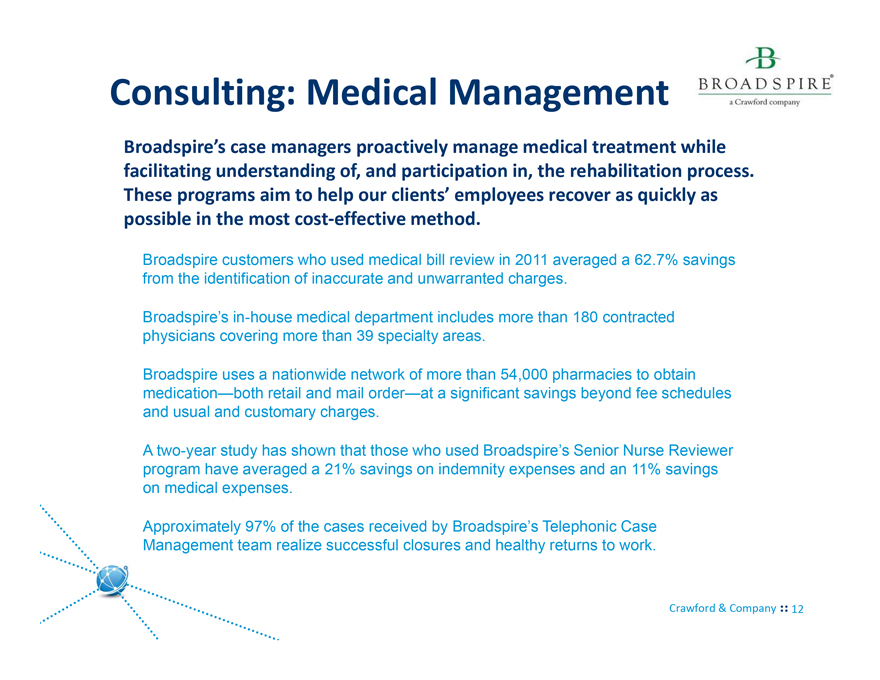
Consulting: Medical Management
Broadspire’s case managers proactively manage medical treatment while facilitating understanding of, and participation in, the rehabilitation process. These programs aim to help our clients’ employees recover as quickly as possible in the most costeffective method.
Broadspire customers who used medical bill review in 2011 averaged a 62.7% savings from the identification of inaccurate and unwarranted charges.
Broadspire’s in-house medical department includes more than 180 contracted physicians covering more than 39 specialty areas.
Broadspire uses a nationwide network of more than 54,000 pharmacies to obtain medication—both retail and mail order—at a significant savings beyond fee schedules and usual and customary charges.
A two-year study has shown that those who used Broadspire’s Senior Nurse Reviewer program have averaged a 21% savings on indemnity expenses and an 11% savings on medical expenses.
Approximately 97% of the cases received by Broadspire’s Telephonic Case Management team realize successful closures and healthy returns to work.
Crawford & Company 12
|
Financial Review and Operational Focus
|
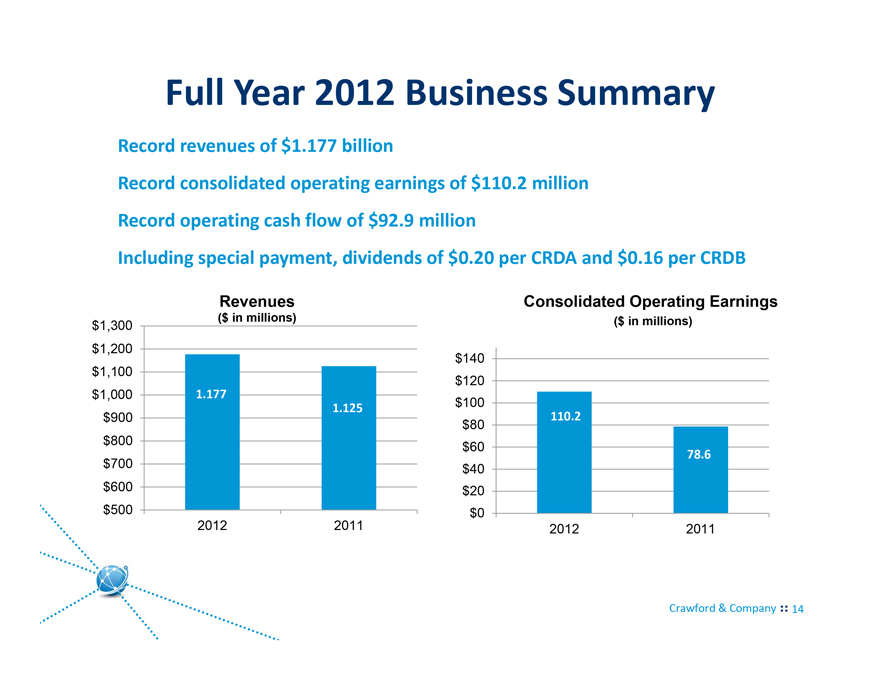
Full Year 2012 Business Summary
Record revenues of $1.177 billion
Record consolidated operating earnings of $110.2 million
Record operating cash flow of $92.9 million
Including special payment, dividends of $0.20 per CRDA and $0.16 per CRDB
$1,300 $1,200 $1,100 $1,000 $900 $800 $700 $600 $500
Revenues
($ in millions)
1.177
1.125
2012 2011
$140 $120 $100 $80 $60 $40 $20 $0
Consolidated Operating Earnings
($ in millions)
110.2
78.6
2012 2011
Crawford & Company 14
|
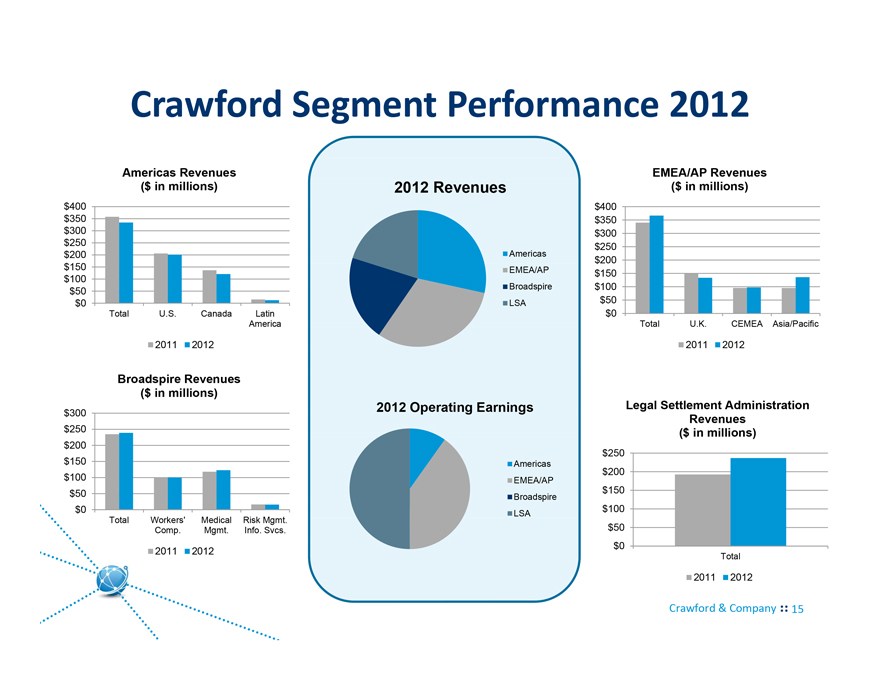
Crawford Segment Performance 2012
Americas Revenues ($ in millions)
$400
$350
$300
$250
$200
$150
$100
$50
$0
Total U.S. Canada Latin
America
2011 2012
Broadspire Revenues ($ in millions)
$300
$250
$200
$150
$100
$50
$0
Total Workers’ Medical Risk Mgmt.
Comp. Mgmt. Info. Svcs.
2011 2012
EMEA/AP Revenues ($ in millions)
$400
$350
$300
$250
$200
$150
$100
$50
$0
Total U.K. CEMEA Asia/Pacific
2011 2012
Legal Settlement Administration Revenues ($ in millions)
$250
$200
$150
$100
$50
$0
Total
2011 2012
Crawford & Company 15
|
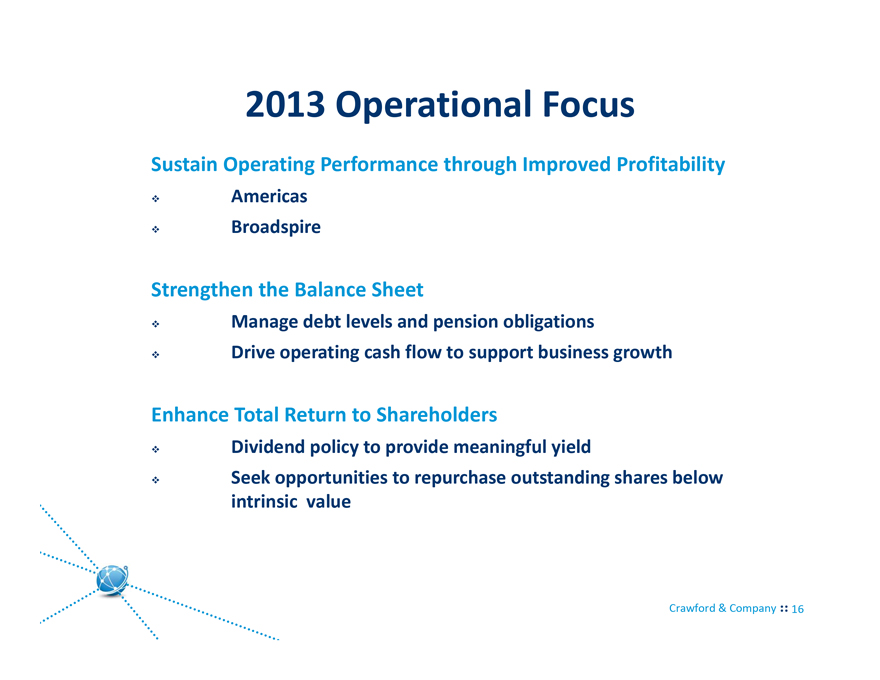
2013 Operational Focus
Sustain Operating Performance through Improved Profitability
Americas
Broadspire
Strengthen the Balance Sheet
Manage debt levels and pension obligations
Drive operating cash flow to support business growth
Enhance Total Return to Shareholders
Dividend policy to provide meaningful yield
Seek opportunities to repurchase outstanding shares below intrinsic value
|
Most Recent 2013 Guidance
On February 25, 2013, Crawford and Company reaffirmed initial full year 2013 guidance as follows:
Consolidated revenues before reimbursements between $1.05 and $1.08 billion Consolidated operating earnings between $85.0 and $93.0 million Consolidated cash provided by operating activities between $65.0 and $70.0 million After reflecting stock option expense, net corporate interest expense, customer-relationship intangible asset amortization expense, and income taxes, net income attributable to shareholders of Crawford & Company on a GAAP basis between $49.0 and $54.0 million, or $0.85 to $0.95 diluted earnings per CRDB share
Crawford & Company 17
|
Enhanced Return to Shareholders
Dividends and Buyback:
™ During the 2013 first quarter, Crawford declared a regular quarterly dividend of $0.04 on CRDA and $0.03 on CRDB
™ Crawford also paid a special dividend of $0.06 per share on both classes of stock during the 2012 fourth quarter
™ During 2012, Crawford paid dividends of $0.20 per share on CRDA and $0.16 per share on CRDB, or double 2011 dividends per share
™ Through 2012, Crawford repurchased 607,877 shares of CRDA and 7,000 shares of CRDB at an average cost of $4.63 and $3.83, respectively
™ 2012 Total Return CRDA:
Price: 38.6%, with reinvested dividends 45.6%
™ 2012 Total Return CRDB:
Price: 29.5%, with reinvested dividends 33.9%
Crawford & Company 18
|
Crawford & Company 19
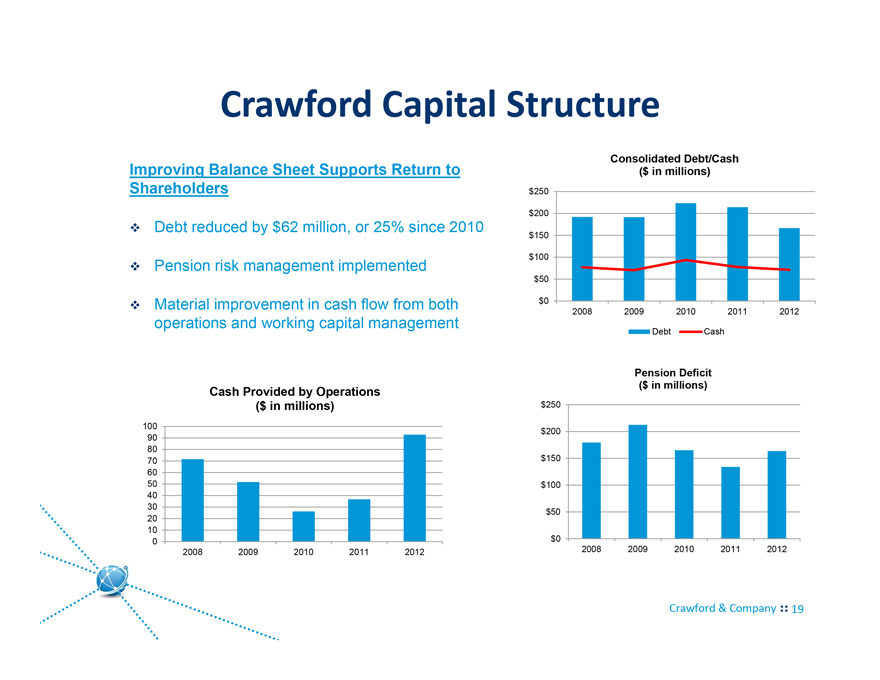
Crawford Capital Structure
Improving Balance Sheet Supports Return to Shareholders
™ Debt reduced by $62 million, or 25% since 2010
™ Pension risk management implemented
™ Material improvement in cash flow from both operations and working capital management
Cash Provided by Operations ($ in millions)
Consolidated Debt/Cash ($ in millions)
100
90 |
|
80 |
|
70 |
|
60 |
|
50 |
|
40 |
|
30 |
|
20 |
|
10 |
|
0
2008 2009 2010 2011 2012
$250 $200 $150 $100 $50
$0
2008 2009 2010 2011 2012
Debt Cash
Pension Deficit ($ in millions)
$250
$200
$150
$100
$50
$0
2008 2009 2010 2011 2012
|
Crawford & Company 20
Capital Structure and Governance
Class A and B Shares:
As of December 31, 2012, there were approximately 29.3 million shares of Class A Common Stock and 24.7 million shares of Class B Common Stock outstanding. The two classes are substantially identical, except with respect to the voting rights of the Class B shares and the greater cash dividends offered on Class A shares.
Insider Ownership:
The Jesse Crawford family beneficially owns approximately 41.2% of outstanding A shares and approximately 52.0% of outstanding B shares as of March 7, 2012.
Management Ownership Requirements:
Bonus program is centered on revenue growth, earnings growth, cash generation and EPS growth. Senior management share ownership levels: 3x annual salary for CEO, 2x for EVPs, 1x for other officers.
Board Diversification and Makeup:
Eight of nine members are independent, with the exception of the CEO, Jeff Bowman. CEO and chairman roles are split.
|
Crawford & Company 21
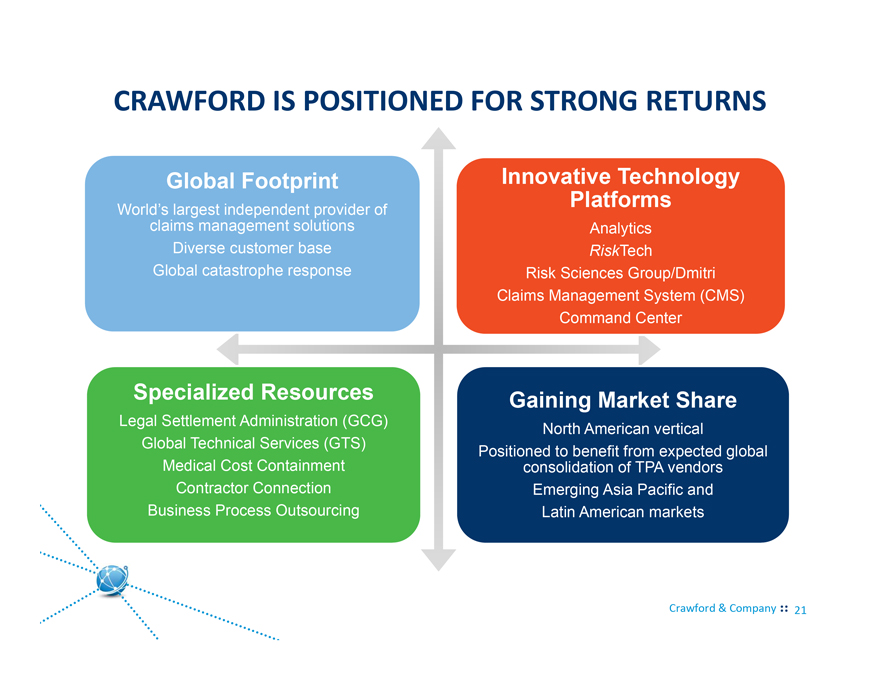
CRAWFORD IS POSITIONED FOR STRONG RETURNS
Global Footprint
World’s largest independent provider of claims management solutions Diverse customer base Global catastrophe response
Specialized Resources
Legal Settlement Administration (GCG) Global Technical Services (GTS) Medical Cost Containment Contractor Connection Business Process Outsourcing
Innovative Technology Platforms
Analytics
RiskTech
Risk Sciences Group/Dmitri Claims Management System (CMS) Command Center
Gaining Market Share
North American vertical
Positioned to benefit from expected global consolidation of TPA vendors Emerging Asia Pacific and Latin American markets
|
Crawford & Company
Appendix
|
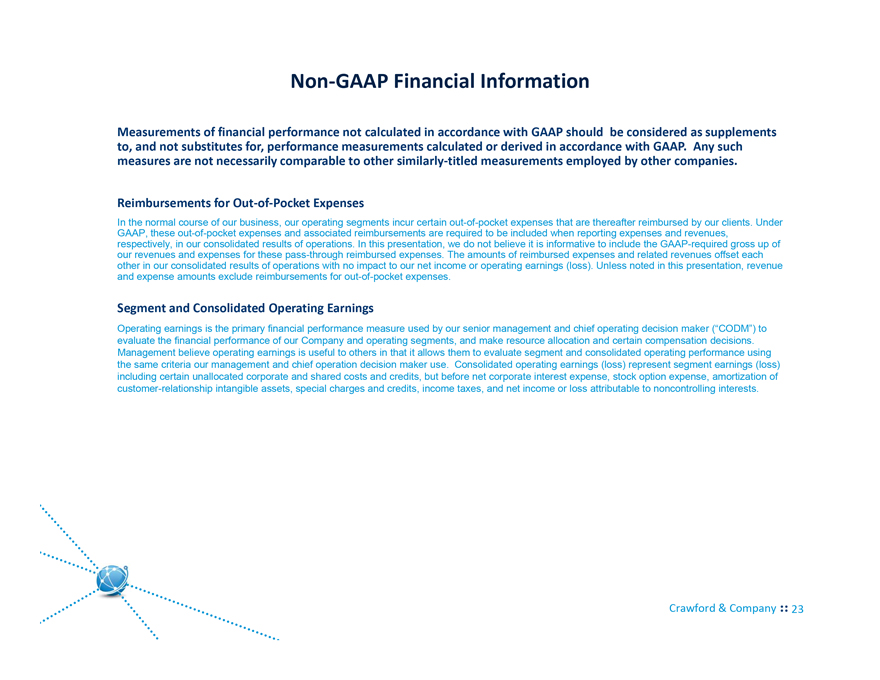
NonGAAP Financial Information
Measurements of financial performance not calculated in accordance with GAAP should be considered as supplements to, and not substitutes for, performance measurements calculated or derived in accordance with GAAP. Any such measures are not necessarily comparable to other similarlytitled measurements employed by other companies.
Reimbursements for OutofPocket Expenses
In the normal course of our business, our operating segments incur certain out-of-pocket expenses that are thereafter reimbursed by our clients. Under GAAP, these out-of-pocket expenses and associated reimbursements are required to be included when reporting expenses and revenues, respectively, in our consolidated results of operations. In this presentation, we do not believe it is informative to include the GAAP-required gross up of our revenues and expenses for these pass-through reimbursed expenses. The amounts of reimbursed expenses and related revenues offset each other in our consolidated results of operations with no impact to our net income or operating earnings (loss). Unless noted in this presentation, revenue and expense amounts exclude reimbursements for out-of-pocket expenses.
Segment and Consolidated Operating Earnings
Operating earnings is the primary financial performance measure used by our senior management and chief operating decision maker (“CODM”) to evaluate the financial performance of our Company and operating segments, and make resource allocation and certain compensation decisions. Management believe operating earnings is useful to others in that it allows them to evaluate segment and consolidated operating performance using the same criteria our management and chief operation decision maker use. Consolidated operating earnings (loss) represent segment earnings (loss) including certain unallocated corporate and shared costs and credits, but before net corporate interest expense, stock option expense, amortization of customer-relationship intangible assets, special charges and credits, income taxes, and net income or loss attributable to noncontrolling interests.
Crawford & Company 23
|
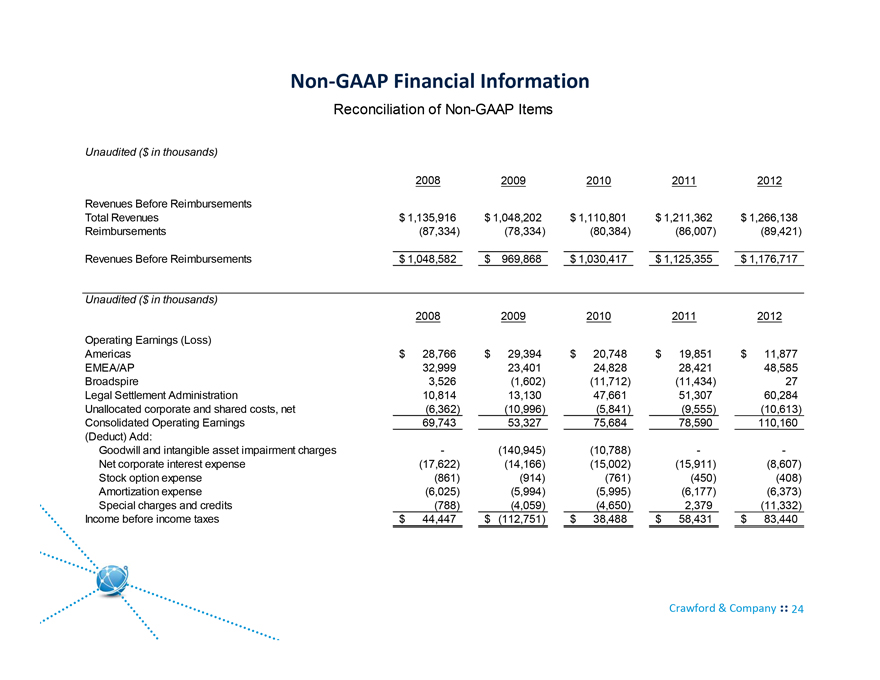
NonGAAP Financial Information
Reconciliation of Non-GAAP Items
Unaudited ($ in thousands)
2008 2009 2010 2011 2012
Revenues Before Reimbursements
Total Revenues $ 1,135,916 $ 1,048,202 $ 1,110,801 $ 1,211,362 $ 1,266,138
Reimbursements(87,334)(78,334)(80,384)(86,007)(89,421)
Revenues Before Reimbursements $ 1,048,582 $ 969,868 $ 1,030,417 $ 1,125,355 $ 1,176,717
Unaudited ($ in thousands)
2008 2009 2010 2011 2012
Operating Earnings (Loss)
Americas $ 28,766 $ 29,394 $ 20,748 $ 19,851 $ 11,877
EMEA/AP 32,999 23,401 24,828 28,421 48,585
Broadspire 3,526(1,602)(11,712)(11,434) 27
Legal Settlement Administration 10,814 13,130 47,661 51,307 60,284
Unallocated corporate and shared costs, net(6,362)(10,996)(5,841)(9,555)(10,613)
Consolidated Operating Earnings 69,743 53,327 75,684 78,590 110,160
(Deduct) Add:
Goodwill and intangible asset impairment charges -(140,945)(10,788) —
Net corporate interest expense(17,622)(14,166)(15,002)(15,911)(8,607)
Stock option expense(861)(914)(761)(450)(408)
Amortization expense(6,025)(5,994)(5,995)(6,177)(6,373)
Special charges and credits(788)(4,059)(4,650) 2,379(11,332)
Income before income taxes $ 44,447 $ (112,751) $ 38,488 $ 58,431 $ 83,440
Crawford & Company 24
|
Crawford & Company