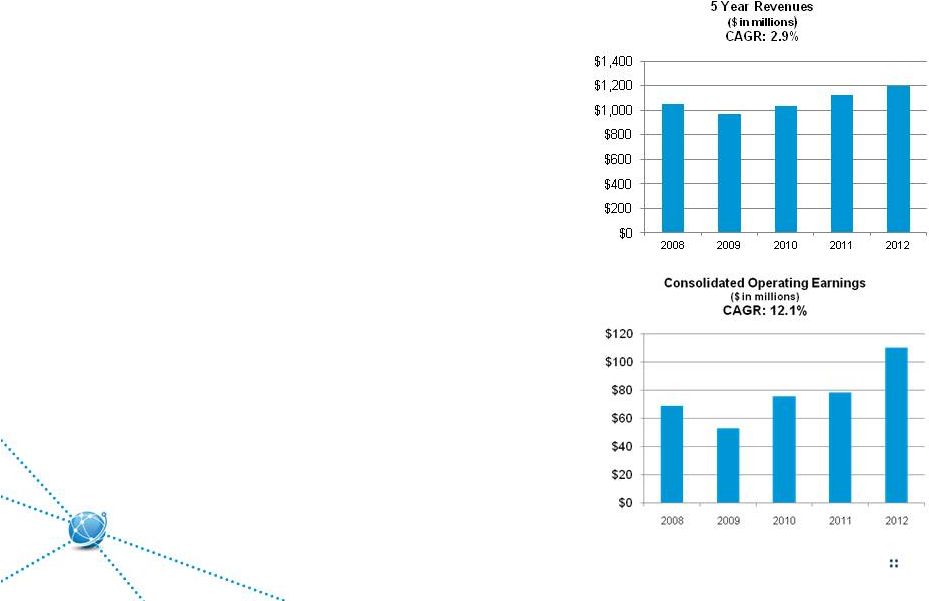
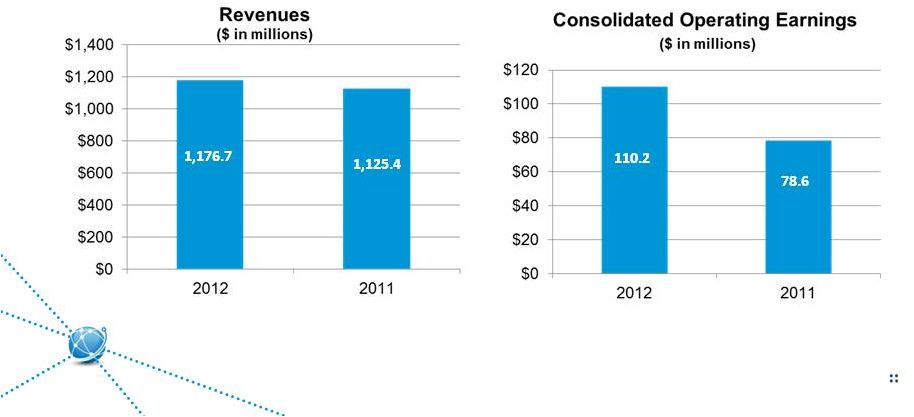
Crawford & Company Non-GAAP Financial Information 29 Unaudited ($ in thousands) YTD through YTD through 2008 2009 2010 2011 2012 June 30, 2013 June 30, 2012 Revenues Before Reimbursements Total Revenues 1,135,916 $ 1,046,202 $ 1,110,801 $ 1,211,362 $ 1,266,138 $ 633,254 $ 606,362 $ Reimbursements (87,334) (78,334) (80,384) (86,007) (89,421) (48,026) (44,762) Revenues Before Reimbursements 1,048,582 $ 967,868 $ 1,030,417 $ 1,125,355 $ 1,176,717 $ 585,228 $ 561,600 $ YTD through YTD through June 30, 2013 June 30, 2012 Costs of Services Before Reimbursements Total Costs of Services 473,700 $ 457,284 $ Reimbursements (48,026) (44,762) Costs of Services Before Reimbursements 425,674 $ 412,522 $ YTD through YTD through 2008 2009 2010 2011 2012 June 30, 2013 June 30, 2012 Operating Earnings (Loss) Americas 28,766 $ 29,394 $ 20,748 $ 19,851 $ 11,877 $ 7,637 $ 895 $ EMEA/AP 32,999 23,401 24,828 28,421 48,585 15,214 17,313 Broadspire 3,526 (1,602) (11,712) (11,434) 27 2,591 (371) Legal Settlement Administration 10,814 13,130 47,661 51,307 60,284 28,543 26,475 Unallocated corporate and shared costs, net (6,362) (10,996) (5,841) (9,555) (10,613) (5,630) (5,964) Consolidated Operating Earnings 69,743 53,327 75,684 78,590 110,160 48,355 38,348 Deduct: Goodwill and intangible asset impairment charges - (140,945) (10,788) - - - - Net corporate interest expense (17,622) (14,166) (15,002) (15,911) (8,607) (3,243) (4,556) Stock option expense (861) (914) (761) (450) (408) (373) (245) Amortization expense (6,025) (5,994) (5,995) (6,177) (6,373) (3,190) (3,198) Special charges and credits (788) (4,059) (4,650) 2,379 (11,332) - (2,461) Income before income taxes 44,447 $ (112,751) $ 38,488 $ 58,431 $ 83,440 $ 41,549 $ 27,888 $ Reconciliation of Non-GAAP Items |