
Crawford & Company First Quarter 2021 Earnings Conference Call CRD-A & CRD-B (NYSE)
Introduction | External Factors | Segment Highlights | New Business Momentum | Disciplined Capital Allocation | Our Workforce | Financial Results | Conclusion Forward-Looking Statements and Additional Information Forward-Looking Statements This presentation contains forward-looking statements, including statements about the expected future financial condition, results of operations and earnings outlook of Crawford & Company. Statements, both qualitative and quantitative, that are not statements of historical fact may be "forward-looking statements" as defined in the Private Securities Litigation Reform Act of 1995 and other securities laws. Forward-looking statements involve a number of risks and uncertainties that could cause actual results to differ materially from historical experience or Crawford & Company's present expectations. Accordingly, no one should place undue reliance on forward-looking statements, which speak only as of the date on which they are made. Crawford & Company does not undertake to update forward-looking statements to reflect the impact of circumstances or events that may arise or not arise after the date the forward-looking statements are made. Results for any interim period presented herein are not necessarily indicative of results to be expected for the full year or for any other future period. For further information regarding Crawford & Company, and the risks and uncertainties involved in forward-looking statements, please read Crawford & Company's reports filed with the Securities and Exchange Commission and available at www.sec.gov or in the Investor Relations portion of Crawford & Company's website at https://ir.crawco.com. Crawford's business is dependent, to a significant extent, on case volumes. The Company cannot predict the future trend of case volumes for a number of reasons, including the fact that the frequency and severity of weather-related claims and the occurrence of natural and man-made disasters, which are a significant source of cases and revenue for the Company, are generally not subject to accurate forecasting. Revenues Before Reimbursements ("Revenues") Revenues Before Reimbursements are referred to as "Revenues" in both consolidated and segment charts, bullets and tables throughout this presentation. Segment and Consolidated Operating Earnings Under the Financial Accounting Standards Board's Accounting Standards Codification ("ASC") Topic 280, "Segment Reporting," the Company has defined segment operating earnings as the primary measure used by the Company to evaluate the results of each of its three operating segments. Segment operating earnings represent segment earnings, including the direct and indirect costs of certain administrative functions required to operate our business, but excludes unallocated corporate and shared costs and credits, net corporate interest expense, stock option expense, amortization of customer-relationship intangible assets, goodwill impairment, restructuring costs, income taxes and net income or loss attributable to noncontrolling interests and redeemable noncontrolling interests. Earnings Per Share The Company's two classes of stock are substantially identical, except with respect to voting rights and the Company's ability to pay greater cash dividends on the non-voting Class A Common Stock than on the voting Class B Common Stock, subject to certain limitations. In addition, with respect to mergers or similar transactions, holders of Class A Common Stock must receive the same type and amount of consideration as holders of Class B Common Stock, unless different consideration is approved by the holders of 75% of the Class A Common Stock, voting as a class. In certain periods, the Company has paid a higher dividend on CRD-A than on CRD-B. This may result in a different earnings per share ("EPS") for each class of stock due to the two-class method of computing EPS as required by ASC Topic 260 - "Earnings Per Share". The two-class method is an earnings allocation method under which EPS is calculated for each class of common stock considering both dividends declared and participation rights in undistributed earnings as if all such earnings had been distributed during the period. Segment Gross Profit Segment gross profit is defined as revenues, less direct costs, which exclude indirect centralized administrative support costs allocated to the business. Indirect expenses consist of centralized administrative support costs, regional and local shared services that are allocated to each segment based on usage. Non-GAAP Financial Information For additional information about certain non-GAAP financial information presented herein, see the Appendix following this presentation.
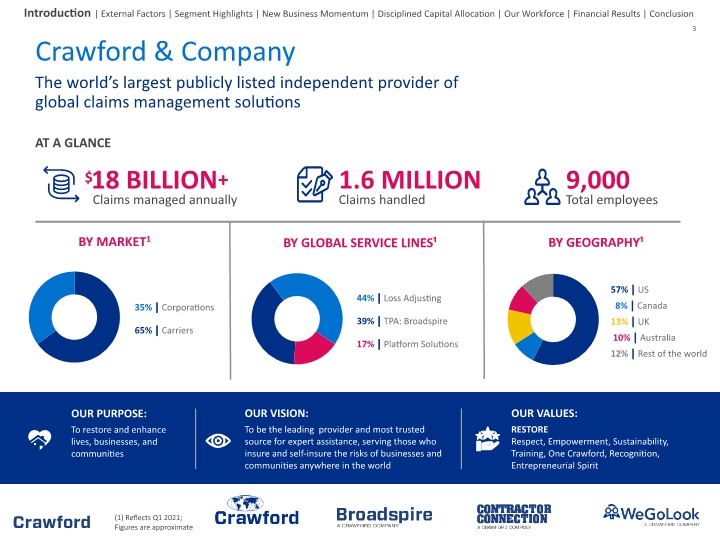
$18 BILLION+ Claims managed annually AT A GLANCE Crawford & Company The world’s largest publicly listed independent provider of global claims management solutions 1.6 MILLION Claims handled 9,000 Total employees Introduction | External Factors | Segment Highlights | New Business Momentum | Disciplined Capital Allocation | Our Workforce | Financial Results | Conclusion OUR VISION: To be the leading provider and most trusted source for expert assistance, serving those who insure and self-insure the risks of businesses and communities anywhere in the world OUR PURPOSE: To restore and enhance lives, businesses, and communities OUR VALUES: RESTORE Respect, Empowerment, Sustainability, Training, One Crawford, Recognition, Entrepreneurial Spirit (1) Reflects Q1 2021; Figures are approximate
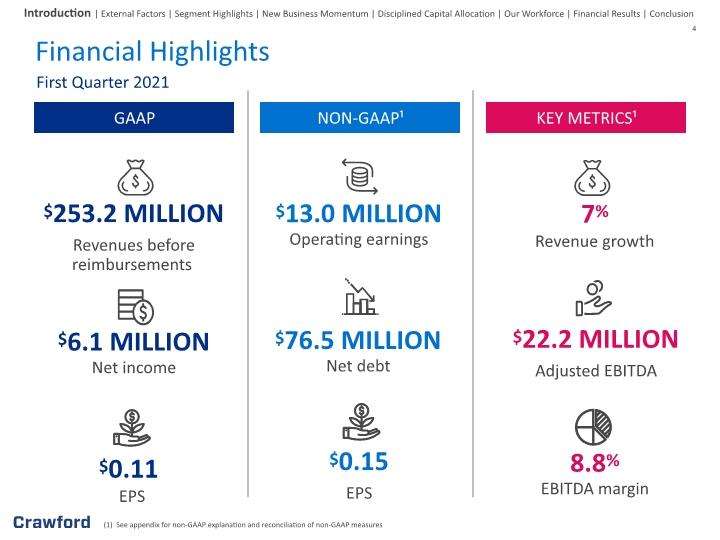
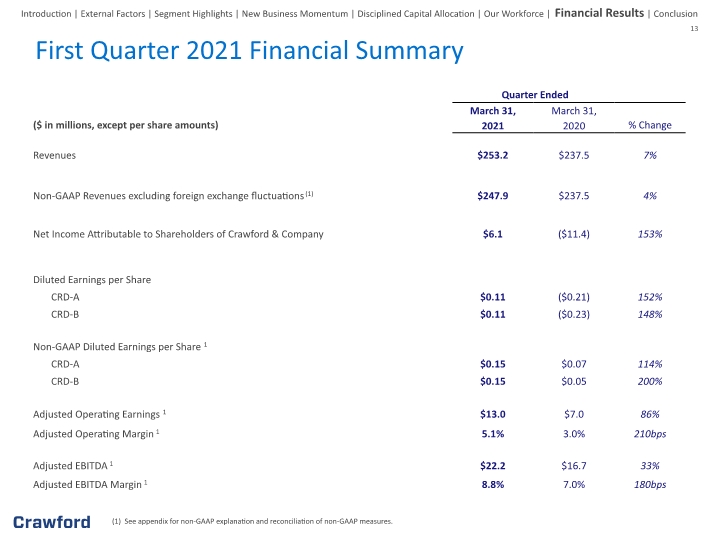
(1) See appendix for non-GAAP explanation and reconciliation of non-GAAP measures Financial Highlights First Quarter 2021 GAAP NON-GAAP¹ KEY METRICS¹ $253.2 MILLION Revenues before reimbursements $6.1 MILLION Net income $0.15 EPS $76.5 MILLION Net debt $22.2 MILLION Adjusted EBITDA 8.8% EBITDA margin $13.0 MILLION Operating earnings Introduction | External Factors | Segment Highlights | New Business Momentum | Disciplined Capital Allocation | Our Workforce | Financial Results | Conclusion 7% Revenue growth $0.11 EPS
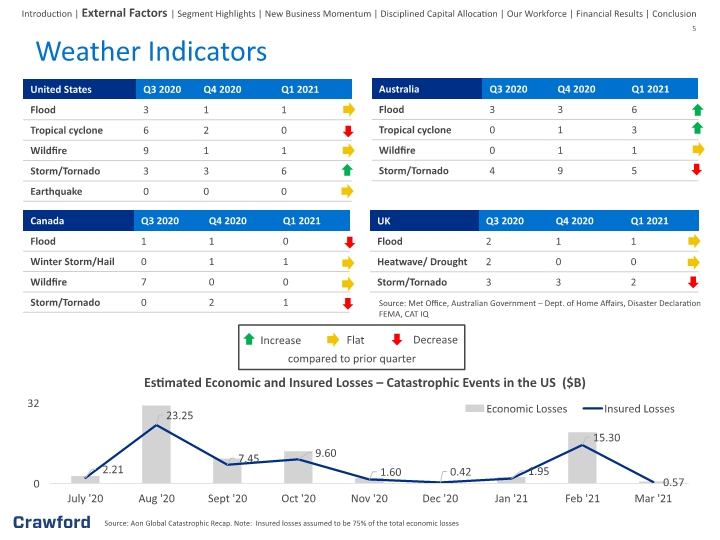
Weather Indicators Introduction | External Factors | Segment Highlights | New Business Momentum | Disciplined Capital Allocation | Our Workforce | Financial Results | Conclusion Source: Aon Global Catastrophic Recap. Note: Insured losses assumed to be 75% of the total economic losses compared to prior quarter Source: Met Office, Australian Government – Dept. of Home Affairs, Disaster Declaration FEMA, CAT IQ
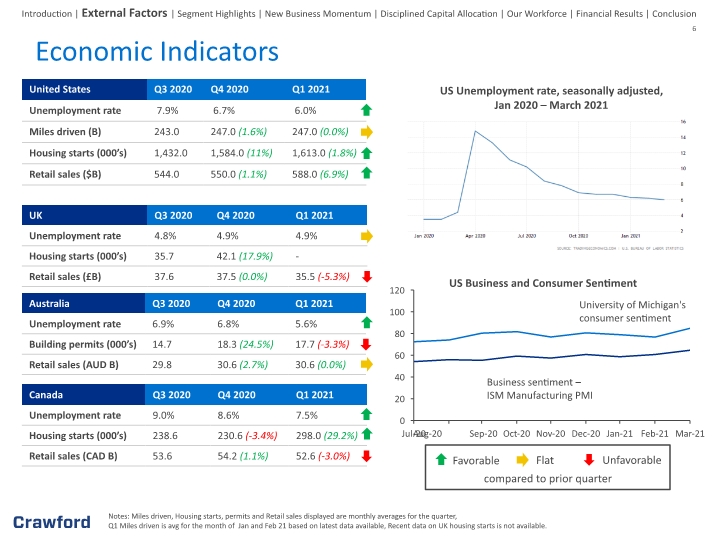
Economic Indicators Introduction | External Factors | Segment Highlights | New Business Momentum | Disciplined Capital Allocation | Our Workforce | Financial Results | Conclusion Notes: Miles driven, Housing starts, permits and Retail sales displayed are monthly averages for the quarter, Q1 Miles driven is avg for the month of Jan and Feb 21 based on latest data available, Recent data on UK housing starts is not available. compared to prior quarter Sep-20 Mar-21 Jul-20 Jan-21 Nov-20 Aug-20 Oct-20 Dec-20 Feb-21 University of Michigan's consumer sentiment Business sentiment – ISM Manufacturing PMI US Business and Consumer Sentiment US Unemployment rate, seasonally adjusted, Jan 2020 – March 2021
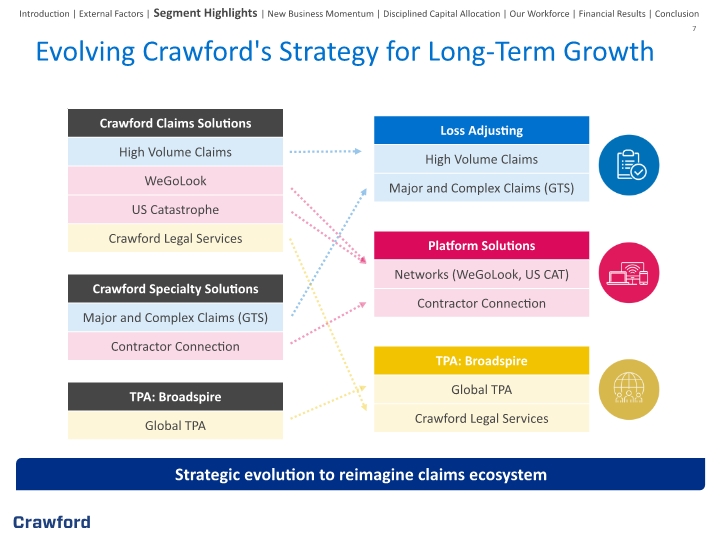
Evolving Crawford's Strategy for Long-Term Growth Introduction | External Factors | Segment Highlights | New Business Momentum | Disciplined Capital Allocation | Our Workforce | Financial Results | Conclusion Strategic evolution to reimagine claims ecosystem
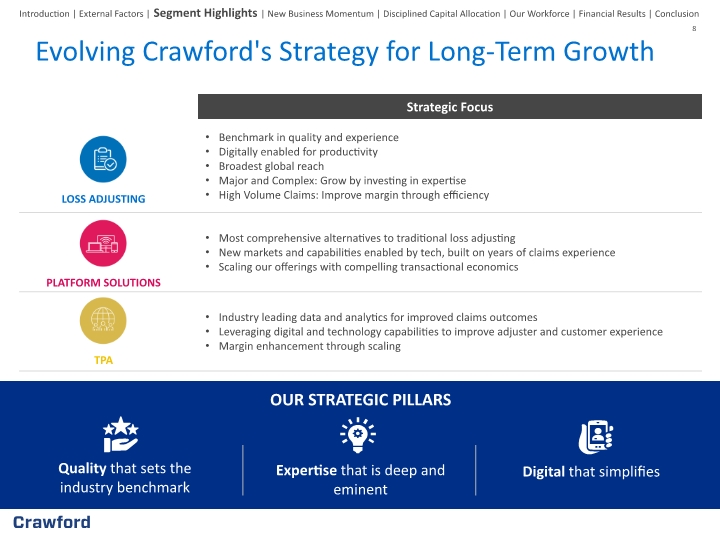
Evolving Crawford's Strategy for Long-Term Growth Introduction | External Factors | Segment Highlights | New Business Momentum | Disciplined Capital Allocation | Our Workforce | Financial Results | Conclusion Expertise that is deep and eminent Quality that sets the industry benchmark Digital that simplifies OUR STRATEGIC PILLARS
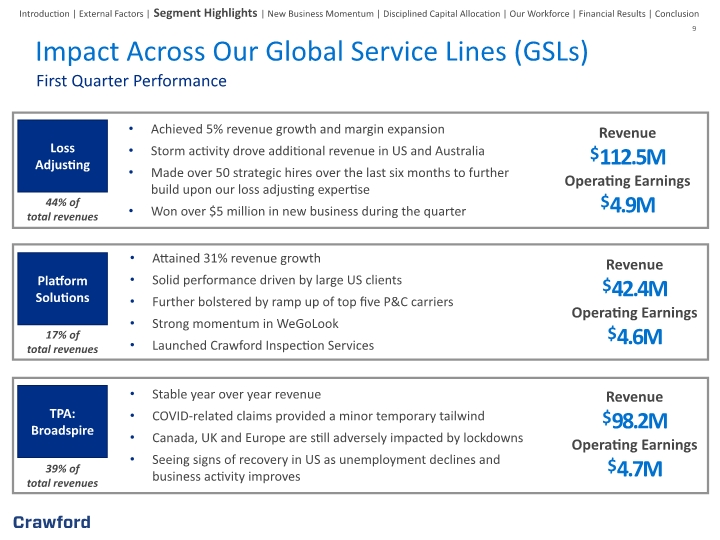
9 Impact Across Our Global Service Lines (GSLs) Introduction | External Factors | Segment Highlights | New Business Momentum | Disciplined Capital Allocation | Our Workforce | Financial Results | Conclusion First Quarter Performance Revenue $98.2M Operating Earnings $4.7M Achieved 5% revenue growth and margin expansion Storm activity drove additional revenue in US and Australia Made over 50 strategic hires over the last six months to further build upon our loss adjusting expertise Won over $5 million in new business during the quarter Stable year over year revenue COVID-related claims provided a minor temporary tailwind Canada, UK and Europe are still adversely impacted by lockdowns Seeing signs of recovery in US as unemployment declines and business activity improves Attained 31% revenue growth Solid performance driven by large US clients Further bolstered by ramp up of top five P&C carriers Strong momentum in WeGoLook Launched Crawford Inspection Services Revenue $112.5M Operating Earnings $4.9M Revenue $42.4M Operating Earnings $4.6M
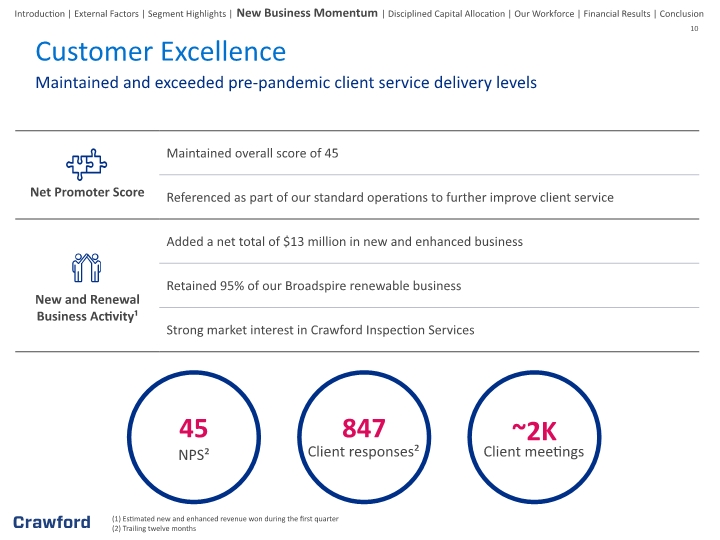
10 Customer Excellence Introduction | External Factors | Segment Highlights | New Business Momentum | Disciplined Capital Allocation | Our Workforce | Financial Results | Conclusion Maintained and exceeded pre-pandemic client service delivery levels Client responses² (1) Estimated new and enhanced revenue won during the first quarter (2) Trailing twelve months
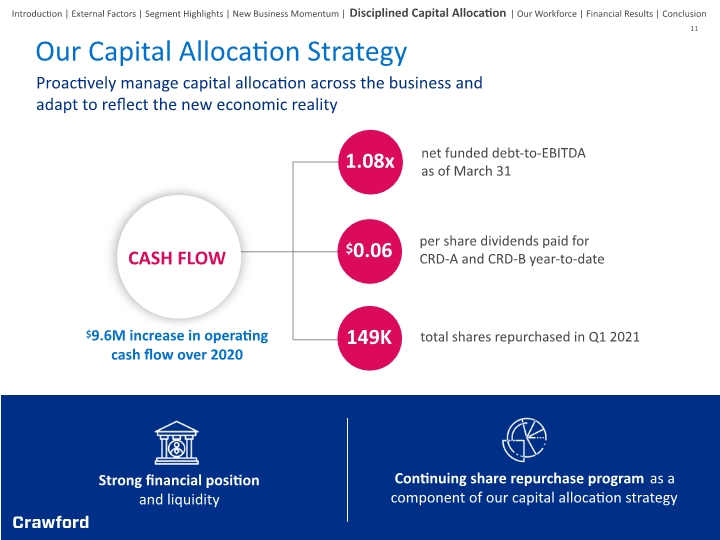
Proactively manage capital allocation across the business and adapt to reflect the new economic reality Strong financial position and liquidity Continuing share repurchase program as a component of our capital allocation strategy Our Capital Allocation Strategy Introduction | External Factors | Segment Highlights | New Business Momentum | Disciplined Capital Allocation | Our Workforce | Financial Results | Conclusion net funded debt-to-EBITDA as of March 31 CASH FLOW 1.08x $0.06 per share dividends paid for CRD-A and CRD-B year-to-date 149K total shares repurchased in Q1 2021 $9.6M increase in operating cash flow over 2020

Introduction | External Factors | Segment Highlights | New Business Momentum | Disciplined Capital Allocation | Our Workforce | Financial Results | Conclusion Supporting Our Global Workforce Prioritizing the Safety and Well-Being of our Workforce Formed a global incident response team and modified sick leave policies Weekly health and safety updates globally Providing access to physical and mental health and wellness programs, including free Headspace membership Working parents support group on Intranet Inclusion and Diversity Launched Office of Inclusion and Diversity and an Employee Advisory Council Established Employee Resource Groups aligned with our purpose Formed a Global Inclusion and Diversity Council to promote inclusion and diversity Proud member of the Business Insurance Diversity Inclusion Institute Human Capital Development Conducted employee pulse survey and COVID-19 response surveys Promoting an environment where employees are empowered to grow, emboldened to act and inspired to innovate through internal programs and initiatives Continuing to demonstrate our resilience despite the significant challenges presented by COVID-19
(1) See appendix for non-GAAP explanation and reconciliation of non-GAAP measures. 13 First Quarter 2021 Financial Summary Introduction | External Factors | Segment Highlights | New Business Momentum | Disciplined Capital Allocation | Our Workforce | Financial Results | Conclusion
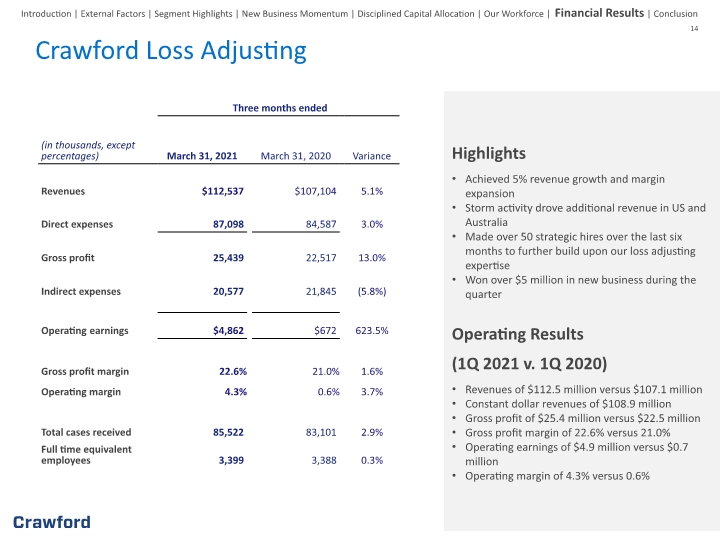
Highlights Achieved 5% revenue growth and margin expansion Storm activity drove additional revenue in US and Australia Made over 50 strategic hires over the last six months to further build upon our loss adjusting expertise Won over $5 million in new business during the quarter Operating Results (1Q 2021 v. 1Q 2020) Revenues of $112.5 million versus $107.1 million Constant dollar revenues of $108.9 million Gross profit of $25.4 million versus $22.5 million Gross profit margin of 22.6% versus 21.0% Operating earnings of $4.9 million versus $0.7 million Operating margin of 4.3% versus 0.6% 14 Crawford Loss Adjusting Introduction | External Factors | Segment Highlights | New Business Momentum | Disciplined Capital Allocation | Our Workforce | Financial Results | Conclusion
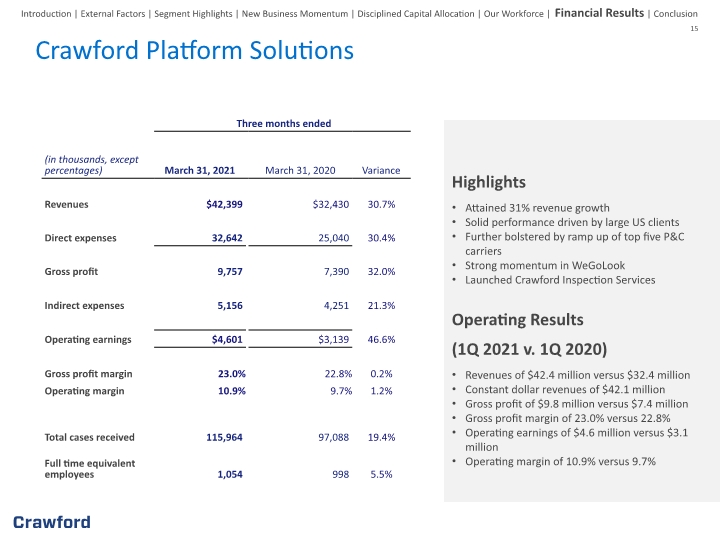
15 Highlights Attained 31% revenue growth Solid performance driven by large US clients Further bolstered by ramp up of top five P&C carriers Strong momentum in WeGoLook Launched Crawford Inspection Services Operating Results (1Q 2021 v. 1Q 2020) Revenues of $42.4 million versus $32.4 million Constant dollar revenues of $42.1 million Gross profit of $9.8 million versus $7.4 million Gross profit margin of 23.0% versus 22.8% Operating earnings of $4.6 million versus $3.1 million Operating margin of 10.9% versus 9.7% Crawford Platform Solutions Introduction | External Factors | Segment Highlights | New Business Momentum | Disciplined Capital Allocation | Our Workforce | Financial Results | Conclusion
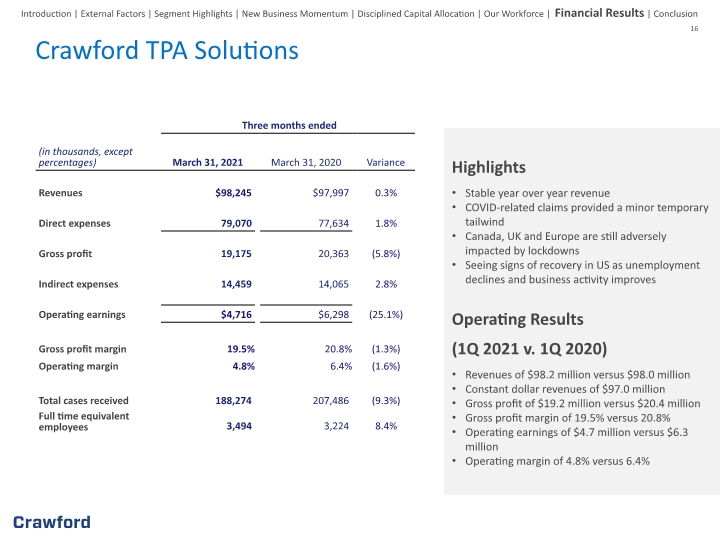
Highlights Stable year over year revenue COVID-related claims provided a minor temporary tailwind Canada, UK and Europe are still adversely impacted by lockdowns Seeing signs of recovery in US as unemployment declines and business activity improves Operating Results (1Q 2021 v. 1Q 2020) Revenues of $98.2 million versus $98.0 million Constant dollar revenues of $97.0 million Gross profit of $19.2 million versus $20.4 million Gross profit margin of 19.5% versus 20.8% Operating earnings of $4.7 million versus $6.3 million Operating margin of 4.8% versus 6.4% 16 Crawford TPA Solutions Introduction | External Factors | Segment Highlights | New Business Momentum | Disciplined Capital Allocation | Our Workforce | Financial Results | Conclusion
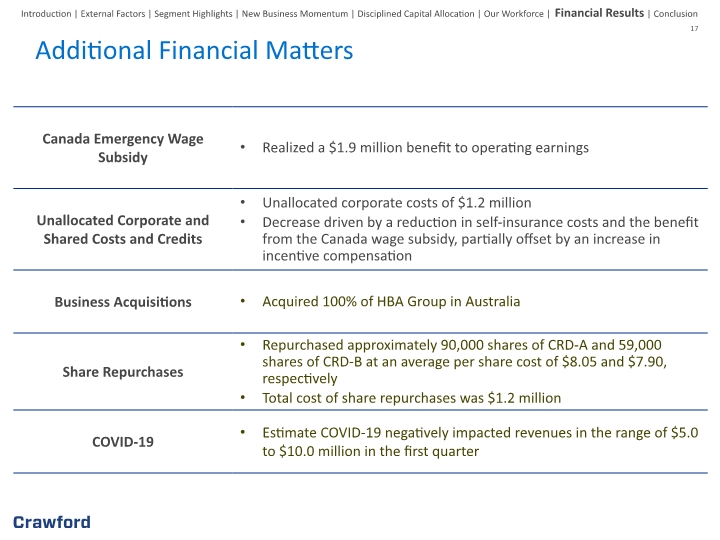
Additional Financial Matters Introduction | External Factors | Segment Highlights | New Business Momentum | Disciplined Capital Allocation | Our Workforce | Financial Results | Conclusion
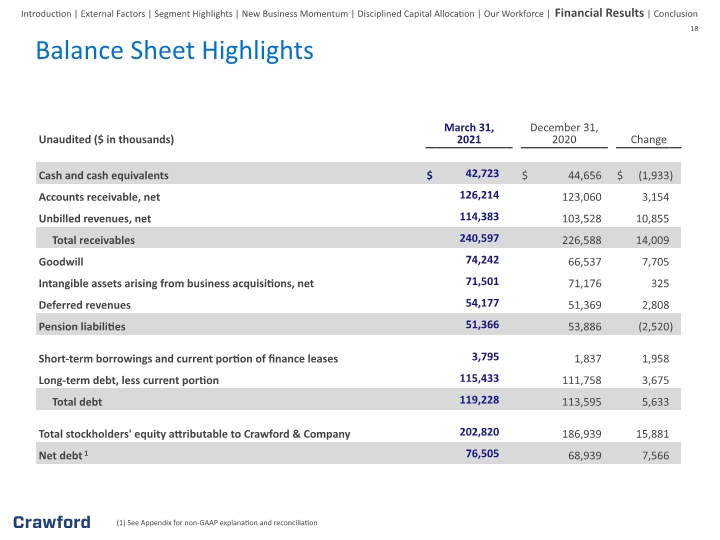
(1) See Appendix for non-GAAP explanation and reconciliation 18 Balance Sheet Highlights Introduction | External Factors | Segment Highlights | New Business Momentum | Disciplined Capital Allocation | Our Workforce | Financial Results | Conclusion
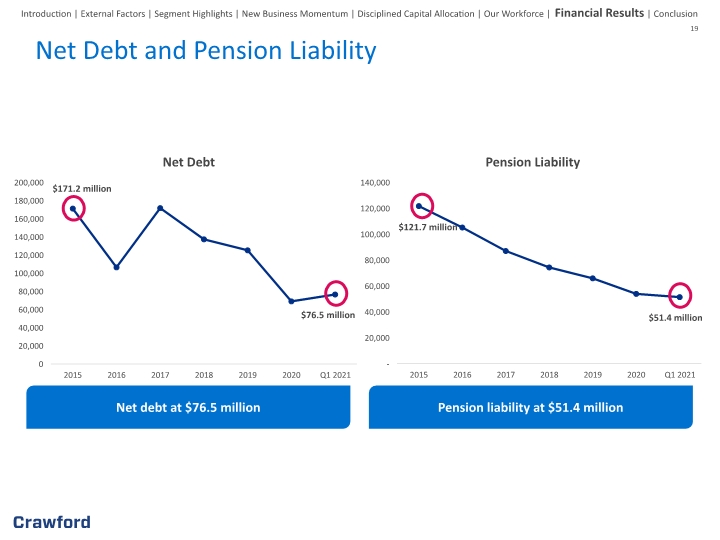
19 Net Debt and Pension Liability Introduction | External Factors | Segment Highlights | New Business Momentum | Disciplined Capital Allocation | Our Workforce | Financial Results | Conclusion $76.5 million $51.4 million Net debt at $76.5 million Pension liability at $51.4 million $171.2 million $121.7 million
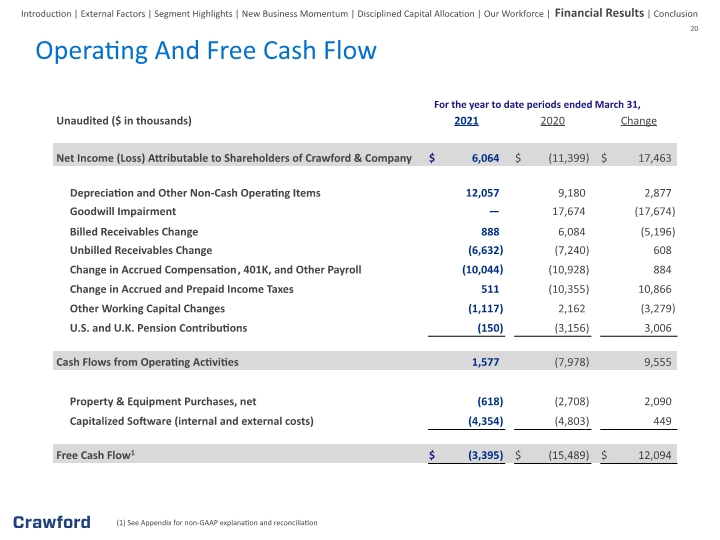
(1) See Appendix for non-GAAP explanation and reconciliation 20 For the year to date periods ended March 31, Operating And Free Cash Flow Introduction | External Factors | Segment Highlights | New Business Momentum | Disciplined Capital Allocation | Our Workforce | Financial Results | Conclusion
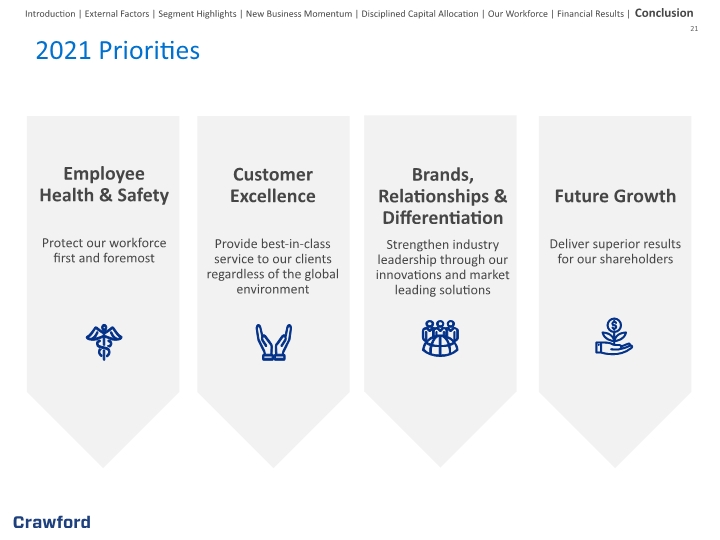
21 Employee Health & Safety Protect our workforce first and foremost Customer Excellence Provide best-in-class service to our clients regardless of the global environment Brands, Relationships & Differentiation Strengthen industry leadership through our innovations and market leading solutions Future Growth Deliver superior results for our shareholders 2021 Priorities Introduction | External Factors | Segment Highlights | New Business Momentum | Disciplined Capital Allocation | Our Workforce | Financial Results | Conclusion
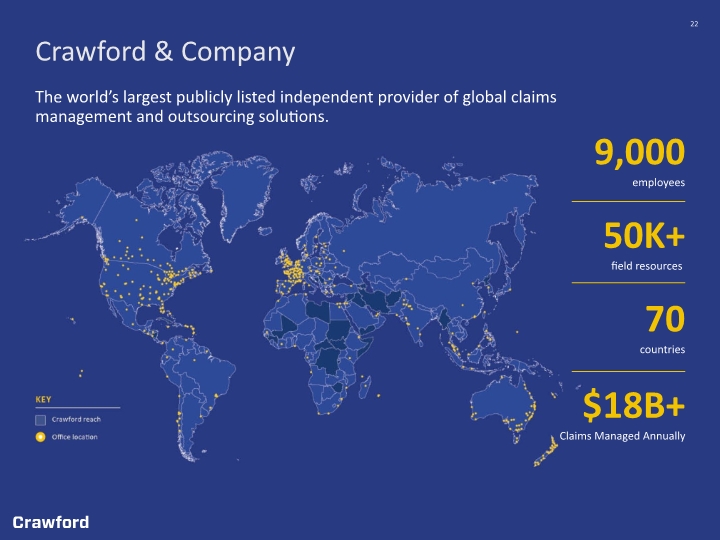
Crawford & Company The world’s largest publicly listed independent provider of global claims management and outsourcing solutions.

Appendix: Non-GAAP Financial Information 23
Appendix: Non-GAAP Financial Information Measurements of financial performance not calculated in accordance with GAAP should be considered as supplements to, and not substitutes for, performance measurements calculated or derived in accordance with GAAP. Any such measures are not necessarily comparable to other similarly-titled measurements employed by other companies. Reimbursements for Out-of-Pocket Expenses In the normal course of our business, our operating segments incur certain out-of-pocket expenses that are thereafter reimbursed by our clients. Under GAAP, these out-of-pocket expenses and associated reimbursements are required to be included when reporting expenses and revenues, respectively, in our consolidated results of operations. In this presentation, we do not believe it is informative to include in reported revenues the amounts of reimbursed expenses and related revenues, as they offset each other in our consolidated results of operations with no impact to our net income or operating earnings. As a result, unless noted in this presentation, revenue and expense amounts exclude reimbursements for out-of-pocket expenses. Net Debt Net debt is computed as the sum of long-term debt, capital leases and short-term borrowings less cash and cash equivalents. Management believes that net debt is useful because it provides investors with an estimate of what the Company's debt would be if all available cash was used to pay down the debt of the Company. The measure is not meant to imply that management plans to use all available cash to pay down debt. Free Cash Flow Management believes free cash flow is useful to investors as it presents the amount of cash the Company has generated that can be used for other purposes, including additional contributions to the Company's defined benefit pension plans, discretionary prepayments of outstanding borrowings under our credit agreement, and return of capital to shareholders, among other purposes. It does not represent the residual cash flow of the Company available for discretionary expenditures. Segment and Consolidated Operating Earnings Operating earnings is the primary financial performance measure used by our senior management and chief operating decision maker to evaluate the financial performance of our Company and operating segments, and make resource allocation and certain compensation decisions. Management believes operating earnings is useful to others in that it allows them to evaluate segment and consolidated operating performance using the same criteria our management and chief operating decision maker use. Consolidated operating earnings represent segment earnings including certain unallocated corporate and shared costs and credits, but before net corporate interest expense, stock option expense, amortization of customer-relationship intangible assets, goodwill impairment, restructuring costs, income taxes and net income or loss attributable to noncontrolling interests.
Appendix: Non-GAAP Financial Information (cont.) Segment and Consolidated Gross Profit Gross profit is defined as revenues less direct expenses which exclude indirect overhead expenses allocated to the business. Indirect expenses consist of centralized administrative support costs, regional and local shared services that are allocated to each segment based on usage. Adjusted EBITDA Adjusted EBITDA is used by management to evaluate, assess and benchmark our operational results and the Company believes that adjusted EBITDA is relevant and useful information widely used by analysts, investors and other interested parties. Adjusted EBITDA is defined as net income attributable to shareholders of the Company with recurring adjustments for depreciation and amortization, net corporate interest expense, income taxes and stock-based compensation expense. Additionally, adjustments for non-recurring expenses for goodwill impairment and restructuring and other costs have been included in the calculation of adjusted EBITDA. Adjusted EBITDA is not a term defined by GAAP and as a result our measure of adjusted EBITDA might not be comparable to similarly titled measures used by other companies. Adjusted Revenue, Operating Earnings, Pretax Earnings, Net Income, Diluted Earnings per Share and EBITDA Included in non-GAAP adjusted measurements as an add back or subtraction to GAAP measurements, are impacts of the goodwill impairment, restructuring and other costs, which arise from non-core items not directly related to our normal business or operations, or our future performance. Management believes it is useful to exclude these charges when comparing net income and diluted earnings per share across periods, as these charges are not from ordinary operations.
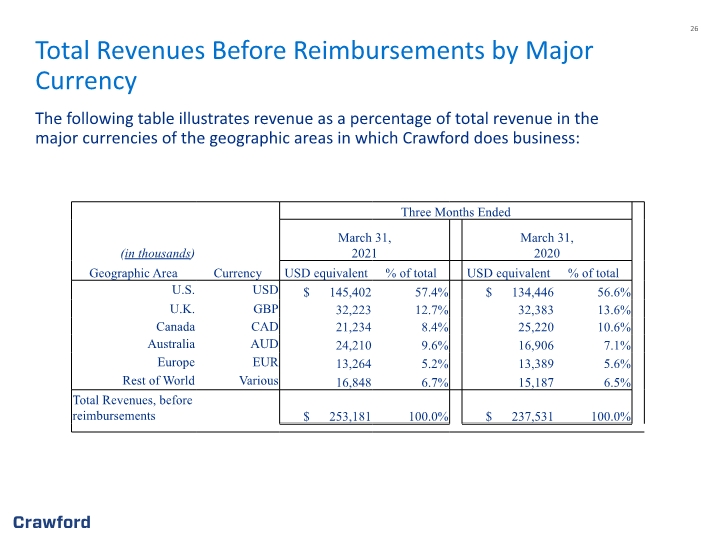
Total Revenues Before Reimbursements by Major Currency The following table illustrates revenue as a percentage of total revenue in the major currencies of the geographic areas in which Crawford does business:
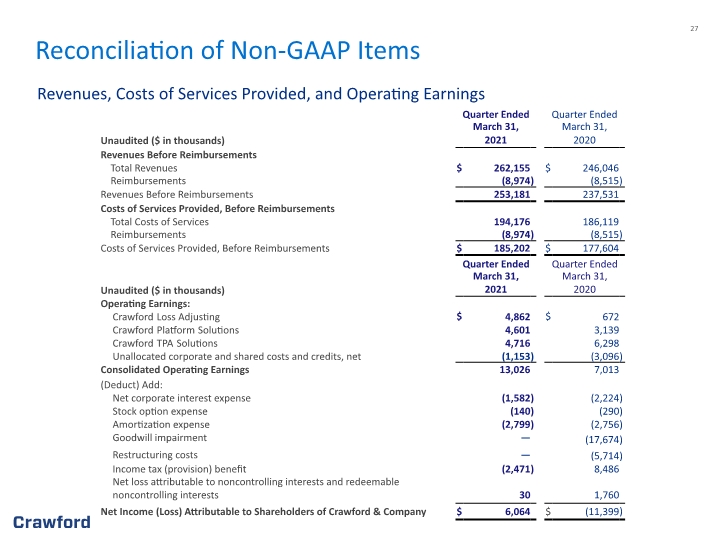
Reconciliation of Non-GAAP Items Revenues, Costs of Services Provided, and Operating Earnings
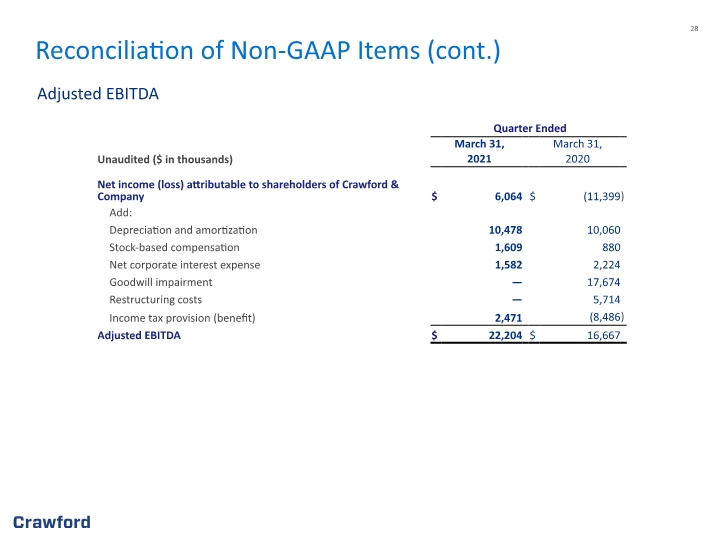
Reconciliation of Non-GAAP Items (cont.) Adjusted EBITDA
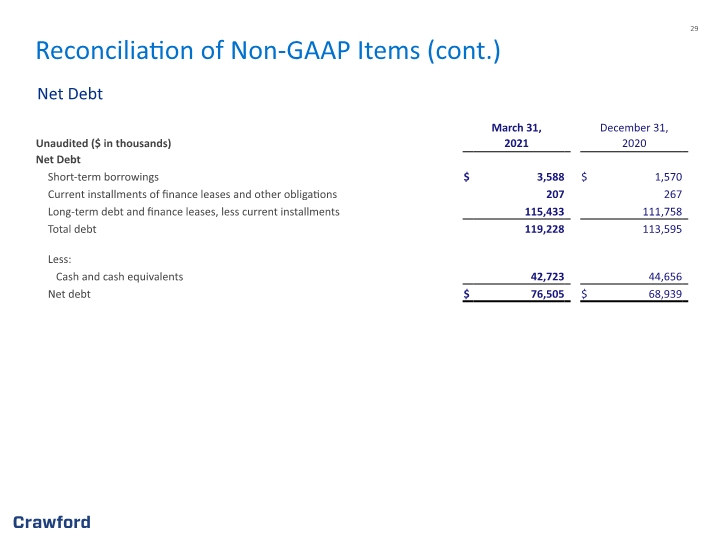
Reconciliation of Non-GAAP Items (cont.) Net Debt
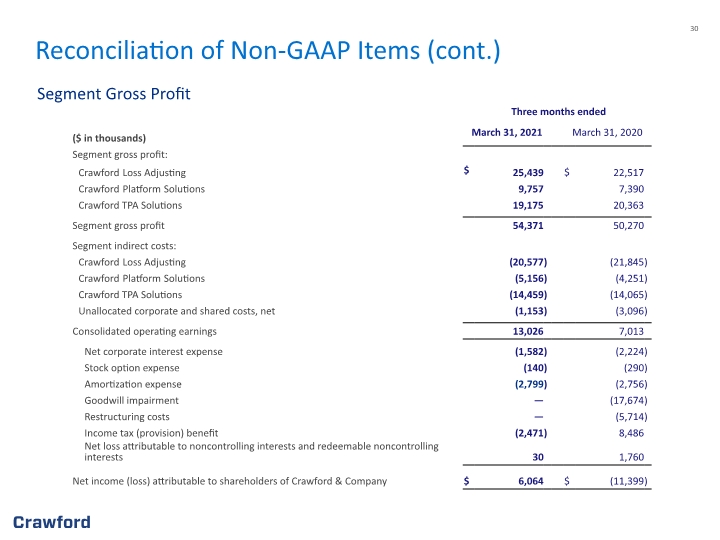
Reconciliation of Non-GAAP Items (cont.) Segment Gross Profit
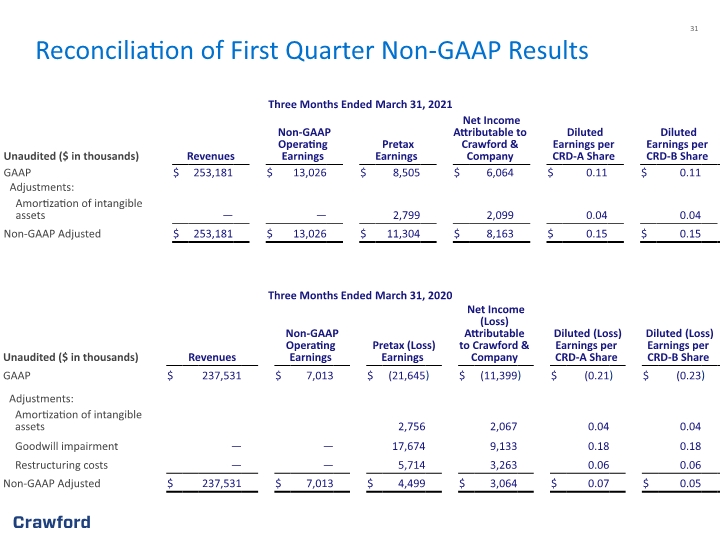
Reconciliation of First Quarter Non-GAAP Results


