TherapeuticsMD, Inc. 8-K
Exhibit 99.2
1 2Q 2019 Earnings August 6, 2019 Building a Premier Women’s Health Portfolio
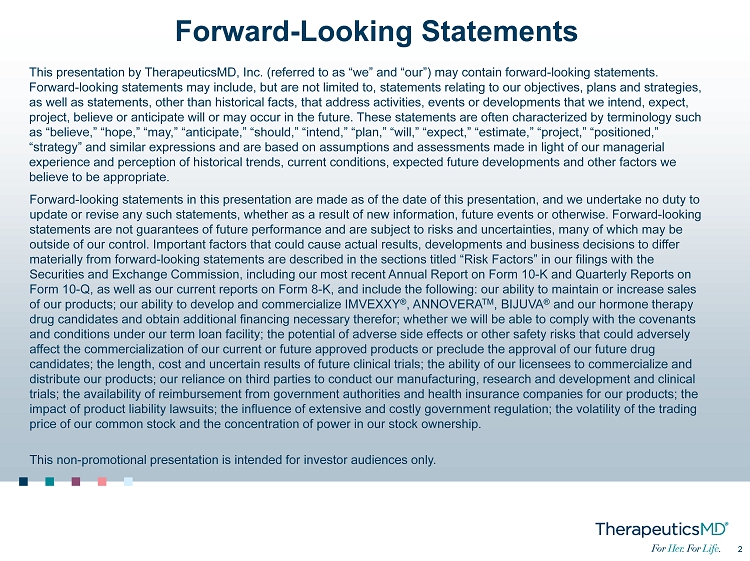
2 2 Forward - Looking Statements This presentation by TherapeuticsMD, Inc. (referred to as “we” and “our”) may contain forward - looking statements. Forward - looking statements may include, but are not limited to, statements relating to our objectives, plans and strategies, as well as statements, other than historical facts, that address activities, events or developments that we intend, expect, project, believe or anticipate will or may occur in the future. These statements are often characterized by terminology such as “believe,” “hope,” “may,” “anticipate,” “should,” “intend,” “plan,” “will,” “expect,” “estimate,” “project,” “positioned,” “strategy” and similar expressions and are based on assumptions and assessments made in light of our managerial experience and perception of historical trends, current conditions, expected future developments and other factors we believe to be appropriate. Forward - looking statements in this presentation are made as of the date of this presentation, and we undertake no duty to update or revise any such statements, whether as a result of new information, future events or otherwise. Forward - looking statements are not guarantees of future performance and are subject to risks and uncertainties, many of which may be outside of our control. Important factors that could cause actual results, developments and business decisions to differ materially from forward - looking statements are described in the sections titled “Risk Factors” in our filings with the Securities and Exchange Commission, including our most recent Annual Report on Form 10 - K and Quarterly Reports on Form 10 - Q, as well as our current reports on Form 8 - K, and include the following: our ability to maintain or increase sales of our products; our ability to develop and commercialize IMVEXXY ® , ANNOVERA TM , BIJUVA ® and our hormone therapy drug candidates and obtain additional financing necessary therefor; whether we will be able to comply with the covenants and conditions under our term loan facility; the potential of adverse side effects or other safety risks that could adversely affect the commercialization of our current or future approved products or preclude the approval of our future drug candidates; the length, cost and uncertain results of future clinical trials; the ability of our licensees to commercialize a nd distribute our products; our reliance on third parties to conduct our manufacturing, research and development and clinical trials; the availability of reimbursement from government authorities and health insurance companies for our products; the impact of product liability lawsuits; the influence of extensive and costly government regulation; the volatility of the trad ing price of our common stock and the concentration of power in our stock ownership. This non - promotional presentation is intended for investor audiences only.
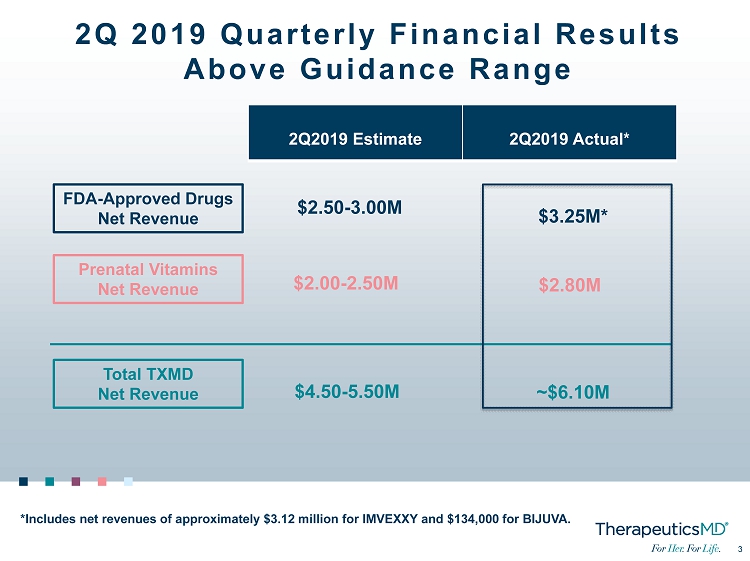
3 3 2Q 2019 Quarterly Financial Results Above Guidance Range FDA - Approved Drugs Net Revenue Prenatal Vitamins Net Revenue Total TXMD Net Revenue 2Q2019 Estimate 2Q2019 Actual* $2.50 - 3.00M $2.00 - 2.50M $4.50 - 5.50M *Includes net revenues of approximately $3.12 million for IMVEXXY and $134,000 for BIJUVA. $ 3.25 M* $ 2.80 M ~$ 6.10 M
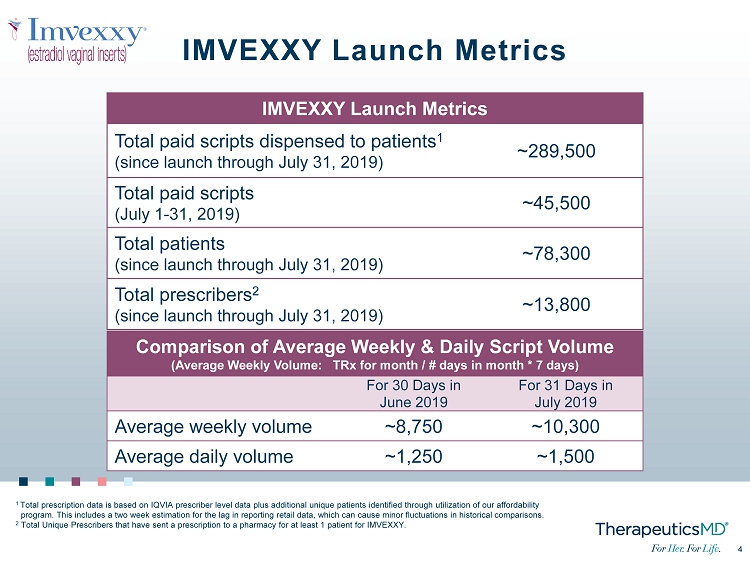
4 4 IMVEXXY Launch Metrics 1 Total prescription data is based on IQVIA prescriber level data plus additional unique patients identified through utilizatio n o f our affordability program. This includes a two week estimation for the lag in reporting retail data, which can cause minor fluctuations in hist ori cal comparisons. 2 Total Unique Prescribers that have sent a prescription to a pharmacy for at least 1 patient for IMVEXXY. IMVEXXY Launch Metrics Total paid scripts dispensed to patients 1 (since launch through July 31, 2019) ~289,500 Total paid scripts (July 1 - 31, 2019) ~45,500 Total patients (since launch through July 31, 2019) ~78,300 Total prescribers 2 (since launch through July 31, 2019) ~13,800 Comparison of Average Weekly & Daily Script Volume (Average Weekly Volume: TRx for month / # days in month * 7 days) For 30 Days in June 2019 For 31 Days in July 2019 Average weekly volume ~8,750 ~10,300 Average daily volume ~1,250 ~1,500
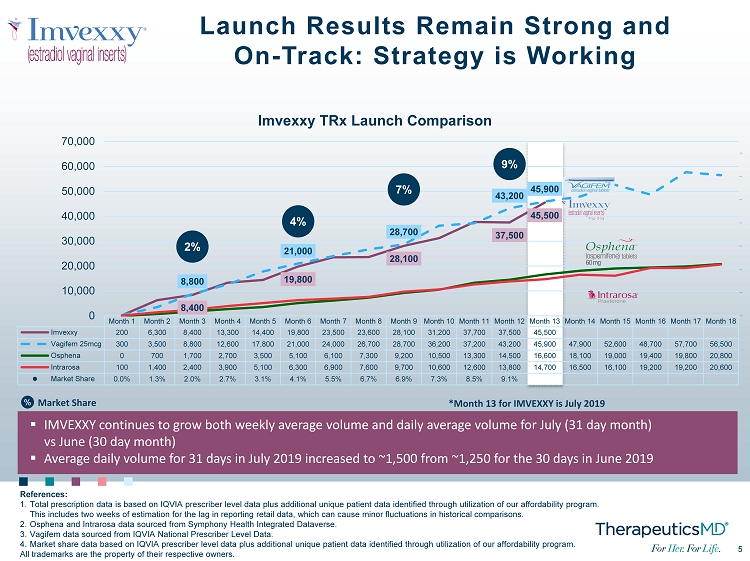
5 5 Month 1 Month 2 Month 3 Month 4 Month 5 Month 6 Month 7 Month 8 Month 9 Month 10 Month 11 Month 12 Month 13 Month 14 Month 15 Month 16 Month 17 Month 18 Imvexxy 200 6,300 8,400 13,300 14,400 19,800 23,500 23,600 28,100 31,200 37,700 37,500 45,500 Vagifem 25mcg 300 3,500 8,800 12,600 17,800 21,000 24,000 26,700 28,700 36,200 37,200 43,200 45,900 47,900 52,600 48,700 57,700 56,500 Osphena 0 700 1,700 2,700 3,500 5,100 6,100 7,300 9,200 10,500 13,300 14,500 16,600 18,100 19,000 19,400 19,800 20,800 Intrarosa 100 1,400 2,400 3,900 5,100 6,300 6,900 7,600 9,700 10,600 12,600 13,800 14,700 16,500 16,100 19,200 19,200 20,600 Market Share 0.0% 1.3% 2.0% 2.7% 3.1% 4.1% 5.5% 6.7% 6.9% 7.3% 8.5% 9.1% 8,400 19,800 28,100 37,500 45,500 8,800 21,000 28,700 43,200 45,900 2% 4% 7% 9% -4.0% -2.0% 0.0% 2.0% 4.0% 6.0% 8.0% 10.0% 0 10,000 20,000 30,000 40,000 50,000 60,000 70,000 Imvexxy TRx Launch Comparison Launch Results Remain Strong and On - Track: Strategy is Working References: 1. Total prescription data is based on IQVIA prescriber level data plus additional unique patient data identified through utiliz ati on of our affordability program. This includes two weeks of estimation for the lag in reporting retail data, which can cause minor fluctuations in historical com parisons. 2. Osphena and Intrarosa data sourced from Symphony Health Integrated Dataverse . 3. Vagifem data sourced from IQVIA National Prescriber Level Data. 4. Market share data based on IQVIA prescriber level data plus additional unique patient data identified through utilization of our affordability program. All trademarks are the property of their respective owners. ▪ IMVEXXY continues to grow both weekly average volume and daily average volume for July (31 day month) vs June (30 day month ) ▪ Average daily volume for 31 days in July 2019 increased to ~1,500 from ~1,250 for the 30 days in June 2019 *Month 13 for IMVEXXY is July 2019 % Market Share
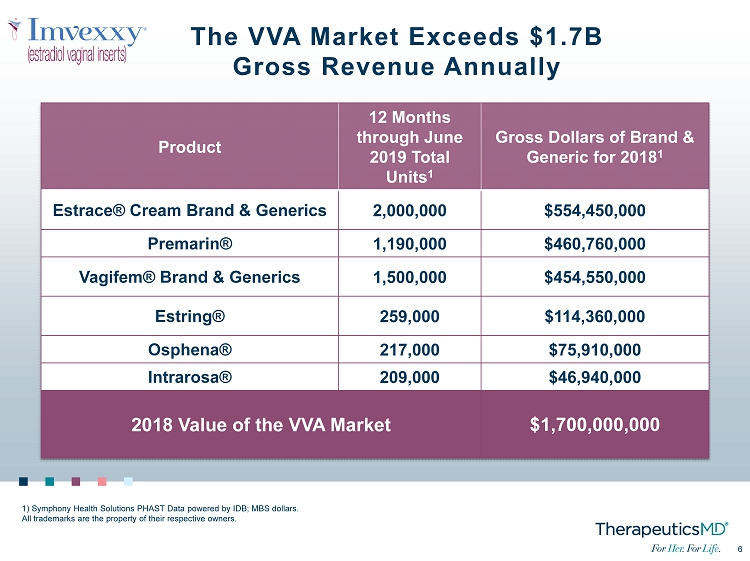
6 6 The VVA Market Exceeds $1.7B Gross Revenue Annually Product 12 Months through June 2019 Total Units 1 Gross Dollars of Brand & Generic for 2018 1 Estrace ® Cream Brand & Generics 2,000,000 $554,450,000 Premarin® 1,190,000 $460,760,000 Vagifem ® Brand & Generics 1,500,000 $454,550,000 Estring® 259,000 $114,360,000 Osphena ® 217,000 $75,910,000 Intrarosa ® 209,000 $46,940,000 2018 Value of the VVA Market $1,700,000,000 1) Symphony Health Solutions PHAST Data powered by IDB; MBS dollars. All trademarks are the property of their respective owners.
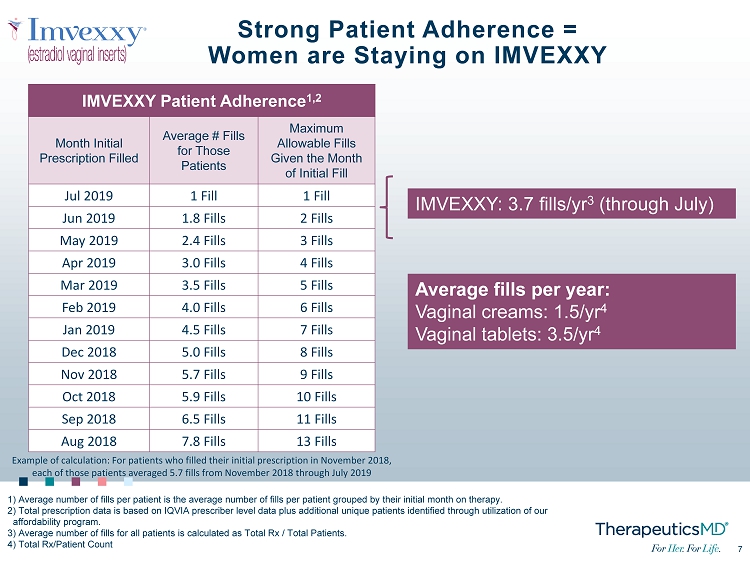
7 7 Strong Patient Adherence = Women are Staying on IMVEXXY IMVEXXY: 3.7 fills/yr 3 (through July) IMVEXXY Patient Adherence 1,2 Month Initial Prescription Filled Average # Fills for Those Patients Maximum Allowable Fills Given the Month of Initial Fill Jul 2019 1 Fill 1 Fill Jun 2019 1.8 Fills 2 Fills May 2019 2.4 Fills 3 Fills Apr 2019 3.0 Fills 4 Fills Mar 2019 3.5 Fills 5 Fills Feb 2019 4.0 Fills 6 Fills Jan 2019 4.5 Fills 7 Fills Dec 2018 5.0 Fills 8 Fills Nov 2018 5.7 Fills 9 Fills Oct 2018 5.9 Fills 10 Fills Sep 2018 6.5 Fills 11 Fills Aug 2018 7.8 Fills 13 Fills 1) Average number of fills per patient is the average number of fills per patient grouped by their initial month on therapy. 2) Total prescription data is based on IQVIA prescriber level data plus additional unique patients identified through utiliza tio n of our affordability program. 3) Average number of fills for all patients is calculated as Total Rx / Total Patients. 4) Total Rx/Patient Count Example of calculation: For patients who filled their initial prescription in November 2018, each of those patients averaged 5.7 fills from November 2018 through July 2019 Average fills per year: Vaginal creams: 1.5/yr 4 Vaginal tablets: 3.5/yr 4
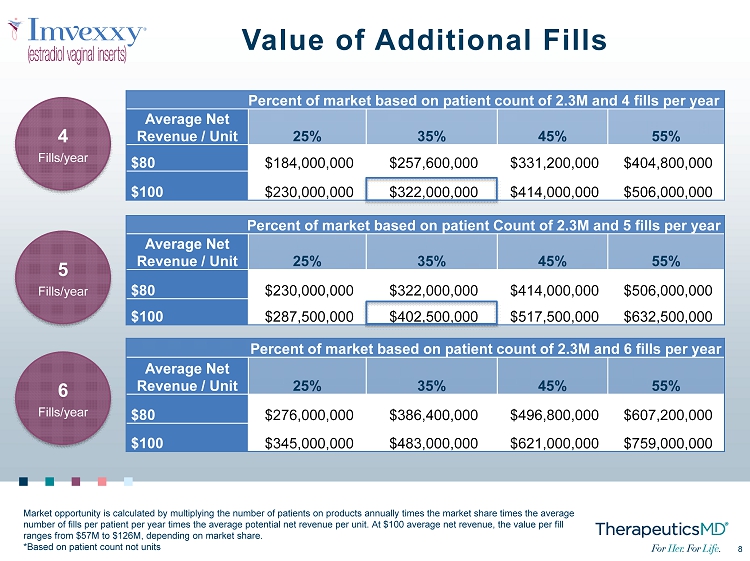
8 8 Value of Additional Fills Percent of market based on patient count of 2.3M and 4 fills per year Average Net Revenue / Unit 25% 35% 45% 55% $80 $184,000,000 $257,600,000 $331,200,000 $404,800,000 $100 $230,000,000 $322,000,000 $414,000,000 $506,000,000 6 Fills/year 5 Fills/year 4 Fills/year Percent of market based on patient Count of 2.3M and 5 fills per year Average Net Revenue / Unit 25% 35% 45% 55% $80 $230,000,000 $322,000,000 $414,000,000 $506,000,000 $100 $287,500,000 $402,500,000 $517,500,000 $632,500,000 Percent of market based on patient count of 2.3M and 6 fills per year Average Net Revenue / Unit 25% 35% 45% 55% $80 $276,000,000 $386,400,000 $496,800,000 $607,200,000 $100 $345,000,000 $483,000,000 $621,000,000 $759,000,000 Market opportunity is calculated by multiplying the number of patients on products annually times the market share times the ave rage number of fills per patient per year times the average potential net revenue per unit. At $100 average net revenue, the value pe r fill ranges from $57M to $126M, depending on market share. *Based on patient count not units
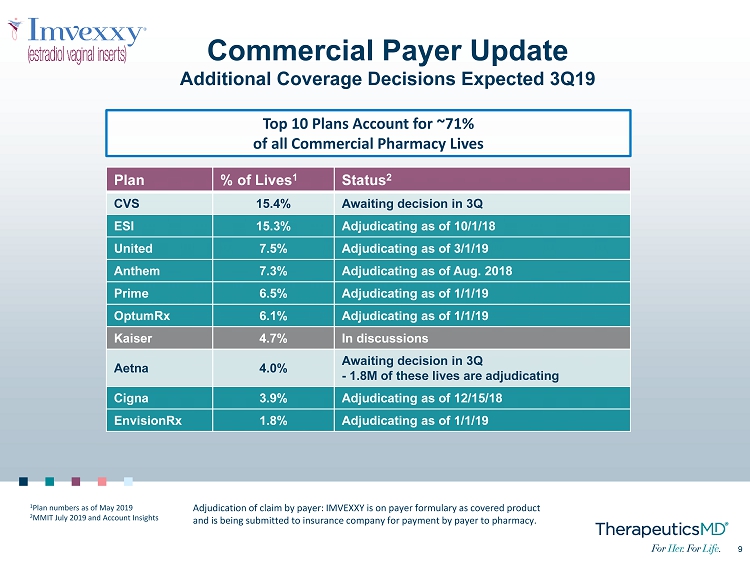
9 9 Commercial Payer Update Additional Coverage Decisions Expected 3Q19 Plan % of Lives 1 Status 2 CVS 15.4% Awaiting decision in 3Q ESI 15.3% Adjudicating as of 10/1/18 United 7.5% Adjudicating as of 3/1/19 Anthem 7.3% Adjudicating as of Aug. 2018 Prime 6.5% Adjudicating as of 1/1/19 OptumRx 6.1% Adjudicating as of 1/1/19 Kaiser 4.7% In discussions Aetna 4.0% Awaiting decision in 3Q - 1.8M of these lives are adjudicating Cigna 3.9% Adjudicating as of 12/15/18 EnvisionRx 1.8% Adjudicating as of 1/1/19 Top 10 Plans Account for ~71% of all Commercial Pharmacy Lives Adjudication of claim by payer: IMVEXXY is on payer formulary as covered product and is being submitted to insurance company for payment by payer to pharmacy. 1 Plan numbers as of May 2019 2 MMIT July 2019 and Account Insights
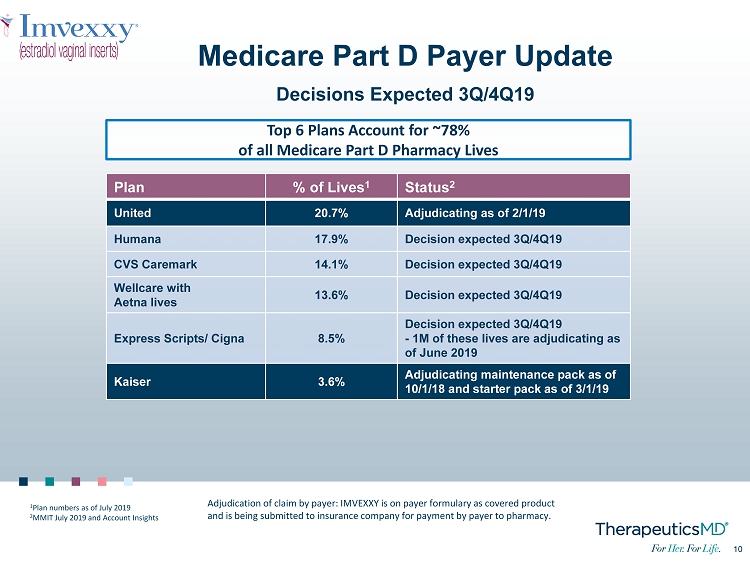
10 10 Medicare Part D Payer Update Decisions Expected 3Q/4Q19 Plan % of Lives 1 Status 2 United 20.7% Adjudicating as of 2/1/19 Humana 17.9% Decision expected 3Q/4Q19 CVS Caremark 14.1% Decision expected 3Q/4Q19 Wellcare with Aetna lives 13.6% Decision expected 3Q/4Q19 Express Scripts/ Cigna 8.5% Decision expected 3Q/4Q19 - 1M of these lives are adjudicating as of June 2019 Kaiser 3.6% Adjudicating maintenance pack as of 10/1/18 and starter pack as of 3/1/19 Top 6 Plans Account for ~78% of all Medicare Part D Pharmacy Lives Adjudication of claim by payer: IMVEXXY is on payer formulary as covered product and is being submitted to insurance company for payment by payer to pharmacy. 1 Plan numbers as of July 2019 2 MMIT July 2019 and Account Insights
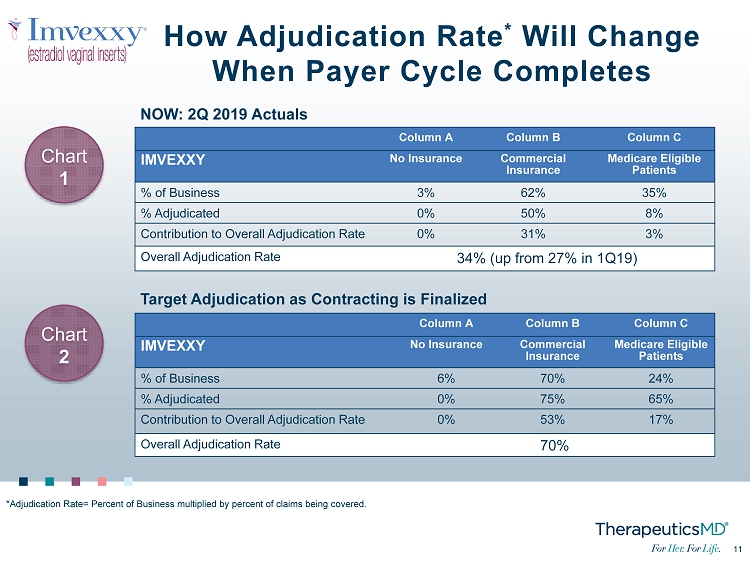
11 11 How Adjudication Rate * Will Change When Payer Cycle Completes Column A Column B Column C IMVEXXY No Insurance Commercial Insurance Medicare Eligible Patients % of Business 3% 62% 35% % Adjudicated 0% 50% 8% Contribution to Overall Adjudication Rate 0% 31% 3% Overall Adjudication Rate 34% (up from 27% in 1Q19) NOW: 2Q 2019 Actuals Column A Column B Column C IMVEXXY No Insurance Commercial Insurance Medicare Eligible Patients % of Business 6% 70% 24% % Adjudicated 0% 75% 65% Contribution to Overall Adjudication Rate 0% 53% 17% Overall Adjudication Rate 70% Target Adjudication as Contracting is Finalized *Adjudication Rate= Percent of Business multiplied by percent of claims being covered. Chart 1 Chart 2
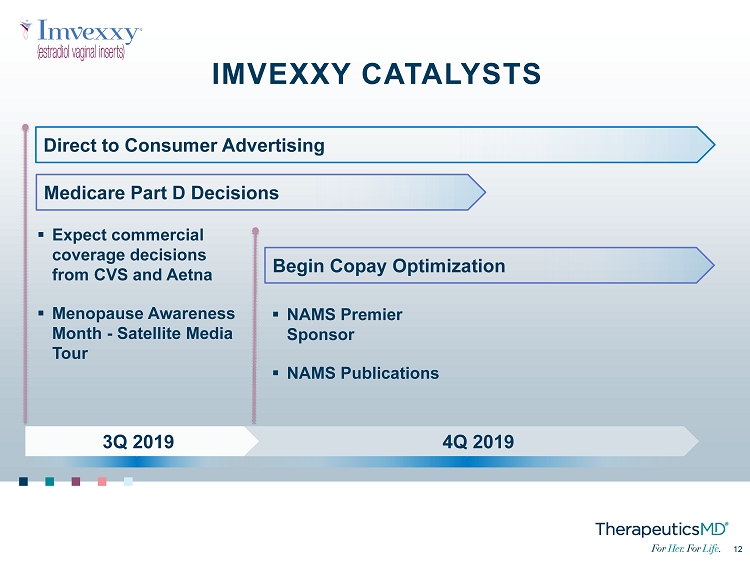
No Image 12 12 ▪ Expect commercial coverage decisions from CVS and Aetna ▪ Menopause Awareness Month - Satellite Media Tour ▪ NAMS Premier Sponsor ▪ NAMS Publications 4Q 2019 3Q 2019 IMVEXXY CATALYSTS Direct to Consumer Advertising Begin Copay Optimization Medicare Part D Decisions
No Image 13 13 BIJUVA
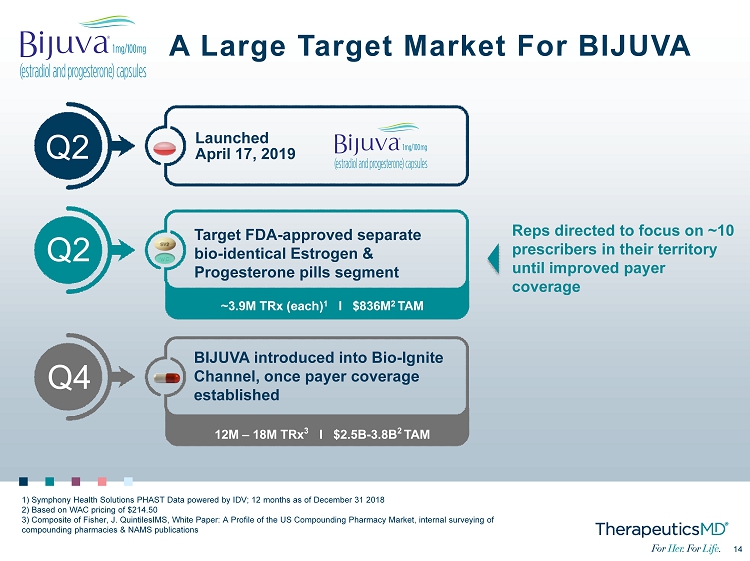
No Image 14 14 BIJUVA introduced into Bio - Ignite Channel, once payer coverage established Launched April 17, 2019 Target FDA - approved separate bio - identical Estrogen & Progesterone pills segment Q2 ~3.9M TRx (each) 1 I $836M 2 TAM 12M – 18M TRx 3 I $2.5B - 3.8B 2 TAM A Large Target Market For BIJUVA 1) Symphony Health Solutions PHAST Data powered by IDV; 12 months as of December 31 2018 2) Based on WAC pricing of $214.50 3) Composite of Fisher, J. QuintilesIMS, White Paper: A Profile of the US Compounding Pharmacy Market, internal surveying of compounding pharmacies & NAMS publications Q2 Q4 Reps directed to focus on ~10 prescribers in their territory until improved payer coverage
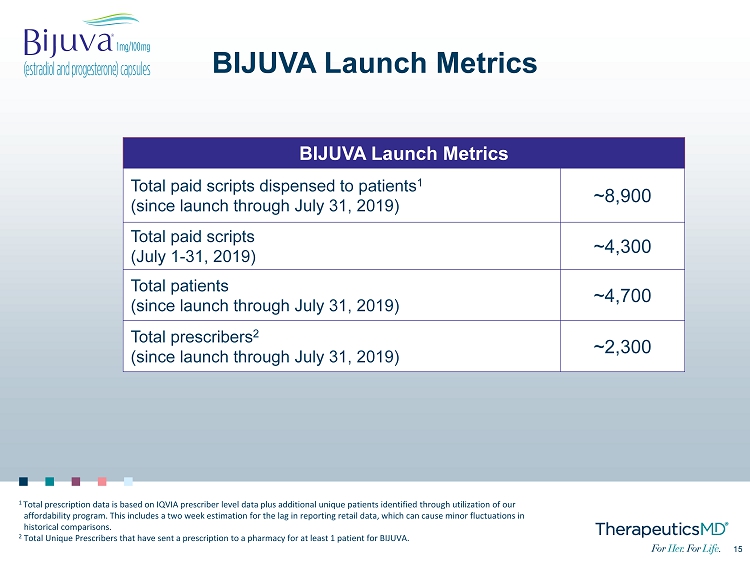
15 15 BIJUVA Launch Metrics BIJUVA Launch Metrics Total paid scripts dispensed to patients 1 (since launch through July 31, 2019) ~8,900 Total paid scripts (July 1 - 31, 2019) ~4,300 Total patients (since launch through July 31, 2019) ~4,700 Total prescribers 2 (since launch through July 31, 2019) ~2,300 1 Total prescription data is based on IQVIA prescriber level data plus additional unique patients identified through utilization of o ur affordability program. This includes a two week estimation for the lag in reporting retail data, which can cause minor fluctu ati ons in historical comparisons. 2 Total Unique Prescribers that have sent a prescription to a pharmacy for at least 1 patient for BIJUVA.
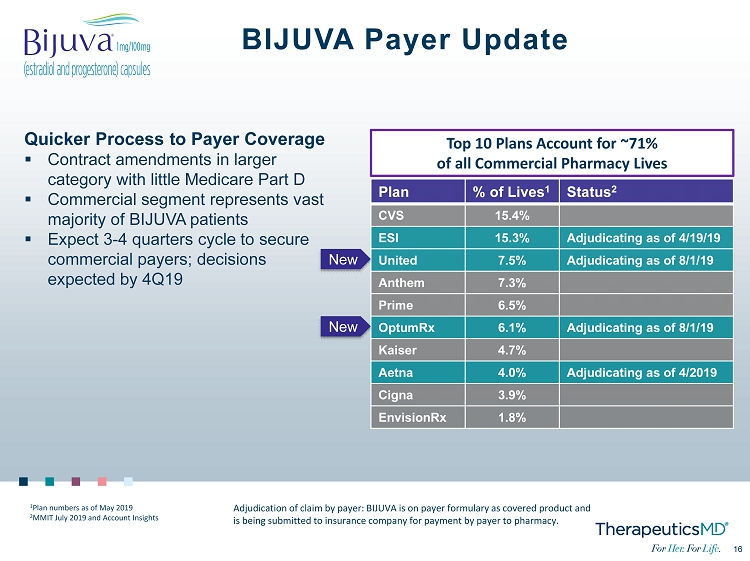
16 16 BIJUVA Payer Update Plan % of Lives 1 Status 2 CVS 15.4% ESI 15.3% Adjudicating as of 4/19/19 United 7.5% Adjudicating as of 8/1/19 Anthem 7.3% Prime 6.5% OptumRx 6.1% Adjudicating as of 8/1/19 Kaiser 4.7% Aetna 4.0% Adjudicating as of 4/2019 Cigna 3.9% EnvisionRx 1.8% Top 10 Plans Account for ~71% of all Commercial Pharmacy Lives Adjudication of claim by payer: BIJUVA is on payer formulary as covered product and is being submitted to insurance company for payment by payer to pharmacy. Quicker Process to Payer Coverage ▪ Contract amendments in larger category with little Medicare Part D ▪ Commercial segment represents vast majority of BIJUVA patients ▪ Expect 3 - 4 quarters cycle to secure commercial payers; decisions expected by 4Q19 1 Plan numbers as of May 2019 2 MMIT July 2019 and Account Insights New New
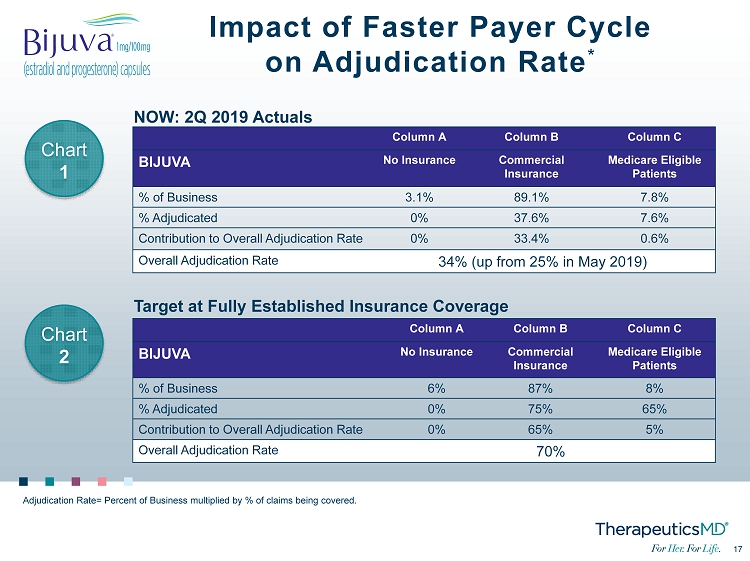
17 17 Impact of Faster Payer Cycle on Adjudication Rate * Column A Column B Column C BIJUVA No Insurance Commercial Insurance Medicare Eligible Patients % of Business 3.1% 89.1% 7.8% % Adjudicated 0% 37.6% 7.6% Contribution to Overall Adjudication Rate 0% 33.4% 0.6% Overall Adjudication Rate 34% (up from 25% in May 2019) NOW: 2Q 2019 Actuals Target at Fully Established Insurance Coverage Column A Column B Column C BIJUVA No Insurance Commercial Insurance Medicare Eligible Patients % of Business 6% 87% 8% % Adjudicated 0% 75% 65% Contribution to Overall Adjudication Rate 0% 65% 5% Overall Adjudication Rate 70% Adjudication Rate= Percent of Business multiplied by % of claims being covered. Chart 1 Chart 2
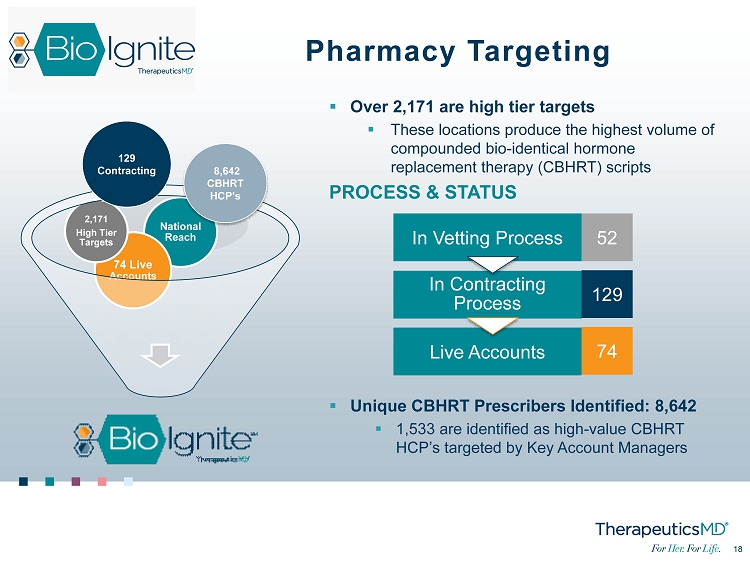
18 18 ▪ Over 2,171 are high tier targets ▪ These locations produce the highest volume of compounded bio - identical hormone replacement therapy (CBHRT) scripts PROCESS & STATUS ▪ Unique CBHRT Prescribers Identified: 8,642 ▪ 1,533 are identified as high - value CBHRT HCP’s targeted by Key Account Managers National Reach 74 Live Accounts 2,171 High Tier Targets 129 Contracting 8,642 CBHRT HCP’s In Vetting Process 52 Live Accounts 74 In Contracting Process 129 Pharmacy Targeting
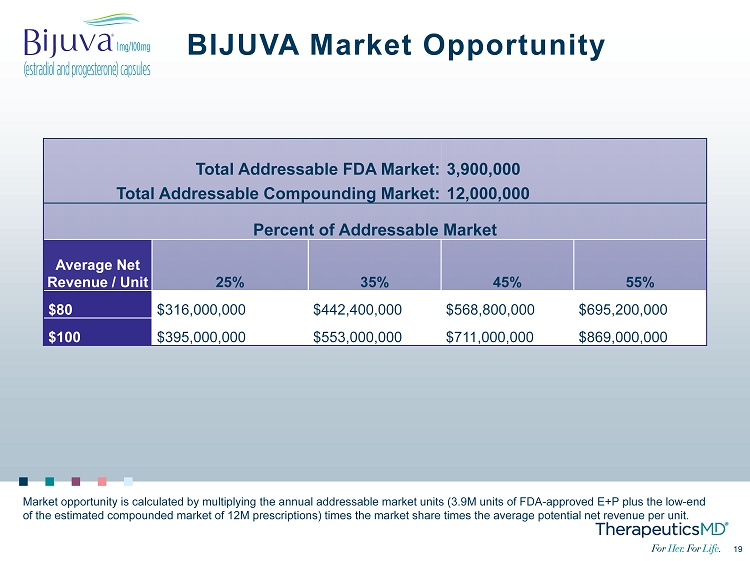
19 19 BIJUVA Market Opportunity Market opportunity is calculated by multiplying the annual addressable market units (3.9M units of FDA - approved E+P plus the low - end of the estimated compounded market of 12M prescriptions) times the market share times the average potential net revenue per u nit . Total Addressable FDA Market: 3,900,000 Total Addressable Compounding Market: 12,000,000 Percent of Addressable Market Average Net Revenue / Unit 25% 35% 45% 55% $80 $316,000,000 $442,400,000 $568,800,000 $695,200,000 $100 $395,000,000 $553,000,000 $711,000,000 $869,000,000
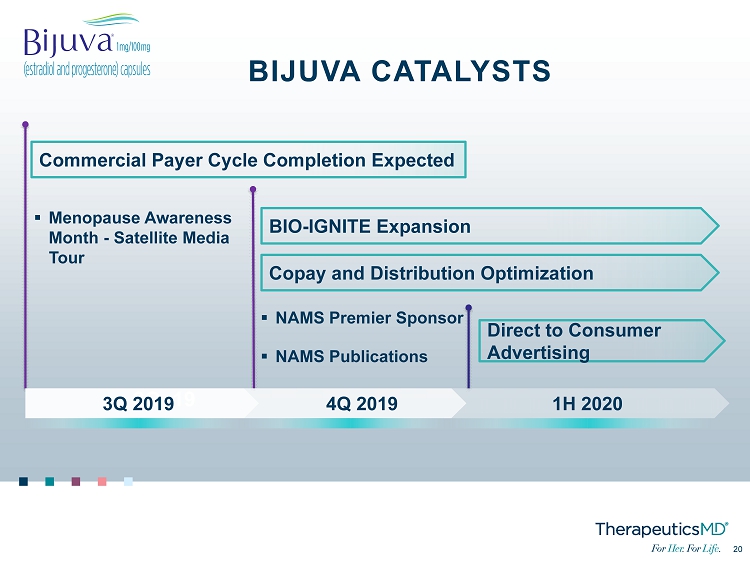
No Image 20 20 3Q 19 ▪ Menopause Awareness Month - Satellite Media Tour ▪ NAMS Premier Sponsor ▪ NAMS Publications 1H 2020 4Q 2019 3Q 2019 BIJUVA CATALYSTS Commercial Payer Cycle Completion Expected BIO - IGNITE Expansion Copay and Distribution Optimization Direct to Consumer Advertising
No Image 21 21 ANNOVERA
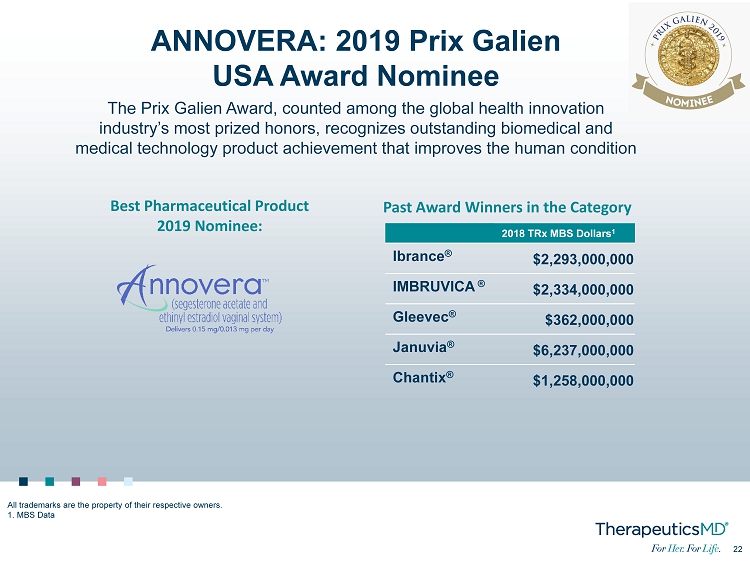
22 22 ANNOVERA: 2019 Prix Galien USA Award Nominee Best Pharmaceutical Product 2019 Nominee: Past Award Winners in the Category All trademarks are the property of their respective owners. 1. MBS Data The Prix Galien Award, counted among the global health innovation industry’s most prized honors, recognizes outstanding biomedical and medical technology product achievement that improves the human condition 2018 TRx MBS Dollars 1 Ibrance ® $2,293,000,000 IMBRUVICA ® $2,334,000,000 Gleevec ® $362,000,000 Januvia ® $6,237,000,000 Chantix ® $1,258,000,000
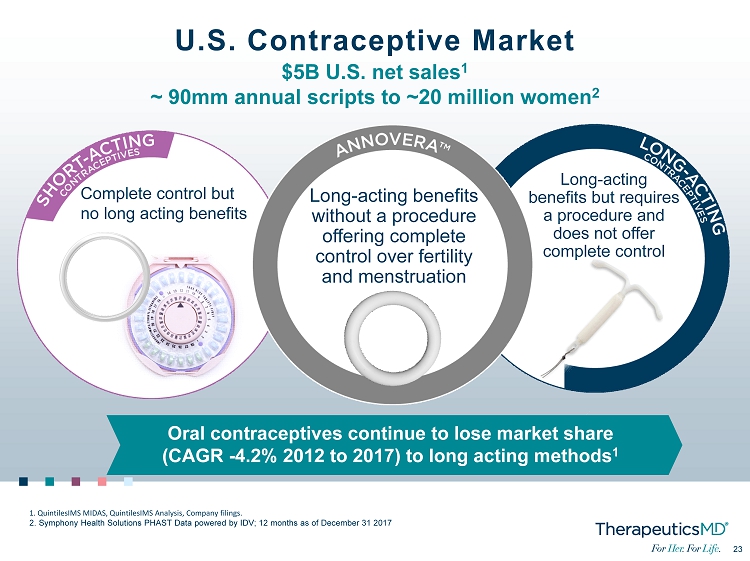
No Image 23 23 U.S. Contraceptive Market $5B U.S. net sales 1 ~ 90mm annual scripts to ~20 million women 2 Complete control but no long acting benefits Long - acting benefits without a procedure offering complete control over fertility and menstruation Long - acting benefits but requires a procedure and does not offer complete control 1. QuintilesIMS MIDAS, QuintilesIMS Analysis, Company filings. 2. Symphony Health Solutions PHAST Data powered by IDV; 12 months as of December 31 2017 Oral contraceptives continue to lose market share (CAGR - 4.2% 2012 to 2017) to long acting methods 1
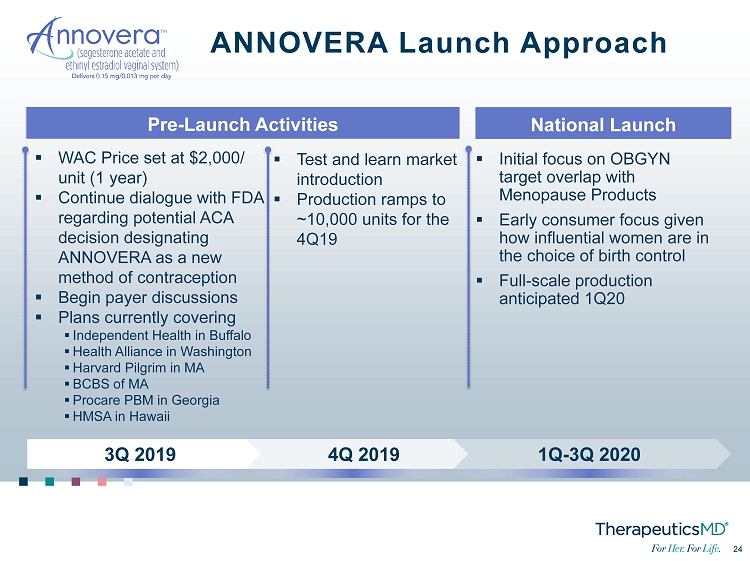
No Image 24 24 ANNOVERA Launch Approach ▪ Initial focus on OBGYN target overlap with Menopause Products ▪ Early consumer focus given how influential women are in the choice of birth control ▪ Full - scale production anticipated 1Q20 ▪ WAC Price set at $2,000/ unit (1 year) ▪ Continue dialogue with FDA regarding potential ACA decision designating ANNOVERA as a new method of contraception ▪ Begin payer discussions ▪ Plans currently covering ▪ Independent Health in Buffalo ▪ Health Alliance in Washington ▪ Harvard Pilgrim in MA ▪ BCBS of MA ▪ Procare PBM in Georgia ▪ HMSA in Hawaii ▪ Test and learn market introduction ▪ Production ramps to ~10,000 units for the 4Q19 1Q - 3Q 2020 4Q 2019 3Q 2019 Pre - Launch Activities National Launch
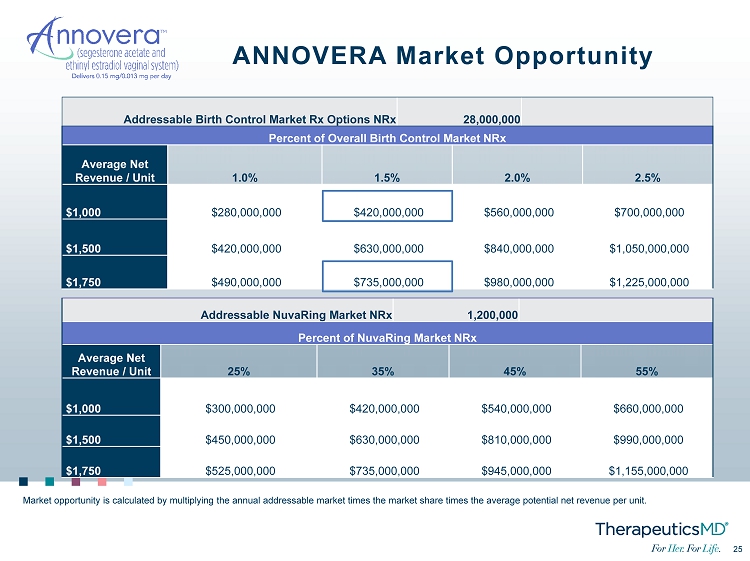
25 25 ANNOVERA Market Opportunity Addressable Birth Control Market Rx Options NRx 28,000,000 Percent of Overall Birth Control Market NRx Average Net Revenue / Unit 1.0% 1.5% 2.0% 2.5% $1,000 $280,000,000 $420,000,000 $560,000,000 $700,000,000 $1,500 $420,000,000 $630,000,000 $840,000,000 $1,050,000,000 $1,750 $490,000,000 $735,000,000 $980,000,000 $1,225,000,000 Addressable NuvaRing Market NRx 1,200,000 Percent of NuvaRing Market NRx Average Net Revenue / Unit 25% 35% 45% 55% $1,000 $300,000,000 $420,000,000 $540,000,000 $660,000,000 $1,500 $450,000,000 $630,000,000 $810,000,000 $990,000,000 $1,750 $525,000,000 $735,000,000 $945,000,000 $1,155,000,000 Market opportunity is calculated by multiplying the annual addressable market times the market share times the average potent ial net revenue per unit.

26 26 Financial Overview

27 27 2Q 2019 Quarterly Financial Results Above Guidance Range FDA - Approved Drugs Net Revenue Prenatal Vitamins Net Revenue Total TXMD Net Revenue 2Q2019 Estimate 2Q2019 Actual* $2.50 - 3.00M $2.00 - 2.50M $4.50 - 5.50M *Includes net revenues of approximately $3.12 million for IMVEXXY and $134,000 for BIJUVA. $ 3.25 M* $ 2.80 M ~$ 6.10 M
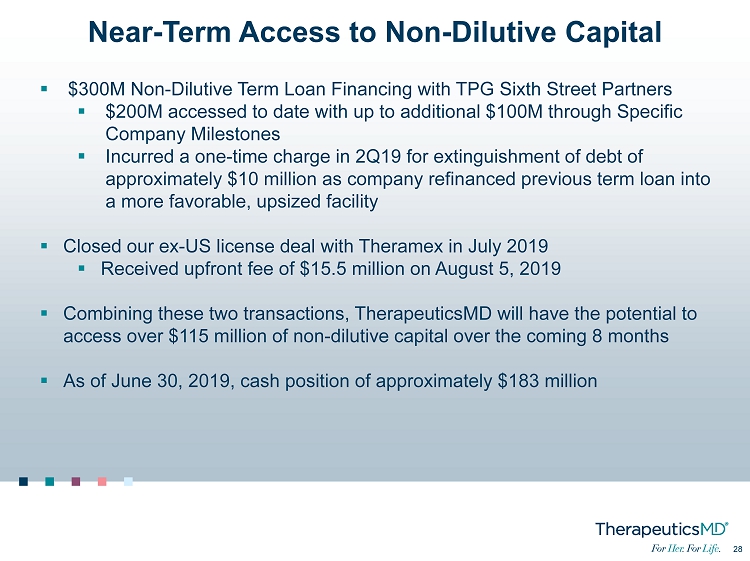
28 28 Near - Term Access to Non - Dilutive Capital ▪ $300M Non - Dilutive Term Loan Financing with TPG Sixth Street Partners ▪ $200M accessed to date with up to additional $100M through Specific Company Milestones ▪ Incurred a one - time charge in 2Q19 for extinguishment of debt of approximately $10 million as company refinanced previous term loan into a more favorable, upsized facility ▪ Closed our ex - US license deal with Theramex in July 2019 ▪ Received upfront fee of $15.5 million on August 5, 2019 ▪ Combining these two transactions, TherapeuticsMD will have the potential to access over $115 million of non - dilutive capital over the coming 8 months ▪ As of June 30, 2019, cash position of approximately $183 million
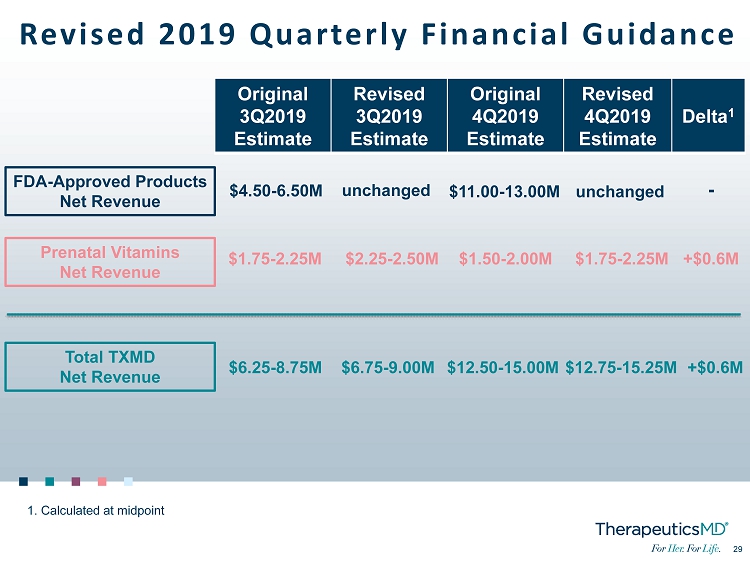
29 29 Revised 2019 Quarterly Financial Guidance FDA - Approved Products Net Revenue Prenatal Vitamins Net Revenue Total TXMD Net Revenue Original 3Q2019 Estimate Revised 3Q2019 Estimate Original 4Q2019 Estimate Revised 4Q2019 Estimate Delta 1 $4.50 - 6.50M $1.75 - 2.25M $6.25 - 8.75M unchanged $2.25 - 2.50M $6.75 - 9.00M $11.00 - 13.00M $1.50 - 2.00M $12.50 - 15.00M unchanged $1.75 - 2.25M $12.75 - 15.25M - +$0.6M +$0.6M 1. Calculated at midpoint
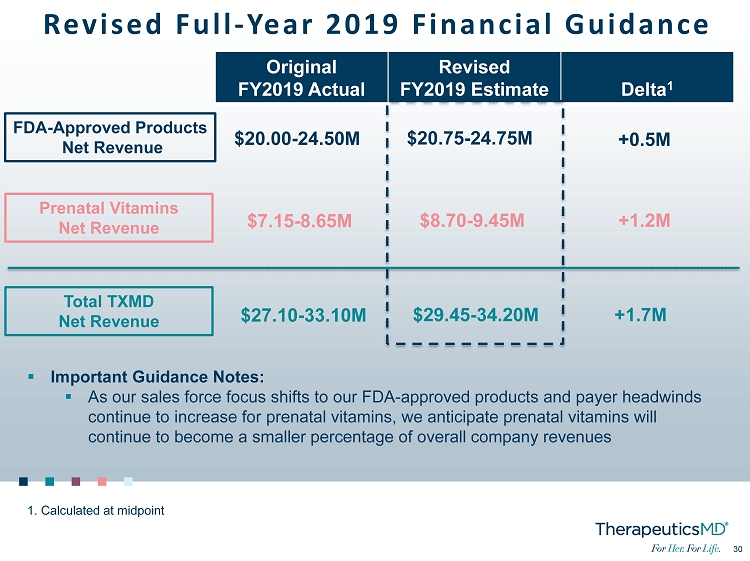
30 30 Revised Full - Year 2019 Financial Guidance FDA - Approved Products Net Revenue Prenatal Vitamins Net Revenue Total TXMD Net Revenue Original FY2019 Actual Revised FY2019 Estimate Delta 1 $20.75 - 24.75M $8.70 - 9.45M $29.45 - 34.20M +0.5M +1.2M +1.7M 1. Calculated at midpoint ▪ Important Guidance Notes: ▪ As our sales force focus shifts to our FDA - approved products and payer headwinds continue to increase for prenatal vitamins, we anticipate prenatal vitamins will continue to become a smaller percentage of overall company revenues $20.00 - 24.50M $7.15 - 8.65M $27.10 - 33.10M
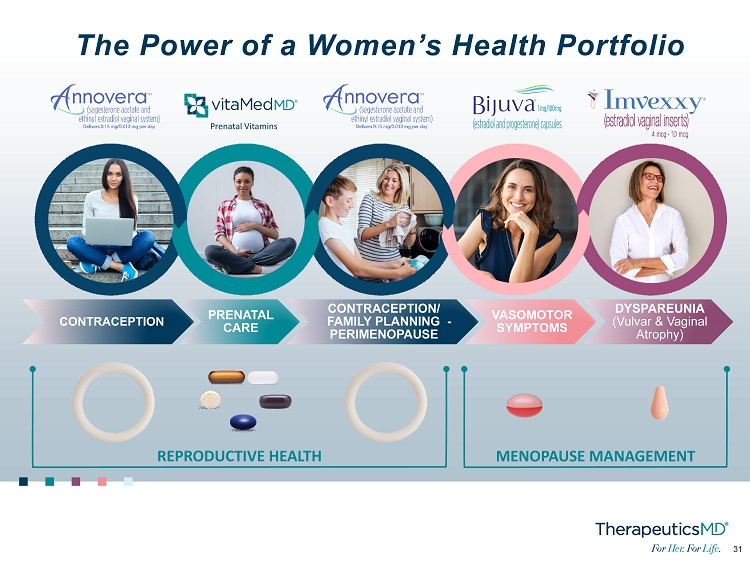
No Image 31 31 CONTRACEPTION PRENATAL CARE CONTRACEPTION/ FAMILY PLANNING - PERIMENOPAUSE VASOMOTOR SYMPTOMS DYSPAREUNIA (Vulvar & Vaginal Atrophy) REPRODUCTIVE HEALTH MENOPAUSE MANAGEMENT Prenatal Vitamins The Power of a Women’s Health Portfolio
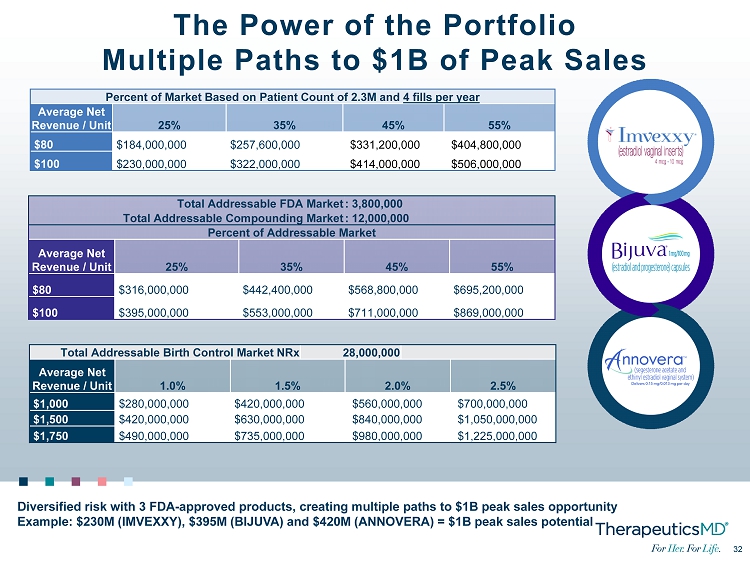
32 32 Total Addressable Birth Control Market NRx 28,000,000 Average Net Revenue / Unit 1.0% 1.5% 2.0% 2.5% $1,000 $280,000,000 $420,000,000 $560,000,000 $700,000,000 $1,500 $420,000,000 $630,000,000 $840,000,000 $1,050,000,000 $1,750 $490,000,000 $735,000,000 $980,000,000 $1,225,000,000 Percent of Market Based on Patient Count of 2.3M and 4 fills per year Average Net Revenue / Unit 25% 35% 45% 55% $80 $184,000,000 $257,600,000 $331,200,000 $404,800,000 $100 $230,000,000 $322,000,000 $414,000,000 $506,000,000 Total Addressable FDA Market : 3,800,000 Total Addressable Compounding Market : 12,000,000 Percent of Addressable Market Average Net Revenue / Unit 25% 35% 45% 55% $80 $316,000,000 $442,400,000 $568,800,000 $695,200,000 $100 $395,000,000 $553,000,000 $711,000,000 $869,000,000 The Power of the Portfolio Multiple Paths to $1B of Peak Sales Diversified risk with 3 FDA - approved products, creating multiple paths to $1B peak sales opportunity Example: $230M (IMVEXXY), $395M (BIJUVA) and $420M (ANNOVERA) = $1B peak sales potential

33 33