TherapeuticsMD, Inc. 8-K
Exhibit 99.2
Building the Premier Women’s Health Company 4Q 2020 Earnings March 2, 2021
2 FOR INVESTOR PRESENTATION PURPOSES ONLY. Forward - Looking Statements This presentation by TherapeuticsMD, Inc . (referred to as “we,” “our,” or the “Company”) may contain forward - looking statements . Forward - looking statements may include, but are not limited to, statements relating to our objectives, plans and strategies, as well as statements, other than historical facts, that address activities, events or developments that we intend, expect, project, believe or anticipate will or may occur in the future . These statements are often characterized by terminology such as “believe,” “hope,” “may,” “anticipate,” “should,” “intend,” “plan,” “will,” “expect,” “estimate,” “project,” “positioned,” “strategy” and similar expressions and are based on assumptions and assessments made in light of our managerial experience and perception of historical trends, current conditions, expected future developments and other factors we believe to be appropriate . Forward - looking statements in this presentation are made as of the date of this presentation, and we undertake no duty to update or revise any such statements, whether as a result of new information, future events or otherwise . Forward - looking statements are not guarantees of future performance and are subject to risks and uncertainties, many of which may be outside of our control . Important factors that could cause actual results, developments and business decisions to differ materially from forward - looking statements are described in the sections titled “Risk Factors” in our filings with the Securities and Exchange Commission (SEC), including our most recent Annual Report on Form 10 - K and Quarterly Reports on Form 10 - Q, as well as our current reports on Form 8 - K, and include the following : the effects of the COVID - 19 pandemic ; whether the company will meet the anticipated and/or projected 2021 and later performance measures that are included in this presentation for informational purposes ; the company’s ability to maintain or increase sales of its products ; the company’s ability to develop and commercialize Imvexxy®, ANNOVERA®, and Bijuva ® and obtain additional financing necessary therefor ; whether the company will be able to comply with the covenants and conditions under its term loan facility, including the minimum net revenue and minimum cash covenants ; whether the company will be able to successfully divest its vitaCare business and how the proceeds that may be generated by such divestiture will be used ; the potential of adverse side effects or other safety risks that could adversely affect the commercialization of the company’s current or future approved products or preclude the approval of the company’s future drug candidates ; whether the FDA will approve the lower dose of Bijuva ; the company’s ability to protect its intellectual property, including with respect to the Paragraph IV notice letters the company received regarding Imvexxy and Bijuva ; the length, cost and uncertain results of future clinical trials ; the company’s reliance on third parties to conduct its manufacturing, research and development and clinical trials ; the ability of the company’s licensees to commercialize and distribute the company’s products ; the ability of the company’s marketing contractors to market ANNOVERA ; the availability of reimbursement from government authorities and health insurance companies for the company’s products ; the ability to grow the company’s vitaCare business ; the impact of product liability lawsuits ; the influence of extensive and costly government regulation ; the volatility of the trading price of the company’s common stock and the concentration of power in its stock ownership . This non - promotional presentation is intended for investor audiences only .

FOR INVESTOR PRESENTATION PURPOSES ONLY. 3 Strategic Overview
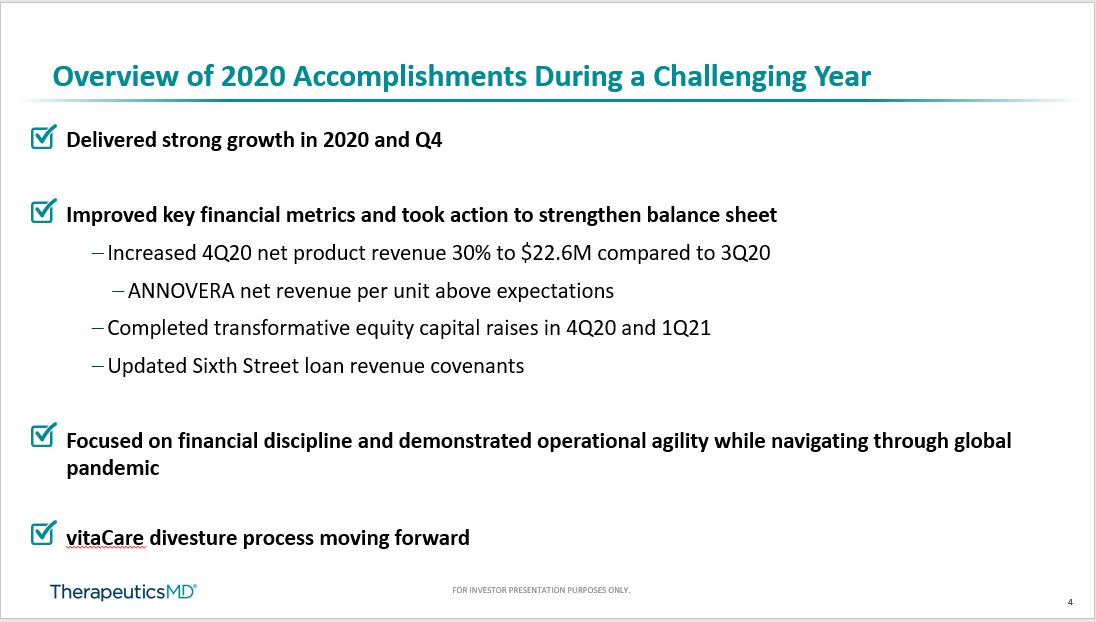
4 FOR INVESTOR PRESENTATION PURPOSES ONLY. Overview of 2020 Accomplishments During a Challenging Year Delivered strong growth in 2020 and Q4 Improved key financial metrics and took action to strengthen balance sheet ⎯ Increased 4Q20 net product revenue 30% to $22.6M compared to 3Q20 ⎯ ANNOVERA net revenue per unit above expectations ⎯ Completed transformative equity capital raises in 4Q20 and 1Q21 ⎯ Updated Sixth Street loan revenue covenants Focused on financial discipline and demonstrated operational agility while navigating through global pandemic vitaCare divesture process moving forward
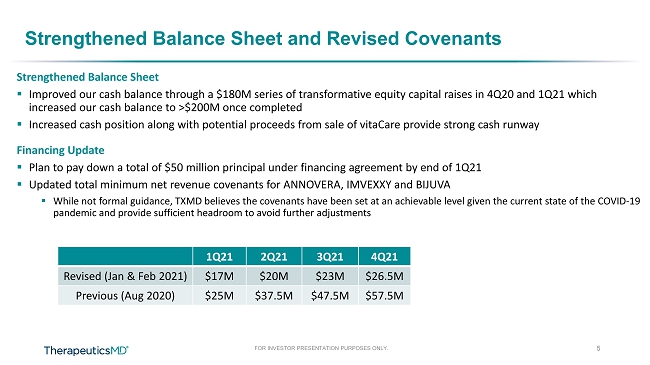
FOR INVESTOR PRESENTATION PURPOSES ONLY. Strengthened Balance Sheet and Revised Covenants Strengthened Balance Sheet ▪ Improved our cash balance through a $180M series of transformative equity capital raises in 4Q20 and 1Q21 which increased our cash balance to >$200M once completed ▪ Increased cash position along with potential proceeds from sale of vitaCare provide strong cash runway Financing Update ▪ Plan to pay down a total of $50 million principal under financing agreement by end of 1Q21 ▪ Updated total minimum net revenue covenants for ANNOVERA, IMVEXXY and BIJUVA ▪ While not formal guidance, TXMD believes the covenants have been set at an achievable level given the current state of the CO VID - 19 pandemic and provide sufficient headroom to avoid further adjustments 1Q21 2Q21 3Q21 4Q21 Revised (Jan & Feb 2021) $17M $20M $23M $26.5M Previous (Aug 2020) $25M $37.5M $47.5M $57.5M 5
FOR INVESTOR PRESENTATION PURPOSES ONLY. 6 4Q20 Financial Overview
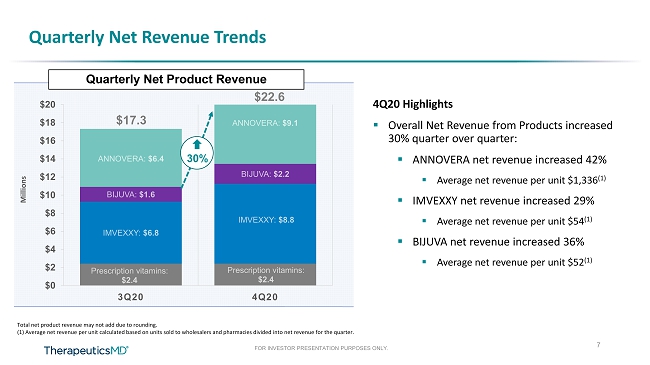
FOR INVESTOR PRESENTATION PURPOSES ONLY. $0 $2 $4 $6 $8 $10 $12 $14 $16 $18 $20 3Q20 4Q20 Quarterly Net Revenue Trends Millions 4Q20 Highlights ▪ Overall Net Revenue from Products increased 30% quarter over quarter: ▪ ANNOVERA net revenue increased 42% ▪ Average net revenue per unit $1,336 (1) ▪ IMVEXXY net revenue increased 29% ▪ Average net revenue per unit $54 (1) ▪ BIJUVA net revenue increased 36% ▪ Average net revenue per unit $52 (1) $17.3 $22.6 Quarterly Net Product Revenue 7 Total net product revenue may not add due to rounding. (1) Average net revenue per unit calculated based on units sold to wholesalers and pharmacies divided into net revenue for th e q uarter. 30%
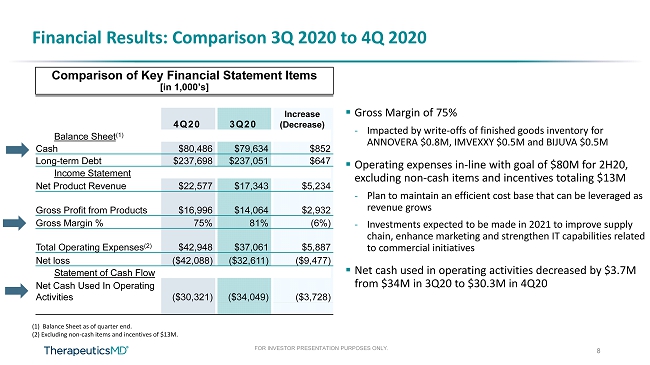
FOR INVESTOR PRESENTATION PURPOSES ONLY. Financial Results: Comparison 3Q 2020 to 4Q 2020 ▪ Gross Margin of 75% - Impacted by write - offs of finished goods inventory for ANNOVERA $0.8M, IMVEXXY $0.5M and BIJUVA $0.5M ▪ Operating expenses in - line with goal of $80M for 2H20, excluding non - cash items and incentives totaling $13M - Plan to maintain an efficient cost base that can be leveraged as revenue grows - Investments expected to be made in 2021 to improve supply chain, enhance marketing and strengthen IT capabilities related to commercial initiatives ▪ Net cash used in operating activities decreased by $3.7M from $34M in 3Q20 to $30.3M in 4Q20 4Q20 3Q20 Increase (Decrease) Balance Sheet (1) Cash $80,486 $79,634 $852 Long - term Debt $237,698 $237,051 $647 Income Statement Net Product Revenue $22,577 $17,343 $5,234 Gross Profit from Products $16,996 $14,064 $2,932 Gross Margin % 75% 81% (6%) Total Operating Expenses (2) $42,948 $37,061 $5,887 Net loss ($42,088) ($32,611) ($9,477) Statement of Cash Flow Net Cash Used In Operating Activities ($30,321) ($34,049) ($3,728) Comparison of Key Financial Statement Items [in 1,000’s] 8 (1) Balance Sheet as of quarter end. (2) Excluding non - cash items and incentives of $13M.
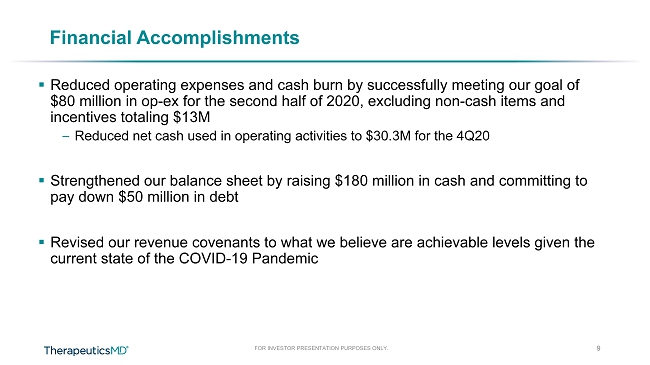
FOR INVESTOR PRESENTATION PURPOSES ONLY. Financial Accomplishments 9 ▪ Reduced operating expenses and cash burn by successfully meeting our goal of $80 million in op - ex for the second half of 2020 , excluding non - cash items and incentives totaling $13M – Reduced net cash used in operating activities to $30.3M for the 4Q20 ▪ Strengthened our balance sheet by raising $180 million in cash and committing to pay down $50 million in debt ▪ Revised our revenue covenants to what we believe are achievable levels given the current state of the COVID - 19 Pandemic

FOR INVESTOR PRESENTATION PURPOSES ONLY. Commercial Performance and Growth Drivers 10
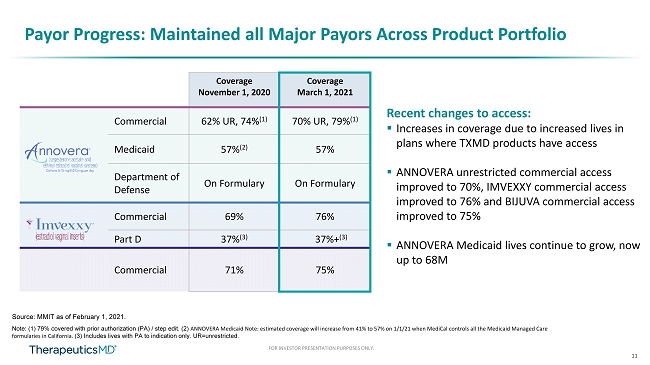
11 FOR INVESTOR PRESENTATION PURPOSES ONLY. Payor Progress: Maintained all Major Payors Across Product Portfolio Coverage November 1, 2020 Coverage March 1, 2021 Commercial 62% UR, 74% (1) 70% UR, 79% (1) Medicaid 57% (2) 57% Department of Defense On Formulary On Formulary Commercial 69% 76% Part D 37% (3) 37%+ (3) Commercial 71% 75% Note: (1) 79% covered with prior authorization (PA) / step edit. (2) ANNOVERA Medicaid Note: estimated coverage will increase from 41% to 57% on 1/1/21 when MediCal controls all the Medicaid Managed Care formularies in California. (3) Includes lives with PA to indication only. UR=unrestricted. Source: MMIT as of February 1, 2021. Recent changes to access: ▪ Increases in coverage due to increased lives in plans where TXMD products have access ▪ ANNOVERA unrestricted commercial access improved to 70%, IMVEXXY commercial access improved to 76% and BIJUVA commercial access improved to 75% ▪ ANNOVERA Medicaid lives continue to grow, now up to 68M

12 12 FOR INVESTOR PRESENTATION PURPOSES ONLY. ANNOVERA: Unique Opportunity to Create a New Segment within Birth Control
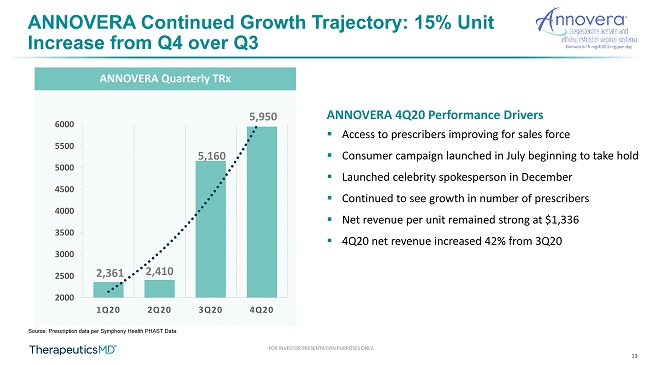
13 FOR INVESTOR PRESENTATION PURPOSES ONLY. ANNOVERA Quarterly TRx ANNOVERA Continued Growth Trajectory: 15% Unit Increase from Q4 over Q3 Source: Prescription data per Symphony Health PHAST Data. 2,361 2,410 5,160 5,950 2000 2500 3000 3500 4000 4500 5000 5500 6000 1Q20 2Q20 3Q20 4Q20 ANNOVERA 4Q20 Performance Drivers ▪ Access to prescribers improving for sales force ▪ Consumer campaign launched in July beginning to take hold ▪ Launched c elebrity spokesperson in December ▪ Continued to see growth in number of prescribers ▪ Net revenue per unit remained strong at $1,336 ▪ 4Q20 net revenue increased 42% from 3Q20
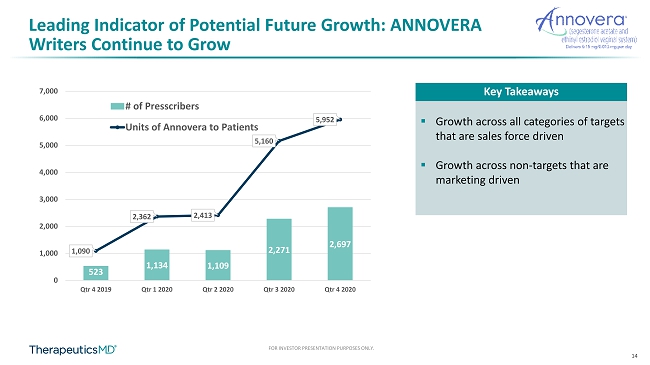
14 FOR INVESTOR PRESENTATION PURPOSES ONLY. Leading Indicator of Potential Future Growth: ANNOVERA Writers Continue to Grow ▪ Growth across all categories of targets that are sales force driven ▪ Growth across non - targets that are marketing driven Key Takeaways 523 1,134 1,109 2,271 2,697 1,090 2,362 2,413 5,160 5,952 0 1,000 2,000 3,000 4,000 5,000 6,000 7,000 Qtr 4 2019 Qtr 1 2020 Qtr 2 2020 Qtr 3 2020 Qtr 4 2020 # of Presscribers Units of Annovera to Patients
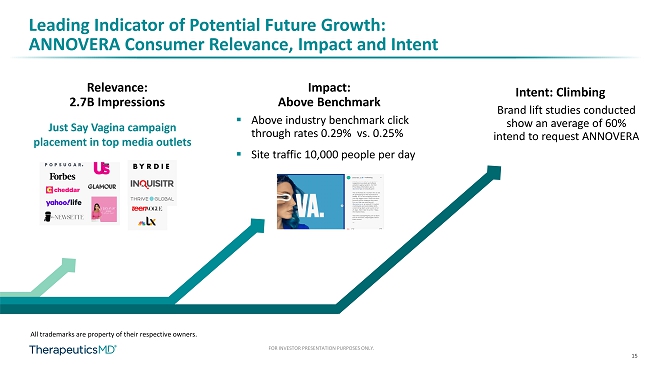
15 FOR INVESTOR PRESENTATION PURPOSES ONLY. Leading Indicator of Potential Future Growth: ANNOVERA Consumer Relevance, Impact and Intent Just Say Vagina campaign p lacement in top media outlets Relevance: 2.7B Impressions Intent: Climbing ▪ Above industry b enchmark click through rates 0.29% vs. 0.25% ▪ Site traffic 10,000 people per day Impact: Above Benchmark Brand lift studies conducted show an average of 60% intend to request ANNOVERA All trademarks are property of their respective owners.
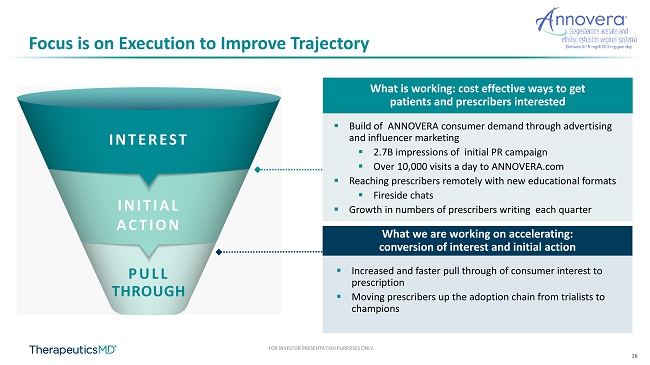
16 FOR INVESTOR PRESENTATION PURPOSES ONLY. Focus is on Execution to Improve Trajectory INTEREST INITIAL ACTION PULL THROUGH ▪ Increased and faster pull through of consumer interest to prescription ▪ Moving prescribers up the adoption chain from trialists to champions What we are working on accelerating: c onversion of interest and initial a ction What is w orking : cost e ffective w ays to get p atients and p rescribers interested ▪ Build of ANNOVERA consumer demand through advertising and influencer marketing ▪ 2.7B impressions of initial PR campaign ▪ Over 10,000 visits a day to ANNOVERA.com ▪ Reaching prescribers r emotely with new educational formats ▪ Fireside chats ▪ Growth in numbers of prescribers writing each quarter
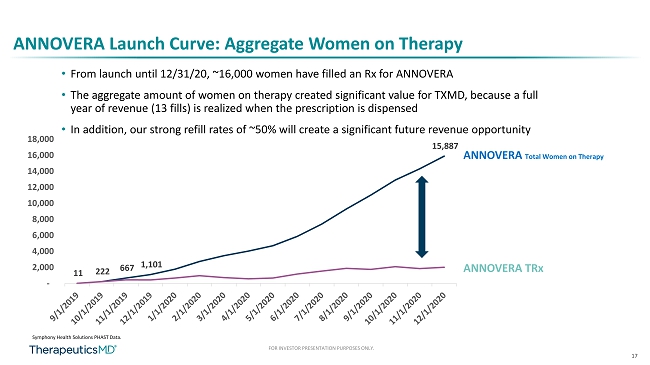
17 FOR INVESTOR PRESENTATION PURPOSES ONLY. 11 222 667 1,101 15,887 - 2,000 4,000 6,000 8,000 10,000 12,000 14,000 16,000 18,000 ANNOVERA Launch Curve: Aggregate Women on Therapy Symphony Health Solutions PHAST Data. ANNOVERA Total Women on Therapy ANNOVERA TRx • From launch until 12/31/20, ~16,000 women have filled an Rx for ANNOVERA • The aggregate amount of women on therapy created significant value for TXMD, because a full year of revenue (13 fills) is realized when the prescription is dispensed • In addition, our strong refill rates of ~50% will create a significant future revenue opportunity
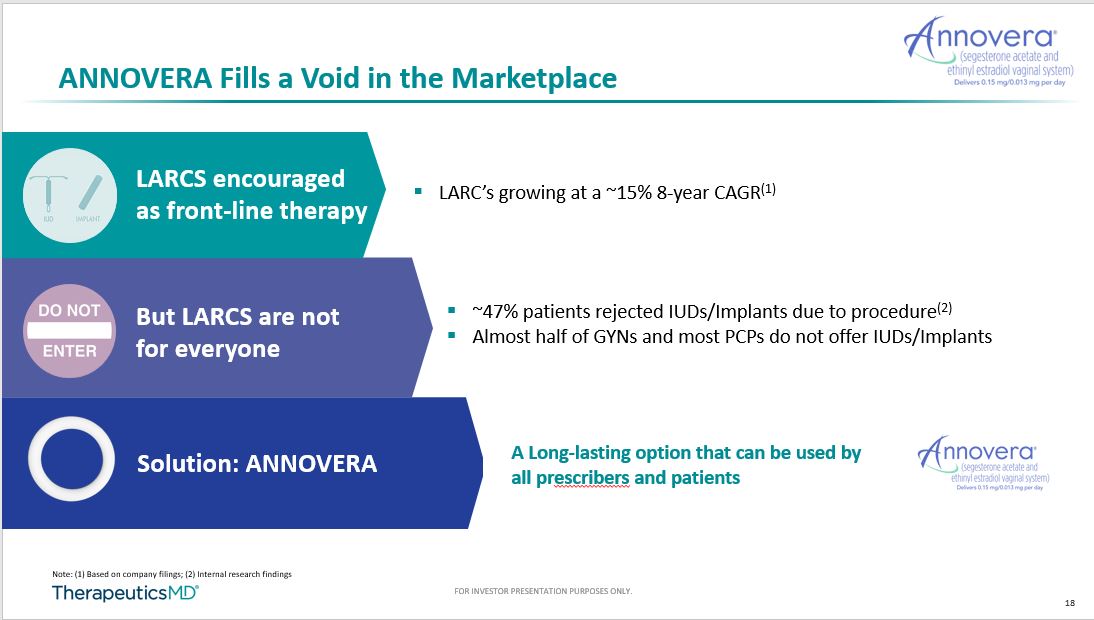
18 FOR INVESTOR PRESENTATION PURPOSES ONLY. A Long - lasting option that can be used by all pr escribers and patients ▪ LARC’s growing at a ~15% 8 - year CAGR (1) ▪ ~47% patients rejected IUDs/Implants due to procedure (2) ▪ Almost half of GYNs and most PCPs do not offer IUDs/Implants LARCS encouraged as front - line therapy But LARCS are not for everyone ANNOVERA Fills a Void in the Marketplace Solution: ANNOVERA Note: (1) Based on company filings; (2) Internal research findings
19 FOR INVESTOR PRESENTATION PURPOSES ONLY. ANNOVERA Removes Barriers to Long - Acting Birth Control by Removing the Need for a Procedure like ColoGuard did for Colorectal Screening All logos are property of their respective owners.
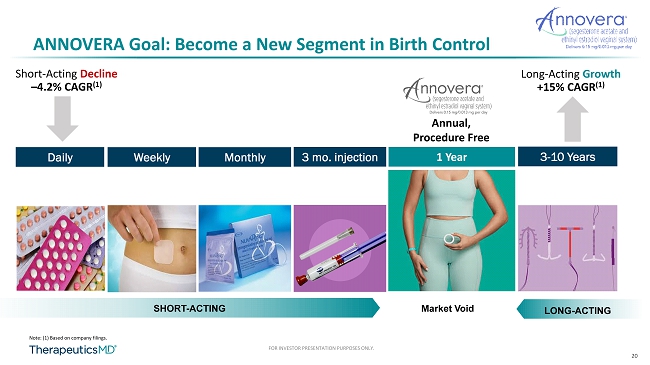
20 FOR INVESTOR PRESENTATION PURPOSES ONLY. ANNOVERA Goal: Become a New Segment in Birth Control Daily Weekly Monthly 3 - 10 Years Annual, Procedure Free SHORT - ACTING LONG - ACTING 3 mo. injection Short - Acting D ecline – 4.2% CAGR (1) 1 Year Long - Acting Growth +15% CAGR (1) Note: (1) Based on company filings. Market Void
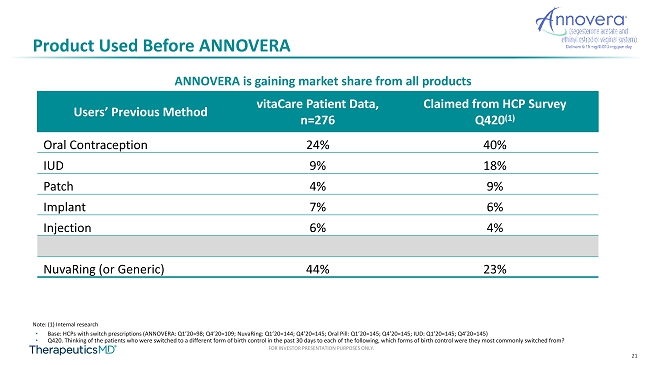
21 FOR INVESTOR PRESENTATION PURPOSES ONLY. Product Used Before ANNOVERA Users’ Previous Method vitaCare Patient Data, n=276 Claimed from HCP Survey Q420 (1) Oral Contraception 24% 40% IUD 9% 18% Patch 4% 9% Implant 7% 6% Injection 6% 4% NuvaRing (or Generic) 44% 23% • Base: HCPs with switch prescriptions (ANNOVERA: Q1’20=98; Q4’20=109; NuvaRing: Q1’20=144; Q4’20=145; Oral Pill: Q1’20=145; Q4 ’20 =145; IUD: Q1’20=145; Q4’20=145) • Q420. Thinking of the patients who were switched to a different form of birth control in the past 30 days to each of the foll owi ng, which forms of birth control were they most commonly switched from? Note: (1) Internal research ANNOVERA is gaining market share from all products
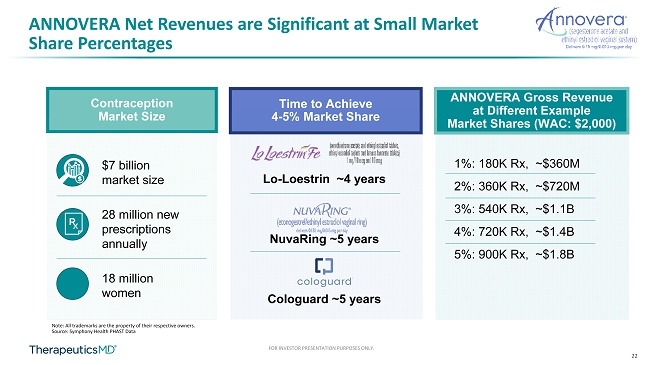
22 FOR INVESTOR PRESENTATION PURPOSES ONLY. ANNOVERA Net Revenues are Significant at Small Market Share Percentages Note: All trademarks are the property of their respective owners. Source: Symphony Health PHAST Data Contraception Market Size ANNOVERA Gross Revenue at Different Example Market Shares (WAC: $2,000) Time to Achieve 4 - 5% Market Share $7 billion market size 28 million new prescriptions annually 18 million women Lo - Loestrin ~4 years NuvaRing ~5 years Cologuard ~5 years 1%: 180K Rx, ~$360M 2%: 360K Rx, ~$720M 3%: 540K Rx, ~$1.1B 4%: 720K Rx, ~$1.4B 5%: 900K Rx, ~$1.8B
23 FOR INVESTOR PRESENTATION PURPOSES ONLY. 23 FOR INVESTOR PRESENTATION PURPOSES ONLY. IMVEXXY: Fastest Growing Branded Product in Vulvar Vaginal Atrophy Category
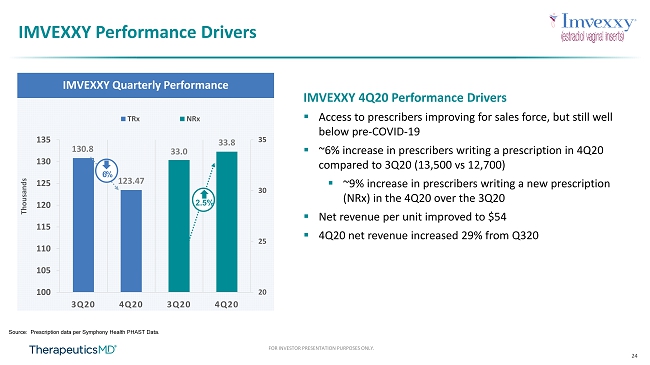
24 FOR INVESTOR PRESENTATION PURPOSES ONLY. IMVEXXY Performance Drivers Source: Prescription data per Symphony Health PHAST Data. IMVEXXY Weekly NRx Thousands 130.8 123.47 33.0 33.8 20 25 30 35 100 105 110 115 120 125 130 135 3Q20 4Q20 3Q20 4Q20 TRx NRx IMVEXXY Quarterly Performance IMVEXXY 4Q20 Performance Drivers ▪ Access to prescribers improving for sales force, but still well below pre - COVID - 19 ▪ ~6% increase in prescribers writing a prescription in 4Q20 compared to 3Q20 (13,500 vs 12,700) ▪ ~9% increase in prescribers writing a new prescription (NRx) in the 4Q20 over the 3Q20 ▪ Net revenue per unit improved to $54 ▪ 4Q20 net revenue increased 29% from Q320 2.5% 6 %
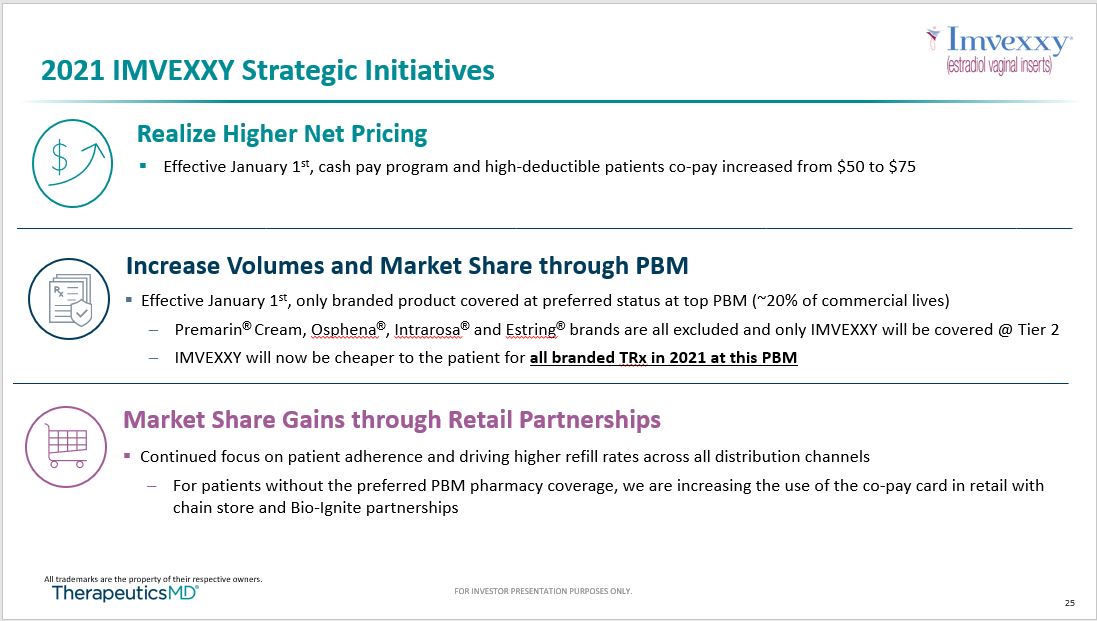
25 FOR INVESTOR PRESENTATION PURPOSES ONLY. 2021 IMVEXXY Strategic Initiatives Increase Volumes and Market Share through PBM ▪ Effective January 1 st , only branded product covered at preferred status at top PBM (~20% of commercial lives) – Premarin ® Cream, Osphena ® , Intrarosa ® and Estring ® brands are all excluded and only IMVEXXY will be covered @ Tier 2 – IMVEXXY will now be cheaper to the patient for all branded TRx in 2021 at this PBM Market Share Gains through Retail Partnerships ▪ Continued focus on patient adherence and driving higher refill rates across all distribution channels – For patients without the preferred PBM pharmacy coverage, we are increasing the use of the co - pay card in retail with chain store and Bio - Ignite partnerships All trademarks are the property of their respective owners . ▪ Effective January 1 st , cash pay program and high - deductible patients co - pay increased from $50 to $75 Realize Higher Net Pricing

26 FOR INVESTOR PRESENTATION PURPOSES ONLY. 2021 IMVEXXY Strategic Initiatives: Status Update IMVEXXY Weekly TRx As expected, short - term impact on volume in January 6,980 7,660 7,260 7,520 7,330 8,190 9,340 8,460 4,000 6,000 8,000 10,000 12/25/20 1/1/21 1/8/21 1/15/21 1/22/21 1/29/21 2/5/21 2/12/21 Jan 1 st Cash Pay Changed to $75 ▪ Improvements in adjudication, net revenue per unit and net revenue ▪ To date, ~$17 improvement in cost per fill for those who used the copay program ▪ Short - term impact on volume in January from high deductible and cash pay customers in - line with expectations Realize Higher Net Pricing Data Source: Prescription data per Symphony Health PHAST Data.
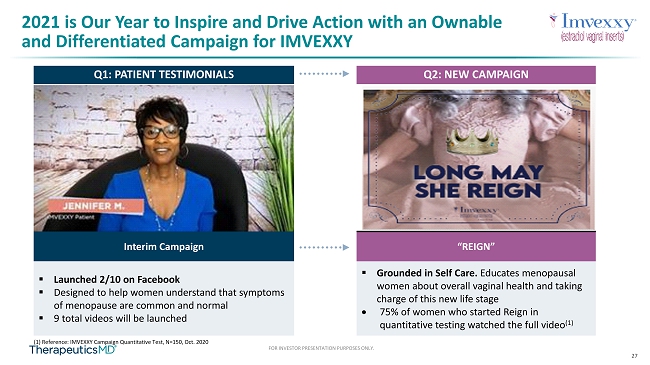
27 FOR INVESTOR PRESENTATION PURPOSES ONLY. 2021 is Our Year to Inspire and Drive Action with an Ownable and Differentiated Campaign for IMVEXXY “REIGN” ▪ Grounded in Self Care. Educates menopausal women about overall vaginal health and taking charge of this new life stage 75% of women who started Reign in quantitative testing watched the full video (1) Q1: PATIENT TESTIMONIALS Q2: NEW CAMPAIGN Interim Campaign ▪ Launched 2/10 on Facebook ▪ Designed to help women understand that symptoms of menopause are common and normal ▪ 9 total videos will be launched (1) Reference: IMVEXXY Campaign Quantitative Test, N=150, Oct. 2020

28 FOR INVESTOR PRESENTATION PURPOSES ONLY. 28 FOR INVESTOR PRESENTATION PURPOSES ONLY. BIJUVA: First and Only FDA - Approved Bio - Identical Solution in Vasomotor Symptoms (VMS) Market

29 FOR INVESTOR PRESENTATION PURPOSES ONLY. Thousands Source: Symphony Data Source: Prescription data per Symphony Health PHAST Data. 32.0 33.0 7.6 7.6 4 5 6 7 8 20 25 30 35 3Q20 4Q20 3Q20 4Q20 TRx NRx BIJUVA Quarterly Performance BIJUVA Volume Increased with Bio - Ignite Focus BIJUVA 4Q20 Performance Drivers ▪ Targeted approach with supporting Bio - Ignite to maintain brand loyalists with 7 sales representatives ▪ ~3% increase in prescribers writing a prescription in 4Q20 compared to 3Q20 (4,750 vs 4,600) ▪ Maintained NRx ▪ Net revenue per unit improved to $52 ▪ 4Q20 net revenue increased 36% from Q320
FOR INVESTOR PRESENTATION PURPOSES ONLY. 30 Summary T ransformed our capital structure I mproved our balance sheet Updated our net revenue covenants Framework is in place to accelerate both ANNOVERA and IMVEXXY adoption throughout 2021 vitaCare divesture progressing W ell positioned to continue our growth to EBITDA break even, anticipated in the first half of 2022

FOR INVESTOR PRESENTATION PURPOSES ONLY. Q&A
32 FOR INVESTOR PRESENTATION PURPOSES ONLY. Appendix
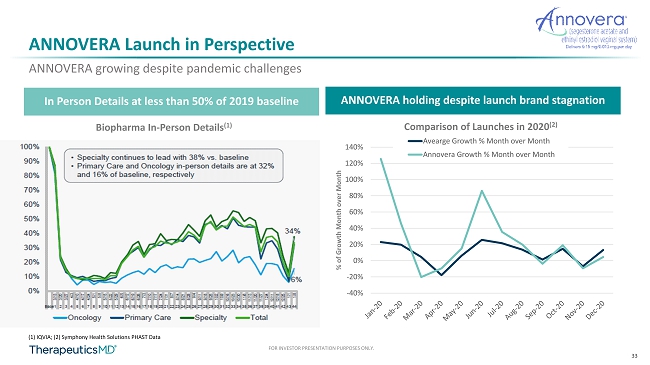
33 FOR INVESTOR PRESENTATION PURPOSES ONLY. In Person Details at less than 50% of 2019 baseline ANNOVERA holding despite launch brand stagnation ANNOVERA growing despite pandemic challenges ANNOVERA Launch in Perspective (1) IQVIA; (2) Symphony Health Solutions PHAST Data -40% -20% 0% 20% 40% 60% 80% 100% 120% 140% % of Growth Month over Month Comparison of Launches in 2020 (2) Avearge Growth % Month over Month Annovera Growth % Month over Month Biopharma In - Person Details (1)
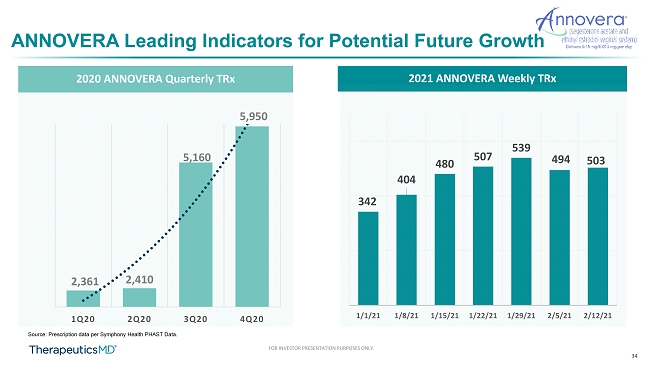
34 FOR INVESTOR PRESENTATION PURPOSES ONLY. 342 404 480 507 539 494 503 1/1/21 1/8/21 1/15/21 1/22/21 1/29/21 2/5/21 2/12/21 2021 ANNOVERA Weekly TRx ANNOVERA Leading Indicators for Potential Future Growth Source: Prescription data per Symphony Health PHAST Data. 2020 ANNOVERA Quarterly TRx 2,361 2,410 5,160 5,950 1Q20 2Q20 3Q20 4Q20
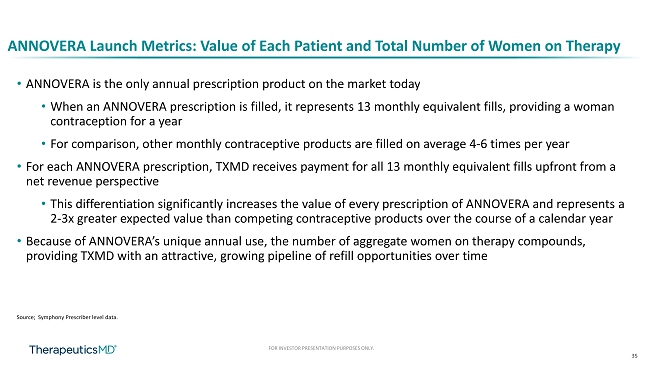
35 FOR INVESTOR PRESENTATION PURPOSES ONLY. ANNOVERA Launch Metrics: Value of Each Patient and Total Number of Women on Therapy Source; Symphony Prescriber level data. • ANNOVERA is the only annual prescription product on the market today • When an ANNOVERA prescription is filled, it represents 13 monthly equivalent fills, providing a woman contraception for a year • For comparison, other monthly contraceptive products are filled on average 4 - 6 times per year • For each ANNOVERA prescription, TXMD receives payment for all 13 monthly equivalent fills upfront from a net revenue perspective • This differentiation significantly increases the value of every prescription of ANNOVERA and represents a 2 - 3x greater expected value than competing contraceptive products over the course of a calendar year • Because of ANNOVERA’s unique annual use, the number of aggregate women on therapy compounds, providing TXMD with an attractive, growing pipeline of refill opportunities over time
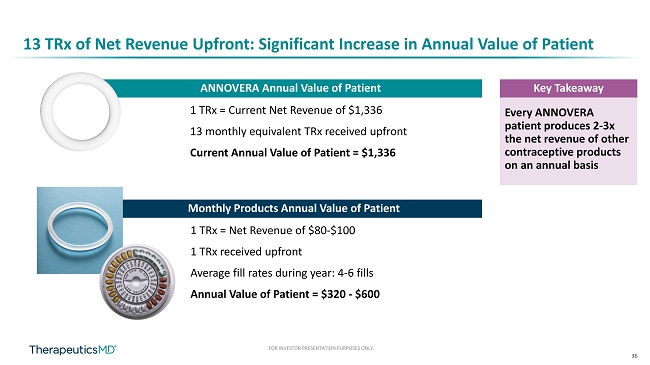
36 FOR INVESTOR PRESENTATION PURPOSES ONLY. 13 TRx of Net Revenue Upfront: Significant Increase in Annual Value of Patient ANNOVERA Annual Value of Patient 1 TRx = Current Net Revenue of $1,336 13 monthly equivalent TRx received upfront Current Annual Value of Patient = $1,336 Monthly Products Annual Value of Patient 1 TRx = Net Revenue of $80 - $100 1 TRx received upfront Average fill rates during year: 4 - 6 fills Annual Value of Patient = $320 - $600 Every ANNOVERA patient produces 2 - 3x the net revenue of other contraceptive products on an annual basis Key Takeaway

37 FOR INVESTOR PRESENTATION PURPOSES ONLY. 11 222 667 1,101 15,887 - 2,000 4,000 6,000 8,000 10,000 12,000 14,000 16,000 18,000 ANNOVERA Launch Curve: Aggregate Women on Therapy Symphony Health Solutions PHAST Data. ANNOVERA Total Women on Therapy ANNOVERA TRx • From launch until 12/31/20, ~16,000 women have filled an Rx for ANNOVERA • The aggregate amount of women on therapy created significant value for TXMD, because a full year of revenue (13 fills) is realized when the prescription is dispensed • In addition, our strong refill rates of ~50% will create a significant future revenue opportunity
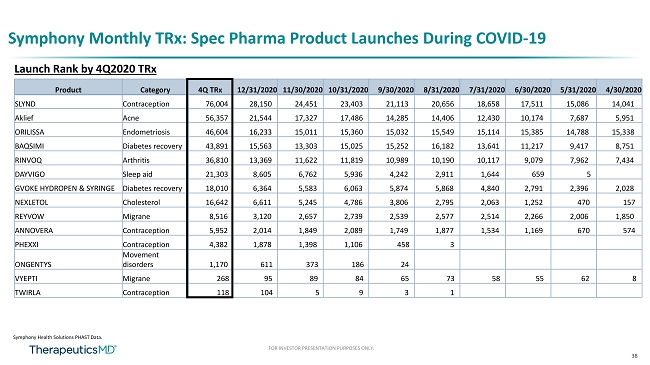
38 FOR INVESTOR PRESENTATION PURPOSES ONLY. Symphony Monthly TRx : Spec Pharma Product Launches During COVID - 19 Launch Rank by 4Q2020 TRx Product Category 4Q TRx 12/31/2020 11/30/2020 10/31/2020 9/30/2020 8/31/2020 7/31/2020 6/30/2020 5/31/2020 4/30/2020 SLYND Contraception 76,004 28,150 24,451 23,403 21,113 20,656 18,658 17,511 15,086 14,041 Aklief Acne 56,357 21,544 17,327 17,486 14,285 14,406 12,430 10,174 7,687 5,951 ORILISSA Endometriosis 46,604 16,233 15,011 15,360 15,032 15,549 15,114 15,385 14,788 15,338 BAQSIMI Diabetes recovery 43,891 15,563 13,303 15,025 15,252 16,182 13,641 11,217 9,417 8,751 RINVOQ Arthritis 36,810 13,369 11,622 11,819 10,989 10,190 10,117 9,079 7,962 7,434 DAYVIGO Sleep aid 21,303 8,605 6,762 5,936 4,242 2,911 1,644 659 5 GVOKE HYDROPEN & SYRINGE Diabetes recovery 18,010 6,364 5,583 6,063 5,874 5,868 4,840 2,791 2,396 2,028 NEXLETOL Cholesterol 16,642 6,611 5,245 4,786 3,806 2,795 2,063 1,252 470 157 REYVOW Migrane 8,516 3,120 2,657 2,739 2,539 2,577 2,514 2,266 2,006 1,850 ANNOVERA Contraception 5,952 2,014 1,849 2,089 1,749 1,877 1,534 1,169 670 574 PHEXXI Contraception 4,382 1,878 1,398 1,106 458 3 ONGENTYS Movement disorders 1,170 611 373 186 24 VYEPTI Migrane 268 95 89 84 65 73 58 55 62 8 TWIRLA Contraception 118 104 5 9 3 1 Symphony Health Solutions PHAST Data.
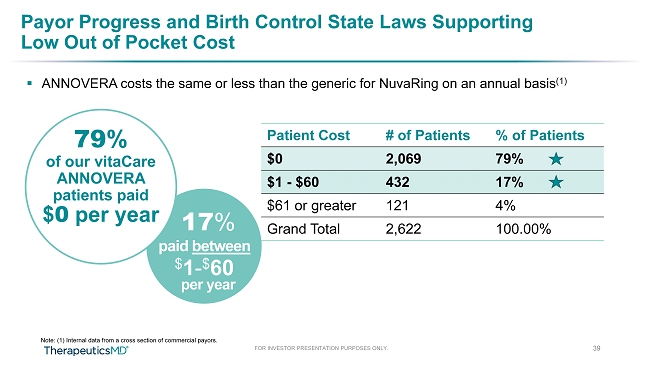
FOR INVESTOR PRESENTATION PURPOSES ONLY. Payor Progress and Birth Control State Laws Supporting Low Out of Pocket Cost ▪ ANNOVERA costs the same or less than the generic for NuvaRing on an annual basis (1) 39 Patient Cost # of Patients % of Patients $0 2,069 79% $1 - $60 432 17% $61 or greater 121 4% Grand Total 2,622 100.00% 80% Paid $0 17 % paid between $ 1 - $ 60 per year 79 % of our vitaCare ANNOVERA patients paid $ 0 per year Note: (1) Internal data from a cross section of commercial payors.
40 FOR INVESTOR PRESENTATION PURPOSES ONLY. TherapeuticsMD Environmental, Social, and Governance ▪ ESG is Important to TherapeuticsMD ▪ While TherapeuticsMD has significant milestones to achieve prior to profitability, it is committed to making a positive impact in our communities, particularly for women ▪ TherapeuticsMD’s mission is to improve the quality of life for women ▪ In 2021: ▪ TherapeuticsMD has taken significant ESG actions in the past, but plans to do more on a go - forward basis, with enhanced ESG reporting ▪ TherapeuticsMD leadership has organized an ESG committee to set in motion initiatives that will further improve our communities into the future
41 FOR INVESTOR PRESENTATION PURPOSES ONLY. TherapeuticsMD Environmental, Social, and Governance ▪ Environmental ▪ TherapeuticsMD recently moved headquarters to a facility that has automated features that allow TherapeuticsMD to be better environmental stewards , including: ▪ Automatic lighting, water conservation fixtures, etc. ▪ Reduction in the number of offices and conferences rooms to reduce the footprint that needs to be cooled and lighted, opting instead to build conference features into offices ▪ TherapeuticsMD products are designed to reduce the amount of waste : ▪ ANNOVERA’s use for 13 cycles eliminates 12 silicone rings that would otherwise end up in landfills. ▪ IMVEXXY was designed specifically to avoid needing insertion with a plastic applicator
42 FOR INVESTOR PRESENTATION PURPOSES ONLY. TherapeuticsMD Environmental, Social, and Governance ▪ Social ▪ TherapeuticsMD’s mission is to improve the quality of life for women , a traditionally underrepresented group ▪ TherapeuticsMD contracts with Title X providers to improve contraceptive access for women ▪ Co - pay cards provide pricing relief for women in need of TXMD products ▪ TherapeuticsMD is committed to diverse hiring : ▪ 64% of TherapeuticsMD’s workforce is women ▪ 44% of TherapeuticsMD’s workforce comprises underrepresented minorities (race or ethnicity)
43 FOR INVESTOR PRESENTATION PURPOSES ONLY. TherapeuticsMD Environmental, Social, and Governance ▪ Governance ▪ Recently increased gender and racial diversity representation on the Company’s Board of Directors ▪ Would meet Nasdaq’s proposed diversity requirements of one woman and one under - represented minority/LGBTQ+ person on the board