Segment
Automotive
25%
Communications
22%
Other
9%
Computer
29%
Electronic
Components
and
Sensors
Electronics
Manufacturing
Services
Markets
Industrial &
Medical
15%
42%
58%
25%
7%
2%
7%
27%
2%
15%
1%
14%
Based on Last Four Quarters Through June 2006
Segment
Defense & Aerospace
Security
Consumer
Segments and Markets
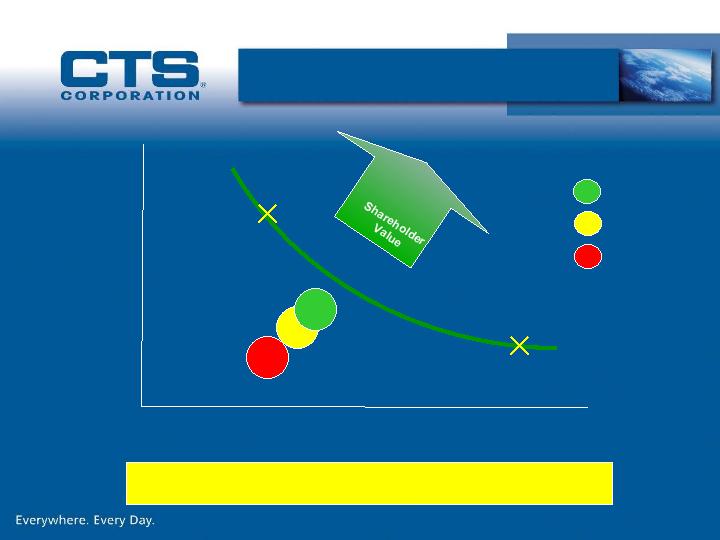
Target Adjusted Return on
Invested Capital (ROIC)
OPERATING
MARGIN
AFTER-TAX
(NOPAT
Margin)
INVESTED CAPITAL TURNOVER
Both Segments Have Comparable ROIC Targets
2003
2004
2005
4%
2%
6%
8%
0.5
1.0
1.5
2.0
2.5
3.0
3.5
4.0%
6.3%
7.9%
ROIC
10%
12%
4.0
EMS
Components
& Sensors
®
®
Automotive
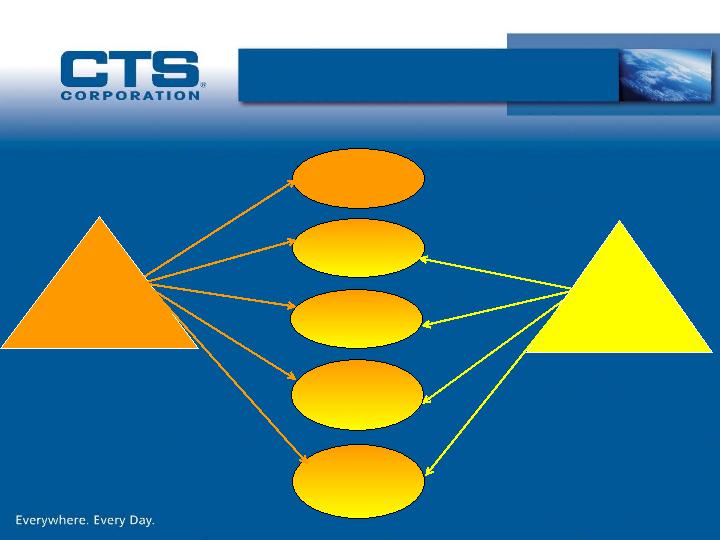
EC
EMS
Customers
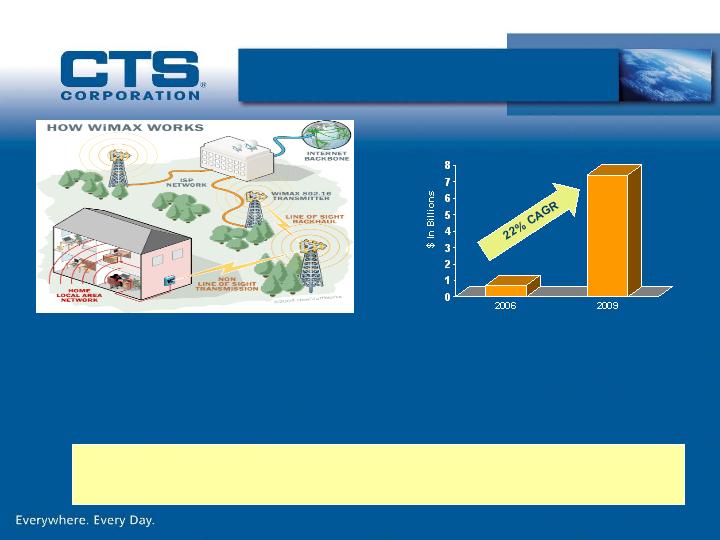
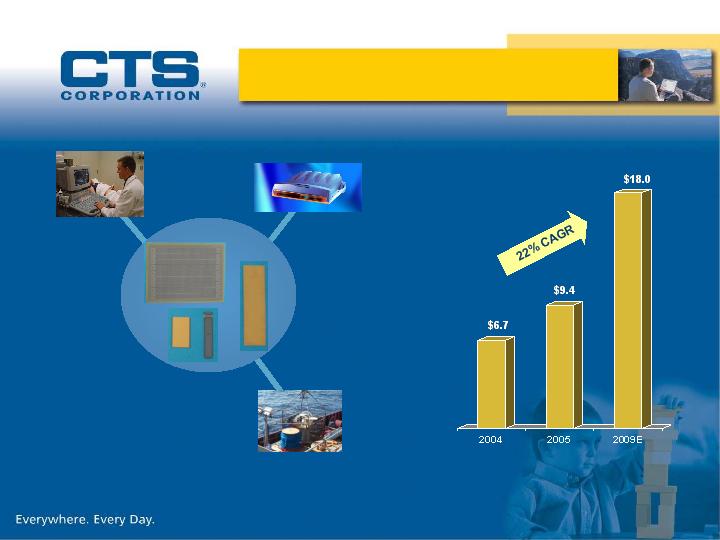
WiMax Applications Expected to Add $10-$12M Incremental
Sales in 2008 (EMS $8-$10M)
WiMax Equipment:
Industry Capital Spend
WiMax allows broadband wireless access networks and equipment to talk to each other
Estimates per Transmedia – based on provider spending plans
•
CTS Electronic Components awarded design wins with three different OEMs
serving several providers.
Content: Frequency and Timing Modules, Crystal Oscillators, Filters
•
CTS EMS provides high level assembly for a major WiMax OEM.
WiMax
Sales
$ in Millions
Medical Ultrasound
Wide Format
Inkjet Printer Head
Undersea Energy
Exploration
Technology:
- Superior piezo ceramic material
-
Photolithographic capabilities
-
Ultra-Thin
- High dielectric
Electronic Components –
Piezo Electronic Elements
Components & Sensors
EMS
SALES
$ in Millions
ADJUSTED
SEGMENT
OPERATING
EARNINGS
% OF SALES
Segment Performance
CTS Corporation |
Appendix 1 |
CTS Corporation | ||||||||||
Definition of Financial Term - | ||||||||||
Adjusted Return on Invested Capital | ||||||||||
| Full Year | ||||||||||
2005 | 2004 | 2003 | ||||||||
| Operating earnings | $ | 40.3 | $ | 31.1 | $ | 13.8 | ||||
| Charges (credits) to reported operating earnings: | ||||||||||
| Restructuring and asset impairment charges | 4.6 | |||||||||
| Gain on sale of excess equipment less LTCC severance | (1.2 | ) | ||||||||
| Gain on sale of excess Canadian land | (2.7 | ) | ||||||||
| Total adjustments to reported operating earnings | (1.2 | ) | (2.7 | ) | 4.6 | |||||
| Adjusted operating earnings | $ | 39.1 | $ | 28.4 | $ | 18.4 | ||||
| Tax rate | 25 | % | 23 | % | 25 | % | ||||
| Tax effected adjusted operating earnings | $ | 29.3 | $ | 21.9 | $ | 13.8 | ||||
| Invested Capital: | ||||||||||
| Current Year: | ||||||||||
| Shareholders' equity | $ | 329.6 | $ | 310.7 | $ | 294.2 | ||||
| Long-term debt | 68.3 | 94.2 | 75.9 | |||||||
| Notes payable and current portion of LT debt | 13.4 | 3.3 | - | |||||||
| Less: Cash | (12.0 | ) | (61.0 | ) | (25.4 | ) | ||||
| Invested capital | 399.3 | 347.2 | 344.7 | |||||||
| Prior Year: | ||||||||||
| Shareholders' equity | 310.7 | 294.2 | 265.0 | |||||||
| Long-term debt | 94.2 | 75.9 | 67.0 | |||||||
| Notes payable and current portion of LT debt | 3.3 | - | 28.3 | |||||||
| Less: Cash | (61.0 | ) | (25.4 | ) | (9.2 | ) | ||||
| Invested capital | 347.2 | 344.7 | 351.1 | |||||||
| Adjusted invested capital | $ | 373.3 | $ | 346.0 | $ | 347.9 | ||||
| Adjusted return on invested capital | 7.9 | % | 6.3 | % | 4.0 | % | ||||
| Sales | $ | 617.5 | $ | 531.3 | $ | 463.0 | ||||
| Tax effected adjusted operating earnings | 29.3 | 21.9 | 13.8 | |||||||
| Tax effected adjusted operating margin as a | ||||||||||
| percentage of sales (a) | 4.7 | % | 4.1 | % | 3.0 | % | ||||
| Sales | $ | 617.5 | $ | 531.3 | $ | 463.0 | ||||
| Adjusted invested capital | 373.3 | 346.0 | 347.9 | |||||||
| Invested capital turns (b) | 1.65 | 1.54 | 1.33 | |||||||
| Adjusted return on invested capital (a) x (b) | 7.9 | % | 6.3 | % | 4.0 | % | ||||
CTS Corporation | |||||||||||||||||||||||||||||||||||||
Reconciliation of Segment Operating Earnings (Loss) to Adjusted Segment Operating Earnings (Loss) | |||||||||||||||||||||||||||||||||||||
($ in millions) | |||||||||||||||||||||||||||||||||||||
YTD Q2 2006 | 2005 | 2004 | 2003 | 2002 | 2001 | ||||||||||||||||||||||||||||||||
| Components | Components | Components | Components | Components | Components | ||||||||||||||||||||||||||||||||
| EMS | & Sensors | EMS | & Sensors | EMS | & Sensors | EMS | & Sensors | EMS | & Sensors | EMS | & Sensors | ||||||||||||||||||||||||||
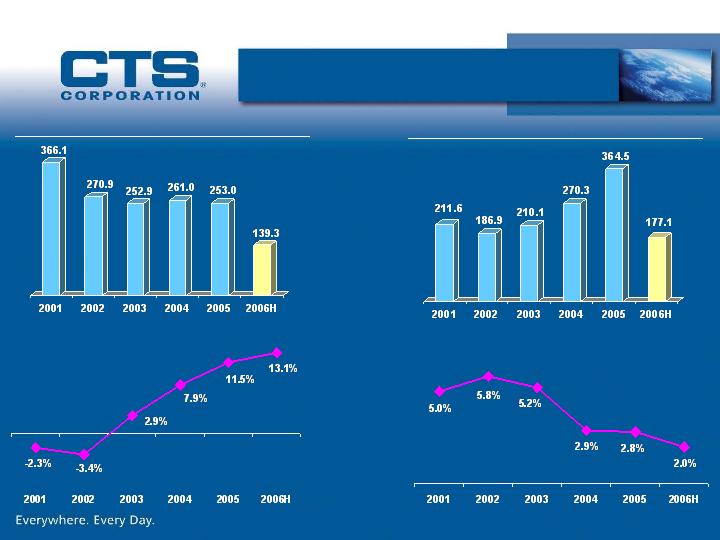
| Segment Net Sales to External Customers | $ | 177.1 | $ | 139.3 | $ | 364.5 | $ | 253.0 | $ | 270.3 | $ | 261.0 | $ | 210.1 | $ | 252.9 | $ | 186.9 | $ | 270.9 | $ | 211.6 | $ | 366.1 | |||||||||||||
| Segment Operating earnings (loss) | $ | 3.6 | $ | 18.3 | $ | 10.1 | $ | 30.2 | $ | 7.8 | $ | 23.3 | $ | 11.0 | $ | 7.4 | $ | 10.8 | $ | (6.0 | ) | $ | 10.5 | $ | (8.3 | ) | |||||||||||
| Charges (credits) to reported operating earnings (loss): | |||||||||||||||||||||||||||||||||||||
| Customer reimbursement | (3.1 | ) | |||||||||||||||||||||||||||||||||||
| Gain on sale of excess equipment less LTCC severance | (1.2 | ) | |||||||||||||||||||||||||||||||||||
| Gain on sale of excess Canadian land | (2.7 | ) | |||||||||||||||||||||||||||||||||||
| Total adjustments to reported operating earnings (loss) | - | - | - | (1.2 | ) | - | (2.7 | ) | - | - | - | (3.1 | ) | - | - | ||||||||||||||||||||||
| Adjusted operating earnings (loss), excluding above referenced items | $ | 3.6 | $ | 18.3 | $ | 10.1 | $ | 29.0 | $ | 7.8 | $ | 20.6 | $ | 11.0 | $ | 7.4 | $ | 10.8 | $ | (9.1 | ) | $ | 10.5 | $ | (8.3 | ) | |||||||||||
| Adjusted segment operating earnings (loss), excluding above referenced items, as a percentage of total sales | 2.0 | % | 13.1 | % | 2.8 | % | 11.5 | % | 2.9 | % | 7.9 | % | 5.2 | % | 2.9 | % | 5.8 | % | -3.4 | % | 5.0 | % | -2.3 | % | |||||||||||||