
2016 Investor Day NYSE, New York, NY September 8, 2016
2 Agenda 1. Overview 2. Transportation Product Lines 3. Ceramic Products Lines 4. Passive & Electromechanical Product Lines 5. Financial Overview 6. Closing Remarks 7. Questions & Answers
Safe Harbor Statement 3 This presentation contains statements that are, or may be deemed to be, forward-looking statements within the meaning of the Private Securities Litigation Reform Act of 1995. These forward-looking statements include, but are not limited to, any financial or other guidance, statements that reflect our current expectations concerning future results and events, and any other statements that are not based solely on historical fact. Forward-looking statements are based on management's expectations, certain assumptions and currently available information. Readers are cautioned not to place undue reliance on these forward-looking statements, which speak only as of the date hereof and are based on various assumptions as to future events, the occurrence of which necessarily are subject to uncertainties. These forward-looking statements are made subject to certain risks, uncertainties and other factors, which could cause our actual results, performance or achievements to differ materially from those presented in the forward-looking statements. Examples of factors that may affect future operating results and financial condition include, but are not limited to: changes in the economy generally and in respect to the businesses in which CTS operates; unanticipated issues in integrating acquisitions; the results of actions to reposition our businesses; rapid technological change; general market conditions in the automotive, communications, and computer industries, as well as conditions in the industrial, defense and aerospace, and medical markets; reliance on key customers; unanticipated natural disasters or other events; the ability to protect our intellectual property; pricing pressures and demand for our products; unanticipated developments that could occur with respect to contingencies such as litigation and environmental matters as well as any product liability claims; and risks associated with our international operations, including trade and tariff barriers, exchange rates and political and geopolitical risks. Many of these, and other, risks and uncertainties are discussed in further detail in Item 1A. of CTS’ Annual Report on Form 10-K. We undertake no obligation to publicly update our forward-looking statements to reflect new information or events or circumstances that arise after the date hereof, including market or industry changes.
CTS is a leading designer and manufacturer of sensors, actuators and electronic components. Our Company 4
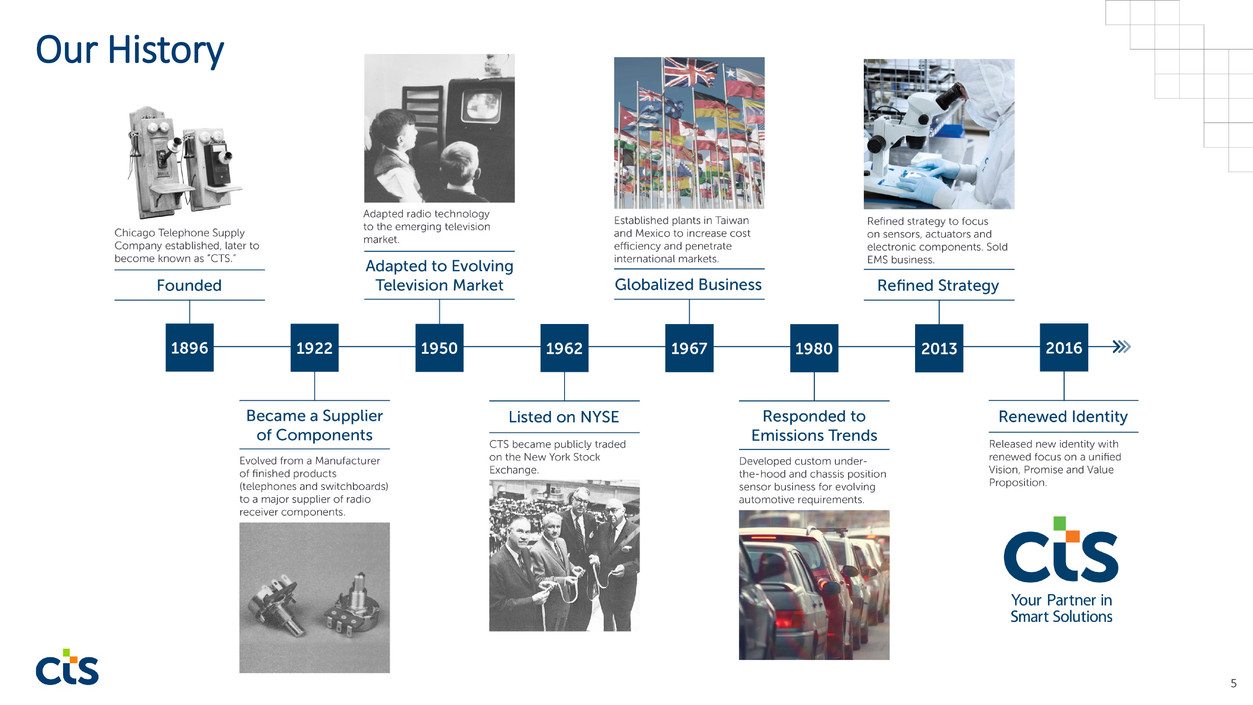
Our History 5
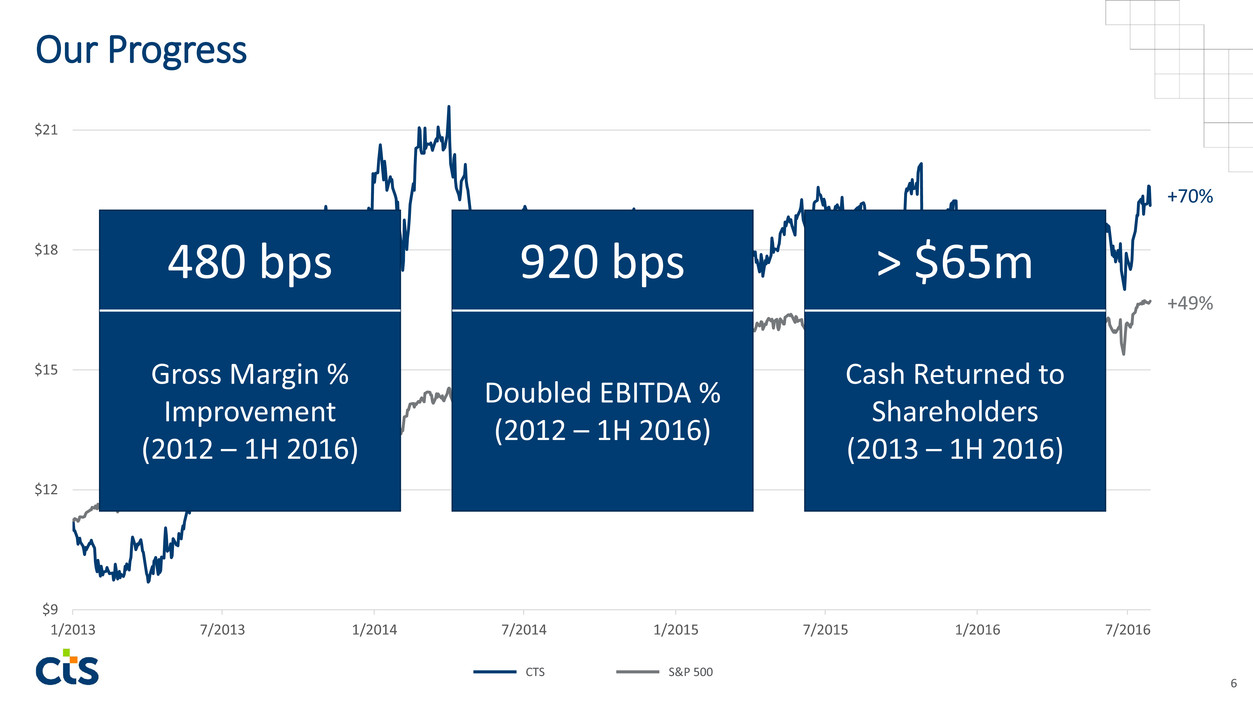
Our Progress 6 $9 $12 $15 $18 $21 1/2013 7/2013 1/2014 7/2014 1/2015 7/2015 1/2016 7/2016 +49% +70% CTS S&P 500 Gross Margin % Improvement (2012 – 1H 2016) 480 bps Doubled EBITDA % (2012 – 1H 2016) 920 bps Cash Returned to Shareholders (2013 – 1H 2016) > $65m
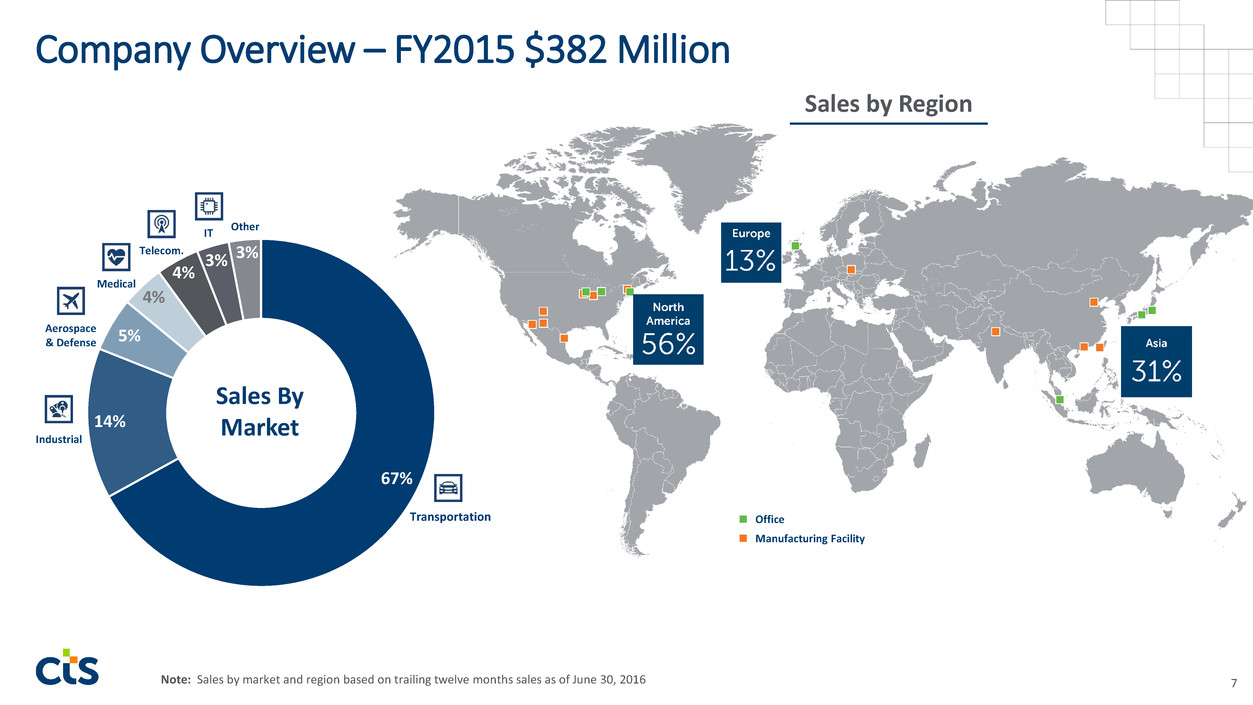
7 Company Overview – FY2015 $382 Million 67% 14% 5% 4% 4% 3% 3% Sales By Market Other Transportation Industrial Aerospace & Defense Medical IT Telecom. Office Manufacturing Facility Sales by Region Note: Sales by market and region based on trailing twelve months sales as of June 30, 2016
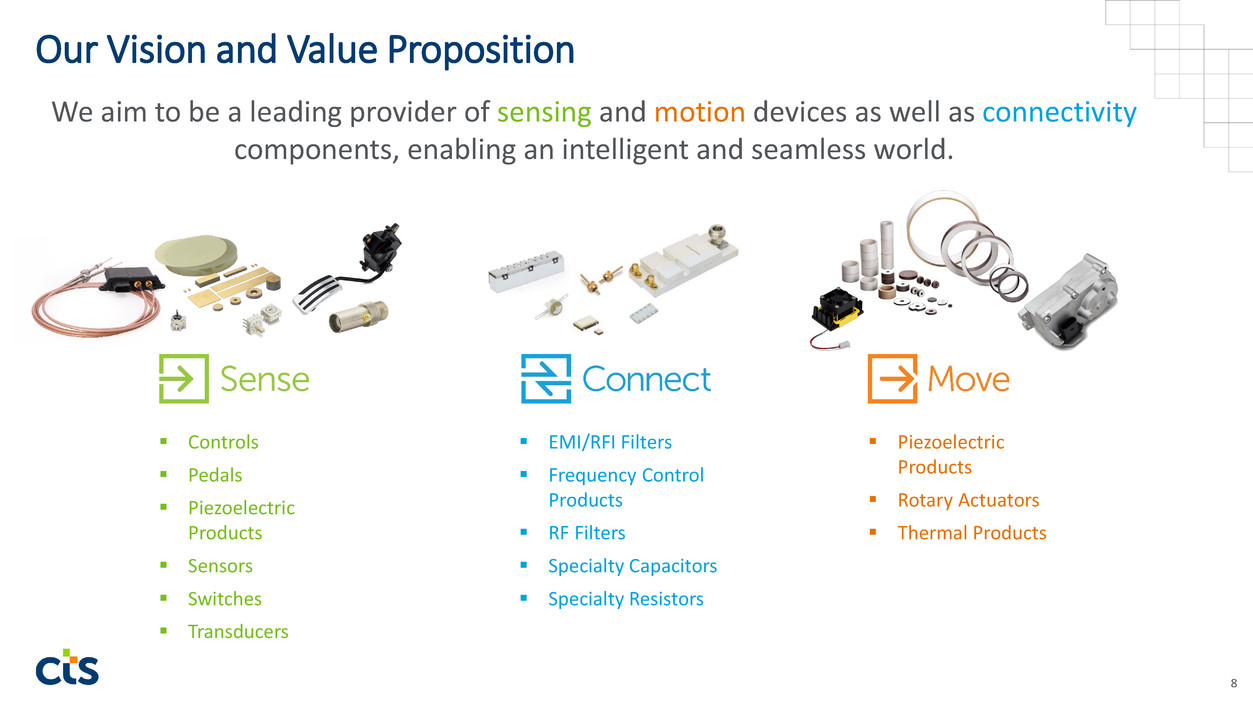
Our Vision and Value Proposition 8 We aim to be a leading provider of sensing and motion devices as well as connectivity components, enabling an intelligent and seamless world. Controls Pedals Piezoelectric Products Sensors Switches Transducers EMI/RFI Filters Frequency Control Products RF Filters Specialty Capacitors Specialty Resistors Piezoelectric Products Rotary Actuators Thermal Products
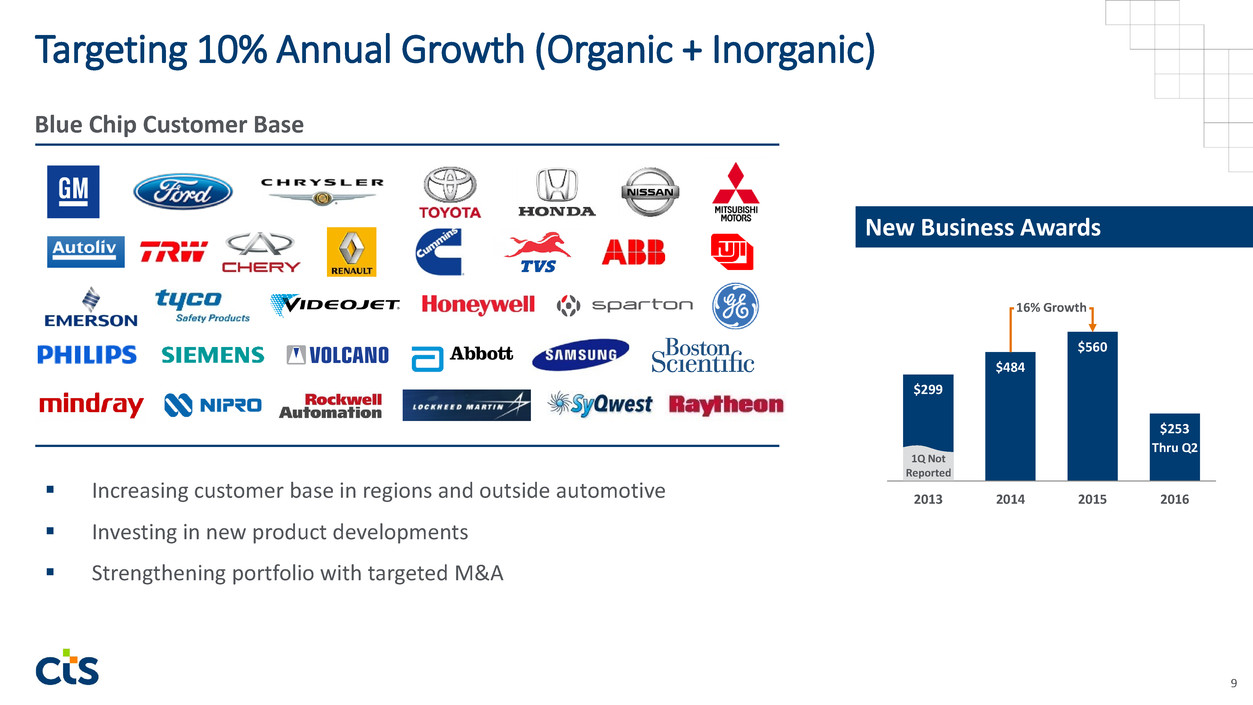
Targeting 10% Annual Growth (Organic + Inorganic) 9 Blue Chip Customer Base New Business Awards $299 $484 $560 $253 2013 2014 2015 2016 Thru Q2 1Q Not Reported 16% Growth Increasing customer base in regions and outside automotive Investing in new product developments Strengthening portfolio with targeted M&A
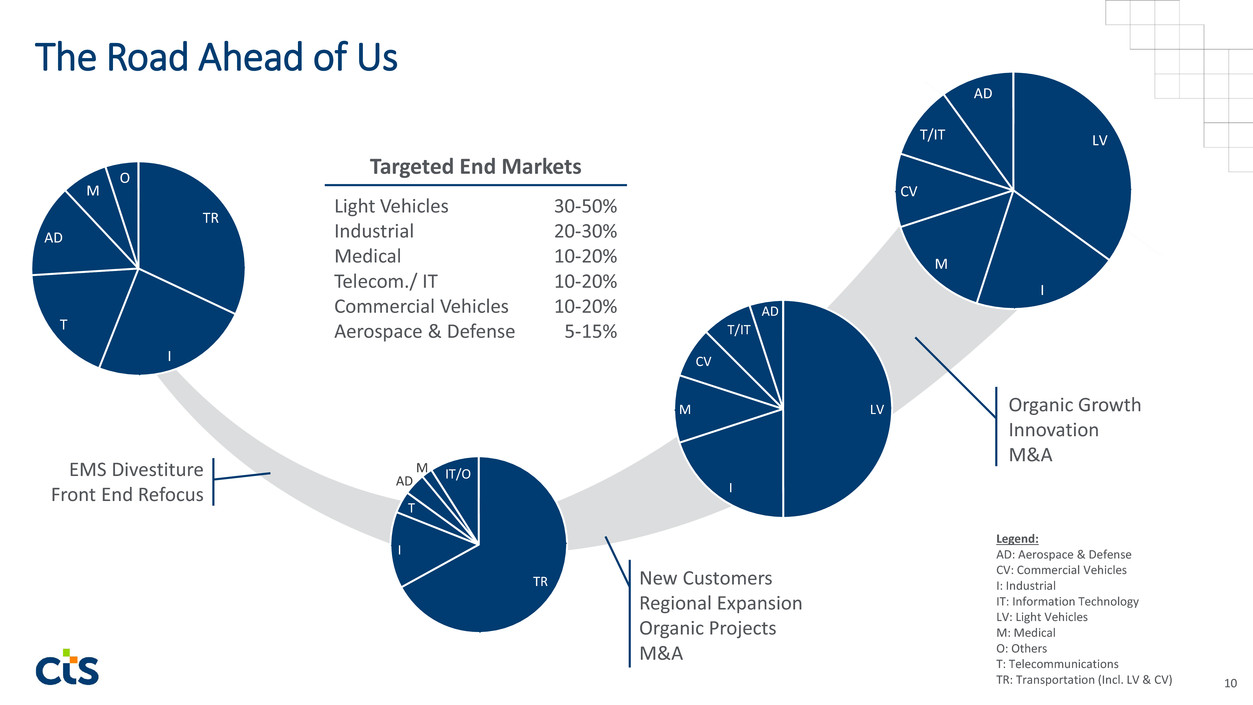
The Road Ahead of Us 10 Legend: AD: Aerospace & Defense CV: Commercial Vehicles I: Industrial IT: Information Technology LV: Light Vehicles M: Medical O: Others T: Telecommunications TR: Transportation (Incl. LV & CV) 30-50% 20-30% 10-20% 10-20% 10-20% 5-15% Targeted End Markets Light Vehicles Industrial Medical Telecom./ IT Commercial Vehicles Aerospace & Defense LV I M CV T/IT AD TR I T AD M IT/O LV I M CV T/IT AD Organic Growth Innovation M&A New Customers Regional Expansion Organic Projects M&A EMS Divestiture Front End Refocus TR I T AD M O
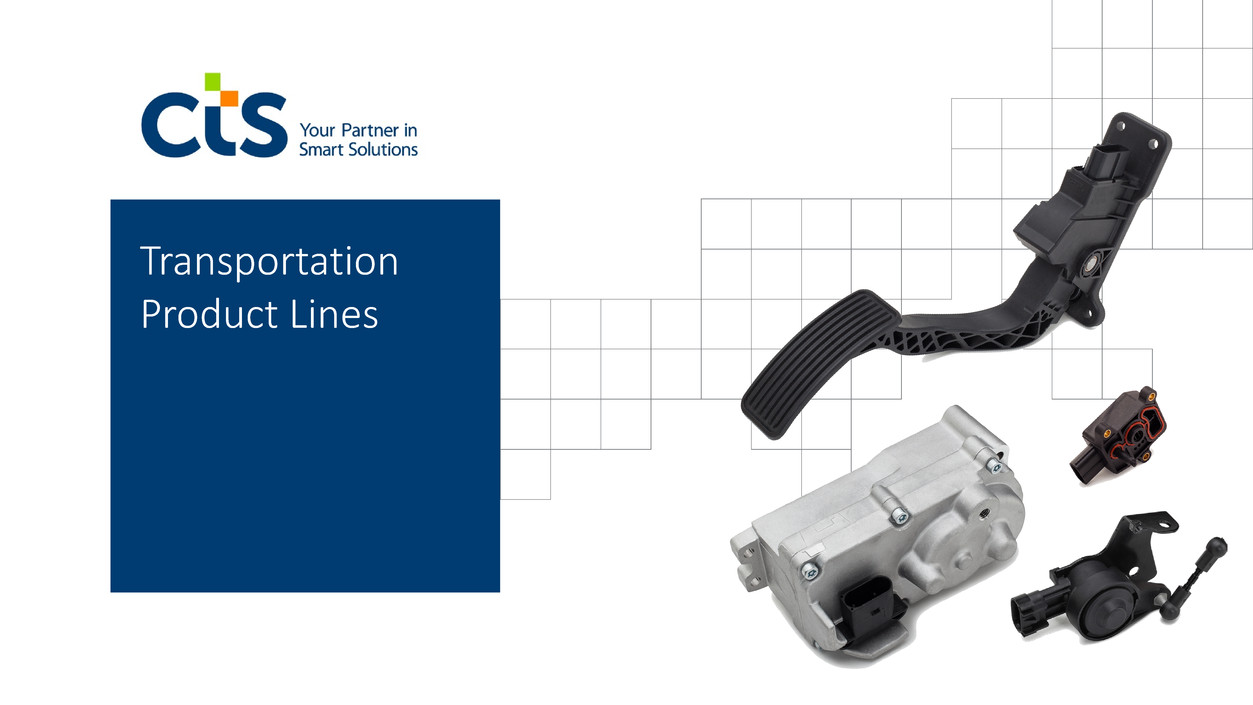
Transportation Product Lines
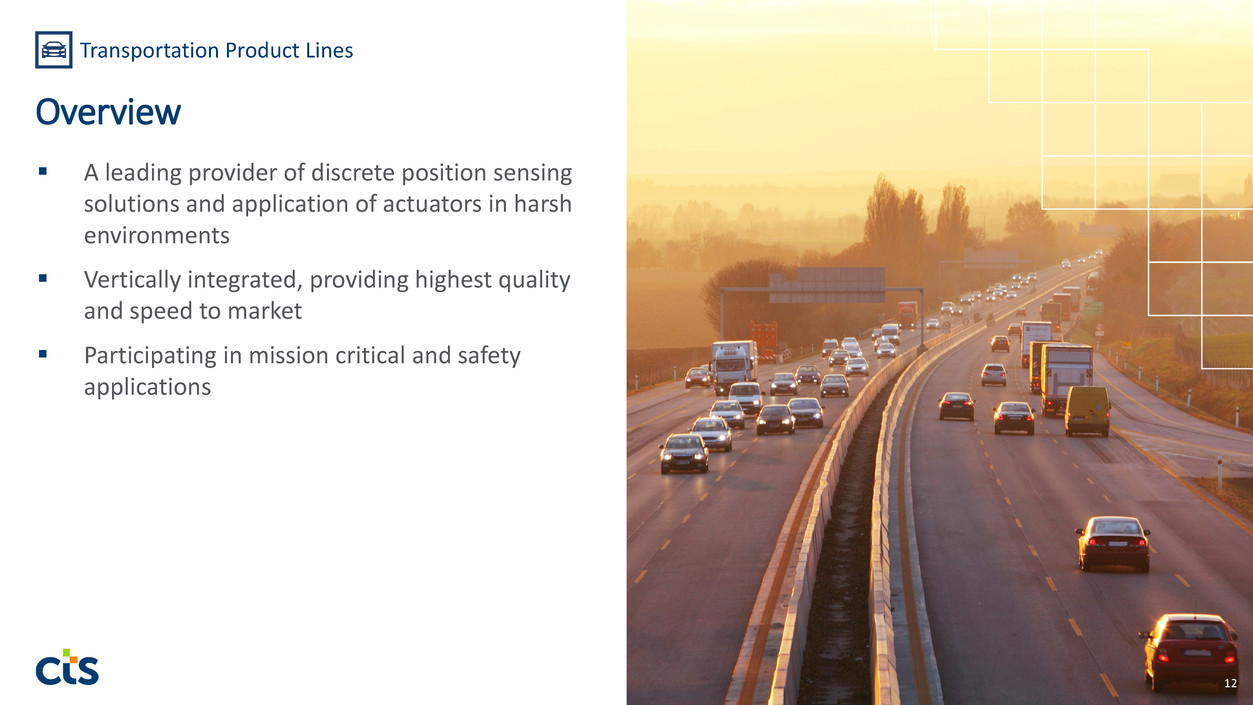
A leading provider of discrete position sensing solutions and application of actuators in harsh environments Vertically integrated, providing highest quality and speed to market Participating in mission critical and safety applications 12 Transportation Product Lines Overview
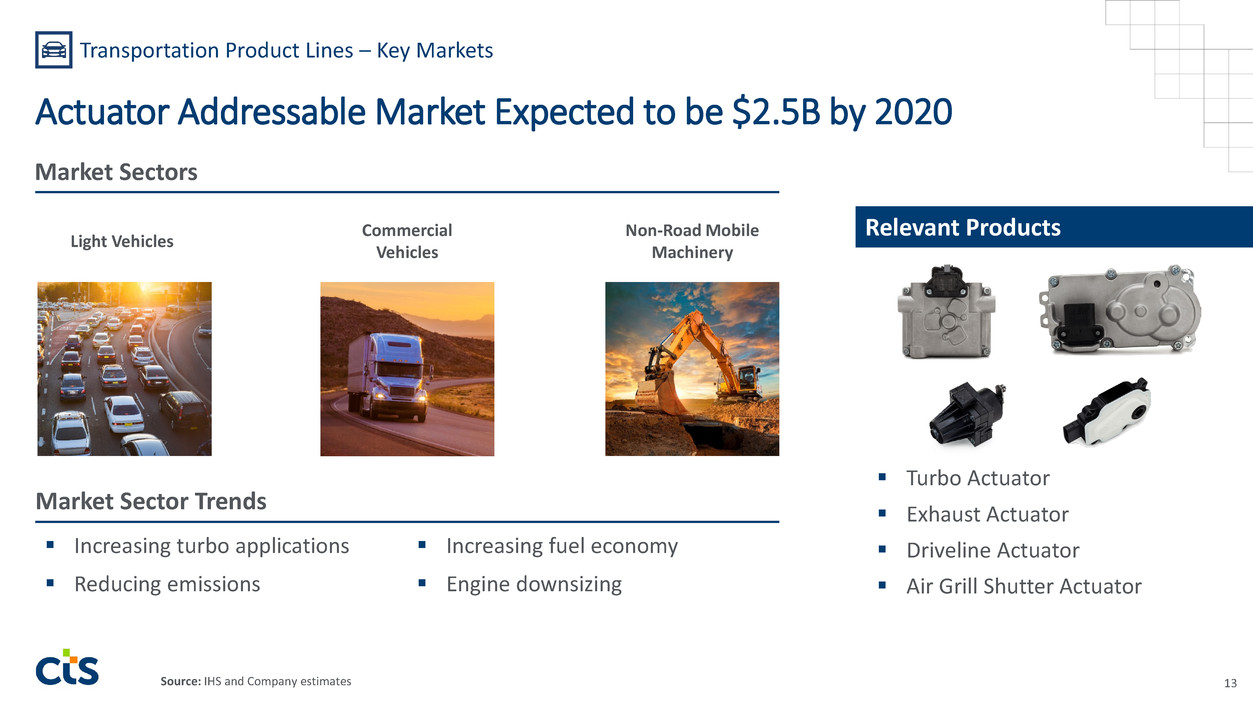
Actuator Addressable Market Expected to be $2.5B by 2020 Turbo Actuator Exhaust Actuator Driveline Actuator Air Grill Shutter Actuator 13 Market Sectors Relevant Products Increasing turbo applications Increasing fuel economy Reducing emissions Engine downsizing Market Sector Trends Transportation Product Lines – Key Markets Light Vehicles Commercial Vehicles Non-Road Mobile Machinery Source: IHS and Company estimates
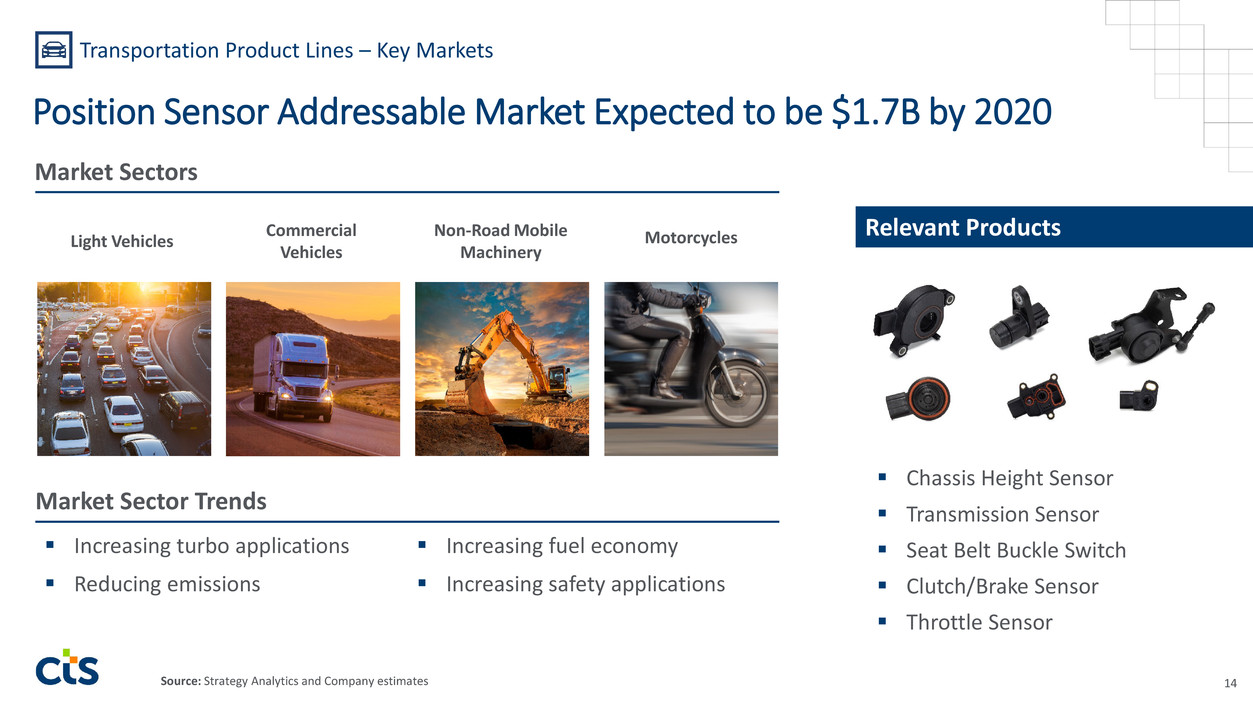
Position Sensor Addressable Market Expected to be $1.7B by 2020 Chassis Height Sensor Transmission Sensor Seat Belt Buckle Switch Clutch/Brake Sensor Throttle Sensor 14 Market Sectors Relevant Products Increasing turbo applications Increasing fuel economy Reducing emissions Increasing safety applications Transportation Product Lines – Key Markets MotorcyclesLight Vehicles Commercial Vehicles Non-Road Mobile Machinery Market Sector Trends Source: Strategy Analytics and Company estimates
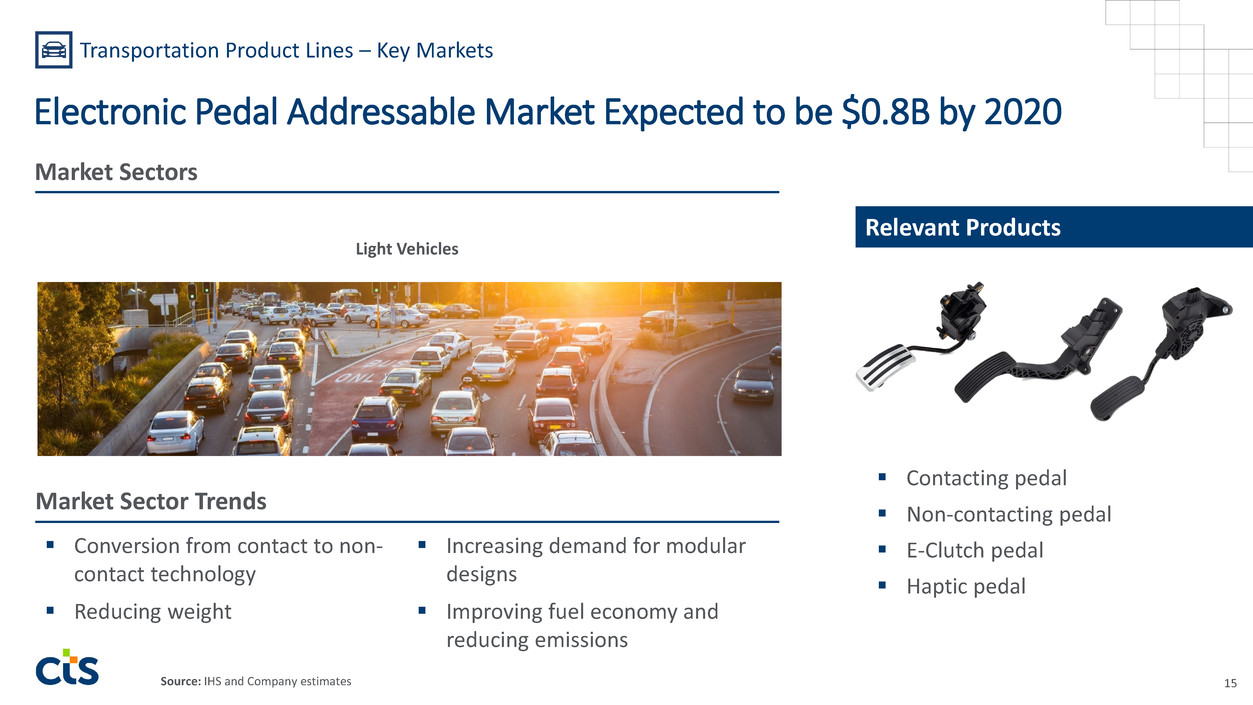
Electronic Pedal Addressable Market Expected to be $0.8B by 2020 Contacting pedal Non-contacting pedal E-Clutch pedal Haptic pedal 15 Market Sectors Relevant Products Conversion from contact to non- contact technology Increasing demand for modular designs Reducing weight Improving fuel economy and reducing emissions Transportation Product Lines – Key Markets Light Vehicles Market Sector Trends Source: IHS and Company estimates

The Customer A leading provider of turbochargers for the Commercial Vehicle market The Situation Needed a very high torque actuator for a specialized application Accelerated development time (3 to 4 times faster than standard) “Your Partner in Smart Solutions” CTS developed a modular actuator solution based on our current portfolio that met the customer’s specifications Collaborated with the customer to expedite development and met the customer’s timing Our Core Values at Play 16 Transportation Product Lines Customer Success Story Play to Win Responsiveness Simplicity Solution Oriented
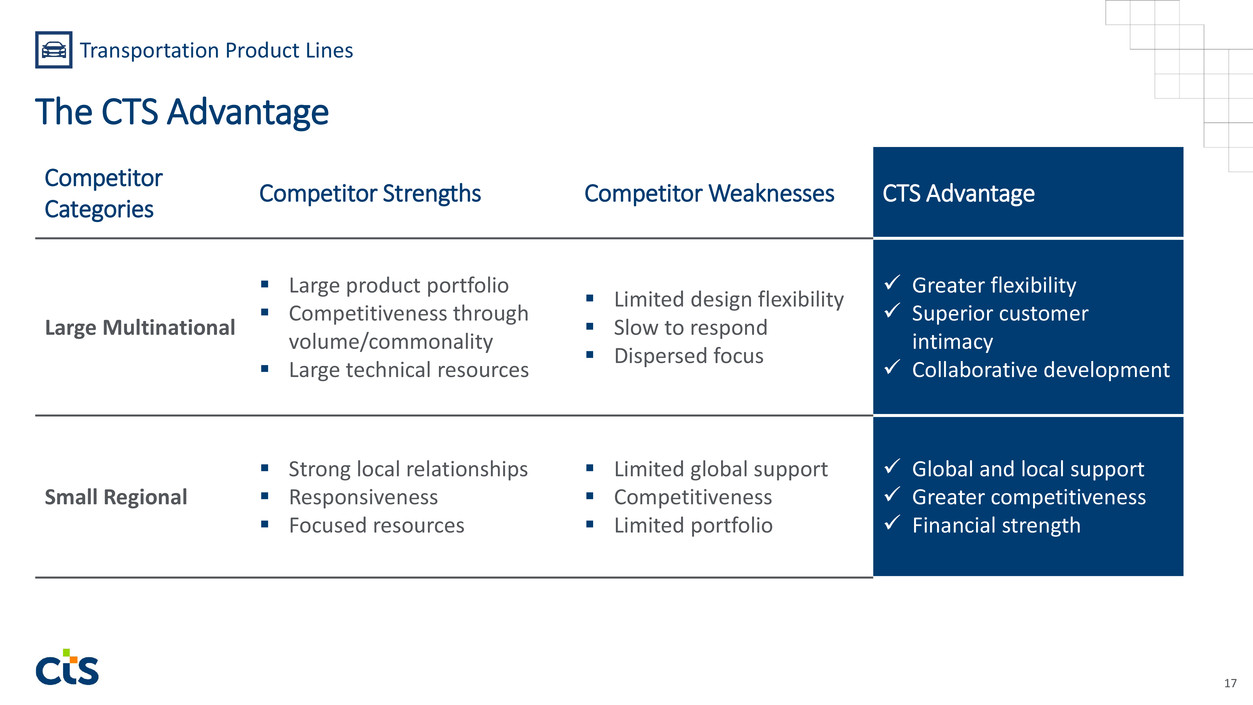
17 Competitor Categories Competitor Strengths Competitor Weaknesses CTS Advantage Large Multinational Large product portfolio Competitiveness through volume/commonality Large technical resources Limited design flexibility Slow to respond Dispersed focus Greater flexibility Superior customer intimacy Collaborative development Small Regional Strong local relationships Responsiveness Focused resources Limited global support Competitiveness Limited portfolio Global and local support Greater competitiveness Financial strength Transportation Product Lines The CTS Advantage
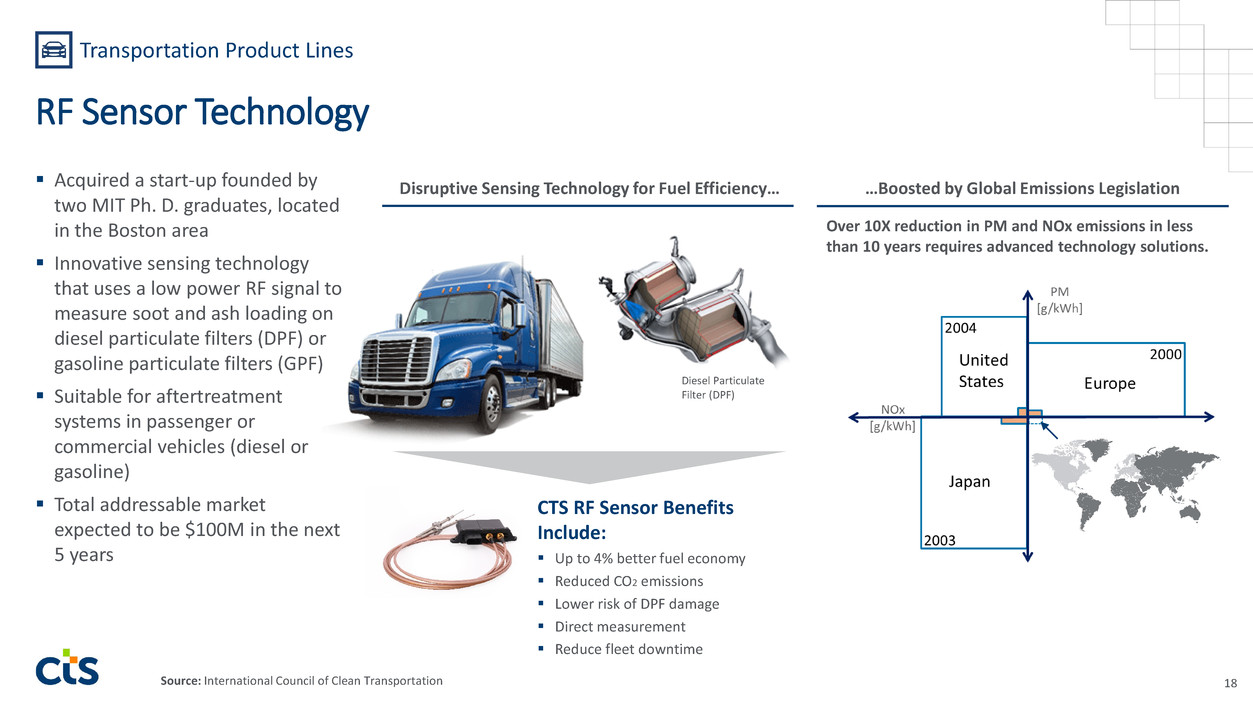
Acquired a start-up founded by two MIT Ph. D. graduates, located in the Boston area Innovative sensing technology that uses a low power RF signal to measure soot and ash loading on diesel particulate filters (DPF) or gasoline particulate filters (GPF) Suitable for aftertreatment systems in passenger or commercial vehicles (diesel or gasoline) Total addressable market expected to be $100M in the next 5 years 18 Transportation Product Lines RF Sensor Technology Disruptive Sensing Technology for Fuel Efficiency… Diesel Particulate Filter (DPF) CTS RF Sensor Benefits Include: Up to 4% better fuel economy Reduced CO2 emissions Lower risk of DPF damage Direct measurement Reduce fleet downtime Over 10X reduction in PM and NOx emissions in less than 10 years requires advanced technology solutions. …Boosted by Global Emissions Legislation Source: International Council of Clean Transportation
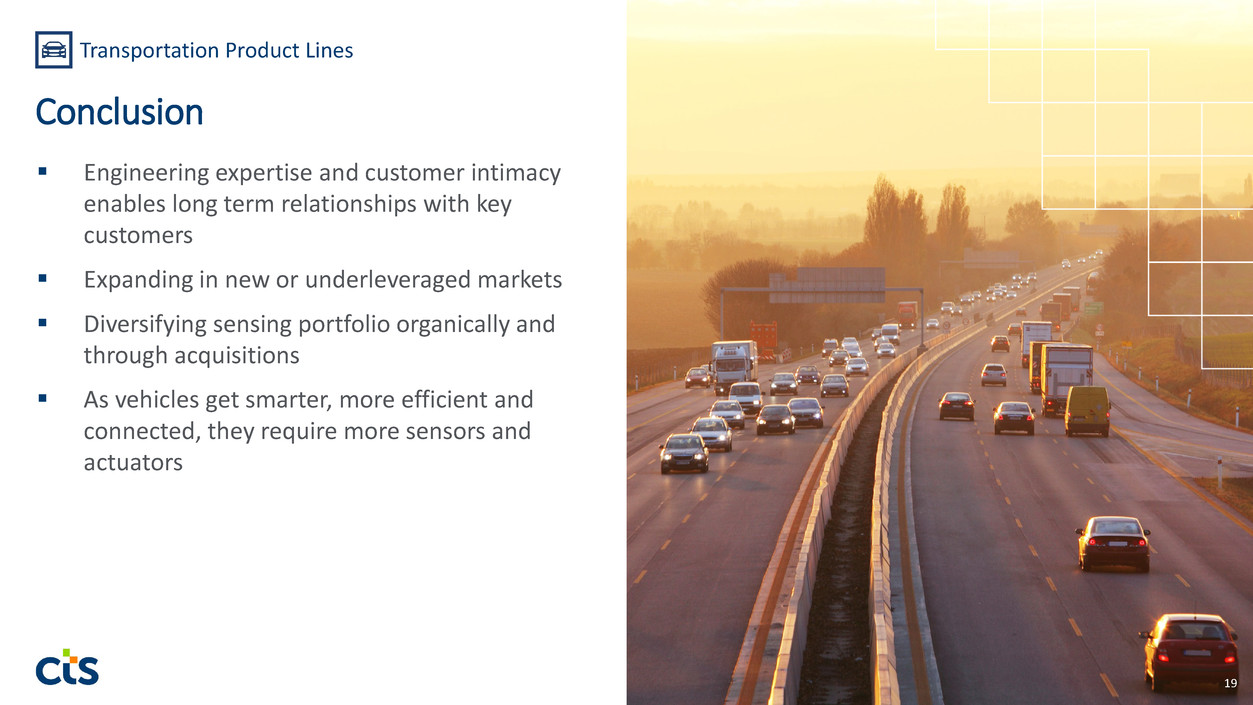
Engineering expertise and customer intimacy enables long term relationships with key customers Expanding in new or underleveraged markets Diversifying sensing portfolio organically and through acquisitions As vehicles get smarter, more efficient and connected, they require more sensors and actuators 19 Transportation Product Lines Conclusion

Ceramic Product Lines
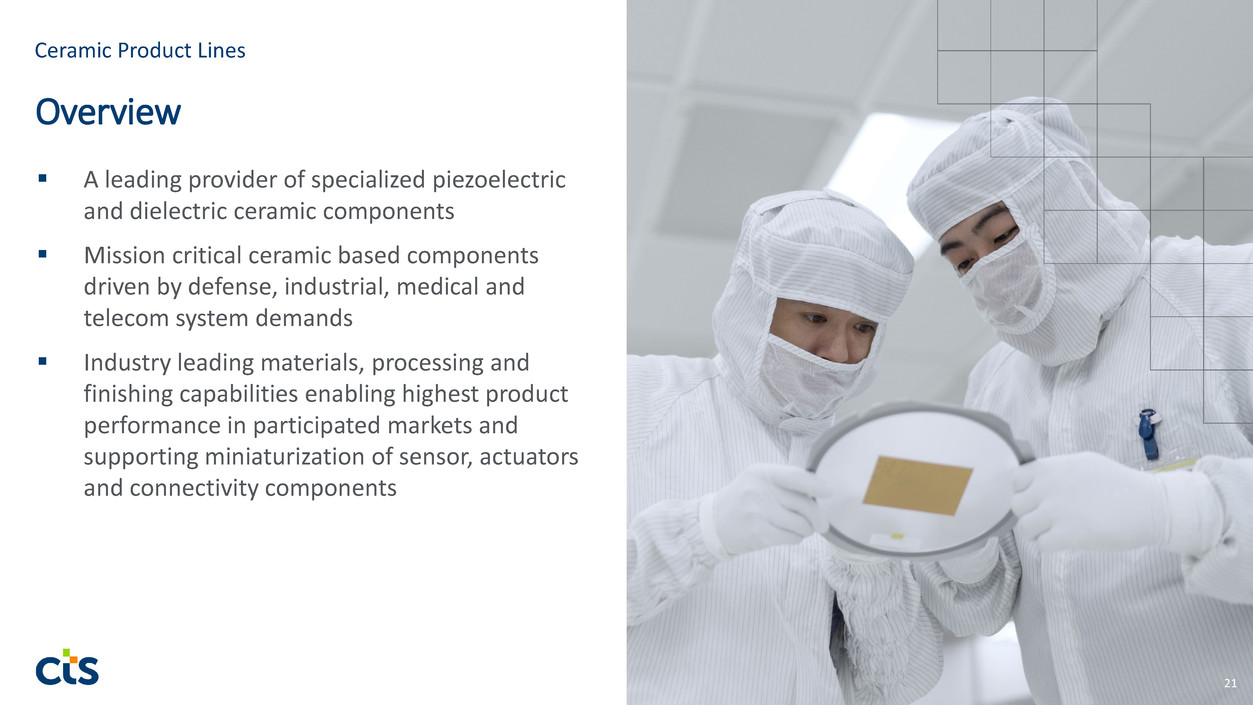
A leading provider of specialized piezoelectric and dielectric ceramic components Mission critical ceramic based components driven by defense, industrial, medical and telecom system demands Industry leading materials, processing and finishing capabilities enabling highest product performance in participated markets and supporting miniaturization of sensor, actuators and connectivity components 21 Ceramic Product Lines Overview
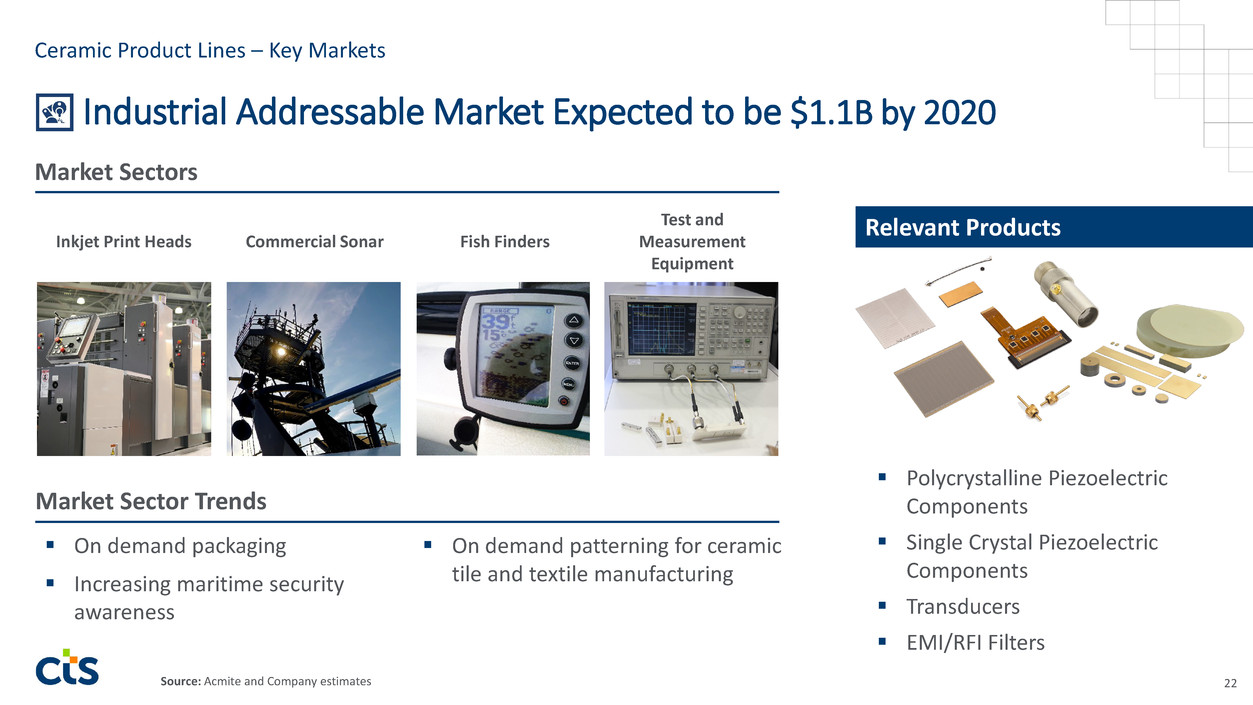
Industrial Addressable Market Expected to be $1.1B by 2020 Polycrystalline Piezoelectric Components Single Crystal Piezoelectric Components Transducers EMI/RFI Filters 22 Market Sectors Inkjet Print Heads Commercial Sonar Fish Finders Relevant Products On demand packaging On demand patterning for ceramic tile and textile manufacturing Increasing maritime security awareness Test and Measurement Equipment Market Sector Trends Ceramic Product Lines – Key Markets Source: Acmite and Company estimates
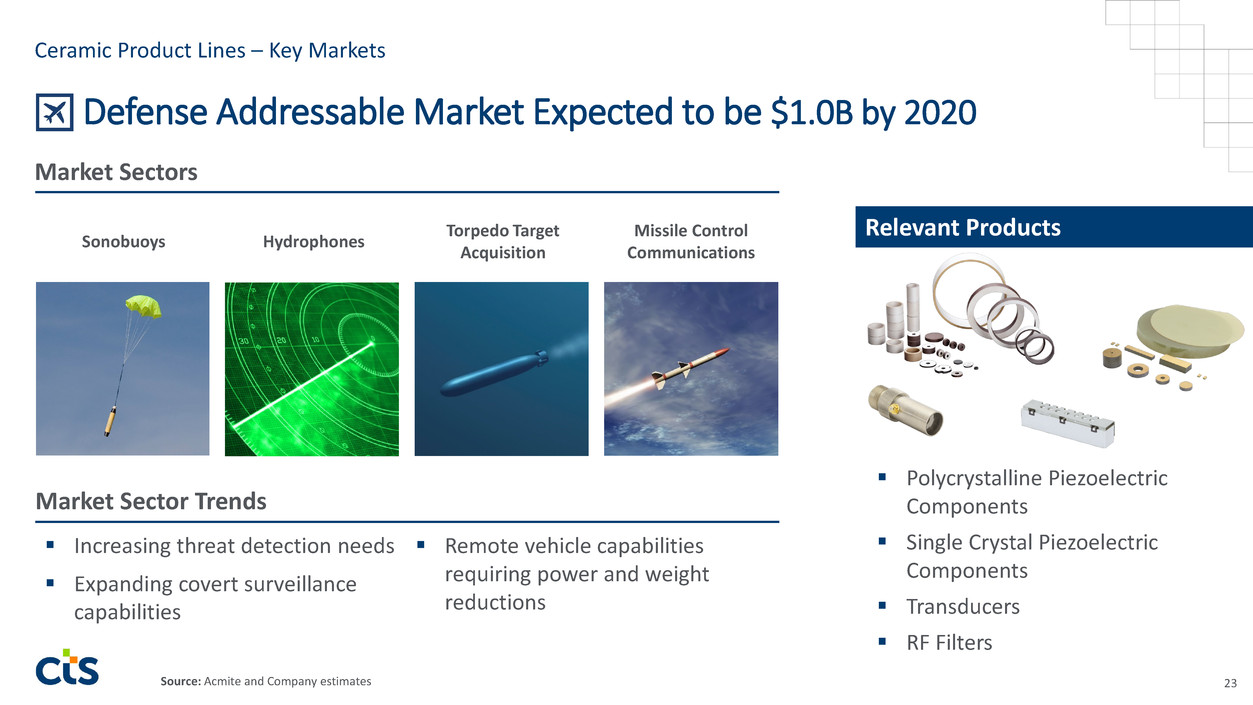
Defense Addressable Market Expected to be $1.0B by 2020 Polycrystalline Piezoelectric Components Single Crystal Piezoelectric Components Transducers RF Filters 23 Market Sectors Sonobuoys Hydrophones Torpedo Target Acquisition Relevant Products Increasing threat detection needs Remote vehicle capabilities requiring power and weight reductions Expanding covert surveillance capabilities Missile Control Communications Market Sector Trends Ceramic Product Lines – Key Markets Source: Acmite and Company estimates
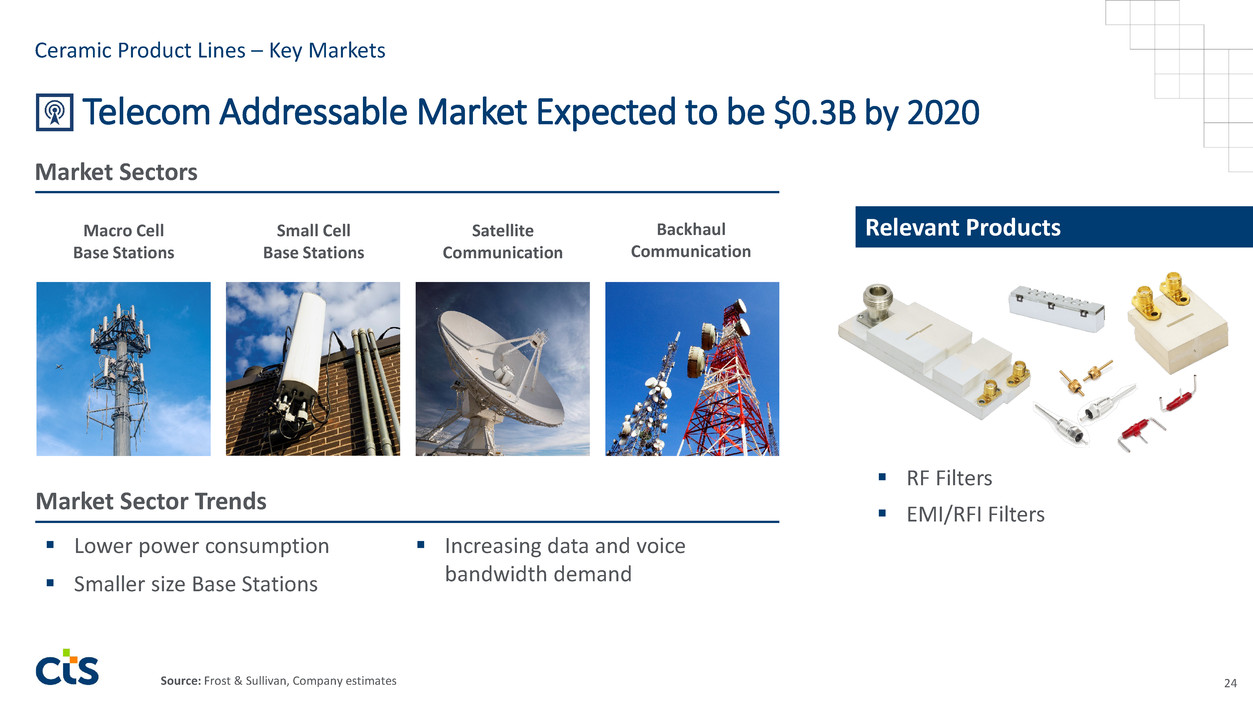
Telecom Addressable Market Expected to be $0.3B by 2020 RF Filters EMI/RFI Filters 24 Market Sectors Relevant Products Lower power consumption Increasing data and voice bandwidth demand Smaller size Base Stations Macro Cell Base Stations Small Cell Base Stations Satellite Communication Backhaul Communication Market Sector Trends Ceramic Product Lines – Key Markets Source: Frost & Sullivan, Company estimates
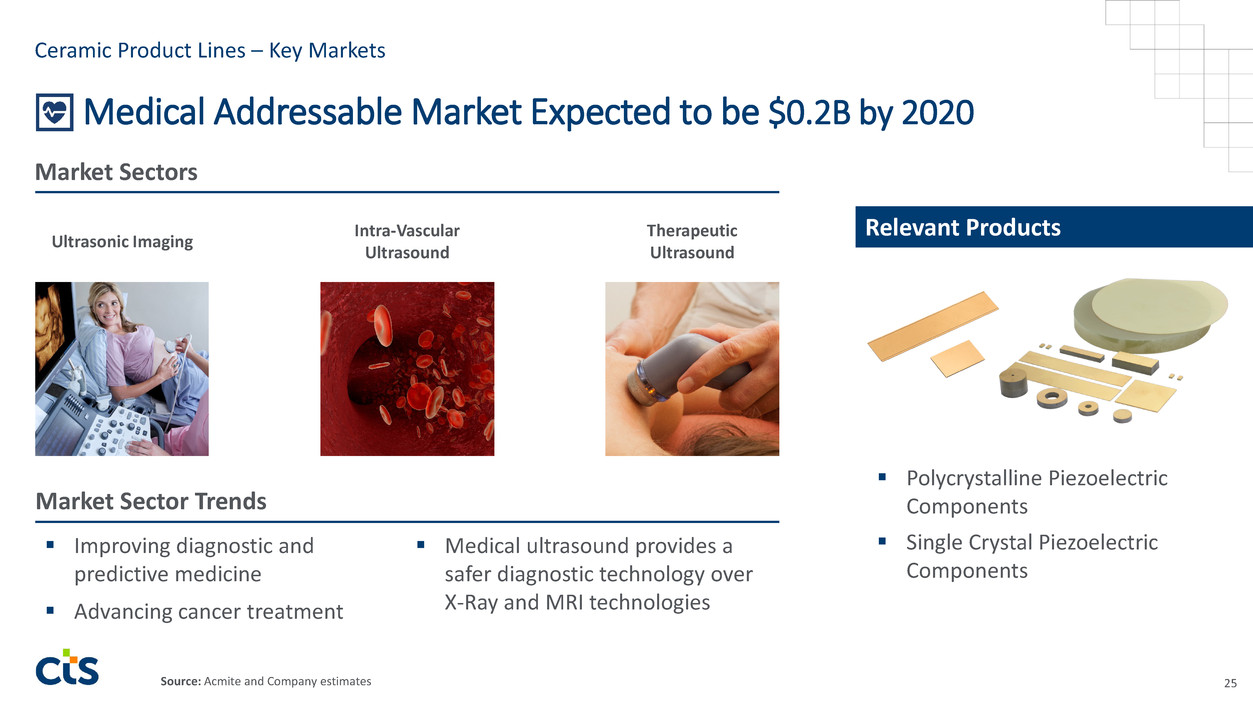
Medical Addressable Market Expected to be $0.2B by 2020 Polycrystalline Piezoelectric Components Single Crystal Piezoelectric Components 25 Market Sectors Ultrasonic Imaging Intra-Vascular Ultrasound Therapeutic Ultrasound Relevant Products Improving diagnostic and predictive medicine Medical ultrasound provides a safer diagnostic technology over X-Ray and MRI technologies Advancing cancer treatment Market Sector Trends Ceramic Product Lines – Key Markets Source: Acmite and Company estimates
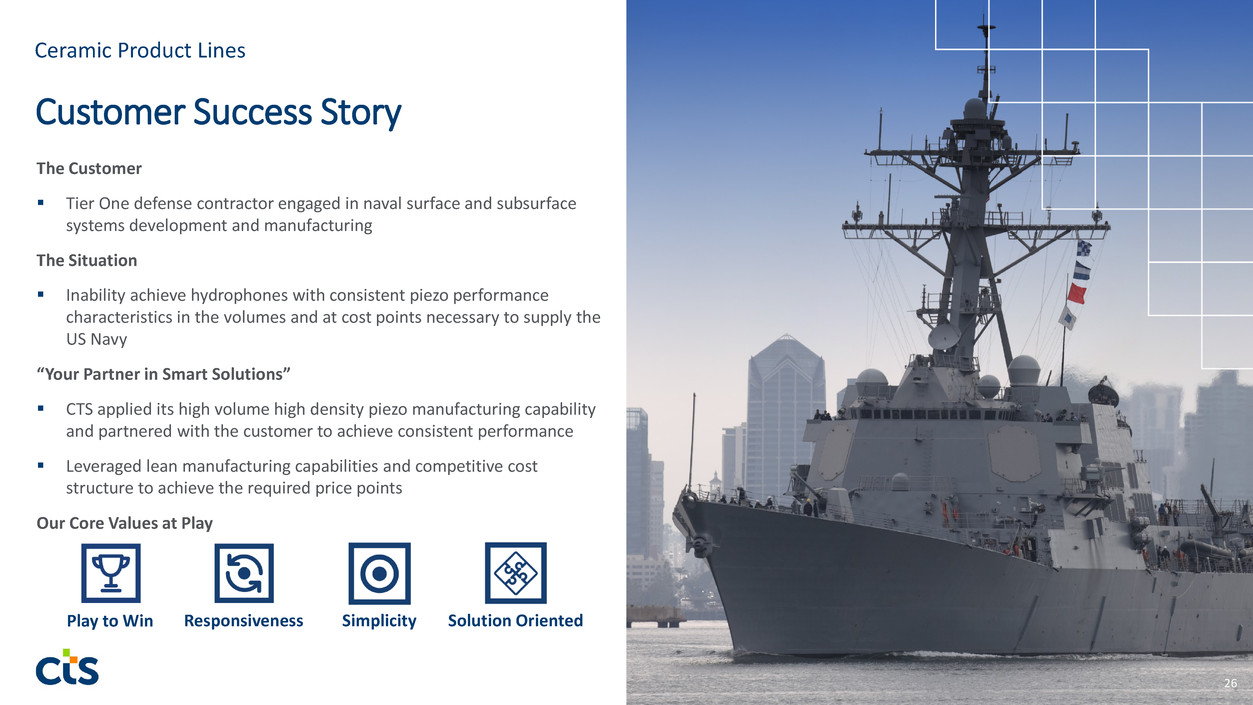
26 The Customer Tier One defense contractor engaged in naval surface and subsurface systems development and manufacturing The Situation Inability achieve hydrophones with consistent piezo performance characteristics in the volumes and at cost points necessary to supply the US Navy “Your Partner in Smart Solutions” CTS applied its high volume high density piezo manufacturing capability and partnered with the customer to achieve consistent performance Leveraged lean manufacturing capabilities and competitive cost structure to achieve the required price points Our Core Values at Play Customer Success Story Play to Win Responsiveness Simplicity Solution Oriented Ceramic Product Lines
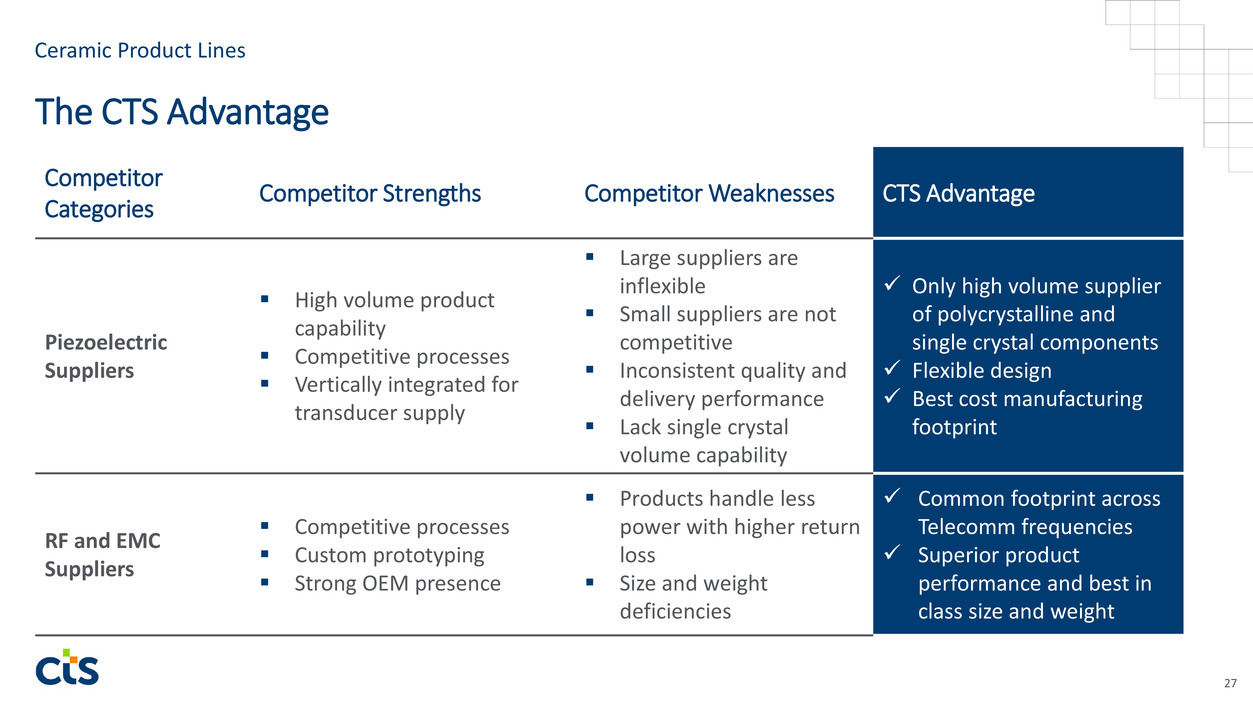
27 Competitor Categories Competitor Strengths Competitor Weaknesses CTS Advantage Piezoelectric Suppliers High volume product capability Competitive processes Vertically integrated for transducer supply Large suppliers are inflexible Small suppliers are not competitive Inconsistent quality and delivery performance Lack single crystal volume capability Only high volume supplier of polycrystalline and single crystal components Flexible design Best cost manufacturing footprint RF and EMC Suppliers Competitive processes Custom prototyping Strong OEM presence Products handle less power with higher return loss Size and weight deficiencies Common footprint across Telecomm frequencies Superior product performance and best in class size and weight The CTS Advantage Ceramic Product Lines
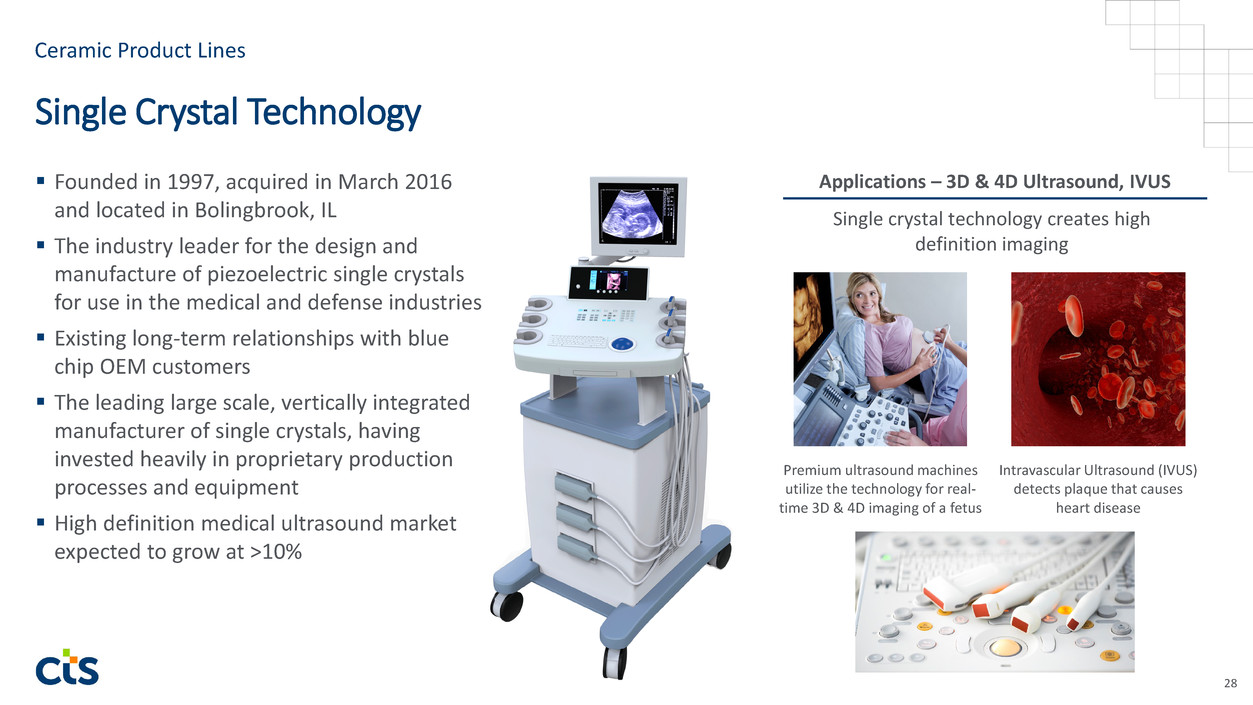
Applications – 3D & 4D Ultrasound, IVUS 28 Single Crystal Technology Founded in 1997, acquired in March 2016 and located in Bolingbrook, IL The industry leader for the design and manufacture of piezoelectric single crystals for use in the medical and defense industries Existing long-term relationships with blue chip OEM customers The leading large scale, vertically integrated manufacturer of single crystals, having invested heavily in proprietary production processes and equipment High definition medical ultrasound market expected to grow at >10% Intravascular Ultrasound (IVUS) detects plaque that causes heart disease Single crystal technology creates high definition imaging Premium ultrasound machines utilize the technology for real- time 3D & 4D imaging of a fetus Ceramic Product Lines
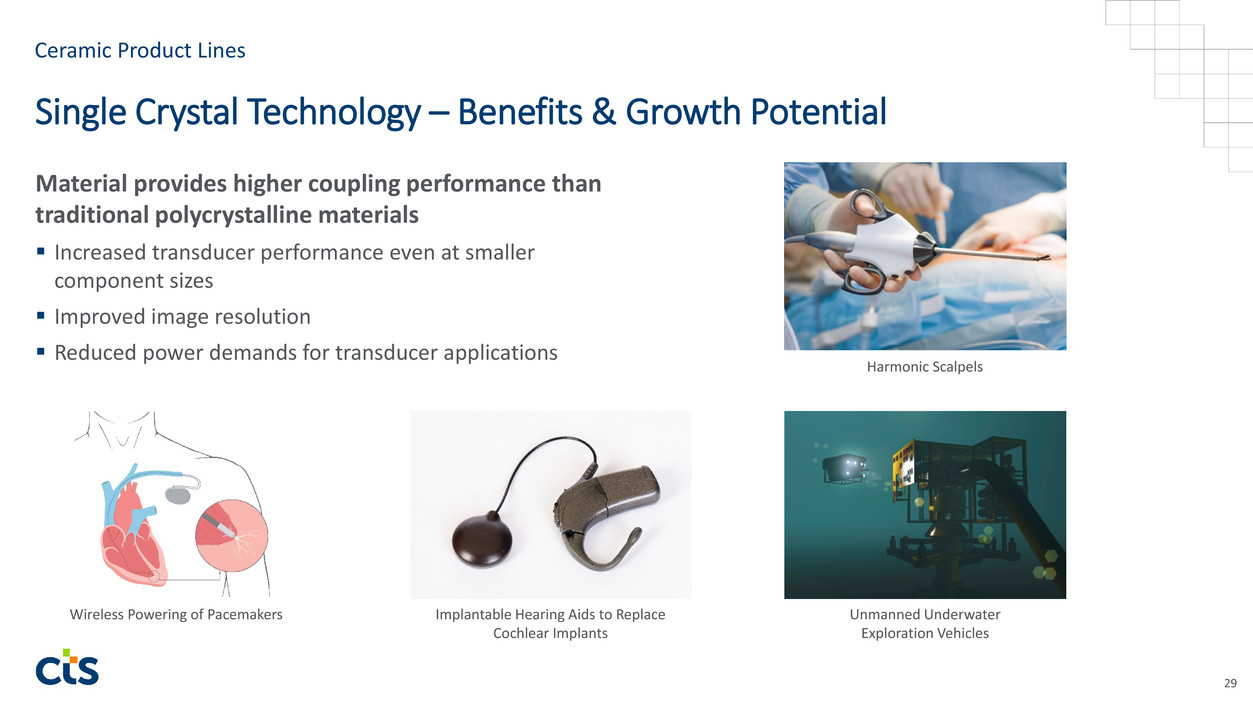
29 Single Crystal Technology – Benefits & Growth Potential Wireless Powering of Pacemakers Implantable Hearing Aids to Replace Cochlear Implants Material provides higher coupling performance than traditional polycrystalline materials Increased transducer performance even at smaller component sizes Improved image resolution Reduced power demands for transducer applications Ceramic Product Lines Harmonic Scalpels Unmanned Underwater Exploration Vehicles
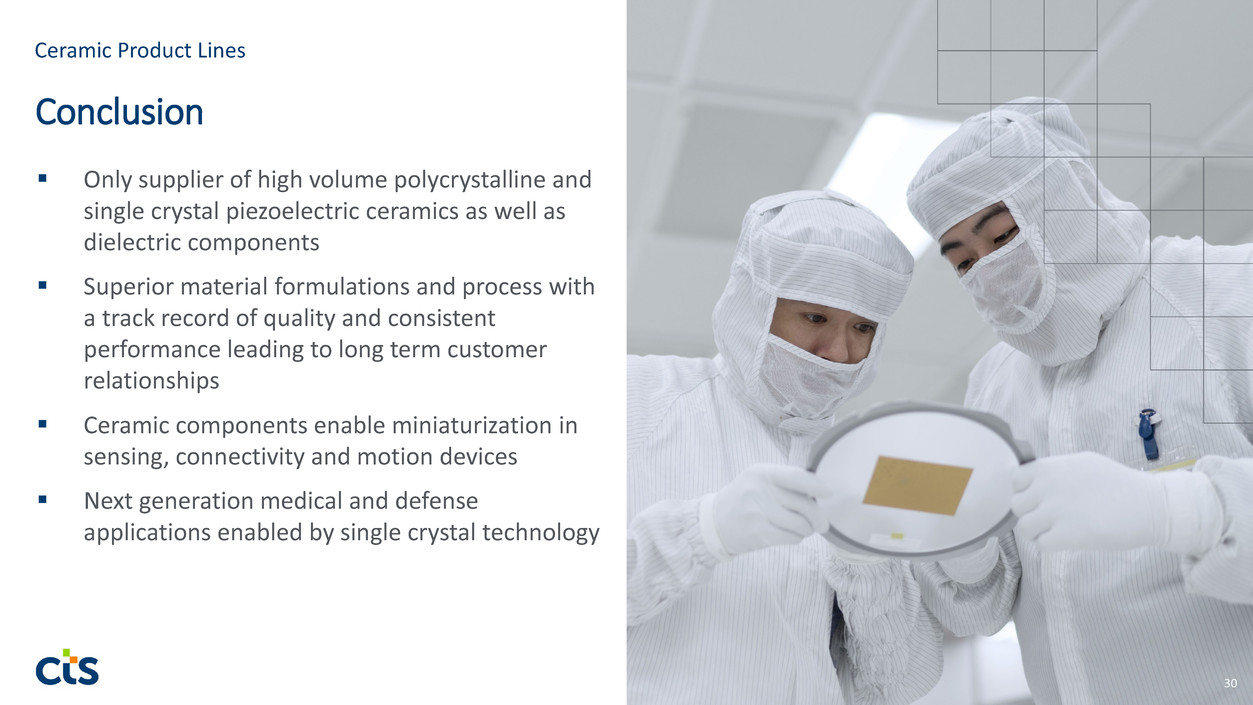
Only supplier of high volume polycrystalline and single crystal piezoelectric ceramics as well as dielectric components Superior material formulations and process with a track record of quality and consistent performance leading to long term customer relationships Ceramic components enable miniaturization in sensing, connectivity and motion devices Next generation medical and defense applications enabled by single crystal technology 30 Conclusion Ceramic Product Lines
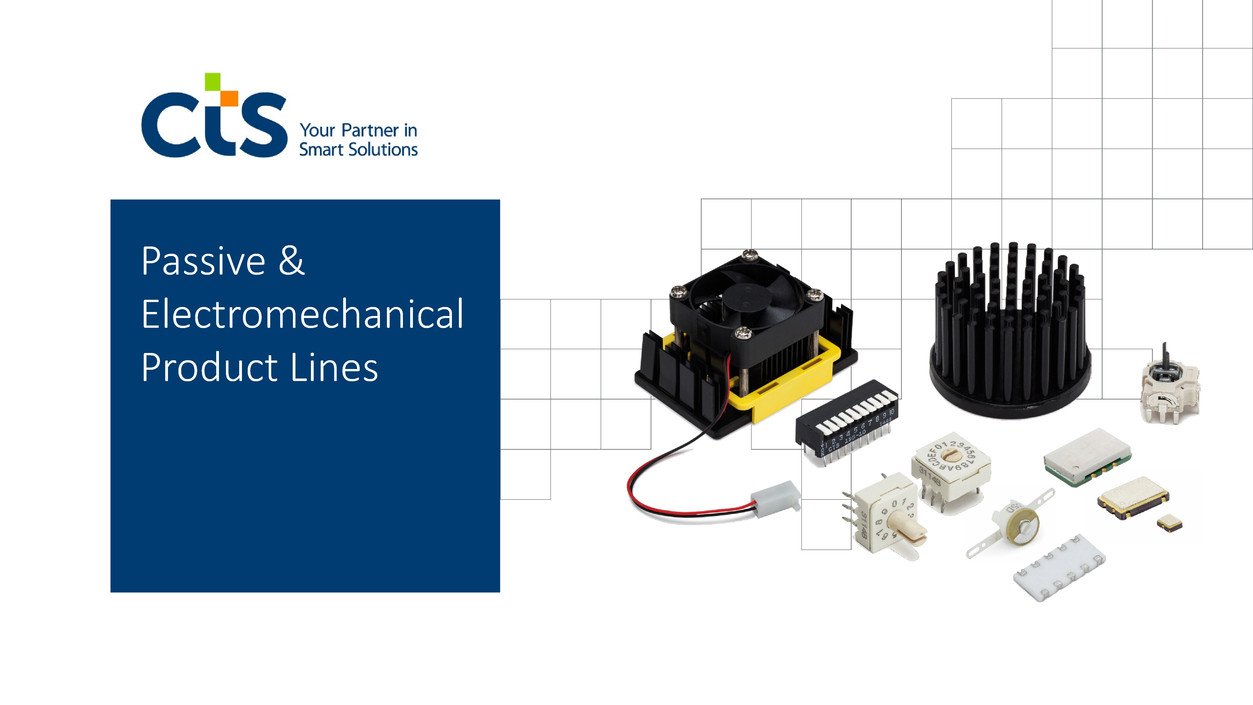
Passive & Electromechanical Product Lines
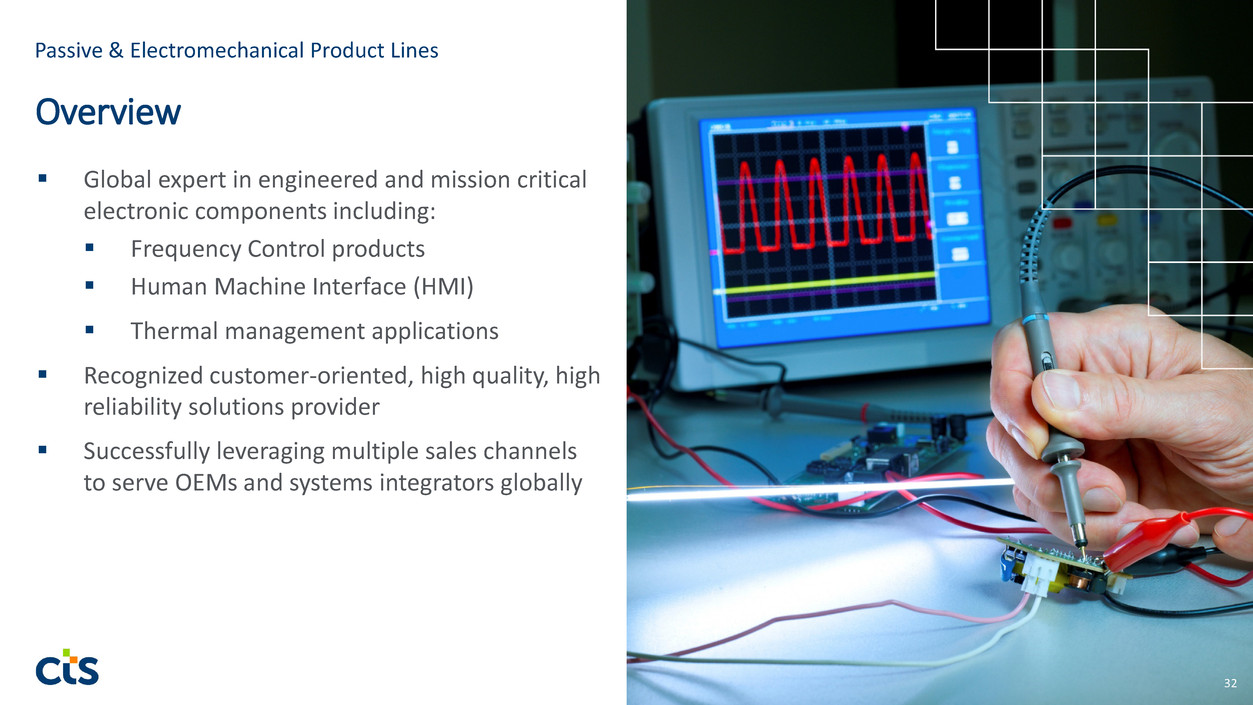
Global expert in engineered and mission critical electronic components including: Frequency Control products Human Machine Interface (HMI) Thermal management applications Recognized customer-oriented, high quality, high reliability solutions provider Successfully leveraging multiple sales channels to serve OEMs and systems integrators globally 32 Passive & Electromechanical Product Lines Overview
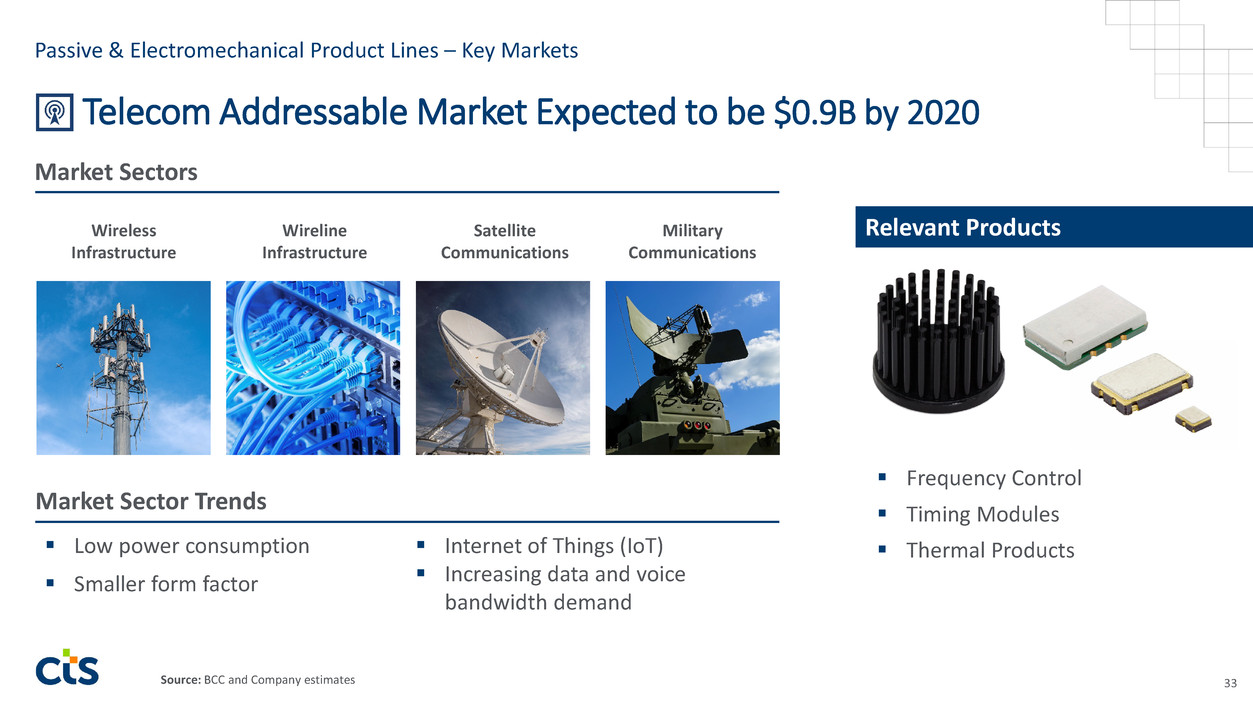
Telecom Addressable Market Expected to be $0.9B by 2020 Frequency Control Timing Modules Thermal Products 33 Market Sectors Wireless Infrastructure Wireline Infrastructure Satellite Communications Relevant Products Low power consumption Internet of Things (IoT) Increasing data and voice bandwidth demand Smaller form factor Military Communications Market Sector Trends Passive & Electromechanical Product Lines – Key Markets Source: BCC and Company estimates
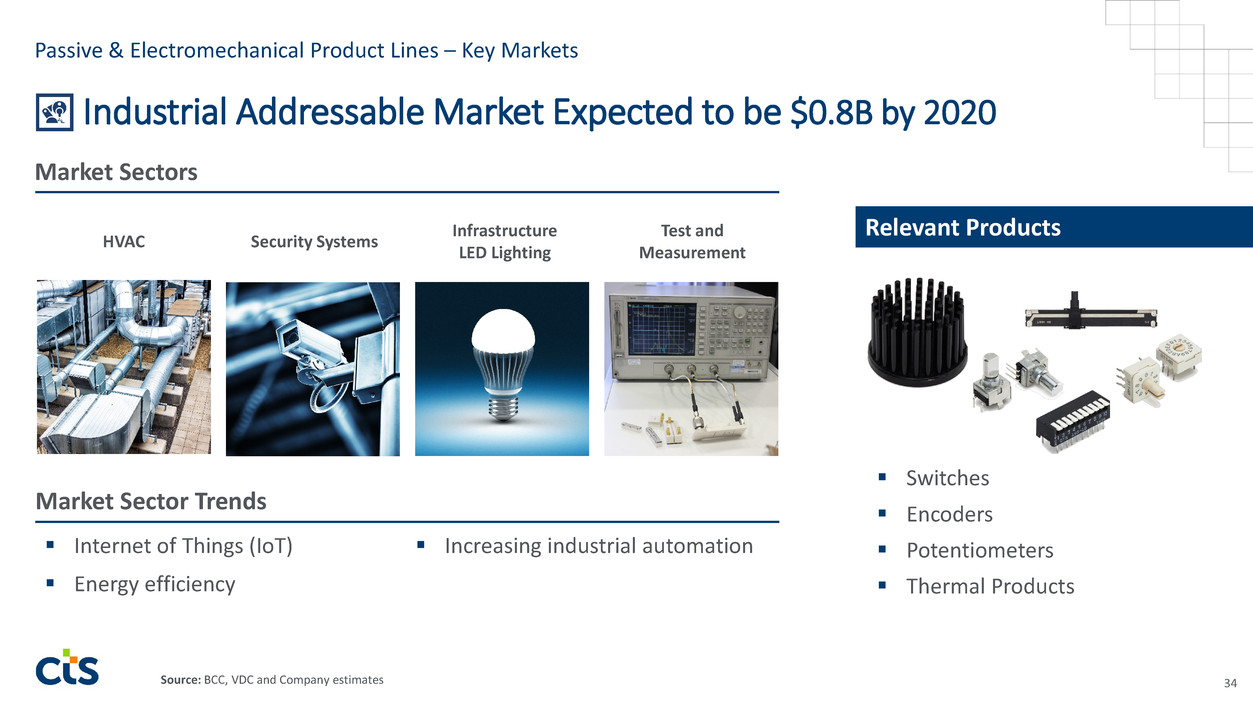
Industrial Addressable Market Expected to be $0.8B by 2020 Switches Encoders Potentiometers Thermal Products 34 Market Sectors HVAC Security Systems Infrastructure LED Lighting Relevant Products Internet of Things (IoT) Increasing industrial automation Energy efficiency Test and Measurement Market Sector Trends Passive & Electromechanical Product Lines – Key Markets Source: BCC, VDC and Company estimates
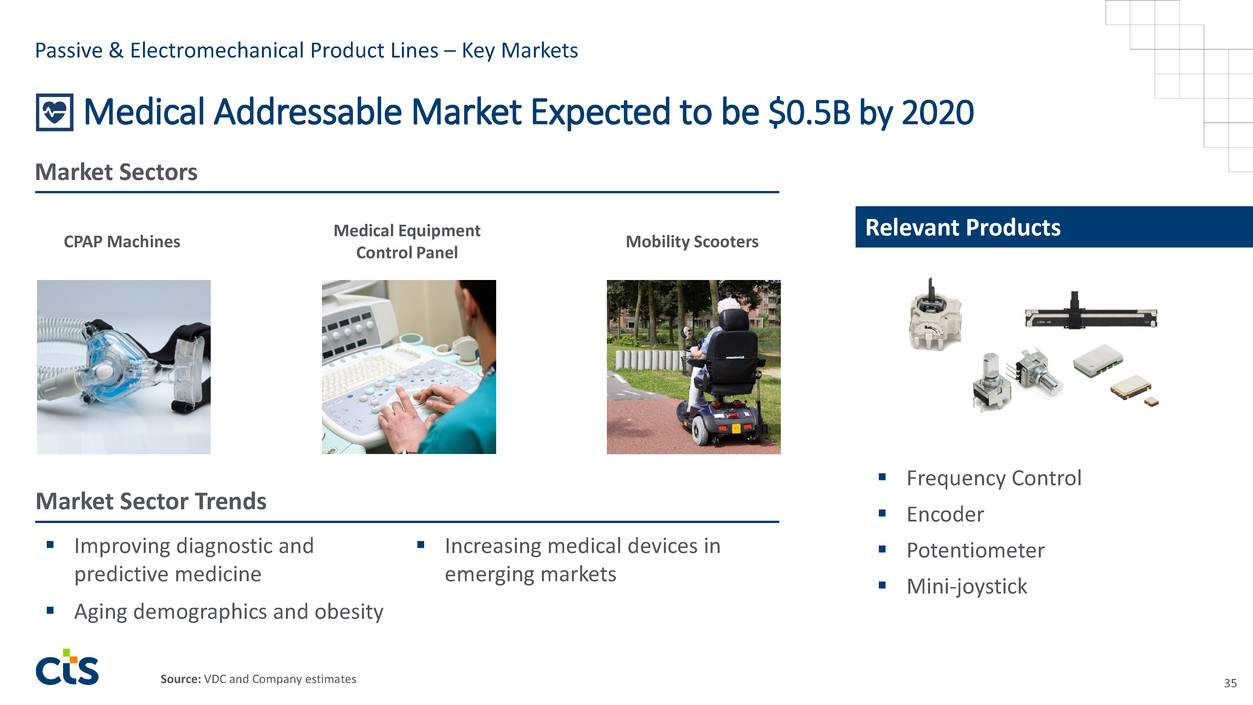
Medical Addressable Market Expected to be $0.5B by 2020 Frequency Control Encoder Potentiometer Mini-joystick 35 Market Sectors CPAP Machines Medical Equipment Control Panel Mobility Scooters Relevant Products Improving diagnostic and predictive medicine Increasing medical devices in emerging markets Aging demographics and obesity Market Sector Trends Passive & Electromechanical Product Lines – Key Markets Source: VDC and Company estimates
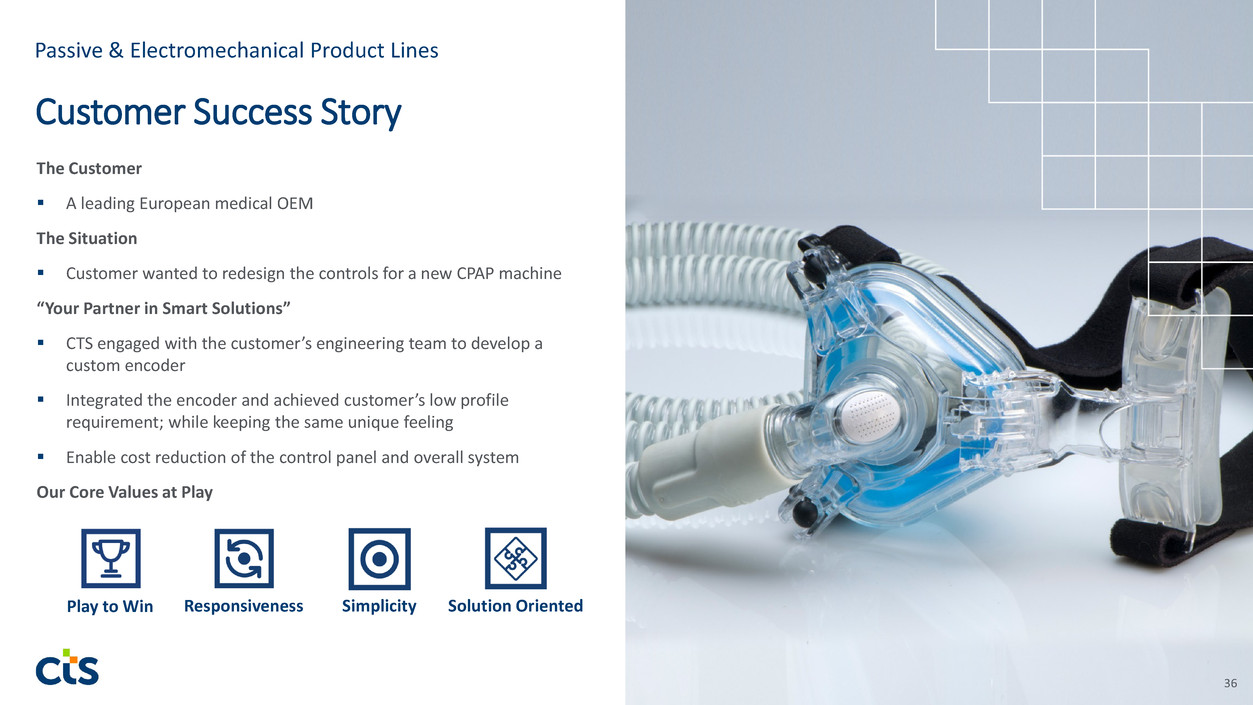
36 The Customer A leading European medical OEM The Situation Customer wanted to redesign the controls for a new CPAP machine “Your Partner in Smart Solutions” CTS engaged with the customer’s engineering team to develop a custom encoder Integrated the encoder and achieved customer’s low profile requirement; while keeping the same unique feeling Enable cost reduction of the control panel and overall system Our Core Values at Play Customer Success Story Passive & Electromechanical Product Lines Play to Win Responsiveness Simplicity Solution Oriented
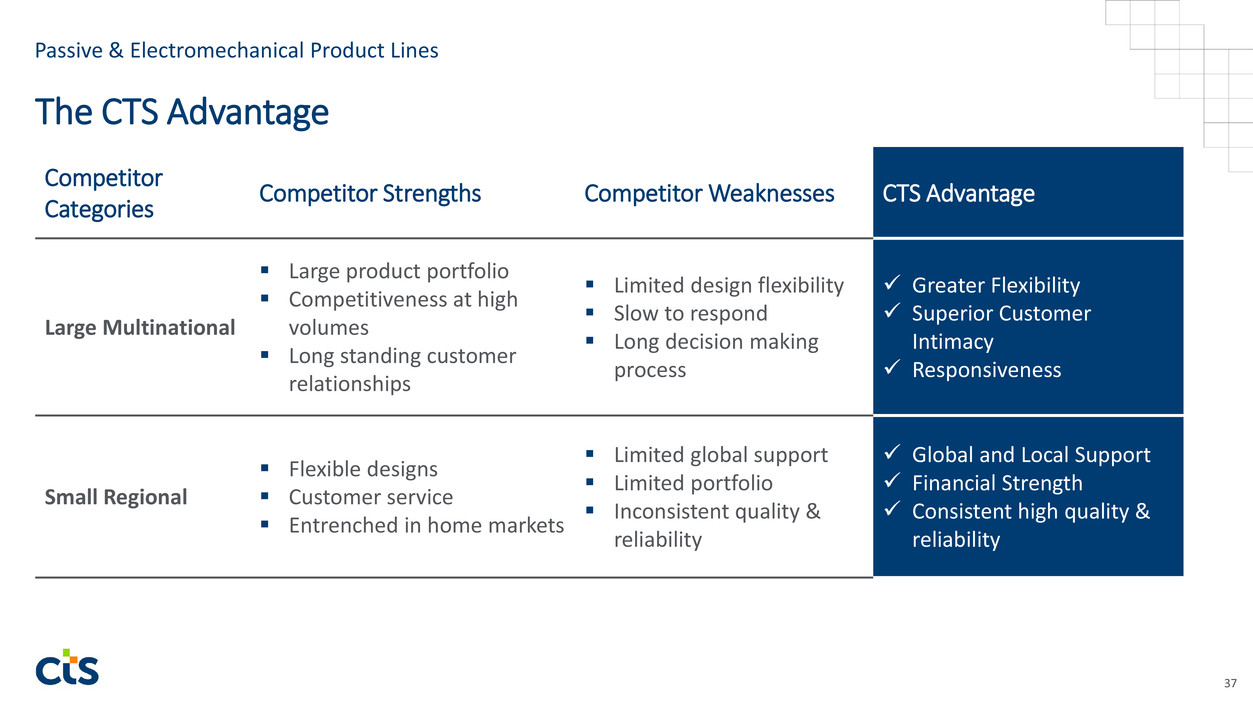
37 Competitor Categories Competitor Strengths Competitor Weaknesses CTS Advantage Large Multinational Large product portfolio Competitiveness at high volumes Long standing customer relationships Limited design flexibility Slow to respond Long decision making process Greater Flexibility Superior Customer Intimacy Responsiveness Small Regional Flexible designs Customer service Entrenched in home markets Limited global support Limited portfolio Inconsistent quality & reliability Global and Local Support Financial Strength Consistent high quality & reliability The CTS Advantage Passive & Electromechanical Product Lines
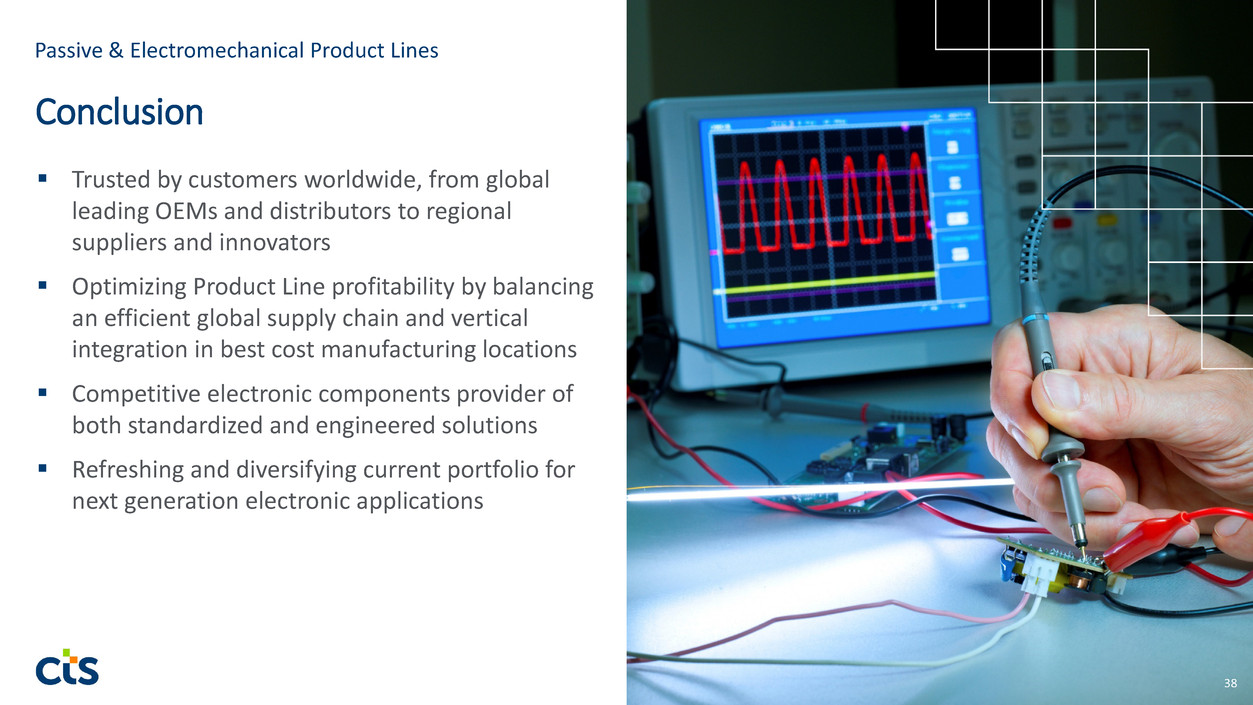
Trusted by customers worldwide, from global leading OEMs and distributors to regional suppliers and innovators Optimizing Product Line profitability by balancing an efficient global supply chain and vertical integration in best cost manufacturing locations Competitive electronic components provider of both standardized and engineered solutions Refreshing and diversifying current portfolio for next generation electronic applications 38 Conclusion Passive & Electromechanical Product Lines

Financial Overview
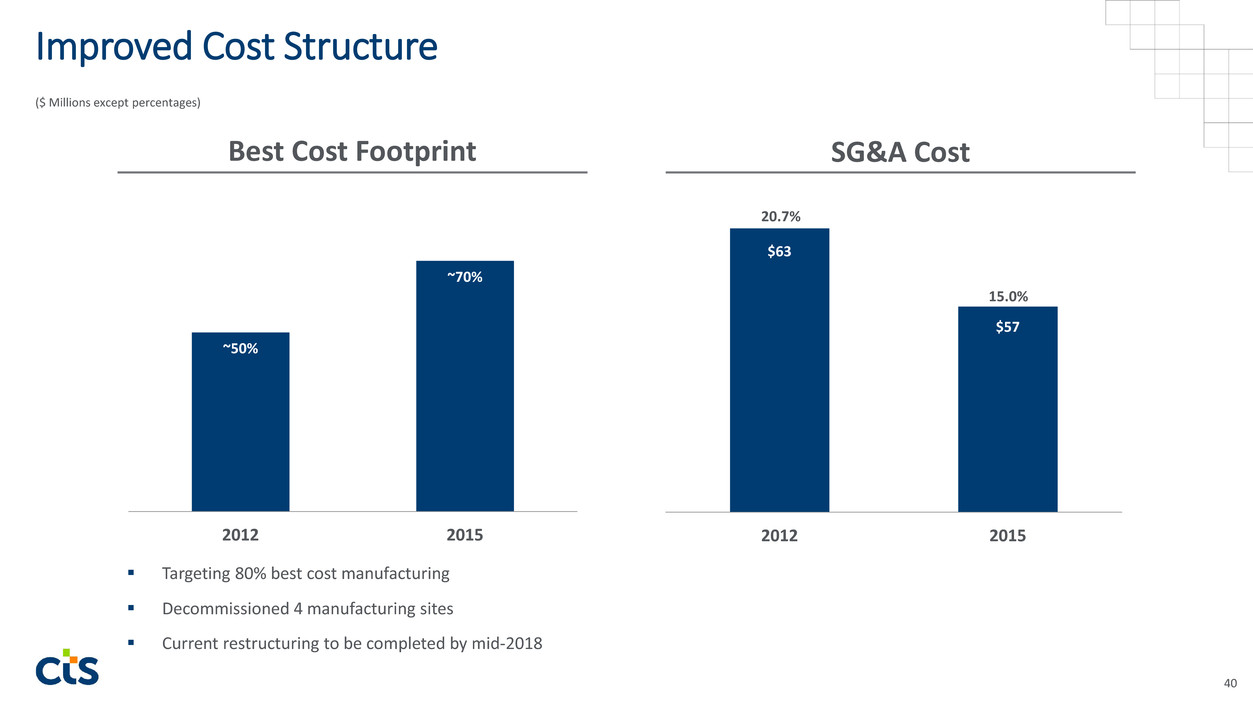
($ Millions except percentages) ~50% ~70% 2012 2015 Best Cost Footprint $63 $57 2012 2015 SG&A Cost Improved Cost Structure 40 Targeting 80% best cost manufacturing Decommissioned 4 manufacturing sites Current restructuring to be completed by mid-2018 20.7% 15.0%
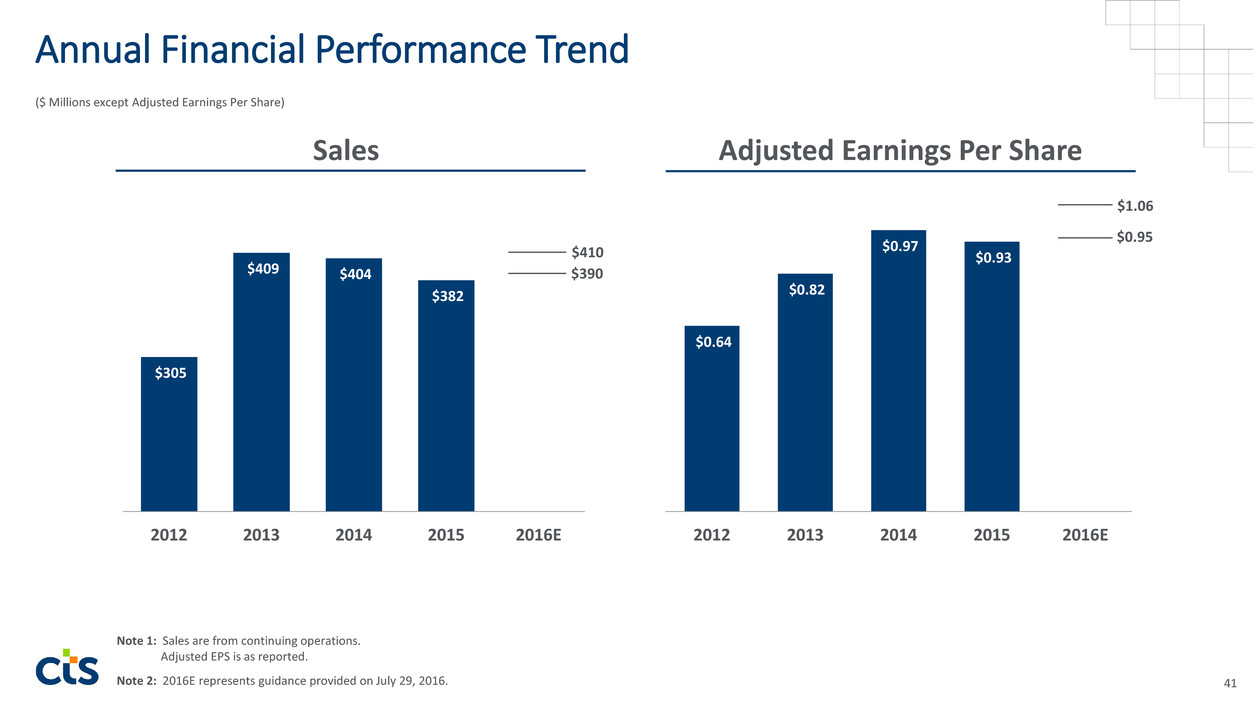
$0.64 $0.82 $0.97 $0.93 2012 2013 2014 2015 2016E Annual Financial Performance Trend $305 $409 $404 $382 2012 2013 2014 2015 2016E Adjusted Earnings Per Share $410 Note 1: Sales are from continuing operations. Adjusted EPS is as reported. Note 2: 2016E represents guidance provided on July 29, 2016. ($ Millions except Adjusted Earnings Per Share) $390 $1.06 $0.95 41 Sales
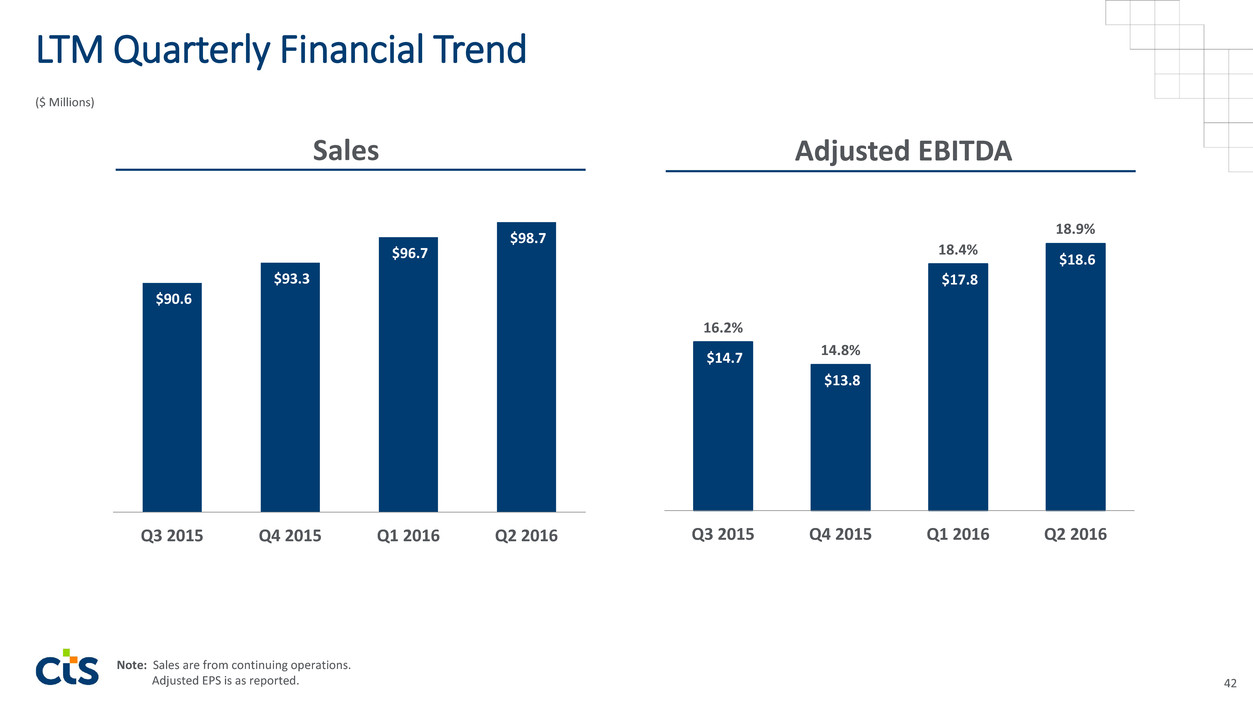
$90.6 $93.3 $96.7 $98.7 Q3 2015 Q4 2015 Q1 2016 Q2 2016 $14.7 $13.8 $17.8 $18.6 Q3 2015 Q4 2015 Q1 2016 Q2 2016 Adjusted EBITDA ($ Millions) LTM Quarterly Financial Trend 42 16.2% 14.8% 18.4% 18.9% Sales Note: Sales are from continuing operations. Adjusted EPS is as reported.
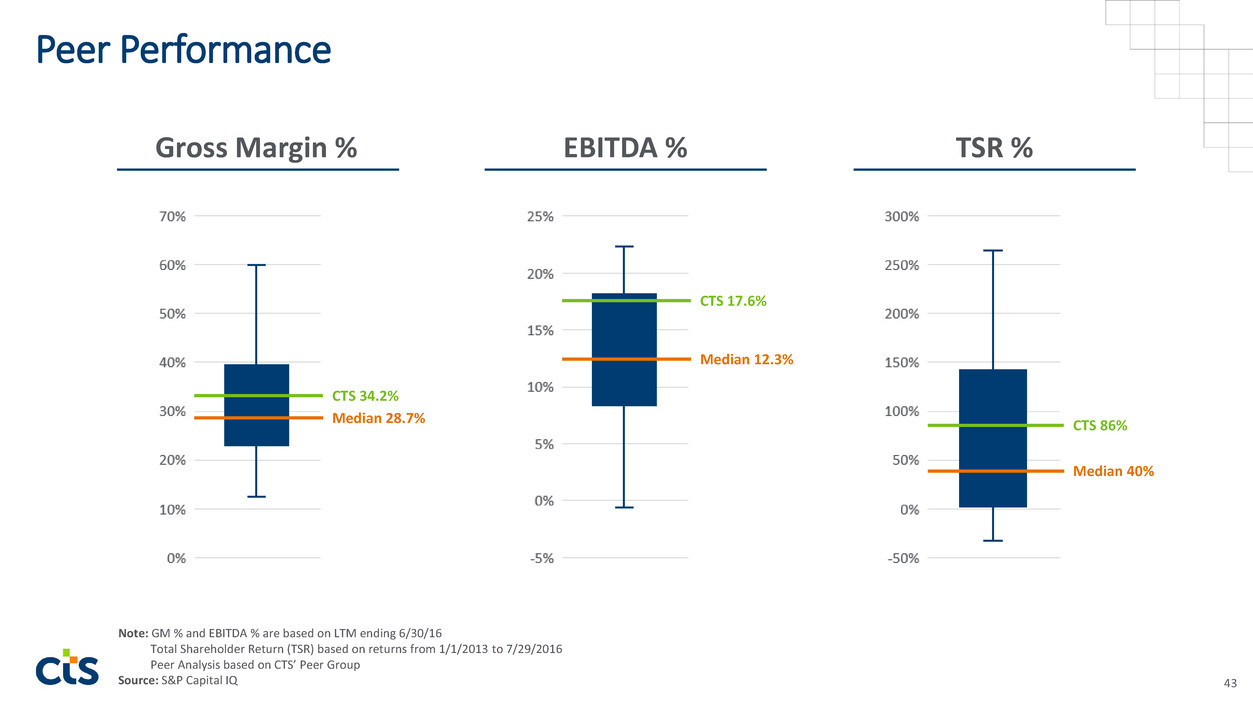
Peer Performance 43 Note: GM % and EBITDA % are based on LTM ending 6/30/16 Total Shareholder Return (TSR) based on returns from 1/1/2013 to 7/29/2016 Peer Analysis based on CTS’ Peer Group Source: S&P Capital IQ TSR %EBITDA %Gross Margin % Median 12.3% Median 28.7% CTS 34.2% CTS 17.6% CTS 86% Median 40%
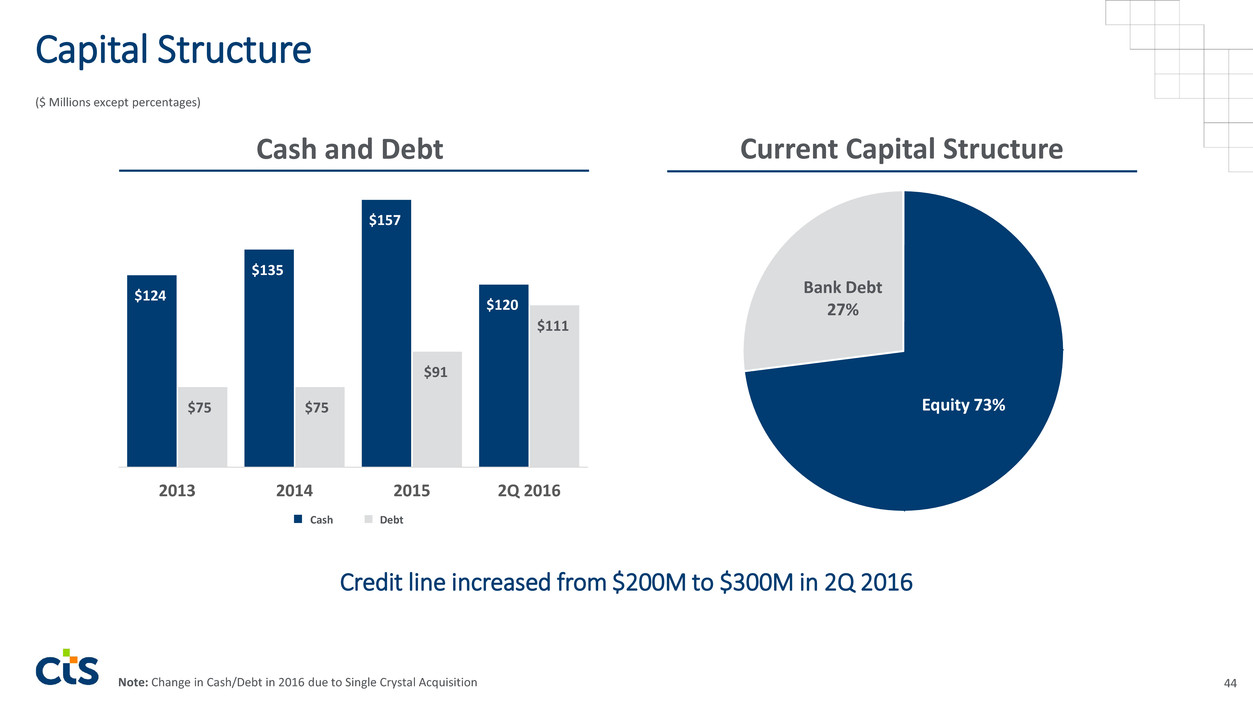
Capital Structure Equity 73% Bank Debt 27% $124 $135 $157 $120 $75 $75 $91 $111 2013 2014 2015 2Q 2016 Note: Change in Cash/Debt in 2016 due to Single Crystal Acquisition Cash and Debt Current Capital Structure DebtCash ($ Millions except percentages) 44 Credit line increased from $200M to $300M in 2Q 2016
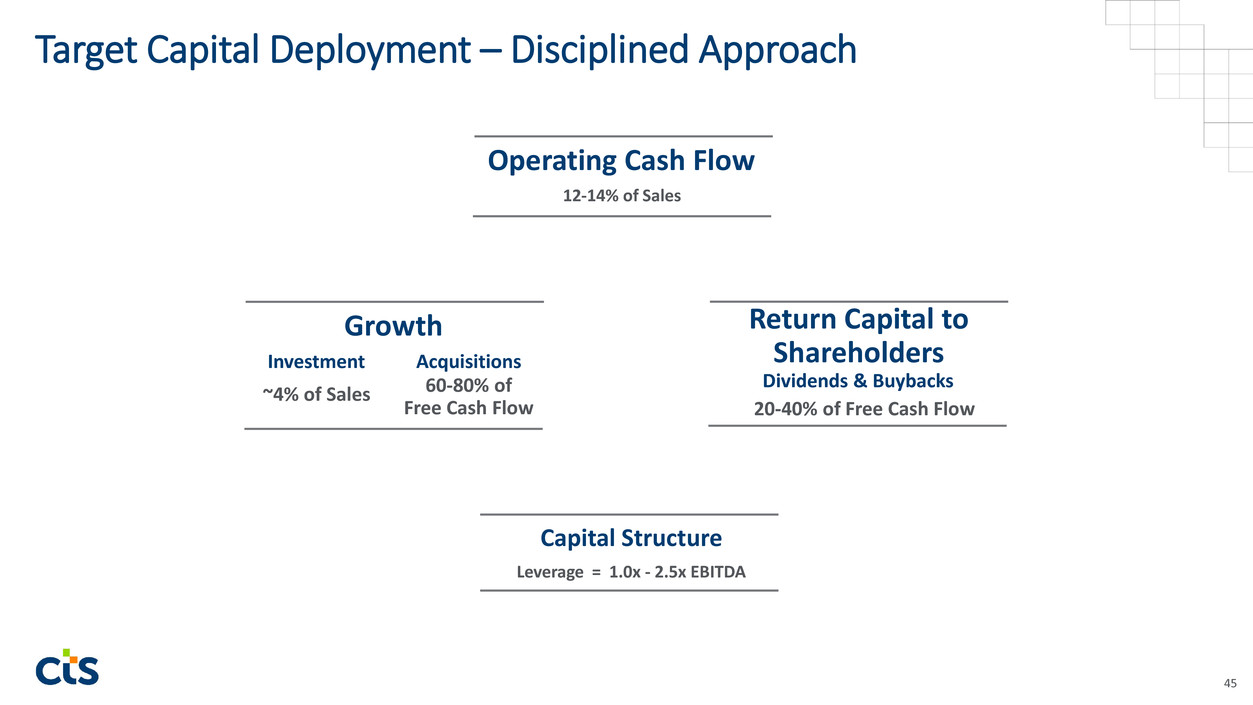
Target Capital Deployment – Disciplined Approach Capital Structure Leverage = 1.0x - 2.5x EBITDA Operating Cash Flow Return Capital to Shareholders ~4% of Sales 20-40% of Free Cash Flow 12-14% of Sales 60-80% of Free Cash Flow Growth AcquisitionsInvestment Dividends & Buybacks 45
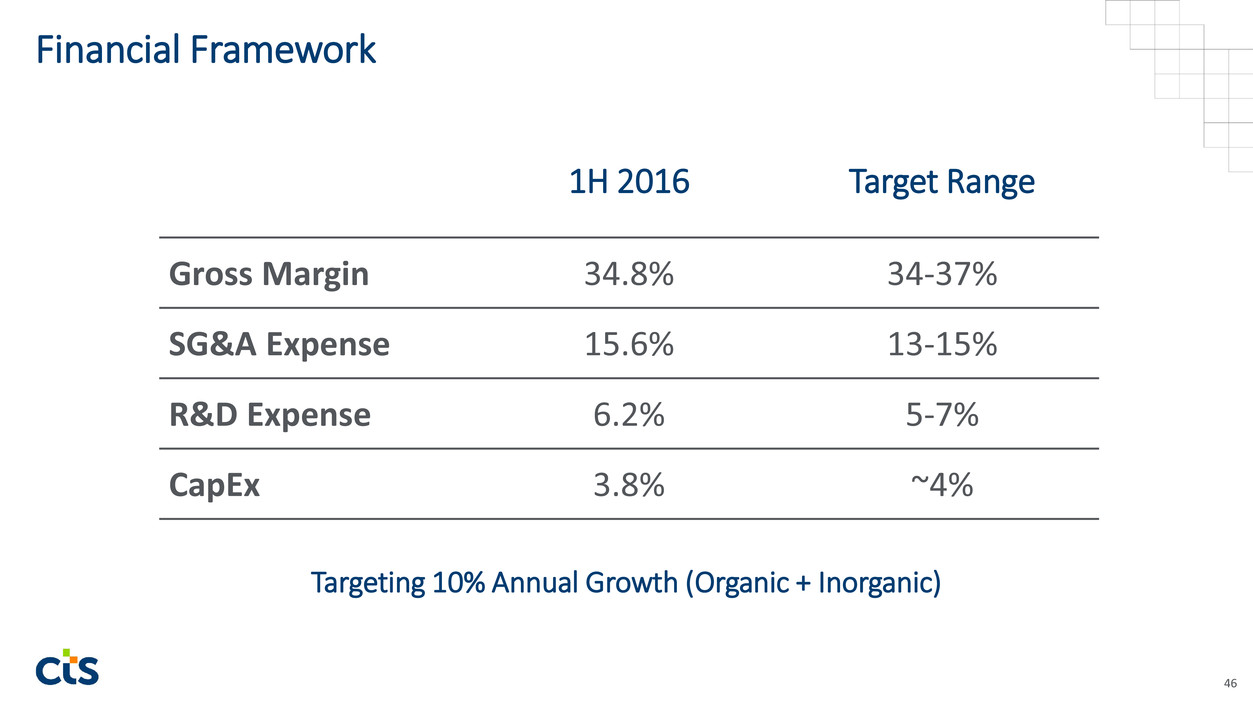
Financial Framework 46 1H 2016 Target Range Gross Margin 34.8% 34-37% SG&A Expense 15.6% 13-15% R&D Expense 6.2% 5-7% CapEx 3.8% ~4% Targeting 10% Annual Growth (Organic + Inorganic)

Closing Remarks
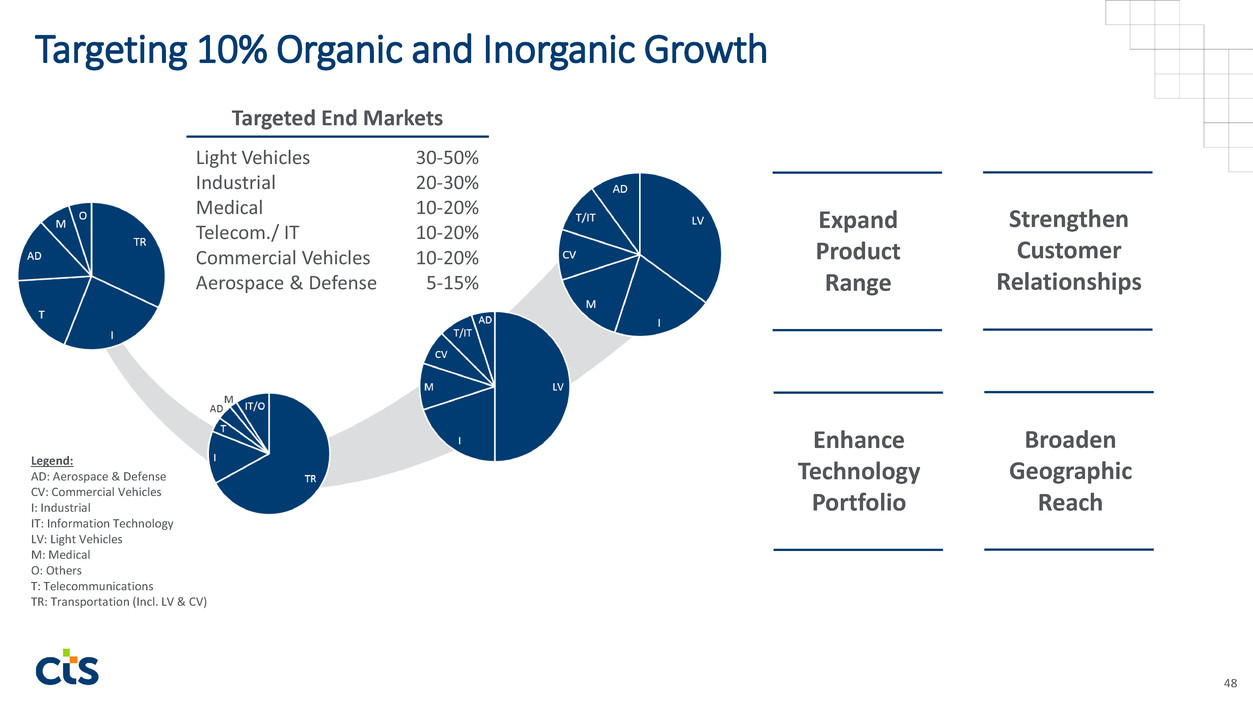
Targeting 10% Organic and Inorganic Growth Expand Product Range Broaden Geographic Reach Enhance Technology Portfolio Strengthen Customer Relationships 48 Legend: AD: Aerospace & Defense CV: Commercial Vehicles I: Industrial IT: Information Technology LV: Light Vehicles M: Medical O: Others T: Telecommunications TR: Transportation (Incl. LV & CV) 30-50% 20-30% 10-20% 10-20% 10-20% 5-15% Targeted End Markets Light Vehicles Industrial Medical Telecom./ IT Commercial Vehicles Aerospace & Defense
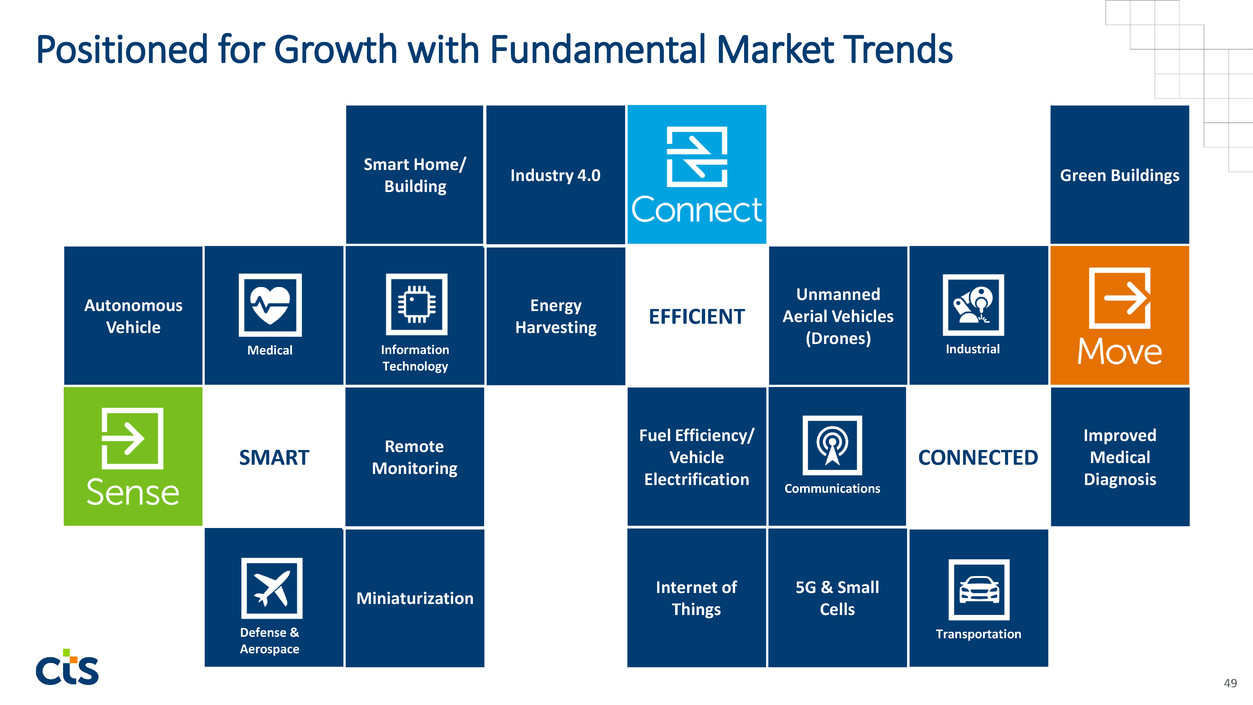
Autonomous Vehicle SMART Smart Home/ Building Unmanned Aerial Vehicles (Drones) Improved Medical Diagnosis Fuel Efficiency/ Vehicle Electrification Miniaturization Energy Harvesting EFFICIENT Green Buildings Remote Monitoring Industry 4.0 Internet of Things 5G & Small Cells CONNECTED Communications Information Technology Transportation IndustrialMedical Defense & Aerospace Positioned for Growth with Fundamental Market Trends 49
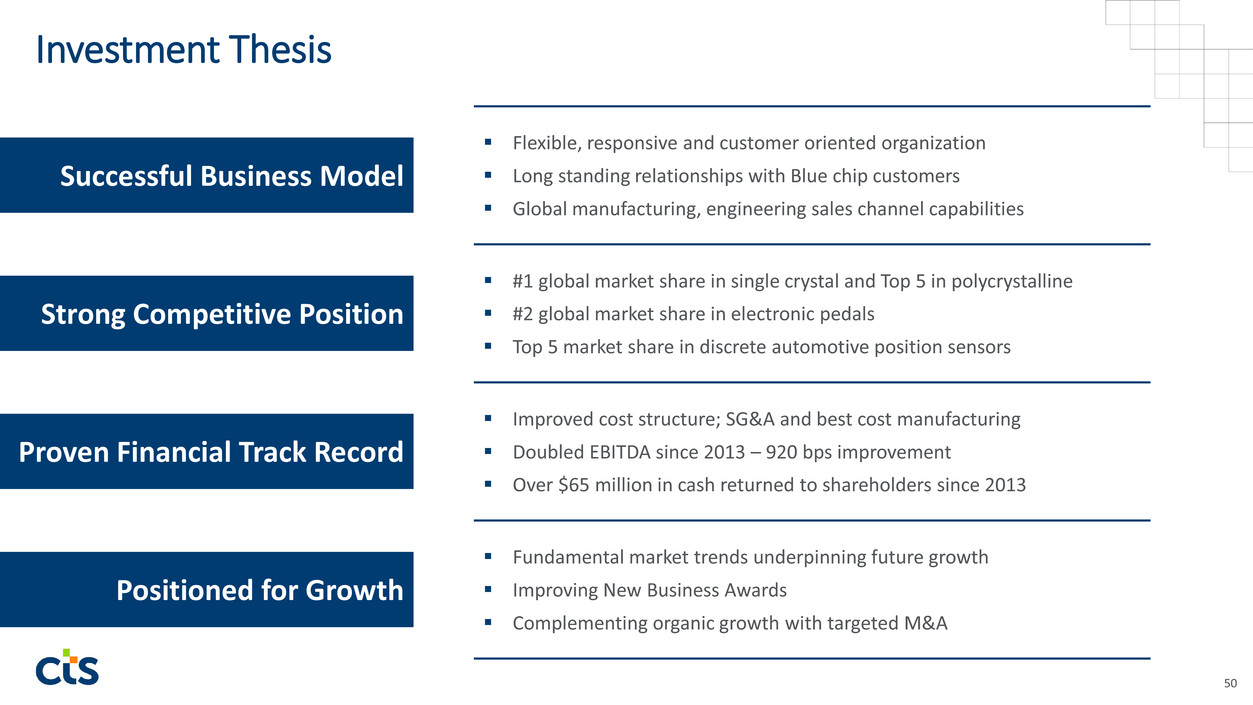
Investment Thesis 50 Positioned for Growth Strong Competitive Position Successful Business Model Fundamental market trends underpinning future growth Improving New Business Awards Complementing organic growth with targeted M&A Flexible, responsive and customer oriented organization Long standing relationships with Blue chip customers Global manufacturing, engineering sales channel capabilities #1 global market share in single crystal and Top 5 in polycrystalline #2 global market share in electronic pedals Top 5 market share in discrete automotive position sensors Proven Financial Track Record Improved cost structure; SG&A and best cost manufacturing Doubled EBITDA since 2013 – 920 bps improvement Over $65 million in cash returned to shareholders since 2013

Questions & Answers

Appendix
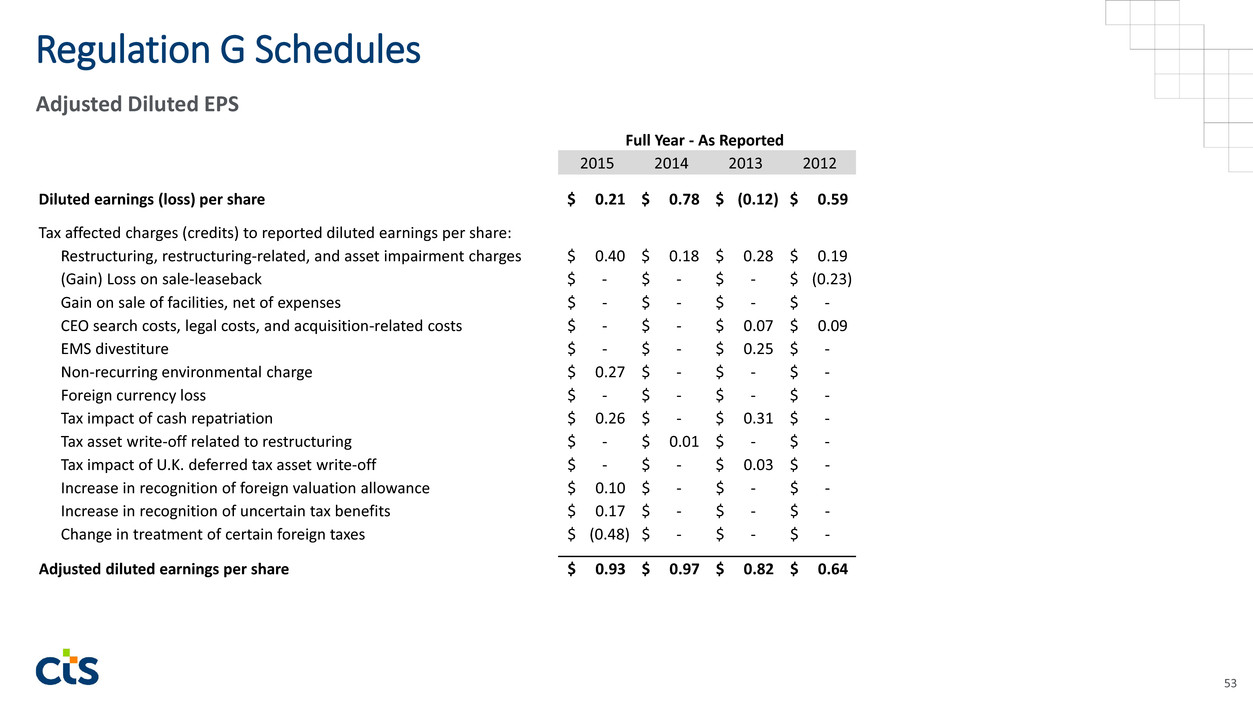
Adjusted Diluted EPS Regulation G Schedules 53 2015 2014 2013 2012 Diluted earnings (loss) per share 0.21$ 0.78$ (0.12)$ 0.59$ Tax affected charges (credits) to reported diluted earnings per share: Restructuring, restructuring-related, and asset impairment charges 0.40$ 0.18$ 0.28$ 0.19$ (Gain) Loss on sale-leaseback -$ -$ -$ (0.23)$ Gain on sale of facilities, net of expenses -$ -$ -$ -$ CEO search costs, legal costs, and acquisition-related costs -$ -$ 0.07$ 0.09$ EMS divestiture -$ -$ 0.25$ -$ Non-recurring environmental charge 0.27$ -$ -$ -$ Foreign currency loss -$ -$ -$ -$ Tax impact of cash repatriation 0.26$ -$ 0.31$ -$ Tax asset write-off related to restructuring -$ 0.01$ -$ -$ Tax impact of U.K. deferred tax asset write-off -$ -$ 0.03$ -$ Increase in recognition of foreign valuation allowance 0.10$ -$ -$ -$ Increase in recognition of uncertain tax benefits 0.17$ -$ -$ -$ Change in treatment of certain foreign taxes (0.48)$ -$ -$ -$ Adjusted diluted earnings per share 0.93$ 0.97$ 0.82$ 0.64$ Full Year - As Reported
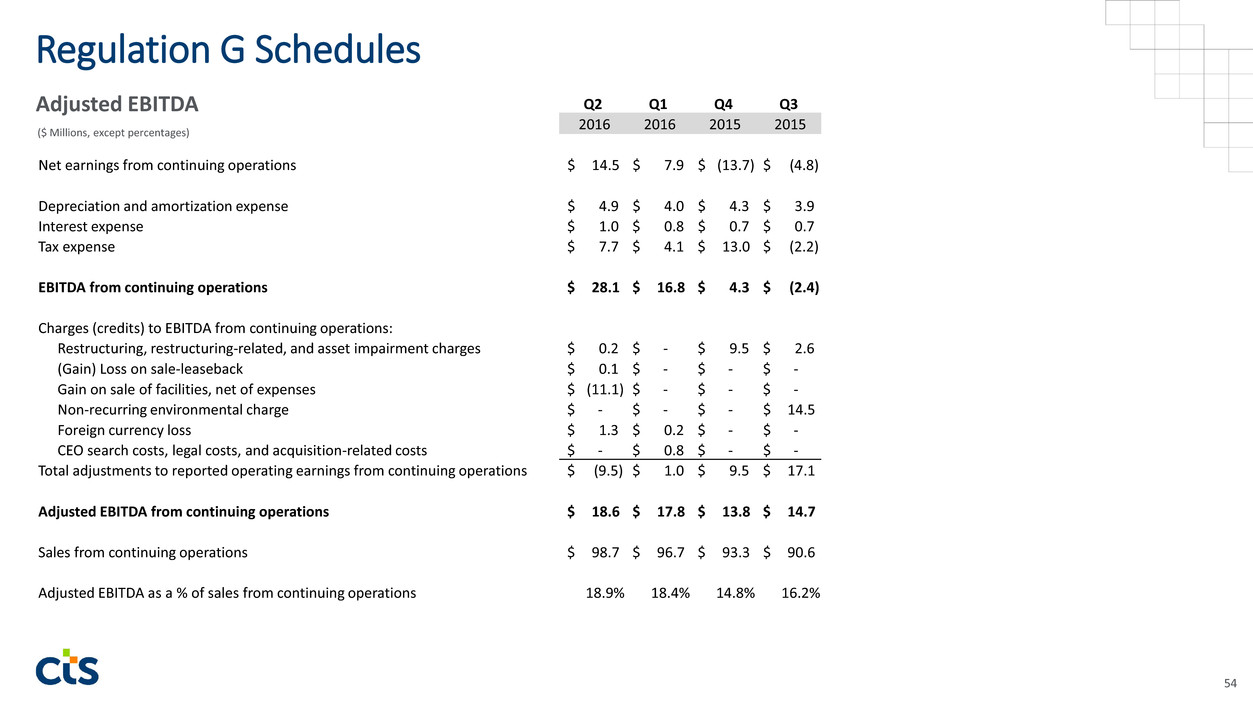
($ Millions, except percentages) Regulation G Schedules 54 Q2 Q1 Q4 Q3 2016 2016 2015 2015 Net earnings from continuing operations 14.5$ 7.9$ (13.7)$ (4.8)$ Depreciation and amortization expense 4.9$ 4.0$ 4.3$ 3.9$ Interest expense 1.0$ 0.8$ 0.7$ 0.7$ Tax expense 7.7$ 4.1$ 13.0$ (2.2)$ EBITDA from continuing operations 28.1$ 16.8$ 4.3$ (2.4)$ Charges (credits) to EBITDA from continuing operations: Restructuring, restructuring-related, and asset impairment charges 0.2$ -$ 9.5$ 2.6$ (Gain) Loss on sale-leaseback 0.1$ -$ -$ -$ Gain on sale of facilities, net of expenses (11.1)$ -$ -$ -$ Non-recurring environmental charge -$ -$ -$ 14.5$ Foreign currency loss 1.3$ 0.2$ -$ -$ CEO search costs, legal costs, and acquisition-related costs -$ 0.8$ -$ -$ Total adjustments to reported operating earnings from continuing operations (9.5)$ 1.0$ 9.5$ 17.1$ Adjusted EBITDA from continuing operations 18.6$ 17.8$ 13.8$ 14.7$ Sales from continuing operations 98.7$ 96.7$ 93.3$ 90.6$ Adjusted EBITDA as a % of sales from continuing operations 18.9% 18.4% 14.8% 16.2% Adjusted EBITDA


