
| January 2004 www.ctscorp.com |

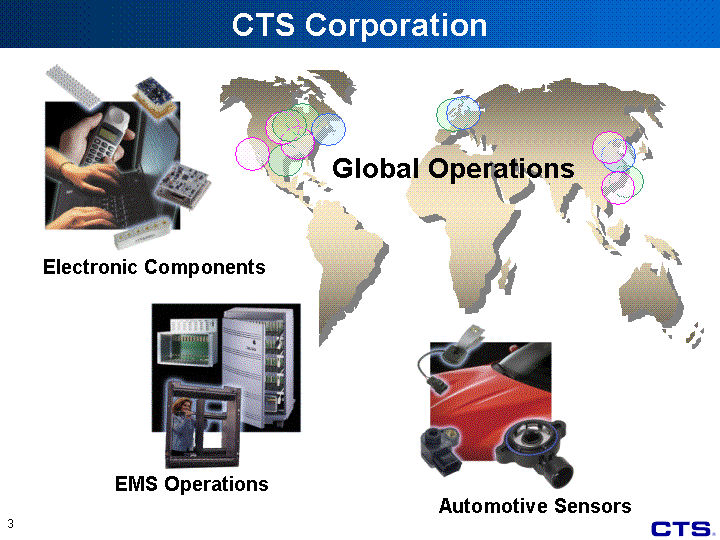
| CTS Corporation Automotive Sensors EMS Operations Electronic Components Global Operations |
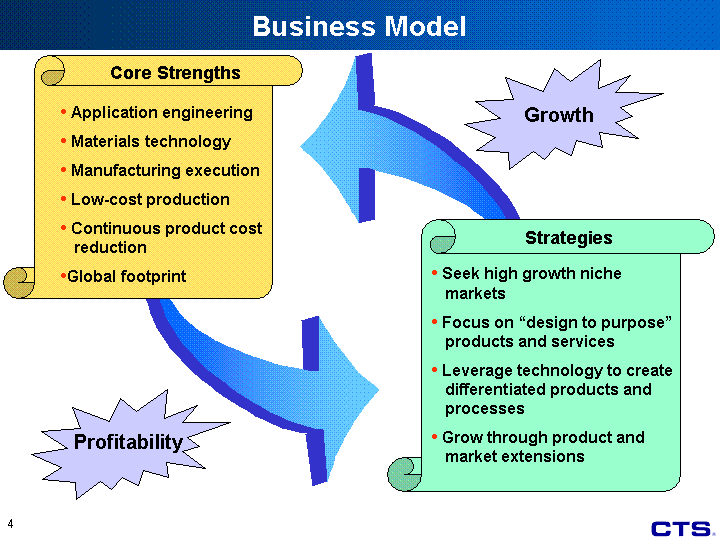
| Business Model Profitability Growth Strategies Seek high growth niche markets Focus on "design to purpose" products and services Leverage technology to create differentiated products and processes Grow through product and market extensions Core Strengths Application engineering Materials technology Manufacturing execution Low-cost production Continuous product cost reduction Global footprint |

| Segments Automotive Communications Mobile Computer Communications Infrastructure Other Segments and Markets Sensors and Electronic Components Electronics Manufacturing Services Markets 56% 44% 7% 39% 11% 27% 16% 2003 Projected |
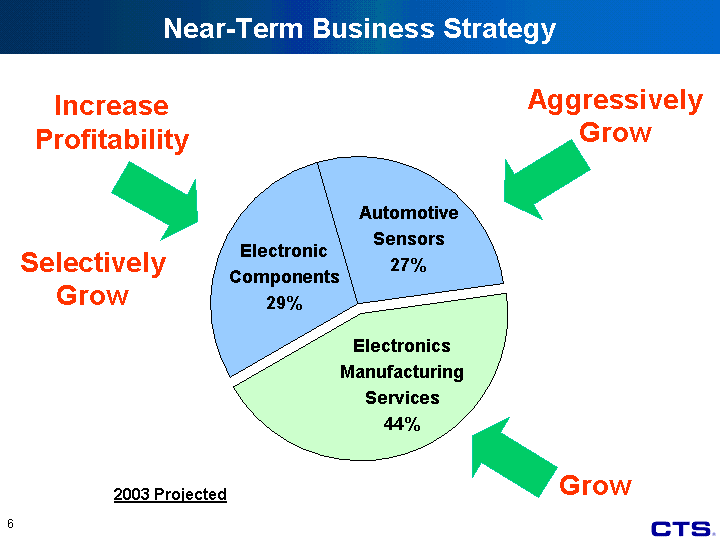
| Near-Term Business Strategy Communications Electronics $96M - 37% Other * $7M - 2% Automotive 23% Resistor/Electro 11% North America 53% Aggressively Grow Grow Increase Profitability Electronic Components Automotive Sensors Electronic Manufacturing Services 0.29 0.27 0.44 Electronics Manufacturing Services 44% Electronic Components 29% Automotive Sensors 27% Selectively Grow 2003 Projected |

| Five-Year Business Growth Targets Automotive Sensors Electronic Components Electronics Manufacturing Services 15 - 20% 3 - 6% 5 - 10% 5 - 10% 3 - 6% 5 - 10% 7 - 10% Market Growth Sales Growth Overall Product/Market Area $650 - $750 million in sales 8 - 10 % Operating Earnings as % of Sales Gross Margins Flat Improving Flat Improving |

| New Products Drive Earnings Growth 2001 2002 2003 2004 2005 2 Q3 Q4 Q5 Actual 0.2 3.2 13.4 0 0 Forecast 5.7 37.7 82.8 Forecast Actual* Belt Tension Sensors Integrated Accelerator Pedals Manifold Actuators Small Engine Throttle Position Sensors Frequency Modules ClearONE(tm) Terminators Pointing Stick Modules (with Touchpads) Expected to Add $10+ Million in Operating Earnings by 2005 * through Q3 2003 |

| Automotive Sensors Growth Strategy Aggressively expand product base. Leverage product/market strength into Asian market. 2002 2007 $116 M $240+ M Double sales in Five years! Sales Growth Unit growth ( N.A. & Eur.) 1 - 3 % Content growth ($/vehicle) 10 - 12 % Asian expansion 3 - 6 % Total (CAGR) 14 - 21 % |

| Growing Sensor Content 2001 2007 East 125 175 2001 2007 East 2.14 3.75 40% 75% Worldwide Market Sensor $ Content / Car Worldwide CTS Sensor $ Content / Car Eight new product categories in development pipeline. Growing customer penetration in Europe, Asia and with North American transplants. |

| Belt Tension Sensor Won 14 Platforms U.S. regulations require 100% of all new light vehicles to have enhanced occupancy sensing systems by 2006. CTS' Belt Tension Sensor provides superior measurement accuracy 2003 2004 2005 2006 2007 SAM 12.5 47 78 81 81 CTS Target Sales 1.9 11.5 19.9 22.3 24.2 Captured 1.9 11.3 15.7 16.3 17.2 Served Available Market $12.5 $47.0 $78.0 $81.0 $81.0 |
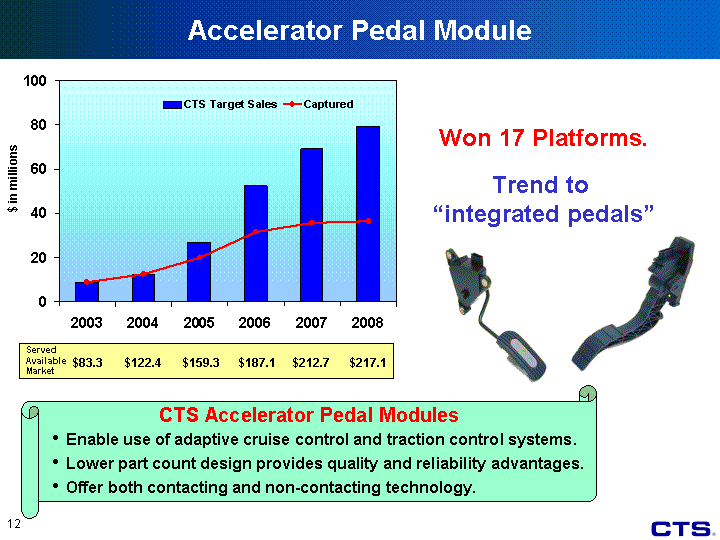
| Accelerator Pedal Module Enable use of adaptive cruise control and traction control systems. Lower part count design provides quality and reliability advantages. Offer both contacting and non-contacting technology. CTS Accelerator Pedal Modules 2003 2004 2005 2006 2007 2008 SAM 83.3 122.4 159.3 187.1 212.7 217.1 CTS Target Sales 8.8 12.3 27 52.5 69.2 79.4 Captured 8.8 12.3 20 31.4 35.6 36.5 Trend to "integrated pedals" $ in millions Won 17 Platforms. $83.3 $122.4 $159.3 $187.1 $212.7 $217.1 Served Available Market |

| Manifold Actuator Winning Positions on New Engines Trend toward active manifolds driven by: Lower emissions requirements. Improved vehicle performance. 30% of North American vehicles will have active manifolds by 2007. 2003 2004 2005 2006 2007 2008 SAM 41 45 64 90 98 106 CTS Target Sales 3.6 3.6 5.4 14.2 19 21.1 Captured 3.6 3.6 5.4 9 11.6 12.7 CTS' innovative solution provides performance and reliability advantages. $41.0 $45.0 $64.0 $90.0 $98.0 $106.0 Served Available Market |

| Asia Business Development - Automotive China Japan Taiwan Auto production projected to grow to 7M cars by 2008; >14% per year. Environmental regulations opening motorcycle market for electronic fuel injection controls; 14 million units per year. 2003 2004 2005 2006 2007 2008 Sales Growth 8.8 10.2 15.8 25.6 45.5 66.5 CTS Asia Region Sales (Projected) |
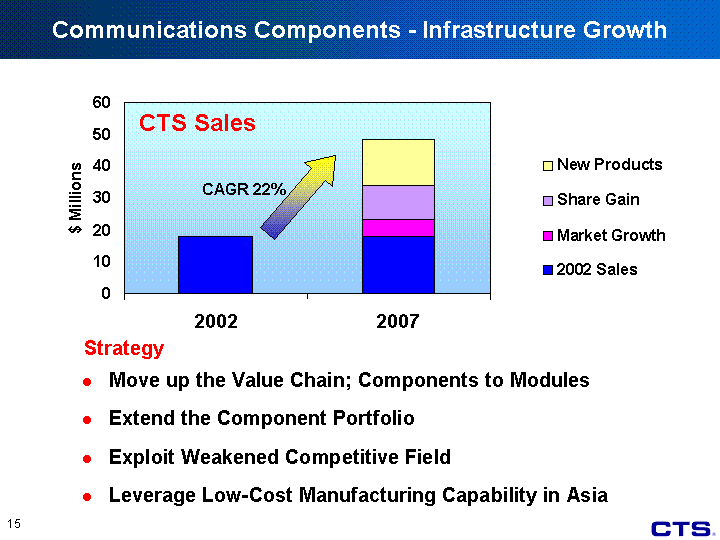
| Communications Components - Infrastructure Growth Move up the Value Chain; Components to Modules Extend the Component Portfolio Exploit Weakened Competitive Field Leverage Low-Cost Manufacturing Capability in Asia CAGR 22% CTS Sales Strategy |

| Communications Components - Infrastructure Growth 2002 2003 15.6 17.9 60+% win rate. Replaced competitors at four OEM and three EMS customers. 2002 2003 New Design Wins 2 33 New Design Wins Value-Added Modules Won 80% of value-added modules design opportunities in 2003. Growing Share In Custom Frequency Products 15% Growth |
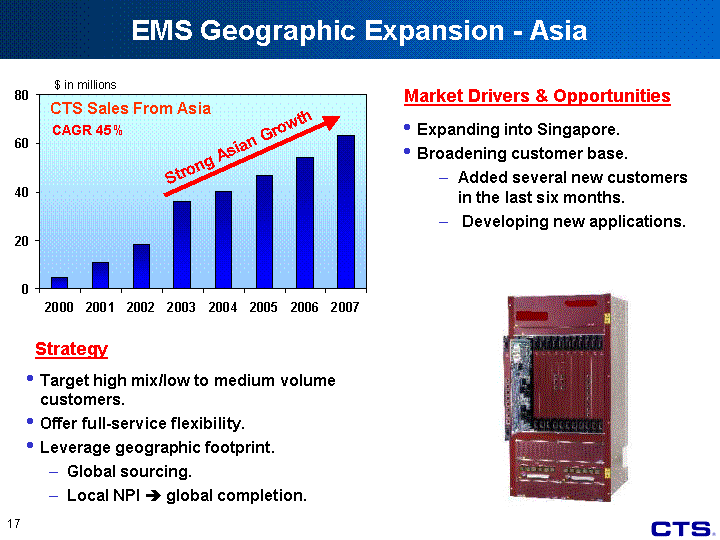
| EMS Geographic Expansion - Asia Market Drivers & Opportunities Expanding into Singapore. Broadening customer base. Added several new customers in the last six months. Developing new applications. 2000 2001 2002 2003 2004 2005 2006 2007 Asia 4.5 10.9 18 36 40.1 46.7 54.4 63.4 27.1 4.5 11.7 18.4 27.1 32.3 38.4 45.7 CTS Sales From Asia Target high mix/low to medium volume customers. Offer full-service flexibility. Leverage geographic footprint. Global sourcing. Local NPI ? global completion. Strategy $ in millions Strong Asian Growth CAGR 45% |
| CTS Corporation Financial Summary |
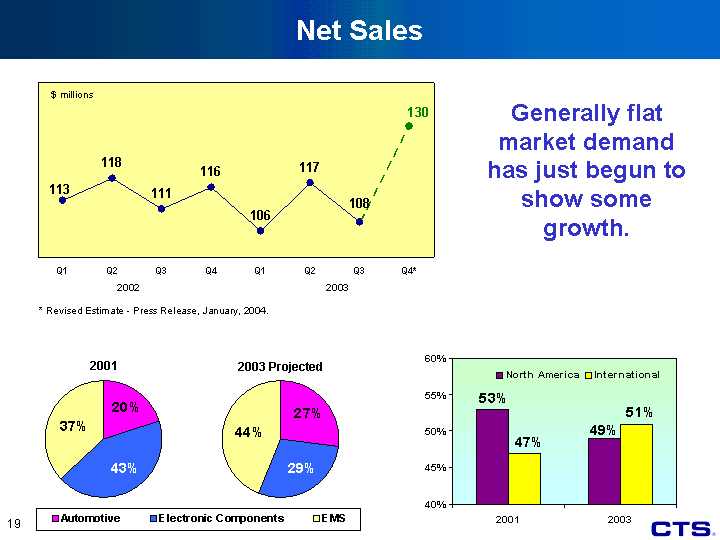
| Q4 Q1 Q2 Q3 Q4 Q1 Q2 Q3 Q4* East 126 113 118 111 116 106 117 108 130 Net Sales * Revised Estimate - Press Release, January, 2004. 2002 2003 $ millions Generally flat market demand has just begun to show some growth. Automotive Electronic Components EMS 2001 0.2 0.43 0.37 Automotive Electronic Components EMS 2003 Projected 0.27 0.29 0.44 2001 2003 Projected 2001 2003 North America 0.53 0.49 International 0.47 0.51 |

| Q4 Q1 Q2 Q3 Q4 Q1 Q2 Q3 Q4 ** -5.7 -3.6 -2.4 0 0.5 0.6 2 1.6 3.2 0.6 Improving Financial Performance 2002 Net Earnings/Loss (Adjusted*) 2003 (3.6) (2.4) 0.0 0.5 0.6 2.0 1.6 3.2 3.8 * Excludes all restructuring and related one-time charges, asset impairments, and unusual gains. ** Revised Estimate - Press Release, January, 2004. Gross Margins Up Approximately 1.5% Points Improved SG&A / Percent of Sales 0.5 - 1.0% Points Interest Expense / Percent of Sales Lowered by Approximately 0.5 - 1.0% Points |

| Cost Structure Overhaul Other 28% Interest 10% Salary/Fringes 50% Depreciation 12% East 28 10 50 12 West 30.6 38.6 34.6 31.6 North 45.9 46.9 45 43.9 Fixed Costs Reduced by $95M Per Year Other 28% Depreciation 12% Interest 10% Salary/Fringes 50% Breakeven Revenue Point Reduced to $440M Per Year Q1 Q2 Q3 Q4 2001 2002 $ in Millions 34% 38% Breakeven Revenue Fixed Costs 63 54 43 42 116 115 167 155 110 Q2/Current 2003 39 |
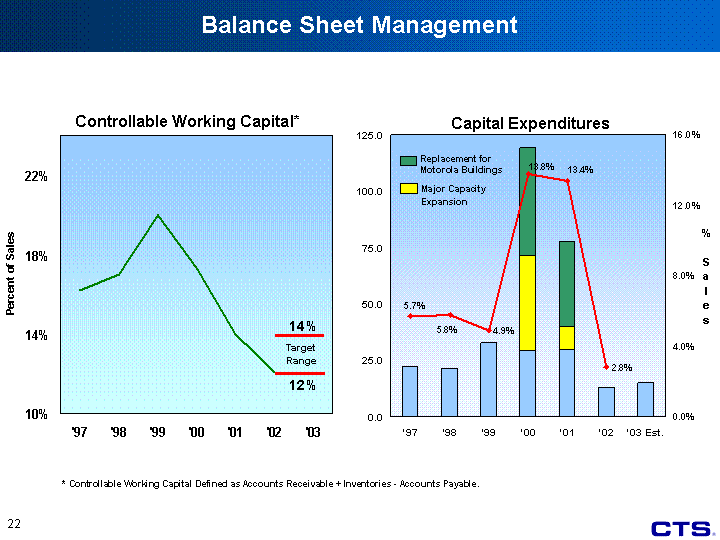
| Balance Sheet Management '97 '98 '99 '00 '01 '02 '03 Adjusted Working Capital 0.162 0.17 0.2 0.173 0.14 0.121 '96 '97 '98 '99 '00 '01 '02 '03 Est. Maintenance 17.2 22.4 21.3 32.9 29.35 29.8 12.8 15 Capacity Increase 42.293 10.1 Building 47.6 37.8 % to Sales 0.054 0.057 0.058 0.049 0.138 0.134 0.028 Controllable Working Capital* Capital Expenditures Replacement for Motorola Buildings Major Capacity Expansion * Controllable Working Capital Defined as Accounts Receivable + Inventories - Accounts Payable. Target Range 14% 12% |

| Capital Structure 1999 2000 2001 2002 Q1 2003 Q2 2003 Q3 2003 Sales 0.514 0.442 0.386 0.265 0.244 0.241 0.221 Debt to Capital Bank Debt IRB Convertible Sub Debt Equity 0.04 0.11 0.07 0.78 Debt Structure Convertible Sub Debt IRB Bank Credit Equity Leverage Ratio Within our Target Range of 20% - 30%. Balance Between Fixed and Floating Coupon. Varied Maturities. |
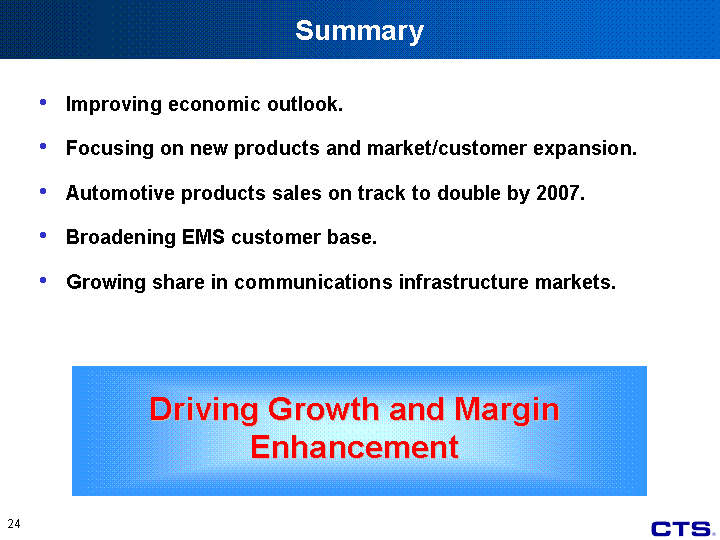
| Summary Improving economic outlook. Focusing on new products and market/customer expansion. Automotive products sales on track to double by 2007. Broadening EMS customer base. Growing share in communications infrastructure markets. Driving Growth and Margin Enhancement |
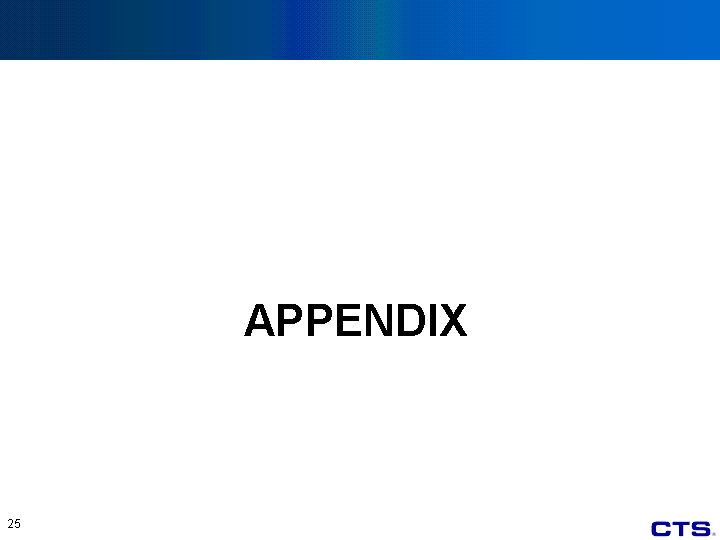
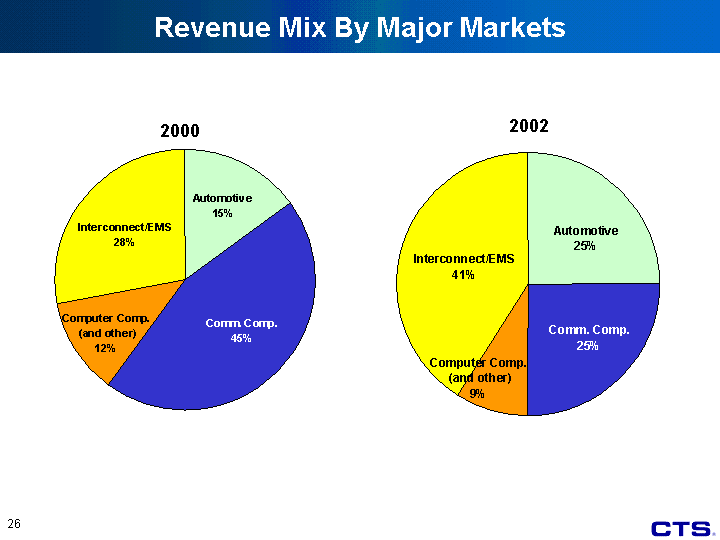
| Revenue Mix By Major Markets Automotive Comm. Comp. Computer Comp. (and other) Interconnect/EMS East 0.15 0.45 0.12 0.28 2000 Automotive Comm. Comp. Computer Comp. (and other) Interconnect/EMS East 0.25 0.25 0.09 0.41 2002 |
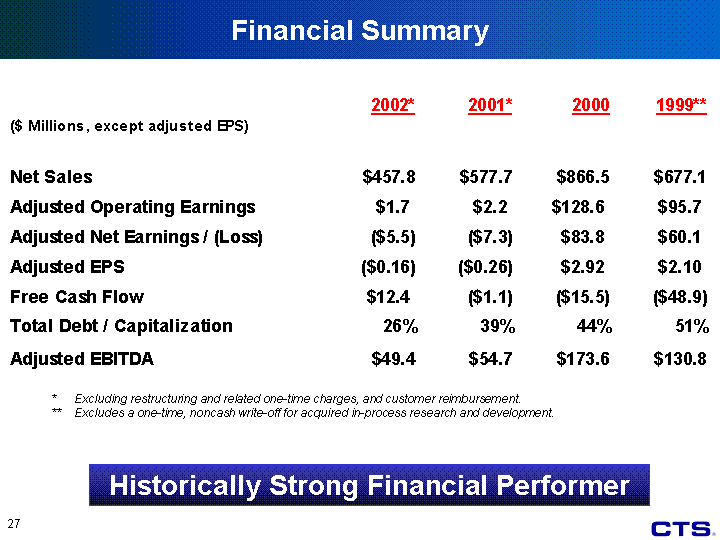
| Financial Summary * Excluding restructuring and related one-time charges, and customer reimbursement. ** Excludes a one-time, noncash write-off for acquired in-process research and development. Historically Strong Financial Performer |
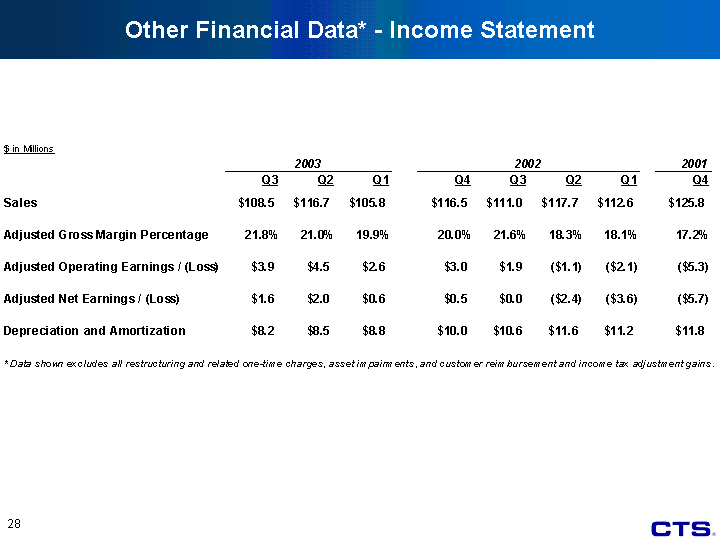
| Other Financial Data* - Income Statement |
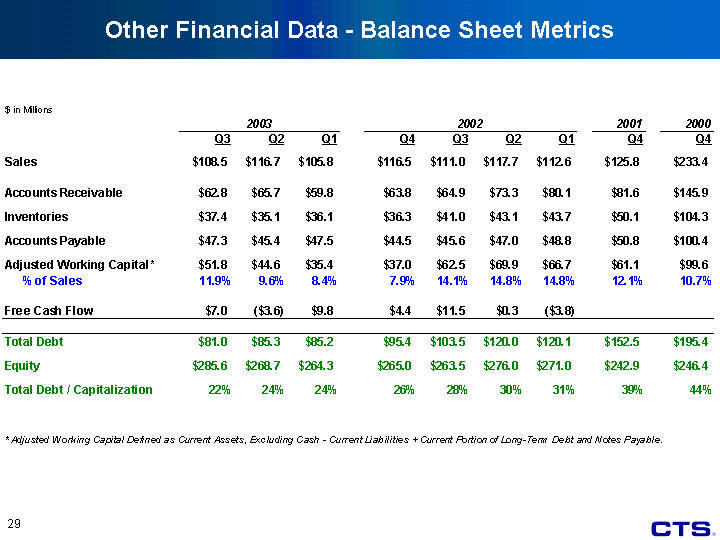
| Other Financial Data - Balance Sheet Metrics |
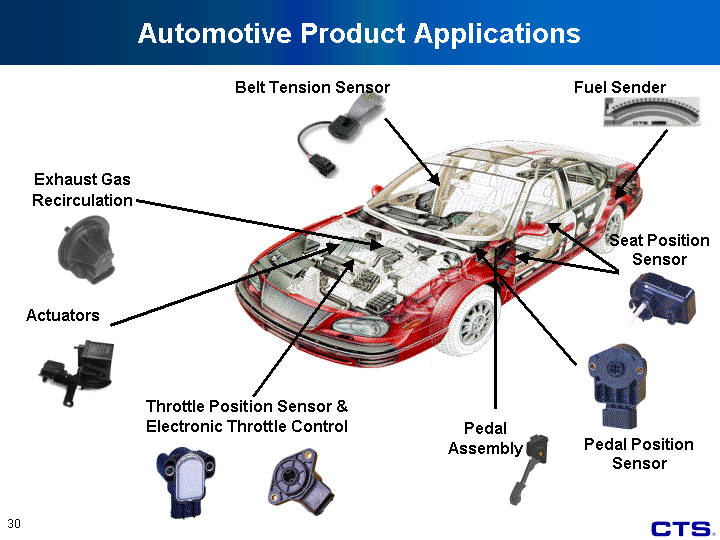
| Automotive Product Applications PPS Exhaust Gas Recirculation Actuators Seat Position Sensor Throttle Position Sensor & Electronic Throttle Control Pedal Assembly Pedal Position Sensor Belt Tension Sensor Fuel Sender |
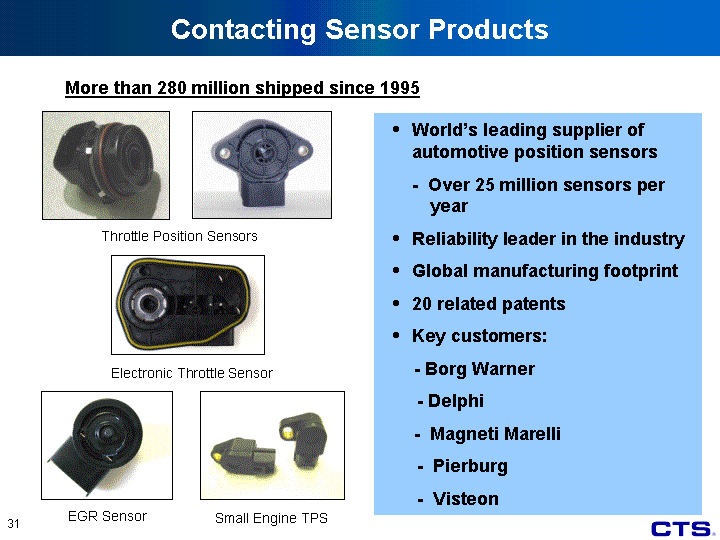
| More than 280 million shipped since 1995 Throttle Position Sensors EGR Sensor World's leading supplier of automotive position sensors - Over 25 million sensors per year Reliability leader in the industry Global manufacturing footprint 20 related patents Key customers: - Borg Warner - Delphi - Magneti Marelli - Pierburg - Visteon Contacting Sensor Products Small Engine TPS Electronic Throttle Sensor |
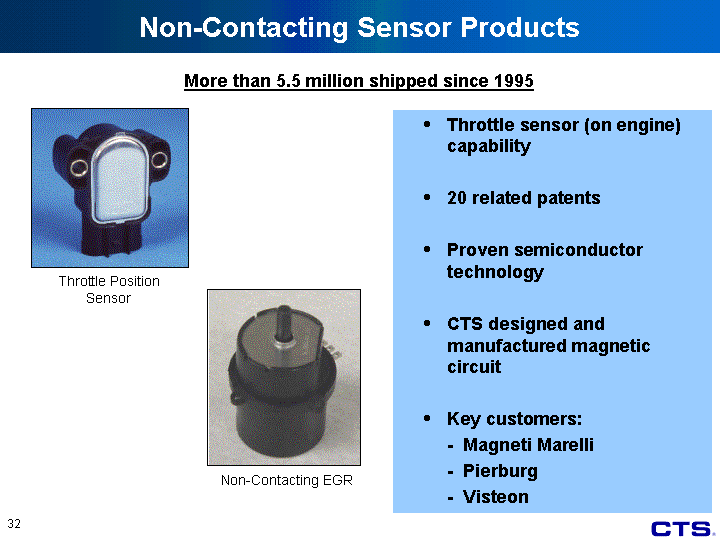
| Throttle sensor (on engine) capability 20 related patents Proven semiconductor technology CTS designed and manufactured magnetic circuit Key customers: - Magneti Marelli - Pierburg - Visteon More than 5.5 million shipped since 1995 Throttle Position Sensor Non-Contacting Sensor Products Non-Contacting EGR |
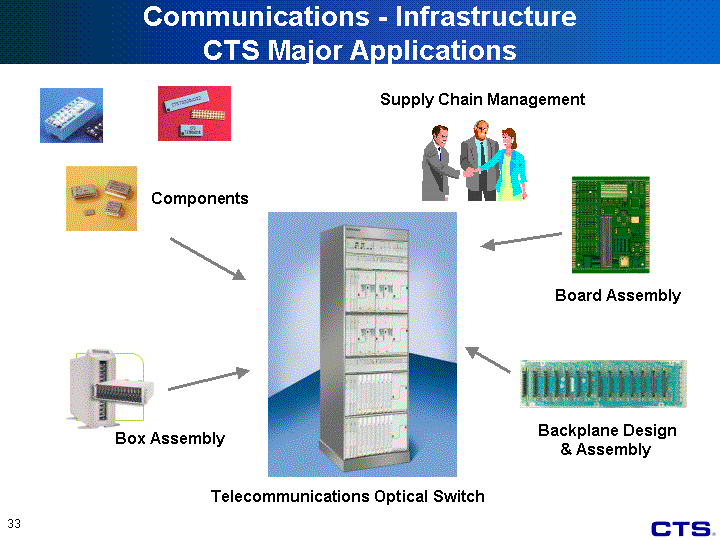
| Communications - Infrastructure CTS Major Applications Telecommunications Optical Switch Components Board Assembly Box Assembly Backplane Design & Assembly Supply Chain Management |
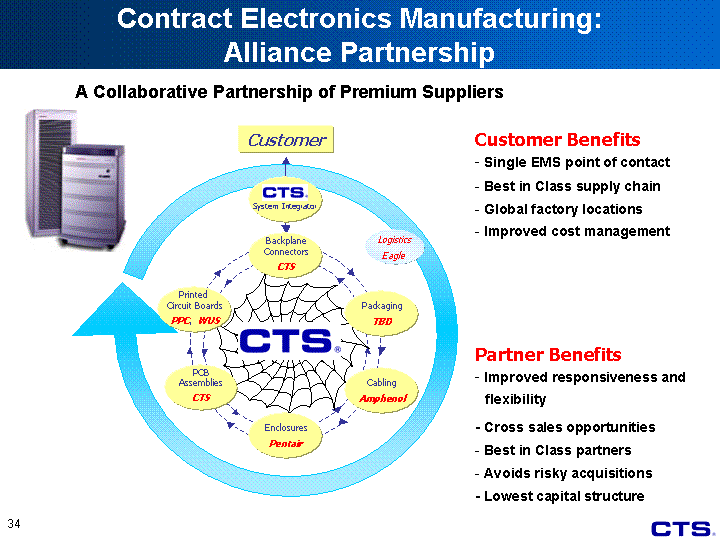
| Customer Logistics Eagle Printed Circuit Boards PPC, WUS Cabling Amphenol Enclosures Pentair Backplane Connectors CTS Packaging TBD PCB Assemblies CTS System Integrator Partner Benefits - - Improved responsiveness and flexibility - - Cross sales opportunities - - Best in Class partners - - Avoids risky acquisitions - - Lowest capital structure EMS: Alliance Partnership A Collaborative Partnership of Premium Suppliers Contract Electronics Manufacturing: Alliance Partnership Customer Benefits - - Single EMS point of contact - - Best in Class supply chain - - Global factory locations - - Improved cost management |
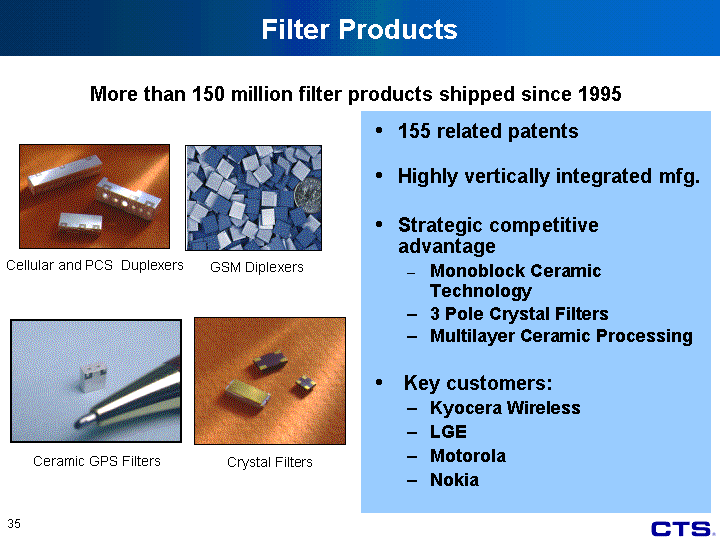
| 155 related patents Highly vertically integrated mfg. Strategic competitive advantage Monoblock Ceramic Technology 3 Pole Crystal Filters Multilayer Ceramic Processing Key customers: Kyocera Wireless LGE Motorola Nokia Ceramic GPS Filters GSM Diplexers Cellular and PCS Duplexers More than 150 million filter products shipped since 1995 Crystal Filters Filter Products |
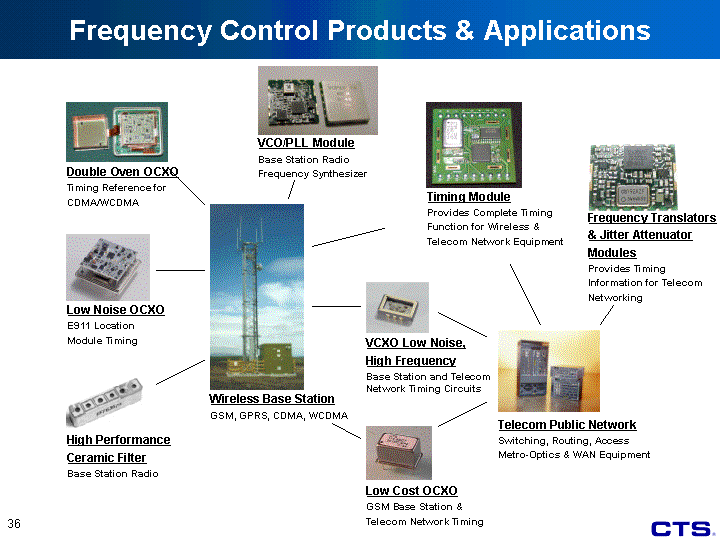
| Frequency Control Products & Applications Wireless Base Station GSM, GPRS, CDMA, WCDMA Telecom Public Network Switching, Routing, Access Metro-Optics & WAN Equipment Double Oven OCXO Timing Reference for CDMA/WCDMA Low Noise OCXO E911 Location Module Timing VCXO Low Noise, High Frequency Base Station and Telecom Network Timing Circuits High Performance Ceramic Filter Base Station Radio Low Cost OCXO GSM Base Station & Telecom Network Timing VCO/PLL Module Base Station Radio Frequency Synthesizer Timing Module Provides Complete Timing Function for Wireless & Telecom Network Equipment Frequency Translators & Jitter Attenuator Modules Provides Timing Information for Telecom Networking |
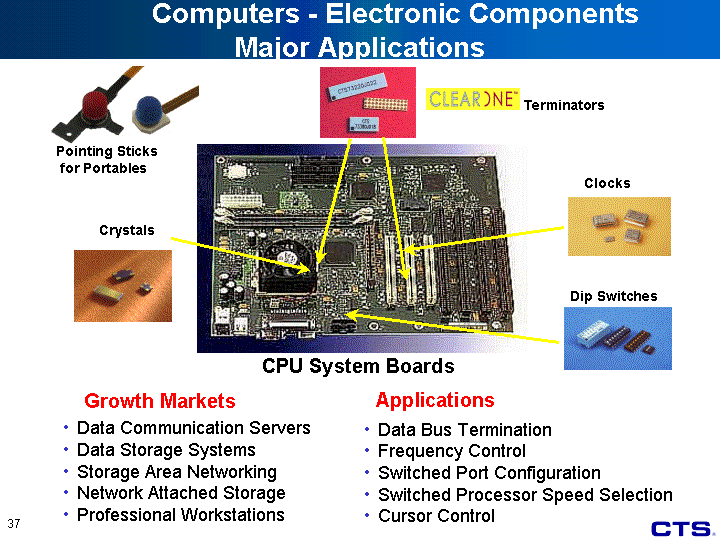
| Growth Markets Data Communication Servers Data Storage Systems Storage Area Networking Network Attached Storage Professional Workstations Applications Data Bus Termination Frequency Control Switched Port Configuration Switched Processor Speed Selection Cursor Control CPU System Boards Crystals Dip Switches Clocks ClearOne Terminators Pointing Sticks for Portables Computers - Electronic Components Major Applications |

| Leaded Leadless Ball Grid Array 50 related patents Thick film technology Molded ceramic reliability Key customers: - Alcatel - Cisco - Compaq - Lucent - Teradyne Billions shipped in 30 years of production Resistor Networks Products |
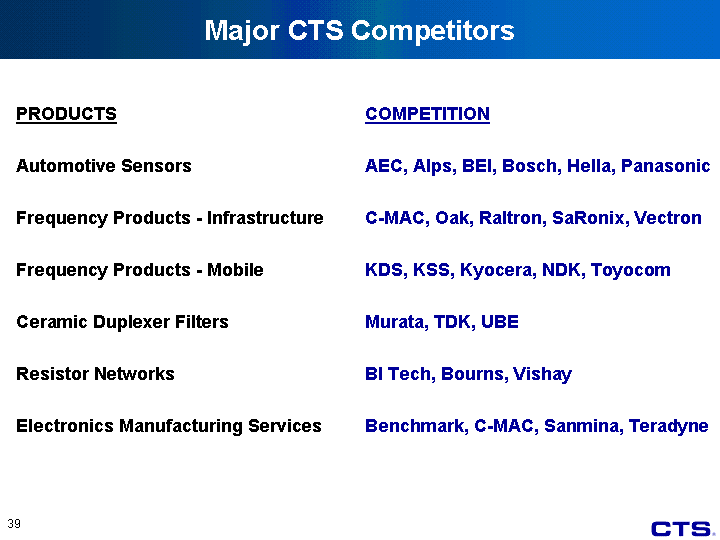
| Major CTS Competitors PRODUCTS Automotive Sensors Frequency Products - Infrastructure Frequency Products - Mobile Ceramic Duplexer Filters Resistor Networks Electronics Manufacturing Services COMPETITION AEC, Alps, BEI, Bosch, Hella, Panasonic C-MAC, Oak, Raltron, SaRonix, Vectron KDS, KSS, Kyocera, NDK, Toyocom Murata, TDK, UBE BI Tech, Bourns, Vishay Benchmark, C-MAC, Sanmina, Teradyne |
Appendix 1 Reconciliation of Non-GAAP Financial Measures
CTS Corporation
Sales
($ in millions)
| | | | | | | | | | | | | | | | | | | | | | | | | | | | | | | | | | | | | | | | | | | | | |
| | | 2003 | | 2002 | | 2001 |
| | |
| |
| |
|
| | | Q3 | | Q2 | | Q1 | | Q4 | | Q3 | | Q2 | | Q1 | | Q4 | | Q3 | | Q2 | | Q1 |
| | |
| |
| |
| |
| |
| |
| |
| |
| |
| |
| |
|
| Sales | | $ | 108.5 | | | $ | 116.7 | | | $ | 105.8 | | | $ | 116.5 | | | $ | 111.0 | | | $ | 117.7 | | | $ | 112.6 | | | $ | 125.8 | | | $ | 131.2 | | | $ | 143.7 | | | $ | 177.0 | |
[Additional columns below]
[Continued from above table, first column(s) repeated]
| | | | | | | | | | | | | | | | | |
| | | Full Year |
| | |
|
| | | 2002 | | 2001 | | 2000 | | 1999 |
| | |
| |
| |
| |
|
| Sales | | $ | 457.8 | | | $ | 577.7 | | | $ | 866.5 | | | $ | 677.1 | |
CTS Corporation
Reconciliation of Gross Margin to Adjusted Gross Margin
($ in millions)
| | | | | | | | | | | | | | | | | | | | | | | | | | | | | | | | | | |
| | | | 2003 | | 2002 | | 2001 |
| | | |
| |
| |
|
| | | | Q3 | | Q2 | | Q1 | | Q4 | | Q3 | | Q2 | | Q1 | | Q4 |
| | | |
| |
| |
| |
| |
| |
| |
| |
|
| Gross margin | | $ | 23.7 | | | $ | 24.5 | | | $ | 21.1 | | | $ | 23.3 | | | $ | 23.9 | | | $ | 21.1 | | | $ | 22.7 | | | $ | 19.3 | |
| Charges (credits) to reported gross margin: | | | | | | | | | | | | | | | | | | | | | | | | | | | | | | | | |
| | Restructuring-related, one-time charges | | | | | | | | | | | | | | | | | | | 0.1 | | | | 0.4 | | | | 0.8 | | | | 2.4 | |
| | Customer reimbursement | | | | | | | | | | | | | | | | | | | | | | | | | | | (3.1 | ) | | | | |
| | | |
| | | |
| | | |
| | | |
| | | |
| | | |
| | | |
| | | |
| |
| Total adjustments to reported gross margin | | | — | | | | — | | | | — | | | | — | | | | 0.1 | | | | 0.4 | | | | (2.3 | ) | | | 2.4 | |
| | | |
| | | |
| | | |
| | | |
| | | |
| | | |
| | | |
| | | |
| |
| Adjusted gross margin | | $ | 23.7 | | | $ | 24.5 | | | $ | 21.1 | | | $ | 23.3 | | | $ | 24.0 | | | $ | 21.5 | | | $ | 20.4 | | | $ | 21.7 | |
| | | |
| | | |
| | | |
| | | |
| | | |
| | | |
| | | |
| | | |
| |
CTS Corporation
Reconciliation of Gross Margin Percentage to Adjusted Gross Margin Percentage
| | | | | | | | | | | | | | | | | | | | | | | | | | | | | | | | | | |
| | | | 2003 | | 2002 | | 2001 |
| | | |
| |
| |
|
| | | | Q3 | | Q2 | | Q1 | | Q4 | | Q3 | | Q2 | | Q1 | | Q4 |
| | | |
| |
| |
| |
| |
| |
| |
| |
|
| Gross margin percentage | | | 21.8 | % | | | 21.0 | % | | | 19.9 | % | | | 20.0 | % | | | 21.5 | % | | | 17.9 | % | | | 20.2 | % | | | 15.3 | % |
| Charges (credits) to reported gross margin percentage: | | | | | | | | | | | | | | | | | | | | | | | | | | | | | | | | |
| | Restructuring-related, one-time charges | | | | | | | | | | | | | | | | | | | 0.1 | % | | | 0.4 | % | | | 0.7 | % | | | 1.9 | % |
| | Customer reimbursement | | | | | | | | | | | | | | | | | | | | | | | | | | | -2.8 | % | | | | |
| | | |
| | | |
| | | |
| | | |
| | | |
| | | |
| | | |
| | | |
| |
| Total adjustments to reported gross margin percentage | | | 0.0 | % | | | 0.0 | % | | | 0.0 | % | | | 0.0 | % | | | 0.1 | % | | | 0.4 | % | | | -2.1 | % | | | 1.9 | % |
| | | |
| | | |
| | | |
| | | |
| | | |
| | | |
| | | |
| | | |
| |
| Adjusted gross margin percentage | | | 21.8 | % | | | 21.0 | % | | | 19.9 | % | | | 20.0 | % | | | 21.6 | % | | | 18.3 | % | | | 18.1 | % | | | 17.2 | % |
| | | |
| | | |
| | | |
| | | |
| | | |
| | | |
| | | |
| | | |
| |
CTS Corporation
Reconciliation of Operating Expenses to Adjusted Operating Expenses
($ in millions)
| | | | | | | | | | | | | | | | | | | | | | | | | | | | | | | | | | |
| | | | 2003 | | 2002 | | 2001 |
| | | |
| |
| |
|
| | | | Q3 | | Q2 | | Q1 | | Q4 | | Q3 | | Q2 | | Q1 | | Q4 |
| | | |
| |
| |
| |
| |
| |
| |
| |
|
| Selling, general and administrative expenses | | $ | 14.7 | | | $ | 14.6 | | | $ | 12.9 | | | $ | 14.8 | | | $ | 16.6 | | | $ | 16.6 | | | $ | 15.3 | | | $ | 19.5 | |
| Research and development expenses | | | 5.1 | | | | 5.4 | | | | 5.6 | | | | 5.6 | | | | 5.4 | | | | 6.0 | | | | 7.2 | | | | 7.4 | |
| Restructuring and impairment charges | | | 4.6 | | | | | | | | | | | | | | | | 18.3 | | | | | | | | | | | | 26.0 | |
| | | |
| | | |
| | | |
| | | |
| | | |
| | | |
| | | |
| | | |
| |
| | Total reported operating expenses | | | 24.4 | | | | 20.0 | | | | 18.5 | | | | 20.4 | | | | 40.3 | | | | 22.6 | | | | 22.5 | | | | 52.9 | |
| | | |
| | | |
| | | |
| | | |
| | | |
| | | |
| | | |
| | | |
| |
| Less restructuring and impairment charges | | | 4.6 | | | | | | | | | | | | | | | | 18.3 | | | | | | | | | | | | 26.0 | |
| | | |
| | | |
| | | |
| | | |
| | | |
| | | |
| | | |
| | | |
| |
| Adjusted operating expenses | | $ | 19.8 | | | $ | 20.0 | | | $ | 18.5 | | | $ | 20.4 | | | $ | 22.0 | | | $ | 22.6 | | | $ | 22.5 | | | $ | 26.9 | |
| | | |
| | | |
| | | |
| | | |
| | | |
| | | |
| | | |
| | | |
| |
CTS Corporation
Reconciliation of Operating Earnings (Loss) to Adjusted Operating Earnings (Loss)
($ in millions)
| | | | | | | | | | | | | | | | | | | | | | | | | | | | | | | | | | | | | | | | | | | | | | |
| | | | 2003 | | 2002 | | 2001 |
| | | |
| |
| |
|
| | | | Q3 | | Q2 | | Q1 | | Q4 | | Q3 | | Q2 | | Q1 | | Q4 | | Q3 | | Q2 | | Q1 |
| | | |
| |
| |
| |
| |
| |
| |
| |
| |
| |
| |
|
| Operating earnings (loss) | | $ | (0.7 | ) | | $ | 4.5 | | | $ | 2.6 | | | $ | 3.0 | | | $ | (16.5 | ) | | $ | (1.5 | ) | | $ | 0.2 | | | $ | (33.7 | ) | | $ | (0.9 | ) | | $ | (19.7 | ) | | $ | 5.8 | |
| Charges (credits) to reported operating earnings (loss): | | | | | | | | | | | | | | | | | | | | | | | | | | | | | | | | | | | | | | | | | | | | |
| | Restructuring and asset impairment charges | | | 4.6 | | | | | | | | | | | | | | | | 18.3 | | | | | | | | | | | | 26.0 | | | | | | | | 14.0 | | | | | |
| | Restructuring-related, one-time charges | | | | | | | | | | | | | | | | | | | 0.1 | | | | 0.4 | | | | 0.8 | | | | 2.4 | | | | 0.8 | | | | 5.4 | | | | 2.1 | |
| | Customer reimbursement | | | | | | | | | | | | | | | | | | | | | | | | | | | (3.1 | ) | | | | | | | | | | | | | | | | |
| | Acquired in-process research and development | | | | | | | | | | | | | | | | | | | | | | | | | | | | | | | | | | | | | | | | | | | | |
| | | |
| | | |
| | | |
| | | |
| | | |
| | | |
| | | |
| | | |
| | | |
| | | |
| | | |
| |
| Total adjustments to reported operating earnings (loss) | | | 4.6 | | | | — | | | | — | | | | — | | | | 18.4 | | | | 0.4 | | | | (2.3 | ) | | | 28.4 | | | | 0.8 | | | | 19.4 | | | | 2.1 | |
| | | |
| | | |
| | | |
| | | |
| | | |
| | | |
| | | |
| | | |
| | | |
| | | |
| | | |
| |
| Adjusted operating earnings (loss) | | $ | 3.9 | | | $ | 4.5 | | | $ | 2.6 | | | $ | 3.0 | | | $ | 1.9 | | | $ | (1.1 | ) | | $ | (2.1 | ) | | $ | (5.3 | ) | | $ | (0.1 | ) | | $ | (0.3 | ) | | $ | 7.9 | |
| | | |
| | | |
| | | |
| | | |
| | | |
| | | |
| | | |
| | | |
| | | |
| | | |
| | | |
| |
[Additional columns below]
[Continued from above table, first column(s) repeated]
| | | | | | | | | | | | | | | | | | |
| | | | Full Year |
| | | |
|
| | | | 2002 | | 2001 | | 2000 | | 1999 |
| | | |
| |
| |
| |
|
| Operating earnings (loss) | | $ | (14.8 | ) | | $ | (48.5 | ) | | $ | 128.6 | | | $ | 82.8 | |
| Charges (credits) to reported operating earnings (loss): | | | | | | | | | | | | | | | | |
| | Restructuring and asset impairment charges | | | 18.3 | | | | 40.0 | | | | | | | | | |
| | Restructuring-related, one-time charges | | | 1.3 | | | | 10.7 | | | | | | | | | |
| | Customer reimbursement | | | (3.1 | ) | | | | | | | | | | | | |
| | Acquired in-process research and development | | | | | | | | | | | | | | | 12.9 | |
| | | |
| | | |
| | | |
| | | |
| |
| Total adjustments to reported operating earnings (loss) | | | 16.5 | | | | 50.7 | | | | — | | | | — | |
| | | |
| | | |
| | | |
| | | |
| |
| Adjusted operating earnings (loss) | | $ | 1.7 | | | $ | 2.2 | | | $ | 128.6 | | | $ | 95.7 | |
| | | |
| | | |
| | | |
| | | |
| |
CTS Corporation
Reconciliation of Net Earnings (Loss) to Adjusted Net Earnings (Loss)
($ in millions)
| | | | | | | | | | | | | | | | | | | | | | | | | | | | | | | | | | | | | | | | | | | | | | |
| | | | 2003 | | 2002 | | 2001 |
| | | |
| |
| |
|
| | | | Q3 | | Q2 | | Q1 | | Q4 | | Q3 | | Q2 | | Q1 | | Q4 | | Q3 | | Q2 | | Q1 |
| | | |
| |
| |
| |
| |
| |
| |
| |
| |
| |
| |
|
| Net earnings (loss) | | $ | 6.1 | | | $ | 2.0 | | | $ | 0.6 | | | $ | 0.5 | | | $ | (13.8 | ) | | $ | (2.7 | ) | | $ | (1.9 | ) | | $ | (27.0 | ) | | $ | (2.9 | ) | | $ | (17.2 | ) | | $ | 1.7 | |
| Charges (credits) to reported net earnings (loss): | | | | | | | | | | | | | | | | | | | | | | | | | | | | | | | | | | | | | | | | | | | | |
| | Restructuring and asset impairment charges | | | 4.6 | | | | | | | | | | | | | | | | 18.3 | | | | | | | | | | | | 26.0 | | | | | | | | 14.0 | | | | | |
| | Restructuring-related, one-time charges | | | | | | | | | | | | | | | | | | | 0.1 | | | | 0.4 | | | | 0.8 | | | | 2.4 | | | | 0.8 | | | | 5.4 | | | | 2.1 | |
| | Customer reimbursement | | | | | | | | | | | | | | | | | | | | | | | | | | | (3.1 | ) | | | | | | | | | | | | | | | | |
| | Acquired in-process research and development | | | | | | | | | | | | | | | | | | | | | | | | | | | | | | | | | | | | | | | | | | | | |
| | | |
| | | |
| | | |
| | | |
| | | |
| | | |
| | | |
| | | |
| | | |
| | | |
| | | |
| |
| Total adjustments to reported net earnings (loss) | | | 4.6 | | | | — | | | | — | | | | — | | | | 18.4 | | | | 0.4 | | | | (2.3 | ) | | | 28.4 | | | | 0.8 | | | | 19.4 | | | | 2.1 | |
| Total adjustments, tax affected | | | 3.4 | | | | — | | | | — | | | | — | | | | 13.8 | | | | 0.3 | | | | (1.7 | ) | | | 21.3 | | | | 0.6 | | | | 14.6 | | | | 1.6 | |
| Reversal of tax reserve | | | (7.9 | ) | | | | | | | | | | | | | | | | | | | | | | | | | | | | | | | | | | | | | | | | |
| | | |
| | | |
| | | |
| | | |
| | | |
| | | |
| | | |
| | | |
| | | |
| | | |
| | | |
| |
| Adjusted net earnings (loss) | | $ | 1.6 | | | $ | 2.0 | | | $ | 0.6 | | | $ | 0.5 | | | $ | 0.0 | | | $ | (2.4 | ) | | $ | (3.6 | ) | | $ | (5.7 | ) | | $ | (2.3 | ) | | $ | (2.6 | ) | | $ | 3.3 | |
| | | |
| | | |
| | | |
| | | |
| | | |
| | | |
| | | |
| | | |
| | | |
| | | |
| | | |
| |
[Additional columns below]
[Continued from above table, first column(s) repeated]
| | | | | | | | | | | | | | | | | | |
| | | | Full Year |
| | | |
|
| | | | 2002 | | 2001 | | 2000 | | 1999 |
| | | |
| |
| |
| |
|
| Net earnings (loss) | | $ | (17.9 | ) | | $ | (45.4 | ) | | $ | 83.8 | | | $ | 51.5 | |
| Charges (credits) to reported net earnings (loss): | | | | | | | | | | | | | | | | |
| | Restructuring and asset impairment charges | | | 18.3 | | | | 40.0 | | | | | | | | | |
| | Restructuring-related, one-time charges | | | 1.3 | | | | 10.7 | | | | | | | | | |
| | Customer reimbursement | | | (3.1 | ) | | | | | | | | | | | | |
| | Acquired in-process research and development | | | | | | | | | | | | | | | 12.9 | |
| | | |
| | | |
| | | |
| | | |
| |
| Total adjustments to reported net earnings (loss) | | | 16.5 | | | | 50.7 | | | | | | | | 12.9 | |
| Total adjustments, tax affected | | | 12.4 | | | | 38.0 | | | | | | | | 8.6 | |
| Reversal of tax reserve | | | | | | | | | | | | | | | | |
| | | |
| | | |
| | | |
| | | |
| |
| Adjusted net earnings (loss) | | $ | (5.5 | ) | | $ | (7.3 | ) | | $ | 83.8 | | | $ | 60.1 | |
| | | |
| | | |
| | | |
| | | |
| |
CTS Corporation
Reconciliation of Earnings Per Share to Adjusted Earnings Per Share
| | | | | | | | | | | | | | | | | | | | | | | | | | | | | | |
| | | | 2003 | | | | | | | | | | Full Year | | | | | | |
| | | |
| | | | | | | | | |
| | | | | | |
| | | | Q3 | | 2002 | | 2001 | | 2000 | | 1999 | | 1998 | | 1997 |
| | | |
| |
| |
| |
| |
| |
| |
|
| Earnings per share | | $ | 0.17 | | | $ | (0.54 | ) | | $ | (1.61 | ) | | $ | 2.92 | | | $ | 1.80 | | | $ | 1.28 | | | $ | 0.72 | |
| Tax affected charges (credits) to reported earnings per share: | | | | | | | | | | | | | | | | | | | | | | | | | | | | |
| | Restructuring and asset impairment charges | | | 0.10 | | | | 0.42 | | | | 1.07 | | | | | | | | | | | | | | | | | |
| | Restructuring-related, one-time charges | | | | | | | 0.03 | | | | 0.28 | | | | | | | | | | | | | | | | | |
| | Customer reimbursement | | | | | | | (0.07 | ) | | | | | | | | | | | | | | | | | | | | |
| | Acquired in-process research and development | | | | | | | | | | | | | | | | | | | 0.30 | | | | | | | | | |
| | | |
| | | |
| | | |
| | | |
| | | |
| | | |
| | | |
| |
| Total tax affected adjustments to reported earnings per share | | | 0.10 | | | | 0.38 | | | | 1.35 | | | | — | | | | 0.30 | | | | — | | | | — | |
| Reduction of tax reserve earnings per share adjustment | | | 0.22 | | | | | | | | | | | | | | | | | | | | | | | | | |
| | | |
| | | |
| | | |
| | | |
| | | |
| | | |
| | | |
| |
| Adjusted earnings per share | | $ | 0.05 | | | $ | (0.16 | ) | | $ | (0.26 | ) | | $ | 2.92 | | | $ | 2.10 | | | $ | 1.28 | | | $ | 0.72 | |
| | | |
| | | |
| | | |
| | | |
| | | |
| | | |
| | | |
| |
CTS Corporation
EBITDA
($ in millions)
Our EBITDA calculation has been revised to reflect guidance published by the Division
of Corporation Finance of the U.S. Securities and Exchange Commission in June 2003.
| | | | | | | | | | | | | | | | | | |
| | | | Full Year |
| | | |
|
| | | | 2002 | | 2001 | | 2000 | | 1999 |
| | | |
| |
| |
| |
|
| Net earnings (loss) | | $ | (17.9 | ) | | $ | (45.4 | ) | | $ | 83.8 | | | $ | 51.5 | |
| Depreciation and amortization expense | | | 43.4 | | | | 51.7 | | | | 44.3 | | | | 33.9 | |
| Interest expense | | | 10.2 | | | | 12.8 | | | | 13.1 | | | | 9.9 | |
| Tax expense (benefit) | | | (5.9 | ) | | | (15.1 | ) | | | 32.4 | | | | 22.6 | |
| | | |
| | | |
| | | |
| | | |
| |
| EBITDA | | $ | 29.8 | | | $ | 4.0 | | | $ | 173.6 | | | $ | 117.9 | |
| | | |
| | | |
| | | |
| | | |
| |
| Charges (credits) to reported EBITDA: | | | | | | | | | | | | | | | | |
| | Restructuring and asset impairment charges | | | 18.3 | | | | 40.0 | | | | — | | | | — | |
| | Restructuring-related, one-time charges | | | 1.3 | | | | 10.7 | | | | — | | | | — | |
| | Acquired in-process research and development | | | — | | | | — | | | | — | | | | 12.9 | |
| | | |
| | | |
| | | |
| | | |
| |
| Total adjustments to reported EBITDA | | | 19.6 | | | | 50.7 | | | | — | | | | 12.9 | |
| | | |
| | | |
| | | |
| | | |
| |
| Adjusted EBITDA | | $ | 49.4 | | | $ | 54.7 | | | $ | 173.6 | | | $ | 130.8 | |
| | | |
| | | |
| | | |
| | | |
| |
CTS Corporation
Free Cash Flow
($ in millions)
| | | | | | | | | | | | | | | | | | | | | | | | | | | | | | | | | | | | | | | | | | | | | |
| | | 2003 | | 2002 | | Full Year |
| | |
| |
| |
|
| | | Q3 | | Q2 | | Q1 | | Q4 | | Q3 | | Q2 | | Q1 | | 2002 | | 2001 | | 2000 | | 1999 |
| | |
| |
| |
| |
| |
| |
| |
| |
| |
| |
| |
|
| Cash flows provided from (used by) operations | | $ | 8.6 | | | $ | (1.3 | ) | | $ | 8.2 | | | $ | 5.3 | | | $ | 14.4 | | | $ | 2.0 | | | $ | 0.7 | | | $ | 22.4 | | | $ | 65.8 | | | $ | 110.8 | | | $ | 55.7 | |
| Cash flows provided from (used by) investing activities | | | (1.6 | ) | | | (2.3 | ) | | | 1.6 | | | | (0.9 | ) | | | (2.9 | ) | | | (1.7 | ) | | | (4.5 | ) | | | (10.0 | ) | | | (66.9 | ) | | | (126.3 | ) | | | (104.6 | ) |
| | | |
| | | |
| | | |
| | | |
| | | |
| | | |
| | | |
| | | |
| | | |
| | | |
| | | |
| |
| Free cash flow | | $ | 7.0 | | | $ | (3.6 | ) | | $ | 9.8 | | | $ | 4.4 | | | $ | 11.5 | | | $ | 0.3 | | | $ | (3.8 | ) | | $ | 12.4 | | | $ | (1.1 | ) | | $ | (15.5 | ) | | $ | (48.9 | ) |
| | | |
| | | |
| | | |
| | | |
| | | |
| | | |
| | | |
| | | |
| | | |
| | | |
| | | |
| |
CTS Corporation
Definition of Financial Terms — “Total Debt to Capitalization”
($ in millions)
| | | | | | | | | | | | | | | | | | | | | | | | | | | | | |
| | | 2003 | | 2002 |
| | |
| |
|
| | | Q3 | | Q2 | | Q1 | | Q4 | | Q3 | | Q2 | | Q1 |
| | |
| |
| |
| |
| |
| |
| |
|
| Notes payable | | $ | — | | | $ | — | | | $ | — | | | $ | — | | | $ | — | | | $ | — | | | $ | 1.4 | |
| Current portion of long-term debt | | | — | | | | — | | | | 18.2 | | | | 28.4 | | | | — | | | | — | | | | 12.5 | |
| Long-term debt | | | 81.0 | | | | 85.3 | | | | 67.0 | | | | 67.0 | | | | 103.5 | | | | 120.0 | | | | 106.2 | |
| | | |
| | | |
| | | |
| | | |
| | | |
| | | |
| | | |
| |
| Total debt | | | 81.0 | | | | 85.3 | | | | 85.2 | | | | 95.4 | | | | 103.5 | | | | 120.0 | | | | 120.1 | |
| Total shareholders’ equity | | | 285.6 | | | | 268.7 | | | | 264.3 | | | | 265.0 | | | | 263.5 | | | | 276.0 | | | | 271.0 | |
| | | |
| | | |
| | | |
| | | |
| | | |
| | | |
| | | |
| |
| Total capitalization | | $ | 366.6 | | | $ | 354.0 | | | $ | 349.5 | | | $ | 360.4 | | | $ | 367.0 | | | $ | 396.0 | | | $ | 391.1 | |
| | | |
| | | |
| | | |
| | | |
| | | |
| | | |
| | | |
| |
| Total debt to capitalization | | | 22.1 | % | | | 24.1 | % | | | 24.4 | % | | | 26.5 | % | | | 28.2 | % | | | 30.3 | % | | | 30.7 | % |
| | | |
| | | |
| | | |
| | | |
| | | |
| | | |
| | | |
| |
[Additional columns below]
[Continued from above table, first column(s) repeated]
| | | | | | | | | | | | | | | | | | | | | | | | | |
| | | 2001 | | December 31, |
| | |
| |
|
| | | Q4 | | Q3 | | Q2 | | Q1 | | 2000 | | 1999 |
| | |
| |
| |
| |
| |
| |
|
| Notes payable | | $ | — | | | $ | 5.3 | | | $ | 12.0 | | | $ | 8.7 | | | $ | 7.4 | | | $ | 7.4 | |
| Current portion of long-term debt | | | 27.5 | | | | 13.8 | | | | 12.5 | | | | 11.2 | | | | 10.0 | | | | 5.0 | |
| Long-term debt | | | 125.0 | | | | 188.2 | | | | 204.5 | | | | 198.3 | | | | 178.0 | | | | 162.0 | |
| | | |
| | | |
| | | |
| | | |
| | | |
| | | |
| | | |
| |
| Total debt | | | 152.5 | | | | 207.3 | | | | 229.0 | | | | 218.2 | | | | 195.4 | | | | 174.4 | |
| Total shareholders’ equity | | | 242.9 | | | | 241.2 | | | | 230.0 | | | | 246.8 | | | | 246.4 | | | | 164.8 | |
| | | |
| | | |
| | | |
| | | |
| | | |
| | | |
| | | |
| |
| Total capitalization | | $ | 395.4 | | | $ | 448.5 | | | $ | 459.0 | | | $ | 465.0 | | | $ | 441.8 | | | $ | 339.2 | |
| | | |
| | | |
| | | |
| | | |
| | | |
| | | |
| |
| Total debt to capitalization | | | 38.6 | % | | | 46.2 | % | | | 49.9 | % | | | 46.9 | % | | | 44.2 | % | | | 51.4 | % |
| | | |
| | | |
| | | |
| | | |
| | | |
| | | |
| |
CTS Corporation
Definition of Financial Terms — “Adjusted Working Capital as a Percentage of Annualized Sales"
($ in millions)
Previously, CTS excluded notes payable and current maturities of long-term debt when discussing working capital.
CTS now excludes cash in addition to notes payable and current maturities of long-term debt. This change, effective
in June 2003, is being made in order for CTS to conform to its internal reporting methodologies.
| | | | | | | | | | | | | | | | | | | | | | | | | | | | | | |
| | | | 2003 | | 2002 |
| | | |
| |
|
| | | | Q3 | | Q2 | | Q1 | | Q4 | | Q3 | | Q2 | | Q1 |
| | | |
| |
| |
| |
| |
| |
| |
|
| Current assets | | $ | 164.4 | | | $ | 153.8 | | | $ | 145.8 | | | $ | 152.3 | | | $ | 174.8 | | | $ | 189.2 | | | $ | 187.4 | |
| Current liabilities | | | 93.0 | | | | 102.5 | | | | 120.9 | | | | 134.5 | | | | 100.7 | | | | 104.3 | | | | 127.0 | |
| | | |
| | | |
| | | |
| | | |
| | | |
| | | |
| | | |
| |
| Working capital | | | 71.4 | | | | 51.3 | | | | 24.9 | | | | 17.8 | | | | 74.1 | | | | 84.9 | | | | 60.4 | |
| | | |
| | | |
| | | |
| | | |
| | | |
| | | |
| | | |
| |
| Adjustments to working capital: | | | | | | | | | | | | | | | | | | | | | | | | | | | | |
| | Cash | | | (19.6 | ) | | | (6.7 | ) | | | (7.7 | ) | | | (9.2 | ) | | | (11.6 | ) | | | (15.0 | ) | | | (7.6 | ) |
| | Notes payable | | | — | | | | — | | | | — | | | | — | | | | — | | | | — | | | | 1.4 | |
| | Current portion of long-term debt | | | — | | | | — | | | | 18.2 | | | | 28.4 | | | | — | | | | — | | | | 12.5 | |
| | | |
| | | |
| | | |
| | | |
| | | |
| | | |
| | | |
| |
| Total adjustments to working capital | | | (19.6 | ) | | | (6.7 | ) | | | 10.5 | | | | 19.2 | | | | (11.6 | ) | | | (15.0 | ) | | | 6.3 | |
| | | |
| | | |
| | | |
| | | |
| | | |
| | | |
| | | |
| |
| Adjusted working capital | | $ | 51.8 | | | $ | 44.6 | | | $ | 35.4 | | | $ | 37.0 | | | $ | 62.5 | | | $ | 69.9 | | | $ | 66.7 | |
| | | |
| | | |
| | | |
| | | |
| | | |
| | | |
| | | |
| |
| Quarterly sales | | $ | 108.5 | | | $ | 116.7 | | | $ | 105.8 | | | $ | 116.5 | | | $ | 111.0 | | | $ | 117.7 | | | $ | 112.6 | |
| Multiplied by 4 | | | 4 | | | | 4 | | | | 4 | | | | 4 | | | | 4 | | | | 4 | | | | 4 | |
| | | |
| | | |
| | | |
| | | |
| | | |
| | | |
| | | |
| |
| Annualized sales | | $ | 434.0 | | | $ | 466.8 | | | $ | 423.2 | | | $ | 466.0 | | | $ | 444.0 | | | $ | 470.8 | | | $ | 450.4 | |
| | | |
| | | |
| | | |
| | | |
| | | |
| | | |
| | | |
| |
| Adjusted working capital as a percentage of annualized sales | | | 11.9 | % | | | 9.6 | % | | | 8.4 | % | | | 7.9 | % | | | 14.1 | % | | | 14.8 | % | | | 14.8 | % |
| | | |
| | | |
| | | |
| | | |
| | | |
| | | |
| | | |
| |
[Additional columns below]
[Continued from above table, first column(s) repeated]
| | | | | | | | | | | | | | | | | | | | | | | |
| | | | 2001 | | 2000 | |
| | | |
| |
| |
| | | | Q4 | | Q3 | | Q2 | | Q1 | | Q4 | |
| | | |
| |
| |
| |
| |
| |
| Current assets | | $ | 200.7 | | | $ | 198.8 | | | $ | 229.9 | | | $ | 256.7 | | | $ | 305.7 | | |
| Current liabilities | | | 153.9 | | | | 126.4 | | | | 152.5 | | | | 155.6 | | | | 202.9 | | |
| | | |
| | | |
| | | |
| | | |
| | | |
| | |
| Working capital | | | 46.8 | | | | 72.4 | | | | 77.4 | | | | 101.1 | | | | 102.8 | | |
| | | |
| | | |
| | | |
| | | |
| | | |
| | |
| Adjustments to working capital: | | | | | | | | | | | | | | | | | | | | | |
| | Cash | | | (13.2 | ) | | | (7.9 | ) | | | (18.6 | ) | | | (14.1 | ) | | | (20.6 | ) | |
| | Notes payable | | | — | | | | 5.3 | | | | 12.0 | | | | 8.7 | | | | 7.4 | | |
| | Current portion of long-term debt | | | 27.5 | | | | 13.8 | | | | 12.5 | | | | 11.3 | | | | 10.0 | | |
| | | |
| | | |
| | | |
| | | |
| | | |
| | |
| Total adjustments to working capital | | | 14.3 | | | | 11.2 | | | | 5.9 | | | | 5.9 | | | | (3.2 | ) | |
| | | |
| | | |
| | | |
| | | |
| | | |
| | |
| Adjusted working capital | | $ | 61.1 | | | $ | 83.6 | | | $ | 83.3 | | | $ | 107.0 | | | $ | 99.6 | | |
| | | |
| | | |
| | | |
| | | |
| | | |
| | |
| Quarterly sales | | $ | 125.8 | | | $ | 131.2 | | | $ | 143.7 | | | $ | 177.0 | | | $ | 233.4 | | |
| Multiplied by 4 | | | 4 | | | | 4 | | | | 4 | | | | 4 | | | | 4 | | |
| | | |
| | | |
| | | |
| | | |
| | | |
| | |
| Annualized sales | | $ | 503.2 | | | $ | 524.8 | | | $ | 574.8 | | | $ | 708.0 | | | $ | 933.6 | | |
| | | |
| | | |
| | | |
| | | |
| | | |
| | |
| Adjusted working capital as a percentage of annualized sales | | | 12.1 | % | | | 15.9 | % | | | 14.5 | % | | | 15.1 | % | | | 10.7 | % | |
| | | |
| | | |
| | | |
| | | |
| | | |
| | |


