
| February 2005 www.ctscorp.com Exhibit 99.1 |


| CTS Corporation EMS Operations Global Operations Electronic Components Automotive Sensors |
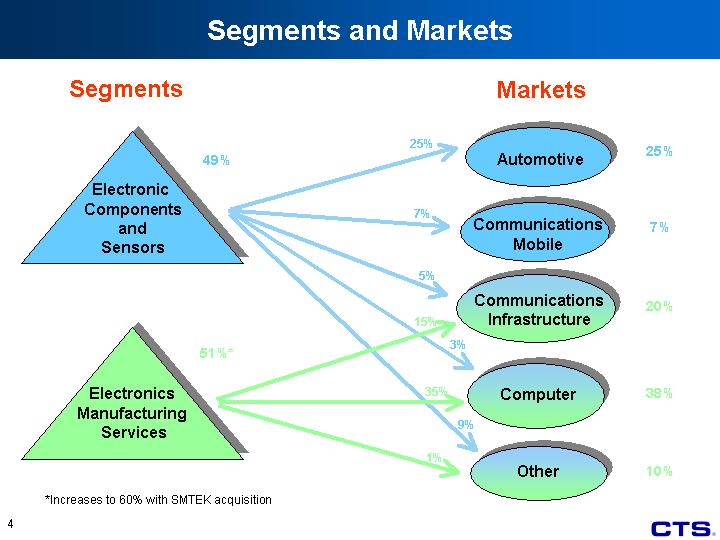
| Segments Automotive Communications Mobile Computer Communications Infrastructure Other Segments and Markets Electronic Components and Sensors Electronics Manufacturing Services Markets 49% 51%* 10% 38% 7% 25% 20% 25% 7% 5% 3% 9% 15% 35% 1% *Increases to 60% with SMTEK acquisition |

| Business Growth Targets - - Automotive Sensors - - Electronic Components Electronics Manufacturing Services 12 - 17% 2 - 5% 8 - 14% 7 - 12% Sales Growth Overall Product/Market Area $850 - $900 million in sales 8 - 9% Operating Earnings as % of Sales Gross Margins Flat Improving Flat Improving (2004 - 2008) Components & Sensors: |
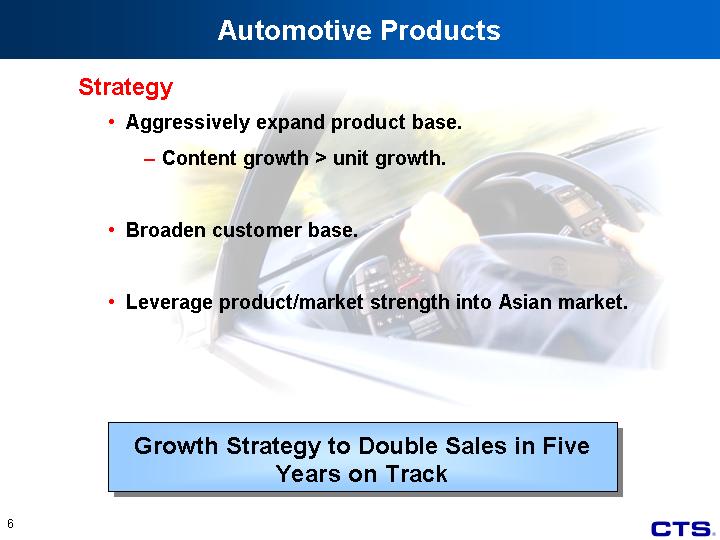
| Automotive Products Strategy Aggressively expand product base. Content growth > unit growth. Broaden customer base. Leverage product/market strength into Asian market. Growth Strategy to Double Sales in Five Years on Track |
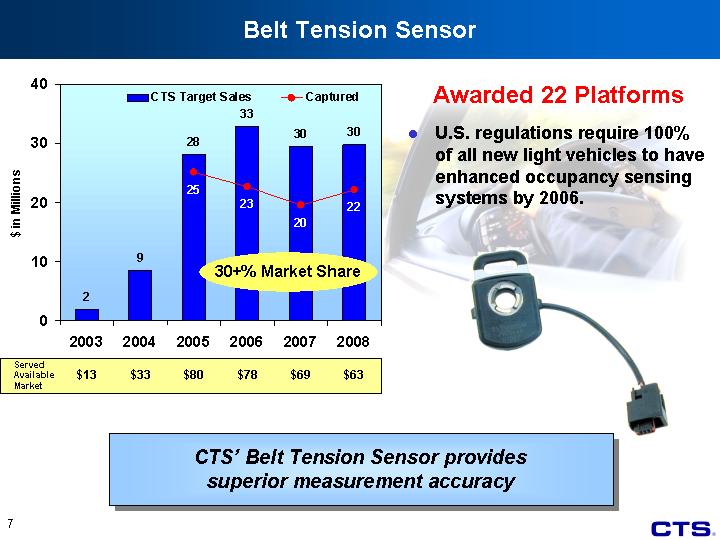
| CTS' Belt Tension Sensor provides superior measurement accuracy Belt Tension Sensor Awarded 22 Platforms U.S. regulations require 100% of all new light vehicles to have enhanced occupancy sensing systems by 2006. 2003 2004 2005 2006 2007 2008 2009 CTS Target Sales 1.9 8.5 28.1 32.9 29.5 29.8 28 Captured 25.1 22.6 19.5 22.1 18.7 30+% Market Share $13 $33 $80 $69 $63 Served Available Market $78 |

| Awarded 34 Platforms Industry trend is to adopt integrated pedals for complexity and cost reduction Served Available Market (Including Pedal Sensors) Accelerator Pedal Module 2003 2004 2005 2006 2007 2008 2009 CTS Target Sales 8.9 13.4 21.6 40.2 72.5 100.8 111.5 Captured 21.5 33.2 46.9 49.2 49.2 $150 $223 $266 $326 $363 $305 CTS Accelerator Pedal Modules Offer Performance, Quality and Cost Advantages |

| Electronic Components Strategy Improve profitability through cost reduction. Seek revenue growth in higher margin products. Manage mix of product portfolio. Improving Financial Performance |
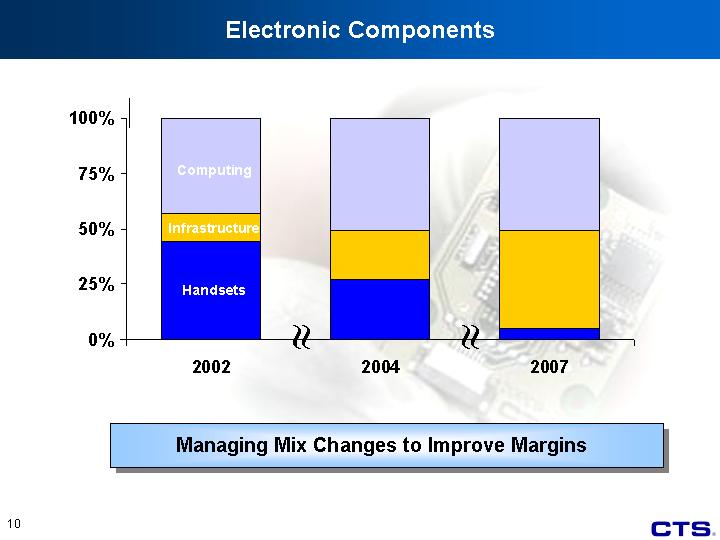
| Electronic Components 2002 2004 2007 Handsets 0.44 0.27 0.05 Infrastructure 0.13 0.22 0.44 Computer/Communications 0.43 0.51 0.51 Managing Mix Changes to Improve Margins Computing Infrastructure Handsets ? ? |
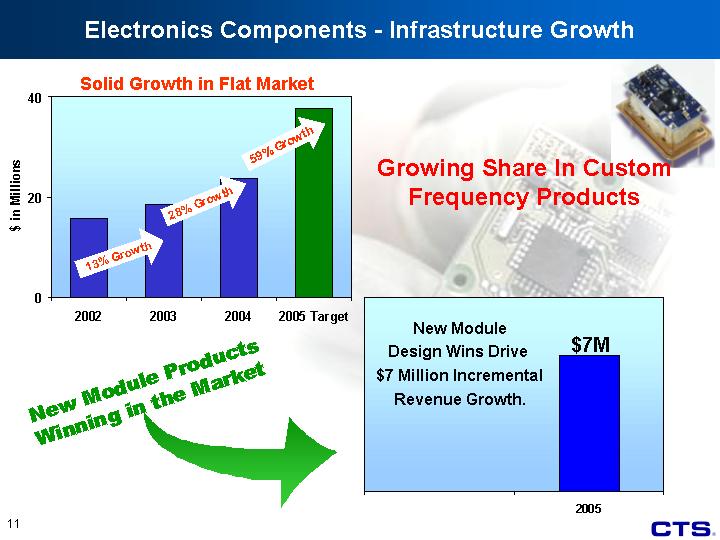
| Electronics Components - Infrastructure Growth 2002 2003 2004 2005 Target 15.8 18.5 23.7 37.6 2005 New Design Wins 7 New Module Design Wins Drive $7 Million Incremental Revenue Growth. New Module Products Winning in the Market Solid Growth in Flat Market 28% Growth 13% Growth 59% Growth Growing Share In Custom Frequency Products |
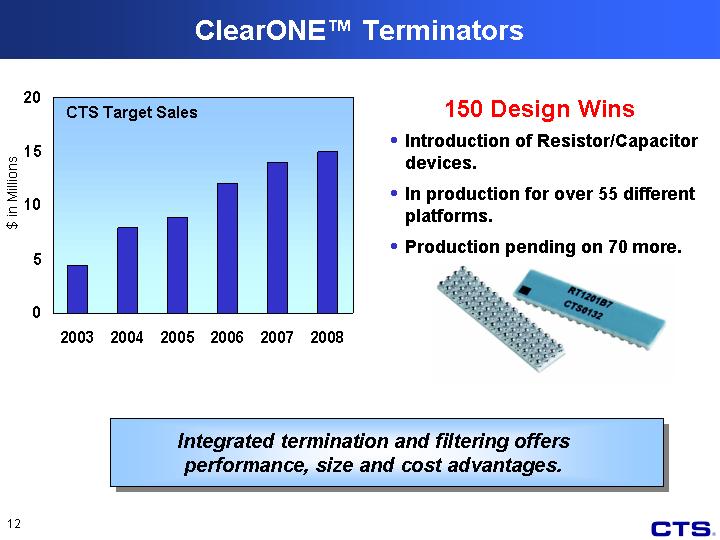
| Introduction of Resistor/Capacitor devices. In production for over 55 different platforms. Production pending on 70 more. 150 Design Wins ClearONE(tm) Terminators 2003 2004 2005 2006 2007 2008 ClearOne 4.4 7.9 8.9 12 14 15 $ in Millions CTS Target Sales Integrated termination and filtering offers performance, size and cost advantages. |
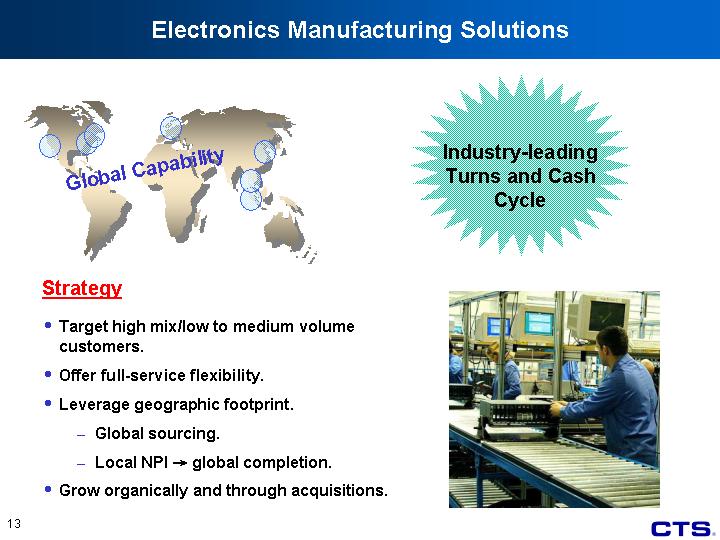
| Electronics Manufacturing Solutions Global Capability Target high mix/low to medium volume customers. Offer full-service flexibility. Leverage geographic footprint. Global sourcing. Local NPI ? global completion. Grow organically and through acquisitions. Strategy Industry-leading Turns and Cash Cycle |
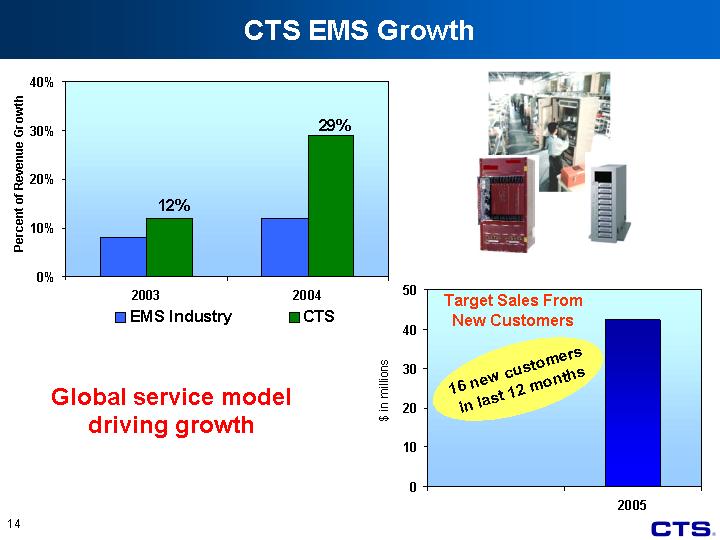
| CTS EMS Growth 2003 2004 EMS Industry 0.08 0.12 CTS 0.12 0.29 Percent of Revenue Growth 2005 New Customers 42.4 $ in millions Target Sales From New Customers 16 new customers in last 12 months Global service model driving growth |

| Acquisition of SMTEK EMS Company offering full turnkey solutions. Focused on customers with high-mix, complex product needs. Primary markets are medical, industrial, security, telecom, and aerospace and defense. Over 25 major customers. Top ten provide 73% of revenue. Closed January 31, 2005. Total enterprise value approximately $58 million, including 800,000 shares of CTS common stock. Each SMTEK share received $10.725 cash and .2913 shares of CTS common stock. The Deal Who is SMTEK? |

| SMTEK Facilities Bangkok 42K sq ft Santa Clara 45K sq ft Moorpark 115K sq ft Marlborough 70K sq ft Over 270,000 Sq. Ft. of Manufacturing Space |
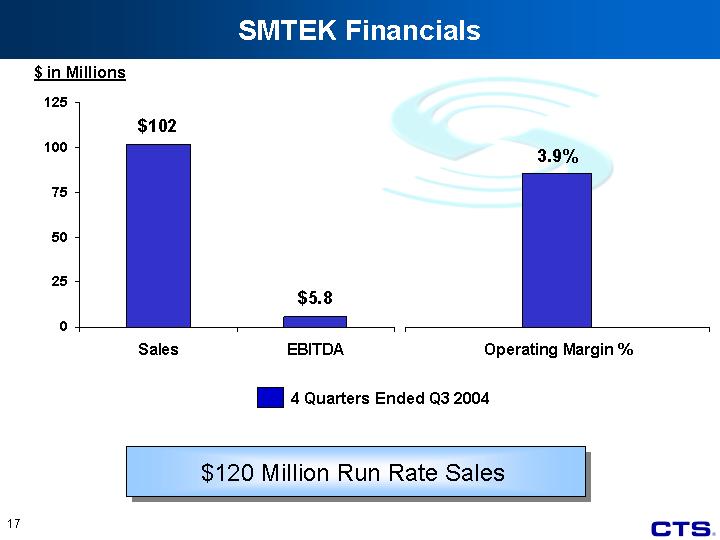
| SMTEK Financials Sales EBITDA Q3 04 102 5.8 Operating Margin % Q3 04 0.039 4 Quarters Ended Q3 2004 $ in Millions $120 Million Run Rate Sales |
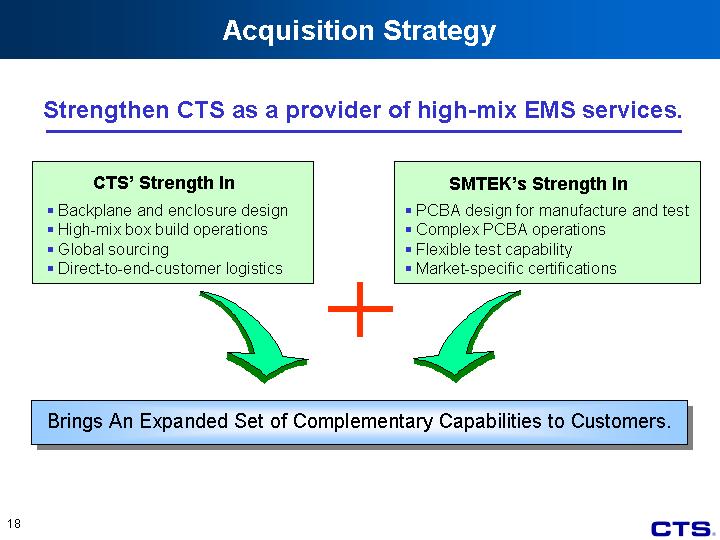
| Acquisition Strategy Strengthen CTS as a provider of high-mix EMS services. CTS' Strength In SMTEK's Strength In Brings An Expanded Set of Complementary Capabilities to Customers. PCBA design for manufacture and test Complex PCBA operations Flexible test capability Market-specific certifications Backplane and enclosure design High-mix box build operations Global sourcing Direct-to-end-customer logistics |

| Acquisition Strategy Accelerate expansion into new markets. Communications Industrial Other Computing East 24 2 2 65 Computing Communications Industrial & Security Other CTS Aero & Def Communications Indust & security Other Computing Medical Consumer East 9 14 38 5 3 24 7 Industrial & Security Other Computing Communications Aero & Defense Medical Consumer SMTEK Positions CTS well in multiple growth markets |

| Combined EMS Markets Med Comm Ind & Sec Aero & Def Other Computing East 6 27 11 2 5 49 Computing 49% Communications 27% Medical 6% Industrial and Security 11% Aerospace and Defense 2% Other 5% Combined sales mix based on estimated 2004 sales. |

| Acquisition Strategy Develop strong presence in West Coast market Significant market on West Coast. SMTEK brings strong West Coast operations. CTS has good market coverage on East Coast. |

| Shareholder Value Accretive $0.04 to $0.06 in first year Stronger top line sales growth Increased operational efficiencies Reduced market and customer concentration |

| Financial Summary Definitions and reconciliation of non-GAAP financial terms are included in the Appendix of this presentation and on CTS' Web site at www.ctscorp.com |

| Sales 2002 2003 2004 New Products Driving Year-Over-Year Quarterly Sales Growth Q2 Q3 Q4 Q1 Q2 Q3 Q4 Q1 Q2 Q3 Q4 Q1 Q2 Q3 Q4 Sales 144 131 126 113 118 111 116 106 117 108 132 122 138 129 142 $ in Millions + 15% Year-Over-Year Growth |
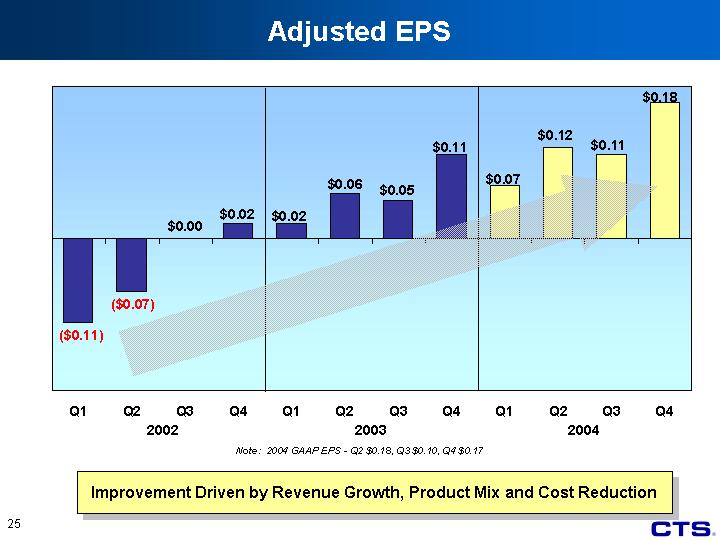
| Q4 Q1 Q2 Q3 Q4 Q1 Q2 Q3 Q4 Q1 Q2 Q3 Q4 -5.7 -0.11 -0.07 0 0.02 0.02 0.06 0.05 0.11 0.07 0.12 0.11 0.18 Adjusted EPS 2002 2003 Improvement Driven by Revenue Growth, Product Mix and Cost Reduction 2004 Note: 2004 GAAP EPS - Q2 $0.18, Q3 $0.10, Q4 $0.17 |

| Adjusted Operating Expenses (Percent of Sales) 2001 2002 2003 Q1 Q2 Q3 Q4 2004 OP Ex. As % of Sales 0.207 0.191 0.169 0.161 0.155 0.159 0.142 0.155 Continue to Improve Operating Leverage ?360 Basis Point Improvement Over Last 3 Years Target Range 13% 14% |
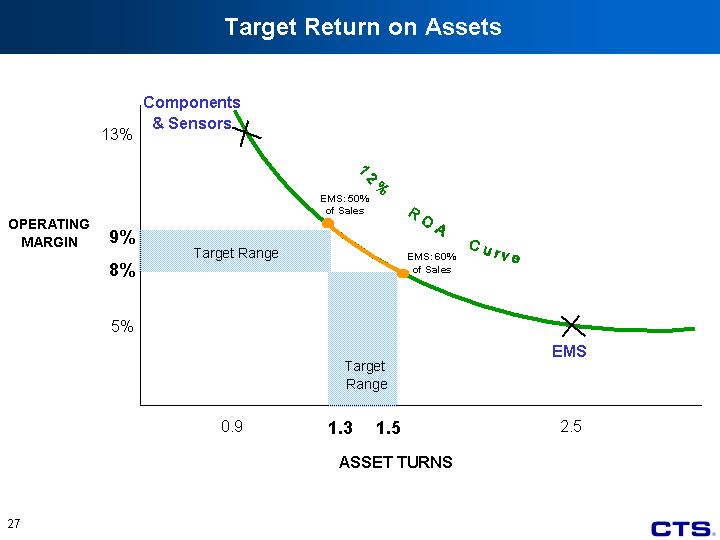
| Target Return on Assets 5% 13% 0.9 1.3 1.5 2.5 EMS Components & Sensors Target Range OPERATING MARGIN 8% 9% ASSET TURNS Target Range Target Range EMS: 50% of Sales EMS: 60% of Sales 12% ROA Curve |
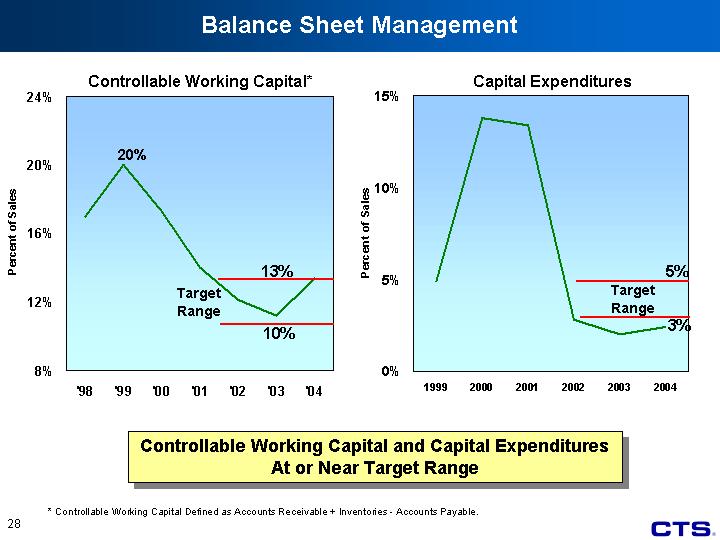
| Balance Sheet Management 1999 2000 2001 2002 2003 2004 Adjusted Working Capital 0.049 0.138 0.134 0.028 0.02 0.024 Capital Expenditures Target Range 5% 3% Controllable Working Capital and Capital Expenditures At or Near Target Range '97 '98 '99 '00 '01 '02 '03 '04 Adjusted Working Capital 0.162 0.17 0.2 0.173 0.14 0.121 0.112 0.134 Controllable Working Capital* Target Range 13% 10% * Controllable Working Capital Defined as Accounts Receivable + Inventories - Accounts Payable. |
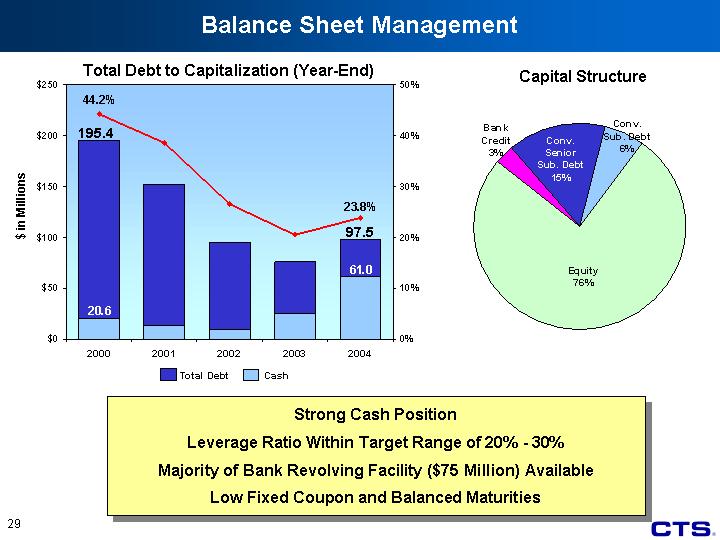
| Balance Sheet Management Strong Cash Position Leverage Ratio Within Target Range of 20% - 30% Majority of Bank Revolving Facility ($75 Million) Available Low Fixed Coupon and Balanced Maturities Conv. Sr. Sub. Debt Conv. Sub. Debt Equity Bank Credit Adjusted Working Capital 0.15 0.06 0.76 0.03 Capital Structure Total Debt to Capitalization (Year-End) 2000 2001 2002 2003 2004 Cash 20.6 13.3 9.2 25.3 61 Debt 174.8 139.2 86.2 50.6 36.5 % 0.442 0.386 0.265 0.205 0.238 195.4 97.5 $ in Millions Total Debt Cash |
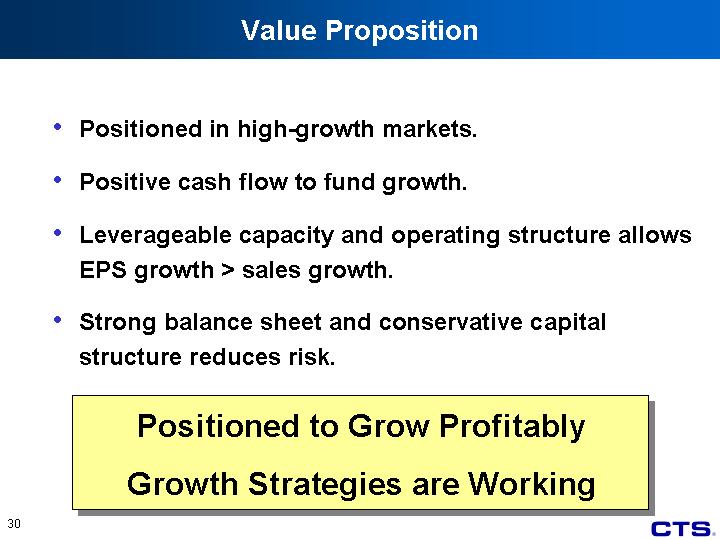
| Value Proposition Positioned in high-growth markets. Positive cash flow to fund growth. Leverageable capacity and operating structure allows EPS growth > sales growth. Strong balance sheet and conservative capital structure reduces risk. Positioned to Grow Profitably Growth Strategies are Working |

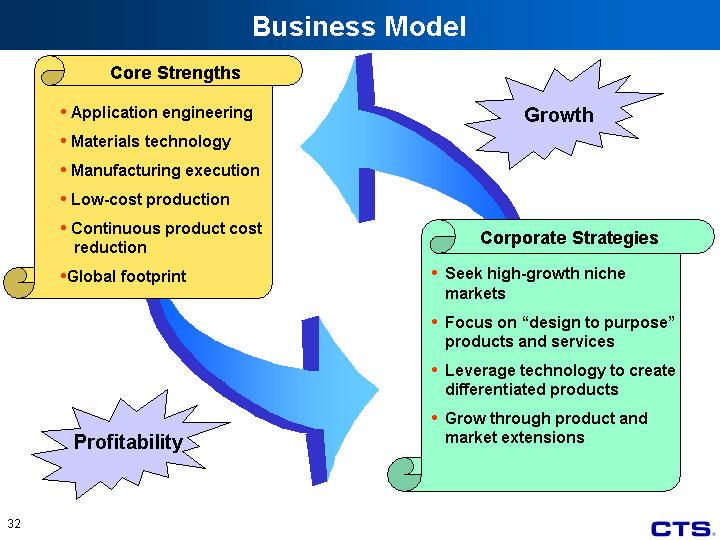
| Business Model Profitability Growth Corporate Strategies Seek high-growth niche markets Focus on "design to purpose" products and services Leverage technology to create differentiated products Grow through product and market extensions Core Strengths Application engineering Materials technology Manufacturing execution Low-cost production Continuous product cost reduction Global footprint |

| New Products Driving Growth 2002 2003 2004 2005 2006 Q3 Q4 Q5 Actual 5.2 20.2 0 0 Forecast 35 69 120 Forecast Actual Belt Tension Sensors Integrated Accelerator Pedals Manifold Actuators Small Engine Throttle Position Sensors Turbocharger Sensors Frequency Modules ClearONE(tm) Terminators Pointing Stick Modules and Touchpads Expected to Contribute $120 Million in Additional Revenue by 2006 CTS Sales |

| Growing Automotive Product Content 2004 2005 2006 2007 North America & Europe 3.5 3.98 4.63 5.25 CTS Sales North America and Europe 14%+ Growth Rate Growing customer penetration - Shifting to Tier I New products provide more value-add - Higher unit prices |

| Automotive Product Applications |
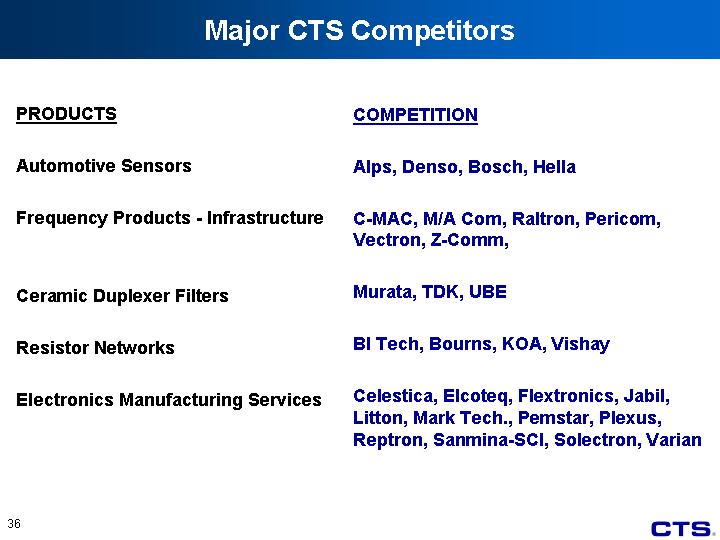
| Major CTS Competitors PRODUCTS Automotive Sensors Frequency Products - Infrastructure Ceramic Duplexer Filters Resistor Networks Electronics Manufacturing Services COMPETITION Alps, Denso, Bosch, Hella C-MAC, M/A Com, Raltron, Pericom, Vectron, Z-Comm, Murata, TDK, UBE BI Tech, Bourns, KOA, Vishay Celestica, Elcoteq, Flextronics, Jabil, Litton, Mark Tech., Pemstar, Plexus, Reptron, Sanmina-SCI, Solectron, Varian |


| Other Financial Data - Income Statement |

| Other Financial Data - Balance Sheet Metrics |
CTS Corporation
Appendix 1
CTS Corporation
Reconciliation of Earnings Per Share to Adjusted Earnings Per Share
| | | | | | | | | | | | | | | | | | | | | | | | | | | | | | | | | | | | | | | | | | | | | | | | | |
| | | 2004 | | | 2003 | | | 2002 | | | Full Year | |
| | | Q4 | | | Q3 | | | Q2 | | | Q3 | | | Q4 | | | Q3 | | | Q2 | | | Q1 | | | 2004 | | | 2003 | | | 2002 | | | 2001 | |
| | | | | | | | | | | | | | | | | | | | | | | | | | | | | | | | | | | | | | | | | | | | | | | | | |
| Earnings per share | | $ | 0.17 | | | $ | 0.10 | | | $ | 0.18 | (1) | | $ | 0.17 | | | $ | 0.02 | | | $ | (0.41 | ) | | $ | (0.08 | ) | | $ | (0.06 | ) | | $ | 0.53 | | | $ | 0.36 | | | $ | (0.54 | ) | | $ | (1.61 | ) |
| | | | | | | | | | | | | | | | | | | | | | | | | | | | | | | | | | | | | | | | | | | | | | | | | |
| Tax affected charges (credits) to reported earnings per share: | | | | | | | | | | | | | | | | | | | | | | | | | | | | | | | | | | | | | | | | | | | | | | | | |
| Restructuring and asset impairment charges | | | | | | | | | | | | | | | 0.10 | | | | 0.00 | | | | 0.41 | | | | | | | | | | | | (0.06 | ) | | | 0.10 | | | | 0.42 | | | | 1.07 | |
| Restructuring-related, one-time charges | | | | | | | | | | | | | | | | | | | | | | | | | | | 0.01 | | | | 0.02 | | | | | | | | | | | | 0.03 | | | | 0.28 | |
| Customer reimbursement | | | | | | | | | | | | | | | | | | | | | | | | | | | | | | | (0.07 | ) | | | | | | | | | | | (0.07 | ) | | | | |
| Gain on sale of Canadian land | | | | | | | | | | | (0.06 | ) | | | | | | | | | | | | | | | | | | | | | | | 0.02 | | | | | | | | | | | | | |
| Affect of adopting EITF No. 04-08 | | | 0.01 | | | | 0.01 | | | | | | | | | | | | | | | | | | | | | | | | | | | | | | | | | | | | | | | | | |
| | | | | | | | | | | |
| Total tax affected adjustments to reported earnings per share | | | 0.01 | | | | 0.01 | | | | (0.06 | ) | | | 0.10 | | | | 0.00 | | | | 0.41 | | | | 0.01 | | | | (0.05 | ) | | | (0.04 | ) | | | 0.10 | | | | 0.38 | | | | 1.35 | |
| | | | | | | | | | | | | | | | | | | | | | | | | | | | | | | | | | | | | | | | | | | | | | | | | |
| Reduction of tax reserve earnings per share adjustment | | | | | | | | | | | | | | | (0.22 | ) | | | | | | | | | | | | | | | | | | | | | | | (0.22 | ) | | | | | | | | |
| | | | | | | | | | | |
| | | | | | | | | | | | | | | | | | | | | | | | | | | | | | | | | | | | | | | | | | | | | | | | | |
| Adjusted earnings per share | | $ | 0.18 | | | $ | 0.11 | | | $ | 0.12 | | | $ | 0.05 | | | $ | 0.02 | | | $ | — | | | $ | (0.07 | ) | | $ | (0.11 | ) | | $ | 0.49 | | | $ | 0.24 | | | $ | (0.16 | ) | | $ | (0.26 | ) |
| | | | | | | | | | | |
| (1) | Diluted earnings per share for the second quarter of 2004 has been restated to reflect the impact of adopting Emerging Issues Task Force (EITF) No. 04-08, “ The Effect of Contingently Convertible Debt on Diluted Earnings Per Share”. EITF No. 04-08 was issued and became effective in the fourth quarter of 2004. Earlier quarters have been restated to show diluted earnings per share computed on a consistent basis. |
Page 1
CTS Corporation
Reconciliation of Operating Expenses to Adjusted Operating Expenses
| | | | | | | | | | | | | |
| | | Full Year | |
| | | 2004 | | | 2003 | | | 2002 | |
| | | | | | | | | | | | | |
| Selling, general and administrative expenses | | $ | 63.5 | | | $ | 56.9 | | | $ | 63.3 | |
| Research and development expenses | | | 19.1 | | | | 21.5 | | | | 24.1 | |
| Restructuring and impairment charges | | | — | | | | 4.6 | | | | 18.3 | |
| Gain on sales of assets | | | (3.9 | ) | | | — | | | | — | |
| | | |
| | | | | | | | | | | | | |
| Total reported operating expenses | | | 78.7 | | | | 83.0 | | | | 105.7 | |
| | | |
| Less restructuring and impairment charges | | | — | | | | 4.6 | | | | 18.3 | |
| Less gain on sale of assets | | | (3.9 | ) | | | — | | | | — | |
| | | |
| | | | | | | | | | | | | |
| Adjusted operating expenses | | $ | 82.6 | | | $ | 78.4 | | | $ | 87.4 | |
| | | |
| | | | | | | | | | | | | |
| Adjusted operating expenses as percent of sales | | | 15.5 | % | | | 16.9 | % | | | 19.1 | % |
| | | |
Page 2
CTS Corporation
Definition of Financial Terms—“Controllable Working Capital as % of Sales”
| | | | | | | | | |
| | | December 31, | | | December 31, | |
| | | |
| | | 2004 | | | 1999 | |
| | | | | | | | | |
| Net Accounts Receivables | | $ | 84.1 | | | $ | 124.7 | |
| Net Inventory | | | 42.7 | | | | 78.9 | |
| Accounts Payables | | | (55.6 | ) | | | (68.3 | ) |
| | | | | | | | | |
| | | |
| Controllable Working Capital | | | 71.2 | | | | 135.3 | |
| | | |
| | | | | | | | | |
| | | |
| Total Sales — Fiscal Year | | | 531.3 | | | | 677.1 | |
| | | |
| | | | | | | | | |
| | | |
| Controllable Working Capital % — Annual | | | 13.4 | % | | | 20.0 | % |
| | | |
Page 3
CTS Corporation
Reconciliation of Net Earnings to Adjusted Net Earnings
| | | | | | | | | | | | | | | | | | | | | | | | | | | | | | | | | | | | | |
| | | 2004 | | | 2003 | | | 2002 | | | Full Year | |
| | | Q2 | | | Q3 | | | Q3 | | | Q2 | | | Q1 | | | 2004 | | | 2003 | | | 2002 | | | 2001 | |
| | | | | | | | | | | | | | | | | | | | | | | | | | | | | | | | | | | | | |
| Net earnings (loss) | | $ | 6.9 | | | $ | 6.1 | | | $ | (13.8 | ) | | $ | (2.7 | ) | | $ | (1.9 | ) | | $ | 19.9 | | | $ | 12.6 | | | $ | (17.9 | ) | | $ | (45.4 | ) |
| | | | | | | | | | | | | | | | | | | | | | | | | | | | | | | | | | | | | |
| Charges (credits) to reported net earnings (loss): | | | | | | | | | | | | | | | | | | | | | | | | | | | | | | | | | | | | |
| Restructuring and asset impairment charges | | | | | | | 4.6 | | | | 18.3 | | | | | | | | | | | | | | | | 4.6 | | | | 18.3 | | | | 40.0 | |
| Restructuring-related, one-time charges | | | | | | | | | | | 0.1 | | | | 0.4 | | | | 0.8 | | | | | | | | | | | | 1.3 | | | | 10.7 | |
| Customer reimbursement | | | | | | | | | | | | | | | | | | | (3.1 | ) | | | | | | | | | | | (3.1 | ) | | | | |
| Gain on sale of Candian land | | | (2.7 | ) | | | | | | | | | | | | | | | | | | | (2.7 | ) | | | | | | | | | | | | |
| | | | | | | | | | | | | |
| Total adjustments to reported net earnings (loss) | | | (2.7 | ) | | | 4.6 | | | | 18.4 | | | | 0.4 | | | | (2.3 | ) | | | (2.7 | ) | | | 4.6 | | | | 16.4 | | | | 50.7 | |
| Total adjustments, tax affected | | | (2.1 | ) | | | 3.4 | | | | 13.8 | | | | 0.3 | | | | (1.7 | ) | | | (2.1 | ) | | | 3.4 | | | | 12.3 | | | | 38.1 | |
| | | | | | | | | | | | | | | | | | | | | | | | | | | | | | | | | | | | | |
| Reversal of tax reserve | | | | | | | (7.9 | ) | | | | | | | | | | | | | | | | | | | (7.9 | ) | | | | | | | | |
| | | | | | | | | | | | | | | | | | | | | | | | | | | | | | | | | | | | | |
| | | | | | | | | | | | | |
| Adjusted net earnings (loss) | | $ | 4.8 | | | $ | 1.6 | | | $ | 0.0 | | | $ | (2.4 | ) | | $ | (3.6 | ) | | $ | 17.8 | | | $ | 8.1 | | | $ | (5.6 | ) | | $ | (7.3 | ) |
| | | | | | | | | | | | | |
| | | | | | | | | | | | | | | | | | | | | | | | | | | | | | | | | | | | | |
| | | | | | | | | | | | | |
| Adjusted net earnings (loss) as a percentage of total sales | | | 3.5 | % | | | 1.5 | % | | | 0.0 | % | | | -2.0 | % | | | -3.2 | % | | | 3.3 | % | | | 1.7 | % | | | -1.2 | % | | | -1.3 | % |
| | | | | | | | | | | | | |
Page 4
CTS Corporation
Reconciliation of Operating Earnings to Adjusted Operating Earnings
| | | | | | | | | | | | | | | | | | | | | | | | | | | | | | | | | | | | | |
| | | 2004 | | | 2003 | | | 2002 | | | Full Year | |
| | | Q2 | | | Q3 | | | Q3 | | | Q2 | | | Q1 | | | 2004 | | | 2003 | | | 2002 | | | 2001 | |
| | | | | | | | | | | | | | | | | | | | | | | | | | | | | | | | | | | | | |
| Operating earnings (loss) | | $ | 10.6 | | | $ | (0.7 | ) | | $ | (16.5 | ) | | $ | (1.5 | ) | | $ | 0.2 | | | $ | 31.1 | | | $ | 13.8 | | | $ | (14.8 | ) | | $ | (48.5 | ) |
| | | | | | | | | | | | | | | | | | | | | | | | | | | | | | | | | | | | | |
| Charges (credits) to reported operating earnings (loss): | | | | | | | | | | | | | | | | | | | | | | | | | | | | | | | | | | | | |
| Restructuring and asset impairment charges | | | | | | | 4.6 | | | | 18.3 | | | | | | | | | | | | | | | | 4.6 | | | | 18.3 | | | | 40.0 | |
| Restructuring-related, one-time charges | | | | | | | | | | | 0.1 | | | | 0.4 | | | | 0.8 | | | | | | | | | | | | 1.3 | | | | 10.7 | |
| Customer reimbursement | | | | | | | | | | | | | | | | | | | (3.1 | ) | | | | | | | | | | | (3.1 | ) | | | | |
| Gain on sale of Candian land | | | (2.7 | ) | | | | | | | | | | | | | | | | | | | (2.7 | ) | | | | | | | | | | | | |
| | | | | | | | | | | | | | | | | | | | | | | | | | | | | | | | | | | | | |
| | | | | | | | | | | | | |
| Total adjustments to reported operating earnings (loss) | | | (2.7 | ) | | | 4.6 | | | | 18.4 | | | | 0.4 | | | | (2.3 | ) | | | (2.7 | ) | | | 4.6 | | | | 16.5 | | | | 50.7 | |
| | | | | | | | | | | | | | | | | | | | | | | | | | | | | | | | | | | | | |
| | | | | | | | | | | | | |
| Adjusted operating earnings (loss) | | $ | 7.9 | | | $ | 3.9 | | | $ | 1.9 | | | $ | (1.1 | ) | | $ | (2.1 | ) | | $ | 28.4 | | | $ | 18.4 | | | $ | 1.7 | | | $ | 2.2 | |
| | | | | | | | | | | | | |
| | | | | | | | | | | | | | | | | | | | | | | | | | | | | | | | | | | | | |
| | | | | | | | | | | | | |
| Adjusted operating earnings (loss) as a percentage of total sales | | | 5.7 | % | | | 3.6 | % | | | 1.8 | % | | | -0.9 | % | | | -1.9 | % | | | 5.3 | % | | | 4.0 | % | | | 0.4 | % | | | 0.4 | % |
| | | | | | | | | | | | | |
Page 5
CTS Corporation
Definition of Financial Terms-“Adjusted Working Capital as % of Sales”
| | | | | | | | | | | | | | | | | | | | | | | | | | | | | | | | | | | | | | | | | | | | | | | | | |
| | | 2004 | | | 2003 | | | 2002 | |
| | | Q4 | | | Q3 | | | Q2 | | | Q1 | | | Q4 | | | Q3 | | | Q2 | | | Q1 | | | Q4 | | | Q3 | | | Q2 | | | Q1 | |
| | | | | | | | | | | | | | | | | | | | | | | | | | | | | | | | | | | | | | | | | | | | | | | | | |
| Current assets | | $ | 204.1 | | | $ | 209.8 | | | $ | 212.0 | | | $ | 190.8 | | | $ | 164.7 | | | $ | 164.4 | | | $ | 153.8 | | | $ | 145.8 | | | $ | 152.3 | | | $ | 174.8 | | | $ | 189.2 | | | $ | 187.4 | |
| Current liabilities | | | 103.0 | | | | 103.4 | | | | 107.9 | | | | 110.8 | | | | 95.7 | | | | 93.0 | | | | 102.5 | | | | 120.9 | | | | 134.5 | | | | 100.7 | | | | 104.3 | | | | 127.0 | |
| | | | | | | | | | | | | | | | | | | | | | | | | | | | | | | | | | | | | | | | | | | | | | | | | |
| | | | | | | |
| Working capital | | | 101.1 | | | | 106.4 | | | | 104.1 | | | | 80.0 | | | | 69.0 | | | | 71.4 | | | | 51.3 | | | | 24.9 | | | | 17.8 | | | | 74.1 | | | | 84.9 | | | | 60.4 | |
| | | | | | | |
| | | | | | | | | | | | | | | | | | | | | | | | | | | | | | | | | | | | | | | | | | | | | | | | | |
| Adjustments to working capital: | | | | | | | | | | | | | | | | | | | | | | | | | | | | | | | | | | | | | | | | | | | | | | | | |
| Cash | | | (61.0 | ) | | | (47.9 | ) | | | (48.2 | ) | | | (32.9 | ) | | | (25.3 | ) | | | (19.6 | ) | | | (6.7 | ) | | | (7.7 | ) | | | (9.2 | ) | | | (11.6 | ) | | | (15.0 | ) | | | (7.6 | ) |
| Notes payable | | | 3.3 | | | | | | | | | | | | | | | | | | | | | | | | | | | | | | | | | | | | | | | | | | | | 1.4 | |
| Current portion of long-term debt | | | | | | | | | | | | | | | | | | | | | | | | | | | | | | | 18.2 | | | | 28.4 | | | | | | | | | | | | 12.5 | |
| | | | | | | | | | | | | | | | | | | | | | | | | | | | | | | | | | | | | | | | | | | | | | | | | |
| | | | | | | |
| Total adjustments to working capital | | | (57.7 | ) | | | (47.9 | ) | | | (48.2 | ) | | | (32.9 | ) | | | (25.3 | ) | | | (19.6 | ) | | | (6.7 | ) | | | 10.5 | | | | 19.2 | | | | (11.6 | ) | | | (15.0 | ) | | | 6.3 | |
| | | | | | | |
| | | | | | | | | | | | | | | | | | | | | | | | | | | | | | | | | | | | | | | | | | | | | | | | | |
| | | | | | | |
| Adjusted working capital | | $ | 43.4 | | | $ | 58.5 | | | $ | 55.9 | | | $ | 47.1 | | | $ | 43.7 | | | $ | 51.8 | | | $ | 44.6 | | | $ | 35.4 | | | $ | 37.0 | | | $ | 62.5 | | | $ | 69.9 | | | $ | 66.7 | |
| | | | | | | |
| | | | | | | | | | | | | | | | | | | | | | | | | | | | | | | | | | | | | | | | | | | | | | | | | |
| Quarterly sales | | | 142.5 | | | | 129.1 | | | | 137.6 | | | | 122.1 | | | $ | 132.0 | | | $ | 108.5 | | | $ | 116.7 | | | $ | 105.8 | | | $ | 116.5 | | | $ | 111.0 | | | $ | 117.7 | | | $ | 112.6 | |
| Multiplied by 4 | | | 4 | | | | 4 | | | | 4 | | | | 4 | | | | 4 | | | | 4 | | | | 4 | | | | 4 | | | | 4 | | | | 4 | | | | 4 | | | | 4 | |
| | | | | | | | | | | | | | | | | | | | | | | | | | | | | | | | | | | | | | | | | | | | | | | | | |
| | | | | | | |
| Annualized sales | | $ | 570.0 | | | $ | 516.4 | | | $ | 550.4 | | | $ | 488.4 | | | $ | 528.0 | | | $ | 434.0 | | | $ | 466.8 | | | $ | 423.2 | | | $ | 466.0 | | | $ | 444.0 | | | $ | 470.8 | | | $ | 450.4 | |
| | | | | | | |
| | | | | | | | | | | | | | | | | | | | | | | | | | | | | | | | | | | | | | | | | | | | | | | | | |
| Adjusted working capital as a percentage of annualized sales | | | 7.6 | % | | | 11.3 | % | | | 10.2 | % | | | 9.6 | % | | | 8.3 | % | | | 11.9 | % | | | 9.6 | % | | | 8.4 | % | | | 7.9 | % | | | 14.1 | % | | | 14.8 | % | | | 14.8 | % |
| | | | | | | |
Page 6
CTS Corporation
Definition of Financial Terms-“Total Debt to Capitalization”
| | | | | | | | | | | | | | | | | | | | | | | | | | | | | | | | | | | | | | | | | | | | | | | | | | | | | | | | | |
| | | 2004 | | | 2003 | | | 2002 | | | 2001 | | | December 31, | |
| | | Q4 | | | Q3 | | | Q2 | | | Q1 | | | Q4 | | | Q3 | | | Q2 | | | Q1 | | | Q4 | | | Q3 | | | Q2 | | | Q1 | | | Q4 | | | 2000 | |
| | | | | | | | | | | | | | | | | | | | | | | | | | | | | | | | | | | | | | | | | | | | | | | | | | | | | | | | | |
| Notes payable | | $ | 3.3 | | | $ | — | | | $ | — | | | $ | — | | | $ | — | | | $ | — | | | $ | — | | | $ | — | | | $ | — | | | $ | — | | | $ | — | | | $ | 1.4 | | | $ | — | | | $ | 7.4 | |
| Current portion of long-term debt | | | — | | | | — | | | | — | | | | — | | | | — | | | | — | | | | — | | | | 18.2 | | | | 28.4 | | | | — | | | | — | | | | 12.5 | | | | 27.5 | | | | 10.0 | |
| Long-term debt | | | 94.2 | | | | 87.0 | | | | 85.0 | | | | 81.2 | | | | 75.9 | | | | 81.0 | | | | 85.3 | | | | 67.0 | | | | 67.0 | | | | 103.5 | | | | 120.0 | | | | 106.2 | | | | 125.0 | | | | 178.0 | |
| | | | | | | | | | | | | | | | | | | | | | | | | | | | | | | | | | | | | | | | | | | | | | | | | | | | | | | | | |
| | | | | | | | | | | | | | | |
| Total debt | | | 97.5 | | | | 87.0 | | | | 85.0 | | | | 81.2 | | | | 75.9 | | | | 81.0 | | | | 85.3 | | | | 85.2 | | | | 95.4 | | | | 103.5 | | | | 120.0 | | | | 120.1 | | | | 152.5 | | | | 195.4 | |
| Total shareholders’ equity | | | 310.7 | | | | 303.6 | | | | 302.7 | | | | 296.4 | | | | 294.2 | | | | 285.6 | | | | 268.7 | | | | 264.3 | | | | 265.0 | | | | 263.5 | | | | 276.0 | | | | 271.0 | | | | 242.9 | | | | 246.4 | |
| | | | | | | | | | | | | | | | | | | | | | | | | | | | | | | | | | | | | | | | | | | | | | | | | | | | | | | | | |
| | | | | | | | | | | | | | | |
| Total capitalization | | $ | 408.2 | | | $ | 390.6 | | | $ | 387.7 | | | $ | 377.6 | | | $ | 370.1 | | | $ | 366.6 | | | $ | 354.0 | | | $ | 349.5 | | | $ | 360.4 | | | $ | 367.0 | | | $ | 396.0 | | | $ | 391.1 | | | $ | 395.4 | | | $ | 441.8 | |
| | | | | | | | | | | | | | | |
| | | | | | | | | | | | | | | | | | | | | | | | | | | | | | | | | | | | | | | | | | | | | | | | | | | | | | | | | |
| Total debt to capitalization | | | 23.8 | % | | | 22.3 | % | | | 21.9 | % | | | 21.5 | % | | | 20.5 | % | | | 22.1 | % | | | 24.1 | % | | | 24.4 | % | | | 26.5 | % | | | 28.2 | % | | | 30.3 | % | | | 30.7 | % | | | 39 | % | | | 44.2 | % |
| | | | | | | | | | | | | | | |
Page 7
CTS Corporation
Reconciliation of Gross Margin Percentage to Adjusted Gross Margin
| | | | | | | | | | | | | |
| | | 2002 | |
| | | Q3 | | | Q2 | | | Q1 | |
| | | | | | | | | | | | | |
| Gross margin percentage | | | 21.5 | % | | | 17.9 | % | | | 20.2 | % |
| | | | | | | | | | | | | |
| Charges (credits) to reported gross margin percentage: | | | | | | | | | | | | |
| Restructuring-related, one-time charges | | | 0.1 | % | | | 0.3 | % | | | 0.7 | % |
| Customer reimbursement | | | 0.0 | % | | | 0.0 | % | | | -2.8 | % |
| | | | | | | | | | | | | |
| | | |
| Total adjustments to reported gross margin percentage | | | 0.1 | % | | | 0.3 | % | | | -2.1 | % |
| | | | | | | | | | | | | |
| | | |
| Adjusted gross margin percentage | | | 21.6 | % | | | 18.2 | % | | | 18.1 | % |
| | | |
Page 8
CTS Corporation
ADJUSTED EBITDA
($ in millions)
| | | | | | | | | | | | | | | | | | | | | | | | | | | | | | | | | | | | | | | | | | | | | | | | | | | | | | | | | | | | | | | | | | | | | |
| | | 2004 | | | 2003 | | | 2002 | | | Full Year | |
| | | Q4 | | | Q3 | | | Q2 | | | Q1 | | | Q4 | | | Q3 | | | Q2 | | | Q1 | | | Q4 | | | Q3 | | | Q2 | | | Q1 | | | 2004 | | | 2003 | | | 2002 | | | 2001 | | | 2000 | |
| Net earnings (loss) | | $ | 6.6 | | | $ | 3.9 | | | $ | 6.9 | | | $ | 2.5 | | | $ | 3.9 | | | $ | 6.1 | | | $ | 2.0 | | | $ | 0.6 | | | $ | 0.5 | | | $ | (13.8 | ) | | $ | (2.7 | ) | | $ | (1.9 | ) | | $ | 19.9 | | | $ | 12.6 | | | $ | (17.9 | ) | | $ | (45.4 | ) | | $ | 83.8 | |
| | | | | | | | | | | | | | | | | | | | | | | | | | | | | | | | | | | | | | | | | | | | | | | | | | | | | | | | | | | | | | | | | | | | | |
| Depreciation and amortization expense | | | 6.4 | | | | 5.7 | | | | 6.7 | | | | 7.3 | | | | 8.1 | | | | 8.2 | | | | 8.5 | | | | 8.8 | | | | 10.0 | | | | 10.6 | | | | 11.6 | | | | 11.2 | | | | 26.1 | | | | 33.6 | | | | 43.4 | | | | 51.7 | | | | 44.3 | |
| Interest expense | | | 1.3 | | | | 1.1 | | | | 1.6 | | | | 1.5 | | | | 1.7 | | | | 2.1 | | | | 1.9 | | | | 1.9 | | | | 2.5 | | | | 2.2 | | | | 2.9 | | | | 2.6 | | | | 5.5 | | | | 7.6 | | | | 10.2 | | | | 12.8 | | | | 13.1 | |
| Tax expense (benefit) | | | 2.0 | | | | 1.2 | | | | 2.0 | | | | 0.9 | | | | 1.3 | | | | (8.5 | ) | | | 0.7 | | | | 0.2 | | | | 0.2 | | | | (4.6 | ) | | | (0.9 | ) | | | (0.6 | ) | | | 6.1 | | | | (6.3 | ) | | | (5.9 | ) | | | (15.1 | ) | | | 32.4 | |
| | | | | | | | | | | | | | | | | | | | | | | | | | | | | | | | | | | | | | | | | | | | | | | | | | | | | | | | | | | | | | | | | | | | | |
| | | | | | | | | |
| EBITDA | | $ | 16.3 | | | $ | 11.9 | | | $ | 17.2 | | | $ | 12.2 | | | $ | 15.0 | | | $ | 7.9 | | | $ | 13.1 | | | $ | 11.5 | | | $ | 13.2 | | | $ | (5.6 | ) | | $ | 10.9 | | | $ | 11.3 | | | $ | 57.6 | | | $ | 47.5 | | | $ | 29.8 | | | $ | 4.0 | | | $ | 173.6 | |
| | | | | | | | | |
| | | | | | | | | | | | | | | | | | | | | | | | | | | | | | | | | | | | | | | | | | | | | | | | | | | | | | | | | | | | | | | | | | | | | |
| Charges (credits) to EBITDA: | | | | | | | | | | | | | | | | | | | | | | | | | | | | | | | | | | | | | | | | | | | | | | | | | | | | | | | | | | | | | | | | | | | | |
| Restructuring and asset impairment charges | | | | | | | | | | | | | | | | | | | | | | | 4.6 | | | | | | | | | | | | | | | | 18.3 | | | | | | | | | | | | | | | | 4.6 | | | | 18.3 | | | | 40.0 | | | | | |
| Restructuring-related, one-time charges | | | | | | | | | | | | | | | | | | | | | | | | | | | | | | | | | | | | | | | 0.1 | | | | 0.4 | | | | 0.8 | | | | | | | | | | | | 1.3 | | | | 10.7 | | | | | |
| Gain on sale of Canadian Land | | | | | | | | | | | (2.7 | ) | | | | | | | | | | | | | | | | | | | | | | | | | | | | | | | | | | | | | | | (2.7 | ) | | | | | | | | | | | | | | | | |
| | | | | | | | | | | | | | | | | | | | | | | | | | | | | | | | | | | | | | | | | | | | | | | | | | | | | | | | | | | | | | | | | | | | | |
| | | | | | | | | |
| Total adjustments to reported EBITDA | | | | | | | — | | | | (2.7 | ) | | | | | | | | | | | 4.6 | | | | | | | | | | | | | | | | 18.4 | | | | 0.4 | | | | 0.8 | | | | (2.7 | ) | | | 4.6 | | | | 19.6 | | | | 50.7 | | | | — | |
| | | | | | | | | | | | | | | | | | | | | | | | | | | | | | | | | | | | | | | | | | | | | | | | | | | | | | | | | | | | | | | | | | | | | |
| | | | | | | | | |
| Adjusted EBITDA | | $ | 16.3 | | | $ | 11.9 | | | $ | 14.5 | | | $ | 12.2 | | | $ | 15.0 | | | $ | 12.5 | | | $ | 13.1 | | | $ | 11.5 | | | $ | 13.2 | | | $ | 12.8 | | | $ | 11.3 | | | $ | 12.1 | | | $ | 54.9 | | | $ | 52.1 | | | $ | 49.4 | | | $ | 54.7 | | | $ | 173.6 | |
| | | | | | | | | |
| | | | | | | | | | | | | | | | | | | | | | | | | | | | | | | | | | | | | | | | | | | | | | | | | | | | | | | | | | | | | | | | | | | | | |
| Adjusted EBITDA % of Sales | | | 11.4 | % | | | 9.2 | % | | | 10.5 | % | | | 10.0 | % | | | 11.4 | % | | | 11.5 | % | | | 11.2 | % | | | 10.9 | % | | | 11.3 | % | | | 11.5 | % | | | 9.6 | % | | | 10.7 | % | | | 10.3 | % | | | 11.3 | % | | | 10.8 | % | | | 9.5 | % | | | 20.0 | % |
Page 9
CTS Corporation
Free Cash Flow
($ in millions)
| | | | | | | | | | | | | | | | | | | | | | | | | | | | | | | | | | | | | | | | | | | | | | | | | | | | | | | | | | | | | | | | | | | | | |
| | | 2004 | | | 2003 | | | 2002 | | | Full Year | |
| | | Q4 | | | Q3 | | | Q2 | | | Q1 | | | Q4 | | | Q3 | | | Q2 | | | Q1 | | | Q4 | | | Q3 | | | Q2 | | | Q1 | | | 2004 | | | 2003 | | | 2002 | | | 2001 | | | 2000 | |
| | | | | | | | | | | | | | | | | | | | | | | | | | | | | | | | | | | | | | | | | | | | | | | | | | | | | | | | | | | | | | | | | | | | | |
| Cash flows provided from (used by) operations | | $ | 4.3 | | | $ | 4.9 | | | $ | 11.5 | | | $ | (6.7 | ) | | $ | 10.2 | | | $ | 8.6 | | | $ | (1.3 | ) | | $ | 8.2 | | | $ | 7.0 | | | $ | 14.4 | | | $ | 2.0 | | | $ | 0.7 | | | $ | 14.0 | | | $ | 25.7 | | | $ | 24.1 | | | $ | 65.8 | | | $ | 110.8 | |
| Cash flows provided from (used by) investing activities | | $ | (2.1 | ) | | $ | (3.6 | ) | | | 2.9 | | | | 9.9 | | | | (2.8 | ) | | | (1.6 | ) | | | (2.3 | ) | | | 1.6 | | | | (0.9 | ) | | | (2.9 | ) | | | (1.7 | ) | | | (4.5 | ) | | | 7.1 | | | | (5.1 | ) | | | (10.0 | ) | | | (66.9 | ) | | | (126.3 | ) |
| | | | | | | | | | | | | | | | | | | | | | | | | | | | | | | | | | | | | | | | | | | | | | | | | | | | | | | | | | | | | | | | | | | | | |
| | | | | | | | | |
| Free cash flow | | $ | 2.2 | | | $ | 1.3 | | | $ | 14.4 | | | $ | 3.2 | | | $ | 7.4 | | | $ | 7.0 | | | $ | (3.6 | ) | | $ | 9.8 | | | $ | 6.1 | | | $ | 11.5 | | | $ | 0.3 | | | $ | (3.8 | ) | | $ | 21.1 | | | $ | 20.6 | | | $ | 14.1 | | | $ | (1.1 | ) | | $ | (15.5 | ) |
| | | | | | | | | |
Page 10
SMTEK
Sales & Operating Earnings
($ in millions)
| | | | | | | | | | | | | | | | | | | | | |
| | | Total | | | Q4 | | | Q1 | | | Q2 | | | Q3 | |
| | | | | | | 2003 | | | 2004 | | | 2004 | | | 2004 | |
| Sales | | $ | 102.4 | | | $ | 20.1 | | | $ | 22.6 | | | $ | 29.9 | | | $ | 29.9 | |
| | | | | | | | | | | | | | | | | | | | | |
| Operating Earnings | | $ | 4.0 | | | $ | 0.2 | | | $ | 0.5 | | | $ | 1.6 | | | $ | 1.7 | |
| Operating Margin% | | | 3.9 | % | | | 0.9 | % | | | 2.3 | % | | | 5.5 | % | | | 5.5 | % |
Page 11
SMTEK
EBITDA
($ in millions)
| | | | | | | | | | | | | | | | | | | | | |
| | | Total | | | Q4 | | | Q1 | | | Q2 | | | Q3 | |
| | | | | | | 2003 | | | 2004 | | | 2004 | | | 2004 | |
| Net earnings | | $ | 3.0 | | | $ | 0.3 | | | $ | 0.1 | | | $ | 1.2 | | | $ | 1.3 | |
| | | | | | | | | | | | | | | | | | | | | |
| Depreciation and amortization expense | | | 1.9 | | | | 0.5 | | | | 0.4 | | | | 0.5 | | | | 0.5 | |
| Interest expense | | | 0.7 | | | | 0.1 | | | | 0.2 | | | | 0.2 | | | | 0.2 | |
| Tax expense | | | 0.2 | | | | — | | | | 0.0 | | | | 0.1 | | | | 0.1 | |
| | | | | | | | | | | | | | | | | | | | | |
| | | |
| EBITDA | | $ | 5.8 | | | $ | 0.8 | | | $ | 0.8 | | | $ | 2.0 | | | $ | 2.2 | |
| | | |
Page 12
SMTEK
ANNUALIZED SALES
($ in millions)
| | | | | |
| | | Q3 | |
| | | 2004 | |
| Sales | | $ | 29.9 | |
| Multiplied by 4 | | | 4 | |
| | | | | |
| | | | |
| Annualized sales | | $ | 119.6 | |
| | | | |
Page 13