CTSÓ
Everywhere. Everyday.
CTSÓ
CORPORATION
www.ctscorp.com
November 2005

2
CTSÓ
Safe Harbor Statement
3
CTSÓ
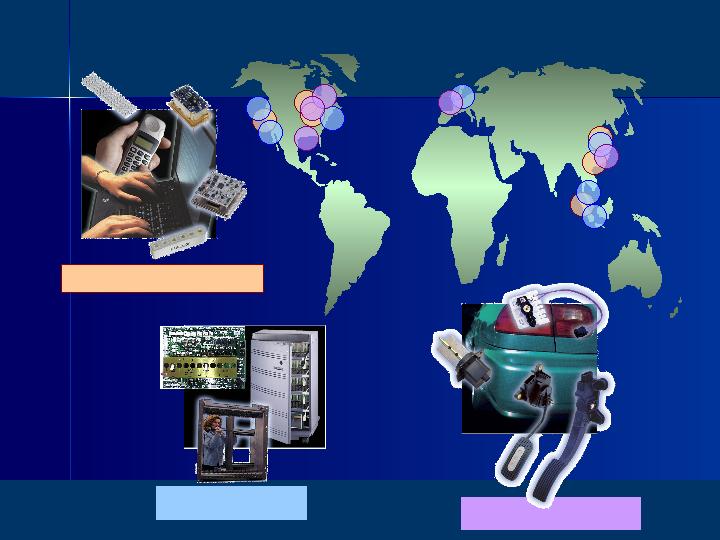
EMS Operations
Electronic Components
Automotive Sensors
CTS Corporation

4
CTSÓ
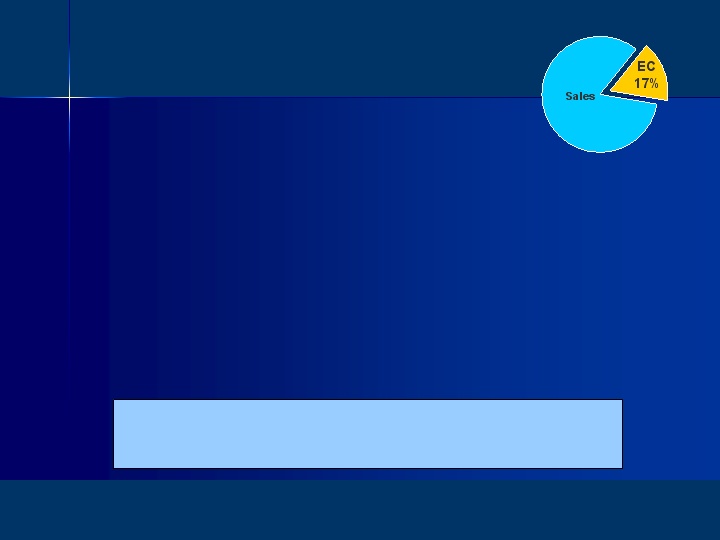
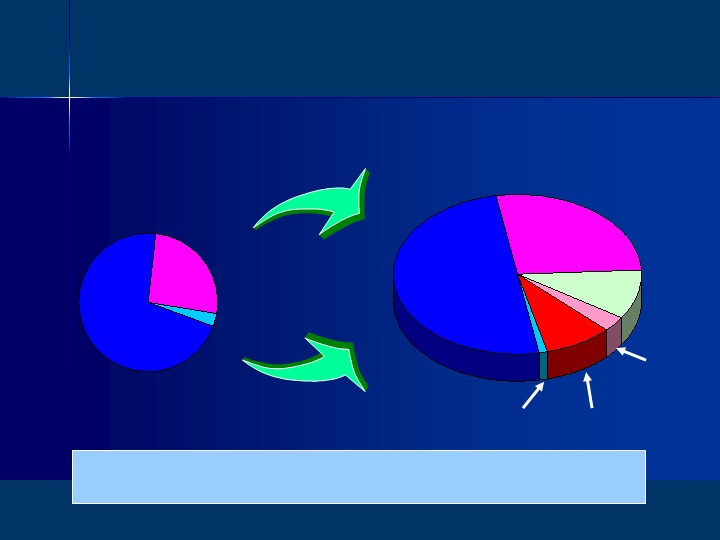
Segments
Automotive
Communications
Other
Computer
Electronic
Components
and
Sensors
Electronics
Manufacturing
Services
Markets
40%
60%
7%
31%
23%
31%
23%
14%
1%
1%
30%
7%
17%
Industrial Consumer
Military & Aerospace
Security
Medical
8%
6%
1%
Segments and Markets

5
CTSÓ
- Automotive Sensors
- Electronic Components
Electronics Manufacturing Services
12 - 17%
2 - 5%
8 - 14%
7 - 12%
Annual Sales Growth
Overall
Product/Market Area
(2004 - 2008)
Components & Sensors:
Business Growth Targets

6
CTSÓ
Strategy
•
Aggressively expand product base.
–
Content growth > unit growth.
•
Broaden customer base.
•
Leverage product/market strength into Asian market.
Targeting Double-Digit Growth
Automotive Products

7
CTSÓ
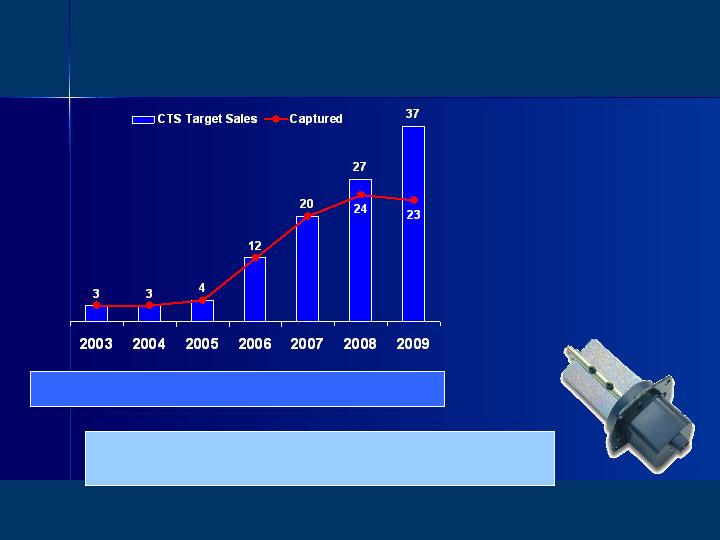
Awarded 42 Platforms
Industry trend is to adopt
integrated pedals for complexity
and cost reduction
integrated pedals for complexity
and cost reduction
Total
Available
Market
(Including Pedal Sensors)
$150
$223
$266
$326
$363
$305
CTS Accelerator Pedal Modules Offer
Performance, Quality and Cost Advantages
$ in Millions
$393
CTS
Automotive
Receives “Excellent
Launch Award”
From Toyota
Actual
Accelerator Pedal Module

8
CTSÓ
CTS Target Sales
$ in Millions
Asia Over 50% of
Growth
Growth
Actual
i
Operations in Taiwan and China
i
China regulations driving local content
i
Leveraging existing product base
10 Year Projected Growth In Vehicle Sales
(17M Units)
(17M Units)
Asian Automotive Growth
9
CTSÓ
Strategy
•
Focus on high margin engineered electronic
components.
components.
•
Leverage our global footprint and Asian
manufacturing.
manufacturing.
•
Aggressively introduce new products and expand
the customer base.
the customer base.
Improving Financial Performance
Electronic Components
10
CTSÓ
Focused on Higher Margin Growth Markets
Communications
Handset
Communications
Infrastructure
Computing and
Other Markets
Electronic Components – Markets Served

11
CTSÓ
OCXO
RF
Module
Filter
WiMAX
Fiber-to-the-premise
Telematics
Cellular
Repeaters
Wireless
Base Station
Satellite
Communications
Communications
4 Design Wins
12 Design Wins
51 Design Wins
In design phase
with 7 OEMs
with 7 OEMs
25 Design Wins
7 Design Wins
Electronic Components– Products/Applications

12
CTSÓ
i
Target customers with complex needs.
i
Offer full-service flexibility.
i
Leverage geographic footprint.
–
Global sourcing.
–
Local NPI u global completion.
i
Grow organically and through acquisitions.
Strategy
Industry-leading
Turns and
Cash Cycle
Electronics Manufacturing Solutions
13
CTSÓ
Strengthen CTS as a provider of high-mix EMS services
CTS’ Strength In
SMTEK’s Strength In
Brings An Expanded Set of Complementary Capabilities to Customers.
§
PCBA design for manufacture and test
§
Complex PCBA operations
§
Flexible test capability
§
Market-specific certifications
§
Backplane and enclosure design
§
High-mix box build operations
§
Global sourcing
§
Direct-to-end-customer logistics
Acquisition Strategy
14
CTSÓ
Communications
Other
CTS Before
Positions CTS well in multiple growth markets
Based on Q3 Sales $
Communications
Medical
Industrial &
Security
Defense
& Aerospace
Other
CTS After
Accelerate expansion into new markets
Computing
Computing
Acquisition Strategy

15
CTSÓ
Stronger top line sales growth
Increased operational efficiencies
Reduced market and customer concentration
Accretive in first year
Shareholder Value

Financial Summary
Definitions and reconciliation of non-GAAP financial terms are included in the
Appendix of this presentation and on CTS’ Web site at www.ctscorp.com
Appendix of this presentation and on CTS’ Web site at www.ctscorp.com
17
CTSÓ
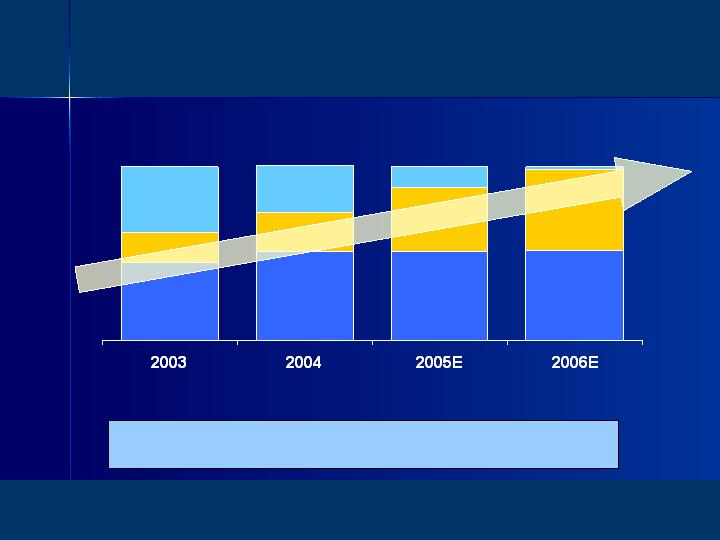
New Products/Acquisition Driving Sales Growth
$ in Millions
2005
2004
2003
2002
Sales

18
CTSÓ
2002
2003
Earnings Growing Faster Than Revenues
2004
2005
Adjusted EPS

19
CTSÓ
Expense Leverage Contributing to Earnings Growth
12%
12.5%
Target
Adjusted Operating Expenses
(Percent of Sales)

20
CTSÓ
Capital Expenditures
Normal
Range
5%
3%
Controllable Working Capital*
Target
Range
13%
10%
* Controllable Working Capital Defined as Accounts Receivable + Inventories - Accounts Payable.
Efficient Utilization of Capital
Balance Sheet Management

21
CTSÓ
Leverage Ratio Within Target Range of 20% - 30%
Balanced Maturities
Current
Capital Structure
Total Debt to Capitalization
195
98
Total Debt
Cash
Debt to Capitalization
Balance Sheet Management

22
CTSÓ
$ in Millions
Free cash flow is defined as the sum of net cash provided by operations and cash used for capital
expenditures
expenditures
Cash Flow Funds Operations and Growth
Free Cash Flow

23
CTSÓ
Growth Strategies are Working
Expect EPS Growth > Sales Growth
Value Proposition
•
Positioned in high-growth markets.
•
Positive cash flow to fund growth.
•
Leverageable capacity and operating structure.
•
Strong balance sheet and conservative capital structure.

24
CTSÓ
APPENDIX

25
CTSÓ
Profitability
Growth
Corporate Strategies
•
Seek high-growth niche
markets
•
Focus on “design to purpose”
products and services
products and services
•
Leverage technology to create
differentiated products
differentiated products
•
Grow through product and
market extensions
market extensions
Core Strengths
•
Application engineering
•
Materials technology
•
Manufacturing execution
•
Low-cost production
•
Continuous product cost
reduction
reduction
•
Global footprint
Business Model

26
CTSÓ
Bangkok
42K sq ft
Santa Clara
45K sq ft
Moorpark
115K sq ft
Over 200,000 Sq. Ft. of Manufacturing Space
SMTEK Facilities

27
CTSÓ
Develop strong presence in West Coast market
SMTEK brings strong
West Coast operations.
West Coast operations.
CTS has good market
coverage on East Coast.
coverage on East Coast.
Acquisition Strategy
28
CTSÓ
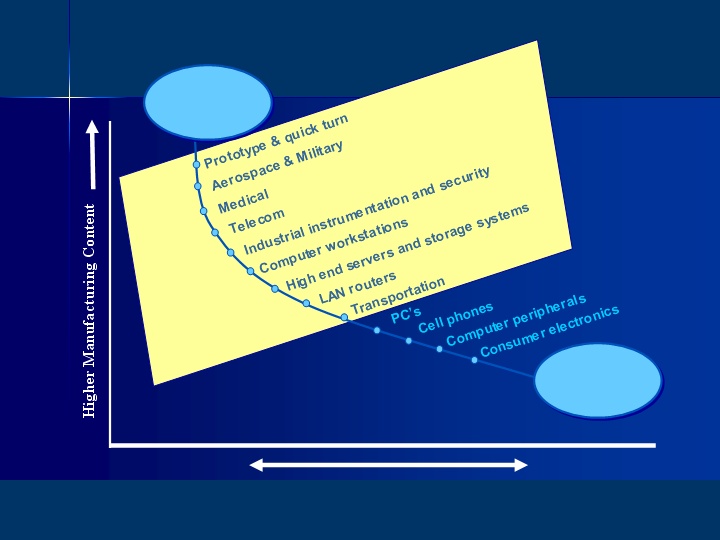
More Complex
Less Complex
High Volume
/ Low Mix
/ Low Mix
Low Volume
/ High Mix
CTS
Markets
Market Differentiation

29
CTSÓ
CTS Sales
North America and Europe
l
Growing customer penetration – Shifting to Tier I
l
New products provide more value-add – Higher unit prices
Growing Automotive Product Content
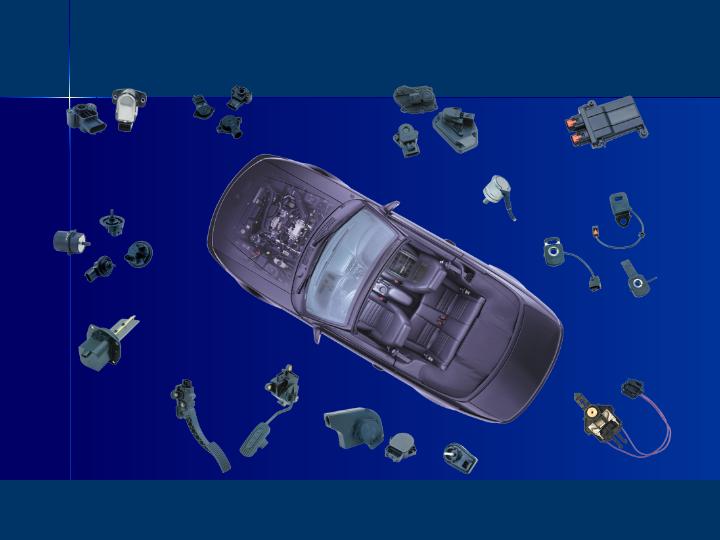
30
CTSÓ
Position Sensors:
(Contacting & Non-Contacting)
Throttle
Exhaust Gas Recirculating
Active Manifold Monitoring
Actuators:
Manifold Tuning
Secondary Runner
Tumble & Swirl Valves
Pedal Modules:
(Contacting & Non-Contacting)
Pedal Position Sensors
Memory Seat
Position Sensors
Fuel Level
Sensing
Safety Systems:
Occupant Classification Systems
Belt Tension Sensors
Electronic Throttle
Sensors
Automotive Product Applications
31
CTSÓ
Awarded 5 Platforms
Trend toward active manifolds
driven by:
driven by:
-
Lower emissions requirements.
-
Better fuel economy.
-
Improved vehicle performance
(engine torque).
(engine torque).
$65
$71
$86
$131
$194
$266
Total
Available
Market
CTS’ innovative solution provides performance
and reliability advantages.
$335
$ in Millions
Active Manifold Actuators

32
CTSÓ
Major CTS Competitors
PRODUCTS
Automotive Products
Frequency Products - Infrastructure
Ceramic Duplexer Filters
Resistor Networks
Electronics Manufacturing Services
COMPETITION
Alps, Delphi, Denso, Bosch, Hella
C-MAC, Raltron, Pericom, Vectron,
Z-Comm,
Z-Comm,
Murata, TDK, UBE
BI Tech, Bourns, KOA, Vishay
Celestica, Flextronics, Jabil, LaBarge,
Mark Tech., Pemstar, Plexus,
Sanmina-SCI, Santron, Solectron, Varian
Mark Tech., Pemstar, Plexus,
Sanmina-SCI, Santron, Solectron, Varian
33
CTSÓ
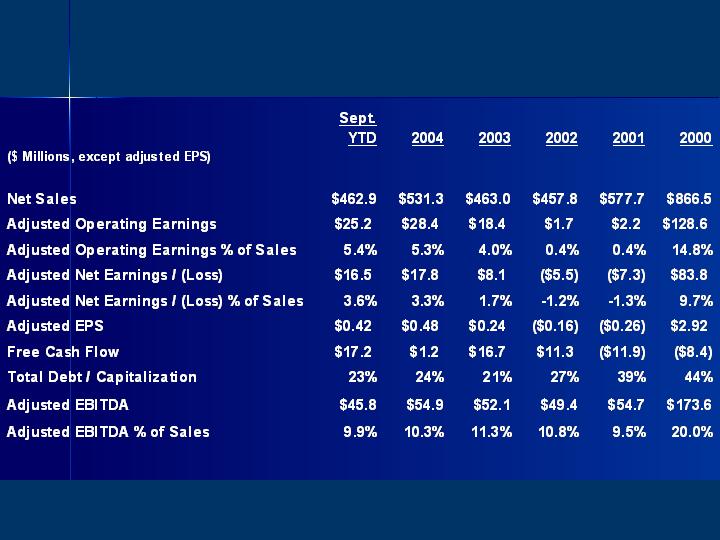
Note: Data shown excludes all restructuring and related one-time charges, asset impairments, customer reimbursement, income tax adjustment and
material asset gains, except adjusted EBITDA, which includes the customer reimbursement only.
material asset gains, except adjusted EBITDA, which includes the customer reimbursement only.
Financial Summary

34
CTSÓ
Note: Data shown excludes income tax adjustment and material asset gains.
Other Financial Data - Income Statement
35
CTSÓ
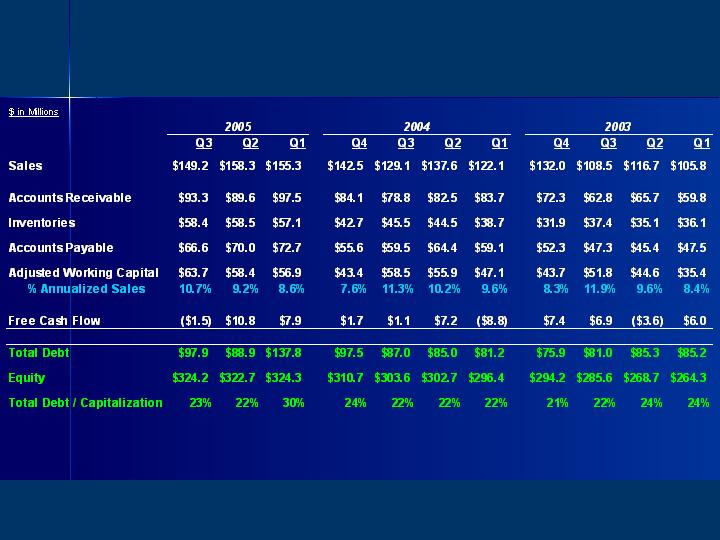
Other Financial Data - Balance Sheet Metrics

36
CTSÓ
Target Return on Assets
5.0%
12.0%
1.0
1.5
1.6
2.5
EMS
Components
& Sensors
OPERATING
MARGIN
7.5%
8.0%
ASSET TURNS
Target Range
Target
Range
EMS: 55%
of Sales
EMS: 65%
of Sales
Both Segments Have Comparable ROA Targets
2003
2004
2005
CTS
CTS
CTS
CTS Corporation
Regulation G
CTS Corporation
Reconciliation of Earnings Per Share to Adjusted Earnings Per Share
| 2005 YTD | 2005 | 2004 | 2003 | 2002 | Full Year | |||||||||||||||||||||||||||||
| Q3 | Q2 | Q2 | Q3 | Q3 | Q2 | Q1 | 2004 | 2003 | 2002 | 2001 | ||||||||||||||||||||||||
| Earnings per share | $ | 0.35 | $ | 0.10 | $ | 0.18 | (1) | $ | 0.17 | $ | (0.41 | ) | $ | (0.08 | ) | $ | (0.06 | ) | $ | 0.53 | $ | 0.36 | $ | (0.54 | ) | $ | (1.61 | ) | ||||||
| Tax affected charges (credits) to reported earnings per share: | ||||||||||||||||||||||||||||||||||
| Restructuring and asset impairment charges | 0.10 | 0.41 | 0.10 | 0.42 | 1.07 | |||||||||||||||||||||||||||||
| Restructuring-related, one-time charges | 0.01 | 0.02 | 0.03 | 0.28 | ||||||||||||||||||||||||||||||
| Customer reimbursement | (0.07 | ) | (0.07 | ) | ||||||||||||||||||||||||||||||
| Gain on sale of excess Canadian land | (0.05 | ) | (0.05 | ) | ||||||||||||||||||||||||||||||
| Total tax affected adjustments to reported earnings per share | 0.35 | 0.10 | (0.05 | ) | 0.10 | 0.41 | 0.01 | (0.05 | ) | (0.05 | ) | 0.10 | 0.38 | 1.35 | ||||||||||||||||||||
| Impact of tax repatriation | 0.11 | 0.11 | ||||||||||||||||||||||||||||||||
| Impact of reversal of tax reserves | (0.04 | ) | (0.04 | ) | (0.22 | ) | (0.22 | ) | ||||||||||||||||||||||||||
| Adjusted earnings per share | $ | 0.42 | $ | 0.17 | $ | 0.13 | $ | 0.05 | $ | - | $ | (0.07 | ) | $ | (0.11 | ) | $ | 0.48 | $ | 0.24 | $ | (0.16 | ) | $ | (0.26 | ) | ||||||||
| (1) | Diluted earnings per share for the second quarter of 2004 has been restated to reflect the impact of adopting Emerging Issues |
Task Force (EITF) No. 04-08, " The Effect of Contingently Convertible Debt on Diluted Earnings Per Share". EITF No. 04-08 was issued and became effective in the fourth quarter of 2004.
Page 1
CTS Corporation
Reconciliation of Operating Expenses to Adjusted Operating Expenses
($ in millions)
| Full Year | ||||||||||
| 2004 | 2003 | 2002 | ||||||||
| Selling, general and administrative expenses | $ | 63.5 | $ | 56.9 | $ | 63.3 | ||||
| Research and development expenses | 19.0 | 21.5 | 24.1 | |||||||
| Restructuring and impairment charges | - | 4.6 | 18.3 | |||||||
| Gain on sale of assets | (3.9 | ) | - | - | ||||||
| Total reported operating expenses | 78.6 | 83.0 | 105.7 | |||||||
| Less restructuring and impairment charges | - | 4.6 | 18.3 | |||||||
| Less gain on sale of excess Canadian land | (2.7 | ) | - | - | ||||||
| Adjusted operating expenses | $ | 81.3 | $ | 78.4 | $ | 87.4 | ||||
| Adjusted operating expenses as a percentage of sales | 15.3 | % | 16.9 | % | 19.1 | % | ||||
Page 2
CTS Corporation
Definition of Financial Term-"Controllable Working Capital as % of Sales"
($ in millions)
| October 2, | December 31, | ||||||
| 2005 | 1999 | ||||||
| Net Accounts Receivables | $ | 93.3 | $ | 124.7 | |||
| Net Inventory | 58.3 | 78.9 | |||||
| Accounts Payables | (66.6 | ) | (68.3 | ) | |||
| Controllable Working Capital | 85.0 | 135.3 | |||||
| Quarterly sales | $ | 149.2 | |||||
| Multiplied by 4 | 4.0 | ||||||
| Annualized sales | 596.8 | 677.1 | |||||
| Controllable Working Capital % | 14.2 | % | 20.0 | % | |||
Page 3
CTS Corporation
Definition of Financial Term-"Total Debt to Capitalization"
($ in millions)
| 2005 | 2004 | 2003 | 2002 | 2001 | December 31, | ||||||||||||||||||||||||||||||||||||||
| Q3 | Q2 | Q1 | Q4 | Q3 | Q2 | Q1 | Q4 | Q3 | Q2 | Q1 | Q4 | Q4 | 2000 | ||||||||||||||||||||||||||||||
| Notes payable | $ | 3.0 | $ | 3.0 | $ | 3.5 | $ | 3.3 | $ | - | $ | - | $ | - | $ | - | $ | - | $ | - | $ | - | $ | - | $ | - | $ | 7.4 | |||||||||||||||
| Current portion of long-term debt | 0.2 | 0.3 | 0.4 | - | - | - | - | - | - | - | 18.2 | 28.4 | 27.5 | 10.0 | |||||||||||||||||||||||||||||
| Long-term debt | 94.7 | 85.6 | 133.9 | 94.2 | 87.0 | 85.0 | 81.2 | 75.9 | 81.0 | 85.3 | 67.0 | 67.0 | 125.0 | 178.0 | |||||||||||||||||||||||||||||
| Total debt | 97.9 | 88.9 | 137.8 | 97.5 | 87.0 | 85.0 | 81.2 | 75.9 | 81.0 | 85.3 | 85.2 | 95.4 | 152.5 | 195.4 | |||||||||||||||||||||||||||||
| Total shareholders' equity | 324.2 | 322.7 | 324.3 | 310.7 | 303.6 | 302.7 | 296.4 | 294.2 | 285.6 | 268.7 | 264.3 | 265.0 | 242.9 | 246.4 | |||||||||||||||||||||||||||||
| Total capitalization | $ | 422.1 | $ | 411.6 | $ | 462.1 | $ | 408.2 | $ | 390.6 | $ | 387.7 | $ | 377.6 | $ | 370.1 | $ | 366.6 | $ | 354.0 | $ | 349.5 | $ | 360.4 | $ | 395.4 | $ | 441.8 | |||||||||||||||
| Total debt to capitalization | 23.2 | % | 21.6 | % | 29.8 | % | 23.9 | % | 22.3 | % | 21.9 | % | 21.5 | % | 20.5 | % | 22.1 | % | 24.1 | % | 24.4 | % | 26.5 | % | 38.6 | % | 44.2 | % | |||||||||||||||
Page 4
CTS Corporation
Free Cash Flow
($ in millions)
| 2005 YTD | 2005 | 2004 | 2003 | Full Year | ||||||||||||||||||||||||||||||||||||||||||||||||
| Q3 | Q3 | Q2 | Q1 | Q4 | Q3 | Q2 | Q1 | Q4 | Q3 | Q2 | Q1 | 2004 | 2003 | 2002 | 2001 | 2000 | ||||||||||||||||||||||||||||||||||||
| Cash flows provided from (used by) operations | $ | 29.7 | $ | 5.1 | $ | 13.7 | $ | 10.9 | $ | 4.3 | $ | 5.0 | $ | 11.4 | $ | (6.8 | ) | $ | 10.2 | $ | 8.6 | $ | (1.3 | ) | $ | 8.2 | $ | 13.9 | $ | 25.7 | $ | 24.1 | $ | 65.8 | $ | 110.8 | ||||||||||||||||
| Capital expenditures | $ | (12.5 | ) | $ | (6.6 | ) | $ | (2.9 | ) | $ | (3.0 | ) | $ | (2.6 | ) | $ | (3.9 | ) | (4.2 | ) | (2.0 | ) | (2.8 | ) | (1.7 | ) | (2.3 | ) | (2.2 | ) | (12.7 | ) | (9.0 | ) | (12.8 | ) | (77.7 | ) | (119.2 | ) | ||||||||||||
| Free cash flow | $ | 17.2 | $ | (1.5 | ) | $ | 10.8 | $ | 7.9 | $ | 1.7 | $ | 1.1 | $ | 7.2 | $ | (8.8 | ) | $ | 7.4 | $ | 6.9 | $ | (3.6 | ) | $ | 6.0 | $ | 1.2 | $ | 16.7 | $ | 11.3 | $ | (11.9 | ) | $ | (8.4 | ) | |||||||||||||
Page 5
CTS Corporation
Reconciliation of Operating Earnings to Adjusted Operating Earnings
($ in millions)
| 2004 | 2003 | Full Year | |||||||||||||||||
| Q2 | Q3 | 2004 | 2003 | 2002 | 2001 | ||||||||||||||
| Operating earnings (loss) | $ | 10.6 | $ | (0.7 | ) | $ | 31.1 | $ | 13.8 | $ | (14.8 | ) | $ | (48.5 | ) | ||||
| Charges (credits) to reported operating earnings (loss): | |||||||||||||||||||
| Restructuring and asset impairment charges | 4.6 | 4.6 | 18.3 | 40.0 | |||||||||||||||
| Restructuring-related, one-time charges | 1.3 | 10.7 | |||||||||||||||||
| Customer reimbursement | (3.1 | ) | |||||||||||||||||
| Gain on sale of excess Canadian land | (2.7 | ) | (2.7 | ) | |||||||||||||||
| Total adjustments to reported operating earnings (loss) | (2.7 | ) | 4.6 | (2.7 | ) | 4.6 | 16.5 | 50.7 | |||||||||||
| Adjusted operating earnings | $ | 7.9 | $ | 3.9 | $ | 28.4 | $ | 18.4 | $ | 1.7 | $ | 2.2 | |||||||
| Adjusted operating earnings as a percentage of total sales | 5.7 | % | 3.6 | % | 5.3 | % | 4.0 | % | 0.4 | % | 0.4 | % | |||||||
Page 6
CTS Corporation
Reconciliation of Net Earnings to Adjusted Net Earnings
($ in millions)
| 2005 | 2004 | 2003 | Full Year | |||||||||||||||||||
| Q2 | Q2 | Q3 | 2004 | 2003 | 2002 | 2001 | ||||||||||||||||
| Net earnings (loss) | $ | 3.9 | $ | 6.9 | $ | 6.1 | $ | 19.9 | $ | 12.6 | $ | (17.9 | ) | $ | (45.4 | ) | ||||||
| Charges (credits) to reported net earnings (loss): | ||||||||||||||||||||||
| Restructuring and asset impairment charges | 4.6 | 4.6 | 18.3 | 40.0 | ||||||||||||||||||
| Restructuring-related, one-time charges | 1.3 | 10.7 | ||||||||||||||||||||
| Customer reimbursement | (3.1 | ) | ||||||||||||||||||||
| Gain on sale of excess Canadian land | - | (2.7 | ) | (2.7 | ) | |||||||||||||||||
| Total adjustments to reported net earnings (loss) | - | (2.7 | ) | 4.6 | (2.7 | ) | 4.6 | 16.5 | 50.7 | |||||||||||||
| Total adjustments, tax affected | - | (2.1 | ) | 3.4 | (2.1 | ) | 3.4 | 12.4 | 38.1 | |||||||||||||
| Impact of tax repatriation | 4.5 | |||||||||||||||||||||
| Impact of reversal of tax reserves | (1.7 | ) | (7.9 | ) | (7.9 | ) | ||||||||||||||||
| Adjusted net earnings (loss) | $ | 6.8 | $ | 4.8 | $ | 1.6 | $ | 17.8 | $ | 8.1 | $ | (5.5 | ) | $ | (7.3 | ) | ||||||
| Adjusted net earnings (loss) as a percentage of total sales | 4.3 | % | 3.5 | % | 1.5 | % | 3.3 | % | 1.7 | % | -1.2 | % | -1.3 | % | ||||||||
Page 7
CTS Corporation
ADJUSTED EBITDA
($ in millions)
| 2005 YTD | 2005 | 2004 | 2003 | Full Year | ||||||||||||||||||||||||||||||||||||||||||||||||
| Q3 | Q3 | Q2 | Q1 | Q4 | Q3 | Q2 | Q1 | Q4 | Q3 | Q2 | Q1 | 2004 | 2003 | 2002 | 2001 | 2000 | ||||||||||||||||||||||||||||||||||||
| Net earnings (loss) | $ | 13.7 | $ | 6.3 | $ | 3.9 | $ | 3.4 | $ | 6.6 | $ | 3.9 | $ | 6.9 | $ | 2.5 | $ | 3.9 | $ | 6.1 | $ | 2.0 | $ | 0.6 | $ | 19.9 | $ | 12.6 | $ | (17.9 | ) | $ | (45.4 | ) | $ | 83.8 | ||||||||||||||||
| Depreciation and amortization expense | 19.8 | 6.2 | 6.8 | 6.9 | 6.4 | 5.7 | 6.7 | 7.3 | 8.1 | 8.2 | 8.5 | 8.8 | 26.1 | 33.6 | 43.4 | 51.7 | 44.3 | |||||||||||||||||||||||||||||||||||
| Interest expense | 4.5 | 1.3 | 1.6 | 1.7 | 1.3 | 1.1 | 1.6 | 1.5 | 1.7 | 2.1 | 1.9 | 1.9 | 5.5 | 7.6 | 10.2 | 12.8 | 13.1 | |||||||||||||||||||||||||||||||||||
| Tax expense (benefit) | 7.8 | 1.9 | 4.9 | 1.0 | 2.0 | 1.2 | 2.0 | 0.9 | 1.3 | (8.5 | ) | 0.7 | 0.2 | 6.1 | (6.3 | ) | (5.9 | ) | (15.1 | ) | 32.4 | |||||||||||||||||||||||||||||||
| EBITDA | $ | 45.8 | $ | 15.7 | $ | 17.2 | $ | 13.0 | $ | 16.3 | $ | 11.9 | $ | 17.2 | $ | 12.2 | $ | 15.0 | $ | 7.9 | $ | 13.1 | $ | 11.5 | $ | 57.6 | $ | 47.5 | $ | 29.8 | $ | 4.0 | $ | 173.6 | ||||||||||||||||||
| Charges (credits) to EBITDA: | ||||||||||||||||||||||||||||||||||||||||||||||||||||
| Restructuring and asset impairment charges | 4.6 | 4.6 | 18.3 | 40.0 | ||||||||||||||||||||||||||||||||||||||||||||||||
| Restructuring-related, one-time charges | 1.3 | 10.7 | ||||||||||||||||||||||||||||||||||||||||||||||||||
| Gain on sale of excess Canadian Land | (2.7 | ) | (2.7 | ) | ||||||||||||||||||||||||||||||||||||||||||||||||
| Total adjustments to reported EBITDA | - | - | - | - | - | - | (2.7 | ) | 4.6 | (2.7 | ) | 4.6 | 19.6 | 50.7 | - | |||||||||||||||||||||||||||||||||||||
| Adjusted EBITDA | $ | 45.8 | $ | 15.7 | $ | 17.2 | $ | 13.0 | $ | 16.3 | $ | 11.9 | $ | 14.5 | $ | 12.2 | $ | 15.0 | $ | 12.5 | $ | 13.1 | $ | 11.5 | $ | 54.9 | $ | 52.1 | $ | 49.4 | $ | 54.7 | $ | 173.6 | ||||||||||||||||||
| Adjusted EBITDA % of total sales | 9.9 | % | 10.5 | % | 10.9 | % | 8.4 | % | 11.4 | % | 9.2 | % | 10.5 | % | 10.0 | % | 11.4 | % | 11.5 | % | 11.2 | % | 10.9 | % | 10.3 | % | 11.3 | % | 10.8 | % | 9.5 | % | 20.0 | % | ||||||||||||||||||
Page 8
CTS Corporation
Definition of Financial Term-"Adjusted Working Capital as % of Sales"
($ in millions)
| 2005 | 2004 | 2003 | ||||||||||||||||||||||||||||||||
| Q3 | Q2 | Q1 | Q4 | Q3 | Q2 | Q1 | Q4 | Q3 | Q2 | Q1 | ||||||||||||||||||||||||
| Current assets | $ | 191.7 | $ | 186.2 | $ | 232.3 | $ | 204.1 | $ | 209.8 | $ | 212.0 | $ | 190.8 | $ | 164.7 | $ | 164.4 | $ | 153.8 | $ | 145.8 | ||||||||||||
| Current liabilities | 114.1 | 116.9 | 121.2 | 103.0 | 103.4 | 107.9 | 110.8 | 95.7 | 93.0 | 102.5 | 120.9 | |||||||||||||||||||||||
| Working capital | 77.6 | 69.3 | 111.1 | 101.1 | 106.4 | 104.1 | 80.0 | 69.0 | 71.4 | 51.3 | 24.9 | |||||||||||||||||||||||
| Adjustments to working capital: | ||||||||||||||||||||||||||||||||||
| Cash | (17.1 | ) | (14.2 | ) | (58.2 | ) | (61.0 | ) | (47.9 | ) | (48.2 | ) | (32.9 | ) | (25.3 | ) | (19.6 | ) | (6.7 | ) | (7.7 | ) | ||||||||||||
| Notes payable | 3.0 | 3.0 | 3.5 | 3.3 | ||||||||||||||||||||||||||||||
| Current portion of long-term debt | 0.2 | 0.3 | 0.5 | 18.2 | ||||||||||||||||||||||||||||||
| Total adjustments to working capital | (13.9 | ) | (10.9 | ) | (54.2 | ) | (57.7 | ) | (47.9 | ) | (48.2 | ) | (32.9 | ) | (25.3 | ) | (19.6 | ) | (6.7 | ) | 10.5 | |||||||||||||
| Adjusted working capital | $ | 63.7 | $ | 58.4 | $ | 56.9 | $ | 43.4 | $ | 58.5 | $ | 55.9 | $ | 47.1 | $ | 43.7 | $ | 51.8 | $ | 44.6 | $ | 35.4 | ||||||||||||
| Quarterly sales | 149.2 | 158.3 | 155.3 | 142.5 | 129.1 | 137.6 | 122.1 | $ | 132.0 | $ | 108.5 | $ | 116.7 | $ | 105.8 | |||||||||||||||||||
| SMTEK January 2005 sales | - | - | 10.0 | |||||||||||||||||||||||||||||||
| Adjusted quarterly sales | 149.2 | 158.3 | 165.3 | |||||||||||||||||||||||||||||||
| Multiplied by 4 | 4 | 4 | 4 | 4 | 4 | 4 | 4 | 4 | 4 | 4 | 4 | |||||||||||||||||||||||
| Annualized sales | $ | 596.8 | $ | 633.2 | $ | 661.2 | $ | 570.0 | $ | 516.4 | $ | 550.4 | $ | 488.4 | $ | 528.0 | $ | 434.0 | $ | 466.8 | $ | 423.2 | ||||||||||||
| Adjusted working capital as a percentage of annualized sales | 10.7 | % | 9.2 | % | 8.6 | % | 7.6 | % | 11.3 | % | 10.2 | % | 9.6 | % | 8.3 | % | 11.9 | % | 9.6 | % | 8.4 | % | ||||||||||||
Page 9