![](https://capedge.com/proxy/8-K/0001140361-07-024513/ex99_11.jpg)
December 2007
Investor Presentation
www.ctscorp.com
![](https://capedge.com/proxy/8-K/0001140361-07-024513/ex99_12.jpg)
2
This presentation contains statements that are, or may be deemed to be, forward-looking statements
within the meaning of the Private Securities Litigation Reform Act of 1995. These forward-looking
statements include, but are not limited to, any financial or other guidance, or statements that reflect
our current expectations concerning future results and events, and any other statements that are not
based solely on historical fact. Readers are cautioned not to place undue reliance on these forward-
looking statements, which speak only as of the date hereof. These forward-looking statements are
made subject to certain risks, uncertainties and other factors, which could cause our actual results,
performance or achievements to differ materially from those presented in the forward-looking
statements, including, without limitation, rapid technological change and general market conditions in
the automotive, communications and computer industries; reliance on key customers; CTS’ ability to
protect its intellectual property; pricing pressures and demand for CTS’ products; risks associated
with CTS’ international operations, including trade and tariff barriers, exchange rates and political
and geopolitical risks; and the impact of the accounting misstatements at its Moorpark and Santa
Clara, California locations, including the results or the impact of the SEC’s informal inquiry into these
misstatements.
For more detailed information on the risks and uncertainties associated with CTS’ business, see the
reports CTS files with the SEC. CTS undertakes no obligation to publicly update its forward-looking
statements to reflect new information or events or circumstances that arise after the date hereof,
including market or industry changes.
reports CTS files with the SEC. CTS undertakes no obligation to publicly update its forward-looking
statements to reflect new information or events or circumstances that arise after the date hereof,
including market or industry changes.
Safe Harbor Statement
![](https://capedge.com/proxy/8-K/0001140361-07-024513/ex99_13.jpg)
3
Automotive
Electronic
Components
EMS Operations
Global Operations
![](https://capedge.com/proxy/8-K/0001140361-07-024513/ex99_14.jpg)
4
®
®
Automotive
EC
EMS
Major Customers
![](https://capedge.com/proxy/8-K/0001140361-07-024513/ex99_15.jpg)
5
Based on sales for the last four quarters through September 2007
Total CTS
EMS
59%
Components
& Sensors
41%
Automotive
27%
Communications
5%
Other
9%
Communications
15%
Computer
19%
Industrial/
Medical
17%
Defense/
Aerospace
8%
Segments
Sales By Market
![](https://capedge.com/proxy/8-K/0001140361-07-024513/ex99_16.jpg)
6
Based on origin of sales
Regions
Customers
Top
2
Diversified Customer and Geographic Base
Increasing Manufacturing in Low Cost Regions
Low Cost
Manufacturing 42%
Sales Diversification
![](https://capedge.com/proxy/8-K/0001140361-07-024513/ex99_17.jpg)
7
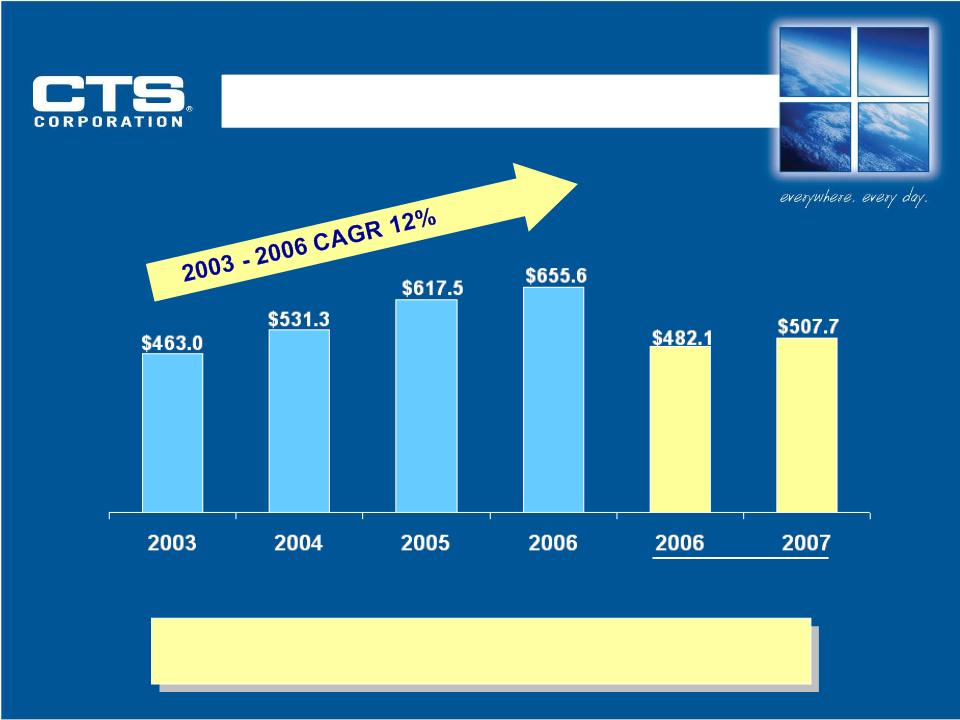
Overall Growth Target: 7% - 12%
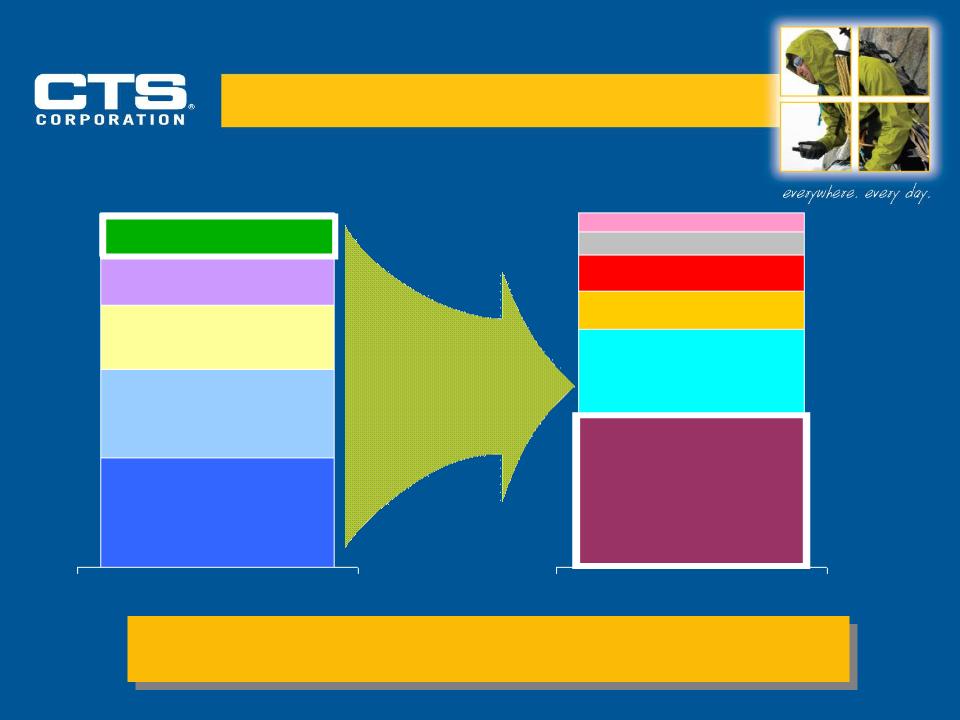
Growth Drivers 2007-2010
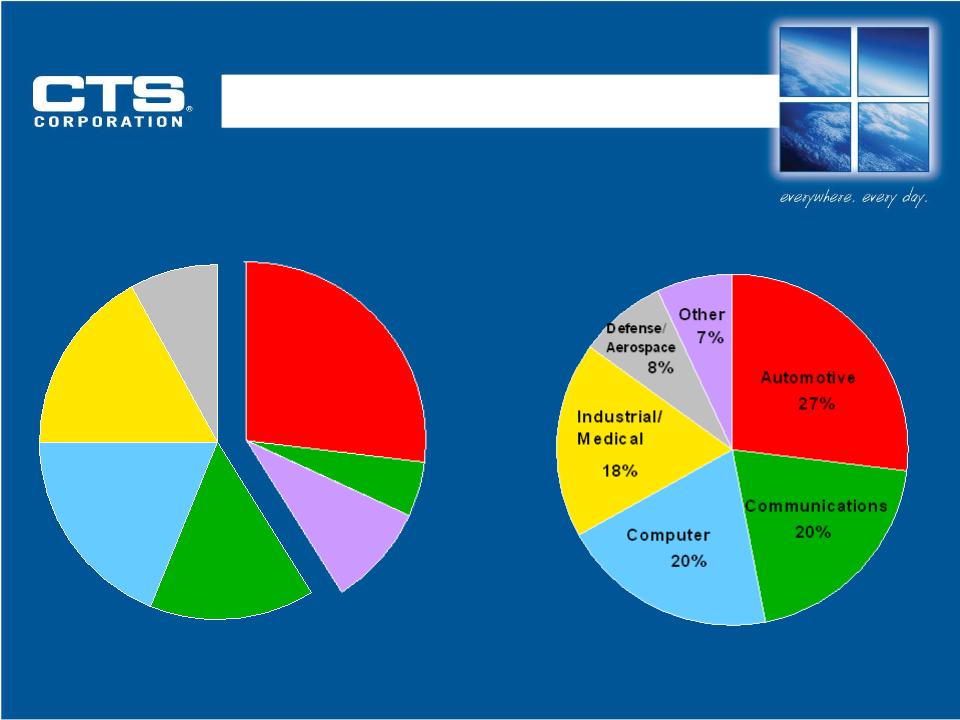
Components & Sensors Segment
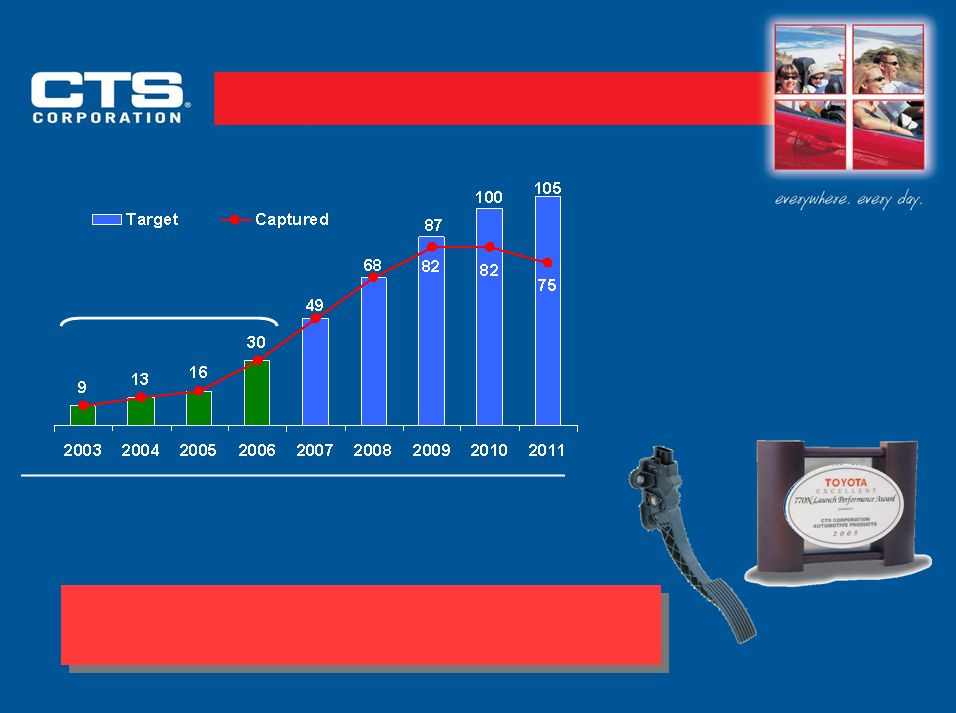
– Automotive
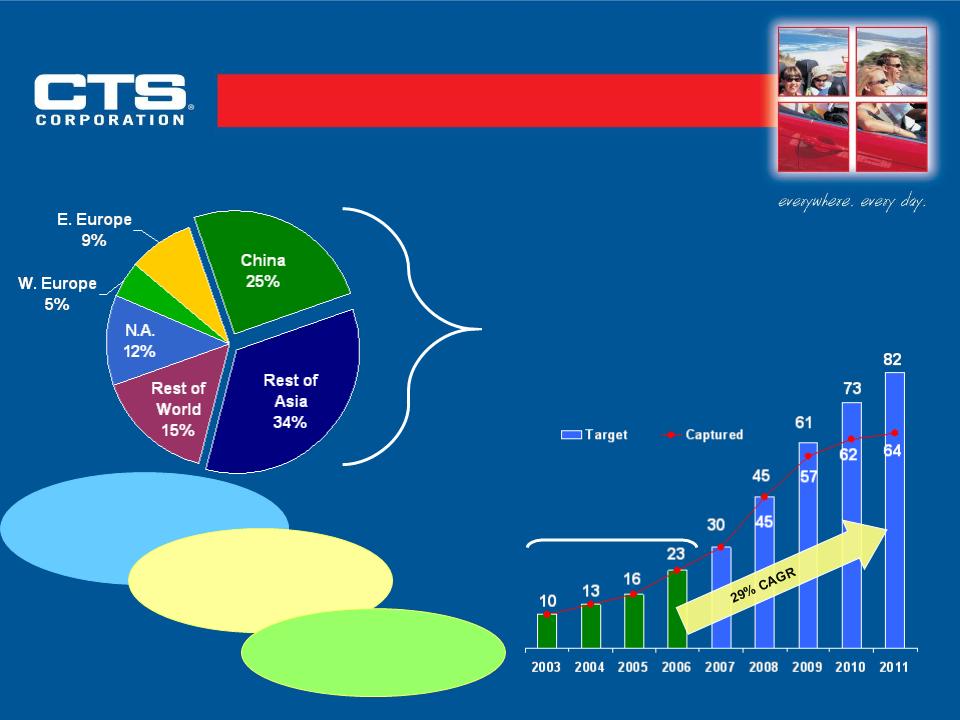
• Increasing penetration of Asian customers (eg. Toyota, Honda, Chery)
• New products and product extensions being introduced (eg. Smart Actuators, and Turbocharger sensors)
• Tighter emissions regulations will drive growth
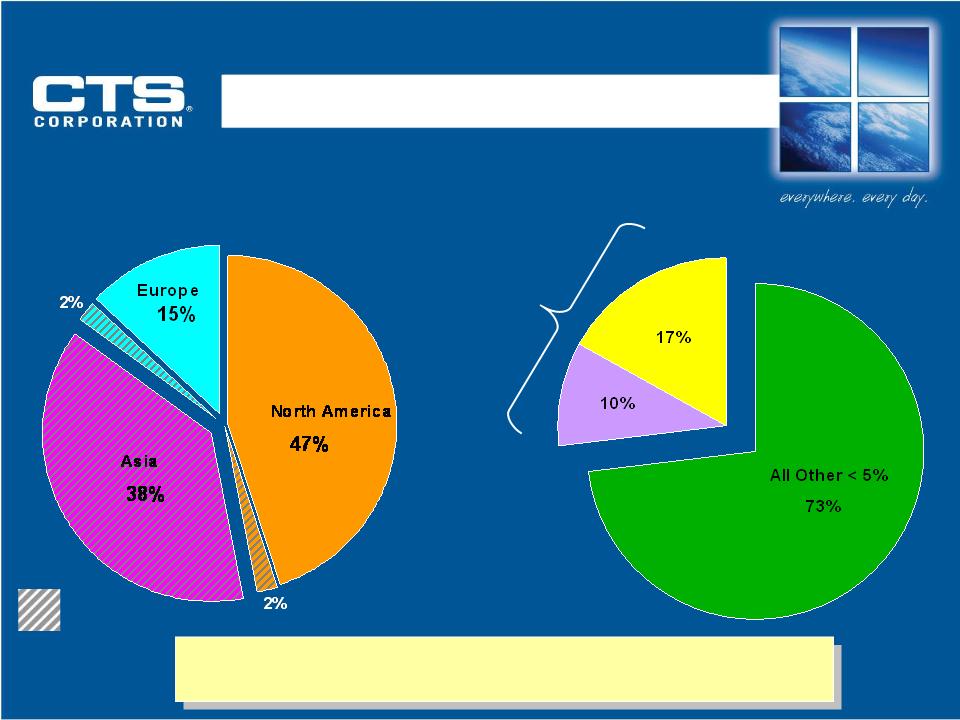
– For light vehicles, adjacent / commercial markets and Asian markets like China and India
– Electronic Components
• Communications infrastructure: New customers and products
• Military electronics: Network-centric military communications
• Piezoceramics: Extending range of capabilities (eg. Alpha Ceramics acquisition)
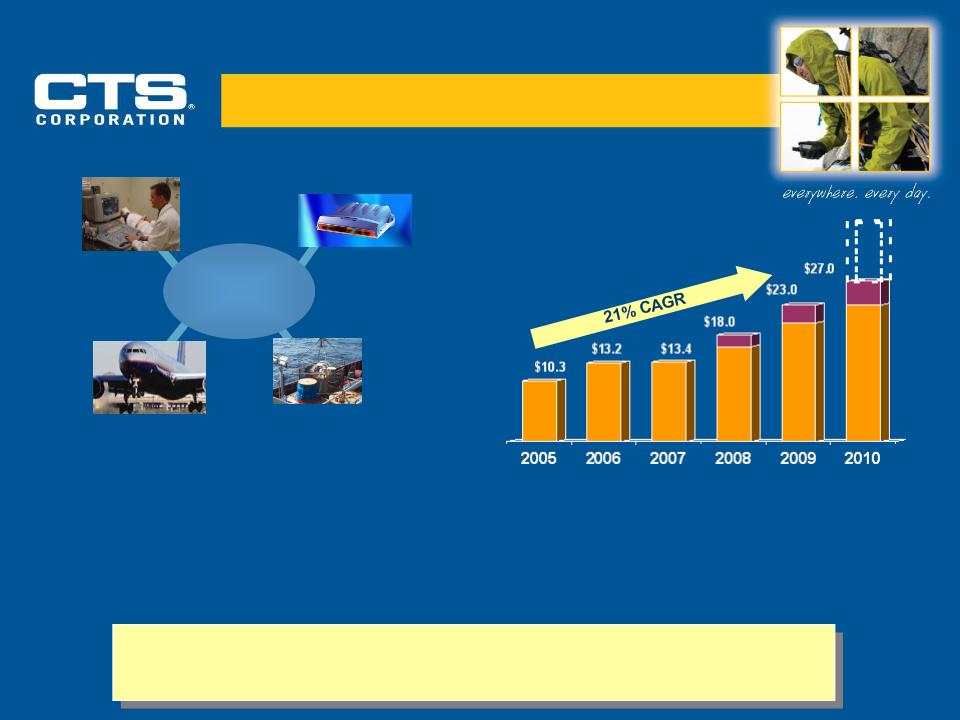
EMS Segment
– Focus on higher value-add / margin niche businesses (eg. Industrial, Defense and Aerospace, and Medical)
• Focus areas growing 20% plus per annum
• All EMS sites have achieved ISO13485 Medical Certification (New Hampshire in 2007)
• Scotland achieved AS9100 Aerospace Certification in 2007 complementing two existing facilities with similar
certifications.
certifications.
• Launched NPI Center and express prototyping service
Mergers and Acquisitions
– New process to streamline target identification, evaluation and execution
– Acquired Alpha Ceramics to add “hard” piezo capabilities
– Two acquisition candidates with revenue in $15 - $25M range under negotiations
![](https://capedge.com/proxy/8-K/0001140361-07-024513/ex99_18.jpg)
8
Realignment of Operations and
Workforce Reductions
• Workforce Reduction Announced December 12
– 103 positions eliminated
– Broad-based throughout CTS, mostly non-U.S.
• Enhanced Shared Services Model and Product Line Transfers
– Combined manufacturing support functions at locations that serve more
than one business
than one business
– Transferred product lines to better serve key customers and leverage
capacity
capacity
Financial Impact
Total expected cost of $3.0 - $3.5M, mostly severance
Payback expected in one year
Expected to Contribute Six Cents to EPS in 2008
![](https://capedge.com/proxy/8-K/0001140361-07-024513/ex99_19.jpg)
9
Strategy
• Aggressively expand product base.
– Content growth > unit growth.
• Broaden customer base.
• Leverage product/market strength into Asian market.
• Penetrate adjacent / commercial markets.
Targeting Double-Digit Growth Over
2008-2010
Automotive Products
![](https://capedge.com/proxy/8-K/0001140361-07-024513/ex99_110.jpg)
10
Leveraging Capabilities Into New Market Segments To
Drive Profitable Growth
Expanding Automotive Business Into
Adjacent Markets
Adjacent Markets
• Early Success in Serving Adjacent Markets: SETPS for
Motorcycles
Motorcycles
• New Opportunities in Larger Commercial Applications: Smart
Actuators for Diesel Engines in Trucks, Ag and Construction
Equipment
Actuators for Diesel Engines in Trucks, Ag and Construction
Equipment
– Brushless actuators with integrated position sensor for engine controls
uses technology based on CTS collaboration with Sonceboz SA
– Today annual revenues are under $10M. Commercial Market Size
estimated at $500 million
• CTS is Pursuing Strategic Opportunities to Potentially Achieve
$100M in Incremental Sales by 2012
![](https://capedge.com/proxy/8-K/0001140361-07-024513/ex99_111.jpg)
11
Awarded 66 Platforms
• CTS currently supplies 10
major customers in North
America, Europe and Asia.
major customers in North
America, Europe and Asia.
Total
Available
Market
(Including Pedal Sensors)
$150
$223
$266
$361
$381
$330
CTS Accelerator Pedal Modules Offer
Performance, Quality and Cost Advantages
CTS Sales $ in Millions
$400
Actual
$408
$414
Accelerator Pedal Module
![](https://capedge.com/proxy/8-K/0001140361-07-024513/ex99_112.jpg)
12
CTS Sales $ in Millions
Asia Over 50% of
Growth
Growth
Actual
10 Year Projected Growth In Vehicle Sales
(17M Units)
(17M Units)
China regulations driving
local content
CTS Operations in
Taiwan and China
New Zhongshan facility
fully operational
Asian Automotive Growth
![](https://capedge.com/proxy/8-K/0001140361-07-024513/ex99_113.jpg)
13
Strategy
• Focus on higher margin engineered
components.
components.
• Launch innovative and differentiating new products.
• Expand into new customers and applications.
• Leverage our global footprint and Asian manufacturing.
• Acquisitions to expand technology and product range
(eg. Alpha).
(eg. Alpha).
Leveraging Growth Opportunities
Electronic Components
![](https://capedge.com/proxy/8-K/0001140361-07-024513/ex99_114.jpg)
14
Ceramic Filters
Frequency
Components/Modules
Resistor
Diversified Product/Market Portfolio
PZT
Switches
PRODUCTS
Consumer
Industrial/Other
(incl. Hydrophones/Printers)
Communications
(Primarily Infrastructure
Applications)
Computer
MARKETS
Medical
Defense/Aerospace
Based on 2006 Sales
Electronic Components - Sales
![](https://capedge.com/proxy/8-K/0001140361-07-024513/ex99_115.jpg)
15
OCXO
RF
Module
Filter
WiMAX
Optical Networking
Cellular
Repeaters
Wireless
Base Station
Satellite
Communications
Communications
Infrastructure Sales
$ Millions
Major/New Customers
Alcatel - Lucent, Cisco,
Huawei 3-Comm, Motorola,
Nokia - Siemens, Powerwave
Huawei 3-Comm, Motorola,
Nokia - Siemens, Powerwave
Electronic Components -
Communications Infrastructure
![](https://capedge.com/proxy/8-K/0001140361-07-024513/ex99_116.jpg)
16
Sales
$ in Millions
Medical Ultrasound
Wide Format
Inkjet Printer Head
Undersea Energy
Exploration
Aerospace
Soft and Hard Piezo
Ceramic Material
• Newly acquired “hard” piezo technology to complement existing “soft”
piezo capabilities
piezo capabilities
• Potential opportunities in actuator technology due to broader capabilities
- Micro pump, haptics and linear motors
- Market size could reach > $200 million with 10%+ share
New Piezo Capabilities Is Expected to Spur
Innovation and Profitable Growth
$10M
Actuator
Driven
Alpha
Current
(Soft Pzt)
Electronic Components -
Piezo Electronic Elements
![](https://capedge.com/proxy/8-K/0001140361-07-024513/ex99_117.jpg)
17
i Target customers with complex needs.
i Target niche sectors - defense, aerospace, medical
industrial.
industrial.
i Provide turnkey services, design to direct ship.
i Leverage geographic footprint
– Local NPI and global volume assembly
– Global sourcing
Strategy
Electronics Manufacturing Solutions
![](https://capedge.com/proxy/8-K/0001140361-07-024513/ex99_118.jpg)
18
TIER 2
4Medium/ Regional/Global
$200M - $2B
$200M - $2B
4Optimized to High Mix -
Medium Volume
Medium Volume
g Medium - Large OEMs
g High Mix; Medium Volume
g Special Needs
CUSTOMER
Characteristics/Needs
EMS Companies
EMS Industry
![](https://capedge.com/proxy/8-K/0001140361-07-024513/ex99_119.jpg)
19
Computer
First Nine Months 2007
• Complexity, design capabilities, and
higher service levels
• Stronger customer relationships
• Higher barriers to entry due to
certifications, etc.
• Higher margins
• Averaged five new customers per
quarter
quarter
Improved Customer/Market Mix
Computer
Communications
Other
68%
29%
2004
Characteristics of Target Markets
EMS Business
![](https://capedge.com/proxy/8-K/0001140361-07-024513/ex99_120.jpg)
Financial Summary
Definitions and reconciliation of non-GAAP financial terms are included in the
Appendix of this presentation and on CTS’ Web site at www.ctscorp.com
![](https://capedge.com/proxy/8-K/0001140361-07-024513/ex99_121.jpg)
21
New Products/Acquisition Driving Sales Growth
$ in Millions
First Nine Months
Sales
![](https://capedge.com/proxy/8-K/0001140361-07-024513/ex99_122.jpg)
22
Earnings Growing Faster Than Revenues
Note: Excludes restructuring
Consensus includes Sidoti, Bear Stearns and Goldman Sachs
EPS (adjusted)
![](https://capedge.com/proxy/8-K/0001140361-07-024513/ex99_123.jpg)
23
Target Adjusted Return on Invested
Capital (ROIC)
Capital (ROIC)
OPERATING
MARGIN
AFTER-TAX
(NOPAT
Margin)
INVESTED CAPITAL TURNOVER
Overall ROIC Improvement on Track
2003
2004
2005
4%
2%
6%
8%
0.5
1.0
1.5
2.0
2.5
3.0
3.5
4.0%
ROIC
10%
12%
4.0
EMS
Components
& Sensors
7.9%
2006
![](https://capedge.com/proxy/8-K/0001140361-07-024513/ex99_124.jpg)
24
Capital Expenditures
Normal Level
3%
Controllable Working Capital*
Target
13%
* Controllable Working Capital Defined as Accounts Receivable + Inventories - Accounts Payable.
Efficient Utilization of Capital
4%
Balance Sheet Management
![](https://capedge.com/proxy/8-K/0001140361-07-024513/ex99_125.jpg)
25
Strong Free Cash Flow Indicates Quality of Earnings
$ in Millions
Net Earnings and Free Cash Flow
![](https://capedge.com/proxy/8-K/0001140361-07-024513/ex99_126.jpg)
26
Strong Balance Sheet
Supports Growth and Shareholder Value Initiatives
Current
Capital Structure
Total Debt to Capitalization
195
Total Debt
Cash
Debt to Capitalization
66
Equity
Capital Structure
![](https://capedge.com/proxy/8-K/0001140361-07-024513/ex99_127.jpg)
27
Expect EPS Growth > Sales Growth
Value Proposition
• Positioned in high-growth markets.
• Positive cash flow.
• Leverageable capacity and operating structure.
• Strong balance sheet and conservative capital structure.
• Acquisitions and buybacks
![](https://capedge.com/proxy/8-K/0001140361-07-024513/ex99_128.jpg)
28
APPENDIX
![](https://capedge.com/proxy/8-K/0001140361-07-024513/ex99_129.jpg)
29
Position Sensors:
Throttle Valve
Exhaust Gas Re-circulating
Accelerator
Pedal Modules:
Pedal Modules:
Pedal Position Sensors
Fuel Level
Sensing
Seat Belt
Tension Sensors
Tension Sensors
Electric Actuators:
Active Manifolds
Turbochargers
Diesel Systems
Automotive Product Applications
![](https://capedge.com/proxy/8-K/0001140361-07-024513/ex99_130.jpg)
30
Enterprise Virtual Array Systems
Storage
Infrastructure
Infrastructure
Communication
Infrastructure
Infrastructure
GSM BTS
Network Routers
3G Apps
IP Infrastructure
CDMA BTS
Wireless LAN Arrays
Medical
Devices &
Equipment
Devices &
Equipment
Defense &
Aerospace
Aerospace
Pain Management
Glucose Monitoring
CO2 Cabinets
Blood Analysis
Ophthalmology
Heart Defibrillator
Thermal Weapons
Secure Phone System
Radar Systems
Defense Comms
Airport Explosives Detection
Industrial
Applications
Applications
CNC Lathes
Process Controls
Test & Measurement
Security
Ultra High-End Workstation
HVAC
Missile Systems
Modular Storage Arrays
RAID Cards
EMS Product Applications
![](https://capedge.com/proxy/8-K/0001140361-07-024513/ex99_131.jpg)
31
Resistor &
Frequency Products
Frequency Products
Frequency Filters
and RF Modules for
Infrastructure
and RF Modules for
Infrastructure
Variable Resistors,
Encoders & Switches
Encoders & Switches
Router
Storage
Test System
Game Controller
Server
Instrument
Piezoelectric
Medical Ultrasound
Wide Format
Inkjet Printer Head
Undersea Energy
Exploration
WiMAX
Wireless
Base Station
Telematics
Washing Machine
Garage Door
Opener
Home Repeater
Aerospace
Electronic Components Product
Applications
Applications
![](https://capedge.com/proxy/8-K/0001140361-07-024513/ex99_132.jpg)
32
Electronic Components
Major CTS Competitors
PRODUCTS
Automotive Products
Frequency Products - Infrastructure
Ceramic Filters
Resistor Networks
Electronics Manufacturing Services
COMPETITION
AB Electronics, Alps, Bosch, Delphi, Denso,
Hella, Mikuni, SiemensVDO
C-MAC, M/A Com, Mtron, Raltron, Pericom,
Sirenza, Vectron, Z-Comm
Murata, TDK, UBE
BI Tech, Bourns, KOA, Vishay
Axiom, Celestica, Flextronics, Jabil,
LaBarge, Note, Plexus, Sanmina-SCI,
Simclar, Sypris Electronics, TT EMS
LaBarge, Note, Plexus, Sanmina-SCI,
Simclar, Sypris Electronics, TT EMS
![](https://capedge.com/proxy/8-K/0001140361-07-024513/ex99_133.jpg)
33
Note: Data shown excludes all restructuring and related one-time charges, asset impairments, customer reimbursement, income tax adjustment and
material asset gains, except adjusted EBITDA, which includes the customer reimbursement only.
Financial Summary
![](https://capedge.com/proxy/8-K/0001140361-07-024513/ex99_134.jpg)
34
Note: Data shown excludes restructuring costs, income tax adjustments related to repatriation and material asset gains.
Other Financial Data - Income Statement
![](https://capedge.com/proxy/8-K/0001140361-07-024513/ex99_135.jpg)
35
Other Financial Data -
Balance Sheet Metrics
CTS Corporation |
Appendix 1 |
Reconciliation of Diluted Earnings Per Share to Adjusted Diluted Earnings Per Share | ||||||||||||||||||||||||||||||||||||
2006 | 2005 | Full Year | ||||||||||||||||||||||||||||||||||
Q3 | Q2 | Q1 | Q4 | Q2 | 2005 | 2004 | 2003 | 2002 | ||||||||||||||||||||||||||||
Earnings per share | $ | 0.16 | $ | 0.14 | $ | 0.13 | $ | 0.19 | $ | 0.10 | $ | 0.53 | $ | 0.53 | $ | 0.36 | $ | (0.54 | ) | |||||||||||||||||
Tax affected charges (credits) to reported earnings per share: | ||||||||||||||||||||||||||||||||||||
Restructuring, restructuring-related, and asset impairment charges | 0.02 | 0.03 | 0.04 | 0.10 | 0.45 | |||||||||||||||||||||||||||||||
Customer reimbursement | (0.07 | ) | ||||||||||||||||||||||||||||||||||
Gain on sale of excess equipment less LTCC severance | (0.02 | ) | (0.02 | ) | ||||||||||||||||||||||||||||||||
Gain on sale of excess Canadian land | (0.05 | ) | ||||||||||||||||||||||||||||||||||
Total tax affected adjustments to reported earnings per share | 0.02 | 0.03 | 0.04 | (0.02 | ) | - | (0.02 | ) | (0.05 | ) | 0.10 | 0.38 | ||||||||||||||||||||||||
Tax impact of cash repatriation | 0.03 | 0.11 | 0.14 | |||||||||||||||||||||||||||||||||
Impact of reversal of tax reserves | (0.04 | ) | (0.04 | ) | (0.22 | ) | ||||||||||||||||||||||||||||||
Adjusted earnings per share | $ | 0.18 | $ | 0.17 | $ | 0.17 | $ | 0.20 | $ | 0.17 | $ | 0.61 | $ | 0.48 | $ | 0.24 | $ | (0.16 | ) |
Page 1
CTS Corporation
Free Cash Flow
($ in millions)
2007 | 2007 | 2006 | 2005 | Full Year | |||||||||||||||||||||||||||||||||||||
YTD | Q3 | Q2 | Q1 | Q4 | Q3 | Q2 | Q1 | Q4 | Q3 | Q2 | Q1 | 2006 | 2005 | 2004 | 2003 | 2002 | |||||||||||||||||||||||||
Cash flows provided from (used by) operations | $ | 31.2 | $ | 15.7 | $ | 11.4 | $ | 4.1 | $ | 18.7 | $ | 11.1 | $ | 14.8 | $ | 2.6 | $ | 14.8 | $ | 5.1 | $ | 13.7 | $ | 10.9 | $ | 47.2 | $ | 44.5 | $ | 14.0 | $ | 25.7 | $ | 24.1 | |||||||
Capital expenditures | (9.3) | (3.0) | (3.6) | (2.7) | (4.7) | (5.2) | (3.4) | (2.5) | $ | (2.5) | (6.6) | (2.9) | (3.0) | (15.8) | (15.0) | (12.7) | (9.0) | (12.8) | |||||||||||||||||||||||
Free cash flow | $ | 21.9 | $ | 12.7 | $ | 7.8 | $ | 1.4 | $ | 14.0 | $ | 5.9 | $ | 11.4 | $ | 0.1 | $ | 12.3 | $ | (1.5) | $ | 10.8 | $ | 7.9 | $ | 31.4 | $ | 29.5 | $ | 1.3 | $ | 16.7 | $ | 11.3 |
Page 2
CTS Corporation | ||||||||
Definition of Financial Term-"Controllable Working Capital as % of Annualized Sales" | ||||||||
($ in millions) | ||||||||
December 31, | December 31, | |||||||
2006 | 1999 | |||||||
Net Accounts Receivables | $ | 106.0 | $ | 124.7 | ||||
Net Inventory | 60.5 | 78.9 | ||||||
Accounts Payables | (78.2 | ) | (68.3 | ) | ||||
Controllable Working Capital | 88.3 | 135.3 | ||||||
Controllable Working Capital % | 12.7 | % | 20.0 | % |
Page 3
CTS Corporation | ||||||||||||||||||||||||||||||||||||||||||||||||||||||||||||||||
Definition of Financial Term-"Total Debt to Capitalization" | ||||||||||||||||||||||||||||||||||||||||||||||||||||||||||||||||
($ in millions) | ||||||||||||||||||||||||||||||||||||||||||||||||||||||||||||||||
2007 | 2006 | 2005 | 2004 | 2003 | 2002 | 2001 | 2000 | |||||||||||||||||||||||||||||||||||||||||||||||||||||||||
Q3 | Q2 | Q1 | Q4 | Q3 | Q2 | Q1 | Q4 | Q3 | Q2 | Q1 | Q4 | Q4 | Q4 | Q4 | Q4 | |||||||||||||||||||||||||||||||||||||||||||||||||
Notes payable | $ | 1.9 | $ | 1.5 | $ | 3.5 | $ | 5.4 | $ | 9.5 | $ | 12.1 | $ | 14.1 | $ | 13.3 | $ | 3.0 | $ | 3.0 | $ | 3.5 | $ | 3.3 | $ | - | $ | - | $ | - | $ | 7.4 | ||||||||||||||||||||||||||||||||
Current portion of long-term debt | - | - | - | 0.2 | 0.2 | 0.2 | 0.2 | 0.2 | 0.2 | 0.3 | 0.5 | - | 28.4 | 27.5 | 10.0 | |||||||||||||||||||||||||||||||||||||||||||||||||
Long-term debt | 60.0 | 60.0 | 60.0 | 60.6 | 60.6 | 64.3 | 68.2 | 68.3 | 94.7 | 85.6 | 133.9 | 94.2 | 75.9 | 67.0 | 125.0 | 178.0 | ||||||||||||||||||||||||||||||||||||||||||||||||
Total debt | 61.9 | 61.5 | 63.5 | 66.2 | 70.3 | 76.6 | 82.5 | 81.8 | 97.9 | 88.9 | 137.9 | 97.5 | 75.9 | 95.4 | 152.5 | 195.4 | ||||||||||||||||||||||||||||||||||||||||||||||||
Total shareholders' equity | 329.6 | 325.5 | 323.6 | 319.0 | 346.5 | 339.5 | 333.6 | 328.1 | 323.8 | 322.7 | 324.3 | 310.7 | 294.2 | 265.0 | 242.9 | 246.4 | ||||||||||||||||||||||||||||||||||||||||||||||||
Total capitalization | $ | 391.6 | $ | 387.0 | $ | 387.1 | $ | 385.2 | $ | 416.8 | $ | 416.1 | $ | 416.1 | $ | 409.9 | $ | 421.7 | $ | 411.6 | $ | 462.2 | $ | 408.2 | $ | 370.1 | $ | 360.4 | $ | 395.4 | $ | 441.8 | ||||||||||||||||||||||||||||||||
Total debt to capitalization | 15.8 | % | 15.9 | % | 16.4 | % | 17.2 | % | 16.9 | % | 18.4 | % | 19.8 | % | 20.0 | % | 23.2 | % | 21.6 | % | 29.8 | % | 23.9 | % | 20.5 | % | 26.5 | % | 38.6 | % | 44.2 | % |
Page 4
CTS Corporation | ||||||||||||||||||||||||||||||||||||
Reconciliation of Operating Earnings to Adjusted Operating Earnings | ||||||||||||||||||||||||||||||||||||
($ in millions) | ||||||||||||||||||||||||||||||||||||
2006 | 2006 | 2006 | 2005 | Full Year | ||||||||||||||||||||||||||||||||
Q3 | Q2 | Q1 | Q4 | 2006 | 2005 | 2004 | 2003 | 2002 | ||||||||||||||||||||||||||||
Operating earnings (loss) | $ | 8.5 | $ | 7.6 | $ | 7.6 | $ | 13.5 | $ | 32.8 | $ | 37.9 | $ | 31.1 | $ | 13.8 | $ | (14.8 | ) | |||||||||||||||||
Charges (credits) to reported operating earnings (loss): | ||||||||||||||||||||||||||||||||||||
Restructuring, restructuring-related, and asset impairment charges | 0.8 | 1.4 | 2.1 | 4.3 | 4.6 | 19.6 | ||||||||||||||||||||||||||||||
Customer reimbursement | (3.1 | ) | ||||||||||||||||||||||||||||||||||
Gain on sale of excess equipment less LTCC severance | (1.2 | ) | (1.2 | ) | ||||||||||||||||||||||||||||||||
Gain on sale of excess Canadian land | (2.7 | ) | ||||||||||||||||||||||||||||||||||
Total adjustments to reported operating earnings (loss) | 0.8 | 1.4 | 2.1 | (1.2 | ) | 4.3 | (1.2 | ) | (2.7 | ) | 4.6 | 16.5 | ||||||||||||||||||||||||
Adjusted operating earnings, excluding the above referenced items | $ | 9.3 | $ | 9.0 | $ | 9.7 | $ | 12.3 | $ | 37.1 | $ | 36.7 | $ | 28.4 | $ | 18.4 | $ | 1.7 | ||||||||||||||||||
Adjusted operating earnings, excluding the above reference items, as a percentage of total sales | 5.6 | % | 5.4 | % | 6.5 | % | 7.9 | % | 5.7 | % | 5.9 | % | 5.3 | % | 4.0 | % | 0.4 | % |
Page 5
CTS Corporation | ||||||||||||||||||||||||||||||||||||||||
Reconciliation of Net Earnings to Adjusted Net Earnings | ||||||||||||||||||||||||||||||||||||||||
($ in millions) | ||||||||||||||||||||||||||||||||||||||||
2006 | 2005 | Full Year | ||||||||||||||||||||||||||||||||||||||
Q3 | Q2 | Q1 | Q4 | Q2 | 2006 | 2005 | 2004 | 2003 | 2002 | |||||||||||||||||||||||||||||||
Net earnings (loss) | $ | 6.2 | $ | 5.3 | $ | 5.0 | $ | 7.5 | $ | 3.9 | $ | 24.2 | $ | 20.8 | $ | 19.9 | $ | 12.6 | $ | (17.9 | ) | |||||||||||||||||||
Charges (credits) to reported net earnings (loss): | ||||||||||||||||||||||||||||||||||||||||
Restructuring, restructuring-related, and asset impairment charges | 0.8 | 1.4 | 2.1 | 4.3 | 4.6 | 19.6 | ||||||||||||||||||||||||||||||||||
Customer reimbursement | (3.1 | ) | ||||||||||||||||||||||||||||||||||||||
Gain on sale of excess equipment less LTCC severance | (1.2 | ) | (1.2 | ) | ||||||||||||||||||||||||||||||||||||
Gain on sale of excess Canadian land | (2.7 | ) | ||||||||||||||||||||||||||||||||||||||
Total adjustments to reported net earnings (loss) | 0.8 | 1.4 | 2.1 | (1.2 | ) | - | 4.3 | (1.2 | ) | (2.7 | ) | 4.6 | 16.5 | |||||||||||||||||||||||||||
Total adjustments, tax affected | 0.6 | 1.1 | 1.6 | (0.9 | ) | - | 3.4 | (0.9 | ) | (2.1 | ) | 3.4 | 12.4 | |||||||||||||||||||||||||||
Tax impact of cash repatriation, net of tax benefit relating to reversal of income tax reserves in certain foreign jurisdictions | 1.5 | 4.5 | 6.0 | |||||||||||||||||||||||||||||||||||||
Impact of reversal of tax reserves | (1.7 | ) | (1.7 | ) | (7.9 | ) | ||||||||||||||||||||||||||||||||||
Adjusted net earnings (loss) | $ | 6.8 | $ | 6.4 | $ | 6.6 | $ | 8.1 | $ | 6.7 | $ | 27.6 | $ | 24.2 | $ | 17.8 | $ | 8.1 | $ | (5.5 | ) | |||||||||||||||||||
Adjusted net earnings (loss) as a percentage of total sales | 4.1 | % | 3.9 | % | 4.4 | % | 5.2 | % | 4.3 | % | 4.2 | % | 3.9 | % | 3.3 | % | 1.7 | % | -1.2 | % |
Page 6
CTS Corporation | ||||||||
Reconciliation of Gross Margin to Adjusted Gross Margin | ||||||||
($ in millions) | ||||||||
Q2 | Q1 | |||||||
2006 | 2006 | |||||||
Gross Margin | $ | 31.8 | $ | 30.0 | ||||
Charges (credits) to reported gross margin: | ||||||||
Restructuring-related costs included in cost of goods sold | 0.5 | 0.2 | ||||||
Total adjustments to reported gross margin | 0.5 | 0.2 | ||||||
Adjusted gross margin | $ | 32.3 | 30.2 | |||||
Adjusted gross margin as a percentage of total sales | 19.5 | % | 20.1 | % |
Page 7
ADJUSTED EBITDA ($ in millions) | |||||||||||||||||||||
2007 | 2007 | 2006 | 2005 | Full Year | |||||||||||||||||
YTD | Q3 | Q2 | Q1 | Q4 | Q3 | Q2 | Q1 | Q4 | Q3 | Q2 | Q1 | 2006 | 2005 | 2004 | 2003 | 2002 | |||||
Net earnings (loss) | $ 17.7 | $ 7.8 | $ 5.9 | $ 4.0 | $ 7.7 | $ 6.2 | $ 5.3 | $ 5.0 | $ 7.6 | $ 5.9 | $ 3.9 | $ 3.4 | $ 24.2 | $ 20.8 | $ 19.9 | $ 12.6 | $ (17.9) | ||||
Depreciation and amortization expense | 17.0 | 5.4 | 5.8 | 5.8 | 5.9 | 5.8 | 6.5 | 6.7 | 7.2 | 6.2 | 6.8 | 6.9 | 24.9 | 27.1 | 26.1 | 33.6 | 43.4 | ||||
Interest expense | 2.3 | 0.9 | 0.7 | 0.7 | 0.8 | 0.8 | 1.0 | 1.1 | 1.3 | 1.3 | 1.6 | 1.7 | 3.7 | 5.9 | 5.5 | 7.6 | 10.2 | ||||
Tax expense (benefit) | 4.8 | 2.1 | 1.6 | 1.1 | 1.5 | 1.9 | 1.5 | 1.6 | 4.8 | 1.6 | 4.9 | 1.0 | 6.5 | 12.3 | 6.1 | (6.3) | (5.9) | ||||
EBITDA | $ 41.8 | $ 16.2 | $ 14.0 | $ 11.6 | $ 15.9 | $ 14.7 | $ 14.3 | $ 14.4 | $ 20.9 | $ 15.0 | $ 17.2 | $ 13.0 | $ 59.3 | $ 66.1 | $ 57.6 | $ 47.5 | $ 29.8 | ||||
Charges (credits) to EBITDA: | |||||||||||||||||||||
Restructuring, restructuring-related, and asset impairment charges | 0.8 | 1.4 | 2.1 | 4.3 | 4.6 | 19.6 | |||||||||||||||
Customer reimbursement | (3.1) | ||||||||||||||||||||
Gain on sale of excess equipment less LTCC severance | (1.2) | (1.2) | |||||||||||||||||||
Gain on sale of excess Canadian Land | (2.7) | ||||||||||||||||||||
Total adjustments to reported EBITDA | - | - | - | - | - | 0.8 | 1.4 | 2.1 | (1.2) | - | - | - | 4.3 | (1.2) | (2.7) | 4.6 | 16.5 | ||||
Adjusted EBITDA | $ 41.8 | $ 16.2 | $ 14.0 | $ 11.6 | $ 15.9 | $ 15.5 | $ 15.7 | $ 16.5 | $ 19.7 | $ 15.0 | $ 17.2 | $ 13.0 | $ 63.6 | $ 64.9 | $ 54.9 | $ 52.1 | $ 46.3 | ||||
Adjusted EBITDA % of total sales | 8.2% | 9.3% | 8.3% | 7.1% | 9.2% | 9.4% | 9.5% | 11.0% | 12.7% | 10.1% | 10.9% | 8.4% | 9.7% | 10.5% | 10.3% | 11.3% | 10.1% |
Page 8
CTS Corporation | ||||||||||||||||
Definition of Financial Term - | ||||||||||||||||
Adjusted Return on Invested Capital | ||||||||||||||||
Full Year | ||||||||||||||||
2006 | 2005 | 2004 | 2003 | |||||||||||||
Operating earnings | $ | 32.8 | $ | 37.9 | $ | 31.1 | $ | 13.8 | ||||||||
Charges (credits) to reported operating earnings: | ||||||||||||||||
Restructuring and asset impairment charges | 4.3 | 4.6 | ||||||||||||||
Gain on sale of excess equipment less LTCC severance | (1.2 | ) | ||||||||||||||
Gain on sale of excess Canadian land | (2.7 | ) | ||||||||||||||
Total adjustments to reported operating earnings | 4.3 | (1.2 | ) | (2.7 | ) | 4.6 | ||||||||||
Adjusted operating earnings | $ | 37.1 | $ | 36.7 | $ | 28.4 | $ | 18.4 | ||||||||
Tax rate | 21 | % | 24 | % | 23 | % | 25 | % | ||||||||
Tax effected adjusted operating earnings | $ | 29.3 | $ | 27.9 | $ | 21.9 | $ | 13.8 | ||||||||
Invested Capital: | ||||||||||||||||
Current Year: | ||||||||||||||||
Shareholders' equity | $ | 319.0 | $ | 328.1 | $ | 310.7 | $ | 294.2 | ||||||||
Long-term debt | 60.6 | 68.3 | 94.2 | 75.9 | ||||||||||||
Notes payable and current portion of LT debt | 5.6 | 13.5 | 3.3 | - | ||||||||||||
Less: Cash | (38.6 | ) | (12.0 | ) | (61.0 | ) | (25.4 | ) | ||||||||
Invested capital | $ | 346.6 | 397.9 | 347.2 | 344.7 | |||||||||||
Prior Year: | ||||||||||||||||
Shareholders' equity | 328.1 | 310.7 | 294.2 | 265.0 | ||||||||||||
Long-term debt | 68.3 | 94.2 | 75.9 | 67.0 | ||||||||||||
Notes payable and current portion of LT debt | 13.5 | 3.3 | - | 28.3 | ||||||||||||
Less: Cash | (12.0 | ) | (61.0 | ) | (25.4 | ) | (9.2 | ) | ||||||||
Invested capital | 397.9 | 347.2 | 344.7 | 351.1 | ||||||||||||
Adjusted invested capital | $ | 372.3 | $ | 372.6 | $ | 346.0 | $ | 347.9 | ||||||||
Adjusted return on invested capital | 7.9 | % | 7.5 | % | 6.3 | % | 4.0 | % | ||||||||
Sales | $ | 655.6 | $ | 617.5 | $ | 531.3 | $ | 463.0 | ||||||||
Tax effected adjusted operating earnings | 29.3 | 27.9 | 21.9 | 13.8 | ||||||||||||
Tax effected adjusted operating margin as a percentage of sales (a) | 4.5 | % | 4.5 | % | 4.1 | % | 3.0 | % | ||||||||
Sales | $ | 655.6 | $ | 617.5 | $ | 531.3 | $ | 463.0 | ||||||||
Adjusted invested capital | 372.3 | 372.6 | 346.0 | 347.9 | ||||||||||||
Invested capital turns (b) | 1.76 | 1.66 | 1.54 | 1.33 | ||||||||||||
Adjusted return on invested capital (a) x (b) | 7.9 | % | 7.5 | % | 6.3 | % | 4.0 | % |
Page 9
CTS Corporation | ||||||||
Reconciliation of Project Full Year Earnings Per Share to Adjusted Projected Earnings Per Share | ||||||||
Year Ended December 31, 2007 (2) | Year Ended December 31, 2006 (1) | |||||||
Projected GAAP earnings per share | $ | 0.59 - $0.62 | $ | 0.66 - $0.69 | ||||
Restructuring and related charges | 0.06 | 0.08 | ||||||
Adjusted earnings per share | $ | 0.65 - $0.68 | $ | 0.74 - $0.77 |
1. Estimate as of 10/24/2006 | ||||||||
2. Estimate as of 10/23/2007 |
Page 10