Free signup for more
- Track your favorite companies
- Receive email alerts for new filings
- Personalized dashboard of news and more
- Access all data and search results
Filing tables
Filing exhibits
CW similar filings
- 16 Feb 17 Curtiss-Wright Reports Fourth Quarter and Full-Year 2016 Financial Results and Issues 2017 Guidance
- 8 Dec 16 Other Events
- 27 Oct 16 Curtiss-Wright Reports Third Quarter 2016 Financial Results; Maintains Full-Year EPS And Increases Operating Margin Guidance
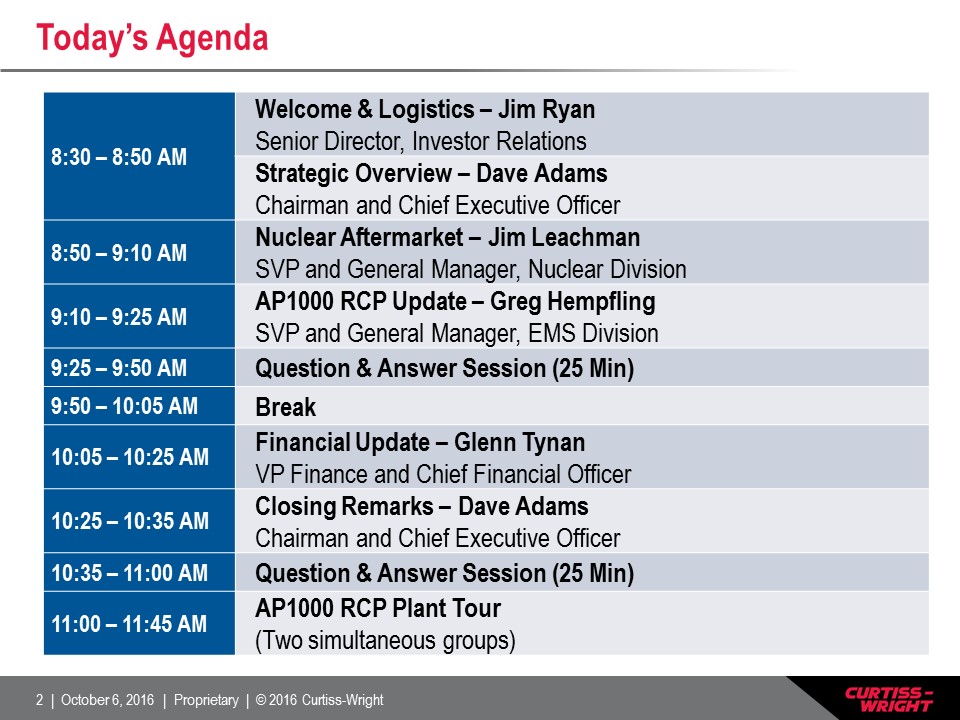
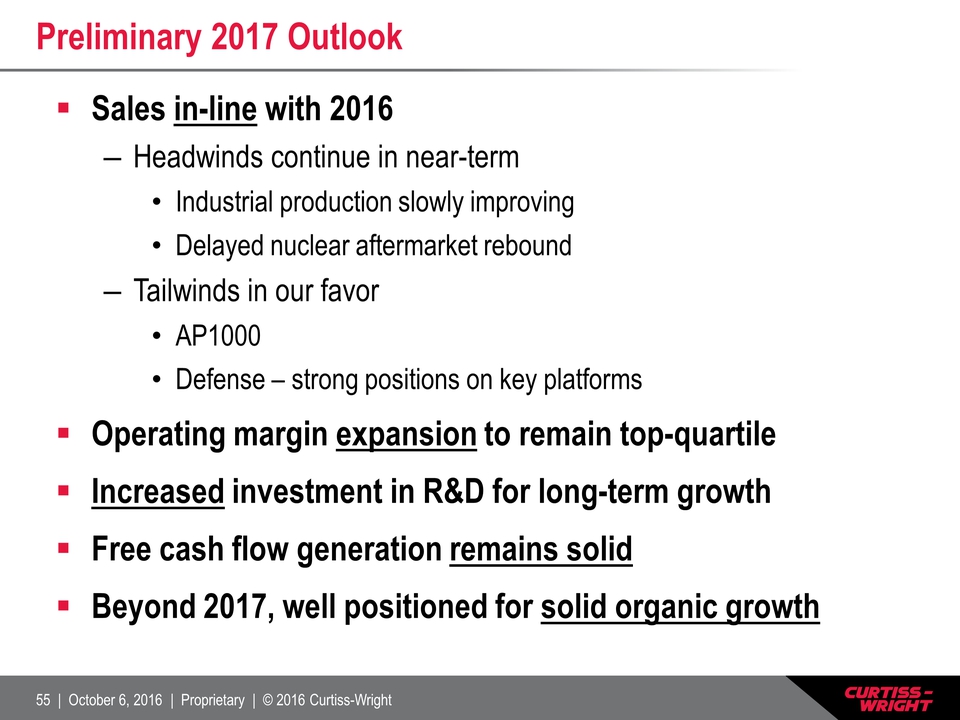
- 6 Oct 16 Curtiss-Wright Reaffirms 2016 Guidance and Offers Initial 2017 Outlook
- 28 Jul 16 Curtiss-Wright Reports Second Quarter 2016 Financial Results; Maintains Full-Year EPS and Increases Free Cash Flow Guidance
- 9 May 16 Submission of Matters to a Vote of Security Holders
- 5 May 16 Curtiss-Wright Reports First Quarter 2016 Financial Results; Raises Full-Year Free Cash Flow Guidance
Filing view
External links