Exhibit 99.2

1 | February 16, 2017 | © 2017 Curtiss-Wright 4Q and FY 2016 Earnings Conference Call February 16, 2017 NYSE: CW
2 | February 16, 2017 | © 2017 Curtiss-Wright Safe Harbor Statement Please note that the information provided in this presentation is accurate as of the date of the original presentation. The presentation will remain posted on this website from one to twelve months following the initial presentation, but content will not be updated to reflect new information that may become available after the original presentation posting. The presentation contains forward-looking statements including, among other things, management's estimates of future performance, revenue and earnings, our management's growth objectives and our management's ability to produce consistent operating improvements. These forward-looking statements are based on expectations as of the time the statements were made only, and are subject to a number of risks and uncertainties which could cause us to fail to achieve our then-current financial projections and other expectations. This presentation also includes certain non-GAAP financial measures with reconciliations being made available in the earnings release that is posted to our website and furnished with the SEC. We undertake no duty to update this information. More information about potential factors that could affect our business and financial results is included in our filings with the Securities and Exchange Commission, including our Annual Reports on Form 10-K and Quarterly Reports on Form 10-Q, including, among other sections, under the captions, "Risk Factors" and "Management's Discussion and Analysis of Financial Condition and Results of Operations," which is on file with the SEC and available at the SEC's website at www.sec.gov.
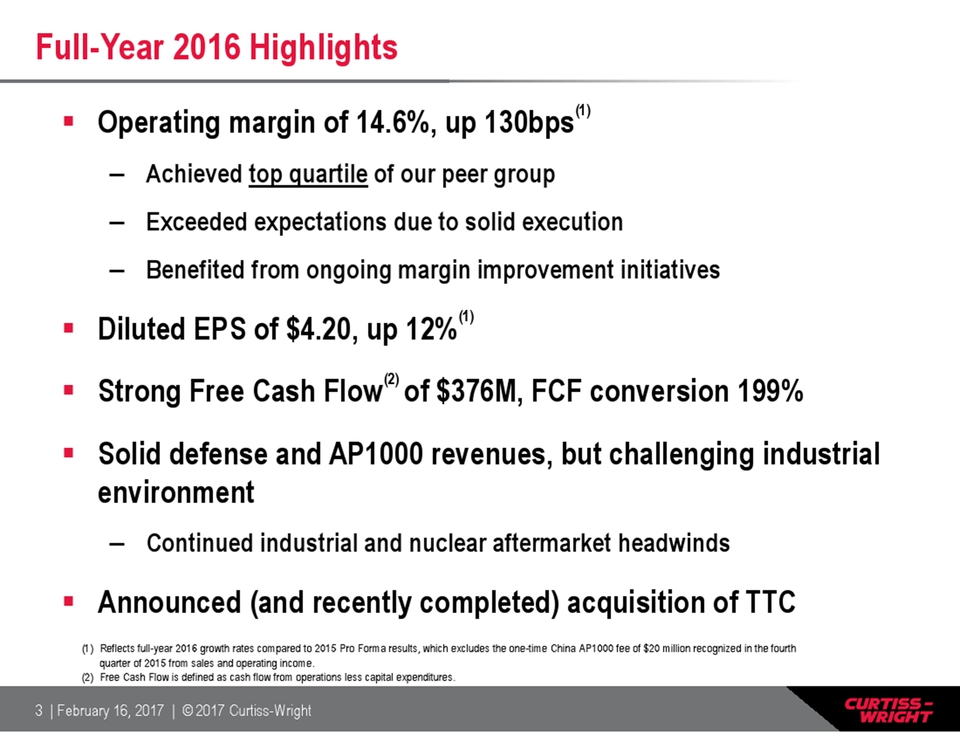
3 | February 16, 2017 | © 2017 Curtiss-Wright Full-Year 2016 Highlights Operating margin of 14.6%, up 130bps(1) – Achieved top quartile of our peer group – Exceeded expectations due to solid execution – Benefited from ongoing margin improvement initiatives Diluted EPS of $4.20, up 12%(1) Strong Free Cash Flow(2) of $376M, FCF conversion 199% Solid defense and AP1000 revenues, but challenging industrial environment – Continued industrial and nuclear aftermarket headwinds Announced (and recently completed) acquisition of TTC (1) Reflects full-year 2016 growth rates compared to 2015 Pro Forma results, which excludes the one-time China AP1000 fee of $20 million recognized in the fourth quarter of 2015 from sales and operating income. (2) Free Cash Flow is defined as cash flow from operations less capital expenditures
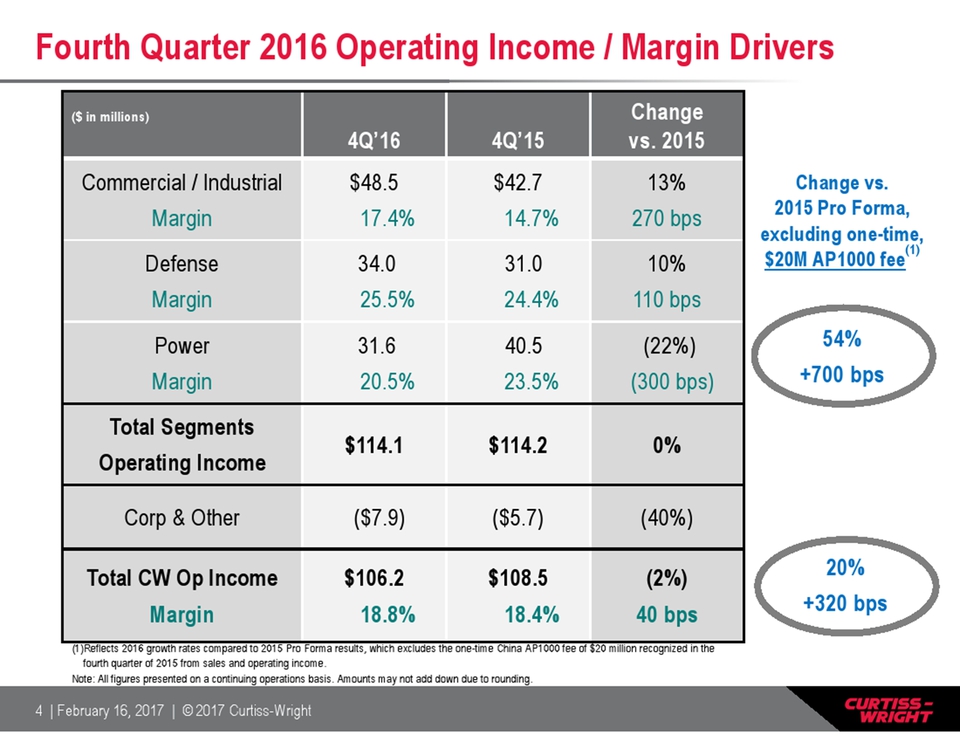
4 | February 16, 2017 | © 2017 Curtiss-Wright Fourth Quarter 2016 Operating Income / Margin Drivers ($ in millions) 4Q’16 4Q’15 Change vs. 2015 Commercial / Industrial Margin $48.5 17.4% $42.7 14.7% 13% 270 bps Defense Margin 34.0 25.5% 31.0 24.4% 10% 110 bps Power Margin 31.6 20.5% 40.5 23.5% (22%) (300 bps) Total Segments Operating Income $114.1 $114.2 0% Corp & Other ($7.9) ($5.7) (40%) Total CW Op Income Margin $106.2 18.8% $108.5 18.4% (2%) 40 bps Note: All figures presented on a continuing operations basis. Amounts may not add down due to rounding. 20% +320 bps Change vs. 2015 Pro Forma, excluding one-time, $20M AP1000 fee(1) 54% +700 bps (1)Reflects 2016 growth rates compared to 2015 Pro Forma results, which excludes the one-time China AP1000 fee of $20 million recognized in the fourth quarter of 2015 from sales and operating income
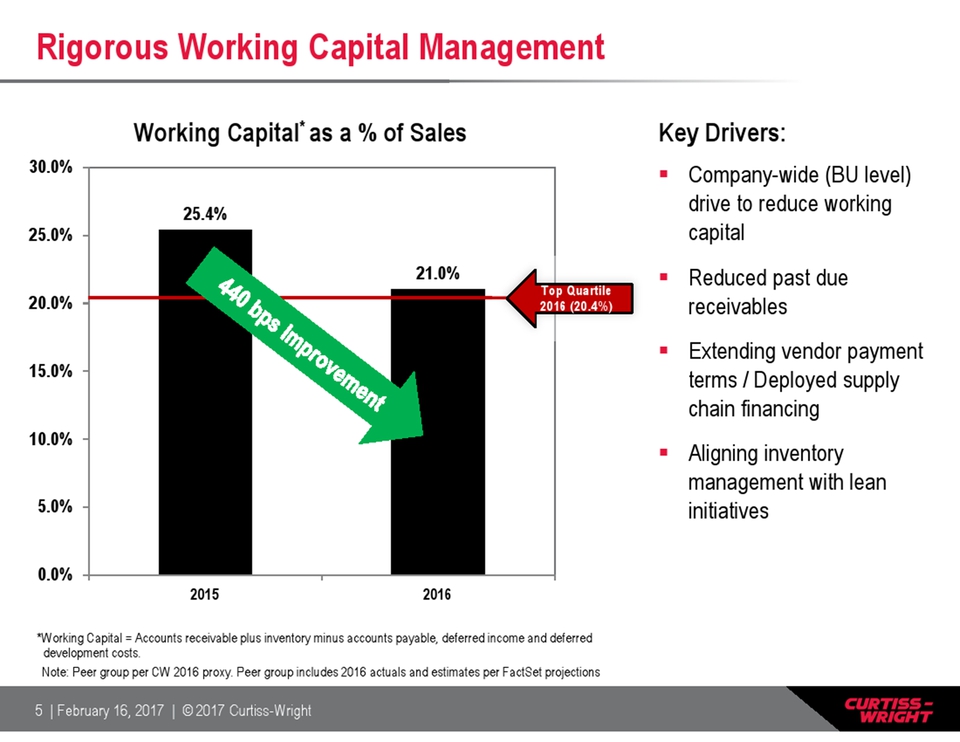
5 | February 16, 2017 | © 2017 Curtiss-Wright Rigorous Working Capital Management 25.4% 21.0% 0.0% 5.0% 10.0% 15.0% 20.0% 25.0% 30.0% 2015 2016 Working Capital* as a % of Sales *Working Capital = Accounts receivable plus inventory minus accounts payable, deferred income and deferred development costs. Note: Peer group per CW 2016 proxy. Peer group includes 2016 actuals and estimates per Fact Set projections Key Drivers: Company-wide (BU level) drive to reduce working capital Reduced past due receivables Extending vendor payment terms / Deployed supply chain financing Aligning inventory management with lean initiatives

6 | February 16, 2017 | © 2017 Curtiss-Wright Strong Free Cash Flow Generation $166 $265 $272 119% 156% 153% 80% 100% 120% 140% 160% 180% 200% 220% 240% $0 $50 $100 $150 $200 $250 $300 $350 $400 $450 2013 2014 2015 Pro Forma 2016 FCF $376 Notes: Free cash flow is defined as cash flow from operations less capital expenditures. 2015 adjusted to remove the $145 million contribution to the Company’s corporate defined benefit pension plan. FCF conversion is defined as free cash flow divided by net earnings from continuing operations. 199% Free cash flow ($ in millions) Free cash flow conversion (%) Targets (est. in 2016): Minimum free cash flow of $250 Million Average free cash flow conversion of at least 125%
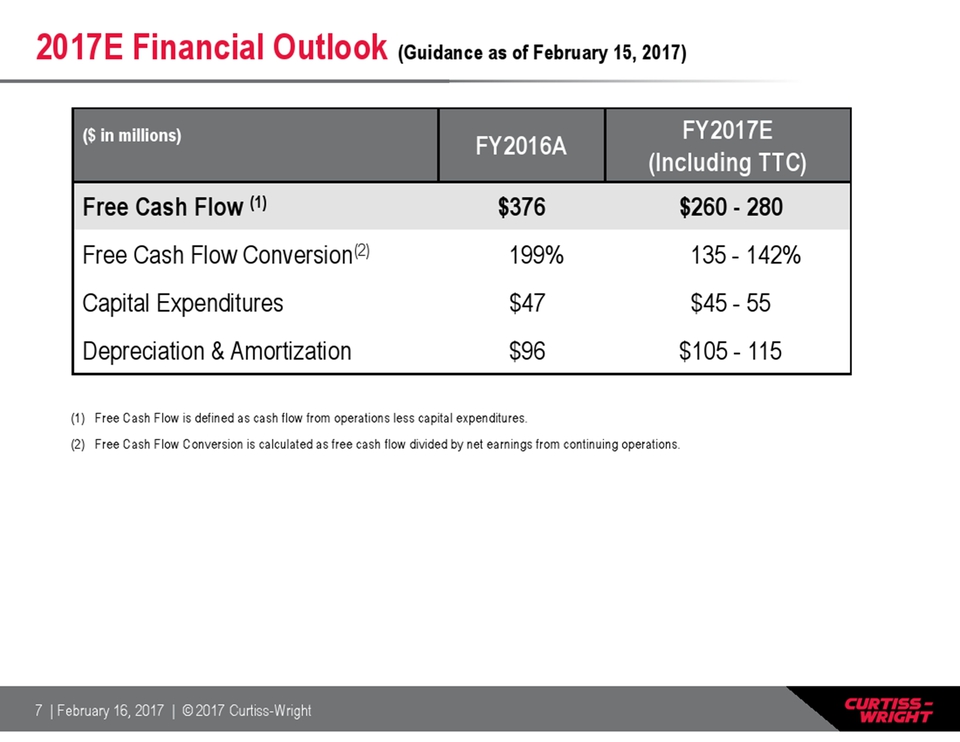
7 | February 16, 2017 | © 2017 Curtiss-Wright 2017E Financial Outlook (Guidance as of February 15, 2017) ($ in millions) FY2016A FY2017E (Including TTC) Free Cash Flow (1) $376 $260 – 280 Free Cash Flow Conversion(2) 199% 135 - 142% Capital Expenditures $47 $45 – 55 Depreciation & Amortization $96 $105 – 115 (1) Free Cash Flow is defined as cash flow from operations less capital expenditures. (2) Free Cash Flow Conversion is calculated as free cash flow divided by net earnings from continuing operations.
 \
\
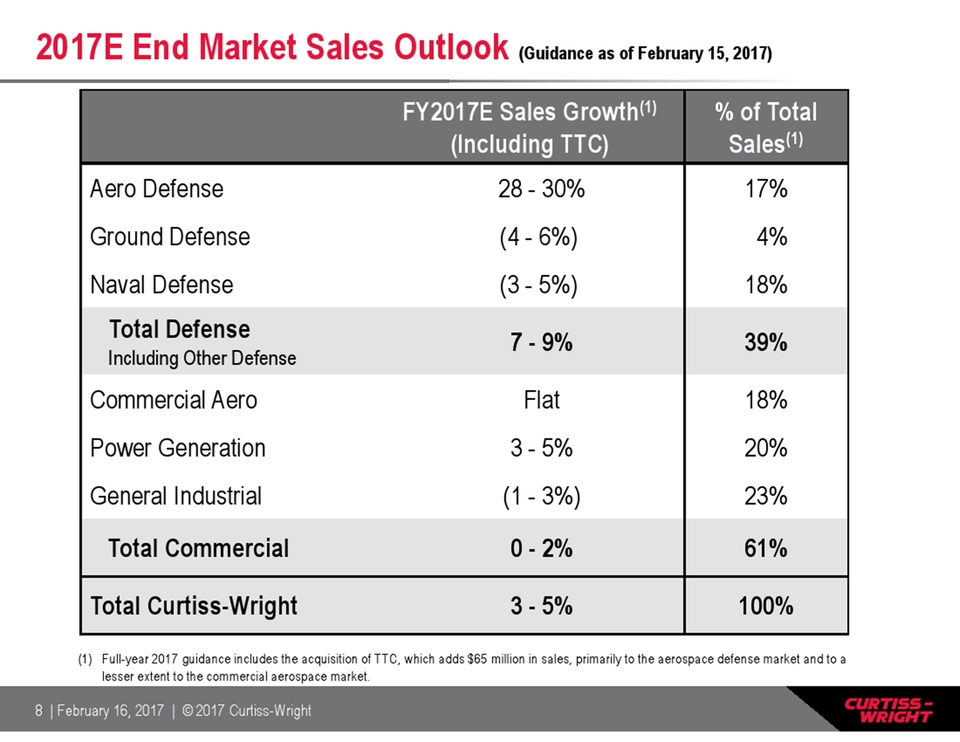
8 | February 16, 2017 | © 2017 Curtiss-Wright 2017E End Market Sales Outlook (Guidance as of February 15, 2017) FY2017E Sales Growth(1) (Including TTC) % of Total Sales(1) Aero Defense 28 - 30% 17% Ground Defense (4 - 6%) 4% Naval Defense (3 - 5%) 18% Total Defense Including Other Defense 7 - 9% 39% Commercial Aero Flat 18% Power Generation 3 - 5% 20% General Industrial (1 - 3%) 23% Total Commercial 0 - 2% 61% Total Curtiss-Wright 3 - 5% 100% (1) Full-year 2017 guidance includes the acquisition of TTC, which adds $65 million in sales, primarily to the aerospace defense market and to a lesser extent to the commercial aerospace market.
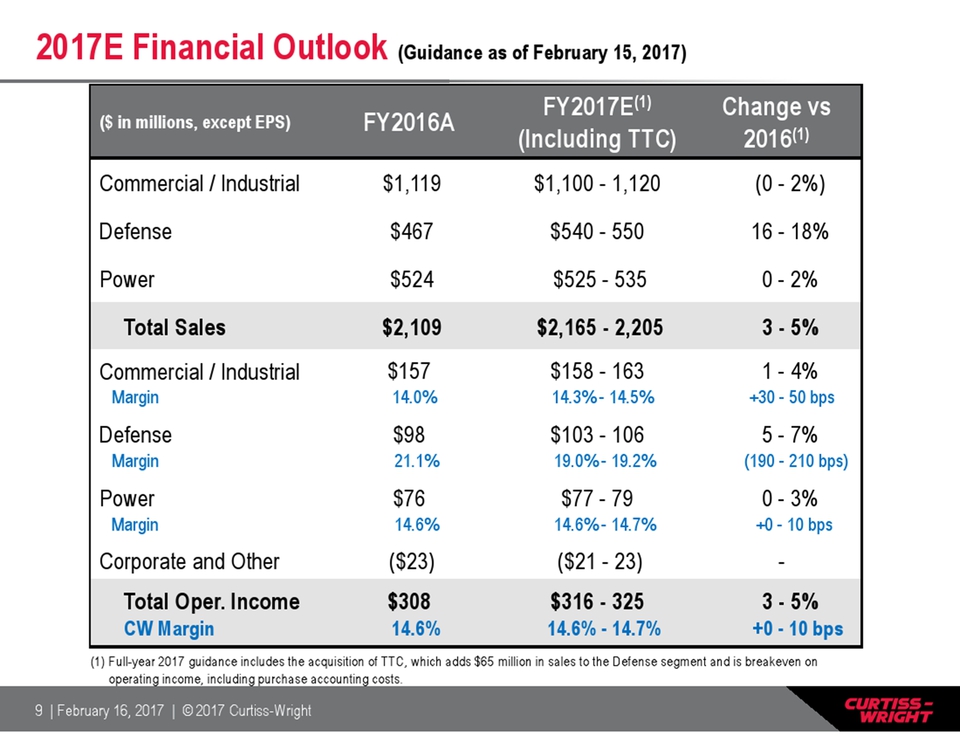
9 | February 16, 2017 | © 2017 Curtiss-Wright ($ in millions, except EPS) FY2016A FY2017E(1) (Including TTC) Change vs 2016(1) Commercial / Industrial $1,119 $1,100 - 1,120 (0 - 2%) Defense $467 $540 - 550 16 - 18% Power $524 $525 - 535 0 - 2% Total Sales $2,109 $2,165 - 2,205 3 - 5% Commercial / Industrial Margin $157 14.0% $158 – 163 14.3% - 14.5% 1 - 4% +30 - 50 bps Defense Margin $98 21.1% $103 – 106 19.0% - 19.2% 5 - 7% (190 - 210 bps) Power Margin $76 14.6% $77 – 79 14.6% - 14.7% 0 - 3% +0 - 10 bps Corporate and Other ($23) ($21 - 23) - Total Oper. Income CW Margin $308 14.6% $316 – 325 14.6% - 14.7% 3 - 5% +0 - 10 bps 2017E Financial Outlook (Guidance as of February 15, 2017) (1) Full-year 2017 guidance includes the acquisition of TTC, which adds $65 million in sales to the Defense segment and is breakeven on operating income, including purchase accounting costs.
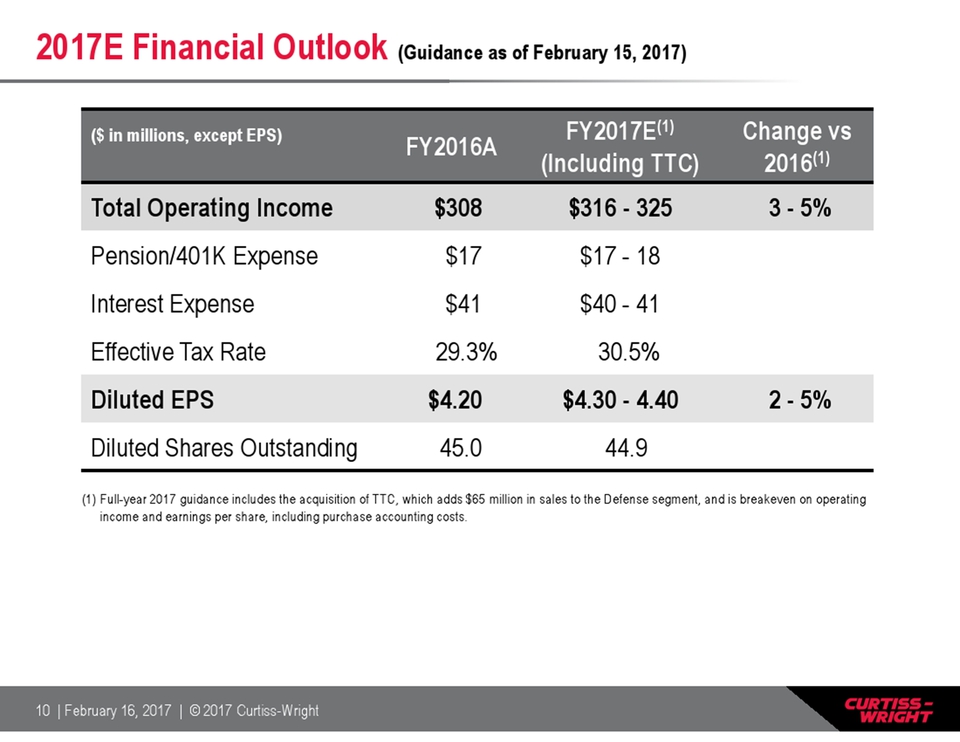
10 | February 16, 2017 | © 2017 Curtiss-Wright ($ in millions, except EPS) FY2016A FY2017E(1) (Including TTC) Change vs 2016(1) Total Operating Income $308 $316 - 325 3 - 5% Pension/401K Expense $17 $17 – 18 Interest Expense $41 $40 – 41 Effective Tax Rate 29.3% 30.5% Diluted EPS $4.20 $4.30 - 4.40 2 - 5% Diluted Shares Outstanding 45.0 44.9 2017E Financial Outlook (Guidance as of February 15, 2017) (1) Full-year 2017 guidance includes the acquisition of TTC, which adds $65 million in sales to the Defense segment, and is breakeven on operating income and earnings per share, including purchase accounting costs.
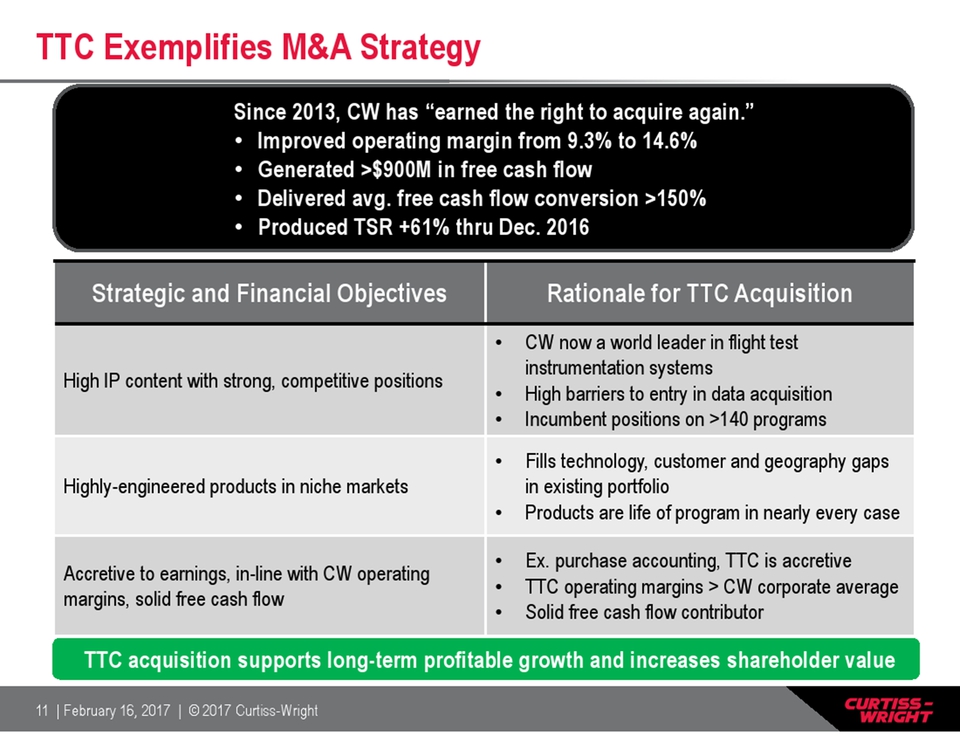
11 | February 16, 2017 | © 2017 Curtiss-Wright TTC Exemplifies M&A Strategy Strategic and Financial Objectives Rationale for TTC Acquisition High IP content with strong, competitive positions • CW now a world leader in flight test instrumentation systems • High barriers to entry in data acquisition • Incumbent positions on >140 programs Highly-engineered products in niche markets • Fills technology, customer and geography gaps in existing portfolio • Products are life of program in nearly every case Accretive to earnings, in-line with CW operating margins, solid free cash flow • Ex. purchase accounting, TTC is accretive • TTC operating margins > CW corporate average • Solid free cash flow contributor TTC acquisition supports long-term profitable growth and increases shareholder value Since 2013, CW has “earned the right to acquire again.” • Improved operating margin from 9.3% to 14.6% • Generated >$900M in free cash flow • Delivered avg. free cash flow conversion >150% • Produced TSR +61% thru Dec. 2016
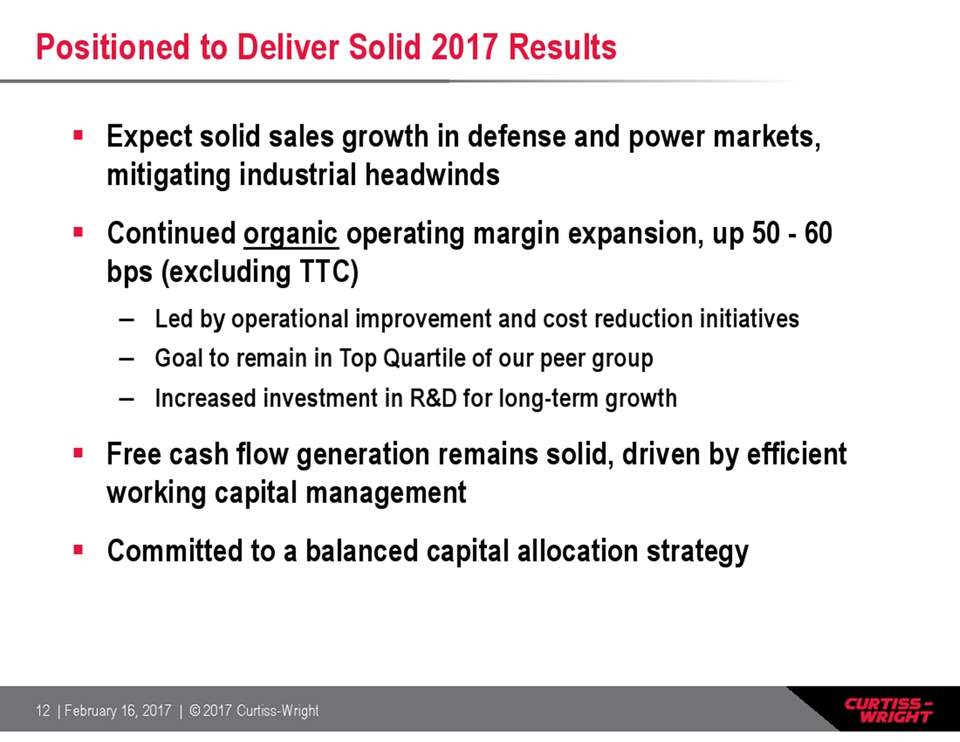
12 | February 16, 2017 | © 2017 Curtiss-Wright Positioned to Deliver Solid 2017 Results Expect solid sales growth in defense and power markets, mitigating industrial headwinds Continued organic operating margin expansion, up 50 – 60 bps (excluding TTC) – Led by operational improvement and cost reduction initiatives – Goal to remain in Top Quartile of our peer group – Increased investment in R&D for long-term growth Free cash flow generation remains solid, driven by efficient working capital management Committed to a balanced capital allocation strategy
13 | February 16, 2017 | © 2017 Curtiss-Wright Appendix
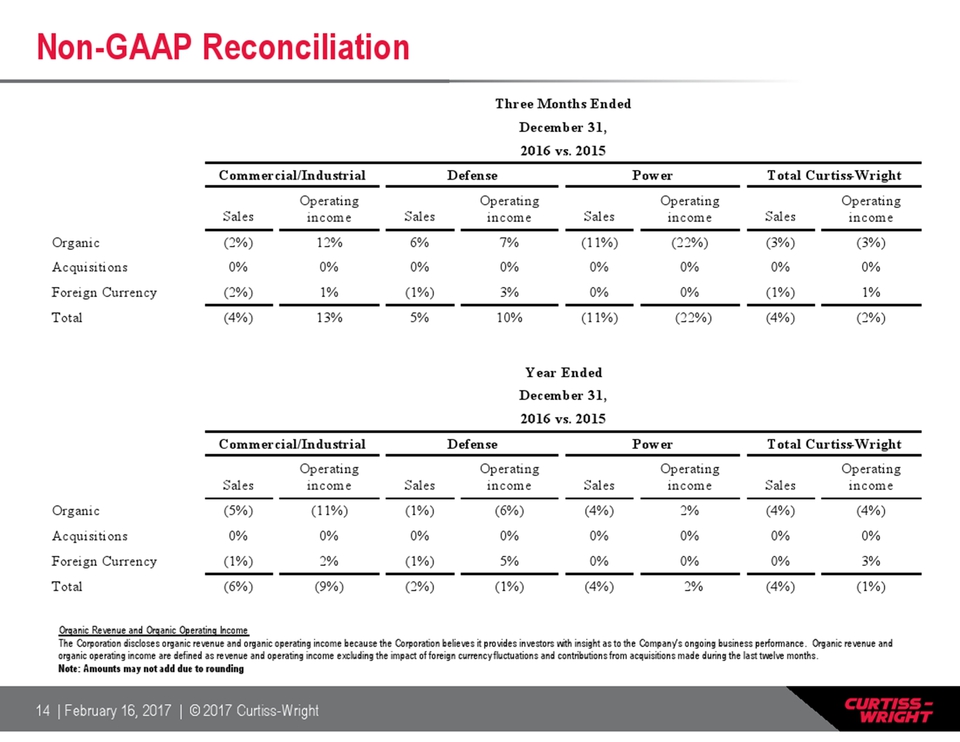
14 | February 16, 2017 | © 2017 Curtiss-Wright Non-GAAP Reconciliation Organic Revenue and Organic Operating Income The Corporation discloses organic revenue and organic operating income because the Corporation believes it provides investors with insight as to the Company’s ongoing business performance. Organic revenue and organic operating income are defined as revenue and operating income excluding the impact of foreign currency fluctuations and contributions from acquisitions made during the last twelve months. Note: Amounts may not add due to rounding Three Months Ended December 31, 2016 vs. 2015 Commercial/Industrial Defense Power Total Curtiss-Wright Sales Operating income Sales Operating income Sales Operating income Sales Operating income Organic (2%) 12% 6% 7% (11%) (22%) (3%) (3%) Acquisitions 0% 0% 0% 0% 0% 0% 0% 0% Foreign Currency (2%) 1% (1%) 3% 0% 0% (1%) 1% Total (4%) 13% 5% 10% (11%) (22%) (4%) (2%) Year Ended December 31, 2016 vs. 2015 Commercial/Industrial Defense Power Total Curtiss-Wright Sales Operating income Sales Operating income Sales Operating income Sales Operating income Organic (5%) (11%) (1%) (6%) (4%) 2% (4%) (4%) Acquisitions 0% 0% 0% 0% 0% 0% 0% 0% Foreign Currency (1%) 2% (1%) 5% 0% 0% 0% 3% Total (6%) (9%) (2%) (1%) (4%) 2% (4%) (1%)
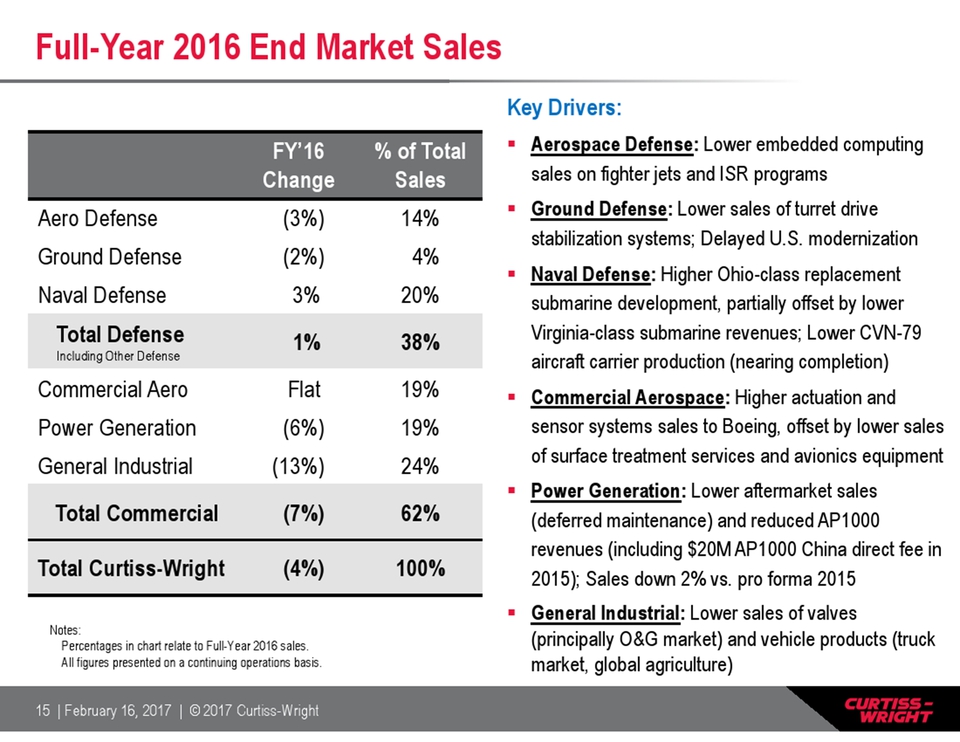
15 | February 16, 2017 | © 2017 Curtiss-Wright Full-Year 2016 End Market Sales Key Drivers: Aerospace Defense: Lower embedded computing sales on fighter jets and ISR programs Ground Defense: Lower sales of turret drive stabilization systems; Delayed U.S. modernization Naval Defense: Higher Ohio-class replacement submarine development, partially offset by lower Virginia-class submarine revenues; Lower CVN-79 aircraft carrier production (nearing completion) Commercial Aerospace: Higher actuation and sensor systems sales to Boeing, offset by lower sales of surface treatment services and avionics equipment Power Generation: Lower aftermarket sales (deferred maintenance) and reduced AP1000 revenues (including $20M AP1000 China direct fee in 2015); Sales down 2% vs. pro forma 2015 General Industrial: Lower sales of valves (principally O&G market) and vehicle products (truck market, global agriculture) Notes: Percentages in chart relate to Full-Year 2016 sales. All figures presented on a continuing operations basis. FY’16 Change % of Total Sales Aero Defense (3%) 14% Ground Defense (2%) 4% Naval Defense 3% 20% Total Defense Including Other Defense 1% 38% Commercial Aero Flat 19% Power Generation (6%) 19% General Industrial (13%) 24% Total Commercial (7%) 62% Total Curtiss-Wright (4%) 100%
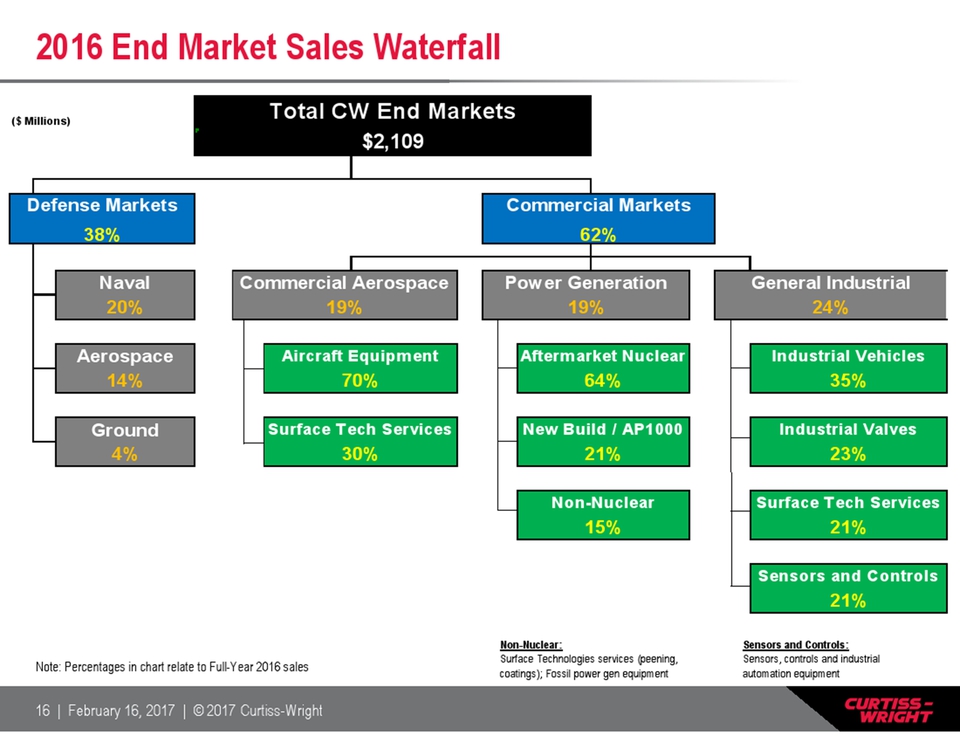
16 | February 16, 2017 | © 2017 Curtiss-Wright 2016 End Market Sales Waterfall Sensors and Controls: Sensors, controls and industrial automation equipment Non-Nuclear: Surface Technologies services (peening, Note: Percentages in chart relate to Full-Year 2016 sales coatings); Fossil power gen equipment ($ Millions) Naval Aerospace Industrial Vehicles Ground Industrial Valves Surface Tech Services Sensors and Controls 38% Defense Markets Total CW End Markets $2,109 35% Commercial Aerospace 4% 20% Aircraft Equipment 70% Surface Tech Services 30% 19% 19% 62% 21% Non-Nuclear 21% 21% 23% 14% Power Generation 15% Commercial Markets Aftermarket Nuclear 64% New Build / AP1000
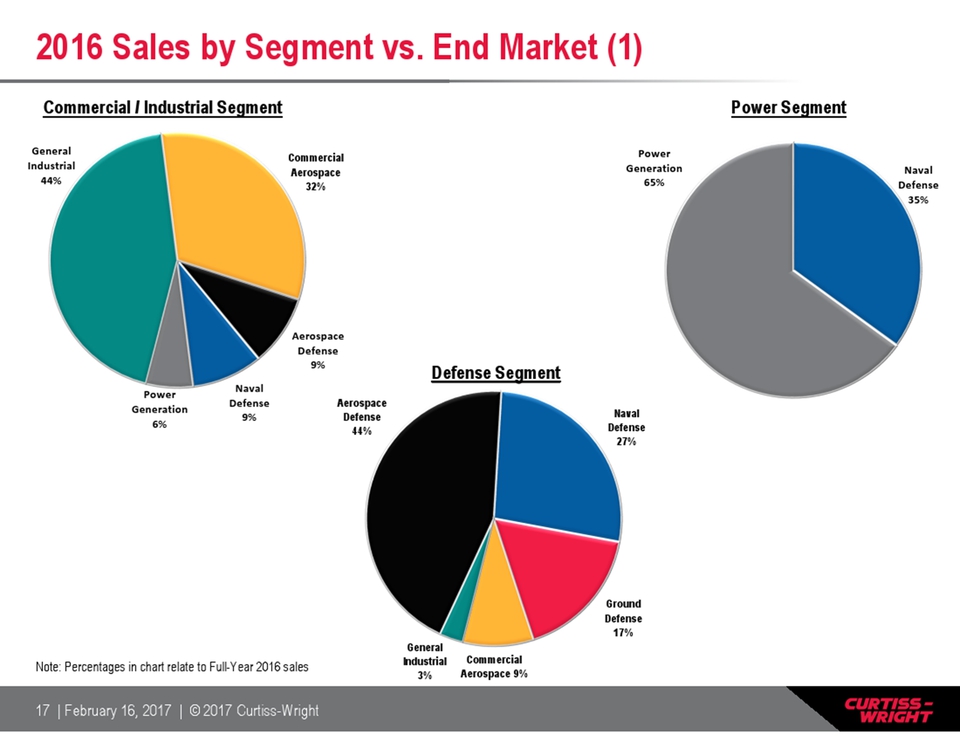
17 | February 16, 2017 | © 2017 Curtiss-Wright 2016 Sales by Segment vs. End Market (1) Naval Defense 35% Power Generation 65% Defense Segment Commercial / Industrial Segment Power Segment Aerospace Defense 9% Naval Defense 9% Power Generation 6% General Industrial 44% Commercial Aerospace 32% Aerospace Defense 44% Naval Defense 27% General Industrial 3% Commercial Aerospace 9% Ground Defense 17% Note: Percentages in chart relate to Full-Year 2016 sales
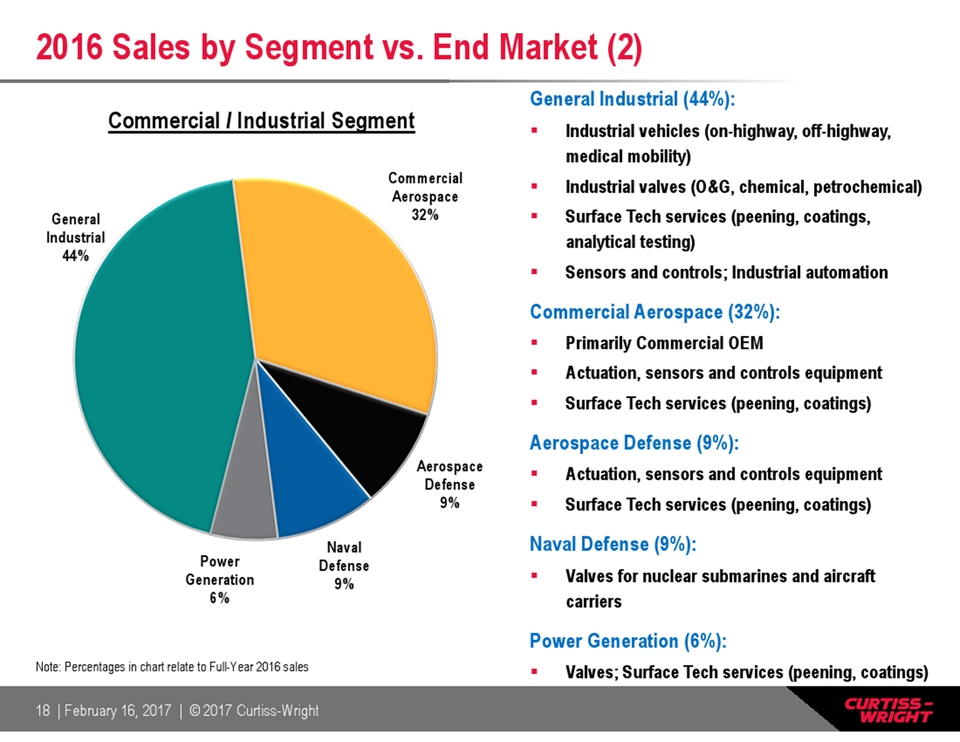
18 | February 16, 2017 | © 2017 Curtiss-Wright 2016 Sales by Segment vs. End Market (2) Commercial / Industrial Segment General Industrial (44%): Industrial vehicles (on-highway, off-highway, medical mobility) Industrial valves (O&G, chemical, petrochemical) Surface Tech services (peening, coatings, analytical testing) Sensors and controls; Industrial automation Commercial Aerospace (32%): Primarily Commercial OEM Actuation, sensors and controls equipment Surface Tech services (peening, coatings) Aerospace Defense (9%): Actuation, sensors and controls equipment Surface Tech services (peening, coatings) Naval Defense (9%): Valves for nuclear submarines and aircraft carriers Power Generation (6%): Valves; Surface Tech services (peening, coatings) Aerospace Defense 9% Naval Defense 9% Power Generation 6% General Industrial 44% Commercial Aerospace 32% Note: Percentages in chart relate to Full-Year 2016 sales
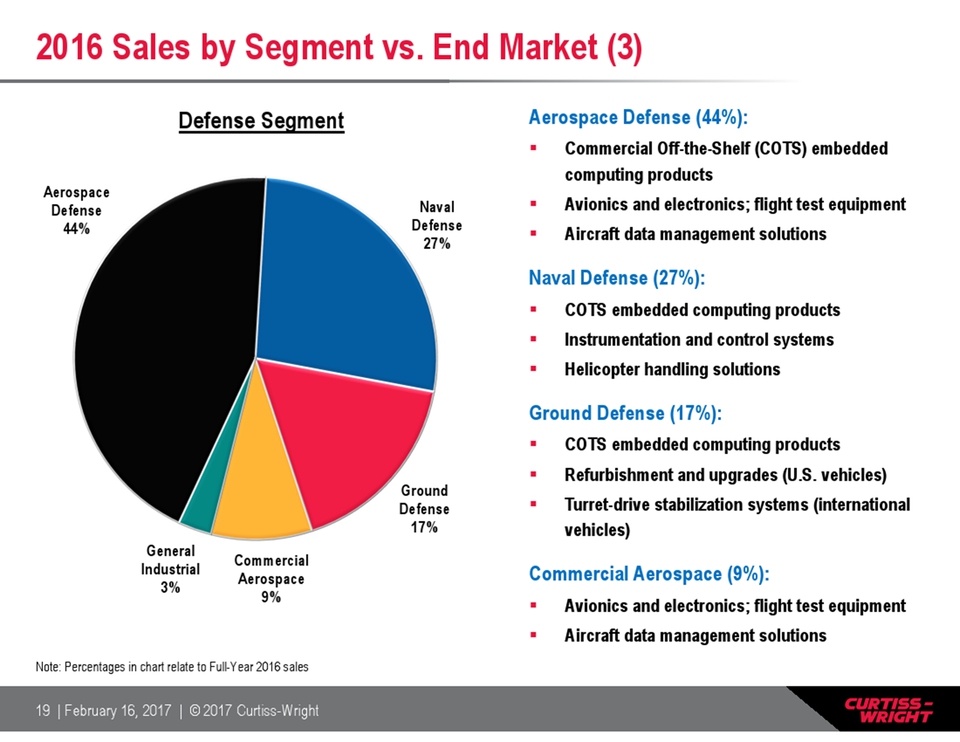
19 | February 16, 2017 | © 2017 Curtiss-Wright Aerospace Defense 44% Naval Defense 27% Ground Defense 17% Commercial Aerospace 9% General Industrial 3% 2016 Sales by Segment vs. End Market (3) Defense Segment Aerospace Defense (44%): Commercial Off-the-Shelf (COTS) embeddedcomputing products Avionics and electronics; flight test equipment Aircraft data management solutions Naval Defense (27%): COTS embedded computing products Instrumentation and control systems Helicopter handling solutions Ground Defense (17%): COTS embedded computing products Refurbishment and upgrades (U.S. vehicles) Turret-drive stabilization systems (international vehicles) Commercial Aerospace (9%): Avionics and electronics; flight test equipment Aircraft data management solutions Note: Percentages in chart relate to Full-Year 2016 sales
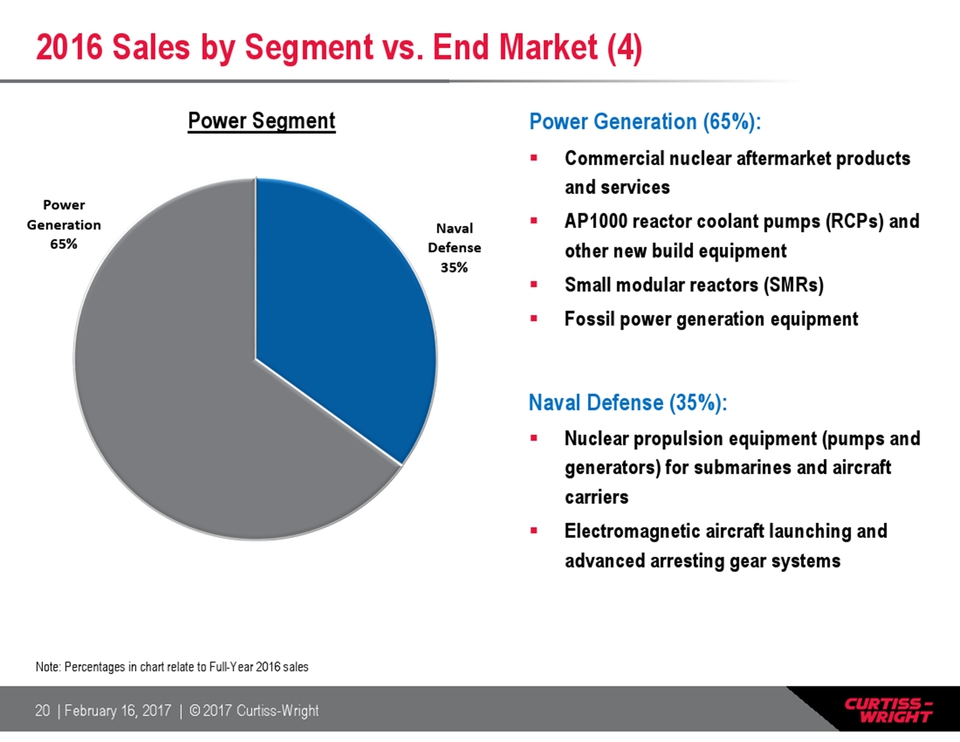
20 | February 16, 2017 | © 2017 Curtiss-Wright Naval Defense 35% Power Generation 65% 2016 Sales by Segment vs. End Market (4) Power Segment Power Generation (65%): Commercial nuclear aftermarket products and services AP1000 reactor coolant pumps (RCPs) and other new build equipment Small modular reactors (SMRs) Fossil power generation equipment Naval Defense (35%): Nuclear propulsion equipment (pumps and generators) for submarines and aircraft carriers Electromagnetic aircraft launching and advanced arresting gear systems Note: Percentages in chart relate to Full-Year 2016 sales
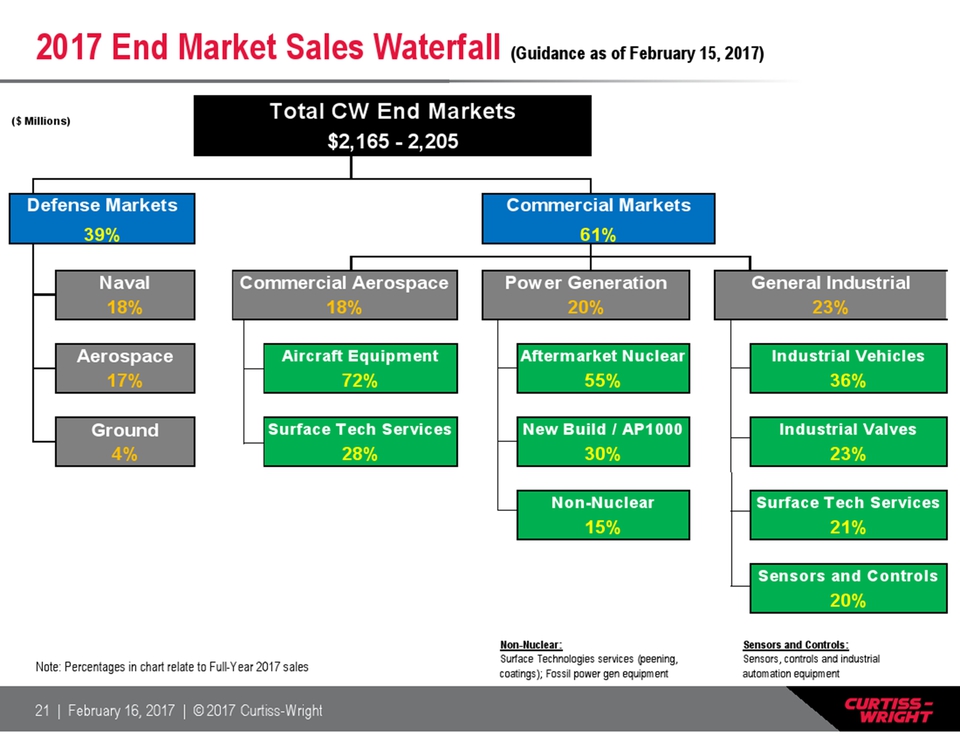
21 | February 16, 2017 | © 2017 Curtiss-Wright 2017 End Market Sales Waterfall (Guidance as of February 15, 2017) Sensors and Controls: Sensors, controls and industrial automation equipment Non-Nuclear: Surface Technologies services (peening, Note: Percentages in chart relate to Full-Year 2017 sales coatings); Fossil power gen equipment ($ Millions) Naval Aerospace Industrial Vehicles Ground Industrial Valves Surface Tech Services Sensors and Controls 39% Defense Markets Total CW End Markets $2,165 - 2,205 36% Commercial Aerospace 4% 18% Aircraft Equipment 72% Surface Tech Services 28% 18% 20% 61% 30% Non-Nuclear 20% 21% 23% 17% Power Generation 15% Commercial Markets Aftermarket Nuclear 55% New Build / AP1000