As filed with the Securities and Exchange Commission on December 6, 2013
Securities Act File No.
SECURITIES AND EXCHANGE COMMISSION
WASHINGTON, D.C. 20549
Form N-14
REGISTRATION STATEMENT UNDER THE SECURITIES ACT OF 1933 x
Pre-Effective Amendment No. o
Post-Effective Amendment No. o
ING Intermediate Bond Portfolio
(Exact Name of Registrant as Specified in Charter)
7337 East Doubletree Ranch Road, Scottsdale, Suite 100, Arizona 85258-2034
(Address of Principal Executive Offices) (Zip Code)
1-800-262-3862
(Registrant’s Area Code and Telephone Number)
Huey P. Falgout, Jr.
ING U.S. Legal Services
7337 East Doubletree Ranch Road
Scottsdale, AZ 85258
(Name and Address of Agent for Service)
With copies to:
Philip H. Newman, Esq.
Goodwin Procter, LLP
Exchange Place
53 State Street
Boston, MA 02109
Approximate Date of Proposed Public Offering:
As soon as practicable after this Registration Statement becomes effective.
It is proposed that this filing will become effective on January 13, 2014, pursuant to Rule 488 under the Securities Act of 1933, as amended.
No filing fee is required because an indefinite number of shares have previously been registered pursuant to Rule 24f-2 under the Investment Company Act of 1940, as amended.
Title of Securities Being Registered: Class S of ING Intermediate Bond Portfolio
ING BOND PORTFOLIO
7337 East Doubletree Ranch Road, Suite 100
Scottsdale, Arizona 85258-2034
(800) 366-0066
January 24, 2014
Dear Shareholder:
On behalf of the Board of Trustees (the “Board”) of ING Bond Portfolio (“Bond Portfolio”), we are pleased to invite you to a special meeting of shareholders (the “Special Meeting”) of Bond Portfolio. The Special Meeting is scheduled for 1:00 P.M., Local time, on February 27, 2014, at 7337 East Doubletree Ranch Road, Suite 100, Scottsdale, Arizona 85258-2034.
At the Special Meeting shareholders of Bond Portfolio will be asked to vote on the proposed reorganization (the “Reorganization”) of Bond Portfolio with and into ING Intermediate Bond Portfolio (“Intermediate Bond Portfolio”) (together with Bond Portfolio, the “Portfolios,” each a “Portfolio”). Each Portfolio is a member of the mutual fund group called the “ING Funds.”
Shares of Bond Portfolio have been purchased by you or at your direction through your qualified pension or retirement plan (collectively, “Qualified Plans”) or, at your direction by your insurance company, through its separate accounts to serve as an investment option under your variable annuity contract or variable life insurance policy. If the Reorganization is approved by shareholders, the separate account in which you have an interest or the Qualified Plan in which you are a participant will own shares of Intermediate Bond Portfolio instead of shares of Bond Portfolio beginning on the date the Reorganization occurs. The Reorganization would provide the separate account in which you have an interest or the Qualified Plan in which you are a participant with an opportunity to participate in a larger combined Portfolio that seeks to maximize total return consistent with reasonable risk.
Formal notice of the Special Meeting appears on the next page, followed by a combined proxy statement and prospectus (the “Proxy Statement/Prospectus”). The Reorganization is discussed in detail in the enclosed Proxy Statement/Prospectus, which you should read carefully. After careful consideration, the Board recommends that you vote “FOR” the Reorganization.
Your vote is important regardless of the number of shares you own. To avoid the added cost of follow-up solicitations and possible adjournments, please take the time to read the Proxy Statement/Prospectus and cast your vote. It is important that your vote be received no later than February 26, 2014.
We appreciate your participation and prompt response in this matter and thank you for your continued support.
| Sincerely, |
| |
| 
|
| Shaun P. Mathews |
| President and Chief Executive Officer |
(This page intentionally left blank)
NOTICE OF SPECIAL MEETING OF SHAREHOLDERS
OF
ING BOND PORTFOLIO
7337 East Doubletree Ranch Road, Suite 100
Scottsdale, Arizona 85258-2034
(800) 366-0066
Scheduled for February 27, 2014
To the Shareholders:
NOTICE IS HEREBY GIVEN that a special meeting of the shareholders (the “Special Meeting”) of ING Bond Portfolio (“Bond Portfolio”) is scheduled for 1:00 P.M., Local time on February 27, 2014 at 7337 East Doubletree Ranch Road, Suite 100, Scottsdale, Arizona 85258-2034.
At the Special Meeting, Bond Portfolio’s shareholders will be asked:
1. To approve an Agreement and Plan of Reorganization by and between Bond Portfolio and ING Intermediate Bond Portfolio (“Intermediate Bond Portfolio”), providing for the reorganization of Bond Portfolio with and into Intermediate Bond Portfolio (the “Reorganization”); and
2. To transact such other business, not currently contemplated, that may properly come before the Special Meeting, or any adjournments or postponements thereof, in the discretion of the proxies or their substitutes.
Please read the enclosed combined proxy statement and prospectus (the “Proxy Statement/Prospectus”) carefully for information concerning the Reorganization to be placed before the Special Meeting.
The Board of Trustees recommends that you vote “FOR” the Reorganization.
Shareholders of record as of the close of business on December 13, 2013 are entitled to notice of, and to vote at, the Special Meeting, and are also entitled to vote at any adjournments or postponements thereof. Your attention is called to the accompanying Proxy Statement/Prospectus. Regardless of whether you plan to attend the Special Meeting, please complete, sign, and return promptly, but in no event later than February 26, 2014, the enclosed Proxy Ballot or Voting Instruction Card so that a quorum will be present and a maximum number of shares may be voted. Proxies or voting instructions may be revoked at any time before they are exercised by submitting a revised Proxy Ballot or Voting Instruction Card, by giving written notice of revocation to Bond Portfolio, or by voting in person at the Special Meeting.
| By Order of the Board of Trustees |
| |
| 
|
| Huey P. Falgout, Jr. |
| Secretary |
January 24, 2014
(This page intentionally left blank)
PROXY STATEMENT/PROSPECTUS
January 24, 2014
Special Meeting of Shareholders
of ING Bond Portfolio
Scheduled for February 27, 2014
ACQUISITION OF THE ASSETS OF: | | BY AND IN EXCHANGE FOR SHARES OF: |
| | |
ING Bond Portfolio
(A series of ING Investors Trust)
7337 East Doubletree Ranch Road, Suite 100
Scottsdale, Arizona 85258-2034
(800) 366-0066 | | ING Intermediate Bond Portfolio
7337 East Doubletree Ranch Road, Suite 100
Scottsdale, Arizona 85258-2034
(800) 992-0180 |
(each an open-end management investment company)
Important Notice Regarding the Availability of Proxy Materials
for the Shareholder Meeting to be Held on February 27, 2014
This Proxy Statement/Prospectus and Notice of Special Meeting are available at:www.proxyvote.com/ing
The Prospectus/Proxy Statement explains concisely what you should know before voting on the matter described herein or investing in ING Intermediate Bond Portfolio. Please read it carefully and keep it for future reference.
THE U.S. SECURITIES AND EXCHANGE COMMISSION HAS NOT APPROVED OR DISAPPROVED THESE SECURITIES, OR DETERMINED THAT THIS PROXY STATEMENT/PROSPECTUS IS TRUTHFUL OR COMPLETE. ANY REPRESENTATION TO THE CONTRARY IS A CRIMINAL OFFENSE.
TO OBTAIN MORE INFORMATION
To obtain more information about ING Bond Portfolio (“Bond Portfolio”) and ING Intermediate Bond Portfolio (“Intermediate Bond Portfolio,” and together with Bond Portfolio, the “Portfolios”), please write, call, or visit our website for a free copy of the current prospectus, statement of additional information, annual/semi-annual shareholder reports, or other information.
By Phone: | | (800) 992-0180 |
| | |
By Mail: | | ING Funds
7337 East Doubletree Ranch Road, Suite 100
Scottsdale, Arizona 85258-2034 |
| | |
By Internet: | | www.ingfunds.com/vp/literature |
The following documents containing additional information about the Portfolios, each having been filed with the U.S. Securities and Exchange Commission (“SEC”), are incorporated by reference into this Proxy Statement/Prospectus:
1. The Statement of Additional Information dated January 24, 2014 relating to this Proxy Statement/Prospectus;
2. The Prospectus and Statement of Additional Information dated April 30, 2013 for Bond Portfolio; and
3. The Prospectus for Class S and Statement of Additional Information dated April 30, 2013 for Intermediate Bond Portfolio.
The Portfolios are subject to the informational requirements of the Securities Exchange Act of 1934, as amended, and the Investment Company Act of 1940, as amended, and in accordance therewith, file reports and other information including proxy materials with the SEC.
You also may view or obtain these documents from the SEC:
In Person: | | Public Reference Section
100 F Street, N.E.
Washington, D.C. 20549
(202) 551-8090 |
| | |
By Mail: | | U.S. Securities and Exchange Commission
Public Reference Section
100 F Street, N.E.
Washington, D.C. 20549
(Duplication Fee Required) |
| | |
By Email: | | publicinfo@sec.gov
(Duplication Fee Required) |
| | |
By Internet: | | www.sec.gov |
When contacting the SEC, you will want to refer to the Portfolios’ SEC file numbers. The file number for the document listed above as (1) is [File No. generated with N-14 filing]. The file numbers for the documents listed above as (2) and (3) are 811-05629 and 811-02361, respectively.
TABLE OF CONTENTS
Introduction | 1 |
What is happening? | 1 |
Why did you send me this booklet? | 1 |
Who is eligible to vote? | 1 |
How do I vote? | 1 |
How does the Board recommend that I vote? | 1 |
When and where will the Special Meeting be held? | 1 |
Summary of the Proposed Reoranization | 2 |
Proposal One — Approval of the Reorganization | 3 |
What is the proposed Reorganization? | 3 |
Why is a Reorganization proposed? | 3 |
How do the Investment Objectives compare? | 3 |
How do the Annual Portfolio Operating Expenses compare? | 3 |
How do the Principal Investment Strategies compare? | 4 |
How do the Principal Risks compare? | 5 |
How does Bond Portfolio’s performance compare to Intermediate Bond Portfolio? | 8 |
How does the management of the Portfolios compare? | 9 |
What are the key differences in the rights of shareholders of Bond Portfolio and Intermediate Bond Portfolio? | 11 |
Additional Information about the Portfolios | 11 |
Additional Information about the Reorganization | 11 |
What is the Board’s recommendation? | 13 |
What factors did the Board consider? | 13 |
What is the required vote? | 13 |
What happens if shareholders do not approve the Reorganization? | 13 |
General Information about the Proxy Statement/Prospectus | 14 |
Who is asking for my vote? | 14 |
How is my proxy being solicited? | 14 |
What happens to my proxy once I submit it? | 14 |
Can I revoke my proxy after I submit it? | 14 |
How will my shares be voted? | 14 |
How many shares are outstanding? | 15 |
Can shareholders submit proposals for a future shareholder meeting? | 15 |
Why did my household only receive one copy of this Proxy Statement/Prospectus? | 15 |
Appendix A: Form of Agreement and Plan of Reorganization | 16 |
Appendix B: Additional Information Regarding ING Intermediate Bond Portfolio | 25 |
Portfolio Holdings Information | 25 |
How Shares Are Priced | 25 |
How to Buy and Sell Shares | 25 |
Frequent Trading - Market Timing | 26 |
Payments to Financial Intermediaries | 27 |
Dividends, Distributions, and Taxes | 27 |
FINANCIAL HIGHLIGHTS | 29 |
Appendix C: Security Ownership of Certain Beneficial and Record Owners | 30 |
INTRODUCTION
What is happening?
On September 13, 2013 the investment adviser to the ING Bond Portfolio (“Bond Portfolio”) and ING Intermediate Bond Portfolio (“Intermediate Bond Portfolio,” together with Bond Portfolio, the “Portfolios) proposed and the Board of Trustees (the “Board”) approved an Agreement and Plan of Reorganization (the “Reorganization Agreement”). The Reorganization Agreement provides for the reorganization of Bond Portfolio with and into Intermediate Bond Portfolio (the “Reorganization”). The Reorganization Agreement requires shareholder approval, and, if approved, is expected to be effective on March 14, 2014, or such other date as the parties may agree (the “Closing Date”).
Why did you send me this booklet?
Shares of Bond Portfolio have been purchased by you or at your direction through your qualified pension or retirement plan (“Qualified Plans”) or, at your direction, by your insurance company through its separate accounts (“Separate Accounts”) to serve as an investment option under your variable annuity and/or variable life contract (“Variable Contract”).
This booklet includes a combined proxy statement and prospectus (the “Proxy Statement/Prospectus”) and a Proxy Ballot or Voting Instruction Card for Bond Portfolio. It provides you with information you should review before providing voting instructions on the matters listed in the Notice of Special Meeting.
The Separate Accounts and Qualified Plans or their trustees, as record owners of Bond Portfolio shares are, in most cases, the true “shareholders” of Bond Portfolio; however, participants in Qualified Plans (“Plan Participants”) or holders of Variable Contracts (“Variable Contracts Holders”) may be asked to instruct their Qualified Plan trustee or Separate Accounts, as applicable, as to how they would like the shares attributed to their Qualified Plan or Variable Contract to be voted. For clarity and ease of reading, references to “shareholder” or “you” throughout this Proxy Statement/Prospectus do not refer to the technical shareholder but rather refer to the persons who are being asked to provide voting instructions with respect to the proposals, unless the context indicates otherwise. Similarly, for ease of reading, references to “voting” or “vote” do not refer to the technical vote but rather to the voting instructions provided by Variable Contracts Holders or Plan Participants.
Because you are being asked to approve a Reorganization Agreement that will result in a transaction in which you will ultimately hold shares of Intermediate Bond Portfolio, this Proxy Statement also serves as a prospectus for Intermediate Bond Portfolio. Intermediate Bond Portfolio is an open-end management investment company, which seeks to maximize total return consistent with reasonable risk, as described more fully below.
Who is eligible to vote?
Shareholders holding an investment in shares of Bond Portfolio as of the close of business on December 13, 2013 (the “Record Date”) are eligible to vote at the Special Meeting or any adjournments or postponements thereof.
How do I vote?
You may submit your Proxy Ballot or Voting Instruction Card in one of four ways:
· By Internet. The web address and instructions for voting can be found on the enclosed Proxy Ballot or Voting Instruction Card. You will be required to provide your control number located on the Proxy Ballot or Voting Instruction Card.
· By Telephone. The toll-free number for telephone voting can be found on the enclosed Proxy Ballot or Voting Instruction Card. You will be required to provide your control number located on the Proxy Ballot or Voting Instruction Card.
· By Mail. Mark the enclosed Proxy Ballot or Voting Instruction Card, sign and date it, and return it in the postage-paid envelope we provided. Joint owners must each sign the Proxy Ballot or Voting Instruction Card.
· In Person at the Special Meeting. You can vote your shares in person at the Special Meeting. If you expect to attend the Special Meeting in person, please call Shareholder Services toll-free at (800) 992-0180.
To be certain your vote will be counted, a properly executed Proxy Ballot or Voting Instruction Card must be received no later than 5:00 P.M., Local time, on February 26, 2014.
How does the Board recommend that I vote?
The Board recommends that shareholders vote “FOR” the Reorganization.
When and where will the Special Meeting be held?
The Special Meeting is scheduled to be held at 7337 East Doubletree Ranch Road, Suite 100, Scottsdale, Arizona 85258-2034, on February 27, 2014, at 1:00 P.M., Local time, and, if the Special Meeting is adjourned or postponed, any adjournments or postponements of the Special Meeting will also be held at the above location. If you expect to attend the Special Meeting in person, please call Shareholder Services toll-free at (800) 992-0180.
1
SUMMARY OF THE PROPOSED REORANIZATION
You should read this entire Proxy Statement/Prospectus carefully. You should also review the Reorganization Agreement, which is attached hereto as Appendix A. For more information about Intermediate Bond Portfolio, please consult Appendix B and the Prospectus dated April 30, 2013.
Subject to shareholder approval, the Reorganization Agreement provides for:
· the transfer of all of the assets of Bond Portfolio to Intermediate Bond Portfolio in exchange for shares of beneficial interest of Intermediate Bond Portfolio;
· the assumption by Intermediate Bond Portfolio of all the liabilities of Bond Portfolio;
· the distribution of shares of Intermediate Bond Portfolio to the shareholders of Bond Portfolio; and
· the complete liquidation of Bond Portfolio.
If shareholders approve the Reorganization, each owner of shares of Bond Portfolio would become a shareholder of Class S shares of Intermediate Bond Portfolio. The Reorganization is expected to be effective on the Closing Date. Each shareholder of Bond Portfolio will hold, immediately after the Closing Date, shares of Intermediate Bond Portfolio having an aggregate value equal to the aggregate value of the shares of Bond Portfolio held by that shareholder as of the close of business on the Closing Date.
In considering whether to approve the Reorganization, you should note that:
· Bond Portfolio and Intermediate Bond Portfolio have substantially similar investment objectives and investment strategies.
· ING Investments, LLC (“ING Investments” or the “Adviser”) serves as adviser to both Portfolios. ING Investment Management Co. LLC (“ING IM”) serves as sub-adviser to both Portfolios.
· The gross and net expense ratios experienced by shareholders of Bond Portfolio are expected to decrease as a result of the Reorganization.
· As of June 30, 2013, Bond Portfolio had approximately $415 million in net assets and Intermediate Bond Portfolio had approximately $2.1 billion in net assets.
· The Reorganization will not affect a shareholder’s right to purchase, redeem, or exchange shares of the Portfolios. In addition, the Reorganization will not affect how shareholders purchase and sell their shares.
· Each Portfolio is distributed by ING Investments Distributor, LLC (the “Distributor”).
· The Reorganization is intended to qualify for federal income tax purposes as a tax-free reorganization pursuant to Section 368(a) of the Internal Revenue Code of 1986, as amended (the “Code”); accordingly, pursuant to this treatment, neither Bond Portfolio nor its shareholders, nor Intermediate Bond Portfolio nor its shareholders are expected to recognize any gain or loss for federal income tax purposes from the transactions contemplated by the Reorganization Agreement.
2
PROPOSAL ONE — APPROVAL OF THE REORGANIZATION
What is the proposed Reorganization?
Shareholders of Bond Portfolio are being asked to approve a Reorganization Agreement, providing for the reorganization of Bond Portfolio with and into Intermediate Bond Portfolio. If the Reorganization is approved, shareholders in Bond Portfolio will become shareholders in Intermediate Bond Portfolio as of the close of business on the Closing Date.
Why is a Reorganization proposed?
The Adviser and its affiliates are in the process of conducting a comprehensive review of the mutual funds offered within the ING Funds Complex. At the September 2013 Board Meeting, the Adviser presented to the Board a series of proposals, including the Reorganization, which were intended to, among other things, enhance the efficiency and reduce the complexity of the ING Funds Complex. In support of its proposal, ING Investments noted that both Bond Portfolio and Intermediate Bond Portfolio have the same portfolio managers and are managed pursuant to substantially similar investment strategies. In addition, the Adviser noted that Intermediate Bond Portfolio had lower gross and net expenses.
How do the Investment Objectives compare?
As described in the chart that follows, the Portfolios have substantially similar investment objectives.
| | Bond Portfolio | | Intermediate Bond Portfolio | |
Investment Objective | | The Portfolio seeks to provide maximum total return through income and capital appreciation. | | The Portfolio seeks to maximize total return consistent with reasonable risk. The Portfolio seeks its objective through investments in a diversified portfolio consisting primarily of debt securities. It is anticipated that capital appreciation and investment income will both be major factors in achieving total return. | |
How do the Annual Portfolio Operating Expenses compare?
The table below describes the fees and expenses that you may pay if you buy and hold shares of the Portfolios. Pro forma fees and expenses, which are the estimated fees and expenses of Intermediate Bond Portfolio after giving effect to the Reorganization, assume that the Reorganization occurred on June 30, 2013. Both the gross and net expenses of Intermediate Bond Portfolio are lower than the gross and net expenses of Bond Portfolio. This table does not reflect fees or expenses that are, or may be, imposed under your Variable Contract or a Qualified Plan. For more information on these charges, please refer to the documents governing your Variable Contract or consult your plan administrator.
Annual Portfolio Operating Expenses
Expenses you pay each year as a % of the value of your investment
| | Bond
Portfolio | | Intermediate
Bond Portfolio
Class S | | Intermediate
Bond Portfolio
Class S
Pro Forma(1) | |
Management Fee | | 0.48 | %(2) | 0.40 | % | 0.40 | % |
Distribution and/or Shareholder Services (12b-1) Fees | | 0.60 | % | 0.25 | % | 0.25 | % |
Administrative Services Fee | | 0.10 | %(3) | 0.06 | % | 0.06 | % |
Other Expenses | | 0.06 | % | 0.04 | % | 0.04 | % |
Acquired Fund Fees and Expenses. | | 0.01 | % | None | | None | |
Total Annual Portfolio Operating Expenses | | 1.25 | %(4) | 0.75 | % | 0.75 | % |
Waivers and Reimbursements | | (0.49 | )%(5) | None | | 0.00 | %(6) |
Total Annual Portfolio Operating Expenses after Waivers and Reimbursements | | 0.76 | % | 0.75 | % | 0.75 | % |
(1) Expense ratios have been adjusted to reflect current expense rates.
(2) Prior to July 20, 2012, the Portfolio operated as a feeder fund and invested all of its assets in Class 1 shares of a master fund, the American Funds Insurance Series® Bond Fund (“Master Fund”), and the management fee previously paid by the Portfolio was that of the Master Fund. This management fee was not paid to the Adviser.
(3) Prior to July 20, 2012, the Portfolio did not pay an administrative services fee.
(4) Total Annual Portfolio Operating Expenses may be higher than the Portfolio’s ratio of expenses to average net assets shown in the Portfolio’s Financial Highlights, which reflects the operating expenses of the Portfolio and does not include Acquired Fund Fees and Expenses.
(5) The adviser is contractually obligated to limit expenses to 0.99% through May 1, 2015; the obligation does not extend to interest, taxes, brokerage commissions, Acquired Fund Fees and Expenses, and extraordinary expenses. The obligation will automatically renew for one-year terms unless: (i) the adviser provides 90 days written notice of its termination; and (ii) such termination is approved by the Board; or (iii) the Investment Advisory Agreement has been terminated. The obligation is subject to possible recoupment by the adviser within three years. In addition, the distributor is contractually obligated to waive a portion of its distribution fee such that the Portfolio’s Total Annual Portfolio Operating Expenses after Waivers and Reimbursements do not exceed 0.75% through May 1, 2015. There is no guarantee that the distribution fee waiver will continue after May 1, 2015. The distribution fee waiver will renew if the distributor elects to renew it. Any fees waived pursuant to the distribution fee waiver shall not be eligible for recoupment. Notwithstanding the foregoing, termination or modification of this distribution fee waiver requires approval by the Portfolio’s Board.
3
(6) If shareholders approve the Reorganization, the Adviser is contractually obligated to limit expenses to 0.80% for Class S through May 1, 2015. The obligation does not extend to interest, taxes, brokerage commissions, Acquired Fund Fees and Expenses, and extraordinary expenses. The obligation will automatically renew for one-year terms unless: (i) the adviser provides 90 days written notice of its termination; and (ii) such termination is approved by the Board; or (iii) the Investment Advisory Agreement has been terminated. The obligation is subject to possible recoupment by the adviser within three years.
Expense Examples
The Examples are intended to help you compare the costs of investing in shares of the Portfolios with the costs of investing in other mutual funds. The Examples do not reflect expenses and charges which are, or may be, imposed under your Variable Contract or Qualified Plan. The Examples assume that you invest $10,000 in the Portfolios for the time periods indicated. The Examples also assume that your investment had a 5% return during each year and that the Portfolios’ operating expenses remain the same. Although your actual costs may be higher or lower based on these assumptions your costs would be:
Bond Portfolio | | Intermediate Bond Portfolio | | Intermediate Bond Portfolio
Pro Forma | |
1 Yr | | 3 Yrs | | 5 Yrs | | 10 Yrs | | 1 Yr | | 3 Yrs | | 5 Yrs | | 10 Yrs | | 1 Yr | | 3 Yrs | | 5 Yrs | | 10 Yrs | |
$ | 78 | | 348 | | 639 | | 1,468 | | 77 | | 240 | | 417 | | 930 | | 77 | | 240 | | 417 | | 930 | |
| | | | | | | | | | | | | | | | | | | | | | | | |
The Examples reflect applicable expense limitation agreements, and/or waivers in effect, if any, for the one-year period, and the first of the three-, five-, and ten-year periods.
How do the Principal Investment Strategies compare?
As described in more detail in the table that follows, the Portfolios have substantially similar investment strategies. Both Portfolios invest primarily in a portfolio of bonds and seek to maintain an average portfolio quality rating of at least investment grade. Both Portfolios may invest a portion of their assets in high-yield debt instruments (commonly referred to as “junk bonds”), foreign securities, and derivatives.
| | Bond Portfolio | | Intermediate Bond Portfolio |
Investment Strategies | | Under normal market conditions, the Portfolio invests at least 80% of its net assets (plus borrowings for investment purposes) in a portfolio of bonds. The Portfolio will provide shareholders with at least 60 days’ prior notice of any change in the investment policy. Bonds include, but are not limited to, corporate, government, and mortgage bonds, which, at the time of purchase, are rated investment-grade. Investment-grade bonds are rated at least BBB- by Standard & Poor’s Rating Services or BBaa3 by Moody’s Investors Service, Inc., have an equivalent rating by a nationally recognized statistical rating organization, or, if unrated, are determined by the sub-adviser (“Sub-Adviser”) to be of comparable quality. The Portfolio may also invest in: preferred stocks; high quality money market instruments; municipal bonds; debt instruments of foreign issues (including those located in emerging market countries); securities denominated in foreign currencies; foreign currencies; mortgage-backed and asset-backed securities; bank loans and floating rate secured loans (“Senior Loans”); and derivatives including futures, options and swaps involving securities, securities indices and interest rates, which may be denominated in the U.S. dollar or foreign currencies. Although the Portfolio may invest a portion of its assets in high-yield (high risk) debt instruments, commonly referred to as “junk bonds,” rated below investment grade, the Portfolio will seek to maintain a minimum average portfolio quality rating of at least investment-grade. Generally, the Sub-Adviser maintains a dollar-weighted average duration between three and ten years. Duration is the most commonly used measure of risk in debt instruments as it incorporates multiple features of the debt instruments (e.g., yield, coupon, maturity, etc.) into one number. Duration is a measure of sensitivity to the price of a debt security to a change in interest rates. Duration is weighted average of the times that interest payments and the final return of principal are received. The weights are the amounts of the instrument. Duration is expressed as a number of | | Under normal market conditions, the Portfolio invests at least 80% of its net assets (plus borrowings for investment purposes) in a portfolio of bonds, including but not limited to corporate, government and mortgage bonds, which, at the time of purchase, are rated investment-grade (e.g., rated at least BBB- by Standard & Poor’s Rating Services or Baa3 by Moody’s Investors Services, Inc.) or have an equivalent rating by a nationally recognized statistical rating organization, or are of comparable quality if unrated. The Portfolio will provide shareholders with at least 60 days’ prior notice of any change in this investment policy. Although the Portfolio may invest a portion of its assets in high-yield (high risk) debt instruments, commonly referred to as “junk bonds,” rated below investment grade, the Portfolio will seek to maintain a minimum average portfolio quality rating of at least investment-grade. Generally, the sub-adviser (“Sub-Adviser”) maintains a dollar-weighted average duration between three and ten years. Duration is the most commonly used measure of risk in debt instruments as it incorporates multiple features of the debt instruments (e.g., yield, coupon, maturity, etc.) into one number. Duration is a measure of sensitivity to the price of a debt security to a change in interest rates. Duration is weighted average of the times that interest payments and the final return of principal are received. The weights are the amounts of the instrument. Duration is expressed as a number of years. The bigger the duration number, the greater the interest-rate risk or reward for the debt instrument prices. For example, the price of a bond with an average duration of five years would be expected to fall approximately 5% if interest rates rose by one percentage point. Conversely, the price of a bond with an average duration of five years would be expected to rise approximately 5% if interest rates drop by one percentage point. The Portfolio may also invest in: preferred stocks; high quality money market instruments; municipal bonds; debt instruments of foreign issues (including those located in emerging market countries); securities |
4
| | Bond Portfolio | | Intermediate Bond Portfolio |
| | years. The bigger the duration number, the greater the interest-rate risk or reward for the debt instrument prices. For example, the price of a bond with an average duration of five years would be expected to fall approximately 5% if interest rates rose by one percentage point. Conversely, the price of a bond with an average duration of five years would be expected to rise approximately 5% if interest rates drop by one percentage point. The Portfolio typically uses derivatives to reduce exposure to other risks, such as interest rate or currency risk, to substitute for taking a position in the underlying assets, and/or to enhance returns in the Portfolio. The Portfolio may seek to obtain exposure to the securities in which it invests by entering into a series of purchase and sale contracts or through other investment techniques such as buy backs and dollar rolls. The Portfolio may invest in other investment companies, including exchange-traded funds, to the extent permitted under the Investment Company Act of 1940, as amended, and the rules, regulations and exemptive orders thereunder (the “1940 Act”). The investment process focuses on buy bonds at a discount to their intrinsic value. The Sub-Adviser utilizes proprietary quantitative techniques to identify bonds or sectors that are inexpensive relative to other bonds or sectors that are inexpensive relative to other bonds or sectors based on their historical price relationships. Teams of asset specialists use this relative value analysis to guide them in the security selection process. The Sub-Adviser may sell securities for a variety of reasons, such as to secure gains, limit losses, or redeploy assets into opportunities believed to be more promising, among others. The Portfolio may lend portfolio securities on a short-term or long-term basis, up to 331/3% of its total assets. | | denominated in foreign currencies; foreign currencies; mortgage-backed and asset-backed securities; bank loans and floating rate secured loans (“Senior Loans”); and derivatives including futures, options and swaps involving securities, securities indices and interest rates, which may be denominated in the U.S. dollar or foreign currencies. The Portfolio typically uses derivatives to reduce exposure to other risks, such as interest rate or currency risk, to substitute for taking a position in the underlying assets, and/or to enhance returns in the Portfolio. The Portfolio may seek to obtain exposure to the securities in which it invests by entering into a series of purchase and sale contracts or through other investment techniques such as buy backs and dollar rolls. The Portfolio may invest in other investment companies, including exchange-traded funds, to the extent permitted under the Investment Company Act of 1940, as amended, and the rules, regulations and exemptive orders thereunder (the “1940 Act”). The Sub-Adviser believes that the relationship between the drivers of debt instrument returns change over time and that recognizing this is key to managing debt instrument assets. Therefore, the Sub-Adviser employs a dynamic investment process that balances top-down macroeconomic considerations and fundamental bottom-up analysis during the steps of its investment process — sector allocation, security selection, duration and yield curve management. This includes leveraging proprietary qualitative analysis along with quantitative tools throughout the portfolio construction process. The Sub-Adviser may sell securities for a variety of reasons, such as to secure gains, limit losses, or redeploy assets into opportunities believed to be more promising, among others. The Portfolio may lend portfolio securities on a short-term or long-term basis, up to 331/3% of its total assets. |
How do the Principal Risks compare?
Because the Portfolios have similar investment objectives, many of the risks of investing in Intermediate Bond Portfolio are the same as the risks of investing in Bond Portfolio. The following summarizes and compares the principal risks of investing in the Portfolios.
Risks | | Bond Portfolio | | Intermediate
Bond Portfolio |
Call During periods of falling interest rates, a bond issuer may “call” or repay its high-yielding bond before the bond’s maturity date. If forced to invest the unanticipated proceeds at lower interest rates, the Portfolio would experience a decline in income. | | ü | | ü |
| | | | |
Company The price of a given company’s stock could decline or underperform for many reasons including, among others, poor management, financial problems, or business challenges. If a company declares bankruptcy or becomes insolvent, its stock could become worthless. | | ü | | ü |
5
Risks | | Bond Portfolio | | Intermediate
Bond Portfolio |
Credit Prices of bonds and other debt instruments can fall if the issuer’s actual or perceived financial health deteriorates, whether because of broad economic or issuer-specific reasons. In certain cases, the issuer could be late in paying interest or principal, or could fail to pay altogether. | | ü | | ü |
| | | | |
Currency To the extent that the Portfolio invests directly in foreign (non-U.S.) currencies or in securities denominated in, or that trade in, foreign (non-U.S.) currencies, it is subject to the risk that those foreign (non-U.S.) currencies will decline in value relative to the U.S. dollar or, in the case of hedging positions, that the U.S. dollar will decline in value relative to the currency being hedged. | | ü | | ü |
| | | | |
Derivative Instruments Derivative instruments are subject to a number of risks, including the risk of changes in the market price of the underlying securities, credit risk with respect to the counterparty, risk of loss due to changes in interest rates and liquidity risk. The use of certain derivatives may also have a leveraging effect which may increase the volatility of the Portfolio and reduce its returns. Derivatives may not perform as expected, so the Portfolio may not realize the intended benefits. When used for hedging, the change in value of a derivative may not correlate as expected with the currency, security, or other risk being hedged. In addition, given their complexity, derivatives expose the Portfolio to the risk of improper valuation. | | ü | | ü |
| | | | |
Foreign Investments/Developing and Emerging Markets Investing in foreign (non-U.S.) securities may result in the Portfolio experiencing more rapid and extreme changes in value than a fund that invests exclusively in securities of U.S. companies due to: smaller markets; differing reporting, accounting, and auditing standards; nationalization, expropriation, or confiscatory taxation; foreign currency fluctuations, currency blockage, or replacement; potential for default on sovereign debt; or political changes or diplomatic developments. Markets and economies throughout the world are becoming increasingly interconnected, and conditions or events in one market, country or region may adversely impact investments or issuers in another market, country or region. Foreign investment risks may be greater in developing and emerging markets than in developed markets. | | ü | | ü |
| | | | |
High-Yield Securities Investments rated below investment-grade (or of similar quality if unrated) are known as “high-yield securities” or “junk bonds.” High-yielding securities are subject to greater levels of credit and liquidity risks. High-yielding securities are considered primarily speculative with respect to the issuer’s continuing ability to make principal and interest payments. | | ü | | ü |
| | | | |
Interest in Loans The value and income streams of interests in loans (including participation interests in lease financings and assignments in secured variable or floating rate loans) will decline if borrowers delay payments or fail to pay altogether. A large rise in interest rates could increase this risk. Although loans are generally fully collateralized when purchased, the collateral may become illiquid or decline in value. Many loans themselves carry liquidity and valuation risks. | | ü | | ü |
| | | | |
Interest Rate With bonds and other fixed rate debt instruments, a rise in interest rates generally causes values to fall; conversely, values generally rise as interest rates fall. The higher the credit quality of the instrument, and the longer its maturity or duration, the more sensitive it is likely to be to interest rate risk. In the case of inverse securities, the interest rate generally will decrease when the market rate of interest to which the inverse security is indexed decreases. As of the date of this Prospectus/Proxy Statement, interest rates in the United States are at or near historic lows, which may increase the Portfolio’s exposure to risks associated with rising interest rates. | | ü | | ü |
| | | | |
Investment Model The manager’s proprietary model may not adequately allow for existing or unforeseen market factors or the interplay between such factors. | | ü | | ü |
| | | | |
Liquidity If a security is illiquid, the Portfolio might be unable to sell the security at a time when the Portfolio’s manager might wish to sell, and the security could have the effect of decreasing the overall level of the Portfolio’s liquidity. Further, the lack of an established secondary market may make it more difficult to value illiquid securities, which could vary from the amount the Portfolio could realize upon disposition. The Portfolio may make investments that become less liquid in response to market developments or adverse investor perception. The Portfolio could lose money if it cannot sell a security at the time and price that would be most beneficial to the Portfolio. | | ü | | ü |
6
Risks | | Bond Portfolio | | Intermediate
Bond Portfolio |
Market Stock prices may be volatile and are affected by the real or perceived impacts of such factors as economic conditions and political events. Stock markets tend to be cyclical, with periods when stock prices generally rise and periods when stock prices generally decline. Any given stock market segment may remain out of favor with investors for a short or long period of time, and stocks as an asset class may underperform bonds or other asset classes during some periods. Additionally, legislative, regulatory or tax policies or developments in these areas may adversely impact the investment techniques available to a manager, add to Portfolio costs and impair the ability of the Portfolio to achieve its investment objectives. | | ü | | ü |
| | | | |
Mortgage- and/or Asset-Backed Securities Defaults on or the low credit quality or liquidity of the underlying assets of the asset-backed (including mortgage-backed) securities held by the Portfolio may impair the value of the securities. There may be limitations on the enforceability of any security interest granted with respect to those underlying assets. These securities also present a higher degree of prepayment and extension risk and interest rate risk than do other types of fixed-income securities. | | ü | | ü |
| | | | |
Municipal Obligations The municipal market in which the Portfolio invests is volatile and can be significantly affected by adverse tax, legislative, or political changes and the financial condition of the issuers of municipal securities. | | ü | | ü |
| | | | |
Other Investment Companies The main risk of investing in other investment companies, including exchange-traded funds, is the risk that the value of the securities underlying an investment company might decrease. Because the Portfolio may invest in other investment companies, you will pay a proportionate share of the expenses of those other investment companies (including management fees, administration fees, and custodial fees) in addition to the expenses of the Portfolio. | | ü | | ü |
| | | | |
Prepayment and Extension Prepayment risk is the risk that principal on mortgages or other loan obligations underlying a security may be repaid prior to the stated maturity date, which may reduce the market value of the security and the anticipated yield-to-maturity. Extension risk is the risk that an issuer will exercise its right to repay principal on an obligation held by the Portfolio later than expected, which may decrease the value of the obligation and prevent the Portfolio from investing expected repayment proceeds in securities paying yields higher than the yields paid by the securities that were expected to be repaid. | | ü | | ü |
| | | | |
Securities Lending Securities lending involves two primary risks: “investment risk” and “borrower default risk.” Investment risk is the risk that the Portfolio will lose money from the investment of the cash collateral received from the borrower. Borrower default risk is the risk that the Portfolio will lose money due to the failure of a borrower to return a borrowed security in a timely manner. | | ü | | ü |
| | | | |
Sovereign Debt These securities are issued or guaranteed by foreign government entities. Investments in sovereign debt are subject to the risk that a government entity may delay payment, restructure its debt, or refuse to pay interest or repay principal on its sovereign debt. Some of these reasons may include cash flow problems, insufficient foreign currency reserves, political considerations, the relative size of its debt position to its economy or its failure to put in place economic reforms required by the International Monetary Fund or other multilateral agencies. If a government entity defaults, it may ask for more time in which to pay or for further loans. There is no legal process for collecting sovereign debts that a government does not pay or a bankruptcy proceeding by which all or a part of the sovereign debt that a government entity has not repaid may be collected. | | ü | | |
| | | | |
U.S. Government Securities and Obligations U.S. government securities are obligations of, or guaranteed by, the U.S. government, its agencies or government-sponsored enterprises. U.S. government securities are subject to market and interest rate risk, and may be subject to varying degrees of credit risk. | | ü | | ü |
7
How does Bond Portfolio’s performance compare to that of Intermediate Bond Portfolio?
The following information is intended to help you understand the risks of investing in the Portfolios. The following bar chart shows the changes in Bond Portfolio’s performance and Intermediate Bond Portfolio’s Class S shares’ performance from year to year, and the table compares each Portfolio’s performance to the performance of a broad-based securities market index for the same period. Each Portfolio’s performance information reflects applicable fee waivers and/or expense limitations in effect during the period presented. Absent such fee waivers/expense limitations, if any, performance would have been lower. Performance in the Average Annual Total Returns table does not include insurance-related charges imposed under a Variable Contract or expenses related to a Qualified Plan. If these charges or expenses were included, performance would be lower. Thus, you should not compare the Portfolio’s performance directly with the performance information of other investment products without taking into account all insurance-related charges and expenses payable under your Variable Contract or Qualified Plan. The Portfolios’ past performance is no guarantee of future results.
ING Bond Portfolio - Calendar Year Total Returns
(as of December 31 of each year)
Best quarter: 2nd, 2009, 5.88% and Worst quarter: 3rd, 2008, (5.64)%
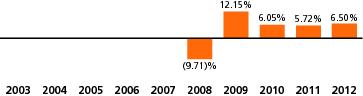
ING Intermediate Bond Portfolio - Calendar Year Total Returns
(as of December 31 of each year)

Best quarter: 3rd, 2009, 7.10% and Worst quarter: 3rd, 2008, (4.42)%
Average Annual Total Returns%
(for the periods ended December 31, 2012)
| | | | 1 Year | | 3 Years | | 5 Years | | 10 Years
(or life of the class) | | Inception
Date | |
Bond Portfolio(1) | | % | | 6.50 | | 6.09 | | 3.87 | | 3.75 | | 11/12/07 | |
BCAB Index(2) | | % | | 4.21 | | 6.19 | | 5.95 | | 6.17 | (4) | — | |
| | | | | | | | | | | | | |
Intermediate Bond Portfolio (Class S)(3) | | % | | 9.08 | | 8.63 | | 5.44 | | 5.02 | | 05/03/02 | |
BCAB Index(2) | | % | | 4.21 | | 6.19 | | 5.95 | | 5.18 | | — | |
(1) Prior to July 2012, Bond Portfolio operated as a “master-feeder” structure, wherein it invested all of its assets in Class 1 shares of the American Funds Insurance Series® Bond Fund (the “Master Fund”). Performance prior to that date is attributable to the Master Fund.
(2) The index returns do not reflect deductions for fees, expenses, or taxes.
(3) Christine Hurtsellers began serving as a portfolio manager to Intermediate Bond Portfolio in January 2009. Matthew Toms began serving as a portfolio manager in August 2010. Performance prior to that period is attributable to a different portfolio management team.
(4) Reflects index performance since the date closest to the Portfolio’s inception for which data is available.
8
How does the management of the Portfolios compare?
The following table describes the management of the Portfolios.
| | Bond Portfolio | | Intermediate Bond Portfolio |
Investment Adviser | | ING Investments, LLC
(“ING Investments” or the “Adviser”) | | ING Investments |
| | | | |
Investment Advisory Fee
(as a percentage of average daily net assets) | | 0.480% of the first $600 million of assets;
0.440% on the next $400 million of assets;
0.400% on the next $1 billion of assets;
0.380% on the next $1 billion of assets
0.360% on assets in excess of $3 billion. | | Currently:
0.400% on all assets If the Reorganization is approved by shareholders;
0.400% on the 1st $4 billion;
0.380% on the next $3 billion; and
0.360% on all assets thereafter(1) |
| | | | |
Sub-Adviser | | ING Investment Management Co. LLC
(“ING IM”) | | ING IM |
| | | | |
Sub-Advisory Fee
(as a percentage of average daily net assets) | | 0.216% on the first $600 million;
0.198% on the next $400 million;
0.180% on the next $1 billion;
0.171% on the next $1 billion;
0.162% on all assets thereafter | | 0.180% on all assets |
| | | | |
Portfolio Managers | | Christine Hurtsellers, CFA
Matthew Toms | | Christine Hurtsellers, CFA
Matthew Toms |
| | | | |
Administrator | | ING Funds Services, LLC
(the “Administrator”) | | Administrator |
| | | | |
Administrative Fee
(as a percentage of average daily net assets) | | 0.100% on all assets | | 0.055% on the first $5 billion;
0.030% on all assets thereafter |
| | | | |
Distributor | | ING Investment Distributor, LLC
(the “Distributor”) | | Distributor |
(1) At the October 2013 Board Meeting, the Board also approved the reorganization of ING PIMCO Total Return Bond Portfolio, a separate series of ING Investors Trust, with and into Intermediate Bond Portfolio. If approved by shareholders of ING PIMCO Total Return Bond Portfolio, this reorganization is also expected to occur in March 2014. This advisory fee is contingent upon shareholder approval of the reorganization of either Bond Portfolio or ING PIMCO Total Return Bond Portfolio into Intermediate Bond Portfolio.
Advisers to the Portfolios
ING Investments, an Arizona limited liability company, serves as the investment adviser to the Portfolios. ING Investments has overall responsibility for the management of the Portfolios. ING Investments oversees all investment advisory and portfolio management services for the Portfolios. ING Investments is registered with the SEC as an investment adviser.
The Adviser is an indirect, wholly-owned subsidiary of ING U.S., Inc. (“ING U.S.”). ING U.S. is a U.S.-based financial institution whose subsidiaries operate in the retirement, investment, and insurance industries. As of the date of this Prospectus, ING U.S. is a majority-owned subsidiary of ING Groep N.V. (“ING Groep”). ING Groep is a global financial institution of Dutch origin, with operations in more than 40 countries.
In October 2009, ING Groep submitted a restructuring plan (the “Restructuring Plan”) to the European Commission in order to receive approval for state aid granted to ING Groep by the Kingdom of the Netherlands in November 2008 and March 2009. To receive approval for this state aid, ING Groep was required to divest its insurance and investment management businesses, including ING U.S., before the end of 2013. In November 2012, the Restructuring Plan was amended to permit ING Groep additional time to complete the divestment. Pursuant to the amended Restructuring Plan, ING Groep must divest at least 25% of ING U.S. by the end of 2013, more than 50% by the end of 2014, and the remaining interest by the end of 2016 (such divestment, the “Separation Plan”).
In May 2013, ING U.S. conducted an initial public offering of ING U.S. common stock (the “IPO”). On September 13, 2013, ING U.S. filed a new Registration Statement on Form S-1 with the U.S. Securities and Exchange Commission (the “SEC”) in connection with another potential public offering of ING U.S. common stock held by ING Groep. ING U.S. will did not issue or sell common stock in the offering. On October 23, 2013, ING U.S. announced the pricing of 33 million shares of its common stock being offered by ING Groep in this offering. Closing of the offering occurred on October 29, 2013. ING Groep also granted the underwriters in the offering an option exercisable within 30 days, to acquire up to approximately an additional 5 million shares from ING Groep. This option was exercised in full. ING U.S. did not receive any proceeds from the offering.
ING Groep continues to own a majority of the common stock of ING U.S. ING Groep has stated that it intends to sell its remaining controlling ownership interest in ING U.S. over time. While the base case for the remainder of the Separation Plan is the
9
divestment of ING Groep’s remaining interest in one or more broadly distributed offerings, all options remain open and it is possible that ING Groep’s divestment of its remaining interest in ING U.S. may take place by means of a sale to a single buyer or group of buyers.
It is anticipated that one or more of the transactions contemplated by the Separation Plan would result in the automatic termination of the existing advisory and sub-advisory agreements under which the Adviser and sub-adviser provide services to each Portfolio. In order to ensure that the existing investment advisory and sub-advisory services can continue uninterrupted, the Board approved new advisory and sub-advisory agreements for the Portfolios in connection with the IPO. Shareholders of the Portfolios approved new investment advisory and sub-advisory agreements prompted by the IPO, as well as any future advisory and sub-advisory agreements prompted by the Separation that are approved by the Board and whose terms are not materially different from the current agreements. This means that shareholders may not have another opportunity to vote on a new agreement with the Adviser or an affiliated sub-adviser even if they undergo a change of control, as long as no single person or group of persons acting together gains “control” (as defined in the 1940 Act) of ING U.S.
The Separation Plan, whether implemented through public offerings or other means, may be disruptive to the businesses of ING U.S. and its subsidiaries, including the Adviser and affiliated entities that provide services to the Portfolios, and may cause, among other things, interruption of business operations or services, diversion of management’s attention from day-to-day operations, reduced access to capital, and loss of key employees or customers. The completion of the Separation Plan is expected to result in the Adviser’s loss of access to the resources of ING Groep, which could adversely affect its business. It is anticipated that ING U.S., as a stand-alone entity, may be a publicly held U.S. company subject to the reporting requirements of the Securities Exchange Act of 1934 as well as other U.S. government and state regulations, and subject to the risk of changing regulation.
During the time that ING Groep retains a majority interest in ING U.S., circumstances affecting ING Groep, including restrictions or requirements imposed on ING Groep by European and other authorities, may also affect ING U.S. A failure to complete the Separation Plan could create uncertainty about the nature of the relationship between ING U.S. and ING Groep, and could adversely affect ING U.S. and the Adviser and its affiliates. Currently, the Adviser and its affiliates do not anticipate that the Separation Plan will have a material adverse impact on their operations or the Portfolios and their operations.
ING Investments’ principal office is located at 7337 East Doubletree Ranch Road, Suite 100, Scottsdale, Arizona 85258-2034. As of December 31, 2012, ING Investments managed approximately $46.2 billion in assets.
Sub-Adviser to the Portfolios
ING IM serves as sub-adviser to the Portfolios. ING IM is a Delaware limited liability company, was founded in 1972 and is registered with the SEC as an investment adviser. ING IM is an indirect, wholly-owned subsidiary of ING U.S. and is an affiliate of ING Investments. ING IM has acted as adviser or sub-adviser to mutual funds since 1994 and has managed institutional accounts since 1972. The principal office of ING IM is located at 230 Park Avenue, New York, New York 10169. As of December 31, 2012, ING IM managed approximately $66.3 billion in assets.
The following individuals are jointly responsible for the day-to-day management of Portfolios.
Christine Hurtsellers, CFA, Portfolio Manager, has been with ING IM since 2005 and leads the fixed-income business for ING IM. From 1999 to 2005, Ms. Hurtsellers worked at Freddie Mac® where she managed adjustable-rate mortgages, mortgage-backed securities, collateralized mortgage obligations, and mortgage derivatives portfolios. Ms. Hurtsellers also managed portfolios for Alliance Capital Management and Banc One.
Matthew Toms, CFA, Portfolio Manager, joined ING IM in September, 2009 as Senior Vice President and Head of U.S. Public Fixed-Income Investments. In this role, Mr. Toms directly oversees the investment teams responsible for investment-grade corporate, high-yield corporate, structured product, and money market strategies for the general account as well as external client business; as well as ensures coordination of credit strategies across developed and emerging markets. Prior to joining ING IM, Mr. Toms was employed by Calamos Investments from March, 2007 to September, 2009, where he established and grew their fixed-income business. From May 2000 to March 2007, Mr. Toms was employed by Northern Trust and Lincoln National in various different roles.
Administrator
The Administrator serves as administrator to each Portfolio. With respect to Intermediate Bond Portfolio, the Administrator receives an annual administrative services fee equal to 0.055% on the first $5 billion of daily net assets and 0.03% thereafter of the Portfolio’s average daily net assets. With respect to Bond Portfolio, the Administrator receives an annual administrative services fee equal to 0.10% of the Portfolio’s average daily net assets.
The administrative services provided to each Portfolio includes acting as a liaison among the various service providers to the Portfolio, including the custodian, portfolio accounting agent, the Sub-Adviser, and the insurance companies to which a Portfolio offers its shares. The Administrator also reviews the Portfolios for compliance with applicable legal requirements and monitors the Sub-Adviser for compliance with requirements under applicable law and with the investment policies and restrictions of the Portfolios.
Distributor
The Distributor is the principal underwriter and distributor of each Portfolio. It is a Delaware limited liability company with its principal offices at 7337 East Doubletree Ranch Road, Suite 100, Scottsdale, Arizona 85258-2034.
10
The Distributor is a member of the Financial Industry Regulatory Authority, Inc. (“FINRA”). To obtain information about FINRA member firms and their associated persons, you may contact FINRA at www.finra.org or the Public Disclosure Hotline at 800-289-9999.
What are the key differences in the rights of shareholders of Bond Portfolio and Intermediate Bond Portfolio?
Bond Portfolio is a separate series of ING Investors Trust, an open-end management investment company organized as a Massachusetts business trust. Intermediate Bond Portfolio is an open-end management investment company organized as a Massachusetts business trust. Both Portfolios are governed by a board of trustees consisting of the same 12 members. For more information on the history of ING Investors Trust or Intermediate Bond Portfolio, see each Portfolio’s SAI dated April 30, 2013.
Each Portfolio is organized as a Massachusetts business trust or series thereof, which is governed by a Declaration of Trust and Bylaws. Under Massachusetts law, shareholders of a Massachusetts business trust, under certain circumstances, could be held personally liable for the obligations of the business trust. However, both Bond Portfolio and Intermediate Bond Portfolio operate under a Declaration of Trust that disclaims shareholder liability for acts or obligations of the Portfolio. As such, shareholders have no personal liability for the Portfolio’s acts or obligations.
The key differences are described in the table below.
| | Bond Portfolio | | Intermediate Bond Portfolio |
Quorum | | Except as otherwise provided by law, the holders of thirty percent of the outstanding Shares of each Series or Class present in person or by proxy shall constitute a quorum for the transactions of any business at any meeting of Shareholders. | | At Any Shareholder meeting, unless otherwise provided by law, this Declaration, or the by-laws, the presence in person or by proxy of a majority of the votes entitled to be cast constitutes a quorum. |
| | | | |
Termination | | The Trust, or any Series or Class thereof, may be terminated by the affirmative vote of a majority of the Trustees. | | The Trust or any Series thereof may be terminated by (i) the affirmative vote of the holders of a majority of the Shares entitled to vote at any meeting of Shareholders or (ii) by an instrument in writing signed by a majority of the Trustees. |
Additional Information about the Portfolios
Dividends and Other Distributions
Each Portfolio declares and pays dividends from net investment income at least annually. Each Portfolio will also pay distributions from net realized capital gains, reduced by available capital losses, at least annually. All dividend and capital gains distributions will be automatically reinvested in additional shares of the Portfolios at the net asset value (“NAV”) of such shares on the payment date unless a participating insurance company’s Separate Account is permitted to hold cash and elects to receive payment in cash. From time to time, a portion of a Portfolio’s distributions may constitute a return of capital.
To comply with federal tax regulations, the Portfolios may also pay an additional capital gains distribution.
Capitalization
The following table shows on an unaudited basis the capitalization of each of the Portfolios as of June 30, 2013 and on a pro forma basis as of June 30, 2013, giving effect to the reorganization.
| | Bond Portfolio | | Intermediate Bond
Portfolio | | Adjustments | | Intermediate Bond
Portfolio
Pro Forma | |
Net Assets | | $ | 415,078,591 | | $ | 1,143,399,409 | | — | | $ | 1,558,478,000 | |
Net Asset Value Per Share | | $ | 10.19 | | $ | 12.65 | | — | | $ | 12.65 | |
Shares Outstanding | | 40,725,530 | | 90,395,947 | | (7,912,993 | )(1) | 123,208,484 | |
(1) Reflects new shares issued, net of retired shares of ING Bond Portfolio. (Calculation: Net Assets ÷ NAV per share.)
Additional Information about the Reorganization
The Reorganization Agreement
The terms and conditions under which the proposed transaction may be consummated are set forth in the Reorganization Agreement. Significant provisions of the Reorganization Agreement are summarized below; however, this summary is qualified in its entirety by reference to the Reorganization Agreement, a copy of which is attached to this Proxy Statement/Prospectus as Appendix A.
11
The Reorganization Agreement provides for: (i) the transfer, as of the Closing Date, of all of the assets of Bond Portfolio in exchange for shares of beneficial interest of Intermediate Bond Portfolio and the assumption by Intermediate Bond Portfolio of all of Bond Portfolio’s liabilities; and (ii) the distribution of shares of Intermediate Bond Portfolio to shareholders of Bond Portfolio, as provided for in the Reorganization Agreement. Bond Portfolio will then be liquidated.
Each shareholder of shares of Bond Portfolio will hold, immediately after the Closing Date, Class S shares of Intermediate Bond Portfolio having an aggregate value equal to the aggregate value of the shares of Bond Portfolio held by that shareholder as of the close of business on the Closing Date. In the interest of economy and convenience, shares of Intermediate Bond Portfolio generally will not be represented by physical certificates, unless you request the certificates in writing.
The obligations of the Portfolios under the Reorganization Agreement are subject to various conditions, including approval of the shareholders of Bond Portfolio and that each Portfolio receives an opinion from the law firm of Dechert LLP to the effect that the Reorganization will qualify as a tax-free reorganization for federal income tax purposes. The Reorganization Agreement also requires that each of the Portfolios take, or cause to be taken, all actions, and do or cause to be done, all things reasonably necessary, proper or advisable to consummate and make effective the transactions contemplated by the Reorganization Agreement. The Reorganization Agreement may be terminated by mutual agreement of the parties or on certain other grounds. Please refer to Appendix A to review the terms and conditions of the Reorganization Agreement.
Expenses of the Reorganization
The expenses of the Reorganization will be borne by the Adviser (or an affiliate). The expenses of the Reorganization shall include, but not be limited to, the costs associated with the preparation of necessary filings with the SEC, printing and distribution the Proxy Statement/Prospectus and proxy materials, legal fees, accounting fees, securities registration fees, and expenses of holding the Special Meeting. The expenses of the Reorganization do not include the transition costs described in “Portfolio Transitioning” below.
Tax Considerations
The Reorganization is intended to qualify for federal income tax purposes as a tax-free reorganization under Section 368 of the Code. Accordingly, pursuant to this treatment, neither Bond Portfolio nor its shareholders, nor Intermediate Bond Portfolio nor its shareholders, are expected to recognize any gain or loss for federal income tax purposes from the transactions contemplated by the Reorganization Agreement. As a condition to the Closing of the Reorganization, the Portfolios will receive an opinion from the law firm of Dechert LLP to the effect that the Reorganization will qualify as a tax-free reorganization for federal income tax purposes. That opinion will be based in part upon certain assumptions and upon certain representations made by the Portfolios.
Prior to the Closing Date, Bond Portfolio will pay to the Separate Accounts of Participating Insurance Companies and Qualified Plans that own its shares, a cash distribution consisting of any undistributed investment company taxable income and/or any undistributed realized net capital gains, including any net gains realized from any sales of assets prior to the Closing Date. Variable Contract owners and Plan Participants are not expected to recognize any income or gains for federal income tax purposes from this cash distribution.
As of June 30, 2013, Bond Portfolio has estimated capital loss carryforwards of $4,738,775; none of which will expire as a result of the Reorganization. Intermediate Bond Portfolio has estimated capital loss carryforwards of $217,644,730, although a portion of the amount of these losses that may offset Intermediate Bond Portfolio’s capital gains in any given year is expected to be limited as a result of other reorganizations entered into by Intermediate Bond Portfolio. Variable Contract Owners and Plan Participants are not expected to be affected by any limitations on the utilization of capital losses by the Portfolios. After the Reorganization, the losses of Bond Portfolio generally may be available to Intermediate Bond Portfolio, to offset its capital gains, although a portion of the amount of these losses that may offset Intermediate Bond Portfolio’s capital gains in any given year may be limited due to this Reorganization. The ability of Intermediate Bond Portfolio to absorb losses in the future depends on a variety of factors that cannot be known in advance, including the existence of capital gains against which these losses may be offset. In addition, the benefits of any of these various capital loss carryforwards and built-in losses currently are available only to pre-Reorganization shareholders of each Portfolio. After Reorganization, however, these benefits will inure to the benefit of all post-Reorganization shareholders of Intermediate Bond Portfolio.
Portfolio Transitioning
As discussed above, the Portfolios have substantially similar investment strategies. As a result, ING IM is not expected to sell a significant portion of Bond Portfolio’s holdings prior to the Closing Date to prepare for the Reorganization. If in connection with the Reorganization any of Bond Portfolio’s holdings are sold prior to the Closing Date, the proceeds of such sales are expected to be invested in securities that ING IM wishes for Intermediate Bond Portfolio to hold and temporary investments, which will be delivered to Intermediate Bond Portfolio at the Closing Date. During the transition period, Bond Portfolio may not be pursuing its investment objective and strategies, and limitations on permissible investments and investment restrictions will not apply. After the Closing Date of the Reorganization, ING IM, as the sub-adviser to Intermediate Bond Portfolio, may also sell portfolio holdings that it acquired from Bond Portfolio, and Intermediate Bond Portfolio may not be immediately fully invested in accordance with its stated investment strategies. In addition, each Portfolio may engage in a variety of transition management techniques to facilitate the portfolio transition process, including without limitation, the purchase and sale of baskets of securities and exchange-traded funds, and enter into and close futures contracts or other derivative transactions. Such sales and purchases by the Portfolios during the transition period may be made at a disadvantageous time and could result in potential losses for the Portfolios. No transition costs are expected to be incurred in connection with the Reorganization; however, the Adviser will be responsible for paying any transition costs that are incurred.
12
Future Allocation of Premiums
Shares of Bond Portfolio have been purchased at the direction of Variable Contract owners by Participating Insurance Companies through Separate Accounts to fund benefits payable under a Variable Contract. If the Reorganization is approved, Participating Insurance Companies have advised us that all premiums or transfers to Bond Portfolio will be allocated to Intermediate Bond Portfolio.
What is the Board’s recommendation?
Based upon its review, the Board, including a majority of the Trustees who are not “interested persons,” as defined by the 1940 Act (the “Independent Trustees”), determined that the interests of the shareholders of the Portfolios would not be diluted as a result of the Reorganization and that the Reorganization would be in the best interests of the Portfolios and their shareholders. Accordingly, after consideration of such factors and information it considered relevant, the Board, including a majority of the Independent Trustees, approved the Reorganization Agreement and voted to recommend to shareholders that they approve the Reorganization Agreement. The Board is therefore recommending that Total Return Bond’s shareholders vote “FOR” the Reorganization Agreement.
What factors did the Board consider?
The Board considered the Reorganization as part of its overall consideration of what would be in the best interest of Bond Portfolio and its shareholders. The Board determined that Bond Portfolio would benefit from being combined into Intermediate Bond Portfolio under the day-to-day management of ING IM.
The Board, in approving the Reorganization, considered a number of factors, including, but not limited to, the following: (1) the similarities and differences in the investment objectives and investment strategies of each Portfolio; (2) an analysis of ING IM as the sub-adviser of each Portfolio; (3) a presentation from ING Investments regarding proposals, including the Reorganization, intending to, among other things, enhance the efficiency and reduce the complexity of the ING Funds Complex; (4) the similarity in fee structures of each of the Portfolios; (5) the superior performance of Intermediate Bond Portfolio as compared to the performance of Bond Portfolio for the year-to-date, one-year, three-year and five-year time periods; (6) the performance of Bond Portfolio as compared to its Morningstar, Inc. (“Morningstar”) peer group and the performance of Intermediate Bond Portfolio as compared to its Morningstar peer group; (7) the lower gross and net expense ratio that current shareholders of Bond Portfolio are expected to experience as a result of the Reorganization; (8) consideration that Bond Portfolio has no designated share classes and Intermediate Bond Portfolio has classes ADV, I, S and S2 and ING Investments’ analysis and proposal regarding merging Bond Portfolio into Class S of Intermediate Bond Portfolio; (9) proposed advisory fee break points for Intermediate Bond Portfolio to be implemented in connection with the Reorganization to provide further benefits to the shareholders of the Portfolios; (10) proposed expense limits for Intermediate Bond Portfolio to be implemented in connection with the Reorganization which will provide the Portfolios’ shareholders with the added benefit of protection against rising expense ratios should Intermediate Bond Portfolio’s net assets ever decrease, subject to Board approval, these expense limits will expire on May 1, 2015; (11) the larger combined asset size of the two Portfolios, which would be likely to provide greater scale and superior potential to maintain long-term scale benefits for the shareholders of both Portfolios; (12) the fact that direct or indirect costs relating to the Reorganization will not be borne by either Portfolio or their shareholders; (13) the expected tax consequences of the Reorganization to Bond Portfolio and its shareholders, including that the Reorganization is intended to qualify for federal income tax purposes as a tax-free reorganization; and (14) the Board’s determination that the Reorganization will not dilute the interests of the shareholders of Bond Portfolio.
In addition, the Board considered the net revenue benefits for ING Investments and its affiliates that would result from the Reorganization.
What is the required vote?
Approval of the Reorganization Agreement requires the affirmative vote of the lesser of: (i) 67% or more of the voting securities present at the meeting, provided that more than 50% of the voting securities are present in person or represented by proxy at the Special Meeting; or (ii) a majority of the shares entitled to vote.
What happens if shareholders do not approve the Reorganization?
If shareholders of Bond Portfolio do not approve the Reorganization, Bond Portfolio will continue to be managed by ING Investments as described in its prospectus, and the Board will determine what additional action should be taken.
13
GENERAL INFORMATION ABOUT THE PROXY STATEMENT/PROSPECTUS
Who is asking for my vote?
The Board is soliciting your vote for a special meeting of Bond Portfolio’s shareholders.
How is my proxy being solicited?
Solicitation of proxies or voting instructions is being made primarily by the mailing of the Notice of Special Meeting, this Proxy Statement/Prospectus, and the Proxy Ballot or Voting Instruction Card on or about January 24, 2014. In addition to the solicitation of proxies by mail, employees of the Adviser and its affiliates, without additional compensation, may solicit proxies in person or by telephone, telegraph, facsimile, or oral communications.
What happens to my proxy once I submit it?
The Board has named Huey P. Falgout, Jr., Secretary, Theresa K. Kelety, Assistant Secretary, and Todd Modic, Assistant Secretary, or one or more substitutes designated by them, as proxies who are authorized to vote Portfolio shares as directed by shareholders.
Can I revoke my proxy after I submit it?
A shareholder may revoke the accompanying proxy at any time prior to its use by filing with ING Investors Trust a written revocation or a duly executed proxy bearing a later date. In addition, any shareholder who attends the Special Meeting in person may vote by ballot at the Special Meeting, thereby canceling any proxy or voting instruction previously given.
How will my shares be voted?
If you follow the voting instructions, your proxies will vote your shares as you have directed. If you submitted your Proxy Ballot or Voting Instruction Card but did not vote on the proposals, your proxies will vote on the proposals as recommended by the Board. If any other matter is properly presented, your proxies will vote in their discretion in accordance with their best judgment, including on any proposal to adjourn the meeting. At the time this Proxy Statement/Prospectus was printed, the Board knew of no matter that needed to be acted upon at the Special Meeting other than the proposals discussed in this Proxy Statement/Prospectus.
Quorum and Tabulation
Each shareholder of Bond Portfolio is entitled to one vote for each share held as to any matter on which such shareholder is entitled to vote and for each fractional share that is owned, the shareholder shall be entitled to a proportionate fractional vote. Thirty percent (30%) of the outstanding shares present in person or by proxy shall constitute a quorum at any meeting of shareholders.
Adjournments
If a quorum is not present at the Special Meeting, if there are insufficient votes to approve any proposal, or for any other reason deemed appropriate by your proxies, your proxies may propose one or more adjournments of the Special Meeting to permit additional time for the solicitation of proxies, in accordance with applicable law. Solicitation of votes may continue to be made without any obligation to provide any additional notice of the adjournment. The persons named as proxies will vote in favor of such adjournments in their discretion.
Abstentions and Broker Non-Votes
If a shareholder abstains from voting as to any matter, or if a broker returns a “non-vote” proxy, indicating a lack of authority to vote on a matter, then the shares represented by such abstention or non-vote will be treated as shares that are present at the Special Meeting for purposes of determining the existence of a quorum. However, abstentions and broker non-votes will be disregarded in determining the “votes cast” on an issue.
Additional Voting Information
The Separate Accounts and Qualified Plans are the record owners of the shares of the Portfolios. The Qualified Plans and Separate Accounts will vote Bond Portfolio’s shares at the Special Meeting in accordance with the timely instructions received from persons entitled to give voting instructions under the Variable Contracts or Qualified Plans. Bond Portfolio does not impose any requirement that a minimum percentage of voting instructions be received, before counting the Separate Accounts and Qualified Plans as the Bond Portfolio’s shareholders in determining whether a quorum is present.
Where Variable Contract Holders and Plan Participants fail to give instructions as to how to vote their shares, the Qualified Plans and Separate Accounts will use proportional voting and vote those shares in proportion to the instructions given by other Variable Contract Holders and Plan Participants who voted. The effect of proportional voting is that if a large number of Variable Contract Holders and Plan Participants fail to give voting instructions, a small number of Variable Contract Holders and Plan Participants may determine the outcome of the vote. Because a significant percentage of Bond Portfolio’s shares are held by Separate Accounts, which use proportional voting, the presence of such Separate Accounts at the Special Meeting shall be sufficient to constitute a quorum for the transaction of business at the Special Meeting.
14
How many shares are outstanding?
As of the Record Date, the following shares of beneficial interest of Bond Portfolio were outstanding and entitled to vote: []. Shares have no preemptive or subscription rights.
[Confirm] [To the knowledge of the Adviser, as of the Record Date, no current Trustee owns 1% or more of any class of the outstanding shares of the Portfolio, and the officers and Trustees own, as a group, less than 1% of any class of the shares of the Portfolio.]
Appendix C hereto lists the persons that, as of the Record Date owned beneficially or of record 5% or more of any class of the outstanding shares of any class of Bond Portfolio or Intermediate Bond Portfolio.
Can shareholders submit proposals for a future shareholder meeting?
The Portfolio is not required to hold annual meetings and currently does not intend to hold such meetings unless shareholder action is required in accordance with the 1940 Act. A shareholder proposal to be considered for inclusion in a proxy statement at any subsequent meeting of shareholders must be submitted in a reasonable time before a proxy statement for that meeting is printed and mailed. Whether a proposal is submitted in a proxy statement will be determined in accordance with applicable federal and state laws.
Why did my household only receive one copy of this Proxy Statement/Prospectus?
Only one copy of this Proxy Statement/Prospectus may be mailed to each household, even if more than one person in the household is a Portfolio shareholder of record, unless the Portfolio has received contrary instructions from one or more of the household’s shareholders. If a shareholder needs an additional copy of this Proxy Statement, please contact Shareholder Services at (800) 992-0180. If in the future, any shareholder does not wish to combine or wishes to recombine the mailing of a proxy statement with household members, please inform the Portfolio in writing at 7337 East Doubletree Ranch Road, Suite 100, Scottsdale, Arizona, 85258-2034 or via telephone at (800) 992-0180.
In order that the presence of a quorum at the Special Meeting may be assured, prompt execution and return of the enclosed Proxy Ballot or Voting Instruction Card is requested. A self-addressed postage paid envelope is enclosed for your convenience. You also may vote via telephone or via the Internet. Please follow the voting instructions as outlined on your Proxy Ballot or Voting Instruction Card.
| 
|
| Huey P. Falgout, Jr. |
| Secretary |
January 24, 2014
7337 East Doubletree Ranch Road, Suite 100
Scottsdale, Arizona 85258-2034
15
APPENDIX A: FORM OF AGREEMENT AND PLAN OF REORGANIZATION
THIS AGREEMENT AND PLAN OF REORGANIZATION (the “Agreement”) is made as of this 12th day of September, 2013, by ING Intermediate Bond Portfolio (“IIBP”), a Massachusetts business trust with its principal place of business at 7337 East Doubletree Ranch Road, Suite 100, Scottsdale, Arizona 85258-2034, on behalf of its series, ING Intermediate Bond Portfolio (the “Acquiring Portfolio”), and ING Investors Trust (“IIT”), a Massachusetts business trust with its principal place of business at 7337 East Doubletree Ranch Road, Suite 100, Scottsdale, Arizona 85258-2034, on behalf of its series, ING Bond Portfolio (the “Acquired Portfolio”).
This Agreement is intended to be and is adopted as a plan of reorganization and liquidation within the meaning of Section 368(a)(1) of the United States Internal Revenue Code of 1986, as amended (the “Code”). The reorganization (the “Reorganization”) will consist of the transfer of all of the assets of the Acquired Portfolio to the Acquiring Portfolio in exchange solely for Class S voting shares of beneficial interest of the Acquiring Portfolio (the “Acquiring Portfolio Shares”), the assumption by the Acquiring Portfolio of the liabilities of the Acquired Portfolio described in paragraph 1.3, and the distribution of the Acquiring Portfolio Shares to the shareholders of the Acquired Portfolio in complete liquidation of the Acquired Portfolio as provided herein, all upon the terms and conditions hereinafter set forth in this Agreement.
WHEREAS, the Acquired Portfolio and the Acquiring Portfolio are series of open-end, registered investment companies of the management type and the Acquired Portfolio owns securities which generally are assets of the character in which the Acquiring Portfolio is permitted to invest; and
WHEREAS, the Board of Trustees of IIBP has determined that the exchange of all of the assets of the Acquired Portfolio for Acquiring Portfolio Shares and the assumption of the liabilities of the Acquired Portfolio, as described in paragraph 1.3 herein, by the Acquiring Portfolio are in the best interests of the Acquiring Portfolio and its shareholders and that the interests of the existing shareholders of the Acquiring Portfolio would not be diluted as a result of this transaction; and
WHEREAS, the Board of Trustees of IIT has determined that the exchange of all of the assets of the Acquired Portfolio for Acquiring Portfolio Shares and the assumption of the liabilities of the Acquired Portfolio by the Acquiring Portfolio, as described in paragraph 1.3 herein, is in the best interests of the Acquired Portfolio and its shareholders and that the interests of the existing shareholders of the Acquired Portfolio would not be diluted as a result of this transaction.
NOW, THEREFORE, in consideration of the premises and of the covenants and agreements hereinafter set forth, the parties hereto covenant and agree as follows:
1. TRANSFER OF ASSETS OF THE ACQUIRED PORTFOLIO TO THE ACQUIRING PORTFOLIO IN EXCHANGE FOR THE ACQUIRING PORTFOLIO SHARES, THE ASSUMPTION OF ALL ACQUIRED PORTFOLIO LIABILITIES AND THE LIQUIDATION OF THE ACQUIRED PORTFOLIO
1.1. Subject to the requisite approval of the Acquired Portfolio shareholders and the other terms and conditions herein set forth and on the basis of the representations and warranties contained herein, the Acquired Portfolio agrees to transfer all of the Acquired Portfolio’s assets, as set forth in paragraph 1.2, to the Acquiring Portfolio, and the Acquiring Portfolio agrees in exchange therefor: (i) to deliver to the Acquired Portfolio the number of full and fractional Class S Acquiring Portfolio Shares determined by dividing the value of the Acquired Portfolio’s net assets with respect to each class, computed in the manner and as of the time and date set forth in paragraph 2.1, by the net asset value of one Acquiring Portfolio Share of the same class, computed in the manner and as of the time and date set forth in paragraph 2.2; and (ii) to assume the liabilities of the Acquired Portfolio, as set forth in paragraph 1.3. Such transactions shall take place at the closing provided for in paragraph 3.1 (the “Closing”).
1.2. The assets of the Acquired Portfolio to be acquired by the Acquiring Portfolio shall consist of all assets and property, including, without limitation, all cash, securities, commodities and futures interests and dividends or interests receivable that are owned by the Acquired Portfolio and any deferred or prepaid expenses shown as an asset on the books of the Acquired Portfolio on the closing date provided for in paragraph 3.1 (the “Closing Date”) (collectively, “Assets”).
1.3. The Acquired Portfolio will endeavor to discharge all of its liabilities and obligations prior to the Closing Date. The Acquiring Portfolio shall assume all of the liabilities of the Acquired Portfolio, whether accrued or contingent, known or unknown, existing at the Valuation Date, as defined in paragraph 2.1. On or as soon as practicable prior to the Closing Date, the Acquired Portfolio will declare and pay to its shareholders of record one or more dividends and/or other distributions so that it will have distributed substantially all (and in no event less than 98%) of its investment company taxable income (computed without regard to any deduction for dividends paid) and realized net capital gain, if any, for the current taxable year through the Closing Date.
1.4. Immediately after the transfer of assets provided for in paragraph 1.1, the Acquired Portfolio will: (i) distribute to the Acquired Portfolio’s shareholders of record with respect to its Class S shares, determined as of immediately after the close of business on the Closing Date, on a pro rata basis within each class, the Acquiring Portfolio Shares of the same class received by the Acquired Portfolio pursuant to paragraph 1.1; and (ii) completely liquidate. Such distribution and liquidation will be accomplished by the transfer of the Acquiring Portfolio Shares then credited to the account of the Acquired Portfolio on the books of the Acquiring Portfolio to open accounts on the share records of the Acquiring Portfolio in the names of the shareholders of record of the Acquired Portfolio’s shares, determined as of immediately after the close of business on the Closing Date (the “Acquired Portfolio Shareholders”). The aggregate net asset value of Class S Acquiring Portfolio Shares to be so credited to shareholders of Class S shares of the Acquired Portfolio shall, with respect to each class, be equal to the aggregate net asset value of the Acquired Portfolio shares of that same class owned by such shareholders on the Closing Date. All issued and outstanding
16
Class S Acquired Portfolio shares will simultaneously be canceled on the books of the Acquired Portfolio, although share certificates representing interests in Class S shares of the Acquired Portfolio will represent a number of the same class of Acquiring Portfolio Shares after the Closing Date, as determined in accordance with Section 2.3. The Acquiring Portfolio shall not issue certificates representing the Class S Acquiring Portfolio Shares in connection with such exchange.
1.5. Ownership of Acquiring Portfolio Shares will be shown on the books of the Acquiring Portfolio’s transfer agent, as defined in paragraph 3.3.
1.6. Any reporting responsibility of the Acquired Portfolio including, but not limited to, the responsibility for filing of regulatory reports, tax returns, or other documents with the U.S. Securities and Exchange Commission (the “Commission”), any state securities commission, and any federal, state or local tax authorities or any other relevant regulatory authority, is and shall remain the responsibility of the Acquired Portfolio.
2. VALUATION
2.1. The value of the Assets shall be the value computed as of immediately after the close of business of the New York Stock Exchange and after the declaration of any dividends on the Closing Date (such time and date being hereinafter called the “Valuation Date”), using the valuation procedures in the then-current prospectus and statement of additional information with respect to the Acquiring Portfolio, and valuation procedures established by the Board of Trustees of IIT.
2.2. The net asset value of a Class S Acquiring Portfolio Share shall be the net asset value per share computed with respect to that class as of the Valuation Date, using the valuation procedures set forth in the Acquiring Portfolio’s then-current prospectus and statement of additional and valuation procedures established by the Board of Trustees of IIT.
2.3. The number of the Class S Acquiring Portfolio Shares to be issued (including fractional shares, if any) in exchange for the Acquired Portfolio’s assets shall be determined with respect to each such class by dividing the value of the net assets with respect to the Class S shares of the Acquired Portfolio, as the case may be, determined using the same valuation procedures referred to in paragraph 2.1, by the net asset value of an Acquiring Portfolio Share of the same Class determined in accordance with paragraph 2.2.
2.4. All computations of value shall be made by the Acquired Portfolio’s designated record keeping agent and shall be subject to review by Acquiring Portfolio’s record keeping agent and by each Fund’s respective independent registered public accounting firm.
3. CLOSING AND CLOSING DATE
3.1. The Closing Date shall be March 14, 2014 or such other date as the parties may agree. All acts taking place at the Closing shall be deemed to take place simultaneously as of immediately after the close of business on the Closing Date unless otherwise agreed to by the parties. The close of business on the Closing Date shall be as of 4:00 p.m., Eastern Time. The Closing shall be held at the offices of the Acquiring Portfolio or at such other time and/or place as the parties may agree.
3.2. The Acquired Portfolio shall direct the Bank of New York Mellon, as custodian for the Acquired Portfolio (the “Custodian”), to deliver, at the Closing, a certificate of an authorized officer stating that (i) the Assets shall have been delivered in proper form to the Acquiring Portfolio within two business days prior to or on the Closing Date; and (ii) all necessary taxes in connection with the delivery of the Assets, including all applicable federal and state stock transfer stamps, if any, have been paid or provision for payment has been made. The Acquired Portfolio’s portfolio securities represented by a certificate or other written instrument shall be presented for examination by the Custodian to the custodian for the Acquiring Portfolio no later than five business days preceding the Closing Date, and shall be transferred and delivered by the Acquired Portfolio as of the Closing Date for the account of the Acquiring Portfolio duly endorsed in proper form for transfer in such condition as to constitute good delivery thereof. The Custodian shall deliver as of the Closing Date by book entry, in accordance with the customary practices of the Custodian and any securities depository (as defined in Rule 17f-4 under the Investment Company Act of 1940, as amended (the “1940 Act”)) in which the Acquired Portfolio’s Assets are deposited, the Acquired Portfolio’s portfolio securities and instruments deposited with such depositories. The cash to be transferred by the Acquired Portfolio shall be delivered by wire transfer of federal funds on the Closing Date.
3.3. The Acquired Portfolio shall direct BNY Mellon Investment Servicing (U.S.) Inc. (the “Transfer Agent”), on behalf of the Acquired Portfolio, to deliver at the Closing a certificate of an authorized officer stating that its records contain the names and addresses of the Acquired Portfolio Shareholders and the number and percentage ownership of outstanding Class S shares owned by each such shareholder immediately prior to the Closing. The Acquiring Portfolio shall issue and deliver a confirmation evidencing the Acquiring Portfolio Shares to be credited on the Closing Date to the Secretary of the Acquiring Portfolio, or provide evidence satisfactory to the Acquired Portfolio that such Acquiring Portfolio Shares have been credited to the Acquired Portfolio’s account on the books of the Acquiring Portfolio. At the Closing, each party shall deliver to the other such bills of sale, checks, assignments, share certificates, if any, receipts or other documents as such other party or its counsel may reasonably request.
3.4. In the event that on the Valuation Date (a) the New York Stock Exchange or another primary trading market for portfolio securities of the Acquiring Portfolio or the Acquired Portfolio shall be closed to trading or trading thereupon shall be restricted, or (b) trading or the reporting of trading on such Exchange or elsewhere shall be disrupted so that, in the judgment of the Board of Trustees of IIT, accurate appraisal of the value of the net assets of the Acquiring Portfolio or the Acquired Portfolio is impracticable, the Closing Date shall be postponed until the first business day after the day when trading shall have been fully resumed and reporting shall have been restored.
17
4. REPRESENTATIONS AND WARRANTIES
4.1. Except as has been disclosed to the Acquiring Portfolio in a written instrument executed by an officer of IIT, IIT, on behalf of the Acquired Portfolio, represents and warrants to IIBP as follows:
(a) The Acquired Portfolio is duly organized as a series of IIT, which is a business trust duly organized, validly existing and in good standing under the laws of the Commonwealth of Massachusetts, with power under IIT’s Declaration of Trust to own all of its properties and assets and to carry on its business as it is now being conducted;
(b) IIT is a registered investment company classified as a management company of the open-end type, and its registration with the Commission as an investment company under the 1940 Act, and the registration of shares of the Acquired Portfolio under the Securities Act of 1933, as amended (“1933 Act”), are in full force and effect;
(c) No consent, approval, authorization, or order of any court or governmental authority is required for the consummation by the Acquired Portfolio of the transactions contemplated herein, except such as have been obtained under the 1933 Act, the Securities Exchange Act of 1934, as amended (the “1934 Act”) and the 1940 Act and such as may be required by state securities laws;
(d) The current prospectus and statement of additional information of the Acquired Portfolio and each prospectus and statement of additional information of the Acquired Portfolio used during the three years previous to the date of this Agreement conforms or conformed at the time of its use in all material respects to the applicable requirements of the 1933 Act and the 1940 Act and the rules and regulations of the Commission thereunder and does not, or did not at the time of its use, include any untrue statement of a material fact or omit to state any material fact required to be stated therein or necessary to make the statements therein, in light of the circumstances under which they were made, not materially misleading;
(e) On the Closing Date, the Acquired Portfolio will have good and marketable title to the Assets and full right, power, and authority to sell, assign, transfer and deliver such Assets hereunder free of any liens or other encumbrances, and upon delivery and payment for such Assets, the Acquiring Portfolio will acquire good and marketable title thereto, subject to no restrictions on the full transfer thereof, including such restrictions as might arise under the 1933 Act, other than as disclosed to the Acquiring Portfolio;
(f) The Acquired Portfolio is not engaged currently, and the execution, delivery and performance of this Agreement will not result, in (i) a material violation of IIT’s Declaration of Trust or By-Laws or of any agreement, indenture, instrument, contract, lease or other undertaking to which IIT, on behalf of the Acquired Portfolio, is a party or by which it is bound; or (ii) the acceleration of any obligation, or the imposition of any penalty, under any agreement, indenture, instrument, contract, lease, judgment or decree to which IIT, on behalf of the Acquired Portfolio, is a party or by which it is bound;
(g) All material contracts or other commitments of the Acquired Portfolio (other than this Agreement and certain investment contracts including options, futures and forward contracts) will terminate without liability to the Acquired Portfolio prior to the Closing Date;
(h) Except as otherwise disclosed in writing to and accepted by IIT, on behalf of the Acquiring Portfolio, no litigation or administrative proceeding or investigation of or before any court or governmental body is presently pending or, to its knowledge, threatened against the Acquired Portfolio or any of its properties or assets that, if adversely determined, would materially and adversely affect its financial condition or the conduct of its business. IIT, on behalf of the Acquired Portfolio, knows of no facts which might form the basis for the institution of such proceedings and is not a party to or subject to the provisions of any order, decree or judgment of any court or governmental body which materially and adversely affects its business or its ability to consummate the transactions herein contemplated;
(i) The Statement of Assets and Liabilities, Statements of Operations and Changes in Net Assets, and Schedule of Investments of the Acquired Portfolio at December 31, 2012 have been audited by KPMG LLP, an independent registered public accounting firm, and are in accordance with U.S. generally accepted accounting principles (“U.S. GAAP”) consistently applied, and such statements (copies of which have been furnished to the Acquiring Portfolio) present fairly, in all material respects, the financial condition of the Acquired Portfolio as of such date in accordance with U.S. GAAP, and there are no known contingent liabilities of the Acquired Portfolio required to be reflected on a balance sheet (including the notes thereto) in accordance with U.S. GAAP as of such date not disclosed therein;
(j) Since December 31, 2012, there has not been any material adverse change in the Acquired Portfolio’s financial condition, assets, liabilities or business, other than changes occurring in the ordinary course of business, or any incurrence by the Acquired Portfolio of indebtedness maturing more than one year from the date such indebtedness was incurred, except as otherwise disclosed to and accepted by the Acquiring Portfolio (for the purposes of this subparagraph (j), a decline in net asset value per share of the Acquired Portfolio due to declines in market values of securities in the Acquired Portfolio’s portfolio, the discharge of Acquired Portfolio liabilities, or the redemption of Acquired Portfolio shares by shareholders of the Acquired Portfolio shall not constitute a material adverse change);
(k) On the Closing Date, all Federal and other tax returns, dividend reporting forms, and other tax-related reports of the Acquired Portfolio required by law to have been filed by such date (including any extensions) shall have been filed and are or will be correct in all material respects, and all Federal and other taxes shown as due or required to be shown as due on said returns and reports shall have been paid or provision shall have been made for the payment thereof, and to the best of the Acquired Portfolio’s knowledge, no such return is currently under audit and no assessment has been asserted with respect to such returns;
18
(l) For each taxable year of its operation (including the taxable year ending on the Closing Date), the Acquired Portfolio has met (or will meet) the requirements of Sub-chapter M of the Code for qualification as a regulated investment company, has been (or will be) eligible to and has computed (or will compute) its federal income tax under Section 852 of the Code, and will have distributed all of its investment company taxable income and net capital gain (as defined in the Code) that has accrued through the Closing Date, and before the Closing Date will have declared dividends sufficient to distribute all of its investment company taxable income and net capital gain for the period ending on the Closing Date, and has met the diversification and other requirements of Section 817(h) of the Code and Treasury Regulations Section 1.815-5 thereunder;
(m) All issued and outstanding shares of the Acquired Portfolio are, and on the Closing Date will be, duly and validly issued and outstanding, fully paid and non-assessable, and have been offered and sold in every state and the District of Columbia in compliance in all material respects with applicable registration requirements of the 1933 Act and state securities laws. All of the issued and outstanding shares of the Acquired Portfolio will, at the time of Closing, be held by the persons and in the amounts set forth in the records of the Transfer Agent, on behalf of the Acquired Portfolio, as provided in paragraph 3.3. The Acquired Portfolio does not have outstanding any options, warrants or other rights to subscribe for or purchase any of the shares of the Acquired Portfolio, nor is there outstanding any security convertible into any of the Acquired Portfolio shares;
(n) The execution, delivery and performance of this Agreement will have been duly authorized prior to the Closing Date by all necessary action, if any, on the part of the Board of Trustees of IIT, on behalf of the Acquired Portfolio, and, subject to the approval of the shareholders of the Acquired Portfolio, this Agreement will constitute a valid and binding obligation of the Acquired Portfolio, enforceable in accordance with its terms, subject, as to enforcement, to bankruptcy, insolvency, reorganization, moratorium and other laws relating to or affecting creditors’ rights and to general equity principles;
(o) The information to be furnished by the Acquired Portfolio for use in registration statements, proxy materials and other documents filed or to be filed with any federal, state or local regulatory authority (including the Financial Industry Regulatory Authority), which may be necessary in connection with the transactions contemplated hereby, shall be accurate and complete in all material respects and shall comply in all material respects with Federal securities and other laws and regulations thereunder applicable thereto; and
(p) The proxy statement of the Acquired Portfolio (the “Proxy Statement”) to be included in the Registration Statement referred to in paragraph 5.6, insofar as it relates to the Acquired Portfolio, will, on the effective date of the Registration Statement and on the Closing Date (i) not contain any untrue statement of a material fact or omit to state a material fact required to be stated therein or necessary to make the statements therein, in light of the circumstances under which such statements were made, not materially misleading provided, however, that the representations and warranties in this subparagraph (p) shall not apply to statements in or omissions from the Proxy Statement and the Registration Statement made in reliance upon and in conformity with information that was furnished by the Acquiring Portfolio for use therein; and (ii) comply in all material respects with the provisions of the 1933 Act, the 1934 Act and the 1940 Act and the rules and regulations thereunder.
4.2. Except as has been disclosed to the Acquired Portfolio in a written instrument executed by an officer of IIBP, IIBP, on behalf of the Acquiring Portfolio, represents and warrants to IIT as follows:
(a) The Acquiring Portfolio is duly organized as a series of IIBP, which is a statutory trust duly organized, validly existing and in good standing under the laws of the Commonwealth of Massachusetts, with power under IIBP’s Declaration of Trust to own all of its properties and assets and to carry on its business as it is now being conducted;
(b) IIBP is a registered investment company classified as a management company of the open-end type, and its registration with the Commission as an investment company under the 1940 Act and the registration of the shares of the Acquiring Portfolio under the 1933 Act, are in full force and effect;
(c) No consent, approval, authorization, or order of any court or governmental authority is required for the consummation by the Acquiring Portfolio of the transactions contemplated herein, except such as have been obtained under the 1933 Act, the 1934 Act and the 1940 Act and such as may be required by state securities laws;
(d) The current prospectus and statement of additional information of the Acquiring Portfolio and each prospectus and statement of additional information of the Acquiring Portfolio used during the three years previous to the date of this Agreement conforms or conformed at the time of its use in all material respects to the applicable requirements of the 1933 Act and the 1940 Act and the rules and regulations of the Commission thereunder and does not or did not at the time of its use include any untrue statement of a material fact or omit to state any material fact required to be stated therein or necessary to make the statements therein, in light of the circumstances under which they were made, not materially misleading;
(e) On the Closing Date, the Acquiring Portfolio will have good and marketable title to the Acquiring Portfolio’s assets, free of any liens or other encumbrances, except those liens or encumbrances as to which the Acquired Portfolio has received notice and necessary documentation at or prior to the Closing;
(f) The Acquiring Portfolio is not engaged currently, and the execution, delivery and performance of this Agreement will not result, in (i) a material violation of IIBP’s Declaration of Trust or By-Laws or of any agreement, indenture, instrument, contract, lease or other undertaking to which IIBP, on behalf of the Acquiring Portfolio, is a party or by which it is bound; or (ii) the acceleration of any obligation, or the imposition of any penalty, under any agreement, indenture, instrument, contract, lease, judgment or decree to which IIBP, on behalf of the Acquiring Portfolio, is a party or by which it is bound;
19
(g) Except as otherwise disclosed in writing to and accepted by IIT, on behalf of the Acquired Portfolio, no litigation or administrative proceeding or investigation of or before any court or governmental body is presently pending or, to its knowledge, threatened against IIBP, on behalf of the Acquiring Portfolio, or any of the Acquiring Portfolio’s properties or assets that, if adversely determined, would materially and adversely affect the Acquiring Portfolio’s financial condition or the conduct of the Acquiring Portfolio’s business. IIBP, on behalf of the Acquiring Portfolio, knows of no facts which might form the basis for the institution of such proceedings and is not a party to or subject to the provisions of any order, decree or judgment of any court or governmental body which materially and adversely affects its business or its ability to consummate the transactions herein contemplated;
(h) The Statement of Assets and Liabilities, Statements of Operations and Changes in Net Assets and Schedule of Investments of the Acquiring Portfolio at December 31, 2012 have been audited by KPMG LLP, an independent registered public accounting firm, and are in accordance with U.S. GAAP consistently applied, and such statements (copies of which have been furnished to the Acquired Portfolio) present fairly, in all material respects, the financial condition of the Acquiring Portfolio as of such date in accordance with U.S. GAAP, and there are no known contingent liabilities of the Acquiring Portfolio required to be reflected on a balance sheet (including the notes thereto) in accordance with U.S. GAAP as of such date not disclosed therein;
(i) Since December 31, 2012, there has not been any material adverse change in the Acquiring Portfolio’s financial condition, assets, liabilities or business, other than changes occurring in the ordinary course of business, or any incurrence by the Acquiring Portfolio of indebtedness maturing more than one year from the date such indebtedness was incurred, except as otherwise disclosed to and accepted by the Acquired Portfolio (For purposes of this subparagraph (i), a decline in net asset value per share of the Acquiring Portfolio due to declines in market values of securities in the Acquiring Portfolio’s portfolio, the discharge of Acquiring Portfolio liabilities, or the redemption of Acquiring Portfolio Shares by shareholders of the Acquiring Portfolio, shall not constitute a material adverse change);
(j) On the Closing Date, all Federal and other tax returns, dividend reporting forms, and other tax-related reports of the Acquiring Portfolio required by law to have been filed by such date (including any extensions) shall have been filed and are or will be correct in all material respects, and all Federal and other taxes shown as due or required to be shown as due on said returns and reports shall have been paid or provision shall have been made for the payment thereof, and to the best of the Acquiring Portfolio’s knowledge no such return is currently under audit and no assessment has been asserted with respect to such returns;
(k) For each taxable year of its operation (including the taxable year that includes the Closing Date), the Acquiring Portfolio has met (or will meet) the requirements of Sub-chapter M of the Code for qualification as a regulated investment company, has been eligible to (or will be eligible to) and has computed (or will compute) its federal income tax under Section 852 of the Code, and has distributed all of its investment company taxable income and net capital gain (as defined in the Code) for periods ending prior to the Closing Date, and has met the diversification and other requirements of Section 817(h) of the Code and Treasury Regulations Section 1.815-5 thereunder;
(l) All issued and outstanding shares of the Acquiring Portfolio are, and on the Closing Date will be, duly and validly issued and outstanding, fully paid and non-assessable by IIBP and have been offered and sold in every state and the District of Columbia in compliance in all material respects with applicable registration requirements of the 1933 Act and state securities laws. The Acquiring Portfolio does not have outstanding any options, warrants or other rights to subscribe for or purchase any Acquiring Portfolio Shares, nor is there outstanding any security convertible into any Acquiring Portfolio Shares;
(m) The execution, delivery and performance of this Agreement will have been fully authorized prior to the Closing Date by all necessary action, if any, on the part of the Board of Trustees of IIBP, on behalf of the Acquiring Portfolio, and this Agreement will constitute a valid and binding obligation of the Acquiring Portfolio, enforceable in accordance with its terms, subject, as to enforcement, to bankruptcy, insolvency, reorganization, moratorium and other laws relating to or affecting creditors’ rights and to general equity principles;
(n) The Class S Acquiring Portfolio Shares to be issued and delivered to the Acquired Portfolio, for the account of the Acquired Portfolio Shareholders, pursuant to the terms of this Agreement, will on the Closing Date have been duly authorized and, when so issued and delivered, will be duly and validly issued Acquiring Portfolio Shares, and will be fully paid and non-assessable;
(o) The information to be furnished by IIBP for use in the registration statements, proxy materials and other documents that may be necessary in connection with the transactions contemplated hereby shall be accurate and complete in all material respects and shall comply in all material respects with Federal securities and other laws and regulations applicable thereto; and
(p) That insofar as it relates to the Acquiring Portfolio, the Registration Statement relating to the Acquiring Portfolio Shares issuable hereunder, and the proxy materials with respect to the Acquired Portfolio to be included in the Registration Statement, and any amendment or supplement to the foregoing, will, from the effective date of the Registration Statement through the date of the meeting of shareholders of the Acquired Portfolio contemplated therein (i) not contain any untrue statement of a material fact or omit to state a material fact required to be stated therein or necessary to make the statements therein, in light of the circumstances under which such statements were made, not misleading, provided, however, that the representations and warranties in this subparagraph (p) shall not apply to statements in or omissions from the Registration Statement made in reliance upon and in conformity with information that was furnished by the Acquired Portfolio for use therein; and (ii) comply in all material respects with the provisions of the 1933 Act, the 1934 Act and the 1940 Act and the rules and regulations thereunder.
20
5. COVENANTS OF THE ACQUIRING PORTFOLIO AND THE ACQUIRED PORTFOLIO
5.1. The Acquiring Portfolio and the Acquired Portfolio each will operate its business in the ordinary course between the date hereof and the Closing Date, it being understood that such ordinary course of business will include the declaration and payment of customary dividends and distributions, and any other distribution that may be advisable.
5.2. The Acquired Portfolio will call a meeting of the shareholders of the Acquired Portfolio to consider and act upon this Agreement and to take all other action necessary to obtain approval of the transactions contemplated herein.
5.3. The Acquired Portfolio covenants that the Class S Acquiring Portfolio Shares to be issued hereunder are not being acquired for the purpose of making any distribution thereof, other than in accordance with the terms of this Agreement.
5.4. The Acquired Portfolio will assist the Acquiring Portfolio in obtaining such information as the Acquiring Portfolio reasonably requests concerning the beneficial ownership of the Acquired Portfolio’s shares.
5.5. Subject to the provisions of this Agreement, the Acquiring Portfolio and the Acquired Portfolio will each take, or cause to be taken, all action, and do or cause to be done, all things reasonably necessary, proper or advisable to consummate and make effective the transactions contemplated by this Agreement.
5.6. The Acquired Portfolio will provide the Acquiring Portfolio with information reasonably necessary for the preparation of a prospectus (the “Prospectus”), which will include the Proxy Statement referred to in paragraph 4.1(p), all to be included in a Registration Statement on Form N-14 of the Acquiring Portfolio (the “Registration Statement”), in compliance with the 1933 Act, the 1934 Act and the 1940 Act, in connection with the meeting of the shareholders of the Acquired Portfolio to consider approval of this Agreement and the transactions contemplated herein.
5.7. As soon as is reasonably practicable after the Closing, the Acquired Portfolio will make a liquidating distribution to its shareholders consisting of the Class S Acquiring Portfolio Shares received at the Closing.
5.8. The Acquiring Portfolio and the Acquired Portfolio shall each use its reasonable best efforts to fulfill or obtain the fulfillment of the conditions precedent to effect the transactions contemplated by this Agreement as promptly as practicable.
5.9. IIT, on behalf of the Acquired Portfolio, covenants that IIT will, from time to time, as and when reasonably requested by the Acquiring Portfolio, execute and deliver or cause to be executed and delivered all such assignments and other instruments, and will take or cause to be taken such further action as IIT, on behalf of the Acquiring Portfolio, may reasonably deem necessary or desirable in order to vest in and confirm (a) IIT’s, on behalf of the Acquired Portfolio’s, title to and possession of the Acquiring Portfolio Shares to be delivered hereunder, and (b) IIT’s, on behalf of the Acquiring Portfolio’s, title to and possession of all the assets and otherwise to carry out the intent and purpose of this Agreement.
5.10. The Acquiring Portfolio will use all reasonable efforts to obtain the approvals and authorizations required by the 1933 Act, the 1940 Act and such of the state blue sky or securities laws as may be necessary in order to continue its operations after the Closing Date.
6. CONDITIONS PRECEDENT TO OBLIGATIONS OF THE ACQUIRED PORTFOLIO
The obligations of IIT, on behalf of the Acquired Portfolio, to consummate the transactions provided for herein shall be subject, at IIT’s election, to the performance by IIBP, on behalf of the Acquiring Portfolio, of all the obligations to be performed by it hereunder on or before the Closing Date, and, in addition thereto, the following further conditions:
6.1. All representations and warranties of IIBP, on behalf of the Acquiring Portfolio, contained in this Agreement shall be true and correct in all material respects as of the date hereof and, except as they may be affected by the transactions contemplated by this Agreement, as of the Closing Date, with the same force and effect as if made on and as of the Closing Date;
6.2. IIBP, on behalf of the Acquiring Portfolio, shall have delivered to the Acquired Portfolio a certificate executed in its name by its President or Vice President and its Treasurer or Assistant Treasurer, in a form reasonably satisfactory to the Acquired Portfolio and dated as of the Closing Date, to the effect that the representations and warranties of IIBP, on behalf of the Acquiring Portfolio, made in this Agreement are true and correct at and as of the Closing Date, except as they may be affected by the transactions contemplated by this Agreement and as to such other matters as the IIT shall reasonably request;
6.3. IIBP, on behalf of the Acquiring Portfolio, shall have performed all of the covenants and complied with all of the provisions required by this Agreement to be performed or complied with by IIBP, on behalf of the Acquiring Portfolio, on or before the Closing Date; and
6.4. The Acquired Portfolio and the Acquiring Portfolio shall have agreed on the number of full and fractional Acquiring Portfolio Shares of each Class to be issued in connection with the Reorganization after such number has been calculated in accordance with paragraph 1.1.
7. CONDITIONS PRECEDENT TO OBLIGATIONS OF THE ACQUIRING PORTFOLIO
The obligations of IIBP, on behalf of the Acquiring Portfolio, to complete the transactions provided for herein shall be subject, at IIBP’s election, to the performance by IIT, on behalf of the Acquired Portfolio, of all of the obligations to be performed by it hereunder on or before the Closing Date and, in addition thereto, the following conditions:
21
7.1. All representations and warranties of IIT, on behalf of the Acquired Portfolio, contained in this Agreement shall be true and correct in all material respects as of the date hereof and, except as they may be affected by the transactions contemplated by this Agreement, as of the Closing Date, with the same force and effect as if made on and as of the Closing Date;
7.2. IIT shall have delivered to the IIBP a statement of the Acquired Portfolio’s assets and liabilities, as of the Closing Date, certified by the Treasurer of IIT;
7.3. IIT, on behalf of the Acquired Portfolio, shall have delivered to the Acquiring Portfolio on the Closing Date a certificate executed in its name by its President or Vice President and its Treasurer or Assistant Treasurer, in form and substance satisfactory to the Acquiring Portfolio and dated as of the Closing Date, to the effect that the representations and warranties of IIT, on behalf of the Acquired Portfolio, made in this Agreement are true and correct at and as of the Closing Date, except as they may be affected by the transactions contemplated by this Agreement, and as to such other matters as the Acquiring Portfolio shall reasonably request;
7.4. IIT, on behalf of the Acquired Portfolio, shall have performed all of the covenants and complied with all of the provisions required by this Agreement to be performed or complied with by IIT, on behalf of the Acquired Portfolio, on or before the Closing Date;
7.5. The Acquired Portfolio and the Acquiring Portfolio shall have agreed on the number of full and fractional Acquiring Portfolio Shares of each class to be issued in connection with the Reorganization after such number has been calculated in accordance with paragraph 1.1; and
7.6. The Acquired Portfolio shall have declared and paid a distribution or distributions prior to the Closing that, together with all previous distributions, shall have the effect of distributing to its shareholders (i) all of its investment company taxable income and all of its net realized capital gains, if any, for the period from the close of its last fiscal year to 4:00 p.m. Eastern time on the Closing; and (ii) any undistributed investment company taxable income and net realized capital gains from any period to the extent not otherwise already distributed.
8. FURTHER CONDITIONS PRECEDENT TO OBLIGATIONS OF THE ACQUIRING PORTFOLIO AND THE ACQUIRED PORTFOLIO
If any of the conditions set forth below have not been satisfied on or before the Closing Date with respect to IIT, on behalf of the Acquired Portfolio, or IIBP, on behalf of the Acquiring Portfolio, the other party to this Agreement shall, at its option, not be required to consummate the transactions contemplated by this Agreement:
8.1. The Agreement and the transactions contemplated herein shall have been approved by the requisite vote of the holders of the outstanding shares of the Acquired Portfolio in accordance with the provisions of IIT’s Declaration of Trust, By-Laws, applicable Massachusetts law and the 1940 Act, and certified copies of the resolutions evidencing such approval shall have been delivered to the IIBP. Notwithstanding anything herein to the contrary, neither IIT nor IIBP may waive the conditions set forth in this paragraph 8.1;
8.2. On the Closing Date no action, suit or other proceeding shall be pending or, to its knowledge, threatened before any court or governmental agency in which it is sought to restrain or prohibit, or obtain damages or other relief in connection with, this Agreement or the transactions contemplated herein;
8.3. All consents of other parties and all other consents, orders and permits of Federal, state and local regulatory authorities deemed necessary by IIBP or IIT to permit consummation, in all material respects, of the transactions contemplated hereby shall have been obtained, except where failure to obtain any such consent, order or permit would not involve a risk of a material adverse effect on the assets or properties of the Acquiring Portfolio or the Acquired Portfolio, provided that either party hereto may for itself waive any of such conditions;
8.4. The Registration Statement shall have become effective under the 1933 Act and no stop orders suspending the effectiveness thereof shall have been issued and, to the best knowledge of the parties hereto, no investigation or proceeding for that purpose shall have been instituted or be pending, threatened or contemplated under the 1933 Act; and
8.5. The parties shall have received the opinion of Dechert LLP addressed to IIT and IIBP substantially to the effect that, based upon certain facts, assumptions, and representations, the transaction contemplated by this Agreement shall constitute a tax-free reorganization for Federal income tax purposes. The delivery of such opinion is conditioned upon receipt by Dechert LLP of representations it shall request of IIT and IIBP. Notwithstanding anything herein to the contrary, neither IIT nor the IIBP may waive the condition set forth in this paragraph 8.5.
9. BROKERAGE FEES AND EXPENSES
9.1. IIT, on behalf of each of the Acquired Portfolio, and the Acquiring Portfolio, represents and warrants that there are no brokers or finders entitled to receive any payments in connection with the transactions provided for herein.
9.2 The expenses relating to the proposed Reorganization will be borne by the investment adviser to the Acquiring Fund (or an affiliate of the investment adviser). The costs of the Reorganization shall include, but not be limited to, costs associated with obtaining any necessary order of exemption from the 1940 Act, preparation of the Registration Statement, printing and distributing the Acquiring Portfolio’s prospectus and the Acquired Portfolio’s proxy materials, legal fees, accounting fees, securities registration fees, and expenses of holding shareholders’ meetings. Notwithstanding any of the foregoing, expenses will in any event be paid by
22
the party directly incurring such expenses if and to the extent that the payment by another person of such expenses would result in the disqualification of such party as a “regulated investment company” within the meaning of Section 851 of the Code.
10. ENTIRE AGREEMENT; SURVIVAL OF WARRANTIES
10.1. The parties agree that neither party has made any representation, warranty or covenant not set forth herein and that this Agreement constitutes the entire agreement between the parties.
10.2. The representations, warranties and covenants contained in this Agreement or in any document delivered pursuant hereto or in connection herewith shall survive the consummation of the transactions contemplated hereunder. The covenants to be performed after the Closing shall survive the Closing.
11. TERMINATION
This Agreement may be terminated and the transactions contemplated hereby may be abandoned by either party by (i) mutual agreement of the parties; or (ii) by either party if the Closing shall not have occurred on or before September 14, 2014, unless such date is extended by mutual agreement of the parties; or (iii) by either party if the other party shall have materially breached its obligations under this Agreement or made a material and intentional misrepresentation herein or in connection herewith. In the event of any such termination, this Agreement shall become void and there shall be no liability hereunder on the part of any party or their respective Trustees or officers, except for any such material breach or intentional misrepresentation, as to each of which all remedies at law or in equity of the party adversely affected shall survive.
12. AMENDMENTS
This Agreement may be amended, modified or supplemented in such manner as may be deemed necessary or advisable by the authorized officers of IIT; provided, however, that following the meeting of the shareholders of the Acquired Portfolio called by IIT pursuant to paragraph 5.2 of this Agreement, no such amendment may have the effect of changing the provisions for determining the number of the Class S Acquiring Portfolio Shares to be issued to the Acquired Portfolio Shareholders under this Agreement to the detriment of such shareholders without their further approval.
13. NOTICES
Any notice, report, statement or demand required or permitted by any provisions of this Agreement shall be in writing and shall be given by facsimile, personal service or prepaid or certified mail addressed to:
ING Intermediate Bond Portfolio
7337 East Doubletree Ranch Road
Suite 100
Scottsdale, Arizona 85258-2034
Attn: Huey P. Falgout, Jr.
With a copy to:
Dechert LLP
1900 K Street, N.W.
Washington, D.C. 20006
Attn: Jeffrey S. Puretz
ING Investors Trust
7337 East Doubletree Ranch Road
Suite 100
Scottsdale, Arizona 85258-2034
Attn: Huey P. Falgout, Jr.
With a copy to:
Dechert LLP
1900 K Street, N.W.
Washington, D.C. 20006
Attn: Jeffrey S. Puretz
14. HEADINGS; COUNTERPARTS; GOVERNING LAW; ASSIGNMENT; LIMITATION OF LIABILITY
14.1. The Article and paragraph headings contained in this Agreement are for reference purposes only and shall not affect in any way the meaning or interpretation of this Agreement.
14.2. This Agreement may be executed in any number of counterparts, each of which shall be deemed an original.
14.3. This Agreement shall be governed by and construed in accordance with the laws of the Commonwealth of Massachusetts without regard to its principles of conflicts of laws.
14.4. This Agreement shall bind and inure to the benefit of the parties hereto and their respective successors and assigns, but no assignment or transfer hereof or of any rights or obligations hereunder shall be made by any party without the written
23
consent of the other party. Nothing herein expressed or implied is intended or shall be construed to confer upon or give any person, firm or corporation, other than the parties hereto and their respective successors and assigns, any rights or remedies under or by reason of this Agreement.
14.5. It is expressly agreed that the obligations of the parties hereunder shall not be binding upon any of their respective Trustees, shareholders, nominees, officers, agents, or employees personally, but shall bind only the property of the Acquired Portfolio or the Acquiring Portfolio, as the case may be, as provided in the Declaration of Trust of IIT. The execution and delivery by such officers shall not be deemed to have been made by any of them individually or to impose any liability on any of them personally, but shall bind only the property of such party.
24
APPENDIX B: ADDITIONAL INFORMATION REGARDING ING INTERMEDIATE BOND PORTFOLIO
Portfolio Holdings Information
A description of the policies and procedures of ING Intermediate Bond Portfolio (the “Portfolio”) regarding the release of portfolio holdings information is available in the Portfolio’s SAI. Portfolio holdings information can be reviewed online at www.INGInvestment.com.
How Shares Are Priced
The net asset value (“NAV”) per share for each class of the Portfolio is determined each business day as of the close of regular trading (“Market Close”) on the New York Stock Exchange (“NYSE”) (normally 4:00 p.m. Eastern time unless otherwise designated by the NYSE). The Portfolio is open for business every day the NYSE is open. The NYSE is closed on all weekends and on all national holidays and Good Friday. Portfolio shares will not be priced on those days. The NAV per share of each class of the Portfolio is calculated by taking the value of the Portfolio’s assets attributable to that class, subtracting the Portfolio’s liabilities attributable to that class, and dividing by the number of shares of that class that are outstanding. To the extent the Portfolio invests in other open-end funds (other than exchange-traded funds “ETFs”), the Portfolio will calculate its NAV using the NAV of the funds in which it invests as described in that fund’s prospectus.
In general, assets are valued based on actual or estimated market value, with special provisions for assets not having readily available market quotations and short-term debt securities, and for situations where market quotations are deemed unreliable. Investments in securities maturing in 60 days or less are valued at amortized cost which, when combined with accrued interest, approximates market value. Securities prices may be obtained from automated pricing services. Shares of investment companies held by the Portfolio (other than ETF shares) will generally be valued at the latest NAV reported by that investment company. The prospectuses for those investment companies explain the circumstances under which they will use fair value pricing and the effects of using fair value pricing.
Trading of foreign securities may not take place every day the NYSE is open. Also, trading in some foreign markets and on some electronic trading networks may occur on weekends or holidays when the Portfolio’s NAV is not calculated. As a result, the NAV of the Portfolio may change on days when shareholders will not be able to purchase or redeem the Portfolio’s shares. When market quotations are not available or are deemed unreliable, the Portfolio will use a fair value for an asset that is determined in accordance with procedures adopted by the Portfolio’s Board. The types of assets for which such fair value pricing might be required include, but are not limited to:
· Foreign securities, where a foreign security whose value at the close of the foreign market on which it principally trades likely would have changed by the time of the close of the NYSE, or the closing value is otherwise deemed unreliable;
· Securities of an issuer that has entered into a restructuring;
· Securities whose trading has been halted or suspended;
· Fixed-income securities that have gone into default and for which there are no current market value quotations; and
· Securities that are restricted as to transfer or resale.
The Portfolio or the Adviser may rely on the recommendations of a fair value pricing service approved by the Portfolio’s Board in valuing foreign securities. Valuing securities at fair value involves greater reliance on judgment than valuing securities that have readily available market quotations. The Adviser will make such determinations in good faith in accordance with procedures adopted by the Portfolio’s Board. Fair value determinations can also involve reliance on quantitative models employed by a fair value pricing service. There can be no assurance that the Portfolio could obtain the fair value assigned to a security if it were to sell the security at approximately the time at which the Portfolio determines its NAV per share.
When your Variable Contract or Qualified Plan is buying shares of the Portfolio, it will pay the NAV that is next calculated after the order from the Variable Contract Holder or Qualified Plan Participant is received in proper form. When the Variable Contract Holder or Qualified Plan Participant is selling shares, it will normally receive the NAV that is next calculated after the order form is received from the Variable Contract Holder or Qualified Plan participant in proper form. Investments will be processed at the NAV next calculated after an order is received and accepted by the Portfolio or its designated agent. In order to receive that day’s price, your order must be received by Market Close.
How to Buy and Sell Shares
The Portfolio’s shares may be offered to insurance company separate accounts serving as investment options under Variable Contracts, Qualified Plans outside the separate account context, custodial accounts, certain investment advisers and their affiliates in connection with the creation or management of the Portfolios, other investment companies and other investors as permitted by the diversification and other requirements of section 817(h) of the Internal Revenue Code of 1986, as amended (the “Code”) and the underlying U.S. Treasury Regulations. The Portfolio may not be available as investment options in your Variable Contract, through your Qualified Plan or other investment company. Please refer to the prospectus for the appropriate insurance company separate account, investment company or your plan documents for information on how to direct investments in, or redemptions from, an investment option corresponding to one of the Portfolio and any fees that may apply. Participating insurance companies and certain other designated organizations are authorized to receive purchase orders on the Portfolio’s behalf.
25
The Portfolio currently does not foresee any disadvantages to investors if the Portfolio serves as an investment option for Variable Contracts and it offers its shares directly to Qualified Plans and other permitted investors. However, it is possible that the interest of owners of Variable Contracts, Qualified Plans and other permitted investors, for which the Portfolio serves as an investment option, might at some time be in conflict because of differences in tax treatment or other considerations. The Board directed the Adviser to monitor events to identify any material conflicts between Variable Contract owners, Qualified Plans and other permitted investors and would have to determine what action, if any, should be taken in the event of such conflict. If such a conflict occurred, an insurance company participating in the Portfolio might be required to redeem the investment of one or more of its separate accounts from the Portfolio or a Qualified Plan, investment company or other permitted investor might be required to redeem its investment, which might force the Portfolio to sell securities at disadvantageous prices. The Portfolio may discontinue sales to a Qualified Plan and require plan participants with existing investments in the Portfolio to redeem those investments if the Qualified Plan loses (or in the opinion of the Adviser, is at risk of losing) its Qualified Plan status.
In addition, the Portfolio’s shares may be purchased by certain other management investment companies, including through fund-of-fund arrangements with ING affiliated funds. In some cases the Portfolio may serve as a primary or significant investment vehicle for the fund-of-funds. From time to time, the Portfolio may experience large investments or redemptions due to allocation or rebalancing by these funds-of-funds. While it is impossible to predict the overall impact of these transactions over time, there could be adverse effects on Portfolio management. For example, the Portfolio may be required to sell securities or invest cash at times when it would not otherwise do so. These transactions could also have tax consequences if sales or securities result in gains and could also increase transaction costs or portfolio turnover. The Adviser and Sub-Adviser will monitor transactions by the funds-of-funds and will attempt to minimize any adverse effects on the Portfolio as a result of these transactions. So long as the Portfolio accepts investments by other investment companies, it will not purchase securities of other investment companies, except to the extent permitted by the 1940 Act or under the terms of an exemptive order granted by the SEC.
The Portfolio reserves the right to suspend the offering of shares or to reject any specific purchase order. The Portfolio may suspend redemptions or postpone payments when the NYSE is closed or when trading is restricted for any reason or under emergency circumstances as determined by the SEC.
Distribution and Shareholder Service Plans
The Portfolio has a Distribution Plan (“12b-1 Plan”) in accordance with Rule 12b-1 under the 1940 Act for the Class S shares. These payments are made to the Distributor on an ongoing basis as compensation for services the Distributor provides and expenses it bears in connection with the marketing and other fees to support the sale and distribution of the Class S shares and for shareholder services provided by securities dealers (including the Adviser) and other financial intermediaries and plan administrators that provide administrative services relating to Class S shares and their shareholders, including Variable Contract owners or Qualified Plan participants with interests in the Portfolio. The annual distribution fee under the 12b-1 Plan may equal up to 0.25% of the average daily net assets of the Portfolio. Because these fees are paid out of the Portfolio’s assets on an ongoing basis, over time these fees will increase the cost of your investment and may cost you more than paying other types of sales charges.
Frequent Trading - Market Timing
The Portfolio is intended for long-term investment and not as short-term trading vehicles. Accordingly, organizations or individuals that use market timing investment strategies and make frequent transfers should not purchase shares of the Portfolio. Shares of the Portfolio are primarily sold through omnibus account arrangements with financial intermediaries, as investment options for Variable Contracts issued by insurance companies and as investment options for Qualified Plans. Omnibus accounts generally do not identify customers’ trading activity on an individual basis. The Portfolio’s Administrator has agreements which require such intermediaries to provide detailed account information, including trading history, upon request of the Portfolio.
The Portfolio relies on the financial intermediaries to monitor frequent, short-term trading within the Portfolio by its customers. You should review the materials provided to you by your financial intermediary including, in the case of a Variable Contract, the prospectus that describes the contract or, in the case of a Qualified Plan, the plan documentation for its policies regarding frequent, short-term trading. With trading information received as a result of these agreements, the Portfolio may make a determination that certain trading activity is harmful to the Portfolio and its shareholders, even if such activity is not strictly prohibited by the intermediaries’ excessive trading policy. As a result, a shareholder investing directly or indirectly in the Portfolio may have their trading privileges suspended without violating the stated excessive trading policy of the intermediary. The Portfolio reserves the right, in its sole discretion and without prior notice, to reject, restrict, or refuse purchase orders whether directly or by exchange including purchase orders that have been accepted by a financial intermediary. The Portfolio seeks assurances from the financial intermediaries that they have procedures adequate to monitor and address frequent, short-term trading. There is, however, no guarantee that the procedures of the financial intermediaries will be able to curtail frequent, short-term trading activity.
The Portfolio believes that market timing or frequent, short-term trading in any account, including a Variable Contract or Qualified Plan account, is not in the best interest of the Portfolio or its shareholders. Due to the disruptive nature of this activity, it can adversely impact the ability of the Adviser or the Sub-Adviser (if applicable) to invest assets in an orderly, long-term manner. Frequent trading can disrupt the management of the Portfolio and raise its expenses through: increased trading and transaction
26
costs; forced and unplanned portfolio turnover; lost opportunity costs; and large asset swings that decrease the Portfolio’s ability to provide maximum investment return to all shareholders. This in turn can have an adverse effect on the Portfolio’s performance.
Portfolios that invest in foreign securities may present greater opportunities for market timers and thus be at a greater risk for excessive trading. If an event occurring after the close of a foreign market, but before the time the Portfolio computes its current NAV, causes a change in the price of the foreign security and such price is not reflected in the Portfolio’s current NAV, investors may attempt to take advantage of anticipated price movements in securities held by the Portfolio based on such pricing discrepancies. This is often referred to as “price arbitrage.” Such price arbitrage opportunities may also occur in portfolios which do not invest in foreign securities. For example, if trading in a security held by the Portfolio is halted and does not resume prior to the time the Portfolio calculates its NAV, such “stale pricing” presents an opportunity for investors to take advantage of the pricing discrepancy. Similarly, the Portfolio that holds thinly-traded securities, such as certain small-capitalization securities, may be exposed to varying levels of pricing arbitrage. The Portfolio has adopted fair valuation policies and procedures intended to reduce the Portfolio’s exposure to price arbitrage, stale pricing, and other potential pricing discrepancies. However, to the extent that a Portfolio’s NAV does not immediately reflect these changes in market conditions, short-term trading may dilute the value of Portfolio shares, which negatively affects long-term shareholders.
Although the policies and procedures known to the Portfolio that are followed by the financial intermediaries that use the Portfolio and the monitoring by the Portfolio is designed to discourage frequent, short-term trading, none of these measures can eliminate the possibility that frequent, short-term trading activity in the Portfolio will occur. Moreover, decisions about allowing trades in the Portfolio may be required. These decisions are inherently subjective, and will be made in a manner that is in the best interest of the Portfolio’s shareholders.
Payments to Financial Intermediaries
ING mutual funds may be offered as investment options in Variable Contracts issued by affiliated and non-affiliated insurance companies and in Qualified Plans. Fees derived from the Portfolio’s Distribution and/or Service Plans (if applicable) may be paid to insurance companies, broker-dealers and companies that service Qualified Plans for selling the Portfolio’s shares and/or for servicing shareholder accounts. In addition, the Portfolio’s Adviser, Distributor, Administrator, or their affiliated entities, out of their own resources and without additional cost to the Portfolio or its shareholders, may pay additional compensation to these insurance companies, broker-dealers, or companies that service Qualified Plans. The Adviser, Distributor, Administrator, or affiliated entities of the Portfolio may also share their profits with affiliated insurance companies or other ING entities through inter-company payments.
For non-affiliated insurance companies and Qualified Plans, payments from the Portfolio’s Distribution and/or Service Plans (if applicable) as well as payments (if applicable) from the Portfolio’s Adviser and/or Distributor generally are based upon an annual percentage of the average net assets held in the Portfolio by those companies. The Portfolio’s Adviser and Distributor may make payments for administrative, record keeping, or other services that insurance companies or Qualified Plans provide to facilitate investment in the Portfolio. These payments as well as payments from the Portfolio’s Distribution and/or Service Plans (if applicable) may also provide incentive for insurance companies or Qualified Plans to make the Portfolio available through Variable Contracts or Qualified Plans, and thus they may promote the distribution of the shares of the Portfolio.
As of the date of April 30, 2013, the Distributor has entered into agreements with the following non-affiliated insurance companies: Zürich Kemper Life Insurance Company; Symetra Life Insurance Company; and First Fortis Life Insurance Company. Fees payable under these agreements are at annual rates that range from 0.15% to 0.25%. This is computed as a percentage of the average aggregate amount invested in the Portfolio by Variable Contract holders through the relevant insurance company’s Variable Contracts.
The insurance companies issuing Variable Contracts or Qualified Plans that use the Portfolio as investment options may also pay fees to third parties in connection with distribution of the Variable Contracts and for services provided to Variable Contract owners. Entities that service Qualified Plans may also pay fees to third parties to help service the Qualified Plans or the accounts of their participants. The Portfolio, the Adviser, and the Distributor are not parties to these arrangements. Variable Contract owners should consult the prospectus and statement of additional information for their Variable Contracts for a discussion of these payments and should consult with their agent or broker. Qualified Plan participants should consult with their pension servicing agent.
Ultimately, the agent or broker selling the Variable Contract to you could have a financial interest in selling you a particular product to increase the compensation they receive. Please make sure you read fully each prospectus and discuss any questions you have with your agent or broker.
Dividends, Distributions, and Taxes
Dividends and Distributions
The Portfolio declares and pays dividends from net investment income at least annually. The Portfolio will also pay distributions from net realized capital gains, reduced by available capital losses, at least annually. All dividends and capital gain distributions will be automatically reinvested in additional shares of the Portfolio at the NAV of such shares on the payment date unless a participating insurance company’s separate account is permitted to hold cash and elects to receive payment in cash. From time to time, a portion of the Portfolio’s distributions may constitute a return of capital.
27
To comply with federal tax regulations, the Portfolio may also pay an additional capital gains distribution.
Tax Matters
Holders of Variable Contracts should refer to the prospectus for their contracts for information regarding the tax consequences of owning such contracts and should consult their tax advisers before investing.
The Portfolio intends to qualify as a regulated investment company (“RIC”) for federal income tax purposes by satisfying the requirements under Subchapter M of the Code, including requirements with respect to diversification of assets, distribution of income, and sources of income. As a RIC, the Portfolio generally will not be subject to tax on its net investment company taxable income and net realized capital gains that it distributes to its shareholders.
The Portfolio also intends to comply with the diversification requirements of Section 817(h) of the Code and the underlying regulations for Variable Contracts so that owners of these contracts should not be subject to federal tax on distributions of dividends and income from the Portfolio to the insurance company’s separate accounts.
Since the sole shareholders of the Portfolio will be separate accounts or other permitted investors, no discussion is included herein as to the federal income tax consequences at the shareholder level. For information concerning the federal income tax consequences to purchasers of the policies, see the attached prospectus for the policy.
See the Portfolio’s Statement of Additional Information dated April 30, 2013 for further information about tax matters.
THE TAX STATUS OF YOUR INVESTMENT IN A PORTFOLIO DEPENDS UPON THE FEATURES OF YOUR VARIABLE CONTRACT. FOR FURTHER INFORMATION, PLEASE REFER TO THE PROSPECTUS FOR THE VARIABLE CONTACT.
28
FINANCIAL HIGHLIGHTS
The following financial highlights are intended to help you understand the Portfolio’s financial performance for the past five years or, if shorter, the period of the share class’ operations. Certain information reflects financial results for a single share. The total returns represent the rate that an investor would have earned (or lost) on an investment in a share of the Portfolio (assuming reinvestment of all dividends and distributions).
This information has been derived from the Portfolio’s financial statements that were audited by KPMG LLP, an independent registered public accounting firm, with the exception of the period ending June 30, 2013. The report of KPMG LLP, along with the financial statements included in the annual shareholder report dated December 31, 2012 and the (unaudited) semi-annual shareholder report dated June 30, 2013, are incorporated herein by reference.
| | | | Income (loss)
from
investment
operations | | | | Less
distributions | | | | | | | | Ratios to average net
assets | | | | Supplemental
data | |
Year or period ended | | Net asset
value,
beginning
of year
or period | | Net
investment
income
(loss) | | Net realized
and
unrealized
gain
(loss) | | Total
from
investment
operations | | From
net
investment
income | | From
net
realized
gains | | Total
Distributions | | Net
asset
value, end
of year or
period | | Total
Return(1) | | Expenses
before
reductions
/additions
(2)(3)(4) | | Expenses net
of fee waivers
and/or
recoupments,
if any(2)(3)(4) | | Expenses
net of all
reductions
/additions
(2)(3)(4) | | Net
investment
income
(loss) (2)(4) | | Net
assets,
end of
year or
period | | Portfolio
turnover
rate | |
| | ($) | | ($) | | ($) | | ($) | | ($) | | ($) | | ($) | | ($) | | ($) | | (%) | | (%) | | (%) | | (%) | | ($000’s) | | (%) | |
Class S | | | | | | | | | | | | | | | | | | | | | | | | | | | | | | | |
06-30-13 | | 12.89 | | 0.21 | | (0.45 | ) | (0.24 | ) | — | | — | | — | | 12.65 | | (1.86 | ) | 0.75 | | 0.75 | | 0.75 | | 3.19 | | 1,143,399 | | 204 | |
12-31-12 | | 12.34 | | 0.45 | · | 0.67 | | 1.12 | | 0.57 | | — | | 0.57 | | 12.89 | | 9.08 | | 0.75 | | 0.75 | | 0.75 | | 3.52 | | 1,221,680 | | 425 | |
12-31-11 | | 12.01 | | 0.51 | · | 0.37 | | 0.88 | | 0.55 | | — | | 0.55 | | 12.34 | | 7.30 | | 0.75 | | 0.75 | | 0.75 | | 4.09 | | 1,247,149 | | 456 | |
12-31-10 | | 11.52 | | 0.57 | · | 0.52 | | 1.09 | | 0.60 | | — | | 0.60 | | 12.01 | | 9.51 | | 0.75 | | 0.75 | † | 0.75 | † | 4.67 | † | 1,292,731 | | 438 | |
12-31-09 | | 11.00 | | 0.50 | · | 0.75 | | 1.25 | | 0.73 | | — | | 0.73 | | 11.52 | | 11.38 | | 0.76 | | 0.76 | † | 0.76 | † | 4.41 | † | 1,279,655 | | 692 | |
12-31-08 | | 13.14 | | 0.60 | · | (1.72 | ) | (1.12 | ) | 0.72 | | 0.30 | | 1.02 | | 11.00 | | (8.73 | ) | 0.76 | | 0.75 | † | 0.75 | † | 4.82 | † | 1,153,518 | | 666 | |
(1) Total return is calculated assuming reinvestment of all dividends, capital gain distributions and return of capital distributions, if any, at net asset value and does not reflect the effect of insurance contract charges. Total return for periods less than one year is not annualized.
(2) Annualized for periods less than a year.
(3) Expense ratios do not include fees and expenses charged under the variable annuity contract or variable life insurance policy.
(4) Expense ratios reflect operating expenses of the Portfolio. Expenses before reductions/additions do not reflect amounts reimbursed by an Adviser and/or Distributor or reductions from brokerage service arrangments or other expense offset arrangements and do not represent the amount paid by a Portfolio during periods when reimbursements or reductions occur. Expenses net of fee waivers reflect expenses after reimbursement by an Adviser and/or Distributor but prior to reductions from brokerage service arrangments or other expense offset arrangements. Expenses net of all reductions/additions represent the net expenses paid by the Portfolio. Net investment income (loss) is net of all such additions or reductions.
· Calculated using average number of shares outstanding throughout the period.
† Impact of waiving the advisory fee for the ING Institutional Primary Money Market Fund holding has less than 0.005% impact on the expenses ratio and net investment income or loss ratio.
29
APPENDIX C: SECURITY OWNERSHIP OF CERTAIN BENEFICIAL AND RECORD OWNERS
The following tables provide information about the persons or entities who, to the knowledge of each Portfolio, owned beneficially or of record 5% or more of any class of that Portfolio’s outstanding shares as of December 13, 2013:
ING Bond Portfolio
Name and Address of Shareholder | | Percent of Class of
Shares and Type of
Ownership | | Percentage of
Portfolio | | Percentage of Combined
Portfolio After the
Reorganization* |
| | | | | | |
| | | | | | |
| | | | | | |
ING Intermediate Bond Portfolio
Name and Address of Shareholder | | Percent of Class of
Shares and Type of
Ownership | | Percentage of
Portfolio | | Percentage of Combined
Portfolio After the
Reorganization* |
| | | | | | |
| | | | | | |
| | | | | | |
* On a pro forma basis, assuming that the value of the shareholder’s interest in the Portfolio on the date of consummation of the Reorganization is the same as on December 13, 2013.
30

| |
| |
7337 EAST DOUBLETREE RANCH ROAD SUITE 100 SCOTTSDALE, ARIZONA 85258-2034 | 3 EASY WAYS TO VOTE YOUR PROXY VOTE BY PHONE: Call toll-free 1-877-907-7646 and follow the recorded instructions. VOTE ON THE INTERNET: Log on to Proxyvote.com and follow the on-line directions. VOTE BY MAIL: Check the appropriate box on the Proxy Ballot below, sign and date the Proxy Ballot and return in the envelope provided. |
| |
| If you vote via phone or the Internet, you do not need to return your Proxy Ballot. PROXY FOR A SPECIAL MEETING OF SHAREHOLDERS TO BE HELD ON FEBRUARY 27, 2014. |
TO VOTE, MARK BLOCKS BELOW IN BLUE OR BLACK INK AS FOLLOWS: | | |
| M64758-S13129 | KEEP THIS PORTION FOR YOUR RECORDS |
| | DETACH AND RETURN THIS PORTION ONLY |
THIS PROXY CARD IS VALID ONLY WHEN SIGNED AND DATED.
| ING BOND PORTFOLIO | |
| | | | |
| | | | |
| | | | |
| | |
| | |
| | |
| | |
| | |
| | |
| THE BOARD OF TRUSTEES RECOMMENDS A VOTE “FOR” THE FOLLOWING PROPOSAL: | |
| | For | Against | Abstain |
| | | | |
| 1. To approve an Agreement and Plan of Reorganization by and between ING Bond Portfolio and ING Intermediate Bond Portfolio (“Intermediate Bond Portfolio”), providing for the reorganization of ING Bond Portfolio with and into Intermediate Bond Portfolio. | o | o | o |
| | | | |
| | | | |
| | |
| | |
| | |
| | |
| To avoid the additional expense of further solicitation, we strongly urge you to review, complete and return your Proxy Ballot as soon as possible. Your vote is important regardless of the number of shares owned. If you vote via phone or the Internet, you do not need to return your Proxy Ballot. | |
| | |
| Please vote, date and sign this proxy and return it promptly in the enclosed envelope. | |
| | |
| This Proxy Ballot must be signed exactly as your name(s) appear(s) hereon. If as an attorney, executor, guardian or in some representative capacity or as an officer of a corporation, please add title(s) as such. Joint owners must each sign. | |
| | |
| | | | | | |
| | | | | | |
| Signature [PLEASE SIGN WITHIN BOX] | Date | | Signature [Joint Owners] | Date | |
| | | | | | | | | | |
Important Notice Regarding the Availability of Proxy Materials for the Meeting to Be Held on
February 27, 2014.
The Proxy Statement for the Meeting and the Notice of the Meeting are available
at WWW.PROXYVOTE.COM/ING.
M64759-S13129
|
|
|
THIS PROXY IS SOLICITED ON BEHALF OF THE BOARD OF TRUSTEES |
|
|
The undersigned hereby appoint(s) Huey P. Falgout, Jr., Theresa K. Kelety, and Todd Modic or any one or all of them, proxies, with full power of substitution, to vote all shares of the above-referenced Portfolio (the "Portfolio"), which the undersigned is entitled to vote at the Special Meeting of Shareholders of the Portfolio to be held at the offices of the Portfolio at 7337 East Doubletree Ranch Road, Suite 100, Scottsdale, AZ 85258-2034 on February 27, 2014, at 1:00 PM, local time and at any adjournment(s) or postponement(s) thereof. |
|
This proxy will be voted as instructed. If no specification is made, the proxy will be voted “FOR” the proposal. |
|
|
|
|
PLEASE SIGN AND DATE ON THE REVERSE SIDE. |
|
|
|
|
PART B
ING Intermediate Bond Portfolio
Statement of Additional Information
January 24, 2013
Acquisition of the Assets and Liabilities of: ING Bond Portfolio (A Series of ING Investors Trust) 7337 East Doubletree Ranch Road, Suite100 Scottsdale, Arizona 85258-2034 | | By and in Exchange for Shares of: ING Intermediate Bond Portfolio 7337 East Doubletree Ranch Road, Suite100 Scottsdale, Arizona 85258-2034 |
This Statement of Additional Information of ING Intermediate Bond Portfolio (“SAI”) is available to the shareholders of ING Bond Portfolio (“Bond Portfolio”), a series of ING Investors Trust, in connection with a proposed transaction whereby all of the assets and liabilities of Bond Portfolio will be transferred to ING Intermediate Bond Portfolio (“Intermediate Bond Portfolio,” together with Bond Portfolio, the “Portfolios, each a “Portfolio”) in exchange for shares of Bond Portfolio.
This SAI consists of: (i) this cover page; (ii) the Portfolio Managers’ Report for Intermediate Bond Portfolio; (iii) the accompanying Pro Forma financial statements; and (iv) the following documents, each of which was filed electronically with the U.S. Securities and Exchange Commission and is incorporated by reference herein:
1. The SAI for Bond Portfolio, dated April 30, 2013, as filed on April 24, 2013 (File No: 811-05629) and the SAI for Intermediate Bond Portfolio dated April 30, 2013, as filed on April 25, 2013 (File No: 811-02361).
2. The Financial Statements of Bond Portfolio included in the Annual Report dated December 31, 2012, as filed on March 6, 2013 and the Semi-Annual Report dated June 30, 2013, as filed on September 4, 2013 (File No: 811-05629) and the Financial Statements of Intermediate Bond Portfolio included in the Annual Report dated December 31, 2013, as filed on March 6, 2013 and the Semi-Annual Report dated June 30, 2013, as filed on September 4, 2013 (File No. 811-02361).
This SAI is not a prospectus. A Proxy Statement/Prospectus dated January 24, 2013, relating to the Reorganization of Bond Portfolio may be obtained, without charge, by writing to the ING Funds at 7337 East Doubletree Ranch Road, Suite 100, Scottsdale, Arizona 85258-2034 or calling 1-800-366-0066.This SAI should be read in conjunction with the Proxy Statement/Prospectus.
1
ING INTERMEDIATE BOND PORTFOLIO
Set forth below is an excerpt from Intermediate Bond Portfolio’s semi-annual report dated June 30, 2013.
Market Perspective: Six Months Ended June 30, 2013
Investors welcomed in 2013 having seen global equities, in the form of the MSCI World IndexSM measured in local currencies including net reinvested dividends, power ahead by 8.69% in the previous six months. Central banks from the U.S. to the U.K. to the euro zone were keeping interest rates so low that investors were ratcheting their risk exposures higher in the search for return. By the end of 2012 it was evident that the Bank of Japan would join the other central banks, as Japan’s parliamentary opposition, promising unlimited monetary easing, won a landslide in December elections. Some commentators fretted that this was not a particularly sound basis for the market’s advance. But sound or not, the index surged another 11.70% in the first half of 2013. (The MSCI World IndexSM returned 8.43% for the six-months ended June 30, 2013, measured in U.S. dollars.)
Much of the strength in global equities in late 2012 could be attributed to a recovery in the euro zone after European Central Bank (“ECB”) President Draghi’s July pronouncement, amid new waves of fear that the euro zone could not survive the depredations of its weakest members, that the ECB was “ready to do whatever it takes to preserve the euro.” This seemed to calm nerves, but confidence was shaken twice in early 2013. First, in February, the Italian general election ended in stalemate on low turnout that signaled the rejection of reform. Next, the final basis of a bailout for insolvent Cyprus banks imposed a levy on uninsured deposits and capital controls. In short order, a euro held in one country became different from a euro held in another: hardly the mark of an effective single currency.
In the U.S., with sentiment cushioned by the Federal Reserve’s $85 billion of monthly Treasury and mortgage-backed securities purchases, investors watched an economic recovery that was undeniable but unimpressive. By June monthly job creation was averaging 155,000 per month but the unemployment rate was still elevated at 7.6%. The highest consumer confidence indices in five years contrasted with stagnant manufacturing output. Growth in first quarter gross domestic product (“GDP”) was surprisingly revised down from 2.4% to a dreary 1.8%. At least the housing market was maintaining its recovery. The final S&P/Case-Shiller 20-City Composite Home Price Index showed a 12.05% year-over-year gain, the most in over seven years, with existing home sales the highest since November 2009.
Elsewhere, China faced faltering growth and fading exports, while it tried to pierce a bank credit bubble with blunt instruments.
But any illusions about the ultimate source of investor confidence in this environment were shattered on May 22 and again on June 19, when Federal Reserve Chairman Bernanke attempted to prepare markets for the beginning of the end of quantitative easing, perhaps sooner than expected. They didn’t like it. Bond yields soared and by June 24 the index had given back 8%, leading nervous central bankers the world over, in the last days of June, to assure all who would listen that easy money would be in force for a long time. So not only were markets being heavily influenced by central bankers; evidently central bankers were more than a little sensitive to their effect on markets.
In U.S. fixed income markets, the Barclays U.S. Aggregate Bond Index (“Barclays Aggregate”) of investment grade bonds slipped 2.44% in the first half of 2013, having been slightly ahead for the year on May 21. Only the sub-indices with the shortest durations held on to positive returns while the Barclays Long Term U.S. Treasury Index lost 7.83%. The Barclays High Yield Bond — 2% Issuer Constrained Composite Index (not a part of the Barclays Aggregate) gained just 1.42%.
U.S. equities, represented by the S&P 500® Index including dividends, jumped 13.82% in the half year, the best first half since 1998, albeit 4% off its high. All sectors rose, led by health care with a gain of 20.26% and financials 19.50%, while materials 2.90% and technology 6.35% lagged the most. Operating earnings per share for S&P 500® companies set a record in the first quarter of 2013. But could this last given that the share of profits in national income was historically high?
In currency markets the dollar rose 1.41% against the euro over the period and 6.85% against the pound, due to the generally better growth outlook in the U.S., events described above in Italy and Cyprus and as Moody’s relieved the U.K. of its Aaa credit rating. The dollar climbed 14.28% over the yen due to the new aggressive monetary easing policy in Japan.
In international markets, the MSCI Japan® Index soared 33.90%. Investors hoped Prime Minister Abe’s and Bank of Japan Governor Kuroda’s steps to conquer deflation and get consumers and businesses spending again would gain traction. Encouragingly GDP growth was reported at 4.1% annualized in the first quarter. However prices were still in the doldrums, flat in May from a year earlier after six straight falls. The MSCI Europe ex UK® Index rose 5.41%, less than half of this for euro zone markets. Mr. Draghi’s words were perceived to remove the existential threat to the euro. But there was little else to motivate investors. The euro zone reported its sixth straight quarterly fall in GDP and a new record unemployment rate of 12.2%, ranging from 5.4% in Germany to 26.8% in Spain. The MSCI UK® Index added
2
7.46%. As in the U.S. and latterly Japan, stock prices were supported by the central bank’s quantitative easing. Having fallen by 0.3% in the fourth quarter, GDP recovered the loss in the first quarter of 2013 and June ended with some key indicators: purchasing managers’ indices and retail sales, showing tentative improvement.
Parentheses denote a negative number.
All indices are unmanaged and investors cannot invest directly in an index. Past performance does not guarantee future results. The performance quoted represents past performance. Investment return and principal value of an investment will fluctuate, and shares, when redeemed, may be worth more or less than their original cost. The Portfolio’s performance is subject to change since the period’s end and may be lower or higher than the performance data shown. Please call (800) 992-0180 or log on to www.inginvestment.com to obtain performance data current to the most recent month end.
Market Perspective reflects the views of ING’s Chief Investment Risk Officer only through the end of the period, and is subject to change based on market and other conditions.
Index | | Description |
Barclays High Yield Bond – 2% Issuer Constrained Composite Index | | An unmanaged index that includes all fixed-income securities having a maximum quality rating of Ba1, a minimum amount outstanding of $150 million, and at least one year to maturity. |
Barclays U.S. Aggregate Bond Index | | An unmanaged index of publicly issued investment grade U.S. Government, mortgage-backed, asset-backed, and corporate debt securities. |
Baryclays Long Term U.S. Treasury Index | | The Index includes all publicly issued, U.S. Treasury securities that have a remaining maturity of 10 or more years, are rated investment grade, and have $250 million or more of outstanding face value. |
MSCI Europe ex UK® Index | | A free float-adjusted market capitalization index that is designed to measure developed market equity performance in Europe, excluding the UK. |
MSCI Japan® Index | | A free float-adjusted market capitalization index that is designed to measure developed market equity performance in Japan. |
MSCI UK® Index | | A free float-adjusted market capitalization index that is designed to measure developed market equity performance in the UK. |
MSCI World IndexSM | | An unmanaged index that measures the performance of over 1,400 securities listed on exchanges in the U.S., Europe, Canada, Australia, New Zealand, and the Far East. |
S&P 500® Index | | An unmanaged index that measures the performance of securities of approximately 500 large-capitalization companies whose securities are traded on major U.S. stock markets. |
S&P/Case-Shiller 20-City Composite Home Price Index | | A composite index of the home price index for the top 20 Metropolitan Statistical Areas in the United States. The index is published monthly by Standard & Poor’s. |
****
3
PRO FORMA FINANCIAL STATEMENTS
In connection with a proposed transaction whereby all of the assets and liabilities of Bond Portfolio will be transferred to Intermediate Bond Portfolio, in exchange for shares of Intermediate Bond Portfolio, shown below are financial statements for each Portfolio and Pro Forma Financial Statements for the combined Portfolio, assuming the Reorganization is consummated, as of June 30, 2013. The first table presents Statements of Assets and Liabilities for each Portfolio and estimated Pro Forma figures for the combined Portfolio. The second table presents Statements of Operations for each Portfolio and estimated Pro Forma figures for the combined Portfolio. The third table presents Portfolio of Investments for each Portfolio and estimated Pro Forma figures for the combined Portfolio. The tables are followed by the Notes to the Pro Forma Financial Statements.
STATEMENTS OF ASSETS AND LIABILITIES as of June 30, 2013 (Unaudited)
| | Bond Portfolio | | Intermediate
Bond Portfolio | | Pro Forma
Adjustments | | Intermediate Bond
Portfolio
Pro Forma
Combined | |
ASSETS: | | | | | | | | | |
Investments in securities at fair value+* | | $ | 430,293,647 | | $ | 2,103,611,304 | | $ | — | | $ | 2,533,904,951 | |
Investments in affiliates at fair value** | | 50,438,932 | | 244,412,026 | | — | | 294,850,958 | |
Short-term investments at fair value*** | | 1,921,748 | | 8,986,769 | | — | | 10,908,517 | |
Total Investments at fair value | | $ | 482,654,327 | | $ | 2,357,010,099 | | $ | — | | $ | 2,839,664,426 | |
Short-term investments at amortized cost | | 7,498,624 | | 23,070,324 | | — | | 30,568,948 | |
Cash | | 842,772 | | 5,956,581 | | — | | 6,799,353 | |
Cash collateral for futures | | 708,082 | | 644,147 | | — | | 1,352,229 | |
Foreign currencies at value**** | | — | | 249 | | — | | 249 | |
Receivables: | | | | | | | | | |
Investment securities sold | | 54,348,322 | | 151,980,499 | | 749,162 | (A) | 207,077,983 | |
Investment securities sold on a delayed-delivery or when-issued basis | | 105,232,721 | | 198,600,962 | | — | | 303,833,683 | |
Fund shares sold | | — | | 375,911 | | — | | 375,911 | |
Dividends | | 12,595 | | 128,533 | | — | | 141,128 | |
Interest | | 2,159,478 | | 12,087,653 | | — | | 14,247,131 | |
Variation margin | | — | | 30,983 | | — | | 30,983 | |
Unrealized appreciation on forward foreign currency contracts | | 749,162 | | 6,809,405 | | (749,162 | )(A) | 6,809,405 | |
Prepaid expenses | | 1,559 | | 15,922 | | — | | 17,481 | |
Reimbursement due from manager | | 75,191 | | — | | 132,500 | (B) | 207,691 | |
Total assets | | 654,282,833 | | 2,756,711,268 | | 132,500 | | 3,411,126,601 | |
| | | | | | | | | |
LIABILITIES: | | | | | | | | | |
Payable for investment securities purchased | | 55,396,342 | | 160,072,686 | | 563,330 | (A) | 216,032,358 | |
Payable for investment securities purchased on a delayed-delivery or when-issued basis | | 180,684,320 | | 474,254,313 | | — | | 654,938,633 | |
Payable for fund shares redeemed | | 164,779 | | 2,552,569 | | — | | 2,717,348 | |
Payable upon receipt of securities loaned | | 1,921,748 | | 8,986,769 | | — | | 10,908,517 | |
Unrealized depreciation on forward foreign currency contracts | | 563,330 | | 2,449,054 | | (563,330 | )(A) | 2,449,054 | |
Payable for derivatives collateral | | — | | 5,109,000 | | — | | 5,109,000 | |
Payable for investment management fees | | 168,236 | | 705,123 | | — | | 873,359 | |
Payable for administrative fees | | 35,049 | | 96,951 | | — | | 132,000 | |
Payable for distribution and shareholder service fees | | 126,177 | | 255,830 | | — | | 382,007 | |
Payable for directors fees | | — | | 11,108 | | 2,220 | (A) | 13,328 | |
Payable for trustee fees | | 2,220 | | — | | (2,220 | )(A) | — | |
Other accrued expenses and liabilities | | 142,041 | | 306,115 | | 132,500 | (B) | 580,656 | |
Total liabilities | | 239,204,242 | | 654,799,518 | | 132,500 | | 894,136,260 | |
NET ASSETS | | $ | 415,078,591 | | $ | 2,101,911,750 | | $ | — | | $ | 2,516,990,341 | |
| | | | | | | | | |
NET ASSETS WERE COMPRISED OF: | | | | | | | | | |
Paid-in capital | | $ | 374,459,486 | | $ | 2,286,912,033 | | $ | — | | $ | 2,661,371,519 | |
4
| | Bond Portfolio | | Intermediate
Bond Portfolio | | Pro Forma
Adjustments | | Intermediate Bond
Portfolio
Pro Forma
Combined | |
Distributions in excess of net investment income | | 10,507,088 | | 29,268,785 | | — | | 39,775,873 | |
Accumulated net realized gain (loss) | | 36,888,795 | | (217,005,574 | ) | 805,885 | (A) | (179,310,894 | ) |
Net unrealized appreciation (depreciation) | | (6,776,778 | ) | 2,736,506 | | (805,885 | )(A) | (4,846,157 | ) |
NET ASSETS | | $ | 415,078,591 | | $ | 2,101,911,750 | | $ | — | | $ | 2,516,990,341 | |
| | | | | | | | | |
|
+ | Including securities loaned at value | | $ | 1,867,512 | | $ | 8,761,751 | | $ | — | | $ | 10,629,263 | |
* | Cost of investments in securities | | $ | 435,097,863 | | $ | 2,091,226,711 | | $ | — | | $ | 2,526,324,574 | |
** | Cost of investments in affiliates | | $ | 53,217,379 | | $ | 258,463,425 | | $ | — | | $ | 311,680,804 | |
*** | Cost of short-term investments | | $ | 1,921,748 | | $ | 8,986,769 | | $ | — | | $ | 10,908,517 | |
**** | Cost of foreign currencies | | $ | — | | $ | 251 | | $ | — | | $ | 251 | |
| | | | | | | | | | |
| Class ADV^: | | | | | | | | | |
| Net Assets | | $ | 415,078,591 | | $ | 38,003,692 | | $ | — | | $ | 38,003,692 | |
| Shares authorized | | unlimited | | unlimited | | | | unlimited | |
| Par value | | $ | 0.001 | | $ | 1.000 | | | | $ | 1.000 | |
| Shares outstanding | | 40,725,530 | | 3,010,870 | | — | | 3,010,870 | |
| Net asset value and redemption price per share | | $ | 10.19 | | $ | 12.62 | | | | $ | 12.62 | |
| | | | | | | | | | |
| Class I: | | | | | | | | | |
| Net Assets | | n/a | | $ | 920,279,389 | | $ | — | | $ | 920,279,389 | |
| Shares authorized | | n/a | | unlimited | | | | unlimited | |
| Par value | | n/a | | $ | 1.000 | | | | $ | 1.000 | |
| Shares outstanding | | n/a | | 72,288,748 | | — | | 72,288,748 | |
| Net asset value and redemption price per share | | n/a | | $ | 12.73 | | | | $ | 12.73 | |
| | | | | | | | | | |
| Class S: | | | | | | | | | |
| Net Assets | | n/a | | $ | 1,143,399,409 | | $ | — | | $ | 1,558,478,000 | |
| Shares authorized | | n/a | | unlimited | | | | unlimited | |
| Par value | | n/a | | $ | 1.000 | | | | $ | 1.000 | |
| Shares outstanding | | n/a | | 90,395,947 | | (7,912,993 | )(C) | 123,208,484 | |
| Net asset value and redemption price per share | | n/a | | $ | 12.65 | | | | $ | 12.65 | |
| | | | | | | | | | |
| Class S2: | | | | | | | | | |
| Net assets | | n/a | | $ | 229,260 | | $ | — | | $ | 229,260 | |
| Shares authorized | | n/a | | unlimited | | | | unlimited | |
| Par value | | n/a | | $ | 1.000 | | | | $ | 1.000 | |
| Shares outstanding | | n/a | | 18,094 | | — | | 18,094 | |
| Net asset value and redemption price per share | | n/a | | $ | 12.67 | | | | $ | 12.67 | |
| |
(A) | Reflects adjustments related to portfolio consolidation. |
(B) | Reflects adjustment for estimated one time merger expenses (See Note 4 in Notes to Pro Forma Financial Statements (Unaudited)). |
(C) | Reflects new shares issued, net of retired shares of ING Bond Portfolio. (Calculation: Net Assets ÷ NAV per share). |
^ | ING Bond Portfolio has no class designation; all net assets and shares are merging into ING Intermediate Bond Class S. |
See accompanying Notes to Pro Forma Financial Statements (Unaudited)
5
STATEMENTS OF OPERATIONS for the twelve months ended June 30, 2012 (Unaudited)
| | Bond Portfolio | | Intermediate
Bond Portfolio | | Pro Forma
Adjustments | | Intermediate
Bond Portfolio
Pro Forma
Combined | |
INVESTMENT INCOME: | | | | | | | | | |
Dividends, net of foreign taxes withheld* | | $ | 2,520,940 | | $ | 1,185,444 | | $ | — | | $ | 3,706,384 | |
Interest, net of foreign taxes withheld* | | 10,159,564 | | 79,012,050 | | — | | 89,171,614 | |
Dividends from affiliated funds | | (148,828 | ) | 9,798,215 | | — | | 9,649,387 | |
Securities lending income, net | | 46,945 | | 116,680 | | — | | 163,625 | |
Total investment income | | 12,578,621 | | 90,112,389 | | — | | 102,691,010 | |
| | | | | | | | | |
EXPENSES: | | | | | | | | | |
Investment management fees | | 2,055,911 | | 9,014,030 | | (11,069,941 | )(A) | — | |
Distribution and service fees: | | | | | | | | | |
Class ADV | | 2,724,344 | | 168,970 | | (2,723,977 | )(A) | 169,337 | |
Class S | | — | | 3,060,213 | | 1,139,974 | (A) | 4,200,187 | |
Class S2 | | — | | 3,679 | | (5 | )(A) | 3,674 | |
Transfer agent fees | | 1,173 | | 7,335 | | 4,406 | (A) | 12,914 | |
Administrative service fees | | 428,309 | | 1,239,394 | | (178,583 | )(A) | 1,489,120 | |
Shareholder reporting expense | | 54,950 | | 171,047 | | (20,486 | )(A) | 205,511 | |
Professional fees | | 44,575 | | 60,779 | | (32,329 | )(A) | 73,025 | |
Custody and accounting expense | | 110,472 | | 713,277 | | 33,246 | (A) | 856,995 | |
Director fees | | — | | 50,536 | | 3,624 | (A) | 60,719 | |
Trustee fees | | 6,559 | | — | | (6,559 | )(A) | — | |
Miscellaneous expense | | 28,634 | | 152,195 | | 2,032 | (A) | 182,861 | |
Interest expense | | 391 | | 1,088 | | (172 | )(A) | 1,307 | |
Merger expenses | | — | | — | | 132,500 | (C) | 132,500 | |
Total expenses | | 5,455,318 | | 14,642,543 | | (1,868,290 | ) | 18,229,571 | |
Net waived and reimbursed fees | | (2,075,295 | ) | (735 | ) | 1,942,795 | (A) | (133,235 | ) |
Net expenses | | 3,380,023 | | 14,641,808 | | 74,505 | | 18,096,336 | |
Net investment income | | 9,198,598 | | 75,470,581 | | (74,505 | ) | 84,594,674 | |
| | | | | | | | | |
REALIZED AND UNREALIZED GAIN (LOSS): | | | | | | | | | |
Net realized gain (loss) on: | | | | | | | | | |
Investments | | 37,550,978 | | 62,574,910 | | — | | 100,125,888 | |
Capital gain distributions from affiliated underlying funds | | 139,391 | | 662,976 | | — | | 802,367 | |
Sale of investments in affiliates | | 507,379 | | 1,745,814 | | — | | 2,253,193 | |
Foreign currency related transactions | | (1,264,126 | ) | (3,490,882 | ) | 185,832 | (B) | (4,569,176 | ) |
Futures | | 613,888 | | 2,222,228 | | 620,053 | (B) | 3,456,169 | |
Swaps | | (112,222 | ) | (5,837,402 | ) | — | | (5,949,624 | ) |
Written options | | — | | 381,044 | | — | | 381,044 | |
Net realized gain | | 37,435,288 | | 58,258,688 | | 805,885 | | 96,499,861 | |
Net change in unrealized appreciation (depreciation) on: | | | | | | | | | |
Investments | | (40,111,628 | ) | (45,365,544 | ) | — | | (85,477,172 | ) |
Affiliated underlying funds | | (2,778,448 | ) | (14,051,399 | ) | — | | (16,829,847 | ) |
Foreign currency related transactions | | 185,832 | | (1,558,321 | ) | (185,832 | )(B) | (1,558,321 | ) |
Futures | | 620,053 | | (323,266 | ) | (620,053 | )(B) | (323,266 | ) |
Swaps | | — | | 4,679,393 | | — | | 4,679,393 | |
Written options | | — | | 19,269 | | — | | 19,269 | |
Net change in unrealized appreciation (depreciation) | | (42,084,191 | ) | (56,599,868 | ) | (805,885 | ) | (99,489,944 | ) |
Net realized and unrealized gain (loss) | | (4,648,903 | ) | 1,658,820 | | — | | (2,990,083 | ) |
Increase (decrease) in net assets resulting from operations | | $ | 4,549,695 | | $ | 77,129,401 | | $ | (74,505 | ) | $ | 81,604,591 | |
| | | | | | | | | |
|
*Foreign taxes withheld | | $ | — | | $ | 251 | | $ | — | | $ | 251 | |
6
(A) | Reflects adjustment in expenses due to effects of new contractual rates. |
(B) | Reflects adjustments related to portfolio consolidation. |
(C) | Reflects adjustment for estimated one time merger expenses (See Note 4 in Notes to Pro Forma Financial Statements (Unaudited)). |
See accompanying Notes to Pro Forma Financial Statements (Unaudited)
7
PORTFOLIO OF INVESTMENTS
as of June 30, 2013 (Unaudited)
Bond
Portfolio | | Intermediate
Bond
Portfolio | | Intermediate
Bond
Portfolio
Pro Forma
Combined | | | | | | Bond Portfolio | | Intermediate Bond
Portfolio | | Intermediate Bond
Portfolio
Pro Forma
Combined | |
Principal
amount† | | Principal
amount† | | Principal
amount† | | | | | | Value | | Value | | Value | |
| | | | CORPORATE BONDS/NOTES: 25.0% | | | | | | | |
| | | | | | | | Consumer Discretionary: 1.8% | | | | | | | |
296,000 | | 1,476,000 | | 1,772,000 | | | | Brinker International, Inc., 2.600%, 05/15/18 | | 289,934 | | 1,445,751 | | 1,735,685 | |
— | | 2,350,000 | | 2,350,000 | | | | Cablevision Systems Corp., 8.625%, 09/15/17 | | — | | 2,679,000 | | 2,679,000 | |
600,000 | | 1,505,000 | | 2,105,000 | | # | | Carlson Wagonlit BV, 6.875%, 06/15/19 | | 609,000 | | 1,527,575 | | 2,136,575 | |
304,000 | | 1,500,000 | | 1,804,000 | | # | | COX Communications, Inc., 4.500%, 06/30/43 | | 262,922 | | 1,297,309 | | 1,560,231 | |
1,792,000 | | 3,661,000 | | 5,453,000 | | | | DIRECTV Holdings LLC / DIRECTV Financing Co., Inc., 2.400%, 03/15/17 | | 1,801,718 | | 3,680,854 | | 5,482,572 | |
642,000 | | 2,272,000 | | 2,914,000 | | | | DIRECTV Holdings LLC / DIRECTV Financing Co., Inc., 5.150%, 03/15/42 | | 575,314 | | 1,267,681 | | 1,842,995 | |
— | | 1,318,000 | | 1,318,000 | | | | DIRECTV Holdings LLC / DIRECTV Financing Co., Inc., 3.800%, 03/15/22 | | — | | 2,036,003 | | 2,036,003 | |
205,000 | | 1,010,000 | | 1,215,000 | | # | | DISH DBS Corp., 4.250%, 04/01/18 | | 201,925 | | 994,850 | | 1,196,775 | |
504,000 | | 2,474,000 | | 2,978,000 | | | | Macy’s Retail Holdings, Inc., 4.300%, 02/15/43 | | 435,480 | | 2,137,660 | | 2,573,140 | |
— | | 3,275,000 | | 3,275,000 | | | | Mediacom, LLC, 7.250%, 02/15/22 | | — | | 3,463,312 | | 3,463,312 | |
214,000 | | 1,069,000 | | 1,283,000 | | | | NBCUniversal Media, LLC, 4.450%, 01/15/43 | | 200,796 | | 1,003,040 | | 1,203,836 | |
595,000 | | 2,940,000 | | 3,535,000 | | | | News America, Inc., 3.000%, 09/15/22 | | 556,080 | | 2,747,689 | | 3,303,769 | |
394,000 | | 1,961,000 | | 2,355,000 | | # | | Pearson Funding Five PLC, 3.250%, 05/08/23 | | 363,731 | | 1,810,348 | | 2,174,079 | |
360,000 | | 826,000 | | 1,186,000 | | | | Time Warner, Inc., 6.500%, 11/15/36 | | 408,811 | | 937,994 | | 1,346,805 | |
— | | 2,306,000 | | 2,306,000 | | | | Toll Brothers Finance Corp., 6.750%, 11/01/19 | | — | | 2,617,310 | | 2,617,310 | |
425,000 | | 2,370,000 | | 2,795,000 | | # | | Viacom, Inc., 4.375%, 03/15/43 | | 362,269 | | 2,020,181 | | 2,382,450 | |
512,000 | | 2,517,000 | | 3,029,000 | | | | WPP Finance 2010, 5.125%, 09/07/42 | | 474,648 | | 2,333,375 | | 2,808,023 | |
750,000 | | 2,875,000 | | 3,625,000 | | # | | XM Satellite Radio, Inc., 7.625%, 11/01/18 | | 821,250 | | 3,148,125 | | 3,969,375 | |
| | | | | | | | | | 7,363,878 | | 37,148,057 | | 44,511,935 | |
| | | | | | | | | | | | | | | |
| | | | | | | | Consumer Staples: 0.4% | | | | | | | |
750,000 | | — | | 750,000 | | | | Constellation Brands, Inc., 6.000%, 05/01/22 | | 808,125 | | — | | 808,125 | |
— | | 3,750,000 | | 3,750,000 | | | | Constellation Brands, Inc., 7.250%, 05/15/17 | | — | | 4,293,750 | | 4,293,750 | |
— | | 2,835,000 | | 2,835,000 | | # | | Hawk Acquisition Sub, Inc., 4.250%, 10/15/20 | | — | | 2,718,056 | | 2,718,056 | |
750,000 | | — | | 750,000 | | # | | JBS USA LLC/JBS USA Finance, Inc., 8.250%, 02/01/20 | | 789,375 | | — | | 789,375 | |
365,000 | | 1,826,000 | | 2,191,000 | | | | Walgreen Co., 4.400%, 09/15/42 | | 329,724 | | 1,649,525 | | 1,979,249 | |
| | | | | | | | | | 1,927,224 | | 8,661,331 | | 10,588,555 | |
| | | | | | | | | | | | | | | |
| | | | | | | | Energy: 3.2% | | | | | | | |
750,000 | | — | | 750,000 | | L | | Alpha Natural Resources, Inc., 6.000%, 06/01/19 | | 613,125 | | — | | 613,125 | |
— | | 2,650,000 | | 2,650,000 | | L | | Alpha Natural Resources, Inc., 6.250%, 06/01/21 | | — | | 2,126,625 | | 2,126,625 | |
326,000 | | 1,630,000 | | 1,956,000 | | | | Anadarko Petroleum Corp., 6.375%, 09/15/17 | | 375,127 | | 1,875,636 | | 2,250,763 | |
8
Bond
Portfolio | | Intermediate
Bond
Portfolio | | Intermediate
Bond
Portfolio
Pro Forma
Combined | | | | | | Bond Portfolio | | Intermediate Bond
Portfolio | | Intermediate Bond
Portfolio
Pro Forma
Combined | |
930,000 | | 4,619,000 | | 5,549,000 | | | | BP Capital Markets PLC, 2.750%, 05/10/23 | | 861,179 | | 4,277,189 | | 5,138,368 | |
— | | 1,225,000 | | 1,225,000 | | | | Chesapeake Energy Corp., 6.625%, 08/15/20 | | — | | 1,323,000 | | 1,323,000 | |
— | | 1,005,000 | | 1,005,000 | | # | | Chesapeake Oilfield Operating LLC/Chesapeake Oilfield Finance, Inc., 6.625%, 11/15/19 | | — | | 999,975 | | 999,975 | |
750,000 | | — | | 750,000 | | | | Continental Resources, Inc./OK, 5.000%, 09/15/22 | | 766,875 | | — | | 766,875 | |
— | | 2,932,000 | | 2,932,000 | | | | Enbridge Energy Partners, 9.875%, 03/01/19 | | — | | 3,832,036 | | 3,832,036 | |
— | | 1,599,000 | | 1,599,000 | | | | Enbridge Energy Partners, 4.200%, 09/15/21 | | — | | 1,627,737 | | 1,627,737 | |
— | | 3,265,000 | | 3,265,000 | | | | Energy Transfer Equity L.P., 7.500%, 10/15/20 | | — | | 3,583,338 | | 3,583,338 | |
1,101,000 | | 3,875,000 | | 4,976,000 | | | | Energy Transfer Partners L.P., 4.650%, 06/01/21 | | 1,140,721 | | 4,014,798 | | 5,155,519 | |
654,000 | | — | | 654,000 | | | | Energy Transfer Partners L.P., 6.050%, 06/01/41 | | 664,161 | | — | | 664,161 | |
— | | 3,770,000 | | 3,770,000 | | | | Energy Transfer Partners L.P., 9.700%, 03/15/19 | | — | | 4,896,348 | | 4,896,348 | |
698,000 | | 1,730,000 | | 2,428,000 | | | | Enterprise Products Operating, LLC, 4.450%, 02/15/43 | | 622,687 | | 1,543,336 | | 2,166,023 | |
710,000 | | 2,202,000 | | 2,912,000 | | | | FMC Technologies, Inc., 3.450%, 10/01/22 | | 681,066 | | 2,112,264 | | 2,793,330 | |
— | | 4,000,000 | | 4,000,000 | | ±,X | | Greater Ohio Ethanol, LLC, 6.301%, 12/31/13 | | — | | — | | — | |
927,000 | | 4,625,000 | | 5,552,000 | | | | Marathon Petroleum Corp., 6.500%, 03/01/41 | | 1,063,340 | | 5,305,231 | | 6,368,571 | |
464,000 | | 2,250,000 | | 2,714,000 | | | | Murphy Oil Corp., 2.500%, 12/01/17 | | 457,952 | | 2,220,674 | | 2,678,626 | |
250,000 | | 1,260,000 | | 1,510,000 | | | | ONEOK Partners L.P., 2.000%, 10/01/17 | | 246,024 | | 1,239,960 | | 1,485,984 | |
257,000 | | 1,303,000 | | 1,560,000 | | | | ONEOK Partners L.P., 3.375%, 10/01/22 | | 236,591 | | 1,199,525 | | 1,436,116 | |
535,000 | | 2,675,000 | | 3,210,000 | | | | Phillips 66, 2.950%, 05/01/17 | | 551,713 | | 2,758,564 | | 3,310,277 | |
1,057,000 | | 4,285,000 | | 5,342,000 | | | | Phillips 66, 4.300%, 04/01/22 | | 1,093,514 | | 4,433,025 | | 5,526,539 | |
750,000 | | — | | 750,000 | | | | Plains Exploration & Production Co., 6.625%, 05/01/21 | | 794,569 | | — | | 794,569 | |
372,000 | | — | | 372,000 | | #,L | | Reliance Industries Ltd., 5.875%, 12/31/49 | | 326,430 | | — | | 326,430 | |
— | | 2,894,000 | | 2,894,000 | | | | Transcontinental Gas Pipe Line Corp., 6.400%, 04/15/16 | | — | | 3,285,479 | | 3,285,479 | |
1,000,000 | | 5,000,000 | | 6,000,000 | | | | Transocean, Inc., 2.500%, 10/15/17 | | 988,906 | | 4,944,530 | | 5,933,436 | |
420,000 | | 2,080,000 | | 2,500,000 | | | | Transocean, Inc., 3.800%, 10/15/22 | | 400,613 | | 1,983,987 | | 2,384,600 | |
1,228,000 | | 3,604,000 | | 4,832,000 | | | | Weatherford International Ltd., 5.950%, 04/15/42 | | 1,165,641 | | 3,420,985 | | 4,586,626 | |
— | | 3,066,000 | | 3,066,000 | | | | Weatherford International Ltd., 6.750%, 09/15/40 | | — | | 3,184,893 | | 3,184,893 | |
1,000,000 | | — | | 1,000,000 | | | | Williams Partners L.P., 6.300%, 04/15/40 | | 1,052,717 | | — | | 1,052,717 | |
| | | | | | | | | | 14,102,951 | | 66,189,135 | | 80,292,086 | |
| | | | | | | | | | | | | | | |
| | | | | | | | Financials: 11.2% | | | | | | | |
— | | 7,036,400 | | 7,036,400 | | L | | Aegon NV, 2.055%, 07/29/49 | | — | | 4,995,844 | | 4,995,844 | |
836,000 | | 1,946,000 | | 2,782,000 | | | | American International Group, Inc., 5.850%, 01/16/18 | | 941,585 | | 2,191,776 | | 3,133,361 | |
615,000 | | 2,943,000 | | 3,558,000 | | | | American International Group, Inc., 8.175%, 05/15/58 | | 753,375 | | 3,605,175 | | 4,358,550 | |
676,000 | | 3,418,000 | | 4,094,000 | | | | American Tower Corp., 4.500%, 01/15/18 | | 721,454 | | 3,647,823 | | 4,369,277 | |
867,000 | | 2,040,000 | | 2,907,000 | | | | AvalonBay Communities, Inc., 2.950%, 09/15/22 | | 803,131 | | 1,889,719 | | 2,692,850 | |
652,000 | | 3,301,000 | | 3,953,000 | | | | Bank of America Corp., 3.300%, 01/11/23 | | 617,107 | | 3,124,340 | | 3,741,447 | |
568,000 | | 2,844,000 | | 3,412,000 | | | | Bank of America Corp., 5.200%, 12/29/49 | | 536,760 | | 2,687,580 | | 3,224,340 | |
— | | 4,196,000 | | 4,196,000 | | | | Bank of America Corp., 8.000%, 12/29/49 | | — | | 4,694,820 | | 4,694,820 | |
795,000 | | 3,915,000 | | 4,710,000 | | L | | Barclays Bank PLC, 7.625%, 11/21/22 | | 782,081 | | 3,851,381 | | 4,633,462 | |
9
Bond
Portfolio | | Intermediate
Bond
Portfolio | | Intermediate
Bond
Portfolio
Pro Forma
Combined | | | | | | Bond Portfolio | | Intermediate Bond
Portfolio | | Intermediate Bond
Portfolio
Pro Forma
Combined | |
532,000 | | 2,667,000 | | 3,199,000 | | | | BB&T Corp., 2.050%, 06/19/18 | | 524,664 | | 2,630,222 | | 3,154,886 | |
1,243,000 | | 3,206,000 | | 4,449,000 | | | | BBVA, 4.664%, 10/09/15 | | 1,280,960 | | 3,303,908 | | 4,584,868 | |
306,000 | | 1,522,000 | | 1,828,000 | | | | Berkshire Hathaway, Inc., 3.000%, 02/11/23 | | 295,043 | | 1,467,502 | | 1,762,545 | |
— | | 1,278,000 | | 1,278,000 | | | | Berkshire Hathaway, Inc., 4.400%, 05/15/42 | | — | | 1,185,325 | | 1,185,325 | |
— | | 4,359,000 | | 4,359,000 | | | | BioMed Realty L.P., 4.250%, 07/15/22 | | — | | 4,291,270 | | 4,291,270 | |
— | | 1,829,000 | | 1,829,000 | | | | Boston Properties L.P., 3.700%, 11/15/18 | | — | | 1,922,484 | | 1,922,484 | |
416,000 | | 2,446,000 | | 2,862,000 | | | | Capital One Bank USA NA, 3.375%, 02/15/23 | | 393,784 | | 2,315,374 | | 2,709,158 | |
429,000 | | 1,072,000 | | 1,501,000 | | | | Citigroup, Inc., 1.300%, 04/01/16 | | 424,134 | | 1,059,841 | | 1,483,975 | |
546,000 | | 2,728,000 | | 3,274,000 | | | | Citigroup, Inc., 4506100.000%, | | 491,081 | | 2,453,607 | | 2,944,688 | |
808,000 | | 2,020,000 | | 2,828,000 | | | | Citigroup, Inc., 4.450%, 01/10/17 | | 865,669 | | 2,164,173 | | 3,029,842 | |
389,000 | | 1,922,000 | | 2,311,000 | | | | Citigroup, Inc., 5.950%, 12/29/49 | | 387,580 | | 1,914,985 | | 2,302,565 | |
620,000 | | 3,000,000 | | 3,620,000 | | | | Citigroup, Inc., 5.900%, 12/29/49 | | 616,389 | | 2,982,528 | | 3,598,917 | |
732,000 | | 3,614,000 | | 4,346,000 | | | | Citigroup, Inc., 5.350%, 05/29/49 | | 689,326 | | 3,403,311 | | 4,092,637 | |
736,000 | | 3,491,000 | | 4,227,000 | | # | | Cooperatieve Centrale Raiffeisen-Boerenleenbank BA/Netherlands, 11.000%, 12/29/49 | | 949,794 | | 4,505,069 | | 5,454,863 | |
1,092,000 | | 5,506,000 | | 6,598,000 | | | | Deutsche Bank AG, 4.296%, 05/24/28 | | 1,009,682 | | 5,090,941 | | 6,100,623 | |
811,000 | | 4,065,000 | | 4,876,000 | | | | Discover Bank/Greenwood DE, 2.000%, 02/21/18 | | 785,525 | | 3,937,310 | | 4,722,835 | |
549,000 | | 2,030,000 | | 2,579,000 | | | | Discover Financial Services, 3.850%, 11/21/22 | | 516,259 | | 1,908,935 | | 2,425,194 | |
— | | 1,010,000 | | 1,010,000 | | | | Discover Financial Services, 6.450%, 06/12/17 | | — | | 1,148,028 | | 1,148,028 | |
705,000 | | 3,504,000 | | 4,209,000 | | | | Equity One, Inc., 3.750%, 11/15/22 | | 664,369 | | 3,302,057 | | 3,966,426 | |
496,000 | | 2,502,000 | | 2,998,000 | | | | ERP Operating L.P., 3.000%, 04/15/23 | | 456,501 | | 2,302,756 | | 2,759,257 | |
750,000 | | 3,739,000 | | 4,489,000 | | | | Fifth Third Bancorp, 5.100%, 12/31/49 | | 710,625 | | 3,542,703 | | 4,253,328 | |
667,000 | | 1,090,000 | | 1,757,000 | | | | Fifth Third Bancorp., 1.450%, 02/28/18 | | 644,813 | | 1,053,742 | | 1,698,555 | |
208,000 | | 1,040,000 | | 1,248,000 | | | | Ford Motor Co., 3.000%, 06/12/17 | | 208,567 | | 1,042,835 | | 1,251,402 | |
— | | 2,419,000 | | 2,419,000 | | | | Ford Motor Co., 8.125%, 01/15/20 | | — | | 2,921,804 | | 2,921,804 | |
336,000 | | 1,653,000 | | 1,989,000 | | | | General Electric Capital Corp., 3.150%, 09/07/22 | | 317,931 | | 1,564,108 | | 1,882,039 | |
208,000 | | 1,035,000 | | 1,243,000 | | | | General Electric Capital Corp., 3.350%, 10/17/16 | | 219,102 | | 1,090,245 | | 1,309,347 | |
600,000 | | 2,700,000 | | 3,300,000 | | | | General Electric Capital Corp., 7.125%, 12/15/49 | | 679,144 | | 3,056,146 | | 3,735,290 | |
400,000 | | 1,800,000 | | 2,200,000 | | | | General Electric Capital Corp., 6.250%, 12/15/49 | | 426,792 | | 1,920,562 | | 2,347,354 | |
700,000 | | 3,400,000 | | 4,100,000 | | | | General Electric Capital Corp., 5.250%, 06/29/49 | | 670,250 | | 3,255,500 | | 3,925,750 | |
— | | 1,358,000 | | 1,358,000 | | | | General Electric Capital Corp., 5.300%, 02/11/21 | | — | | 1,491,338 | | 1,491,338 | |
417,000 | | 2,076,000 | | 2,493,000 | | L | | Genworth Financial, Inc., 7.625%, 09/24/21 | | 485,121 | | 2,415,133 | | 2,900,254 | |
495,000 | | 2,456,000 | | 2,951,000 | | | | Goldman Sachs Group, Inc., 2.375%, 01/22/18 | | 486,354 | | 2,413,101 | | 2,899,455 | |
516,000 | | 2,580,000 | | 3,096,000 | | | | Goldman Sachs Group, Inc., 3.625%, 01/22/23 | | 494,385 | | 2,471,924 | | 2,966,309 | |
371,000 | | 1,474,000 | | 1,845,000 | | | | Goldman Sachs Group, Inc., 5.750%, 01/24/22 | | 409,709 | | 1,627,791 | | 2,037,500 | |
388,000 | | 1,955,000 | | 2,343,000 | | | | Goldman Sachs Group, Inc., 6.750%, 10/01/37 | | 398,990 | | 2,010,373 | | 2,409,363 | |
611,000 | | 1,285,000 | | 1,896,000 | | | | Hartford Financial Services Group, Inc., 6.625%, 03/30/40 | | 729,449 | | 1,534,111 | | 2,263,560 | |
372,000 | | 1,847,000 | | 2,219,000 | | | | Hartford Financial Services Group, Inc., 8.125%, 06/15/38 | | 411,990 | | 2,045,553 | | 2,457,543 | |
— | | 2,317,000 | | 2,317,000 | | | | Hartford Financial Services Group, Inc., 5.125%, 04/15/22 | | — | | 2,524,318 | | 2,524,318 | |
10
Bond
Portfolio | | Intermediate
Bond
Portfolio | | Intermediate
Bond
Portfolio
Pro Forma
Combined | | | | | | Bond Portfolio | | Intermediate Bond
Portfolio | | Intermediate Bond
Portfolio
Pro Forma
Combined | |
505,000 | | 2,489,000 | | 2,994,000 | | # | | HBOS PLC, 6.750%, 05/21/18 | | 537,052 | | 2,646,977 | | 3,184,029 | |
483,000 | | 2,443,000 | | 2,926,000 | | | | Health Care REIT, Inc., 2.250%, 03/15/18 | | 474,575 | | 2,400,387 | | 2,874,962 | |
1,096,000 | | 5,477,000 | | 6,573,000 | | # | | HSBC Bank PLC, 1.500%, 05/15/18 | | 1,057,021 | | 5,282,210 | | 6,339,231 | |
506,000 | | 2,534,000 | | 3,040,000 | | | | HSBC Finance Corp., 6.676%, 01/15/21 | | 559,995 | | 2,804,403 | | 3,364,398 | |
— | | 3,437,000 | | 3,437,000 | | # | | International Lease Finance Corp., 7.125%, 09/01/18 | | — | | 3,815,070 | | 3,815,070 | |
308,000 | | 1,554,000 | | 1,862,000 | | | | Intesa Sanpaolo SpA, 3.125%, 01/15/16 | | 302,987 | | 1,528,707 | | 1,831,694 | |
2,140,000 | | 9,750,000 | | 11,890,000 | | | | Jefferies Loan Trust 2013-A Class A, 3.698%, 11/02/14 | | 2,140,000 | | 9,750,000 | | 11,890,000 | |
1,011,000 | | 3,297,000 | | 4,308,000 | | | | JPMorgan Chase & Co., 1.625%, 05/15/18 | | 969,972 | | 3,163,201 | | 4,133,173 | |
430,000 | | 2,174,000 | | 2,604,000 | | | | JPMorgan Chase & Co., 3.250%, 09/23/22 | | 408,806 | | 2,066,848 | | 2,475,654 | |
732,000 | | 3,619,000 | | 4,351,000 | | | | JPMorgan Chase & Co., 3.375%, 05/01/23 | | 682,593 | | 3,374,732 | | 4,057,325 | |
602,000 | | 1,718,000 | | 2,320,000 | | | | JPMorgan Chase & Co., 5.400%, 01/06/42 | | 639,809 | | 1,825,901 | | 2,465,710 | |
536,000 | | 2,700,000 | | 3,236,000 | | | | JPMorgan Chase & Co., 5.150%, 05/29/49 | | 513,220 | | 2,585,250 | | 3,098,470 | |
655,000 | | 3,267,000 | | 3,922,000 | | | | Kimco Realty Corp., 3.125%, 06/01/23 | | 606,901 | | 3,027,091 | | 3,633,992 | |
1,169,000 | | 4,676,000 | | 5,845,000 | | | | Merrill Lynch & Co., Inc., 6.050%, 05/16/16 | | 1,266,461 | | 5,065,843 | | 6,332,304 | |
363,000 | | 1,790,000 | | 2,153,000 | | | | MetLife, Inc., 4.125%, 08/13/42 | | 324,513 | | 1,600,213 | | 1,924,726 | |
499,000 | | 2,494,000 | | 2,993,000 | | # | | Metropolitan Life Global Funding I, 1.500%, 01/10/18 | | 484,135 | | 2,419,704 | | 2,903,839 | |
524,000 | | 2,633,000 | | 3,157,000 | | | | Morgan Stanley, 2.125%, 04/25/18 | | 501,863 | | 2,521,764 | | 3,023,627 | |
672,000 | | 4,717,000 | | 5,389,000 | | | | Morgan Stanley, 4.100%, 05/22/23 | | 621,740 | | 4,364,211 | | 4,985,951 | |
594,000 | | 1,974,000 | | 2,568,000 | | | | Morgan Stanley, 4.750%, 03/22/17 | | 630,388 | | 2,094,927 | | 2,725,315 | |
420,000 | | 2,029,000 | | 2,449,000 | | | | Morgan Stanley, 5.500%, 07/28/21 | | 449,003 | | 2,169,111 | | 2,618,114 | |
— | | 1,380,000 | | 1,380,000 | | | | MPT Operating Partnership L.P./MPT Finance Corp., 6.375%, 02/15/22 | | — | | 1,455,900 | | 1,455,900 | |
654,000 | | 3,228,000 | | 3,882,000 | | | | Murray Street Investment Trust I, 4.647%, 03/09/17 | | 692,806 | | 3,419,537 | | 4,112,343 | |
401,000 | | 2,023,000 | | 2,424,000 | | | | National Retail Properties, Inc., 3.300%, 04/15/23 | | 362,921 | | 1,830,894 | | 2,193,815 | |
397,000 | | 1,965,000 | | 2,362,000 | | | | PNC Financial Services Group, Inc./The, 4.850%, 05/29/49 | | 371,195 | | 1,837,275 | | 2,208,470 | |
378,000 | | 1,051,000 | | 1,429,000 | | | | Prudential Financial, Inc., 5.200%, 03/15/44 | | 358,627 | | 997,136 | | 1,355,763 | |
613,000 | | 3,019,000 | | 3,632,000 | | | | Prudential Financial, Inc., 5.625%, 06/15/43 | | 602,272 | | 2,966,168 | | 3,568,440 | |
463,000 | | 2,294,000 | | 2,757,000 | | # | | RBS Citizens Financial Group, Inc., 4.150%, 09/28/22 | | 450,473 | | 2,231,931 | | 2,682,404 | |
250,000 | | 994,000 | | 1,244,000 | | | | Regions Bank/Birmingham AL, 6.450%, 06/26/37 | | 263,316 | | 1,046,945 | | 1,310,261 | |
772,000 | | 3,605,000 | | 4,377,000 | | | | Regions Bank/Birmingham AL, 7.500%, 05/15/18 | | 902,396 | | 4,213,910 | | 5,116,306 | |
1,002,000 | | 5,012,000 | | 6,014,000 | | | | Royal Bank of Scotland Group PLC, 6.125%, 12/15/22 | | 956,324 | | 4,783,528 | | 5,739,852 | |
— | | 3,002,000 | | 3,002,000 | | L | | Royal Bank of Scotland Group PLC, 6.100%, 06/10/23 | | — | | 2,851,678 | | 2,851,678 | |
493,000 | | 2,390,000 | | 2,883,000 | | # | | Simon Property Group L.P., 1.500%, 02/01/18 | | 475,201 | | 2,303,711 | | 2,778,912 | |
268,000 | | 1,323,000 | | 1,591,000 | | | | Simon Property Group L.P., 4.750%, 03/15/42 | | 256,455 | | 1,266,009 | | 1,522,464 | |
363,000 | | 1,788,000 | | 2,151,000 | | | | SLM Corp., 4.625%, 09/25/17 | | 358,462 | | 1,765,650 | | 2,124,112 | |
868,000 | | 1,460,000 | | 2,328,000 | | | | SLM Corp., 6.000%, 01/25/17 | | 911,400 | | 1,533,000 | | 2,444,400 | |
938,000 | | 3,233,000 | | 4,171,000 | | # | | Standard Chartered PLC, 3.950%, 01/11/23 | | 873,763 | | 3,011,594 | | 3,885,357 | |
1,228,000 | | 6,098,000 | | 7,326,000 | | | | State Street Corp., 3.100%, 05/15/23 | | 1,151,923 | | 5,720,217 | | 6,872,140 | |
11
Bond
Portfolio | | Intermediate
Bond
Portfolio | | Intermediate
Bond
Portfolio
Pro Forma
Combined | | | | | | Bond Portfolio | | Intermediate Bond
Portfolio | | Intermediate Bond
Portfolio
Pro Forma
Combined | |
550,000 | | 2,381,000 | | 2,931,000 | | | | UBS AG/Stamford CT, 7.625%, 08/17/22 | | 604,302 | | 2,616,079 | | 3,220,381 | |
522,000 | | 1,088,000 | | 1,610,000 | | | | Wells Fargo & Co., 1.500%, 01/16/18 | | 509,490 | | 1,061,926 | | 1,571,416 | |
345,000 | | 1,740,000 | | 2,085,000 | | | | Wells Fargo & Co., 3.450%, 02/13/23 | | 329,954 | | 1,664,118 | | 1,994,072 | |
| | | | | | | | | | 46,401,789 | | 235,043,127 | | 281,444,916 | |
| | | | | | | | Health Care: 1.6% | | | | | | | |
274,000 | | 1,354,000 | | 1,628,000 | | | | Aetna, Inc., 1.500%, 11/15/17 | | 266,210 | | 1,315,507 | | 1,581,717 | |
371,000 | | 1,804,000 | | 2,175,000 | | | | Aetna, Inc., 2.750%, 11/15/22 | | 342,173 | | 1,663,829 | | 2,006,002 | |
— | | 1,156,000 | | 1,156,000 | | | | Amgen, Inc., 5.150%, 11/15/41 | | — | | 1,156,799 | | 1,156,799 | |
— | | 1,619,000 | | 1,619,000 | | | | Amgen, Inc., 3.875%, 11/15/21 | | — | | 1,668,430 | | 1,668,430 | |
319,000 | | 1,596,000 | | 1,915,000 | | | | Baxter International, Inc., 4326600.000%, | | 316,665 | | 1,584,316 | | 1,900,981 | |
1,206,000 | | 3,229,000 | | 4,435,000 | | | | Celgene Corp., 3.250%, 08/15/22 | | 1,145,356 | | 3,066,630 | | 4,211,986 | |
407,000 | | 2,150,000 | | 2,557,000 | | | | Express Scripts Holding Co., 2.650%, 02/15/17 | | 414,667 | | 2,190,500 | | 2,605,167 | |
750,000 | | — | | 750,000 | | | | HCA, Inc., 7.500%, 02/15/22 | | 832,500 | | — | | 832,500 | |
668,000 | | — | | 668,000 | | | | Healthsouth Corp., 7.250%, 10/01/18 | | 716,430 | | — | | 716,430 | |
466,000 | | 2,251,000 | | 2,717,000 | | | | Humana, Inc., 3.150%, 12/01/22 | | 433,070 | | 2,091,933 | | 2,525,003 | |
— | | 1,927,000 | | 1,927,000 | | | | Kaiser Foundation Hospitals, 4.875%, 04/01/42 | | — | | 1,923,924 | | 1,923,924 | |
178,000 | | 887,000 | | 1,065,000 | | | | Medtronic, Inc., 2.750%, 04/01/23 | | 166,621 | | 830,296 | | 996,917 | |
523,000 | | 2,644,000 | | 3,167,000 | | | | St Jude Medical, Inc., 4.750%, 04/15/43 | | 487,132 | | 2,462,669 | | 2,949,801 | |
— | | 2,508,000 | | 2,508,000 | | X | | U.S. Oncology Escrow, 9.125%, 12/31/49 | | — | | — | | — | |
750,000 | | 2,890,000 | | 3,640,000 | | # | | Valeant Pharmaceuticals International, 7.250%, 07/15/22 | | 765,000 | | 2,947,800 | | 3,712,800 | |
664,000 | | 3,567,000 | | 4,231,000 | | | | WellPoint, Inc., 4.625%, 05/15/42 | | 618,950 | | 3,324,993 | | 3,943,943 | |
507,000 | | 2,513,000 | | 3,020,000 | | # | | Zoetis, Inc., 1.875%, 02/01/18 | | 496,689 | | 2,461,891 | | 2,958,580 | |
709,000 | | 3,518,000 | | 4,227,000 | | # | | Zoetis, Inc., 3.250%, 02/01/23 | | 674,593 | | 3,347,275 | | 4,021,868 | |
253,000 | | 1,257,000 | | 1,510,000 | | # | | Zoetis, Inc., 4.700%, 02/01/43 | | 237,440 | | 1,179,694 | | 1,417,134 | |
| | | | | | | | | | 7,913,496 | | 33,216,486 | | 41,129,982 | |
| | | | | | | | Industrials: 0.9% | | | | | | | |
376,000 | | 1,864,000 | | 2,240,000 | | # | | Barrick Gold Corp., 2.500%, 05/01/18 | | 337,667 | | 1,673,965 | | 2,011,632 | |
527,000 | | 2,612,000 | | 3,139,000 | | # | | Barrick Gold Corp., 4.100%, 05/01/23 | | 440,885 | | 2,185,186 | | 2,626,071 | |
750,000 | | — | | 750,000 | | | | BE Aerospace, Inc., 6.875%, 10/01/20 | | 813,750 | | — | | 813,750 | |
750,000 | | 675,000 | | 1,425,000 | | | | Case New Holland, Inc., 7.875%, 12/01/17 | | 853,125 | | 767,813 | | 1,620,938 | |
234,000 | | 1,146,000 | | 1,380,000 | | | | Ford Motor Co., 4.750%, 01/15/43 | | 207,212 | | 1,014,808 | | 1,222,020 | |
681,000 | | 3,411,000 | | 4,092,000 | | # | | Ingersoll-Rand Global Holding Co. Ltd., 4.250%, 06/15/23 | | 677,679 | | 3,394,368 | | 4,072,047 | |
916,000 | | 4,501,000 | | 5,417,000 | | | | MDC Holdings, Inc., 6.000%, 01/15/43 | | 854,474 | | 4,198,677 | | 5,053,151 | |
487,000 | | 2,429,000 | | 2,916,000 | | | | Rio Tinto Finance USA PLC, 2.250%, 12/14/18 | | 473,650 | | 2,362,414 | | 2,836,064 | |
429,000 | | 2,106,000 | | 2,535,000 | | # | | Turlock Corp., 2.750%, 11/02/22 | | 401,910 | | 1,973,010 | | 2,374,920 | |
| | | | | | | | | | 5,060,352 | | 17,570,241 | | 22,630,593 | |
12
Bond
Portfolio | | Intermediate
Bond
Portfolio | | Intermediate
Bond
Portfolio
Pro Forma
Combined | | | | | | Bond Portfolio | | Intermediate Bond
Portfolio | | Intermediate Bond
Portfolio
Pro Forma
Combined | |
| | | | | | | | Information Technology: 1.7% | | | | | | | |
274,000 | | 1,363,000 | | 1,637,000 | | | | Apple, Inc., 4504900.000%, | | 254,510 | | 1,266,050 | | 1,520,560 | |
232,000 | | 1,157,000 | | 1,389,000 | | | | Apple, Inc., 5235500.000%, | | 207,189 | | 1,033,265 | | 1,240,454 | |
— | | 3,465,000 | | 3,465,000 | | | | Brocade Communications Systems, Inc., 6.875%, 01/15/20 | | — | | 3,716,213 | | 3,716,213 | |
957,000 | | 2,273,000 | | 3,230,000 | | | | eBay, Inc., 4.000%, 07/15/42 | | 815,778 | | 1,937,580 | | 2,753,358 | |
1,293,000 | | 6,476,000 | | 7,769,000 | | | | EMC Corp./MA, 1.875%, 06/01/18 | | 1,279,129 | | 6,406,525 | | 7,685,654 | |
737,000 | | 3,691,000 | | 4,428,000 | | | | EMC Corp./MA, 3.375%, 06/01/23 | | 724,436 | | 3,628,076 | | 4,352,512 | |
955,000 | | 4,824,000 | | 5,779,000 | | | | Fidelity National Information Services, Inc., 3.500%, 04/15/23 | | 863,752 | | 4,363,076 | | 5,226,828 | |
1,725,000 | | 1,474,000 | | 3,199,000 | | | | Hewlett-Packard Co., 2.600%, 09/15/17 | | 1,723,875 | | 1,473,039 | | 3,196,914 | |
— | | 1,998,000 | | 1,998,000 | | | | Hewlett-Packard Co., 5.400%, 03/01/17 | | — | | 2,179,239 | | 2,179,239 | |
— | | 4,858,000 | | 4,858,000 | | | | Hewlett-Packard Co., 3.000%, 09/15/16 | | — | | 4,991,833 | | 4,991,833 | |
— | | 2,304,000 | | 2,304,000 | | | | Jabil Circuit, Inc., 7.750%, 07/15/16 | | — | | 2,620,800 | | 2,620,800 | |
258,000 | | 1,283,000 | | 1,541,000 | | | | Motorola Solutions, Inc., 3.750%, 05/15/22 | | 251,134 | | 1,248,858 | | 1,499,992 | |
— | | 352,000 | | 352,000 | | | | Seagate Technology HDD Holdings, 6.800%, 10/01/16 | | — | | 391,600 | | 391,600 | |
| | | | | | | | | | 6,119,803 | | 35,256,154 | | 41,375,957 | |
| | | | | | | | | | | | | | | |
| | | | | | | | Materials: 1.3% | | | | | | | |
968,000 | | 4,885,000 | | 5,853,000 | | # | | Anglo American Capital PLC, 2.625%, 09/27/17 | | 944,377 | | 4,765,787 | | 5,710,164 | |
100,000 | | — | | 100,000 | | | | AngloGold Ashanti Holdings PLC, 5.125%, 08/01/22 | | 88,533 | | — | | 88,533 | |
300,000 | | — | | 300,000 | | # | | Ashland, Inc., 4.750%, 08/15/22 | | 297,750 | | — | | 297,750 | |
938,000 | | 3,196,000 | | 4,134,000 | | | | Cabot Corp., 3.700%, 07/15/22 | | 908,476 | | 3,095,406 | | 4,003,882 | |
649,000 | | 3,243,000 | | 3,892,000 | | # | | Freeport-McMoRan Copper & Gold, Inc., 2.375%, 03/15/18 | | 617,701 | | 3,086,600 | | 3,704,301 | |
598,000 | | 2,984,000 | | 3,582,000 | | # | | Freeport-McMoRan Copper & Gold, Inc., 3.875%, 03/15/23 | | 541,995 | | 2,704,536 | | 3,246,531 | |
488,000 | | 2,443,000 | | 2,931,000 | | # | | Georgia-Pacific LLC, 3.734%, 07/15/23 | | 475,343 | | 2,379,638 | | 2,854,981 | |
450,000 | | 2,265,000 | | 2,715,000 | | | | Goldcorp, Inc., 3.700%, 03/15/23 | | 399,042 | | 2,008,509 | | 2,407,551 | |
300,000 | | 1,470,000 | | 1,770,000 | | | | Rio Tinto Finance USA PLC, 1.625%, 08/21/17 | | 294,431 | | 1,442,712 | | 1,737,143 | |
750,000 | | 1,445,000 | | 2,195,000 | | # | | Sealed Air Corp., 8.375%, 09/15/21 | | 851,250 | | 1,640,075 | | 2,491,325 | |
815,000 | | 4,055,000 | | 4,870,000 | | # | | Xstrata Finance Canada Ltd., 4.250%, 10/25/22 | | 740,906 | | 3,686,348 | | 4,427,254 | |
289,000 | | 1,444,000 | | 1,733,000 | | # | | Xstrata Finance Canada Ltd., 4.950%, 11/15/21 | | 280,117 | | 1,399,616 | | 1,679,733 | |
| | | | | | | | | | 6,439,921 | | 26,209,227 | | 32,649,148 | |
| | | | | | | | | | | | | | | |
| | | | | | | | Telecommunication Services: 0.9% | | | | | | | |
399,000 | | 1,993,000 | | 2,392,000 | | | | AT&T, Inc., 5.350%, 09/01/40 | | 405,586 | | 2,025,898 | | 2,431,484 | |
413,000 | | 2,002,000 | | 2,415,000 | | | | CC Holdings GS V LLC / Crown Castle GS III Corp., 2.381%, 12/15/17 | | 406,723 | | 1,971,574 | | 2,378,297 | |
750,000 | | 1,375,000 | | 2,125,000 | | | | Intelsat Jackson Holdings SA, 7.500%, 04/01/21 | | 791,250 | | 1,450,625 | | 2,241,875 | |
13
Bond
Portfolio | | Intermediate
Bond
Portfolio | | Intermediate
Bond
Portfolio
Pro Forma
Combined | | | | | | Bond Portfolio | | Intermediate Bond
Portfolio | | Intermediate Bond
Portfolio
Pro Forma
Combined | |
— | | 1,300,000 | | 1,300,000 | | | | Intelsat Jackson Holdings SA, 7.250%, 10/15/20 | | — | | 1,371,500 | | 1,371,500 | |
275,000 | | 1,377,000 | | 1,652,000 | | | | Motorola Solutions, Inc., 3.500%, 03/01/23 | | 259,607 | | 1,299,921 | | 1,559,528 | |
— | | 2,350,000 | | 2,350,000 | | # | | Sable International Finance Ltd., 8.750%, 02/01/20 | | — | | 2,596,750 | | 2,596,750 | |
225,000 | | 1,200,000 | | 1,425,000 | | | | Telefonica Emisiones SAU, 4321700.000%, | | 218,097 | | 1,163,184 | | 1,381,281 | |
— | | 2,907,000 | | 2,907,000 | | | | Telefonica Emisiones SAU, 3.992%, 02/16/16 | | — | | 3,004,870 | | 3,004,870 | |
223,000 | | 1,124,000 | | 1,347,000 | | | | Vodafone Group PLC, 4497600.000%, | | 206,453 | | 1,040,596 | | 1,247,049 | |
751,000 | | 3,749,000 | | 4,500,000 | | | | Vodafone Group PLC, 4.375%, 02/19/43 | | 676,154 | | 3,375,367 | | 4,051,521 | |
750,000 | | — | | 750,000 | | | | Windstream Corp., 7.750%, 10/15/20 | | 780,000 | | — | | 780,000 | |
| | | | | | | | | | 3,743,870 | | 19,300,285 | | 23,044,155 | |
| | | | | | | | | | | | | | | |
| | | | | | | | Utilities: 2.0% | | | | | | | |
— | | 2,770,000 | | 2,770,000 | | | | AES Corp., 8.000%, 10/15/17 | | — | | 3,130,100 | | 3,130,100 | |
— | | 2,816,000 | | 2,816,000 | | | | Ameren Corp., 8.875%, 05/15/14 | | — | | 3,002,200 | | 3,002,200 | |
309,000 | | 1,500,000 | | 1,809,000 | | | | American Electric Power Co., Inc., 1.650%, 12/15/17 | | 300,601 | | 1,459,225 | | 1,759,826 | |
244,000 | | 1,184,000 | | 1,428,000 | | | | CenterPoint Energy Houston Electric LLC, 3.550%, 08/01/42 | | 211,057 | | 1,024,147 | | 1,235,204 | |
640,000 | | 3,230,000 | | 3,870,000 | | | | Duke Energy Corp., 4326600.000%, | | 636,534 | | 3,212,510 | | 3,849,044 | |
— | | 2,192,000 | | 2,192,000 | | # | | Duquesne Light Holdings, Inc., 6.400%, 09/15/20 | | — | | 2,553,807 | | 2,553,807 | |
— | | 1,992,000 | | 1,992,000 | | # | | Duquesne Light Holdings, Inc., 5.900%, 12/01/21 | | — | | 2,243,221 | | 2,243,221 | |
401,000 | | 2,003,000 | | 2,404,000 | | | | FirstEnergy Corp., 2.750%, 03/15/18 | | 390,673 | | 1,951,415 | | 2,342,088 | |
598,000 | | 1,765,000 | | 2,363,000 | | | | FirstEnergy Corp., 4.250%, 03/15/23 | | 556,370 | | 1,642,129 | | 2,198,499 | |
— | | 1,394,000 | | 1,394,000 | | # | | Iberdrola Finance Ireland Ltd., 3.800%, 09/11/14 | | — | | 1,430,321 | | 1,430,321 | |
— | | 170,133 | | 170,133 | | # | | Juniper Generation, LLC, 6.790%, 12/31/14 | | — | | 161,812 | | 161,812 | |
141,000 | | 2,379,000 | | 2,520,000 | | | | Metropolitan Edison, 7.700%, 01/15/19 | | 172,973 | | 2,918,457 | | 3,091,430 | |
— | | 2,398,000 | | 2,398,000 | | | | Nevada Power Co., 7.125%, 03/15/19 | | — | | 2,972,731 | | 2,972,731 | |
446,000 | | 2,236,000 | | 2,682,000 | | | | NextEra Energy Capital Holdings, Inc., 3.625%, 06/15/23 | | 430,210 | | 2,156,839 | | 2,587,049 | |
380,000 | | — | | 380,000 | | | | Nisource Finance Corp., 6.125%, 03/01/22 | | 429,369 | | — | | 429,369 | |
— | | 1,698,000 | | 1,698,000 | | | | Nisource Finance Corp., 5.950%, 06/15/41 | | — | | 1,791,869 | | 1,791,869 | |
— | | 1,820,000 | | 1,820,000 | | | | Oncor Electric Delivery Co. LLC, 6.800%, 09/01/18 | | — | | 2,200,970 | | 2,200,970 | |
— | | 43,000 | | 43,000 | | | | Oncor Electric Delivery Co. LLC, 4.100%, 06/01/22 | | — | | 44,424 | | 44,424 | |
1,000,000 | | — | | 1,000,000 | | | | Oncor Electric Delivery Co., LLC, 5.300%, 06/01/42 | | 1,065,488 | | — | | 1,065,488 | |
897,000 | | 4,471,000 | | 5,368,000 | | | | Petrobras Global Finance BV, 4.375%, 05/20/23 | | 831,347 | | 4,143,759 | | 4,975,106 | |
447,000 | | 2,237,000 | | 2,684,000 | | | | PPL Capital Funding, Inc., 3.400%, 06/01/23 | | 424,137 | | 2,122,582 | | 2,546,719 | |
— | | 2,328,000 | | 2,328,000 | | | | Southwestern Electric Power, 5.550%, 01/15/17 | | — | | 2,575,317 | | 2,575,317 | |
407,000 | | 2,013,000 | | 2,420,000 | | | | TransAlta Corp., 4.500%, 11/15/22 | | 388,659 | | 1,922,286 | | 2,310,945 | |
| | | | | | | | | | 5,837,418 | | 44,660,121 | | 50,497,539 | |
| | | | | | | | | | | | | | | |
| | | | | | | | Total Corporate Bonds/Notes (Cost $637,565,758) | | 104,910,702 | | 523,254,164 | | 628,164,866 | |
14
Bond
Portfolio | | Intermediate
Bond
Portfolio | | Intermediate
Bond
Portfolio
Pro Forma
Combined | | | | | | Bond Portfolio | | Intermediate Bond
Portfolio | | Intermediate Bond
Portfolio
Pro Forma
Combined | |
| | | | COLLATERALIZED MORTGAGE OBLIGATIONS: 17.3% | | | | | | | |
| | | | | | | | Collateralized Mortgage Obligations: 17.3% | | | | | | | |
— | | 3,315,000 | | 3,315,000 | | # | | American General Mortgage Loan Trust, 5.650%, 03/25/58 | | — | | 3,487,237 | | 3,487,237 | |
— | | 2,700,000 | | 2,700,000 | | # | | Arkle Master Issuer PLC, 1.974%, 05/17/60 | | — | | 2,764,201 | | 2,764,201 | |
1,047,850 | | 5,133,654 | | 6,181,504 | | | | Banc of America Alternative Loan Trust 2007-2, 6.000%, 06/25/37 | | 800,137 | | 3,920,050 | | 4,720,187 | |
913,261 | | — | | 913,261 | | | | Banc of America Funding Corp., 6.000%, 08/25/37 | | 810,897 | | — | | 810,897 | |
— | | 503,088 | | 503,088 | | | | Banc of America Funding Corp., 5.750%, 11/25/35 | | — | | 498,833 | | 498,833 | |
1,121,757 | | 2,186,152 | | 3,307,909 | | # | | Banc of America Large Loan, Inc., 1.593%, 06/15/18 | | 1,121,757 | | 2,186,152 | | 3,307,909 | |
370,000 | | 1,849,000 | | 2,219,000 | | # | | Banc of America Merrill Lynch Commercial Mortgage, Inc., 5.361%, 03/11/41 | | 367,363 | | 1,835,824 | | 2,203,187 | |
— | | 2,550,000 | | 2,550,000 | | | | Banc of America Merrill Lynch Commercial Mortgage, Inc., 5.185%, 09/10/47 | | — | | 2,677,167 | | 2,677,167 | |
— | | 3,130,000 | | 3,130,000 | | | | Banc of America Merrill Lynch Commercial Mortgage, Inc., 5.185%, 09/10/47 | | — | | 3,208,951 | | 3,208,951 | |
— | | 346,624 | | 346,624 | | # | | Banc of America Merrill Lynch Commercial Mortgage, Inc., 6.850%, 11/15/31 | | — | | 347,927 | | 347,927 | |
— | | 1,520,000 | | 1,520,000 | | # | | Banc of America Merrill Lynch Commercial Mortgage, Inc., 5.361%, 03/11/41 | | — | | 1,551,481 | | 1,551,481 | |
— | | 1,590,000 | | 1,590,000 | | # | | Banc of America Merrill Lynch Commercial Mortgage, Inc., 5.337%, 07/10/43 | | — | | 1,656,146 | | 1,656,146 | |
644,275 | | — | | 644,275 | | | | Banc of America Mortgage Securities, Inc., 5.500%, 09/25/35 | | 639,655 | | — | | 639,655 | |
— | | 8,627,117 | | 8,627,117 | | | | BCAP LLC Trust 2007-AA2, 0.403%, 05/25/47 | | — | | 5,528,494 | | 5,528,494 | |
— | | 668,218 | | 668,218 | | | | Bear Stearns Alternative-A Trust, 0.833%, 07/25/34 | | — | | 637,593 | | 637,593 | |
718,098 | | 3,600,296 | | 4,318,394 | | | | Bear Stearns ARM Trust 2006-2, 2.726%, 07/25/36 | | 571,551 | | 2,865,564 | | 3,437,115 | |
460,000 | | 2,340,000 | | 2,800,000 | | # | | Bear Stearns Commercial Mortgage Securities, 5.766%, 04/12/38 | | 490,522 | | 2,495,264 | | 2,985,786 | |
— | | 1,080,000 | | 1,080,000 | | # | | Bear Stearns Commercial Mortgage Securities, 5.640%, 02/14/31 | | — | | 1,092,897 | | 1,092,897 | |
— | | 1,747,151 | | 1,747,151 | | | | Bear Stearns Commercial Mortgage Securities, 6.500%, 02/15/32 | | — | | 1,693,609 | | 1,693,609 | |
830,000 | | 4,170,000 | | 5,000,000 | | # | | Bear Stearns Commercial Mortgage Securities Trust 2004-PWR4, 5.815%, 06/11/41 | | 837,538 | | 4,207,872 | | 5,045,410 | |
510,000 | | 2,550,000 | | 3,060,000 | | | | CD 2007-CD5 Mortgage Trust, 6.323%, 11/15/44 | | 517,512 | | 2,587,551 | | 3,105,063 | |
— | | 3,258,533 | | 3,258,533 | | | | Chase Mortgage Finance Corp., 6.000%, 05/25/37 | | — | | 2,801,675 | | 2,801,675 | |
1,670,000 | | — | | 1,670,000 | | # | | Citigroup Commercial Mortgage Trust, 5.615%, 04/15/40 | | 1,704,131 | | — | | 1,704,131 | |
— | | 14,498,190 | | 14,498,190 | | # | | Citigroup Commercial Mortgage Trust, 2.415%, 09/10/45 | | — | | 1,785,600 | | 1,785,600 | |
15
Bond
Portfolio | | Intermediate
Bond
Portfolio | | Intermediate
Bond
Portfolio
Pro Forma
Combined | | | | | | Bond Portfolio | | Intermediate Bond
Portfolio | | Intermediate Bond
Portfolio
Pro Forma
Combined | |
454,000 | | 900,000 | | 1,354,000 | | # | | Citigroup Commercial Mortgage Trust 2004-C1, 5.615%, 04/15/40 | | 459,139 | | 910,187 | | 1,369,326 | |
1,118,000 | | 5,501,894 | | 6,619,894 | | # | | Citigroup Mortgage Loan Trust 2010-7, 6.583%, 12/25/35 | | 1,097,110 | | 5,399,092 | | 6,496,202 | |
779,116 | | 3,904,432 | | 4,683,548 | | | | Citigroup Mortgage Loan Trust, Inc., 3.027%, 09/25/37 | | 621,816 | | 3,116,148 | | 3,737,964 | |
961,457 | | — | | 961,457 | | | | Citimortgage Alternative Loan Trust, 6.000%, 02/25/37 | | 793,959 | | — | | 793,959 | |
1,571,856 | | 4,224,562 | | 5,796,418 | | | | Citimortgage Alternative Loan Trust, 6.000%, 06/25/37 | | 1,317,999 | | 3,542,289 | | 4,860,288 | |
3,451,060 | | 17,060,371 | | 20,511,431 | | ^ | | COMM 2013-LC6 Mortgage Trust, 1.955%, 01/10/46 | | 354,249 | | 1,751,233 | | 2,105,482 | |
14,576,488 | | 21,652,835 | | 36,229,323 | | ^ | | Commercial Mortgage Pass Through Certificates, 2.425%, 05/15/45 | | 1,873,586 | | 2,783,143 | | 4,656,729 | |
4,546,104 | | 9,319,514 | | 13,865,618 | | ^ | | Commercial Mortgage Pass Through Certificates, 2.120%, 08/15/45 | | 532,500 | | 1,091,625 | | 1,624,125 | |
10,860,000 | | 54,306,000 | | 65,166,000 | | #,^ | | Commercial Mortgage Pass Through Certificates, 0.752%, 10/15/45 | | 538,971 | | 2,695,152 | | 3,234,123 | |
3,146,386 | | 15,239,627 | | 18,386,013 | | ^ | | Commercial Mortgage Pass Through Certificates, 2.086%, 12/10/45 | | 356,600 | | 1,727,207 | | 2,083,807 | |
— | | 66,920 | | 66,920 | | | | Commercial Mortgage Pass Through Certificates, 5.800%, 12/10/49 | | — | | 66,809 | | 66,809 | |
914,772 | | 4,533,385 | | 5,448,157 | | | | Countrywide Alternative Loan Trust, 5.500%, 12/25/35 | | 835,404 | | 4,140,055 | | 4,975,459 | |
4,420,550 | | 5,774,623 | | 10,195,173 | | | | Countrywide Alternative Loan Trust, 0.313%, 06/25/36 | | 3,039,371 | | 3,970,371 | | 7,009,742 | |
— | | 4,475,968 | | 4,475,968 | | | | Countrywide Home Loan Mortgage Pass-Through Trust, 5.750%, 06/25/37 | | — | | 4,072,685 | | 4,072,685 | |
— | | 1,738,081 | | 1,738,081 | | | | Countrywide Home Loan Mortgage Pass-Through Trust, 0.513%, 04/25/35 | | — | | 363,005 | | 363,005 | |
294,324 | | 882,972 | | 1,177,296 | | | | Credit Suisse First Boston Mortgage Securities Corp., 7.525%, 08/15/36 | | 294,615 | | 883,844 | | 1,178,459 | |
100,000 | | 2,010,000 | | 2,110,000 | | | | Credit Suisse First Boston Mortgage Securities Corp., 5.343%, 12/15/39 | | 106,161 | | 2,133,831 | | 2,239,992 | |
460,000 | | 1,610,000 | | 2,070,000 | | # | | Credit Suisse First Boston Mortgage Securities Corp., 5.763%, 04/12/49 | | 469,300 | | 1,642,549 | | 2,111,849 | |
— | | 8,866,411 | | 8,866,411 | | | | Deutsche ALT-A Securities, Inc. Alternate Loan Trust, 0.383%, 10/25/36 | | — | | 4,672,886 | | 4,672,886 | |
— | | 6,579,533 | | 6,579,533 | | | | Deutsche ALT-A Securities, Inc. Alternate Loan Trust, 0.313%, 08/25/36 | | — | | 4,283,519 | | 4,283,519 | |
1,666,381 | | — | | 1,666,381 | | | | First Horizon Alternative Mortgage Securities, 6.000%, 05/25/36 | | 1,437,317 | | — | | 1,437,317 | |
777,458 | | 3,827,484 | | 4,604,942 | | | | First Horizon Alternative Mortgage Securities, 0.493%, 12/25/36 | | 470,498 | | 2,316,296 | | 2,786,794 | |
777,458 | | 3,827,484 | | 4,604,942 | | ^ | | First Horizon Alternative Mortgage Securities, 6.507%, 12/25/36 | | 170,548 | | 839,620 | | 1,010,168 | |
1,055,866 | | 5,201,802 | | 6,257,668 | | | | First Horizon Alternative Mortgage Securities, 6.250%, 02/25/37 | | 938,135 | | 4,621,791 | | 5,559,926 | |
— | | 2,653,589 | | 2,653,589 | | | | First Horizon Alternative Mortgage Securities, 6.000%, 02/25/37 | | — | | 2,286,745 | | 2,286,745 | |
— | | 1,223,651 | | 1,223,651 | | | | First Horizon Alternative Mortgage Securities, 6.000%, 08/25/36 | | — | | 1,032,311 | | 1,032,311 | |
16
Bond
Portfolio | | Intermediate
Bond
Portfolio | | Intermediate
Bond
Portfolio
Pro Forma
Combined | | | | | | Bond Portfolio | | Intermediate Bond
Portfolio | | Intermediate Bond
Portfolio
Pro Forma
Combined | |
— | | 3,736,379 | | 3,736,379 | | | | First Horizon Alternative Mortgage Securities Trust 2006-FA8, 6.000%, 02/25/37 | | — | | 3,219,845 | | 3,219,845 | |
770,000 | | 3,780,000 | | 4,550,000 | | # | | First Union National Bank Com Mort Pas Thr Cert Ser 2001 C4, 6.000%, 12/12/33 | | 774,627 | | 3,802,712 | | 4,577,339 | |
642,727 | | — | | 642,727 | | # | | Fosse Master Issuer PLC, 1.677%, 10/18/54 | | 649,306 | | — | | 649,306 | |
— | | 4,500,000 | | 4,500,000 | | # | | Fosse Master PLC, 1.677%, 10/18/54 | | — | | 4,580,325 | | 4,580,325 | |
— | | 4,862,116 | | 4,862,116 | | | | Freddie Mac, 5.000%, 02/15/35 | | — | | 5,255,969 | | 5,255,969 | |
— | | 6,738,027 | | 6,738,027 | | | | Freddie Mac, 5.500%, 07/15/37 | | — | | 7,327,344 | | 7,327,344 | |
2,000,000 | | 5,840,000 | | 7,840,000 | | # | | GE Capital Commercial Mortgage Corp., 5.496%, 11/10/38 | | 2,064,393 | | 6,028,028 | | 8,092,421 | |
700,000 | | 3,500,000 | | 4,200,000 | | # | | GMAC Commercial Mortgage Securities, Inc. Series 2003-C3 Trust, 5.748%, 04/10/40 | | 705,488 | | 3,527,438 | | 4,232,926 | |
— | | 1,358,638 | | 1,358,638 | | # | | Gracechurch Mortgage Financing PLC, 1.824%, 11/20/56 | | — | | 1,382,431 | | 1,382,431 | |
2,000,000 | | — | | 2,000,000 | | # | | Greenwich Capital Commercial Funding Corp., 5.567%, 01/05/36 | | 2,031,339 | | — | | 2,031,339 | |
350,000 | | 1,720,000 | | 2,070,000 | | # | | Greenwich Capital Commercial Funding Corp., 5.756%, 01/05/36 | | 353,148 | | 1,735,471 | | 2,088,619 | |
301,000 | | 1,504,000 | | 1,805,000 | | | | GS Mort Sec Corp. II Commercial Mort Ps Thr Cert Ser 2004-GG2, 5.830%, 08/10/38 | | 295,654 | | 1,477,288 | | 1,772,942 | |
3,010,988 | | 14,398,608 | | 17,409,596 | | #,^ | | GS Mortgage Securities Corp. II, 1.907%, 08/10/44 | | 234,565 | | 1,121,693 | | 1,356,258 | |
3,514,198 | | 17,021,030 | | 20,535,228 | | ^ | | GS Mortgage Securities Corp. II, 2.563%, 11/10/45 | | 495,513 | | 2,400,018 | | 2,895,531 | |
490,000 | | 2,450,000 | | 2,940,000 | | # | | GS Mortgage Securities Trust 2011-GC3, 5.728%, 03/10/44 | | 469,466 | | 2,347,328 | | 2,816,794 | |
1,257,167 | | — | | 1,257,167 | | | | GSR Mortgage Loan Trust, 5.500%, 05/25/36 | | 1,146,585 | | — | | 1,146,585 | |
1,151,937 | | — | | 1,151,937 | | | | GSR Mortgage Loan Trust, 6.250%, 08/25/36 | | 984,186 | | — | | 984,186 | |
462,422 | | 424,454 | | 886,876 | | | | GSR Mortgage Loan Trust, 6.000%, 01/25/37 | | 424,900 | | 390,013 | | 814,913 | |
— | | 3,500,000 | | 3,500,000 | | # | | Holmes Master Issuer PLC, 1.827%, 10/21/54 | | — | | 3,548,815 | | 3,548,815 | |
— | | 476,818 | | 476,818 | | | | Homebanc Mortgage Trust, 1.053%, 08/25/29 | | — | | 434,339 | | 434,339 | |
362,972 | | 1,743,845 | | 2,106,817 | | | | JP Morgan Alternative Loan Trust, 5.500%, 12/25/35 | | 301,457 | | 1,448,305 | | 1,749,762 | |
— | | 3,020,000 | | 3,020,000 | | # | | JP Morgan Chase Com Mort Sec Corp. Ps Thr Certs Ser 2003-LN1, 5.725%, 10/15/37 | | — | | 2,784,200 | | 2,784,200 | |
1,060,000 | | — | | 1,060,000 | | | | JP Morgan Chase Commercial Mortgage Securities Corp., 5.836%, 06/12/41 | | 1,091,107 | | — | | 1,091,107 | |
100,408 | | — | | 100,408 | | | | JP Morgan Chase Commercial Mortgage Securities Corp., 4.903%, 10/15/42 | | 101,837 | | — | | 101,837 | |
10,963,817 | | 21,299,707 | | 32,263,524 | | ^ | | JP Morgan Chase Commercial Mortgage Securities Corp., 2.100%, 12/15/47 | | 1,228,098 | | 2,385,859 | | 3,613,957 | |
4,700,000 | | 15,180,000 | | 19,880,000 | | #,^ | | JP Morgan Chase Commercial Mortgage Securities Corp., 0.447%, 12/15/47 | | 133,920 | | 432,533 | | 566,453 | |
2,000,000 | | 9,970,000 | | 11,970,000 | | # | | JP Morgan Chase Commercial Mortgage Securities Corp., 0.974%, 04/15/30 | | 1,997,224 | | 9,956,162 | | 11,953,386 | |
540,000 | | 2,671,000 | | 3,211,000 | | # | | JP Morgan Commercial Mort Pass Thr Certs Ser 2004-C1, 6.015%, 01/15/38 | | 547,702 | | 2,709,098 | | 3,256,800 | |
1,540,110 | | 3,385,608 | | 4,925,718 | | | | JP Morgan Mortgage Trust, 6.500%, 08/25/36 | | 1,381,107 | | 3,036,072 | | 4,417,179 | |
17
Bond
Portfolio | | Intermediate
Bond
Portfolio | | Intermediate
Bond
Portfolio
Pro Forma
Combined | | | | | | Bond Portfolio | | Intermediate Bond
Portfolio | | Intermediate Bond
Portfolio
Pro Forma
Combined | |
1,366,384 | | 2,220,280 | | 3,586,664 | | | | JP Morgan Mortgage Trust 2006-S4, 6.000%, 01/25/37 | | 1,148,737 | | 1,866,618 | | 3,015,355 | |
456,776 | | 2,992,794 | | 3,449,570 | | | | JP Morgan Mortgage Trust 2007-S2, 6.750%, 06/25/37 | | 394,093 | | 2,582,099 | | 2,976,192 | |
— | | 532,416 | | 532,416 | | # | | JPMorgan Chase Commerical Mortgage Securities Corp., 6.135%, 07/12/37 | | — | | 533,160 | | 533,160 | |
— | | 361,140 | | 361,140 | | | | JPMorgan Chase Commerical Mortgage Securities Corp., 5.198%, 12/15/44 | | — | | 362,830 | | 362,830 | |
2,500,000 | | 500,000 | | 3,000,000 | | # | | Lanark Master Issuer PLC, 1.673%, 12/22/54 | | 2,552,215 | | 510,443 | | 3,062,658 | |
190,000 | | 880,000 | | 1,070,000 | | | | LB Commercial Conduit Mortgage Trust, 6.081%, 07/15/44 | | 210,671 | | 975,738 | | 1,186,409 | |
— | | 2,800,000 | | 2,800,000 | | # | | LB Commercial Mortgage Trust 2007-C3, 6.081%, 07/15/44 | | — | | 3,113,775 | | 3,113,775 | |
840,000 | | 4,040,000 | | 4,880,000 | | # | | LB-UBS Commercial Mortgage Trust, 6.890%, 07/15/32 | | 791,670 | | 3,807,555 | | 4,599,225 | |
1,500,000 | | — | | 1,500,000 | | # | | LB-UBS Commercial Mortgage Trust, 5.560%, 10/15/36 | | 1,419,918 | | — | | 1,419,918 | |
1,270,000 | | 2,120,000 | | 3,390,000 | | # | | LB-UBS Commercial Mortgage Trust, 5.713%, 10/15/36 | | 993,166 | | 1,657,884 | | 2,651,050 | |
460,000 | | 2,290,000 | | 2,750,000 | | | | LB-UBS Commercial Mortgage Trust, 5.350%, 11/15/40 | | 456,594 | | 2,273,045 | | 2,729,639 | |
29,984,657 | | 150,805,867 | | 180,790,524 | | #,^ | | LB-UBS Commercial Mortgage Trust, 0.847%, 11/15/38 | | 598,527 | | 3,010,251 | | 3,608,778 | |
— | | 4,450,000 | | 4,450,000 | | # | | LB-UBS Commercial Mortgage Trust, 6.089%, 09/15/39 | | — | | 4,459,723 | | 4,459,723 | |
— | | 4,210,000 | | 4,210,000 | | # | | LB-UBS Commercial Mortgage Trust, 6.089%, 09/15/39 | | — | | 4,140,261 | | 4,140,261 | |
— | | 35,405,585 | | 35,405,585 | | #,^ | | LB-UBS Commercial Mortgage Trust, 0.337%, 11/15/38 | | — | | 596,177 | | 596,177 | |
— | | 4,110,000 | | 4,110,000 | | | | LB-UBS Commercial Mortgage Trust, 4.983%, 07/15/40 | | — | | 4,048,595 | | 4,048,595 | |
— | | 2,000,000 | | 2,000,000 | | # | | LB-UBS Commercial Mortgage Trust, 5.413%, 10/15/36 | | — | | 2,034,387 | | 2,034,387 | |
— | | 1,310,000 | | 1,310,000 | | # | | LB-UBS Commercial Mortgage Trust, 5.413%, 02/15/40 | | — | | 1,183,142 | | 1,183,142 | |
— | | 50,090 | | 50,090 | | | | LB-UBS Commercial Mortgage Trust, 5.084%, 02/15/31 | | — | | 50,128 | | 50,128 | |
— | | 2,920,000 | | 2,920,000 | | | | LB-UBS Commercial Mortgage Trust, 6.081%, 06/15/38 | | — | | 2,919,955 | | 2,919,955 | |
— | | 1,710,000 | | 1,710,000 | | | | LB-UBS Commercial Mortgage Trust 2000-C4, 8.150%, 07/15/32 | | — | | 1,802,386 | | 1,802,386 | |
7,123,578 | | 36,097,153 | | 43,220,731 | | #,^ | | LB-UBS Commercial Mortgage Trust 2004-C1, 1.000%, 01/15/36 | | 210,858 | | 1,068,476 | | 1,279,334 | |
310,000 | | 1,510,000 | | 1,820,000 | | | | LB-UBS Commercial Mortgage Trust 2005-C3, 4.954%, 07/15/40 | | 307,553 | | 1,498,079 | | 1,805,632 | |
450,000 | | 2,175,000 | | 2,625,000 | | | | LB-UBS Commercial Mortgage Trust 2006-C4, 6.081%, 06/15/38 | | 418,899 | | 2,024,678 | | 2,443,577 | |
1,820,000 | | 3,255,000 | | 5,075,000 | | | | Merrill Lynch Mortgage Investors, Inc., 6.750%, 11/15/26 | | 1,868,712 | | 3,342,120 | | 5,210,832 | |
— | | 919,794 | | 919,794 | | | | Merrill Lynch Mortgage Investors, Inc., 6.250%, 12/10/29 | | — | | 917,579 | | 917,579 | |
4,509,424 | | 27,800,206 | | 32,309,630 | | #,^ | | Morgan Stanley Bank of America Merrill Lynch Trust, 2.081%, 08/15/45 | | 466,390 | | 2,875,250 | | 3,341,640 | |
2,727,127 | | 13,561,898 | | 16,289,025 | | #,^ | | Morgan Stanley Bank of America Merrill Lynch Trust, 2.339%, 11/15/45 | | 317,837 | | 1,580,592 | | 1,898,429 | |
4,589,179 | | 22,776,660 | | 27,365,839 | | ^ | | Morgan Stanley Bank of America Merrill Lynch Trust, 1.662%, 12/15/48 | | 353,370 | | 1,753,821 | | 2,107,191 | |
510,000 | | 2,540,000 | | 3,050,000 | | | | Morgan Stanley Capital I, 5.073%, 08/13/42 | | 535,293 | | 2,665,969 | | 3,201,262 | |
530,000 | | 2,575,000 | | 3,105,000 | | # | | Morgan Stanley Capital I, 5.420%, 09/15/47 | | 512,419 | | 2,489,582 | | 3,002,001 | |
18
Bond
Portfolio | | Intermediate
Bond
Portfolio | | Intermediate
Bond
Portfolio
Pro Forma
Combined | | | | | | Bond Portfolio | | Intermediate Bond
Portfolio | | Intermediate Bond
Portfolio
Pro Forma
Combined | |
510,000 | | 2,585,000 | | 3,095,000 | | # | | Morgan Stanley Capital I, 5.420%, 09/15/47 | | 481,163 | | 2,438,839 | | 2,920,002 | |
— | | 3,428,000 | | 3,428,000 | | | | Morgan Stanley Capital I, 5.302%, 01/14/42 | | — | | 3,583,120 | | 3,583,120 | |
— | | 3,330,000 | | 3,330,000 | | | | Morgan Stanley Capital I, 5.336%, 01/14/42 | | — | | 3,471,755 | | 3,471,755 | |
— | | 2,690,000 | | 2,690,000 | | | | Morgan Stanley Capital I, 5.202%, 08/13/42 | | — | | 2,662,683 | | 2,662,683 | |
— | | 375,972 | | 375,972 | | # | | Morgan Stanley Capital I, 7.350%, 07/15/32 | | — | | 396,451 | | 396,451 | |
— | | 2,670,000 | | 2,670,000 | | | | Morgan Stanley Capital I, 5.300%, 06/15/40 | | — | | 2,752,094 | | 2,752,094 | |
990,000 | | 4,930,000 | | 5,920,000 | | # | | Morgan Stanley Capital I Trust 2004-HQ3, 6.082%, 01/13/41 | | 1,005,844 | | 5,008,897 | | 6,014,741 | |
160,000 | | 800,000 | | 960,000 | | # | | Morgan Stanley Capital I Trust 2004-HQ3, 5.079%, 01/13/41 | | 159,961 | | 799,806 | | 959,767 | |
170,000 | | 846,250 | | 1,016,250 | | # | | Morgan Stanley Capital I Trust 2004-HQ3, 5.079%, 01/13/41 | | 164,570 | | 819,221 | | 983,791 | |
— | | 2,450,000 | | 2,450,000 | | | | Morgan Stanley Capital I Trust 2004-HQ4, 5.150%, 04/14/40 | | — | | 2,444,790 | | 2,444,790 | |
— | | 4,110,000 | | 4,110,000 | | | | Morgan Stanley Capital I Trust 2005-HQ6, 5.271%, 07/13/15 | | — | | 3,693,585 | | 3,693,585 | |
600,000 | | 3,240,000 | | 3,840,000 | | # | | Morgan Stanley Capital I Trust 2008-TOP29, 6.459%, 01/11/43 | | 602,808 | | 3,255,162 | | 3,857,970 | |
— | | 718,400 | | 718,400 | | # | | Morgan Stanley Capital I, Inc., 5.910%, 11/15/31 | | — | | 733,332 | | 733,332 | |
— | | 1,954,000 | | 1,954,000 | | | | Morgan Stanley Capital I, Inc., 5.539%, 06/15/38 | | — | | 2,000,727 | | 2,000,727 | |
— | | 1,160,000 | | 1,160,000 | | # | | Morgan Stanley Dean Witter Capital I, 7.644%, 07/15/33 | | — | | 1,152,617 | | 1,152,617 | |
698,000 | | 3,490,000 | | 4,188,000 | | # | | Morgan Stanley Dean Witter Capital I Trust 2002-IQ3, 5.980%, 09/15/37 | | 738,801 | | 3,694,004 | | 4,432,805 | |
2,037,147 | | — | | 2,037,147 | | | | Morgan Stanley Mortgage Loan Trust 2005-7, 5.500%, 11/25/35 | | 1,730,866 | | — | | 1,730,866 | |
580,000 | | — | | 580,000 | | # | | Morgan Stanley Reremic Trust, 5.391%, 12/17/43 | | 586,812 | | — | | 586,812 | |
580,000 | | 2,890,000 | | 3,470,000 | | # | | Nationslink Funding Corp. 1999-ltl-1 Commer Loan Pas Thr Cer, 6.450%, 01/22/26 | | 624,022 | | 3,109,351 | | 3,733,373 | |
1,039,085 | | 1,904,990 | | 2,944,075 | | | | Prime Mortgage Trust 2007-1, 5.500%, 03/25/37 | | 904,990 | | 1,659,149 | | 2,564,139 | |
472,339 | | 2,331,023 | | 2,803,362 | | | | RALI Trust, 6.000%, 09/25/35 | | 445,504 | | 2,198,592 | | 2,644,096 | |
370,000 | | 6,289,000 | | 6,659,000 | | # | | RBSCF Trust, 5.305%, 01/16/49 | | 372,638 | | 6,333,834 | | 6,706,472 | |
— | | 49,680,426 | | 49,680,426 | | #,^ | | RBSCF Trust, 1.109%, 04/15/24 | | — | | 667,998 | | 667,998 | |
— | | 15,051,853 | | 15,051,853 | | | | Residential Accredit Loans, Inc., 0.643%, 12/25/36 | | — | | 7,854,802 | | 7,854,802 | |
— | | 12,563,700 | | 12,563,700 | | | | Residential Accredit Loans, Inc., 0.363%, 01/25/37 | | — | | 9,129,048 | | 9,129,048 | |
2,500,000 | | — | | 2,500,000 | | # | | Silverstone Master Issuer PLC, 1.826%, 01/21/55 | | 2,539,247 | | — | | 2,539,247 | |
— | | 4,000,000 | | 4,000,000 | | | | Silverstone Master Issuer PLC, 1.826%, 01/21/55 | | — | | 4,093,476 | | 4,093,476 | |
830,000 | | 4,110,000 | | 4,940,000 | | # | | Springleaf Mortgage Loan Trust, 4.440%, 12/25/59 | | 864,159 | | 4,279,147 | | 5,143,306 | |
558,000 | | 2,848,000 | | 3,406,000 | | # | | Springleaf Mortgage Loan Trust, 3.790%, 06/25/58 | | 560,820 | | 2,862,391 | | 3,423,211 | |
470,000 | | 2,400,000 | | 2,870,000 | | # | | Springleaf Mortgage Loan Trust, 4.440%, 06/25/58 | | 473,282 | | 2,416,762 | | 2,890,044 | |
— | | 838,751 | | 838,751 | | | | Structured Asset Mortgage Investments, Inc., 0.672%, 04/19/35 | | — | | 805,393 | | 805,393 | |
1,083,393 | | — | | 1,083,393 | | | | Structured Asset Securities Corp., 5.500%, 10/25/35 | | 1,094,503 | | — | | 1,094,503 | |
— | | 19,942,278 | | 19,942,278 | | #,^ | | UBS-Barclays Commercial Mortgage Trust, 1.968%, 05/10/63 | | — | | 1,918,814 | | 1,918,814 | |
19
Bond
Portfolio | | Intermediate
Bond
Portfolio | | Intermediate
Bond
Portfolio
Pro Forma
Combined | | | | | | Bond Portfolio | | Intermediate Bond
Portfolio | | Intermediate Bond
Portfolio
Pro Forma
Combined | |
1,370,000 | | 3,241,000 | | 4,611,000 | | | | Wachovia Bank Commercial Mortgage Trust, 5.383%, 12/15/43 | | 1,448,369 | | 3,426,398 | | 4,874,767 | |
— | | 676,000 | | 676,000 | | # | | Wachovia Bank Commercial Mortgage Trust, 5.125%, 08/15/35 | | — | | 676,395 | | 676,395 | |
446,385 | | 2,248,915 | | 2,695,300 | | | | WaMu Mortgage Pass Through Certificates, 5.703%, 10/25/36 | | 351,767 | | 1,772,221 | | 2,123,988 | |
— | | 288,949 | | 288,949 | | | | WaMu Mortgage Pass Through Certificates, 2.444%, 10/25/35 | | — | | 289,134 | | 289,134 | |
888,314 | | 4,305,363 | | 5,193,677 | | | | Washington Mutual Alternative Mortgage Pass-Through Certificates, 6.000%, 11/25/35 | | 752,759 | | 3,648,371 | | 4,401,130 | |
918,088 | | — | | 918,088 | | | | Washington Mutual Alternative Mortgage Pass-Through Certificates, 5.500%, 10/25/35 | | 817,486 | | — | | 817,486 | |
— | | 1,879,334 | | 1,879,334 | | | | Washington Mutual Mortgage Pass-through Certificates, 6.000%, 06/25/34 | | — | | 2,007,596 | | 2,007,596 | |
1,675,417 | | 3,224,835 | | 4,900,252 | | | | Wells Fargo Alternative Loan Trust, 6.250%, 07/25/37 | | 1,480,764 | | 2,850,167 | | 4,330,931 | |
— | | 5,101,057 | | 5,101,057 | | | | Wells Fargo Mortgage Backed Securities 2006-AR7 Trust, 2.605%, 05/25/36 | | — | | 4,665,215 | | 4,665,215 | |
1,005,125 | | 1,767,204 | | 2,772,329 | | | | Wells Fargo Mortgage Backed Securities Trust, 5.592%, 04/25/36 | | 961,312 | | 1,690,174 | | 2,651,486 | |
3,177,750 | | 13,853,202 | | 17,030,952 | | #,^ | | Wells Fargo Mortgage Backed Securities Trust, 2.406%, 08/15/45 | | 389,168 | | 1,696,552 | | 2,085,720 | |
— | | 28,007,263 | | 28,007,263 | | #,^ | | Wells Fargo Mortgage Backed Securities Trust, 1.755%, 06/15/45 | | — | | 2,833,542 | | 2,833,542 | |
— | | 1,512,579 | | 1,512,579 | | | | Wells Fargo Mortgage Backed Securities Trust, 5.062%, 05/25/35 | | — | | 1,515,317 | | 1,515,317 | |
— | | 3,397,979 | | 3,397,979 | | # | | Wells Fargo Mortgage-Backed Securities Trust, 5.235%, 06/26/35 | | — | | 3,201,770 | | 3,201,770 | |
— | | 992,722 | | 992,722 | | | | Wells Fargo Mortgage-Backed Securities Trust, 5.000%, 12/25/33 | | — | | 998,279 | | 998,279 | |
| | | | | | | | | | 74,088,500 | | 361,155,036 | | 435,243,536 | |
| | | | | | | | | | | | | | | |
| | | | | | | | Total Collateralized Mortgage Obligations (Cost $425,532,828) | | 74,088,500 | | 361,155,036 | | 435,243,536 | |
| | | | | | | | | | | | | | | |
| | | | ASSET-BACKED SECURITIES: 9.2% | | | | | | | |
| | | | | | | | Automobile Asset-Backed Securities: 0.5% | | | | | | | |
250,000 | | 2,500,000 | | 2,750,000 | | # | | Motor PLC, 1.286%, 02/25/20 | | 250,705 | | 2,507,052 | | 2,757,757 | |
500,000 | | 3,300,000 | | 3,800,000 | | | | SMART Trust, 1.050%, 10/14/18 | | 499,074 | | 3,293,885 | | 3,792,959 | |
— | | 4,250,000 | | 4,250,000 | | # | | SMART Trust, 1.590%, 10/14/16 | | — | | 4,291,030 | | 4,291,030 | |
300,000 | | 1,000,000 | | 1,300,000 | | | | SMART Trust/Australia, 1.180%, 02/14/19 | | 296,280 | | 987,600 | | 1,283,880 | |
| | | | | | | | | | 1,046,059 | | 11,079,567 | | 12,125,626 | |
20
Bond
Portfolio | | Intermediate
Bond
Portfolio | | Intermediate
Bond
Portfolio
Pro Forma
Combined | | | | | | Bond Portfolio | | Intermediate Bond
Portfolio | | Intermediate Bond
Portfolio
Pro Forma
Combined | |
| | | | | | | | Credit Card Asset-Backed Securities: 0.7% | | | | | | | |
1,000,000 | | 4,200,000 | | 5,200,000 | | # | | Cards II Trust, 0.643%, 09/15/17 | | 1,003,006 | | 4,212,626 | | 5,215,632 | |
1,300,000 | | 5,400,000 | | 6,700,000 | | # | | Gracechurch Card Funding PLC, 0.893%, 02/15/17 | | 1,309,580 | | 5,439,793 | | 6,749,373 | |
— | | 7,000,000 | | 7,000,000 | | # | | Penarth Master Issuer PLC, 0.763%, 03/18/14 | | — | | 7,025,851 | | 7,025,851 | |
| | | | | | | | | | 2,312,586 | | 16,678,270 | | 18,990,856 | |
| | | | | | | | | | | | | | | |
| | | | | | | | Home Equity Asset-Backed Securities: 0.4% | | | | | | | |
1,593,557 | | 7,884,272 | | 9,477,829 | | | | GSAA Trust, 0.253%, 10/25/36 | | 784,406 | | 3,880,922 | | 4,665,328 | |
1,435,995 | | 7,103,124 | | 8,539,119 | | | | GSAA Trust, 0.283%, 12/25/36 | | 728,383 | | 3,602,932 | | 4,331,315 | |
— | | 1,045,517 | | 1,045,517 | | | | Specialty Underwriting & Residential Finance, 0.393%, 12/25/36 | | — | | 1,027,993 | | 1,027,993 | |
| | | | | | | | | | 1,512,789 | | 8,511,847 | | 10,024,636 | |
| | | | | | | | | | | | | | | |
| | | | | | | | Other Asset-Backed Securities: 7.6% | | | | | | | |
732,368 | | 1,464,736 | | 2,197,104 | | # | | Aimco CDO, 0.526%, 10/20/19 | | 718,048 | | 1,436,096 | | 2,154,144 | |
700,000 | | 4,175,000 | | 4,875,000 | | # | | AMMC CLO III Ltd., 1.526%, 07/25/16 | | 699,712 | | 4,173,280 | | 4,872,992 | |
500,000 | | 1,000,000 | | 1,500,000 | | # | | Apidos CDO I Ltd., 1.026%, 07/27/17 | | 484,970 | | 969,940 | | 1,454,910 | |
500,000 | | 2,060,000 | | 2,560,000 | | # | | Apidos CDO II, 1.076%, 12/21/18 | | 473,767 | | 1,951,920 | | 2,425,687 | |
700,000 | | 3,425,000 | | 4,125,000 | | # | | Ares Enhanced Loan Investment Strategy IR Ltd., 6.276%, 10/16/20 | | 701,735 | | 3,433,487 | | 4,135,222 | |
— | | 1,650,000 | | 1,650,000 | | # | | Ares Enhanced Loan Investment Strategy IR Ltd., 4.276%, 10/16/20 | | — | | 1,652,238 | | 1,652,238 | |
450,000 | | 2,200,000 | | 2,650,000 | | # | | Ares VIR CLO Ltd., 2.174%, 03/12/18 | | 440,328 | | 2,152,715 | | 2,593,043 | |
946,100 | | 4,699,695 | | 5,645,795 | | # | | Ares VR CLO Ltd., 2.174%, 02/24/18 | | 915,608 | | 4,548,228 | | 5,463,836 | |
484,818 | | 3,372,649 | | 3,857,467 | | # | | ARES X CLO Ltd., 2.273%, 09/18/17 | | 484,368 | | 3,369,516 | | 3,853,884 | |
835,000 | | 4,315,000 | | 5,150,000 | | # | | Ares XII CLO Ltd., 2.273%, 11/25/20 | | 806,036 | | 4,165,326 | | 4,971,362 | |
— | | 664,266 | | 664,266 | | # | | Atrium CDO Corp., 0.603%, 10/27/16 | | — | | 661,080 | | 661,080 | |
— | | 1,750,000 | | 1,750,000 | | | | Atrium CDO Corp., 0.853%, 10/27/16 | | — | | 1,729,212 | | 1,729,212 | |
— | | 1,525,000 | | 1,525,000 | | # | | Atrium III, 2.273%, 10/27/16 | | — | | 1,480,369 | | 1,480,369 | |
750,000 | | — | | 750,000 | | # | | Atrium IV, 1.024%, 06/08/19 | | 723,191 | | — | | 723,191 | |
— | | 1,250,000 | | 1,250,000 | | # | | Atrium IV, 2.124%, 06/08/19 | | — | | 1,218,429 | | 1,218,429 | |
— | | 3,000,000 | | 3,000,000 | | # | | Avalon Capital Ltd 3, 1.074%, 02/24/19 | | — | | 2,931,063 | | 2,931,063 | |
625,000 | | — | | 625,000 | | # | | Babson CLO, Inc. 2005-III, 0.675%, 11/10/19 | | 595,237 | | — | | 595,237 | |
— | | 2,400,000 | | 2,400,000 | | # | | Ballyrock CLO III Ltd., 1.006%, 07/25/17 | | — | | 2,358,034 | | 2,358,034 | |
— | | 712,851 | | 712,851 | | | | Bear Stearns Asset-Backed Securities, Inc., 0.593%, 07/25/36 | | — | | 129,409 | | 129,409 | |
— | | 1,549,061 | | 1,549,061 | | # | | Black Diamond CLO 2005-1 Delaware Corp., 0.692%, 06/20/17 | | — | | 1,517,262 | | 1,517,262 | |
405,213 | | 2,343,338 | | 2,748,551 | | # | | Black Diamond CLO Ltd., 0.542%, 06/20/17 | | 403,187 | | 2,331,621 | | 2,734,808 | |
1,220,908 | | — | | 1,220,908 | | # | | Black Diamond CLO Ltd., 0.622%, 06/20/17 | | 1,207,632 | | — | | 1,207,632 | |
21
Bond
Portfolio | | Intermediate
Bond
Portfolio | | Intermediate
Bond
Portfolio
Pro Forma
Combined | | | | | | Bond Portfolio | | Intermediate Bond
Portfolio | | Intermediate Bond
Portfolio
Pro Forma
Combined | |
250,000 | | — | | 250,000 | | # | | Callidus Debt Partners CLO Fund VII Ltd., 1.776%, 01/21/21 | | 247,360 | | — | | 247,360 | |
— | | 1,250,000 | | 1,250,000 | | # | | Callidus Debt Partners CLO Fund VII Ltd., 2.526%, 01/21/21 | | — | | 1,225,651 | | 1,225,651 | |
624,558 | | 3,076,180 | | 3,700,738 | | # | | Castle Garden Funding, 0.535%, 10/27/20 | | 617,891 | | 3,043,345 | | 3,661,236 | |
800,000 | | 1,700,000 | | 2,500,000 | | # | | Castle Garden Funding, 6.560%, 10/27/20 | | 856,620 | | 1,820,317 | | 2,676,937 | |
— | | 2,500,000 | | 2,500,000 | | # | | Castle Garden Funding, 1.025%, 10/27/20 | | — | | 2,457,690 | | 2,457,690 | |
— | | 1,000,000 | | 1,000,000 | | # | | Castle Garden Funding, 5.025%, 10/27/20 | | — | | 1,000,871 | | 1,000,871 | |
— | | 218,995 | | 218,995 | | | | Chase Funding Trust Series 2003-5, 0.793%, 07/25/33 | | — | | 201,981 | | 201,981 | |
900,000 | | 4,500,000 | | 5,400,000 | | # | | CIFC Funding 2006-I Ltd., 0.676%, 10/20/20 | | 855,365 | | 4,276,827 | | 5,132,192 | |
875,000 | | — | | 875,000 | | # | | Clydesdale CLO 2005 Ltd, 0.727%, 12/06/17 | | 856,405 | | — | | 856,405 | |
830,000 | | 4,080,000 | | 4,910,000 | | | | CNH Equipment Trust, 0.870%, 11/15/19 | | 815,103 | | 4,006,770 | | 4,821,873 | |
— | | 5,642,000 | | 5,642,000 | | | | Countrywide Asset-Backed Certificates, 5.530%, 04/25/47 | | — | | 5,260,855 | | 5,260,855 | |
— | | 1,429,117 | | 1,429,117 | | | | Credit-Based Asset Servicing and Securitization, LLC, 4.579%, 08/25/35 | | — | | 1,456,261 | | 1,456,261 | |
— | | 1,610,022 | | 1,610,022 | | # | | Credit-Based Asset Servicing and Securitization, LLC, 5.746%, 12/25/37 | | — | | 1,638,031 | | 1,638,031 | |
550,000 | | 4,250,000 | | 4,800,000 | | # | | Eaton Vance CDO IX Ltd., 0.926%, 04/20/19 | | 511,850 | | 3,955,207 | | 4,467,057 | |
1,750,000 | | — | | 1,750,000 | | # | | Emporia Preferred Funding, 0.777%, 10/18/18 | | 1,659,334 | | — | | 1,659,334 | |
650,000 | | 3,365,000 | | 4,015,000 | | # | | Emporia Preferred Funding I Corp., 0.827%, 10/12/18 | | 647,995 | | 3,354,619 | | 4,002,614 | |
751,694 | | 3,725,789 | | 4,477,483 | | # | | Emporia Preferred Funding II Corp., 0.557%, 10/18/18 | | 746,858 | | 3,701,818 | | 4,448,676 | |
525,000 | | 2,575,000 | | 3,100,000 | | # | | Fraser Sullivan CLO II Ltd., 0.672%, 12/20/20 | | 497,153 | | 2,438,419 | | 2,935,572 | |
— | | 1,000,000 | | 1,000,000 | | # | | Fraser Sullivan CLO II Ltd., 0.992%, 12/20/20 | | — | | 943,342 | | 943,342 | |
135,019 | | 540,076 | | 675,095 | | # | | Galaxy CLO Ltd, 0.728%, 04/17/17 | | 134,989 | | 539,958 | | 674,947 | |
1,225,000 | | 6,100,000 | | 7,325,000 | | # | | Gulf Stream - Compass CLO 2005-I Ltd, 2.175%, 05/15/17 | | 1,192,187 | | 5,936,605 | | 7,128,792 | |
— | | 1,032,000 | | 1,032,000 | | # | | Gulf Stream - Compass CLO 2005-I Ltd., 1.025%, 05/15/17 | | — | | 1,022,344 | | 1,022,344 | |
— | | 3,000,000 | | 3,000,000 | | # | | Gulf Stream - Compass CLO 2005-II Ltd, 1.075%, 01/24/20 | | — | | 2,934,837 | | 2,934,837 | |
350,000 | | 3,475,000 | | 3,825,000 | | # | | Gulf Stream - Compass CLO 2007-I Ltd., 2.276%, 10/28/19 | | 336,634 | | 3,342,293 | | 3,678,927 | |
865,000 | | 5,745,000 | | 6,610,000 | | # | | Gulf Stream - Sextant CLO 2006-1 Ltd., 1.874%, 08/21/20 | | 823,600 | | 5,470,038 | | 6,293,638 | |
— | | 2,850,000 | | 2,850,000 | | # | | Gulf Stream - Sextant CLO 2006-1 Ltd., 0.974%, 08/21/20 | | — | | 2,665,175 | | 2,665,175 | |
1,550,000 | | 4,100,000 | | 5,650,000 | | # | | Gulf Stream - Sextant CLO Ltd., 0.614%, 08/21/20 | | 1,522,320 | | 4,026,782 | | 5,549,102 | |
— | | 4,423,321 | | 4,423,321 | | # | | Gulf Stream Compass CLO Ltd., 0.695%, 05/15/17 | | — | | 4,414,183 | | 4,414,183 | |
1,275,000 | | 6,500,000 | | 7,775,000 | | # | | Halcyon Structured Asset Management CLO I Ltd., 4324100.000%, | | 1,255,869 | | 6,402,468 | | 7,658,337 | |
— | | 2,225,000 | | 2,225,000 | | # | | Halcyon Structured Asset Management Long Secured/Short Unsecured 2007-1 Ltd., 0.723%, 08/07/21 | | — | | 2,146,867 | | 2,146,867 | |
22
Bond
Portfolio | | Intermediate
Bond
Portfolio | | Intermediate
Bond
Portfolio
Pro Forma
Combined | | | | | | Bond Portfolio | | Intermediate Bond
Portfolio | | Intermediate Bond
Portfolio
Pro Forma
Combined | |
— | | 955,000 | | 955,000 | | # | | Halcyon Structured Asset Management Long Secured/Short Unsecured 2007-1 Ltd., 2.573%, 08/07/21 | | — | | 917,893 | | 917,893 | |
480,000 | | 3,630,000 | | 4,110,000 | | # | | Halcyon Structured Asset Management Long Secured/Short Unsecured CLO 2006-1 Ltd., 4338500.000%, 01/00/00 | | 468,263 | | 3,541,239 | | 4,009,502 | |
— | | 1,250,000 | | 1,250,000 | | # | | Hewett’s Island CDO Ltd., 1.225%, 08/09/17 | | — | | 1,228,632 | | 1,228,632 | |
354,046 | | — | | 354,046 | | # | | Katonah VI Ltd., 2.472%, 09/20/16 | | 354,358 | | — | | 354,358 | |
1,075,000 | | 3,500,000 | | 4,575,000 | | # | | Landmark VI CDO Ltd, 0.777%, 01/14/18 | | 1,038,394 | | 3,380,822 | | 4,419,216 | |
— | | 976,861 | | 976,861 | | | | Lehman XS Trust, 0.473%, 08/25/35 | | — | | 911,065 | | 911,065 | |
869,485 | | 3,623,795 | | 4,493,280 | | # | | Lightpoint CLO Ltd., 0.533%, 09/15/17 | | 854,266 | | 3,560,368 | | 4,414,634 | |
350,000 | | 3,740,000 | | 4,090,000 | | # | | Madison Park Funding I Ltd., 2.175%, 05/10/19 | | 349,932 | | 3,739,274 | | 4,089,206 | |
270,000 | | 1,340,000 | | 1,610,000 | | | | Madison Park Funding I Ltd., 5.025%, 05/10/19 | | 270,148 | | 1,340,734 | | 1,610,882 | |
575,000 | | 2,800,000 | | 3,375,000 | | # | | Marathon CLO I Ltd, 2.176%, 07/26/19 | | 574,917 | | 2,799,594 | | 3,374,511 | |
408,119 | | 2,047,885 | | 2,456,004 | | # | | Mesa West Capital CDO Ltd., 0.453%, 02/25/47 | | 392,815 | | 1,971,089 | | 2,363,904 | |
625,000 | | 1,250,000 | | 1,875,000 | | # | | Morgan Stanley Investment Management Croton Ltd, 0.727%, 01/15/18 | | 607,856 | | 1,215,711 | | 1,823,567 | |
500,000 | | 1,500,000 | | 2,000,000 | | # | | Oak Hill Credit Partners IV Ltd, 1.974%, 05/17/21 | | 474,919 | | 1,424,757 | | 1,899,676 | |
500,000 | | 2,600,000 | | 3,100,000 | | # | | Stanfield Veyron CLO Ltd., 0.677%, 07/15/18 | | 481,664 | | 2,504,653 | | 2,986,317 | |
800,000 | | 3,900,000 | | 4,700,000 | | # | | Stanfield Veyron CLO Ltd., 0.957%, 07/15/18 | | 759,298 | | 3,701,576 | | 4,460,874 | |
— | | 1,000,000 | | 1,000,000 | | # | | Venture IV CDO Ltd., 2.425%, 08/15/16 | | — | | 990,863 | | 990,863 | |
525,000 | | 2,875,000 | | 3,400,000 | | # | | WhiteHorse III Ltd./Corp, 1.024%, 05/01/18 | | 504,454 | | 2,762,484 | | 3,266,938 | |
425,000 | | 3,275,000 | | 3,700,000 | | # | | Whitney CLO Ltd, 2.375%, 03/01/17 | | 424,963 | | 3,274,718 | | 3,699,681 | |
140,286 | | 233,810 | | 374,096 | | # | | Whitney CLO Ltd., 0.725%, 03/01/17 | | 140,215 | | 233,692 | | 373,907 | |
| | | | | | | | | | 29,927,814 | | 161,391,943 | | 191,319,757 | |
| | | | | | | | | | | | | | | |
| | | | | | | | Total Asset-Backed Securities (Cost $232,446,440) | | 34,799,248 | | 197,661,627 | | 232,460,875 | |
| | | | | | | | | | | | | | | |
| | | | U.S. TREASURY OBLIGATIONS: 15.6% | | | | | | | |
| | | | | | | | U.S. Treasury Inflation Indexed Protected Securities: 1.8% | | | | | |
7,621,105 | | 37,724,366 | | 45,345,471 | | | | 0.125%, due 01/15/22 | | 7,463,622 | | 36,944,830 | | 44,408,452 | |
| | | | | | | | | | | | | | | |
| | | | | | | | U.S. Treasury Bonds: 3.7% | | | | | | | |
4,736,000 | | 48,563,000 | | 53,299,000 | | | | 3.125%, due 02/15/43 | | 4,427,421 | | 45,398,829 | | 49,826,250 | |
4,366,000 | | 25,279,000 | | 29,645,000 | | | | 1.750%, due 05/15/23 | | 4,086,646 | | 23,661,548 | | 27,748,194 | |
2,720,000 | | 13,434,000 | | 16,154,000 | | | | 2.000%, due 02/15/22 | | 2,659,012 | | 13,132,783 | | 15,791,795 | |
| | | | | | | | | | 11,173,079 | | 82,193,160 | | 93,366,239 | |
23
Bond
Portfolio | | Intermediate
Bond
Portfolio | | Intermediate
Bond
Portfolio
Pro Forma
Combined | | | | | | Bond Portfolio | | Intermediate Bond
Portfolio | | Intermediate Bond
Portfolio
Pro Forma
Combined | |
| | | | | | | | U.S. Treasury Notes: 10.1% | | | | | | | |
2,553,000 | | 12,942,000 | | 15,495,000 | | | | 1.875%, due 06/30/20 | | 2,542,129 | | 12,886,893 | | 15,429,022 | |
2,367,000 | | 4,994,000 | | 7,361,000 | | | | 0.250%, due 05/31/15 | | 2,362,701 | | 4,984,931 | | 7,347,632 | |
12,563,000 | | 26,500,000 | | 39,063,000 | | | | 0.375%, due 06/30/15 | | 12,566,430 | | 26,507,235 | | 39,073,665 | |
14,533,000 | | 44,342,000 | | 58,875,000 | | | | 0.500%, due 06/15/16 | | 14,469,985 | | 44,149,733 | | 58,619,718 | |
162,000 | | 794,000 | | 956,000 | | | | 1.000%, due 05/31/18 | | 159,165 | | 780,105 | | 939,270 | |
10,000 | | — | | 10,000 | | | | 1.125%, due 04/30/20 | | 9,504 | | — | | 9,504 | |
1,609,000 | | 8,157,000 | | 9,766,000 | | | | 1.375%, due 05/31/20 | | 1,551,868 | | 7,867,361 | | 9,419,229 | |
28,428,000 | | 96,440,000 | | 124,868,000 | | | | 1.375%, due 06/30/18 | | 28,402,472 | | 96,353,397 | | 124,755,869 | |
| | | | | | | | | | 62,064,254 | | 193,529,655 | | 255,593,909 | |
| | | | | | | | | | | | | | | |
| | | | | | | | Total U.S. Treasury Obligations
(Cost $397,966,669) | | 80,700,955 | | 312,667,645 | | 393,368,600 | |
| | | | | | | | | | | | | | | |
| | | | U.S. GOVERNMENT AGENCY OBLIGATIONS: 31.2% | | | | | | | |
| | | | | | | | Federal Home Loan Mortgage Corporation:## 8.6% | | | | | | | |
— | | 12,882 | | 12,882 | | | | 2.439%, due 11/01/35 | | — | | 13,767 | | 13,767 | |
— | | 4,165,148 | | 4,165,148 | | | | 3.000%, due 02/01/27 | | — | | 4,294,968 | | 4,294,968 | |
— | | 7,775,362 | | 7,775,362 | | | | 3.000%, due 02/01/27 | | — | | 8,016,059 | | 8,016,059 | |
— | | 4,035,000 | | 4,035,000 | | W | | 3.000%, due 02/15/27 | | — | | 4,136,663 | | 4,136,663 | |
— | | 1,639,186 | | 1,639,186 | | | | 3.293%, due 03/15/38 | | — | | 1,683,076 | | 1,683,076 | |
26,223,000 | | — | | 26,223,000 | | W | | 3.500%, due 01/15/42 | | 26,493,425 | | — | | 26,493,425 | |
4,761,177 | | — | | 4,761,177 | | | | 3.500%, due 08/01/42 | | 4,830,819 | | — | | 4,830,819 | |
— | | 5,062,000 | | 5,062,000 | | W | | 4.000%, due 01/15/41 | | — | | 5,254,395 | | 5,254,395 | |
— | | 2,188,021 | | 2,188,021 | | | | 4.000%, due 03/15/41 | | — | | 2,272,212 | | 2,272,212 | |
— | | 7,032,339 | | 7,032,339 | | | | 4.000%, due 10/01/41 | | — | | 7,335,087 | | 7,335,087 | |
— | | 758,163 | | 758,163 | | | | 4.000%, due 11/01/41 | | — | | 790,803 | | 790,803 | |
— | | 1,718,313 | | 1,718,313 | | | | 4.000%, due 11/01/41 | | — | | 1,792,288 | | 1,792,288 | |
— | | 5,000,000 | | 5,000,000 | | ^ | | 4.000%, due 11/15/38 | | — | | 1,349,831 | | 1,349,831 | |
— | | 8,182,864 | | 8,182,864 | | | | 4.000%, due 12/01/41 | | — | | 8,535,143 | | 8,535,143 | |
— | | 4,669,386 | | 4,669,386 | | | | 4.500%, due 01/15/42 | | — | | 4,906,783 | | 4,906,783 | |
— | | 2,734,481 | | 2,734,481 | | | | 4.500%, due 08/01/41 | | — | | 2,888,413 | | 2,888,413 | |
— | | 2,895,271 | | 2,895,271 | | | | 4.500%, due 08/01/41 | | — | | 3,058,255 | | 3,058,255 | |
— | | 4,252,669 | | 4,252,669 | | | | 4.500%, due 08/01/41 | | — | | 4,492,064 | | 4,492,064 | |
24
Bond
Portfolio | | Intermediate
Bond
Portfolio | | Intermediate
Bond
Portfolio
Pro Forma
Combined | | | | | | Bond Portfolio | | Intermediate Bond
Portfolio | | Intermediate Bond
Portfolio
Pro Forma
Combined | |
— | | 4,068,714 | | 4,068,714 | | | | 4.500%, due 09/01/41 | | — | | 4,297,754 | | 4,297,754 | |
— | | 930,718 | | 930,718 | | | | 4.500%, due 09/01/41 | | — | | 981,186 | | 981,186 | |
— | | 5,644,616 | | 5,644,616 | | | | 4.500%, due 10/01/41 | | — | | 5,962,368 | | 5,962,368 | |
8,466,521 | | — | | 8,466,521 | | ^ | | 4.500%, due 12/15/40 | | 1,642,568 | | — | | 1,642,568 | |
— | | 1,529,903 | | 1,529,903 | | ^ | | 4.846%, due 03/15/33 | | — | | 1,628,045 | | 1,628,045 | |
— | | 2,046,027 | | 2,046,027 | | | | 5.000%, due 01/01/41 | | — | | 2,203,656 | | 2,203,656 | |
— | | 5,442,463 | | 5,442,463 | | | | 5.000%, due 02/15/35 | | — | | 5,939,763 | | 5,939,763 | |
— | | 813,471 | | 813,471 | | | | 5.000%, due 02/15/35 | | — | | 844,180 | | 844,180 | |
— | | 4,783,754 | | 4,783,754 | | ^ | | 5.000%, due 02/15/40 | | — | | 890,781 | | 890,781 | |
— | | 212,114 | | 212,114 | | | | 5.000%, due 05/01/28 | | — | | 226,441 | | 226,441 | |
— | | 641,107 | | 641,107 | | | | 5.000%, due 08/15/16 | | — | | 653,324 | | 653,324 | |
— | | 1,592,601 | | 1,592,601 | | | | 5.000%, due 12/15/17 | | — | | 1,698,790 | | 1,698,790 | |
— | | 943,222 | | 943,222 | | | | 5.500%, due 02/15/33 | | — | | 1,061,148 | | 1,061,148 | |
— | | 19,179,154 | | 19,179,154 | | | | 5.500%, due 02/15/36 | | — | | 21,203,716 | | 21,203,716 | |
— | | 2,943 | | 2,943 | | | | 5.500%, due 03/15/32 | | — | | 2,944 | | 2,944 | |
— | | 2,589,920 | | 2,589,920 | | | | 5.500%, due 05/15/37 | | — | | 2,791,918 | | 2,791,918 | |
— | | 7,446,092 | | 7,446,092 | | | | 5.500%, due 06/15/37 | | — | | 8,086,106 | | 8,086,106 | |
— | | 6,289,179 | | 6,289,179 | | | | 5.500%, due 08/15/36 | | — | | 7,059,754 | | 7,059,754 | |
— | | 2,538,227 | | 2,538,227 | | | | 5.500%, due 09/15/34 | | — | | 2,711,759 | | 2,711,759 | |
— | | 2,824,620 | | 2,824,620 | | | | 5.500%, due 11/15/22 | | — | | 3,057,869 | | 3,057,869 | |
11,082,588 | | — | | 11,082,588 | | ^ | | 5.500%, due 12/15/18 | | 881,291 | | — | | 881,291 | |
— | | 1,579,381 | | 1,579,381 | | | | 5.500%, due 12/15/32 | | — | | 1,750,415 | | 1,750,415 | |
— | | 17,759 | | 17,759 | | | | 5.656%, due 03/01/36 | | — | | 18,877 | | 18,877 | |
— | | 6,640,093 | | 6,640,093 | | ^ | | 5.808%, due 05/15/36 | | — | | 897,192 | | 897,192 | |
— | | 8,059,726 | | 8,059,726 | | ^ | | 5.858%, due 07/15/40 | | — | | 1,372,578 | | 1,372,578 | |
— | | 1,068,614 | | 1,068,614 | | | | 6.000%, due 01/15/29 | | — | | 1,185,661 | | 1,185,661 | |
— | | 1,124,354 | | 1,124,354 | | | | 6.000%, due 01/15/29 | | — | | 1,259,565 | | 1,259,565 | |
— | | 24,233 | | 24,233 | | | | 6.000%, due 02/01/29 | | — | | 26,353 | | 26,353 | |
— | | 1,500,152 | | 1,500,152 | | | | 6.000%, due 03/01/37 | | — | | 1,627,646 | | 1,627,646 | |
— | | 1,508,525 | | 1,508,525 | | ^ | | 6.000%, due 04/15/33 | | — | | 295,158 | | 295,158 | |
— | | 1,482,324 | | 1,482,324 | | | | 6.000%, due 07/15/32 | | — | | 1,662,590 | | 1,662,590 | |
— | | 166,665 | | 166,665 | | | | 6.000%, due 08/01/37 | | — | | 180,804 | | 180,804 | |
— | | 14,402,595 | | 14,402,595 | | | | 6.000%, due 10/15/37 | | — | | 15,906,767 | | 15,906,767 | |
— | | 110,249 | | 110,249 | | | | 6.000%, due 11/01/37 | | — | | 119,601 | | 119,601 | |
— | | 5,924,864 | | 5,924,864 | | ^ | | 6.293%, due 06/15/36 | | — | | 947,254 | | 947,254 | |
— | | 16,705,439 | | 16,705,439 | | ^ | | 6.358%, due 05/15/41 | | — | | 3,474,669 | | 3,474,669 | |
— | | 6,604,599 | | 6,604,599 | | ^ | | 6.408%, due 09/15/33 | | — | | 955,356 | | 955,356 | |
7,456,699 | | — | | 7,456,699 | | | | 6.500%, due 03/15/42 | | 8,647,447 | | — | | 8,647,447 | |
— | | 4,724,459 | | 4,724,459 | | | | 6.500%, due 09/01/34 | | — | | 5,368,225 | | 5,368,225 | |
— | | 1,071,978 | | 1,071,978 | | | | 7.000%, due 09/01/26 | | — | | 1,228,893 | | 1,228,893 | |
25
Bond
Portfolio | | Intermediate
Bond
Portfolio | | Intermediate
Bond
Portfolio
Pro Forma
Combined | | | | | | Bond Portfolio | | Intermediate Bond
Portfolio | | Intermediate Bond
Portfolio
Pro Forma
Combined | |
— | | 61,579 | | 61,579 | | | | 7.000%, due 11/01/31 | | — | | 71,417 | | 71,417 | |
— | | 1,014,981 | | 1,014,981 | | | | 19.283%, due 03/15/35 | | — | | 1,532,209 | | 1,532,209 | |
5,680,550 | | — | | 5,680,550 | | ^ | | 23.861%, due 01/15/36 | | 3,229,795 | | — | | 3,229,795 | |
| | | | | | | | | | 45,725,345 | | 172,002,539 | | 217,727,884 | |
| | | | | | | | | | | | | | | |
| | | | | | | | Federal National Mortgage Association:## 18.5% | | | | | | | |
— | | 483,570 | | 483,570 | | | | 2.216%, due 04/01/35 | | — | | 511,326 | | 511,326 | |
6,700,000 | | 12,000,000 | | 18,700,000 | | W | | 2.500%, due 05/25/27 | | 6,726,172 | | 12,046,874 | | 18,773,046 | |
2,795,000 | | 41,390,000 | | 44,185,000 | | W | | 3.000%, due 05/25/27 | | 2,869,679 | | 42,495,891 | | 45,365,570 | |
31,301,000 | | 23,861,000 | | 55,162,000 | | W | | 3.000%, due 05/25/42 | | 30,420,658 | | 23,189,908 | | 53,610,566 | |
— | | 5,529,589 | | 5,529,589 | | | | 3.000%, due 10/01/27 | | — | | 5,704,364 | | 5,704,364 | |
— | | 12,323,195 | | 12,323,195 | | ^ | | 3.000%, due 10/25/32 | | — | | 1,645,638 | | 1,645,638 | |
— | | 70,285,000 | | 70,285,000 | | W | | 3.500%, due 03/25/27 | | — | | 72,118,996 | | 72,118,996 | |
— | | 33,747,000 | | 33,747,000 | | W | | 3.500%, due 03/25/41 | | — | | 34,073,922 | | 34,073,922 | |
1,897,914 | | — | | 1,897,914 | | | | 3.500%, due 08/01/42 | | 1,929,828 | | — | | 1,929,828 | |
5,710,653 | | — | | 5,710,653 | | | | 3.500%, due 08/01/42 | | 5,806,681 | | — | | 5,806,681 | |
— | | 6,913,950 | | 6,913,950 | | | | 4.000%, due 02/01/42 | | — | | 7,219,774 | | 7,219,774 | |
2,757,000 | | 22,907,000 | | 25,664,000 | | W | | 4.000%, due 02/25/39 | | 2,872,988 | | 23,870,704 | | 26,743,692 | |
— | | 5,956,783 | | 5,956,783 | | | | 4.000%, due 03/01/42 | | — | | 6,228,566 | | 6,228,566 | |
— | | 3,628,705 | | 3,628,705 | | | | 4.000%, due 07/01/42 | | — | | 3,794,267 | | 3,794,267 | |
— | | 10,644,931 | | 10,644,931 | | | | 4.000%, due 07/01/42 | | — | | 11,130,615 | | 11,130,615 | |
— | | 4,163,950 | | 4,163,950 | | | | 4.000%, due 07/01/42 | | — | | 4,353,934 | | 4,353,934 | |
3,106,993 | | — | | 3,106,993 | | | | 4.000%, due 08/01/42 | | 3,248,752 | | — | | 3,248,752 | |
1,706,592 | | — | | 1,706,592 | | | | 4.000%, due 08/01/42 | | 1,784,457 | | — | | 1,784,457 | |
1,043,674 | | — | | 1,043,674 | | | | 4.000%, due 08/01/42 | | 1,088,021 | | — | | 1,088,021 | |
— | | 2,383,510 | | 2,383,510 | | ^ | | 4.000%, due 11/01/18 | | — | | 154,931 | | 154,931 | |
— | | 3,918,895 | | 3,918,895 | | | | 4.000%, due 12/25/40 | | — | | 3,715,139 | | 3,715,139 | |
— | | 1,074,253 | | 1,074,253 | | | | 4.500%, due 01/01/41 | | — | | 1,138,516 | | 1,138,516 | |
— | | 862,108 | | 862,108 | | | | 4.500%, due 01/01/41 | | — | | 913,681 | | 913,681 | |
3,159,000 | | 17,741,000 | | 20,900,000 | | W | | 4.500%, due 08/01/39 | | 3,337,681 | | 18,744,475 | | 22,082,156 | |
— | | 859,746 | | 859,746 | | | | 4.500%, due 09/01/41 | | — | | 911,861 | | 911,861 | |
— | | 9,003,559 | | 9,003,559 | | | | 4.500%, due 09/01/41 | | — | | 9,549,327 | | 9,549,327 | |
— | | 1,373,049 | | 1,373,049 | | | | 4.500%, due 10/01/40 | | — | | 1,473,323 | | 1,473,323 | |
— | | 194,202 | | 194,202 | | | | 4.500%, due 10/01/41 | | — | | 205,974 | | 205,974 | |
— | | 694,660 | | 694,660 | | | | 4.500%, due 10/01/41 | | — | | 736,768 | | 736,768 | |
— | | 2,298,523 | | 2,298,523 | | | | 4.500%, due 10/01/41 | | — | | 2,437,705 | | 2,437,705 | |
— | | 5,644,101 | | 5,644,101 | | | | 4.500%, due 10/01/41 | | — | | 5,986,229 | | 5,986,229 | |
— | | 4,055,885 | | 4,055,885 | | | | 4.500%, due 10/01/41 | | — | | 4,301,740 | | 4,301,740 | |
— | | 4,691,953 | | 4,691,953 | | | | 4.500%, due 11/01/40 | | — | | 4,972,633 | | 4,972,633 | |
— | | 3,033,794 | | 3,033,794 | | | | 4.500%, due 11/01/40 | | — | | 3,215,280 | | 3,215,280 | |
26
Bond
Portfolio | | Intermediate
Bond
Portfolio | | Intermediate
Bond
Portfolio
Pro Forma
Combined | | | | | | Bond Portfolio | | Intermediate Bond
Portfolio | | Intermediate Bond
Portfolio
Pro Forma
Combined | |
— | | 1,928,875 | | 1,928,875 | | | | 4.500%, due 11/01/41 | | — | | 2,045,798 | | 2,045,798 | |
— | | 468,542 | | 468,542 | | | | 4.500%, due 12/01/40 | | — | | 496,571 | | 496,571 | |
— | | 841,955 | | 841,955 | | | | 4.500%, due 12/01/40 | | — | | 892,322 | | 892,322 | |
— | | 1,710,013 | | 1,710,013 | | | | 5.000%, due 01/01/36 | | — | | 1,846,440 | | 1,846,440 | |
1,860,655 | | — | | 1,860,655 | | | | 5.000%, due 02/01/35 | | 2,013,178 | | — | | 2,013,178 | |
— | | 2,241,308 | | 2,241,308 | | | | 5.000%, due 02/01/36 | | — | | 2,419,487 | | 2,419,487 | |
— | | 1,712,943 | | 1,712,943 | | | | 5.000%, due 02/01/41 | | — | | 1,849,164 | | 1,849,164 | |
11,749,964 | | — | | 11,749,964 | | ^ | | 5.000%, due 04/25/42 | | 2,609,002 | | — | | 2,609,002 | |
— | | 1,047,694 | | 1,047,694 | | | | 5.000%, due 05/01/41 | | — | | 1,143,982 | | 1,143,982 | |
— | | 7,595,303 | | 7,595,303 | | ^ | | 5.000%, due 05/25/18 | | — | | 546,181 | | 546,181 | |
— | | 63,501 | | 63,501 | | | | 5.000%, due 05/25/32 | | — | | 63,581 | | 63,581 | |
— | | 1,468,623 | | 1,468,623 | | | | 5.000%, due 06/01/33 | | — | | 1,589,005 | | 1,589,005 | |
— | | 3,873,836 | | 3,873,836 | | | | 5.000%, due 06/01/41 | | — | | 4,229,858 | | 4,229,858 | |
— | | 2,424,147 | | 2,424,147 | | | | 5.000%, due 06/01/41 | | — | | 2,646,936 | | 2,646,936 | |
— | | 2,804,239 | | 2,804,239 | | | | 5.000%, due 07/01/35 | | — | | 3,032,934 | | 3,032,934 | |
— | | 2,342,164 | | 2,342,164 | | | | 5.000%, due 07/01/36 | | — | | 2,534,425 | | 2,534,425 | |
— | | 3,393,745 | | 3,393,745 | | | | 5.000%, due 07/01/37 | | — | | 3,671,941 | | 3,671,941 | |
— | | 8,868,781 | | 8,868,781 | | | | 5.000%, due 07/01/37 | | — | | 9,595,752 | | 9,595,752 | |
— | | 2,516,899 | | 2,516,899 | | | | 5.000%, due 07/25/34 | | — | | 2,581,596 | | 2,581,596 | |
— | | 1,940,728 | | 1,940,728 | | | | 5.000%, due 11/01/40 | | — | | 2,123,330 | | 2,123,330 | |
— | | 122,539 | | 122,539 | | | | 5.000%, due 12/01/23 | | — | | 131,519 | | 131,519 | |
11,275,968 | | — | | 11,275,968 | | | | 5.000%, due 12/01/36 | | 12,140,316 | | — | | 12,140,316 | |
— | | 795,648 | | 795,648 | | | | 5.009%, due 07/01/35 | | — | | 854,589 | | 854,589 | |
— | | 3,067 | | 3,067 | | | | 5.500%, due 01/01/18 | | — | | 3,255 | | 3,255 | |
— | | 6,145 | | 6,145 | | | | 5.500%, due 02/01/18 | | — | | 6,503 | | 6,503 | |
— | | 85,156 | | 85,156 | | | | 5.500%, due 02/01/18 | | — | | 90,376 | | 90,376 | |
— | | 2,195,596 | | 2,195,596 | | | | 5.500%, due 03/01/37 | | — | | 2,394,917 | | 2,394,917 | |
— | | 2,896 | | 2,896 | | | | 5.500%, due 04/01/17 | | — | | 3,062 | | 3,062 | |
— | | 1,477 | | 1,477 | | | | 5.500%, due 06/01/18 | | — | | 1,563 | | 1,563 | |
— | | 19,405 | | 19,405 | | | | 5.500%, due 10/01/18 | | — | | 20,530 | | 20,530 | |
— | | 2,039 | | 2,039 | | | | 5.500%, due 11/01/16 | | — | | 2,156 | | 2,156 | |
— | | 16,343,680 | | 16,343,680 | | ^ | | 5.500%, due 11/25/40 | | — | | 2,193,495 | | 2,193,495 | |
— | | 25,380 | | 25,380 | | | | 5.500%, due 12/01/16 | | — | | 26,832 | | 26,832 | |
— | | 9,391 | | 9,391 | | | | 6.000%, due 01/01/17 | | — | | 9,843 | | 9,843 | |
— | | 10,593 | | 10,593 | | | | 6.000%, due 01/01/17 | | — | | 11,034 | | 11,034 | |
2,221,430 | | — | | 2,221,430 | | | | 6.000%, due 01/01/38 | | 2,469,497 | | — | | 2,469,497 | |
— | | 8,877 | | 8,877 | | | | 6.000%, due 02/01/17 | | — | | 9,332 | | 9,332 | |
— | | 1,193 | | 1,193 | | | | 6.000%, due 02/01/17 | | — | | 1,259 | | 1,259 | |
— | | 526 | | 526 | | | | 6.000%, due 02/01/17 | | — | | 556 | | 556 | |
— | | 2,022 | | 2,022 | | | | 6.000%, due 02/01/18 | | — | | 2,148 | | 2,148 | |
27
Bond
Portfolio | | Intermediate
Bond
Portfolio | | Intermediate
Bond
Portfolio
Pro Forma
Combined | | | | | | Bond Portfolio | | Intermediate Bond
Portfolio | | Intermediate Bond
Portfolio
Pro Forma
Combined | |
— | | 1,762,816 | | 1,762,816 | | | | 6.000%, due 02/01/38 | | — | | 1,948,518 | | 1,948,518 | |
— | | 304 | | 304 | | | | 6.000%, due 03/01/17 | | — | | 321 | | 321 | |
— | | 221,917 | | 221,917 | | | | 6.000%, due 03/01/36 | | — | | 243,044 | | 243,044 | |
— | | 196,185 | | 196,185 | | | | 6.000%, due 03/01/37 | | — | | 213,234 | | 213,234 | |
— | | 30,654 | | 30,654 | | | | 6.000%, due 04/01/17 | | — | | 32,646 | | 32,646 | |
— | | 12,034 | | 12,034 | | | | 6.000%, due 04/01/17 | | — | | 12,709 | | 12,709 | |
— | | 9,867 | | 9,867 | | | | 6.000%, due 04/01/17 | | — | | 10,373 | | 10,373 | |
— | | 18,264 | | 18,264 | | | | 6.000%, due 04/01/17 | | — | | 19,125 | | 19,125 | |
— | | 51,230 | | 51,230 | | | | 6.000%, due 04/01/18 | | — | | 54,190 | | 54,190 | |
— | | 1,237,933 | | 1,237,933 | | | | 6.000%, due 04/25/31 | | — | | 1,385,691 | | 1,385,691 | |
— | | 24,207 | | 24,207 | | | | 6.000%, due 05/01/17 | | — | | 25,591 | | 25,591 | |
— | | 39,068 | | 39,068 | | | | 6.000%, due 05/01/17 | | — | | 41,177 | | 41,177 | |
— | | 12,413 | | 12,413 | | | | 6.000%, due 05/01/17 | | — | | 13,104 | | 13,104 | |
— | | 9,217 | | 9,217 | | | | 6.000%, due 05/01/17 | | — | | 9,727 | | 9,727 | |
— | | 23,569 | | 23,569 | | | | 6.000%, due 06/01/16 | | — | | 24,907 | | 24,907 | |
— | | 40,174 | | 40,174 | | | | 6.000%, due 06/01/17 | | — | | 42,397 | | 42,397 | |
— | | 6,872 | | 6,872 | | | | 6.000%, due 06/01/17 | | — | | 7,256 | | 7,256 | |
— | | 15,744 | | 15,744 | | | | 6.000%, due 07/01/17 | | — | | 16,627 | | 16,627 | |
— | | 5,366 | | 5,366 | | | | 6.000%, due 07/01/17 | | — | | 5,390 | | 5,390 | |
— | | 140,890 | | 140,890 | | | | 6.000%, due 07/01/37 | | — | | 153,258 | | 153,258 | |
— | | 685,093 | | 685,093 | | | | 6.000%, due 07/25/29 | | — | | 761,022 | | 761,022 | |
— | | 1,611,371 | | 1,611,371 | | | | 6.000%, due 07/25/29 | | — | | 1,789,959 | | 1,789,959 | |
— | | 47,353 | | 47,353 | | | | 6.000%, due 08/01/16 | | — | | 49,808 | | 49,808 | |
— | | 608 | | 608 | | | | 6.000%, due 08/01/16 | | — | | 644 | | 644 | |
— | | 19,016 | | 19,016 | | | | 6.000%, due 08/01/17 | | — | | 20,277 | | 20,277 | |
— | | 15,718 | | 15,718 | | | | 6.000%, due 08/01/17 | | — | | 16,475 | | 16,475 | |
— | | 22,977 | | 22,977 | | | | 6.000%, due 08/01/17 | | — | | 24,325 | | 24,325 | |
— | | 233,369 | | 233,369 | | | | 6.000%, due 08/01/34 | | — | | 257,959 | | 257,959 | |
— | | 307,487 | | 307,487 | | | | 6.000%, due 08/01/37 | | — | | 338,765 | | 338,765 | |
— | | 2,399,102 | | 2,399,102 | | ^ | | 6.000%, due 08/25/33 | | — | | 427,477 | | 427,477 | |
— | | 196,321 | | 196,321 | | | | 6.000%, due 09/01/17 | | — | | 209,545 | | 209,545 | |
— | | 57,321 | | 57,321 | | | | 6.000%, due 09/01/17 | | — | | 60,886 | | 60,886 | |
— | | 19,660 | | 19,660 | | | | 6.000%, due 09/01/18 | | — | | 21,039 | | 21,039 | |
— | | 379,778 | | 379,778 | | | | 6.000%, due 09/01/36 | | — | | 413,330 | | 413,330 | |
— | | 440,855 | | 440,855 | | | | 6.000%, due 09/01/36 | | — | | 479,804 | | 479,804 | |
— | | 14,757 | | 14,757 | | | | 6.000%, due 10/01/16 | | — | | 15,467 | | 15,467 | |
— | | 19,069 | | 19,069 | | | | 6.000%, due 10/01/16 | | — | | 20,008 | | 20,008 | |
— | | 1,780 | | 1,780 | | | | 6.000%, due 10/01/17 | | — | | 1,889 | | 1,889 | |
— | | 20,834 | | 20,834 | | | | 6.000%, due 10/01/18 | | — | | 22,361 | | 22,361 | |
— | | 96,751 | | 96,751 | | | | 6.000%, due 10/01/38 | | — | | 107,082 | | 107,082 | |
28
Bond
Portfolio | | Intermediate
Bond
Portfolio | | Intermediate
Bond
Portfolio
Pro Forma
Combined | | | | | | Bond Portfolio | | Intermediate Bond
Portfolio | | Intermediate Bond
Portfolio
Pro Forma
Combined | |
— | | 52,534 | | 52,534 | | | | 6.000%, due 11/01/17 | | — | | 55,629 | | 55,629 | |
— | | 11,547 | | 11,547 | | | | 6.000%, due 11/01/18 | | — | | 12,362 | | 12,362 | |
— | | 875,450 | | 875,450 | | | | 6.000%, due 12/01/37 | | — | | 960,408 | | 960,408 | |
— | | 8,701,083 | | 8,701,083 | | ^ | | 6.257%, due 02/25/42 | | — | | 1,680,974 | | 1,680,974 | |
— | | 36,514 | | 36,514 | | | | 6.500%, due 01/01/32 | | — | | 42,010 | | 42,010 | |
— | | 21,611 | | 21,611 | | | | 6.500%, due 02/01/28 | | — | | 23,947 | | 23,947 | |
— | | 13,844 | | 13,844 | | | | 6.500%, due 04/01/27 | | — | | 15,365 | | 15,365 | |
— | | 49,239 | | 49,239 | | | | 6.500%, due 09/01/32 | | — | | 54,899 | | 54,899 | |
— | | 53,935 | | 53,935 | | | | 6.500%, due 10/01/32 | | — | | 60,282 | | 60,282 | |
— | | 63,471 | | 63,471 | | | | 6.500%, due 10/01/32 | | — | | 71,492 | | 71,492 | |
— | | 3,745,662 | | 3,745,662 | | ^ | | 6.507%, due 08/25/26 | | — | | 482,923 | | 482,923 | |
— | | 11,651,759 | | 11,651,759 | | ^ | | 6.547%, due 01/25/37 | | — | | 1,854,768 | | 1,854,768 | |
— | | 27,376,412 | | 27,376,412 | | ^ | | 6.557%, due 10/25/35 | | — | | 4,807,424 | | 4,807,424 | |
— | | 6,369 | | 6,369 | | | | 7.000%, due 02/01/26 | | — | | 7,375 | | 7,375 | |
— | | 21,466 | | 21,466 | | | | 7.000%, due 02/01/26 | | — | | 24,856 | | 24,856 | |
— | | 15,368 | | 15,368 | | | | 7.000%, due 03/01/26 | | — | | 17,854 | | 17,854 | |
— | | 12,107 | | 12,107 | | | | 7.000%, due 03/01/26 | | — | | 14,019 | | 14,019 | |
— | | 6,222 | | 6,222 | | | | 7.000%, due 03/01/26 | | — | | 7,228 | | 7,228 | |
— | | 36,422 | | 36,422 | | | | 7.000%, due 03/01/26 | | — | | 42,312 | | 42,312 | |
— | | 1,183,964 | | 1,183,964 | | | | 7.000%, due 03/01/38 | | — | | 1,378,709 | | 1,378,709 | |
— | | 1,246,495 | | 1,246,495 | | | | 7.000%, due 04/01/38 | | — | | 1,451,525 | | 1,451,525 | |
— | | 20,295 | | 20,295 | | | | 7.000%, due 06/01/31 | | — | | 23,706 | | 23,706 | |
— | | 4,857 | | 4,857 | | | | 7.000%, due 08/01/25 | | — | | 5,624 | | 5,624 | |
— | | 1,938 | | 1,938 | | | | 7.000%, due 11/01/25 | | — | | 2,244 | | 2,244 | |
— | | 16,314 | | 16,314 | | | | 7.000%, due 12/01/25 | | — | | 18,890 | | 18,890 | |
— | | 3,637 | | 3,637 | | | | 7.000%, due 12/01/25 | | — | | 4,211 | | 4,211 | |
— | | 2,624 | | 2,624 | | | | 7.000%, due 12/01/27 | | — | | 3,057 | | 3,057 | |
— | | 29,908 | | 29,908 | | | | 7.500%, due 09/01/31 | | — | | 35,744 | | 35,744 | |
— | | 32,350 | | 32,350 | | | | 7.500%, due 10/01/30 | | — | | 36,843 | | 36,843 | |
— | | 3,395 | | 3,395 | | | | 7.500%, due 11/01/29 | | — | | 3,877 | | 3,877 | |
— | | 61,319 | | 61,319 | | | | 7.500%, due 11/01/30 | | — | | 65,661 | | 65,661 | |
— | | 57,020 | | 57,020 | | | | 10.000%, due 02/25/19 | | — | | 64,089 | | 64,089 | |
— | | 2,700,419 | | 2,700,419 | | | | 15.018%, due 03/25/38 | | — | | 3,212,002 | | 3,212,002 | |
— | | 368,851 | | 368,851 | | | | 23.228%, due 07/25/35 | | — | | 391,674 | | 391,674 | |
— | | 992,654 | | 992,654 | | | | 24.401%, due 01/25/35 | | — | | 1,379,981 | | 1,379,981 | |
— | | 247,511 | | 247,511 | | | | 27.828%, due 02/25/34 | | — | | 358,044 | | 358,044 | |
— | | 909,534 | | 909,534 | | | | 32.485%, due 11/25/36 | | — | | 1,402,545 | | 1,402,545 | |
| | | | | | | | | | 79,316,910 | | 385,286,593 | | 464,603,503 | |
29
Bond
Portfolio | | Intermediate
Bond
Portfolio | | Intermediate
Bond
Portfolio
Pro Forma
Combined | | | | | | Bond Portfolio | | Intermediate Bond
Portfolio | | Intermediate Bond
Portfolio
Pro Forma
Combined | |
| | | | | | | | Government National Mortgage Association:## 4.1% | | | | | | | |
— | | 1,185,262 | | 1,185,262 | | | | 1.625%, due 02/20/30 | | — | | 1,239,377 | | 1,239,377 | |
— | | 29,522 | | 29,522 | | | | 1.625%, due 12/20/29 | | — | | 30,809 | | 30,809 | |
— | | 49,057 | | 49,057 | | | | 1.750%, due 04/20/28 | | — | | 51,210 | | 51,210 | |
— | | 34,218,000 | | 34,218,000 | | W | | 3.000%, due 07/01/43 | | — | | 33,838,396 | | 33,838,396 | |
— | | 18,569,941 | | 18,569,941 | | ^ | | 4.000%, due 08/16/26 | | — | | 2,247,695 | | 2,247,695 | |
— | | 2,105,647 | | 2,105,647 | | | | 4.000%, due 10/20/41 | | — | | 2,183,210 | | 2,183,210 | |
2,244,456 | | — | | 2,244,456 | | | | 4.000%, due 10/20/42 | | 2,361,507 | | — | | 2,361,507 | |
— | | 3,830,295 | | 3,830,295 | | | | 4.000%, due 11/20/40 | | — | | 4,032,912 | | 4,032,912 | |
— | | 7,401,133 | | 7,401,133 | | | | 4.500%, due 04/15/39 | | — | | 7,886,633 | | 7,886,633 | |
2,000,000 | | — | | 2,000,000 | | | | 4.500%, due 05/20/39 | | 2,208,292 | | — | | 2,208,292 | |
7,648,035 | | — | | 7,648,035 | | ^ | | 4.500%, due 05/20/40 | | 1,100,764 | | — | | 1,100,764 | |
— | | 6,087,413 | | 6,087,413 | | | | 4.500%, due 08/20/41 | | — | | 6,527,245 | | 6,527,245 | |
— | | 14,389,330 | | 14,389,330 | | ^ | | 4.500%, due 12/20/37 | | — | | 1,717,870 | | 1,717,870 | |
11,190,392 | | — | | 11,190,392 | | ^ | | 5.000%, due 03/20/40 | | 2,084,501 | | — | | 2,084,501 | |
— | | 21,374,350 | | 21,374,350 | | ^ | | 5.000%, due 06/16/39 | | — | | 782,592 | | 782,592 | |
— | | 7,969,859 | | 7,969,859 | | ^ | | 5.000%, due 10/20/40 | | — | | 1,021,815 | | 1,021,815 | |
— | | 5,467,613 | | 5,467,613 | | ^ | | 5.000%, due 11/20/39 | | — | | 870,538 | | 870,538 | |
— | | 4,185,372 | | 4,185,372 | | | | 5.140%, due 10/20/60 | | — | | 4,691,602 | | 4,691,602 | |
— | | 2,733,768 | | 2,733,768 | | | | 5.288%, due 10/20/60 | | — | | 3,073,144 | | 3,073,144 | |
— | | 1,568,915 | | 1,568,915 | | | | 5.500%, due 03/20/60 | | — | | 1,772,475 | | 1,772,475 | |
— | | 2,857,296 | | 2,857,296 | | | | 5.500%, due 09/15/39 | | — | | 3,128,546 | | 3,128,546 | |
— | | 12,078,860 | | 12,078,860 | | ^ | | 5.658%, due 06/20/40 | | — | | 1,690,886 | | 1,690,886 | |
— | | 17,414,536 | | 17,414,536 | | ^ | | 6.008%, due 04/20/39 | | — | | 2,398,969 | | 2,398,969 | |
— | | 11,524,021 | | 11,524,021 | | ^ | | 6.008%, due 06/20/38 | | — | | 1,139,372 | | 1,139,372 | |
— | | 12,905,434 | | 12,905,434 | | ^ | | 6.108%, due 05/20/39 | | — | | 1,312,160 | | 1,312,160 | |
— | | 8,784,050 | | 8,784,050 | | ^ | | 6.208%, due 04/20/38 | | — | | 1,143,791 | | 1,143,791 | |
— | | 13,694,903 | | 13,694,903 | | ^ | | 6.308%, due 01/16/39 | | — | | 2,501,646 | | 2,501,646 | |
— | | 5,304,491 | | 5,304,491 | | ^ | | 6.308%, due 05/16/38 | | — | | 747,202 | | 747,202 | |
— | | 9,273,721 | | 9,273,721 | | ^ | | 6.458%, due 09/16/40 | | — | | 1,801,000 | | 1,801,000 | |
— | | 809,230 | | 809,230 | | | | 6.500%, due 09/16/38 | | — | | 917,293 | | 917,293 | |
— | | 4,014,564 | | 4,014,564 | | ^ | | 6.578%, due 02/16/35 | | — | | 770,136 | | 770,136 | |
— | | 11,243,762 | | 11,243,762 | | ^ | | 6.795%, due 04/20/36 | | — | | 1,312,822 | | 1,312,822 | |
— | | 281,631 | | 281,631 | | | | 7.000%, due 05/16/32 | | — | | 321,015 | | 321,015 | |
— | | 1,405,157 | | 1,405,157 | | | | 21.427%, due 03/20/37 | | — | | 1,993,343 | | 1,993,343 | |
— | | 902,895 | | 902,895 | | | | 24.594%, due 04/16/37 | | — | | 1,271,487 | | 1,271,487 | |
| | | | | | | | | | 7,755,064 | | 94,417,191 | | 102,172,255 | |
| | | | | | | | | | | | | | | |
| | | | | | | | Total U.S. Government Agency Obligations
(Cost $769,537,626) | | 132,797,319 | | 651,706,323 | | 784,503,642 | |
30
Bond
Portfolio | | Intermediate
Bond
Portfolio | | Intermediate
Bond
Portfolio
Pro Forma
Combined | | | | | | Bond Portfolio | | Intermediate Bond
Portfolio | | Intermediate Bond
Portfolio
Pro Forma
Combined | |
| | | | FOREIGN GOVERNMENT BONDS: 1.4% | | | | | | | |
| | | | | | | | Foreign Government Bonds: 1.4% | | | | | | | |
— | | 62,000,000 | | BRL | 62,000,000 | | Z | | Brazil Letras do Tesouro Nacional, 8.361%, 04/01/15 | | — | | 23,451,904 | | 23,451,904 | |
— | | 27,360,000 | | BRL | 27,360,000 | | | | Brazil Notas do Tesouro Nacional Series F, 10.000%, 01/01/23 | | — | | 11,513,275 | | 11,513,275 | |
| | | | | | | | | | — | | 34,965,179 | | 34,965,179 | |
| | | | | | | | | | | | | | | |
| | | | | | | | Total Foreign Government Bonds
(Cost $38,139,280) | | — | | 34,965,179 | | 34,965,179 | |
| | | | | | | | | | | | | | | |
Shares | | Shares | | Shares | | | | | | Value | | Value | | Value | |
| | | | | | | | | | | | | | | |
| | | | PREFERRED STOCK: 1.0% | | | | | | | |
| | | | | | | | Financials: 1.0% | | | | | | | |
10,875 | | 55,018 | | 65,893 | | @ | | Aspen Insurance Holdings Ltd. | | 277,313 | | 1,402,959 | | 1,680,272 | |
21,000 | | 108,000 | | 129,000 | | @,P | | The Bank of New York Mellon Corp. | | 497,070 | | 2,556,360 | | 3,053,430 | |
27,655 | | 138,311 | | 165,966 | | @,P | | Discover Financial Services | | 694,140 | | 3,471,606 | | 4,165,746 | |
40,000 | | 204,000 | | 244,000 | | @,P | | Goldman Sachs Group, Inc./The | | 965,600 | | 4,924,560 | | 5,890,160 | |
— | | 115,957 | | 115,957 | | @,P | | PNC Financial Services Group, Inc. | | — | | 3,118,084 | | 3,118,084 | |
24,000 | | 120,000 | | 144,000 | | @,P | | US Bancorp | | 562,800 | | 2,814,000 | | 3,376,800 | |
— | | 45,255 | | 45,255 | | @,P | | US Bancorp | | — | | 1,240,439 | | 1,240,439 | |
— | | 95,136 | | 95,136 | | @,P | | US Bancorp | | — | | 2,673,322 | | 2,673,322 | |
| | | | | | | | | | 2,996,923 | | 22,201,330 | | 25,198,253 | |
| | | | | | | | | | | | | | | |
| | | | | | | | Total Preferred Stock
(Cost $25,135,973) | | 2,996,923 | | 22,201,330 | | 25,198,253 | |
| | | | | | | | | | | | | | | |
| | | | INVESTMENT COMPANIES: 11.7% | | | | | | | |
| | | | | | | | Mutual Funds: 11.7% | | | | | | | |
848,148 | | 4,207,520 | | 5,055,668 | | | | ING Emerging Markets Corporate Debt Fund - Class P | | 8,260,961 | | 40,981,248 | | 49,242,209 | |
2,075,512 | | 10,297,919 | | 12,373,431 | | | | ING Emerging Markets Hard Currency Sovereign Debt Fund - Class P | | 19,468,301 | | 96,594,482 | | 116,062,783 | |
1,097,561 | | 5,495,122 | | 6,592,683 | | | | ING Emerging Markets Local Currency Debt Fund - Class P | | 10,075,610 | | 50,445,220 | | 60,520,830 | |
128,485 | | 1,292,608 | | 1,421,093 | | | | ING High Yield Bond Fund - Class P | | 1,040,727 | | 10,470,129 | | 11,510,856 | |
1,119,048 | | 4,432,524 | | 5,551,572 | | | | ING Investment Grade Credit Fund - Class P | | 11,593,333 | | 45,920,947 | | 57,514,280 | |
| | | | | | | | | | 50,438,932 | | 244,412,026 | | 294,850,958 | |
| | | | | | | | | | | | | | | |
| | | | | | | | Total Investment Companies
(Cost $311,680,804) | | 50,438,932 | | 244,412,026 | | 294,850,958 | |
| | | | | | | | | | | | | | | |
| | | | | | | | Total Long-Term Investments
(Cost $2,838,005,378) | | 480,732,579 | | 2,348,023,330 | | 2,828,755,909 | |
31
Principal
amount† | | Principal
amount† | | Principal
amount† | | | | | | Value | | Value | | Value | |
| | | | SHORT-TERM INVESTMENTS: 1.6% | | | | | | | |
| | | | | | | | Commercial Paper: 1.2% | | | | | | | |
700,000 | | — | | 700,000 | | | | American Electric, 0.250%, 07/11/13 | | 699,947 | | — | | 699,947 | |
— | | 7,500,000 | | 7,500,000 | | | | Con Edison, 0.300%, 07/11/13 | | — | | 7,499,312 | | 7,499,312 | |
2,800,000 | | — | | 2,800,000 | | | | Dominion Resources Inc., 0.280%, 07/24/13 | | 2,799,477 | | — | | 2,799,477 | |
— | | 2,500,000 | | 2,500,000 | | | | Dominion Resources Inc., 0.270%, 07/15/13 | | — | | 2,499,719 | | 2,499,719 | |
4,000,000 | | — | | 4,000,000 | | | | Kinder Morgan, 0.300%, 07/24/13 | | 3,999,200 | | — | | 3,999,200 | |
— | | 1,573,000 | | 1,573,000 | | | | Kinder Morgan, 0.300%, 07/22/13 | | — | | 1,572,712 | | 1,572,712 | |
— | | 1,500,000 | | 1,500,000 | | | | VW Credit, Inc., 0.280%, 07/15/13 | | — | | 1,499,825 | | 1,499,825 | |
— | | 10,000,000 | | 10,000,000 | | | | VW Credit, Inc., 0.280%, 07/16/13 | | — | | 9,998,756 | | 9,998,756 | |
| | | | | | | | | | 7,498,624 | | 23,070,324 | | 30,568,948 | |
| | | | | | | | | | | | | | | |
| | | | | | | | Securities Lending Collateralcc(1): 0.4% | | | | | | | |
1,000,000 | | 2,134,359 | | 3,134,359 | | | | Repurchase Agreement dated 06/28/13, 0.14%, due 07/01/13 (Repurchase Amount $1,000,012, collateralized by various U.S. Government Agency Obligations, 2.166%-5.500%, Market Value plus accrued interest $1,020,000, due 12/01/17-06/01/43) | | 1,000,000 | | 2,134,359 | | 3,134,359 | |
— | | 2,134,359 | | 2,134,359 | | | | Repurchase Agreement dated 06/28/13, 0.15%, due 07/01/13 (Repurchase Amount $2,134,385, collateralized by various U.S. Government Agency Obligations, 1.370%-7.900%, Market Value plus accrued interest $2,177,092, due 05/01/15-01/01/47) | | — | | 2,134,359 | | 2,134,359 | |
— | | 2,134,359 | | 2,134,359 | | | | Repurchase Agreement dated 06/28/13, 0.15%, due 07/01/13 (Repurchase Amount $2,134,385, collateralized by various U.S. Government Agency Obligations, 2.189%-5.000%, Market Value plus accrued interest $2,177,046, due 06/01/18-04/01/43) | | — | | 2,134,359 | | 2,134,359 | |
— | | 449,333 | | 449,333 | | | | Repurchase Agreement dated 06/28/13, 0.15%, due 07/01/13 (Repurchase Amount $449,339, collateralized by various U.S. Government Securities, 0.000%-2.125%, Market Value plus accrued interest $458,320, due 07/05/13-08/15/21) | | — | | 449,333 | | 449,333 | |
32
Bond
Portfolio | | Intermediate
Bond
Portfolio | | Intermediate
Bond
Portfolio
Pro Forma
Combined | | | | | | Bond Portfolio | | Intermediate Bond
Portfolio | | Intermediate Bond
Portfolio
Pro Forma
Combined | |
921,748 | | — | | 921,748 | | | | Repurchase Agreement dated 06/28/13, 0.15%, due 07/01/13 (Repurchase Amount $921,759, collateralized by various U.S. Government Agency Obligations, 2.000%-9.500%, Market Value plus accrued interest $940,183, due 04/01/14-01/01/52) | | 921,748 | | — | | 921,748 | |
— | | 2,134,359 | | 2,134,359 | | | | Repurchase Agreement dated 06/28/13, 0.16%, due 07/01/13 (Repurchase Amount $2,134,387, collateralized by various U.S. Government/U.S. Government Agency Obligations, 0.000%-8.875%, Market Value plus accrued interest $2,177,046, due 12/04/13-08/27/32) | | — | | 2,134,359 | | 2,134,359 | |
| | | | | | | | | | 1,921,748 | | 8,986,769 | | 10,908,517 | |
| | | | | | | | | | | | | | | |
| | | | | | | | Total Short-Term Investments
(Cost $41,477,465) | | 9,420,372 | | 32,057,093 | | 41,477,465 | |
| | | | | | | | | | | | | | | |
| | | | | | | | Total Investments in Securities
(Cost $2,879,482,843) * | 114.0 | % | $ | 490,152,951 | | $ | 2,380,080,423 | | $ | 2,870,233,374 | |
| | | | | | | | Other Assets and Liabilities - Net | (14.0 | ) | (75,074,360 | ) | (278,168,673 | ) | (353,243,033 | ) |
| | | | | | | | Net Assets | 100.0 | % | $ | 415,078,591 | | $ | 2,101,911,750 | | $ | 2,516,990,341 | |
| | | | | | † | | Unless otherwise indicated, principal amount is shown in USD. | | | | | | | |
| | | | | | # | | Securities with purchases pursuant to Rule 144A or section 4(2), under the Securities Act of 1933 and may not be resoldsubject to that rule except to qualified institutional buyers. | | | | | | | |
| | | | | | ## | | On September 7, 2008, the Federal Housing Finance Agency placed the Federal National Mortgage Association and the Federal Home Loan Mortgage Corporation into conservatorship and the U.S. Treasury guaranteed the debt issued by those organizations. | | | | | | | |
| | | | | | @ | | Non-income producing security | | | | | | | |
| | | | | | + | | Step-up basis bonds. Interest rates shown reflect current and next coupon rates. | | | | | | | |
| | | | | | P | | Preferred Stock may be called prior to convertible date. | | | | | | | |
| | | | | | cc | | Securities purchased with cash collateral for securities loaned. | | | | | | | |
| | | | | | W | | Settlement is on a when-issued or delayed-delivery basis. | | | | | | | |
| | | | | | L | | Loaned security, a portion or all of the security is on loan at June 30, 2013. | | | | | | | |
33
Bond
Portfolio | | Intermediate
Bond
Portfolio | | Intermediate
Bond
Portfolio
Pro Forma
Combined | | | | | | Bond Portfolio | | Intermediate Bond
Portfolio | | Intermediate Bond
Portfolio
Pro Forma
Combined | |
| | | | | | ± | | Defaulted security | | | | | | | |
| | | | | | X | | Fair value determined by ING Funds Valuation Committee appointed by the Funds’ Board of Directors/Trustees. | | | | | | | |
| | | | | | ^ | | Interest only securities represent the right to receive the monthly interest payments on an underlying pool of mortgage loans. Principal amount shown represents the notional amount on which current interest is calculated. Payments of principal on the pool reduce the value of the interest only security. | | | | | | | |
| | | | | | Z | | Indicates Zero Coupon Bond; rate shown reflects current effective yield. | | | | | | | |
| | | | | | (1) | | Collateral received from brokers for securities lending was invested into these shot-term investments. | | | | | | | |
| | | | | | BRL | | Brazilian Real | | | | | | | |
| | | | | | | | | | | | | | | |
| | | | | | * | | Cost for federal income tax purposes is: | | $ | 498,150,308 | | $ | 2,385,433,848 | | $ | 2,883,584,156 | |
| | | | | | | | Net unrealized appreciation consists of: | | | | | | | |
| | | | | | | | Gross Unrealized Appreciation | | $ | 3,459,223 | | $ | 56,886,675 | | $ | 60,345,898 | |
| | | | | | | | Gross Unrealized Depreciation | | (11,456,580 | ) | (62,240,101 | ) | (73,696,681 | ) |
| | | | | | | | Net Unrealized Appreciation | | $ | (7,997,357 | ) | $ | (5,353,426 | ) | $ | (13,350,783 | ) |
Fair Value Measurements^
The following is a summary of the fair valuations according to the inputs used as of June 30,2013 in valuing the assets and liabilities:
| | ING Bond
Portfolio | | ING Intermediate Bond
Portfolio | | Pro-forma adjustments | | ING Intermediate Bond
Portfolio Pro Forma
Combined | |
Asset Table | | | | | | | | | |
Investments, at value | | | | | | | | | |
Level 1 - Quoted Prices | | $ | 53,435,855 | | $ | 266,613,356 | | $ | — | | $ | 320,049,211 | |
Level 2 - Other Significant Observable Inputs | | 433,062,524 | | 2,099,559,825 | | — | | 2,532,622,349 | |
Level 3 - Significant Unobservable Inputs | | 3,654,572 | | 13,907,241 | | — | | 17,561,813 | |
Total Investments, at value | | $ | 490,152,951 | | $ | 2,380,080,422 | | $ | — | | $ | 2,870,233,373 | |
^ See Note 2, “Security Valuation” in the Notes to Unaudited Pro Forma Financial Statements for additional information.
34
NOTES TO PRO FORMA FINANCIAL STATEMENTS (UNAUDITED)
Note 1 — Basis of Combination:
The Board of Trustees (the “Board”) of ING Bond Portfolio (“Bond”) and ING Intermediate Bond Portfolio (“Intermediate Bond”) (each a “Portfolio” and collectively, the “Portfolios”), approved an Agreement and Plan of Reorganization dated September 12, 2013 (the “Plan”) whereby, subject to approval by the shareholders of Bond, Intermediate Bond will acquire all of the assets of Bond, subject to the liabilities of such Portfolio, in exchange for Intermediate Bond issuing shares of such fund to shareholders of Bond in a number equal in value to net assets of Bond (the “Merger”).
The Merger will be accounted for as a tax-free merger of investment companies with Intermediate Bond remaining as both the tax and accounting survivor. The unaudited pro forma combined financial statements are presented for the information of the reader and may not necessarily be representative of what the actual combined financial statements would have been had the reorganization(s) occurred at June 30, 2013. The unaudited pro forma Portfolio of Investments and Statement of Assets and Liabilities reflect the financial position of Bond and Intermediate Bond at June 30, 2013. The unaudited pro forma Statement of Operations reflects the results of operations of Bond and Intermediate Bond for the twelve-months ended June 30, 2013. These statements have been derived from the Portfolios’ respective books and records utilized in calculating daily net asset value at the date indicated above for Bond and Intermediate Bond under U.S. generally accepted accounting principles for investment companies. The unaudited pro forma Portfolio of Investments reflects the pro forma combined portfolio holdings of Bond and Intermediate Bond as of June 30, 2013. This unaudited pro forma Portfolio of Investments reflects management’s anticipation that most portfolio transitioning, including the sale of most holdings of Bond and the purchases of assets Intermediate Bond may hold or wish to hold, will take place shortly prior to the closing date of the Mergers. The historical cost of investment securities will be carried forward to the surviving entity and the results of operations of Intermediate Bond for pre-combination periods will not be restated.
The unaudited pro forma Portfolio of Investments, and Statement of Assets and Liabilities and Statement of Operations should be read in conjunction with the historical financial statements of each Portfolio, which are incorporated by reference in the Statement of Additional Information.
Note 2 — Security Valuation:
Investments in equity securities traded on a national securities exchange are valued at the last reported sale price. Securities reported by NASDAQ will be valued at the NASDAQ official closing price. Portfolio securities traded on an exchange or NASDAQ for which there has been no sale and securities traded in the over-the-counter-market are valued at the mean between the last reported bid and ask prices. All investments quoted in foreign currencies will be valued daily in U.S. dollars on the basis of the foreign currency exchange rates prevailing at the time such valuation is determined by a Portfolio’s custodian. Debt securities are valued at bid prices obtained from independent services or from one or more dealers making markets in the securities and may be adjusted based on a Portfolio’s valuation procedures. U.S. Government obligations are valued by using market quotations or independent pricing services that use prices provided by market-makers or estimates of market values obtained from yield data relating to instruments or securities with similar characteristics. Securities for which market quotations are not readily available are valued at their fair values as determined in good faith and in accordance with policies set by the Board of each Portfolio. Among elements of analysis, the Board has authorized the use of one or more research services to assist with the determination of the fair value of foreign securities in light of significant events. Research services use statistical analyses and quantitative models to help determine fair value as of the time a Portfolio calculates its net asset value. Investments in securities maturing in 60 days or less are valued at amortized cost, which, when combined with accrued interest, approximates market value.
Note 3 — Capital Shares:
The unaudited pro forma net asset value per share assumes additional shares of common Intermediate Bond issued in connection with the proposed acquisition of Bond by Intermediate Bond as of June 30, 2013. The number of additional shares issued was calculated by dividing the net assets of each class of Bond by the respective class net asset value per share of Intermediate Bond.
Note 4 — Merger Costs:
ING Investments, LLC (the “Adviser”) will bear the costs associated with obtaining shareholder approval, including, but not limited to, vote solicitation and SEC filings.
35
Merger costs to be incurred by the Adviser are estimated at approximately $132,500. These costs represent the estimated expenses of the Portfolio carrying out its obligations under the Plan and consist of management’s estimate of legal fees, accounting fees, printing costs and mailing charges related to the proposed merger.
Note 5 — Use of Estimates in Preparation of Pro Forma Financial Statements:
Management of the Portfolios has made certain estimates and assumptions relating to the reporting of assets, liabilities, income, and expenses to prepare these financial statements in conformity with U.S. generally accepted accounting principles for investment companies. Actual results could differ from these estimates.
Note 6 — Federal Income Taxes:
It is the policy of the Portfolios to comply with subchapter M of the Internal Revenue Code and related excise tax provisions applicable to regulated investment companies and to distribute substantially all of their net investment income and any net realized capital gains to their shareholders. Therefore, no federal income tax provision is required. No capital gain distributions shall be made until any capital loss carryforwards have been fully utilized or expired. A portion of the amount of these capital loss carryforwards may be limited in the future.
36
ING Intermediate Bond Portfolio
(“Registrant”)
PART C:
OTHER INFORMATION
ITEM 15. INDEMNIFICATION
Article 5.3 of ING Intermediate Bond Portfolio’s Amended and Restated Declaration of Trust, as amended, provides the following:
5.3 Indemnification. The Trust shall indemnify its trustees and officers, and any person who serves at the request of the Trust as a director, officer, employee, or agent of another corporation, partnership, joint venture, trust, or other enterprise as follows:
(a) Every person who is or has been a trustee or officer of the Trust and persons who serve at the Trust’s request as director or officer of another corporation, partnership, joint venture, trust, or other enterprise shall be indemnified by the Trust to the fullest extent permitted by law against liability and against all expenses reasonably incurred or paid in connection with any debt, claim, action, demand, suit, proceeding, judgment, decree, liability or obligation of any kind in which he/she becomes involved as a party or otherwise by virtue of being or having been a trustee or officer of the Trust or of another corporation, partnership, joint venture, trust, or other enterprise at the request of the Trust and against amounts paid or incurred in the settlement thereof.
(b) The words “claim,” “action,” “suit,” or “proceeding” shall apply to all claims, actions, suits, or proceedings (civil, criminal, administrative, legislative, investigative, or other, including appeals), actual or threatened, and the words “liability” and “expenses” shall include, without limitation, attorneys’ fees, costs, judgments, amounts paid in settlement, fines, penalties, and other liabilities.
(c) No indemnification shall be provided hereunder to a trustee, officer, employee, or agent against any liability to the Trust, a Series thereof, or its shareholders by reason of willful misfeasance, bad faith, gross negligence, or reckless disregard of the duties involved in the conduct of office.
(d) The right of indemnification herein provided may be insured against by policies maintained by the Trust, shall be severable; shall not affect any other rights to which any trustee, officer, employee, or agent may now or hereafter be entitled; shall continue as to a person who has ceased to be such trustee, officer, employee, or agent; and shall inure to the benefit of the heirs, executors, and administrators of such a person.
(e) In the absence of a final decision on the merits by a court or other body before which such proceeding was brought, an indemnification payment will not be made, except as provided in paragraph (f) of this Article, unless in the absence of such a decision, a reasonable determination based upon a factual review has been made: (i) by a majority vote of a quorum of non-party trustees who are not interested persons of the Trust, or (ii) by independent legal counsel in a written opinion that the indemnitee was not liable for an act of willful misfeasance, bad faith, gross negligence, or reckless disregard of duties.
(f) The Trust further undertakes that advancement of expenses incurred in the defense of a proceeding (upon undertaking for repayment unless it is ultimately determined that indemnification is appropriate) against a trustee or officer of the Trust will not be made absent the fulfillment of at least one of the following conditions: (i) the indemnitee provides security for this undertaking; (ii) the Trust is insured against losses arising by reason of any lawful advances; or (iii) a majority of a quorum of disinterested non-party trustees or independent legal counsel in a written opinion shall have determined, based on a review of readily available facts (as opposed to a full trial-type inquiry), that there is reason to believe the indemnitee ultimately will be entitled to indemnification.
(g) No amendment of this Declaration or repeal of any of its provisions shall limit or eliminate the rights of indemnification provided hereunder with respect to acts or omission occurring prior to such amendment or repeal.
In addition, ING Intermediate Bond Portfolio’s officers and trustees are currently covered under a directors and officers errors and omissions liability insurance policy issued by ICI Mutual Insurance Company.
Insofar as indemnification for liabilities arising under the Securities Act of 1933, as amended (the “1933 Act”) may be permitted to trustees, officers, and controlling persons of ING Intermediate Bond Portfolio pursuant to the foregoing provisions or otherwise, ING Intermediate Bond Portfolio has been advised that in the opinion of the Securities and Exchange Commission such indemnification is against public policy as expressed in the 1933 Act and is therefore, unenforceable. In the event that a claim for indemnification against such liabilities (other than the payment by ING Intermediate Bond Portfolio of expenses incurred or paid by a trustee, officer, or controlling person of ING Intermediate Bond Portfolio in connection with the successful defense of any action, suit, or proceeding) is asserted by such trustee, officer, or controlling person in connection with the shares being registered, ING Intermediate Bond Portfolio will, unless in the opinion of its counsel the
1
matter has been settled by controlling precedent, submit to a court of appropriate jurisdiction the question whether such indemnification by it is against public policy, as expressed in the Act and be governed by final adjudication of such issue.
Pursuant to Indemnification Agreements between the Trust and each Independent Trustee, the Trust indemnifies each Independent Trustee against any liabilities resulting from the Independent Trustee’s serving in such capacity, provided that the Independent Trustee has not engaged in certain disabling conduct.
ITEM 16. EXHIBITS
1. (a) Amended and Restated Declaration of Trust dated May 1, 2002 — Filed as an exhibit to Post-Effective Amendment No. 59 to the Registrant’s Form N-1A Registration Statement on April 30, 2004 and incorporated herein by reference.
(b) Certificate of Amendment of Declaration of Trust dated June 26, 2002 — Filed as an Exhibit to Post-Effective Amendment No. 57 to the Registrant’s Form N-1A Registration Statement on April 30, 2003 and incorporated herein by reference.
(c) Certificate Evidencing Establishment and Declaration of Classes of Shares dated June 20, 2003 — Filed as an exhibit to Post-Effective Amendment No. 59 to the Registrant’s Form N-1A Registration Statement on April 30, 2004 and incorporated herein by reference.
(d) Certificate of Amendment of Declaration of Trust, effective August 6, 2004 — Filed as an Exhibit to Post-Effective Amendment No. 60 to the Registrant’s Form N-1A Registration Statement on February 11, 2005 and incorporated herein by reference.
(e) Re-Designation of Classes of Shares of Beneficial Interest, effective April 30, 2004, (redesignation of Class R shares Class I shares) — Filed as an Exhibit to Post-Effective Amendment No. 60 to the Registrant’s Form N-1A Registration Statement on February 11, 2005 and incorporated herein by reference.
(f) Establishment and Designation of Classes of Shares of Beneficial Interest, $1.00 Par Value, effective April 29, 2005, (Issuance of Class ADV Shares). — Filed as an exhibit to Post-Effective Amendment No. 62 to the Registrant’s Form N-1A Registration Statement on April 28, 2005 and incorporated herein by reference.
(g) Establishment and Designation of Classes of Shares of Beneficial Interest, $1.00 Par Value, effective February 3, 2009, (Issuance of Class S2 Shares). ��� Filed as an exhibit to Post-Effective Amendment No. 72 to the Registrant’s Form N-1A Registration Statement on February 20, 2009 and incorporated herein by reference.
(h) Certificate of Amendment of Declaration of Trust, effective May 1, 2009 — Filed as an exhibit to Post-Effective Amendment No. 73 to the Registrant’s Form N-1A Registration Statement on April 30, 2009 and incorporated herein by reference.
2. Second Amended and Restated Bylaws — Filed as an Exhibit to Post-Effective Amendment No. 64 to the Registrant’s Form N-1A Registration Statement on April 27, 2004 and incorporated herein by reference.
(a) Amendment dated March 11, 2010 to the Second Amended and Restated Bylaws — Filed as an Exhibit to Post-Effective Amendment No. 77 to the Registrant’s Form N-1A Registration Statement on April 25, 2011 and incorporated herein by reference.
3. Not Applicable.
4. Agreement and Plan of Reorganization between ING Bond Portfolio, a series of ING Investors Trust, and ING Intermediate Bond Portfolio— Attached as Appendix A to the Proxy Statement/Prospectus.
5. Instruments Defining Rights of Holders — Filed as an Exhibit to Post-Effective Amendment No. 46 to the Registrant’s Form N-1A Registration Statement on June 7, 1996 and incorporated herein by reference.
6. (a) Investment Management Agreement between ING Investments, LLC and ING Intermediate Bond Portfolio (formerly, ING VP Intermediate Bond Portfolio) dated March 1, 2002 — Filed as an Exhibit to Post-Effective Amendment No. 55 to the Registrant’s Form N-1A Registration Statement on April 19, 2002 and incorporated herein by reference.
2
(1) Amended Schedule A dated December 2009, to Investment Management Agreement between the ING Investments, LLC and ING Intermediate Bond Portfolio dated March 1, 2002 — Filed as an Exhibit to Post-Effective Amendment No. 74 to the Registrant’s Form N-1A Registration Statement on February 10, 2010 and incorporated herein by reference.
(2) Amendment, effective January 1, 2007, to Investment Management Agreement between ING Investments, LLC and ING Intermediate Bond Portfolio dated March 1, 2002 — Filed as an exhibit to Post-Effective Amendment No. 66 to the Registrant’s Form N-1A Registration Statement on April 27, 2007 and incorporated herein by reference.
(b) Sub-Advisory Agreement between ING Investments, LLC and ING Investment Management Co. LLC (formerly, Aeltus Investment Management, Inc.) dated March 1, 2002 — Filed as an Exhibit to Post-Effective Amendment No. 55 to the Registrant’s Form N-1A Registration Statement on April 19, 2002 and incorporated herein by reference.
(1) First Amendment, effective as of July 29, 2003, to the Sub-Advisory Agreement between ING Investments, LLC and ING Investment Management Co. LLC dated March 1, 2002 — Filed as an exhibit to Post-Effective Amendment No. 59 to the Registrant’s Form N-1A Registration Statement on April 30, 2004 and incorporated herein by reference.
(2) Second Amendment, effective January 1, 2007, to the Sub-Advisory Agreement between ING Investments, LLC and ING Investment Management Co. LLC dated March 1, 2002 — Filed as an exhibit to Post-Effective Amendment No. 66 to the Registrant’s Form N-1A Registration Statement on April 27, 2007 and incorporated herein by reference.
(3) Third Amendment, effective October 1, 2007 to the Sub-Advisory Agreement between ING Investments, LLC and ING Investment Management Co. LLC dated March 1, 2002 — Filed as an exhibit to Post-Effective Amendment No. 68 to the Registrant’s Form N-1A Registration Statement on April 25, 2008 and incorporated herein by reference.
(4) Amended Schedule A dated December 2009 to the Sub-Advisory Agreement between ING Investments, LLC and ING Investment Management Co. LLC dated March 1, 2002 — Filed as an Exhibit to Post-Effective Amendment No. 74 to the Registrant’s Form N-1A Registration Statement on February 10, 2010 and incorporated herein by reference.
7. (a) Distribution Agreement between ING Intermediate Bond Portfolio (formerly, ING VP Intermediate Bond Portfolio) and ING Investments Distributor, LLC (formerly, ING Funds Distributor, LLC) dated January 1, 2002 — Filed as an Exhibit to Post-Effective Amendment No. 55 to the Registrant’s Form N-1A Registration Statement on April 19, 2002 and incorporated herein by reference.
(1) Amended Schedule of Approvals dated December 2011 to the Distribution Agreement between ING Intermediate Bond Portfolio and ING Investments Distributor, LLC dated January 1, 2002 — Filed as an Exhibit to Post-Effective Amendment No. 80 to the Registrant’s Form N-1A Registration Statement on April 26, 2012 and incorporated herein by reference.
(2) Substitution Agreement dated October 8, 2002 to the Distribution Agreement between ING Intermediate Bond Portfolio and ING Investments Distributor, LLC dated January 1, 2002 — Filed as an exhibit to Post-Effective Amendment No. 59 to the Registrant’s Form N-1A Registration Statement on April 30, 2004 and incorporated herein by reference.
8. Directors’ Deferred Compensation Plan dated September 24, 1997 — Filed as an Exhibit to Post-Effective Amendment No. 48 to the Registrant’s Form N-1A Registration Statement on April 27, 1998 and incorporated herein by reference.
9. (a) Custody Agreement with The Bank of New York Mellon dated January 6, 2003 — Filed as an exhibit to Post-Effective Amendment No. 59 to the Registrant’s Form N-1A Registration Statement on April 30, 2004 and incorporated herein by reference.
(1) Amended Exhibit A dated March 28, 2013, to the Custody Agreement with The Bank of New York Mellon dated January 6, 2003 — Filed as an exhibit to Post-Effective Amendment No. 83 to the Registrant’s Form N-1A Registration Statement on April 25, 2013 and incorporated herein by reference.
3
(b) Foreign Custody Manager Agreement with the Bank of New York Mellon dated January 6, 2003 — Filed as an exhibit to Post-Effective Amendment No. 59 to the Registrant’s Form N-1A Registration Statement on April 30, 2004 and incorporated herein by reference.
(1) Amended Exhibit A dated March 28, 2013, to the Foreign Custody Manager Agreement with The Bank of New York Mellon dated January 6, 2003 — Filed as an exhibit to Post-Effective Amendment No. 83 to the Registrant’s Form N-1A Registration Statement on April 25, 2013 and incorporated herein by reference.
(2) Amended Schedule 2 dated as of June 4, 2008 to the Foreign Custody Manager Agreement with the Bank of New York Mellon dated January 6, 2003 — Filed as an exhibit to Post-Effective Amendment No. 73 to the Registrant’s Form N-1A Registration Statement on April 30, 2009 and incorporated herein by reference.
(c) Securities Lending Agreement and Guaranty with The Bank of New York Mellon dated August 7, 2003 — Filed as an exhibit to Post-Effective Amendment No. 59 to the Registrant’s Form N-1A Registration Statement on April 30, 2004 and incorporated herein by reference.
(1) Amended Exhibit A dated March 28, 2013, to the Securities Lending Agreement and Guaranty with The Bank of New York Mellon dated August 7, 2003 — Filed as an exhibit to Post-Effective Amendment No. 83 to the Registrant’s Form N-1A Registration Statement on April 25, 2013 and incorporated herein by reference.
10. (a) Restated Distribution Plan for Class S shares, effective March 24, 2004 — Filed as an exhibit to Post-Effective Amendment No. 59 to the Registrant’s Form N-1A Registration Statement on April 30, 2004 and incorporated herein by reference.
(1) Amended Schedule 1 to the Restated Distribution Plan for Class S Shares with respect to ING Intermediate Bond Portfolio (Class S shares) — Filed as an Exhibit to Post-Effective Amendment No. 74 to the Registrant’s Form N-1A Registration Statement on February 10, 2010 and incorporated herein by reference.
(b) Shareholder Service and Distribution Plan for Class ADV shares, effective April 29, 2005 — Filed as an Exhibit to Post-Effective Amendment No. 74 to the Registrant’s Form N-1A Registration Statement on February 10, 2010 and incorporated herein by reference.
(c) Shareholder Service and Distribution Plan for Class S2 shares, effective February 28, 2009 — Filed as an Exhibit to Post-Effective Amendment No. 74 to the Registrant’s Form N-1A Registration Statement on February 10, 2010 and incorporated herein by reference.
(1) Form Of - Side Agreement dated May 1, 2013 to the Shareholder Service and Distribution Plan for Class S2 Shares dated February 28, 2009 — Filed as an exhibit to Post-Effective Amendment No. 83 to the Registrant’s Form N-1A Registration Statement on April 25, 2013 and incorporated herein by reference.
(d) Second Amended and Restated Multi-Class Plan pursuant to Rule 18f-3 for ING Intermediate Bond Portfolio, effective February 28, 2009 — Filed as an exhibit to Post-Effective Amendment No. 72 to the Registrant’s Form N-1A Registration Statement on February 20, 2009 and incorporated herein by reference.
11. Opinion and Consent of Counsel — Filed herein.
12. Opinion and Consent of Counsel Supporting Tax Matters and Consequences — To be filed by subsequent post-effective amendment.
13. (a) Amended and Restated Administration Agreement between ING Funds Services, LLC and ING Intermediate Bond Portfolio (formerly ING VP Intermediate Bond Portfolio) dated April 1, 2002 as amended and restated December 31, 2008 — Filed as an exhibit to Post-Effective Amendment No. 73 to the Registrant’s Form N-1A Registration Statement on April 30, 2009 and incorporated herein by reference.
(1) Amended Schedule A, dated December 2009, to the Amended and Restated Administration Agreement between ING Funds Services, LLC and ING Intermediate Bond Portfolio dated April 1, 2002 as amended and restated December 31, 2008 — Filed as an Exhibit to Post-Effective Amendment No. 74 to the Registrant’s Form N-1A Registration Statement on February 10, 2010 and incorporated herein by reference.
4
(b) License Agreement between Aetna Life Insurance Company and Aetna Income Shares, Inc. dated March 2, 1973 — Filed as an Exhibit to Post-Effective Amendment No. 47 to the Registrant’s Form N-1A Registration Statement on April 11, 1997 and incorporated herein by reference.
(c) Fund Accounting Agreement with The Bank of New York Mellon dated January 6, 2003 — Filed as an exhibit to Post-Effective Amendment No. 59 to the Registrant’s Form N-1A Registration Statement on April 30, 2004 and incorporated herein by reference.
(1) Amended Exhibit A dated March 28, 2013, to the Fund Accounting Agreement with The Bank of New York Mellon dated January 6, 2003 — Filed as an exhibit to Post-Effective Amendment No. 83 to the Registrant’s Form N-1A Registration Statement on April 25, 2013 and incorporated herein by reference.
(d) Allocation Agreement (Investment Company Blanket Bond) dated September 24, 2003 — Filed as an exhibit to Post-Effective Amendment No. 59 to the Registrant’s Form N-1A Registration Statement on April 30, 2004 and incorporated herein by reference.
(1) Amended Schedule A dated April 2007 to the Allocation Agreement (Investment Company Blanket Bond) September 24, 2003 — Filed as an exhibit to Post-Effective Amendment No. 68 to the Registrant’s Form N-1A Registration Statement on April 25, 2008 and incorporated herein by reference.
(e) Allocation Agreement (Directors and Officers Liability) dated September 26, 2002 — Filed as an exhibit to Post-Effective Amendment No. 66 to the Registrant’s Form N-1A Registration Statement on April 27, 2007 and incorporated herein by reference.
(1) Amended Schedule A dated April 2007 to the Allocation Agreement (Directors and Officers Liability) September 26, 2003 — Filed as an exhibit to Post-Effective Amendment No. 68 to the Registrant’s Form N-1A Registration Statement on April 25, 2008 and incorporated herein by reference.
(f) Transfer Agency Services Agreement between ING Intermediate Bond Portfolio and BNY Mellon Investment Servicing (U.S.) Inc. (formerly, PNC Global Investment Servicing (U.S.) Inc.) dated February 25, 2009 — Filed as an exhibit to Post-Effective Amendment No. 73 to the Registrant’s Form N-1A Registration Statement on April 30, 2009 and incorporated herein by reference.
(1) Amendment, effective February 8, 2011 to the Transfer Agency Services Agreement dated February 25, 2009 — Filed as an Exhibit to Post-Effective Amendment No. 77 to the Registrant’s Form N-1A Registration Statement on April 25, 2011 and incorporated herein by reference.
(2) Amended Exhibit A, effective February 29, 2012, to the Transfer Agency Services Agreement dated February 25, 2009 — Filed as an Exhibit to Post-Effective Amendment No. 80 to the Registrant’s Form N-1A Registration Statement on April 26, 2012 and incorporated herein by reference.
(g) Participation Agreement between ING Intermediate Bond Portfolio (formerly, ING VP Bond Portfolio), ReliaStar Life Insurance Company, and ING Investments Distributor, LLC (formerly, ING Funds Distributor, LLC) dated May 1, 2002 — Filed as an exhibit to Post-Effective Amendment No. 59 to the Registrant’s Form N-1A Registration Statement on April 30, 2004 and incorporated herein by reference.
(1) Amendment, executed September 22, 2003 to the Participation Agreement between ING Intermediate Bond Portfolio, ReliaStar Life Insurance Company, and ING Investments Distributor, LLC dated May 1, 2002 — Filed as an exhibit to Post-Effective Amendment No. 59 to the Registrant’s Form N-1A Registration Statement on April 30, 2004 and incorporated herein by reference.
(h) Participation Agreement between ING Intermediate Bond Portfolio (formerly, ING VP Bond Portfolio), ReliaStar Life Insurance Company of New York, and ING Investments Distributor, LLC (formerly, ING Funds Distributor, LLC) dated May 1, 2002 — Filed as an exhibit to Post-Effective Amendment No. 59 to the Registrant’s Form N-1A Registration Statement on April 30, 2004 and incorporated herein by reference.
(i) Participation Agreement between ING Intermediate Bond Portfolio (formerly, ING VP Bond Portfolio), Security Life of Denver Insurance Company, and ING Investments Distributor, LLC (formerly, ING Funds Distributor, LLC) dated May 1, 2001 — Filed as an exhibit to Post-Effective Amendment No. 59 to the Registrant’s Form N-1A Registration Statement on April 30, 2004 and incorporated herein by reference.
5
(j) Participation Agreement between ING Intermediate Bond Portfolio (formerly, ING VP Bond Portfolio), Southland Life Insurance Company, and ING Investments Distributor, LLC (formerly, ING Funds Distributor, LLC) dated May 1, 2001 — Filed as an exhibit to Post-Effective Amendment No. 59 to the Registrant’s Form N-1A Registration Statement on April 30, 2004 and incorporated herein by reference.
(k) Participation Agreement between Aetna Insurance Company of America, Aetna Variable Fund, Aetna Variable Encore Fund, Aetna Income Shares, Aetna Balanced VP, Inc., Aetna GET Fund, Aetna Generation Portfolios, Inc., Aetna Variable Portfolios, Inc., and Aeltus Investment Management, Inc. dated May 1, 1998 — Filed as an exhibit to Post-Effective Amendment No. 59 to the Registrant’s Form N-1A Registration Statement on April 30, 2004 and incorporated herein by reference.
(1) Amendment No. 1, executed May 1, 2000, to the Participation Agreement between Aetna Insurance Company of America, Aetna Variable Fund, Aetna Variable Encore Fund, Aetna Income Shares, Aetna Balanced VP, Inc., Aetna GET Fund, Aetna Generation Portfolios, Inc., Aetna Variable Portfolios, Inc., and Aeltus Investment Management, Inc. dated May 1, 1998 — Filed as an exhibit to Post-Effective Amendment No. 59 to the Registrant’s Form N-1A Registration Statement on April 30, 2004 and incorporated herein by reference.
(2) Amendment No. 2 executed June 26, 2001, to the Participation Agreement between Aetna Insurance Company of America, Aetna Variable Fund, Aetna Variable Encore Fund, Aetna Income Shares, Aetna Balanced VP, Inc., Aetna GET Fund, Aetna Generation Portfolios, Inc., Aetna Variable Portfolios, Inc., and Aeltus Investment Management, Inc. dated May 1, 1998 — Filed as an exhibit to Post-Effective Amendment No. 59 to the Registrant’s Form N-1A Registration Statement on April 30, 2004 and incorporated herein by reference.
(l) Participation Agreement between Aetna Life Insurance and Annuity Company, Aetna Variable Fund, Aetna Variable Encore Fund, Aetna Income Shares, Aetna Balanced VP, Inc., Aetna GET Fund, Aetna Generation Portfolios, Inc., Aetna Variable Portfolios, Inc., and Aeltus Investment Management, Inc. dated May 1, 1998 — Filed as an exhibit to Post-Effective Amendment No. 59 to the Registrant’s Form N-1A Registration Statement on April 30, 2004 and incorporated herein by reference.
(1) Amendment, executed November 9, 1998, to the Fund Participation Agreement between Aetna Life Insurance and Annuity Company, Aetna Variable Fund, Aetna Variable Encore Fund, Aetna Income Shares, Aetna Balanced VP, Inc., Aetna GET Fund, Aetna Generation Portfolios, Inc., Aetna Variable Portfolios, Inc., and Aeltus Investment Management, Inc. dated May 1, 1998 — Filed as an exhibit to Post-Effective Amendment No. 59 to the Registrant’s Form N-1A Registration Statement on April 30, 2004 and incorporated herein by reference.
(2) Amendment, executed June 1, 1999, to the Fund Participation Agreement between Aetna Life Insurance and Annuity Company, Aetna Variable Fund, Aetna Variable Encore Fund, Aetna Income Shares, Aetna Balanced VP, Inc., Aetna GET Fund, Aetna Generation Portfolios, Inc., Aetna Variable Portfolios, Inc., and Aeltus Investment Management, Inc. dated May 1, 1998 — Filed as an exhibit to Post-Effective Amendment No. 59 to the Registrant’s Form N-1A Registration Statement on April 30, 2004 and incorporated herein by reference.
(3) Second Amendment, executed December 31, 1999, to the Fund Participation Agreement between Aetna Life Insurance and Annuity Company, Aetna Variable Fund, Aetna Variable Encore Fund, Aetna Income Shares, Aetna Balanced VP, Inc., Aetna GET Fund, Aetna Generation Portfolios, Inc., Aetna Variable Portfolios, Inc., and Aeltus Investment Management, Inc. dated May 1, 1998 — Filed as an exhibit to Post-Effective Amendment No. 59 to the Registrant’s Form N-1A Registration Statement on April 30, 2004 and incorporated herein by reference.
(4) Third Amendment, executed February 11, 2000, to the Fund Participation Agreement between Aetna Life Insurance and Annuity Company, Aetna Variable Fund, Aetna Variable Encore Fund, Aetna Income Shares, Aetna Balanced VP, Inc., Aetna GET Fund, Aetna Generation Portfolios, Inc., Aetna Variable Portfolios, Inc., and Aeltus Investment Management, Inc. dated May 1, 1998 — Filed as an exhibit to Post-Effective Amendment No. 59 to the Registrant’s Form N-1A Registration Statement on April 30, 2004 and incorporated herein by reference.
(5) Fourth Amendment, executed May 1, 2000, to the Fund Participation Agreement between Aetna Life Insurance and Annuity Company, Aetna Variable Fund, Aetna Variable Encore Fund, Aetna Income Shares, Aetna Balanced VP, Inc., Aetna GET Fund, Aetna Generation Portfolios, Inc., Aetna Variable Portfolios, Inc., and Aeltus Investment Management, Inc. dated May 1, 1998 — Filed as an exhibit to Post-Effective Amendment No. 59 to the Registrant’s Form N-1A Registration Statement on April 30, 2004 and incorporated herein by reference.
6
(6) Fifth Amendment, executed February 27, 2001, to the Fund Participation Agreement between Aetna Life Insurance and Annuity Company, Aetna Variable Fund, Aetna Variable Encore Fund, Aetna Income Shares, Aetna Balanced VP, Inc., Aetna GET Fund, Aetna Generation Portfolios, Inc., Aetna Variable Portfolios, Inc., and Aeltus Investment Management, Inc. dated May 1, 1998 — Filed as an exhibit to Post-Effective Amendment No. 59 to the Registrant’s Form N-1A Registration Statement on April 30, 2004 and incorporated herein by reference.
(7) Sixth Amendment, executed June 19, 2001, to the Fund Participation Agreement between Aetna Life Insurance and Annuity Company, Aetna Variable Fund, Aetna Variable Encore Fund, Aetna Income Shares, Aetna Balanced VP, Inc., Aetna GET Fund, Aetna Generation Portfolios, Inc., Aetna Variable Portfolios, Inc., and Aeltus Investment Management, Inc. dated May 1, 1998 — Filed as an exhibit to Post-Effective Amendment No. 59 to the Registrant’s Form N-1A Registration Statement on April 30, 2004 and incorporated herein by reference.
(m) Fund Participation Agreement between Golden American Life Insurance Company, Aetna Variable Fund, Aetna Variable Encore Fund, Aetna Income Shares, Aetna Balanced VP, Inc., Aetna GET Fund, Aetna Generation Portfolios, Inc., Aetna Variable Portfolios, Inc., and Aeltus Investment Management, Inc. dated July 16, 2001 — Filed as an exhibit to Post-Effective Amendment No. 59 to the Registrant’s Form N-1A Registration Statement on April 30, 2004 and incorporated herein by reference.
14. Consent of independent registered public accounting firm — Filed herein.
15. Not applicable.
16. Powers of Attorney — Filed herein.
17. Not applicable.
ITEM 17. UNDERTAKINGS
1. The undersigned registrant agrees that prior to any public reoffering of the securities registered through the use of a prospectus which is a part of this registration statement by any person or party who is deemed to be an underwriter within the meaning of Rule 145(c) under the Securities Act (17 CFR 230.145(c)), the reoffering prospectus will contain the information called for by the applicable registration form for reofferings by persons who may be deemed underwriters, in addition to the information called for by the other items of the applicable form.
2. The undersigned registrant agrees that every prospectus that is filed under paragraph (1) above will be filed as a part of an amendment to the registration statement and will not be used until the amendment is effective, and that, in determining any liability under the 1933 Act, each post-effective amendment shall be deemed to be a new registration statement for the securities offered therein, and the offering of the securities at that time shall be deemed to be the initial bona fide offering of them.
3. The undersigned registrant undertakes to file a post-effective amendment to this registration statement upon the closing of the reorganization described in this registration statement that contains an opinion of counsel supporting the tax matters.
7
SIGNATURES
Pursuant to the requirements of the Securities Act of 1933, as amended (the “1933 Act”), the Registrant certifies that it meets all the requirements for effectiveness of this Registration Statement under Rule 485(b) under the 1933 Act and has duly caused this Registration Statement on Form N-14 to be signed on its behalf by the undersigned, thereunto duly authorized, in the city of Scottsdale and State of Arizona on the 6th day of December, 2013.
| ING Intermediate Bond Portfolio |
| | |
| | |
| By: | /s/Huey P. Falgout, Jr. |
| | Huey P. Falgout, Jr. |
| | Secretary |
Pursuant to the requirements of the 1933 Act, this Registration Statement has been signed below by the following persons in the capacities and on the date indicated.
Signature | | Title | | Date |
| | | | |
| | | | |
Todd Modic* | | Senior Vice President Chief/Principal Financial Officer | | December 6, 2013 |
| | | | |
| | | | |
John V. Boyer* | | Trustee | | December 6, 2013 |
| | | | |
| | | | |
Patricia W. Chadwick* | | Trustee | | December 6, 2013 |
| | | | |
| | | | |
Albert E. DePrince, Jr.* | | Trustee | | December 6, 2013 |
| | | | |
| | | | |
Peter S. Drotch* | | Trustee | | December 6, 2013 |
| | | | |
| | | | |
J. Michael Earley* | | Trustee | | December 6, 2013 |
| | | | |
| | | | |
Russell H. Jones* | | Trustee | | December 6, 2013 |
| | | | |
| | | | |
Patrick W. Kenny* | | Trustee | | December 6, 2013 |
| | | | |
| | | | |
Shaun P. Mathews* | | Interested Trustee and President and Chief Executive Officer | | December 6, 2013 |
| | | | |
| | | | |
Joseph E. Obermeyer | | Trustee | | December 6, 2013 |
| | | | |
| | | | |
Sheryl K. Pressler* | | Trustee | | December 6, 2013 |
| | | | |
| | | | |
Colleen D. Baldwin* | | Trustee | | December 6, 2013 |
8
Roger B. Vincent* | | Trustee | | December 6, 2013 |
| | | | |
| | | | |
*By: | /s/ Huey P. Falgout, Jr. | | | | |
| Huey P. Falgout, Jr. | | | | |
| as Attorney-in-Fact** | | | | |
** Powers of Attorney for Todd Modic and each Trustee - Filed herein.
9
EXHIBIT INDEX
EXHIBIT NUMBER | | EXHIBIT DESCRIPTION |
(11) | | Opinion and Consent of Counsel |
| | |
(14) | | Consent of Independent Registered Public Accounting Firm |
| | |
(16) | | Powers of Attorney |
10