OMB APPROVAL
OMB Number: 3235-0570
Expires: August 31, 2010
Estimated average burden hours per response: 18.9
UNITED STATES
SECURITIES AND EXCHANGE COMMISSION
Washington, D.C. 20549
FORM N-CSR
CERTIFIED SHAREHOLDER REPORT OF
REGISTERED MANAGEMENT INVESTMENT COMPANIES
Investment Company Act file number: 811-2514
ING Variable Funds
(Exact name of registrant as specified in charter)
7337 E. Doubletree Ranch Rd., Scottsdale, AZ | | 85258 |
(Address of principal executive offices) | | (Zip code) |
CT Corporation System, 101 Federal Street, Boston, MA 02110
(Name and address of agent for service)
Registrant’s telephone number, including area code: 1-800-992-0180
Date of fiscal year end: | December 31 |
| |
Date of reporting period: | January 1, 2007 to December 31, 2007 |
Item 1. Reports to Stockholders.
The following is a copy of the report transmitted to stockholders pursuant to Rule 30e-1 under the Act (17 CFR 270.30e-1):

Funds
Annual Report
December 31, 2007
Classes ADV, I and S
ING Variable Product Funds
Domestic Equity and Income Portfolios
n ING VP Balanced Portfolio
n ING VP Growth and Income Portfolio
Fixed Income Portfolios
n ING VP Intermediate Bond Portfolio
n ING VP Money Market Portfolio
Domestic Equity Growth Portfolios
n ING VP Growth Portfolio
n ING VP Small Company Portfolio
Global and International Equity Portfolio
n ING VP Global Science and Technology Portfolio
Domestic Equity Value Portfolio
n ING VP Value Opportunity Portfolio
This report is submitted for general information to shareholders of the ING Funds. It is not authorized for distribution to prospective shareholders unless accompanied or preceded by a prospectus which includes details regarding the funds' investment objectives, risks, charges, expenses and other information. This information should be read carefully.

TABLE OF CONTENTS
| President's Letter | | | 1 | | |
|
| Market Perspective | | | 2 | | |
|
| Portfolio Managers' Reports | | | 4 | | |
|
| Shareholder Expense Examples | | | 19 | | |
|
| Report of Independent Registered Public Accounting Firm | | | 22 | | |
|
| Statements of Assets and Liabilities | | | 23 | | |
|
| Statements of Operations | | | 26 | | |
|
| Statements of Changes in Net Assets | | | 29 | | |
|
| Financial Highlights | | | 33 | | |
|
| Notes to Financial Statements | | | 46 | | |
|
| Portfolios of Investments | | | 62 | | |
|
| Shareholder Meeting Information | | | 120 | | |
|
| Tax Information | | | 126 | | |
|
| Director/Trustee and Officer Information | | | 127 | | |
|
| Advisory Contract Approval Discussion | | | 131 | | |
|
PROXY VOTING INFORMATION
A description of the policies and procedures that the Portfolios use to determine how to vote proxies related to portfolio securities is available: (1) without charge, upon request, by calling Shareholder Services toll-free at (800) 992-0180; (2) on the ING Funds' website at www.ingfunds.com; and (3) on the U.S. Securities and Exchange Commission's (the "SEC") website at www.sec.gov. Information regarding how the Portfolios voted proxies related to portfolio securities during the most recent 12-month period ended June 30 is available without charge on the ING Funds' website at www.ingfunds.com and on the SEC's website at www.sec.gov.
QUARTERLY PORTFOLIO HOLDINGS
The Portfolios file their complete schedule of portfolio holdings with the SEC for the first and third quarters of each fiscal year on Form N-Q. The Portfolios' Forms N-Q are available on the SEC's website at www.sec.gov. The Portfolios' Forms N-Q may be reviewed and copied at the SEC's Public Reference Room in Washington, DC, and information on the operation of the Public Reference Room may be obtained by calling (800) SEC-0330; and is available upon request from the Portfolios by calling Shareholder Services toll-free at (800) 992-0180.
(THIS PAGE INTENTIONALLY LEFT BLANK)
PRESIDENT'S LETTER
Dear Shareholder,
It is impossible to discuss the current market climate without acknowledging the recent turmoil brought on by problems in the sub-prime mortgage market. Clearly the excesses in this sector of the market and other segments of collateralized debt have created challenges throughout credit markets worldwide.
Amidst the volatility, we at ING Funds remind our shareholders that the creditworthiness and quality of our funds' holdings is our ultimate priority — whether those holdings are part of our money market funds, fixed income funds or equity funds. Market volatility is an often present component of investing and we believe the best way to manage through turbulent environments is to build a well-balanced, fully-diversified portfolio, which aligns with your goals and risk tolerance.
ING Funds remains committed to developing and offering a diverse array of mutual funds designed to meet the goals of most investors. We urge you to work with your investment professional to make sure you are invested appropriately. Together, you can select the funds that will help you achieve your financial goals. We thank you for choosing ING Funds and look forward to continuing to serve you.
Sincerely,

Shaun Mathews
President
ING Funds
January 28, 2008
The views expressed in the President's Letter reflect those of the President as of the date of the letter. Any such views are subject to change at any time based upon market or other conditions and ING Funds disclaims any responsibility to update such views. These views may not be relied on as investment advice and because investment decisions for an ING Fund are based on numerous factors, may not be relied on as an indication of investment intent on behalf of any ING Fund. Reference to specific company securities should not be construed as recommendations or investment advice.
International investing poses special risks including currency fluctuation, economic and political risks not found in investments that are solely domestic.

1
MARKET PERSPECTIVE: YEAR ENDED DECEMBER 31, 2007
After recording a solid, if frequently nervous, 8.2% in the first half of the reporting period, global equities in the form of the Morgan Stanley Capital International World IndexSM(1) ("MSCI World IndexSM") measured in local currencies, including net reinvested dividends ("MSCI" for regions discussed below) succumbed to a 3.2% loss in the second half of the reporting period, as some important debt markets all but seized up, the crisis threatening the solvency of financial institutions and forcing central bankers to throw lifelines to stranded borrowers, while investors fled to the safe haven of short Treasuries. By year-end, confidence was wavering, oil was nudging $100 per barrel and markets seemed to be pricing in a recession. In currencies, the yen strengthened as "carry trades" were unwound in the flight from risk. The euro benefited from the European Central Bank's implacable refusal to match the Federal Reserve Board (the "Fed") and reduce interest rates. But the pound finally gave back some of its rece nt gains as the UK housing market started to sag. For the second six months, the dollar fell 8.5% and 8.9% against the euro and yen respectively, but rose 0.3% against the pound.
A relentlessly deteriorating housing market had caused alarm in the sub-prime mortgage loan sector, where lax lending standards in a low interest rate environment, had driven foreclosure rates inexorably higher. The problem had been exacerbated over the years by the business of securitizing the loans. They would be sliced, diced and repackaged for handsome fees into other securities, then sold on in their billions worldwide to financial institutions, which purchased them by issuing commercial paper, over the cost of which an effortless profit could apparently be made.
At one level this spreads the loan risk. But when the originator is removed from those taking the risk another is created. Like the banking business in its simplest form, everything depends on confidence. When it became obvious that these securities, many of them rated A or higher, were ultimately backed by sub-prime and not so sub-prime mortgages with questionable repayment prospects, confidence evaporated. The asset-backed commercial paper market contracted sharply. Banks stopped lending to each other. The structured investment vehicles, their investors and sponsoring banks would have to bear huge losses, but which ones and how much?
The Fed's first response to the liquidity and resulting economic threats was to reduce the discount rate, (the rate it will lend to banks), by 50 basis points (0.50%) on August 17, 2007 and another 100 basis points (1.00%) in three steps by year end, with matching cuts in the federal funds rate.
But it was no good. Using the discount window had a stigma attached to it while the liquidity problem was not an overnight one. The one-month London Interbank Offered Rate ("LIBOR") continued to rise even as the Fed eased. A procession of financial institutions announced heavy write- downs of mortgage-backed assets, along with various capital saving and raising initiatives, including the tapping of billions of dollars from sovereign wealth funds based in the Middle-East and Asia, surely a development of historic significance.
The spread between the one-month LIBOR and the federal funds rate only drifted down after the announcement of coordinated central bank action to add liquidity where it was needed including in the U.S., the use of a "term auction facility" where loans would be auctioned and broader forms of collateral would be accepted.
But by year end global economic conditions were still clearly weakening and many felt that the U.S. might already be in or on the cusp of recession.
In U.S. fixed income markets' the Treasury yield curve steepened in the first half and continued to do so in the second. The yield on the ten-year Treasury Note fell 100 basis points (1.00%) to 4.03%, while the yield on the three-month Bill fell 153 basis points (1.53%) to 3.14%. The broader Lehman Brothers® Aggregate Bond Index(2) ("LBAB") of investment grade bonds returned 5.93% for the first half of the reporting period and 6.97% for the year ended December 31, 2007.
U.S. equities, represented by the Standard & Poor's 500® Composite Stock Price Index(3) ("S&P 500® Index") including dividends, lost 1.4% in the second half, with the worst fourth quarter since 2000, after gaining 7% through June. For a while, as the events described above played out, investors seemed to believe that the Fed had the will and the tools to keep any down turn brief. The S&P 500® Index actually made a new high on October 9, 2007. For the year ended December 31, 2007, the S&P 500® Index returned 5.49%. But, the sense that a serious crisis was only just beginning to unfold and a succession of earnings disappointments especially among the financials sector, increasingly weighed on sentiment as the year wound down. Bizarrely, gross domestic product ("GDP") growth was being reported at a brisk 4.9%
2
MARKET PERSPECTIVE: YEAR ENDED DECEMBER 31, 2007
for the third quarter, even as S&P 500 companies were reporting a decline in operating profits, the first fall in more than five years.
Internationally, the MSCI Japan® Index(4) slumped 15.8% in the second half of the reporting period on a resumption of falling consumer prices and fading global growth, while the strengthening yen threatened all-important exports. For the year ended December 31, 2007, the MSCI Japan® Index lost 4.23%. The MSCI Europe ex UK® Index(5) lost 4.8% in the second six months of the reporting period. A first half rally gave way to nervousness in mid-July after another rate increase and turned into a rout as the sub-prime debacle took shape. U.S. rate cuts were not reciprocated by the European Central Bank, which, with headline inflation up to 3.1%, confined its response to making liquidity available to the banking system, a staggering †500 billion on December 18, 2007. In the UK, stocks surged into the summer making the August 2007 slide ev en more violent than in continental Europe. But similar inflation worries limited the Bank of England to one 0.25% rate reduction despite a clearly weakening housing market. The MSCI UK® Index(5) fell 1.4% in the second half of the reporting period and returned 8.36% for the year ended December 31, 2007.
(1) The MSCI World IndexSM is an unmanaged index that measures the performance of over 1,400 securities listed on exchanges in the U.S., Europe, Canada Australia, New Zealand and the Far East.
(2) The LBAB Index is a widely recognized, unmanaged index of publicly issued investment grade U.S. Government, mortgage-backed, asset-backed and corporate debt securities.
(3) The S&P 500® Index is an unmanaged index that measures the performance of securities of approximately 500 of the largest companies in the United States.
(4) The MSCI Japan® Index is a free float-adjusted market capitalization index that is designed to measure developed market equity performance in Japan.
(5) The MSCI Europe ex UK® Index is a free float rising adjusted market capitalization index that is designed to measure developed market equity performance in Europe, excluding the UK.
(6) The MSCI UK® Index is a free float-adjusted market capitalization index that is designed to measure developed market equity performance in the UK.
All indices are unmanaged and investors cannot invest directly in an index.
Past performance does not guarantee future results. The performance quoted represents past performance. Investment return and principal value of an investment will fluctuate, and shares, when redeemed, may be worth more or less than their original cost. The Portfolios' performance is subject to change since the period's end and may be lower or higher than the performance data shown. Please call (800) 992-0180 or log on to www.ingfunds.com to obtain performance data current to the most recent month end.
Market Perspective reflects the views of ING's Chief Investment Risk Officer only through the end of the period, and is subject to change based on market and other conditions.
3
ING VP BALANCED PORTFOLIO
PORTFOLIO MANAGERS' REPORT
ING VP Balanced Portfolio (the "Portfolio") seeks to maximize investment return consistent with reasonable safety of principal, by investing in a diversified portfolio of one or more of the following asset classes: stocks, bonds and cash equivalents, based on the judgment of the Portfolio's management, of which of those sectors or mix thereof offers the best investment prospects. The Portfolio is managed by Omar Aguilar, Ph.D., Paul Zemsky, and James B. Kauffmann, Portfolio Managers, of ING Investment Management Co. — the Sub-Adviser.
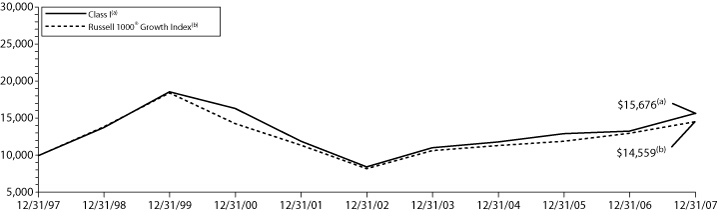
Performance: For the year ended December 31, 2007, the Portfolio's Class I shares provided a total return of 5.57% compared to the Standard & Poor's 500® Composite Stock Price Index(1) ("S&P 500® Index"), the Lehman Brothers® Aggregate Bond Index(2) ("LBAB Index") and the Composite Index(3) (60% S&P 500® Index/40% LBAB Index), which returned 5.49%, 6.97% and 6.22%, respectively, for the same period.
Portfolio Specifics: Asset allocation results contributed positively to performance of the Portfolio during 2007, mainly due to our neutralizing our equity position as equity markets deteriorated.
The performance of the domestic equity portion of the Portfolio was in line with its benchmark, the S&P 500® Index. Stock selection in the smaller-cap stocks was the largest detractor from performance during the year. Selection in the largest-cap stocks added value, particularly in the consumer discretionary and industrials sectors. Selection effect in information technology and the smaller-capitalization Industrial stocks acted as a major drag.
2007 was a difficult year for quantitatively managed equity strategies, as many underperformed. During the summer, a majority of our quantitative factors related to value, quality and momentum significantly underperformed. A systematic unwinding of highly leveraged positions by quantitative hedge funds, which focused on the same valuation factors, affected many of our holdings during August. A recalibration of factor weights during the second half of the year enabled us to recapture some of the losses, as our model was adjusted to a more growth-oriented market.
The fixed-income portion of the Portfolio underperformed its benchmark, the LBAB Index. The Portfolio's average credit quality was lower than that of the benchmark and detracted from results, as did the allocation to floating-rate notes and bonds issued by financial entities. While the Portfolios' overweight in mortgage-backed securities was not great, the sector experienced such losses that it hurt performance. An underweighting in corporate bonds for later periods of the year benefited performance. The Portfolio's generally long duration (higher interest-rate risk) stance helped performance for most but not all of the period.
The overall duration of the Portfolio was adjusted as investors fled from riskier bonds to purchase U.S. Treasuries or other sovereign debt. The Portfolio was underweight longer-dated Treasuries at various times, and so benefited form the relative underperformance of longer-dated Treasuries versus shorter as markets began to anticipate aggressive Federal Reserve Board (the "Fed") easing and the increasing risks for inflation. We also added Treasury inflation-protected securities positions as a counterweight to a re-inflationary Fed policy.
Current Strategy and Outlook: Economic growth in the United States slowed in the fourth quarter and we believe is likely to remain so into the first half of 2008. In our opinion, this is mainly due to tighter credit conditions, higher energy costs and continued weakness in housing. We do not anticipate any of these negative catalysts turning around in the first half of the year. If the U.S. economy avoids slipping into recession, we believe it may represent a buying opportunity in equities, but we do not see any catalyst at the moment to induce us to add to our stock holdings. We remain neutral in equities, with an overweight to large-cap, which we view as in better position than small- or mid-cap stocks to weather a period of slow growth or aftershocks from the credit crisis.
Allocations between equities and fixed-income are dependent on our quantitative asset allocation model not on a qualitative evaluation of the bond versus the equity markets.
Portfolio holdings and characteristics are subject to change and may not be representative of current holdings and characteristics. The outlook for this Portfolio may differ from that presented for other ING Funds. Performance for the different classes of shares will vary based on differences in fees associated with each class.
Top Ten Holdings*
as of December 31, 2007
(as a percent of net assets)
| U.S. Treasury Note, 3.125%, due 11/30/09 | | | 6.2 | % | |
| ExxonMobil Corp. | | | 2.8 | % | |
| Chevron Corp. | | | 1.5 | % | |
| U.S. Treasury Note, 3.375%, due 11/30/12 | | | 1.4 | % | |
| Federal Home Loan Mortgage Corporation, | | | | | |
| 6.000%, due 02/01/34 | | | 1.4 | % | |
| Intel Corp. | | | 1.3 | % | |
| ConocoPhillips | | | 1.3 | % | |
| Goldman Sachs Group, Inc. | | | 1.1 | % | |
| Microsoft Corp. | | | 1.0 | % | |
| PepsiCo, Inc. | | | 1.0 | % | |
* Excludes short-term investments related to ING Institutional Prime Money Market Fund and securities lending collateral.
Portfolio holdings are subject to change daily.
4
ING VP BALANCED PORTFOLIO
PORTFOLIO MANAGERS' REPORT
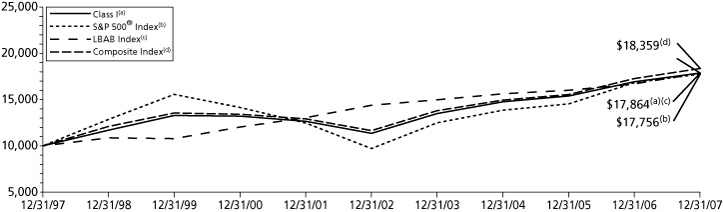
| Average Annual Total Returns for the Periods Ended December 31, 2007 | |
| | | 1 Year | | 5 Year | | 10 Year | | Since Inception
of Class ADV
December 29, 2006 | | Since Inception
of Class S
May 29, 2003 | |
| Class ADV | | | 4.78 | % | | | — | | | | — | | | | 4.75 | % | | | — | | |
| Class I | | | 5.57 | % | | | 9.50 | % | | | 5.97 | % | | | — | | | | — | | |
| Class S | | | 5.31 | % | | | — | | | | — | | | | — | | | | 8.37 | % | |
| S&P 500® Index(1) | | | 5.49 | % | | | 12.83 | % | | | 5.91 | % | | | 5.49 | %(4) | | | 11.65 | %(5) | |
| LBAB Index(2) | | | 6.97 | % | | | 4.42 | % | | | 5.97 | % | | | 6.97 | %(4) | | | 3.91 | %(5) | |
| Composite Index(3) | | | 6.22 | % | | | 9.51 | % | | | 6.26 | % | | | 6.22 | %(4) | | | 8.60 | %(5) | |
Based on a $10,000 initial investment, the graph and table above illustrate the total return of ING VP Balanced Portfolio against the indices indicated. An index has no cash in its portfolio, imposes no sales charges and incurs no operating expenses. An investor cannot invest directly in an index. The Portfolio's performance is shown without the imposition of any expenses or charges which are, or may be, imposed under your annuity contract. Total returns would have been lower if such expenses or charges were included.
The performance graph and table do not reflect the deduction of taxes that a shareholder will pay on portfolio distributions or the redemption of portfolio shares.
The performance shown may include the effect of fee waivers and/or expense reimbursements by the Investment Adviser and/or other service providers, which have the effect of increasing total return. Had all fees and expenses been considered, the total returns would have been lower.
The performance update illustrates performance for a variable investment option available through a variable annuity contract. The performance shown indicates past performance and is not a projection or prediction of future results. Actual investment returns and principal value will fluctuate so that shares and/or units, at redemption, may be worth more or less than their original cost. Please call (800) 992-0180 to get performance through the most recent month end.
This report contains statements that may be "forward-looking" statements. Actual results may differ materially from those projected in the "forward-looking" statements.
The views expressed in this report reflect those of the portfolio managers, only through the end of the period as stated on the cover. The portfolio managers' views are subject to change at any time based on market and other conditions.
Portfolio holdings are subject to change daily.
(1) The S&P 500® Index is an unmanaged index that measures the performance of securities of approximately 500 of the largest companies in the U.S.
(2) The LBAB Index is an unmanaged index composed of securities from the Lehman Brothers Government/Corporate Bond Index, Mortgage-Backed Securities Index and the Asset-Backed Securities Index.
(3) The Composite Index consists of 60% of return of (securities included in) the S&P 500® Index and 40% of the return of (securities included in) the LBAB Index.
(4) Since inception performance for the indices is shown from January 1, 2007.
(5) Since inception performance for the indices is shown from June 1, 2003.
Effective March 1, 2002, ING Investments, LLC began serving as investment adviser and ING Investment Management Co., the former investment adviser, began serving as sub-adviser to the Portfolio.
5
ING VP GROWTH AND INCOME PORTFOLIO
PORTFOLIO MANAGERS' REPORT
VP Growth and Income Portfolio (the "Portfolio") seeks to maximize total return through investments in a diversified portfolio of common stocks and securities convertible into common stock. It is anticipated that capital appreciation and investment income will both be major factors in acheiving total return. The Portfolio is managed by Christopher F. Corapi*, Portfolio Manager of ING Investment Management Co. — the Sub-Adviser.
Performance: For the year ended December 31, 2007, the Portfolio's Class I shares provided a total return of 7.40% compared to the Standard & Poor's 500® Composite Stock Price Index(1) ("S&P 500® Index"), which returned 5.49% for the same period.
Portfolio Specifics: The Portfolio outperformed its benchmark as a result of solid stock selection and sector allocation decisions. In particular, our stock picks within financials, industrials and health care contributed the most to performance. Underweighting the financials and consumer discretionary sectors throughout most of the year also aided relative returns. Stock selection in the consumer discretionary and energy sectors detracted from performance.
In the financial sector, Deutsche Boerse (sold), the European stock exchange and trading system provider, had a positive impact during the period. This stock was among the capital markets-oriented stocks whose earnings streams were viewed as more insulated from direct effects of the credit crisis. Precision Castparts Corp. and BE Aerospace, Inc. were two industrial names that have benefited from strength in the aerospace market. We believe this cycle could extend even further once the legacy carriers in the United States and Europe re-enter the market, and the next generation narrow body plane is introduced. In health care, our position in Covance, Inc. continues to benefit from the trend for pharmaceutical and biotech companies to outsource more early stage drug development and toxicology testing to contract research organizations.
Our investment in Omnicare, a geriatric pharmaceutical services company, was hurt during the quarter by rumors that the Department of Justice would launch an investigation into their business practices. We sold the position in December, as we believed that an investigation would overshadow management's turnaround efforts. Within consumer discretionary, Liz Claiborne, Inc. declined due to concerns over a continued housing crisis. We believe that lower guidance from the company going forward leaves room for a potential earnings surprise. The company has several strategic options, such as brand divestitures, that could enhance shareholder value. The biggest detractor from performance this year was bond guarantor MBIA, which declined due to exposure to collateralized debt obligations ("CDOs") and where fears of write downs prompted the company to seek additional outside capital and to shore up loss reserves.
Current Strategy and Outlook: Currently, the Portfolio is positioned in companies that we believe have strong or improving competitive positions, robust end markets or superior capital allocation opportunities. We believe each stock possesses an attractive valuation and a clear catalyst to improve it. Top holdings include Microsoft Corp., Google, Inc. and Johnson & Johnson ("JNJ"). We believe Microsoft Corp. will benefit from an upcoming product cycle in its main business. We believe that this is a major product cycle for Microsoft Corp. and while many are skeptical about the features, we believe that the new operating system and the Office application will be strong. Google, Inc. should be well positioned due to a secular trend toward online advertising, international expansion and growth opportunities in video and display advertising. We find JNJ attr active as a defensive play, given its diverse sources of revenue in terms of product mix and geographic breadth.
* Effective December 31, 2007, Scott Lewis is no longer a Portfolio Manager to the Portfolio.
Portfolio holdings and characteristics are subject to change and may not be representative of current holdings and characteristics. The outlook for this Portfolio may differ from that presented for other ING Funds. Performance for the different classes of shares will vary based on differences in fees associated with each class.
Top Ten Holdings*
as of December 31, 2007
(as a percent of net assets)
| ExxonMobil Corp. | | | 4.6 | % | |
| Microsoft Corp. | | | 4.1 | % | |
| Johnson & Johnson | | | 3.3 | % | |
| Google, Inc. - Class A | | | 3.1 | % | |
| Intel Corp. | | | 2.6 | % | |
| Altria Group, Inc. | | | 2.5 | % | |
| Procter & Gamble Co. | | | 2.4 | % | |
| Abbott Laboratories | | | 2.2 | % | |
| Merck & Co., Inc. | | | 2.1 | % | |
| General Electric Co. | | | 1.9 | % | |
* Excludes short-term investments related to ING Institutional Prime Money Market Fund and securities lending collateral.
Portfolio holdings are subject to change daily.
6
ING VP GROWTH AND INCOME PORTFOLIO
PORTFOLIO MANAGERS' REPORT
| Average Annual Total Returns for the Periods Ended December 31, 2007 | |
| | | 1 Year | | 5 Year | | 10 Year | | Since Inception
of Class ADV
December 20, 2006 | | Since Inception
of Class S
June 11, 2003 | |
| Class ADV | | | 6.66 | % | | | — | | | | — | | | | 6.22 | % | | | — | | |
| Class I | | | 7.40 | % | | | 12.62 | % | | | 2.87 | % | | | — | | | | — | | |
| Class S | | | 7.13 | % | | | — | | | | — | | | | — | | | | 10.72 | % | |
| S&P 500® Index(1) | | | 5.49 | % | | | 12.83 | % | | | 5.91 | % | | | 5.49 | %(2) | | | 11.65 | %(3) | |
Based on a $10,000 initial investment, the graph and table above illustrate the total return of ING VP Growth and Income Portfolio against the index indicated. An index has no cash in its portfolio, imposes no sales charges and incurs no operating expenses. An investor cannot invest directly in an index. The Portfolio's performance is shown without the imposition of any expenses or charges which are, or may be, imposed under your annuity contract. Total returns would have been lower if such expenses or charges were included.
The performance graph and table do not reflect the deduction of taxes that a shareholder will pay on portfolio distributions or the redemption of portfolio shares.
The performance shown may include the effect of fee waivers and/or expense reimbursements by the Investment Adviser and/or other service providers, which have the effect of increasing total return. Had all fees and expenses been considered, the total returns would have been lower.
The performance update illustrates performance for a variable investment option available through a variable annuity contract. The performance shown indicates past performance and is not a projection or prediction of future results. Actual investment returns and principal value will fluctuate so that shares and/or units, at redemption, may be worth more or less than their original cost. Please call (800) 992-0180 to get performance through the most recent month end.
This report contains statements that may be "forward-looking" statements. Actual results may differ materially from those projected in the "forward-looking" statements.
The views expressed in this report reflect those of the portfolio manager only through the end of the period as stated on the cover. The portfolio manager's views are subject to change at any time based on market and other conditions.
Portfolio holdings are subject to change daily.
(1) The S&P 500® Index is an unmanaged index that measures the performance of securities of approximately 500 of the largest companies in the U.S.
(2) Since inception performance for the index is shown from January 1, 2007.
(3) Since inception performance for the index is shown from June 1, 2003.
Effective March 1, 2002, ING Investments, LLC began serving as investment adviser and ING Investment Management Co., the former investment adviser, began serving as sub-adviser to the Portfolio.
7
ING VP GROWTH PORTFOLIO
PORTFOLIO MANAGERS' REPORT
ING VP Growth Portfolio (the "Portfolio") seeks growth of capital through investment in a diversified portfolio consisting primarily of common stock and securities convertible into common stocks believed to offer growth potential. The Portfolio is managed by Richard Welsh, CFA, Portfolio Manager and Jeff Bianchi, Portfolio Manager of ING Investment Management Co. — the Sub-Adviser.
Performance: For the year ended December 31, 2007, the Portfolio's Class I shares provided a total return of 17.86% compared to the Russell 1000® Growth Index(1), which returned 11.81% for the same period.
Portfolio Specifics: Although real growth for fourth quarter 2007 is expected to weaken to about 1%, the nine-month average was in line with long-term gross domestic product ("GDP") potential at 3.1%. S&P 500® Index operating earnings surprised to the upside during this period as well. The market was further supported by attractive valuations, particularly relative to other asset categories. Bursting of the housing and credit market bubbles raised the level of both investment uncertainty and risk aversion. From a style perspective, however, growth stock performance relative to value improved dramatically, particularly during the second half. For the year, growth outperformed value by 12% in the Russell 1000® Index, thereby recouping practically all of 2006's relative underperformance. Growth stocks typically outperform in a period of high inflation and slowing economic and earnings growth.
The energy and materials sectors were the strongest performers with each rising 39%. Energy was spurred by the backdrop of a 43% increase in crude oil prices and 19% gain in natural gas. Equipment & services stocks led the advance in the sector. The materials sector benefited from a major contribution from the chemicals industry. The utilities sector also had a strong return of 27%.
The consumer discretionary sector had a negative return of 10.5% led by automobiles and leisure equipment & products. Consumer discretionary stocks started discounting deceleration in consumer spending as a consequence of tighter credit standards, lower confidence and energy prices. The telecommunication services sector fell 7% in large measure due to weakness in the diversified services segment. The financials sector declined less than 1% with particular weakness in the thrifts & mortgage finance industry.
The Portfolio's outperformance was due primarily to stock selection, with seven of ten sectors positive for the year. These sectors included health care, industrials, consumer discretionary, energy, materials, information technology and financials.
Agricultural company, Monsanto Co. made the strongest contribution to returns. Business trends improved throughout the year as evidenced by higher corn seed prices, increased corn acreage and market share gains reflecting superior technology. Market share outside the United States is expected to grow 2% annually through 2010. Shares of Gilead Science performed well as the company's HIV drug franchise continued to gain market share aided by its new triple combination drug, Atripla. Research In Motion Ltd. benefited from accelerated adoption of its BlackBerry phones. Mosaic Co. was another notable contributor.
Ambac Financial Group and American Express detracted equivalent amounts from returns. Ambac Financial Group's share weakness reflected investor nervousness that Ambac Financial Group would have to pay claims on instruments insured. Shares of American Express reflected signs that the sub-prime mortgage contagion was affecting the consumer credit area. Pactiv Corp. also detracted from relative returns as input prices continued to exceed expectations, and competition remained keen in the company's consumer products division. Other notable detractors were ITT Educational Services, Inc., Microsoft Corp. and Oracle Systems.
Current Strategy and Outlook: We expect the equity market to continue to feel the impact of housing and financial dislocations, thereby pressuring corporate profits. We anticipate increased volatility during the near-term as we attempt to quantify the damage associated with credit dislocations, real-estate losses and declining confidence. The Portfolio has been positioned more conservatively in anticipation of this backdrop.
From an investment perspective, sharply declining equity markets historically present opportunities. As unwelcome as market volatility and uncertainty are, we believe volatility can result in opportunistic stock purchases. We continuously seek companies that exhibit strong relative business momentum and market recognition at appropriate valuation levels.
Portfolio holdings and characteristics are subject to change and may not be representative of current holdings and characteristics. The outlook for this Portfolio may differ from that presented for other ING Funds. Performance for the different classes of shares will vary based on differences in fees associated with each class.
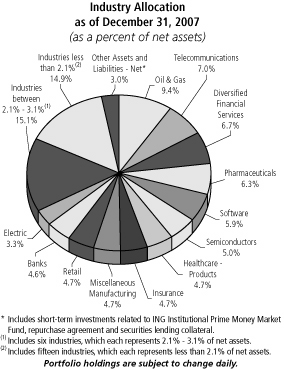
Industry Allocation
as of December 31, 2007
(as a percent of net assets)
| Oil & Gas | | | 9.9 | % | |
| Healthcare - Services | | | 8.9 | % | |
| Chemicals | | | 7.7 | % | |
| Software | | | 7.1 | % | |
| Aerospace/Defense | | | 6.7 | % | |
| Semiconductors | | | 6.3 | % | |
| Telecommunications | | | 5.9 | % | |
| Beverages | | | 5.4 | % | |
| Internet | | | 5.4 | % | |
| Biotechnology | | | 5.3 | % | |
| Computers | | | 4.9 | % | |
| Miscellaneous Manufacturing | | | 4.4 | % | |
| Industries between 2.6% - 4.3%(1) | | | 12.1 | % | |
| Industries less than 2.6%(2) | | | 10.1 | % | |
| Other Assets and Liabilities - Net* | | | (0.1 | )% | |
| Net Assets | | | 100.0 | % | |
* Includes short-term investments related to ING Institutional Prime Money Market Fund and repurchase agreement.
(1) Includes four industries, which each represents 2.6% - 4.3% of net assets.
(2) Includes nine industries, which each represents less than 2.6% of net assets.
Portfolio holdings are subject to change daily.
Top Ten Holdings
as of December 31, 2007
(as a percent of net assets)
| Humana, Inc. | | | 3.9 | % | |
| Apple, Inc. | | | 3.6 | % | |
| Intel Corp. | | | 3.5 | % | |
| Aetna, Inc. | | | 3.5 | % | |
| Amazon.com, Inc. | | | 3.5 | % | |
| Lockheed Martin Corp. | | | 3.4 | % | |
| Express Scripts, Inc. | | | 3.3 | % | |
| Potash Corp. of Saskatchewan | | | 3.0 | % | |
| CA, Inc. | | | 3.0 | % | |
| Chevron Corp. | | | 2.9 | % | |
Portfolio holdings are subject to change daily.
8
ING VP GROWTH PORTFOLIO
PORTFOLIO MANAGERS' REPORT
| Average Annual Total Returns for the Periods Ended December 31, 2007 | |
| | | 1 Year | | 5 Year | | 10 Year | | Since Inception
of Class ADV
December 29, 2006 | | Since Inception
of Class S
November 1, 2001 | |
| Class ADV | | | 17.21 | % | | | — | | | | — | | | | 17.11 | % | | | — | | |
| Class I | | | 17.86 | % | | | 13.08 | % | | | 4.60 | % | | | — | | | | — | | |
| Class S | | | 17.54 | % | | | 12.79 | % | | | — | | | | — | | | | 5.11 | % | |
| Russell 1000® Growth Index(1) | | | 11.81 | % | | | 12.11 | % | | | 3.83 | % | | | 11.81 | %(2) | | | 5.57 | % | |
Based on a $10,000 initial investment, the graph and table above illustrate the total return of ING VP Growth Portfolio against the index indicated. An index has no cash in its portfolio, imposes no sales charges and incurs no operating expenses. An investor cannot invest directly in an index. The Portfolio's performance is shown without the imposition of any expenses or charges which are, or may be, imposed under your annuity contract. Total returns would have been lower if such expenses or charges were included.
The performance graph and table do not reflect the deduction of taxes that a shareholder will pay on portfolio distributions or the redemption of portfolio shares.
The performance shown may include the effect of fee waivers and/or expense reimbursements by the Investment Adviser and/or other service providers, which have the effect of increasing total return. Had all fees and expenses been considered, the total returns would have been lower.
The performance update illustrates performance for a variable investment option available through a variable annuity contract. The performance shown indicates past performance and is not a projection or prediction of future results. Actual investment returns and principal value will fluctuate so that shares and/or units, at redemption, may be worth more or less than their original cost. Please call (800) 992-0180 to get performance through the most recent month end.
This report contains statements that may be "forward-looking" statements. Actual results may differ materially from those projected in the "forward-looking" statements.
The views expressed in this report reflect those of the portfolio manager only through the end of the period as stated on the cover. The portfolio manager's views are subject to change at any time based on market and other conditions.
Portfolio holdings are subject to change daily.
(1) The Russell 1000® Growth Index measures the performance of the 1,000 largest companies in the Russell 3000 Index with higher price-to-book ratios and higher forecasted growth. The Russell 3000 Index is an unmanaged index that measures the performance of 3,000 U.S. companies based on total market capitalization.
(2) Since inception performance for the index is shown from January 1, 2007.
Effective March 1, 2002, ING Investments, LLC began serving as investment adviser and ING Investment Management Co., the former investment adviser, began serving as sub-adviser to the Portfolio.
9
ING VP SMALL COMPANY PORTFOLIO
PORTFOLIO MANAGERS' REPORT
ING VP Small Company Portfolio (the "Portfolio") seeks growth of capital primarily through investment in a diversified portfolio of common stocks of companies with smaller market capitalizations. The Portfolio is managed by Joseph Basset, CFA, and Steve Salopek, Portfolio Managers of ING Investment Management Co. — the Sub Adviser.
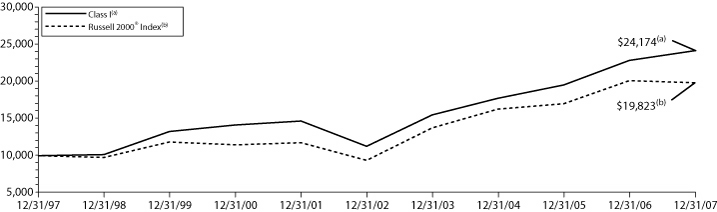
Performance: For the year ended December 31, 2007, the Portfolio's Class I shares provided a total return of 5.90% compared to the Russell 2000® Index(1), which returned (1.57)% for the same period.
Portfolio Specifics: Small-cap stocks, as measured by the Russell 2000® Index, lagged behind large- and mid-cap stocks for 2007. The Russell 2000® Index finished down 1.57% versus a rise of 5.77% for the Russell 1000® Index and a rise of 5.60% for the Russell Mid Cap Index. Small-cap stocks were hurt by concerns about the housing market and the credit crunch. Despite the federal rate cuts, the market faced considerable headwinds. Issues surrounding the credit markets heightened in July and August and then again in November, and concerns about credit availability affected financial firms and began to spread into the consumer discretionary sector, including retailers and retail real estate investment trust ("REITS"). However, 2007 proved to be positive for small-caps in that growth beat value for the first time since 2003 and active managers outperformed their benchmarks, due to size and quality biases in the market.
Stock selection within financials, energy, industrials and health care, coupled with our slight underweight in consumer discretionary, were the main performance drivers over the period. Stock selection in consumer discretionary and consumer staples detracted most from performance.
Ansys, Inc. BioMarin Pharmaceuticals Inc. and energy company Denbury Resources, Inc. contributed significantly to performance over the period. Ansys, Inc. develops engineering simulation software products. Throughout 2007, the company delivered revenue growth that was often ahead of Wall Street expectations, and expanded margins to near peak levels. The company's better than expected results and positive earnings revisions helped propel the stock higher during the year. BioMarin Pharmaceuticals develops and commercializes therapeutic enzyme products. The company received FDA approval in late 2007 for a drug called Kuvan for the treatment of Phenylketonuria, an inherited metabolic disorder. The company also announced pricing for the drug, which was at the higher end of investors' expectations.
Steven Madden Ltd. (sold) and Entercom Communications Corp. were two of the largest detractors from performance over the period. Steve Madden Ltd. designs and sells footwear brands for men, women and children. The stock's performance was negatively impacted by concerns surrounding earnings expectations and that the company's products were out of favor with the consumer. We no longer hold a position in this company. Entercom Communications Corp., which acquires and operates radio broadcast properties, underperformed in 2007 due to a slowdown in advertising spending. Also, the company's earnings were under pressure throughout the year, as the firm increased their expense and investment for future growth opportunities while revenues fell below expectations. We continue to hold this stock in the Portfolio, as we believe that the company's investments will pay off over the next year or two.
Current Strategy and Outlook: We continue to focus on companies that we believe have strong balance sheets and cash-flow generation capabilities. We believe we are defensively positioned within the financials sector, and have exposure to banks, diversified financials, and insurance. We are underweight real estate investment trusts, as we think that the real estate market is overextended. Within health care, the Portfolio continues to be positioned to gain from the strong demands and needs for behavioral health providers, health care equipment suppliers with niche franchises and disease management providers. We are underweight biotech stocks due to risk and valuation considerations, and we have no exposure to Medicaid managed care providers due to the deteriorating reimbursement environment. Our technology exposure is in software and services, hardware and e quipment and semiconductors.
Portfolio holdings and characteristics are subject to change and may not be representative of current holdings and characteristics. The outlook for this Portfolio may differ from that presented for other ING Funds. Performance for the different classes of shares will vary based on differences in fees associated with each class.

Top Ten Holdings*
as of December 31, 2007
(as a percent of net assets)
| iShares Russell 2000 Index Fund | | | 2.0 | % | |
| Portland General Electric Co. | | | 1.1 | % | |
| Waste Connections, Inc. | | | 1.1 | % | |
| Carrizo Oil & Gas, Inc. | | | 1.1 | % | |
| UAP Holding Corp. | | | 1.0 | % | |
| Magellan Health Services, Inc. | | | 1.0 | % | |
| Westfield Financial, Inc. | | | 1.0 | % | |
| Human Genome Sciences, Inc. | | | 1.0 | % | |
| Vectren Corp. | | | 1.0 | % | |
| Alaska Communications Systems Group, Inc. | | | 1.0 | % | |
* Excludes short-term investments related to ING Institutional Prime Money Market Fund and securities lending collateral.
Portfolio holdings are subject to change daily.
10
ING VP SMALL COMPANY PORTFOLIO
PORTFOLIO MANAGERS' REPORT
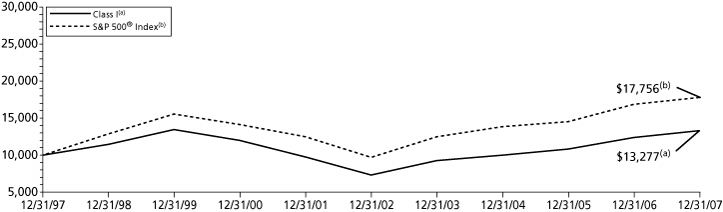
| Average Annual Total Returns for the Periods Ended December 31, 2007 | |
| | | 1 Year | | 5 Year | | 10 Year | | Since Inception
of Class S
November 1, 2001 | |
| Class I | | | 5.90 | % | | | 16.48 | % | | | 9.22 | % | | | — | | |
| Class S | | | 5.68 | % | | | 16.22 | % | | | — | | | | 9.99 | % | |
| Russell 2000® Index(1) | | | (1.57 | )% | | | 16.25 | % | | | 7.08 | % | | | 11.26 | % | |
Based on a $10,000 initial investment, the graph and table above illustrate the total return of ING VP Small Company Portfolio against the index indicated. An index has no cash in its portfolio, imposes no sales charges and incurs no operating expenses. An investor cannot invest directly in an index. The Portfolio's performance is shown without the imposition of any expenses or charges which are, or may be, imposed under your annuity contract. Total returns would have been lower if such expenses or charges were included.
The performance graph and table do not reflect the deduction of taxes that a shareholder will pay on portfolio distributions or the redemption of portfolio shares.
The performance shown may include the effect of fee waivers and/or expense reimbursements by the Investment Adviser and/or other service providers, which have the effect of increasing total return. Had all fees and expenses been considered, the total returns would have been lower.
The performance update illustrates performance for a variable investment option available through a variable annuity contract. The performance shown indicates past performance and is not a projection or prediction of future results. Actual investment returns and principal value will fluctuate so that shares and/or units, at redemption, may be worth more or less than their original cost. Please call (800) 992-0180 to get performance through the most recent month end.
This report contains statements that may be "forward-looking" statements. Actual results may differ materially from those projected in the "forward-looking" statements.
The views expressed in this report reflect those of the portfolio manager, only through the end of the period as stated on the cover. The portfolio manager's views are subject to change at any time based on market and other conditions.
Portfolio holdings are subject to change daily.
(1) The Russell 2000® Index measures the performance of the 2,000 smallest companies in the Russell 3000 Index. The Russell 3000 Index is an unmanaged index that measures the performance of 3,000 U.S. companies based on total market capitalization.
Effective March 1, 2002, ING Investments, LLC began serving as investment adviser and ING Investment Management Co., the former investment adviser, began serving as sub-adviser to the Portfolio.
11
ING VP VALUE OPPORTUNITY PORTFOLIO
PORTFOLIO MANAGERS' REPORT
ING VP Value Opportunity Portfolio (the "Portfolio") seeks growth of capital primarily through investment in a diversified portfolio of common stocks. The Portfolio is managed by Omar Aguilar, Ph.D. and Vincent Costa*, Portfolio Managers of ING Investment Management Co. — the Sub-Adviser.
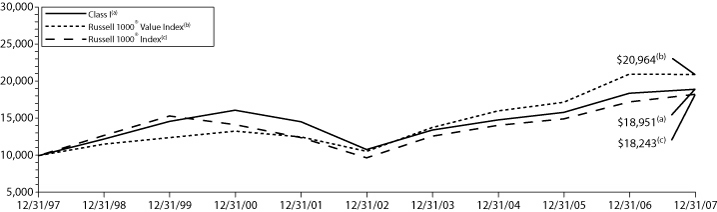
Performance: For the year ended December 31, 2007, the Portfolio's Class I shares provided a total return of 3.01% compared to the Russell 1000® Value Index(1) and the Russell 1000® Index(2), which returned (0.17)% and 5.77%, respectively, for the same period.
Portfolio Specifics: Relative to the Russell 1000® Value Index, the Portfolio benefited from favorable stock selection in consumer staples. Stock selection among consumer discretionary companies also helped relative performance. Stock selection and an underweight in financials also helped results.
Within consumer staples, two tobacco companies, Carolina Group and Altria Group, Inc., were top performers as tobacco litigation began easing. Strong international growth also enhanced Altria Group, Inc. (sold), Molson Coors Brewing Company, a consumer discretionary, was a turnaround story. Cost cutting, improving market share, and a strong brand boosted the stock price. The Portfolio's underweight in Time Warner, Inc. helped performance as the cable business slowed. Medco Health Solutions, Inc. and Mirant Corp. also contributed significantly.
Our underweight in energy detracted value during the period as higher oil prices aided energy stocks such as Chevron Corp. Growth in emerging countries outpaced the industry's ability to meet natural resources demand. Plains Exploration & Production Co. and Newfield Exploration Co. were two energy holdings that declined over the period. Two financial stocks were important detractors: E*Trade Financial Corp. and Bear Stearns.
Current Strategy and Outlook: Currently, the Portfolio is positioned in companies that we believe have strong or improving competitive positions, robust end markets and/or superior capital allocation opportunities. Furthermore, each stock possesses an attractive valuation and a clear catalyst to improve it.
* Effective November 12, 2007, Omar Aguilar, Ph.D. and Vincent Costa replaced Scott Lewis and Michael Leskinen as portfolio managers to the Portfolio.
Portfolio holdings and characteristics are subject to change and may not be representative of current holdings and characteristics. The outlook for this Portfolio may differ from that presented for other ING Funds. Performance for the different classes of shares will vary based on differences in fees associated with each class.
Industry Allocation
as of December 31, 2007
(as a percent of net assets)
| Oil & Gas | | | 16.2 | % | |
| Insurance | | | 16.0 | % | |
| Telecommunications | | | 9.8 | % | |
| Aerospace/Defense | | | 8.0 | % | |
| Healthcare - Services | | | 5.3 | % | |
| Banks | | | 4.9 | % | |
| Diversified Financial Services | | | 4.7 | % | |
| Miscellaneous Manufacturing | | | 4.5 | % | |
| Regional Malls | | | 3.3 | % | |
| Agriculture | | | 2.9 | % | |
| Electric | | | 2.8 | % | |
| Chemicals | | | 2.6 | % | |
| Industries between 1.7% - 2.5%(1) | | | 10.3 | % | |
| Industries less than 1.7%(2) | | | 8.8 | % | |
| Other Assets and Liabilities - Net* | | | (0.1 | )% | |
| Net Assets | | | 100.0 | % | |
* Includes short-term investments related to ING Institutional Prime Money Market Fund and securities lending collateral.
(1) Includes five industries, which each represents 1.7% - 2.5% of net assets.
(2) Includes nine industries, which each represents less than 1.7% of net assets.
Portfolio holdings are subject to change daily.
Top Ten Holdings*
as of December 31, 2007
(as a percent of net assets)
| ExxonMobil Corp. | | | 6.0 | % | |
| General Dynamics Corp. | | | 4.2 | % | |
| Telefonica SA ADR | | | 4.2 | % | |
| AT&T, Inc. | | | 4.1 | % | |
| United Technologies Corp. | | | 3.8 | % | |
| ConocoPhillips | | | 3.4 | % | |
| Taubman Centers, Inc. | | | 3.2 | % | |
| Loews Corp. | | | 2.9 | % | |
| Chevron Corp. | | | 2.9 | % | |
| Axis Capital Holdings Ltd. | | | 2.5 | % | |
* Excludes short-term investments related to securities lending collateral.
Portfolio holdings are subject to change daily.
12
ING VP VALUE OPPORTUNITY PORTFOLIO
PORTFOLIO MANAGERS' REPORT
| Average Annual Total Returns for the Periods Ended December 31, 2007 | |
| | | 1 Year | | 5 Year | | 10 Year | | Since Inception
of Class ADV
December 29, 2006 | | Since Inception
of Class S
July 16, 2001 | |
| Class ADV | | | 2.33 | % | | | — | | | | — | | | | 2.31 | % | | | — | | |
| Class I | | | 3.01 | % | | | 11.91 | % | | | 6.59 | % | | | — | | | | — | | |
| Class S | | | 2.77 | % | | | 11.62 | % | | | — | | | | — | | | | 2.44 | % | |
| Russell 1000® Value Index(1) | | | (0.17 | )% | | | 14.63 | % | | | 7.68 | % | | | (0.17 | )%(3) | | | 7.62 | %(4) | |
| Russell 1000® Index(2) | | | 5.77 | % | | | 13.43 | % | | | 6.20 | % | | | 5.77 | %(3) | | | 5.44 | %(4) | |
Based on a $10,000 initial investment, the graph and table above illustrate the total return of ING VP Value Opportunity Portfolio against the indices indicated. An index has no cash in its portfolio, imposes no sales charges and incurs no operating expenses. An investor cannot invest directly in the indices. The Portfolio's performance is shown without the imposition of any expenses or charges which are, or may be, imposed under your annuity contract. Total returns would have been lower if such expenses or charges were included.
The performance graph and table do not reflect the deduction of taxes that a shareholder will pay on portfolio distributions or the redemption of portfolio shares.
The performance shown may include the effect of fee waivers and/or expense reimbursements by the Investment Adviser and/or other service providers, which have the effect of increasing total return. Had all fees and expenses been considered, the total returns would have been lower.
The performance update illustrates performance for a variable investment option available through a variable annuity contract. The performance shown indicates past performance and is not a projection or prediction of future results. Actual investment returns and principal value will fluctuate so that shares and/or units, at redemption, may be worth more or less than their original cost. Please call (800) 992-0180 to get performance through the most recent month end.
This report contains statements that may be "forward-looking" statements. Actual results may differ materially from those projected in the "forward-looking" statements.
The views expressed in this report reflect those of the portfolio manager, only through the end of the period as stated on the cover. The portfolio manager's views are subject to change at any time based on market and other conditions.
Portfolio holdings are subject to change daily.
(1) The Russell 1000® Value Index is an unmanaged index that measures the performance of those Russell 1000 companies with lower price-to-book ratios and lower forecasted growth values, which more closely tracks the types of securities in which the Portfolio invests than the S&P 500® Composite Stock Price Index.
(2) The Russell 1000® Index is a comprehensive large-cap index measuring the performance of the largest 1,000 U.S. incorporated companies.
(3) Since inception performance for the indices is shown from January 1, 2007.
(4) Since inception performance for the indices is shown from August 1, 2001.
Effective March 1, 2002, ING Investments, LLC began serving as investment adviser and ING Investment Management Co., the former investment adviser, began serving as sub-adviser to the Portfolio.
13
ING VP INTERMEDIATE BOND PORTFOLIO
PORTFOLIO MANAGERS' REPORT
ING VP Intermediate Bond Portfolio (the "Portfolio") seeks to maximize total return consistent with reasonable risk. It is anticipated that capital appreciation and investment income will both be major factors in achieving total return. The Portfolio is managed by James B. Kauffmann, Portfolio Manager of ING Investment Management Co. — the Sub-Adviser.
Performance: For the year ended December 31, 2007, the Portfolio's Class I shares provided a total return of 5.95% compared to the Lehman Brothers® Aggregate Bond Index(1) ("LBAB"), which returned 6.97% for the same period.
Portfolio Specifics: The dramatic sell-off in risk-based fixed-income assets following the summer of 2007 was the primary driver of performance for bond portfolio managers and sectors of the bond market. While the firestorm started with sub-prime mortgages, the unprecedented risk aversion spread quickly and resulted in massive losses at many mortgage companies, banks and brokerage firms. Sovereign wealth funds became major players in the re-capitalization of U.S. financial institutions. In general, markets made little distinction between the ultimate creditworthiness of individual bonds in the rush for perceived safety. Central banks around the globe were forced to inject liquidity as the inter-bank lending markets came to a near standstill.
The use of credit default swaps and related derivative indices enabled the Portfolio to mitigate some of the negative effects of the market disruption. Generally, the Portfolio's underweighting in corporate bonds for later periods of the year benefited performance. On the other hand, the Portfolio's allocation to floating-rate notes and bonds issued by financial entities acted as a drag. While our over weight in mortgage-backed securities ("MBS") was not great, the sector experienced such losses that it hurt our performance. The Portfolio's average credit quality was lower than benchmark and also detracted from results.
The Portfolio's generally long duration (higher interest-rate risk) stance helped performance for most but not all of the period. The overall duration of the Portfolio was adjusted as investors fled from riskier bonds to purchase U.S. Treasuries ("UST") or other sovereign debt. The Portfolio was underweight longer-dated Treasuries at various times, and so benefited from the relative underperformance of longer-dated UST versus shorter as markets began to anticipate aggressive Federal Reserve Board (the "Fed") easing and the increasing risks of inflation. We also added Treasury inflation-protected securities ("TIPS") positions as a counterweight to a re-inflationary Fed policy.
Current Outlook and Strategy: Our negative outlook for the U.S. economy remains intact. The pessimistic events in the U.S. residential real estate, amongst its credit enablers, and the systemic illiquidity these events have spawned will not soon abate. Extraordinary interventions by central banks across the world may have to continue into 2008. We believe that the troubles in the bond market will soon impact the real economy as lenders retreat and consumers become concerned about a softening labor market and the shrinking value of their homes.
We do not find solace in the global de-coupling theme advocated by others; and we are skeptical that the rest of the world can be untouched by a significant downturn in the U.S. economy. We maintain our long-term negative outlook for financials, construction and other industries afflicted by the residential real estate market; yet, unique tactical trades may arise near term. Our outlook for the U.S. dollar remains negative although it may be nearing a temporary oversold condition. Unease in the credit marketplace should persist, and we are comfortable with our current credit shorts or underweights. The heavy new issue calendar for corporate bonds may pressure spreads wider on existing paper, as new deals may come at discounts to outstanding paper, but opportunities may soon emerge.
The MBS team believes that their market has not yet priced in the risk of a slowing in prepayments as homeowners are less able to refinance or must stay in their homes longer. The commercial mortgage-backed securities ("CMBS") market could witness a rough patch in the near-term as it was not immune to the over-confident lending practices that have hobbled residential MBS.
The interest rates strategy team has positioned the Portfolio slightly long in duration with exposures to TIPS and the front end of the curve. Changing market perceptions of central bank actions may change quickly as could our duration postures.
We continue to hold some special situation high-yield bonds, despite our negative outlook for the sector as large new issues have yet to be digested. We will wait for more generalized price weakness or more compelling relative value before entering emerging market debt in a large way.
Portfolio holdings and characteristics are subject to change and may not be representative of current holdings and characteristics. The outlook for this Portfolio may differ from that presented for other ING Funds. Performance for the different classes of shares will vary based on differences in fees associated with each class.
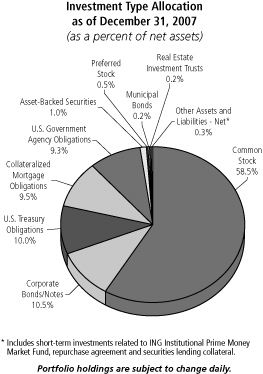
Investment Type Allocation
as of December 31, 2007
(as a percent of net assets)
| U.S. Treasury Obligations | | | 28.9 | % | |
| Collateralized Mortgage Obligations | | | 27.5 | % | |
| Corporate Bonds/Notes | | | 24.0 | % | |
| U.S. Government Agency Obligations | | | 18.5 | % | |
| Asset-Backed Securities | | | 2.4 | % | |
| Preferred Stock | | | 0.9 | % | |
| Municipal Bonds | | | 0.5 | % | |
| Other Assets and Liabilities - Net* | | | (2.7 | )% | |
| Net Assets | | | 100.0 | % | |
* Includes short-term investments related to ING Institutional Prime Money Market Fund, repurchase agreement and securities lending collateral.
Portfolio holdings are subject to change daily.
Top Ten Industries*
as of December 31, 2007
(as a percent of net assets)
| Collateralized Mortgage Obligations | | | 27.5 | % | |
| U.S. Treasury Notes | | | 24.3 | % | |
| Federal Home Loan Mortgage Corporation | | | 11.5 | % | |
| Diversified Financial Services | | | 6.8 | % | |
| Federal National Mortgage Corporation | | | 6.6 | % | |
| Banks | | | 6.2 | % | |
| Treasury Inflation Indexed Protected Securities | | | 2.3 | % | |
| U.S. Treasury Bonds | | | 2.3 | % | |
| Electric | | | 1.6 | % | |
| Retail | | | 1.4 | % | |
* Excludes short-term investments related to ING Institutional Prime Money Market Fund and securities lending collateral.
Portfolio holdings are subject to change daily.
14
ING VP INTERMEDIATE BOND PORTFOLIO
PORTFOLIO MANAGERS' REPORT

| Average Annual Total Returns for the Periods Ended December 31, 2007 | |
| | | 1 Year | | 5 Year | | 10 Year | | Since Inception
of Class ADV
December 20, 2006 | | Since Inception
of Class S
May 3, 2002 | |
| Class ADV | | | 5.60 | % | | | — | | | | — | | | | 5.12 | % | | | — | | |
| Class I | | | 5.95 | % | | | 4.86 | % | | | 5.80 | % | | | — | | | | — | | |
| Class S | | | 5.70 | % | | | 4.60 | % | | | — | | | | — | | | | 5.38 | % | |
| LBAB Index(1) | | | 6.97 | % | | | 4.42 | % | | | 5.97 | % | | | 6.97 | %(2) | | | 5.32 | %(3) | |
Based on a $10,000 initial investment, the graph and table above illustrate the total return of ING VP Intermediate Bond Portfolio against the index indicated. An index has has no cash in its portfolio, imposes no sales charges and incurs no operating expenses. An investor cannot invest directly in an index. The Portfolio's performance is shown without the imposition of any expenses or charges which are, or may be, imposed under your annuity contract. Total returns would have been lower if such expenses or charges were included.
The performance graph and table do not reflect the deduction of taxes that a shareholder will pay on portfolio distributions or the redemption of portfolio shares.
The performance shown may include the effect of fee waivers and/or expense reimbursements by the Investment Adviser and/or other service providers, which have the effect of increasing total return. Had all fees and expenses been considered, the total returns would have been lower.
The performance update illustrates performance for a variable investment option available through a variable annuity contract. The performance shown indicates past performance and is not a projection or prediction of future results. Actual investment returns and principal value will fluctuate so that shares and/or units, at redemption, may be worth more or less than their original cost. Please call (800) 992-0180 to get performance through the most recent month end.
This report contains statements that may be "forward-looking" statements. Actual results may differ materially from those projected in the "forward-looking" statements.
The views expressed in this report reflect those of the portfolio managers, only through the end of the period as stated on the cover. The portfolio managers' views are subject to change at any time based on market and other conditions.
Portfolio holdings are subject to change daily.
(1) The LBAB Index is an unmanaged index composed of securities from the Lehman Brothers Government/Corporate Bond Index, Mortgage-Backed Securities Index and the Asset-Backed Securities Index.
(2) Since inception performance for the the index is shown from January 1, 2007.
(3) Since inception performance for the index is shown from May 1, 2002.
Effective March 1, 2002, ING Investments, LLC began serving as investment adviser and ING Investment Management Co., the former investment adviser, began serving as sub-adviser to the Portfolio.
15
ING VP MONEY MARKET PORTFOLIO
PORTFOLIO MANAGERS' REPORT
ING VP Money Market Portfolio (the "Portfolio") seeks to provide high current return, consistent with preservation of capital and liquidity, through investment in high-quality money market instruments. The Portfolio is managed by David S. Yealy, Portfolio Manager of ING Investment Management Co. — the Sub-Adviser.
Performance: For the year ended December 31, 2007, the Portfolio's Class I shares provided a total return of 5.13% compared to the iMoneyNet First Tier Retail Index(1), which returned 4.57% for the same period.
Portfolio Specifics: 2007 was a challenging year for short-term fixed- income investors and in particular money market funds. Money market rates traded in a very narrow range for the first half of the year and into July as the Federal Open Markets Committees ("FOMC") kept the federal funds rate at 5.25%. There were limited opportunities for the Portfolio to differentiate itself from its competitors during this period.
In early August the sub-prime, hedge fund and collateralized debt obligations ("CDO") problems widened to affect most mortgage related markets, money market securities and interbank lending. Commercial paper rates and London Interbank Offered Rate ("LIBOR") skyrocketed as there was a flight to quality due to liquidity and counterparty concerns. The Federal Reserve Board (the "Fed") and other central banks were forced to take drastic measures to increase liquidity and market confidence. The Fed flooded the banking system with excess liquidity and cut the discount rate 0.50% in August. This was followed by an additional 0.50% cut in the discount rate and similar cut in the federal funds rate in September. Short-term liquidity and market confidence improved slowly following the moves by the central banks.
This improvement was only temporary forcing the Fed to cut rates another 0.25% on October 31. Liquidity concerns returned in December as the markets worried about financing over year-end and a deteriorating economic outlook. The Fed cut rates another 0.25%. The federal funds rate ended the year at 4.25%, a full percent below where it started the year. The central banks also added significant cash reserves over year-end to replace the financing normally provided by the large global banks.
The Portfolio used various strategies during the year as the market conditions changed. During the early stable period, the Portfolio took advantage of the trading range, increasing its weighted average maturity ("WAM") by buying longer-term fixed securities as rates moved to the higher end of the trading range. Our strategy of overweighting floating rate assets whose yields were tied to LIBOR worked well during the market dislocation and high LIBOR rates experienced during the later part of the year. We selectively bought asset-backed commercial paper of issuers that we determined to be well structured with excess credit enhancement and liquidity provided by highly rated strong financial institutions. We avoided issuers that had large exposure to sub-prime and CDO assets, including structured investment vehicles ("SIVs") which have been in the negative spotlight recently. This strategy allowed the Portfolio to outperform the majority of its peers during the second half of the year and for the year overall. That strategy remains in place.
Current Strategy and Outlook: We expect liquidity and money market securities to remain under stress in 2008 and require additional actions by the U.S. Treasury, the FOMC and other central banks. These will be determined by continued market stress on certain assets classes, interbank market liquidity and the state of the U.S and global economy. The market is expecting the Fed to ease at least 0.25% at its January 30 meeting, with additional cuts over the course of 2008. We see a risk that the effects of the deteriorating housing market and a slowing in the job market could spill over into the full economy. This is not now fully priced into the market. Our current strategy is to continue to take advantage of the high LIBOR rates by buying additional floating rate securities of highly rated issuers and selectively adding duration by buying longer-term fixed r ate securities.
(1) The iMoneyNet First Tier Retail Index is an unmanaged index that includes the most broadly based money market funds. This index is intended to be the comparative index for the Portfolio.
Portfolio holdings and characteristics are subject to change and may not be representative of current holdings and characteristics. The outlook for this Portfolio may differ from that presented for other ING Funds. Performance for the different classes of shares will vary based on differences in fees associated with each class.
Investment Type Allocation
as of December 31, 2007
(as a percent of net assets) | |
| Corporate Bonds/Notes | | | 53.5 | % | |
| Commercial Paper | | | 41.3 | % | |
| Repurchase Agreement | | | 4.3 | % | |
| Certificates Of Deposit | | | 1.0 | % | |
| Securities Lending Collateral | | | 0.0 | % | |
| Other Assets and Liabilities - Net | | | (0.1 | )% | |
| Net Assets | | | 100.0 | % | |
Portfolio holdings are subject to change daily.
16
ING VP GLOBAL SCIENCE AND TECHNOLOGY PORTFOLIO
PORTFOLIO MANAGERS' REPORT
ING VP Global Science and Technology Portfolio (the "Portfolio") seeks long-term capital appreciation. The Portfolio is managed by Thomas P. Callan, CFA, Managing Director and Senior Portfolio Manager, Erin Xie, PhD, Managing Director and Portfolio Manager and Jean M. Rosenbaum, CFA, Managing Director and Portfolio Manager of BlackRock Advisors, LLC — the Sub-Adviser.
Performance: For the year ended December 31, 2007, the Portfolio's Class I shares provided a total return of 19.00% compared to the Standard & Poor's 500® Composite Stock Price Index(1) ("S&P 500® Index") and the NYSE Arca Tech 100 IndexSM(2),which returned 5.49% and 7.77%, respectively, for the same period.
Portfolio Specifics: Over the past year, global equity markets experienced gains, however increased volatility and meaningful market corrections made the period a much different one than in recent years. The Federal Reserve Board cut the federal funds target rate by 50 basis points (0.50%) on September 18, followed by an additional 25 basis points (0.25%) of easing on October 31 and December 11. These were the first rate cuts since July 2003. As financials and consumer discretionary stocks declined due to housing and credit related problems, technology shares faired relatively well amidst uncertain economic conditions.
Both stock selection and sector allocation decisions contributed positively to relative outperformance during the period. The most significant contributor was stock selection, which was positive across all economic sectors. In particular, selection gains were strongest in the information technology group. Allocation benefits were more moderate. The Portfolio's exposure to telecommunication services — a sector that is absent from the benchmark — produced the most favorable results.
Within information technology, selection gains were most pronounced in internet software & services, with Google, Inc. among the strongest contributors, and broadly across semiconductor equipment and software as performance within these groups were well above benchmark results. Stock selection within biotechnology benefited results over the year, as individual company performance varied significantly. Strong picks among wireless telecommunication services names also contributed to performance as several positions appreciated significantly, including Bharti Airtel Ltd. and China Mobile Ltd.
Conversely, hindering the Portfolio's relative return was an underweight to the strong-performing aerospace & defense and computer hardware sub-industry groups. Additionally, weaker stock selection within electronic manufacturing services and data processing & outsourced services partially offset otherwise strong performance across the information technology sector. The greatest drags on relative results from an individual stock perspective came from an underweight to Apple, Inc. and no exposure to Medimmune, Inc., both of which experienced significant price appreciation over the period.
Current Strategy and Outlook: While concerns grow about the U.S. economy and the extent of credit-related issues across the financial system, global growth expectations, in our opinion, remain relatively strong. However, forecasts are mixed across regions and we believe the risks are to the downside. We have been steadily building balance in the portfolio by adding more defensive positions and reducing our cyclical exposure. While valuations remain reasonable and world growth relatively robust, we are growing more wary of downside risks and believe caution is warranted. At year-end, the Portfolio was invested in information technology, health care, industrials, telecommunication services, and the remainder distributed among consumer discretionary, consumer staples, and materials sectors. Within information technology, the Portfolio's primary overweights ver sus the NYSE Arca Tech 100 IndexSM were in home entertainment software and internet software & services; significant underweights were in computer hardware, application software, and data processing & outsourced services. Inside the health care portion of the Portfolio, the Portfolio held an above-benchmark allocation to healthcare equipment and pharmaceuticals and a below-benchmark weighting in biotechnology and life science tools & services. Further, we maintained the Portfolio's allocation to telecommunication services, as strong global growth and rising revenue-per-user remain catalysts.
Portfolio holdings and characteristics are subject to change and may not be representative of current holdings and characteristics. The outlook for this Portfolio may differ from that presented for other ING Funds. Performance for the different classes of shares will vary based on differences in fees associated with each class.
Top Ten Holdings*
as of December 31, 2007
(as a percent of net assets) | |
| Apple, Inc. | | | 4.6 | % | |
| Google, Inc. - Class A | | | 3.2 | % | |
| Intel Corp. | | | 2.1 | % | |
| DST Systems, Inc. | | | 2.1 | % | |
| Research In Motion Ltd. | | | 1.9 | % | |
| Cisco Systems, Inc. | | | 1.9 | % | |
| Microsoft Corp. | | | 1.9 | % | |
| Hewlett-Packard Co. | | | 1.8 | % | |
| Waters Corp. | | | 1.6 | % | |
| Lockheed Martin Corp. | | | 1.6 | % | |
* Excludes short-term investments related to securities lending collateral and U.S. government agency obligation.
Portfolio holdings are subject to change daily.
17
ING VP GLOBAL SCIENCE AND TECHNOLOGY PORTFOLIO
PORTFOLIO MANAGERS' REPORT
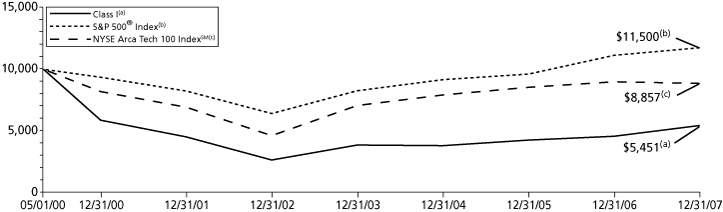
| Average Annual Total Returns for the Periods Ended December 31, 2007 | |
| | | 1 Year | | 5 Year | | Since Inception
of Class I
May 1, 2000 | | Since Inception
of Class S
November 1, 2001 | |
| Class I | | | 19.00 | % | | | 15.42 | % | | | (7.61 | )% | | | — | | |
| Class S* | | | 18.86 | % | | | 15.23 | % | | | — | | | | 1.95 | % | |
| S&P 500® Index(1) | | | 5.49 | % | | | 12.83 | % | | | 1.84 | % | | | 7.33 | % | |
| NYSE Arca Tech 100 IndexSM(2) | | | 7.77 | % | | | 15.89 | % | | | (1.57 | )% | | | 7.97 | % | |
Based on a $10,000 initial investment, the graph and table above illustrate the total return of ING VP Global Science and Technology Portfolio against the indices indicated. An index has no cash in its portfolio, imposes no sales charges and incurs no operating expenses. An investor cannot invest directly in an index. The Portfolio's performance is shown without the imposition of any expenses or charges which are, or may be, imposed under your annuity contract. Total returns would have been lower if such expenses or charges were included.
The performance graph and table do not reflect the deduction of taxes that a shareholder will pay on portfolio distributions or the redemption of portfolio shares.
The performance shown may include the effect of fee waivers and/or expense reimbursements by the Investment Adviser and/or other service providers, which have the effect of increasing total return. Had all fees and expenses been considered, the total returns would have been lower.
The performance update illustrates performance for a variable investment option available through a variable annuity contract. The performance shown indicates past performance and is not a projection or prediction of future results. Actual investment returns and principal value will fluctuate so that shares and/or units, at redemption, may be worth more or less than their original cost. Please call (800) 992-0180 to get performance through the most recent month end.
This report contains statements that may be "forward-looking" statements. Actual results may differ materially from those projected in the "forward-looking" statements.
The views expressed in this report reflect those of the portfolio managers, only through the end of the period as stated on the cover. The portfolio managers' views are subject to change at any time based on market and other conditions.
Portfolio holdings are subject to change daily.
* On December 16, 2003, all outstanding shares of Class S were fully redeemed. On July 20, 2005, Class S recommenced operations. The returns for Class S include the performance for Class I, adjusted to reflect the higher expenses of Class S, for the period December 17, 2003 to July 19, 2005.
(1) The S&P 500® Index is an unmanaged index that measures the performance of the securities of approximately 500 of the largest companies in the U.S.
(2) The NYSE Arca Tech 100 IndexSM is a multi-industry technology index measuring the performance of companies using technology innovation across a broad spectrum of industries. It is comprised of 100 listed and over-the-counter stocks from 14 different subsectors including computer hardware, software, semiconductors, telecommunications, data storage and processing, electronics and biotechnology.
Effective March 1, 2002, ING Investments, LLC began serving as investment adviser. Formerly, ING Investment Management Co. served as the investment adviser. Prior to January 1, 2004, the Portfolio was sub-advised by a different sub-adviser.
18
SHAREHOLDER EXPENSE EXAMPLES (UNAUDITED)
As a shareholder of a Portfolio, you incur two types of costs: (1) transaction costs, including redemption fees and exchange fees; and (2) ongoing costs, including management fees, distribution and/or service (12b-1) fees, and other Portfolio expenses. These Examples are intended to help you understand your ongoing costs (in dollars) of investing in a Portfolio and to compare these costs with the ongoing costs of investing in other mutual funds.
The Examples are based on an investment of $1,000 invested at the beginning of the period and held for the entire period from July 1, 2007 to December 31, 2007. The Portfolios' expenses are shown without the imposition of any charges which are, or may be, imposed under your annuity contract. Expenses would have been higher if such charges were included.
Actual Expenses
The first section of the table shown, "Actual Portfolio Return," provides information about actual account values and actual expenses. You may use the information in this section, together with the amount you invested, to estimate the expenses that you paid over the period. Simply divide your account value by $1,000 (for example, an $8,600 account value divided by $1,000 = 8.6), then multiply the result by the number in the first section under the heading entitled "Expenses Paid During the Period" to estimate the expenses you paid on your account during this period.
Hypothetical Example for Comparison Purposes
The second section of the table shown, "Hypothetical (5% return before expenses)," provides information about hypothetical account values and hypothetical expenses based on the Portfolio's actual expense ratio and an assumed rate of return of 5% per year before expenses, which is not the Portfolio's actual return. The hypothetical account values and expenses may not be used to estimate the actual ending account balance or expenses you paid for the period. You may use this information to compare the ongoing costs of investing in the Portfolio and other mutual funds. To do so, compare this 5% hypothetical example with the 5% hypothetical examples that appear in the shareholder reports of the other mutual funds.
Please note that the expenses shown in the table are meant to highlight your ongoing costs only and do not reflect any transactional costs, such as redemption fees or exchange fees. Therefore, the hypothetical lines of the table are useful in comparing ongoing costs only, and will not help you determine the relative total costs of owning different mutual funds. In addition, if these transactional costs were included, your costs would have been higher.
| ING VP Balanced Portfolio | | Beginning
Account
Value
July 1, 2007 | | Ending
Account
Value
December 31, 2007 | | Annualized
Expense
Ratio | | Expenses Paid
During the
Period Ended
December 31, 2007* | |
| Actual Portfolio Return | |
| Class ADV | | $ | 1,000.00 | | | $ | 1,003.50 | | | | 1.25 | % | | $ | 6.31 | | |
| Class I | | | 1,000.00 | | | | 1,007.70 | | | | 0.60 | | | | 3.04 | | |
| Class S | | | 1,000.00 | | | | 1,006.30 | | | | 0.85 | | | | 4.30 | | |
| Hypothetical (5% return before expenses) | |
| Class ADV | | $ | 1,000.00 | | | $ | 1,018.90 | | | | 1.25 | % | | $ | 6.36 | | |
| Class I | | | 1,000.00 | | | | 1,022.18 | | | | 0.60 | | | | 3.06 | | |
| Class S | | | 1,000.00 | | | | 1,020.92 | | | | 0.85 | | | | 4.33 | | |
* Expenses are equal to each Portfolio's respective annualized expense ratios multiplied by the average account value over the period, multiplied by 184/365 to reflect the most recent fiscal half-year.
19
SHAREHOLDER EXPENSE EXAMPLES (UNAUDITED) (CONTINUED)
| ING VP Growth and Income Portfolio | | Beginning
Account
Value
July 1, 2007 | | Ending
Account
Value
December 31, 2007 | | Annualized
Expense
Ratio | | Expenses Paid
During the
Period Ended
December 31, 2007* | |
| Actual Portfolio Return | |
| Class ADV | | $ | 1,000.00 | | | $ | 994.70 | | | | 1.09 | % | | $ | 5.48 | | |
| Class I | | | 1,000.00 | | | | 998.00 | | | | 0.59 | | | | 2.97 | | |
| Class S | | | 1,000.00 | | | | 996.90 | | | | 0.84 | | | | 4.23 | | |
| Hypothetical (5% return before expenses) | |
| Class ADV | | $ | 1,000.00 | | | $ | 1,019.71 | | | | 1.09 | % | | $ | 5.55 | | |
| Class I | | | 1,000.00 | | | | 1,022.23 | | | | 0.59 | | | | 3.01 | | |
| Class S | | | 1,000.00 | | | | 1,020.97 | | | | 0.84 | | | | 4.28 | | |
| ING VP Growth Portfolio | |
| Actual Portfolio Return | |
| Class ADV | | $ | 1,000.00 | | | $ | 1,089.20 | | | | 1.20 | % | | $ | 6.32 | | |
| Class I | | | 1,000.00 | | | | 1,093.40 | | | | 0.70 | | | | 3.69 | | |
| Class S | | | 1,000.00 | | | | 1,091.60 | | | | 0.95 | | | | 5.01 | | |
| Hypothetical (5% return before expenses) | |
| Class ADV | | $ | 1,000.00 | | | $ | 1,019.16 | | | | 1.20 | % | | $ | 6.11 | | |
| Class I | | | 1,000.00 | | | | 1,021.68 | | | | 0.70 | | | | 3.57 | | |
| Class S | | | 1,000.00 | | | | 1,020.42 | | | | 0.95 | | | | 4.84 | | |
| ING VP Small Company Portfolio | |
| Actual Portfolio Return | |
| Class I | | $ | 1,000.00 | | | $ | 957.40 | | | | 0.84 | % | | $ | 4.14 | | |
| Class S | | | 1,000.00 | | | | 956.10 | | | | 1.09 | | | | 5.37 | | |
| Hypothetical (5% return before expenses) | |
| Class I | | $ | 1,000.00 | | | $ | 1,020.97 | | | | 0.84 | % | | $ | 4.28 | | |
| Class S | | | 1,000.00 | | | | 1,019.71 | | | | 1.09 | | | | 5.55 | | |
| ING VP Value Opportunity Portfolio | |
| Actual Portfolio Return | |
| Class ADV | | $ | 1,000.00 | | | $ | 954.20 | | | | 1.19 | % | | $ | 5.86 | | |
| Class I | | | 1,000.00 | | | | 956.50 | | | | 0.69 | | | | 3.40 | | |
| Class S | | | 1,000.00 | | | | 955.60 | | | | 0.94 | | | | 4.63 | | |
| Hypothetical (5% return before expenses) | |
| Class ADV | | $ | 1,000.00 | | | $ | 1,019.21 | | | | 1.19 | % | | $ | 6.06 | | |
| Class I | | | 1,000.00 | | | | 1,021.73 | | | | 0.69 | | | | 3.52 | | |
| Class S | | | 1,000.00 | | | | 1,020.47 | | | | 0.94 | | | | 4.79 | | |
* Expenses are equal to each Portfolio's respective annualized expense ratios multiplied by the average account value over the period, multiplied by 184/365 to reflect the most recent fiscal half-year.
20
SHAREHOLDER EXPENSE EXAMPLES (UNAUDITED) (CONTINUED)
| ING VP Intermediate Bond Portfolio | | Beginning
Account
Value
July 1, 2007 | | Ending
Account
Value
December 31, 2007 | | Annualized
Expense
Ratio | | Expenses Paid
During the
Period Ended
December 31, 2007* | |
| Actual Portfolio Return | |
| Class ADV | | $ | 1,000.00 | | | $ | 1,046.30 | | | | 0.99 | % | | $ | 5.11 | | |
| Class I | | | 1,000.00 | | | | 1,047.30 | | | | 0.49 | | | | 2.53 | | |
| Class S | | | 1,000.00 | | | | 1,046.40 | | | | 0.74 | | | | 3.82 | | |
| Hypothetical (5% return before expenses) | |
| Class ADV | | $ | 1,000.00 | | | $ | 1,020.21 | | | | 0.99 | % | | $ | 5.04 | | |
| Class I | | | 1,000.00 | | | | 1,022.74 | | | | 0.49 | | | | 2.50 | | |
| Class S | | | 1,000.00 | | | | 1,021.48 | | | | 0.74 | | | | 3.77 | | |
| ING VP Money Market Portfolio | |
| Actual Portfolio Return | |
| Class I | | $ | 1,000.00 | | | $ | 1,025.70 | | | | 0.33 | % | | $ | 1.68 | | |
| Hypothetical (5% return before expenses) | |
| Class I | | $ | 1,000.00 | | | $ | 1,023.54 | | | | 0.33 | % | | $ | 1.68 | | |
| ING VP Global Science and Technology Portfolio | |
| Actual Portfolio Return | |
| Class I | | $ | 1,000.00 | | | $ | 1,075.00 | | | | 1.08 | % | | $ | 5.65 | | |
| Class S | | | 1,000.00 | | | | 1,075.40 | | | | 1.33 | | | | 6.96 | | |
| Hypothetical (5% return before expenses) | |
| Class I | | $ | 1,000.00 | | | $ | 1,019.76 | | | | 1.08 | % | | $ | 5.50 | | |
| Class S | | | 1,000.00 | | | | 1,018.50 | | | | 1.33 | | | | 6.77 | | |
* Expenses are equal to each Portfolio's respective annualized expense ratios multiplied by the average account value over the period, multiplied by 184/365 to reflect the most recent fiscal half-year.
21
REPORT OF INDEPENDENT REGISTERED PUBLIC ACCOUNTING FIRM
The Shareholders and Board of Directors/Trustees
ING VP Balanced Portfolio, Inc., ING Variable Funds, ING Variable Portfolios, Inc., ING VP Intermediate Bond Portfolio, and ING VP Money Market Portfolio
We have audited the accompanying statements of assets and liabilities, including the portfolios of investments, of ING VP Balanced Portfolio, ING VP Growth and Income Portfolio, a series of ING Variable Funds, ING VP Growth Portfolio, ING VP Small Company Portfolio, ING VP Value Opportunity Portfolio, and ING VP Global Science and Technology Portfolio, each a series of ING Variable Portfolios, Inc., ING VP Intermediate Bond Portfolio, and ING VP Money Market Portfolio, as of December 31, 2007, and the related statements of operations for the year then ended, the statements of changes in net assets for each of the years in the two-year period then ended, and the financial highlights for each of the years or periods in the five-year period then ended. These financial statements and financial highlights are the responsibility of management. Our responsibility is to express an opinion on these financial statements and financial highlights based on our audits.
We conducted our audits in accordance with the standards of the Public Company Accounting Oversight Board (United States). Those standards require that we plan and perform the audits to obtain reasonable assurance about whether the financial statements and financial highlights are free of material misstatement. An audit includes examining, on a test basis, evidence supporting the amounts and disclosures in the financial statements. Our procedures included confirmation of securities owned as of December 31, 2007, by correspondence with the custodian and brokers, or by other appropriate auditing procedures when replies from brokers were not received. An audit also includes assessing the accounting principles used and significant estimates made by management, as well as evaluating the overall financial statement presentation. We believe that our audits provide a reasonable basis for our opinion.
In our opinion, the financial statements and financial highlights referred to above present fairly, in all material respects, the financial position of the aforementioned portfolios as of December 31, 2007, the results of their operations, the changes in their net assets, and the financial highlights for the periods specified in the first paragraph above, in conformity with U.S. generally accepted accounting principles.
Boston, Massachusetts
February 29, 2008
22
STATEMENTS OF ASSETS AND LIABILITIES AS OF DECEMBER 31, 2007
| | | ING
VP Balanced
Portfolio | | ING
VP Growth and
Income
Portfolio | | ING
VP Growth
Portfolio | |
| ASSETS: | |
| Investments in securities at value+* | | $ | 1,053,819,059 | | | $ | 2,737,567,597 | | | $ | 159,706,311 | | |
| Short-term investments in affiliates at amortized cost | | | 29,000,000 | | | | 59,925,000 | | | | 525,000 | | |
| Short-term investments at amortized cost | | | 196,902,493 | | | | 342,423,398 | | | | 321,000 | | |
| Cash | | | 42,252 | | | | 4,459,343 | | | | 1,290 | | |
| Cash collateral for futures | | | 1,358,291 | | | | 990,000 | | | | — | | |
| Foreign currencies at value** | | | 117,309 | | | | 19,311 | | | | — | | |
| Receivables: | |
| Investment securities sold | | | 38,001,916 | | | | 137,481,638 | | | | 4,594,561 | | |
| Fund shares sold | | | 43,216 | | | | 14,770 | | | | 4,101 | | |
| Dividends and interest | | | 3,428,208 | | | | 4,129,451 | | | | 93,812 | | |
| Variation margin | | | 245,787 | | | | — | | | | — | | |
| Unrealized appreciation on forward foreign currency contracts | | | 240,554 | | | | — | | | | — | | |
| Upfront payments made on swap agreements | | | 1,456,235 | | | | — | | | | — | | |
| Unrealized appreciation on swap agreements | | | 2,301,547 | | | | — | | | | — | | |
| Prepaid expenses | | | 598 | | | | 1,586 | | | | — | | |
| Total assets | | | 1,326,957,465 | | | | 3,287,012,094 | | | | 165,246,075 | | |
| LIABILITIES: | |
| Payable for investment securities purchased | | | 71,877,594 | | | | 123,298,521 | | | | 4,359,436 | | |
| Payable for fund shares redeemed | | | 1,210,522 | | | | 2,530,264 | | | | 1,155,766 | | |
| Payable for futures variation margin | | | 159,834 | | | | 114,125 | | | | — | | |
| Payable upon receipt of securities loaned | | | 194,627,493 | | | | 336,741,398 | | | | — | | |
| Unrealized depreciation on forward foreign currency contracts | | | 27,691 | | | | — | | | | — | | |
| Upfront payments received on swap agreements | | | 568,679 | | | | — | | | | — | | |
| Unrealized depreciation on swap agreements | | | 1,008,784 | | | | — | | | | — | | |
| Payable to affiliates | | | 502,300 | | | | 1,359,980 | | | | 95,010 | | |
| Payable for directors fees | | | 34,088 | | | | 69,210 | | | | 4,203 | | |
| Other accrued expenses and liabilities | | | 159,908 | | | | 403,598 | | | | 36,235 | | |
| Total liabilities | | | 270,176,893 | | | | 464,517,096 | | | | 5,650,650 | | |
| NET ASSETS | | $ | 1,056,780,572 | | | $ | 2,822,494,998 | | | $ | 159,595,425 | | |
| NET ASSETS WERE COMPRISED OF: | |
| Paid-in capital | | $ | 932,901,009 | | | $ | 4,333,962,550 | | | $ | 292,078,274 | | |
| Undistributed net investment income | | | 29,652,010 | | | | — | | | | 790,454 | | |
Accumulated net realized gain (loss) on investments, foreign
currency related transactions, futures, swaps, and written options | | | 76,465,912 | | | | (1,827,931,288 | ) | | | (139,449,071 | ) | |
Net unrealized appreciation on investments, foreign currency
related transactions, futures, and swaps | | | 17,761,641 | | | | 316,463,736 | | | | 6,175,768 | | |
| NET ASSETS | | $ | 1,056,780,572 | | | $ | 2,822,494,998 | | | $ | 159,595,425 | | |
| + Including securities loaned at value | | $ | 189,920,382 | | | $ | 326,408,493 | | | $ | — | | |
| * Cost of investments in securities | | $ | 1,037,188,649 | | | $ | 2,420,852,039 | | | $ | 153,530,543 | | |
| ** Cost of foreign currencies | | $ | 117,369 | | | $ | 19,427 | | | $ | — | | |
| Class ADV: | |
| Net assets | | $ | 1,006 | | | $ | 1,210,898 | | | $ | 1,386,445 | | |
| Shares authorized | | | 500,000,000 | | | | unlimited | | | | 100,000,000 | | |
| Par value | | $ | 0.001 | | | $ | 1.00 | | | $ | 0.001 | | |
| Shares outstanding | | | 70 | | | | 49,198 | | | | 111,250 | | |
| Net asset value and redemption price per share | | $ | 14.34 | | | $ | 24.61 | | | $ | 12.46 | | |
| Class I: | |
| Net assets | | $ | 1,046,498,170 | | | $ | 2,796,115,289 | | | $ | 137,104,296 | | |
| Shares authorized | | | 500,000,000 | | | | unlimited | | | | 100,000,000 | | |
| Par value | | $ | 0.001 | | | $ | 1.00 | | | $ | 0.001 | | |
| Shares outstanding | | | 72,424,967 | | | | 112,925,801 | | | | 10,943,202 | | |
| Net asset value and redemption price per share | | $ | 14.45 | | | $ | 24.76 | | | $ | 12.53 | | |
| Class S: | |
| Net assets | | $ | 10,281,396 | | | $ | 25,168,811 | | | $ | 21,104,684 | | |
| Shares authorized | | | 500,000,000 | | | | unlimited | | | | 100,000,000 | | |
| Par value | | $ | 0.001 | | | $ | 1.00 | | | $ | 0.001 | | |
| Shares outstanding | | | 715,902 | | | | 1,021,794 | | | | 1,703,078 | | |
| Net asset value and redemption price per share | | $ | 14.36 | | | $ | 24.63 | | | $ | 12.39 | | |
See Accompanying Notes to Financial Statements
23
STATEMENTS OF ASSETS AND LIABILITIES AS OF DECEMBER 31, 2007
| | | ING
VP Small
Company
Portfolio | | ING
VP Value
Opportunity
Portfolio | | ING
VP Intermediate
Bond
Portfolio | |
| ASSETS: | |
| Investments in securities at value+* | | $ | 588,961,687 | | | $ | 167,417,483 | | | $ | 3,436,872,286 | | |
| Short-term investments in affiliates at amortized cost | | | 17,300,000 | | | | 60,000 | | | | 58,316,000 | | |
| Short-term investments at amortized cost | | | 178,547,837 | | | | 38,345,940 | | | | 879,357,480 | | |
| Cash | | | 2,905 | | | | 736 | | | | 7,942,580 | | |
| Cash collateral for futures | | | — | | | | — | | | | 11,970,138 | | |
| Receivables: | |
| Investment securities sold | | | 4,530,597 | | | | — | | | | 210,604,445 | | |
| Fund shares sold | | | 532,204 | | | | 33,484 | | | | 3,723,375 | | |
| Dividends and interest | | | 1,333,624 | | | | 187,908 | | | | 19,641,709 | | |
| Variation margin | | | — | | | | — | | | | 1,890,019 | | |
| Unrealized appreciation on forward currency contracts | | | — | | | | — | | | | 1,911,125 | | |
| Upfront payments made on swap agreements | | | — | | | | — | | | | 10,566,319 | | |
| Unrealized appreciation on swap agreements | | | — | | | | — | | | | 16,327,858 | | |
| Prepaid expenses | | | 265 | | | | — | | | | 1,105 | | |
| Total assets | | | 791,209,119 | | | | 206,045,551 | | | | 4,659,124,439 | | |
| LIABILITIES: | |
| Payable for investment securities purchased | | | 6,092,395 | | | | — | | | | 418,150,264 | | |
| Payable for fund shares redeemed | | | 884,211 | | | | 222,278 | | | | 7,021,867 | | |
| Payable for futures variation margin | | | — | | | | — | | | | 876,521 | | |
| Payable upon receipt of securities loaned | | | 177,336,837 | | | | 38,345,940 | | | | 872,460,480 | | |
| Unrealized depreciation on forward foreign currency contracts | | | — | | | | — | | | | 210,783 | | |
| Upfront payments received on swap agreements | | | — | | | | — | | | | 4,265,267 | | |
| Unrealized depreciation on swap agreements | | | — | | | | — | | | | 7,327,101 | | |
| Payable to affiliates | | | 417,504 | | | | 99,531 | | | | 1,505,233 | | |
| Payable to custodian due to foreign currency overdraft** | | | — | | | | — | | | | 322,938 | | |
| Payable for directors fees | | | 9,221 | | | | 5,997 | | | | 10,028 | | |
| Other accrued expenses and liabilities | | | 87,497 | | | | 47,034 | | | | 303,744 | | |
| Total liabilities | | | 184,827,665 | | | | 38,720,780 | | | | 1,312,454,226 | | |
| NET ASSETS | | $ | 606,381,454 | | | $ | 167,324,771 | | | $ | 3,346,670,213 | | |
| NET ASSETS WERE COMPRISED OF: | |
| Paid-in capital | | $ | 515,472,179 | | | $ | 137,510,755 | | | $ | 3,327,078,932 | | |
| Undistributed net investment income | | | 5,914,678 | | | | 2,600,516 | | | | 22,702,254 | | |
Accumulated net realized gain on investments, foreign
currency related transactions, futures, swaps, and written options | | | 73,024,318 | | | | 19,956,641 | | | | 43,184,649 | | |
Net unrealized appreciation or depreciation on investments, foreign
currency related transactions, futures, and swaps | | | 11,970,279 | | | | 7,256,859 | | | | (46,295,622 | ) | |
| NET ASSETS | | $ | 606,381,454 | | | $ | 167,324,771 | | | $ | 3,346,670,213 | | |
| + Including securities loaned at value | | $ | 170,136,305 | | | $ | 37,164,280 | | | $ | 857,043,519 | | |
| * Cost of investments in securities | | $ | 576,991,408 | | | $ | 160,160,624 | | | $ | 3,492,575,090 | | |
| ** Cost of foreign currency overdraft | | $ | — | | | $ | — | | | $ | 319,220 | | |
| Class ADV: | |
| Net assets | | | n/a | | | $ | 1,032 | | | $ | 1,003 | | |
| Shares authorized | | | n/a | | | | 100,000,000 | | | | unlimited | | |
| Par value | | | n/a | | | $ | 0.001 | | | $ | 1.00 | | |
| Shares outstanding | | | n/a | | | | 65 | | | | 76 | | |
| Net asset value and redemption price per share | | | n/a | | | $ | 15.82 | | | $ | 13.23 | | |
| Class I: | |
| Net assets | | $ | 603,491,642 | | | $ | 143,438,134 | | | $ | 2,267,007,698 | | |
| Shares authorized | | | 100,000,000 | | | | 100,000,000 | | | | unlimited | | |
| Par value | | $ | 0.001 | | | $ | 0.001 | | | $ | 1.00 | | |
| Shares outstanding | | | 30,848,271 | | | | 8,934,210 | | | | 171,429,839 | | |
| Net asset value and redemption price per share | | $ | 19.56 | | | $ | 16.05 | | | $ | 13.22 | | |
| Class S: | |
| Net assets | | $ | 2,889,812 | | | $ | 23,885,605 | | | $ | 1,079,661,512 | | |
| Shares authorized | | | 100,000,000 | | | | 100,000,000 | | | | unlimited | | |
| Par value | | $ | 0.001 | | | $ | 0.001 | | | $ | 1.00 | | |
| Shares outstanding | | | 149,054 | | | | 1,499,291 | | | | 82,192,637 | | |
| Net asset value and redemption price per share | | $ | 19.39 | | | $ | 15.93 | | | $ | 13.14 | | |
See Accompanying Notes to Financial Statements
24
STATEMENTS OF ASSETS AND LIABILITIES AS OF DECEMBER 31, 2007
| | ING
VP Money
Market
Portfolio | | ING
VP Global Science
and Technology
Portfolio | |
| ASSETS: | |
| Investments in securities at value+* | | $ | — | | | $ | 93,543,381 | | |
| Short-term investments at amortized cost | | | 1,713,502,244 | | | | 23,008,604 | | |
| Cash | | | 51,772 | | | | 1,094,685 | | |
| Foreign currencies at value** | | | — | | | | 2,142,384 | | |
| Receivables: | |
| Investment securities sold | | | — | | | | 6,585 | | |
| Fund shares sold | | | 331 | | | | 930,493 | | |
| Dividends and interest | | | 5,736,737 | | | | 34,920 | | |
| Unrealized appreciation on forward currency contracts | | | — | | | | 191,744 | | |
| Prepaid expenses | | | 640 | | | | — | | |
| Total assets | | | 1,719,291,724 | | | | 120,952,796 | | |
| LIABILITIES: | |
| Payable for fund shares redeemed | | | 6,566,021 | | | | 16,236 | | |
| Payable upon receipt of securities loaned | | | 1,010,974 | | | | 21,410,626 | | |
| Unrealized depreciation on forward foreign currency contracts | | | — | | | | 318,696 | | |
| Payable to affiliates | | | 442,315 | | | | 84,233 | | |
| Payable for directors fees | | | 11,217 | | | | 2,511 | | |
| Other accrued expenses and liabilities | | | 121,910 | | | | 37,443 | | |
| Total liabilities | | | 8,152,437 | | | | 21,869,745 | | |
| NET ASSETS | | $ | 1,711,139,287 | | | $ | 99,083,051 | | |
| NET ASSETS WERE COMPRISED OF: | |
| Paid-in capital | | $ | 1,637,792,151 | | | $ | 116,638,510 | | |
| Undistributed net investment income | | | 77,924,640 | | | | 131,809 | | |
Accumulated net realized loss on investments and foreign
currency related transactions | | | (4,577,504 | ) | | | (32,464,964 | ) | |
Net unrealized appreciation on investments and foreign currency
related transactions | | | — | | | | 14,777,696 | | |
| NET ASSETS | | $ | 1,711,139,287 | | | $ | 99,083,051 | | |
| + Including securities loaned at value | | $ | 981,245 | | | $ | 20,640,654 | | |
| * Cost of investments in securities | | $ | — | | | $ | 78,627,641 | | |
| ** Cost of foreign currencies | | $ | — | | | $ | 2,153,644 | | |
| Class I: | |
| Net assets | | $ | 1,711,139,287 | | | $ | 97,942,613 | | |
| Shares authorized | | | unlimited | | | | 100,000,000 | | |
| Par value | | $ | 1.00 | | | $ | 0.001 | | |
| Shares outstanding | | | 126,672,176 | | | | 17,957,743 | | |
| Net asset value and redemption price per share | | $ | 13.51 | | | $ | 5.45 | | |
| Class S: | |
| Net assets | | | n/a | | | $ | 1,140,438 | | |
| Shares authorized | | | n/a | | | | 100,000,000 | | |
| Par value | | | n/a | | | $ | 0.001 | | |
| Shares outstanding | | | n/a | | | | 210,356 | | |
| Net asset value and redemption price per share | | | n/a | | | $ | 5.42 | | |
See Accompanying Notes to Financial Statements
25
STATEMENTS OF OPERATIONS FOR THE YEAR ENDED DECEMBER 31, 2007
| | | ING
VP Balanced
Portfolio | | ING
VP Growth and
Income
Portfolio | | ING
VP Growth
Portfolio | |
| INVESTMENT INCOME: | |
| Dividends, net of foreign taxes withheld* | | $ | 12,674,154 | | | $ | 52,134,785 | | | $ | 2,110,608 | | |
| Interest(1) | | | 23,939,338 | | | | 4,789,727 | | | | 128,019 | | |
| Securities lending income | | | 427,231 | | | | 342,155 | | | | 25,982 | | |
| Total investment income | | | 37,040,723 | | | | 57,266,667 | | | | 2,264,609 | | |
| EXPENSES: | |
| Investment management fees | | | 5,655,120 | | | | 14,949,836 | | | | 1,198,635 | | |
| Distribution and service fees: | | | | | | | | | | | | | |
| Class ADV | | | 8 | | | | 1,242 | | | | 10,552 | | |
| Class S | | | 26,113 | | | | 20,756 | | | | 56,082 | | |
| Transfer agent fees | | | 365 | | | | 8,328 | | | | 183 | | |
| Administrative service fees | | | 622,044 | | | | 1,644,432 | | | | 109,871 | | |
| Shareholder reporting expense | | | 67,165 | | | | 158,930 | | | | 12,424 | | |
| Registration fees | | | 1,039 | | | | 2,492 | | | | — | | |
| Professional fees | | | 108,543 | | | | 256,555 | | | | 26,440 | | |
| Custody and accounting expense | | | 154,170 | | | | 285,123 | | | | 29,663 | | |
| Directors fees | | | 94,556 | | | | 213,500 | | | | 14,772 | | |
| Miscellaneous expense | | | 73,368 | | | | 227,811 | | | | 14,874 | | |
| Interest expense | | | — | | | | 5,994 | | | | 2,389 | | |
| Total expenses | | | 6,802,491 | | | | 17,774,999 | | | | 1,475,885 | | |
| Net waived and reimbursed fees | | | (37,365 | ) | | | (58,290 | ) | | | (1,291 | ) | |
| Brokerage commission recapture | | | — | | | | — | | | | (1,615 | ) | |
| Net expenses | | | 6,765,126 | | | | 17,716,709 | | | | 1,472,979 | | |
| Net investment income | | | 30,275,597 | | | | 39,549,958 | | | | 791,630 | | |
REALIZED AND UNREALIZED GAIN (LOSS)
ON INVESTMENTS, FOREIGN CURRENCY
RELATED TRANSACTIONS, FUTURES, SWAPS, AND WRITTEN OPTIONS: | |
| Net realized gain (loss) on: | |
| Investments | | | 85,334,030 | | | | 309,355,005 | | | | 44,248,409 | | |
| Foreign currency related transactions | | | (218,544 | ) | | | (57,187 | ) | | | — | | |
| Futures, swaps, and written options | | | 2,297,732 | | | | 3,093,129 | | | | — | | |
Net realized gain on investments, foreign currency
related transactions, futures, swaps, and written options | | | 87,413,218 | | | | 312,390,947 | | | | 44,248,409 | | |
| Net change in unrealized appreciation or depreciation on: | |
| Investments | | | (56,499,937 | ) | | | (132,191,243 | ) | | | (12,856,157 | ) | |
| Foreign currency related transactions | | | 212,773 | | | | 8,729 | | | | — | | |
| Futures and swaps | | | 1,373,433 | | | | (593,144 | ) | | | — | | |
Net change in unrealized appreciation or depreciation on
investments, foreign currency related transactions, futures, and swaps | | | (54,913,731 | ) | | | (132,775,658 | ) | | | (12,856,157 | ) | |
Net realized and unrealized gain on investments, foreign currency
related transactions, futures, swaps, and written options | | | 32,499,487 | | | | 179,615,289 | | | | 31,392,252 | | |
| Increase in net assets resulting from operations | | $ | 62,775,084 | | | $ | 219,165,247 | | | $ | 32,183,882 | | |
| * Foreign taxes withheld | | $ | 3,555 | | | $ | 266,542 | | | $ | 36,052 | | |
| (1) Affiliated income | | $ | 2,437,808 | | | $ | 3,794,834 | | | $ | 85,291 | | |
See Accompanying Notes to Financial Statements
26
STATEMENTS OF OPERATIONS FOR THE YEAR ENDED DECEMBER 31, 2007
| | | ING
VP Small
Company
Portfolio | | ING
VP Value
Opportunity
Portfolio | | ING
VP Intermediate
Bond
Portfolio | |
| INVESTMENT INCOME: | |
| Dividends, net of foreign taxes withheld* | | $ | 9,910,724 | | | $ | 3,834,991 | | | $ | 2,146,183 | | |
| Interest(1) | | | 1,144,094 | | | | 165,931 | | | | 162,149,884 | | |
| Securities lending income | | | 453,722 | | | | 30,187 | | | | 2,508,460 | | |
| Total investment income | | | 11,508,540 | | | | 4,031,109 | | | | 166,804,527 | | |
| EXPENSES: | |
| Investment management fees | | | 4,305,767 | | | | 1,135,795 | | | | 11,762,996 | | |
| Distribution and service fees: | |
| Class ADV | | | — | | | | 8 | | | | 4 | | |
| Class S | | | 6,209 | | | | 67,360 | | | | 2,163,586 | | |
| Transfer agent fees | | | 365 | | | | 531 | | | | 9,412 | | |
| Administrative service fees | | | 315,747 | | | | 104,111 | | | | 1,617,360 | | |
| Shareholder reporting expense | | | 29,592 | | | | 7,768 | | | | 189,584 | | |
| Registration fees | | | 415 | | | | — | | | | 11,325 | | |
| Professional fees | | | 46,265 | | | | 18,143 | | | | 236,615 | | |
| Custody and accounting expense | | | 63,875 | | | | 23,047 | | | | 309,360 | | |
| Directors fees | | | 33,692 | | | | 12,222 | | | | 141,020 | | |
| Miscellaneous expense | | | 40,519 | | | | 13,855 | | | | 127,604 | | |
| Interest expense | | | 597 | | | | — | | | | 6,222 | | |
| Total expenses | | | 4,843,043 | | | | 1,382,840 | | | | 16,575,088 | | |
| Net waived and reimbursed fees | | | (15,361 | ) | | | (1,756 | ) | | | (92,157 | ) | |
| Net expenses | | | 4,827,682 | | | | 1,381,084 | | | | 16,482,931 | | |
| Net investment income | | | 6,680,858 | | | | 2,650,025 | | | | 150,321,596 | | |
REALIZED AND UNREALIZED GAIN (LOSS)
ON INVESTMENTS, FOREIGN CURRENCY
RELATED TRANSACTIONS, FUTURES, SWAPS, AND WRITTEN OPTIONS: | |
| Net realized gain (loss) on: | |
| Investments | | | 72,668,573 | | | | 25,779,697 | | | | 49,687,632 | | |
| Foreign currency related transactions | | | 10,983 | | | | (29,673 | ) | | | (1,445,936 | ) | |
| Futures, swaps, and written options | | | — | | | | — | | | | 11,585,613 | | |
Net realized gain on investments, foreign currency
related transactions, futures, swaps, and written options | | | 72,679,556 | | | | 25,750,024 | | | | 59,827,309 | | |
| Net change in unrealized appreciation or depreciation on: | |
| Investments | | | (50,313,212 | ) | | | (22,057,799 | ) | | | (50,388,290 | ) | |
| Foreign currency related transactions | | | — | | | | — | | | | 1,696,322 | | |
| Futures and swaps | | | — | | | | — | | | | 9,056,386 | | |
Net change in unrealized appreciation or depreciation on
investments, foreign currency related transactions, futures, and swaps | | | (50,313,212 | ) | | | (22,057,799 | ) | | | (39,635,582 | ) | |
Net realized and unrealized gain on investments, foreign currency
related transactions, futures, swaps, and written options | | | 22,366,344 | | | | 3,692,225 | | | | 20,191,727 | | |
| Increase in net assets resulting from operations | | $ | 29,047,202 | | | $ | 6,342,250 | | | $ | 170,513,323 | | |
| * Foreign taxes withheld | | $ | — | | | $ | 29,156 | | | $ | 938 | | |
| (1) Affiliated income | | $ | 1,004,059 | | | $ | 115,556 | | | $ | 6,040,550 | | |
See Accompanying Notes to Financial Statements
27
STATEMENTS OF OPERATIONS FOR THE YEAR ENDED DECEMBER 31, 2007
| | | ING
VP Money
Market
Portfolio | | ING
VP Global Science
and Technology
Portfolio | |
| INVESTMENT INCOME: | |
| Dividends, net of foreign taxes withheld* | | $ | — | | | $ | 611,976 | | |
| Interest | | | 83,104,329 | | | | 82,168 | | |
| Securities lending income | | | 1,469 | | | | 36,588 | | |
| Total investment income | | | 83,105,798 | | | | 730,732 | | |
| EXPENSES: | |
| Investment management fees | | | 3,875,870 | | | | 826,795 | | |
| Distribution and service fees: | | | | | | | | | |
| Class S | | | — | | | | 1,772 | | |
| Transfer agent fees | | | 345 | | | | 291 | | |
| Administrative service fees | | | 852,665 | | | | 47,866 | | |
| Shareholder reporting expense | | | 54,860 | | | | 7,365 | | |
| Registration fees | | | 880 | | | | — | | |
| Professional fees | | | 111,020 | | | | 21,826 | | |
| Custody and accounting expense | | | 138,000 | | | | 24,541 | | |
| Directors fees | | | 75,167 | | | | 5,156 | | |
| Miscellaneous expense | | | 62,735 | | | | 8,864 | | |
| Interest expense | | | — | | | | 560 | | |
| Total expenses | | | 5,171,542 | | | | 945,036 | | |
| Net investment income (loss) | | | 77,934,256 | | | | (214,304 | ) | |
REALIZED AND UNREALIZED GAIN (LOSS) ON
INVESTMENTS AND FOREIGN CURRENCY RELATED TRANSACTIONS: | |
| Net realized gain (loss) on: | |
| Investments (net of Indian capital gains tax withheld)** | | | 43,078 | | | | 10,127,289 | | |
| Foreign currency related transactions | | | — | | | | (311,913 | ) | |
Net realized gain on investments and foreign currency
related transactions | | | 43,078 | | | | 9,815,376 | | |
| Net change in unrealized appreciation or depreciation on: | |
| Investments | | | — | | | | 5,039,274 | | |
| Foreign currency related transactions | | | — | | | | (98,831 | ) | |
| Net change in unrealized appreciation or depreciation on investments | | | — | | | | 4,940,443 | | |
Net realized and unrealized gain on
investments and foreign currency related transactions | | | 43,078 | | | | 14,755,819 | | |
| Increase in net assets resulting from operations | | $ | 77,977,334 | | | $ | 14,541,515 | | |
| * Foreign taxes withheld | | $ | — | | | $ | 42,841 | | |
| ** Foreign tax on sale of Indian investments | | $ | — | | | $ | 23,584 | | |
See Accompanying Notes to Financial Statements
28
STATEMENTS OF CHANGES IN NET ASSETS
| | | ING VP Balanced Portfolio | | ING VP Growth and
Income Portfolio | |
| | | Year
Ended
December 31,
2007 | | Year
Ended
December 31,
2006 | | Year
Ended
December 31,
2007 | | Year
Ended
December 31,
2006 | |
| FROM OPERATIONS: | |
| Net investment income | | $ | 30,275,597 | | | $ | 30,129,554 | | | $ | 39,549,958 | | | $ | 35,726,032 | | |
Net realized gain on investments, foreign currency
related transactions, futures, and swaps | | | 87,413,218 | | | | 64,973,809 | | | | 312,390,947 | | | | 284,669,891 | | |
Net change in unrealized appreciation or
depreciation on investments, foreign currency
related transactions, futures, and swaps | | | (54,913,731 | ) | | | 20,635,045 | | | | (132,775,658 | ) | | | 89,779,583 | | |
| Increase in net assets resulting from operations | | | 62,775,084 | | | | 115,738,408 | | | | 219,165,247 | | | | 410,175,506 | | |
| FROM DISTRIBUTIONS TO SHAREHOLDERS: | |
| Net investment income: | |
| Class ADV | | | (27 | ) | | | — | | | | (15,923 | ) | | | (12 | ) | |
| Class I | | | (30,215,749 | ) | | | (28,870,646 | ) | | | (39,306,243 | ) | | | (35,978,959 | ) | |
| Class S | | | (258,983 | ) | | | (70,509 | ) | | | (348,348 | ) | | | (46,207 | ) | |
| Net realized gains: | | | | | | | | | | | | | | | | | |
| Class ADV | | | (40 | ) | | | — | | | | — | | | | — | | |
| Class I | | | (44,705,487 | ) | | | — | | | | — | | | | — | | |
| Class S | | | (414,002 | ) | | | — | | | | — | | | | — | | |
| Total distributions | | | (75,594,288 | ) | | | (28,941,155 | ) | | | (39,670,514 | ) | | | (36,025,178 | ) | |
| FROM CAPITAL SHARE TRANSACTIONS: | |
| Net proceeds from sale of shares | | | 10,060,036 | | | | 68,843,823 | | | | 8,193,101 | | | | 26,744,895 | | |
| Proceeds from shares issued in merger (Note 15) | | | — | | | | 21,745,814 | | | | 74,681,070 | | | | — | | |
| Dividends reinvested | | | 75,594,221 | | | | 28,941,155 | | | | 39,643,089 | | | | 35,997,107 | | |
| | | | 85,654,257 | | | | 119,530,792 | | | | 122,517,260 | | | | 62,742,002 | | |
| Cost of shares redeemed | | | (210,666,560 | ) | | | (251,212,849 | ) | | | (582,395,681 | ) | | | (482,469,282 | ) | |
Net decrease in net assets resulting from
capital share transactions | | | (125,012,303 | ) | | | (131,682,057 | ) | | | (459,878,421 | ) | | | (419,727,280 | ) | |
| Net decrease in net assets | | | (137,831,507 | ) | | | (44,884,804 | ) | | | (280,383,688 | ) | | | (45,576,952 | ) | |
| NET ASSETS: | |
| Beginning of year | | | 1,194,612,079 | | | | 1,239,496,883 | | | | 3,102,878,686 | | | | 3,148,455,638 | | |
| End of year | | $ | 1,056,780,572 | | | $ | 1,194,612,079 | | | $ | 2,822,494,998 | | | $ | 3,102,878,686 | | |
| Undistributed net investment income at end of year | | $ | 29,652,010 | | | $ | 30,641,694 | | | $ | — | | | $ | 161,526 | | |
See Accompanying Notes to Financial Statements
29
STATEMENTS OF CHANGES IN NET ASSETS
| | | ING VP Growth Portfolio | | ING VP Small Company Portfolio | |
| | | Year
Ended
December 31,
2007 | | Year
Ended
December 31,
2006 | | Year
Ended
December 31,
2007 | | Year
Ended
December 31,
2006 | |
| FROM OPERATIONS: | |
| Net investment income | | $ | 791,630 | | | $ | 365,241 | | | $ | 6,680,858 | | | $ | 1,129,645 | | |
Net realized gain on investments and foreign currency
related transactions | | | 44,248,409 | | | | 13,075,352 | | | | 72,679,556 | | | | 76,291,234 | | |
Net change in unrealized depreciation
on investments | | | (12,856,157 | ) | | | (9,629,888 | ) | | | (50,313,212 | ) | | | (665,601 | ) | |
| Increase in net assets resulting from operations | | | 32,183,882 | | | | 3,810,705 | | | | 29,047,202 | | | | 76,755,278 | | |
| FROM DISTRIBUTIONS TO SHAREHOLDERS: | |
| Net investment income: | | | | | | | | | | | | | | | | | |
| Class ADV | | | (5,297 | ) | | | — | | | | — | | | | — | | |
| Class I | | | (317,593 | ) | | | (113,349 | ) | | | (935,976 | ) | | | (1,544,649 | ) | |
| Class S | | | (41,178 | ) | | | — | | | | — | | | | (154,077 | ) | |
| Net realized gains: | | | | | | | | | | | | | | | | | |
| Class I | | | — | | | | — | | | | (76,399,058 | ) | | | (58,647,564 | ) | |
| Class S | | | — | | | | — | | | | (343,384 | ) | | | (12,123,157 | ) | |
| Total distributions | | | (364,068 | ) | | | (113,349 | ) | | | (77,678,418 | ) | | | (72,469,447 | ) | |
| FROM CAPITAL SHARE TRANSACTIONS: | |
| Net proceeds from sale of shares | | | 14,782,965 | | | | 51,217,584 | | | | 167,605,751 | | | | 161,701,457 | | |
| Proceeds from shares issued in merger (Note 15) | | | 36,851,627 | | | | — | | | | — | | | | — | | |
| Dividends reinvested | | | 364,068 | | | | 113,349 | | | | 77,678,418 | | | | 72,469,447 | | |
| | | | 51,998,660 | | | | 51,330,933 | | | | 245,284,169 | | | | 234,170,904 | | |
| Cost of shares redeemed | | | (110,992,399 | ) | | | (43,840,954 | ) | | | (104,878,944 | ) | | | (186,317,390 | ) | |
Net increase (decrease) in net assets resulting from
capital share transactions | | | (58,993,739 | ) | | | 7,489,979 | | | | 140,405,225 | | | | 47,853,514 | | |
| Net increase (decrease) in net assets | | | (27,173,925 | ) | | | 11,187,335 | | | | 91,774,009 | | | | 52,139,345 | | |
| NET ASSETS: | |
| Beginning of year | | | 186,769,350 | | | | 175,582,015 | | | | 514,607,445 | | | | 462,468,100 | | |
| End of year | | $ | 159,595,425 | | | $ | 186,769,350 | | | $ | 606,381,454 | | | $ | 514,607,445 | | |
| Undistributed net investment income at end of year | | $ | 790,454 | | | $ | 362,892 | | | $ | 5,914,678 | | | $ | 970,883 | | |
See Accompanying Notes to Financial Statements
30
STATEMENTS OF CHANGES IN NET ASSETS
| | | ING VP Value
Opportunity Portfolio | | ING VP Intermediate
Bond Portfolio | |
| | | Year
Ended
December 31,
2007 | | Year
Ended
December 31,
2006 | | Year
Ended
December 31,
2007 | | Year
Ended
December 31,
2006 | |
| FROM OPERATIONS: | |
| Net investment income | | $ | 2,650,025 | | | $ | 3,129,904 | | | $ | 150,321,596 | | | $ | 101,202,907 | | |
Net realized gain (loss) on investments, foreign
currency related transactions, futures, and swaps | | | 25,750,024 | | | | 17,917,306 | | | | 59,827,309 | | | | (13,025,987 | ) | |
Net change in unrealized appreciation or
depreciation on investments, foreign currency
related transactions, futures, and swaps | | | (22,057,799 | ) | | | 9,299,578 | | | | (39,635,582 | ) | | | (973,051 | ) | |
| Increase in net assets resulting from operations | | | 6,342,250 | | | | 30,346,788 | | | | 170,513,323 | | | | 87,203,869 | | |
| FROM DISTRIBUTIONS TO SHAREHOLDERS: | |
| Net investment income: | | | | | | | | | | | | | | | | | |
| Class ADV | | | (17 | ) | | | — | | | | (34 | ) | | | (40 | ) | |
| Class I | | | (2,729,403 | ) | | | (2,514,028 | ) | | | (83,987,331 | ) | | | (75,863,165 | ) | |
| Class S | | | (385,996 | ) | | | (411,247 | ) | | | (38,555,643 | ) | | | (23,433,812 | ) | |
| Total distributions | | | (3,115,416 | ) | | | (2,925,275 | ) | | | (122,543,008 | ) | | | (99,297,017 | ) | |
| FROM CAPITAL SHARE TRANSACTIONS: | |
| Net proceeds from sale of shares | | | 1,549,317 | | | | 2,493,673 | | | | 1,136,671,743 | | | | 1,313,238,729 | | |
| Proceeds from shares issued in merger (Note 15) | | | — | | | | — | | | | — | | | | 2,862,609 | | |
| Dividends reinvested | | | 3,115,398 | | | | 2,925,275 | | | | 122,517,553 | | | | 99,270,730 | | |
| | | | 4,664,715 | | | | 5,418,948 | | | | 1,259,189,296 | | | | 1,415,372,068 | | |
| Cost of shares redeemed | | | (41,972,831 | ) | | | (40,387,407 | ) | | | (490,715,350 | ) | | | (638,397,059 | ) | |
Net increase (decrease) in net assets resulting from
capital share transactions | | | (37,308,116 | ) | | | (34,968,459 | ) | | | 768,473,946 | | | | 776,975,009 | | |
| Net increase (decrease) in net assets | | | (34,081,282 | ) | | | (7,546,946 | ) | | | 816,444,261 | | | | 764,881,861 | | |
| NET ASSETS: | |
| Beginning of year | | | 201,406,053 | | | | 208,952,999 | | | | 2,530,225,952 | | | | 1,765,344,091 | | |
| End of year | | $ | 167,324,771 | | | $ | 201,406,053 | | | $ | 3,346,670,213 | | | $ | 2,530,225,952 | | |
| Undistributed net investment income at end of year | | $ | 2,600,516 | | | $ | 3,112,822 | | | $ | 22,702,254 | | | $ | 914,743 | | |
See Accompanying Notes to Financial Statements
31
STATEMENTS OF CHANGES IN NET ASSETS
| | | ING VP Money Market Portfolio | | ING VP Global Science and
Technology Portfolio | |
| | | Year
Ended
December 31,
2007 | | Year
Ended
December 31,
2006 | | Year
Ended
December 31,
2007 | | Year
Ended
December 31,
2006 | |
| FROM OPERATIONS: | |
| Net investment income (loss) | | $ | 77,934,256 | | | $ | 57,136,163 | | | $ | (214,304 | ) | | $ | (248,859 | ) | |
Net realized gain on investments and foreign currency
related transactions | | | 43,078 | | | | 75,645 | | | | 9,815,376 | | | | 11,202,478 | | |
Net change in unrealized appreciation or depreciation
on investments and foreign currency
related transactions | | | — | | | | — | | | | 4,940,443 | | | | (5,191,876 | ) | |
| Increase in net assets resulting from operations | | | 77,977,334 | | | | 57,211,808 | | | | 14,541,515 | | | | 5,761,743 | | |
| FROM DISTRIBUTIONS TO SHAREHOLDERS: | |
| Net investment income: | | | (57,130,928 | ) | | | (31,895,864 | ) | | | — | | | | — | | |
| Total distributions | | | (57,130,928 | ) | | | (31,895,864 | ) | | | — | | | | — | | |
| FROM CAPITAL SHARE TRANSACTIONS: | |
| Net proceeds from sale of shares | | | 503,402,892 | | | | 428,969,203 | | | | 17,784,780 | | | | 13,780,858 | | |
| Dividends reinvested | | | 57,130,928 | | | | 31,895,864 | | | | — | | | | — | | |
| | | | 560,533,820 | | | | 460,865,067 | | | | 17,784,780 | | | | 13,780,858 | | |
| Cost of shares redeemed | | | (226,091,022 | ) | | | (203,348,846 | ) | | | (15,393,467 | ) | | | (21,993,235 | ) | |
Net increase (decrease) in net assets resulting from
capital share transactions | | | 334,442,798 | | | | 257,516,221 | | | | 2,391,313 | | | | (8,212,377 | ) | |
| Net increase (decrease) in net assets | | | 355,289,204 | | | | 282,832,165 | | | | 16,932,828 | | | | (2,450,634 | ) | |
| NET ASSETS: | |
| Beginning of year | | | 1,355,850,083 | | | | 1,073,017,918 | | | | 82,150,223 | | | | 84,600,857 | | |
| End of year | | $ | 1,711,139,287 | | | $ | 1,355,850,083 | | | $ | 99,083,051 | | | $ | 82,150,223 | | |
| Undistributed net investment income at end of year | | $ | 77,924,640 | | | $ | 57,121,312 | | | $ | 131,809 | | | $ | 21,353 | | |
See Accompanying Notes to Financial Statements
32
ING VP BALANCED PORTFOLIO
FINANCIAL HIGHLIGHTS
Selected data for a share of beneficial interest outstanding throughout each period.
| | | | | Class ADV | |
| | | | | Year
Ended
December 31,
2007 | | December 29,
2006(1) to
December 31,
2006 | |
| Per Share Operating Performance: | |
| Net asset value, beginning of period | | $ | | | 14.65 | | | | 14.65 | | |
| Income (loss) from investment operations: | |
| Net investment income (loss) | | $ | | | 0.29 | | | | (0.00 | )** | |
| Net realized and unrealized gain on investments | | $ | | | 0.37 | | | | — | | |
| Total from investment operations | | $ | | | 0.66 | | | | (0.00 | )** | |
| Less distributions from: | |
| Net investment income | | $ | | | 0.39 | | | | — | | |
| Net realized gains on investments | | $ | | | 0.58 | | | | — | | |
| Total distributions | | $ | | | 0.97 | | | | — | | |
| Net asset value, end of period | | $ | | | 14.34 | | | | 14.65 | | |
| Total Return(2) | | % | | | 4.78 | | | | — | | |
| Ratios and Supplemental Data: | |
| Net assets, end of period (millions) | | $ | | | 0 | *** | | | 0 | *** | |
| Ratios to average net assets: | |
| Expenses(3) | | % | | | 1.10 | † | | | 1.10 | † | |
| Net investment income (loss)(3) | | % | | | 2.05 | † | | | (1.10 | )† | |
| Portfolio turnover rate | | % | | | 257 | | | | 236 | | |
| | | | | Class I | |
| | | | | Year Ended December 31, | |
| | | | | 2007 | | 2006 | | 2005 | | 2004 | | 2003 | |
| Per Share Operating Performance: | |
| Net asset value, beginning of year | | $ | | | 14.65 | | | | 13.64 | | | | 13.40 | | | | 12.50 | | | | 10.73 | | |
| Income from investment operations: | |
| Net investment income | | $ | | | 0.39 | * | | | 0.34 | * | | | 0.29 | * | | | 0.29 | | | | 0.25 | | |
| Net realized and unrealized gain on investments | | $ | | | 0.38 | | | | 1.00 | | | | 0.27 | | | | 0.87 | | | | 1.76 | | |
| Total from investment operations | | $ | | | 0.77 | | | | 1.34 | | | | 0.56 | | | | 1.16 | | | | 2.01 | | |
| Less distributions from: | |
| Net investment income | | $ | | | 0.39 | | | | 0.33 | | | | 0.32 | | | | 0.26 | | | | 0.24 | | |
| Net realized gains on investments | | $ | | | 0.58 | | | | — | | | | — | | | | — | | | | — | | |
| Total distributions | | $ | | | 0.97 | | | | 0.33 | | | | 0.32 | | | | 0.26 | | | | 0.24 | | |
| Net asset value, end of year | | $ | | | 14.45 | | | | 14.65 | | | | 13.64 | | | | 13.40 | | | | 12.50 | | |
| Total Return(2) | | % | | | 5.57 | | | | 9.99 | | | | 4.24 | | | | 9.42 | | | | 18.87 | | |
| Ratios and Supplemental Data: | |
| Net assets, end of year (millions) | | $ | | | 1,046 | | | | 1,184 | | | | 1,236 | | | | 1,358 | | | | 1,375 | | |
| Ratios to average net assets: | |
| Expenses | | % | | | 0.60 | † | | | 0.60 | † | | | 0.60 | | | | 0.59 | | | | 0.60 | | |
| Net investment income | | % | | | 2.68 | † | | | 2.44 | † | | | 2.30 | | | | 2.15 | | | | 2.04 | | |
| Portfolio turnover rate | | % | | | 257 | | | | 236 | | | | 308 | | | | 272 | | | | 333 | | |
(1) Commencement of operations.
(2) Total return is calculated assuming reinvestment of all dividends and capital gain distributions at net asset value and does not reflect the effect of insurance contract charges. Total return for periods less than one year is not annualized.
(3) Annualized for periods less than one year.
* Calculated using average number of shares outstanding throughout the period.
** Amount is more than $(0.005).
*** Amount is less than $500,000.
† Impact of waiving the advisory fee for the ING Institutional Prime Money Market Fund holding has less than 0.005% impact on the expense ratio.
See Accompanying Notes to Financial Statements
33
ING VP BALANCED PORTFOLIO (CONTINUED)
FINANCIAL HIGHLIGHTS
Selected data for a share of beneficial interest outstanding throughout each year.
| | | | | Class S | |
| | | | |
Year Ended December 31, | | May 29,
2003(1) to
December 31, | |
| | | | | 2007 | | 2006 | | 2005 | | 2004 | | 2003 | |
| Per Share Operating Performance: | |
| Net asset value, beginning of year | | $ | | | 14.57 | | | | 13.58 | | | | 13.35 | | | | 12.49 | | | | 11.53 | | |
| Income from investment operations: | |
| Net investment income | | $ | | | 0.35 | * | | | 0.32 | * | | | 0.27 | | | | 0.22 | | | | 0.34 | | |
| Net realized and unrealized gain on investments | | $ | | | 0.38 | | | | 0.97 | | | | 0.25 | | | | 0.89 | | | | 0.85 | | |
| Total from investment operations | | $ | | | 0.73 | | | | 1.29 | | | | 0.52 | | | | 1.11 | | | | 1.19 | | |
| Less distributions from: | |
| Net investment income | | $ | | | 0.36 | | | | 0.30 | | | | 0.29 | | | | 0.25 | | | | 0.23 | | |
| Net realized gains on investments | | $ | | | 0.58 | | | | — | | | | — | | | | — | | | | — | | |
| Total distributions | | $ | | | 0.94 | | | | 0.30 | | | | 0.29 | | | | 0.25 | | | | 0.23 | | |
| Net asset value, end of year | | $ | | | 14.36 | | | | 14.57 | | | | 13.58 | | | | 13.35 | | | | 12.49 | | |
| Total Return(2) | | % | | | 5.31 | | | | 9.62 | | | | 3.99 | | | | 9.06 | | | | 10.51 | | |
| Ratios and Supplemental Data: | |
| Net assets, end of year (millions) | | $ | | | 10 | | | | 11 | | | | 3 | | | | 3 | | | | 1 | | |
| Ratios to average net assets: | |
| Expenses(3) | | % | | | 0.85 | † | | | 0.85 | † | | | 0.85 | | | | 0.84 | | | | 0.83 | | |
| Net investment income(3) | | % | | | 2.43 | † | | | 2.29 | † | | | 2.06 | | | | 1.98 | | | | 3.06 | | |
| Portfolio turnover rate | | % | | | 257 | | | | 236 | | | | 308 | | | | 272 | | | | 333 | | |
(1) Commencement of operations.
(2) Total return is calculated assuming reinvestment of all dividends and capital gain distributions at net asset value and does not reflect the effect of insurance contract charges. Total return for periods less than one year is not annualized.
(3) Annualized for periods less than one year.
* Calculated using average number of shares outstanding throughout the period.
† Impact of waiving the advisory fee for the ING Institutional Prime Money Market Fund holding has less than 0.005% impact on the expense ratio.
See Accompanying Notes to Financial Statements
34
ING VP GROWTH AND INCOME PORTFOLIO
FINANCIAL HIGHLIGHTS
Selected data for a share of beneficial interest outstanding throughout each period.
| | | | | Class ADV | |
| | | | | Year
Ended
December 31,
2007 | | December 20,
2006(1) to
December 31,
2006 | |
| Per Share Operating Performance: | |
| Net asset value, beginning of period | | $ | | | 23.38 | | | | 23.70 | | |
| Income (loss) from investment operations: | |
| Net investment income | | $ | | | 0.72 | * | | | 0.01 | * | |
| Net realized and unrealized gain (loss) on investments | | $ | | | 0.84 | | | | (0.06 | ) | |
| Total from investment operations | | $ | | | 1.56 | | | | (0.05 | ) | |
| Less distributions from: | |
| Net investment income | | $ | | | 0.33 | | | | 0.27 | | |
| Total distributions | | $ | | | 0.33 | | | | 0.27 | | |
| Net asset value, end of period | | $ | | | 24.61 | | | | 23.38 | | |
| Total Return(2) | | % | | | 6.66 | | | | (0.23 | ) | |
| Ratios and Supplemental Data: | |
| Net assets, end of period (millions) | | $ | | | 1 | | | | 0 | ** | |
| Ratios to average net assets: | |
| Expenses(3) | | % | | | 1.09 | † | | | 1.09 | † | |
| Net investment income(3) | | % | | | 2.95 | † | | | 1.08 | † | |
| Portfolio turnover rate | | % | | | 146 | | | | 103 | | |
| | | | | Class I | |
| | | | | Year Ended Necember 31, | |
| | | | | 2007 | | 2006 | | 2005 | | 2004 | | 2003 | |
| Per Share Operating Performance: | |
| Net asset value, beginning of year | | $ | | | 23.38 | | | | 20.71 | | | | 19.35 | | | | 18.28 | | | | 14.50 | | |
| Income from investment operations: | |
| Net investment income | | $ | | | 0.33 | * | | | 0.25 | * | | | 0.23 | | | | 0.28 | | | | 0.16 | | |
| Net realized and unrealized gain on investments | | $ | | | 1.40 | | | | 2.69 | | | | 1.35 | | | | 1.24 | | | | 3.62 | | |
| Total from investment operations | | $ | | | 1.73 | | | | 2.94 | | | | 1.58 | | | | 1.52 | | | | 3.78 | | |
| Less distributions from: | |
| Net investment income | | $ | | | 0.35 | | | | 0.27 | | | | 0.22 | | | | 0.45 | | | | — | | |
| Total distributions | | $ | | | 0.35 | | | | 0.27 | | | | 0.22 | | | | 0.45 | | | | — | | |
| Net asset value, end of year | | $ | | | 24.76 | | | | 23.38 | | | | 20.71 | | | | 19.35 | | | | 18.28 | | |
| Total Return(2) | | % | | | 7.40 | | | | 14.20 | | | | 8.13 | | | | 8.39 | | | | 26.07 | | |
| Ratios and Supplemental Data: | |
| Net assets, end of year (millions) | | $ | | | 2,796 | | | | 3,098 | | | | 3,146 | | | | 3,531 | | | | 3,795 | | |
| Ratios to average net assets: | |
| Expenses | | % | | | 0.59 | † | | | 0.59 | † | | | 0.59 | | | | 0.58 | | | | 0.60 | | |
| Net investment income | | % | | | 1.32 | † | | | 1.15 | † | | | 1.03 | | | | 1.41 | | | | 0.95 | | |
| Portfolio turnover rate | | % | | | 146 | | | | 103 | | | | 80 | | | | 139 | | | | 150 | | |
(1) Commencement of operations.
(2) Total return is calculated assuming reinvestment of all dividends and capital gain distributions at net asset value and does not reflect the effect of insurance contract charges. Total return for periods less than one year is not annualized.
(3) Annualized for periods less than one year.
* Calculated using average number of shares outstanding throughout the period.
** Amount is less than $500,000.
† Impact of waiving the advisory fee for the ING Institutional Prime Money Market Fund holding has less than 0.005% impact on the expense ratio.
See Accompanying Notes to Financial Statements
35
ING VP GROWTH AND INCOME PORTFOLIO (CONTINUED)
FINANCIAL HIGHLIGHTS
Selected data for a share of beneficial interest outstanding throughout each period.
| | | | | Class S | |
| | | | | Year Ended December 31, | | June 11,
2003(1) to
December 31, | |
| | | | | 2007 | | 2006 | | 2005 | | 2004 | | 2003 | |
| Per Share Operating Performance: | |
| Net asset value, beginning of period | | $ | | | 23.30 | | | | 20.69 | | | | 19.34 | | | | 18.26 | | | | 16.32 | | |
| Income from investment operations: | |
| Net investment income | | $ | | | 0.37 | * | | | 0.20 | * | | | 0.14 | | | | 0.21 | | | | 0.04 | | |
| Net realized and unrealized gain on investments | | $ | | | 1.29 | | | | 2.64 | | | | 1.41 | | | | 1.26 | | | | 1.90 | | |
| Total from investment operations | | $ | | | 1.66 | | | | 2.84 | | | | 1.55 | | | | 1.47 | | | | 1.94 | | |
| Less distributions from: | |
| Net investment income | | $ | | | 0.33 | | | | 0.23 | | | | 0.20 | | | | 0.39 | | | | — | | |
| Total distributions | | $ | | | 0.33 | | | | 0.23 | | | | 0.20 | | | | 0.39 | | | | — | | |
| Net asset value, end of period | | $ | | | 24.63 | | | | 23.30 | | | | 20.69 | | | | 19.34 | | | | 18.26 | | |
| Total Return(2) | | % | | | 7.13 | | | | 13.72 | | | | 7.98 | | | | 8.10 | | | | 11.89 | | |
| Ratios and Supplemental Data: | |
| Net assets, end of period (millions) | | $ | | | 25 | | | | 5 | | | | 2 | | | | 2 | | | | 2 | | |
| Ratios to average net assets: | |
| Expenses(3) | | % | | | 0.84 | † | | | 0.84 | † | | | 0.84 | | | | 0.83 | | | | 0.84 | | |
| Net investment income(3) | | % | | | 1.50 | † | | | 0.94 | † | | | 0.78 | | | | 1.18 | | | | 0.57 | | |
| Portfolio turnover rate | | % | | | 146 | | | | 103 | | | | 80 | | | | 139 | | | | 150 | | |
(1) Commencement of operations.
(2) Total return is calculated assuming reinvestment of all dividends and capital gain distributions at net asset value and does not reflect the effect of insurance contract charges. Total return for periods less than one year is not annualized.
(3) Annualized for periods less than one year.
* Calculated using average number of shares outstanding throughout the period.
† Impact of waiving the advisory fee for the ING Institutional Prime Money Market Fund holding has less than 0.005% impact on the expense ratio.
See Accompanying Notes to Financial Statements
36
ING VP GROWTH PORTFOLIO
FINANCIAL HIGHLIGHTS
Selected data for a share of beneficial interest outstanding throughout each period.
| | | | | Class ADV | |
| | | | | Year
Ended
December 31,
2007 | | December 29,
2006(1) to
December 31,
2006 | |
| Per Share Operating Performance: | |
| Net asset value, beginning of period | | $ | | | 10.65 | | | | 10.65 | | |
| Income (loss) from investment operations: | |
| Net investment loss | | $ | | | (0.02 | )* | | | (0.00 | )** | |
| Net realized and unrealized gain on investments | | $ | | | 1.85 | | | | — | | |
| Total from investment operations | | $ | | | 1.83 | | | | (0.00 | )** | |
| Less distributions from: | |
| Net investment income | | $ | | | 0.02 | | | | — | | |
| Total distributions | | $ | | | 0.02 | | | | — | | |
| Net asset value, end of period | | $ | | | 12.46 | | | | 10.65 | | |
| Total Return(2) | | % | | | 17.21 | | | | — | | |
| Ratios and Supplemental Data: | |
| Net assets, end of period (000's) | | $ | | | 1,386 | | | | 1 | | |
| Ratios to average net assets: | |
| Gross expenses prior to expense waiver and brokerage commission recapture(3) | | % | | | 1.20 | | | | 1.19 | | |
| Net expenses after expense waiver and prior to brokerage commission recapture(3) | | % | | | 1.20 | † | | | 1.19 | | |
| Net expenses after expense waiver and brokerage commission recapture(3) | | % | | | 1.20 | † | | | 1.19 | | |
| Net investment loss after expense waiver and brokerage commission recapture(3) | | % | | | (0.18 | )† | | | (1.19 | ) | |
| Portfolio turnover rate | | % | | | 279 | | | | 188 | | |
| | | | | Class I | |
| | | | | Year Ended December 31, | |
| | | | | 2007 | | 2006 | | 2005 | | 2004 | | 2003 | |
| Per Share Operating Performance: | |
| Net asset value, beginning of year | | $ | | | 10.65 | | | | 10.38 | | | | 9.56 | | | | 8.93 | | | | 6.85 | | |
| Income from investment operations: | |
| Net investment income | | $ | | | 0.05 | * | | | 0.02 | | | | 0.02 | | | | 0.06 | | | | 0.01 | | |
| Net realized and unrealized gain on investments | | $ | | | 1.85 | | | | 0.26 | | | | 0.87 | | | | 0.58 | | | | 2.07 | | |
| Total from investment operations | | $ | | | 1.90 | | | | 0.28 | | | | 0.89 | | | | 0.64 | | | | 2.08 | | |
| Less distributions from: | |
| Net investment income | | $ | | | 0.02 | | | | 0.01 | | | | 0.07 | | | | 0.01 | | | | — | | |
| Total distributions | | $ | | | 0.02 | | | | 0.01 | | | | 0.07 | | | | 0.01 | | | | — | | |
| Net asset value, end of year | | $ | | | 12.53 | | | | 10.65 | | | | 10.38 | | | | 9.56 | | | | 8.93 | | |
| Total Return(2) | | % | | | 17.86 | | | | 2.65 | | | | 9.38 | †† | | | 7.19 | | | | 30.36 | | |
| Ratios and Supplemental Data: | |
| Net assets, end of year (000's) | | $ | | | 137,104 | | | | 186,495 | | | | 175,297 | | | | 193,280 | | | | 224,330 | | |
| Ratios to average net assets: | |
Gross expenses prior to expense waiver and
brokerage commission recapture | | % | | | 0.70 | | | | 0.69 | | | | 0.69 | | | | 0.69 | | | | 0.71 | | |
Net expenses after expense waiver and prior
to brokerage commission recapture | | % | | | 0.70 | † | | | 0.69 | | | | 0.69 | | | | 0.69 | | | | 0.71 | | |
Net expenses after expense waiver and
brokerage commission recapture | | % | | | 0.70 | † | | | 0.69 | | | | 0.69 | | | | 0.69 | | | | 0.71 | | |
Net investment income after expense waiver
and brokerage commission recapture | | % | | | 0.42 | † | | | 0.19 | | | | 0.08 | | | | 0.61 | | | | 0.13 | | |
| Portfolio turnover rate | | % | | | 279 | | | | 188 | | | | 119 | | | | 123 | | | | 162 | | |
(1) Commencement of operations.
(2) Total return is calculated assuming reinvestment of all dividends and capital gain distributions at net asset value and does not reflect the effect of insurance contract charges. Total return for periods less than one year is not annualized.
(3) Annualized for periods less than one year.
* Calculated using average number of shares outstanding throughout the period.
** Amount is less than $0.005 or more than $(0.005).
† Impact of waiving the advisory fee for the ING Institutional Prime Money Market Fund holding has more than 0.005% impact on the expense ratio.
†† In 2005, the Investment Adviser fully reimbursed the Portfolio for a loss incurred from a transaction not meeting the Portfolio's investment's guidelines. There was no impact on total return.
See Accompanying Notes to Financial Statements
37
ING VP GROWTH PORTFOLIO (CONTINUED)
FINANCIAL HIGHLIGHTS
Selected data for a share of beneficial interest outstanding throughout each year.
| | | | | Class S | |
| | | | | Year Ended December 31, | |
| | | | | 2007 | | 2006 | | 2005 | | 2004 | | 2003 | |
| Per Share Operating Performance: | |
| Net asset value, beginning of year | | $ | | | 10.56 | | | | 10.31 | | �� | | 9.50 | | | | 8.88 | | | | 6.83 | | |
| Income (loss) from investment operations: | |
| Net investment income (loss) | | $ | | | 0.00 | * | | | (0.01 | ) | | | (0.00 | )* | | | 0.04 | | | | 0.00 | * | |
| Net realized and unrealized gain on investments | | $ | | | 1.85 | | | | 0.26 | | | | 0.85 | | | | 0.58 | | | | 2.05 | | |
| Total from investment operations | | $ | | | 1.85 | | | | 0.25 | | | | 0.85 | | | | 0.62 | | | | 2.05 | | |
| Less distributions from: | |
| Net investment income | | $ | | | 0.02 | | | | — | | | | 0.04 | | | | — | | | | — | | |
| Total distributions | | $ | | | 0.02 | | | | — | | | | 0.04 | | | | — | | | | — | | |
| Net asset value, end of year | | $ | | | 12.39 | | | | 10.56 | | | | 10.31 | | | | 9.50 | | | | 8.88 | | |
| Total Return(1) | | % | | | 17.54 | | | | 2.42 | | | | 9.05 | †† | | | 6.98 | | | | 30.01 | | |
| Ratios and Supplemental Data: | |
| Net assets, end of year (000's) | | $ | | | 21,105 | | | | 273 | | | | 285 | | | | 356 | | | | 292 | | |
| Ratios to average net assets: | |
Gross expenses prior to expense waiver and
brokerage commission recapture | | % | | | 0.95 | | | | 0.94 | | | | 0.94 | | | | 0.94 | | | | 0.96 | | |
Net expenses after expense waiver and prior to
brokerage commission recapture | | % | | | 0.95 | † | | | 0.94 | | | | 0.94 | | | | 0.94 | | | | 0.96 | | |
Net expenses after expense waiver and
brokerage commission recapture | | % | | | 0.95 | † | | | 0.94 | | | | 0.94 | | | | 0.94 | | | | 0.96 | | |
Net investment income (loss) after expense
waiver and brokerage commission recapture | | % | | | 0.23 | † | | | (0.06 | ) | | | (0.17 | ) | | | 0.44 | | | | (0.10 | ) | |
| Portfolio turnover rate | | % | | | 279 | | | | 188 | | | | 119 | | | | 123 | | | | 162 | | |
(1) Total return is calculated assuming reinvestment of all dividends and capital gain distributions at net asset value and does not reflect the effect of insurance contract charges.
* Amount is less than $0.005 or more than $(0.005).
† Impact of waiving the advisory fee for the ING Institutional Prime Money Market Fund holding has more than 0.005% impact on the expense ratio.
†† In 2005, the Investment Adviser fully reimbursed the Portfolio for a loss incurred from a transaction not meeting the Portfolio's investment's guidelines. There was no impact on total return.
See Accompanying Notes to Financial Statements
38
ING VP SMALL COMPANY PORTFOLIO
FINANCIAL HIGHLIGHTS
Selected data for a share of beneficial interest outstanding throughout each year.
| | | | | Class I | |
| | | | | Year Ended December 31, | |
| | | | | 2007 | | 2006 | | 2005 | | 2004 | | 2003 | |
| Per Share Operating Performance: | |
| Net asset value, beginning of year | | $ | | | 21.70 | | | | 21.65 | | | | 19.94 | | | | 17.48 | | | | 12.75 | | |
| Income from investment operations: | |
| Net investment income | | $ | | | 0.24 | * | | | 0.05 | | | | 0.10 | | | | 0.04 | | | | 0.06 | | |
| Net realized and unrealized gain on investments | | $ | | | 0.99 | | | | 3.46 | | | | 1.92 | | | | 2.47 | | | | 4.71 | | |
| Total from investment operations | | $ | | | 1.23 | | | | 3.51 | | | | 2.02 | | | | 2.51 | | | | 4.77 | | |
| Less distributions from: | |
| Net investment income | | $ | | | 0.04 | | | | 0.09 | | | | 0.03 | | | | 0.05 | | | | 0.04 | | |
| Net realized gains on investments | | $ | | | 3.33 | | | | 3.37 | | | | 0.28 | | | | — | | | | — | | |
| Total distributions | | $ | | | 3.37 | | | | 3.46 | | | | 0.31 | | | | 0.05 | | | | 0.04 | | |
| Net asset value, end of year | | $ | | | 19.56 | | | | 21.70 | | | | 21.65 | | | | 19.94 | | | | 17.48 | | |
| Total Return(1) | | % | | | 5.90 | | | | 16.79 | | | | 10.27 | †† | | | 14.39 | | | | 37.47 | | |
| Ratios and Supplemental Data: | |
| Net assets, end of year (000's) | | $ | | | 603,492 | | | | 512,446 | | | | 393,700 | | | | 461,014 | | | | 464,228 | | |
| Ratios to average net assets: | |
| Expenses | | % | | | 0.84 | † | | | 0.85 | † | | | 0.85 | | | | 0.84 | | | | 0.85 | | |
| Net investment income | | % | | | 1.16 | † | | | 0.26 | † | | | 0.43 | | | | 0.21 | | | | 0.47 | | |
| Portfolio turnover rate | | % | | | 106 | | | | 83 | | | | 72 | | | | 93 | | | | 178 | | |
| | | | | Class S | |
| | | | | Year Ended December 31, | |
| | | | | 2007 | | 2006 | | 2005 | | 2004 | | 2003 | |
| Per Share Operating Performance: | |
| Net asset value, beginning of year | | $ | | | 21.54 | | | | 21.59 | | | | 19.90 | | | | 17.49 | | | | 12.72 | | |
| Income (loss) from investment operations: | |
| Net investment income (loss) | | $ | | | 0.18 | * | | | (0.05 | )* | | | 0.06 | | | | 0.03 | * | | | 0.01 | | |
| Net realized and unrealized gain on investments | | $ | | | 1.00 | | | | 3.41 | | | | 1.92 | | | | 2.43 | | | | 4.79 | | |
| Total from investment operations | | $ | | | 1.18 | | | | 3.36 | | | | 1.98 | | | | 2.46 | | | | 4.80 | | |
| Less distribution from: | |
| Net investment income | | $ | | | — | | | | 0.04 | | | | 0.01 | | | | 0.05 | | | | 0.03 | | |
| Net realized gains on investments | | $ | | | 3.33 | | | | 3.37 | | | | 0.28 | | | | — | | | | — | | |
| Total distribution | | $ | | | 3.33 | | | | 3.41 | | | | 0.29 | | | | 0.05 | | | | 0.03 | | |
| Net asset value, end of year | | $ | | | 19.39 | | | | 21.54 | | | | 21.59 | | | | 19.90 | | | | 17.49 | | |
| Total Return(1) | | % | | | 5.68 | | | | 16.07 | | | | 10.05 | †† | | | 14.09 | | | | 37.76 | | |
| Ratios and Supplemental Data: | |
| Net assets, end of year (000's) | | $ | | | 2,890 | | | | 2,162 | | | | 68,768 | | | | 72,225 | | | | 840 | | |
| Ratios to average net assets: | |
| Expenses | | % | | | 1.09 | † | | | 1.10 | † | | | 1.10 | | | | 1.09 | | | | 1.10 | | |
| Net investment income (loss) | | % | | | 0.90 | † | | | (0.24 | )† | | | 0.26 | | | | 0.19 | | | | 0.22 | | |
| Portfolio turnover rate | | % | | | 106 | | | | 83 | | | | 72 | | | | 93 | | | | 178 | | |
(1) Total return is calculated assuming reinvestment of all dividends and capital gain distributions at net asset value and does not reflect the effect of insurance contract charges.
* Calculated using average number of shares outstanding throughout the period.
† Impact of waiving the advisory fee for the ING Institutional Prime Money Market Fund holding has less than 0.005% impact on the expense ratio.
†† In 2005, the Investment Adviser fully reimbursed the Portfolio for a loss incurred from a transaction not meeting the Portfolio's investment guidelines. There was no impact on total return.
See Accompanying Notes to Financial Statements
39
ING VP VALUE OPPORTUNITY PORTFOLIO
FINANCIAL HIGHLIGHTS
Selected data for a share of beneficial interest outstanding throughout each period.
| | | | | Class ADV | |
| | | | | Year
Ended
December 31,
2007 | | December 29,
2006(1) to
December 31,
2006 | |
| Per Share Operating Performance: | |
| Net asset value, beginning of period | | $ | | | 15.72 | | | | 15.72 | | |
| Income (loss) from investment operations: | |
| Net investment income (loss) | | $ | | | 0.16 | | | | (0.00 | )** | |
| Net realized and unrealized gain on investments | | $ | | | 0.20 | | | | — | | |
| Total from investment operations | | $ | | | 0.36 | | | | (0.00 | )** | |
| Less distributions from: | |
| Net investment income | | $ | | | 0.26 | | | | — | | |
| Total distributions | | $ | | | 0.26 | | | | — | | |
| Net asset value, end of period | | $ | | | 15.82 | | | | 15.72 | | |
| Total Return(2) | | % | | | 2.33 | | | | — | | |
| Ratios and Supplemental Data: | |
| Net assets, end of period (000's) | | $ | | | 1 | | | | 1 | | |
| Ratios to average net assets: | |
| Expenses(3) | | % | | | 1.19 | † | | | 1.19 | | |
| Net investment income (loss)(3) | | % | | | 0.99 | † | | | (1.19 | ) | |
| Portfolio turnover rate | | % | | | 197 | | | | 83 | | |
| | | | | Class I | |
| | | | | Year Ended December 31, | |
| | | | | 2007 | | 2006 | | 2005 | | 2004 | | 2003 | |
| Per Share Operating Performance: | |
| Net asset value, beginning of year | | $ | | | 15.84 | | | | 13.84 | | | | 13.19 | | | | 12.08 | | | | 9.77 | | |
| Income from investment operations: | |
| Net investment income | | $ | | | 0.23 | * | | | 0.23 | * | | | 0.19 | * | | | 0.24 | | | | 0.10 | | |
| Net realized and unrealized gain on investments | | $ | | | 0.24 | | | | 1.98 | | | | 0.71 | | | | 0.98 | | | | 2.29 | | |
| Total from investment operations | | $ | | | 0.47 | | | | 2.21 | | | | 0.90 | | | | 1.22 | | | | 2.39 | | |
| Less distributions from: | |
| Net investment income | | $ | | | 0.26 | | | | 0.21 | | | | 0.25 | | | | 0.11 | | | | 0.08 | | |
| Total distributions | | $ | | | 0.26 | | | | 0.21 | | | | 0.25 | | | | 0.11 | | | | 0.08 | | |
| Net asset value, end of year | | $ | | | 16.05 | | | | 15.84 | | | | 13.84 | | | | 13.19 | | | | 12.08 | | |
| Total Return(2) | | % | | | 3.01 | | | | 16.10 | | | | 6.95 | | | | 10.15 | | | | 24.59 | | |
| Ratios and Supplemental Data: | |
| Net assets, end of year (000's) | | $ | | | 143,438 | | | | 173,014 | | | | 178,828 | | | | 219,889 | | | | 257,448 | | |
| Ratios to average net assets: | |
| Expenses | | % | | | 0.69 | † | | | 0.69 | | | | 0.70 | | | | 0.69 | | | | 0.70 | | |
| Net investment income | | % | | | 1.44 | † | | | 1.58 | | | | 1.47 | | | | 1.61 | | | | 0.91 | | |
| Portfolio turnover rate | | % | | | 197 | | | | 83 | | | | 94 | | | | 16 | | | | 251 | | |
(1) Commencement of operations.
(2) Total return is calculated assuming reinvestment of all dividends and capital gain distributions at net asset value and does not reflect the effect of insurance contract charges. Total return for periods less than one year is not annualized.
(3) Annualized for periods less than one year.
* Calculated using average number of shares outstanding throughout the period.
** Amount is more than $(0.005).
† Impact of waiving advisory fee for the ING Institutional Prime Money Market Fund holding has less than 0.005% impact on the expense ratio.
See Accompanying Notes to Financial Statements
40
ING VP VALUE OPPORTUNITY PORTFOLIO (CONTINUED)
FINANCIAL HIGHLIGHTS
Selected data for a share of beneficial interest outstanding throughout each year.
| | | | | Class S | |
| | | | | Year Ended December 31, | |
| | | | | 2007 | | 2006 | | 2005 | | 2004 | | 2003 | |
| Per Share Operating Performance: | |
| Net asset value, beginning of year | | $ | | | 15.72 | | | | 13.77 | | | | 13.12 | | | | 12.03 | | | | 9.75 | | |
| Income from investment operations: | |
| Net investment income | | $ | | | 0.19 | * | | | 0.19 | * | | | 0.16 | * | | | 0.13 | | | | 0.04 | | |
| Net realized and unrealized gain on investments | | $ | | | 0.24 | | | | 1.96 | | | | 0.71 | | | | 1.05 | | | | 2.31 | | |
| Total from investment operations | | $ | | | 0.43 | | | | 2.15 | | | | 0.87 | | | | 1.18 | | | | 2.35 | | |
| Less distributions from: | |
| Net investment income | | $ | | | 0.22 | | | | 0.20 | | | | 0.22 | | | | 0.09 | | | | 0.07 | | |
| Total distributions | | $ | | | 0.22 | | | | 0.20 | | | | 0.22 | | | | 0.09 | | | | 0.07 | | |
| Net asset value, end of year | | $ | | | 15.93 | | | | 15.72 | | | | 13.77 | | | | 13.12 | | | | 12.03 | | |
| Total Return(1) | | % | | | 2.77 | | | | 15.77 | | | | 6.76 | | | | 9.88 | | | | 24.21 | | |
| Ratios and Supplemental Data: | |
| Net assets, end of year (000's) | | $ | | | 23,886 | | | | 28,391 | | | | 30,125 | | | | 3,505 | | | | 2,277 | | |
| Ratios to average net assets: | |
| Expenses | | % | | | 0.94 | † | | | 0.94 | | | | 0.95 | | | | 0.94 | | | | 0.95 | | |
| Net investment income | | % | | | 1.19 | † | | | 1.32 | | | | 1.18 | | | | 1.36 | | | | 0.64 | | |
| Portfolio turnover rate | | % | | | 197 | | | | 83 | | | | 94 | | | | 16 | | | | 251 | | |
(1) Total return is calculated assuming reinvestment of all dividends and capital gain distributions at net asset value and does not reflect the effect of insurance contract charges.
* Calculated using average number of shares outstanding throughout the period.
† Impact of waiving the advisory fee for the ING Institutional Prime Money Market Fund holding has less than 0.005% impact on the expense ratio.
See Accompanying Notes to Financial Statements
41
ING VP INTERMEDIATE BOND PORTFOLIO
FINANCIAL HIGHLIGHTS
Selected data for a share of beneficial interest outstanding throughout each period.
| | | | | Class ADV | |
| | | | | Year
Ended
December 31,
2007 | | December 20,
2006(1) to
December 31,
2006 | |
| Per Share Operating Performance: | |
| Net asset value, beginning of period | | $ | | | 12.96 | | | | 13.53 | | |
| Income (loss) from investment operations: | |
| Net investment income | | $ | | | 0.63 | * | | | 0.02 | | |
| Net realized and unrealized gain (loss) on investments | | $ | | | 0.09 | | | | (0.06 | ) | |
| Total from investment operations | | $ | | | 0.72 | | | | (0.04 | ) | |
| Less distributions from: | |
| Net investment income | | $ | | | 0.45 | | | | 0.53 | | |
| Total distributions | | $ | | | 0.45 | | | | 0.53 | | |
| Net asset value, end of period | | $ | | | 13.23 | | | | 12.96 | | |
| Total Return(2) | | % | | | 5.60 | †† | | | (0.30 | ) | |
| Ratios and Supplemental Data: | |
| Net assets, end of period (millions) | | $ | | | 0 | ** | | | 0 | ** | |
| Ratios to average net assets: | |
| Expenses(3) | | % | | | 0.99 | † | | | 0.99 | † | |
| Net investment income(3) | | % | | | 4.77 | † | | | 6.82 | † | |
| Portfolio turnover rate | | % | | | 438 | | | | 390 | | |
| | | | | Class I | |
| | | | | Year Ended December 31, | |
| | | | | 2007 | | 2006 | | 2005 | | 2004 | | 2003 | |
| Per Share Operating Performance: | |
| Net asset value, beginning of year | | $ | | | 12.96 | | | | 12.97 | | | | 13.14 | | | | 14.15 | | | | 13.53 | | |
| Income (loss) from investment operations: | |
| Net investment income | | $ | | | 0.69 | * | | | 0.65 | * | | | 0.54 | | | | 0.53 | | | | 0.56 | | |
| Net realized and unrealized gain (loss) on investments | | $ | | | 0.08 | | | | (0.12 | ) | | | (0.13 | ) | | | 0.13 | | | | 0.29 | | |
| Total from investment operations | | $ | | | 0.77 | | | | 0.53 | | | | 0.41 | | | | 0.66 | | | | 0.85 | | |
| Less distributions from: | |
| Net investment income | | $ | | | 0.51 | | | | 0.54 | | | | 0.51 | | | | 1.11 | | | | 0.11 | | |
| Net realized gains on investments | | $ | | | — | | | | — | | | | 0.07 | | | | 0.56 | | | | 0.12 | | |
| Total distributions | | $ | | | 0.51 | | | | 0.54 | | | | 0.58 | | | | 1.67 | | | | 0.23 | | |
| Net asset value, end of year | | $ | | | 13.22 | | | | 12.96 | | | | 12.97 | | | | 13.14 | | | | 14.15 | | |
| Total Return(2) | | % | | | 5.95 | †† | | | 4.06 | | | | 3.14 | | | | 4.88 | | | | 6.30 | | |
| Ratios and Supplemental Data: | |
| Net assets, end of year (millions) | | $ | | | 2,267 | | | | 1,909 | | | | 1,148 | | | | 1,093 | | | | 1,126 | | |
| Ratios to average net assets: | |
| Expenses | | % | | | 0.49 | † | | | 0.49 | † | | | 0.49 | | | | 0.48 | | | | 0.50 | | |
| Net investment income | | % | | | 5.19 | † | | | 4.97 | † | | | 4.14 | | | | 3.79 | | | | 3.77 | | |
| Portfolio turnover rate | | % | | | 438 | | | | 390 | | | | 589 | | | | 407 | | | | 521 | | |
(1) Commencement of operations.
(2) Total return is calculated assuming reinvestment of all dividends and capital gain distributions at net asset value and does not reflect the effect of insurance contract charges. Total return for periods less than one year is not annualized.
(3) Annualized for periods less than one year.
* Calculated using average number of shares outstanding throughout the period.
** Amount is less than $500,000.
† Impact of waiving the advisory fee for the ING Institutional Prime Money Market Fund holding has less than 0.005% impact on the expense ratio.
†† There was no impact on total return by the affiliate payment in Note 18.
See Accompanying Notes to Financial Statements
42
ING VP INTERMEDIATE BOND PORTFOLIO (CONTINUED)
FINANCIAL HIGHLIGHTS
Selected data for a share of beneficial interest outstanding throughout each year.
| | | | | Class S | |
| | | | | Year Ended December 31, | |
| | | | | 2007 | | 2006 | | 2005 | | 2004 | | 2003 | |
| Per Share Operating Performance: | |
| Net asset value, beginning of year | | $ | | | 12.89 | | | | 12.91 | | | | 13.09 | | | | 14.13 | | | | 13.53 | | |
| Income (loss) from investment operations: | |
| Net investment income | | $ | | | 0.65 | * | | | 0.61 | * | | | 0.41 | | | | 0.40 | | | | 0.49 | | |
| Net realized and unrealized gain (loss) on investments | | $ | | | 0.08 | | | | (0.12 | ) | | | (0.03 | ) | | | 0.22 | | | | 0.32 | | |
| Total from investment operations | | $ | | | 0.73 | | | | 0.49 | | | | 0.38 | | | | 0.62 | | | | 0.81 | | |
| Less distributions from: | |
| Net investment income | | $ | | | 0.48 | | | | 0.51 | | | | 0.49 | | | | 1.10 | | | | 0.09 | | |
| Net realized gains on investments | | $ | | | — | | | | — | | | | 0.07 | | | | 0.56 | | | | 0.12 | | |
| Total distributions | | $ | | | 0.48 | | | | 0.51 | | | | 0.56 | | | | 1.66 | | | | 0.21 | | |
| Net asset value, end of year | | $ | | | 13.14 | | | | 12.89 | | | | 12.91 | | | | 13.09 | | | | 14.13 | | |
| Total Return(1) | | % | | | 5.70 | †† | | | 3.77 | | | | 2.94 | | | | 4.58 | | | | 6.04 | | |
| Ratios and Supplemental Data: | |
| Net assets, end of year (millions) | | $ | | | 1,080 | | | | 621 | | | | 617 | | | | 301 | | | | 71 | | |
| Ratios to average net assets: | |
| Expenses | | % | | | 0.74 | † | | | 0.74 | † | | | 0.74 | | | | 0.73 | | | | 0.75 | | |
| Net investment income | | % | | | 4.92 | † | | | 4.69 | † | | | 3.94 | | | | 3.52 | | | | 3.52 | | |
| Portfolio turnover rate | | % | | | 438 | | | | 390 | | | | 589 | | | | 407 | | | | 521 | | |
(1) Total return is calculated assuming reinvestment of all dividends and capital gain distributions at net asset value and does not reflect the effect of insurance contract charges.
* Calculated using average number of shares outstanding throughout the period.
† Impact of waiving the advisory fee for the ING Institutional Prime Money Market Fund holding has less than 0.005% impact on the expense ratio.
†† There was no impact on total return by the affiliate payment in Note 18.
See Accompanying Notes to Financial Statements
43
ING VP MONEY MARKET PORTFOLIO
FINANCIAL HIGHLIGHTS
Selected data for a share of beneficial interest outstanding throughout each year.
| | | | | Class I | |
| | | | | Year Ended December 31, | |
| | | | | 2007 | | 2006 | | 2005 | | 2004 | | 2003 | |
| Per Share Operating Performance: | |
| Net asset value, beginning of year | | $ | | | 13.40 | | | | 13.17 | | | | 12.94 | | | | 12.94 | | | | 13.03 | | |
| Income (loss) from investment operations: | |
| Net investment income | | $ | | | 0.66 | * | | | 0.63 | * | | | 0.39 | | | | 0.15 | | | | 0.08 | | |
| Net realized and unrealized gain (loss) on investments | | $ | | | (0.00 | )** | | | 0.00 | ** | | | (0.01 | ) | | | (0.01 | ) | | | 0.03 | | |
| Total from investment operations | | $ | | | 0.66 | | | | 0.63 | | | | 0.38 | | | | 0.14 | | | | 0.11 | | |
| Less distributions from: | |
| Net investment income | | $ | | | 0.55 | | | | 0.40 | | | | 0.15 | | | | 0.14 | | | | 0.20 | | |
| Total distributions | | $ | | | 0.55 | | | | 0.40 | | | | 0.15 | | | | 0.14 | | | | 0.20 | | |
| Net asset value, end of year | | $ | | | 13.51 | | | | 13.40 | | | | 13.17 | | | | 12.94 | | | | 12.94 | | |
| Total Return(1) | | % | | | 5.13 | | | | 4.88 | | | | 2.98 | | | | 1.06 | | | | 0.92 | | |
| Ratios and Supplemental Data: | |
| Net assets, end of year (millions) | | $ | | | 1,711 | | | | 1,356 | | | | 1,073 | | | | 1,101 | | | | 1,238 | | |
| Ratios to average net assets: | |
| Expenses | | % | | | 0.33 | | | | 0.34 | | | | 0.35 | | | | 0.34 | | | | 0.35 | | |
| Net investment income | | % | | | 5.03 | | | | 4.79 | | | | 2.93 | | | | 1.11 | | | | 0.91 | | |
(1) Total return is calculated assuming reinvestment of all dividends and capital gain distributions at net asset value and does not reflect the effect of insurance contract charges.
* Calculated using average number of shares outstanding throughout the period.
** Amount is less than $0.005 or more than $(0.005).
See Accompanying Notes to Financial Statements
44
ING VP GLOBAL SCIENCE AND TECHNOLOGY PORTFOLIO
FINANCIAL HIGHLIGHTS
Selected data for a share of beneficial interest outstanding throughout each period.
| | | | | Class I | |
| | | | | Year Ended December 31, | |
| | | | | 2007 | | 2006 | | 2005 | | 2004 | | 2003 | |
| Per Share Operating Performance: | |
| Net asset value, beginning of year | | $ | | | 4.58 | | | | 4.27 | | | | 3.82 | | | | 3.87 | | | | 2.66 | | |
| Income (loss) from investment operations: | |
| Net investment loss | | $ | | | (0.01 | ) | | | (0.01 | ) | | | (0.02 | ) | | | (0.03 | ) | | | (0.02 | ) | |
Net realized and unrealized gain (loss)
on investments (net of Indian tax) | | $ | | | 0.88 | | | | 0.32 | | | | 0.47 | | | | (0.02 | ) | | | 1.23 | | |
| Total from investment operations | | $ | | | 0.87 | | | | 0.31 | | | | 0.45 | | | | (0.05 | ) | | | 1.21 | | |
| Net asset value, end of year | | $ | | | 5.45 | | | | 4.58 | | | | 4.27 | | | | 3.82 | | | | 3.87 | | |
| Total Return(1) | | % | | | 19.00 | | | | 7.26 | | | | 11.78 | | | | (1.29 | ) | | | 45.49 | | |
| Ratios and Supplemental Data: | |
| Net assets, end of year (000's) | | $ | | | 97,943 | | | | 81,599 | | | | 84,523 | | | | 86,291 | | | | 97,742 | | |
| Ratios to average net assets: | |
Gross expenses prior to expense
reimbursement/recoupment | | % | | | 1.08 | | | | 1.08 | | | | 1.06 | | | | 1.05 | | | | 1.10 | | |
Net expenses after expense
reimbursement/recoupment(2) | | % | | | 1.08 | | | | 1.08 | | | | 1.06 | | | | 1.05 | | | | 1.11 | | |
Net investment loss after expense
reimbursement/recoupment(2) | | % | | | (0.24 | ) | | | (0.29 | ) | | | (0.48 | ) | | | (0.67 | ) | | | (0.88 | ) | |
| Portfolio turnover rate | | % | | | 84 | | | | 129 | | | | 118 | | | | 163 | | | | 15 | | |
| | | | | Class S | |
| | | | | Year
Ended
December 31, | | July 20,
2005(4) to
December 31, | | January 1,
2003 to
December 16, | |
Year Ended
December 31, | | November 1,
2001(5) to
December 31, | |
| | | | | 2007 | | 2006 | | 2005 | | 2003(4) | | 2002 | | 2001 | |
| Per Share Operating Performance: | |
| Net asset value, beginning of period | | $ | | | 4.56 | | | | 4.27 | | | | 3.90 | | | | 2.65 | | | | 4.53 | | | | 3.92 | | |
| Income (loss) from investment operations: | |
| Net investment loss | | $ | | | (0.02 | ) | | | (0.02 | ) | | | (0.01 | ) | | | (0.07 | ) | | | (0.04 | ) | | | — | | |
Net realized and unrealized gain on investments
(net of Indian tax) | | $ | | | 0.88 | | | | 0.31 | | | | 0.38 | | | | 1.09 | | | | (1.84 | ) | | | 0.61 | | |
| Total from investment operations | | $ | | | 0.86 | | | | 0.29 | | | | 0.37 | | | | 1.02 | | | | (1.88 | ) | | | 0.61 | | |
| Net asset value, end of period | | $ | | | 5.42 | | | | 4.56 | | | | 4.27 | | | | 3.67 | | | | 2.65 | | | | 4.53 | | |
| Total Return(1) | | % | | | 18.86 | | | | 6.79 | | | | 9.49 | | | | 38.49 | | | | (41.50 | ) | | | 15.56 | | |
| Ratios and Supplemental Data: | |
| Net assets, end of period (000's) | | $ | | | 1,140 | | | | 551 | | | | 78 | | | | — | | | | 7 | | | | 12 | | |
| Ratios to average net assets: | |
| Gross expenses prior to expense reimbursement(3) | | % | | | 1.33 | | | | 1.33 | | | | 1.31 | | | | 1.35 | | | | 1.36 | | | | 1.36 | | |
| Net expenses after expense reimbursement(2)(3) | | % | | | 1.33 | | | | 1.33 | | | | 1.31 | | | | 1.36 | | | | 1.37 | | | | 1.36 | | |
| Net investment loss after expense reimbursement(2)(3) | | % | | | (0.50 | ) | | | (0.51 | ) | | | (0.73 | ) | | | (1.13 | ) | | | (1.14 | ) | | | (0.74 | ) | |
| Portfolio turnover rate | | % | | | 84 | | | | 129 | | | | 118 | | | | 15 | | | | 61 | | | | 129 | | |
(1) Total return is calculated assuming reinvestment of all dividends and capital gain distributions at net asset value and does not reflect the effect of insurance contract charges. Total return for periods less than one year is not annualized.
(2) The Investment Adviser has agreed to limit expenses, (excluding interest, taxes, brokerage and extraordinary expenses) subject to possible recoupment by the Investment Adviser within three years of being incurred.
(3) Annualized for periods less than one year.
(4) Class S was fully redeemed on December 16, 2003 and recommenced operations on July 20, 2005.
(5) Commencement of operations.
See Accompanying Notes to Financial Statements
45
NOTES TO FINANCIAL STATEMENTS AS OF DECEMBER 31, 2007
NOTE 1 — ORGANIZATION
Organization. The ING Variable Product Funds are comprised of ING VP Balanced Portfolio, Inc., ING Variable Funds, ING Variable Portfolios, Inc., ING VP Intermediate Bond Portfolio, ING Strategic Allocation Portfolios, Inc. and ING VP Money Market Portfolio (collectively, "Registrants"), all of which are open-end investment management companies registered under the Investment Company Act of 1940, as amended ("1940 Act").
ING VP Balanced Portfolio, Inc. is a company incorporated under the laws of Maryland on December 14, 1988 with one portfolio, ING VP Balanced Portfolio ("Balanced"). ING Variable Funds is a business trust formed under the laws of Massachusetts on January 25, 1984 with one portfolio, ING VP Growth and Income Portfolio ("Growth and Income"). ING Variable Portfolios, Inc. is a company incorporated under the laws of Maryland on June 4, 1996 and has eight separate portfolios. The four portfolios that are in this report are: ING VP Growth Portfolio ("Growth"), ING VP Small Company Portfolio ("Small Company"), ING VP Value Opportunity Portfolio ("Value Opportunity"), and ING VP Global Science and Technology Portfolio ("Global Science and Technology"). ING VP Intermediate Bond Portfolio is a business trust formed under the laws of Massachusetts on January 25, 1984 with one portfolio, ING VP Intermediate Bond Portfolio ("Intermediate Bond"). ING VP M oney Market Portfolio is a business trust under the laws of Massachusetts on January 25, 1984 with one portfolio, ING VP Money Market Portfolio ("Money Market"). Each of the portfolios is a "Portfolio" and collectively, they are the "Portfolios".
The following is a brief description of each Portfolio's investment objective:
• Balanced seeks to maximize investment return consistent with reasonable safety of principal, by investing in a diversified portfolio of one or more of the following asset classes: stocks, bonds, and cash equivalents based on the judgment of the Portfolio's management, of which of those sectors or mix thereof offers the best investment prospects;
• Growth and Income seeks to maximize total return through investments in a diversified portfolio of common stocks and securities convertible into common stock;
• Growth seeks growth of capital through investment in a diversified portfolio consisting primarily of common stocks and securities convertible into common stock believed to offer growth potential;
• Small Company seeks growth of capital primarily through investment in a diversified portfolio of common stocks and securities of companies with smaller market capitalizations;
• Value Opportunity seeks growth of capital primarily through investment in a diversified portfolio of common stocks;
• Intermediate Bond seeks to maximize total return consistent with reasonable risk;
• Money Market seeks to provide high current return, consistent with preservation of capital and liquidity, through investment in high-quality money market instruments; and
• Global Science and Technology seeks long-term capital appreciation.
Each Portfolio offers Class I and Class S shares. Each Portfolio except, Small Company, Money Market and Global Science and Technology offers Adviser ("ADV") Class shares. The three classes differ principally in applicable distribution and service fees. Shareholders of each class also bear certain expenses that pertain to that particular class. All shareholders bear the common expenses of the Portfolios and earn income and realized gains/losses from the Portfolio pro rata based on the average daily net assets of each class, without discrimination between share classes. Common expenses of the Portfolios (including custodial asset-based fees, legal and audit fees, printing and mailing expenses, transfer agency out-of-pocket expenses, and fees and expenses of the independent trustees) are allocated to each Portfolio in proportion to its relative daily net assets. Expenses directly attributable to a particular portfolio (including advisory, admi nistration, custodial transaction-based, registration, other professional, distribution and/or service fees, certain taxes, and offering costs) are charged directly to that Portfolio. Differences in per share dividend rates generally result from differences in separate class expenses, including distribution, and shareholder servicing fees.
Shares of the Portfolios may be offered to segregated asset accounts of insurance companies as investment options under variable annuity contracts and variable life insurance policies. Shares may also be offered to qualified pension and retirement plans outside the variable contract and to certain investment advisers and their affiliates. Class I shares may be made available to other investment companies, including series of the companies under fund-of-funds arrangements.
Participating insurance companies and other designated organizations are authorized to receive purchase orders on the Portfolio's behalf.
46
NOTES TO FINANCIAL STATEMENTS AS OF DECEMBER 31, 2007 (CONTINUED)
NOTE 1 — ORGANIZATION (continued)
ING Investments, LLC ("ING Investments'' or the "Investment Adviser"), an Arizona limited liability company, serves as the investment adviser to the Portfolios. ING Investments has engaged ING Investment Management Co. ("ING IM''), a Connecticut corporation, to serve as the Sub-Adviser to each Portfolio, with the exception of Global Science and Technology. ING Funds Distributor, LLC ("IFD" or the "Distributor") is the principal underwriter of the Portfolios. ING Investments, ING IM and the Distributor are indirect, wholly-owned subsidiaries of ING Groep N.V. ("ING Groep"). ING Groep is one of the largest financial services organizations in the world, and offers an array of banking, insurance and asset management services to both individuals and institutional investors.
NOTE 2 — SIGNIFICANT ACCOUNTING POLICIES`
The following significant accounting policies are consistently followed by the Portfolios in the preparation of their financial statements. Such policies are in conformity with U.S. generally accepted accounting principles for investment companies.
A. Security Valuation. Investments in equity securities traded on a national securities exchange are valued at the last reported sale price. Securities reported by NASDAQ are valued at the NASDAQ official closing prices. Securities traded on an exchange or NASDAQ for which there has been no sale and securities traded in the over-the-counter-market are valued at the mean between the last reported bid and ask prices. All investments quoted in foreign currencies will be valued daily in U.S. dollars on the basis of the foreign currency exchange rates prevailing at that time. Debt securities are valued at prices obtained from independent services or from one or more dealers making markets in the securities and may be adjusted based on the Portfolios' valuation procedures. U.S. government obligations are valued by using market quotations or independent pricing services that use prices provided by market-makers or estimates of market values obtained from yield data relating to instruments or securities with similar characteristics.
Securities and assets for which market quotations are not readily available (which may include certain restricted securities, which are subject to limitations as to their sale) are valued at their fair values as determined in good faith by or under the supervision of the Portfolios' Board of Directors/Trustees ("Board"), in accordance with methods that are specifically authorized by the Board. Securities traded on exchanges, including foreign exchanges, which close earlier than the time that a Portfolio calculates its net asset value ("NAV") may also be valued at their fair values as determined in good faith by or under the supervision of a Portfolio's Board, in accordance with methods that are specifically authorized by the Board. The value of a foreign security traded on an exchange outside the United States is generally based on its price on the principal foreign exch ange where it trades as of the time a Portfolio determines its NAV or if the foreign exchange closes prior to the time the Portfolio determines its NAV, the most recent closing price of the foreign security on its principal exchange. Trading in certain non-U.S. securities may not take place on all days on which the New York Stock Exchange ("NYSE") is open. Further, trading takes place in various foreign markets on days on which the NYSE is not open. Consequently, the calculation of a Portfolio's NAV may not take place contemporaneously with the determination of the prices of securities held by a Portfolio in foreign securities markets. Further, the value of a Portfolio's assets may be significantly affected by foreign trading on days when a shareholder cannot purchase or redeem shares of the Portfolio. In calculating a Portfolio's NAV, foreign securities denominated in foreign currency are converted to U.S. dollar equivalents. If an event occurs after the time at which the market for foreign securities held by a Portfolio closes but before the time that a Portfolio's NAV is calculated, such event may cause the closing price on the foreign exchange to not represent a readily available reliable market value quotation for such securities at the time a Portfolio determines its NAV. In such a case, a Portfolio will use the fair value of such securities as determined under a Portfolio's valuation procedures. Events after the close of trading on a foreign market that could require a Portfolio to fair value some or all of its foreign securities include, among others, securities trading in the U.S. and other markets, corporate announcements, natural and other disasters, and political and other events. Among other elements of analysis in the determination of a security's fair value, the Board has authorized the use of one or more independent research services to assist with such determinations. An independent research service may use statistical analyses and quantitative models to help determine fair value
47
NOTES TO FINANCIAL STATEMENTS AS OF DECEMBER 31, 2007 (CONTINUED)
NOTE 2 — SIGNIFICANT ACCOUNTING POLICIES (continued)
as of the time a Portfolio calculates its NAV. There can be no assurance that such models accurately reflect the behavior of the applicable markets or the effect of the behavior of such markets on the fair value of securities, or that such markets will continue to behave in a fashion that is consistent with such models. Unlike the closing price of a security on an exchange, fair value determinations employ elements of judgment. Consequently, the fair value assigned to a security may not represent the actual value that a Portfolio could obtain if it were to sell the security at the time of the close of the NYSE. Pursuant to procedures adopted by the Board, a Portfolio is not obligated to use the fair valuations suggested by any research service, and valuation recommendations provided by such research services may be overridden if other events have occurred or if other fair valuations are determined in good faith to be more accurate. Unless an event is such that it causes a Portfolio to determine that the closing prices for one or more securities do not represent readily available reliable market value quotations at the time the Portfolio determines its NAV, events that occur between the time of the close of the foreign market on which they are traded and the close of regular trading on the NYSE will not be reflected in the Portfolio's NAV. Investments in securities maturing in 60 days or less from date of acquisition are valued at amortized cost which approximates market value.
B. Security Transactions and Revenue Recognition. Securities transactions are accounted for on the trade date. Realized gains and losses are reported on the basis of identified cost of securities sold. Interest income is recorded on an accrual basis. Dividend income is recorded on the ex-dividend date, or for certain foreign securities, when the information becomes available to the Portfolios. Premium amortization and discount accretion are determined by the effective yield method.
C. Foreign Currency Translation. The books and records of the Portfolios are maintained in U.S. dollars. Any foreign currency amounts are translated into U.S. dollars on the following basis:
(1) Market value of investment securities, other assets and liabilities — at the exchange rates prevailing at the end of the day.
(2) Purchases and sales of investment securities, income and expenses — at the rates of exchange prevailing on the respective dates of such transactions.
Although the net assets and the market values are presented at the foreign exchange rates at the end of the day, the Portfolios do not isolate the portion of the results of operations resulting from changes in foreign exchange rates on investments from the fluctuations arising from changes in market prices of securities held. Such fluctuations are included with the net realized and unrealized gains or losses from investments. For securities, which are subject to foreign withholding tax upon disposition, liabilities are recorded on the Statements of Assets and Liabilities for the estimated tax withholding based on the securities' current market value. Upon disposition, realized gains or losses on such securities are recorded net of foreign withholding tax.
Reported net realized foreign exchange gains or losses arise from sales of foreign currencies, currency gains or losses realized between the trade and settlement dates on securities transactions, the difference between the amounts of dividends, interest, and foreign withholding taxes recorded on a Portfolio's books, and the U.S. dollar equivalent of the amounts actually received or paid. Net unrealized foreign exchange gains and losses arise from changes in the value of assets and liabilities other than investments in securities at fiscal year end, resulting from changes in the exchange rate. Foreign security and currency transactions may involve certain considerations and risks not typically associated with investing in U.S. companies and U.S. government securities. These risks include, but are not limited to, revaluation of currencies and future adverse political and economic developments, which could cause securities and their markets to be less liquid and prices more volatile than those of comparable U.S. companies and U.S. government securities.
D. Foreign Currency Transactions and Futures Contracts. Certain Portfolios may enter into foreign currency exchange transactions to convert to and from different foreign currencies and to and from the U.S. dollar in connection with the planned purchases or sales of securities. When entering into a currency forward contract, a Portfolio agrees to receive or deliver a fixed quantity of foreign currency for an agreed-upon price on an agreed future date. A Portfolio either enters into these transactions on a spot basis at the spot rate prevailing in the foreign currency exchange market or uses forward foreign currency contracts to purchase or sell foreign currencies. When the contract is fulfilled or closed, gains or
48
NOTES TO FINANCIAL STATEMENTS AS OF DECEMBER 31, 2007 (CONTINUED)
NOTE 2 — SIGNIFICANT ACCOUNTING POLICIES (continued)
losses are realized. Until then, the gain or loss is included in unrealized appreciation or depreciation. Risks may arise upon entering into forward contracts from the potential inability of counterparties to meet the terms of their forward contracts and from unanticipated movements in the value of foreign currencies relative to the U.S. dollar.
Each Portfolio, with the exception of Money Market, may enter into futures contracts involving foreign currency, interest rates, securities and securities indices. A futures contract obligates the seller of the contract to deliver and the purchaser of the contract to take delivery of the type of foreign currency, financial instrument or security called for in the contract at a specified future time for a specified price. Upon entering into such a contract, a Portfolio is required to deposit and maintain as collateral such initial margin as required by the exchange on which the contract is traded. Pursuant to the contract, a Portfolio agrees to receive from or pay to the broker an amount equal to the daily fluctuations in the value of the contract. Such receipts or payments are known as variation margins and are recorded as unrealized gains or losses by the Portfolio. When the contract is closed, the Portfolio records a realized gain or loss equal to the difference between the value of the contract at the time it was opened and the value at the time it was closed.
E. Distributions to Shareholders. The Portfolios record distributions to their shareholders on the ex-dividend date. Balanced, Growth, Small Company, Value Opportunity, Money Market and Global Science and Technology declare and pay dividends annually. Growth and Income and Intermediate Bond declare and pay dividends semi-annually. The Portfolios may make distributions on a more frequent basis to comply with the distribution requirements of the Internal Revenue Code. The characteristics of income and gains to be distributed are determined in accordance with income tax regulations, which may differ from U.S. generally accepted accounting principles for investment companies.
F. Federal Income Taxes. It is the policy of the Portfolios to comply with subchapter M of the Internal Revenue Code and related excise tax provisions applicable to regulated investment companies and to distribute substantially all of their net investment income and any net realized capital gains to their shareholders. Therefore, no federal income tax provision is required. No capital gain distributions shall be made until any capital loss carryforwards have been fully utilized or expire.
G. Use of Estimates. The preparation of financial statements in conformity with U.S. generally accepted accounting principles requires management to make estimates and assumptions that affect the reported amounts of assets and liabilities and disclosure of contingent assets and liabilities at the date of the financial statements and the reported amounts of increases and decreases in net assets from operations during the reporting period. Actual results could differ from those estimates.
H. Repurchase Agreements. Each Portfolio may invest in repurchase agreements only with government securities dealers recognized by the Board of Governors of the Federal Reserve System. Under such agreements, the seller of the security agrees to repurchase it at a mutually agreed upon time and price. The resale price is in excess of the purchase price and reflects an agreed upon interest rate for the period of time the agreement is outstanding. The period of the repurchase agreements is usually short, from overnight to one week, while the underlying securities generally have longer maturities. Each Portfolio will receive as collateral securities acceptable to it whose market value is equal to at least 100% of the carrying amount of the repurchase agreements, plus accrued interest, be ing invested by the Portfolio. The underlying collateral is valued daily on a mark-to-market basis to assure that the value, including accrued interest is at least equal to the repurchase price. There would be potential loss to the Portfolio in the event the Portfolio is delayed or prevented from exercising its right to dispose of the collateral, and it might incur disposition costs in liquidating the collateral.
I. Securities Lending. Each Portfolio has the option to temporarily loan up to 30% of its total assets to brokers, dealers or other financial institutions in exchange for a negotiated lender's fee. The borrower is required to fully collateralize the loans with cash or U.S. government securities. Generally, in the event of counterparty default, a Portfolio has the right to use collateral to offset losses incurred. There would be potential loss to a Portfolio in the event a Portfolio is delayed or prevented from exercising its right to dispose of the collateral. A Portfolio bears the risk of loss with respect to the investment of collateral. Engaging in securities lending could have a leveraging effect, which may intensify the credit, market and other risks associated with investing i n a Portfolio.
49
NOTES TO FINANCIAL STATEMENTS AS OF DECEMBER 31, 2007 (CONTINUED)
NOTE 2 — SIGNIFICANT ACCOUNTING POLICIES (continued)
J. Illiquid and Restricted Securities. The Portfolios may not invest more than 15% (10% for Money Market) of their net assets in illiquid securities. Illiquid securities are not readily marketable. Disposing of illiquid investments may involve time-consuming negotiation and legal expenses, and it may be difficult or impossible for the Portfolios to sell them promptly at an acceptable price. The Portfolios may also invest in restricted securities, which include those sold under Rule 144A of the Securities Act of 1933 ("1933 Act") or securities offered pursuant to Section 4(2) of the 1933 Act, and/or are subject to legal or contractual restrictions on resale and may not be publicly sold without registration under the 1933 Act. Certain restricted securities may be considered liquid pur suant to guidelines approved by the Board or may be deemed to be illiquid because they may not be readily marketable. Illiquid and restricted securities are valued using market quotations when readily available. In the absence of market quotations, the securities are valued based upon their fair value determined under procedures approved by the Board.
K. When-Issued and Delayed-Delivery Transactions. Each Portfolio may purchase or sell securities on a when-issued or forward commitment basis. The price of the underlying securities and date when the securities will be delivered and paid for are fixed at the time the transaction is negotiated. The market value of such is identified in the Portfolio of Investments. Losses may arise due to changes in the market value of the securities or from the inability of counterparties to meet the terms of the contract. In connection with such purchases, the Portfolios are required to hold liquid assets as collateral with the Portfolios' custodian sufficient to cover the purchase price.
L. Mortgage Dollar Roll Transactions. Balanced, Growth and Income, Value Opportunity, Global Science and Technology, and Money Market Portfolios may engage in dollar roll transactions with respect to mortgage-backed securities issued by Government National Mortgage Association, Federal National Mortgage Association and Federal Home Loan Mortgage Corp. In a dollar roll transaction, a Portfolio sells a mortgage-backed security to a financial institution, such as a bank or broker/dealer, and simultaneously agrees to repurchase a substantially similar (i.e., same type, coupon, and maturity) security from the institution on a delayed delivery basis at an agreed upon price. The mortgage-backed securities that are repu rchased will bear the same interest rate as those sold, but generally will be collateralized by different pools of mortgages with different prepayment histories. The Portfolios account for dollar roll transactions as purchases and sales.
M. Options Contracts. Certain Portfolios may purchase put and call options and may write (sell) put options and covered call options. The Portfolios may engage in option transactions as a hedge against adverse movements in the value of portfolio holdings or to increase market exposure. Option contracts are valued daily and unrealized gains or losses are recorded based upon the last sales price on the principal exchange on which the options are traded. An amount equal to the premium received by the Portfolios upon the writing of a put or call option is included in the Statements of Assets and Liabilities as a liability which is subsequ ently marked-to-market until it is exercised or closed, or it expires. The Portfolios will realize a gain or loss upon the expiration or closing of the option contract. When an option is exercised, the proceeds on sales of the underlying security for a written call option, the purchase cost of the security for a written put option, or the cost of the security for a purchased put or call option is adjusted by the amount of premium received or paid. Realized and unrealized gains or losses on option contracts are reflected in the accompanying financial statements. The risk in writing a covered call option is that the Portfolios give up the opportunity for profit if the market price of the security increases and the option is exercised. The risk in writing a put option is that the Portfolios may incur a loss if the market price of the security decreases and the option is exercised. The risk in buying an option is that the Portfolios pay a premium whether or not the option is exercised. Risks may also arise from an illiquid secondary market or from the inability of counterparties to meet the terms of the contract.
N. Credit Default Swaps. Certain Portfolios may enter into credit default swap contracts for investment purposes. Certain Portfolios may also purchase credit default swap contracts in order to hedge against risk of default of debt securities held in their portfolio.
As the seller in a credit default swap contract, a Portfolio would be required to pay the par (or other agreed-upon) value of a referenced debt obligation to the counterparty in the event of a
50
NOTES TO FINANCIAL STATEMENTS AS OF DECEMBER 31, 2007 (CONTINUED)
NOTE 2 — SIGNIFICANT ACCOUNTING POLICIES (continued)
default by a third party, such as a U.S. or foreign corporate issuer, on the debt obligation. In return, a Portfolio would receive from the counterparty a periodic stream of payments over the term of the contract provided that no event of default has occurred. If no default occurs, a Portfolio would keep the stream of payments and would have no payment obligations. As the seller, a Portfolio would be subject to investment exposure on the notional amount of the swap.
When a Portfolio purchases a credit default swap, the Portfolio would function as the counterparty referenced in the preceding paragraph. This would involve the risk that the investment may expire worthless and would only generate income in the event of an actual default by the issuer of the underlying obligation (as opposed to a credit downgrade or other indication of financial instability). It would also involve credit risk — that the seller may fail to satisfy its payment obligations to the Portfolios in the event of a default.
O. Swap Contracts. Each Portfolio, with the exception of Money Market, may enter into interest rate swaps, currency swaps and other types of swap agreements, including swaps on securities and indices. A swap is an agreement between two parties pursuant to which each party agrees to make one or more payments to the other on regularly scheduled dates over a stated term, based on different interest rates, currency exchange rates, security prices, the prices or rates of other types of financial instruments or assets or the levels of specified indices. During the term of the swap, changes in the value of the swap are recognized as unrealized appreciation or depreciation. Derivatives are also subject to credit risks related to the counterparty's ability to perform, and any deterioration i n the counterparty's creditworthiness could adversely affect the instrument.
P. Reverse Repurchase Agreements. A reverse repurchase agreement involves the sale of a security, with an agreement to repurchase the same or a substantially similar security at an agreed upon price and date. Reverse repurchase agreements are considered borrowings and the difference between the sale and repurchase prices represents interest expense at an agreed upon rate. Whether such a transaction produces a gain for a Portfolio depends upon whether the income and gains on the securities purchased with the proceeds received from the sale of the security exceeds the interest expense incurred by the Portfolio. Reverse repurchase agreements, as a leveraging technique, may increase a Portfolio's yield; however, suc h transactions also increase a Portfolio's risk to capital and may result in a shareholder's loss of principal.
Q. Indemnifications. In the normal course of business, the Registrants may enter into contracts that provide certain indemnifications. The Registrants' maximum exposure under these arrangements is dependent on future claims that may be made against the Portfolios and, therefore, cannot be estimated; however, based on experience, the risk of loss from such claims is considered remote.
NOTE 3 — INVESTMENT TRANSACTIONS
For the year ended December 31, 2007, the cost of purchases and the proceeds from the sales of securities, excluding short-term securities and U.S. government securities, were as follows:
| | | Purchases | | Sales | |
| Balanced | | $ | 1,222,746,003 | | | $ | 1,429,182,511 | | |
| Growth and Income | | | 4,249,822,095 | | | | 4,714,348,629 | | |
| Growth | | | 545,719,331 | | | | 637,774,383 | | |
| Small Company | | | 648,983,675 | | | | 585,484,476 | | |
| Value Opportunity | | | 367,115,028 | | | | 402,811,725 | | |
| Intermediate Bond | | | 1,489,908,026 | | | | 1,291,646,728 | | |
| Global Science and Technology | | | 70,735,784 | | | | 72,671,539 | | |
U.S. government securities not included above were as follows:
| | | Purchases | | Sales | |
| Balanced | | $ | 1,605,154,207 | | | $ | 1,526,490,009 | | |
| Intermediate Bond | | | 12,637,034,101 | | | | 12,097,926,605 | | |
NOTE 4 — INVESTMENT MANAGEMENT AND ADMINISTRATIVE FEES
The Portfolios entered into investment management agreements ("Investment Management Agreements") with the Investment Adviser. The Investment Management Agreements compensate the Investment Adviser with a fee, computed daily and payable monthly, based on the average daily net assets of each Portfolio, at the following annual rates:
| Balanced | | | 0.500 | % | |
| Growth and Income | | | 0.500% on first $10 billion;
0.450% on next $5 billion; and
0.425% over $15 billion | | |
| Growth | | | 0.600 | % | |
| Small Company | | | 0.750 | % | |
| Value Opportunity | | | 0.600 | % | |
| Intermediate Bond | | | 0.400 | % | |
| Money Market | | | 0.250 | % | |
| Global Science and Technology | | | 0.950 | % | |
51
NOTES TO FINANCIAL STATEMENTS AS OF DECEMBER 31, 2007 (CONTINUED)
NOTE 4 — INVESTMENT MANAGEMENT AND ADMINISTRATIVE FEES (continued)
The Investment Adviser entered into sub-advisory agreements with ING IM. ING IM acts as sub-adviser to all Portfolios except for Global Science and Technology. Subject to such policies as the Board or the Investment Adviser may determine, ING IM manages the Portfolios' assets in accordance with the Portfolios' investment objectives, policies, and limitations.
BlackRock Advisors, LLC ("BlackRock"), serves as Sub-Adviser to Global Science and Technology pursuant to a Sub-Advisory Agreement effective April 1, 2004 between the Investment Adviser and BlackRock.
Certain ING Portfolios sub-advised by ING IM are permitted to invest end-of-day cash balances into ING Institutional Prime Money Market Fund. Investment management fees paid by the Portfolios will be reduced by an amount equal to management fees paid indirectly to the ING Institutional Prime Money Market Fund with respect to assets invested by the Portfolios. For the year ended December 31, 2007, the Investment Adviser for Balanced, Growth and Income, Growth, Small Company, Value Opportunity and Intermediate Bond waived $37,365, $58,290, $1,291, $15,361, $1,756 and $92,157, respectively. These fees are not subject to recoupment.
Pursuant to administration agreements, ING Funds Services, LLC ("IFS"), an indirect, wholly-owned subsidiary of ING Groep, acts as administrator and provides certain administrative and shareholder services necessary for Portfolio operations and is responsible for the supervision of other service providers.
IFS is entitled to receive from each Portfolio a fee at an annual rate of 0.055% on the first $5 billion of daily net assets and 0.03% thereafter.
NOTE 5 — DISTRIBUTION AND SERVICE FEES
ADV Class shares of the respective Portfolios are subject to a Shareholder Service and Distribution Plan (the "Plan"). Under the Plan, the Distributor is paid an annual shareholder service fee at the rate of 0.25% and an annual distribution fee at the rate of 0.25% of the average daily net assets attributable to its ADV Class shares.
Class S shares of the Portfolios have adopted Distribution Plans pursuant to Rule 12b-1 under the 1940 Act (the "12b-1 Plans"), whereby the Distributor is compensated by the Portfolios for expenses incurred in the distribution of each Portfolio's shares ("Distribution Fees"). Pursuant to the 12b-1 Plans, the Distributor is entitled to a payment each month to compensate for expenses incurred in the distribution and promotion of each Portfolio's shares, including expenses incurred in printing prospectuses and reports used for sales purposes, expenses incurred in preparing and printing sales literature and other such distribution related expenses, including any distribution or shareholder servicing fees ("Service Fees") paid to securities dealers who have executed a distribution agreement with the Distributor. Under the 12b-1 Plans, Class S shares of the Portfolios pay the Distributor a fee calculated at an annual rate of 0.25% of average daily net assets.
NOTE 6 — OTHER TRANSACTIONS WITH AFFILIATED AND RELATED PARTIES
At December 31, 2007, the Portfolios had the following amounts recorded in payable to affiliates on the accompanying Statements of Assets and Liabilities (see Notes 4 and 5):
| | | Accrued
Investment
Management
Fees | | Accrued
Administrative
Fees | | Accrued
Shareholder
Service and
Distribution
Fees | | Total | |
| Balanced | | $ | 450,278 | | | $ | 49,832 | | | $ | 2,190 | | | $ | 502,300 | | |
| Growth and Income | | | 1,219,640 | | | | 134,290 | | | | 6,050 | | | | 1,359,980 | | |
| Growth | | | 82,172 | | | | 7,536 | | | | 5,302 | | | | 95,010 | | |
| Small Company | | | 388,328 | | | | 28,568 | | | | 608 | | | | 417,504 | | |
| Value Opportunity | | | 86,471 | | | | 7,930 | | | | 5,130 | | | | 99,531 | | |
| Intermediate Bond | | | 1,121,977 | | | | 155,070 | | | | 228,186 | | | | 1,505,233 | | |
| Money Market | | | 362,555 | | | | 79,760 | | | | — | | | | 442,315 | | |
Global Science and
Technology | | | 79,397 | | | | 4,597 | | | | 239 | | | | 84,233 | | |
The Registrants have adopted a Deferred Compensation Plan (the "Policy"), which allows eligible non-affiliated directors as described in the Policy to defer the receipt of all or a portion of the directors' fees payable. Deferred fees are invested in various funds advised by ING Investments until distribution in accordance with the Policy.
At December 31, 2007, the following ING Portfolios or indirect, wholly owned subsidiaries of ING Groep owned more than 5% of the following Portfolios:
ING Life Insurance and Annuity Company — Balanced (91.95%); Growth and Income (93.28%); Growth (86.57%); Small Company (55.12%); Value Opportunity (82.71%); Intermediate Bond (33.93%); Money Market (98.44%); and Global Science and Technology (96.58%)
ING LifeStyle Aggressive Growth Portfolio — Small Company (8.95%)
ING LifeStyle Growth Portfolio — Small Company (19.91%)
52
NOTES TO FINANCIAL STATEMENTS AS OF DECEMBER 31, 2007 (CONTINUED)
NOTE 6 — OTHER TRANSACTIONS WITH AFFILIATED AND RELATED PARTIES (continued)
ING LifeSyle Moderate Growth Portfolio — Intermediate Bond (9.20%)
ING USA Annuity and Life Insurance Company — Value Opportunity (13.77%) and Intermediate Bond (32.17%)
Reliastar Life Insurance Company — Growth (12.16%)
For the year ended December 31, 2007, Global Science and Technology placed a portion of its portfolio transactions with a brokerage firm which is an affiliate of the Investment Adviser. The commissions paid to the affiliated firm, ING Baring LLC, was $230.
NOTE 7 — EXPENSE LIMITATIONS
ING Investments entered into written expense limitation agreements ("Expense Limitation Agreements") with each of the following Portfolios whereby the Investment Adviser has agreed to limit expenses, excluding interest expense, taxes, brokerage and extraordinary expenses (and acquired fund fees and expenses) to the levels listed below:
| | | Class ADV | | Class I | | Class S | |
| Growth | | | 1.30 | % | | | 0.80 | % | | | 1.05 | % | |
| Small Company | | N/A | | | 0.95 | % | | | 1.20 | % | |
| Value Opportunity | | | 1.30 | % | | | 0.80 | % | | | 1.05 | % | |
| Global Science and Technology | | N/A | | | 1.15 | % | | | 1.40 | % | |
The Investment Adviser may at a later date recoup from a Portfolio management fees waived and other expenses assumed by the Investment Adviser during the previous 36 months, but only if, after such recoupment, the Portfolio's expense ratio does not exceed the percentage described above. Waived and reimbursed fees net of any recoupment by the Investment Adviser of such waived and reimbursed fees are reflected on the accompanying Statements of Operations. Amounts payable by the Investment Manager are reflected on the accompanying Statements of Assets and Liabilities for each Portfolio.
As of December 31, 2007, the Portfolios have no reimbursed fees that are subject to possible recoupment by the Investment Adviser.
The Expense Limitation Agreements are contractual and shall renew automatically for one-year terms unless ING Investments provides written notice of the termination of an Expense Limitation Agreement within 90 days of the end of the then current term.
NOTE 8 — BORROWINGS
The Portfolios, in addition to certain other funds managed by the Investment Adviser, have entered into an unsecured committed revolving line of credit agreement (the "Credit Agreement ") with a syndicate
of banks led by Citibank, N.A. for an aggregate amount of $100,000,000. The proceeds may be used only to: (1) temporarily finance the purchase and sale of securities; (2) finance the redemption of shares of an investor in the Portfolios; and (3) enable the Portfolios to meet other emergency expenses as defined in the Credit Agreement. The Portfolios to which the line of credit is available pay a commitment fee equal to 0.09% per annum on the daily unused portion of the committed line amount. Each of the Portfolios will pay its pro rata share of both the agent and commitment fee. Generally, borrowings under the Credit Agreement accrue interest at the federal funds rate plus a specified margin. Repayments generally must be made within 30 days after the date of a revolving credit advance. The following Portfolios utilized the line of credit during the year ended December 31, 2007:
| | | Days
Utilized | | Approximate
Average Daily
Balance | | Approximate
Weighted
Average
Interest Rate | |
| Growth and Income | | | 2 | | | $ | 20,365,000 | | | | 5.37 | % | |
| Growth | | | 9 | | | | 1,867,778 | | | | 5.19 | | |
| Small Company | | | 1 | | | | 3,840,000 | | | | 5.67 | | |
| Intermediate Bond | | | 2 | | | | 19,600,000 | | | | 5.79 | | |
Global Science and
Technology | | | 4 | | | | 890,000 | | | | 5.74 | | |
NOTE 9 — OPTIONS WRITTEN
Transactions in written options for Balanced for the year ended December 31, 2007 were as follows:
| | | Number of
Contracts | | Premium | |
| Balance at 12/31/06 | | | — | | | $ | — | | |
| Options Written | | | 540 | | | | 106,650 | | |
Options Terminated in
Closing Purchase
Transactions | | | (540 | ) | | | (106,650 | ) | |
| Balance at 12/31/07 | | | — | | | $ | — | | |
Transactions in written options for Growth and Income for the year ended December 31, 2007 were as follows:
| | | Number of
Contracts | | Premium | |
| Balance at 12/31/06 | | | 150,000 | | | $ | 178,500 | | |
| Options Written | | | 1,254,600 | | | | 3,798,079 | | |
Options Terminated in
Closing Purchase
Transactions | | | (920,600 | ) | | | (3,046,529 | ) | |
| Options Expirations | | | (484,000 | ) | | | (930,050 | ) | |
| Balance at 12/31/07 | | | — | | | $ | — | | |
Transactions in written options for Intermediate Bond for the year ended December 31, 2007 were as follows:
| | | Number of
Contracts | | Premium | |
| Balance at 12/31/06 | | | — | | | $ | — | | |
| Options Written | | | 3,908 | | | | 771,830 | | |
Options Terminated in
Closing Purchase
Transactions | | | (3,908 | ) | | | (771,830 | ) | |
| Balance at 12/31/07 | | | — | | | $ | — | | |
53
NOTES TO FINANCIAL STATEMENTS AS OF DECEMBER 31, 2007 (CONTINUED)
Transactions in capital shares and dollars were as follows:
| | | Class ADV | | Class I | | Class S | |
| | | Year
Ended
December 31,
2007 | | December 29,
2006(1) to
December 31,
2006 | | Year
Ended
December 31,
2007 | | Year
Ended
December 31,
2006 | | Year
Ended
December 31,
2007 | | Year
Ended
December 31,
2006 | |
| Balanced (Number of Shares) | |
| Shares sold | | | 2 | | | | 68 | | | | 601,762 | | | | 4,878,404 | | | | 98,592 | | | | 102,380 | | |
| Shares issued in merger | | | — | | | | — | | | | — | | | | 974,709 | | | | — | | | | 599,724 | | |
| Dividends reinvested | | | — | | | | — | | | | 5,397,784 | | | | 2,095,112 | | | | 48,696 | | | | 5,132 | | |
| Shares redeemed | | | — | | | | — | | | | (14,407,746 | ) | | | (17,759,754 | ) | | | (164,770 | ) | | | (207,251 | ) | |
| Net increase (decrease) in shares outstanding | | | 2 | | | | 68 | | | | (8,408,200 | ) | | | (9,811,529 | ) | | | (17,482 | ) | | | 499,985 | | |
| Balanced ($) | |
| Shares sold | | $ | 28 | | | $ | 1,000 | | | $ | 8,646,382 | | | $ | 67,433,818 | | | $ | 1,413,626 | | | $ | 1,409,005 | | |
| Proceeds from shares issued in merger | | | — | | | | — | | | | — | | | | 13,476,644 | | | | — | | | | 8,269,170 | | |
| Dividends reinvested | | | — | | | | — | | | | 74,921,236 | | | | 28,870,646 | | | | 672,985 | | | | 70,509 | | |
| Shares redeemed | | | — | | | | — | | | | (208,308,305 | ) | | | (248,353,965 | ) | | | (2,358,255 | ) | | | (2,858,884 | ) | |
| Net increase (decrease) | | $ | 28 | | | $ | 1,000 | | | $ | (124,740,687 | ) | | $ | (138,572,857 | ) | | $ | (271,644 | ) | | $ | 6,889,800 | | |
| | | Class ADV | | Class I | | Class S | |
| | | Year
Ended
December 31,
2007 | | December 20,
2006(1) to
December 31,
2006 | | Year
Ended
December 31,
2007 | | Year
Ended
December 31,
2006 | | Year
Ended
December 31,
2007 | | Year
Ended
December 31,
2006 | |
| Growth and Income (Number of Shares) | |
| Shares sold | | | 4,938 | | | | 43 | | | | 203,330 | | | | 1,044,630 | | | | 126,276 | | | | 112,415 | | |
| Shares issued in merger | | | 114,031 | | | | — | | | | 2,058,554 | | | | — | | | | 852,618 | | | | — | | |
| Dividends reinvested | | | 642 | | | | — | | | | 1,574,933 | | | | 1,528,513 | | | | 14,041 | | | | 1,970 | | |
| Shares redeemed | | | (70,456 | ) | | | — | | | | (23,418,770 | ) | | | (21,948,383 | ) | | | (175,331 | ) | | | (27,677 | ) | |
| Net increase (decrease) in shares outstanding | | | 49,155 | | | | 43 | | | | (19,581,953 | ) | | | (19,375,240 | ) | | | 817,604 | | | | 86,708 | | |
| Growth and Income ($) | |
| Shares sold | | $ | 122,979 | | | $ | 1,000 | | | $ | 4,950,308 | | | $ | 24,293,092 | | | $ | 3,119,814 | | | $ | 2,450,803 | | |
| Proceeds from shares issued in merger | | | 2,802,427 | | | | — | | | | 50,909,777 | | | | — | | | | 20,968,866 | | | | — | | |
| Dividends reinvested | | | 15,909 | | | | — | | | | 39,278,832 | | | | 35,950,900 | | | | 348,348 | | | | 46,207 | | |
| Shares redeemed | | | (1,754,815 | ) | | | — | | | | (576,312,116 | ) | | | (481,867,035 | ) | | | (4,328,750 | ) | | | (602,247 | ) | |
| Net increase (decrease) | | $ | 1,186,500 | | | $ | 1,000 | | | $ | (481,173,199 | ) | | $ | (421,623,043 | ) | | $ | 20,108,278 | | | $ | 1,894,763 | | |
| | | Class ADV | | Class I | | Class S | |
| | | Year
Ended
December 31,
2007 | | December 29,
2006(1) to
December 31,
2006 | | Year
Ended
December 31,
2007 | | Year
Ended
December 31,
2006 | | Year
Ended
December 31,
2007 | | Year
Ended
December 31,
2006 | |
| Growth (Number of Shares) | |
| Shares sold | | | 83,613 | | | | 94 | | | | 978,074 | | | | 4,813,793 | | | | 225,599 | | | | 5,711 | | |
| Shares issued in merger | | | 260,860 | | | | — | | | | 294,101 | | | | — | | | | 2,834,516 | | | | — | | |
| Dividends reinvested | | | 493 | | | | — | | | | 29,544 | | | | 10,584 | | | | 3,866 | | | | — | | |
| Shares redeemed | | | (233,810 | ) | | | — | | | | (7,868,207 | ) | | | (4,206,698 | ) | | | (1,386,799 | ) | | | (7,478 | ) | |
| Net increase (decrease) in shares outstanding | | | 111,156 | | | | 94 | | | | (6,566,488 | ) | | | 617,679 | | | | 1,677,182 | | | | (1,767 | ) | |
| Growth ($) | |
| Shares sold | | $ | 977,275 | | | $ | 1,000 | | | $ | 11,185,278 | | | $ | 51,157,509 | | | $ | 2,620,412 | | | $ | 59,075 | | |
| Proceeds from shares issued in merger | | | 2,856,192 | | | | — | | | | 3,220,605 | | | | — | | | | 30,774,830 | | | | — | | |
| Dividends reinvested | | | 5,295 | | | | — | | | | 317,595 | | | | 113,349 | | | | 41,178 | | | | — | | |
| Shares redeemed | | | (2,637,192 | ) | | | — | | | | (92,737,170 | ) | | | (43,763,130 | ) | | | (15,618,037 | ) | | | (77,824 | ) | |
| Net increase (decrease) | | $ | 1,201,570 | | | $ | 1,000 | | | $ | (78,013,692 | ) | | $ | 7,507,728 | | | $ | 17,818,383 | | | $ | (18,749 | ) | |
(1) Commencement of operations
54
NOTES TO FINANCIAL STATEMENTS AS OF DECEMBER 31, 2007 (CONTINUED)
NOTE 10 — CAPITAL SHARES (continued)
| | | Class I | | Class S | |
| | | Year
Ended
December 31,
2007 | | Year
Ended
December 31,
2006 | | Year
Ended
December 31,
2007 | | Year
Ended
December 31,
2006 | |
| Small Company (Number of Shares) | |
| Shares sold | | | 8,292,290 | | | | 6,746,441 | | | | 50,908 | | | | 822,424 | | |
| Dividends reinvested | | | 4,011,153 | | | | 2,874,293 | | | | 17,941 | | | | 587,427 | | |
| Shares redeemed | | | (5,072,403 | ) | | | (4,186,153 | ) | | | (20,147 | ) | | | (4,494,836 | ) | |
| Net increase (decrease) in shares outstanding | | | 7,231,040 | | | | 5,434,581 | | | | 48,702 | | | | (3,084,985 | ) | |
| Small Company ($) | |
| Shares sold | | $ | 166,568,181 | | | $ | 143,089,598 | | | $ | 1,037,570 | | | $ | 18,611,859 | | |
| Dividends reinvested | | | 77,335,029 | | | | 60,192,208 | | | | 343,389 | | | | 12,277,239 | | |
| Shares redeemed | | | (104,467,481 | ) | | | (90,027,948 | ) | | | (411,463 | ) | | | (96,289,442 | ) | |
| Net increase (decrease) | | $ | 139,435,729 | | | $ | 113,253,858 | | | $ | 969,496 | | | $ | (65,400,344 | ) | |
| | | Class ADV | | Class I | | Class S | |
| | | Year
Ended
December 31,
2007 | | December 29,
2006(1) to
December 31,
2006 | | Year
Ended
December 31,
2007 | | Year
Ended
December 31,
2006 | | Year
Ended
December 31,
2007 | | Year
Ended
December 31,
2006 | |
| Value Opportunity (Number of Shares) | |
| Shares sold | | | 1 | | | | 64 | | | | 69,432 | | | | 163,605 | | | | 26,164 | | | | 10,706 | | |
| Dividends reinvested | | | — | | | | — | | | | 171,661 | | | | 176,547 | | | | 24,430 | | | | 29,063 | | |
| Shares redeemed | | | — | | | | — | | | | (2,226,807 | ) | | | (2,338,568 | ) | | | (357,045 | ) | | | (421,907 | ) | |
| Net increase (decrease) in shares outstanding | | | 1 | | | | 64 | | | | (1,985,714 | ) | | | (1,998,416 | ) | | | (306,451 | ) | | | (382,138 | ) | |
| Value Opportunity ($) | |
| Shares sold | | $ | 16 | | | $ | 1,000 | | | $ | 1,122,023 | | | $ | 2,340,296 | | | $ | 427,278 | | | $ | 152,377 | | |
| Dividends reinvested | | | — | | | | — | | | | 2,729,402 | | | | 2,514,028 | | | | 385,996 | | | | 411,247 | | |
| Shares redeemed | | | — | | | | — | | | | (36,232,111 | ) | | | (34,295,707 | ) | | | (5,740,720 | ) | | | (6,091,700 | ) | |
| Net increase (decrease) | | $ | 16 | | | $ | 1,000 | | | $ | (32,380,686 | ) | | $ | (29,441,383 | ) | | $ | (4,927,446 | ) | | $ | (5,528,076 | ) | |
| | | Class ADV | | Class I | | Class S | |
| | | Year
Ended
December 31,
2007 | | December 20,
2006(1) to
December 31,
2006 | | Year
Ended
December 31,
2007 | | Year
Ended
December 31,
2006 | | Year
Ended
December 31,
2007 | | Year
Ended
December 31,
2006 | |
| Intermediate Bond (Number of Shares) | |
| Shares sold | | | 1 | | | | 75 | | | | 49,001,222 | | | | 68,647,762 | | | | 36,862,315 | | | | 31,962,510 | | |
| Shares issued in merger | | | — | | | | — | | | | — | | | | 222,036 | | | | — | | | | — | | |
| Dividends reinvested | | | — | | | | — | | | | 6,365,573 | | | | 5,842,808 | | | | 2,943,179 | | | | 1,815,268 | | |
| Shares redeemed | | | — | | | | — | | | | (31,214,224 | ) | | | (15,931,235 | ) | | | (5,787,371 | ) | | | (33,432,290 | ) | |
| Net increase in shares outstanding | | | 1 | | | | 75 | | | | 24,152,571 | | | | 58,781,371 | | | | 34,018,123 | | | | 345,488 | | |
| Intermediate Bond ($) | |
| Shares sold | | $ | 13 | | | $ | 1,000 | | | $ | 650,399,991 | | | $ | 896,296,588 | | | $ | 486,271,739 | | | $ | 416,941,141 | | |
| Proceeds from shares issued in merger | | | — | | | | — | | | | — | | | | 2,862,609 | | | | — | | | | — | | |
| Dividends reinvested | | | — | | | | — | | | | 83,961,911 | | | | 75,836,918 | | | | 38,555,642 | | | | 23,433,812 | | |
| Shares redeemed | | | — | | | | — | | | | (414,573,638 | ) | | | (209,279,344 | ) | | | (76,141,712 | ) | | | (429,117,715 | ) | |
| Net increase | | $ | 13 | | | $ | 1,000 | | | $ | 319,788,264 | | | $ | 765,716,771 | | | $ | 448,685,669 | | | $ | 11,257,238 | | |
| | | Class I | |
| | | Year
Ended
December 31,
2007 | | Year
Ended
December 31,
2006 | |
| Money Market (Number of Shares) | |
| Shares sold | | | 38,082,834 | | | | 32,751,915 | | |
| Dividends reinvested | | | 4,428,411 | | | | 2,488,618 | | |
| Shares redeemed | | | (17,045,429 | ) | | | (15,506,729 | ) | |
| Net increase in shares outstanding | | | 25,465,816 | | | | 19,733,804 | | |
| Money Market ($) | |
| Shares sold | | $ | 503,402,892 | | | $ | 428,969,203 | | |
| Dividends reinvested | | | 57,130,928 | | | | 31,895,864 | | |
| Shares redeemed | | | (226,091,022 | ) | | | (203,348,846 | ) | |
| Net increase | | $ | 334,442,798 | | | $ | 257,516,221 | | |
(1) Commencement of operations
55
NOTES TO FINANCIAL STATEMENTS AS OF DECEMBER 31, 2007 (CONTINUED)
NOTE 10 — CAPITAL SHARES (continued)
| | | Class I | | Class S | |
| | | Year
Ended
December 31,
2007 | | Year
Ended
December 31,
2006 | | Year
Ended
December 31,
2007 | | Year
Ended
December 31,
2006 | |
| Global Science and Technology (Number of Shares) | |
| Shares sold | | | 3,234,547 | | | | 2,971,865 | | | | 115,132 | | | | 127,341 | | |
| Shares redeemed | | | (3,091,773 | ) | | | (4,955,941 | ) | | | (25,466 | ) | | | (25,008 | ) | |
| Net increase (decrease) in shares outstanding | | | 142,774 | | | | (1,984,076 | ) | | | 89,666 | | | | 102,333 | | |
| Global Science and Technology ($) | |
| Shares sold | | $ | 17,170,211 | | | $ | 13,210,390 | | | $ | 614,569 | | | $ | 570,468 | | |
| Shares redeemed | | | (15,261,016 | ) | | | (21,885,263 | ) | | | (132,451 | ) | | | (107,972 | ) | |
| Net increase (decrease) | | $ | 1,909,195 | | | $ | (8,674,873 | ) | | $ | 482,118 | | | $ | 462,496 | | |
NOTE 11 — ILLIQUID SECURITIES
Pursuant to guidelines adopted by the Portfolios' Board, the following securities have been deemed to be illiquid. Each Portfolio currently limits investment in illiquid securities to 15% (10% for Money Market) of the Portfolio's net assets, at market value, at time of purchase.
| | | Security | | Principal
Amount/
Shares | | Initial
Acquisition
Date | | Cost | | Value | | Percent
of Net
Assets | |
| Balanced | | Alabama National Bancorp. | | | 1,000 | | | 09/25/07 | | $ | 77,660 | | | $ | 77,810 | | | | 0.0 | % | |
| | | Alpine III, 5.428%, due 08/16/14 | | | 218,000 | | | 08/16/04 | | | 218,079 | | | | 218,702 | | | | 0.0 | % | |
| | | Alpine III, 5.828%, due 08/16/14 | | | 218,000 | | | 08/16/04 | | | 218,079 | | | | 218,795 | | | | 0.0 | % | |
| | | Alpine III, 7.628%, due 08/16/14 | | | 328,000 | | | 08/16/04 | | | 330,840 | | | | 330,476 | | | | 0.0 | % | |
| | | Alpine III, 10.878%, due 08/16/14 | | | 560,000 | | | 08/16/04 | | | 560,878 | | | | 573,446 | | | | 0.1 | % | |
| | | | | | | | | | | $ | 1,405,536 | | | $ | 1,419,229 | | | | 0.1 | % | |
| Intermediate Bond | | Alpine III, 5.428%, due 08/16/14 | | | 1,006,000 | | | 08/16/04 | | $ | 1,006,347 | | | $ | 1,009,241 | | | | 0.0 | % | |
| | | Alpine III, 5.828%, due 08/16/14 | | | 1,006,000 | | | 08/16/04 | | | 1,006,347 | | | | 1,009,667 | | | | 0.0 | % | |
| | | Alpine III, 7.628%, due 08/16/14 | | | 1,507,000 | | | 08/16/04 | | | 1,521,972 | | | | 1,518,378 | | | | 0.0 | % | |
| | | Alpine III, 10.878%, due 08/16/14 | | | 2,576,000 | | | 08/16/04 | | | 2,604,854 | | | | 2,637,850 | | | | 0.1 | % | |
| | | | | | | | | | | $ | 6,139,520 | | | $ | 6,175,136 | | | | 0.1 | % | |
| Money Market | | Goldman Sachs Group LP, 5.268%,
due 04/11/08 | | | 22,000,000 | | | 04/12/07 | | $ | 22,000,000 | | | $ | 22,000,000 | | | | 1.3 | % | |
| | | | | | | | | | | $ | 22,000,000 | | | $ | 22,000,000 | | | | 1.3 | % | |
NOTE 12 — SECURITIES LENDING
Under an agreement with The Bank of New York Mellon Corporation ("BNY"), the Portfolios can lend their securities to approved brokers, dealers and other financial institutions. Loans are collateralized by cash and U.S. Government securities. The collateral must be in an amount equal to at least 105% of the market value of non-U.S. securities loaned and 102% of the market value of U.S. securities loaned. The cash collateral received is invested in approved investments as defined in the Securities Lending Agreement with BNY (the "Agreement"). The securities purchased with cash collateral received are reflected in the Portfolio of Investments. Generally, in the event of counterparty default, the Portfolios have the right to use the collateral to offset losses incurred. The Agreement contains certain guarantees by BNY in the event of counterparty default and/or a borrower's failure to return a loaned security, however there would be a potential loss to the Portfolios in the event the Portfolios are delayed or prevented from exercising their right to dispose of the collateral. The Portfolios bear the risk of loss with respect to the investment of collateral. Engaging in securities lending could have a leveraging effect, which may intensify the credit, market and other risks associated with investing in a Portfolio. At December 31, 2007, the Portfolios had securities on loan with the following market values:
| | | Value of
Securities
Loaned | | Value of
Collateral | |
| Balanced | | $ | 189,920,382 | | | $ | 194,627,493 | | |
| Growth and Income | | | 326,408,493 | | | | 336,741,398 | | |
| Small Company | | | 170,136,305 | | | | 177,336,837 | | |
| Value Opportunity | | | 37,164,280 | | | | 38,345,940 | | |
| Intermediate Bond | | | 857,043,519 | | | | 872,460,480 | | |
| Money Market | | | 981,245 | | | | 1,010,974 | | |
| Global Science and Technology | | | 20,640,654 | | | | 21,410,626 | | |
56
NOTES TO FINANCIAL STATEMENTS AS OF DECEMBER 31, 2007 (CONTINUED)
NOTE 13 — CONCENTRATION OF INVESTMENT RISKS
Concentration (Global Science and Technology). The Portfolio concentrates (for purposes of the 1940 Act) its assets in securities related to a particular industry, which means that at least 25% of its assets will be invested in that particular industry at all times. As a result, the Portfolio may be subject to greater market fluctuation than a portfolio which has securities representing a broader range of investment alternatives.
Foreign Securities (All Portfolios). Investments in foreign securities may entail risks not present in domestic investments. Since securities in which the Portfolios may invest are denominated in foreign currencies, changes in the relationship of these foreign currencies to the U.S. dollar can significantly affect the value of the investments and earnings of the Portfolios. Foreign investments may also subject the Portfolios to foreign government exchange restrictions, expropriation, taxation or other political, social or economic developments, as well as changes vis-a-vis the U.S. dollar from movements in currency, and changes in security value and interest rate, all of which could affect the market and/or credit risk of the Portfolios' investments.
Emerging Markets Investments (Intermediate Bond and Global Science and Technology). Because of less developed markets and economies and, in some countries, less mature governments and governmental institutions, the risks of investing in foreign securities can be intensified in the case of investments in issuers domiciled or doing substantial business in emerging market countries.
NOTE 14 — FEDERAL INCOME TAXES AND OTHER TAX MATTERS
The amount of distributions from net investment income and net realized capital gains are determined in accordance with federal income tax regulations, which may differ from U.S. generally accepted accounting principles for investment companies. These book/tax differences may be either temporary or permanent. Permanent differences are reclassified within the capital accounts based on their federal tax-basis treatment; temporary differences are not reclassified. Key differences include the treatment of short-term capital gains, foreign currency transactions, and wash sale deferrals. Distributions in excess of net investment income and/or net realized capital gains for tax purposes are reported as distributions of paid-in capital.
The following permanent tax differences have been reclassified as of December 31, 2007:
| | | Paid-in
Capital | | Undistributed
Net Investment
Income | | Accumulated
Net Realized
Gains/
(Losses) on
Investments | |
| Balanced | | $ | 1,035 | | | $ | (790,522 | ) | | $ | 789,487 | | |
| Growth and Income | | | (16,217 | ) | | | (40,970 | ) | | | 57,187 | | |
| Growth | | | (1,954,766 | ) | | | — | | | | 1,954,766 | | |
| Small Company | | | — | | | | (801,087 | ) | | | 801,087 | | |
| Value Opportunity | | | — | | | | (46,915 | ) | | | 46,915 | | |
| Intermediate Bond | | | — | | | | (5,991,077 | ) | | | 5,991,077 | | |
Global Science and
Technology | | | (636,673 | ) | | | 324,760 | | | | 311,913 | | |
Dividends paid by the Portfolios from net investment income and distributions of net realized short-term capital gains are, for federal income tax purposes, taxable as ordinary income to shareholders.
The tax composition of dividends and distributions to shareholders was as follows:
| | | Year Ended
December 31, 2007 | | Year Ended
December 31, 2006 | |
| | | Ordinary
Income | | Long-Term
Capital Gains | | Ordinary
Income | | Long-Term
Capital Gains | |
| Balanced | | $ | 42,494,750 | | | $ | 33,099,538 | | | $ | 28,941,155 | | | $ | — | | |
| Growth and Income | | | 39,670,514 | | | | — | | | | 36,025,178 | | | | — | | |
| Growth | | | 364,068 | | | | — | | | | 113,349 | | | | — | | |
| Small Company | | | 10,265,009 | | | | 67,413,409 | | | | 6,394,186 | | | | 66,075,261 | | |
| Value Opportunity | | | 3,115,416 | | | | — | | | | 2,925,275 | | | | — | | |
| Intermediate Bond | | | 122,543,008 | | | | — | | | | 99,297,017 | | | | — | | |
| Money Market | | | 57,130,928 | | | | — | | | | 31,895,864 | | | | — | | |
57
NOTES TO FINANCIAL STATEMENTS AS OF DECEMBER 31, 2007 (CONTINUED)
NOTE 14 — FEDERAL INCOME TAXES AND OTHER TAX MATTERS (continued)
The tax-basis components of distributable earnings and the expiration dates of the capital loss carryforwards which may be used to offset future realized capital gains for federal income tax purposes as of December 31, 2007 were:
| | | Undistributed
Ordinary Income | | Undistributed
Long-Term
Capital Gains | | Unrealized
Appreciation/
(Depreciation) | | Capital
Loss
Carryforwards | | Expiration
Dates | |
| Balanced | | $ | 60,972,577 | | | $ | 50,744,407 | | | $ | 13,310,749 | | | $ | (574,085 | ) | | | 2008 | | |
| | | | | | | | | | | | | | | | (574,085 | ) | | | 2009 | | |
| | | | | | | | | | | | | | | $ | (1,148,170 | )* | | | | | |
| Growth and Income | | | — | | | | — | | | | 299,273,284 | | | | (1,077,057 | ) | | | 2008 | | |
| | | | | | | | | | | | | | | | (1,077,056 | ) | | | 2009 | | |
| | | | | | | | | | | | | | | | (1,745,504,149 | ) | | | 2010 | | |
| | | | | | | | | | | �� | | | | | (63,082,574 | ) | | | 2011 | | |
| | | | | | | | | | | | | | | $ | (1,810,740,836 | )* | | | | | |
| Growth | | | 790,454 | | | | — | | | | 5,924,373 | | | | (71,685,369 | ) | | | 2009 | | |
| | | | | | | | | | | | | | | | (65,982,870 | ) | | | 2010 | | |
| | | | | | | | | | | | | | | | (1,529,437 | ) | | | 2011 | | |
| | | | | | | | | | | | | | | $ | (139,197,676 | )* | | | | | |
| Small Company | | | 5,854,495 | | | | 74,243,480 | | | | 10,811,300 | | | | — | | | | — | | |
| Value Opportunity | | | 2,600,516 | | | | 20,976,051 | | | | 6,237,449 | | | | — | | | | — | | |
| Intermediate Bond | | | 80,001,470 | | | | — | | | | (60,410,188 | ) | | | — | | | | — | | |
| Money Market | | | 77,924,640 | | | | — | | | | — | | | | (616,847 | ) | | | 2008 | | |
| | | | | | | | | | | | | | | | (3,715,968 | ) | | | 2009 | | |
| | | | | | | | | | | | | | | | (169 | ) | | | 2011 | | |
| | | | | | | | | | | | | | | | (244,520 | ) | | | 2012 | | |
| | | | | | | | | | | | | | | $ | (4,577,504 | ) | | | | | |
| Global Science and Technology | | | — | | | | — | | | | 14,832,352 | | | | (11,940,884 | ) | | | 2009 | | |
| | | | | | | | | | | | | | | | (15,534,432 | ) | | | 2010 | | |
| | | | | | | | | | | | | | | | (4,912,495 | ) | | | 2011 | | |
| | | | | | | | | | | | | | | $ | (32,387,811 | ) | | | | | |
* Utilization of these capital losses is subject to annual limitations under Section 382 of the Internal Revenue Code.
The Portfolio's major tax jurisdictions are federal, Arizona and Massachusetts. The earliest tax year that remains subject to examination by these jurisdictions is 2003.
Under U.S. federal income tax law, as specified in the Internal Revenue Code (the "Code") and U.S. Treasury regulations, the Portfolios must meet various technical requirements relating to fund administration, portfolio investments, and "eligible investors" in the Portfolios. Complying with these requirements is a condition for beneficial tax treatment of certain insurance products that offer the Portfolios as investment options. The failure of the Portfolios to meet any of these complex requirements could result in an excise tax, administrative penalties imposed by the Internal Revenue Service, potential liability to insurers whose products include the Portfolios as investment options, and unanticipated costs associated with remedying a failure. It was disclosed in the Portfolio's Annual Report for the year ended December 31, 2006, that an affiliate of a Portfolio's investment adviser may have failed to limit the availability of Intermediat e Bond for investment to "eligible investors" under the Code. Management has determined that it is more likely than not the Portfolio would sustain their tax position relative to this matter.
NOTE 15 — REORGANIZATIONS
On November 10, 2007, Growth and Income, as listed below ("Acquiring Portfolio"), acquired the assets and certain liabilities of ING Fundamental Research Portfolio, also listed below ("Acquired Portfolio"), in a tax-free reorganization in exchange for shares of the Acquiring Portfolio, pursuant to a plan of reorganization approved by the Acquired Portfolio's shareholders. The number and value of shares issued by the Acquiring Portfolio are
58
NOTES TO FINANCIAL STATEMENTS AS OF DECEMBER 31, 2007 (CONTINUED)
NOTE 15 — REORGANIZATIONS (continued)
presented in Note 10 — Capital Share Transactions. Net assets, acquired capital loss carryforwards and unrealized appreciation as of the reorganization date were as follows:
Acquiring
Portfolio | | Acquired
Portfolio | | Total
Net Assets of
Acquired
Portfolio (000's) | | Total
Net Assets of
Acquiring
Portfolio (000's) | | Acquired
Capital Loss
Carryforwards
(000's) | | Acquired Portfolio
Unrealized
Appreciation (000's) | | Conversion
Ratio | |
| Growth and | | ING Fundamental | | | | | | | | | | | | | | | | | | |
| | |
| Income | | Research | | | | | | | | | | | | | | | | | | |
| | |
| | | Portfolio | | | | | | | | | | | | | | | | | | |
| | |
| Class ADV | | Class ADV | | $ | 2,802 | | | $ | 1 | | | $ | 99 | | | $ | 701 | | | | 0.37 | | |
| Class I | | Class I | | | 50,910 | | | | 2,805,342 | | | | 1,793 | | | | 1,280 | | | | 0.37 | | |
| Class S | | Class S | | | 20,969 | | | | 6,214 | | | | 738 | | | | 1,334 | | | | 0.37 | | |
| | | | | $ | 74,681 | | | $ | 2,811,557 | | | $ | 2,630 | | | $ | 3,315 | | | | | | |
The net assets of Growth and Income after the acquisition were approximately $2,886,238,230.
On January 3, 2007, Growth, as listed below ("Acquiring Portfolio"), acquired the assets and certain liabilities of ING Goldman Sachs Capital Growth Portfolio, also listed below ("Acquired Portfolio"), in a tax-free reorganization in exchange for shares of the Acquiring Portfolio, pursuant to a plan of reorganization approved by the Acquired Portfolio's shareholders. The number and value of shares issued by the Acquiring Portfolio are presented in Note 10 — Capital Share Transactions. Net assets, acquired capital loss carryforwards and unrealized appreciation as of the reorganization date were as follows:
Acquiring
Portfolio | | Acquired
Portfolio | | Total
Net Assets of
Acquired
Portfolio (000's) | | Total
Net Assets of
Acquiring
Portfolio (000's) | | Acquired
Capital Loss
Carryforwards
(000's) | | Acquired Portfolio
Unrealized
Appreciation (000's) | | Conversion
Ratio | |
| Growth | | ING Goldman Sachs | | | | | | | | | | | | | | | | | | |
| | |
| | | Capital Growth | | | | | | | | | | | | | | | | | | |
| | |
| | | Portfolio | | | | | | | | | | | | | | | | | | |
| | |
| Class ADV | | Class ADV | | $ | 2,856 | | | $ | 1 | | | $ | 740 | | | $ | 1,689 | | | | 1.14 | | |
| Class I | | Class I | | | 3,221 | | | | 189,159 | | | | 834 | | | | 254 | | | | 1.15 | | |
| Class S | | Class S | | | 30,775 | | | | 281 | | | | 7,973 | | | | 3,322 | | | | 1.15 | | |
| | | | | $ | 36,852 | | | $ | 189,441 | | | $ | 9,547 | | | $ | 5,265 | | | | | | |
The net assets of Growth after the acquisition were approximately $226,292,711.
On April 29, 2006, Balanced and Intermediate Bond as listed below (each "Acquiring Portfolio" and collectively, "Acquiring Portfolios"), acquired the assets and certain liabilities of the ING VP Convertible Portfolio, The Asset Allocation Portfolio and The Bond Portfolio, also listed below (each "Acquired Portfolio"and collectively, "Acquired Portfolios"), in a tax-free reorganization in exchange for shares of the Acquiring Portfolios, pursuant to a plan of reorganization approved by the Acquired Portfolios' shareholders. The number and value of shares issued by the Acquiring Portfolios are presented in Note 10 — Capital Share Transactions. Net assets, acquired capital loss carryforwards and unrealized appreciation/depreciation as of the reorganization date were as follows:
Acquiring
Portfolio | | Acquired
Portfolio | | Total
Net Assets of
Acquired
Portfolio (000's) | | Total
Net Assets of
Acquiring
Portfolio (000's) | | Acquired
Capital Loss
Carryforwards
(000's) | | Acquired Portfolio
Unrealized
Appreciation (000's) | | Conversion
Ratio | |
| Balanced | | ING VP | | | | | | | | | | | | | | | | | | |
| | |
| | | Convertible Portfolio | | $ | 8,269 | | | $ | 1,224,744 | | | $ | — | | | $ | 231 | | | | 0.81 | | |
| Balanced | | The Asset | | | | | | | | | | | | | | | | | | |
| | |
| | | Allocation Portfolio | | | 13,477 | | | | 1,224,744 | | | | 3,540 | | | | 632 | | | | 0.72 | | |
| Intermediate Bond | | The Bond Portfolio | | | 2,863 | | | | 1,890,564 | | | | 104 | | | | (60 | ) | | | 0.74 | | |
The net assets of Balanced and Intermediate Bond after the acquisition were approximately $1,246,490,241 and $1,893,426,244, respectively.
59
NOTES TO FINANCIAL STATEMENTS AS OF DECEMBER 31, 2007 (CONTINUED)
NOTE 16 — SUBSEQUENT EVENTS
Subsequent to December 31, 2007, the following Portfolio declared dividends from net investment income:
| | | Per Share
Amount | | Payable Date | | Record Date | |
| Money Market | |
| Class I | | $ | 0.5797 | | | February 4, 2008 | | January 30, 2008 | |
NOTE 17 — OTHER ACCOUNTING PRONOUNCEMENTS
In June 2006, the Financial Accounting Standards Board ("FASB") issued FASB Interpretation No. 48 ("FIN 48"), "Accounting for Uncertainty in Income Taxes." This standard defines the threshold for recognizing the benefits of tax-return positions in the financial statements as "more-likely-than-not" to be sustained upon challenge by the taxing authority and requires measurement of a tax position meeting the more-likely-than-not criterion, based on the largest benefit that is more than 50 percent likely to be realized. FIN 48 was effective for fiscal years beginning after December 15, 2006, with early application permitted if no interim financial statements have been issued. However, acknowledging the unique issues that FIN 48 presents for investment companies that calculate NAVs, the SEC indicated that they would not object if a fund implemented FIN 48 in its NAV calculation as late as its last NAV calculation in the first required financial s tatement reporting period for its fiscal year beginning after December 15, 2006. At adoption, companies must adjust their financial statements to reflect only those tax positions that are more likely-than-not to be sustained as of the adoption date. Management of the Portfolios has analyzed the tax positions of the Portfolios. Upon adoption of FIN 48, we identified no uncertain tax positions that have not met the more likely-than-not standard.
On September 15, 2006, the FASB issued Statement of Financial Accounting Standards No. 157 ("SFAS No. 157"), "Fair Value Measurements." The new accounting statement defines fair value, establishes a framework for measuring fair value in generally accepted accounting principles ("GAAP"), and expands disclosures about fair value measurements. SFAS No. 157 defines fair value as the price that would be received to sell an asset or paid to transfer a liability in an orderly transaction between market participants at the measurement date (an exit price). SFAS No. 157 also stipulates that, as a market-based measurement, fair value should be determined based on the assumptions that market participants would use in pricing the asset or liability, and establishes a fair value hierarchy that distinguishes between (a) market participant assumptions developed based on market data obt ained from sources independent of the reporting entity (observable inputs) and (b) the reporting entity's own assumptions about market participant assumptions developed based on the best information available in the circumstances (unobservable inputs). SFAS No. 157 is effective for financial statements issued for fiscal years beginning after November 15, 2007. As of December 31, 2007, management of the Portfolios is currently assessing the impact in addition to expanded financial statement disclosures, if any, that will result from adopting SFAS No. 157.
NOTE 18 — INFORMATION REGARDING TRADIING OF ING'S U.S. MUTUAL FUNDS
The adviser and its affiliates ("ING") received informal and formal requests for information or subpoenas from the SEC, NASD, Attorney General for the State of New York ("NYAG") as well as certain other governmental agencies in connection with "late trading" activity and/or "market timing" activity in the Portfolios. ING agreed with the Portfolios to indemnify and hold harmless the Portfolios from all damages resulting from wrongful conduct by ING or its employees or from ING's internal investigation, any investigations conducted by any governmental or self-regulatory agencies, litigation or other formal proceedings, including any proceedings by the U.S. Securities and Exchange Commission. In November, 2007, ING settled its indemnification commitments by making payments to the affected Portfolios. In connection with the settlement, ING paid $1,480 to Intermediate Bond.
NOTE 19 — LITIGATION
On December 12, 2003, Aeltus Investment Management, Inc. received a copy of a complaint (the "Complaint") filed in the United States Bankruptcy Court for the Southern District of New York in the matter of Enron Corp. v. Mass Mutual Life Insurance Co., et al. Among other defendants named in the Complaint are defendants ING VP Balanced Portfolio, and ING VP Bond Portfolio (the "Subject Portfolios"). As of August 6, 2004 the ING VP Bond Portfolio changed its name to the ING VP Intermediate Bond Portfolio. The Complaint alleges that Enron Corp. ("Enron") transferred to the defendants, including the Subject Portfolios, over $1 billion in the aggregate for the purpose of prepaying certain commercial paper issued by Enron (the "Notes") and held by the defendants prior to the filing by Enron for
60
NOTES TO FINANCIAL STATEMENTS AS OF DECEMBER 31, 2007 (CONTINUED)
NOTE 19 — LITIGATION (continued)
bankruptcy protection under Chapter 11 of Title 11 of the Bankruptcy Code (the "Bankruptcy Code").
The Complaint seeks to recover from the defendants, including the Subject Portfolios, these transfers under the alternative but interrelated bankruptcy theories of preferential transfer and fraudulent conveyance. Although the Complaint does not specify the amount of each transfer in dispute, it appears that the sale of ING VP Balanced Portfolio, Inc. of $23,181,757 of the Notes on or about October 29, 2001, and the sale by ING VP Bond Portfolio, Inc. of $24,963,125 of the Notes on or about October 29, 2001 are in dispute. The Complaint seeks to require the Subject Portfolios to repay to Enron the full amount of these transfers, in which event the Subject Portfolios would be granted unsecured claims against the Enron bankruptcy estate in the amounts of the repayments. If Enron proves up the elements of preferential transfer and/or fraudulent conveyance, these are strict liability theories of recovery.
The Subject Portfolios are part of a defense group of similarly-situated defendants. Along with those and other defendants, the Subject Portfolios moved to dismiss all counts of the Complaint, contending, among other things, that section 546(e) of the Bankruptcy Code provides a complete defense.
The Bankruptcy Court denied the motion on July 1, 2005. Accordingly, the Subject Portfolios filed an answer to the Complaint on July 29, 2005. The Subject Portfolios moved for leave to pursue an immediate appeal (the "Appeal") of the Bankruptcy Court's decision to the District Court.
The Subject Portfolios motion for leave to appeal the denial of defendants' motion to dismiss that has been pending for over 18 months. On January 25, 2008, the United States District Court of Southern New York denied the motion for leave to appeal the bankruptcy court's denial of our motion to dismiss. The court found there were questions of fact that still needed to be resolved. Expert depositions are expected to be taken through the second quarter of 2008. A motion for summary judgment is being prepared for trial. Settlements are being monitored as they are announced.
61
PORTFOLIO OF INVESTMENTS
ING VP BALANCED PORTFOLIO AS OF DECEMBER 31, 2007
| Shares | | | | | |
Value | |
| COMMON STOCK: 58.5% | | | |
| | | | | Advertising: 0.6% | |
| | 1,402 | | | @ | | Getty Images, Inc. | | $ | 40,658 | | |
| | 1,800 | | | @,L | | inVentiv Health, Inc. | | | 55,728 | | |
| | 125,000 | | | | | Omnicom Group | | | 5,941,250 | | |
| | | | 6,037,636 | | |
| | | | | Aerospace/Defense: 2.8% | |
| | 4,230 | | | @,L | | BE Aerospace, Inc. | | | 223,767 | | |
| | 4,400 | | | | | Curtiss-Wright Corp. | | | 220,880 | | |
| | 2,500 | | | L | | DRS Technologies, Inc. | | | 135,675 | | |
| | 1,300 | | | @,L | | Esterline
Technologies Corp. | | | 67,275 | | |
| | 46,500 | | | | | General Dynamics Corp. | | | 4,138,035 | | |
| | 46,500 | | | L | | L-3 Communications
Holdings, Inc. | | | 4,926,210 | | |
| | 45,900 | | | L | | Lockheed Martin Corp. | | | 4,831,434 | | |
| | 1,500 | | | @,L | | Moog, Inc. | | | 68,715 | | |
| | 108,000 | | | | | Northrop Grumman Corp. | | | 8,493,120 | | |
| | 2,500 | | | @,L | | Teledyne Technologies, Inc. | | | 133,325 | | |
| | 500 | | | L | | Triumph Group, Inc. | | | 41,175 | | |
| | 86,910 | | | | | United Technologies Corp. | | | 6,652,091 | | |
| | | | 29,931,702 | | |
| | | | | Agriculture: 0.8% | |
| | 6,600 | | | @ | | Alliance One
International, Inc. | | | 26,862 | | |
| | 76,405 | | | | | Altria Group, Inc. | | | 5,774,690 | | |
| | 1,000 | | | | | Andersons, Inc. | | | 44,800 | | |
| | 3,100 | | | L | | Universal Corp. | | | 158,782 | | |
| | 39,400 | | | L | | UST, Inc. | | | 2,159,120 | | |
| | | | 8,164,254 | | |
| | | | | Airlines: 0.0% | |
| | 2,600 | | | @,L | | Frontier Airlines
Holdings, Inc. | | | 13,676 | | |
| | 5,295 | | | | | Skywest, Inc. | | | 142,171 | | |
| | | | 155,847 | | |
| | | | | Apparel: 1.0% | |
| | 5,000 | | | @,L | | CROCS, Inc. | | | 184,050 | | |
| | 861 | | | @,L | | Deckers Outdoor Corp. | | | 133,507 | | |
| | 6,800 | | | @,L | | Iconix Brand Group, Inc. | | | 133,688 | | |
| | 1,400 | | | L | | Kellwood Co. | | | 23,296 | | |
| | 900 | | | @,L | | Maidenform Brands, Inc. | | | 12,177 | | |
| | 141,800 | | | | | Nike, Inc. | | | 9,109,232 | | |
| | 2,800 | | | @,L | | Skechers USA, Inc. | | | 54,628 | | |
| | 1,600 | | | @,L | | Volcom, Inc. | | | 35,248 | | |
| | 6,600 | | | @,L | | Warnaco Group, Inc. | | | 229,680 | | |
| | 5,600 | | | | | Wolverine World Wide, Inc. | | | 137,312 | | |
| | | | 10,052,818 | | |
| | | | | Auto Manufacturers: 0.1% | |
| | 11,000 | | | L | | Oshkosh Truck Corp. | | | 519,860 | | |
| | 1,400 | | | | | Wabash National Corp. | | | 10,766 | | |
| | | | 530,626 | | |
| | | | | Auto Parts & Equipment: 0.1% | |
| | 6,800 | | | | | BorgWarner, Inc. | | | 329,188 | | |
| | 6,800 | | | @,L | | Lear Corp. | | | 188,088 | | |
| | 1,400 | | | | | Superior
Industries International | | | 25,438 | | |
| | | | 542,714 | | |
| Shares | | | | | |
Value | |
| | | | | Banks: 1.9% | |
| | 1,000 | | | I,L | | Alabama
National Bancorp. | | $ | 77,810 | | |
| | 10,300 | | | L | | Associated Banc-Corp. | | | 279,027 | | |
| | 1,913 | | | | | Bank Mutual Corp. | | | 20,220 | | |
| | 58,235 | | | | | Bank of America Corp. | | | 2,402,776 | | |
| | 51,300 | | | | | BB&T Corp. | | | 1,573,371 | | |
| | 7,700 | | | L | | Boston Private
Financial Holdings, Inc. | | | 208,516 | | |
| | 2,300 | | | L | | Cascade Bancorp. | | | 32,016 | | |
| | 10,000 | | | L | | Cathay General Bancorp. | | | 264,900 | | |
| | 2,900 | | | L | | Central Pacific
Financial Corp. | | | 53,534 | | |
| | 30,700 | | | L | | Colonial BancGroup, Inc. | | | 415,678 | | |
| | 8,100 | | | | | Commerce Bancorp., Inc. | | | 308,934 | | |
| | 1,500 | | | | | Community Bank
System, Inc. | | | 29,805 | | |
| | 3,700 | | | L | | Corus Bankshares, Inc. | | | 39,479 | | |
| | 6,292 | | | L | | East-West Bancorp., Inc. | | | 152,455 | | |
| | 3,800 | | | @@,L | | First Bancorp. | | | 27,702 | | |
| | 800 | | | | | First Indiana Corp. | | | 25,600 | | |
| | 10,700 | | | L | | FirstMerit Corp. | | | 214,107 | | |
| | 3,600 | | | L | | Fremont General Corp. | | | 12,600 | | |
| | 10,100 | | | L | | Frontier Financial Corp. | | | 187,557 | | |
| | 700 | | | L | | Glacier Bancorp., Inc. | | | 13,118 | | |
| | 5,300 | | | L | | Hanmi Financial Corp. | | | 45,686 | | |
| | 1,500 | | | | | Independent Bank Corp. | | | 14,250 | | |
| | 98,200 | | | L | | Marshall & Ilsley Corp. | | | 2,600,336 | | |
| | 2,700 | | | | | Nara Bancorp., Inc. | | | 31,509 | | |
| | 2,300 | | | L | | Provident Bankshares Corp. | | | 49,197 | | |
| | 107,300 | | | L | | Regions Financial Corp. | | | 2,537,645 | | |
| | 1,800 | | | @,L | | Signature Bank | | | 60,750 | | |
| | 10,300 | | | L | | South Financial Group, Inc. | | | 160,989 | | |
| | 1,500 | | | L | | Sterling Bancshares, Inc. | | | 16,740 | | |
| | 2,900 | | | L | | Susquehanna
Bancshares, Inc. | | | 53,476 | | |
| | 15,000 | | | @ | | Synovus Financial Corp. | | | 152,775 | | |
| | 1,200 | | | | | TCF Financial Corp. | | | 21,516 | | |
| | 9,100 | | | | | UCBH Holdings, Inc. | | | 128,856 | | |
| | 2,030 | | | | | UMB Financial Corp. | | | 77,871 | | |
| | 1,500 | | | L | | Umpqua Holdings Corp. | | | 23,010 | | |
| | 1,100 | | | L | | United Bankshares, Inc. | | | 30,822 | | |
| | 900 | | | L | | United Community
Banks, Inc. | | | 14,220 | | |
| | 18,250 | | | L | | Wachovia Corp. | | | 694,048 | | |
| | 5,500 | | | L | | Webster Financial Corp. | | | 175,835 | | |
| | 222,400 | | | L | | Wells Fargo & Co. | | | 6,714,256 | | |
| | 600 | | | L | | Whitney Holding Corp. | | | 15,690 | | |
| | 2,500 | | | | | Wilshire Bancorp., Inc. | | | 19,625 | | |
| | 800 | | | L | | Wintrust Financial Corp. | | | 26,504 | | |
| | | | 20,004,811 | | |
| | | | | Beverages: 2.0% | |
| | 132,500 | | | | | Anheuser-Busch Cos., Inc. | | | 6,935,050 | | |
| | 71,500 | | | @ | | Constellation Brands, Inc. | | | 1,690,260 | | |
| | 1,800 | | | @,L | | Hansen Natural Corp. | | | 79,722 | | |
| | 50,200 | | | | | Pepsi Bottling Group, Inc. | | | 1,980,892 | | |
| | 13,500 | | | | | PepsiAmericas, Inc. | | | 449,820 | | |
| | 135,600 | | | | | PepsiCo, Inc. | | | 10,292,040 | | |
| | | | 21,427,784 | | |
| | | | | Biotechnology: 0.3% | |
| | 1,500 | | | @,L | | Affymetrix, Inc. | | | 34,710 | | |
| | 2,400 | | | @,L | | Arqule, Inc. | | | 13,920 | | |
See Accompanying Notes to Financial Statements
62
PORTFOLIO OF INVESTMENTS
ING VP BALANCED PORTFOLIO AS OF DECEMBER 31, 2007 (CONTINUED)
| Shares | | | | | |
Value | |
| | | | | Biotechnology (continued) | |
| | 900 | | | @,L | | Charles River Laboratories
International, Inc. | | $ | 59,220 | | |
| | 4,500 | | | @,L | | CryoLife, Inc. | | | 35,775 | | |
| | 2,800 | | | @,L | | Enzo Biochem, Inc. | | | 35,672 | | |
| | 3,400 | | | @,L | | Invitrogen Corp. | | | 317,594 | | |
| | 1,630 | | | @,L | | Lifecell Corp. | | | 70,269 | | |
| | 2,700 | | | @,L | | Martek Biosciences Corp. | | | 79,866 | | |
| | 18,700 | | | @,L | | Millennium
Pharmaceuticals, Inc. | | | 280,126 | | |
| | 19,900 | | | @ | | Millipore Corp. | | | 1,456,282 | | |
| | 7,300 | | | @,L | | PDL BioPharma, Inc. | | | 127,896 | | |
| | 2,600 | | | @,L | | Regeneron
Pharmaceuticals, Inc. | | | 62,790 | | |
| | 4,600 | | | @,L | | Vertex Pharmaceuticals, Inc. | | | 106,858 | | |
| | | | 2,680,978 | | |
| | | | | Building Materials: 0.0% | |
| | 4,700 | | | L | | Apogee Enterprises, Inc. | | | 80,417 | | |
| | 1,700 | | | @,L | | Drew Industries, Inc. | | | 46,580 | | |
| | 1,000 | | | | | Gibraltar Industries, Inc. | | | 15,420 | | |
| | 5,200 | | | | | Lennox International, Inc. | | | 215,384 | | |
| | 1,300 | | | @,L | | NCI Building Systems, Inc. | | | 37,427 | | |
| | 800 | | | L | | Texas Industries, Inc. | | | 56,080 | | |
| | 600 | | | L | | Universal Forest
Products, Inc. | | | 17,676 | | |
| | | | 468,984 | | |
| | | | | Chemicals: 1.2% | |
| | 3,300 | | | | | Air Products &
Chemicals, Inc. | | | 325,479 | | |
| | 4,900 | | | | | Airgas, Inc. | | | 255,339 | | |
| | 700 | | | L | | Albemarle Corp. | | | 28,875 | | |
| | 9,500 | | | L | | Cabot Corp. | | | 316,730 | | |
| | 2,200 | | | L | | CF Industries Holdings, Inc. | | | 242,132 | | |
| | 700 | | | L | | Cytec Industries, Inc. | | | 43,106 | | |
| | 27,700 | | | | | Ecolab, Inc. | | | 1,418,517 | | |
| | 3,200 | | | L | | HB Fuller Co. | | | 71,840 | | |
| | 4,700 | | | | | Lubrizol Corp. | | | 254,552 | | |
| | 3,150 | | | L | | Minerals Technologies, Inc. | | | 210,893 | | |
| | 49,400 | | | | | Monsanto Co. | | | 5,517,486 | | |
| | 13,400 | | | L | | Olin Corp. | | | 259,022 | | |
| | 2,200 | | | @,L | | OM Group, Inc. | | | 126,588 | | |
| | 500 | | | L | | Penford Corp. | | | 12,795 | | |
| | 3,221 | | | @ | | PolyOne Corp. | | | 21,194 | | |
| | 3,700 | | | | | Praxair, Inc. | | | 328,227 | | |
| | 1,025 | | | | | Quaker Chemical Corp. | | | 22,519 | | |
| | 3,100 | | | L | | Schulman A, Inc. | | | 66,805 | | |
| | 648 | | | | | Sensient Technologies Corp. | | | 18,461 | | |
| | 50,000 | | | L | | Sigma-Aldrich Corp. | | | 2,730,000 | | |
| | 4,800 | | | @,L | | Terra Industries, Inc. | | | 229,248 | | |
| | 3,100 | | | L | | Tronox, Inc. | | | 26,815 | | |
| | 911 | | | | | Valspar Corp. | | | 20,662 | | |
| | 1,600 | | | @,L | | Zep, Inc. | | | 22,192 | | |
| | | | 12,569,477 | | |
| | | | | Coal: 0.0% | |
| | 2,200 | | | L | | Arch Coal, Inc. | | | 98,846 | | |
| | 6,500 | | | L | | Massey Energy Co. | | | 232,375 | | |
| | 1,500 | | | @,L | | Patriot Coal Corp. | | | 62,610 | | |
| | | | 393,831 | | |
| Shares | | | | | |
Value | |
| | | | | Commercial Services: 1.1% | |
| | 1,700 | | | L | | Aaron Rents, Inc. | | $ | 32,708 | | |
| | 1,000 | | | | | ABM Industries, Inc. | | | 20,390 | | |
| | 1,300 | | | L | | Administaff, Inc. | | | 36,764 | | |
| | 3,700 | | | @,L | | Alliance Data Systems Corp. | | | 277,463 | | |
| | 1,041 | | | @ | | AMN Healthcare
Services, Inc. | | | 17,874 | | |
| | 4,900 | | | @ | | Apollo Group, Inc.-Class A | | | 343,735 | | |
| | 2,300 | | | L | | Arbitron, Inc. | | | 95,611 | | |
| | 1,100 | | | @,L | | Bankrate, Inc. | | | 52,899 | | |
| | 2,000 | | | L | | Bowne & Co., Inc. | | | 35,200 | | |
| | 1,600 | | | @ | | Bright Horizons Family
Solutions, Inc. | | | 55,264 | | |
| | 3,400 | | | @,L | | Career Education Corp. | | | 85,476 | | |
| | 1,400 | | | | | CDI Corp. | | | 33,964 | | |
| | 2,100 | | | L | | Chemed Corp. | | | 117,348 | | |
| | 3,900 | | | @,W,L | | ChoicePoint, Inc. | | | 142,038 | | |
| | 300 | | | @,L | | Consolidated Graphics, Inc. | | | 14,346 | | |
| | 1,700 | | | @,L | | Corinthian Colleges, Inc. | | | 26,180 | | |
| | 600 | | | L | | CPI Corp. | | | 14,130 | | |
| | 1,100 | | | L | | Deluxe Corp. | | | 36,179 | | |
| | 3,700 | | | L | | DeVry, Inc. | | | 192,252 | | |
| | 4,300 | | | @,L | | Gartner, Inc. | | | 75,508 | | |
| | 2,250 | | | L | | Healthcare Services Group | | | 47,655 | | |
| | 700 | | | L | | Heidrick & Struggles
International, Inc. | | | 25,977 | | |
| | 2,000 | | | @,L | | ITT Educational Services, Inc. | | | 170,540 | | |
| | 500 | | | @,L | | Kendle International, Inc. | | | 24,460 | | |
| | 3,500 | | | @,L | | Live Nation, Inc. | | | 50,820 | | |
| | 5,700 | | | | | Manpower, Inc. | | | 324,330 | | |
| | 3,000 | | | L | | MAXIMUS, Inc. | | | 115,830 | | |
| | 26,100 | | | | | McKesson Corp. | | | 1,709,811 | | |
| | 1,500 | | | @,L | | Midas, Inc. | | | 21,990 | | |
| | 6,500 | | | @,L | | MPS Group, Inc. | | | 71,110 | | |
| | 1,400 | | | @,L | | Parexel International Corp. | | | 67,620 | | |
| | 600 | | | @,L | | Pharmanet
Development Group | | | 23,526 | | |
| | 1,100 | | | @,L | | Pre-Paid Legal Services, Inc. | | | 60,885 | | |
| | 8,700 | | | L | | Robert Half
International, Inc. | | | 235,248 | | |
| | 3,300 | | | L | | Rollins, Inc. | | | 63,360 | | |
| | 81,800 | | | | | RR Donnelley & Sons Co. | | | 3,087,132 | | |
| | 2,610 | | | | | Service Corp. International | | | 36,825 | | |
| | 7,009 | | | L | | Sotheby's | | | 267,043 | | |
| | 7,900 | | | @,L | | Spherion Corp. | | | 57,512 | | |
| | 600 | | | | | Strayer Education, Inc. | | | 102,348 | | |
| | 3,300 | | | @,L | | TrueBlue, Inc. | | | 47,784 | | |
| | 3,200 | | | @ | | United Rentals, Inc. | | | 58,752 | | |
| | 6,100 | | | @,L | | Valassis
Communications, Inc. | | | 71,309 | | |
| | 1,550 | | | @ | | Volt Information
Sciences, Inc. | | | 28,303 | | |
| | 2,800 | | | | | Watson Wyatt
Worldwide, Inc. | | | 129,948 | | |
| | 117,200 | | | | | Western Union Co. | | | 2,845,616 | | |
| | 1,960 | | | @ | | Wright Express Corp. | | | 69,560 | | |
| | | | 11,520,623 | | |
| | | | | Computers: 2.6% | |
| | 5,100 | | | @ | | Affiliated Computer
Services, Inc. | | | 230,010 | | |
| | 600 | | | @,L | | Ansoft Corp. | | | 15,510 | | |
| | 42,200 | | | @ | | Apple, Inc. | | | 8,358,976 | | |
| | 2,590 | | | @,L | | CACI International, Inc. | | | 115,954 | | |
| | 5,900 | | | @ | | Ciber, Inc. | | | 36,049 | | |
See Accompanying Notes to Financial Statements
63
PORTFOLIO OF INVESTMENTS
ING VP BALANCED PORTFOLIO AS OF DECEMBER 31, 2007 (CONTINUED)
| Shares | | | | | |
Value | |
| | | | | Computers (continued) | |
| | 309,000 | | | @ | | Dell, Inc. | | $ | 7,573,590 | | |
| | 2,201 | | | | | Diebold, Inc. | | | 63,785 | | |
| | 5,900 | | | @,L | | DST Systems, Inc. | | | 487,045 | | |
| | 76,800 | | | @ | | EMC Corp. | | | 1,423,104 | | |
| | 2,400 | | | | | Factset Research
Systems, Inc. | | | 133,680 | | |
| | 135,500 | | | | | Hewlett-Packard Co. | | | 6,840,040 | | |
| | 1,000 | | | @,L | | Hutchinson Technology, Inc. | | | 26,320 | | |
| | 6,350 | | | | | International Business
Machines Corp. | | | 686,435 | | |
| | 12,300 | | | L | | Jack Henry & Associates, Inc. | | | 299,382 | | |
| | 1,700 | | | @,L | | Manhattan Associates, Inc. | | | 44,812 | | |
| | 1,600 | | | @,L | | Mercury Computer
Systems, Inc. | | | 25,776 | | |
| | 3,237 | | | @,L | | Micros Systems, Inc. | | | 227,108 | | |
| | 5,400 | | | @ | | NCR Corp. | | | 135,540 | | |
| | 2,600 | | | @,L | | Radiant Systems, Inc. | | | 44,798 | | |
| | 500 | | | @,L | | SI International, Inc. | | | 13,735 | | |
| | 4,134 | | | @,L | | SRA International, Inc. | | | 121,746 | | |
| | 1,978 | | | @,L | | Stratasys, Inc. | | | 51,112 | | |
| | 2,600 | | | @,L | | SYKES Enterprises, Inc. | | | 46,800 | | |
| | 1,400 | | | @,L | | Synaptics, Inc. | | | 57,624 | | |
| | 9,700 | | | @ | | Synopsys, Inc. | | | 251,521 | | |
| | 12,800 | | | @,L | | Western Digital Corp. | | | 386,688 | | |
| | | | 27,697,140 | | |
| | | | | Cosmetics/Personal Care: 0.5% | |
| | 8,900 | | | | | Alberto-Culver Co. | | | 218,406 | | |
| | 1,800 | | | @,L | | Chattem, Inc. | | | 135,972 | | |
| | 17,000 | | | | | Colgate-Palmolive Co. | | | 1,325,320 | | |
| | 53,792 | | | | | Procter & Gamble Co. | | | 3,949,409 | | |
| | | | 5,629,107 | | |
| | | | | Distribution/Wholesale: 0.1% | |
| | 5,000 | | | @,L | | Brightpoint, Inc. | | | 76,800 | | |
| | 7,112 | | | L | | Fastenal Co. | | | 287,467 | | |
| | 4,000 | | | @ | | Ingram Micro, Inc. | | | 72,160 | | |
| | 7,252 | | | @,L | | LKQ Corp. | | | 152,437 | | |
| | 400 | | | L | | Owens & Minor, Inc. | | | 16,972 | | |
| | 1,800 | | | @,L | | Scansource, Inc. | | | 58,230 | | |
| | 1,273 | | | @ | | Tech Data Corp. | | | 48,126 | | |
| | 1,100 | | | @,L | | United Stationers, Inc. | | | 50,831 | | |
| | 900 | | | L | | Watsco, Inc. | | | 33,084 | | |
| | | | 796,107 | | |
| | | | | | | Diversified Financial
Services: 2.0% | | | | | |
| | 15,100 | | | @,L | | AmeriCredit Corp. | | | 193,129 | | |
| | 15,100 | | | | | Charles Schwab Corp. | | | 385,805 | | |
| | 33,365 | | | | | Citigroup, Inc. | | | 982,266 | | |
| | 23,600 | | | L | | Countrywide Financial Corp. | | | 210,984 | | |
| | 6,700 | | | L | | Eaton Vance Corp. | | | 304,247 | | |
| | 32,200 | | | | | Federated Investors, Inc. | | | 1,325,352 | | |
| | 3,700 | | | | | Financial Federal Corp. | | | 82,473 | | |
| | 54,350 | | | L | | Goldman Sachs Group, Inc. | | | 11,687,968 | | |
| | 3,500 | | | L | | IndyMac Bancorp., Inc. | | | 20,825 | | |
| | 3,800 | | | @,L | | Investment Technology
Group, Inc. | | | 180,842 | | |
| | 5,600 | | | L | | Jefferies Group, Inc. | | | 129,080 | | |
| | 30,900 | | | | | JPMorgan Chase & Co. | | | 1,348,785 | | |
| | 6,500 | | | @,L | | LaBranche & Co., Inc. | | | 32,760 | | |
| | 16,400 | | | L | | Lehman Brothers
Holdings, Inc. | | | 1,073,216 | | |
| | 45,700 | | | | | Morgan Stanley | | | 2,427,127 | | |
| Shares | | | | | |
Value | |
| | 4,200 | | | L | | OptionsXpress
Holdings, Inc. | | $ | 142,044 | | |
| | 1,000 | | | @,L | | Piper Jaffray Cos. | | | 46,320 | | |
| | 700 | | | @,L | | Portfolio Recovery
Associates, Inc. | | | 27,769 | | |
| | 15,000 | | | | | Raymond James
Financial, Inc. | | | 489,900 | | |
| | 16,700 | | | | | SLM Corp. | | | 336,338 | | |
| | 5,650 | | | L | | SWS Group, Inc. | | | 71,586 | | |
| | 1,400 | | | @,L | | TradeStation Group, Inc. | | | 19,894 | | |
| | 1,300 | | | | | Waddell & Reed
Financial, Inc. | | | 46,917 | | |
| | 400 | | | @,L | | World Acceptance, Corp. | | | 10,792 | | |
| | | | 21,576,419 | | |
| | | | | Electric: 2.3% | |
| | 8,400 | | | L | | Alliant Energy Corp. | | | 341,796 | | |
| | 17,500 | | | @ | | Aquila, Inc. | | | 65,275 | | |
| | 600 | | | L | | Central Vermont Public
Service Corp. | | | 18,504 | | |
| | 8,700 | | | L | | Cleco Corp. | | | 241,860 | | |
| | 44,500 | | | | | Constellation Energy
Group, Inc. | | | 4,562,585 | | |
| | 92,800 | | | L | | Dominion Resources, Inc. | | | 4,403,360 | | |
| | 2,500 | | | @,L | | El Paso Electric Co. | | | 63,925 | | |
| | 7,300 | | | | | Energy East Corp. | | | 198,633 | | |
| | 60,600 | | | | | Entergy Corp. | | | 7,242,912 | | |
| | 1,500 | | | | | MDU Resources Group, Inc. | | | 41,415 | | |
| | 20,600 | | | | | Northeast Utilities | | | 644,986 | | |
| | 3,300 | | | L | | NSTAR | | | 119,526 | | |
| | 2,800 | | | | | OGE Energy Corp. | | | 101,612 | | |
| | 57,200 | | | | | Public Service Enterprise
Group, Inc. | | | 5,619,328 | | |
| | 5,300 | | | | | Puget Energy, Inc. | | | 145,379 | | |
| | 2,531 | | | W,L | | SCANA Corp. | | | 106,682 | | |
| | 11,000 | | | | | Sierra Pacific Resources | | | 186,780 | | |
| | 500 | | | | | Wisconsin Energy Corp. | | | 24,355 | | |
| | | | 24,128,913 | | |
| | | | | Electrical Components & Equipment: 0.1% | |
| | 2,100 | | | @,L | | Advanced Energy
Industries, Inc. | | | 27,468 | | |
| | 5,100 | | | W | | Ametek, Inc. | | | 238,884 | | |
| | 3,159 | | | | | Belden Cdt, Inc. | | | 140,576 | | |
| | 3,200 | | | @,L | | C&D Technologies, Inc. | | | 21,152 | | |
| | 300 | | | @,L | | Energizer Holdings, Inc. | | | 33,639 | | |
| | 2,700 | | | @,L | | Greatbatch, Inc. | | | 53,973 | | |
| | 4,700 | | | | | Hubbell, Inc. | | | 242,520 | | |
| | 1,600 | | | @ | | Littelfuse, Inc. | | | 52,736 | | |
| | | | 810,948 | | |
| | | | | Electronics: 1.3% | |
| | 8,300 | | | L | | Amphenol Corp. | | | 384,871 | | |
| | 900 | | | L | | Analogic Corp. | | | 60,948 | | |
| | 67,700 | | | L | | Applera Corp.-Applied
Biosystems Group | | | 2,296,384 | | |
| | 4,700 | | | @,L | | Arrow Electronics, Inc. | | | 184,616 | | |
| | 11,300 | | | @ | | Avnet, Inc. | | | 395,161 | | |
| | 4,400 | | | @,L | | Benchmark Electronics, Inc. | | | 78,012 | | |
| | 3,400 | | | | | Brady Corp. | | | 119,306 | | |
| | 2,800 | | | @,L | | Checkpoint Systems, Inc. | | | 72,744 | | |
| | 2,700 | | | L | | Cubic Corp. | | | 105,840 | | |
| | 1,700 | | | @,L | | Cymer, Inc. | | | 66,181 | | |
| | 1,387 | | | @,L | | Dionex Corp. | | | 114,927 | | |
See Accompanying Notes to Financial Statements
64
PORTFOLIO OF INVESTMENTS
ING VP BALANCED PORTFOLIO AS OF DECEMBER 31, 2007 (CONTINUED)
| Shares | | | | | |
Value | |
| | | | | Electronics (continued) | |
| | 3,500 | | | @,L | | Electro Scientific
Industries, Inc. | | $ | 69,475 | | |
| | 2,500 | | | @,L | | Faro Technologies, Inc. | | | 67,950 | | |
| | 2,000 | | | @,L | | FEI Co. | | | 49,660 | | |
| | 7,600 | | | @,L | | Flir Systems, Inc. | | | 237,880 | | |
| | 10,200 | | | | | Gentex Corp. | | | 181,254 | | |
| | 1,100 | | | @,L | | Itron, Inc. | | | 105,567 | | |
| | 1,300 | | | | | Keithley Instruments, Inc. | | | 12,584 | | |
| | 2,000 | | | @,L | | LoJack Corp. | | | 33,620 | | |
| | 4,600 | | | | | Methode Electronics, Inc. | | | 75,624 | | |
| | 7,900 | | | L | | National Instruments Corp. | | | 263,307 | | |
| | 1,600 | | | | | Park Electrochemical Corp. | | | 45,184 | | |
| | 2,300 | | | @,L | | Planar Systems, Inc. | | | 14,720 | | |
| | 2,100 | | | @ | | Plexus Corp. | | | 55,146 | | |
| | 600 | | | @,L | | Rogers Corp. | | | 26,022 | | |
| | 4,000 | | | | | Technitrol, Inc. | | | 114,320 | | |
| | 81,800 | | | @ | | Thermo Electron Corp. | | | 4,718,224 | | |
| | 6,500 | | | @,L | | Thomas & Betts Corp. | | | 318,760 | | |
| | 6,580 | | | @,L | | Trimble Navigation Ltd. | | | 198,979 | | |
| | 3,100 | | | @,L | | TTM Technologies, Inc. | | | 36,146 | | |
| | 2,800 | | | @,L | | Varian, Inc. | | | 182,840 | | |
| | 7,300 | | | @,L | | Vishay Intertechnology, Inc. | | | 83,293 | | |
| | 38,000 | | | @ | | Waters Corp. | | | 3,004,660 | | |
| | 1,600 | | | | | Woodward Governor Co. | | | 108,720 | | |
| | | | 13,882,925 | | |
| | | | | Energy-Alternate Sources: 0.0% | |
| | 7,600 | | | @,L | | Headwaters, Inc. | | | 89,224 | | |
| | | | 89,224 | | |
| | | | | Engineering & Construction: 0.1% | |
| | 4,100 | | | @ | | Dycom Industries, Inc. | | | 109,265 | | |
| | 8,500 | | | @ | | EMCOR Group, Inc. | | | 200,855 | | |
| | 5,100 | | | | | Granite Construction, Inc. | | | 184,518 | | |
| | 8,721 | | | @ | | KBR, Inc. | | | 338,375 | | |
| | 4,900 | | | @ | | Shaw Group, Inc. | | | 296,156 | | |
| | 2,587 | | | @ | | URS Corp. | | | 140,552 | | |
| | | | 1,269,721 | | |
| | | | | Entertainment: 0.0% | |
| | 7,900 | | | @,L | | Macrovision Corp. | | | 144,807 | | |
| | 1,000 | | | @,L | | Pinnacle Entertainment, Inc. | | | 23,560 | | |
| | 1,100 | | | @,L | | Scientific Games Corp. | | | 36,575 | | |
| | 2,700 | | | @,L | | Shuffle Master, Inc. | | | 32,373 | | |
| | | | 237,315 | | |
| | | | | Environmental Control: 0.0% | |
| | 1,200 | | | @,L | | Tetra Tech, Inc. | | | 25,800 | | |
| | 5,150 | | | @,L | | Waste Connections, Inc. | | | 159,135 | | |
| | | | 184,935 | | |
| | | | | Food: 0.5% | |
| | 3,400 | | | | | Corn Products
International, Inc. | | | 124,950 | | |
| | 5,300 | | | | | Flowers Foods, Inc. | | | 124,073 | | |
| | 81,417 | | | | | General Mills, Inc. | | | 4,640,769 | | |
| | 800 | | | @,L | | Great Atlantic &
Pacific Tea Co. | | | 25,064 | | |
| | 2,300 | | | @,L | | Hain Celestial Group, Inc. | | | 73,600 | | |
| | 1,479 | | | | | Hormel Foods Corp. | | | 59,870 | | |
| | 839 | | | | | JM Smucker Co. | | | 43,234 | | |
| | 1,000 | | | L | | Nash Finch Co. | | | 35,280 | | |
| Shares | | | | | |
Value | |
| | 600 | | | @ | | Performance Food
Group Co. | | $ | 16,122 | | |
| | 900 | | | @ | | Ralcorp Holdings, Inc. | | | 54,711 | | |
| | 8,200 | | | | | Ruddick Corp. | | | 284,294 | | |
| | 500 | | | L | | Sanderson Farms, Inc. | | | 16,890 | | |
| | 4,600 | | | @,L | | Smithfield Foods, Inc. | | | 133,032 | | |
| | 1,100 | | | L | | Spartan Stores, Inc. | | | 25,135 | | |
| | 2,600 | | | @,L | | TreeHouse Foods, Inc. | | | 59,774 | | |
| | 800 | | | @,L | | United Natural Foods, Inc. | | | 25,376 | | |
| | | | 5,742,174 | | |
| | | | | Forest Products & Paper: 0.0% | |
| | 8,100 | | | @,L | | Buckeye Technologies, Inc. | | | 101,250 | | |
| | 1,400 | | | L | | Neenah Paper, Inc. | | | 40,810 | | |
| | 5,300 | | | L | | Rock-Tenn Co. | | | 134,673 | | |
| | 800 | | | L | | Schweitzer-Mauduit
International, Inc. | | | 20,728 | | |
| | 2,900 | | | L | | Wausau Paper Corp. | | | 26,071 | | |
| | | | 323,532 | | |
| | | | | Gas: 0.2% | |
| | 1,700 | | | | | Atmos Energy Corp. | | | 47,668 | | |
| | 8,930 | | | | | Energen Corp. | | | 573,574 | | |
| | 817 | | | | | Laclede Group, Inc. | | | 27,974 | | |
| | 1,979 | | | L | | New Jersey Resources Corp. | | | 98,990 | | |
| | 4,500 | | | L | | Northwest Natural Gas Co. | | | 218,970 | | |
| | 4,322 | | | L | | Piedmont Natural Gas Co. | | | 113,064 | | |
| | 1,300 | | | L | | South Jersey Industries, Inc. | | | 46,917 | | |
| | 4,900 | | | | | Southern Union Co. | | | 143,864 | | |
| | 1,529 | | | | | Southwest Gas Corp. | | | 45,346 | | |
| | 7,830 | | | | | UGI Corp. | | | 213,368 | | |
| | 10,450 | | | L | | Vectren Corp. | | | 303,155 | | |
| | 11,200 | | | | | WGL Holdings, Inc. | | | 366,912 | | |
| | | | 2,199,802 | | |
| | | | | Hand/Machine Tools: 0.3% | |
| | 5,500 | | | | | Baldor Electric Co. | | | 185,130 | | |
| | 19,500 | | | | | Black & Decker Corp. | | | 1,358,175 | | |
| | 1,928 | | | | | Kennametal, Inc. | | | 72,994 | | |
| | 900 | | | | | Lincoln Electric
Holdings, Inc. | | | 64,062 | | |
| | 1,454 | | | | | Regal-Beloit Corp. | | | 65,357 | | |
| | 23,100 | | | | | Snap-On, Inc. | | | 1,114,344 | | |
| | | | 2,860,062 | | |
| | | | | Healthcare-Products: 0.6% | |
| | 2,900 | | | @,L | | American Medical Systems
Holdings, Inc. | | | 41,934 | | |
| | 1,400 | | | @,L | | Arthrocare Corp. | | | 67,270 | | |
| | 1,700 | | | L | | Cooper Cos., Inc. | | | 64,600 | | |
| | 2,200 | | | @,L | | Cyberonics | | | 28,952 | | |
| | 17,544 | | | | | Densply International, Inc. | | | 789,831 | | |
| | 4,500 | | | @,L | | Edwards Lifesciences Corp. | | | 206,955 | | |
| | 3,500 | | | @,L | | Gen-Probe, Inc. | | | 220,255 | | |
| | 1,700 | | | @,L | | Haemonetics Corp. | | | 107,134 | | |
| | 5,636 | | | @,L | | Henry Schein, Inc. | | | 346,050 | | |
| | 3,052 | | | @,L | | Hologic, Inc. | | | 209,489 | | |
| | 1,200 | | | @,L | | ICU Medical, Inc. | | | 43,212 | | |
| | 2,672 | | | @ | | Idexx Laboratories, Inc. | | | 156,659 | | |
| | 3,400 | | | @,L | | Immucor, Inc. | | | 115,566 | | |
| | 1,800 | | | @,L | | Intuitive Surgical, Inc. | | | 584,100 | | |
| | 1,000 | | | | | Invacare Corp. | | | 25,200 | | |
| | 39,300 | | | | | Johnson & Johnson | | | 2,621,310 | | |
See Accompanying Notes to Financial Statements
65
PORTFOLIO OF INVESTMENTS
ING VP BALANCED PORTFOLIO AS OF DECEMBER 31, 2007 (CONTINUED)
| Shares | | | | | |
Value | |
| | | | | Healthcare-Products (continued) | |
| | 3,190 | | | @,L | | Kinetic Concepts, Inc. | | $ | 170,856 | | |
| | 2,400 | | | L | | LCA-Vision, Inc. | | | 47,928 | | |
| | 900 | | | L | | Mentor Corp. | | | 35,190 | | |
| | 1,700 | | | L | | Meridian Bioscience, Inc. | | | 51,136 | | |
| | 1,850 | | | @ | | Merit Medical Systems, Inc. | | | 25,715 | | |
| | 2,200 | | | @ | | Osteotech, Inc. | | | 17,204 | | |
| | 900 | | | @,L | | Palomar Medical
Technologies, Inc. | | | 13,788 | | |
| | 4,700 | | | @,L | | PSS World Medical, Inc. | | | 91,979 | | |
| | 3,457 | | | @ | | Respironics, Inc. | | | 226,364 | | |
| | 858 | | | | | Steris Corp. | | | 25,021 | | |
| | 300 | | | @,L | | SurModics, Inc. | | | 16,281 | | |
| | 1,100 | | | @,L | | Symmetry Medical, Inc. | | | 19,173 | | |
| | 2,000 | | | @ | | Techne Corp. | | | 132,100 | | |
| | 1,500 | | | @,L | | Ventana Medical Systems | | | 130,845 | | |
| | | | 6,632,097 | | |
| | | | | Healthcare-Services: 2.0% | |
| | 82,800 | | | | | Aetna, Inc. | | | 4,780,044 | | |
| | 1,100 | | | @,L | | Amedisys, Inc. | | | 53,372 | | |
| | 4,000 | | | @,L | | AMERIGROUP Corp. | | | 145,800 | | |
| | 2,900 | | | @,L | | Amsurg Corp. | | | 78,474 | | |
| | 5,400 | | | @,L | | Apria Healthcare
Group, Inc. | | | 116,478 | | |
| | 3,200 | | | @,L | | Centene Corp. | | | 87,808 | | |
| | 3,200 | | | @,W | | Covance, Inc. | | | 277,184 | | |
| | 54,450 | | | @ | | Coventry Health Care, Inc. | | | 3,226,163 | | |
| | 1,600 | | | @,L | | Gentiva Health
Services, Inc. | | | 30,464 | | |
| | 7,900 | | | @ | | Health Net, Inc. | | | 381,570 | | |
| | 2,200 | | | @,L | | Healthways, Inc. | | | 128,568 | | |
| | 62,200 | | | @ | | Humana, Inc. | | | 4,684,282 | | |
| | 2,700 | | | @ | | LifePoint Hospitals, Inc. | | | 80,298 | | |
| | 4,200 | | | @,L | | Lincare Holdings, Inc. | | | 147,672 | | |
| | 1,000 | | | @,L | | Matria Healthcare, Inc. | | | 23,770 | | |
| | 1,500 | | | @,L | | Medcath Corp. | | | 36,840 | | |
| | 1,800 | | | @,L | | Molina Healthcare, Inc. | | | 69,660 | | |
| | 3,000 | | | @,L | | Pediatrix Medical
Group, Inc. | | | 204,450 | | |
| | 800 | | | @,L | | RehabCare Group, Inc. | | | 18,048 | | |
| | 3,200 | | | @ | | Sierra Health Services, Inc. | | | 134,272 | | |
| | 2,000 | | | @,L | | Sunrise Senior Living, Inc. | | | 61,360 | | |
| | 73,800 | | | | | UnitedHealth Group, Inc. | | | 4,295,160 | | |
| | 900 | | | @,L | | WellCare Health Plans, Inc. | | | 38,169 | | |
| | 23,140 | | | @ | | WellPoint, Inc. | | | 2,030,072 | | |
| | | | 21,129,978 | | |
| | | | | Home Builders: 0.1% | |
| | 9,000 | | | @,L | | Champion Enterprises, Inc. | | | 84,780 | | |
| | 4,500 | | | @,L | | Hovnanian Enterprises, Inc. | | | 32,265 | | |
| | 3,500 | | | | | M/I Homes, Inc. | | | 36,750 | | |
| | 5,200 | | | L | | MDC Holdings, Inc. | | | 193,076 | | |
| | 300 | | | @,L | | NVR, Inc. | | | 157,200 | | |
| | 1,000 | | | L | | Skyline Corp. | | | 29,350 | | |
| | 7,877 | | | L | | Thor Industries, Inc. | | | 299,405 | | |
| | 2,700 | | | @,L | | Toll Brothers, Inc. | | | 54,162 | | |
| | 1,500 | | | L | | Winnebago Industries | | | 31,530 | | |
| | | | 918,518 | | |
| | | | | Home Furnishings: 0.0% | |
| | 2,500 | | | L | | Ethan Allen Interiors, Inc. | | | 71,250 | | |
| | 900 | | | @,L | | Universal Electronics, Inc. | | | 30,096 | | |
| | | | 101,346 | | |
| Shares | | | | | |
Value | |
| | | | | Household Products/Wares: 0.2% | |
| | 12,700 | | | | | American Greetings Corp. | | $ | 257,810 | | |
| | 2,500 | | | L | | Blyth, Inc. | | | 54,850 | | |
| | 3,200 | | | @,L | | Central Garden and Pet Co. | | | 17,152 | | |
| | 4,000 | | | @,L | | Fossil, Inc. | | | 167,920 | | |
| | 17,200 | | | | | Kimberly-Clark Corp. | | | 1,192,648 | | |
| | 5,500 | | | @,L | | Spectrum Brands, Inc. | | | 29,315 | | |
| | 4,620 | | | L | | Tupperware Corp. | | | 152,599 | | |
| | 400 | | | | | WD-40 Co. | | | 15,188 | | |
| | | | 1,887,482 | | |
| | | | | Housewares: 0.0% | |
| | 2,400 | | | L | | Toro Co. | | | 130,656 | | |
| | | | 130,656 | | |
| | | | | Insurance: 5.2% | |
| | 121,200 | | | @@ | | ACE Ltd. | | | 7,487,736 | | |
| | 66,800 | | | | | Allstate Corp. | | | 3,488,964 | | |
| | 12,075 | | | L | | American Financial
Group, Inc. | | | 348,726 | | |
| | 176,200 | | | | | American International
Group, Inc. | | | 10,272,460 | | |
| | 10,800 | | | L | | Brown & Brown, Inc. | | | 253,800 | | |
| | 147,300 | | | | | Chubb Corp. | | | 8,039,634 | | |
| | 2,100 | | | L | | Commerce Group, Inc. | | | 75,558 | | |
| | 4,000 | | | | | Delphi Financial Group | | | 141,120 | | |
| | 7,300 | | | @@ | | Everest Re Group Ltd. | | | 732,920 | | |
| | 1,800 | | | | | First American Corp. | | | 61,416 | | |
| | 4,300 | | | L | | Hanover Insurance
Group, Inc. | | | 196,940 | | |
| | 31,727 | | | | | Hartford Financial Services
Group, Inc. | | | 2,766,277 | | |
| | 13,100 | | | | | HCC Insurance
Holdings, Inc. | | | 375,708 | | |
| | 300 | | | L | | Hilb Rogal & Hobbs Co. | | | 12,171 | | |
| | 400 | | | | | Infinity Property &
Casualty Corp. | | | 14,452 | | |
| | 1,370 | | | L | | Landamerica Financial
Group, Inc. | | | 45,827 | | |
| | 900 | | | L | | Mercury General Corp. | | | 44,829 | | |
| | 69,150 | | | | | Metlife, Inc. | | | 4,261,023 | | |
| | 740 | | | @ | | Navigators Group, Inc. | | | 48,100 | | |
| | 5,190 | | | @ | | Philadelphia Consolidated
Holding Co. | | | 204,227 | | |
| | 2,300 | | | L | | Presidential Life Corp. | | | 40,273 | | |
| | 4,400 | | | @,L | | ProAssurance Corp. | | | 241,648 | | |
| | 2,100 | | | | | Protective Life Corp. | | | 86,142 | | |
| | 45,436 | | | | | Prudential Financial, Inc. | | | 4,227,365 | | |
| | 3,500 | | | L | | Radian Group, Inc. | | | 40,880 | | |
| | 3,500 | | | | | RLI Corp. | | | 198,765 | | |
| | 2,200 | | | L | | Safety Insurance Group, Inc. | | | 80,564 | | |
| | 6,060 | | | L | | Selective Insurance Group | | | 139,319 | | |
| | 3,300 | | | | | Stancorp Financial
Group, Inc. | | | 166,254 | | |
| | 900 | | | L | | Tower Group, Inc. | | | 30,060 | | |
| | 175,400 | | | | | Travelers Cos., Inc. | | | 9,436,520 | | |
| | 3,700 | | | L | | United Fire & Casualty Co. | | | 107,633 | | |
| | 4,500 | | | L | | Unitrin, Inc. | | | 215,955 | | |
| | 12,750 | | | | | WR Berkley Corp. | | | 380,078 | | |
| | 2,800 | | | L | | Zenith National
Insurance Corp. | | | 125,244 | | |
| | | | 54,388,588 | | |
See Accompanying Notes to Financial Statements
66
PORTFOLIO OF INVESTMENTS
ING VP BALANCED PORTFOLIO AS OF DECEMBER 31, 2007 (CONTINUED)
| Shares | | | | | |
Value | |
| | | | | Internet: 0.9% | |
| | 23,800 | | | @,L | | Amazon.com, Inc. | | $ | 2,204,832 | | |
| | 2,300 | | | @,L | | Blue Coat Systems, Inc. | | | 75,601 | | |
| | 1,700 | | | @,L | | Blue Nile, Inc. | | | 115,702 | | |
| | 5,131 | | | @,L | | Cybersource Corp. | | | 91,178 | | |
| | 1,660 | | | @,L | | DealerTrack Holdings, Inc. | | | 55,560 | | |
| | 8,700 | | | @,L | | Expedia, Inc. | | | 275,094 | | |
| | 5,900 | | | @ | | Google, Inc.-Class A | | | 4,079,732 | | |
| | 2,200 | | | @ | | Infospace, Inc. | | | 41,360 | | |
| | 4,000 | | | @,L | | j2 Global
Communications, Inc. | | | 84,680 | | |
| | 1,490 | | | @,L | | Knot, Inc. | | | 23,751 | | |
| | 8,675 | | | @ | | McAfee, Inc. | | | 325,313 | | |
| | 5,200 | | | @ | | Napster, Inc. | | | 10,244 | | |
| | 2,700 | | | @,L | | NetFlix, Inc. | | | 71,874 | | |
| | 2,100 | | | @ | | PC-Tel, Inc. | | | 14,406 | | |
| | 4,190 | | | @,L | | Perficient, Inc. | | | 65,951 | | |
| | 3,900 | | | @,L | | Secure Computing Corp. | | | 37,440 | | |
| | 1,300 | | | @,L | | Stamps.com, Inc. | | | 15,834 | | |
| | 74,700 | | | @,L | | Symantec Corp. | | | 1,205,658 | | |
| | 4,400 | | | L | | United Online, Inc. | | | 52,008 | | |
| | 1,400 | | | @ | | Valueclick, Inc. | | | 30,660 | | |
| | 3,600 | | | @,L | | Websense, Inc. | | | 61,128 | | |
| | | | 8,938,006 | | |
| | | | | Iron/Steel: 0.2% | |
| | 1,880 | | | L | | Cleveland-Cliffs, Inc. | | | 189,504 | | |
| | 1,300 | | | @ | | Material Sciences Corp. | | | 9,659 | | |
| | 3,900 | | | | | Reliance Steel &
Aluminum Co. | | | 211,380 | | |
| | 2,800 | | | | | Steel Dynamics, Inc. | | | 166,796 | | |
| | 12,300 | | | L | | United States Steel Corp. | | | 1,487,193 | | |
| | | | 2,064,532 | | |
| | | | | Leisure Time: 0.1% | |
| | 11,500 | | | L | | Callaway Golf Co. | | | 200,445 | | |
| | 2,700 | | | @,L | | Life Time Fitness, Inc. | | | 134,136 | | |
| | 3,750 | | | L | | Polaris Industries, Inc. | | | 179,138 | | |
| | 2,600 | | | @,L | | WMS Industries, Inc. | | | 95,264 | | |
| | | | 608,983 | | |
| | | | | Lodging: 0.1% | |
| | 8,200 | | | L | | Harrah's Entertainment, Inc. | | | 727,750 | | |
| | 600 | | | @,L | | Monarch Casino &
Resort, Inc. | | | 14,448 | | |
| | | | 742,198 | | |
| | | | | Machinery-Construction & Mining: 0.2% | |
| | 1,100 | | | @,L | | Astec Industries, Inc. | | | 40,909 | | |
| | 18,400 | | | | | Caterpillar, Inc. | | | 1,335,104 | | |
| | 7,400 | | | | | Joy Global, Inc. | | | 487,068 | | |
| | | | 1,863,081 | | |
| | | | | Machinery-Diversified: 0.7% | |
| | 6,580 | | | @,L | | AGCO Corp. | | | 447,308 | | |
| | 3,400 | | | L | | Applied Industrial
Technologies, Inc. | | | 98,668 | | |
| | 1,700 | | | L | | Briggs & Stratton Corp. | | | 38,522 | | |
| | 800 | | | | | Cascade Corp. | | | 37,168 | | |
| | 2,800 | | | L | | Cognex Corp. | | | 56,420 | | |
| | 39,000 | | | | | Cummins, Inc. | | | 4,967,430 | | |
| | 4,800 | | | | | Deere & Co. | | | 446,976 | | |
| | 1,600 | | | | | Flowserve Corp. | | | 153,920 | | |
| | 4,000 | | | @,L | | Gardner Denver, Inc. | | | 132,000 | | |
| Shares | | | | | |
Value | |
| | 800 | | | | | Graco, Inc. | | $ | 29,808 | | |
| | 4,400 | | | | | IDEX Corp. | | | 158,972 | | |
| | 1,000 | | | @,L | | Intevac, Inc. | | | 14,540 | | |
| | 700 | | | L | | Lindsay Manufacturing Co. | | | 49,483 | | |
| | 2,300 | | | L | | Nordson Corp. | | | 133,308 | | |
| | 1,000 | | | | | Robbins & Myers, Inc. | | | 75,630 | | |
| | 2,200 | | | L | | Wabtec Corp. | | | 75,768 | | |
| | 3,600 | | | @,L | | Zebra Technologies Corp. | | | 124,920 | | |
| | | | 7,040,841 | | |
| | | | | Media: 1.1% | |
| | 24,000 | | | | | Clear Channel
Communications, Inc. | | | 828,480 | | |
| | 4,500 | | | | | John Wiley & Sons, Inc. | | | 192,780 | | |
| | 3,900 | | | @,L | | Scholastic Corp. | | | 136,071 | | |
| | 65,400 | | | @ | | Viacom-Class B | | | 2,872,368 | | |
| | 238,400 | | | | | Walt Disney Co. | | | 7,695,552 | | |
| | | | 11,725,251 | | |
| | | | | Metal Fabricate/Hardware: 0.1% | |
| | 1,500 | | | L | | AM Castle & Co. | | | 40,785 | | |
| | 1,100 | | | L | | Kaydon Corp. | | | 59,994 | | |
| | 400 | | | | | Lawson Products | | | 15,168 | | |
| | 4,000 | | | | | Mueller Industries, Inc. | | | 115,960 | | |
| | 2,436 | | | | | Quanex Corp. | | | 126,428 | | |
| | 900 | | | | | Valmont Industries, Inc. | | | 80,208 | | |
| | 6,700 | | | L | | Worthington Industries | | | 119,796 | | |
| | | | 558,339 | | |
| | | | | Mining: 0.8% | |
| | 1,600 | | | L | | Amcol International Corp. | | | 57,648 | | |
| | 1,300 | | | @,L | | Brush Engineered
Materials, Inc. | | | 48,126 | | |
| | 1,000 | | | @,L | | Century Aluminum Co. | | | 53,940 | | |
| | 84,500 | | | | | Freeport-McMoRan
Copper & Gold, Inc. | | | 8,656,180 | | |
| | 600 | | | @,L | | RTI International Metals, Inc. | | | 41,358 | | |
| | | | 8,857,252 | | |
| | | | | Miscellaneous Manufacturing: 3.1% | |
| | 3,200 | | | L | | Acuity Brands, Inc. | | | 144,000 | | |
| | 1,300 | | | L | | AO Smith Corp. | | | 45,565 | | |
| | 4,144 | | | | | Aptargroup, Inc. | | | 169,531 | | |
| | 2,200 | | | L | | Barnes Group, Inc. | | | 73,458 | | |
| | 3,400 | | | | | Carlisle Cos., Inc. | | | 125,902 | | |
| | 1,900 | | | @,L | | Ceradyne, Inc. | | | 89,167 | | |
| | 2,900 | | | | | Clarcor, Inc. | | | 110,113 | | |
| | 7,100 | | | | | Crane Co. | | | 304,590 | | |
| | 81,200 | | | | | Danaher Corp. | | | 7,124,488 | | |
| | 76,600 | | | | | Dover Corp. | | | 3,530,494 | | |
| | 44,700 | | | | | Eaton Corp. | | | 4,333,665 | | |
| | 1,700 | | | @,L | | EnPro Industries, Inc. | | | 52,105 | | |
| | 275,515 | | | | | General Electric Co. | | | 10,213,341 | | |
| | 1,000 | | | | | Harsco Corp. | | | 64,070 | | |
| | 10,600 | | | | | Honeywell
International, Inc. | | | 652,642 | | |
| | 5,300 | | | | | Illinois Tool Works, Inc. | | | 283,762 | | |
| | 1,800 | | | @ | | Lydall, Inc. | | | 18,936 | | |
| | 900 | | | L | | Matthews International
Corp.-Class A | | | 42,183 | | |
| | 1,500 | | | | | Myers Industries, Inc. | | | 21,705 | | |
| | 48,400 | | | L | | Parker Hannifin Corp. | | | 3,645,004 | | |
| | 6,500 | | | L | | Pentair, Inc. | | | 226,265 | | |
See Accompanying Notes to Financial Statements
67
PORTFOLIO OF INVESTMENTS
ING VP BALANCED PORTFOLIO AS OF DECEMBER 31, 2007 (CONTINUED)
| Shares | | | | | |
Value | |
| | | | | Miscellaneous Manufacturing (continued) | |
| | 3,800 | | | | | Roper Industries, Inc. | | $ | 237,652 | | |
| | 1,500 | | | | | SPX Corp. | | | 154,275 | | |
| | 5,200 | | | @,L | | Sturm Ruger & Co., Inc. | | | 43,056 | | |
| | 3,667 | | | | | Teleflex, Inc. | | | 231,058 | | |
| | 23,700 | | | @@ | | Tyco International Ltd. | | | 939,705 | | |
| | | | 32,876,732 | | |
| | | | | Office Furnishings: 0.0% | |
| | 6,002 | | | L | | Herman Miller, Inc. | | | 194,405 | | |
| | 6,600 | | | L | | HNI, Corp. | | | 231,396 | | |
| | 2,500 | | | L | | Interface, Inc. | | | 40,800 | | |
| | | | 466,601 | | |
| | | | | Oil & Gas: 7.0% | |
| | 3,100 | | | @,L | | Atwood Oceanics, Inc. | | | 310,744 | | |
| | 660 | | | @,L | | Bill Barrett Corp. | | | 27,634 | | |
| | 3,000 | | | L | | Cabot Oil & Gas Corp. | | | 121,110 | | |
| | 174,786 | | | | | Chevron Corp. | | | 16,312,777 | | |
| | 2,267 | | | | | Cimarex Energy Co. | | | 96,416 | | |
| | 154,900 | | | | | ConocoPhillips | | | 13,677,670 | | |
| | 12,000 | | | @ | | Denbury Resources, Inc. | | | 357,000 | | |
| | 3,800 | | | | | Devon Energy Corp. | | | 337,858 | | |
| | 5,100 | | | L | | ENSCO International, Inc. | | | 304,062 | | |
| | 314,340 | | | S | | ExxonMobil Corp. | | | 29,450,515 | | |
| | 3,900 | | | @ | | Forest Oil Corp. | | | 198,276 | | |
| | 9,800 | | | | | Frontier Oil Corp. | | | 397,684 | | |
| | 4,400 | | | | | Helmerich & Payne, Inc. | | | 176,308 | | |
| | 5,100 | | | | | Hess Corp. | | | 514,386 | | |
| | 67,800 | | | | | Marathon Oil Corp. | | | 4,126,308 | | |
| | 800 | | | @,L | | Newfield Exploration Co. | | | 42,160 | | |
| | 59,500 | | | L | | Occidental Petroleum Corp. | | | 4,580,905 | | |
| | 5,900 | | | | | Patterson-UTI Energy, Inc. | | | 115,168 | | |
| | 300 | | | L | | Penn Virginia Corp. | | | 13,089 | | |
| | 500 | | | L | | Pioneer Natural
Resources Co. | | | 24,420 | | |
| | 5,793 | | | @,L | | Plains Exploration &
Production Co. | | | 312,822 | | |
| | 7,200 | | | @,L | | Pride International, Inc. | | | 244,080 | | |
| | 900 | | | @,L | | Quicksilver Resources, Inc. | | | 53,631 | | |
| | 6,300 | | | @ | | Southwestern Energy Co. | | | 351,036 | | |
| | 4,300 | | | L | | St. Mary Land &
Exploration Co. | | | 166,023 | | |
| | 3,000 | | | @,L | | Stone Energy Corp. | | | 140,730 | | |
| | 1,273 | | | @,L | | Swift Energy Co. | | | 56,050 | | |
| | 10,703 | | | @,L | | Transocean, Inc. | | | 1,532,134 | | |
| | 1,866 | | | @ | | Unit Corp. | | | 86,303 | | |
| | | | 74,127,299 | | |
| | | | | Oil & Gas Services: 0.4% | |
| | 19,000 | | | @,L | | Cameron
International Corp. | | | 914,470 | | |
| | 1,600 | | | @,L | | Dril-Quip, Inc. | | | 89,056 | | |
| | 2,620 | | | @,L | | Exterran Holdings, Inc. | | | 214,316 | | |
| | 7,614 | | | @ | | FMC Technologies, Inc. | | | 431,714 | | |
| | 5,800 | | | @,L | | Grant Prideco, Inc. | | | 321,958 | | |
| | 6,500 | | | @,L | | Helix Energy Solutions
Group, Inc. | | | 269,750 | | |
| | 1,850 | | | @,L | | Hornbeck Offshore
Services, Inc. | | | 83,158 | | |
| | 4,000 | | | @,L | | ION Geophysical Corp. | | | 63,120 | | |
| | 1,400 | | | L | | Lufkin Industries, Inc. | | | 80,206 | | |
| | 1,700 | | | @,L | | Matrix Service Co. | | | 37,094 | | |
| | 970 | | | @,L | | NATCO Group, Inc. | | | 52,526 | | |
| Shares | | | | | |
Value | |
| | 15,100 | | | @ | | National Oilwell Varco, Inc. | | $ | 1,109,246 | | |
| | 3,459 | | | @ | | Oceaneering
International, Inc. | | | 232,964 | | |
| | 1,300 | | | @,L | | SEACOR Holdings, Inc. | | | 120,562 | | |
| | 2,300 | | | @,L | | Superior Energy Services | | | 79,166 | | |
| | 700 | | | @,L | | Superior Well Services, Inc. | | | 14,854 | | |
| | 1,400 | | | @,L | | W-H Energy Services, Inc. | | | 78,694 | | |
| | | | 4,192,854 | | |
| | | | | Packaging & Containers: 0.0% | |
| | 2,300 | | | L | | Chesapeake Corp. | | | 11,937 | | |
| | 2,100 | | | | | Packaging Corp. of America | | | 59,220 | | |
| | 11,000 | | | | | Sonoco Products Co. | | | 359,480 | | |
| | | | 430,637 | | |
| | | | | Pharmaceuticals: 2.5% | |
| | 1,600 | | | @,L | | Alpharma, Inc. | | | 32,240 | | |
| | 900 | | | @,L | | Bradley
Pharmaceuticals, Inc. | | | 17,730 | | |
| | 103,300 | | | | | Bristol-Myers Squibb Co. | | | 2,739,516 | | |
| | 1,100 | | | @,L | | Cephalon, Inc. | | | 78,936 | | |
| | 156,500 | | | | | Eli Lilly & Co. | | | 8,355,535 | | |
| | 7,800 | | | @,L | | Endo Pharmaceuticals
Holdings, Inc. | | | 208,026 | | |
| | 31,200 | | | @ | | Gilead Sciences, Inc. | | | 1,435,512 | | |
| | 1,700 | | | @,L | | HealthExtras, Inc. | | | 44,336 | | |
| | 5,300 | | | @ | | Medco Health Solutions, Inc. | | | 537,420 | | |
| | 5,000 | | | | | Medicis
Pharmaceutical Corp. | | | 129,850 | | |
| | 175,300 | | | | | Merck & Co., Inc. | | | 10,186,683 | | |
| | 4,100 | | | @ | | MGI Pharma, Inc. | | | 166,173 | | |
| | 3,900 | | | @,L | | NBTY, Inc. | | | 106,860 | | |
| | 11,300 | | | L | | Perrigo Co. | | | 395,613 | | |
| | 1,000 | | | @,L | | PetMed Express, Inc. | | | 12,100 | | |
| | 62,200 | | | | | Pfizer, Inc. | | | 1,413,806 | | |
| | 2,730 | | | @,L | | Salix Pharmaceuticals Ltd. | | | 21,512 | | |
| | 2,200 | | | @,L | | Sciele Pharma, Inc. | | | 44,990 | | |
| | 10,300 | | | @,L | | Sepracor, Inc. | | | 270,375 | | |
| | 4,600 | | | @ | | Theragenics Corp. | | | 16,468 | | |
| | 900 | | | @,L | | USANA Health Sciences, Inc. | | | 33,372 | | |
| | 4,700 | | | @,L | | VCA Antech, Inc. | | | 207,881 | | |
| | 4,500 | | | @,L | | Viropharma, Inc. | | | 35,730 | | |
| | | | 26,490,664 | | |
| | | | | Pipelines: 0.1% | |
| | 800 | | | | | Equitable Resources, Inc. | | | 42,624 | | |
| | 7,218 | | | | | National Fuel Gas Co. | | | 336,936 | | |
| | 9,700 | | | | | Oneok, Inc. | | | 434,269 | | |
| | | | 813,829 | | |
| | | | | Real Estate: 0.0% | |
| | 1,690 | | | L | | Jones Lang LaSalle, Inc. | | | 120,260 | | |
| | | | 120,260 | | |
| | | | | Retail: 3.0% | |
| | 31,700 | | | L | | Abercrombie & Fitch Co. | | | 2,535,049 | | |
| | 7,950 | | | @,L | | Aeropostale, Inc. | | | 210,675 | | |
| | 5,455 | | | | | American Eagle Outfitters | | | 113,300 | | |
| | 3,100 | | | @ | | AnnTaylor Stores Corp. | | | 79,236 | | |
| | 12,000 | | | @ | | Autozone, Inc. | | | 1,438,920 | | |
| | 3,100 | | | L | | Barnes & Noble, Inc. | | | 106,795 | | |
| | 17,600 | | | | | Best Buy Co., Inc. | | | 926,640 | | |
| | 3,600 | | | L | | Big 5 Sporting Goods Corp. | | | 51,912 | | |
See Accompanying Notes to Financial Statements
68
PORTFOLIO OF INVESTMENTS
ING VP BALANCED PORTFOLIO AS OF DECEMBER 31, 2007 (CONTINUED)
| Shares | | | | | |
Value | |
| | | | | Retail (continued) | |
| | 40,900 | | | @,L | | Big Lots, Inc. | | $ | 653,991 | | |
| | 3,100 | | | @,L | | BJ's Wholesale Club, Inc. | | | 104,873 | | |
| | 2,625 | | | | | Brown Shoe Co., Inc. | | | 39,821 | | |
| | 1,380 | | | @,L | | Buffalo Wild Wings, Inc. | | | 32,044 | | |
| | 1,389 | | | @ | | Cabela's, Inc. | | | 20,932 | | |
| | 1,000 | | | @,L | | California Pizza
Kitchen, Inc. | | | 15,570 | | |
| | 5,900 | | | L | | Casey's General Stores, Inc. | | | 174,699 | | |
| | 1,900 | | | L | | Cash America
International, Inc. | | | 61,370 | | |
| | 2,400 | | | | | Cato Corp. | | | 37,584 | | |
| | 700 | | | | | CBRL Group, Inc. | | | 22,673 | | |
| | 2,200 | | | @,L | | CEC Entertainment, Inc. | | | 57,112 | | |
| | 1,600 | | | @,L | | Chipotle Mexican Grill, Inc. | | | 235,312 | | |
| | 4,600 | | | | | Christopher & Banks Corp. | | | 52,670 | | |
| | 142,000 | | | @ | | Coach, Inc. | | | 4,342,360 | | |
| | 1,928 | | | @ | | Collective Brands, Inc. | | | 33,528 | | |
| | 2,700 | | | @ | | Copart, Inc. | | | 114,885 | | |
| | 60,900 | | | | | Costco Wholesale Corp. | | | 4,248,384 | | |
| | 47,400 | | | | | CVS Caremark Corp. | | | 1,884,150 | | |
| | 4,000 | | | @,L | | Dick's Sporting Goods, Inc. | | | 111,040 | | |
| | 9,100 | | | @ | | Dollar Tree Stores, Inc. | | | 235,872 | | |
| | 2,700 | | | @,L | | Dress Barn, Inc. | | | 33,777 | | |
| | 5,000 | | | | | Foot Locker, Inc. | | | 68,300 | | |
| | 1,300 | | | @,L | | Genesco, Inc. | | | 49,140 | | |
| | 4,750 | | | | | Guess ?, Inc. | | | 179,978 | | |
| | 2,000 | | | @ | | Gymboree Corp. | | | 60,920 | | |
| | 7,400 | | | @ | | Hanesbrands, Inc. | | | 201,058 | | |
| | 1,800 | | | @,L | | Hibbett Sporting
Goods, Inc. | | | 35,964 | | |
| | 4,000 | | �� | @,L | | HOT Topic, Inc. | | | 23,280 | | |
| | 1,200 | | | L | | IHOP Corp. | | | 43,896 | | |
| | 4,200 | | | @,L | | Jack in the Box, Inc. | | | 108,234 | | |
| | 1,900 | | | @,L | | Jo-Ann Stores, Inc. | | | 24,852 | | |
| | 3,000 | | | @,L | | JOS A Bank Clothiers, Inc. | | | 85,350 | | |
| | 1,300 | | | L | | Longs Drug Stores Corp. | | | 61,100 | | |
| | 98,900 | | | | | McDonald's Corp. | | | 5,826,199 | | |
| | 5,100 | | | | | Men's Wearhouse, Inc. | | | 137,598 | | |
| | 500 | | | L | | Movado Group, Inc. | | | 12,645 | | |
| | 7,900 | | | | | MSC Industrial Direct Co. | | | 319,713 | | |
| | 1,100 | | | @,L | | O'Reilly Automotive, Inc. | | | 35,673 | | |
| | 2,080 | | | @,L | | Panera Bread Co. | | | 74,506 | | |
| | 800 | | | @,L | | Papa John's
International, Inc. | | | 18,160 | | |
| | 827 | | | @ | | PF Chang's China Bistro, Inc. | | | 18,889 | | |
| | 4,300 | | | | | Phillips-Van Heusen | | | 158,498 | | |
| | 17,000 | | | L | | Polo Ralph Lauren Corp. | | | 1,050,430 | | |
| | 7,600 | | | @,L | | Quiksilver, Inc. | | | 65,208 | | |
| | 36,900 | | | L | | RadioShack Corp. | | | 622,134 | | |
| | 1,500 | | | @,L | | Red Robin Gourmet
Burgers, Inc. | | | 47,985 | | |
| | 5,100 | | | L | | Ross Stores, Inc. | | | 130,407 | | |
| | 2,200 | | | @,L | | School Specialty, Inc. | | | 76,010 | | |
| | 3,207 | | | @,L | | Select Comfort Corp. | | | 22,481 | | |
| | 971 | | | | | Sonic Automotive, Inc. | | | 18,921 | | |
| | 5,960 | | | @,L | | Sonic Corp. | | | 130,524 | | |
| | 1,610 | | | | | Stage Stores, Inc. | | | 24,126 | | |
| | 3,100 | | | @,L | | Texas Roadhouse, Inc. | | | 34,286 | | |
| | 84,100 | | | L | | TJX Cos., Inc. | | | 2,416,193 | | |
| | 1,500 | | | @,L | | Tractor Supply Co. | | | 53,910 | | |
| | 2,710 | | | @,L | | Tween Brands, Inc. | | | 71,761 | | |
| | 9,200 | | | @,L | | Urban Outfitters, Inc. | | | 250,792 | | |
| | 14,100 | | | | | Wal-Mart Stores, Inc. | | | 670,173 | | |
| Shares | | | | | |
Value | |
| | 33,400 | | | | | Wendy's International, Inc. | | $ | 863,056 | | |
| | 500 | | | | | World Fuel Services Corp. | | | 14,515 | | |
| | 1,950 | | | @,L | | Zumiez, Inc. | | | 47,502 | | |
| | | | 32,129,541 | | |
| | | | | Savings & Loans: 0.3% | |
| | 1,600 | | | L | | Anchor Bancorp.
Wisconsin, Inc. | | | 37,632 | | |
| | 8,800 | | | L | | Astoria Financial Corp. | | | 204,776 | | |
| | 7,800 | | | | | BankAtlantic Bancorp., Inc. | | | 31,980 | | |
| | 8,798 | | | L | | Bankunited Financial Corp. | | | 60,706 | | |
| | 2,600 | | | L | | Dime
Community Bancshares | | | 33,202 | | |
| | 6,700 | | | L | | First Niagara Financial
Group, Inc. | | | 80,668 | | |
| | 3,900 | | | @,L | | FirstFed Financial Corp. | | | 139,698 | | |
| | 1,300 | | | L | | Flagstar Bancorp., Inc. | | | 9,061 | | |
| | 202,500 | | | L | | Hudson City Bancorp., Inc. | | | 3,041,550 | | |
| | | | 3,639,273 | | |
| | | | | Semiconductors: 2.4% | |
| | 1,700 | | | @,L | | Actel Corp. | | | 23,222 | | |
| | 3,600 | | | @,L | | AMIS Holdings, Inc. | | | 36,072 | | |
| | 1,100 | | | @,L | | ATMI, Inc. | | | 35,475 | | |
| | 1,200 | | | @,L | | Cabot
Microelectronics Corp. | | | 43,092 | | |
| | 1,300 | | | L | | Cohu, Inc. | | | 19,890 | | |
| | 2,500 | | | @ | | Cypress
Semiconductor Corp. | | | 90,075 | | |
| | 2,400 | | | @,L | | Diodes, Inc. | | | 72,168 | | |
| | 8,600 | | | @ | | Fairchild Semiconductor
International, Inc. | | | 124,098 | | |
| | 5,392 | | | @ | | Integrated Device
Technology, Inc. | | | 60,984 | | |
| | 533,400 | | | | | Intel Corp. | | | 14,220,433 | | |
| | 3,400 | | | @,L | | International Rectifier Corp. | | | 115,498 | | |
| | 8,900 | | | L | | Intersil Corp. | | | 217,872 | | |
| | 8,300 | | | @,L | | Kulicke & Soffa
Industries, Inc. | | | 56,938 | | |
| | 7,400 | | | @,L | | Lam Research Corp. | | | 319,902 | | |
| | 1,300 | | | @,L | | Microsemi Corp. | | | 28,782 | | |
| | 1,200 | | | @,L | | MKS Instruments, Inc. | | | 22,968 | | |
| | 136,700 | | | @,L | | Nvidia Corp. | | | 4,650,534 | | |
| | 5,400 | | | @,L | | Pericom
Semiconductor Corp. | | | 100,980 | | |
| | 8,200 | | | @,L | | Semtech Corp. | | | 127,264 | | |
| | 14,800 | | | @,L | | Skyworks Solutions, Inc. | | | 125,800 | | |
| | 2,300 | | | @,L | | Standard
Microsystems Corp. | | | 89,861 | | |
| | 500 | | | @,L | | Supertex, Inc. | | | 15,645 | | |
| | 120,200 | | | L | | Texas Instruments, Inc. | | | 4,014,680 | | |
| | 5,505 | | | @ | | Varian Semiconductor
Equipment Associates, Inc. | | | 203,685 | | |
| | | | 24,815,918 | | |
| | | | | Software: 2.3% | |
| | 12,900 | | | @ | | Activision, Inc. | | | 383,130 | | |
| | 600 | | | @,L | | Advent Software, Inc. | | | 32,460 | | |
| | 2,400 | | | @,L | | Allscripts Healthcare
Solutions, Inc. | | | 46,608 | | |
| | 5,000 | | | @,L | | Ansys, Inc. | | | 207,300 | | |
| | 29,100 | | | @ | | Autodesk, Inc. | | | 1,448,016 | | |
| | 1,128 | | | @ | | Avid Technology, Inc. | | | 31,968 | | |
See Accompanying Notes to Financial Statements
69
PORTFOLIO OF INVESTMENTS
ING VP BALANCED PORTFOLIO AS OF DECEMBER 31, 2007 (CONTINUED)
| Shares | | | | | |
Value | |
| | | | | Software (continued) | |
| | 66,100 | | | @,L | | BMC Software, Inc. | | $ | 2,355,804 | | |
| | 10,200 | | | | | Broadridge Financial
Solutions ADR | | | 228,786 | | |
| | 143,100 | | | L | | CA, Inc. | | | 3,570,345 | | |
| | 3,700 | | | @ | | Captaris, Inc. | | | 15,984 | | |
| | 2,800 | | | @,L | | Cerner Corp. | | | 157,920 | | |
| | 2,000 | | | @,L | | Concur Technologies, Inc. | | | 72,420 | | |
| | 2,200 | | | @,L | | CSG Systems International | | | 32,384 | | |
| | 4,329 | | | | | Dun & Bradstreet Corp. | | | 383,679 | | |
| | 1,200 | | | | | Global Payments, Inc. | | | 55,824 | | |
| | 5,500 | | | @,L | | Informatica Corp. | | | 99,110 | | |
| | 800 | | | @ | | JDA Software Group, Inc. | | | 16,368 | | |
| | 1,300 | | | @,L | | Mantech
International Corp. | | | 56,966 | | |
| | 4,100 | | | @,L | | Metavante
Technologies, inc. | | | 95,612 | | |
| | 292,975 | | | L | | Microsoft Corp. | | | 10,429,910 | | |
| | 64,600 | | | @,L | | Novell, Inc. | | | 443,802 | | |
| | 2,230 | | | @,L | | Omnicell, Inc. | | | 60,054 | | |
| | 139,800 | | | @ | | Oracle Corp. | | | 3,156,684 | | |
| | 4,190 | | | @,L | | Phase Forward, Inc. | | | 91,133 | | |
| | 2,900 | | | @ | | Progress Software Corp. | | | 97,672 | | |
| | 1,610 | | | @,L | | Smith Micro Software, Inc. | | | 13,637 | | |
| | 1,400 | | | @,L | | SPSS, Inc. | | | 50,274 | | |
| | 9,500 | | | @,L | | Sybase, Inc. | | | 247,855 | | |
| | 600 | | | @,L | | THQ, Inc. | | | 16,914 | | |
| | | | 23,898,619 | | |
| | | | | Telecommunications: 3.0% | |
| | 16,400 | | | @ | | 3Com Corp. | | | 74,128 | | |
| | 5,000 | | | @ | | Adaptec, Inc. | | | 16,900 | | |
| | 5,300 | | | @,L | | ADC
Telecommunications, Inc. | | | 82,415 | | |
| | 2,400 | | | @,L | | Anixter International, Inc. | | | 149,448 | | |
| | 5,312 | | | @,L | | Arris Group, Inc. | | | 53,017 | | |
| | 229,937 | | | | | AT&T, Inc. | | | 9,556,182 | | |
| | 38,700 | | | | | CenturyTel, Inc. | | | 1,604,502 | | |
| | 28,600 | | | @,L | | Cincinnati Bell, Inc. | | | 135,850 | | |
| | 105,360 | | | @ | | Cisco Systems, Inc. | | | 2,852,095 | | |
| | 3,824 | | | @,L | | CommScope, Inc. | | | 188,177 | | |
| | 1,800 | | | @,L | | Comtech Telecommunications | | | 97,218 | | |
| | 61,500 | | | | | Corning, Inc. | | | 1,475,385 | | |
| | 6,920 | | | @ | | Foundry Networks, Inc. | | | 121,238 | | |
| | 6,000 | | | @,L | | Harmonic, Inc. | | | 62,880 | | |
| | 8,183 | | | | | Harris Corp. | | | 512,910 | | |
| | 77,900 | | | @,L | | JDS Uniphase Corp. | | | 1,036,070 | | |
| | 23,500 | | | @,L | | Juniper Networks, Inc. | | | 780,200 | | |
| | 2,699 | | | @,L | | Netgear, Inc. | | | 96,273 | | |
| | 4,500 | | | @,L | | Network Equipment
Technologies, Inc. | | | 37,890 | | |
| | 8,900 | | | @,L | | NeuStar, Inc. | | | 255,252 | | |
| | 4,400 | | | @,L | | Novatel Wireless, Inc. | | | 71,280 | | |
| | 3,500 | | | L | | Plantronics, Inc. | | | 91,000 | | |
| | 189,300 | | | | | Qualcomm, Inc. | | | 7,448,955 | | |
| | 37,500 | | | @ | | RF Micro Devices, Inc. | | | 214,125 | | |
| | 25,200 | | | L | | Sprint Nextel Corp. | | | 330,876 | | |
| | 4,600 | | | @ | | Symmetricom, Inc. | | | 21,666 | | |
| | 7,075 | | | L | | Telephone & Data
Systems, Inc. | | | 442,895 | | |
| | 1,900 | | | @ | | Tollgrade
Communications, Inc. | | | 15,238 | | |
| Shares | | | | | |
Value | |
| | 88,400 | | | | | Verizon
Communications, Inc. | | $ | 3,862,196 | | |
| | 1,700 | | | @,L | | Viasat, Inc. | | | 58,531 | | |
| | | | 31,744,792 | | |
| | | | | Textiles: 0.0% | |
| | 3,900 | | | | | G&K Services, Inc. | | | 146,328 | | |
| | 3,200 | | | @,L | | Mohawk Industries, Inc. | | | 238,080 | | |
| | 1,500 | | | | | Unifirst Corp. | | | 57,000 | | |
| | | | 441,408 | | |
| | | | | Toys/Games/Hobbies: 0.0% | |
| | 1,800 | | | @,L | | Jakks Pacific, Inc. | | | 42,498 | | |
| | 500 | | | @,L | | RC2 Corp. | | | 14,035 | | |
| | | | 56,533 | | |
| | | | | Transportation: 0.2% | |
| | 921 | | | | | Arkansas Best Corp. | | | 20,207 | | |
| | 1,300 | | | @,L | | Bristow Group, Inc. | | | 73,645 | | |
| | 5,000 | | | | | Con-way, Inc. | | | 207,700 | | |
| | 8,300 | | | | | CSX Corp. | | | 365,034 | | |
| | 2,800 | | | @,L | | HUB Group, Inc. | | | 74,424 | | |
| | 3,480 | | | @,L | | Kansas City Southern | | | 119,468 | | |
| | 3,700 | | | @,L | | Kirby Corp. | | | 171,976 | | |
| | 1,200 | | | | | Landstar System, Inc. | | | 50,580 | | |
| | 800 | | | @,L | | Old Dominion Freight Line | | | 18,488 | | |
| | 6,700 | | | L | | Tidewater, Inc. | | | 367,562 | | |
| | 4,800 | | | | | Union Pacific Corp. | | | 602,976 | | |
| | 1,500 | | | @,L | | YRC Worldwide, Inc. | | | 25,635 | | |
| | | | 2,097,695 | | |
| | | | | Water: 0.0% | |
| | 1,900 | | | L | | American States Water Co. | | | 71,592 | | |
| | | | 71,592 | | |
Total Common Stock
(Cost $594,498,179) | | | 617,911,804 | | |
| REAL ESTATE INVESTMENT TRUSTS: 0.2% | | | |
| | | | | Apartments: 0.0% | |
| | 1,540 | | | L | | Camden Property Trust | | | 74,151 | | |
| | 580 | | | L | | Essex Property Trust, Inc. | | | 56,544 | | |
| | 2,200 | | | | | Mid-America Apartment
Communities, Inc. | | | 94,050 | | |
| | | | 224,745 | | |
| | | | | Diversified: 0.0% | |
| | 2,600 | | | | | Colonial Properties Trust | | | 58,838 | | |
| | 800 | | | | | Entertainment
Properties Trust | | | 37,600 | | |
| | | | 96,438 | | |
| | | | | Forest Products & Paper: 0.0% | |
| | 2,882 | | | L | | Potlatch Corp. | | | 128,076 | | |
| | | | 128,076 | | |
| | | | | Health Care: 0.0% | |
| | 3,100 | | | | | LTC Properties, Inc. | | | 77,655 | | |
| | 2,800 | | | L | | Medical Properties
Trust, Inc. | | | 28,532 | | |
| | 2,000 | | | L | | Senior Housing
Properties Trust | | | 45,360 | | |
| | | | 151,547 | | |
See Accompanying Notes to Financial Statements
70
PORTFOLIO OF INVESTMENTS
ING VP BALANCED PORTFOLIO AS OF DECEMBER 31, 2007 (CONTINUED)
| Shares | | | | | |
Value | |
| | | | | Hotels: 0.0% | |
| | 5,370 | | | | | DiamondRock
Hospitality Co. | | $ | 80,443 | | |
| | 5,600 | | | L | | Hospitality Properties Trust | | | 180,432 | | |
| | | | 260,875 | | |
| | | | | Office Property: 0.0% | |
| | 1,440 | | | | | Alexandria Real Estate
Equities, Inc. | | | 146,405 | | |
| | 3,660 | | | | | BioMed Realty Trust, Inc. | | | 84,802 | | |
| | 1,000 | | | | | Kilroy Realty Corp. | | | 54,960 | | |
| | | | 286,167 | | |
| | | | | Regional Malls: 0.1% | |
| | 4,100 | | | L | | Macerich Co. | | | 291,346 | | |
| | | | 291,346 | | |
| | | | | Shopping Centers: 0.0% | |
| | 2,600 | | | | | Federal Realty
Investment Trust | | | 213,590 | | |
| | | | 213,590 | | |
| | | | | Single Tenant: 0.0% | |
| | 2,200 | | | L | | National Retail
Properties, Inc. | | | 51,436 | | |
| | 4,600 | | | | | Realty Income Corp. | | | 124,292 | | |
| | | | 175,728 | | |
| | | | | Storage: 0.0% | |
| | 3,600 | | | | | Extra Space Storage, Inc. | | | 51,444 | | |
| | | | 51,444 | | |
| | | | | Warehouse/Industrial: 0.1% | |
| | 11,000 | | | | | AMB Property Corp. | | | 633,160 | | |
| | 400 | | | L | | EastGroup Properties, Inc. | | | 16,740 | | |
| | | | 649,900 | | |
Total Real Estate
Investment Trusts
(Cost $2,667,872) | | | 2,529,856 | | |
| PREFERRED STOCK: 0.5% | | | |
| | | | | Banks: 0.1% | |
| | 35,875 | | | @@,P | | Santander Finance,
5.661%, due 03/05/17 | | | 678,038 | | |
| | | | 678,038 | | |
| | | | | Diversified Financial Services: 0.1% | |
| | 24,000 | | | P | | Deutsche Bank
Capital Trust II, 6.550%,
due 05/23/17 | | | 518,640 | | |
| | 46,500 | | | P,L | | Merrill Lynch & Co., Inc.,
5.482%, due 05/21/12 | | | 813,750 | | |
| | | | 1,332,390 | | |
| | | | | Insurance: 0.3% | |
| | 48,903 | | | @@,P | | Aegon NV, 6.375%,
due 06/15/15 | | | 965,834 | | |
| | 19,271 | | | @@,P | | Aegon NV-Series 1,
5.866%, due 12/15/10 | | | 342,060 | | |
| | 51,650 | | | P | | Metlife, Inc., 6.500%,
due 09/15/10 | | | 1,128,036 | | |
| | | | 2,435,930 | | |
| Shares | | | | | |
Value | |
| | | | | Sovereign: 0.0% | |
| | 9,000 | | | P,L | | Fannie Mae, 5.580%,
due 09/30/12 | | $ | 204,750 | | |
| | | | 204,750 | | |
Total Preferred Stock
(Cost $5,861,131) | | | 4,651,108 | | |
Principal
Amount | | | | | | Value | |
| CORPORATE BONDS/NOTES: 10.5% | | | |
| | | | | Aerospace/Defense: 0.1% | |
| $ | 1,352,000 | | | C,S | | United Technologies Corp.,
5.375%, due 12/15/17 | | | 1,366,407 | | |
| | | | 1,366,407 | | |
| | | | | Airlines: 0.2% | |
| | 1,752,000 | | | C,S | | Delta Airlines, Inc., 7.570%,
due 11/18/10 | | | 1,771,492 | | |
| | 756,000 | | | S | | United AirLines, Inc., 6.932%,
due 09/01/11 | | | 899,640 | | |
| | | | 2,671,132 | | |
| | | | | Auto Manufacturers: 0.1% | |
| | 959,748 | | | S | | Ford Motor Co., 8.597%,
due 11/29/13 | | | 890,493 | | |
| | | | 890,493 | | |
| | | | | Banks: 2.6% | |
| | 1,040,000 | | | @@,C,S | | Australia & New Zealand
Banking Group Ltd.,
4.963%, due 12/31/49 | | | 840,202 | | |
| | 1,639,000 | | | C,S | | BAC Capital Trust XIV,
5.630%, due 12/31/49 | | | 1,455,776 | | |
| | 172,552 | | | @@,#,S | | Banco Itau SA,
5.720%, due 09/20/08 | | | 170,826 | | |
| | 786,000 | | | @@,#,C,S | | Banco Mercantil del Norte SA,
6.135%, due 10/13/16 | | | 781,205 | | |
| | 985,000 | | | S | | Bank of America Corp.,
5.750%, due 12/01/17 | | | 989,107 | | |
| | 400,000 | | | @@,C,S | | Bank of Ireland,
5.188%, due 12/29/49 | | | 326,000 | | |
| | 210,000 | | | @@,C,S | | Bank of Scotland,
5.125%, due 12/31/49 | | | 165,160 | | |
| | 77,000 | | | C,S | | BankAmerica Capital II,
8.000%, due 12/15/26 | | | 80,832 | | |
| | 490,000 | | | @@,C,S | | Barclays Bank PLC,
5.563%, due 12/31/49 | | | 389,550 | | |
| | 434,000 | | | @@,#,C,S | | Barclays Bank PLC,
5.926%, due 12/15/16 | | | 404,512 | | |
| | 1,235,000 | | | @@,#,S | | Barclays Bank PLC,
6.050%, due 12/04/17 | | | 1,246,712 | | |
| | 110,000 | | | @@,C,S | | Barclays O/S Inv,
5.063%, due 05/19/08 | | | 68,200 | | |
| | 710,000 | | | @@,C,S | | BNP Paribas,
5.238%, due 09/29/49 | | | 598,339 | | |
| | 1,267,000 | | | @@,#,C,S | | Chuo Mitsui Trust &
Banking Co., Ltd.,
5.506%, due 04/15/49 | | | 1,166,694 | | |
| | 377,000 | | | @@,#,C,S | | Danske Bank A/S,
5.914%, due 12/29/49 | | | 357,174 | | |
| | 220,000 | | | @@,C,S | | Den Norske Bank ASA,
5.375%, due 11/29/49 | | | 177,100 | | |
See Accompanying Notes to Financial Statements
71
PORTFOLIO OF INVESTMENTS
ING VP BALANCED PORTFOLIO AS OF DECEMBER 31, 2007 (CONTINUED)
Principal
Amount | | | | | | Value | |
| | | | | Banks (continued) | |
| $ | 723,000 | | | #,C,S | | Dresdner Funding Trust I,
8.151%, due 06/30/31 | | $ | 739,349 | | |
| | 1,000 | | | C | | Fleet Capital Trust II,
7.920%, due 12/11/26 | | | 1,039 | | |
| | 416,000 | | | @@,#,C,S | | HBOS PLC, 5.375%,
due 11/29/49 | | | 379,695 | | |
| | 860,000 | | | @@,C,S | | Hongkong & Shanghai
Banking Corp., Ltd.,
5.250%, due 07/29/49 | | | 636,400 | | |
| | 1,150,000 | | | @@,C,S | | HSBC Bank PLC, 4.913%,
due 06/29/49 | | | 902,750 | | |
| | 1,140,000 | | | @@,C,S | | HSBC Bank PLC, 5.000%,
due 06/29/49 | | | 894,900 | | |
| | 620,000 | | | @@,C,S,L | | Lloyds TSB Bank PLC,
5.125%, due 06/29/49 | | | 501,084 | | |
| | 770,000 | | | @@,C,S | | Lloyds TSB Bank PLC,
5.313%, due 11/29/49 | | | 612,150 | | |
| | 1,030,000 | | | @@,C,S | | Lloyds TSB Bank PLC,
5.523%, due 08/29/49 | | | 829,150 | | |
| | 382,000 | | | @@,#,C,S | | Lloyds TSB Group PLC,
6.267%, due 11/13/49 | | | 347,116 | | |
| | 805,000 | | | @@,C,S | | Mizuho Financial Group
Cayman Ltd., 8.375%,
due 12/31/49 | | | 813,605 | | |
| | 60,000 | | | @@,C,S | | National Westminster
Bank PLC, 5.563%,
due 08/29/49 | | | 46,243 | | |
| | 130,000 | | | @@,C,S | | National Westminster
Bank PLC, 6.250%,
due 11/29/49 | | | 100,588 | | |
| | 640,000 | | | #,C,S | | Rabobank Capital
Funding II, 5.260%,
due 12/29/49 | | | 597,024 | | |
| | 612,000 | | | #,C,S | | Rabobank Capital
Funding Trust, 5.254%,
due 12/31/49 | | | 548,689 | | |
| | 538,000 | | | C,S | | RBS Capital Trust I, 5.512%,
due 09/30/49 | | | 495,261 | | |
| | 962,000 | | | @@,#,C,S | | Resona Bank Ltd.,
5.850%, due 09/29/49 | | | 895,755 | | |
| | 1,580,000 | | | @@,C,S | | Royal Bank of Scotland
Group PLC, 4.938%,
due 12/29/49 | | | 1,177,100 | | |
| | 370,000 | | | @@,C,S | | Societe Generale, 4.981%,
due 11/29/49 | | | 304,558 | | |
| | 1,400,000 | | | @@,C,S | | Standard Chartered PLC,
4.974%, due 07/29/49 | | | 980,000 | | |
| | 1,800,000 | | | @@,C,S,L | | Standard Chartered PLC,
5.125%, due 11/29/49 | | | 1,314,000 | | |
| | 230,000 | | | @@,C,S,L | | Standard Chartered PLC,
5.588%, due 01/29/49 | | | 163,300 | | |
| | 200,000 | | | @@,#,C,S | | Standard Chartered PLC,
6.409%, due 12/31/49 | | | 181,441 | | |
| | 100,000 | | | @@,#,C,S | | Standard Chartered PLC,
7.014%, due 07/30/49 | | | 94,968 | | |
| | 898,000 | | | @@,C,S | | Sumitomo Mitsui
Banking Corp., 8.150%,
due 08/01/49 | | | 916,517 | | |
| | 379,000 | | | C,S | | SunTrust Preferred Capital I,
5.853%, due 12/31/49 | | | 334,751 | | |
| | 421,000 | | | C,S | | USB Capital IX, 6.189%,
due 03/29/49 | | | 381,283 | | |
Principal
Amount | | | | | | Value | |
| $ | 541,000 | | | S | | Wachovia Bank NA,
6.600%, due 01/15/38 | | $ | 545,493 | | |
| | 807,000 | | | C,S | | Wachovia Capital Trust III,
5.800%, due 12/31/49 | | | 721,602 | | |
| | 1,338,000 | | | L | | Wells Fargo & Co., 5.625%,
due 12/11/17 | | | 1,341,344 | | |
| | 450,000 | | | @@,C,S | | Westpac Banking Corp.,
5.306%, due 09/30/49 | | | 367,995 | | |
| | 372,000 | | | @@,#,C,S | | Westpac Capital Trust IV,
5.256%, due 12/29/49 | | | 327,493 | | |
| | | | 27,710,032 | | |
| | | | | Beverages: 0.1% | |
| BRL | 1,039,000 | | | @@,#,S | | Ambev International
Finance Co., Ltd.,
9.500%, due 07/24/17 | | | 496,152 | | |
| $ | 376,000 | | | C,S | | Anheuser-Busch Cos., Inc.,
5.500%, due 01/15/18 | | | 384,587 | | |
| | 537,000 | | | S | | PepsiCo, Inc., 4.650%,
due 02/15/13 | | | 541,217 | | |
| | | | 1,421,956 | | |
| | | | | Chemicals: 0.2% | |
| | 260,000 | | | S,Z | | Stauffer Chemical, 4.480%,
due 04/15/10 | | | 235,188 | | |
| | 450,000 | | | S,Z | | Stauffer Chemical, 5.500%,
due 04/15/18 | | | 259,515 | | |
| | 570,000 | | | S,Z | | Stauffer Chemical, 6.750%,
due 04/15/17 | | | 348,361 | | |
| | 1,051,000 | | | S | | Union Carbide Corp.,
7.750%, due 10/01/96 | | | 1,105,404 | | |
| | | | 1,948,468 | | |
| | | | | Diversified Financial Services: 3.1% | |
| | 2,095,000 | | | @@,#,C,S | | Aiful Corp., 4.450%,
due 02/16/10 | | | 1,981,516 | | |
| | 218,000 | | | @@,#,C,S,I | | Alpine III, 5.428%,
due 08/16/14 | | | 218,702 | | |
| | 218,000 | | | @@,#,S,I | | Alpine III, 5.828%,
due 08/16/14 | | | 218,795 | | |
| | 328,000 | | | @@,#,S,I | | Alpine III, 7.628%,
due 08/16/14 | | | 330,476 | | |
| | 560,000 | | | @@,#,S,I | | Alpine III, 10.878%,
due 08/16/14 | | | 573,446 | | |
| | 500,000 | | | S | | American General
Finance Corp., 6.900%,
due 12/15/17 | | | 501,392 | | |
| | 2,520,000 | | | #,S | | Astoria Depositor Corp.,
8.144%, due 05/01/21 | | | 2,608,200 | | |
| | 963,000 | | | #,C,S | | Biomet, Inc., 11.625%,
due 10/15/17 | | | 953,370 | | |
| | 653,000 | | | S | | Caterpillar Financial
Services Corp., 4.850%,
due 12/07/12 | | | 654,837 | | |
| | 809,000 | | | S | | Citigroup, Inc., 6.125%,
due 11/21/17 | | | 832,535 | | |
| | 1,265,000 | | | C,S | | Citigroup, Inc., 8.300%,
due 12/21/57 | | | 1,324,650 | | |
| | 1,131,000 | | | #,C,S | | Corestates Capital Trust I,
8.000%, due 12/15/26 | | | 1,170,955 | | |
| | 762,000 | | | @@,S | | Eksportfinans A/S, 5.125%,
due 10/26/11 | | | 790,506 | | |
See Accompanying Notes to Financial Statements
72
PORTFOLIO OF INVESTMENTS
ING VP BALANCED PORTFOLIO AS OF DECEMBER 31, 2007 (CONTINUED)
Principal
Amount | | | | | | Value | |
| | | | | Diversified Financial Services (continued) | |
| $ | 420,000 | | | @@,C,S | | Financiere CSFB NV,
4.806%, due 03/29/49 | | $ | 333,900 | | |
| | 492,000 | | | S | | Ford Motor Credit Co.,
7.993%, due 01/13/12 | | | 413,608 | | |
| | 1,180,000 | | | S | | Ford Motor Credit Co.,
8.000%, due 12/15/16 | | | 1,003,812 | | |
| | 1,007,000 | | | S | | Ford Motor Credit Co.,
9.693%, due 04/15/12 | | | 990,551 | | |
| | 760,000 | | | C,S | | Fund American Cos., Inc.,
5.875%, due 05/15/13 | | | 762,506 | | |
| | 816,000 | | | C,S | | Goldman Sachs Group, Inc.,
5.793%, due 12/31/49 | | | 727,187 | | |
| | 386,000 | | | C,S | | Goldman Sachs Group, Inc.,
6.750%, due 10/01/37 | | | 379,389 | | |
| | 562,000 | | | #,C,S | | HVB Funding Trust III,
9.000%, due 10/22/31 | | | 636,093 | | |
| | 972,000 | | | S | | John Deere Capital Corp.,
4.950%, due 12/17/12 | | | 974,394 | | |
| | 1,199,000 | | | S | | JPMorgan Chase & Co.,
6.000%, due 01/15/18 | | | 1,220,914 | | |
| | 1,412,000 | | | #,C,S | | Mangrove Bay Pass-
Through Trust, 6.102%,
due 07/15/33 | | | 1,271,715 | | |
| | 1,131,000 | | | @@,#,S | | Mantis Reef Ltd., 4.799%,
due 11/03/09 | | | 1,147,678 | | |
| | 804,000 | | | @@, C | | MUFG Capital Finance 1 Ltd.,
6.346%, due 12/31/49 | | | 762,723 | | |
| | 485,000 | | | @@, C | | Paribas, 5.063%,
due 12/31/49 | | | 405,296 | | |
| | 192,778 | | | @@,#,C,S | | Petroleum Export Ltd.,
4.623%, due 06/15/10 | | | 189,852 | | |
| | 1,007,053 | | | @@,#,C,S | | PF Export Receivables
Master Trust, 6.436%,
due 06/01/15 | | | 1,015,462 | | |
| | 1,438,022 | | | #,C,S | | Piper Jaffray Equipment
Trust Securities, 6.000%,
due 09/10/11 | | | 1,366,121 | | |
| | 1,256,307 | | | #,C,S | | Piper Jaffray Equipment
Trust Securities, 6.750%,
due 04/01/11 | | | 1,218,618 | | |
| | 92,770 | | | #,S | | Power Receivable
Finance, LLC, 6.290%,
due 01/01/12 | | | 96,937 | | |
| | 128,000 | | | C, L | | Residential Capital Corp.,
8.375%, due 06/30/15 | | | 78,080 | | |
| | 829,000 | | | C,S | | Residential Capital, LLC,
8.000%, due 04/17/13 | | | 513,980 | | |
| | 1,341,000 | | | C,S | | Southern Star Central Corp.,
6.750%, due 03/01/16 | | | 1,290,713 | | |
| | 1,122,000 | | | @@,#,S | | TNK-BP Finance SA, 7.500%,
due 07/18/16 | | | 1,089,743 | | |
| | 5,212,395 | | | #, S,Z | | Toll Road Investors
Partnership II LP, 1
15.740%, due 02/15/45 | | | 752,196 | | |
| | 430,000 | | | #,C,S | | Twin Reefs Pass-
Through Trust, 6.243%,
due 12/10/49 | | | 280,390 | | |
| | 848,000 | | | @@,C,S | | UFJ Finance Aruba AEC,
8.750%, due 12/31/49 | | | 859,578 | | |
| | 446,000 | | | #,C,S | | Wachovia Capital Trust V,
7.965%, due 06/01/27 | | | 464,848 | | |
| | | | 32,405,664 | | |
Principal
Amount | | | | | | Value | |
| | | | | Electric: 0.7% | |
| $ | 1,721,000 | | | C,S | | Commonwealth Edison Co.,
6.950%, due 07/15/18 | | $ | 1,748,966 | | |
| | 224,000 | | | @@,L | | Empresa Nacional de
Electricidad SA, 8.625%,
due 08/01/15 | | | 258,782 | | |
| | 460,000 | | | @@,#,C,S | | Intergen NV, 9.000%,
due 06/30/17 | | | 486,450 | | |
| | 534,366 | | | #,C,S | | Juniper Generation, LLC,
6.790%, due 12/31/14 | | | 555,826 | | |
| | 1,040,000 | | | C,S | | Nevada Power Co., 5.950%,
due 03/15/16 | | | 1,036,198 | | |
| | 417,000 | | | C,S | | Nevada Power Co., 6.750%,
due 07/01/37 | | | 433,135 | | |
| | 1,214,000 | | | C,S | | NorthWestern Corp.,
5.875%, due 11/01/14 | | | 1,198,216 | | |
| | 1,113,000 | | | C,S | | Sierra Pacific Power Co.,
6.250%, due 04/15/12 | | | 1,147,816 | | |
| | 319,000 | | | #,S | | White Pine Hydro
Portfolio, LLC, 6.960%,
due 07/10/37 | | | 330,990 | | |
| | 479,000 | | | #,S | | White Pine Hydro
Portfolio, LLC, 7.260%,
due 07/20/15 | | | 497,270 | | |
| | | | 7,693,649 | | |
| | | | | Energy-Alternate Sources: 0.2% | |
| | 600,000 | | | S | | Greater Ohio Ethanol, LLC,
8.864%, due 12/31/13 | | | 579,000 | | |
| | 700,000 | | | S | | Greater Ohio Ethanol, LLC,
12.630%, due 12/31/13 | | | 640,063 | | |
| | 467,000 | | | #,S | | White Pine Hydro, LLC,
6.310%, due 07/10/17 | | | 489,829 | | |
| | | | 1,708,892 | | |
| | | | | Food: 0.1% | |
| | 782,000 | | | S | | Kraft Foods, Inc., 6.125%,
due 02/01/18 | | | 789,449 | | |
| | 480,000 | | | S | | Kraft Foods, Inc., 6.875%,
due 02/01/38 | | | 499,946 | | |
| | | | 1,289,395 | | |
| | | | | Gas: 0.3% | |
| | 993,000 | | | @@,#,C,S | | Nakilat, Inc., 6.067%,
due 12/31/33 | | | 908,878 | | |
| | 203,000 | | | #,C,S | | Nakilat, Inc., 6.267%,
due 12/31/33 | | | 185,136 | | |
| | 2,447,000 | | | C, L | | Southern Union Co.,
7.200%, due 11/01/66 | | | 2,419,055 | | |
| | | | 3,513,069 | | |
| | | | | Healthcare-Products: 0.1% | |
| | 703,000 | | | C,S | | Baxter International, Inc.,
6.250%, due 12/01/37 | | | 723,783 | | |
| | | | 723,783 | | |
| | | | | Insurance: 0.4% | |
| | 1,355,000 | | | @@,C,S | | Aegon NV, 5.399%,
due 12/31/49 | | | 976,786 | | |
| | 1,045,000 | | | S | | American International
Group, Inc., 5.850%,
due 01/16/18 | | | 1,053,824 | | |
| | 729,000 | | | #,C,S | | Metlife Capital Trust IV,
7.875%, due 12/15/37 | | | 744,916 | | |
See Accompanying Notes to Financial Statements
73
PORTFOLIO OF INVESTMENTS
ING VP BALANCED PORTFOLIO AS OF DECEMBER 31, 2007 (CONTINUED)
Principal
Amount | | | | | | Value | |
| | | | | Insurance (continued) | |
| $ | 368,000 | | | #,C,S | | North Front Pass-
Through Trust, 5.810%,
due 12/15/24 | | $ | 352,602 | | |
| | 491,000 | | | S | | Prudential Financial, Inc.,
6.000%, due 12/01/17 | | | 489,879 | | |
| | 533,000 | | | S | | Prudential Financial, Inc.,
6.625%, due 12/01/37 | | | 539,231 | | |
| | | | 4,157,238 | | |
| | | | | Media: 0.1% | |
| | 445,000 | | | C,S | | Dex Media West, LLC,
9.875%, due 08/15/13 | | | 463,913 | | |
| | 494,000 | | | #,C,S | | News America, Inc.,
6.650%, due 11/15/37 | | | 511,228 | | |
| | | | 975,141 | | |
| | | | | Miscellaneous Manufacturing: 0.1% | |
| | 1,073,000 | | | S | | General Electric Co.,
5.250%, due 12/06/17 | | | 1,072,762 | | |
| | | | 1,072,762 | | |
| | | | | Multi-National: 0.1% | |
| | 669,000 | | | @@,S | | Corp. Andina de
Fomento CAF, 5.125%,
due 05/05/15 | | | 647,350 | | |
| | | | 647,350 | | |
| | | | | Oil & Gas: 0.5% | |
| | 459,000 | | | @@,#,S | | Empresa Nacional de
Petroleo ENAP, 4.875%,
due 03/15/14 | | | 445,029 | | |
| | 331,000 | | | @@,#,S | | Empresa Nacional de
Petroleo ENAP, 6.750%,
due 11/15/12 | | | 353,299 | | |
| | 1,003,000 | | | @@,#,S | | Pemex Project Funding
Master Trust, 6.291%,
due 06/15/10 | | | 1,019,550 | | |
| | 878,000 | | | @@,C,L | | Pemex Project Funding
Master Trust, 6.625%,
due 06/15/35 | | | 929,832 | | |
| | 930,000 | | | @@,#,C,S | | Ras Laffan Liquefied
Natural Gas Co., Ltd. II,
5.298%, due 09/30/20 | | | 904,681 | | |
| | 922,000 | | | @@,C,S | | Transocean, Inc., 6.000%,
due 03/15/18 | | | 921,276 | | |
| | 797,000 | | | @@,C,S | | Transocean, Inc., 6.800%,
due 03/15/38 | | | 815,850 | | |
| | | | 5,389,517 | | |
| | | | | Pipelines: 0.3% | |
| | 645,000 | | | #,C,S | | NGPL PipeCo, LLC, 7.119%,
due 12/15/17 | | | 662,523 | | |
| | 544,000 | | | #,C,S | | NGPL PipeCo, LLC, 7.768%,
due 12/15/37 | | | 570,863 | | |
| | 345,000 | | | C,L | | Northwest Pipeline Corp.,
7.000%, due 06/15/16 | | | 369,150 | | |
| | 536,000 | | | C,S | | Panhandle Eastern
Pipe Line, 6.200%,
due 11/01/17 | | | 529,784 | | |
| | 316,000 | | | @@,C,S | | Trans-Canada Pipelines,
6.200%, due 10/15/37 | | | 314,813 | | |
| | 460,000 | | | C,S | | Transcontinental Gas
Pipe Line Corp., 6.400%,
due 04/15/16 | | | 474,375 | | |
| | | | 2,921,508 | | |
Principal
Amount | | | | | | Value | |
| | | | | Real Estate: 0.1% | |
| $ | 366,000 | | | C,S | | Istar Financial, Inc.,
5.150%, due 03/01/12 | | $ | 316,588 | | |
| | 111,000 | | | C,L | | Istar Financial, Inc.,
5.500%, due 06/15/12 | | | 96,536 | | |
| | 297,000 | | | C,S | | Istar Financial, Inc.,
5.850%, due 03/15/17 | | | 244,528 | | |
| | 162,000 | | | C,S | | Liberty Property LP,
6.375%, due 08/15/12 | | | 169,202 | | |
| | 532,000 | | | C,S | | Liberty Property LP,
7.750%, due 04/15/09 | | | 546,723 | | |
| | | | 1,373,577 | | |
| | | | | Regional Malls: 0.2% | |
| | 134,000 | | | C,S | | Rouse Co., 7.200%,
due 09/15/12 | | | 128,266 | | |
| | 2,190,000 | | | #,C,S | | Rouse Co. LP/TRC
Co.-Issuer, Inc., 6.750%,
due 05/01/13 | | | 2,045,333 | | |
| | | | 2,173,599 | | |
| | | | | Retail: 0.6% | |
| | 414,000 | | | C,S | | Darden Restaurants, Inc.,
5.625%, due 10/15/12 | | | 421,240 | | |
| | 641,000 | | | @@,#,C,S | | Marks & Spencer PLC,
7.125%, due 12/01/37 | | | 611,500 | | |
| | 311,000 | | | C,S | | McDonald's Corp., 5.800%,
due 10/15/17 | | | 322,603 | | |
| | 353,000 | | | C,S | | Nordstrom, Inc., 6.250%,
due 01/15/18 | | | 362,052 | | |
| | 485,000 | | | C,S | | Nordstrom, Inc., 7.000%,
due 01/15/38 | | | 501,354 | | |
| | 120,000 | | | C,S | | Rite Aid Corp., 9.375%,
due 12/15/15 | | | 100,200 | | |
| | 711,000 | | | C,S | | Rite Aid Corp., 9.500%,
due 06/15/17 | | | 591,908 | | |
| | 1,352,000 | | | C,S | | Target Corp., 6.500%,
due 10/15/37 | | | 1,363,372 | | |
| | 273,000 | | | S | | Wal-Mart Stores, Inc.,
5.250%, due 09/01/35 | | | 242,986 | | |
| | 1,267,000 | | | S | | Wal-Mart Stores, Inc.,
6.500%, due 08/15/37 | | | 1,338,672 | | |
| | | | 5,855,887 | | |
| | | | | Savings & Loans: 0.0% | |
| | 100,000 | | | #,C,S | | Washington Mutual IV,
9.750%, due 10/29/49 | | | 80,117 | | |
| | 300,000 | | | #,C,S | | Washington Mutual
Preferred Funding
Delaware, 6.534%,
due 03/15/11 | | | 185,670 | | |
| | | | 265,787 | | |
| | | | | Telecommunications: 0.2% | |
| | 1,263,000 | | | S | | Bellsouth
Telecommunications, Inc.,
7.000%, due 12/01/95 | | | 1,321,827 | | |
| | 69,000 | | | C,S | | Embarq Corp., 7.995%,
due 06/01/36 | | | 72,925 | | |
| | 597,000 | | | @@,C,S | | Rogers Wireless, Inc.,
7.250%, due 12/15/12 | | | 647,759 | | |
| | | | 2,042,511 | | |
See Accompanying Notes to Financial Statements
74
PORTFOLIO OF INVESTMENTS
ING VP BALANCED PORTFOLIO AS OF DECEMBER 31, 2007 (CONTINUED)
Principal
Amount | | | | | | Value | |
| | | | | Water: 0.1% | |
| $ | 441,000 | | | #,C,S | | American Water
Capital Corp., 6.085%,
due 10/15/17 | | $ | 440,317 | | |
| | 441,000 | | | #,C,S | | American Water
Capital Corp., 6.593%,
due 10/15/37 | | | 432,946 | | |
| | | | 873,263 | | |
Total Corporate Bonds/Notes
(Cost $114,826,676) | | | 111,091,080 | | |
| U.S. GOVERNMENT AGENCY OBLIGATIONS: 9.3% | | | |
| | | | | Federal Home Loan Bank: 0.1% | |
| | 1,220,000 | | | S | | 5.000%, due 10/13/11 | | | 1,272,719 | | |
| | | | 1,272,719 | | |
| | | | | | | Federal Home Loan
Mortgage Corporation: 6.5% | | | | | |
| | 172,180 | | | C,S | | 4.500%, due 12/15/16 | | | 172,325 | | |
| | 2,087,000 | | | C,S | | 4.500%, due 02/15/20 | | | 2,002,339 | | |
| | 2,862,000 | | | S,Z | | 4.940%, due 03/15/31 | | | 922,065 | | |
| | 1,444,000 | | | C,S | | 5.000%, due 12/11/12 | | | 1,450,697 | | |
| | 2,095,253 | | | C,S | | 5.000%, due 08/15/16 | | | 2,106,856 | | |
| | 1,456,000 | | | C,S | | 5.000%, due 12/15/17 | | | 1,461,867 | | |
| | 955,000 | | | C,S | | 5.000%, due 05/15/20 | | | 952,159 | | |
| | 1,846,935 | | | C,S | | 5.000%, due 08/15/21 | | | 1,854,605 | | |
| | 2,435,000 | | | C,S | | 5.000%, due 04/15/23 | | | 2,373,416 | | |
| | 902,000 | | | C,S | | 5.000%, due 09/15/31 | | | 862,790 | | |
| | 343,000 | | | C,S | | 5.000%, due 02/15/32 | | | 333,083 | | |
| | 1,949,000 | | | C,S | | 5.000%, due 03/15/32 | | | 1,893,937 | | |
| | 341,000 | | | C,S | | 5.000%, due 04/15/32 | | | 336,661 | | |
| | 8,000,000 | | | W | | 5.000%, due 02/15/35 | | | 7,801,248 | | |
| | 331,206 | | | S | | 5.001%, due 04/01/35 | | | 325,303 | | |
| | 2,173,000 | | | C,S | | 5.250%, due 03/15/12 | | | 2,185,679 | | |
| | 3,339,503 | | | C,S | | 5.378%, due 05/15/33 | | | 3,309,812 | | |
| | 4,531,619 | | | C,S | | 5.500%, due 08/15/20 | | | 4,426,480 | | |
| | 574,000 | | | C,S | | 5.500%, due 12/15/20 | | | 573,032 | | |
| | 367,000 | | | C,S | | 5.500%, due 09/15/32 | | | 363,016 | | |
| | 344,000 | | | C,S | | 5.500%, due 10/15/32 | | | 341,599 | | |
| | 306,000 | | | C,S | | 5.500%, due 11/15/32 | | | 300,900 | | |
| | 367,000 | | | C,S | | 5.500%, due 07/15/33 | | | 364,876 | | |
| | 461,332 | | | S | | 5.500%, due 06/01/36 | | | 455,910 | | |
| | 7,127,000 | | | W | | 5.500%, due 02/12/37 | | | 7,108,071 | | |
| | 6,970,111 | | | C,S | | 6.000%, due 01/15/29 | | | 7,131,779 | | |
| | 14,208,000 | | | W | | 6.000%, due 02/01/34 | | | 14,405,576 | | |
| | 275,253 | | | S | | 6.500%, due 11/01/28 | | | 285,360 | | |
| | 56,358 | | | S | | 6.500%, due 12/01/31 | | | 58,289 | | |
| | 2,336,000 | | | | | 6.500%, due 02/01/34 | | | 2,399,144 | | |
| | | | 68,558,874 | | |
| | | | | | | Federal National
Mortgage Corporation: 2.4% | | | | | |
| | 2,103,000 | | | L | | 4.750%, due 11/19/12 | | | 2,178,685 | | |
| | 27,242 | | | C,S | | 4.750%, due 12/25/42 | | | 27,169 | | |
| | 1,099,000 | | | W | | 5.000%, due 02/15/20 | | | 1,099,515 | | |
| | 1,163,711 | | | S | | 5.000%, due 02/25/29 | | | 1,167,353 | | |
| | 5,464,022 | | | S | | 5.000%, due 08/01/37 | | | 5,251,256 | | |
| | 1,136,000 | | | C,S | | 5.400%, due 03/26/12 | | | 1,140,208 | | |
| | 1,867,000 | | | S | | 5.500%, due 05/25/30 | | | 1,858,562 | | |
| | 488,084 | | | S | | 5.500%, due 07/01/36 | | | 482,806 | | |
| | 74,884 | | | S | | 6.000%, due 06/01/16 | | | 76,763 | | |
| | 365,874 | | | S | | 6.000%, due 07/01/16 | | | 375,054 | | |
| | 111,846 | | | S | | 6.000%, due 08/01/16 | | | 114,652 | | |
Principal
Amount | | | | | | Value | |
| $ | 887 | | | | | 6.000%, due 10/01/16 | | $ | 909 | | |
| | 97,739 | | | S | | 6.000%, due 10/01/16 | | | 100,192 | | |
| | 434,157 | | | S | | 6.000%, due 03/01/17 | | | 445,132 | | |
| | 176,083 | | | S | | 6.000%, due 04/01/17 | | | 180,533 | | |
| | 263,511 | | | S | | 6.000%, due 06/01/17 | | | 270,172 | | |
| | 52,552 | | | S | | 6.000%, due 09/01/17 | | | 53,881 | | |
| | 73,208 | | | S | | 6.000%, due 10/01/17 | | | 75,059 | | |
| | 251,648 | | | S | | 6.000%, due 11/01/17 | | | 257,962 | | |
| | 278,356 | | | S | | 6.000%, due 12/01/17 | | | 285,392 | | |
| | 246,696 | | | S | | 6.000%, due 12/01/18 | | | 252,565 | | |
| | 3,667,471 | | | S | | 6.000%, due 07/25/29 | | | 3,764,158 | | |
| | 1,961,669 | | | S | | 6.000%, due 04/25/31 | | | 2,024,073 | | |
| | 2,054,000 | | | | | 6.500%, due 02/12/37 | | | 2,109,522 | | |
| | 36,504 | | | S | | 7.000%, due 06/01/29 | | | 38,507 | | |
| | 805 | | | | | 7.000%, due 08/01/29 | | | 850 | | |
| | 5,082 | | | S | | 7.000%, due 10/01/29 | | | 5,361 | | |
| | 83,243 | | | S | | 7.000%, due 01/01/30 | | | 87,821 | | |
| | 1,158,760 | | | S | | 7.000%, due 06/01/31 | | | 1,222,403 | | |
| | 12,056 | | | S | | 7.000%, due 10/01/31 | | | 12,709 | | |
| | 25,725 | | | S | | 7.000%, due 01/01/32 | | | 27,119 | | |
| | 6,989 | | | S | | 7.000%, due 04/01/32 | | | 7,360 | | |
| | 14,253 | | | S | | 7.000%, due 05/01/32 | | | 15,010 | | |
| | 37,966 | | | S | | 7.000%, due 07/01/32 | | | 39,982 | | |
| | 11,129 | | | S | | 7.500%, due 11/01/29 | | | 11,900 | | |
| | 70,252 | | | S | | 7.500%, due 10/01/30 | | | 75,008 | | |
| | 109,263 | | | S | | 7.500%, due 11/01/30 | | | 116,660 | | |
| | 596,473 | | | C,S | | 7.500%, due 01/25/48 | | | 623,989 | | |
| | | | 25,876,252 | | |
| Government National Mortgage Association: 0.3% | | | |
| | 23,694 | | | S | | 6.125%, due 12/20/29 | | | 23,964 | | |
| | 91,820 | | | S | | 6.375%, due 04/20/28 | | | 92,847 | | |
| | 134,277 | | | S | | 6.500%, due 10/15/31 | | | 139,237 | | |
| | 418,508 | | | S | | 7.000%, due 09/15/24 | | | 444,440 | | |
| | 703,298 | | | S | | 7.000%, due 10/15/24 | | | 746,870 | | |
| | 120,473 | | | S | | 7.000%, due 11/15/24 | | | 127,928 | | |
| | 1,098,487 | | | S | | 7.500%, due 12/15/23 | | | 1,171,095 | | |
| | | | 2,746,381 | | |
Total U.S. Government
Agency Obligations
(Cost $97,932,527) | | | 98,454,226 | | |
| U.S. TREASURY OBLIGATIONS: 10.0% | | | |
| | | | | U.S. Treasury Bonds: 1.0% | |
| | 5,165,000 | | | L | | 4.250%, due 11/15/17 | | | 5,256,601 | | |
| | 4,610,000 | | | L | | 4.750%, due 02/15/37 | | | 4,826,098 | | |
| | | | 10,082,699 | | |
| | | | | U.S. Treasury Notes: 8.0% | |
| | 65,568,000 | | | L | | 3.125%, due 11/30/09 | | | 65,660,254 | | |
| | 14,756,000 | | | L | | 3.375%, due 11/30/12 | | | 14,711,053 | | |
| | 4,094,000 | | | L | | 4.500%, due 05/15/10 | | | 4,231,853 | | |
| | | | 84,603,160 | | |
| | | | | | | Treasury Inflation Indexed Protected
Securities: 1.0% | | | | | |
| | 2,014,753 | | | L | | 2.375%, due 04/15/11 | | | 2,100,696 | | |
| | 1,957,117 | | | S | | 2.375%, due 01/15/17 | | | 2,065,829 | | |
| | 1,958,596 | | | L | | 2.375%, due 01/15/25 | | | 2,056,833 | | |
| | 4,112,472 | | | L | | 3.875%, due 01/15/09 | | | 4,235,205 | | |
| | | | 10,458,563 | | |
Total U.S. Treasury
Obligations
(Cost $104,648,827) | | | 105,144,422 | | |
See Accompanying Notes to Financial Statements
75
PORTFOLIO OF INVESTMENTS
ING VP BALANCED PORTFOLIO AS OF DECEMBER 31, 2007 (CONTINUED)
Principal
Amount | | | | | | Value | |
| ASSET-BACKED SECURITIES: 1.0% | | | |
| | | | | | | Automobile Asset-Backed
Securities: 0.0% | | | | | |
| $ | 53,233 | | | C,S | | AmeriCredit Automobile
Receivables Trust,
4.220%, due 07/06/09 | | $ | 53,162 | | |
| | | | 53,162 | | |
| | | | | Credit Card Asset-Backed Securities: 0.1% | |
| | 12,000 | | | C,S | | Bank One Issuance Trust,
4.540%, due 09/15/10 | | | 11,999 | | |
| | 553,000 | | | C,S | | Citibank Credit Card
Issuance Trust, 5.650%,
due 09/20/19 | | | 561,986 | | |
| | | | 573,985 | | |
| | | | | | | Home Equity Asset-Backed
Securities: 0.3% | | | | | |
| | 2,707,000 | | | C,S | | GSAA Trust, 5.242%,
due 06/25/34 | | | 2,706,857 | | |
| | 428,000 | | | #,C,S | | Irwin Home Equity, 5.960%,
due 08/25/37 | | | 376,506 | | |
| | 153,045 | | | C,S | | Merrill Lynch Mortgage
Investors, Inc., 5.225%,
due 07/25/34 | | | 148,697 | | |
| | 356 | | | C | | Renaissance Home Equity
Loan Trust, 4.456%,
due 05/25/35 | | | 354 | | |
| | 428,000 | | | C,S | | Residential Funding
Mortgage Securities II, Inc.,
5.890%, due 05/25/37 | | | 417,980 | | |
| | | | 3,650,394 | | |
| | | | | Other Asset-Backed Securities: 0.6% | |
| | 118,113 | | | C,S | | Amortizing Residential
Collateral Trust, 5.365%,
due 05/25/32 | | | 105,563 | | |
| | 2,274 | | | C,S | | Chase Funding
Mortgage Loan, 4.045%,
due 05/25/33 | | | 2,213 | | |
| | 125,362 | | | C,S | | Chase Funding
Mortgage Loan, 5.165%,
due 07/25/33 | | | 124,275 | | |
| | 283 | | | C | | Countrywide Asset-Backed
Certificates, 4.493%,
due 02/25/36 | | | 282 | | |
| | 104,000 | | | C,S | | Countrywide Asset-Backed
Certificates, 5.689%,
due 10/25/46 | | | 97,139 | | |
| | 987,000 | | | C,S | | Credit-Based Asset Servicing
and Securitization, LLC,
4.831%, due 08/25/35 | | | 968,194 | | |
| | 1,583,000 | | | C,S | | Credit-Based Asset Servicing
and Securitization, LLC,
5.501%, due 12/25/36 | | | 1,564,313 | | |
| | 459,000 | | | #,C,S | | Credit-Based Asset Servicing
and Securitization, LLC,
5.746%, due 12/25/37 | | | 452,904 | | |
| | 241,000 | | | #,C,S | | Credit-Based Asset Servicing
and Securitization, LLC,
6.020%, due 12/25/37 | | | 230,193 | | |
Principal
Amount | | | | | | Value | |
| $ | 748,000 | | | C,S | | Equity One, Inc., 5.050%,
due 09/25/33 | | $ | 727,427 | | |
| | 121,931 | | | C,S | | Fannie Mae, 5.005%,
due 04/25/35 | | | 121,959 | | |
| | 927,000 | | | #,C,S | | Hudson Mezzanine Funding,
5.982%, due 06/12/42 | | | 23,175 | | |
| | 719,000 | | | C,S | | Merrill Lynch Mortgage
Investors, Inc., 5.609%,
due 03/25/37 | | | 713,775 | | |
| | 2,249 | | | C,S | | Popular Mortgage
Pass-Through Trust,
4.000%, due 12/25/34 | | | 2,220 | | |
| | 1,580 | | | C,S | | Popular Mortgage
Pass-Through Trust,
4.596%, due 11/25/35 | | | 1,574 | | |
| | 796,000 | | | C,S | | Renaissance Home Equity
Loan Trust, 5.608%,
due 05/25/36 | | | 789,323 | | |
| | 39,221 | | | C,S | | Residential Asset Mortgage
Products, Inc., 5.485%,
due 06/25/33 | | | 38,882 | | |
| | 482,300 | | | C,S | | Structured Asset
Securities Corp., 4.910%,
due 06/25/33 | | | 482,503 | | |
| | 249,466 | | | C,S | | Structured Asset
Securities Corp., 6.000%,
due 03/25/34 | | | 249,133 | | |
| | | | 6,695,047 | | |
Total Asset-Backed Securities
(Cost $12,007,803) | | | 10,972,588 | | |
| COLLATERALIZED MORTGAGE OBLIGATIONS: 9.5% | | | |
| | 810,268 | | | C,S | | American Home
Mortgage Assets, 5.708%,
due 11/25/46 | | | 761,620 | | |
| | 1,069,128 | | | #,S | | Astoria Depositor Corp.,
7.902%, due 05/01/21 | | | 1,111,893 | | |
| | 162,787 | | | C,S | | Banc of America
Alternative Loan Trust,
6.493%, due 04/25/37 | | | 162,760 | | |
| | 19,900,941 | | | C,S,^ | | Banc of America Commercial
Mortgage, Inc., 0.292%,
due 01/15/49 | | | 412,274 | | |
| | 100,000 | | | C,S | | Banc of America Commercial
Mortgage, Inc., 4.161%,
due 12/10/42 | | | 99,287 | | |
| | 60,000 | | | C,S | | Banc of America Commercial
Mortgage, Inc., 4.429%,
due 11/10/39 | | | 59,369 | | |
| | 10,000 | | | C,S | | Banc of America Commercial
Mortgage, Inc., 4.502%,
due 07/10/42 | | | 9,928 | | |
| | 8,323 | | | C,S | | Banc of America Commercial
Mortgage, Inc., 4.772%,
due 07/11/43 | | | 8,349 | | |
| | 10,000 | | | C,S | | Banc of America Commercial
Mortgage, Inc., 4.877%,
due 11/10/42 | | | 9,978 | | |
| | 10,000 | �� | | C,S | | Banc of America Commercial
Mortgage, Inc., 4.891%,
due 07/10/45 | | | 9,880 | | |
See Accompanying Notes to Financial Statements
76
PORTFOLIO OF INVESTMENTS
ING VP BALANCED PORTFOLIO AS OF DECEMBER 31, 2007 (CONTINUED)
Principal
Amount | | | | | | Value | |
| COLLATERALIZED MORTGAGE OBLIGATIONS (continued) | | | |
| $ | 516,000 | | | C,S | | Banc of America Commercial
Mortgage, Inc., 5.463%,
due 09/10/47 | | $ | 474,436 | | |
| | 160,000 | | | C,S | | Banc of America Commercial
Mortgage, Inc., 6.186%,
due 06/11/35 | | | 167,906 | | |
| | 1,579,940 | | | C,S | | Banc of America
Funding Corp., 5.260%,
due 09/20/35 | | | 1,529,966 | | |
| | 3,056,993 | | | C,S | | Banc of America
Funding Corp., 5.653%,
due 06/20/37 | | | 2,978,995 | | |
| | 2,338,636 | | | C,S | | Banc of America
Funding Corp., 5.750%,
due 09/20/34 | | | 2,297,839 | | |
| | 796,444 | | | C,S | | Banc of America
Funding Corp., 5.843%,
due 05/20/36 | | | 786,152 | | |
| | 551,761 | | | C,S | | Banc of America
Funding Corp., 7.000%,
due 10/25/37 | | | 560,390 | | |
| | 976,069 | | | C,S | | Banc of America Mortgage
Securities, Inc., 5.177%,
due 09/25/35 | | | 953,390 | | |
| | 772,854 | | | C,S | | Banc of America Mortgage
Securities, Inc., 5.250%,
due 11/25/19 | | | 769,741 | | |
| | 807,327 | | | C,S | | Banc of America Mortgage
Securities, Inc., 5.500%,
due 11/25/33 | | | 780,625 | | |
| | 1,554,631 | | | C,S | | Banc of America Mortgage
Securities, Inc., 5.500%,
due 06/25/35 | | | 1,556,806 | | |
| | 242,134 | | | C,S | | Bear Stearns
Alternative-A Trust,
5.185%, due 07/25/34 | | | 241,665 | | |
| | 26,000 | | | C,S | | Bear Stearns Commercial
Mortgage Securities,
4.030%, due 02/13/46 | | | 25,759 | | |
| | 392,000 | | | S | | Bear Stearns Commercial
Mortgage Securities,
5.660%, due 09/11/41 | | | 366,598 | | |
| | 1,000 | | | C | | Capco America
Securitization Corp.,
6.460%, due 10/15/30 | | | 1,009 | | |
| | 1,924,676 | | | C,S | | Chase Manhattan Bank-First
Union National Bank,
7.439%, due 08/15/31 | | | 1,991,409 | | |
| | 2,262,038 | | | C,S | | Chase Mortgage
Finance Corp., 5.409%,
due 12/25/35 | | | 2,264,259 | | |
| | 1,300,183 | | | C,S | | Chase Mortgage
Finance Corp., 5.500%,
due 11/25/35 | | | 1,300,924 | | |
| | 780,351 | | | C,S | | Chaseflex Trust, 6.500%,
due 02/25/37 | | | 784,496 | | |
| | 663,849 | | | C,S | | Citigroup Mortgage
Loan Trust, Inc., 5.612%,
due 04/25/37 | | | 656,958 | | |
| | 172,303 | | | C,S | | Citigroup Mortgage
Loan Trust, Inc., 5.940%,
due 06/25/36 | | | 170,804 | | |
Principal
Amount | | | | | | Value | |
| $ | 2,439,574 | | | C,S | | Citigroup Mortgage
Loan Trust, Inc., 6.000%,
due 11/25/35 | | $ | 2,442,183 | | |
| | 935,116 | | | C,S | | Citigroup Mortgage
Securities, Inc., 5.500%,
due 02/25/22 | | | 945,496 | | |
| | 444,000 | | | C,S | | Commercial Mortgage
Pass-Through Certificates,
4.221%, due 03/10/39 | | | 439,578 | | |
| | 15,000 | | | C,S | | Commercial Mortgage
Pass-Through Certificates,
3.600%, due 03/10/39 | | | 14,817 | | |
| | 88,418 | | | C,S | | Countrywide Alternative
Loan Trust, 5.165%,
due 02/25/35 | | | 87,114 | | |
| | 24,763 | | | C,S | �� | Countrywide Alternative
Loan Trust, 5.407%,
due 10/25/35 | | | 24,747 | | |
| | 1,914,275 | | | C,S | | Countrywide Alternative
Loan Trust, 5.500%,
due 02/25/25 | | | 1,847,169 | | |
| | 665,253 | | | C,S | | Countrywide Alternative
Loan Trust, 5.668%,
due 11/25/46 | | | 599,127 | | |
| | 90,912 | | | C,S | | Countrywide Alternative
Loan Trust, 6.000%,
due 05/25/36 | | | 90,634 | | |
| | 564,708 | | | C,S | | Countrywide Home Loan
Mortgage Pass-Through
Trust, 5.250%,
due 10/25/35 | | | 530,429 | | |
| | 585,651 | | | C,S | | Credit Suisse First Boston
Mortgage Securities Corp.,
3.727%, due 03/15/35 | | | 570,656 | | |
| | 394,741 | | | C,S | | Credit Suisse First Boston
Mortgage Securities Corp.,
3.819%, due 05/15/36 | | | 386,554 | | |
| | 10,000 | | | C,S | | Credit Suisse First Boston
Mortgage Securities Corp.,
4.801%, due 03/15/36 | | | 9,956 | | |
| | 8,000 | | | C,S | | Credit Suisse First Boston
Mortgage Securities Corp.,
7.560%, due 04/15/62 | | | 8,560 | | |
| | 1,236,760 | | | C,S | | Credit Suisse Mortgage
Capital Certificates,
7.000%, due 08/25/36 | | | 1,249,473 | | |
| | 36,715 | | | C,S | | DLJ Commercial
Mortgage Corp., 6.240%,
due 11/12/31 | | | 36,903 | | |
| | 108,900 | | | C,S | | DLJ Commercial
Mortgage Corp., 7.300%,
due 06/10/32 | | | 111,973 | | |
| | 949,341 | | | C,S | | First Horizon Alternative
Mortgage Securities,
5.500%, due 08/25/35 | | | 927,687 | | |
| | 571,162 | | | C,S | | First Horizon Asset
Securities, Inc., 5.390%,
due 10/25/35 | | | 569,887 | | |
| | 770,640 | | | C,S | | First Horizon Asset
Securities, Inc., 5.500%,
due 12/25/35 | | | 770,219 | | |
| | 1,500,000 | | | C,S | | First Union National Bank
Commercial Mortgage,
6.663%, due 01/12/43 | | | 1,579,549 | | |
See Accompanying Notes to Financial Statements
77
PORTFOLIO OF INVESTMENTS
ING VP BALANCED PORTFOLIO AS OF DECEMBER 31, 2007 (CONTINUED)
Principal
Amount | | | | | | Value | |
| COLLATERALIZED MORTGAGE OBLIGATIONS (continued) | | | |
| $ | 19,612,903 | | | C,S,^ | | GE Capital Commercial
Mortgage Corp., 0.507%,
due 06/10/48 | | $ | 299,921 | | |
| | 578,191 | | | C,S | | GE Capital Commercial
Mortgage Corp., 3.752%,
due 07/10/39 | | | 572,483 | | |
| | 1,000 | | | C | | GE Capital Commercial
Mortgage Corp., 4.865%,
due 07/10/39 | | | 1,004 | | |
| | 249,971 | | | C,S | | GE Capital Commercial
Mortgage Corp., 5.560%,
due 06/10/38 | | | 253,628 | | |
| | 1,461,393 | | | C,S | | GMAC Mortgage Corp.
Loan Trust, 4.583%,
due 10/19/33 | | | 1,426,089 | | |
| | 1,738,697 | | | C,S | | GMAC Mortgage Corp.
Loan Trust, 5.259%,
due 03/18/35 | | | 1,684,243 | | |
| | 169,064 | | | C,S | | GMAC Mortgage Corp.
Loan Trust, 5.461%,
due 11/19/35 | | | 165,950 | | |
| | 15,686,014 | | | #,C,S,^ | | Greenwich Capital
Commercial Funding Corp.,
0.323%, due 03/10/39 | | | 336,020 | | |
| | 870,000 | | | C,S | | Greenwich Capital
Commercial Funding Corp.,
5.117%, due 04/10/37 | | | 872,062 | | |
| | 474,000 | | | C,S | | Greenwich Capital
Commercial Funding Corp.,
5.534%, due 03/10/39 | | | 430,581 | | |
| | 240,000 | | | C,S | | Greenwich Capital
Commercial Funding Corp.,
5.554%, due 03/10/39 | | | 215,401 | | |
| | 192,000 | | | C,S | | Greenwich Capital
Commercial Funding Corp.,
5.613%, due 03/10/39 | | | 162,953 | | |
| | 684,000 | | | C,S | | GS Mortgage
Securities Corp. II,
5.627%, due 04/10/38 | | | 620,275 | | |
| | 927,205 | | | #,C,S | | GSMPS 2005-RP1 1AF,
5.215%, due 01/25/35 | | | 916,571 | | |
| | 813,796 | | | #,C,S | | GSMPS Mortgage
Loan Trust, 5.189%,
due 04/25/36 | | | 806,382 | | |
| | 428,185 | | | C,S | | GSR Mortgage Loan Trust,
5.500%, due 07/25/35 | | | 422,247 | | |
| | 251,676 | | | C,S | | Harborview Mortgage
Loan Trust, 5.315%,
due 01/19/35 | | | 243,078 | | |
| | 345,269 | | | C,S | | Homebanc Mortgage Trust,
5.295%, due 08/25/29 | | | 345,068 | | |
| | 247,424 | | | C,S | | JPMorgan Alternative
Loan Trust, 5.507%,
due 01/25/36 | | | 245,057 | | |
| | 57,561,960 | | | C,S,^ | | JPMorgan Chase
Commercial Mortgage
Securities Corp., 0.046%,
due 01/12/43 | | | 75,222 | | |
| | 15,000 | | | C,S | | JPMorgan Chase
Commercial Mortgage
Securities Corp., 4.223%,
due 01/15/42 | | | 14,892 | | |
Principal
Amount | | | | | | Value | |
| $ | 1,000,000 | | | C,S | | JPMorgan Chase
Commercial Mortgage
Securities Corp., 4.262%,
due 08/12/40 | | $ | 993,401 | | |
| | 14,000 | | | C,S | | JPMorgan Chase
Commercial Mortgage
Securities Corp., 4.865%,
due 03/15/46 | | | 13,807 | | |
| | 468,000 | | | C,S | | JPMorgan Chase
Commercial Mortgage
Securities Corp., 5.298%,
due 05/15/47 | | | 468,943 | | |
| | 152,000 | | | C,S | | JPMorgan Chase
Commercial Mortgage
Securities Corp., 5.455%,
due 05/15/47 | | | 142,938 | | |
| | 304,000 | | | C,S | | JPMorgan Chase
Commercial Mortgage
Securities Corp., 5.495%,
due 05/15/47 | | | 279,054 | | |
| | 141,856 | | | C,S | | JPMorgan Chase
Commercial Mortgage
Securities Corp., 5.833%,
due 04/15/45 | | | 143,698 | | |
| | 877,000 | | | C,S | | JPMorgan Chase
Commercial Mortgage
Securities Corp., 5.861%,
due 04/15/45 | | | 898,561 | | |
| | 4,075,901 | | | C,S,^ | | LB-UBS Commercial
Mortgage Trust, 0.485%,
due 02/15/40 | | | 127,466 | | |
| | 528,000 | | | C,S | | LB-UBS Commercial
Mortgage Trust, 4.201%,
due 12/15/29 | | | 524,753 | | |
| | 1,000 | | | C | | LB-UBS Commercial
Mortgage Trust, 4.567%,
due 06/15/29 | | | 998 | | |
| | 626,089 | | | C,S | | LB-UBS Commercial
Mortgage Trust, 4.821%,
due 04/15/30 | | | 624,564 | | |
| | 231,000 | | | C,S | | LB-UBS Commercial
Mortgage Trust, 4.836%,
due 02/15/40 | | | 215,889 | | |
| | 250,000 | | | C,S | | LB-UBS Commercial
Mortgage Trust, 4.885%,
due 09/15/30 | | | 249,626 | | |
| | 10,000 | | | C,S | | LB-UBS Commercial
Mortgage Trust, 4.998%,
due 04/15/30 | | | 9,925 | | |
| | 340,000 | | | C,S | | LB-UBS Commercial
Mortgage Trust, 5.103%,
due 11/15/30 | | | 340,803 | | |
| | 620,000 | | | C,S | | LB-UBS Commercial
Mortgage Trust, 5.287%,
due 04/15/40 | | | 586,393 | | |
| | 329,000 | | | C,S | | LB-UBS Commercial
Mortgage Trust, 5.516%,
due 11/15/38 | | | 291,782 | | |
| | 246,000 | | | C,S | | LB-UBS Commercial
Mortgage Trust, 5.533%,
due 02/15/40 | | | 220,841 | | |
See Accompanying Notes to Financial Statements
78
PORTFOLIO OF INVESTMENTS
ING VP BALANCED PORTFOLIO AS OF DECEMBER 31, 2007 (CONTINUED)
Principal
Amount | | | | | | Value | |
| COLLATERALIZED MORTGAGE OBLIGATIONS (continued) | | | |
| $ | 491,000 | | | C,S | | LB-UBS Commercial
Mortgage Trust, 5.563%,
due 02/15/40 | | $ | 432,975 | | |
| | 2,212,000 | | | C,S | | LB-UBS Commercial
Mortgage Trust, 6.365%,
due 12/15/28 | | | 2,327,218 | | |
| | 3,171,069 | | | C,S | | LB-UBS Commercial
Mortgage Trust, 7.370%,
due 08/15/26 | | | 3,343,983 | | |
| | 522,000 | | | C,S | | MASTR Alternative
Loans Trust, 6.250%,
due 07/25/36 | | | 525,306 | | |
| | 53,826 | | | C,S | | MASTR Alternative
Loans Trust, 6.500%,
due 05/25/33 | | | 53,693 | | |
| | 319,796 | | | C,S | | MASTR Alternative
Loans Trust, 8.500%,
due 05/25/33 | | | 321,151 | | |
| | 13,019,292 | | | #,C,S,^ | | Merrill Lynch Mortgage Trust,
0.177%, due 11/12/35 | | | 71,872 | | |
| | 3,114,101 | | | C,S,^ | | Merrill Lynch/
Countrywide Commercial
Mortgage Trust, 0.545%,
due 08/12/48 | | | 116,856 | | |
| | 237,000 | | | C,S | | Merrill Lynch/
Countrywide Commercial
Mortgage Trust, 5.479%,
due 08/12/48 | | | 211,433 | | |
| | 264,000 | | | C,S | | Merrill Lynch/
Countrywide Commercial
Mortgage Trust, 5.509%,
due 08/12/48 | | | 231,310 | | |
| | 121,967 | | | C,S | | MLCC Mortgage
Investors, Inc., 5.185%,
due 01/25/29 | | | 121,385 | | |
| | 160,000 | | | C,S | | Morgan Stanley Capital I,
5.007%, due 01/14/42 | | | 158,937 | | |
| | 129,346 | | | C,S | | MortgageIT Trust, 5.235%,
due 11/25/35 | | | 120,303 | | |
| | 788,000 | | | C,S | | New York Mortgage
Trust, Inc., 5.649%,
due 05/25/36 | | | 795,327 | | |
| | 447,492 | | | C,S | | Prime Mortgage Trust,
5.365%, due 02/25/35 | | | 440,726 | | |
| | 107,489 | | | C,S | | Prudential Commercial
Mortgage Trust, 3.669%,
due 02/11/36 | | | 105,542 | | |
| | 600,000 | | | C,S | | Prudential Securities
Secured Financing Corp.,
6.649%, due 07/15/08 | | | 600,679 | | |
| | 1,043,918 | | | C,S | | RAAC Series, 5.250%,
due 09/25/34 | | | 1,029,020 | | |
| | 139,544 | | | C,S | | Sequoia Mortgage Trust,
5.219%, due 01/20/35 | | | 135,988 | | |
| | 3,885 | | | C,S | | Structured Adjustable Rate
Mortgage Loan Trust,
5.175%, due 07/25/35 | | | 3,644 | | |
| | 238,930 | | | C,S | | Structured Asset Mortgage
Investments, Inc., 5.205%,
due 04/19/35 | | | 237,749 | | |
| | 189,000 | | | #,C,S | | Wachovia Bank Commercial
Mortgage Trust, 5.210%,
due 10/15/44 | | | 173,065 | | |
Principal
Amount | | | | | | Value | |
| $ | 1,601,000 | | | C,S | | Wachovia Bank Commercial
Mortgage Trust, 5.210%,
due 10/15/44 | | $ | 1,494,019 | | |
| | 70,000 | | | C,S | | Wachovia Bank Commercial
Mortgage Trust, 5.244%,
due 07/15/42 | | | 70,302 | | |
| | 758,000 | | | C,S | | Washington Mutual
Mortgage Pass-Through
Certificates, 3.795%,
due 06/25/34 | | | 745,452 | | |
| | 280,637 | | | C,S | | Washington Mutual
Mortgage Pass-Through
Certificates, 5.000%,
due 12/25/18 | | | 277,686 | | |
| | 372,083 | | | C,S | | Washington Mutual
Mortgage Pass-Through
Certificates, 5.175%,
due 01/25/45 | | | 352,337 | | |
| | 61,493 | | | C,S | | Washington Mutual
Mortgage Pass-Through
Certificates, 5.233%,
due 06/25/44 | | | 60,605 | | |
| | 1,303,258 | | | C,S | | Washington Mutual
Mortgage Pass-Through
Certificates, 5.496%,
due 01/25/37 | | | 1,291,832 | | |
| | 546,035 | | | C,S | | Washington Mutual
Mortgage Pass-Through
Certificates, 5.598%,
due 07/25/47 | | | 504,187 | | |
| | 2,576,519 | | | C,S | | Washington Mutual
Mortgage Pass-Through
Certificates, 5.683%,
due 06/25/37 | | | 2,573,205 | | |
| | 1,000,642 | | | C,S | | Washington Mutual
Mortgage Pass-Through
Certificates, 5.700%,
due 06/25/37 | | | 988,093 | | |
| | 1,019,520 | | | C,S | | Washington Mutual
Mortgage Pass-Through
Certificates, 5.708%,
due 09/25/46 | | | 895,540 | | |
| | 639,930 | | | C,S | | Washington Mutual
Mortgage Pass-Through
Certificates, 5.750%,
due 02/25/36 | | | 636,771 | | |
| | 69,968 | | | C,S | | Washington Mutual
Mortgage Pass-Through
Certificates, 5.758%,
due 05/25/46 | | | 61,572 | | |
| | 290,300 | | | C,S | | Washington Mutual
Mortgage Pass-Through
Certificates, 5.758%,
due 06/25/46 | | | 270,022 | | |
| | 221,839 | | | C,S | | Washington Mutual
Mortgage Pass-through
Certificates, 5.819%,
due 06/25/37 | | | 217,933 | | |
| | 2,119,452 | | | C,S | | Washington Mutual
Mortgage Pass-Through
Certificates, 5.877%,
due 07/25/37 | | | 2,071,271 | | |
See Accompanying Notes to Financial Statements
79
PORTFOLIO OF INVESTMENTS
ING VP BALANCED PORTFOLIO AS OF DECEMBER 31, 2007 (CONTINUED)
Principal
Amount | | | | | | Value | |
| COLLATERALIZED MORTGAGE OBLIGATIONS (continued) | | | |
| $ | 1,719,653 | | | C,S | | Washington Mutual
Mortgage Pass-Through
Certificates, 5.880%,
due 07/25/37 | | $ | 1,717,243 | | |
| | 1,260,098 | | | C,S | | Washington Mutual
Mortgage Pass-Through
Certificates, 5.914%,
due 07/25/37 | | | 1,255,353 | | |
| | 1,563,989 | | | C,S | | Washington Mutual
Mortgage Pass-Through
Certificates, 6.000%,
due 06/25/34 | | | 1,579,582 | | |
| | 1,081,960 | | | C,S | | Washington Mutual
Mortgage Pass-Through
Certificates, 6.000%,
due 07/25/36 | | | 1,079,537 | | |
| | 1,445,000 | | | C,S | | Wells Fargo
Mortgage-Backed
Securities Trust, 3.500%,
due 06/25/35 | | | 1,434,718 | | |
| | 2,225,000 | | | C,S | | Wells Fargo
Mortgage-Backed
Securities Trust, 4.500%,
due 08/25/18 | | | 2,148,991 | | |
| | 617,000 | | | C,S | | Wells Fargo
Mortgage-Backed
Securities Trust, 4.790%,
due 07/25/34 | | | 607,774 | | |
| | 628,000 | | | C,S | | Wells Fargo
Mortgage-Backed
Securities Trust, 4.818%,
due 07/25/34 | | | 610,899 | | |
| | 730,304 | | | C,S | | Wells Fargo
Mortgage-Backed
Securities Trust, 4.892%,
due 08/25/34 | | | 716,792 | | |
| | 1,727,919 | | | C,S | | Wells Fargo
Mortgage-Backed
Securities Trust, 5.110%,
due 03/25/36 | | | 1,683,168 | | |
| | 2,415,113 | | | C,S | | Wells Fargo
Mortgage-Backed
Securities Trust, 5.387%,
due 08/25/35 | | | 2,369,341 | | |
| | 1,108,009 | | | C,S | | Wells Fargo
Mortgage-Backed
Securities Trust, 5.500%,
due 12/25/35 | | | 1,085,817 | | |
| | 1,648,565 | | | C,S | | Wells Fargo
Mortgage-Backed
Securities Trust, 5.500%,
due 01/25/36 | | | 1,615,548 | | |
| | 2,001,344 | | | C,S | | Wells Fargo
Mortgage-Backed
Securities Trust, 5.650%,
due 12/25/36 | | | 1,968,172 | | |
| | 1,520,254 | | | C,S | | Wells Fargo
Mortgage-Backed
Securities Trust, 5.940%,
due 11/25/36 | | | 1,537,189 | | |
| | 2,274,251 | | | C,S | | Wells Fargo
Mortgage-Backed
Securities Trust, 5.950%,
due 10/25/36 | | | 2,300,149 | | |
Principal
Amount | | | | | | Value | |
| $ | 243,712 | | | C,S | | Wells Fargo
Mortgage-Backed
Securities Trust, 6.000%,
due 06/25/36 | | $ | 245,872 | | |
Total Collateralized
Mortgage Obligations
(Cost $102,305,482) | | | 100,815,879 | | |
| MUNICIPAL BONDS: 0.2% | | | |
| | | | | California: 0.1% | |
| | 836,000 | | | C,S | | City of San Diego,
7.125%, due 06/01/32 | | | 764,698 | | |
| | | | 764,698 | | |
| | | | | Michigan: 0.1% | |
| | 1,595,000 | | | S | | Michigan Tobacco
Settlement Finance
Authority,
7.309%, due 06/01/34 | | | 1,483,398 | | |
| | | | 1,483,398 | | |
Total Municipal Bonds
(Cost $2,440,152) | | | 2,248,096 | | |
Total Long-Term Investments
(Cost $1,037,188,649) | | | 1,053,819,059 | | |
| Shares | | | | | | Value | |
| SHORT-TERM INVESTMENTS: 21.4% | | | |
| | | | | Money Market: 2.8% | |
| | 29,000,000 | | | **,S | | ING Institutional Prime
Money Market Fund | | | 29,000,000 | | |
Total Money Market
(Cost $29,000,000) | | | 29,000,000 | | |
Principal
Amount | | | | Value | |
| | | | | Repurchase Agreement: 0.2% | |
| $ | 2,275,000 | | | S | | Goldman Sachs Repurchase
Agreement dated 12/31/07,
4.150%, due 01/02/08,
$2,275,525 to be received
upon repurchase
(Collateralized by $2,120,000
Federal Home Loan Mortgage
Corporation, 5.750%, Market
Value plus accrued interest
$2,320,645, due 01/15/12) | | | 2,275,000 | | |
Total Repurchase Agreement
(Cost $2,275,000) | | | | | 2,275,000 | | |
| | | | | Securities Lending Collateralcc: 18.4% | |
| | 194,627,493 | | | | | Bank of New York
Mellon Corp. Institutional
Cash Reserves | | | 194,627,493 | | |
Total Securities Lending
Collateral
(Cost $194,627,493) | | | | | 194,627,493 | | |
Total Short-Term Investments
(Cost $225,902,493) | | | | | 225,902,493 | | |
See Accompanying Notes to Financial Statements
80
PORTFOLIO OF INVESTMENTS
ING VP BALANCED PORTFOLIO AS OF DECEMBER 31, 2007 (CONTINUED)
| | | | | Value | |
Total Investments in
Securities
(Cost $1,263,091,142)* | | | 121.1 | % | | $ | 1,279,721,552 | | |
Other Assets and
Liabilities - Net | | | (21.1 | ) | | | (222,940,980 | ) | |
| Net Assets | | | 100.0 | % | | $ | 1,056,780,572 | | |
@ Non-income producing security
@@ Foreign Issuer
ADR American Depositary Receipt
MASTR Mortgage Asset Securitization Transaction, Inc.
# Securities with purchases pursuant to Rule 144A or section 4(2), under the Securities Act of 1933 and may not be resold subject to that rule except to qualified institutional buyers. Unless otherwise noted, these securities have been determined to be liquid under the guidelines established by the Funds' Board of Directors/Trustees.
C Bond may be called prior to maturity date.
P Preferred Stock may be called prior to convertible date.
cc Securities purchased with cash collateral for securities loaned.
W When-issued or delayed delivery security
S All or a portion of this security is segregated for certain derivatives, when-issued or delayed delivery securities and forward currency exchange contracts.
I Illiquid security
L Loaned security, a portion or all of the security is on loan at December 31, 2007.
** Investment in affiliate
^ Interest Only (IO) Security
Z Indicates Zero Coupon Bond; rate shown reflects current effective yield.
BRL Brazilian Real
* Cost for federal income tax purposes is $1,266,059,411.
Net unrealized appreciation consists of:
| Gross Unrealized Appreciation | | $ | 50,950,699 | | |
| Gross Unrealized Depreciation | | | (37,288,558 | ) | |
| Net Unrealized Appreciation | | $ | 13,662,141 | | |
At December 31, 2007 the following forward foreign currency contracts were outstanding for ING VP Balanced Portfolio:
| Currency | | Buy/Sell | | Settlement
Date | | In
Exchange
For | | Value | | Unrealized
Appreciation/
(Depreciation) | |
| Euro | | | | | | USD | | | | | | |
| | |
| EUR 2,880,356 | | Buy | | 1/14/08 | | 4,218,463 | | | 4,212,352 | | | $ | (6,110 | ) | |
Euro
EUR 2,866,132 | | Buy | | 1/14/08 | | 4,196,743 | | | 4,191,551 | | | | (5,191 | ) | |
| | | $ | (11,301 | ) | |
Brazil Real
BRL 960,500 | | Sell | | 1/31/08 | | 526,128 | | | 536,965 | | | $ | (10,838 | ) | |
Euro
EUR 2,880,356 | | Sell | | 1/14/08 | | 4,206,800 | | | 4,212,352 | | | | (5,552 | ) | |
Euro
EUR 2,866,132 | | Sell | | 1/14/08 | | 4,206,800 | | | 4,191,551 | | | | 15,249 | | |
British Pound
Sterling
GBP 4,075,100 | | Sell | | 2/14/08 | | 8,326,978 | | | 8,101,672 | | | | 225,305 | | |
| | | $ | 224,164 | | |
ING VP Balanced Portfolio Open Futures Contracts on December 31, 2007:
Contract
Description | | Number
of Contracts | | Notional
Market Value | | Expiration
Date | | Unrealized
Appreciation/
(Depreciation) | |
| Long Contracts | |
| 90-Day Eurodollar | | | 250 | | | $ | 59,853,125 | | | 03/17/08 | | $ | 294,502 | | |
| 90-Day Eurodollar | | | 420 | | | | 101,335,500 | | | 09/15/08 | | | 395,749 | | |
| 90-Day Sterling | | | 75 | | | | 17,723,221 | | | 09/17/08 | | | 16,144 | | |
| 90-Day Sterling | | | 75 | | | | 17,754,947 | | | 12/17/08 | | | 27,911 | | |
Australia
10-Year Bond | | | 66 | | | | 5,661,281 | | | 03/17/08 | | | (16,944 | ) | |
Canada
10-Year Bond | | | 53 | | | | 6,171,295 | | | 03/19/08 | | | (41,296 | ) | |
| Euro-Bund | | | 34 | | | | 5,622,674 | | | 03/06/08 | | | (120,790 | ) | |
| Euro-Schatz | | | 93 | | | | 14,053,270 | | | 03/06/08 | | | (67,235 | ) | |
| Long Gilt | | | 27 | | | | 5,924,457 | | | 03/27/08 | | | (23,801 | ) | |
| Russell Mini | | | 1 | | | | 77,220 | | | 03/20/08 | | | 1,618 | | |
| S&P 500 | | | 3 | | | | 1,107,900 | | | 03/19/08 | | | (9,368 | ) | |
| S&P Mid 400 E-Mini | | | 13 | | | | 1,124,240 | | | 03/20/08 | | | (2,945 | ) | |
U.S. Treasury
2-Year Note | | | 103 | | | | 21,655,750 | | | 03/31/08 | | | 111,773 | | |
U.S. Treasury
5-Year Note | | | 177 | | | | 19,519,781 | | | 03/31/08 | | | 14,768 | | |
| | | | | | | | | | | | | $ | 580,086 | | |
| Short Contracts | |
| 90-Day Eurodollar | | | 420 | | | $ | (101,167,500 | ) | | 09/14/09 | | $ | (456,643 | ) | |
| 90-Day Sterling | | | 75 | | | | (17,758,679 | ) | | 09/16/09 | | | (40,971 | ) | |
| 90-Day Sterling | | | 75 | | | | (17,747,482 | ) | | 12/16/09 | | | (35,311 | ) | |
| Fed Fund 30-Day | | | 53 | | | | (21,216,051 | ) | | 03/31/08 | | | (79,124 | ) | |
| Fed Fund 30-Day | | | 55 | | | | (22,034,992 | ) | | 04/30/08 | | | (96,619 | ) | |
| Fed Fund 30-Day | | | 43 | | | | (17,255,130 | ) | | 05/30/08 | | | (126,780 | ) | |
U.S. Treasury
10-Year Note | | | 38 | | | | (4,308,844 | ) | | 03/19/08 | | | (54,720 | ) | |
U.S. Treasury
Long Bond | | | 26 | | | | (3,025,750 | ) | | 03/19/08 | | | (64,253 | ) | |
| | | | | | | | | | | | | $ | (954,421 | ) | |
ING VP Balanced Portfolio Interest Rate Swap Agreements Outstanding on December 31, 2007:
| | | Termination
Date | | Notional
Principal
Amount | | Unrealized
Appreciation/
(Depreciation) | |
Receive a fixed rate
equal to 4.04221% and
pay a floating rate
based on 3-month
USD-LIBOR
Counterparty:
Citibank N.A., New York | | 12/13/09 | | USD | 21,865,000 | | | $ | 64,316 | | |
Receive a floating rate
based on 3-month
USD-LIBOR and
pay a fixed rate
equal to 4.80031%
Counterparty:
Citibank N.A., New York | | 12/13/17 | | USD | 5,226,000 | | | | (51,721 | ) | |
| | | | | $ | 12,595 | | |
See Accompanying Notes to Financial Statements
81
PORTFOLIO OF INVESTMENTS
ING VP BALANCED PORTFOLIO AS OF DECEMBER 31, 2007 (CONTINUED)
ING VP Balanced Portfolio Credit Default Swap Agreements Outstanding on December 31, 2007:
| Counterparty | | Reference
Entity/Obligation | | Buy/Sell
Protection | | (Pay)/Receive
Fixed Rate | | Termination
Date | |
| | Notional
Amount | | Unrealized
Appreciation/
(Depreciation) | |
| Barclays Bank PLC | | Alcoa Inc. 5.375%, 01/15/13 | | Buy | | | (0.390 | )% | | 09/20/12 | | USD | | | 809,000 | | | $ | 2,346 | | |
Citibank N.A.,
New York | | Alcoa Inc. 5.375%, 01/15/13 | | Buy | | | (0.570 | )% | | 12/20/17 | | USD | | | 2,022,000 | | | | 10,409 | | |
| JPMorgan | |
Chase Bank N.A.,
New York | | Alcoa Inc. 5.375%, 01/15/13 | | Buy | | | (0.430 | )% | | 09/20/12 | | USD | | | 438,000 | | | | 518 | | |
Lehman Brothers
Special Financing Inc. | | Alcoa Inc. 5.375%, 01/15/13 | | Buy | | | (0.400 | )% | | 09/20/12 | | USD | | | 876,000 | | | | 2,165 | | |
| UBS AG | | Australia and New Zealand Banking
Group 4.450%, 02/05/15 | | Buy | | | (0.350 | )% | | 09/20/17 | | USD | | | 720,000 | | | | 3,566 | | |
| UBS AG | | Australia and New Zealand Banking
Group 4.450%, 02/05/15 | | Buy | | | (0.510 | )% | | 09/20/17 | | USD | | | 661,000 | | | | 10,217 | | |
Citibank N.A.,
New York | | Bank of Scotland 5.125%, 12/05/13 | | Buy | | | (0.320 | )% | | 09/20/17 | | USD | | | 928,000 | | | | 45,095 | | |
Citibank N.A.,
New York | | Bank of Scotland 5.125%, 12/05/13 | | Buy | | | (0.660 | )% | | 09/20/17 | | USD | | | 938,000 | | | | 21,306 | | |
Citibank N.A.,
New York | | Bank of Scotland 5.125%, 12/05/13 | | Buy | | | (0.650 | )% | | 09/20/17 | | USD | | | 436,000 | | | | 10,235 | | |
| UBS AG | | Bank of Scotland 5.125%, 12/05/13 | | Buy | | | (0.410 | )% | | 09/20/17 | | USD | | | 720,000 | | | | 30,055 | | |
Merrill Lynch
International | | Belo Corp. 7.750%, 06/01/27 | | Buy | | | (2.050 | )% | | 12/20/17 | | USD | | | 812,000 | | | | 21,433 | | |
Citibank N.A.,
New York | | Belo Corp. 8.000%, 11/01/08 | | Buy | | | (0.930 | )% | | 09/20/12 | | USD | | | 482,000 | | | | 19,852 | | |
Citibank N.A.,
New York | | Belo Corp. 8.000%, 11/01/08 | | Buy | | | (1.400 | )% | | 09/20/14 | | USD | | | 484,000 | | | | 21,009 | | |
Citibank N.A.,
New York | | BNP Paribas 5.250%, 12/17/12 | | Buy | | | (0.250 | )% | | 09/20/17 | | USD | | | 928,000 | | | | 15,198 | | |
Citibank N.A.,
New York | | BNP Paribas 5.250%, 12/17/12 | | Buy | | | (0.520 | )% | | 09/20/17 | | USD | | | 194,000 | | | | (921 | ) | |
Citibank N.A.,
New York | | BNP Paribas 5.250%, 12/17/12 | | Buy | | | (0.520 | )% | | 09/20/17 | | USD | | | 436,000 | | | | (2,069 | ) | |
Citibank N.A.,
New York | | CDX.EM.6 Index | | Buy | | | (1.400 | )% | | 12/20/11 | | USD | | | 1,455,000 | | | | 27,780 | | |
Citibank N.A.,
New York | | CDX.EM.7 Index | | Buy | | | (1.250 | )% | | 06/20/12 | | USD | | | 2,488,000 | | | | (39,614 | ) | |
Citibank N.A.,
New York | | CDX.EM.7 Index | | Buy | | | (1.250 | )% | | 06/20/12 | | USD | | | 2,500,000 | | | | (61,962 | ) | |
Citibank N.A.,
New York | | CDX.EM.7 Index | | Buy | | | (1.250 | )% | | 06/20/12 | | USD | | | 629,000 | | | | (2,043 | ) | |
| UBS AG | | CDX.EM.7 Index | | Buy | | | (1.250 | )% | | 06/20/12 | | USD | | | 2,024,000 | | | | (47,206 | ) | |
| UBS AG | | CDX.EM.7 Index | | Buy | | | (1.250 | )% | | 06/20/12 | | USD | | | 1,532,000 | | | | (10,324 | ) | |
| UBS AG | | CDX.EM.7 Index | | Buy | | | (1.250 | )% | | 06/20/12 | | USD | | | 1,979,501 | | | | (42,204 | ) | |
| UBS AG | | CDX.EM.7 Index | | Buy | | | (1.250 | )% | | 06/20/12 | | USD | | | 1,557,000 | | | | (5,099 | ) | |
| UBS AG | | CDX.NA.HY.8 Index | | Buy | | | (2.750 | )% | | 06/20/12 | | USD | | | 1,917,000 | | | | (352 | ) | |
| UBS AG | | CDX.NA.HY.8 Index | | Sell | | | 2.750 | % | | 06/20/12 | | USD | | | 1,866,000 | | | | 40,947 | | |
Lehman Brothers
Special Financing Inc. | | CDX.NA.HY.8 Index (15-25% Tranche) | | Buy | | | (4.750 | )% | | 06/20/12 | | USD | | | 2,599,000 | | | | 76,847 | | |
Citibank N.A.,
New York | | CDX.NA.HY.9 Index | | Buy | | | (3.750 | )% | | 12/20/12 | | USD | | | 3,271,000 | | | | 112,989 | | |
| UBS AG | | CDX.NA.HY.9 Index | | Buy | | | (3.750 | )% | | 12/20/12 | | USD | | | 2,757,000 | | | | 34,112 | | |
Lehman Brothers
Special Financing Inc. | | CDX.NA.HY.9 Index (15-25% Tranche) | | Sell | | | 7.050 | % | | 12/20/12 | | USD | | | 1,299,000 | | | | (7,950 | ) | |
Lehman Brothers
Special Financing Inc. | | CDX.NA.HY.9 Index (15-25% Tranche) | | Sell | | | 6.500 | % | | 12/20/12 | | USD | | | 1,577,000 | | | | (45,039 | ) | |
Lehman Brothers
Special Financing Inc. | | CDX.NA.HY.9 Index (35-60% Tranche) | | Sell | | | 1.950 | % | | 12/20/12 | | USD | | | 1,577,000 | | | | (72,000 | ) | |
Lehman Brothers
Special Financing Inc. | | CDX.NA.HY.9 Index (35-60% Tranche) | | Sell | | | 2.600 | % | | 12/20/12 | | USD | | | 2,926,000 | | | | (50,096 | ) | |
Citibank N.A.,
New York | | CDX.NA.IG.9 Index | | Buy | | | (0.600 | )% | | 12/20/12 | | USD | | | 1,000,000 | | | | 1,799 | | |
Lehman Brothers
Special Financing Inc. | | CDX.NA.IG.9 Index | | Buy | | | (0.600 | )% | | 12/20/12 | | USD | | | 3,066,000 | | | | 8,614 | | |
Goldman Sachs
International | | CDX.NA.IG.HVOL.9 Index | | Buy | | | (1.400 | )% | | 12/20/12 | | USD | | | 8,585,000 | | | | 33,014 | | |
Lehman Brothers
Special Financing Inc. | | CDX.NA.IG.HVOL.9 Index | | Buy | | | (1.400 | )% | | 12/20/12 | | USD | | | 8,760,000 | | | | 33,005 | | |
Lehman Brothers
Special Financing Inc. | | CDX.NA.IG.HVOL.9 Index | | Buy | | | (1.400 | )% | | 12/20/12 | | USD | | | 8,760,000 | | | | 33,645 | | |
See Accompanying Notes to Financial Statements
82
PORTFOLIO OF INVESTMENTS
ING VP BALANCED PORTFOLIO AS OF DECEMBER 31, 2007 (CONTINUED)
| Counterparty | | Reference
Entity/Obligation | | Buy/Sell
Protection | | (Pay)/Receive
Fixed Rate | | Termination
Date | |
| | Notional
Amount | | Unrealized
Appreciation/
(Depreciation) | |
Citibank N.A.,
New York | | Centurytel Inc. 7.875%, 08/15/12 | | Buy | | | (0.730 | )% | | 09/20/12 | | USD | | | 1,134,000 | | | $ | (8,810 | ) | |
Citibank N.A.,
New York | | Centurytel Inc. 7.875%, 08/15/12 | | Buy | | | (0.720 | )% | | 09/20/12 | | USD | | | 194,000 | | | | (1,424 | ) | |
Merrill Lynch
International | | Centurytel Inc. 7.875%, 08/15/12 | | Buy | | | (0.740 | )% | | 09/20/12 | | USD | | | 432,000 | | | | (3,541 | ) | |
Citibank N.A.,
New York | | CMS Energy Corp. 6.875%, 12/15/15 | | Sell | | | 0.820 | % | | 03/20/12 | | USD | | | 190,000 | | | | (2,627 | ) | |
Merrill Lynch
International | | CMS Energy Corp. 6.875%, 12/15/15 | | Sell | | | 0.840 | % | | 03/20/12 | | USD | | | 1,020,000 | | | | (13,326 | ) | |
Citibank N.A.,
New York | | Computer Sciences Corp.
5.000%, 02/15/13 | | Buy | | | (0.780 | )% | | 09/20/17 | | USD | | | 1,687,000 | | | | (22,909 | ) | |
Lehman Brothers
Special Financing Inc. | | Countrywide Home Loan
4.000%, 03/22/11 | | Sell | | | 8.700 | % | | 12/20/12 | | USD | | | 83,000 | | | | (3,404 | ) | |
| UBS AG | | Countrywide Home Loan
4.000%, 03/22/11 | | Sell | | | 9.000 | % | | 12/20/12 | | USD | | | 83,000 | | | | (2,749 | ) | |
Citibank N.A.,
New York | | Darden Restaurants Inc.
7.125%, 02/01/16 | | Buy | | | (0.610 | )% | | 12/20/12 | | USD | | | 207,000 | | | | 2,157 | | |
Morgan Stanley
Capital Services Inc. | | Domtar Corp. (Obligation
not yet specified) | | Buy | | | (2.650 | )% | | 09/20/11 | | USD | | | 543,500 | | | | (10,920 | ) | |
| UBS AG | | Domtar Corp. (Obligation
not yet specified) | | Sell | | | 2.600 | % | | 09/20/11 | | USD | | | 542,000 | | | | 9,985 | | |
| Barclays Bank PLC | | Federative Republic of Brazil
12.250%, 03/06/30 | | Sell | | | 0.240 | % | | 06/20/08 | | USD | | | 2,799,000 | | | | (1,768 | ) | |
| Barclays Bank PLC | | Federative Republic of Brazil
12.250%, 03/06/30 | | Buy | | | (0.725 | )% | | 06/20/12 | | USD | | | 979,000 | | | | 8,085 | | |
| Barclays Bank PLC | | Federative Republic of Brazil
12.250%, 03/06/30 | | Buy | | | (1.600 | )% | | 08/20/12 | | USD | | | 800,000 | | | | (21,438 | ) | |
Citibank N.A.,
New York | | Federative Republic of Brazil
12.250%, 03/06/30 | | Sell | | | 0.240 | % | | 07/20/08 | | USD | | | 1,970,000 | | | | (1,459 | ) | |
Citibank N.A.,
New York | | Federative Republic of Brazil
12.250%, 03/06/30 | | Buy | | | (0.740 | )% | | 07/20/12 | | USD | | | 492,000 | | | | 4,004 | | |
Lehman Brothers
Special Financing Inc. | | Federative Republic of Brazil
12.250%, 03/06/30 | | Buy | | | (0.800 | )% | | 07/20/12 | | USD | | | 884,000 | | | | 5,162 | | |
| UBS AG | | Federative Republic of Brazil
12.250%, 03/06/30 | | Buy | | | (0.780 | )% | | 07/20/12 | | USD | | | 2,037,500 | | | | 13,565 | | |
| UBS AG | | Federative Republic of Brazil
12.250%, 03/06/30 | | Buy | | | (0.860 | )% | | 08/20/12 | | USD | | | 568,000 | | | | 2,156 | | |
| UBS AG | | Federative Republic of Brazil
12.250%, 03/06/30 | | Buy | | | (1.150 | )% | | 08/20/12 | | USD | | | 1,376,000 | | | | (11,110 | ) | |
Citibank N.A.,
New York | | First Data Corp. 4.700%, 08/01/13 | | Buy | | | (5.350 | )% | | 12/20/12 | | USD | | | 990,000 | | | | 17,457 | | |
Citibank N.A.,
New York | | First Data Corp. 4.700%, 08/01/13 | | Buy | | | (5.900 | )% | | 12/20/17 | | USD | | | 559,000 | | | | 12,090 | | |
Lehman Brothers
Special Financing Inc. | | First Data Corp. 4.700%, 08/01/13 | | Buy | | | (5.450 | )% | | 12/20/12 | | USD | | | 812,000 | | | | 11,242 | | |
Merrill Lynch
International | | First Data Corp. 4.700%, 08/01/13 | | Buy | | | (5.450 | )% | | 12/20/12 | | USD | | | 1,219,000 | | | | 16,878 | | |
Citibank N.A.,
New York | | Ford Motor Co. 6.500%, 08/01/18 | | Sell | | | 6.100 | % | | 12/20/12 | | USD | | | 417,000 | | | | (24,019 | ) | |
| Barclays Bank PLC | | Gannett Co. 6.375%, 04/01/12 | | Buy | | | (0.780 | )% | | 09/20/14 | | USD | | | 765,000 | | | | 8,040 | | |
Citibank N.A.,
New York | | Gannett Co. 6.375%, 04/01/12 | | Buy | | | (0.690 | )% | | 06/20/14 | | USD | | | 1,101,000 | | | | 15,852 | | |
Citibank N.A.,
New York | | Gannett Co. 6.375%, 04/01/12 | | Buy | | | (0.860 | )% | | 09/20/14 | | USD | | | 499,000 | | | | 2,972 | | |
Citibank N.A.,
New York | | Gannett Co. 6.375%, 04/01/12 | | Buy | | | (0.770 | )% | | 09/20/14 | | USD | | | 484,000 | | | | 5,362 | | |
Citibank N.A.,
New York | | Gannett Co. 6.375%, 04/01/12 | | Buy | | | (0.810 | )% | | 09/20/14 | | USD | | | 484,000 | | | | 4,260 | | |
| Barclays Bank PLC | | Georgia-Pacific Corp. 7.750%, 11/15/29 | | Sell | | | 3.000 | % | | 09/20/12 | | USD | | | 406,000 | | | | (6,384 | ) | |
| UBS AG | | Georgia-Pacific Corp. 7.750%, 11/15/29 | | Sell | | | 3.000 | % | | 09/20/12 | | USD | | | 152,000 | | | | (2,390 | ) | |
See Accompanying Notes to Financial Statements
83
PORTFOLIO OF INVESTMENTS
ING VP BALANCED PORTFOLIO AS OF DECEMBER 31, 2007 (CONTINUED)
| Counterparty | | Reference
Entity/Obligation | | Buy/Sell
Protection | | (Pay)/Receive
Fixed Rate | | Termination
Date | |
| | Notional
Amount | | Unrealized
Appreciation/
(Depreciation) | |
Citibank N.A.,
New York | | Goldman Sachs Group Inc.
6.600%, 01/15/12 | | Buy | | | (0.600 | )% | | 12/20/12 | | USD | | | 786,000 | | | $ | 2,670 | | |
Citibank N.A.,
New York | | Goldman Sachs Group Inc.
6.600%, 01/15/12 | | Buy | | | (0.960 | )% | | 12/20/12 | | USD | | | 1,165,000 | | | | (14,599 | ) | |
Citibank N.A.,
New York | | Goldman Sachs Group Inc.
6.600%, 01/15/12 | | Buy | | | (0.640 | )% | | 12/20/12 | | USD | | | 349,000 | | | | 568 | | |
Lehman Brothers
Special Financing Inc. | | Goldman Sachs Group Inc.
6.600%, 01/15/12 | | Buy | | | (1.030 | )% | | 12/20/12 | | USD | | | 803,000 | | | | (12,550 | ) | |
Morgan Stanley
Capital Services Inc. | | Goldman Sachs Group Inc.
6.600%, 01/15/12 | | Buy | | | (1.030 | )% | | 12/20/12 | | USD | | | 743,000 | | | | (11,612 | ) | |
Lehman Brothers
Special Financing Inc. | | Harrah's Operating Co., Inc.
5.625%, 06/01/15 | | Sell | | | 0.600 | % | | 03/20/08 | | USD | | | 3,972,000 | | | | (17,141 | ) | |
| UBS AG | | HSBC Bank PLC 4.250%, 03/18/16 | | Buy | | | (0.400 | )% | | 09/20/17 | | USD | | | 720,000 | | | | 14,434 | | |
| UBS AG | | LCDX.NA.8 Index | | Buy | | | (1.200 | )% | | 06/20/12 | | USD | | | 3,775,921 | | | | (7,962 | ) | |
| UBS AG | | LCDX.NA.8 Index | | Buy | | | (1.200 | )% | | 06/20/12 | | USD | | | 635,945 | | | | (6,278 | ) | |
| UBS AG | | LCDX.NA.8 Index | | Sell | | | 1.200 | % | | 06/20/12 | | USD | | | 7,551,843 | | | | (157,724 | ) | |
| UBS AG | | LCDX.NA.8 Index | | Sell | | | 1.200 | % | | 06/20/12 | | USD | | | 1,969,800 | | | | 46,249 | | |
Citibank N.A.,
New York | | Lehman Brothers Hldgs.
6.625%, 01/18/12 | | Buy | | | (1.100 | )% | | 12/20/12 | | USD | | | 349,000 | | | | 1,768 | | |
Citibank N.A.,
New York | | Lehman Brothers Hldgs.
6.625%, 01/18/12 | | Buy | | | (1.100 | )% | | 12/20/12 | | USD | | | 349,000 | | | | 1,768 | | |
| Barclays Bank PLC | | Lloyds TSB Group PLC 5.875%, 07/08/14 | | Buy | | | (0.500 | )% | | 12/20/17 | | USD | | | 373,000 | | | | 832 | | |
Citibank N.A.,
New York | | Louisiana-Pacific Corp. 8.875%, 08/15/10 | | Buy | | | (2.000 | )% | | 12/20/12 | | USD | | | 461,000 | | | | 11,459 | | |
Citibank N.A.,
New York | | Louisiana-Pacific Corp. 8.875%, 08/15/10 | | Buy | | | (2.100 | )% | | 12/20/12 | | USD | | | 829,000 | | | | 17,135 | | |
Morgan Stanley
Capital Services Inc. | | Louisiana-Pacific Corp. 8.875%, 08/15/10 | | Buy | | | (2.230 | )% | | 12/20/12 | | USD | | | 743,000 | | | | 11,315 | | |
| UBS AG | | Louisiana-Pacific Corp. 8.875%, 08/15/10 | | Buy | | | (2.000 | )% | | 12/20/12 | | USD | | | 485,000 | | | | 12,055 | | |
Lehman Brothers
Special Financing Inc. | | Macquarie Bank Ltd. FRN, 09/18/15 | | Buy | | | (1.200 | )% | | 12/20/12 | | USD | | | 2,836,000 | | | | (8,145 | ) | |
Lehman Brothers
Special Financing Inc. | | Macquarie Bank Ltd. FRN, 09/18/15 | | Sell | | | 1.300 | % | | 12/20/17 | | USD | | | 1,689,000 | | | | (2,940 | ) | |
| Barclays Bank PLC | | Merrill Lynch & Co. 5.000%, 01/15/15 | | Buy | | | (0.860 | )% | | 09/20/12 | | USD | | | 1,746,000 | | | | 32,193 | | |
| UBS AG | | Merrill Lynch & Co. 5.000%, 01/15/15 | | Buy | | | (0.830 | )% | | 09/20/12 | | USD | | | 191,000 | | | | 3,758 | | |
| Barclays Bank PLC | | Morgan Stanley 6.600%, 04/01/12 | | Buy | | | (1.040 | )% | | 12/20/12 | | USD | | | 745,000 | | | | 1,097 | | |
Citibank N.A.,
New York | | Morgan Stanley 6.600%, 04/01/12 | | Buy | | | (1.080 | )% | | 12/20/12 | | USD | | | 1,165,000 | | | | (316 | ) | |
Citibank N.A.,
New York | | Norbord Inc. 7.250%, 07/01/12 | | Sell | | | 2.200 | % | | 06/20/12 | | USD | | | 193,000 | | | | (14,321 | ) | |
Citibank N.A.,
New York | | Norbord Inc. 7.250%, 07/01/12 | | Buy | | | (2.450 | )% | | 12/20/17 | | USD | | | 1,108,000 | | | | 99,993 | | |
Credit Suisse
International | | Norbord Inc. 7.250%, 07/01/12 | | Buy | | | (1.450 | )% | | 06/20/14 | | USD | | | 1,448,000 | | | | 183,252 | | |
| UBS AG | | Norbord Inc. 7.250%, 07/01/12 | | Buy | | | (1.500 | )% | | 06/20/12 | | USD | | | 193,000 | | | | 19,199 | | |
| UBS AG | | Norbord Inc. 7.250%, 07/01/12 | | Buy | | | (2.400 | )% | | 12/20/17 | | USD | | | 440,000 | | | | 41,049 | | |
Lehman Brothers
Special Financing Inc. | | Radian Group Inc. 5.375%, 06/15/15 | | Sell | | | 3.900 | % | | 09/20/14 | | USD | | | 1,887,900 | | | | (130,993 | ) | |
| UBS AG | | Radian Group Inc. 5.375%, 06/15/15 | | Buy | | | (0.850 | )% | | 09/20/14 | | USD | | | 1,887,900 | | | | 374,157 | | |
Lehman Brothers
Special Financing Inc. | | Residential Capital LLC
6.500%, 04/17/13 | | Sell | | | 5.000 | % | | 12/20/12 | | USD | | | 302,000 | | | | 4,851 | | |
Citibank N.A.,
New York | | Royal Bank of Scotland PLC
6.000%, 05/10/13 | | Buy | | | (0.290 | )% | | 09/20/17 | | USD | | | 928,000 | | | | 35,422 | | |
| UBS AG | | Royal Bank of Scotland PLC
6.000%, 05/10/13 | | Buy | | | (0.400 | )% | | 09/20/17 | | USD | | | 720,000 | | | | 21,401 | | |
Citibank N.A.,
New York | | Simon Property Group LP
6.350%, 08/28/12 | | Buy | | | (0.380 | )% | | 09/20/12 | | USD | | | 200,000 | | | | 6,462 | | |
See Accompanying Notes to Financial Statements
84
PORTFOLIO OF INVESTMENTS
ING VP BALANCED PORTFOLIO AS OF DECEMBER 31, 2007 (CONTINUED)
| Counterparty | | Reference
Entity/Obligation | | Buy/Sell
Protection | | (Pay)/Receive
Fixed Rate | | Termination
Date | |
| | Notional
Amount | | Unrealized
Appreciation/
(Depreciation) | |
Citibank N.A.,
New York | | Societe Generale 6.625%, 04/27/15 | | Buy | | | (0.510 | )% | | 09/20/17 | | USD | | | 194,000 | | | $ | (707 | ) | |
Citibank N.A.,
New York | | Societe Generale 6.625%, 04/27/15 | | Buy | | | (0.510 | )% | | 09/20/17 | | USD | | | 436,000 | | | | (1,588 | ) | |
| UBS AG | | Societe Generale 6.625%, 04/27/15 | | Buy | | | (0.380 | )% | | 09/20/17 | | USD | | | 720,000 | | | | 4,693 | | |
| Barclays Bank PLC | | Standard Chartered Bank
3.625%, 02/03/17 | | Buy | | | (0.750 | )% | | 12/20/17 | | USD | | | 373,000 | | | | 220 | | |
Citibank N.A.,
New York | | Standard Chartered Bank
3.625%, 02/03/17 | | Buy | | | (0.670 | )% | | 09/20/17 | | USD | | | 194,000 | | | | 1,285 | | |
| UBS AG | | Standard Chartered Bank
3.625%, 02/03/17 | | Buy | | | (0.420 | )% | | 09/20/17 | | USD | | | 720,000 | | | | 18,622 | | |
Goldman Sachs
International | | Temple-Inland Inc. 7.875%, 05/01/12 | | Buy | | | (1.040 | )% | | 03/20/14 | | USD | | | 414,000 | | | | 1,689 | | |
JPMorgan
Chase Bank N.A.,
New York | | Temple-Inland Inc. 7.875%, 05/01/12 | | Buy | | | (0.890 | )% | | 03/20/14 | | USD | | | 905,000 | | | | 10,907 | | |
JPMorgan
Chase Bank N.A.,
New York | | Temple-Inland Inc. 7.875%, 05/01/12 | | Buy | | | (1.020 | )% | | 03/20/14 | | USD | | | 1,181,000 | | | | 6,074 | | |
Morgan Stanley
Capital Services Inc. | | Temple-Inland Inc. 7.875%, 05/01/12 | | Buy | | | (0.900 | )% | | 03/20/14 | | USD | | | 793,000 | | | | 9,136 | | |
Morgan Stanley
Capital Services Inc. | | Temple-Inland Inc. 7.875%, 05/01/12 | | Buy | | | (1.600 | )% | | 09/20/17 | | USD | | | 811,000 | | | | (19,051 | ) | |
| UBS AG | | Temple-Inland Inc. 7.875%, 05/01/12 | | Buy | | | (0.900 | )% | | 03/20/14 | | USD | | | 847,000 | | | | 9,758 | | |
| UBS AG | | Toll Bros Finance Corp. 6.875%, 11/15/12 | | Buy | | | (1.000 | )% | | 06/20/12 | | USD | | | 1,756,000 | | | | 110,498 | | |
Citibank N.A.,
New York | | United Mexican States 7.500%, 04/08/33 | | Sell | | | 0.160 | % | | 07/20/08 | | USD | | | 2,986,000 | | | | (310 | ) | |
Citibank N.A.,
New York | | United Mexican States 7.500%, 04/08/33 | | Buy | | | (0.355 | )% | | 07/20/12 | | USD | | | 373,000 | | | | 4,519 | | |
| UBS AG | | United Mexican States 7.500%, 04/08/33 | | Buy | | | (0.620 | )% | | 08/20/12 | | USD | | | 1,453,000 | | | | 2,227 | | |
Bear Stearns
Credit Products Inc. | | UST Inc. 6.625%, 07/15/12 | | Buy | | | (0.280 | )% | | 03/20/14 | | USD | | | 2,475,000 | | | | 9,549 | | |
Bear Stearns
Credit Products Inc. | | UST Inc. 6.625%, 07/15/12 | | Buy | | | (0.380 | )% | | 03/20/17 | | USD | | | 990,000 | | | | 4,120 | | |
Merrill Lynch
International | | Washington Mutual, Inc.
5.250%, 09/15/17 | | Buy | | | (3.150 | )% | | 12/20/12 | | USD | | | 1,752,000 | | | | 64,557 | | |
| UBS AG | | Westpac Banking Corp.
5.875%, 04/29/18 | | Buy | | | (0.350 | )% | | 09/20/17 | | USD | | | 720,000 | | | | 19,535 | | |
| UBS AG | | Westpac Banking Corp. 5.875%, 04/29/18 | | Buy | | | (0.510 | )% | | 09/20/17 | | USD | | | 661,000 | | | | 9,864 | | |
Citibank N.A.,
New York | | Weyerhaeuser Co. 6.750%, 03/15/12 | | Buy | | | (0.580 | )% | | 03/20/14 | | USD | | | 157,000 | | | | 3,797 | | |
JPMorgan
Chase Bank N.A.,
New York | | Weyerhaeuser Co. 6.750%, 03/15/12 | | Buy | | | (0.640 | )% | | 03/20/14 | | USD | | | 974,000 | | | | 20,438 | | |
Lehman Brothers
Special Financing Inc. | | Weyerhaeuser Co. 6.750%, 03/15/12 | | Buy | | | (0.570 | )% | | 03/20/14 | | USD | | | 905,000 | | | | 22,367 | | |
Morgan Stanley
Capital Services Inc. | | Weyerhaeuser Co. 6.750%, 03/15/12 | | Buy | | | (0.600 | )% | | 03/20/14 | | USD | | | 1,644,000 | | | | 38,002 | | |
Morgan Stanley
Capital Services Inc. | | Weyerhaeuser Co. 6.750%, 03/15/12 | | Buy | | | (0.880 | )% | | 03/20/17 | | USD | | | 909,000 | | | | 18,255 | | |
| Barclays Bank PLC | | Weyerhaeuser Co. 7.125%, 07/15/23 | | Sell | | | 0.780 | % | | 09/20/12 | | USD | | | 874,000 | | | | (4,897 | ) | |
Lehman Brothers
Special Financing Inc. | | Weyerhaeuser Co. 7.125%, 07/15/23 | | Sell | | | 0.780 | % | | 09/20/12 | | USD | | | 740,000 | | | | (4,146 | ) | |
Lehman Brothers
Special Financing Inc. | | Weyerhaeuser Co. 7.125%, 07/15/23 | | Sell | | | 0.770 | % | | 09/20/12 | | USD | | �� | 1,840,000 | | | | (11,090 | ) | |
| UBS AG | | Weyerhaeuser Co. 7.125%, 07/15/23 | | Sell | | | 0.790 | % | | 09/20/12 | | USD | | | 606,000 | | | | (3,138 | ) | |
Citibank N.A.,
New York | | Williams Partners LP 7.500%, 06/15/11 | | Sell | | | 1.030 | % | | 03/20/12 | | USD | | | 1,036,947 | | | | 12,467 | | |
| UBS AG | | XL Capital Assurance Inc.
(no specified obligation) | | Buy | | | (6.400 | )% | | 12/20/12 | | USD | | | 247,000 | | | | (2,398 | ) | |
| UBS AG | | XL Capital Ltd. 5.250%, 09/15/14 | | Buy | | | (0.610 | )% | | 09/20/16 | | USD | | | 1,025,000 | | | | 45,381 | | |
| UBS AG | | XL Capital Ltd. 5.250%, 09/15/14 | | Buy | | | (0.610 | )% | | 09/20/16 | | USD | | | 2,050,000 | | | | 90,761 | | |
| | | | | | | $ | 1,280,168 | | |
See Accompanying Notes to Financial Statements
85
PORTFOLIO OF INVESTMENTS
ING VP GROWTH AND INCOME PORTFOLIO AS OF DECEMBER 31, 2007
| Shares | | | | | | Value | |
| COMMON STOCK: 97.0% | | | |
| | | | | Aerospace/Defense: 1.1% | |
| | 324,300 | | | @,L | | BE Aerospace, Inc. | | $ | 17,155,470 | | |
| | 177,450 | | | | | United Technologies Corp. | | | 13,582,023 | | |
| | | | 30,737,493 | | |
| | | | | Agriculture: 2.5% | |
| | 940,438 | | | | | Altria Group, Inc. | | | 71,078,304 | | |
| | | | 71,078,304 | | |
| | | | | Apparel: 0.3% | |
| | 156,250 | | | | | Nike, Inc. | | | 10,037,500 | | |
| | | | 10,037,500 | | |
| | | | | Banks: 4.6% | |
| | 780,755 | | | | | Bank of America Corp. | | | 32,213,951 | | |
| | 174,465 | | | | | Bank of New York
Mellon Corp. | | | 8,506,913 | | |
| | 227,850 | | | L | | Cullen/Frost Bankers, Inc. | | | 11,542,881 | | |
| | 345,400 | | | | | PNC Financial Services
Group, Inc. | | | 22,675,510 | | |
| | 348,300 | | | | | State Street Corp. | | | 28,281,960 | | |
| | 799,700 | | | | | US Bancorp. | | | 25,382,478 | | |
| | | | 128,603,693 | | |
| | | | | Beverages: 1.7% | |
| | 119,200 | | | | | Anheuser-Busch Cos., Inc. | | | 6,238,928 | | |
| | 329,200 | | | | | Coca-Cola Co. | | | 20,203,004 | | |
| | 276,150 | | | | | PepsiCo, Inc. | | | 20,959,785 | | |
| | | | 47,401,717 | | |
| | | | | Chemicals: 1.0% | |
| | 282,000 | | | | | Air Products &
Chemicals, Inc. | | | 27,813,660 | | |
| | | | 27,813,660 | | |
| | | | | Computers: 2.6% | |
| | 171,200 | | | @ | | Apple, Inc. | | | 33,911,296 | | |
| | 1,054,200 | | | @,L | | Dell, Inc. | | | 25,838,442 | | |
| | 591,950 | | | L | | Seagate Technology, Inc. | | | 15,094,725 | | |
| | 2,600 | | | | | Seagate Technology,
Inc.-Escrow | | | — | | |
| | | | 74,844,463 | | |
| | | | | Cosmetics/Personal Care: 2.4% | |
| | 906,692 | | | | | Procter & Gamble Co. | | | 66,569,327 | | |
| | | | 66,569,327 | | |
| | | | | Diversified Financial Services: 6.7% | |
| | 151,400 | | | L | | Bear Stearns Cos., Inc. | | | 13,361,050 | | |
| | 1,055,476 | | | L | | Citigroup, Inc. | | | 31,073,213 | | |
| | 1,377,250 | | | | | Invesco Ltd. | | | 43,218,105 | | |
| | 998,950 | | | | | JPMorgan Chase & Co. | | | 43,604,168 | | |
| | 309,800 | | | @@,L | | Lazard Ltd. | | | 12,602,664 | | |
| | 581,000 | | | L | | Lehman Brothers
Holdings, Inc. | | | 38,020,640 | | |
| | 347,600 | | | @,L | | TD Ameritrade Holding Corp. | | | 6,972,856 | | |
| | | | 188,852,696 | | |
| | | | | Electric: 3.3% | |
| | 321,500 | | | | | Exelon Corp. | | | 26,247,260 | | |
| | 824,150 | | | @,L | | NRG Energy, Inc. | | | 35,718,661 | | |
| | 398,100 | | | L | | NSTAR | | | 14,419,182 | | |
| | 406,500 | | | | | PG&E Corp. | | | 17,516,085 | | |
| | | | 93,901,188 | | |
| Shares | | | | | | Value | |
| | | | | Environmental Control: 1.4% | |
| | 1,206,550 | | | | | Waste Management, Inc. | | $ | 39,417,989 | | |
| | | | 39,417,989 | | |
| | | | | Food: 1.2% | |
| | 1,039,083 | | | | | Kraft Foods, Inc. | | | 33,905,278 | | |
| | | | 33,905,278 | | |
| | | | | Healthcare-Products: 4.7% | |
| | 1,383,260 | | | | | Johnson & Johnson | | | 92,263,442 | | |
| | 986,600 | | | @ | | St. Jude Medical, Inc. | | | 40,095,424 | | |
| | | | 132,358,866 | | |
| | | | | Healthcare-Services: 1.1% | |
| | 345,647 | | | @,W,L | | Covance, Inc. | | | 29,939,943 | | |
| | | | 29,939,943 | | |
| | | | | Holding Companies-Diversified: 0.9% | |
| | 723,100 | | | @,@@ | | GEA Group AG | | | 24,774,666 | | |
| | | | 24,774,666 | | |
| | | | | Home Furnishings: 0.3% | |
| | 316,350 | | | L | | Tempur-Pedic
International, Inc. | | | 8,215,610 | | |
| | | | 8,215,610 | | |
| | | | | Household Products/Wares: 0.5% | |
| | 207,350 | | | | | Kimberly-Clark Corp. | | | 14,377,649 | | |
| | | | 14,377,649 | | |
| | | | | Insurance: 4.7% | |
| | 355,300 | | | | | American International
Group, Inc. | | | 20,713,990 | | |
| | 432,800 | | | L | | Assurant, Inc. | | | 28,954,320 | | |
| | 1,108,450 | | | L | | MBIA, Inc. | | | 20,650,424 | | |
| | 375,700 | | | L | | Principal Financial
Group, Inc. | | | 25,863,188 | | |
| | 472,000 | | | | | Protective Life Corp. | | | 19,361,440 | | |
| | 333,100 | | | | | Travelers Cos., Inc. | | | 17,920,780 | | |
| | | | 133,464,142 | | |
| | | | | Internet: 3.1% | |
| | 127,000 | | | @ | | Google, Inc.-Class A | | | 87,817,960 | | |
| | | | 87,817,960 | | |
| | | | | Investment Companies: 0.4% | |
| | 692,262 | | | | | KKR Private Equity
Investors LP | | | 12,571,478 | | |
| | | | 12,571,478 | | |
| | | | | Media: 2.4% | |
| | 1,957,750 | | | | | News Corp.-Class A | | | 40,114,298 | | |
| | 562,900 | | | | | Time Warner, Inc. | | | 9,293,479 | | |
| | 540,100 | | | L | | Walt Disney Co. | | | 17,434,428 | | |
| | | | 66,842,205 | | |
| | | | | Metal Fabricate/Hardware: 1.4% | |
| | 291,300 | | | | | Precision Castparts Corp. | | | 40,403,310 | | |
| | | | 40,403,310 | | |
| | | | | Mining: 2.0% | |
| | 739,900 | | | | | Alcoa, Inc. | | | 27,043,345 | | |
| | 290,400 | | | | | Freeport-McMoRan
Copper & Gold, Inc. | | | 29,748,576 | | |
| | | | 56,791,921 | | |
See Accompanying Notes to Financial Statements
86
PORTFOLIO OF INVESTMENTS
ING VP GROWTH AND INCOME PORTFOLIO AS OF DECEMBER 31, 2007 (CONTINUED)
| Shares | | | | | | Value | |
| | | | | Miscellaneous Manufacturing: 4.7% | |
| | 834,850 | | | L | | Cooper Industries Ltd. | | $ | 44,146,868 | | |
| | 1,479,231 | | | | | General Electric Co. | | | 54,835,093 | | |
| | 545,996 | | | | | Roper Industries, Inc. | | | 34,146,590 | | |
| | | | 133,128,551 | | |
| | | | | Oil & Gas: 9.4% | |
| | 285,100 | | | | | Apache Corp. | | | 30,659,654 | | |
| | 1,382,715 | | | | | ExxonMobil Corp. | | | 129,546,568 | | |
| | 194,580 | | | @@ | | Royal Dutch Shell PLC ADR | | | 16,381,541 | | |
| | 507,700 | | | | | Sunoco, Inc. | | | 36,777,788 | | |
| | 245,750 | | | | | Tesoro Petroleum Corp. | | | 11,722,275 | | |
| | 762,688 | | | | | XTO Energy, Inc. | | | 39,171,656 | | |
| | | | 264,259,482 | | |
| | | | | Oil & Gas Services: 2.1% | |
| | 1,065,300 | | | | | BJ Services Co. | | | 25,844,178 | | |
| | 653,827 | | | | | Halliburton Co. | | | 24,786,582 | | |
| | 102,300 | | | | | Schlumberger Ltd. | | | 10,063,251 | | |
| | | | 60,694,011 | | |
| | | | | Pharmaceuticals: 6.3% | |
| | 1,110,150 | | | | | Abbott Laboratories | | | 62,334,923 | | |
| | 166,598 | | | @ | | Gilead Sciences, Inc. | | | 7,665,174 | | |
| | 554,300 | | | @,L | | Hospira, Inc. | | | 23,635,352 | | |
| | 997,400 | | | | | Merck & Co., Inc. | | | 57,958,914 | | |
| | 580,950 | | | @@,L | | Teva Pharmaceutical
Industries Ltd. ADR | | | 27,002,556 | | |
| | | | 178,596,919 | | |
| | | | | Retail: 4.7% | |
| | 871,900 | | | @,L | | Aeropostale, Inc. | | | 23,105,350 | | |
| | 599,200 | | | | | CVS Caremark Corp. | | | 23,818,200 | | |
| | 633,550 | | | L | | Home Depot, Inc. | | | 17,067,837 | | |
| | 321,700 | | | @,L | | Kohl's Corp. | | | 14,733,860 | | |
| | 845,100 | | | L | | Liz Claiborne, Inc. | | | 17,197,785 | | |
| | 171,350 | | | | | McDonald's Corp. | | | 10,094,229 | | |
| | 470,150 | | | | | TJX Cos., Inc. | | | 13,507,410 | | |
| | 252,200 | | | | | Wal-Mart Stores, Inc. | | | 11,987,066 | | |
| | | | 131,511,737 | | |
| | | | | Savings & Loans: 0.5% | |
| | 736,550 | | | L | | People's United
Financial, Inc. | | | 13,110,590 | | |
| | | | 13,110,590 | | |
| | | | | Semiconductors: 5.0% | |
| | 2,784,350 | | | | | Intel Corp. | | | 74,230,766 | | |
| | 1,062,050 | | | | | Maxim Integrated Products | | | 28,123,084 | | |
| | 3,966,998 | | | @@ | | Taiwan Semiconductor
Manufacturing Co.,
Ltd. ADR | | | 39,511,300 | | |
| | | | 141,865,150 | | |
| | | | | Software: 5.9% | |
| | 493,350 | | | @,L | | Adobe Systems, Inc. | | | 21,080,846 | | |
| | 3,237,011 | | | L | | Microsoft Corp. | | | 115,237,592 | | |
| | 1,284,550 | | | @ | | Oracle Corp. | | | 29,005,139 | | |
| | | | 165,323,577 | | |
| | | | | Telecommunications: 7.0% | |
| | 1,216,350 | | | | | AT&T, Inc. | | | 50,551,506 | | |
| | 1,990,450 | | | @ | | Cisco Systems, Inc. | | | 53,881,482 | | |
| | 1,069,050 | | | | | Qualcomm, Inc. | | | 42,067,118 | | |
| Shares | | | | | | Value | |
| | 2,210,700 | | | @,L | | Qwest Communications
International, Inc. | | $ | 15,497,007 | | |
| | 806,600 | | | | | Verizon
Communications, Inc. | | | 35,240,354 | | |
| | | | 197,237,467 | | |
| | | | | Toys/Games/Hobbies: 1.1% | |
| | 53,000 | | | @@ | | Nintendo Co., Ltd. | | | 31,119,055 | | |
| | | | 31,119,055 | | |
Total Common Stock
(Cost $2,420,852,039) | | | 2,737,567,597 | | |
Principal
Amount | | | | | | Value | |
| RIGHTS: 0.0% | | | |
| | | | | Electric: 0.0% | |
| $ | 20,000,000 | | | X | | Mirant Corp.-Escrow,
due 06/15/21 | | | — | | |
| | 10,000,000 | | | X | | Southern Energy Escrow,
due 07/15/09 | | | — | | |
Total Rights
(Cost $—) | | | — | | |
Total Long-Term Investments
(Cost $2,420,852,039) | | | 2,737,567,597 | | |
| Shares | | | | | | Value | |
| SHORT-TERM INVESTMENTS: 14.2% | | | |
| | | | | Mutual Fund: 2.1% | |
| | 59,925,000 | | | **,S | | ING Institutional Prime
Money Market Fund | | | 59,925,000 | | |
Total Mutual Fund
(Cost $59,925,000) | | | 59,925,000 | | |
Principal
Amount | | | | Value | |
| | | Repurchase Agreement: 0.2% | |
| $ | 5,682,000 | | | Deutsche Bank Repurchase
Agreement dated 12/31/07,
4.250%, due 01/02/08,
$5,683,342 to be received
upon repurchase
(Collateralized by $5,804,000
Federal Home Loan Bank,
Discount Note, Market Value
$5,796,455, due 01/11/08) | | | 5,682,000 | | |
Total Repurchase Agreement
(Cost $5,682,000) | | | 5,682,000 | | |
See Accompanying Notes to Financial Statements
87
PORTFOLIO OF INVESTMENTS
ING VP GROWTH AND INCOME PORTFOLIO AS OF DECEMBER 31, 2007 (CONTINUED)
Principal
Amount | | | | Value | |
| | | Securities Lending Collateralcc: 11.9% | |
| $ | 336,741,398 | | | Bank of New York
Mellon Corp. Institutional
Cash Reserves | | $ | 336,741,398 | | |
Total Securities Lending
Collateral
(Cost $336,741,398) | | | 336,741,398 | | |
Total Short-Term Investments
(Cost $402,348,398) | | | 402,348,398 | | |
Total Investments in
Securities
(Cost $2,823,200,437)* | | | 111.2 | % | | $ | 3,139,915,995 | | |
Other Assets and
Liabilities - Net | | | (11.2 | ) | | | (317,420,997 | ) | |
| Net Assets | | | 100.0 | % | | $ | 2,822,494,998 | | |
@ Non-income producing security
@@ Foreign Issuer
ADR American Depositary Receipt
cc Securities purchased with cash collateral for securities loaned.
W When-issued or delayed delivery security
S All or a portion of this security is segregated for certain derivatives, when-issued or delayed delivery securities and forward currency exchange contracts.
L Loaned security, a portion or all of the security is on loan at December 31, 2007.
X Fair value determined by ING Funds Valuation Committee appointed by the Fund's Board of Directors/Trustees.
** Investment in affiliate
* Cost for federal income tax purposes is $2,840,254,096
Net unrealized appreciation consists of:
| Gross Unrealized Appreciation | | $ | 392,250,994 | | |
| Gross Unrealized Depreciation | | | (92,589,095 | ) | |
| Net Unrealized Appreciation | | $ | 299,661,899 | | |
ING VP Growth and Income Portfolio Open Futures Contracts on December 31, 2007:
Contract
Description | | Number
of Contracts | | Notional
Market Value | | Expiration
Date | | Unrealized
Depreciation | |
| Long Contracts | |
| S&P 500 | | | 55 | | | $ | 20,311,500 | | | 03/19/08 | | $ | (272,929 | ) | |
| | | | | | | | | $ | (272,929 | ) | |
See Accompanying Notes to Financial Statements
88
PORTFOLIO OF INVESTMENTS
ING VP GROWTH PORTFOLIO AS OF DECEMBER 31, 2007
| Shares | | | | | | Value | |
| COMMON STOCK: 98.2% | | | |
| | | | | Aerospace/Defense: 6.7% | |
| | 11,000 | | | | | Goodrich Corp. | | $ | 776,710 | | |
| | 21,200 | | | | | L-3 Communications Holdings, Inc. | | | 2,245,928 | | |
| | 52,200 | | | | | Lockheed Martin Corp. | | | 5,494,572 | | |
| | 28,600 | | | | | Northrop Grumman Corp. | | | 2,249,104 | | |
| | | | 10,766,314 | | |
| | | | | Apparel: 2.6% | |
| | 64,000 | | | | | Nike, Inc. | | | 4,111,360 | | |
| | | | 4,111,360 | | |
| | | | | Banks: 0.5% | |
| | 5,400 | | | @@ | | Uniao de Bancos Brasileiros SA
GDR | | | 754,056 | | |
| | | | 754,056 | | |
| | | | | Beverages: 5.4% | |
| | 60,600 | | | | | Anheuser-Busch Cos., Inc. | | | 3,171,804 | | |
| | 79,300 | | | | | Pepsi Bottling Group, Inc. | | | 3,129,178 | | |
| | 31,200 | | | | | PepsiCo, Inc. | | | 2,368,080 | | |
| | | | 8,669,062 | | |
| | | | | Biotechnology: 5.3% | |
| | 43,800 | | | @ | | Invitrogen Corp. | | | 4,091,358 | | |
| | 290,800 | | | @ | | Millennium Pharmaceuticals, Inc. | | | 4,356,184 | | |
| | | | 8,447,542 | | |
| | | | | Chemicals: 7.7% | |
| | 21,800 | | | | | CF Industries Holdings, Inc. | | | 2,399,308 | | |
| | 16,800 | | | @ | | Mosaic Co. | | | 1,584,912 | | |
| | 33,700 | | | @@ | | Potash Corp. of Saskatchewan | | | 4,851,452 | | |
| | 62,300 | | | | | Sigma-Aldrich Corp. | | | 3,401,580 | | |
| | | | 12,237,252 | | |
| | | | | Commercial Services: 0.8% | |
| | 14,200 | | | @ | | ITT Educational Services, Inc. | | | 1,210,834 | | |
| | | | 1,210,834 | | |
| | | | | Computers: 4.9% | |
| | 29,100 | | | @ | | Apple, Inc. | | | 5,764,128 | | |
| | 84,200 | | | | | Seagate Technology, Inc. | | | 2,147,100 | | |
| | | | 7,911,228 | | |
| | | | | Diversified Financial Services: 2.6% | |
| | 39,600 | | | | | Federated Investors, Inc. | | | 1,629,936 | | |
| | 11,700 | | | | | Goldman Sachs Group, Inc. | | | 2,516,085 | | |
| | | | 4,146,021 | | |
| | | | | Electric: 0.6% | |
| | 10,100 | | | | | Constellation Energy Group, Inc. | | | 1,035,553 | | |
| | | | 1,035,553 | | |
| | | | | Electronics: 2.6% | |
| | 47,600 | | | | | Applera Corp. - Applied
Biosystems Group | | | 1,614,592 | | |
| | 205,700 | | | @,@@ | | Flextronics International Ltd. | | | 2,480,742 | | |
| | | | 4,095,334 | | |
| | | | | Food: 1.7% | |
| | 18,000 | | | | | General Mills, Inc. | | | 1,026,000 | | |
| | 45,500 | | | @@ | | Unilever NV ADR | | | 1,658,930 | | |
| | | | 2,684,930 | | |
| Shares | | | | | | Value | |
| | | | | Healthcare-Services: 8.9% | |
| | 96,500 | | | | | Aetna, Inc. | | $ | 5,570,945 | | |
| | 38,700 | | | @ | | Coventry Health Care, Inc. | | | 2,292,975 | | |
| | 83,400 | | | @ | | Humana, Inc. | | | 6,280,854 | | |
| | | | 14,144,774 | | |
| | | | | Household Products/Wares: 1.5% | |
| | 18,400 | | | @ | | Fossil, Inc. | | | 772,432 | | |
| | 22,900 | | | | | Kimberly-Clark Corp. | | | 1,587,886 | | |
| | | | 2,360,318 | | |
| | | | | Insurance: 1.7% | |
| | 22,400 | | | @@ | | Axis Capital Holdings Ltd. | | | 872,928 | | |
| | 6,800 | | | @@ | | Everest Re Group Ltd. | | | 682,720 | | |
| | 6,800 | | | @@ | | RenaissanceRe Holdings Ltd. | | | 409,632 | | |
| | 15,000 | | | | | Travelers Cos., Inc. | | | 807,000 | | |
| | | | 2,772,280 | | |
| | | | | Internet: 5.4% | |
| | 60,000 | | | @ | | Amazon.com, Inc. | | | 5,558,400 | | |
| | 96,100 | | | @ | | Expedia, Inc. | | | 3,038,682 | | |
| | | | 8,597,082 | | |
| | | | | Miscellaneous Manufacturing: 4.4% | |
| | 16,700 | | | | | Eaton Corp. | | | 1,619,065 | | |
| | 51,100 | | | | | Parker Hannifin Corp. | | | 3,848,341 | | |
| | 10,400 | | | @@ | | Siemens AG ADR | | | 1,636,544 | | |
| | | | 7,103,950 | | |
| | | | | Oil & Gas: 9.9% | |
| | 50,000 | | | | | Chevron Corp. | | | 4,666,500 | | |
| | 6,800 | | | @@ | | Encana Corp. | | | 462,128 | | |
| | 45,500 | | | | | ExxonMobil Corp. | | | 4,262,895 | | |
| | 69,100 | | | @@ | | Petro-Canada | | | 3,705,142 | | |
| | 19,900 | | | @@ | | Royal Dutch Shell PLC ADR | | | 1,675,580 | | |
| | 7,065 | | | @ | | Transocean, Inc. | | | 1,011,355 | | |
| | | | 15,783,600 | | |
| | | | | Pharmaceuticals: 4.3% | |
| | 72,400 | | | @ | | Express Scripts, Inc. | | | 5,285,200 | | |
| | 38,700 | | | @@ | | Herbalife Ltd. | | | 1,558,836 | | |
| | | | 6,844,036 | | |
| | | | | Retail: 0.9% | |
| | 12,600 | | | @ | | Autozone, Inc. | | | 1,510,866 | | |
| | | | 1,510,866 | | |
| | | | | Savings & Loans: 0.5% | |
| | 55,600 | | | | | Hudson City Bancorp., Inc. | | | 835,112 | | |
| | | | 835,112 | | |
| | | | | Semiconductors: 6.3% | |
| | 211,700 | | | | | Intel Corp. | | | 5,643,922 | | |
| | 128,200 | | | @ | | Nvidia Corp. | | | 4,361,364 | | |
| | | | 10,005,286 | | |
| | | | | Software: 7.1% | |
| | 87,100 | | | @ | | BMC Software, Inc. | | | 3,104,244 | | |
| | 191,600 | | | | | CA, Inc. | | | 4,780,420 | | |
| | 96,900 | | | | | Microsoft Corp. | | | 3,449,640 | | |
| | | | 11,334,304 | | |
See Accompanying Notes to Financial Statements
89
PORTFOLIO OF INVESTMENTS
ING VP GROWTH PORTFOLIO AS OF DECEMBER 31, 2007 (CONTINUED)
| Shares | | | | | | Value | |
| | | | | Telecommunications: 5.9% | |
| | 9,000 | | | @@ | | China Mobile Ltd. ADR | | $ | 781,830 | | |
| | 74,100 | | | | | Harris Corp. | | | 4,644,588 | | |
| | 81,700 | | | @@ | | Nokia OYJ ADR | | | 3,136,463 | | |
| | 29,000 | | | @@ | | Turkcell Iletisim Hizmet AS ADR | | | 799,530 | | |
| | | | 9,362,411 | | |
Total Common Stock
(Cost $150,452,736) | | | 156,723,505 | | |
| EXCHANGE-TRADED FUNDS: 1.9% | | | |
| | | | | Exchange-Traded Funds: 1.9% | |
| | 26,000 | | | | | Financial Select Sector SPDR Fund | | | 752,180 | | |
| | 36,700 | | | | | iShares Russell 1000 Growth | | | 2,230,626 | | |
Total Exchange-Traded Funds
(Cost $3,077,807) | | | 2,982,806 | | |
Total Long-Term Investments
(Cost $153,530,543) | | | 159,706,311 | | |
| SHORT-TERM INVESTMENTS: 0.5% | | | |
| | | | | Mutual Fund: 0.3% | |
| | 525,000 | | | ** | | ING Institutional Prime Money
Market Fund | | | 525,000 | | |
Total Mutual Fund
(Cost $525,000) | | | 525,000 | | |
Principal
Amount | | | | Value | |
| REPURCHASE AGREEMENT: 0.2% | |
| $ | 321,000 | | | Morgan Stanley Repurchase
Agreement dated 12/31/07, 4.250%,
due 01/02/08, $321,076
to be received upon repurchase
(Collateralized by $330,000
Federal Home Loan Bank,
Discount Note, Market Value
$329,373, due 01/16/08) | | | 321,000 | | |
Total Repurchase Agreement
(Cost $321,000) | | | 321,000 | | |
Total Short-Term Investments
(Cost $846,000) | | | 846,000 | | |
Total Investments in
Securities
(Cost $154,376,543)* | | | 100.6 | % | | $ | 160,552,311 | | |
Other Assets and
Liabilities - Net | | | (0.6 | ) | | | (956,886 | ) | |
| Net Assets | | | 100.0 | % | | $ | 159,595,425 | | |
@ Non-income producing security
@@ Foreign Issuer
ADR American Depositary Receipt
GDR Global Depositary Receipt
** Investment in affiliate
* Cost for federal income tax purposes is $154,627,938
Net unrealized appreciation consists of:
| Gross Unrealized Appreciation | | $ | 8,221,594 | | |
| Gross Unrealized Depreciation | | | (2,297,221 | ) | |
| Net Unrealized Appreciation | | $ | 5,924,373 | | |
See Accompanying Notes to Financial Statements
90
PORTFOLIO OF INVESTMENTS
ING VP SMALL COMPANY PORTFOLIO AS OF DECEMBER 31, 2007
| Shares | | | | | | Value | |
| COMMON STOCK: 91.8% | | | |
| | | | | Advertising: 0.3% | |
| | 60,200 | | | @ | | inVentiv Health, Inc. | | $ | 1,863,792 | | |
| | | | 1,863,792 | | |
| | | | | Aerospace/Defense: 2.4% | |
| | 92,800 | | | L | | DRS Technologies, Inc. | | | 5,036,256 | | |
| | 123,700 | | | @,L | | Moog, Inc. | | | 5,666,697 | | |
| | 69,300 | | | @ | | Teledyne Technologies, Inc. | | | 3,695,769 | | |
| | | | 14,398,722 | | |
| | | | | Apparel: 0.9% | |
| | 134,522 | | | @,@@,L | | Gildan Activewear, Inc. | | | 5,536,926 | | |
| | | | 5,536,926 | | |
| | | | | Auto Parts & Equipment: 0.3% | |
| | 143,400 | | | L | | ArvinMeritor, Inc. | | | 1,682,082 | | |
| | | | 1,682,082 | | |
| | | | | Banks: 5.5% | |
| | 525,114 | | | L | | Bank Mutual Corp. | | | 5,550,455 | | |
| | 143,050 | | | L | | Boston Private Financial
Holdings, Inc. | | | 3,873,794 | | |
| | 112,825 | | | | | Chittenden Corp. | | | 4,018,827 | | |
| | 244,950 | | | | | FirstMerit Corp. | | | 4,901,450 | | |
| | 152,869 | | | L | | Prosperity Bancshares, Inc. | | | 4,492,820 | | |
| | 131,100 | | | @ | | Signature Bank | | | 4,424,625 | | |
| | 73,702 | | | L | | UMB Financial Corp. | | | 2,827,209 | | |
| | 126,200 | | | L | | Whitney Holding Corp. | | | 3,300,130 | | |
| | | | 33,389,310 | | |
| | | | | Biotechnology: 1.0% | |
| | 580,800 | | | @,L | | Human Genome Sciences, Inc. | | | 6,063,552 | | |
| | | | 6,063,552 | | |
| | | | | Chemicals: 3.5% | |
| | 107,300 | | | | | Albemarle Corp. | | | 4,426,125 | | |
| | 65,800 | | | | | Cytec Industries, Inc. | | | 4,051,964 | | |
| | 144,800 | | | | | Hercules, Inc. | | | 2,801,880 | | |
| | 78,000 | | | @,L | | Terra Industries, Inc. | | | 3,725,280 | | |
| | 163,500 | | | L | | UAP Holding Corp. | | | 6,311,100 | | |
| | | | 21,316,349 | | |
| | | | | Commercial Services: 3.2% | |
| | 32,900 | | | @,L | | Advisory Board Co. | | | 2,111,851 | | |
| | 87,000 | | | L | | Arbitron, Inc. | | | 3,616,590 | | |
| | 48,200 | | | @,L | | Exponent, Inc. | | | 1,303,328 | | |
| | 79,200 | | | @,L | | FTI Consulting, Inc. | | | 4,881,888 | | |
| | 195,000 | | | @,L | | Geo Group, Inc. | | | 5,460,000 | | |
| | 125,200 | | | @,L | | TrueBlue, Inc. | | | 1,812,896 | | |
| | | | 19,186,553 | | |
| | | | | Computers: 3.3% | |
| | 96,100 | | | @,L | | CACI International, Inc. | | | 4,302,397 | | |
| | 254,000 | | | @ | | Electronics for Imaging | | | 5,709,920 | | |
| | 108,200 | | | @,@@,L | | Logitech International | | | 3,964,448 | | |
| | 311,000 | | | @,L | | Mentor Graphics Corp. | | | 3,352,580 | | |
| | 34,700 | | | @,L | | Micros Systems, Inc. | | | 2,434,552 | | |
| | | | 19,763,897 | | |
| | | | | Distribution/Wholesale: 1.2% | |
| | 245,560 | | | @,L | | Brightpoint, Inc. | | | 3,771,802 | | |
| | 80,713 | | | L | | Owens & Minor, Inc. | | | 3,424,653 | | |
| | | | 7,196,455 | | |
| Shares | | | | | | Value | |
| | | | | Diversified Financial Services: 3.4% | |
| | 38,475 | | | @,L | | GFI Group, Inc. | | $ | 3,682,827 | | |
| | 54,500 | | | L | | Greenhill & Co., Inc. | | | 3,623,160 | | |
| | 104,550 | | | @ | | Investment Technology
Group, Inc. | | | 4,975,535 | | |
| | 86,712 | | | @,L | | Piper Jaffray Cos. | | | 4,016,500 | | |
| | 122,803 | | | | | Waddell & Reed Financial, Inc. | | | 4,431,960 | | |
| | | | 20,729,982 | | |
| | | | | Electric: 2.0% | |
| | 81,600 | | | L | | Idacorp, Inc. | | | 2,873,952 | | |
| | 41,000 | | | L | | ITC Holdings Corp. | | | 2,313,220 | | |
| | 245,000 | | | | | Portland General Electric Co. | | | 6,806,098 | | |
| | | | 11,993,270 | | |
| | | | | | | Electrical Components &
Equipment: 1.7% | | | | | |
| | 156,600 | | | @,L | | Advanced Energy Industries, Inc. | | | 2,048,328 | | |
| | 87,700 | | | W | | Ametek, Inc. | | | 4,107,868 | | |
| | 209,000 | | | @,L | | Greatbatch, Inc. | | | 4,177,910 | | |
| | | | 10,334,106 | | |
| | | | | Electronics: 2.7% | |
| | 212,600 | | | @,L | | Benchmark Electronics, Inc. | | | 3,769,398 | | |
| | 95,500 | | | @,L | | Cymer, Inc. | | | 3,717,815 | | |
| | 213,200 | | | @ | | NU Horizons Electronics Corp. | | | 1,481,740 | | |
| | 61,000 | | | @ | | Thomas & Betts Corp. | | | 2,991,440 | | |
| | 69,500 | | | @ | | Varian, Inc. | | | 4,538,350 | | |
| | | | 16,498,743 | | |
| | | | | Environmental Control: 1.1% | |
| | 219,900 | | | @,L | | Waste Connections, Inc. | | | 6,794,910 | | |
| | | | 6,794,910 | | |
| | | | | Food: 1.5% | |
| | 149,800 | | | | | Corn Products International, Inc. | | | 5,505,150 | | |
| | 119,800 | | | L | | Pilgrim's Pride Corp. | | | 3,468,210 | | |
| | | | 8,973,360 | | |
| | | | | Forest Products & Paper: 0.3% | |
| | 78,500 | | | @@,L | | AbitibiBowater, Inc. | | | 1,617,885 | | |
| | | | 1,617,885 | | |
| | | | | Gas: 2.6% | |
| | 84,400 | | | L | | New Jersey Resources Corp. | | | 4,221,688 | | |
| | 207,100 | | | | | Vectren Corp. | | | 6,007,971 | | |
| | 162,600 | | | | | WGL Holdings, Inc. | | | 5,326,776 | | |
| | | | 15,556,435 | | |
| | | | | Hand/Machine Tools: 0.6% | |
| | 85,000 | | | | | Regal-Beloit Corp. | | | 3,820,750 | | |
| | | | 3,820,750 | | |
| | | | | Healthcare-Products: 2.3% | |
| | 183,300 | | | @,L | | Accuray, Inc. | | | 2,789,826 | | |
| | 82,900 | | | L | | Cooper Cos., Inc. | | | 3,150,200 | | |
| | 12,987 | | | @,L | | Luminex Corp. | | | 210,909 | | |
| | 176,400 | | | @,L | | Micrus Endovascular Corp. | | | 3,471,552 | | |
| | 144,000 | | | @,L | | Spectranetics Corp. | | | 2,207,520 | | |
| | 153,510 | | | @,L | | Volcano Corp. | | | 1,920,410 | | |
| | | | 13,750,417 | | |
See Accompanying Notes to Financial Statements
91
PORTFOLIO OF INVESTMENTS
ING VP SMALL COMPANY PORTFOLIO AS OF DECEMBER 31, 2007 (CONTINUED)
| Shares | | | | | | Value | |
| | | | | Healthcare-Services: 3.3% | |
| | 51,400 | | | @,L | | Healthways, Inc. | | $ | 3,003,816 | | |
| | 134,600 | | | @ | | Magellan Health Services, Inc. | | | 6,276,398 | | |
| | 154,700 | | | @,L | | Psychiatric Solutions, Inc. | | | 5,027,750 | | |
| | 116,200 | | | | | Universal Health Services, Inc. | | | 5,949,440 | | |
| | | | 20,257,404 | | |
| | | | | Household Products/Wares: 0.3% | |
| | 72,909 | | | @,L | | Jarden Corp. | | | 1,721,381 | | |
| | | | 1,721,381 | | |
| | | | | Housewares: 0.9% | |
| | 101,300 | | | L | | Toro Co. | | | 5,514,772 | | |
| | | | 5,514,772 | | |
| | | | | Insurance: 4.1% | |
| | 142,504 | | | @@,L | | Aspen Insurance Holdings Ltd. | | | 4,109,815 | | |
| | 126,700 | | | @@,L | | Assured Guaranty Ltd. | | | 3,362,618 | | |
| | 200,440 | | | @ | | First Mercury Financial Corp. | | | 4,890,736 | | |
| | 114,650 | | | @@,L | | Platinum Underwriters
Holdings Ltd. | | | 4,076,954 | | |
| | 67,050 | | | @,L | | ProAssurance Corp. | | | 3,682,386 | | |
| | 201,675 | | | | | Selective Insurance Group | | | 4,636,508 | | |
| | | | 24,759,017 | | |
| | | | | Internet: 2.2% | |
| | 161,400 | | | @,L | | Cogent Communications
Group, Inc. | | | 3,826,794 | | |
| | 309,900 | | | @,L | | Trizetto Group | | | 5,382,963 | | |
| | 245,800 | | | @,L | | Websense, Inc. | | | 4,173,684 | | |
| | | | 13,383,441 | | |
| | | | | Leisure Time: 0.7% | |
| | 88,500 | | | @, L | | Life Time Fitness, Inc. | | | 4,396,680 | | |
| | | | 4,396,680 | | |
| | | | | Machinery-Diversified: 2.6% | |
| | 106,200 | | | @ | | Gardner Denver, Inc. | | | 3,504,600 | | |
| | 85,500 | | | | | Nordson Corp. | | | 4,955,580 | | |
| | 48,400 | | | L | | Tennant Co. | | | 2,143,636 | | |
| | 151,700 | | | | | Wabtec Corp. | | | 5,224,548 | | |
| | | | 15,828,364 | | |
| | | | | Media: 0.9% | |
| | 239,600 | | | L | | Entercom Communications Corp. | | | 3,280,124 | | |
| | 259,500 | | | L | | GateHouse Media, Inc. | | | 2,278,410 | | |
| | | | 5,558,534 | | |
| | | | | Metal Fabricate/Hardware: 0.7% | |
| | 135,200 | | | | | Commercial Metals Co. | | | 3,981,640 | | |
| | | | 3,981,640 | | |
| | | | | Miscellaneous Manufacturing: 0.9% | |
| | 164,400 | | | | | Barnes Group, Inc. | | | 5,489,316 | | |
| | | | 5,489,316 | | |
| | | | | Oil & Gas: 3.3% | |
| | 119,300 | | | @,L | | Carrizo Oil & Gas, Inc. | | | 6,531,675 | | |
| | 54,600 | | | @ | | Denbury Resources, Inc. | | | 1,624,350 | | |
| | 298,600 | | | @,L | | EXCO Resources, Inc. | | | 4,622,328 | | |
| | 220,600 | | | @,L | | Parallel Petroleum Corp. | | | 3,889,178 | | |
| | 66,300 | | | @ | | Unit Corp. | | | 3,066,375 | | |
| | | | 19,733,906 | | |
| Shares | | | | | | Value | |
| | | | | Oil & Gas Services: 1.8% | |
| | 113,400 | | | @,L | | Cal Dive International, Inc. | | $ | 1,501,416 | | |
| | 21,500 | | | @,L | | Core Laboratories NV | | | 2,681,480 | | |
| | 151,796 | | | @,L | | Global Industries Ltd. | | | 3,251,470 | | |
| | 224,900 | | | @,L | | Tetra Technologies, Inc. | | | 3,501,693 | | |
| | | | 10,936,059 | | |
| | | | | Packaging & Containers: 1.6% | |
| | 159,700 | | | @ | | Crown Holdings, Inc. | | | 4,096,305 | | |
| | 106,000 | | | L | | Silgan Holdings, Inc. | | | 5,505,640 | | |
| | | | 9,601,945 | | |
| | | | | Pharmaceuticals: 4.1% | |
| | 312,700 | | | @,L | | Akorn, Inc. | | | 2,295,218 | | |
| | 144,400 | | | @,L | | BioMarin Pharmaceuticals, Inc. | | | 5,111,760 | | |
| | 144,100 | | | @,L | | Cubist Pharmaceuticals, Inc. | | | 2,955,491 | | |
| | 265,100 | | | @,L | | MannKind Corp. | | | 2,110,196 | | |
| | 315,700 | | | @,L | | Salix Pharmaceuticals Ltd. | | | 2,487,716 | | |
| | 203,800 | | | @,L | | Sciele Pharma, Inc. | | | 4,167,710 | | |
| | 31,400 | | | @,L | | United Therapeutics Corp. | | | 3,066,210 | | |
| | 79,400 | | | @,L | | USANA Health Sciences, Inc. | | | 2,944,152 | | |
| | | | 25,138,453 | | |
| | | | | Retail: 7.2% | |
| | 198,100 | | | | | Casey's General Stores, Inc. | | | 5,865,741 | | |
| | 90,400 | | | @ | | Gymboree Corp. | | | 2,753,584 | | |
| | 199,300 | | | @ | | Jack in the Box, Inc. | | | 5,135,961 | | |
| | 167,681 | | | @,L | | JOS A Bank Clothiers, Inc. | | | 4,770,524 | | |
| | 111,800 | | | | | Longs Drug Stores Corp. | | | 5,254,600 | | |
| | 109,800 | | | @,L | | Pantry, Inc. | | | 2,869,074 | | |
| | 181,300 | | | @ | | Papa John's International, Inc. | | | 4,115,510 | | |
| | 96,500 | | | | | Phillips-Van Heusen | | | 3,556,990 | | |
| | 169,700 | | | L | | Regis Corp. | | | 4,744,812 | | |
| | 311,350 | | | L | | Stage Stores, Inc. | | | 4,607,980 | | |
| | | | 43,674,776 | | |
| | | | | Savings & Loans: 2.5% | |
| | 365,072 | | | L | | First Niagara Financial Group, Inc. | | | 4,395,467 | | |
| | 424,168 | | | L | | NewAlliance Bancshares, Inc. | | | 4,886,415 | | |
| | 633,900 | | | | | Westfield Financial, Inc. | | | 6,148,830 | | |
| | | | 15,430,712 | | |
| | | | | Semiconductors: 5.9% | |
| | 211,600 | | | @,L | | DSP Group, Inc. | | | 2,581,520 | | |
| | 202,400 | | | @ | | Emulex Corp. | | | 3,303,168 | | |
| | 569,800 | | | @,L | | Entegris, Inc. | | | 4,917,374 | | |
| | 146,300 | | | @ | | Fairchild Semiconductor
International, Inc. | | | 2,111,109 | | |
| | 166,400 | | | @,L | | Formfactor, Inc. | | | 5,507,840 | | |
| | 216,500 | | | | | Micrel, Inc. | | | 1,829,425 | | |
| | 552,000 | | | @,L | | ON Semiconductor Corp. | | | 4,901,760 | | |
| | 419,000 | | | @ | | QLogic Corp. | | | 5,949,800 | | |
| | 180,100 | | | @,@@ | | Verigy Ltd. | | | 4,893,317 | | |
| | | | 35,995,313 | | |
| | | | | Software: 3.1% | |
| | 141,200 | | | @ | | Ansys, Inc. | | | 5,854,152 | | |
| | 308,600 | | | @,L | | Epicor Software Corp. | | | 3,635,308 | | |
| | 100,500 | | | @,L | | SPSS, Inc. | | | 3,608,955 | | |
| | 200,850 | | | @,L | | THQ, Inc. | | | 5,661,962 | | |
| | | | 18,760,377 | | |
See Accompanying Notes to Financial Statements
92
PORTFOLIO OF INVESTMENTS
ING VP SMALL COMPANY PORTFOLIO AS OF DECEMBER 31, 2007 (CONTINUED)
| Shares | | | | | | Value | |
| | | | | Telecommunications: 4.1% | |
| | 397,100 | | | | | Alaska Communications Systems
Group, Inc. | | $ | 5,956,500 | | |
| | 71,800 | | | @,L | | Anixter International, Inc. | | | 4,470,986 | | |
| | 80,300 | | | @,L | | CommScope, Inc. | | | 3,951,563 | | |
| | 71,000 | | | | | Otelco, Inc. | | | 986,900 | | |
| | 279,328 | | | @,L | | RCN Corp. | | | 4,354,724 | | |
| | 149,500 | | | @,L | | SBA Communications Corp. | | | 5,059,080 | | |
| | | | 24,779,753 | | |
| | | | | Transportation: 1.8% | |
| | 108,000 | | | L | | General Maritime Corp. | | | 2,640,600 | | |
| | 145,300 | | | L | | Heartland Express, Inc. | | | 2,060,354 | | |
| | 171,100 | | | L | | Horizon Lines, Inc. | | | 3,189,304 | | |
| | 116,800 | | | @,L | | HUB Group, Inc. | | | 3,104,544 | | |
| | | | 10,994,802 | | |
Total Common Stock
(Cost $542,020,776) | | | 556,404,141 | | |
| REAL ESTATE INVESTMENT TRUSTS: 3.4% | | | |
| | | | | Diversified: 1.5% | |
| | 140,900 | | | | | Digital Realty Trust, Inc. | | | 5,406,333 | | |
| | 271,600 | | | | | Lexington Corporate
Properties Trust | | | 3,949,064 | | |
| | | | 9,355,397 | | |
| | | | | Health Care: 0.8% | |
| | 151,200 | | | L | | Nationwide Health
Properties, Inc. | | | 4,743,144 | | |
| | | | 4,743,144 | | |
| | | | | Mortgage: 0.5% | |
| | 154,445 | | | | | Annaly Capital Management, Inc. | | | 2,807,810 | | |
| | | | 2,807,810 | | |
| | | | | Office Property: 0.6% | |
| | 164,900 | | | | | BioMed Realty Trust, Inc. | | | 3,820,733 | | |
| | | | 3,820,733 | | |
Total Real Estate
Investment Trusts
(Cost $22,419,583) | | | 20,727,084 | | |
| EXCHANGE-TRADED FUNDS: 1.9% | | | |
| | | | | Exchange-Traded Funds: 1.9% | |
| | 155,828 | | | L | | iShares Russell 2000 Index Fund | | | 11,830,462 | | |
Total Exchange-Traded Funds
(Cost $12,551,049) | | | 11,830,462 | | |
Total Long-Term Investments
(Cost $576,991,408) | | | 588,961,687 | | |
| SHORT-TERM INVESTMENTS: 32.3% | | | |
| | | | | Mutual Fund: 2.9% | |
| | 17,300,000 | | | ** | | ING Institutional Prime Money
Market Fund | | | 17,300,000 | | |
Total Mutual Fund
(Cost $17,300,000) | | | 17,300,000 | | |
Principal
Amount | | | | Value | |
| REPURCHASE AGREEMENT: 0.2% | |
| $ | 1,211,000 | | | Morgan Stanley Repurchase
Agreement dated 12/31/07, 4.250%,
due 01/02/08, $1,211,286
to be received upon repurchase
(Collateralized by $1,240,000
Federal Home Loan Bank,
Discount Note, Market Value
$1,237,644, due 01/16/08) | | $ | 1,211,000 | | |
Total Repurchase Agreement
(Cost $1,211,000) | | | 1,211,000 | | |
| | | Securities Lending Collateralcc: 29.2% | |
| | 177,336,837 | | | Bank of New York Mellon Corp.
Institutional Cash Reserves | | | 177,336,837 | | |
Total Securities Lending Collateral
(Cost $177,336,837) | | | 177,336,837 | | |
Total Short-Term Investments
(Cost $195,847,837) | | | 195,847,837 | | |
Total Investments in
Securities
(Cost $772,839,245)* | | | 129.4 | % | | $ | 784,809,524 | | |
Other Assets and
Liabilities - Net | | | (29.4 | ) | | | (178,428,070 | ) | |
| Net Assets | | | 100.0 | % | | $ | 606,381,454 | | |
@ Non-income producing security
@@ Foreign Issuer
cc Securities purchased with cash collateral for securities loaned.
W When-issued or delayed delivery security
L Loaned security, a portion or all of the security is on loan at December 31, 2007.
** Investment in affiliate
* Cost for federal income tax purposes is $773,998,224
Net unrealized appreciation consists of:
| Gross Unrealized Appreciation | | $ | 54,501,128 | | |
| Gross Unrealized Depreciation | | | (43,689,828 | ) | |
| Net Unrealized Appreciation | | $ | 10,811,300 | | |
See Accompanying Notes to Financial Statements
93
PORTFOLIO OF INVESTMENTS
ING VP VALUE OPPORTUNITY PORTFOLIO AS OF DECEMBER 31, 2007
| Shares | | | | | | Value | |
| COMMON STOCK: 95.6% | | | |
| | | | | Advertising: 1.0% | |
| | 35,100 | | | | | Omnicom Group | | $ | 1,668,303 | | |
| | | | 1,668,303 | | |
| | | | | Aerospace/Defense: 8.0% | |
| | 79,900 | | | | | General Dynamics Corp. | | | 7,110,301 | | |
| | 82,900 | | | | | United Technologies Corp. | | | 6,345,166 | | |
| | | | 13,455,467 | | |
| | | | | Agriculture: 2.9% | |
| | 57,300 | | | L | | Loews Corp. | | | 4,887,690 | | |
| | | | 4,887,690 | | |
| | | | | Banks: 4.9% | |
| | 54,000 | | | @@,L | | Banco Bilbao Vizcaya Argentaria
SA ADR | | | 1,309,500 | | |
| | 81,000 | | | @@,L | | Banco Santander Central Hispano
SA ADR | | | 1,744,740 | | |
| | 30,200 | | | @@ | | Lloyds TSB Group PLC - Spon ADR | | | 1,137,030 | | |
| | 8,600 | | | @@ | | Uniao de Bancos Brasileiros
SA GDR | | | 1,200,904 | | |
| | 75,100 | | | L | | Wachovia Corp. | | | 2,856,053 | | |
| | | | 8,248,227 | | |
| | | | | Chemicals: 2.6% | |
| | 30,000 | | | | | Dow Chemical Co. | | | 1,182,600 | | |
| | 54,300 | | | L | | Sherwin-Williams Co. | | | 3,151,572 | | |
| | | | 4,334,172 | | |
| | | | | Commercial Services: 1.0% | |
| | 25,900 | | | | | McKesson Corp. | | | 1,696,709 | | |
| | | | 1,696,709 | | |
| | | | | Computers: 1.9% | |
| | 121,500 | | | | | Seagate Technology, Inc. | | | 3,098,250 | | |
| | | | 3,098,250 | | |
| | | | | Diversified Financial Services: 4.7% | |
| | 24,600 | | | L | | Janus Capital Group, Inc. | | | 808,110 | | |
| | 93,400 | | | | | JPMorgan Chase & Co. | | | 4,076,910 | | |
| | 16,900 | | | | | Legg Mason, Inc. | | | 1,236,235 | | |
| | 27,300 | | | L | | Lehman Brothers Holdings, Inc. | | | 1,786,512 | | |
| | | | 7,907,767 | | |
| | | | | Electric: 2.8% | |
| | 59,300 | | | | | Alliant Energy Corp. | | | 2,412,917 | | |
| | 88,000 | | | @@ | | Cia Energetica de Minas Gerais
ADR | | | 1,624,480 | | |
| | 8,100 | | | | | FirstEnergy Corp. | | | 585,954 | | |
| | | | 4,623,351 | | |
| | | | | Food: 2.3% | |
| | 143,900 | | | L | | Kroger Co. | | | 3,843,569 | | |
| | | | 3,843,569 | | |
| | | | | Gas: 1.7% | |
| | 44,300 | | | | | Energen Corp. | | | 2,845,389 | | |
| | | | 2,845,389 | | |
| | | | | Healthcare-Services: 5.3% | |
| | 29,700 | | | | | Aetna, Inc. | | | 1,714,581 | | |
| | 99,900 | | | @,L | | AMERIGROUP Corp. | | | 3,641,355 | | |
| | 49,200 | | | @,L | | Lincare Holdings, Inc. | | | 1,729,872 | | |
| | 19,600 | | | @ | | WellPoint, Inc. | | | 1,719,508 | | |
| | | | 8,805,316 | | |
| Shares | | | | | | Value | |
| | | | | Household Products/Wares: 1.0% | |
| | 24,200 | | | | | Kimberly-Clark Corp. | | $ | 1,678,028 | | |
| | | | 1,678,028 | | |
| | | | | Insurance: 16.0% | |
| | 62,100 | | | @@ | | ACE Ltd. | | | 3,836,538 | | |
| | 28,800 | | | L | | American Financial Group, Inc. | | | 831,744 | | |
| | 49,400 | | | | | American International
Group, Inc. | | | 2,880,020 | | |
| | 101,000 | | | @@,L | | Aspen Insurance Holdings Ltd. | | | 2,912,840 | | |
| | 108,800 | | | @@ | | Axis Capital Holdings Ltd. | | | 4,239,936 | | |
| | 61,600 | | | | | Chubb Corp. | | | 3,362,128 | | |
| | 55,800 | | | | | HCC Insurance Holdings, Inc. | | | 1,600,344 | | |
| | 42,700 | | | @@ | | RenaissanceRe Holdings Ltd. | | | 2,572,248 | | |
| | 10,800 | | | | | Safeco Corp. | | | 601,344 | | |
| | 74,000 | | | | | Travelers Cos., Inc. | | | 3,981,200 | | |
| | | | 26,818,342 | | |
| | | | | Internet: 1.4% | |
| | 50,700 | | | @,L | | Expedia, Inc. | | | 1,603,134 | | |
| | 49,800 | | | @ | | Symantec Corp. | | | 803,772 | | |
| | | | 2,406,906 | | |
| | | | | Iron/Steel: 2.5% | |
| | 25,400 | | | | | Nucor Corp. | | | 1,504,188 | | |
| | 22,500 | | | L | | United States Steel Corp. | | | 2,720,475 | | |
| | | | 4,224,663 | | |
| | | | | Media: 0.7% | |
| | 69,400 | | | | | Time Warner, Inc. | | | 1,145,794 | | |
| | | | 1,145,794 | | |
| | | | | Miscellaneous Manufacturing: 4.5% | |
| | 59,400 | | | | | General Electric Co. | | | 2,201,958 | | |
| | 59,400 | | | | | Honeywell International, Inc. | | | 3,657,258 | | |
| | 22,600 | | | | | Parker Hannifin Corp. | | | 1,702,006 | | |
| | | | 7,561,222 | | |
| | | | | Oil & Gas: 16.2% | |
| | 52,000 | | | | | Chevron Corp. | | | 4,853,160 | | |
| | 63,700 | | | | | ConocoPhillips | | | 5,624,710 | | |
| | 18,400 | | | @@ | | ENI S.p.A. ADR | | | 1,332,712 | | |
| | 106,800 | | | | | ExxonMobil Corp. | | | 10,006,092 | | |
| | 30,500 | | | | | Frontier Oil Corp. | | | 1,237,690 | | |
| | 65,900 | | | | | Marathon Oil Corp. | | | 4,010,674 | | |
| | | | 27,065,038 | | |
| | | | | Pharmaceuticals: 1.1% | |
| | 23,200 | | | | | AmerisourceBergen Corp. | | | 1,040,984 | | |
| | 47,100 | | | @@,L | | Dr. Reddy's Laboratories Ltd. ADR | | | 855,336 | | |
| | | | 1,896,320 | | |
| | | | | Retail: 1.9% | |
| | 21,900 | | | | | Advance Auto Parts, Inc. | | | 831,981 | | |
| | 24,300 | | | L | | TJX Cos., Inc. | | | 698,139 | | |
| | 35,200 | | | | | Wal-Mart Stores, Inc. | | | 1,673,056 | | |
| | | | 3,203,176 | | |
| | | | | Software: 1.4% | |
| | 63,500 | | | | | Microsoft Corp. | | | 2,260,600 | | |
| | | | 2,260,600 | | |
See Accompanying Notes to Financial Statements
94
PORTFOLIO OF INVESTMENTS
ING VP VALUE OPPORTUNITY PORTFOLIO AS OF DECEMBER 31, 2007 (CONTINUED)
| Shares | | | | | | Value | |
| | | | | Telecommunications: 9.8% | |
| | 165,300 | | | | | AT&T, Inc. | | $ | 6,869,868 | | |
| | 52,100 | | | @@,L | | Partner Communications ADR | | | 1,150,368 | | |
| | 71,600 | | | @@,L | | Telefonica SA ADR | | | 6,987,444 | | |
| | 35,400 | | | @@,L | | Telefonos de Mexico SA de CV
ADR | | | 1,304,136 | | |
| | | | 16,311,816 | | |
Total Common Stock
(Cost $151,783,307) | | | 159,986,115 | | |
| REAL ESTATE INVESTMENT TRUSTS: 4.0% | | | |
| | | | | Hotels: 0.7% | |
| | 36,500 | | | L | | Hospitality Properties Trust | | | 1,176,030 | | |
| | | | 1,176,030 | | |
| | | | | Regional Malls: 3.3% | |
| | 110,200 | | | | | Taubman Centers, Inc. | | | 5,420,738 | | |
| | | | 5,420,738 | | |
Total Real Estate
Investment Trusts
(Cost $7,536,962) | | | 6,596,768 | | |
| EXCHANGE-TRADED FUNDS: 0.5% | | | |
| | | | | Exchange-Traded Funds: 0.5% | |
| | 10,400 | | | L | | iShares Russell 1000 Value
Index Fund | | | 834,600 | | |
Total Exchange-Traded Funds
(Cost $840,355) | | | 834,600 | | |
Total Long-Term Investments
(Cost $160,160,624) | | | 167,417,483 | | |
| SHORT-TERM INVESTMENTS: 22.9% | | | |
| | | | | Mutual Fund: 0.0% | |
| | 60,000 | | | ** | | ING Institutional Prime Money
Market Fund | | | 60,000 | | |
Total Mutual Fund
(Cost $60,000) | | | 60,000 | | |
Principal
Amount | | | | Value | |
| | | Securities Lending Collateralcc: 22.9% | |
| $ | 38,345,940 | | | Bank of New York Mellon Corp.
Institutional Cash Reserves | | | 38,345,940 | | |
Total Securities Lending Collateral
(Cost $38,345,940) | | | 38,345,940 | | |
Total Short-Term Investments
(Cost $38,405,940) | | | 38,405,940 | | |
Total Investments in
Securities
(Cost $198,566,564)* | | | 123.0 | % | | $ | 205,823,423 | | |
Other Assets and
Liabilities - Net | | | (23.0 | ) | | | (38,498,652 | ) | |
| Net Assets | | | 100.0 | % | | $ | 167,324,771 | | |
@ Non-income producing security
@@ Foreign Issuer
ADR American Depositary Receipt
GDR Global Depositary Receipt
cc Securities purchased with cash collateral for securities loaned.
L Loaned security, a portion or all of the security is on loan at December 31, 2007.
** Investment in affiliate
* Cost for federal income tax purposes is $199,585,974
Net unrealized appreciation consists of:
| Gross Unrealized Appreciation | | $ | 9,161,345 | | |
| Gross Unrealized Depreciation | | | (2,923,896 | ) | |
| Net Unrealized Appreciation | | $ | 6,237,449 | | |
See Accompanying Notes to Financial Statements
95
PORTFOLIO OF INVESTMENTS
ING VP INTERMEDIATE BOND PORTFOLIO AS OF DECEMBER 31, 2007
Principal
Amount | | | | | | Value | |
| CORPORATE BONDS/NOTES: 24.0% | | | |
| | | | | Aerospace/Defense: 0.3% | |
| $ | 10,800,000 | | | C,S | | United Technologies Corp.,
5.375%, due 12/15/17 | | $ | 10,915,086 | | |
| | | | 10,915,086 | | |
| | | | | Airlines: 0.6% | |
| | 13,910,000 | | | C,S | | Delta Airlines, Inc.,
7.570%, due 11/18/10 | | | 14,064,756 | | |
| | 3,733,000 | | | S | | United AirLines, Inc.,
6.932%, due 09/01/11 | | | 4,442,270 | | |
| | | | 18,507,026 | | |
| | | | | Auto Manufacturers: 0.2% | |
| | 6,237,863 | | | S | | Ford Motor Co.,
8.597%, due 11/29/13 | | | 5,787,745 | | |
| | | | 5,787,745 | | |
| | | | | Banks: 6.2% | |
| | 7,320,000 | | | @@,C,S | | Australia & New Zealand
Banking Group Ltd.,
4.963%, due 12/31/49 | | | 5,913,733 | | |
| | 12,895,000 | | | C,S | | BAC Capital Trust XIV,
5.630%, due 12/31/49 | | | 11,453,468 | | |
| | 675,807 | | | @@,#,S | | Banco Itau SA,
5.720%, due 09/20/08 | | | 669,049 | | |
| | 6,020,000 | | | @@,#,C,S | | Banco Mercantil del Norte SA,
6.135%, due 10/13/16 | | | 5,983,278 | | |
| | 7,940,000 | | | S | | Bank of America Corp.,
5.750%, due 12/01/17 | | | 7,973,110 | | |
| | 2,800,000 | | | @@,C,S | | Bank of Ireland,
5.188%, due 12/29/49 | | | 2,282,000 | | |
| | 1,110,000 | | | @@,C,S,L | | Bank of Scotland,
5.125%, due 12/31/49 | | | 872,989 | | |
| | 379,000 | | | C,S | | BankAmerica Capital II,
8.000%, due 12/15/26 | | | 397,861 | | |
| | 3,600,000 | | | @@,C | | Barclays Bank PLC,
5.563%, due 12/31/49 | | | 2,862,000 | | |
| | 3,395,000 | | | @@,#,C,S | | Barclays Bank PLC,
5.926%, due 12/15/16 | | | 3,164,330 | | |
| | 9,927,000 | | | @@,#,S | | Barclays Bank PLC,
6.050%, due 12/04/17 | | | 10,021,138 | | |
| | 840,000 | | | @@,C,S | | Barclays O/S Inv,
5.063%, due 05/19/08 | | | 520,800 | | |
| | 635,000 | | | @@,C | | Barclays O/S Inv,
5.063%, due 11/01/49 | | | 393,700 | | |
| | 4,870,000 | | | @@,C,S,L | | BNP Paribas,
5.238%, due 09/29/49 | | | 4,104,100 | | |
| | 9,751,000 | | | @@,#,C,S | | Chuo Mitsui Trust &
Banking Co., Ltd.,
5.506%, due 04/15/49 | | | 8,979,033 | | |
| | 2,568,000 | | | @@,#,C,S | | Danske Bank A/S,
5.914%, due 12/29/49 | | | 2,432,954 | | |
| | 2,230,000 | | | @@,C,S | | Den Norske Bank ASA,
5.375%, due 11/29/49 | | | 1,795,150 | | |
| | 6,186,000 | | | #,C,S | | Dresdner Funding Trust I,
8.151%, due 06/30/31 | | | 6,325,884 | | |
| | 2,000 | | | C,S | | Fleet Capital Trust II,
7.920%, due 12/11/26 | | | 2,078 | | |
| | 2,966,000 | | | @@,#,C,S | | HBOS PLC,
5.375%, due 11/29/49 | | | 2,707,154 | | |
| | 8,370,000 | | | @@,C,S | | Hongkong & Shanghai
Banking Corp., Ltd.,
5.250%, due 07/29/49 | | | 6,193,800 | | |
Principal
Amount | | | | | | Value | |
| $ | 9,590,000 | | | @@,C,S | | HSBC Bank PLC,
4.913%, due 06/29/49 | | $ | 7,528,150 | | |
| | 5,300,000 | | | @@,C,S | | HSBC Bank PLC,
5.000%, due 06/29/49 | | | 4,160,500 | | |
| | 6,810,000 | | | @@,C,L | | Lloyds TSB Bank PLC,
5.125%, due 06/29/49 | | | 5,503,842 | | |
| | 5,490,000 | | | @@,C,S | | Lloyds TSB Bank PLC,
5.313%, due 11/29/49 | | | 4,364,550 | | |
| | 5,490,000 | | | @@, C | | Lloyds TSB Bank PLC,
5.523%, due 08/29/49 | | | 4,419,450 | | |
| | 2,819,000 | | | @@,#,C,S | | Lloyds TSB Group PLC,
6.267%, due 11/13/49 | | | 2,561,569 | | |
| | 6,355,000 | | | @@,C,S,L | | Mizuho Financial Group
Cayman Ltd.,
8.375%, due 12/31/49 | | | 6,422,935 | | |
| | 1,140,000 | | | @@,C,L | | National Westminster
Bank PLC,
5.563%, due 08/29/49 | | | 878,611 | | |
| | 710,000 | | | @@,C,S,L | | National Westminster
Bank PLC,
6.250%, due 11/29/49 | | | 549,363 | | |
| | 4,649,000 | | | #,C,S | | Rabobank Capital Funding II,
5.260%, due 12/29/49 | | | 4,336,820 | | |
| | 4,530,000 | | | #,C,S | | Rabobank Capital
Funding Trust,
5.254%, due 12/31/49 | | | 4,061,372 | | |
| | 4,285,000 | | | C,S | | RBS Capital Trust I,
5.512%, due 09/30/49 | | | 3,944,600 | | |
| | 6,747,000 | | | @@,#,C,S | | Resona Bank Ltd.,
5.850%, due 09/29/49 | | | 6,282,388 | | |
| | 11,010,000 | | | @@,C,S,L | | Royal Bank of Scotland
Group PLC,
4.938%, due 12/29/49 | | | 8,202,450 | | |
| | 2,570,000 | | | @@,C,S | | Societe Generale,
4.981%, due 11/29/49 | | | 2,115,447 | | |
| | 7,140,000 | | | @@,C,S | | Standard Chartered PLC,
4.974%, due 07/29/49 | | | 4,998,000 | | |
| | 3,240,000 | | | @@,C,S,L | | Standard Chartered PLC,
5.088%, due 12/29/49 | | | 2,332,800 | | |
| | 11,480,000 | | | @@,C,L | | Standard Chartered PLC,
5.125%, due 11/29/49 | | | 8,380,400 | | |
| | 1,150,000 | | | @@,C,L | | Standard Chartered PLC,
5.588%, due 01/29/49 | | | 816,500 | | |
| | 1,700,000 | | | @@,#,C,S | | Standard Chartered PLC,
6.409%, due 12/31/49 | | | 1,542,252 | | |
| | 1,500,000 | | | @@,#,C,S | | Standard Chartered PLC,
7.014%, due 07/30/49 | | | 1,424,519 | | |
| | 6,705,000 | | | @@,C,S | | Sumitomo Mitsui
Banking Corp.,
8.150%, due 08/01/49 | | | 6,843,257 | | |
| | 2,989,000 | | | C,S | | SunTrust Preferred Capital I,
5.853%, due 12/31/49 | | | 2,640,031 | | |
| | 3,312,000 | | | C,S | | USB Capital IX,
6.189%, due 03/29/49 | | | 2,999,549 | | |
| | 4,260,000 | | | S | | Wachovia Bank NA,
6.600%, due 01/15/38 | | | 4,295,379 | | |
| | 6,365,000 | | | C,S | | Wachovia Capital Trust III,
5.800%, due 12/31/49 | | | 5,691,443 | | |
| | 10,756,000 | | | S | | Wells Fargo & Co.,
5.625%, due 12/11/17 | | | 10,782,879 | | |
| | 3,150,000 | | | @@,C,S | | Westpac Banking Corp.,
5.306%, due 09/30/49 | | | 2,575,963 | | |
| | 2,498,000 | | | @@,#,C,S | | Westpac Capital Trust IV,
5.256%, due 12/29/49 | | | 2,199,132 | | |
| | | | 207,901,760 | | |
See Accompanying Notes to Financial Statements
96
PORTFOLIO OF INVESTMENTS
ING VP INTERMEDIATE BOND PORTFOLIO AS OF DECEMBER 31, 2007 (CONTINUED)
Principal
Amount | | | | | | Value | |
| | | | | Beverages: 0.3% | |
| BRL | 7,664,000 | | | @@,#,S | | Ambev International
Finance Co., Ltd.,
9.500%, due 07/24/17 | | $ | 3,659,775 | | |
| $ | 2,974,000 | | | C,S | | Anheuser-Busch Cos., Inc.,
5.500%, due 01/15/18 | | | 3,041,920 | | |
| | 4,208,000 | | | S | | PepsiCo, Inc.,
4.650%, due 02/15/13 | | | 4,241,041 | | |
| | | | 10,942,736 | | |
| | | | | Chemicals: 0.4% | |
| | 1,410,000 | | | S,Z | | Stauffer Chemical,
4.480%, due 04/15/10 | | | 1,275,444 | | |
| | 2,420,000 | | | S,Z | | Stauffer Chemical,
5.500%, due 04/15/18 | | | 1,395,614 | | |
| | 2,970,000 | | | S,Z | | Stauffer Chemical,
6.750%, due 04/15/17 | | | 1,815,145 | | |
| | 7,254,000 | | | S | | Union Carbide Corp.,
7.750%, due 10/01/96 | | | 7,629,496 | | |
| | | | 12,115,699 | | |
| | | | | Diversified Financial Services: 6.8% | |
| | 16,520,000 | | | @@,#,C,S | | Aiful Corp.,
4.450%, due 02/16/10 | | | 15,625,128 | | |
| | 1,006,000 | | | @@,#,C,S,I | | Alpine III,
5.428%, due 08/16/14 | | | 1,009,241 | | |
| | 1,006,000 | | | @@,#,S,I | | Alpine III,
5.828%, due 08/16/14 | | | 1,009,667 | | |
| | 1,507,000 | | | @@,#,S,I | | Alpine III,
7.628%, due 08/16/14 | | | 1,518,378 | | |
| | 2,576,000 | | | @@,#,S,I | | Alpine III,
10.878%, due 08/16/14 | | | 2,637,850 | | |
| | 4,500,000 | | | S | | American General
Finance Corp.,
6.900%, due 12/15/17 | | | 4,512,524 | | |
| | 17,659,000 | | | #,S | | Astoria Depositor Corp.,
8.144%, due 05/01/21 | | | 18,277,065 | | |
| | 7,051,000 | | | #,C,S | | Biomet, Inc.,
11.625%, due 10/15/17 | | | 6,980,490 | | |
| | 5,159,000 | | | S | | Caterpillar Financial
Services Corp.,
4.850%, due 12/07/12 | | | 5,173,512 | | |
| | 6,280,000 | | | L | | Citigroup, Inc.,
6.125%, due 11/21/17 | | | 6,462,691 | | |
| | 10,138,000 | | | C,S | | Citigroup, Inc.,
8.300%, due 12/21/57 | | | 10,616,047 | | |
| | 4,546,000 | | | #,C,S | | Corestates Capital Trust I,
8.000%, due 12/15/26 | | | 4,706,597 | | |
| | 6,814,000 | | | @@,S | | Eksportfinans A/S,
5.125%, due 10/26/11 | | | 7,068,912 | | |
| | 2,890,000 | | | @@,C,S | | Financiere CSFB NV,
4.806%, due 03/29/49 | | | 2,297,550 | | |
| | 3,669,000 | | | S | | Ford Motor Credit Co.,
7.993%, due 01/13/12 | | | 3,084,404 | | |
| | 8,272,000 | | | S | | Ford Motor Credit Co.,
8.000%, due 12/15/16 | | | 7,036,891 | | |
| | 7,223,000 | | | S | | Ford Motor Credit Co.,
9.693%, due 04/15/12 | | | 7,105,012 | | |
| | 5,794,000 | | | C,S | | Fund American Cos., Inc.,
5.875%, due 05/15/13 | | | 5,813,109 | | |
| | 5,944,000 | | | C,S | | Goldman Sachs Group, Inc.,
5.793%, due 12/31/49 | | | 5,297,061 | | |
| | 3,118,000 | | | C,S | | Goldman Sachs Group, Inc.,
6.750%, due 10/01/37 | | | 3,064,601 | | |
Principal
Amount | | | | | | Value | |
| $ | 4,369,000 | | | #,C,S | | HVB Funding Trust III,
9.000%, due 10/22/31 | | $ | 4,945,000 | | |
| | 7,754,000 | | | S | | John Deere Capital Corp.,
4.950%, due 12/17/12 | | | 7,773,098 | | |
| | 9,636,000 | | | S | | JPMorgan Chase & Co.,
6.000%, due 01/15/18 | | | 9,812,113 | | |
| | 6,391,000 | | | C,S | | Lehman Brothers Holdings
Capital Trust VIII,
5.911%, due 05/29/49 | | | 5,120,552 | | |
| | 8,668,000 | | | #,C,S | | Mangrove Bay
Pass-Through Trust,
6.102%, due 07/15/33 | | | 7,806,817 | | |
| | 6,907,000 | | | @@,#,S | | Mantis Reef Ltd.,
4.799%, due 11/03/09 | | | 7,008,851 | | |
| | 5,605,000 | | | @@,C,S | | MUFG Capital
Finance 1 Ltd.,
6.346%, due 12/31/49 | | | 5,317,245 | | |
| | 2,560,000 | | | @@,C | | Paribas,
5.063%, due 12/31/49 | | | 2,139,292 | | |
| | 1,075,556 | | | @@,#,C,S | | Petroleum Export Ltd.,
4.623%, due 06/15/10 | | | 1,059,230 | | |
| | 4,933,590 | | | @@,#,C,S | | PF Export Receivables
Master Trust,
6.436%, due 06/01/15 | | | 4,974,786 | | |
| | 9,196,202 | | | #,C,S | | Piper Jaffray Equipment
Trust Securities,
6.000%, due 09/10/11 | | | 8,736,391 | | |
| | 7,471,675 | | | #,C,S | | Piper Jaffray Equipment
Trust Securities,
6.750%, due 04/01/11 | | | 7,247,525 | | |
| | 819,259 | | | #,S | | Power Receivable
Finance, LLC,
6.290%, due 01/01/12 | | | 856,061 | | |
| | 975,000 | | | C,L | | Residential Capital Corp.,
8.375%, due 06/30/15 | | | 594,750 | | |
| | 6,029,000 | | | C,S | | Residential Capital, LLC,
8.000%, due 04/17/13 | | | 3,737,980 | | |
| | 8,607,000 | | | C,S | | Southern Star Central Corp.,
6.750%, due 03/01/16 | | | 8,284,238 | | |
| | 9,082,000 | | | @@,#,S | | TNK-BP Finance SA,
7.500%, due 07/18/16 | | | 8,820,893 | | |
| | 32,846,336 | | | #,S,Z | | Toll Road Investors
Partnership II LP,
15.740%, due 02/15/45 | | | 4,740,022 | | |
| | 2,981,000 | | | #,C,S | | Twin Reefs
Pass-Through Trust,
6.243%, due 12/10/49 | | | 1,943,821 | | |
| | 6,653,000 | | | @@,C,S | | UFJ Finance Aruba AEC,
8.750%, due 12/31/49 | | | 6,743,833 | | |
| | 2,105,000 | | | #,C,S | | Wachovia Capital Trust V,
7.965%, due 06/01/27 | | | 2,193,955 | | |
| | | | 229,153,183 | | |
| | | | | Electric: 1.6% | |
| | 12,447,000 | | | C,S | | Commonwealth Edison Co.,
6.950%, due 07/15/18 | | | 12,649,264 | | |
| | 1,542,000 | | | @@,S | | Empresa Nacional de
Electricidad SA,
8.625%, due 08/01/15 | | | 1,781,439 | | |
| | 3,719,000 | | | @@,#,C,S | | Intergen NV,
9.000%, due 06/30/17 | | | 3,932,843 | | |
| | 1,271,371 | | | #,C,S | | Juniper Generation, LLC,
6.790%, due 12/31/14 | | | 1,322,429 | | |
See Accompanying Notes to Financial Statements
97
PORTFOLIO OF INVESTMENTS
ING VP INTERMEDIATE BOND PORTFOLIO AS OF DECEMBER 31, 2007 (CONTINUED)
Principal
Amount | | | | | | Value | |
| | | | | Electric (continued) | |
| $ | 5,310,000 | | | C,S | | Nevada Power Co.,
5.950%, due 03/15/16 | | $ | 5,290,587 | | |
| | 3,310,000 | | | C,S | | Nevada Power Co.,
6.750%, due 07/01/37 | | | 3,438,077 | | |
| | 8,873,000 | | | C,S | | NorthWestern Corp.,
5.875%, due 11/01/14 | | | 8,757,633 | | |
| | 8,677,000 | | | C,S | | Sierra Pacific Power Co.,
6.250%, due 04/15/12 | | | 8,948,425 | | |
| | 2,455,000 | | | #,S | | White Pine Hydro
Portfolio, LLC,
6.960%, due 07/10/37 | | | 2,547,276 | | |
| | 3,936,000 | | | #,S | | White Pine Hydro
Portfolio, LLC,
7.260%, due 07/20/15 | | | 4,086,127 | | |
| | | | 52,754,100 | | |
| | | | | Energy-Alternate Sources: 0.4% | |
| | 4,000,000 | | | S | | Greater Ohio Ethanol, LLC,
8.864%, due 12/31/13 | | | 3,860,000 | | |
| | 4,900,000 | | | S | | Greater Ohio Ethanol, LLC,
12.630%, due 12/31/13 | | | 4,480,438 | | |
| | 3,837,000 | | | #,S | | White Pine Hydro, LLC,
6.310%, due 07/10/17 | | | 4,024,568 | | |
| | | | 12,365,006 | | |
| | | | | Food: 0.3% | |
| | 6,228,000 | | | S | | Kraft Foods, Inc.,
6.125%, due 02/01/18 | | | 6,287,322 | | |
| | 3,862,000 | | | S | | Kraft Foods, Inc.,
6.875%, due 02/01/38 | | | 4,022,485 | | |
| | | | 10,309,807 | | |
| | | | | Gas: 0.7% | |
| | 7,368,000 | | | @@,#,C,S | | Nakilat, Inc.,
6.067%, due 12/31/33 | | | 6,743,820 | | |
| | 1,494,000 | | | #,C,S | | Nakilat, Inc.,
6.267%, due 12/31/33 | | | 1,362,531 | | |
| | 16,171,000 | | | C,S | | Southern Union Co.,
7.200%, due 11/01/66 | | | 15,986,327 | | |
| | | | 24,092,678 | | |
| | | | | Healthcare-Products: 0.2% | |
| | 5,570,000 | | | C,S | | Baxter International, Inc.,
6.250%, due 12/01/37 | | | 5,734,666 | | |
| | | | 5,734,666 | | |
| | | | | Insurance: 0.9% | |
| | 9,566,000 | | | @@,C,S | | Aegon NV,
5.399%, due 12/31/49 | | | 6,895,890 | | |
| | 8,298,000 | | | S | | American International
Group, Inc.,
5.850%, due 01/16/18 | | | 8,368,068 | | |
| | 5,776,000 | | | #,C,S | | Metlife Capital Trust IV,
7.875%, due 12/15/37 | | | 5,902,102 | | |
| | 1,741,000 | | | #,C,S | | North Front
Pass-Through Trust,
5.810%, due 12/15/24 | | | 1,668,153 | | |
| | 3,951,000 | | | S | | Prudential Financial, Inc.,
6.000%, due 12/01/17 | | | 3,941,980 | | |
| | 4,284,000 | | | S | | Prudential Financial, Inc.,
6.625%, due 12/01/37 | | | 4,334,080 | | |
| | | | 31,110,273 | | |
Principal
Amount | | | | | | Value | |
| | | | | Media: 0.2% | |
| $ | 3,351,000 | | | C,S | | Dex Media West, LLC,
9.875%, due 08/15/13 | | $ | 3,493,418 | | |
| | 3,970,000 | | | #,C,S | | News America, Inc.,
6.650%, due 11/15/37 | | | 4,108,450 | | |
| | | | 7,601,868 | | |
| | | | | Miscellaneous Manufacturing: 0.3% | |
| | 8,628,000 | | | S | | General Electric Co.,
5.250%, due 12/06/17 | | | 8,626,085 | | |
| | | | 8,626,085 | | |
| | | | | Multi-National: 0.1% | |
| | 4,459,000 | | | @@,S | | Corp. Andina de
Fomento CAF,
5.125%, due 05/05/15 | | | 4,314,702 | | |
| | | | 4,314,702 | | |
| | | | | Oil & Gas: 1.0% | |
| | 2,475,000 | | | @@,#,S | | Empresa Nacional de
Petroleo ENAP,
4.875%, due 03/15/14 | | | 2,399,668 | | |
| | 1,588,000 | | | @@,#,S | | Empresa Nacional de
Petroleo ENAP,
6.750%, due 11/15/12 | | | 1,694,980 | | |
| | 4,608,000 | | | @@,#,S | | Pemex Project Funding
Master Trust,
6.291%, due 06/15/10 | | | 4,684,032 | | |
| | 4,129,000 | | | @@,C,L | | Pemex Project Funding
Master Trust,
6.625%, due 06/15/35 | | | 4,372,751 | | |
| | 4,908,000 | | | @@,#,C,S | | Ras Laffan Liquefied
Natural Gas Co., Ltd. II,
5.298%, due 09/30/20 | | | 4,774,380 | | |
| | 7,416,000 | | | @@,C,S | | Transocean, Inc.,
6.000%, due 03/15/18 | | | 7,410,178 | | |
| | 6,406,000 | | | @@,C,S | | Transocean, Inc.,
6.800%, due 03/15/38 | | | 6,557,508 | | |
| | | | 31,893,497 | | |
| | | | | Pipelines: 0.6% | |
| | 5,144,000 | | | #,C,S | | NGPL PipeCo, LLC,
7.119%, due 12/15/17 | | | 5,283,752 | | |
| | 4,342,000 | | | #,C,S | | NGPL PipeCo, LLC,
7.768%, due 12/15/37 | | | 4,556,408 | | |
| | 1,893,000 | | | C,L | | Northwest Pipeline Corp.,
7.000%, due 06/15/16 | | | 2,025,510 | | |
| | 4,064,000 | | | C,S | | Panhandle Eastern Pipe Line,
6.200%, due 11/01/17 | | | 4,016,870 | | |
| | 2,316,000 | | | @@,C,S | | Trans - Canada Pipelines,
6.200%, due 10/15/37 | | | 2,307,303 | | |
| | 2,894,000 | | | C,S | | Transcontinental Gas
Pipe Line Corp.,
6.400%, due 04/15/16 | | | 2,984,438 | | |
| | | | 21,174,281 | | |
| | | | | Real Estate: 0.3% | |
| | 2,828,000 | | | C,S | | Istar Financial, Inc.,
5.150%, due 03/01/12 | | | 2,446,206 | | |
| | 1,272,000 | | | C,S | | Istar Financial, Inc.,
5.500%, due 06/15/12 | | | 1,106,256 | | |
See Accompanying Notes to Financial Statements
98
PORTFOLIO OF INVESTMENTS
ING VP INTERMEDIATE BOND PORTFOLIO AS OF DECEMBER 31, 2007 (CONTINUED)
Principal
Amount | | | | | | Value | |
| | | | | Real Estate (continued) | |
| $ | 3,398,000 | | | C,S | | Istar Financial, Inc.,
5.850%, due 03/15/17 | | $ | 2,797,665 | | |
| | 1,027,000 | | | C,S | | Liberty Property LP,
6.375%, due 08/15/12 | | | 1,072,659 | | |
| | 3,533,000 | | | C,S | | Liberty Property LP,
7.750%, due 04/15/09 | | | 3,630,776 | | |
| | | | 11,053,562 | | |
| | | | | Regional Malls: 0.4% | |
| | 975,000 | | | C,S | | Rouse Co.,
7.200%, due 09/15/12 | | | 933,281 | | |
| | 14,834,000 | | | #,C,S | | Rouse Co.
LP/TRC Co.-Issuer, Inc.,
6.750%, due 05/01/13 | | | 13,854,096 | | |
| | | | 14,787,377 | | |
| | | | | Retail: 1.4% | |
| | 3,322,000 | | | C,S | | Darden Restaurants, Inc.,
5.625%, due 10/15/12 | | | 3,380,095 | | |
| | 5,027,000 | | | @@,#,C,S | | Marks & Spencer PLC,
7.125%, due 12/01/37 | | | 4,795,650 | | |
| | 2,481,000 | | | C,S | | McDonald's Corp.,
5.800%, due 10/15/17 | | | 2,573,561 | | |
| | 2,770,000 | | | C,S | | Nordstrom, Inc.,
6.250%, due 01/15/18 | | | 2,841,028 | | |
| | 3,865,000 | | | C,S | | Nordstrom, Inc.,
7.000%, due 01/15/38 | | | 3,995,324 | | |
| | 935,000 | | | C,S | | Rite Aid Corp.,
9.375%, due 12/15/15 | | | 780,725 | | |
| | 5,599,000 | | | C,S | | Rite Aid Corp.,
9.500%, due 06/15/17 | | | 4,661,168 | | |
| | 10,778,000 | | | C,S | | Target Corp.,
6.500%, due 10/15/37 | | | 10,868,654 | | |
| | 2,008,000 | | | S | | Wal-Mart Stores, Inc.,
5.250%, due 09/01/35 | | | 1,787,234 | | |
| | 10,041,000 | | | S | | Wal-Mart Stores, Inc.,
6.500%, due 08/15/37 | | | 10,608,999 | | |
| | | | 46,292,438 | | |
| | | | | Savings & Loans: 0.1% | |
| | 200,000 | | | #,C,S | | Washington Mutual IV,
9.750%, due 10/29/49 | | | 160,234 | | |
| | 3,000,000 | | | #,C,S | | Washington Mutual
Preferred Funding Delaware,
6.534%, due 03/15/11 | | | 1,856,703 | | |
| | | | 2,016,937 | | |
| | | | | Telecommunications: 0.5% | |
| | 9,173,000 | | | S | | Bellsouth
Telecommunications, Inc.,
7.000%, due 12/01/95 | | | 9,600,251 | | |
| | 562,000 | | | C,S | | Embarq Corp.,
7.995%, due 06/01/36 | | | 593,969 | | |
| | 4,648,000 | | | @@,C,S | | Rogers Wireless, Inc.,
7.250%, due 12/15/12 | | | 5,043,187 | | |
| | | | 15,237,407 | | |
| | | | | Water: 0.2% | |
| | 3,313,000 | | | #,C,S | | American Water
Capital Corp.,
6.085%, due 10/15/17 | | | 3,307,868 | | |
Principal
Amount | | | | | | Value | |
| $ | 3,313,000 | | | #,C,S | | American Water
Capital Corp.,
6.593%, due 10/15/37 | | $ | 3,252,498 | | |
| | | | 6,560,366 | | |
Total Corporate Bonds/
Notes
(Cost $829,124,839) | | | 801,248,285 | | |
| U.S. GOVERNMENT AGENCY OBLIGATIONS: 18.5% | | | |
| | | | | Federal Home Loan Bank: 0.3% | |
| | 9,620,000 | | | S | | 5.000%, due 10/13/11 | | | 10,035,699 | | |
| | | | 10,035,699 | | |
| | | | | | | Federal Home Loan Mortgage
Corporation: 11.5% | | | | | |
| | 2,138,896 | | | C,S | | 4.500%, due 12/15/16 | | | 2,140,701 | | |
| | 7,696,000 | | | C,S | | 4.500%, due 02/15/20 | | | 7,383,806 | | |
| | 20,656,000 | | | S,Z | | 4.940%, due 03/15/31 | | | 6,654,847 | | |
| | 11,456,000 | | | C,S | | 5.000%, due 12/11/12 | | | 11,509,133 | | |
| | 8,379,350 | | | C,S | | 5.000%, due 08/15/16 | | | 8,425,754 | | |
| | 9,490,000 | | | C,S | | 5.000%, due 12/15/17 | | | 9,528,241 | | |
| | 1,675,000 | | | C,S | | 5.000%, due 05/15/20 | | | 1,670,017 | | |
| | 5,982,636 | | | C,S | | 5.000%, due 08/15/21 | | | 6,007,482 | | |
| | 7,892,000 | | | C,S | | 5.000%, due 04/15/23 | | | 7,692,403 | | |
| | 6,144,721 | | | C,S | | 5.000%, due 09/15/31 | | | 5,877,609 | | |
| | 2,333,000 | | | C,S | | 5.000%, due 02/15/32 | | | 2,265,544 | | |
| | 13,805,220 | | | C,S | | 5.000%, due 03/15/32 | | | 13,415,199 | | |
| | 6,270,000 | | | C,S | | 5.000%, due 04/15/32 | | | 6,190,211 | | |
| | 7,628,000 | | | C,S | | 5.000%, due 08/15/32 | | | 7,505,825 | | |
| | 11,091,000 | | | C,S | | 5.000%, due 12/15/32 | | | 10,912,664 | | |
| | 5,779,361 | | | C,S | | 5.000%, due 02/15/35 | | | 5,739,608 | | |
| | 1,203,050 | | | S | | 5.001%, due 04/01/35 | | | 1,181,610 | | |
| | 15,675,000 | | | C,S | | 5.250%, due 03/15/12 | | | 15,766,464 | | |
| | 18,852,941 | | | C,S | | 5.378%, due 05/15/33 | | | 18,685,322 | | |
| | 21,493,023 | | | C,S | | 5.500%, due 08/15/20 | | | 20,994,359 | | |
| | 3,905,000 | | | C,S | | 5.500%, due 12/15/20 | | | 3,898,417 | | |
| | 12,728,922 | | | C,S | | 5.500%, due 11/15/22 | | | 12,870,051 | | |
| | 11,485,000 | | | C,S | | 5.500%, due 09/15/32 | | | 11,452,045 | | |
| | 2,342,000 | | | C,S | | 5.500%, due 10/15/32 | | | 2,325,656 | | |
| | 2,082,000 | | | C,S | | 5.500%, due 11/15/32 | | | 2,047,301 | | |
| | 1,100,000 | | | C,S | | 5.500%, due 04/15/33 | | | 1,097,445 | | |
| | 2,511,000 | | | C,S | | 5.500%, due 06/15/33 | | | 2,489,748 | | |
| | 6,856,000 | | | C,S | | 5.500%, due 07/15/33 | | | 6,816,317 | | |
| | 2,369,718 | | | S | | 5.500%, due 06/01/36 | | | 2,341,869 | | |
| | 32,725,000 | | | W | | 5.500%, due 02/12/37 | | | 32,638,082 | | |
| | 4,603,468 | | | C,S | | 5.678%, due 04/15/32 | | | 4,645,051 | | |
| | 15,944,598 | | | C,S | | 6.000%, due 01/15/29 | | | 16,312,442 | | |
| | 58,204,000 | | | W | | 6.000%, due 02/01/34 | | | 59,013,385 | | |
| | 15,753,600 | | | S | | 6.000%, due 02/01/36 | | | 16,024,453 | | |
| | 37,559,000 | | | | | 6.500%, due 02/01/34 | | | 38,574,257 | | |
| | 1,317,741 | | | S | | 7.000%, due 09/01/26 | | | 1,370,461 | | |
| | 490,002 | | | S | | 7.500%, due 11/01/28 | | | 524,813 | | |
| | | | 383,988,592 | | |
| | | | | | | Federal National Mortgage
Corporation: 6.6% | | | | | |
| | 4,131,000 | | | W | | 4.500%, due 02/15/19 | | | 4,066,453 | | |
| | 16,039,000 | | | L | | 4.750%, due 11/19/12 | | | 16,616,228 | | |
| | 72,794 | | | C,S | | 4.750%, due 12/25/42 | | | 72,601 | | |
| | 1,216,240 | | | S | | 4.926%, due 04/01/35 | | | 1,214,086 | | |
| | 37,975,000 | | | W | | 5.000%, due 02/15/20 | | | 37,992,810 | | |
| | 5,539,219 | | | S | | 5.000%, due 02/25/29 | | | 5,556,555 | | |
| | 4,489,391 | | | S | | 5.000%, due 01/01/36 | | | 4,314,577 | | |
| | 38,849,000 | | | W | | 5.000%, due 02/13/36 | | | 37,883,835 | | |
See Accompanying Notes to Financial Statements
99
PORTFOLIO OF INVESTMENTS
ING VP INTERMEDIATE BOND PORTFOLIO AS OF DECEMBER 31, 2007 (CONTINUED)
Principal
Amount | | | | | | Value | |
| | | | | | | Federal National Mortgage
Corporation (continued) | | | | | |
| $ | 3,386,843 | | | S | | 5.000%, due 04/01/36 | | $ | 3,254,962 | | |
| | 4,680,040 | | | S | | 5.000%, due 05/01/37 | | | 4,497,802 | | |
| | 30,000,329 | | | S | | 5.000%, due 08/01/37 | | | 28,832,134 | | |
| | 1,369,943 | | | S | | 5.037%, due 07/01/35 | | | 1,350,696 | | |
| | 2,517,197 | | | S | | 5.115%, due 07/25/36 | | | 2,509,187 | | |
| | 1,007,468 | | | S | | 5.224%, due 08/01/35 | | | 1,001,172 | | |
| | 7,859,000 | | | C,S | | 5.400%, due 03/26/12 | | | 7,888,110 | | |
| | 19,403 | | | S | | 5.500%, due 11/01/16 | | | 19,705 | | |
| | 94,769 | | | S | | 5.500%, due 12/01/16 | | | 96,248 | | |
| | 15,537 | | | S | | 5.500%, due 04/01/17 | | | 15,774 | | |
| | 35,534 | | | S | | 5.500%, due 02/01/18 | | | 36,077 | | |
| | 12,420 | | | S | | 5.500%, due 06/01/18 | | | 12,607 | | |
| | 58,662 | | | S | | 5.500%, due 10/01/18 | | | 59,558 | | |
| | 3,646,000 | | | S | | 5.500%, due 05/25/30 | | | 3,629,522 | | |
| | 10,445,290 | | | S | | 5.500%, due 01/25/36 | | | 10,292,114 | | |
| | 2,525,185 | | | S | | 5.500%, due 07/01/36 | | | 2,497,876 | | |
| | 13,012,406 | | | S | | 5.500%, due 12/25/36 | | | 12,748,790 | | |
| | 10,333,683 | | | S | | 5.500%, due 02/25/37 | | | 10,393,411 | | |
| | 124,917 | | | S | | 6.000%, due 06/01/16 | | | 128,052 | | |
| | 15,841 | | | S | | 6.000%, due 08/01/16 | | | 16,238 | | |
| | 241,919 | | | S | | 6.000%, due 10/01/16 | | | 247,990 | | |
| | 279,670 | | | S | | 6.000%, due 01/01/17 | | | 286,719 | | |
| | 124,852 | | | S | | 6.000%, due 02/01/17 | | | 128,009 | | |
| | 596,386 | | | S | | 6.000%, due 04/01/17 | | | 611,461 | | |
| | 395,614 | | | S | | 6.000%, due 05/01/17 | | | 405,615 | | |
| | 167,822 | | | S | | 6.000%, due 06/01/17 | | | 172,064 | | |
| | 294,371 | | | S | | 6.000%, due 07/01/17 | | | 301,812 | | |
| | 503,891 | | | S | | 6.000%, due 08/01/17 | | | 516,567 | | |
| | 1,533,322 | | | S | | 6.000%, due 09/01/17 | | | 1,572,081 | | |
| | 6,810 | | | S | | 6.000%, due 10/01/17 | | | 6,982 | | |
| | 363,400 | | | S | | 6.000%, due 11/01/17 | | | 372,519 | | |
| | 8,261 | | | S | | 6.000%, due 02/01/18 | | | 8,470 | | |
| | 347,822 | | | S | | 6.000%, due 04/01/18 | | | 356,051 | | |
| | 84,283 | | | S | | 6.000%, due 09/01/18 | | | 86,288 | | |
| | 124,427 | | | S | | 6.000%, due 11/01/18 | | | 127,387 | | |
| | 149,830 | | | S | | 6.000%, due 12/01/18 | | | 153,589 | | |
| | 8,360,584 | | | S | | 6.000%, due 07/25/29 | | | 8,580,996 | | |
| | 4,418,842 | | | S | | 6.000%, due 04/25/31 | | | 4,559,412 | | |
| | 207,947 | | | S | | 6.500%, due 01/01/32 | | | 215,067 | | |
| | 130,274 | | | S | | 6.500%, due 09/01/32 | | | 134,699 | | |
| | 394,318 | | | S | | 6.500%, due 10/01/32 | | | 407,711 | | |
| | 14,019 | | | S | | 7.000%, due 08/01/25 | | | 14,784 | | |
| | 4,240 | | | S | | 7.000%, due 11/01/25 | | | 4,472 | | |
| | 53,805 | | | S | | 7.000%, due 12/01/25 | | | 56,743 | | |
| | 89,252 | | | S | | 7.000%, due 02/01/26 | | | 94,125 | | |
| | 187,746 | | | S | | 7.000%, due 03/01/26 | | | 198,011 | | |
| | 79,718 | | | S | | 7.000%, due 01/01/30 | | | 84,103 | | |
| | 2,563,484 | | | S | | 7.000%, due 06/01/31 | | | 2,704,278 | | |
| | 11,129 | | | S | | 7.500%, due 11/01/29 | | | 11,900 | | |
| | 56,652 | | | S | | 7.500%, due 10/01/30 | | | 60,487 | | |
| | 104,276 | | | S | | 7.500%, due 11/01/30 | | | 111,335 | | |
| | 1,463,663 | | | C,S | | 7.500%, due 01/25/48 | | | 1,531,184 | | |
| | 235,666 | | | S | | 10.000%, due 02/25/19 | | | 266,389 | | |
| | | | 221,386,480 | | |
| | | | | | | Government National Mortgage
Association: 0.1% | | | | | |
| | 66,588 | | | S | | 6.125%, due 12/20/29 | | | 67,347 | | |
| | 97,979 | | | S | | 6.375%, due 04/20/28 | | | 99,075 | | |
| | 2,357,133 | | | S | | 6.500%, due 10/15/31 | | | 2,444,209 | | |
| | 402,694 | | | S | | 7.000%, due 04/15/26 | | | 427,826 | | |
Principal
Amount | | | | | | Value | |
| $ | 160,363 | | | S | | 7.000%, due 05/15/32 | | $ | 170,044 | | |
| | 26,796 | | | S | | 7.500%, due 04/15/22 | | | 28,571 | | |
| | 6,154 | | | S | | 7.500%, due 05/15/22 | | | 6,561 | | |
| | 6,431 | | | S | | 7.500%, due 06/15/22 | | | 6,856 | | |
| | 1,368 | | | | | 7.500%, due 08/15/22 | | | 1,459 | | |
| | 5,443 | | | S | | 7.500%, due 06/15/24 | | | 5,811 | | |
| | 6,154 | | | S | | 7.500%, due 01/15/26 | | | 6,574 | | |
| | 2,024 | | | S | | 7.500%, due 07/15/26 | | | 2,162 | | |
| | 29,074 | | | S | | 7.500%, due 03/15/29 | | | 31,037 | | |
| | 40,551 | | | S | | 7.500%, due 04/15/29 | | | 43,288 | | |
| | 83,360 | | | S | | 7.500%, due 08/15/29 | | | 88,988 | | |
| | 9,757 | | | S | | 7.500%, due 09/15/29 | | | 10,416 | | |
| | 21,081 | | | S | | 7.500%, due 10/15/29 | | | 22,504 | | |
| | 37,839 | | | S | | 7.500%, due 12/15/29 | | | 40,397 | | |
| | 7,410 | | | S | | 7.500%, due 01/15/30 | | | 7,907 | | |
| | 61,346 | | | S | | 7.500%, due 02/15/30 | | | 65,462 | | |
| | 675 | | | | | 7.500%, due 02/15/30 | | | 720 | | |
| | 43,339 | | | S | | 7.500%, due 05/15/30 | | | 46,247 | | |
| | 22,224 | | | S | | 7.500%, due 06/15/30 | | | 23,715 | | |
| | 15,950 | | | S | | 7.500%, due 07/15/30 | | | 17,020 | | |
| | 475 | | | | | 7.500%, due 08/15/30 | | | 507 | | |
| | 41,909 | | | S | | 7.500%, due 08/15/30 | | | 44,721 | | |
| | 136 | | | | | 7.500%, due 08/15/30 | | | 145 | | |
| | 11,003 | | | S | | 7.500%, due 10/15/30 | | | 11,742 | | |
| | 2,936 | | | | | 7.500%, due 11/15/30 | | | 3,123 | | |
| | 1,708 | | | | | 7.500%, due 01/15/31 | | | 1,821 | | |
| | 1,465 | | | S | | 7.500%, due 02/15/31 | | | 1,563 | | |
| | 652 | | | | | 7.500%, due 02/15/31 | | | 695 | | |
| | 21,043 | | | S | | 7.500%, due 02/15/31 | | | 22,448 | | |
| | 559 | | | | | 7.500%, due 02/15/31 | | | 596 | | |
| | 17,587 | | | S | | 7.500%, due 03/15/31 | | | 18,761 | | |
| | 12,433 | | | S | | 7.500%, due 04/15/31 | | | 13,263 | | |
| | 1,590 | | | S | | 7.500%, due 09/15/31 | | | 1,696 | | |
| | 374,317 | | | S | | 7.500%, due 12/15/31 | | | 399,414 | | |
| | 56,648 | | | S | | 7.500%, due 01/15/32 | | | 60,453 | | |
| | 66,430 | | | S | | 7.500%, due 03/15/32 | | | 70,865 | | |
| | 981 | | | | | 7.500%, due 04/15/32 | | | 1,045 | | |
| | 36,454 | | | S | | 7.500%, due 05/15/32 | | | 38,847 | | |
| | 973 | | | | | 7.500%, due 06/15/32 | | | 1,036 | | |
| | 91,403 | | | S | | 7.500%, due 06/15/32 | | | 97,402 | | |
| | | | 4,454,339 | | |
Total U.S. Government
Agency Obligations
(Cost $614,417,220) | | | 619,865,110 | | |
| U.S. TREASURY OBLIGATIONS: 28.9% | | | |
| | | | | U.S. Treasury Bonds: 2.3% | |
| | 37,337,000 | | | L | | 4.250%, due 11/15/17 | | | 37,999,172 | | |
| | 36,643,000 | | | L | | 4.750%, due 02/15/37 | | | 38,360,677 | | |
| | | | 76,359,849 | | |
| | | | | U.S. Treasury Notes: 24.3% | |
| | 550,485,000 | | | S,L | | 3.125%, due 11/30/09 | | | 551,259,532 | | |
| | 3,390,000 | | | S | | 3.250%, due 12/31/09 | | | 3,402,716 | | |
| | 260,554,000 | | | L | | 3.375%, due 11/30/12 | | | 259,760,353 | | |
| | | | 814,422,601 | | |
| | | | | | | Treasury Inflation Indexed
Protected Securities: 2.3% | | | | | |
| | 14,560,116 | | | L | | 2.375%, due 04/15/11 | | | 15,181,207 | | |
| | 14,549,391 | | | L | | 2.375%, due 01/15/17 | | | 15,357,566 | | |
See Accompanying Notes to Financial Statements
100
PORTFOLIO OF INVESTMENTS
ING VP INTERMEDIATE BOND PORTFOLIO AS OF DECEMBER 31, 2007 (CONTINUED)
Principal
Amount | | | | | | Value | |
| | | | | Treasury Inflation Indexed
Protected Securities
(continued) | |
| $ | 15,353,972 | | | L | | 2.375%, due 01/15/25 | | $ | 16,124,082 | | |
| | 30,230,746 | | | L | | 3.875%, due 01/15/09 | | | 31,132,952 | | |
| | | | 77,795,807 | | |
Total U.S. Treasury
Obligations
(Cost $966,325,512) | | | 968,578,257 | | |
| ASSET-BACKED SECURITIES: 2.4% | | | |
| | | | | | | Automobile Asset-Backed
Securities: 0.0% | | | | | |
| | 246,276 | | | C,S | | AmeriCredit Automobile
Receivables Trust,
4.220%, due 07/06/09 | | | 245,947 | | |
| | | | 245,947 | | |
| | | | | | | Credit Card Asset-Backed
Securities: 0.1% | | | | | |
| | 6,000 | | | C,S | | Bank One Issuance Trust,
4.540%, due 09/15/10 | | | 6,000 | | |
| | 4,167,000 | | | C,S | | Citibank Credit Card
Issuance Trust,
5.650%, due 09/20/19 | | | 4,234,714 | | |
| | | | 4,240,714 | | |
| | | | | | | Home Equity Asset-Backed
Securities: 1.0% | | | | | |
| | 10,593,000 | | | C,S | | GSAA Trust,
5.242%, due 06/25/34 | | | 10,592,440 | | |
| | 3,328,000 | | | #,C,S | | Irwin Home Equity,
5.960%, due 08/25/37 | | | 2,927,602 | | |
| | 350,262 | | | C,S | | Merrill Lynch Mortgage
Investors, Inc.,
5.225%, due 07/25/34 | | | 340,310 | | |
| | 9,285,000 | | | C,S | | Morgan Stanley
Mortgage Loan Trust,
5.858%, due 01/25/47 | | | 8,835,104 | | |
| | 396,309 | | | C,S | | Renaissance Home
Equity Loan Trust,
4.456%, due 05/25/35 | | | 394,452 | | |
| | 729,195 | | | C,S | | Renaissance Home
Equity Loan Trust,
4.723%, due 11/25/35 | | | 726,600 | | |
| | 3,393,000 | | | C,S | | Residential Funding
Mortgage Securities II, Inc.,
5.890%, due 05/25/37 | | | 3,313,562 | | |
| | 4,000,000 | | | C,S | | Specialty Underwriting &
Residential Finance,
5.065%, due 12/25/36 | | | 3,686,924 | | |
| | 1,305,472 | | | C,S | | Wells Fargo Home
Equity Trust,
3.970%, due 05/25/34 | | | 1,226,953 | | |
| | 500,000 | | | C,S | | Wells Fargo Home
Equity Trust,
4.430%, due 05/25/34 | | | 469,062 | | |
| | | | 32,513,009 | | |
Principal
Amount | | | | | | Value | |
| | | | | | | Other Asset-Backed
Securities: 1.3% | | | | | |
| $ | 287,416 | | | C,S | | Amortizing Residential
Collateral Trust,
5.365%, due 05/25/32 | | $ | 256,878 | | |
| | 855,203 | | | C,S | | Bear Stearns Asset-Backed
Securities, Inc.,
5.265%, due 07/25/36 | | | 740,632 | | |
| | 1,819 | | | C,S | | Chase Funding
Mortgage Loan,
4.045%, due 05/25/33 | | | 1,770 | | |
| | 725,661 | | | C,S | | Chase Funding
Mortgage Loan,
5.165%, due 07/25/33 | | | 719,371 | | |
| | 163,313 | | | C,S | | Countrywide
Asset-Backed Certificates,
4.493%, due 02/25/36 | | | 162,800 | | |
| | 6,668,000 | | | C,S | | Credit-Based Asset Servicing
and Securitization, LLC,
4.831%, due 08/25/35 | | | 6,540,950 | | |
| | 4,266,000 | | | C,S | | Credit-Based Asset Servicing
and Securitization, LLC,
5.501%, due 12/25/36 | | | 4,215,640 | | |
| | 3,360,000 | | | #,C,S | | Credit-Based Asset Servicing
and Securitization, LLC,
5.746%, due 12/25/37 | | | 3,315,376 | | |
| | 2,876,000 | | | #,C,S | | Credit-Based Asset Servicing
and Securitization, LLC,
6.020%, due 12/25/37 | | | 2,747,029 | | |
| | 3,375,000 | | | C,S | | Equity One, Inc.,
5.050%, due 09/25/33 | | | 3,282,176 | | |
| | 589,438 | | | C,S | | Fannie Mae,
5.005%, due 04/25/35 | | | 589,573 | | |
| | 2,382,223 | | | C,S | | First Horizon Asset
Back Trust,
4.995%, due 09/25/29 | | | 2,144,643 | | |
| | 6,265,000 | | | #,C,S | | Hudson Mezzanine Funding,
5.982%, due 06/12/42 | | | 156,625 | | |
| | 3,173,208 | | | C,S | | Lehman XS Trust,
5.145%, due 08/25/35 | | | 3,083,945 | | |
| | 466,463 | | | C,S | | Long Beach Mortgage
Loan Trust,
5.195%, due 01/25/46 | | | 426,873 | | |
| | 1,194,086 | | | C,S | | Merrill Lynch Mortgage
Investors, Inc.,
5.045%, due 09/25/36 | | | 944,543 | | |
| | 5,845,000 | | | C,S | | Merrill Lynch Mortgage
Investors, Inc.,
5.065%, due 01/25/37 | | | 5,519,419 | | |
| | 2,065,000 | | | C,S | | Merrill Lynch Mortgage
Investors, Inc.,
5.609%, due 03/25/37 | | | 2,049,993 | | |
| | 843 | | | C | | Popular Mortgage
Pass-Through Trust,
4.000%, due 12/25/34 | | | 833 | | |
| | 893,477 | | | C,S | | Popular Mortgage
Pass-Through Trust,
4.596%, due 11/25/35 | | | 890,624 | | |
| | 1,380,000 | | | C,S | | Renaissance Home
Equity Loan Trust,
5.608%, due 05/25/36 | | | 1,368,424 | | |
| | 89,791 | | | C,S | | Residential Asset
Mortgage Products, Inc.,
5.485%, due 06/25/33 | | | 89,014 | | |
See Accompanying Notes to Financial Statements
101
PORTFOLIO OF INVESTMENTS
ING VP INTERMEDIATE BOND PORTFOLIO AS OF DECEMBER 31, 2007 (CONTINUED)
Principal
Amount | | | | | | Value | |
| | | | | | | Other Asset-Backed
Securities (continued) | | | | | |
| $ | 3,269,876 | | | C,S | | Structured Asset
Securities Corp.,
4.910%, due 06/25/33 | | $ | 3,271,251 | | |
| | 645,357 | | | C,S | | Structured Asset
Securities Corp.,
6.000%, due 03/25/34 | | | 644,496 | | |
| | | | 43,162,878 | | |
Total Asset-Backed
Securities
(Cost $88,872,928) | | | 80,162,548 | | |
| COLLATERALIZED MORTGAGE OBLIGATIONS: 27.5% | | | |
| | 794,355 | | | C,S | | American Home
Mortgage Assets,
5.578%, due 02/25/47 | | | 690,208 | | |
| | 9,823,639 | | | C,S | | American Home
Mortgage Assets,
5.708%, due 11/25/46 | | | 9,233,828 | | |
| | 4,664,285 | | | C,S | | American Home
Mortgage Assets,
5.788%, due 09/25/46 | | | 4,105,564 | | |
| | 5,047,215 | | | C,S | | American Home
Mortgage Investment Trust,
5.155%, due 11/25/45 | | | 4,801,682 | | |
| | 7,273,818 | | | #,S | | Astoria Depositor Corp.,
7.902%, due 05/01/21 | | | 7,564,770 | | |
| | 10,558,935 | | | C,S | | Banc of America
Alternative Loan Trust,
6.280%, due 11/25/21 | | | 10,967,694 | | |
| | 8,146,524 | | | C,S | | Banc of America
Alternative Loan Trust,
6.493%, due 04/25/37 | | | 8,145,209 | | |
| | 138,174,273 | | | C,S,^ | | Banc of America
Commercial Mortgage, Inc.,
0.292%, due 01/15/49 | | | 2,862,460 | | |
| | 781,000 | | | C,S | | Banc of America
Commercial Mortgage, Inc.,
4.161%, due 12/10/42 | | | 775,432 | | |
| | 385,000 | | | C,S | | Banc of America
Commercial Mortgage, Inc.,
4.429%, due 11/10/39 | | | 380,951 | | |
| | 3,941,000 | | | C,S | | Banc of America
Commercial Mortgage, Inc.,
4.502%, due 07/10/42 | | | 3,912,769 | | |
| | 7,612,000 | | | C,S | | Banc of America
Commercial Mortgage, Inc.,
4.611%, due 07/10/43 | | | 7,561,424 | | |
| | 2,735,000 | | | C,S | | Banc of America
Commercial Mortgage, Inc.,
4.764%, due 07/10/45 | | | 2,718,457 | | |
| | 3,928,213 | | | C,S | | Banc of America
Commercial Mortgage, Inc.,
4.772%, due 07/11/43 | | | 3,940,915 | | |
| | 4,150,000 | | | C,S | | Banc of America
Commercial Mortgage, Inc.,
4.891%, due 07/10/45 | | | 4,100,391 | | |
| | 3,295,000 | | | C,S | | Banc of America
Commercial Mortgage, Inc.,
5.463%, due 09/10/47 | | | 3,029,585 | | |
| | 970,000 | | | C,S | | Banc of America
Commercial Mortgage, Inc.,
6.186%, due 06/11/35 | | | 1,017,933 | | |
Principal
Amount | | | | | | Value | |
| $ | 6,434,386 | | | C,S | | Banc of America
Funding Corp.,
5.159%, due 05/20/47 | | $ | 6,112,708 | | |
| | 7,714,491 | | | C,S | | Banc of America
Funding Corp.,
5.159%, due 06/20/47 | | | 6,761,831 | | |
| | 11,248,072 | | | C,S | | Banc of America
Funding Corp.,
5.260%, due 09/20/35 | | | 10,892,290 | | |
| | 19,354,261 | | | C,S | | Banc of America
Funding Corp.,
5.653%, due 06/20/37 | | | 18,860,449 | | |
| | 5,352,878 | | | C,S | | Banc of America
Funding Corp.,
5.750%, due 09/20/34 | | | 5,259,498 | | |
| | 5,264,299 | | | C,S | | Banc of America
Funding Corp.,
5.843%, due 05/20/36 | | | 5,196,271 | | |
| | 4,198,903 | | | C,S | | Banc of America
Funding Corp.,
7.000%, due 10/25/37 | | | 4,264,569 | | |
| | 5,617,114 | | | C,S | | Banc of America
Mortgage Securities, Inc.,
5.177%, due 09/25/35 | | | 5,486,601 | | |
| | 1,950,262 | | | C,S | | Banc of America
Mortgage Securities, Inc.,
5.250%, due 11/25/19 | | | 1,942,407 | | |
| | 2,106,942 | | | C,S | | Banc of America
Mortgage Securities, Inc.,
5.500%, due 11/25/33 | | | 2,037,254 | | |
| | 4,000,182 | | | C,S | | Banc of America
Mortgage Securities, Inc.,
5.500%, due 06/25/35 | | | 4,005,780 | | |
| | 1,402,002 | | | C,S | | Bear Stearns
Alternative-A Trust,
5.185%, due 07/25/34 | | | 1,399,285 | | |
| | 405,000 | | | C,S | | Bear Stearns Commercial
Mortgage Securities,
4.030%, due 02/13/46 | | | 401,245 | | |
| | 1,206,000 | | | C,S | | Bear Stearns Commercial
Mortgage Securities,
4.565%, due 07/11/42 | | | 1,200,169 | | |
| | 5,802,000 | | | S | | Bear Stearns Commercial
Mortgage Securities,
5.660%, due 09/11/41 | | | 5,426,017 | | |
| | 3,221,000 | | | C,S | | Bear Stearns Commercial
Mortgage Securities,
7.780%, due 02/15/32 | | | 3,379,632 | | |
| | 677,661 | | | C,S | | Capco America
Securitization Corp.,
6.260%, due 10/15/30 | | | 681,029 | | |
| | 279,000 | | | C,S | | Capco America
Securitization Corp.,
6.460%, due 10/15/30 | | | 281,581 | | |
| | 5,762,422 | | | C,S | | Chase Manhattan
Bank-First Union
National Bank,
7.439%, due 08/15/31 | | | 5,962,219 | | |
| | 11,049,900 | | | C,S | | Chase Mortgage
Finance Corp.,
5.409%, due 12/25/35 | | | 11,060,753 | | |
| | 6,910,841 | | | C,S | | Chase Mortgage
Finance Corp.,
5.500%, due 11/25/35 | | | 6,914,779 | | |
See Accompanying Notes to Financial Statements
102
PORTFOLIO OF INVESTMENTS
ING VP INTERMEDIATE BOND PORTFOLIO AS OF DECEMBER 31, 2007 (CONTINUED)
Principal
Amount | | | | | | Value | |
| COLLATERALIZED MORTGAGE OBLIGATIONS (continued) | | | |
| $ | 9,471,939 | | | C,S | | Chaseflex Trust,
6.500%, due 02/25/37 | | $ | 9,522,251 | | |
| | 4,070,442 | | | C,S | | Citigroup Mortgage
Loan Trust, Inc.,
5.612%, due 04/25/37 | | | 4,028,189 | | |
| | 6,122,450 | | | C,S | | Citigroup Mortgage
Loan Trust, Inc.,
5.940%, due 06/25/36 | | | 6,069,170 | | |
| | 11,459,517 | | | C,S | | Citigroup Mortgage
Loan Trust, Inc.,
6.000%, due 11/25/35 | | | 11,471,773 | | |
| | 23,671,843 | | | C,S | | Citigroup Mortgage
Loan Trust, Inc.,
6.059%, due 08/25/36 | | | 23,956,748 | | |
| | 2,413,703 | | | C,S | | Citigroup Mortgage
Securities, Inc.,
5.500%, due 02/25/22 | | | 2,440,497 | | |
| | 819,000 | | | C,S | | Commercial Mortgage
Pass-Through Certificates,
3.600%, due 03/10/39 | | | 808,989 | | |
| | 2,524,821 | | | C,S | | Countrywide Alternative
Loan Trust,
5.105%, due 11/25/46 | | | 2,336,734 | | |
| | 344,213 | | | C,S | | Countrywide Alternative
Loan Trust,
5.165%, due 02/25/35 | | | 339,136 | | |
| | 12,146,831 | | | C,S | | Countrywide Alternative
Loan Trust,
5.407%, due 10/25/35 | | | 12,138,654 | | |
| | 1,707,182 | | | C,S | | Countrywide Alternative
Loan Trust,
5.500%, due 02/25/25 | | | 1,647,335 | | |
| | 4,515,996 | | | C,S | | Countrywide Alternative
Loan Trust,
5.565%, due 09/25/36 | | | 4,512,048 | | |
| | 7,694,451 | | | C,S | | Countrywide Alternative
Loan Trust,
5.668%, due 11/25/46 | | | 6,929,622 | | |
| | 1,491,575 | | | C,S | | Countrywide Alternative
Loan Trust,
6.000%, due 05/25/36 | | | 1,487,015 | | |
| | 600,506 | | | C,S | | Countrywide Home Loan
Mortgage Pass-Through Trust,
5.000%, due 02/25/18 | | | 584,623 | | |
| | 4,056,483 | | | C,S | | Countrywide Home Loan
Mortgage Pass-Through Trust,
5.250%, due 10/25/35 | | | 3,810,248 | | |
| | 20,388,073 | | | C,S | | Countrywide Home Loan
Mortgage Pass-Through Trust,
5.750%, due 07/25/37 | | | 20,473,214 | | |
| | 1,624,916 | | | C,S | | Credit Suisse First Boston
Mortgage Securities Corp.,
3.727%, due 03/15/35 | | | 1,583,312 | | |
| | 1,063,383 | | | C,S | | Credit Suisse First Boston
Mortgage Securities Corp.,
3.819%, due 05/15/36 | | | 1,041,330 | | |
| | 2,328,000 | | | C,S | | Credit Suisse First Boston
Mortgage Securities Corp.,
4.801%, due 03/15/36 | | | 2,317,692 | | |
| | 1,506,361 | | | C,S | | Credit Suisse First Boston
Mortgage Securities Corp.,
5.000%, due 08/25/20 | | | 1,461,646 | | |
Principal
Amount | | | | | | Value | |
| $ | 4,000 | | | C,S | | Credit Suisse First Boston
Mortgage Securities Corp.,
7.560%, due 04/15/62 | | $ | 4,280 | | |
| | 3,731,924 | | | C,S | | Credit Suisse Mortgage
Capital Certificates,
7.000%, due 08/25/36 | | | 3,770,285 | | |
| | 19,701 | | | C,S | | DLJ Commercial
Mortgage Corp.,
6.240%, due 11/12/31 | | | 19,802 | | |
| | 59,658 | | | C,S | | DLJ Commercial
Mortgage Corp.,
7.300%, due 06/10/32 | | | 61,342 | | |
| | 11,784,906 | | | C,S | | First Horizon Alternative
Mortgage Securities,
5.500%, due 08/25/35 | | | 11,516,094 | | |
| | 4,095,766 | | | C,S | | First Horizon Asset
Securities, Inc.,
5.500%, due 12/25/35 | | | 4,093,531 | | |
| | 3,400,000 | | | C,S | | First Union National Bank
Commercial Mortgage,
6.663%, due 01/12/43 | | | 3,580,312 | | |
| | 136,168,971 | | | C,S,^ | | GE Capital Commercial
Mortgage Corp.,
0.507%, due 06/10/48 | | | 2,082,296 | | |
| | 1,336,793 | | | C,S | | GE Capital Commercial
Mortgage Corp.,
3.752%, due 07/10/39 | | | 1,323,596 | | |
| | 793,000 | | | C,S | | GE Capital Commercial
Mortgage Corp.,
4.371%, due 01/10/38 | | | 789,083 | | |
| | 301,000 | | | C,S | | GE Capital Commercial
Mortgage Corp.,
4.865%, due 07/10/39 | | | 302,217 | | |
| | 987,999 | | | C,S | | GE Capital Commercial
Mortgage Corp.,
5.560%, due 06/10/38 | | | 1,002,451 | | |
| | 3,291,986 | | | C,S | | GMAC Mortgage Corp.
Loan Trust,
4.583%, due 10/19/33 | | | 3,212,459 | | |
| | 8,224,632 | | | C,S | | GMAC Mortgage Corp.
Loan Trust,
5.259%, due 03/18/35 | | | 7,967,043 | | |
| | 4,804,444 | | | C,S | | GMAC Mortgage Corp.
Loan Trust,
5.461%, due 11/19/35 | | | 4,715,956 | | |
| | 109,281,769 | | | #,C,S,^ | | Greenwich Capital
Commercial Funding Corp.,
0.323%, due 03/10/39 | | | 2,340,990 | | |
| | 6,606,000 | | | C,S | | Greenwich Capital
Commercial Funding Corp.,
5.117%, due 04/10/37 | | | 6,621,656 | | |
| | 3,280,000 | | | C,S | | Greenwich Capital
Commercial Funding Corp.,
5.534%, due 03/10/39 | | | 2,979,549 | | |
| | 1,660,000 | | | C,S | | Greenwich Capital
Commercial Funding Corp.,
5.554%, due 03/10/39 | | | 1,489,859 | | |
| | 1,325,000 | | | C,S | | Greenwich Capital
Commercial Funding Corp.,
5.613%, due 03/10/39 | | | 1,124,547 | | |
| | 4,390,000 | | | C,S | | GS Mortgage
Securities Corp. II,
5.627%, due 04/10/38 | | | 3,981,004 | | |
See Accompanying Notes to Financial Statements
103
PORTFOLIO OF INVESTMENTS
ING VP INTERMEDIATE BOND PORTFOLIO AS OF DECEMBER 31, 2007 (CONTINUED)
Principal
Amount | | | | | | Value | |
| COLLATERALIZED MORTGAGE OBLIGATIONS (continued) | | | |
| $ | 1,209,858 | | | #,C,S | | GSMPS 2005-RP1 1AF,
5.215%, due 01/25/35 | | $ | 1,195,984 | | |
| | 2,955,499 | | | C,S | | GSR Mortgage Loan Trust,
5.500%, due 07/25/35 | | | 2,914,511 | | |
| | 1,153,843 | | | C,S | | Harborview Mortgage
Loan Trust,
5.315%, due 01/19/35 | | | 1,114,426 | | |
| | 774,749 | | | C,S | | Homebanc Mortgage Trust,
5.295%, due 08/25/29 | | | 774,299 | | |
| | 15,000,000 | | | C,S | | JPMorgan Alternative
Loan Trust,
5.035%, due 08/25/36 | | | 14,746,554 | | |
| | 1,129,141 | | | C,S | | JPMorgan Alternative
Loan Trust,
5.507%, due 01/25/36 | | | 1,118,339 | | |
| | 369,168,553 | | | C,S,^ | | JPMorgan Chase
Commercial Mortgage
Securities Corp.,
0.046%, due 01/12/43 | | | 482,429 | | |
| | 659,488 | | | C,S | | JPMorgan Chase
Commercial Mortgage
Securities Corp.,
4.200%, due 07/12/35 | | | 653,722 | | |
| | 3,890,000 | | | C,S | | JPMorgan Chase
Commercial Mortgage
Securities Corp.,
4.223%, due 01/15/42 | | | 3,861,936 | | |
| | 4,771,456 | | | C,S | | JPMorgan Chase
Commercial Mortgage
Securities Corp.,
4.275%, due 01/12/37 | | | 4,731,488 | | |
| | 1,402,000 | | | C,S | | JPMorgan Chase
Commercial Mortgage
Securities Corp.,
4.865%, due 03/15/46 | | | 1,382,641 | | |
| | 978,000 | | | C,S | | JPMorgan Chase
Commercial Mortgage
Securities Corp.,
5.455%, due 05/15/47 | | | 919,690 | | |
| | 1,951,000 | | | C,S | | JPMorgan Chase
Commercial Mortgage
Securities Corp.,
5.495%, due 05/15/47 | | | 1,790,899 | | |
| | 638,350 | | | C,S | | JPMorgan Chase
Commercial Mortgage
Securities Corp.,
5.833%, due 04/15/45 | | | 646,643 | | |
| | 4,589,000 | | | C,S | | JPMorgan Chase
Commercial Mortgage
Securities Corp.,
5.857%, due 10/12/35 | | | 4,756,780 | | |
| | 4,005,000 | | | C,S | | JPMorgan Chase
Commercial Mortgage
Securities Corp.,
5.861%, due 04/15/45 | | | 4,103,463 | | |
| | 26,939,708 | | | C,S | | JPMorgan Mortgage Trust,
5.405%, due 11/25/35 | | | 26,377,620 | | |
| | 28,084,493 | | | C,S,^ | | LB-UBS Commercial
Mortgage Trust,
0.485%, due 02/15/40 | | | 878,292 | | |
| | 1,794,000 | | | C,S | | LB-UBS Commercial
Mortgage Trust,
3.992%, due 10/15/29 | | | 1,776,613 | | |
Principal
Amount | | | | | | Value | |
| $ | 6,291,000 | | | C,S | | LB-UBS Commercial
Mortgage Trust,
4.201%, due 12/15/29 | | $ | 6,252,315 | | |
| | 499,000 | | | C,S | | LB-UBS Commercial
Mortgage Trust,
4.310%, due 02/15/30 | | | 492,625 | | |
| | 1,707,000 | | | C,S | | LB-UBS Commercial
Mortgage Trust,
4.510%, due 12/15/29 | | | 1,694,251 | | |
| | 2,276,000 | | | C,S | | LB-UBS Commercial
Mortgage Trust,
4.567%, due 06/15/29 | | | 2,270,497 | | |
| | 2,531,788 | | | C,S | | LB-UBS Commercial
Mortgage Trust,
4.821%, due 04/15/30 | | | 2,525,622 | | |
| | 1,066,000 | | | C,S | | LB-UBS Commercial
Mortgage Trust,
4.836%, due 02/15/40 | | | 996,266 | | |
| | 2,050,000 | | | C,S | | LB-UBS Commercial
Mortgage Trust,
4.885%, due 09/15/30 | | | 2,046,932 | | |
| | 2,416,000 | | | C,S | | LB-UBS Commercial
Mortgage Trust,
4.998%, due 04/15/30 | | | 2,397,992 | | |
| | 3,322,000 | | | C,S | | LB-UBS Commercial
Mortgage Trust,
5.103%, due 11/15/30 | | | 3,329,843 | | |
| | 4,256,000 | | | C,S | | LB-UBS Commercial
Mortgage Trust,
5.287%, due 04/15/40 | | | 4,025,302 | | |
| | 6,517,000 | | | C,S | | LB-UBS Commercial
Mortgage Trust,
5.403%, due 02/15/40 | | | 6,552,980 | | |
| | 2,358,000 | | | C,S | | LB-UBS Commercial
Mortgage Trust,
5.516%, due 11/15/38 | | | 2,091,254 | | |
| | 1,693,000 | | | C,S | | LB-UBS Commercial
Mortgage Trust,
5.533%, due 02/15/40 | | | 1,519,852 | | |
| | 3,386,000 | | | C,S | | LB-UBS Commercial
Mortgage Trust,
5.563%, due 02/15/40 | | | 2,985,852 | | |
| | 15,233,000 | | | C,S | | LB-UBS Commercial
Mortgage Trust,
6.365%, due 12/15/28 | | | 16,026,449 | | |
| | 11,516,549 | | | C,S | | LB-UBS Commercial
Mortgage Trust,
7.370%, due 08/15/26 | | | 12,144,530 | | |
| | 3,752,000 | | | C,S | | MASTR Alternative
Loans Trust,
6.250%, due 07/25/36 | | | 3,775,762 | | |
| | 158,560 | | | C,S | | MASTR Alternative
Loans Trust,
6.500%, due 05/25/33 | | | 158,167 | | |
| | 812,996 | | | C,S | | MASTR Alternative
Loans Trust,
8.500%, due 05/25/33 | | | 816,440 | | |
| | 83,495,729 | | | #,C,S,^ | | Merrill Lynch
Mortgage Trust,
0.177%, due 11/12/35 | | | 460,930 | | |
| | 104,882,132 | | | S,^ | | Merrill Lynch
Mortgage Trust,
0.212%, due 10/12/41 | | | 1,972,602 | | |
See Accompanying Notes to Financial Statements
104
PORTFOLIO OF INVESTMENTS
ING VP INTERMEDIATE BOND PORTFOLIO AS OF DECEMBER 31, 2007 (CONTINUED)
Principal
Amount | | | | | | Value | |
| COLLATERALIZED MORTGAGE OBLIGATIONS (continued) | | | |
| $ | 2,725,000 | | | C,S | | Merrill Lynch
Mortgage Trust,
4.892%, due 02/12/42 | | $ | 2,736,173 | | |
| | 19,360,891 | | | C,S,^ | | Merrill Lynch/Countrywide
Commercial Mortgage Trust,
0.545%, due 08/12/48 | | | 726,512 | | |
| | 1,445,000 | | | C,S | | Merrill Lynch/Countrywide
Commercial Mortgage Trust,
5.479%, due 08/12/48 | | | 1,289,115 | | |
| | 1,617,000 | | | C,S | | Merrill Lynch/Countrywide
Commercial Mortgage Trust,
5.509%, due 08/12/48 | | | 1,416,776 | | |
| | 1,138,249 | | | C,S | | MLCC Mortgage
Investors, Inc.,
5.095%, due 04/25/29 | | | 1,118,200 | | |
| | 498,109 | | | C,S | | MLCC Mortgage
Investors, Inc.,
5.185%, due 01/25/29 | | | 495,732 | | |
| | 8,245,000 | | | C,S | | Morgan Stanley Capital I,
5.007%, due 01/14/42 | | | 8,190,216 | | |
| | 1,319,370 | | | C,S | | Morgan Stanley
Dean Witter Capital I,
4.180%, due 03/12/35 | | | 1,296,604 | | |
| | 72,414 | | | C,S | | MortgageIT Trust,
5.235%, due 11/25/35 | | | 67,351 | | |
| | 3,764,000 | | | C,S | | New York Mortgage
Trust, Inc.,
5.649%, due 05/25/36 | | | 3,798,999 | | |
| | 1,804,000 | | | C,S | | Nomura Asset
Securities Corp.,
6.690%, due 03/15/30 | | | 1,920,334 | | |
| | 2,117,716 | | | C,S | | Prime Mortgage Trust,
5.365%, due 02/25/35 | | | 2,085,699 | | |
| | 2,344,282 | | | C,S | | Prudential Commercial
Mortgage Trust,
3.669%, due 02/11/36 | | | 2,301,819 | | |
| | 14,283,854 | | | C,S | | RAAC Series,
5.250%, due 09/25/34 | | | 14,080,006 | | |
| | 1,661,824 | | | C,S | | Residential Accredit
Loans, Inc.,
5.095%, due 05/25/46 | | | 1,528,638 | | |
| | 13,998,680 | | | C,S | | Residential Accredit
Loans, Inc.,
5.500%, due 05/25/34 | | | 12,609,272 | | |
| | 1,315,905 | | | C,S | | Residential Funding
Mortgage Security I,
5.315%, due 05/25/33 | | | 1,305,362 | | |
| | 8,105,338 | | | C,S | | Residential Funding
Mortgage Security I,
6.000%, due 06/25/36 | | | 8,163,569 | | |
| | 739,497 | | | C,S | | Sequoia Mortgage Trust,
5.219%, due 01/20/35 | | | 720,652 | | |
| | 884,541 | | | C,S | | Structured Adjustable Rate
Mortgage Loan Trust,
5.175%, due 07/25/35 | | | 829,649 | | |
| | 1,162,742 | | | C,S | | Structured Adjustable Rate
Mortgage Loan Trust,
5.922%, due 05/25/36 | | | 1,153,769 | | |
| | 1,488,883 | | | C,S | | Structured Asset Mortgage
Investments, Inc.,
5.205%, due 04/19/35 | | | 1,481,522 | | |
Principal
Amount | | | | | | Value | |
| $ | 6,176,819 | | | C,S | | Structured Asset Mortgage
Investments, Inc.,
7.148%, due 12/27/35 | | $ | 6,266,748 | | |
| | 1,410,324 | | | C,S | | Structured Asset
Securities Corp.,
5.500%, due 07/25/33 | | | 1,401,261 | | |
| | 2,212,541 | | | C,S | | Thornburg Mortgage
Securities Trust,
5.215%, due 12/25/33 | | | 2,198,750 | | |
| | 2,065,142 | | | C,S | | Thornburg Mortgage
Securities Trust,
5.235%, due 09/25/44 | | | 2,029,718 | | |
| | 1,336,000 | | | #,C,S | | Wachovia Bank Commercial
Mortgage Trust,
5.210%, due 10/15/44 | | | 1,223,361 | | |
| | 11,328,000 | | | C,S | | Wachovia Bank Commercial
Mortgage Trust,
5.210%, due 10/15/44 | | | 10,571,046 | | |
| | 610,000 | | | C,S | | Wachovia Bank Commercial
Mortgage Trust,
5.244%, due 07/15/42 | | | 612,634 | | |
| | 4,782,000 | | | C,S | | Washington Mutual
Mortgage Pass-Through
Certificates,
3.795%, due 06/25/34 | | | 4,702,839 | | |
| | 3,979,815 | | | C,S | | Washington Mutual
Mortgage Pass-Through
Certificates, 5.000%,
due 12/25/18 | | | 3,937,963 | | |
| | 7,926,316 | | | C,S | | Washington Mutual
Mortgage Pass-Through
Certificates, 5.079%,
due 09/25/46 | | | 6,884,092 | | |
| | 1,005,561 | | | C,S | | Washington Mutual
Mortgage Pass-Through
Certificates, 5.175%,
due 01/25/45 | | | 952,198 | | |
| | 981,704 | | | C,S | | Washington Mutual
Mortgage Pass-Through
Certificates, 5.233%,
due 06/25/44 | | | 967,536 | | |
| | 1,809,825 | | | C,S | | Washington Mutual
Mortgage Pass-Through
Certificates, 5.265%,
due 08/25/45 | | | 1,757,782 | | |
| | 1,291,969 | | | C,S | | Washington Mutual
Mortgage Pass-Through
Certificates, 5.465%,
due 07/25/36 | | | 1,280,838 | | |
| | 7,773,835 | | | C,S | | Washington Mutual
Mortgage Pass-Through
Certificates, 5.488%,
due 03/25/47 | | | 7,136,596 | | |
| | 8,813,658 | | | C,S | | Washington Mutual
Mortgage Pass-Through
Certificates, 5.496%,
due 01/25/37 | | | 8,736,390 | | |
| | 9,246,327 | | | C,S | | Washington Mutual
Mortgage Pass-Through
Certificates, 5.548%,
due 04/25/47 | | | 8,435,799 | | |
See Accompanying Notes to Financial Statements
105
PORTFOLIO OF INVESTMENTS
ING VP INTERMEDIATE BOND PORTFOLIO AS OF DECEMBER 31, 2007 (CONTINUED)
Principal
Amount | | | | | | Value | |
| COLLATERALIZED MORTGAGE OBLIGATIONS (continued) | | | |
| $ | 13,407,174 | | | C,S | | Washington Mutual
Mortgage Pass-Through
Certificates, 5.558%,
due 04/25/47 | | $ | 12,341,243 | | |
| | 17,845,290 | | | C,S | | Washington Mutual
Mortgage Pass-Through
Certificates, 5.558%,
due 05/25/47 | | | 16,462,942 | | |
| | 5,855,145 | | | C,S | | Washington Mutual
Mortgage Pass-Through
Certificates, 5.598%,
due 07/25/47 | | | 5,406,405 | | |
| | 5,907,072 | | | C,S | | Washington Mutual
Mortgage Pass-Through
Certificates, 5.628%,
due 11/25/46 | | | 5,486,007 | | |
| | 15,215,875 | | | C,S | | Washington Mutual
Mortgage Pass-Through
Certificates, 5.683%,
due 06/25/37 | | | 15,196,304 | | |
| | 19,863,029 | | | C,S | | Washington Mutual
Mortgage Pass-Through
Certificates, 5.700%,
due 06/25/37 | | | 19,613,933 | | |
| | 8,673,661 | | | C,S | | Washington Mutual
Mortgage Pass-Through
Certificates, 5.748%,
due 09/25/46 | | | 8,056,907 | | |
| | 12,810,530 | | | C,S | | Washington Mutual
Mortgage Pass-Through
Certificates, 5.750%,
due 02/25/36 | | | 12,747,278 | | |
| | 6,786,932 | | | C,S | | Washington Mutual
Mortgage Pass-Through
Certificates, 5.758%,
due 05/25/46 | | | 5,972,500 | | |
| | 870,192 | | | C,S | | Washington Mutual
Mortgage Pass-Through
Certificates, 5.758%,
due 06/25/46 | | | 809,408 | | |
| | 2,761,000 | | | C,S | | Washington Mutual
Mortgage Pass-Through
Certificates, 5.822%,
due 10/25/36 | | | 2,790,724 | | |
| | 10,845,794 | | | C,S | | Washington Mutual
Mortgage Pass-Through
Certificates, 5.877%,
due 07/25/37 | | | 10,599,242 | | |
| | 13,254,048 | | | C,S | | Washington Mutual
Mortgage Pass-Through
Certificates, 5.880%,
due 07/25/37 | | | 13,235,477 | | |
| | 1,617,591 | | | C,S | | Washington Mutual
Mortgage Pass-Through
Certificates, 5.883%,
due 10/25/46 | | | 1,582,206 | | |
| | 9,708,742 | | | C,S | | Washington Mutual
Mortgage Pass-Through
Certificates, 5.914%,
due 07/25/37 | | | 9,672,190 | | |
Principal
Amount | | | | | | Value | |
| $ | 3,548,529 | | | C,S | | Washington Mutual
Mortgage Pass-Through
Certificates, 6.000%,
due 06/25/34 | | $ | 3,583,910 | | |
| | 7,011,463 | | | C,S | | Washington Mutual
Mortgage Pass-Through
Certificates, 6.000%,
due 07/25/36 | | | 6,995,758 | | |
| | 4,750,372 | | | C,S | | Wells Fargo Alternative
Loan Trust, 6.000%,
due 06/25/37 | | | 4,699,616 | | |
| | 2,431,979 | | | C,S | | Wells Fargo Alternative
Loan Trust, 6.250%,
due 11/25/37 | | | 2,390,734 | | |
| | 6,671,000 | | | C,S | | Wells Fargo
Mortgage-Backed
Securities Trust,
3.500%, due 06/25/35 | | | 6,623,531 | | |
| | 5,950,000 | | | C,S | | Wells Fargo
Mortgage-Backed
Securities Trust,
4.500%, due 08/25/18 | | | 5,746,740 | | |
| | 4,195,000 | | | C,S | | Wells Fargo
Mortgage-Backed
Securities Trust,
4.790%, due 07/25/34 | | | 4,132,274 | | |
| | 4,243,000 | | | C,S | | Wells Fargo
Mortgage-Backed
Securities Trust,
4.818%, due 07/25/34 | | | 4,127,458 | | |
| | 4,215,843 | | | C,S | | Wells Fargo
Mortgage-Backed
Securities Trust,
4.892%, due 08/25/34 | | | 4,137,846 | | |
| | 6,391,066 | | | C,S | | Wells Fargo
Mortgage-Backed
Securities Trust,
5.000%, due 12/25/33 | | | 6,200,589 | | |
| | 9,977,426 | | | C,S | | Wells Fargo
Mortgage-Backed
Securities Trust,
5.110%, due 03/25/36 | | | 9,719,027 | | |
| | 9,673,070 | | | C,S | | Wells Fargo
Mortgage-Backed
Securities Trust,
5.387%, due 08/25/35 | | | 9,489,745 | | |
| | 5,582,110 | | | C,S | | Wells Fargo
Mortgage-Backed
Securities Trust,
5.500%, due 12/25/35 | | | 5,470,308 | | |
| | 6,321,663 | | | C,S | | Wells Fargo
Mortgage-Backed
Securities Trust,
5.500%, due 01/25/36 | | | 6,195,052 | | |
| | 19,880,331 | | | C,S | | Wells Fargo
Mortgage-Backed
Securities Trust,
5.650%, due 12/25/36 | | | 19,550,826 | | |
| | 8,231,862 | | | C,S | | Wells Fargo
Mortgage-Backed
Securities Trust,
5.940%, due 11/25/36 | | | 8,323,557 | | |
See Accompanying Notes to Financial Statements
106
PORTFOLIO OF INVESTMENTS
ING VP INTERMEDIATE BOND PORTFOLIO AS OF DECEMBER 31, 2007 (CONTINUED)
Principal
Amount | | | | | | Value | |
| COLLATERALIZED MORTGAGE OBLIGATIONS (continued) | | | |
| $ | 9,465,121 | | | C,S | | Wells Fargo
Mortgage-Backed
Securities Trust,
5.950%, due 10/25/36 | | $ | 9,572,903 | | |
| | 10,412,828 | | | C,S | | Wells Fargo
Mortgage-Backed
Securities Trust,
6.000%, due 06/25/36 | | | 10,505,137 | | |
Total Collateralized
Mortgage Obligations
(Cost $936,946,619) | | | 919,886,306 | | |
| MUNICIPAL BONDS: 0.5% | | | |
| | | | | California: 0.2% | |
| | 6,482,000 | | | C,S | | City of San Diego,
7.125%, due 06/01/32 | | | 5,929,150 | | |
| | | | 5,929,150 | | |
| | | | | Michigan: 0.3% | |
| | 11,680,000 | | | S | | Michigan Tobacco
Settlement Finance
Authority, 7.309%,
due 06/01/34 | | | 10,862,750 | | |
| | | | 10,862,750 | | |
Total Municipal Bonds
(Cost $18,265,815) | | | 16,791,900 | | |
| Shares | | | | | | Value | |
| PREFERRED STOCK: 0.9% | | | |
| | | | | Banks: 0.1% | |
| | 248,050 | | | @@,P,S | | Santander Finance,
5.661%, due 03/05/17 | | | 4,688,145 | | |
| | | | 4,688,145 | | |
| | | | | Diversified Financial Services: 0.3% | |
| | 182,000 | | | P,S | | Deutsche Bank
Capital Trust II,
6.550%, due 05/23/17 | | | 3,933,020 | | |
| | 302,625 | | | P, L | | Merrill Lynch & Co., Inc.,
5.482%, due 05/21/12 | | | 5,295,938 | | |
| | | | 9,228,958 | | |
| | | | | Insurance: 0.4% | |
| | 324,192 | | | @@,P,S | | Aegon NV,
6.375%, due 06/15/15 | | | 6,402,792 | | |
| | 126,500 | | | @@,P,S | | Aegon NV - Series 1,
5.866%, due 12/15/10 | | | 2,245,375 | | |
| | 285,147 | | | P,S | | Metlife, Inc.,
6.500%, due 09/15/10 | | | 6,227,610 | | |
| | | | 14,875,777 | | |
| | | | | Sovereign: 0.1% | |
| | 68,000 | | | P,S | | Fannie Mae,
5.580%, due 09/30/12 | | | 1,547,000 | | |
| | | | 1,547,000 | | |
Total Preferred Stock
(Cost $38,622,157) | | | 30,339,880 | | |
Total Long-Term Investments
(Cost $3,492,575,090) | | | 3,436,872,286 | | |
| Shares | | | | | | Value | |
| SHORT-TERM INVESTMENTS: 28.0% | | | |
| | | | | Mutual Fund: 1.7% | |
| | 58,316,000 | | | **,S | | ING Institutional Prime
Money Market Fund | | $ | 58,316,000 | | |
Total Mutual Fund
(Cost $58,316,000) | | | 58,316,000 | | |
Principal
Amount | | | | | | Value | |
| | | | | Repurchase Agreement: 0.2% | |
| $ | 6,897,000 | | | S | | Goldman Sachs Repurchase
Agreement dated
12/31/07, 4.150%,
due 01/02/08, $6,898,590
to be received upon
repurchase (Collateralized
by $6,427,000 Federal
Home Loan Mortgage
Corporation, 5.750%,
Market Va lue plus
accrued interest
$7,035,276, due 01/15/12) | | | 6,897,000 | | |
Total Repurchase Agreement
(Cost $6,897,000) | | | 6,897,000 | | |
| | | | | Securities Lending Collateralcc: 26.1% | |
| | 872,460,480 | | | | | Bank of New York
Mellon Corp. Institutional
Cash Reserves | | | 872,460,480 | | |
Total Securities Lending
Collateral
(Cost $872,460,480) | | | 872,460,480 | | |
Total Short-Term Investments
(Cost $937,673,480) | | | 937,673,480 | | |
Total Investments in
Securities (Cost
$4,430,248,570)* | | | 130.7 | % | | $ | 4,374,545,766 | | |
Other Assets and
Liabilities - Net | | | (30.7 | ) | | | (1,027,875,553 | ) | |
| Net Assets | | | 100.0 | % | | $ | 3,346,670,213 | | |
@@ Foreign Issuer
MASTR Mortgage Asset Securitization Transaction, Inc.
# Securities with purchases pursuant to Rule 144A or section 4(2), under the Securities Act of 1933 and may not be resold subject to that rule except to qualified institutional buyers. Unless otherwise noted, these securities have been determined to be liquid under the guidelines established by the Funds' Board of Directors/Trustees.
C Bond may be called prior to maturity date.
P Preferred Stock may be called prior to convertible date.
cc Securities purchased with cash collateral for securities loaned.
W When-issued or delayed delivery security
S All or a portion of this security is segregated for certain derivatives, when-issued or delayed delivery securities and forward currency exchange contracts.
I Illiquid security
L Loaned security, a portion or all of the security is on loan at December 31, 2007.
** Investment in affiliate
^ Interest Only (IO) Security
Z Indicates Zero Coupon Bond; rate shown reflects current effective yield.
BRL Brazilian Real
See Accompanying Notes to Financial Statements
107
PORTFOLIO OF INVESTMENTS
ING VP INTERMEDIATE BOND PORTFOLIO AS OF DECEMBER 31, 2007 (CONTINUED)
* Cost for federal income tax purposes is $4,433,119,083
Net unrealized depreciation consists of:
| Gross Unrealized Appreciation | | $ | 17,461,973 | | |
| Gross Unrealized Depreciation | | | (76,035,290 | ) | |
| Net Unrealized Depreciation | | $ | (58,573,317 | ) | |
At December 31, 2007 the following forward foreign currency contracts were outstanding for ING VP Intermediate Bond Portfolio:
| Currency | | Buy/Sell | | Settlement
Date | | In
Exchange
For | | Value | | Unrealized
Appreciation/
(Depreciation) | |
| | | | | | | | USD | | | | | | | | | | |
Euro
EUR 22,361,292 | | Buy | | 1/14/08 | | | 32,749,521 | | | | 32,702,086 | | | $ | (47,435 | ) | |
Euro
EUR 22,250,869 | | Buy | | 1/14/08 | | | 32,580,902 | | | | 32,540,599 | | | | (40,303 | ) | |
| | | $ | (87,738 | ) | |
Brazil Real
BRL 7,085,400 | | Sell | | 1/31/08 | | | 3,881,135 | | | | 3,961,074 | | | $ | (79,939 | ) | |
Euro
EUR 22,361,292 | | Sell | | 1/14/08 | | | 32,658,980 | | | | 32,702,086 | | | | (43,106 | ) | |
Euro
EUR 22,250,869 | | Sell | | 1/14/08 | | | 32,658,980 | | | | 32,540,599 | | | | 118,381 | | |
British Pound
Sterling
GBP 32,425,300 | | Sell | | 2/14/08 | | | 66,257,210 | | | | 64,464,467 | | | | 1,792,744 | | |
| | | $ | 1,788,080 | | |
ING VP Intermediate Bond Portfolio Open Futures Contracts on December 31, 2007:
Contract
Description | | Number of
Contracts | | Notional
Market Value | | Expiration
Date | | Unrealized
Appreciation/
(Depreciation) | |
| Long Contracts | |
| 90-Day Eurodollar | | | 1,859 | | | $ | 445,067,838 | | | 03/17/08 | | $ | 2,173,246 | | |
| 90-Day Eurodollar | | | 3,313 | | | | 799,344,075 | | | 09/15/08 | | | 2,977,385 | | |
| 90-Day Sterling | | | 569 | | | | 134,460,173 | | | 09/17/08 | | | 128,261 | | |
| 90-Day Sterling | | | 569 | | | | 134,700,862 | | | 12/17/08 | | | 211,575 | | |
Australia 10-Year
Bond | | | 519 | | | | 44,518,259 | | | 03/17/08 | | | (131,900 | ) | |
Canada 10-Year
Bond | | | 413 | | | | 48,089,528 | | | 03/19/08 | | | (321,241 | ) | |
| Euro-Bund | | | 262 | | | | 43,327,661 | | | 03/06/08 | | | (930,641 | ) | |
| Euro-Schatz | | | 721 | | | | 108,950,619 | | | 03/06/08 | | | (521,246 | ) | |
| Long Gilt | | | 211 | | | | 46,298,531 | | | 03/27/08 | | | (186,012 | ) | |
U.S. Treasury 2-Year
Note | | | 1,648 | | | | 346,492,000 | | | 03/31/08 | | | 1,282,505 | | |
U.S. Treasury 5-Year
Note | | | 508 | | | | 56,022,875 | | | 03/31/08 | | | 238,832 | | |
| | | $ | 4,920,764 | | |
| Short Contracts | |
| 90-Day Eurodollar | | | 3,313 | | | $ | (798,018,875 | ) | | 09/14/09 | | $ | (3,423,787 | ) | |
| 90-Day Sterling | | | 569 | | | | (134,729,178 | ) | | 09/16/09 | | | (316,590 | ) | |
| 90-Day Sterling | | | 569 | | | | (134,644,229 | ) | | 12/16/09 | | | (267,736 | ) | |
| Fed Fund 30-Day | | | 403 | | | | (161,322,051 | ) | | 03/31/08 | | | (573,660 | ) | |
| Fed Fund 30-Day | | | 403 | | | | (161,456,395 | ) | | 04/30/08 | | | (715,189 | ) | |
| Fed Fund 30-Day | | | 310 | | | | (124,397,451 | ) | | 05/30/08 | | | (914,001 | ) | |
| | | $ | (6,210,963 | ) | |
ING VP Intermediate Bond Portfolio Interest Rate Swap Agreements Outstanding on December 31, 2007:
| | | Termination
Date | | Notional
Principal
Amount | | Unrealized
Appreciation/
(Depreciation) | |
Receive a fixed rate
equal to 4.04221%
and pay a floating rate
based on 3-month
USD-LIBOR
Counterparty:
Citibank N.A., New York | | 12/13/09 | | USD | 173,948,000 | | | $ | 511,664 | | |
Receive a floating rate
based on 3-month
USD-LIBOR and
pay a fixed rate
equal to 4.80031%
Counterparty:
Citibank N.A., New York | | 12/13/17 | | USD | 41,434,000 | | | | (410,063 | ) | |
| | | | | $ | 101,601 | | |
See Accompanying Notes to Financial Statements
108
PORTFOLIO OF INVESTMENTS
ING VP INTERMEDIATE BOND PORTFOLIO AS OF DECEMBER 31, 2007 (CONTINUED)
ING VP Intermediate Bond Portfolio Credit Default Swap Agreements Outstanding on December 31, 2007:
| Counterparty | | Reference
Entity/Obligation | | Buy/Sell
Protection | | (Pay)/Receive
Fixed Rate | | Termination
Date | | Notional
Amount | | Unrealized
Appreciation/
(Depreciation) | |
| Barclays Bank PLC | | Alcoa Inc. 5.375%, 01/15/13 | | Buy | | | (0.390 | )% | | 09/20/12 | | USD | 5,827,000 | | | $ | 16,901 | | |
Citibank N.A.,
New York | | Alcoa Inc. 5.375%, 01/15/13 | | Buy | | | (0.570 | )% | | 12/20/17 | | USD | 14,942,000 | | | | 76,919 | | |
JPMorgan
Chase Bank N.A.,
New York | | Alcoa Inc. 5.375%, 01/15/13 | | Buy | | | (0.430 | )% | | 09/20/12 | | USD | 3,153,000 | | | | 3,729 | | |
Lehman Brothers
Special Financing Inc. | | Alcoa Inc. 5.375%, 01/15/13 | | Buy | | | (0.400 | )% | | 09/20/12 | | USD | 6,305,000 | | | | 15,580 | | |
| UBS AG | | Australia and New Zealand Banking
Group 4.450%, 02/05/15 | | Buy | | | (0.350 | )% | | 09/20/17 | | USD | 5,233,000 | | | | 25,918 | | |
| UBS AG | | Australia and New Zealand Banking
Group 4.450%, 02/05/15 | | Buy | | | (0.510 | )% | | 09/20/17 | | USD | 5,067,000 | | | | 78,320 | | |
Citibank N.A.,
New York | | Bank of Scotland 5.125%, 12/05/13 | | Buy | | | (0.320 | )% | | 09/20/17 | | USD | 6,645,000 | | | | 322,905 | | |
Citibank N.A.,
New York | | Bank of Scotland 5.125%, 12/05/13 | | Buy | | | (0.660 | )% | | 09/20/17 | | USD | 6,826,000 | | | | 155,048 | | |
Citibank N.A.,
New York | | Bank of Scotland 5.125%, 12/05/13 | | Buy | | | (0.650 | )% | | 09/20/17 | | USD | 3,151,000 | | | | 73,971 | | |
| UBS AG | | Bank of Scotland 5.125%, 12/05/13 | | Buy | | | (0.410 | )% | | 09/20/17 | | USD | 5,233,000 | | | | 218,442 | | |
Merrill Lynch
International | | Belo Corp. 7.750%, 06/01/27 | | Buy | | | (2.050 | )% | | 12/20/17 | | USD | 6,001,000 | | | | 158,401 | | |
Citibank N.A.,
New York | | Belo Corp. 8.000%, 11/01/08 | | Buy | | | (0.930 | )% | | 09/20/12 | | USD | 3,505,000 | | | | 144,356 | | |
Citibank N.A.,
New York | | Belo Corp. 8.000%, 11/01/08 | | Buy | | | (1.400 | )% | | 09/20/14 | | USD | 3,501,000 | | | | 151,967 | | |
Citibank N.A.,
New York | | BNP Paribas 5.250%, 12/17/12 | | Buy | | | (0.250 | )% | | 09/20/17 | | USD | 6,645,000 | | | | 108,823 | | |
Citibank N.A.,
New York | | BNP Paribas 5.250%, 12/17/12 | | Buy | | | (0.520 | )% | | 09/20/17 | | USD | 1,410,000 | | | | (6,691 | ) | |
Citibank N.A.,
New York | | BNP Paribas 5.250%, 12/17/12 | | Buy | | | (0.520 | )% | | 09/20/17 | | USD | 3,151,000 | | | | (14,953 | ) | |
Citibank N.A.,
New York | | CDX.EM.6 Index | | Buy | | | (1.400 | )% | | 12/20/11 | | USD | 9,301,000 | | | | 177,583 | | |
Citibank N.A.,
New York | | CDX.EM.7 Index | | Buy | | | (1.250 | )% | | 06/20/12 | | USD | 17,909,000 | | | | (285,152 | ) | |
Citibank N.A.,
New York | | CDX.EM.7 Index | | Buy | | | (1.250 | )% | | 06/20/12 | | USD | 17,993,000 | | | | (445,949 | ) | |
Citibank N.A.,
New York | | CDX.EM.7 Index | | Buy | | | (1.250 | )% | | 06/20/12 | | USD | 4,550,000 | | | | (14,778 | ) | |
| UBS AG | | CDX.EM.7 Index | | Buy | | | (1.250 | )% | | 06/20/12 | | USD | 14,567,000 | | | | (339,748 | ) | |
| UBS AG | | CDX.EM.7 Index | | Buy | | | (1.250 | )% | | 06/20/12 | | USD | 11,229,000 | | | | (75,675 | ) | |
| UBS AG | | CDX.EM.7 Index | | Buy | | | (1.250 | )% | | 06/20/12 | | USD | 14,271,138 | | | | (304,265 | ) | |
| UBS AG | | CDX.EM.7 Index | | Buy | | | (1.250 | )% | | 06/20/12 | | USD | 11,636,000 | | | | (38,107 | ) | |
| UBS AG | | CDX.NA.HY.8 Index | | Buy | | | (2.750 | )% | | 06/20/12 | | USD | 14,015,000 | | | | (2,572 | ) | |
| UBS AG | | CDX.NA.HY.8 Index | | Sell | | | 2.750 | % | | 06/20/12 | | USD | 13,822,000 | | | | 303,304 | | |
Lehman Brothers
Special Financing Inc. | | CDX.NA.HY.8 Index (15-25% Tranche) | | Buy | | | (4.750 | )% | | 06/20/12 | | USD | 19,199,000 | | | | 567,676 | | |
Citibank N.A.,
New York | | CDX.NA.HY.9 Index | | Buy | | | (3.750 | )% | | 12/20/12 | | USD | 23,547,000 | | | | 813,376 | | |
| UBS AG | | CDX.NA.HY.9 Index | | Buy | | | (3.750 | )% | | 12/20/12 | | USD | 21,957,000 | | | | 271,669 | | |
Lehman Brothers
Special Financing Inc. | | CDX.NA.HY.9 Index (15-25% Tranche) | | Sell | | | 7.050 | % | | 12/20/12 | | USD | 9,600,000 | | | | (58,752 | ) | |
Lehman Brothers
Special Financing Inc. | | CDX.NA.HY.9 Index (15-25% Tranche) | | Sell | | | 6.500 | % | | 12/20/12 | | USD | 11,348,000 | | | | (324,099 | ) | |
Lehman Brothers
Special Financing Inc. | | CDX.NA.HY.9 Index (35-60% Tranche) | | Sell | | | 1.950 | % | | 12/20/12 | | USD | 11,348,000 | | | | (518,104 | ) | |
Lehman Brothers
Special Financing Inc. | | CDX.NA.HY.9 Index (35-60% Tranche) | | Sell | | | 2.600 | % | | 12/20/12 | | USD | 22,617,000 | | | | (387,226 | ) | |
Citibank N.A.,
New York | | CDX.NA.IG.9 Index | | Buy | | | (0.600 | )% | | 12/20/12 | | USD | 7,200,000 | | | | 12,953 | | |
Lehman Brothers
Special Financing Inc. | | CDX.NA.IG.9 Index | | Buy | | | (0.600 | )% | | 12/20/12 | | USD | 22,065,000 | | | | 61,990 | | |
Goldman Sachs
International | | CDX.NA.IG.HVOL.9 Index | | Buy | | | (1.400 | )% | | 12/20/12 | | USD | 61,786,000 | | | | 237,599 | | |
Lehman Brothers
Special Financing Inc. | | CDX.NA.IG.HVOL.9 Index | | Buy | | | (1.400 | )% | | 12/20/12 | | USD | 63,044,000 | | | | 237,530 | | |
Lehman Brothers
Special Financing Inc. | | CDX.NA.IG.HVOL.9 Index | | Buy | | | (1.400 | )% | | 12/20/12 | | USD | 63,044,000 | | | | 242,132 | | |
See Accompanying Notes to Financial Statements
109
PORTFOLIO OF INVESTMENTS
ING VP INTERMEDIATE BOND PORTFOLIO AS OF DECEMBER 31, 2007 (CONTINUED)
| Counterparty | | Reference
Entity/Obligation | | Buy/Sell
Protection | | (Pay)/Receive
Fixed Rate | | Termination
Date | | Notional
Amount | | Unrealized
Appreciation/
(Depreciation) | |
Citibank N.A.,
New York | | Centurytel Inc. 7.875%, 08/15/12 | | Buy | | | (0.730 | )% | | 09/20/12 | | USD | 8,176,000 | | | $ | (63,518 | ) | |
Citibank N.A.,
New York | | Centurytel Inc. 7.875%, 08/15/12 | | Buy | | | (0.720 | )% | | 09/20/12 | | USD | 1,083,000 | | | | (7,950 | ) | |
Merrill Lynch
International | | Centurytel Inc. 7.875%, 08/15/12 | | Buy | | | (0.740 | )% | | 09/20/12 | | USD | 3,114,000 | | | | (25,527 | ) | |
Citibank N.A.,
New York | | CMS Energy Corp. 6.875%, 12/15/15 | | Sell | | | 0.820 | % | | 03/20/12 | | USD | 1,040,000 | | �� | | (14,380 | ) | |
Merrill Lynch
International | | CMS Energy Corp. 6.875%, 12/15/15 | | Sell | | | 0.840 | % | | 03/20/12 | | USD | 5,710,000 | | | | (74,597 | ) | |
Citibank N.A.,
New York | | Computer Sciences Corp.
5.000%, 02/15/13 | | Buy | | | (0.780 | )% | | 09/20/17 | | USD | 12,736,000 | | | | (172,955 | ) | |
Lehman Brothers
Special Financing Inc. | | Countrywide Home Loan
4.000%, 03/22/11 | | Sell | | | 8.700 | % | | 12/20/12 | | USD | 649,000 | | | | (26,618 | ) | |
| UBS AG | | Countrywide Home Loan
4.000%, 03/22/11 | | Sell | | | 9.000 | % | | 12/20/12 | | USD | 649,000 | | | | (21,496 | ) | |
Citibank N.A.,
New York | | Darden Restaurants Inc.
7.125%,02/01/16 | | Buy | | | (0.610 | )% | | 12/20/12 | | USD | 1,660,000 | | | | 17,300 | | |
Morgan Stanley
Capital Services Inc. | | Domtar Corp. (Obligation not
yet specified) | | Buy | | | (2.650 | )% | | 09/20/11 | | USD | 2,758,500 | | | | (55,423 | ) | |
| UBS AG | | Domtar Corp. (Obligation not
yet specified) | | Sell | | | 2.600 | % | | 09/20/11 | | USD | 2,761,000 | | | | 50,865 | | |
| Barclays Bank PLC | | Federative Republic of Brazil
12.250%, 03/06/30 | | Sell | | | 0.240 | % | | 06/20/08 | | USD | 21,978,000 | | | | (13,884 | ) | |
| Barclays Bank PLC | | Federative Republic of Brazil
12.250%, 03/06/30 | | Buy | | | (0.725 | )% | | 06/20/12 | | USD | 7,693,000 | | | | 63,529 | | |
| Barclays Bank PLC | | Federative Republic of Brazil
12.250%, 03/06/30 | | Buy | | | (1.600 | )% | | 08/20/12 | | USD | 5,850,000 | | | | (156,766 | ) | |
Citibank N.A.,
New York | | Federative Republic of Brazil
12.250%, 03/06/30 | | Sell | | | 0.240 | % | | 07/20/08 | | USD | 14,080,000 | | | | (10,431 | ) | |
Citibank N.A.,
New York | | Federative Republic of Brazil
12.250%, 03/06/30 | | Buy | | | (0.740 | )% | | 07/20/12 | | USD | 3,522,000 | | | | 28,664 | | |
Lehman Brothers
Special Financing Inc. | | Federative Republic of Brazil
12.250%, 03/06/30 | | Buy | | | (0.800 | )% | | 07/20/12 | | USD | 6,292,000 | | | | 36,738 | | |
| UBS AG | | Federative Republic of Brazil
12.250%, 03/06/30 | | Buy | | | (0.780 | )% | | 07/20/12 | | USD | 14,517,500 | | | | 96,654 | | |
| UBS AG | | Federative Republic of Brazil
12.250%, 03/06/30 | | Buy | | | (0.860 | )% | | 08/20/12 | | USD | 4,079,000 | | | | 15,482 | | |
| UBS AG | | Federative Republic of Brazil
12.250%, 03/06/30 | | Buy | | | (1.150 | )% | | 08/20/12 | | USD | 10,111,000 | | | | (81,638 | ) | |
Citibank N.A.,
New York | | First Data Corp. 4.700%, 08/01/13 | | Buy | | | (5.350 | )% | | 12/20/12 | | USD | 7,311,000 | | | | 128,916 | | |
Citibank N.A.,
New York | | First Data Corp. 4.700%, 08/01/13 | | Buy | | | (5.900 | )% | | 12/20/17 | | USD | 4,133,000 | | | | 89,388 | | |
Lehman Brothers
Special Financing Inc. | | First Data Corp. 4.700%, 08/01/13 | | Buy | | | (5.450 | )% | | 12/20/12 | | USD | 6,002,000 | | | | 83,100 | | |
Merrill Lynch
International | | First Data Corp. 4.700%, 08/01/13 | | Buy | | | (5.450 | )% | | 12/20/12 | | USD | 9,001,000 | | | | 124,622 | | |
Citibank N.A.,
New York | | Ford Motor Co. 6.500%, 08/01/18 | | Sell | | | 6.100 | % | | 12/20/12 | | USD | 3,159,000 | | | | (181,959 | ) | |
| Barclays Bank PLC | | Gannett Co. 6.375%, 04/01/12 | | Buy | | | (0.780 | )% | | 09/20/14 | | USD | 5,612,000 | | | | 58,982 | | |
Citibank N.A.,
New York | | Gannett Co. 6.375%, 04/01/12 | | Buy | | | (0.690 | )% | | 06/20/14 | | USD | 8,772,000 | | | | 126,296 | | |
Citibank N.A.,
New York | | Gannett Co. 6.375%, 04/01/12 | | Buy | | | (0.860 | )% | | 09/20/14 | | USD | 2,745,000 | | | | 16,350 | | |
Citibank N.A.,
New York | | Gannett Co. 6.375%, 04/01/12 | | Buy | | | (0.770 | )% | | 09/20/14 | | USD | 3,501,000 | | | | 38,788 | | |
Citibank N.A.,
New York | | Gannett Co. 6.375%, 04/01/12 | | Buy | | | (0.810 | )% | | 09/20/14 | | USD | 3,503,000 | | | | 30,834 | | |
| Barclays Bank PLC | | Georgia-Pacific Corp. 7.750%, 11/15/29 | | Sell | | | 3.000 | % | | 09/20/12 | | USD | 2,907,000 | | | | (45,708 | ) | |
| UBS AG | | Georgia-Pacific Corp. 7.750%, 11/15/29 | | Sell | | | 3.000 | % | | 09/20/12 | | USD | 1,179,000 | | | | (18,538 | ) | |
See Accompanying Notes to Financial Statements
110
PORTFOLIO OF INVESTMENTS
ING VP INTERMEDIATE BOND PORTFOLIO AS OF DECEMBER 31, 2007 (CONTINUED)
| Counterparty | | Reference
Entity/Obligation | | Buy/Sell
Protection | | (Pay)/Receive
Fixed Rate | | Termination
Date | | Notional
Amount | | Unrealized
Appreciation/
(Depreciation) | |
Citibank N.A.,
New York | | Goldman Sachs Group Inc.
6.600%, 01/15/12 | | Buy | | | (0.600 | )% | | 12/20/12 | | USD | 6,020,000 | | | $ | 20,447 | | |
Citibank N.A.,
New York | | Goldman Sachs Group Inc.
6.600%, 01/15/12 | | Buy | | | (0.960 | )% | | 12/20/12 | | USD | 8,950,000 | | | | (112,156 | ) | |
Citibank N.A.,
New York | | Goldman Sachs Group Inc.
6.600%, 01/15/12 | | Buy | | | (0.640 | )% | | 12/20/12 | | USD | 2,664,000 | | | | 4,334 | | |
Lehman Brothers
Special Financing Inc. | | Goldman Sachs Group Inc.
6.600%, 01/15/12 | | Buy | | | (1.030 | )% | | 12/20/12 | | USD | 6,593,000 | | | | (103,038 | ) | |
Morgan Stanley
Capital Services Inc. | | Goldman Sachs Group Inc.
6.600%, 01/15/12 | | Buy | | | (1.030 | )% | | 12/20/12 | | USD | 5,742,000 | | | | (89,738 | ) | |
Lehman Brothers
Special Financing Inc. | | Harrah's Operating Co., Inc.
5.625%, 06/01/15 | | Sell | | | 0.600 | % | | 03/20/08 | | USD | 28,308,000 | | | | (122,161 | ) | |
| UBS AG | | HSBC Bank PLC 4.250%, 03/18/16 | | Buy | | | (0.400 | )% | | 09/20/17 | | USD | 5,233,000 | | | | 104,904 | | |
| UBS AG | | LCDX.NA.8 Index | | Buy | | | (1.200 | )% | | 06/20/12 | | USD | 27,067,035 | | | | (57,076 | ) | |
| UBS AG | | LCDX.NA.8 Index | | Buy | | | (1.200 | )% | | 06/20/12 | | USD | 4,558,658 | | | | (44,998 | ) | |
| UBS AG | | LCDX.NA.8 Index | | Sell | | | 1.200 | % | | 06/20/12 | | USD | 54,134,069 | | | | (1,130,613 | ) | |
| UBS AG | | LCDX.NA.8 Index | | Sell | | | 1.200 | % | | 06/20/12 | | USD | 14,327,600 | | | | 336,398 | | |
Citibank N.A.,
New York | | Lehman Brothers Hldgs.
6.625%, 01/18/12 | | Buy | | | (1.100 | )% | | 12/20/12 | | USD | 2,664,000 | | | | 13,498 | | |
Citibank N.A.,
New York | | Lehman Brothers Hldgs.
6.625%, 01/18/12 | | Buy | | | (1.100 | )% | | 12/20/12 | | USD | 2,676,000 | | | | 13,558 | | |
| Barclays Bank PLC | | Lloyds TSB Group PLC
5.875%, 07/08/14 | | Buy | | | (0.500 | )% | | 12/20/17 | | USD | 2,859,000 | | | | 6,377 | | |
Citibank N.A.,
New York | | Louisiana-Pacific Corp.
8.875%, 08/15/10 | | Buy | | | (2.000 | )% | | 12/20/12 | | USD | 3,317,000 | | | | 82,447 | | |
Citibank N.A.,
New York | | Louisiana-Pacific Corp.
8.875%, 08/15/10 | | Buy | | | (2.100 | )% | | 12/20/12 | | USD | 5,970,000 | | | | 123,399 | | |
Morgan Stanley
Capital Services Inc. | | Louisiana-Pacific Corp.
8.875%, 08/15/10 | | Buy | | | (2.230 | )% | | 12/20/12 | | USD | 5,742,000 | | | | 87,441 | | |
| UBS AG | | Louisiana-Pacific Corp.
8.875%, 08/15/10 | | Buy | | | (2.000 | )% | | 12/20/12 | | USD | 3,489,000 | | | | 86,722 | | |
Lehman Brothers
Special Financing Inc. | | Macquarie Bank Ltd. FRN, 09/18/15 | | Buy | | | (1.200 | )% | | 12/20/12 | | USD | 22,001,000 | | | | (63,184 | ) | |
Lehman Brothers
Special Financing Inc. | | Macquarie Bank Ltd. FRN, 09/18/15 | | Sell | | | 1.300 | % | | 12/20/17 | | USD | 13,104,000 | | | | (22,810 | ) | |
| Barclays Bank PLC | | Merrill Lynch & Co. 5.000%, 01/15/15 | | Buy | | | (0.860 | )% | | 09/20/12 | | USD | 12,627,000 | | | | 232,821 | | |
| UBS AG | | Merrill Lynch & Co. 5.000%, 01/15/15 | | Buy | | | (0.830 | )% | | 09/20/12 | | USD | 1,392,000 | | | | 27,386 | | |
| Barclays Bank PLC | | Morgan Stanley 6.600%, 04/01/12 | | Buy | | | (1.040 | )% | | 12/20/12 | | USD | 5,724,000 | | | | 8,429 | | |
Citibank N.A.,
New York | | Morgan Stanley 6.600%, 04/01/12 | | Buy | | | (1.080 | )% | | 12/20/12 | | USD | 8,950,000 | | | | (2,426 | ) | |
Citibank N.A.,
New York | | Norbord Inc. 7.250%, 07/01/12 | | Sell | | | 2.200 | % | | 06/20/12 | | USD | 1,495,500 | | | | (110,967 | ) | |
Citibank N.A.,
New York | | Norbord Inc. 7.250%, 07/01/12 | | Buy | | | (2.450 | )% | | 12/20/17 | | USD | 8,363,000 | | | | 754,732 | | |
Credit Suisse
International | | Norbord Inc. 7.250%, 07/01/12 | | Buy | | | (1.450 | )% | | 06/20/14 | | USD | 9,317,000 | | | | 1,179,117 | | |
| UBS AG | | Norbord Inc. 7.250%, 07/01/12 | | Buy | | | (1.500 | )% | | 06/20/12 | | USD | 1,495,500 | | | | 148,769 | | |
| UBS AG | | Norbord Inc. 7.250%, 07/01/12 | | Buy | | | (2.400 | )% | | 12/20/17 | | USD | 3,325,000 | | | | 310,199 | | |
Lehman Brothers
Special Financing Inc. | | Radian Group Inc. 5.375%, 06/15/15 | | Sell | | | 3.900 | % | | 09/20/14 | | USD | 13,533,900 | | | | (939,058 | ) | |
| UBS AG | | Radian Group Inc. 5.375%, 06/15/15 | | Buy | | | (0.850 | )% | | 09/20/14 | | USD | 13,533,900 | | | | 2,682,244 | | |
Lehman Brothers
Special Financing Inc. | | Residential Capital LLC
6.500%, 04/17/13 | | Sell | | | 5.000 | % | | 12/20/12 | | USD | 2,715,000 | | | | 43,608 | | |
Citibank N.A.,
New York | | Royal Bank of Scotland PLC
6.000%, 05/10/13 | | Buy | | | (0.290 | )% | | 09/20/17 | | USD | 6,645,000 | | | | 253,639 | | |
See Accompanying Notes to Financial Statements
111
PORTFOLIO OF INVESTMENTS
ING VP INTERMEDIATE BOND PORTFOLIO AS OF DECEMBER 31, 2007 (CONTINUED)
| Counterparty | | Reference
Entity/Obligation | | Buy/Sell
Protection | | (Pay)/Receive
Fixed Rate | | Termination
Date | | Notional
Amount | | Unrealized
Appreciation/
(Depreciation) | |
| UBS AG | | Royal Bank of Scotland PLC
6.000%, 05/10/13 | | Buy | | | (0.400 | )% | | 09/20/17 | | USD | 5,233,000 | | | $ | 155,544 | | |
Citibank N.A.,
New York | | Simon Property Group LP
6.350%, 08/28/12 | | Buy | | | (0.380 | )% | | 09/20/12 | | USD | 1,445,000 | | | | 46,690 | | |
Citibank N.A.,
New York | | Societe Generale 6.625%, 04/27/15 | | Buy | | | (0.510 | )% | | 09/20/17 | | USD | 1,410,000 | | | | (5,136 | ) | |
Citibank N.A.,
New York | | Societe Generale 6.625%, 04/27/15 | | Buy | | | (0.510 | )% | | 09/20/17 | | USD | 3,151,000 | | | | (11,477 | ) | |
| UBS AG | | Societe Generale 6.625%, 04/27/15 | | Buy | | | (0.380 | )% | | 09/20/17 | | USD | 5,233,000 | | | | 34,111 | | |
| Barclays Bank PLC | | Standard Chartered Bank
3.625%, 02/03/17 | | Buy | | | (0.750 | )% | | 12/20/17 | | USD | 2,859,000 | | | | 1,689 | | |
Citibank N.A.,
New York | | Standard Chartered Bank
3.625%, 02/03/17 | | Buy | | | (0.670 | )% | | 09/20/17 | | USD | 1,410,000 | | | | 9,340 | | |
| UBS AG | | Standard Chartered Bank
3.625%, 02/03/17 | | Buy | | | (0.420 | )% | | 09/20/17 | | USD | 5,233,000 | | | | 135,343 | | |
Goldman Sachs
International | | Temple-Inland Inc. 7.875%, 05/01/12 | | Buy | | | (1.040 | )% | | 03/20/14 | | USD | 2,105,000 | | | | 8,590 | | |
JPMorgan
Chase Bank N.A.,
New York | | Temple-Inland Inc. 7.875%, 05/01/12 | | Buy | | | (0.890 | )% | | 03/20/14 | | USD | 6,218,000 | | | | 74,940 | | |
JPMorgan
Chase Bank N.A.,
New York | | Temple-Inland Inc. 7.875%, 05/01/12 | | Buy | | | (1.020 | )% | | 03/20/14 | | USD | 6,015,000 | | | | 30,938 | | |
Morgan Stanley
Capital Services Inc. | | Temple-Inland Inc. 7.875%, 05/01/12 | | Buy | | | (0.900 | )% | | 03/20/14 | | USD | 5,447,000 | | | | 62,753 | | |
Morgan Stanley
Capital Services Inc. | | Temple-Inland Inc. 7.875%, 05/01/12 | | Buy | | | (1.600 | )% | | 09/20/17 | | USD | 5,813,000 | | | | (136,554 | ) | |
| UBS AG | | Temple-Inland Inc. 7.875%, 05/01/12 | | Buy | | | (0.900 | )% | | 03/20/14 | | USD | 5,820,000 | | | | 67,050 | | |
| UBS AG | | Toll Bros Finance Corp.
6.875%, 11/15/12 | | Buy | | | (1.000 | )% | | 06/20/12 | | USD | 13,620,000 | | | | 857,050 | | |
Citibank N.A.,
New York | | United Mexican States
7.500%, 04/08/33 | | Sell | | | 0.160 | % | | 07/20/08 | | USD | 21,337,000 | | | | (2,212 | ) | |
Citibank N.A.,
New York | | United Mexican States
7.500%, 04/08/33 | | Buy | | | (0.355 | )% | | 07/20/12 | | USD | 2,668,000 | | | | 32,326 | | |
| UBS AG | | United Mexican States
7.500%, 04/08/33 | | Buy | | | (0.620 | )% | | 08/20/12 | | USD | 10,673,000 | | | | 16,356 | | |
Bear Stearns Credit
Products Inc. | | UST Inc. 6.625%, 07/15/12 | | Buy | | | (0.280 | )% | | 03/20/14 | | USD | 15,391,000 | | | | 59,383 | | |
Bear Stearns Credit
Products Inc. | | UST Inc. 6.625%, 07/15/12 | | Buy | | | (0.380 | )% | | 03/20/17 | | USD | 6,156,000 | | | | 25,619 | | |
Merrill Lynch
International | | Washington Mutual, Inc.
5.250%, 09/15/17 | | Buy | | | (3.150 | )% | | 12/20/12 | | USD | 12,608,000 | | | | 464,571 | | |
| UBS AG | | Westpac Banking Corp.
5.875%, 04/29/18 | | Buy | | | (0.350 | )% | | 09/20/17 | | USD | 5,233,000 | | | | 141,978 | | |
| UBS AG | | Westpac Banking Corp.
5.875%, 04/29/18 | | Buy | | | (0.510 | )% | | 09/20/17 | | USD | 5,067,000 | | | | 75,612 | | |
Morgan Stanley
Capital Services Inc. | | Weyerhaeuser Co. 6.750%, 03/15/12 | | Buy | | | (0.880 | )% | | 03/20/17 | | USD | 5,814,000 | | | | 116,760 | | |
Citibank N.A.,
New York | | Weyerhaeuser Co. 6.750%, 03/15/12 | | Buy | | | (0.580 | )% | | 03/20/14 | | USD | 1,083,000 | | | | 26,189 | | |
JPMorgan
Chase Bank N.A.,
New York | | Weyerhaeuser Co. 6.750%, 03/15/12 | | Buy | | | (0.640 | )% | | 03/20/14 | | USD | 6,191,000 | | | | 129,908 | | |
Lehman Brothers
Special Financing Inc. | | Weyerhaeuser Co. 6.750%, 03/15/12 | | Buy | | | (0.570 | )% | | 03/20/14 | | USD | 6,218,000 | | | | 153,678 | | |
Morgan Stanley
Capital Services Inc. | | Weyerhaeuser Co. 6.750%, 03/15/12 | | Buy | | | (0.600 | )% | | 03/20/14 | | USD | 11,701,000 | | | | 270,477 | | |
| Barclays Bank PLC | | Weyerhaeuser Co. 7.125%, 07/15/23 | | Sell | | | 0.780 | % | | 09/20/12 | | USD | 5,906,000 | | | | (33,088 | ) | |
Lehman Brothers
Special Financing Inc. | | Weyerhaeuser Co. 7.125%, 07/15/23 | | Sell | | | 0.780 | % | | 09/20/12 | | USD | 4,980,000 | | | | (27,900 | ) | |
Lehman Brothers
Special Financing Inc. | | Weyerhaeuser Co. 7.125%, 07/15/23 | | Sell | | | 0.770 | % | | 09/20/12 | | USD | 12,455,000 | | | | (75,067 | ) | |
| UBS AG | | Weyerhaeuser Co. 7.125%, 07/15/23 | | Sell | | | 0.790 | % | | 09/20/12 | | USD | 4,096,000 | | | | (21,209 | ) | |
See Accompanying Notes to Financial Statements
112
PORTFOLIO OF INVESTMENTS
ING VP INTERMEDIATE BOND PORTFOLIO AS OF DECEMBER 31, 2007 (CONTINUED)
| Counterparty | | Reference
Entity/Obligation | | Buy/Sell
Protection | | (Pay)/Receive
Fixed Rate | | Termination
Date | | Notional
Amount | | Unrealized
Appreciation/
(Depreciation) | |
Citibank N.A.,
New York | | Williams Partners LP 7.500%, 06/15/11 | | Sell | | | 1.030 | % | | 03/20/12 | | USD | 7,035,351 | | | $ | 84,584 | | |
| UBS AG | | XL Capital Assurance Inc.
(no specified obligation) | | Buy | | | (6.400 | )% | | 12/20/12 | | USD | 1,927,000 | | | | (18,710 | ) | |
| UBS AG | | XL Capital Ltd. 5.250%, 09/15/14 | | Buy | | | (0.610 | )% | | 09/20/16 | | USD | 5,501,000 | | | | 243,548 | | |
| UBS AG | | XL Capital Ltd. 5.250%, 09/15/14 | | Buy | | | (0.610 | )% | | 09/20/16 | | USD | 11,002,000 | | | | 487,097 | | |
| | | | | | | $ | 8,899,156 | | |
See Accompanying Notes to Financial Statements
113
PORTFOLIO OF INVESTMENTS
ING VP MONEY MARKET PORTFOLIO AS OF DECEMBER 31, 2007
Principal
Amount | | | | | | Value | |
| CERTIFICATES OF DEPOSIT: 1.0% | | | |
| $ | 6,800,000 | | | | | Canadian Imperial
Bank of Commerce,
5.000%, due 04/18/08 | | $ | 6,794,517 | | |
| | 10,000,000 | | | | | HBOS Treasury Services,
4.500%, due 01/14/08 | | | 10,002,432 | | |
Total Certificates of Deposit
(Cost $16,796,949) | | | 16,796,949 | | |
| COMMERCIAL PAPER: 41.3% | | | |
| | 8,000,000 | | | # | | ASB Finance Ltd.,
5.100%, due 01/25/08 | | | 7,972,800 | | |
| | 41,500,000 | | | # | | Barton Capital, LLC,
4.800%, due 01/11/08 | | | 41,329,503 | | |
| | 17,500,000 | | | | | BNP Paribas Finance, Inc.,
4.850%, due 03/28/08 | | | 17,294,885 | | |
| | 64,000,000 | | | | | Cafco, LLC,
5.900%, due 01/25/08 | | | 63,647,032 | | |
| | 22,000,000 | | | | | Caisse Nationale des
Caisses d'Epargne et
de Prevoyance,
4.740%, due 02/29/08 | | | 21,829,097 | | |
| | 19,960,000 | | | | | Cargill Global Fund PLC,
5.000%, due 02/28/08 | | | 19,799,211 | | |
| | 28,000,000 | | | | | Ciesco LP,
5.800%, due 01/24/08 | | | 27,895,440 | | |
| | 70,000,000 | | | | | Concord Minutemen
Capital Co., LLC,
5.130%, due 04/11/08 | | | 68,958,062 | | |
| | 64,000,000 | | | | | Crown Point Capital Co.,
6.000%, due 03/14/08 | | | 63,119,333 | | |
| | 29,000,000 | | | | | Jupiter Securities Co., LLC,
5.250%, due 01/22/08 | | | 28,911,567 | | |
| | 70,000,000 | | | # | | Old Line Funding, LLC,
6.050%, due 01/15/08 | | | 69,794,339 | | |
| | 47,650,000 | | | # | | Park Avenue,
4.990%, due 02/19/08 | | | 47,326,971 | | |
| | 53,000,000 | | | | | Thunder Bay Funding, LLC,
5.140%, due 01/10/08 | | | 52,773,610 | | |
| | 51,500,000 | | | # | | Tulip Funding Corp.,
4.860%, due 02/06/08 | | | 51,259,043 | | |
| | 37,000,000 | | | # | | Variable Funding Capital,
4.850%, due 01/10/08 | | | 36,807,964 | | |
| | 1,500,000 | | | | | Westpac Banking Corp.,
4.650%, due 03/20/08 | | | 1,484,694 | | |
| | 44,000,000 | | | | | Windmill Funding Corp.,
5.050%, due 01/04/08 | | | 43,908,217 | | |
| | 43,250,000 | | | # | | Yorktown Capital, LLC,
4.950%, due 01/25/08 | | | 43,074,751 | | |
Total Commercial Paper
(Cost $707,186,519) | | | 707,186,519 | | |
| CORPORATE BONDS/NOTES: 53.5% | | | |
| | 3,500,000 | | | @@ | | Alliance & Leicester PLC,
5.318%, due 01/14/08 | | | 3,500,089 | | |
| | 10,940,000 | | | | | Allstate Financial
Global Funding,
5.402%, due 01/25/08 | | | 10,929,188 | | |
| | 3,500,000 | | | # | | Allstate Financial
Global Funding,
5.476%, due 06/20/08 | | | 3,453,259 | | |
| | 5,750,000 | | | | | Allstate Life
Global Funding Trusts,
4.895%, due 08/27/08 | | | 5,750,352 | | |
Principal
Amount | | | | | | Value | |
| $ | 14,000,000 | | | | | American Express Bank FSB,
5.038%, due 10/16/08 | | $ | 13,977,438 | | |
| | 11,000,000 | | | | | American Express Credit,
4.949%, due 08/20/08 | | | 11,000,122 | | |
| | 4,250,000 | | | | | American Express Credit Corp.,
5.394%, due 05/16/08 | | | 4,213,820 | | |
| | 34,200,000 | | | # | | American General
Finance Corp.,
5.088%, due 09/12/08 | | | 34,203,431 | | |
| | 16,000,000 | | | | | American General
Finance Corp.,
5.329%, due 01/18/08 | | | 16,001,029 | | |
| | 4,000,000 | | | # | | American Honda
Finance Corp.,
4.630%, due 02/04/08 | | | 4,000,311 | | |
| | 10,000,000 | | | # | | American Honda
Finance Corp.,
5.360%, due 03/11/08 | | | 9,978,407 | | |
| | 5,100,000 | | | # | | American International
Group, Inc.,
4.884%, due 06/23/08 | | | 5,097,303 | | |
| | 2,900,000 | | | @@,# | | ANZ National
International Ltd.,
5.302%, due 05/16/08 | | | 2,889,249 | | |
| | 7,100,000 | | | @@,# | | Banco Santander Totta SA,
5.038%, due 08/15/08 | | | 7,100,199 | | |
| | 9,500,000 | | | # | | Bank of New York,
4.925%, due 05/27/08 | | | 9,500,000 | | |
| | 7,800,000 | | | @@,# | | Bank of Scotland PLC,
4.701%, due 08/29/08 | | | 7,800,000 | | |
| | 5,500,000 | | | | | Bank One Corp.,
5.384%, due 08/01/08 | | | 5,518,744 | | |
| | 3,000,000 | | | | | Bank One Corp.,
5.412%, due 06/30/08 | | | 2,960,269 | | |
| | 19,400,000 | | | | | Bear Stearns Cos., Inc.,
4.550%, due 07/02/08 | | | 19,139,219 | | |
| | 12,300,000 | | | | | Bear Stearns Cos., Inc.,
4.640%, due 08/05/08 | | | 12,300,000 | | |
| | 12,750,000 | | | | | Bear Stearns Cos., Inc.,
4.915%, due 08/28/08 | | | 12,750,000 | | |
| | 4,300,000 | | | | | Bear Stearns Cos., Inc.,
5.128%, due 01/15/08 | | | 4,300,195 | | |
| | 4,000,000 | | | | | Bear Stearns Cos., Inc.,
5.161%, due 04/29/08 | | | 4,002,158 | | |
| | 6,850,000 | | | | | Bear Stearns Cos., Inc.,
5.465%, due 01/31/08 | | | 6,841,923 | | |
| | 13,200,000 | | | | | Canadian Imperial
Bank of Commerce,
4.360%, due 02/14/08 | | | 13,200,561 | | |
| | 6,000,000 | | | | | Canadian Imperial
Bank of Commerce,
4.896%, due 08/22/08 | | | 6,000,759 | | |
| | 12,000,000 | | | | | Citigroup Funding, Inc.,
4.360%, due 03/14/08 | | | 12,000,991 | | |
| | 10,000,000 | | | | | Citigroup Funding, Inc.,
4.360%, due 10/03/08 | | | 9,982,507 | | |
| | 2,865,000 | | | L | | Credit Suisse First
Boston USA, Inc.,
5.234%, due 06/02/08 | | | 2,866,513 | | |
| | 20,000,000 | | | | | Credit Suisse First
Boston USA, Inc.,
5.276%, due 12/09/08 | | | 19,992,010 | | |
See Accompanying Notes to Financial Statements
114
PORTFOLIO OF INVESTMENTS
ING VP MONEY MARKET PORTFOLIO AS OF DECEMBER 31, 2007 (CONTINUED)
Principal
Amount | | | | | | Value | |
| CORPORATE BONDS/NOTES (continued) | | | |
| $ | 4,000,000 | | | | | Credit Suisse First
Boston USA, Inc.,
5.456%, due 06/01/08 | | $ | 4,016,641 | | |
| | 20,500,000 | | | | | Credit Suisse Group,
4.320%, due 03/14/08 | | | 20,499,812 | | |
| | 5,865,000 | | | | | Credit Suisse Holdings USA, Inc.,
5.558%, due 03/27/08 | | | 5,874,569 | | |
| | 13,000,000 | | | @@,# | | Danske Bank A/S,
4.919%, due 08/19/08 | | | 12,999,370 | | |
| | 35,000,000 | | | | | Deutsche Bank AG,
4.941%, due 06/19/08 | | | 35,004,139 | | |
| | 9,000,000 | | | @@ | | Deutsche Bank AG,
5.243%, due 01/09/09 | | | 8,974,418 | | |
| | 4,000,000 | | | | | General Electric Capital Corp.,
4.420%, due 01/27/09 | | | 3,972,400 | | |
| | 3,600,000 | | | | | General Electric Capital Corp.,
5.171%, due 03/04/08 | | | 3,600,062 | | |
| | 22,000,000 | | | I | | Goldman Sachs Group LP,
5.268%, due 04/11/08 | | | 22,000,000 | | |
| | 7,000,000 | | | | | Goldman Sachs Group, Inc.,
4.924%, due 12/23/08 | | | 6,950,765 | | |
| | 19,550,000 | | | # | | Goldman Sachs Group, Inc.,
5.098%, due 09/12/08 | | | 19,552,297 | | |
| | 5,750,000 | | | | | Goldman Sachs Group, Inc.,
5.111%, due 07/29/08 | | | 5,729,815 | | |
| | 27,000,000 | | | @@,# | | HBOS Treasury Services PLC,
4.954%, due 06/24/08 | | | 27,000,000 | | |
| | 5,000,000 | | | L | | HSBC Finance Corp.,
5.036%, due 05/09/08 | | | 4,997,751 | | |
| | 28,500,000 | | | | | HSBC Finance Corp.,
5.312%, due 06/17/08 | | | 28,640,588 | | |
| | 3,000,000 | | | | | HSBC Finance Corp.,
5.316%, due 01/15/08 | | | 2,999,235 | | |
| | 6,420,000 | | | | | HSBC Finance Corp.,
5.368%, due 03/11/08 | | | 6,405,139 | | |
| | 2,850,000 | | | | | Lehman Brothers
Holdings, Inc.,
4.733%, due 04/02/08 | | | 2,849,492 | | |
| | 5,700,000 | | | | | Lehman Brothers
Holdings, Inc.,
5.448%, due 08/07/08 | | | 5,636,028 | | |
| | 16,339,000 | | | | | Lehman Brothers
Holdings, Inc.,
5.819%, due 02/01/08 | | | 16,358,547 | | |
| | 1,000,000 | | | | | Marshall & Ilsley Bank,
5.030%, due 02/08/08 | | | 998,301 | | |
| | 6,000,000 | | | # | | MBIA Global Funding, LLC,
4.315%, due 03/14/08 | | | 6,000,000 | | |
| | 19,000,000 | | | # | | MBIA Global Funding, LLC,
4.370%, due 02/15/08 | | | 19,000,892 | | |
| | 6,925,000 | | | # | | MBIA Global Funding, LLC,
5.308%, due 01/11/08 | | | 6,925,169 | | |
| | 4,500,000 | | | | | MBNA Corp.,
5.308%, due 05/05/08 | | | 4,506,766 | | |
| | 42,000,000 | | | | | Merrill Lynch & Co., Inc.,
4.980%, due 08/22/08 | | | 41,974,381 | | |
| | 2,000,000 | | | | | Merrill Lynch & Co., Inc.,
5.091%, due 06/16/08 | | | 1,999,703 | | |
| | 7,000,000 | | | | | Merrill Lynch & Co., Inc.,
5.323%, due 04/21/08 | | | 6,966,179 | | |
| | 10,000,000 | | | | | Morgan Stanley,
4.650%, due 09/03/08 | | | 10,005,506 | | |
Principal
Amount | | | | | | Value | |
| $ | 8,000,000 | | | | | Morgan Stanley,
4.725%, due 09/03/08 | | $ | 8,003,085 | | |
| | 11,500,000 | | | | | Morgan Stanley,
5.114%, due 04/25/08 | | | 11,500,460 | | |
| | 17,000,000 | | | | | Morgan Stanley,
5.201%, due 03/07/08 | | | 17,002,368 | | |
| | 9,900,000 | | | | | Morgan Stanley,
5.270%, due 05/14/08 | | | 9,912,749 | | |
| | 4,450,000 | | | C | | Morgan Stanley,
5.449%, due 04/01/08 | | | 4,430,444 | | |
| | 10,040,000 | | | | | PNC Funding Corp.,
5.353%, due 03/10/08 | | | 10,018,689 | | |
| | 25,500,000 | | | | | Royal Bank of Canada,
3.744%, due 01/22/08 | | | 25,499,185 | | |
| | 11,500,000 | | | | | Royal Bank of Canada,
4.305%, due 04/02/08 | | | 11,499,624 | | |
| | 14,000,000 | | | @@,# | | Royal Bank of Scotland
Group PLC,
4.942%, due 08/20/08 | | | 14,002,192 | | |
| | 12,000,000 | | | @@,# | | Santander US Debt SA,
4.970%, due 09/19/08 | | | 11,986,440 | | |
| | 35,500,000 | | | @@,# | | Santander US Debt
SA Unipersonal,
4.875%, due 02/06/08 | | | 35,500,984 | | |
| | 2,900,000 | | | @@,# | | Santander US Debt
SA Unipersonal,
5.240%, due 10/21/08 | | | 2,896,077 | | |
| | 3,000,000 | | | | | SunTrust Bank,
4.729%, due 10/15/08 | | | 2,983,271 | | |
| | 3,000,000 | | | | | SunTrust Bank,
5.101%, due 06/01/08 | | | 3,013,902 | | |
| | 15,000,000 | | | | | SunTrust Bank,
5.133%, due 06/12/08 | | | 14,998,102 | | |
| | 2,800,000 | | | | | Toyota Motor Credit Corp.,
3.714%, due 03/17/08 | | | 2,799,533 | | |
| | 4,200,000 | | | | | Toyota Motor Credit Corp.,
3.714%, due 03/24/08 | | | 4,199,222 | | |
| | 32,500,000 | | | | | Toyota Motor Credit Corp.,
4.340%, due 06/16/08 | | | 32,503,488 | | |
| | 8,500,000 | | | | | Wachovia Bank NA,
4.320%, due 10/03/08 | | | 8,458,557 | | |
| | 4,600,000 | | | | | Wachovia Corp.,
4.905%, due 10/28/08 | | | 4,593,331 | | |
| | 34,300,000 | | | | | Washington Mutual Bank,
5.239%, due 04/18/08 | | | 34,287,532 | | |
| | 14,000,000 | | | # | | Wells Fargo & Co.,
5.108%, due 09/12/08 | | | 14,004,556 | | |
| | 7,800,000 | | | | | Westpac Banking Corp.,
5.201%, due 07/11/08 | | | 7,800,000 | | |
Total Corporate Bonds/Notes
(Cost $915,581,802) | | | 915,581,802 | | |
See Accompanying Notes to Financial Statements
115
PORTFOLIO OF INVESTMENTS
ING VP MONEY MARKET PORTFOLIO AS OF DECEMBER 31, 2007 (CONTINUED)
Principal
Amount | | | | | | Value | |
| REPURCHASE AGREEMENT: 4.3% | |
| $ | 72,926,000 | | | | | Deutsche Bank Repurchase
Agreement dated 12/31/07,
4.250%, due 01/02/08,
$69,058,000 to be received
upon repurchase
(Collateralized by
$72,943,219 v arious
U.S. Government Agency
Obligations, 5.250%-5.375%,
Market Value plus accrued
interest $74,384,642,
due 08/01/12-09/09/16) | | $ | 72,926,000 | | |
Total Repurchase Agreement
(Cost $72,926,000) | | | 72,926,000 | | |
| | | | | Securities Lending Collateralcc: 0.0% | |
| | 1,010,974 | | | | | Bank of New York
Mellon Corp. Institutional
Cash Reserves | | | 1,010,974 | | |
Total Securities Lending
Collateral
(Cost $1,010,974) | | | 1,010,974 | | |
Total Investments in
Securities
(Cost $1,713,502,244)* | | | 100.1 | % | | $ | 1,713,502,244 | | |
Other Assets and
Liabilities - Net | | | (0.1 | ) | | | (2,362,957 | ) | |
| Net Assets | | | 100.0 | % | | $ | 1,711,139,287 | | |
@@ Foreign Issuer
# Securities with purchases pursuant to Rule 144A or section 4(2), under the Securities Act of 1933 and may not be resold subject to that rule except to qualified institutional buyers. Unless otherwise noted, these securities have been determined to be liquid under the guidelines established by the Funds' Board of Directors/Trustees.
C Bond may be called prior to maturity date.
cc Securities purchased with cash collateral for securities loaned.
I Illiquid security
L Loaned security, a portion or all of the security is on loan at December 31, 2007.
* Cost for federal income tax purposes is the same for financial statement purposes.
See Accompanying Notes to Financial Statements
116
ING VP GLOBAL SCIENCE AND PORTFOLIO OF INVESTMENTS
TECHNOLOGY PORTFOLIO AS OF DECEMBER 31, 2007
| Shares | | | | | | Value | |
| COMMON STOCK: 94.4% | | | |
| | | | | Argentina: 0.3% | |
| | 3,900 | | | @,L | | Mercadolibre, Inc. | | $ | 288,132 | | |
| | | | 288,132 | | |
| | | | | Canada: 3.2% | |
| | 22,100 | | | @,L | | Cognos, Inc. | | | 1,272,297 | | |
| | 16,500 | | | @,L | | Research In Motion Ltd. | | | 1,871,100 | | |
| | | | 3,143,397 | | |
| | | | | China: 1.2% | |
| | 1,500 | | | @ | | Baidu.com ADR | | | 585,585 | | |
| | 13,500 | | | @,L | | Sina Corp. | | | 598,185 | | |
| | | | 1,183,770 | | |
| | | | | Finland: 0.7% | |
| | 18,700 | | | | | Nokia OYJ ADR | | | 717,893 | | |
| | | | 717,893 | | |
| | | | | France: 1.9% | |
| | 2,200 | | | | | Alstom | | | 472,545 | | |
| | 11,900 | | | @,X | | Business Objects SA ADR | | | 724,710 | | |
| | 19 | | | @ | | NicOx SA | | | 304 | | |
| | 6,900 | | | @ | | UbiSoft Entertainment | | | 700,474 | | |
| | | | 1,898,033 | | |
| | | | | Germany: 1.5% | |
| | 23,100 | | | @ | | Infineon Technologies AG ADR | | | 268,884 | | |
| | 11,600 | | | L | | SAP AG ADR | | | 592,180 | | |
| | 3,900 | | | L | | Siemens AG | | | 617,603 | | |
| | | | 1,478,667 | | |
| | | | | Hong Kong: 1.4% | |
| | 67,300 | | | | | ASM Pacific Technology | | | 489,188 | | |
| | 54,700 | | | L | | China Mobile Ltd. | | | 952,573 | | |
| | | | 1,441,761 | | |
| | | | | India: 0.9% | |
| | 34,900 | | | @ | | Bharti Airtel Ltd. | | | 872,938 | | |
| | | | 872,938 | | |
| | | | | Indonesia: 0.7% | |
| | 655,200 | | | | | Telekomunikasi Indonesia Tbk PT | | | 693,621 | | |
| | | | 693,621 | | |
| | | | | Japan: 3.6% | |
| | 7,000 | | | | | Disco Corp. | | | 387,416 | | |
| | 32,700 | | | | | Konica Minolta Holdings, Inc. | | | 573,264 | | |
| | 32,100 | | | | | Kurita Water Industries Ltd. | | | 968,195 | | |
| | 4,300 | | | L | | Nihon Dempa Kogyo Co., Ltd. | | | 208,400 | | |
| | 1,800 | | | | | Nintendo Co., Ltd. | | | 1,056,874 | | |
| | 22,000 | | | | | Sumitomo Metal Mining Co., Ltd. | | | 371,943 | | |
| | | | 3,566,092 | | |
| | | | | Mexico: 0.6% | |
| | 9,000 | | | | | America Movil SA de CV ADR | | | 552,510 | | |
| | | | 552,510 | | |
| | | | | South Korea: 1.3% | |
| | 3,900 | | | @ | | NHN Corp. | | | 929,981 | | |
| | 700 | | | | | Samsung Electronics Co., Ltd. | | | 411,948 | | |
| | | | 1,341,929 | | |
| Shares | | | | | | Value | |
| | | | | Switzerland: 0.7% | |
| | 3,100 | | | | | Roche Holding AG | | $ | 535,884 | | |
| | 1,500 | | | | | Roche Holding Ltd. ADR | | | 129,576 | | |
| | | | 665,460 | | |
| | | | | Taiwan: 2.3% | |
| | 144,500 | | | | | Asustek Computer, Inc. | | | 429,973 | | |
| | 29,119 | | | | | AV TECH Corp. | | | 184,015 | | |
| | 18,900 | | | | | High Tech Computer Corp. | | | 346,105 | | |
| | 499,800 | | | | | Inventec Co., Ltd. | | | 287,235 | | |
| | 20,300 | | | | | MediaTek, Inc. | | | 260,202 | | |
| | 52,259 | | | | | Taiwan Semiconductor
Manufacturing Co., Ltd. ADR | | | 520,500 | | |
| | 288,831 | | | | | Vanguard International
Semiconductor Corp. | | | 214,751 | | |
| | | | 2,242,781 | | |
| | | | | United Kingdom: 0.6% | |
| | 52,900 | | | @ | | Blinkx PLC | | | 28,916 | | |
| | 88,200 | | | | | Meggitt PLC | | | 583,711 | | |
| | | | 612,627 | | |
| | | | | United States: 73.5% | |
| | 21,400 | | | | | Abbott Laboratories | | | 1,201,610 | | |
| | 34,000 | | | @ | | Adobe Systems, Inc. | | | 1,452,820 | | |
| | 25,300 | | | @ | | Agilent Technologies, Inc. | | | 929,522 | | |
| | 4,000 | | | @,L | | Alexion Pharmaceuticals, Inc. | | | 300,120 | | |
| | 8,700 | | | @ | | American Tower Corp. | | | 370,620 | | |
| | 18,000 | | | | | Amphenol Corp. | | | 834,660 | | |
| | 23,000 | | | @ | | Apple, Inc. | | | 4,555,840 | | |
| | 18,700 | | | L | | Applera Corp. - Applied
Biosystems Group | | | 634,304 | | |
| | 23,500 | | | @,L | | Applera Corp. - Celera
Genomics Group | | | 372,945 | | |
| | 25,500 | | | L | | Applied Materials, Inc. | | | 452,880 | | |
| | 17,800 | | | | | AT&T, Inc. | | | 739,768 | | |
| | 16,300 | | | @,L | | Atheros Communications, Inc. | | | 497,802 | | |
| | 16,900 | | | @ | | Autodesk, Inc. | | | 840,944 | | |
| | 15,200 | | | | | Becton Dickinson & Co. | | | 1,270,416 | | |
| | 7,700 | | | @,L | | BioForm Medical, Inc. | | | 52,591 | | |
| | 22,800 | | | @,L | | BioMarin Pharmaceuticals, Inc. | | | 807,120 | | |
| | 13,700 | | | @ | | BMC Software, Inc. | | | 488,268 | | |
| | 19,200 | | | @ | | Broadcom Corp. | | | 501,888 | | |
| | 11,500 | | | @,L | | Cavium Networks, Inc. | | | 264,730 | | |
| | 2,500 | | | @,L | | Cephalon, Inc. | | | 179,400 | | |
| | 9,000 | | | @,L | | Charles River Laboratories
International, Inc. | | | 592,200 | | |
| | 8,200 | | | @,L | | Ciena Corp. | | | 279,702 | | |
| | 68,400 | | | @ | | Cisco Systems, Inc. | | | 1,851,588 | | |
| | 25,900 | | | @ | | Citrix Systems, Inc. | | | 984,459 | | |
| | 13,900 | | | @,L | | Computer Sciences Corp. | | | 687,633 | | |
| | 38,500 | | | | | Corning, Inc. | | | 923,615 | | |
| | 6,200 | | | @,W | | Covance, Inc. | | | 537,044 | | |
| | 10,600 | | | | | CVS Caremark Corp. | | | 421,350 | | |
| | 15,800 | | | @,L | | Cyberonics | | | 207,928 | | |
| | 28,200 | | | @ | | Dell, Inc. | | | 691,182 | | |
| | 25,400 | | | @,L | | DST Systems, Inc. | | | 2,096,770 | | |
| | 31,000 | | | @ | | eBay, Inc. | | | 1,028,890 | | |
| | 21,400 | | | @,L | | Electronic Arts, Inc. | | | 1,249,974 | | |
| | 56,000 | | | @ | | EMC Corp. | | | 1,037,680 | | |
| | 35,300 | | | @,L | | Foundry Networks, Inc. | | | 618,456 | | |
| | 19,400 | | | @ | | Gilead Sciences, Inc. | | | 892,594 | | |
| | 14,000 | | | | | Goodrich Corp. | | | 988,540 | | |
| | 4,600 | | | @ | | Google, Inc. - Class A | | | 3,180,808 | | |
| | 15,200 | | | | | Harris Corp. | | | 952,736 | | |
See Accompanying Notes to Financial Statements
117
ING VP GLOBAL SCIENCE AND PORTFOLIO OF INVESTMENTS
TECHNOLOGY PORTFOLIO AS OF DECEMBER 31, 2007 (CONTINUED)
| Shares | | | | | | Value | |
| | | | | United Kingdom (continued) | |
| | 19,300 | | | @,L | | Harris Stratex Networks, Inc. | | $ | 322,310 | | |
| | 35,300 | | | | | Hewlett-Packard Co. | | | 1,781,944 | | |
| | 8,000 | | | @ | | ImClone Systems, Inc. | | | 344,000 | | |
| | 9,100 | | | @,L | | Integra LifeSciences Holdings Corp. | | | 381,563 | | |
| | 78,800 | | | | | Intel Corp. | | | 2,100,811 | | |
| | 9,000 | | | L | | International Business
Machines Corp. | | | 972,900 | | |
| | 15,100 | | | | | Intersil Corp. | | | 369,648 | | |
| | 4,400 | | | | | Johnson & Johnson | | | 293,480 | | |
| | 35,900 | | | @,L | | Juniper Networks, Inc. | | | 1,191,880 | | |
| | 13,600 | | | | | KLA-Tencor Corp. | | | 654,976 | | |
| | 49 | | | @,L | | Kosan Biosciences, Inc. | | | 176 | | |
| | 38,900 | | | @,L | | Kulicke & Soffa Industries, Inc. | | | 266,854 | | |
| | 9,400 | | | @ | | Lam Research Corp. | | | 406,362 | | |
| | 14,900 | | | @,L | | Liberty Global, Inc. | | | 583,931 | | |
| | 14,600 | | | | | Lockheed Martin Corp. | | | 1,536,796 | | |
| | 19,200 | | | | | Maxim Integrated Products | | | 508,416 | | |
| | 25,100 | | | @ | | McAfee, Inc. | | | 941,250 | | |
| | 8,900 | | | @ | | MedAssets, Inc. | | | 213,066 | | |
| | 10,200 | | | @ | | MEMC Electronic Materials, Inc. | | | 902,598 | | |
| | 18,100 | | | | | Merck & Co., Inc. | | | 1,051,791 | | |
| | 51,900 | | | | | Microsoft Corp. | | | 1,847,640 | | |
| | 5,200 | | | @,L | | Millipore Corp. | | | 380,536 | | |
| | 25,400 | | | | | Motorola, Inc. | | | 407,416 | | |
| | 4,000 | | | @,L | | Myriad Genetics, Inc. | | | 185,680 | | |
| | 21,000 | | | | | National Semiconductor Corp. | | | 475,440 | | |
| | 1,100 | | | @,L | | Netezza Corp. | | | 15,180 | | |
| | 8,900 | | | @,L | | Netlogic Microsystems, Inc. | | | 286,580 | | |
| | 16,500 | | | @ | | Nvidia Corp. | | | 561,330 | | |
| | 14,400 | | | @,L | | Onyx Pharmaceuticals, Inc. | | | 800,928 | | |
| | 58,100 | | | @ | | Oracle Corp. | | | 1,311,898 | | |
| | 10,900 | | | L | | Owens & Minor, Inc. | | | 462,487 | | |
| | 6,500 | | | @,L | | Pharmion Corp. | | | 408,590 | | |
| | 6,700 | | | @,L | | Priceline.com, Inc. | | | 769,562 | | |
| | 12,200 | | | @ | | Progress Software Corp. | | | 410,896 | | |
| | 16,500 | | | | | Qualcomm, Inc. | | | 649,275 | | |
| | 11,000 | | | | | Raytheon Co. | | | 667,700 | | |
| | 12,600 | | | @,L | | Salesforce.com, Inc. | | | 789,894 | | |
| | 21,900 | | | | | Seagate Technology, Inc. | | | 558,450 | | |
| | 13,000 | | | @ | | SenoRx, Inc. | | | 110,500 | | |
| | 14,700 | | | @ | | St. Jude Medical, Inc. | | | 597,408 | | |
| | 13,000 | | | | | Stryker Corp. | | | 971,360 | | |
| | 20,900 | | | @,L | | Sun Microsystems, Inc. | | | 378,917 | | |
| | 25,500 | | | @,L | | Sybase, Inc. | | | 665,295 | | |
| | 26,300 | | | @,L | | Syniverse Holdings, Inc. | | | 409,754 | | |
| | 14,900 | | | @ | | Synopsys, Inc. | | | 386,357 | | |
| | 19,400 | | | | | Texas Instruments, Inc. | | | 647,960 | | |
| | 8,600 | | | | | Textron, Inc. | | | 613,180 | | |
| | 5,900 | | | @,L | | United Therapeutics Corp. | | | 576,135 | | |
| | 14,700 | | | @,L | | Varian Medical Systems, Inc. | | | 766,752 | | |
| | 7,500 | | | @ | | Varian, Inc. | | | 489,750 | | |
| | 27,500 | | | @,L | | VeriSign, Inc. | | | 1,034,275 | | |
| | 13,600 | | | | | Verizon Communications, Inc. | | | 594,184 | | |
| | 6,700 | | | @,L | | VMware, Inc. | | | 569,433 | | |
| | 20,562 | | | @ | | Waters Corp. | | | 1,625,837 | | |
| | 26,700 | | | @ | | Yahoo!, Inc. | | | 621,042 | | |
| | | | 72,843,770 | | |
Total Common Stock
(Cost $78,627,641) | | | 93,543,381 | | |
Principal
Amount | | | | | | Value | |
| SHORT-TERM INVESTMENTS: 23.2% | |
| | | | | U.S. Government Agency
Obligations: 1.6% | | | |
| $ | 1,600,000 | | | Z | | Federal Home Loan Bank,
3.250%, due 01/14/08 | | $ | 1,597,978 | | |
Total U.S. Government Agency
Obligations
(Cost $1,597,978) | | | 1,597,978 | | |
| | | | | Securities Lending Collateralcc: 21.6% | |
| | 21,410,626 | | | | | Bank of New York Mellon Corp.
Institutional Cash Reserves | | | 21,410,626 | | |
Total Securities Lending Collateral
(Cost $21,410,626) | | | 21,410,626 | | |
Total Short-Term Investments
(Cost $23,008,604) | | | 23,008,604 | | |
Total Investments in
Securities
(Cost $101,636,245)* | | | 117.6 | % | | $ | 116,551,985 | | |
Other Assets and
Liabilities - Net | | | (17.6 | ) | | | (17,468,934 | ) | |
| Net Assets | | | 100.0 | % | | $ | 99,083,051 | | |
@ Non-income producing security
ADR American Depositary Receipt
cc Securities purchased with cash collateral for securities loaned.
W When-issued or delayed delivery security
L Loaned security, a portion or all of the security is on loan at December 31, 2007.
Z Indicates Zero Coupon Bond; rate shown reflects current effective yield.
X Fair value determined by ING Funds Valuation Committee appointed by the Funds' Board of Directors/Trustees.
* Cost for federal income tax purposes is $101,713,398
Net unrealized appreciation consists of:
| Gross Unrealized Appreciation | | $ | 17,656,639 | | |
| Gross Unrealized Depreciation | | | (2,818,052 | ) | |
| Net Unrealized Appreciation | | $ | 14,838,587 | | |
| Industry | | Percentage of
Net Assets | |
| Aerospace/Defense | | | 3.8 | % | |
| Biotechnology | | | 2.2 | | |
| Computers | | | 15.8 | | |
| Distribution/Wholesale | | | 0.5 | | |
| Electronics | | | 5.4 | | |
| Environmental Control | | | 1.0 | | |
| Hand/Machine Tools | | | 0.4 | | |
| Healthcare-Products | | | 4.3 | | |
| Healthcare-Services | | | 0.5 | | |
| Internet | | | 10.1 | | |
| Machinery-Diversified | | | 0.5 | | |
| Media | | | 0.6 | | |
| Mining | | | 0.4 | | |
| Miscellaneous Manufacturing | | | 1.8 | | |
| Pharmaceuticals | | | 7.0 | | |
| Retail | | | 0.4 | | |
| Semiconductors | | | 10.7 | | |
| Software | | | 14.2 | | |
| Telecommunications | | | 13.7 | | |
| Toys/Games/Hobbies | | | 1.1 | | |
| Short-Term Investments | | | 23.2 | | |
| Other Assets and Liabilities - Net | | | (17.6 | ) | |
| Net Assets | | | 100.0 | % | |
See Accompanying Notes to Financial Statements
118
ING VP GLOBAL SCIENCE AND PORTFOLIO OF INVESTMENTS
TECHNOLOGY PORTFOLIO AS OF DECEMBER 31, 2007 (CONTINUED)
At December 31, 2007 the following forward foreign currency contracts were outstanding for ING VP Global Science and Technology Portfolio:
| Currency | | Buy/Sell | | Settlement
Date | | In
Exchange
For | | Value | | Unrealized
Appreciation/
(Depreciation) | |
Australia Dollars
AUD 409,000 | | Buy | | 1/23/08 | | | 366,140 | | | | 358,649 | | | $ | (7,491 | ) | |
Australia Dollars
AUD 391,000 | | Buy | | 1/23/08 | | | 335,996 | | | | 342,865 | | | | 6,868 | | |
Switzerland Francs
CHF 780,000 | | Buy | | 1/23/08 | | | 663,098 | | | | 690,025 | | | | 26,928 | | |
Switzerland Francs
CHF 165,000 | | Buy | | 1/23/08 | | | 143,931 | | | | 145,967 | | | | 2,036 | | |
Switzerland Francs
CHF 35,000 | | Buy | | 1/23/08 | | | 30,902 | | | | 30,963 | | | | 61 | | |
EURO
EUR 46,000 | | Buy | | 1/23/08 | | | 67,391 | | | | 67,284 | | | | (107 | ) | |
EURO
EUR 382,000 | | Buy | | 1/23/08 | | | 560,771 | | | | 558,748 | | | | (2,023 | ) | |
British Pound
Sterling
GBP 240,000 | | Buy | | 1/23/08 | | | 484,448 | | | | 477,417 | | | | (7,030 | ) | |
British Pound
Sterling
GBP 554,000 | | Buy | | 1/23/08 | | | 1,105,523 | | | | 1,102,038 | | | | (3,485 | ) | |
Japanese Yen
JPY 66,230,000 | | Buy | | 1/15/08 | | | 574,026 | | | | 593,868 | | | | 19,842 | | |
Japanese Yen
JPY 60,000,000 | | Buy | | 1/23/08 | | | 548,256 | | | | 538,497 | | | | (9,758 | ) | |
Japanese Yen
JPY 1,317,000 | | Buy | | 1/23/08 | | | 11,713 | | | | 11,820 | | | | 107 | | |
Japanese Yen
JPY 21,800,000 | | Buy | | 1/23/08 | | | 193,114 | | | | 195,654 | | | | 2,540 | | |
Korea (South)
Won
KRW 2,394,675,000 | | Buy | | 1/30/08 | | | 2,565,265 | | | | 2,564,578 | | | | (687 | ) | |
Norway Krone
NOK 818,000 | | Buy | | 1/23/08 | | | 146,206 | | | | 150,551 | | | | 4,345 | | |
Singapore Dollars
SGD 557,000 | | Buy | | 1/23/08 | | | 382,203 | | | | 387,645 | | | | 5,442 | | |
| | | $ | 37,588 | | |
Australia Dollars
AUD 800,000 | | Sell | | 1/23/08 | | | 700,440 | | | | 701,514 | | | | (1,074 | ) | |
Switzerland
Francs
CHF 780,000 | | Sell | | 1/23/08 | | | 663,098 | | | | 690,025 | | | | (26,927 | ) | |
Switzerland
Francs
CHF 780,000 | | Sell | | 1/23/08 | | | 664,785 | | | | 690,025 | | | | (25,240 | ) | |
EURO
EUR 1,244,500 | | Sell | | 1/23/08 | | | 1,763,457 | | | | 1,820,320 | | | | (56,864 | ) | |
British Pound
Sterling
GBP 1,064,000 | | Sell | | 1/23/08 | | | 2,165,978 | | | | 2,116,550 | | | | 49,429 | | |
Hong Kong
Dollars
HKD 10,733,000 | | Sell | | 1/23/08 | | | 1,383,049 | | | | 1,377,785 | | | | 5,264 | | |
Japanese Yen
JPY 373,725,751 | | Sell | | 1/23/08 | | | 3,213,988 | | | | 3,354,173 | | | | (140,185 | ) | |
| Currency | | Buy/Sell | | Settlement
Date | | In
Exchange
For | | Value | | Unrealized
Appreciation/
(Depreciation) | |
Japanese Yen
JPY 70,000,000 | | Sell | | 1/23/08 | | | 603,805 | | | | 628,247 | | | $ | (24,442 | ) | |
Japanese Yen
JPY 86,000,000 | | Sell | | 1/23/08 | | | 784,883 | | | | 771,846 | | | | 13,036 | | |
Korea (South)
Won
KRW 2,394,675,000 | | Sell | | 1/30/08 | | | 2,620,425 | | | | 2,564,578 | | | | 55,846 | | |
Singapore Dollars
SGD 557,000 | | Sell | | 1/23/08 | | | 383,444 | | | | 387,645 | | | | (4,202 | ) | |
Taiwan New
Dollars
TWD 90,000,000 | | Sell | | 1/30/08 | | | 2,780,911 | | | | 2,790,092 | | | | (9,181 | ) | |
| | | $ | (164,540 | ) | |
See Accompanying Notes to Financial Statements
119
SHAREHOLDER MEETING INFORMATION (UNAUDITED)
A special meeting of shareholders of ING Variable Portfolios, Inc. was held February 1, 2007, at the offices of ING Funds, 7337 East Doubletree Ranch Road, Scottsdale, AZ 85258.
A brief description of each matter voted upon as well as the results are outlined below:
Matters:
1 To approve a new sub-advisory agreement for the Portfolio between ING Investments, LLC ("ING Investments"), the Portfolio's investment adviser, and BlackRock Advisors, LLC ("BA LLC"), under which BA LLC will serve as sub-adviser to the Portfolio, with no change in the investment adviser, the portfolio management team or the overall management fee paid by the Portfolio to ING Investments.
2 To approve a "Manager-of Managers" arrangement for the Portfolio to permit ING Investments, in its capacity as the Portfolio's investment adviser, subject to prior approval by the Portfolio's Board of Directors/Trustees, to enter into and materially amend agreements with unaffiliated sub-advisers without obtaining approval of the Portfolio's shareholders.
Results:
| | | Proposal* | | Shares voted for | | Shares voted
against or
withheld | | Shares
abstained | | Broker
non-vote | | Total shares
voted | |
ING VP Global Science and
Technology Portfolio | | | 1 | | | | 10,312,248 | | | | 344,995 | | | | 1,698,537 | | | | — | | | | 12,355,780 | | |
ING VP Global Science and
Technology Portfolio | | | 2 | | | | 9,088,860 | | | | 1,516,492 | | | | 1,750,428 | | | | — | | | | 12,355,780 | | |
* All proposals passed at this meeting.
A special meeting of shareholders of ING VP Balanced Portfolio, Inc. was held November 15, 2007, at the offices of ING Funds, 7337 East Doubletree Ranch Road, Scottsdale, AZ 85258.
A brief description of each matter voted upon as well as the results are outlined below:
Matters:
1 To elect a Board of Directors/Trustees.
2 To ratify the selection of KPMG LLP as the registered independent public accounting firm for the Portfolio for the fiscal year beginning January 1, 2008.
3 To approve the following series of proposals to standardize the investment restrictions of the Portfolio:
3A to modify the fundamental investment restriction on concentration.
3B to modify the fundamental investment restriction on diversification.
3C to modify the fundamental investment restriction on borrowing.
3D to modify the fundamental investment restriction on lending.
3E to modify the fundamental investment restriction on underwriting.
3F to modify the fundamental investment restriction on real estate.
3G to modify the fundamental investment restriction on senior securities.
3H to modify the fundamental investment restriction on commodities.
4 To reclassify the investment objective of each Portfolio as non-fundamental.
5 To approve a proposal to implement a "manager-of-managers" arrangement for each of the Portfolios which will permit ING Investments, LLC ("ING Investments" or the "Adviser"), in its capacity as the investment adviser of a Portfolio, subject to prior approval by the Board of the Portfolio, to enter into and materially amend agreements with unaffiliated sub-advisers without obtaining the approval of the Portfolio's shareholders.
Results:
| | | Proposal* | | Shares voted for | | Shares voted
against or
withheld | | Shares
abstained | | Broker
non-vote | | Total shares
voted | |
| Albert E. DePrince, Jr. | | | 1 | | | | 55,236,272 | | | | 1,464,301 | | | | — | | | | — | | | | 56,700,573 | | |
| Maria T. Fighetti | | | 1 | | | | 55,287,562 | | | | 1,413,011 | | | | — | | | | — | | | | 56,700,573 | | |
| Sidney Koch | | | 1 | | | | 55,196,051 | | | | 1,504,522 | | | | — | | | | — | | | | 56,700,573 | | |
| Corine T. Norgaard | | | 1 | | | | 55,234,871 | | | | 1,465,702 | | | | — | | | | — | | | | 56,700,573 | | |
| Joseph E. Obermeyer | | | 1 | | | | 55,284,998 | | | | 1,415,575 | | | | — | | | | — | | | | 56,700,573 | | |
| Edward T. O'Dell | | | 1 | | | | 55,286,310 | | | | 1,414,263 | | | | — | | | | — | | | | 56,700,573 | | |
| Russell Jones | | | 1 | | | | 55,286,300 | | | | 1,414,273 | | | | — | | | | — | | | | 56,700,573 | | |
| Shaun Mathews | | | 1 | | | | 55,283,120 | | | | 1,417,453 | | | | — | | | | — | | | | 56,700,573 | | |
| Fredric (Rick) A. Nelson III | | | 1 | | | | 55,272,550 | | | | 1,428,023 | | | | — | | | | — | | | | 56,700,573 | | |
| ING VP Balanced Portfolio, Inc. | | | 2 | | | | 52,980,357 | | | | 490,607 | | | | 3,229,609 | | | | — | | | | 56,700,573 | | |
| ING VP Balanced Portfolio | | | 3 | A | | | 51,413,726 | | | | 1,254,340 | | | | 4,032,507 | | | | — | | | | 56,700,573 | | |
| ING VP Balanced Portfolio | | | 3 | B | | | 51,389,624 | | | | 1,428,030 | | | | 3,882,919 | | | | — | | | | 56,700,573 | | |
| ING VP Balanced Portfolio | | | 3 | C | | | 51,534,614 | | | | 1,510,318 | | | | 3,655,641 | | | | — | | | | 56,700,573 | | |
| ING VP Balanced Portfolio | | | 3 | D | | | 51,443,872 | | | | 1,390,622 | | | | 3,866,079 | | | | — | | | | 56,700,573 | | |
120
SHAREHOLDER MEETING INFORMATION (UNAUDITED) (CONTINUED)
| | | Proposal* | | Shares voted for | | Shares voted
against or
withheld | | Shares
abstained | | Broker
non-vote | | Total shares
voted | |
| ING VP Balanced Portfolio | | | 3 | E | | | 51,154,255 | | | | 1,381,190 | | | | 4,165,128 | | | | — | | | | 56,700,573 | | |
| ING VP Balanced Portfolio | | | 3 | F | | | 51,066,468 | | | | 1,523,977 | | | | 4,110,128 | | | | — | | | | 56,700,573 | | |
| ING VP Balanced Portfolio | | | 3 | G | | | 51,164,753 | | | | 1,603,351 | | | | 3,932,469 | | | | — | | | | 56,700,573 | | |
| ING VP Balanced Portfolio | | | 3 | H | | | 51,531,424 | | | | 1,426,442 | | | | 3,742,707 | | | | — | | | | 56,700,573 | | |
| ING VP Balanced Portfolio | | | 4 | | | | 51,764,460 | | | | 1,726,369 | | | | 3,209,744 | | | | — | | | | 56,700,573 | | |
| ING VP Balanced Portfolio | | | 5 | | | | 51,109,476 | | | | 2,078,253 | | | | 3,512,844 | | | | — | | | | 56,700,573 | | |
* All proposals passed at this meeting.
A special meeting of shareholders of ING VP Money Market Portfolio was held November 15, 2007, at the offices of ING Funds, 7337 East Doubletree Ranch Road, Scottsdale, AZ 85258.
A brief description of each matter voted upon as well as the results are outlined below:
Matters:
1 To elect a Board of Directors/Trustees.
2 To ratify the selection of KPMG LLP as the registered independent public accounting firm for the Portfolio for the fiscal year beginning January 1, 2008.
3 To approve the following series of proposals to standardize the investment restrictions of the Portfolio:
3A to modify the fundamental investment restriction on concentration.
3B to modify the fundamental investment restriction on diversification.
3C to modify the fundamental investment restriction on borrowing.
3D to modify the fundamental investment restriction on lending.
3E to modify the fundamental investment restriction on underwriting.
3F to modify the fundamental investment restriction on real estate.
3G to modify the fundamental investment restriction on senior securities.
3H to modify the fundamental investment restriction on commodities.
4 To reclassify the investment objective of each Portfolio as non-fundamental
5 To approve a proposal to implement a "manager-of-managers" arrangement for each of the Portfolios which will permit ING Investments, LLC ("ING Investments" or the "Adviser"), in its capacity as the investment adviser of a Portfolio, subject to prior approval by the Board of the Portfolio, to enter into and materially amend agreements with unaffiliated sub-advisers without obtaining the approval of the Portfolio's shareholders.
Results:
| | | Proposal* | | Shares voted for | | Shares voted
against or
withheld | | Shares
abstained | | Broker
non-vote | | Total shares
voted | |
| Albert E. DePrince, Jr. | | | 1 | | | | 61,270,226 | | | | 1,826,186 | | | | — | | | | — | | | | 63,096,412 | | |
| Maria T. Fighetti | | | 1 | | | | 61,262,025 | | | | 1,834,387 | | | | — | | | | — | | | | 63,096,412 | | |
| Sidney Koch | | | 1 | | | | 61,225,168 | | | | 1,871,244 | | | | — | | | | — | | | | 63,096,412 | | |
| Corine T. Norgaard | | | 1 | | | | 61,256,894 | | | | 1,839,518 | | | | — | | | | — | | | | 63,096,412 | | |
| Joseph E. Obermeyer | | | 1 | | | | 61,260,137 | | | | 1,836,275 | | | | — | | | | — | | | | 63,096,412 | | |
| Edward T. O'Dell | | | 1 | | | | 61,226,179 | | | | 1,870,233 | | | | — | | | | — | | | | 63,096,412 | | |
| Russell Jones | | | 1 | | | | 61,271,527 | | | | 1,824,885 | | | | — | | | | — | | | | 63,096,412 | | |
| Shaun Mathews | | | 1 | | | | 61,227,406 | | | | 1,819,006 | | | | — | | | | — | | | | 63,046,412 | | |
| Fredric (Rick) A. Nelson III | | | 1 | | | | 61,264,268 | | | | 1,832,144 | | | | — | | | | — | | | | 63,096,412 | | |
| ING VP Money Market Portfolio | | | 2 | | | | 59,832,138 | | | | 1,808,124 | | | | 1,456,150 | | | | — | | | | 63,096,412 | | |
| ING VP Money Market Portfolio | | | 3 | A | | | 57,762,164 | | | | 3,151,785 | | | | 2,182,463 | | | | — | | | | 63,096,412 | | |
| ING VP Money Market Portfolio | | | 3 | B | | | 58,336,995 | | | | 2,688,140 | | | | 2,071,277 | | | | — | | | | 63,096,412 | | |
| ING VP Money Market Portfolio | | | 3 | C | | | 57,631,057 | | | | 3,160,185 | | | | 2,305,170 | | | | — | | | | 63,096,412 | | |
| ING VP Money Market Portfolio | | | 3 | D | | | 58,311,648 | | | | 2,534,272 | | | | 2,250,492 | | | | — | | | | 63,096,412 | | |
| ING VP Money Market Portfolio | | | 3 | E | | | 58,045,923 | | | | 3,417,144 | | | | 1,633,345 | | | | — | | | | 63,096,412 | | |
| ING VP Money Market Portfolio | | | 3 | F | | | 58,052,301 | | | | 3,095,220 | | | | 1,948,891 | | | | — | | | | 63,096,412 | | |
| ING VP Money Market Portfolio | | | 3 | G | | | 58,062,499 | | | | 3,088,132 | | | | 1,945,781 | | | | — | | | | 63,096,412 | | |
| ING VP Money Market Portfolio | | | 3 | H | | | 58,320,282 | | | | 2,713,838 | | | | 2,062,292 | | | | — | | | | 63,096,412 | | |
| ING VP Money Market Portfolio | | | 4 | | | | 58,818,739 | | | | 2,695,149 | | | | 1,582,524 | | | | — | | | | 63,096,412 | | |
| ING VP Money Market Portfolio | | | 5 | | | | 57,578,989 | | | | 3,717,370 | | | | 1,800,053 | | | | — | | | | 63,096,412 | | |
* All proposals passed at this meeting.
121
SHAREHOLDER MEETING INFORMATION (UNAUDITED) (CONTINUED)
A special meeting of shareholders of ING VP Intermediate Bond Portfolio was held November 15, 2007, at the offices of ING Funds, 7337 East Doubletree Ranch Road, Scottsdale, AZ 85258.
A brief description of each matter voted upon as well as the results are outlined below:
Matters:
1 To elect a Board of Directors/Trustees.
2 To ratify the selection of KPMG LLP as the registered independent public accounting firm for the Portfolio for the fiscal year beginning January 1, 2008.
3 To approve the following series of proposals to standardize the investment restrictions of the Portfolio:
3A to modify the fundamental investment restriction on concentration.
3B to modify the fundamental investment restriction on diversification.
3C to modify the fundamental investment restriction on borrowing.
3D to modify the fundamental investment restriction on lending.
3E to modify the fundamental investment restriction on underwriting.
3F to modify the fundamental investment restriction on real estate.
3G to modify the fundamental investment restriction on senior securities.
3H to modify the fundamental investment restriction on commodities.
4 To reclassify the investment objective of each Portfolio as non-fundamental.
5 To approve a proposal to implement a "manager-of-managers" arrangement for each of the Portfolio which will permit ING Investments, LLC ("ING Investments" or the "Adviser"), in its capacity as the investment adviser of a Portfolio, subject to prior approval by the Board of the Portfolio, to enter into and materially amend agreements with unaffiliated sub-advisers without obtaining the approval of the Portfolio's shareholders.
Results:
| | | Proposal* | | Shares voted for | | Shares voted
against or
withheld | | Shares
abstained | | Broker
non-vote | | Total shares
voted | |
| Albert E. DePrince, Jr. | | | 1 | | | | 182,355,307 | | | | 3,511,983 | | | | — | | | | — | | | | 185,867,290 | | |
| Maria T. Fighetti | | | 1 | | | | 182,139,198 | | | | 3,728,092 | | | | — | | | | — | | | | 185,867,290 | | |
| Sidney Koch | | | 1 | | | | 182,018,178 | | | | 3,849,112 | | | | — | | | | — | | | | 185,867,290 | | |
| Corine T. Norgaard | | | 1 | | | | 182,020,116 | | | | 3,847,174 | | | | — | | | | — | | | | 185,867,290 | | |
| Joseph E. Obermeyer | | | 1 | | | | 182,360,932 | | | | 3,506,358 | | | | — | | | | — | | | | 185,867,290 | | |
| Edward T. O'Dell | | | 1 | | | | 182,072,542 | | | | 3,794,748 | | | | — | | | | — | | | | 185,867,290 | | |
| Russell Jones | | | 1 | | | | 182,347,077 | | | | 3,520,213 | | | | — | | | | — | | | | 185,867,290 | | |
| Shaun Mathews | | | 1 | | | | 182,313,022 | | | | 3,554,268 | | | | — | | | | — | | | | 185,867,290 | | |
| Fredric (Rick) A. Nelson III | | | 1 | | | | 182,349,325 | | | | 3,517,965 | | | | — | | | | — | | | | 185,867,290 | | |
| ING VP Intermediate Bond Portfolio | | | 2 | | | | 178,343,656 | | | | 1,561,054 | | | | 5,962,580 | | | | — | | | | 185,867,290 | | |
| ING VP Intermediate Bond Portfolio | | | 3 | A | | | 169,565,639 | | | | 7,922,951 | | | | 8,378,700 | | | | — | | | | 185,867,290 | | |
| ING VP Intermediate Bond Portfolio | | | 3 | B | | | 170,169,118 | | | | 7,725,211 | | | | 7,972,961 | | | | — | | | | 185,867,290 | | |
| ING VP Intermediate Bond Portfolio | | | 3 | C | | | 168,818,464 | | | | 8,504,013 | | | | 8,544,813 | | | | — | | | | 185,867,290 | | |
| ING VP Intermediate Bond Portfolio | | | 3 | D | | | 168,925,379 | | | | 8,465,124 | | | | 8,476,787 | | | | — | | | | 185,867,290 | | |
| ING VP Intermediate Bond Portfolio | | | 3 | E | | | 169,528,352 | | | | 7,727,140 | | | | 8,611,798 | | | | — | | | | 185,867,290 | | |
| ING VP Intermediate Bond Portfolio | | | 3 | F | | | 169,955,151 | | | | 7,349,738 | | | | 8,562,401 | | | | — | | | | 185,867,290 | | |
| ING VP Intermediate Bond Portfolio | | | 3 | G | | | 170,293,866 | | | | 7,245,969 | | | | 8,327,455 | | | | — | | | | 185,867,290 | | |
| ING VP Intermediate Bond Portfolio | | | 3 | H | | | 170,990,486 | | | | 7,104,629 | | | | 7,772,175 | | | | — | | | | 185,867,290 | | |
| ING VP Intermediate Bond Portfolio | | | 4 | | | | 172,807,763 | | | | 6,124,488 | | | | 6,935,039 | | | | — | | | | 185,867,290 | | |
| ING VP Intermediate Bond Portfolio | | | 5 | | | | 168,238,500 | | | | 10,835,181 | | | | 6,793,609 | | | | — | | | | 185,867,290 | | |
* All proposals passed at this meeting.
A special meeting of shareholders of ING Variable Funds was held November 15, 2007, at the offices of ING Funds, 7337 East Doubletree Ranch Road, Scottsdale, AZ 85258.
A brief description of each matter voted upon as well as the results are outlined below:
Matters:
1 To elect a Board of Directors/Trustees.
2 To ratify the selection of KPMG LLP as the registered independent public accounting firm for the Portfolio for the fiscal year beginning January 1, 2008.
122
SHAREHOLDER MEETING INFORMATION (UNAUDITED) (CONTINUED)
Results:
| | | Proposal* | | Shares voted for | | Shares voted
against or
withheld | | Shares
abstained | | Broker
non-vote | | Total shares
voted | |
| Albert E. DePrince, Jr. | | | 1 | | | | 91,221,024 | | | | 3,177,754 | | | | — | | | | — | | | | 94,398,778 | | |
| Maria T. Fighetti | | | 1 | | | | 91,267,208 | | | | 3,131,570 | | | | — | | | | — | | | | 94,398,778 | | |
| Sidney Koch | | | 1 | | | | 87,294,817 | | | | 7,103,961 | | | | — | | | | — | | | | 94,398,778 | | |
| Corine T. Norgaard | | | 1 | | | | 87,543,220 | | | | 6,855,558 | | | | — | | | | — | | | | 94,398,778 | | |
| Joseph E. Obermeyer | | | 1 | | | | 91,306,818 | | | | 3,091,960 | | | | — | | | | — | | | | 94,398,778 | | |
| Edward T. O'Dell | | | 1 | | | | 87,521,456 | | | | 6,877,322 | | | | — | | | | — | | | | 94,398,778 | | |
| Russell Jones | | | 1 | | | | 90,961,188 | | | | 3,437,590 | | | | — | | | | — | | | | 94,398,778 | | |
| Shaun Mathews | | | 1 | | | | 91,003,235 | | | | 3,395,543 | | | | — | | | | — | | | | 94,398,778 | | |
| Fredric (Rick) A. Nelson III | | | 1 | | | | 87,535,295 | | | | 6,863,483 | | | | — | | | | — | | | | 94,398,778 | | |
| ING Variable Funds | | | 2 | | | | 87,398,594 | | | | 1,877,604 | | | | 5,122,580 | | | | — | | | | 94,398,778 | | |
* All proposals passed at this meeting.
A special meeting of shareholders of ING Variable Portfolios, Inc. was held November 15, 2007, at the offices of ING Funds, 7337 East Doubletree Ranch Road, Scottsdale, AZ 85258.
A brief description of each matter voted upon as well as the results are outlined below:
Matters:
1 To elect a Board of Directors/Trustees.
2 To ratify the selection of KPMG LLP as the registered independent public accounting firm for the Portfolios for the fiscal year beginning January 1, 2008.
3 To approve the following series of proposals to standardize the investment restrictions of the Portfolios:
3A to modify the fundamental investment restriction on concentration.
3B to modify the fundamental investment restriction on diversification.
3C to modify the fundamental investment restriction on borrowing.
3D to modify the fundamental investment restriction on lending.
3E to modify the fundamental investment restriction on underwriting.
3F to modify the fundamental investment restriction on real estate.
3G to modify the fundamental investment restriction on senior securities.
3H to modify the fundamental investment restriction on commodities.
4 To reclassify the investment objective of each Portfolio as non-fundamental.
5 To approve a proposal to implement a "manager-of-managers" arrangement for each of the Portfolios which will permit ING Investments, LLC ("ING Investments" or the "Adviser"), in its capacity as the investment adviser of a Portfolio, subject to prior approval by the Board of the Portfolios, to enter into and materially amend agreements with unaffiliated sub-advisers without obtaining the approval of the Portfolios' shareholders.
Results:
| | | Proposal* | | Shares voted for | | Shares voted
against or
withheld | | Shares
abstained | | Broker
non-vote | | Total shares
voted | |
| Albert E. DePrince, Jr. | | | 1 | | | | 250,857,166 | | | | 8,475,859 | | | | — | | | | — | | | | 259,333,025 | | |
| Maria T. Fighetti | | | 1 | | | | 250,793,862 | | | | 8,539,163 | | | | — | | | | — | | | | 259,333,025 | | |
| Sidney Koch | | | 1 | | | | 250,897,973 | | | | 8,435,052 | | | | — | | | | — | | | | 259,333,025 | | |
| Corine T. Norgaard | | | 1 | | | | 250,770,381 | | | | 8,562,644 | | | | — | | | | — | | | | 259,333,025 | | |
| Joseph E. Obermeyer | | | 1 | | | | 251,335,057 | | | | 7,997,968 | | | | — | | | | — | | | | 259,333,025 | | |
| Edward T. O'Dell | | | 1 | | | | 250,879,308 | | | | 8,453,717 | | | | — | | | | — | | | | 259,333,025 | | |
| Russell Jones | | | 1 | | | | 251,163,020 | | | | 8,170,005 | | | | — | | | | — | | | | 259,333,025 | | |
| Shaun Mathews | | | 1 | | | | 250,937,676 | | | | 8,395,349 | | | | — | | | | — | | | | 259,333,025 | | |
| Fredric (Rick) A. Nelson III | | | 1 | | | | 251,210,575 | | | | 8,122,450 | | | | — | | | | — | | | | 259,333,025 | | |
| ING Variable Portfolios | | | 2 | | | | 229,972,736 | | | | 5,567,926 | | | | 23,792,363 | | | | — | | | | 259,333,025 | | |
| ING VP Small Company Portfolio | | | 3 | A | | | 20,195,948 | | | | 452,393 | | | | 1,956,626 | | | | — | | | | 22,604,967 | | |
| ING VP Small Company Portfolio | | | 3 | B | | | 20,652,291 | | | | 472,439 | | | | 1,480,237 | | | | — | | | | 22,604,967 | | |
| ING VP Small Company Portfolio | | | 3 | C | | | 20,039,050 | | | | 607,824 | | | | 1,958,093 | | | | — | | | | 22,604,967 | | |
| ING VP Small Company Portfolio | | | 3 | D | | | 20,531,449 | | | | 740,186 | | | | 1,333,332 | | | | — | | | | 22,604,967 | | |
| ING VP Small Company Portfolio | | | 3 | E | | | 19,930,873 | | | | 720,859 | | | | 1,953,235 | | | | — | | | | 22,604,967 | | |
| ING VP Small Company Portfolio | | | 3 | F | | | 20,190,427 | | | | 527,359 | | | | 1,887,181 | | | | — | | | | 22,604,967 | | |
| ING VP Small Company Portfolio | | | 3 | G | | | 20,028,725 | | | | 627,623 | | | | 1,948,619 | | | | — | | | | 22,604,967 | | |
| ING VP Small Company Portfolio | | | 3 | H | | | 20,097,593 | | | | 545,528 | | | | 1,961,846 | | | | — | | | | 22,604,967 | | |
| ING VP Small Company Portfolio | | | 4 | | | | 20,667,431 | | | | 1,255,796 | | | | 681,740 | | | | — | | | | 22,604,967 | | |
| ING VP Small Company Portfolio | | | 5 | | | | 19,109,789 | | | | 1,906,275 | | | | 1,588,903 | | | | — | | | | 22,604,967 | | |
| ING VP Value Opportunity Portfolio | | | 3 | A | | | 7,082,236 | | | | 252,774 | | | | 1,090,741 | | | | — | | | | 8,425,752 | | |
123
SHAREHOLDER MEETING INFORMATION (UNAUDITED) (CONTINUED)
| | | Proposal* | | Shares voted for | | Shares voted
against or
withheld | | Shares
abstained | | Broker
non-vote | | Total shares
voted | |
| ING VP Value Opportunity Portfolio | | | 3 | B | | | 7,077,904 | | | | 297,042 | | | | 1,050,806 | | | | — | | | | 8,425,752 | | |
| ING VP Value Opportunity Portfolio | | | 3 | C | | | 7,041,578 | | | | 284,586 | | | | 1,099,588 | | | | — | | | | 8,425,752 | | |
| ING VP Value Opportunity Portfolio | | | 3 | D | | | 7,133,543 | | | | 257,968 | | | | 1,034,241 | | | | — | | | | 8,425,752 | | |
| ING VP Value Opportunity Portfolio | | | 3 | E | | | 7,113,848 | | | | 184,343 | | | | 1,127,561 | | | | — | | | | 8,425,752 | | |
| ING VP Value Opportunity Portfolio | | | 3 | F | | | 7,093,372 | | | | 236,781 | | | | 1,095,599 | | | | — | | | | 8,425,752 | | |
| ING VP Value Opportunity Portfolio | | | 3 | G | | | 7,092,306 | | | | 298,432 | | | | 1,035,014 | | | | — | | | | 8,425,752 | | |
| ING VP Value Opportunity Portfolio | | | 3 | H | | | 7,144,774 | | | | 266,295 | | | | 1,014,682 | | | | — | | | | 8,425,752 | | |
| ING VP Value Opportunity Portfolio | | | 4 | | | | 7,166,801 | | | | 216,407 | | | | 1,042,544 | | | | — | | | | 8,425,752 | | |
| ING VP Value Opportunity Portfolio | | | 5 | | | | 7,012,833 | | | | 343,849 | | | | 1,069,070 | | | | — | | | | 8,425,752 | | |
ING VP Global Science and
Technology Portfolio | | | 3 | A | | | 7,530,114 | | | | 528,611 | | | | 2,296,271 | | | | — | | | | 10,354,996 | | |
ING VP Global Science and
Technology Portfolio | | | 3 | B | | | 7,948,396 | | | | 541,710 | | | | 1,864,890 | | | | — | | | | 10,354,996 | | |
ING VP Global Science and
Technology Portfolio | | | 3 | C | | | 7,951,742 | | | | 549,041 | | | | 1,854,214 | | | | — | | | | 10,354,996 | | |
ING VP Global Science and
Technology Portfolio | | | 3 | D | | | 8,030,497 | | | | 548,632 | | | | 1,775,867 | | | | — | | | | 10,354,996 | | |
ING VP Global Science and
Technology Portfolio | | | 3 | E | | | 8,059,640 | | | | 528,611 | | | | 1,766,745 | | | | — | | | | 10,354,996 | | |
ING VP Global Science and
Technology Portfolio | | | 3 | F | | | 7,540,339 | | | | 545,657 | | | | 2,269,000 | | | | — | | | | 10,354,996 | | |
ING VP Global Science and
Technology Portfolio | | | 3 | G | | | 7,542,196 | | | | 546,145 | | | | 2,266,655 | | | | — | | | | 10,354,996 | | |
ING VP Global Science and
Technology Portfolio | | | 3 | H | | | 7,501,529 | | | | 545,657 | | | | 2,307,810 | | | | — | | | | 10,354,996 | | |
ING VP Global Science and
Technology Portfolio | | | 4 | | | | 8,110,689 | | | | 487,895 | | | | 1,756,412 | | | | — | | | | 10,354,996 | | |
ING VP Global Science and
Technology Portfolio | | | 5 | ** | | | 6,650,964 | | | | 1,001,401 | | | | 2,702,631 | | | | — | | | | 10,354,996 | | |
| ING VP Growth Portfolio | | | 3 | A*** | | | 6,196,340 | | | | 398,286 | | | | 897,532 | | | | — | | | | 7,492,158 | | |
| ING VP Growth Portfolio | | | 3 | B*** | | | 6,313,582 | | | | 348,170 | | | | 830,406 | | | | — | | | | 7,492,158 | | |
| ING VP Growth Portfolio | | | 3 | C*** | | | 6,281,447 | | | | 378,810 | | | | 831,901 | | | | — | | | | 7,492,158 | | |
| ING VP Growth Portfolio | | | 3 | D*** | | | 6,190,873 | | | | 405,694 | | | | 895,591 | | | | — | | | | 7,492,158 | | |
| ING VP Growth Portfolio | | | 3 | E*** | | | 6,188,346 | | | | 412,265 | | | | 891,547 | | | | — | | | | 7,492,158 | | |
| ING VP Growth Portfolio | | | 3 | F*** | | | 6,247,524 | | | | 426,139 | | | | 818,495 | | | | — | | | | 7,492,158 | | |
| ING VP Growth Portfolio | | | 3 | G*** | | | 6,191,399 | | | | 406,756 | | | | 894,002 | | | | — | | | | 7,492,158 | | |
| ING VP Growth Portfolio | | | 3 | H*** | | | 6,201,861 | | | | 391,376 | | | | 898,921 | | | | — | | | | 7,492,158 | | |
| ING VP Growth Portfolio | | | 4 | *** | | | 6,206,514 | | | | 391,872 | | | | 893,771 | | | | — | | | | 7,492,158 | | |
| ING VP Growth Portfolio | | | 5 | *** | | | 6,149,141 | | | | 369,277 | | | | 973,740 | | | | — | | | | 7,492,158 | | |
* All proposals passed at this meeting.
** The Shareholder Meeting for ING VP Global Science and Technology Portfolio, Proposal 5 was adjourned to December 17, 2007.
*** The Shareholder Meeting for ING VP Growth Portfolio was adjourned to December 17, 2007.
A special meeting of shareholders of ING Variable Portfolios, Inc. was held December 17, 2007, at the offices of ING Funds, 7337 East Doubletree Ranch Road, Scottsdale, AZ 85258.
A brief description of each matter voted upon as well as the results are outlined below:
Matters:
3 To approve the following series of proposals to standardize the investment restrictions of the Portfolios:
3A to modify the fundamental investment restriction on concentration.
3B to modify the fundamental investment restriction on diversification.
3C to modify the fundamental investment restriction on borrowing.
3D to modify the fundamental investment restriction on lending.
3E to modify the fundamental investment restriction on underwriting.
3F to modify the fundamental investment restriction on real estate.
3G to modify the fundamental investment restriction on senior securities.
3H to modify the fundamental investment restriction on commodities.
4 To reclassify the investment objective of each Portfolio as non-fundamental.
5 To approve a proposal to implement a "manager-of-managers" arrangement for each of the Portfolios which will permit ING Investments, LLC ("ING Investments" or the "Adviser"), in its capacity as the investment adviser of a Portfolio, subject to prior approval by the Board of the Portfolio, to enter into and materially amend agreements with unaffiliated sub-advisers without obtaining the approval of the Portfolio's shareholders.
124
SHAREHOLDER MEETING INFORMATION (UNAUDITED) (CONTINUED)
Results:
| | | Proposal* | | Shares voted for | | Shares voted
against or
withheld | | Shares
abstained | | Broker
non-vote | | Total shares
voted | |
| ING VP Growth Portfolio | | | 3 | A | | | 7,937,806 | | | | 228,755 | | | | 597,045 | | | | — | | | | 8,763,606 | | |
| ING VP Growth Portfolio | | | 3 | B | | | 8,019,859 | | | | 192,740 | | | | 551,008 | | | | — | | | | 8,763,606 | | |
| ING VP Growth Portfolio | | | 3 | C | | | 7,997,560 | | | | 209,988 | | | | 556,058 | | | | — | | | | 8,763,606 | | |
| ING VP Growth Portfolio | | | 3 | D | | | 7,932,510 | | | | 237,126 | | | | 593,971 | | | | — | | | | 8,763,606 | | |
| ING VP Growth Portfolio | | | 3 | E | | | 7,901,466 | | | | 277,402 | | | | 584,738 | | | | — | | | | 8,763,606 | | |
| ING VP Growth Portfolio | | | 3 | F | | | 7,985,004 | | | | 237,921 | | | | 540,681 | | | | — | | | | 8,763,606 | | |
| ING VP Growth Portfolio | | | 3 | G | | | 7,900,159 | | | | 278,043 | | | | 585,405 | | | | — | | | | 8,763,606 | | |
| ING VP Growth Portfolio | | | 3 | H | | | 7,953,352 | | | | 217,373 | | | | 592,882 | | | | — | | | | 8,763,606 | | |
| ING VP Growth Portfolio | | | 4 | | | | 7,941,852 | | | | 214,874 | | | | 606,879 | | | | — | | | | 8,763,606 | | |
| ING VP Growth Portfolio | | | 5 | | | | 7,904,923 | | | | 207,898 | | | | 650,785 | | | | — | | | | 8,763,606 | | |
ING VP Global Science and
Technology Portfolio | | | 5 | | | | 7,685,748 | | | | 792,022 | | | | 2,201,908 | | | | — | | | | 10,679,678 | | |
* All proposals passed at this meeting.
125
TAX INFORMATION (UNAUDITED)
Dividends paid during the year ended December 31, 2007 were as follows:
| Portfolio Name | | Type | | Per Share Amount | |
| ING VP Balanced Portfolio | |
| Class ADV | | NII | | $ | 0.3935 | | |
| Class I | | NII | | $ | 0.3935 | | |
| Class S | | NII | | $ | 0.3642 | | |
| All Classes | | STCG | | $ | 0.1551 | | |
| All Classes | | LTCG | | $ | 0.4271 | | |
| ING VP Growth and Income Portfolio | |
| Class ADV | | NII | | $ | 0.3286 | | |
| Class I | | NII | | $ | 0.3527 | | |
| Class S | | NII | | $ | 0.3337 | | |
| ING VP Growth Portfolio | |
| Class ADV | | NII | | $ | 0.0194 | | |
| Class I | | NII | | $ | 0.0194 | | |
| Class S | | NII | | $ | 0.0191 | | |
| ING VP Small Company Portfolio | |
| Class I | | NII | | $ | 0.0408 | | |
| Class S | | NII | | $ | — | | |
| All Classes | | STCG | | $ | 0.4048 | | |
| All Classes | | LTCG | | $ | 2.9255 | | |
| Portfolio Name | | Type | | Per Share Amount | |
| ING VP Value Opportunity Portfolio | |
| Class ADV | | NII | | $ | 0.2645 | | |
| Class I | | NII | | $ | 0.2645 | | |
| Class S | | NII | | $ | 0.2230 | | |
| ING VP Intermediate Bond Portfolio | |
| Class ADV | | NII | | $ | 0.4538 | | |
| Class I | | NII | | $ | 0.5096 | | |
| Class S | | NII | | $ | 0.4827 | | |
| ING VP Money Market Portfolio | |
| Class I | | NII | | $ | 0.5534 | | |
NII — Net investment income
STCG — Short-term capital gain
LTCG — Long-term capital gain
Of the ordinary distributions made during the year ended December 31, 2007, the following percentages qualify for the dividends received deduction (DRD) available to corporate shareholders:
| ING VP Balanced Portfolio | | | 30.73 | % | |
| ING VP Growth and Income Portfolio | | | 100.00 | % | |
| ING VP Growth Portfolio | | | 100.00 | % | |
| ING VP Small Company Portfolio | | | 30.79 | % | |
| ING VP Value Opportunity Portfolio | | | 100.00 | % | |
| ING VP Intermediate Bond Portfolio | | | 0.56 | % | |
For the year ended December 31, 2007, the following is a percentage of net investment income dividends paid by the Portfolio that is designated as qualifying dividend income (QDI) subject to reduced income tax rates for individuals:
| ING VP Growth and Income Portfolio | | | 100.00 | % | |
Above figures may differ from those cited elsewhere in this report due to differences in the calculation of income and gains under U.S. generally accepted accounting principles (book) purposes and Internal Revenue Service (tax) purposes.
Shareholders are strongly advised to consult their own tax advisers with respect to the tax consequences of their investments in the Portfolios. In January, shareholders, excluding corporate shareholders, receive an IRS 1099-DIV regarding the federal tax status of the dividends and distributions they received in the calendar year.
126
DIRECTOR/TRUSTEE AND OFFICER INFORMATION (UNAUDITED)
The business and affairs of the Portfolios are managed under the direction of the Board. A director/trustee who is not an interested person of the Funds, as defined in the 1940 Act, is an independent director/trustee ("Non-Interested Director/Trustee"). The Directors/Trustees of the Registrants are listed below. The Statement of Additional Information includes additional information about directors/trustees of the Registrants and is available, without charge, upon request at (800) 992-0180.
Name, Address
and Age | | Position(s)
held
with the
Registrants | | Term of
Office and
Length of
Time
Served(1) | | Principal
Occupation(s)
during the
Past Five Years | | Number of
Portfolios
in Fund
Complex
Overseen by
Director/
Trustee | | Other
Directorships
held by
Director/
Trustee | |
Albert E. DePrince, Jr.
7337 E. Doubletree Ranch Rd.
Scottsdale, Arizona 85258
Age: 66 | | Director/Trustee | | June 1998 - Present | | Professor of Economics and Finance, Middle Tennessee State University (August 1991 - Present). Formerly, Director of Business and Economic Research Center, Middle Tennessee State University (August 1994 - August 2003). | | | 29 | | | Executive Committee, Academy of Economics and Finance (February 2007 - February 2011); President, Academy of Economics and Finance (February 2006 - February 2007); President-Elect, Academy of Economics and Finance (February 2005 - February 2006); First Vice President, Academy of Economics and Finance (February 2004 - February 2005); Second Vice President, Academy of Economics and Finance (February 2003 - February 2004); Academy of Economics and Finance (February 2002 - February 2003); Executive Committee, International Atlantic Economic Society (October 2002 - October 2005); and Tennessee Tax Structure Commission (December 2002 - December 2004); and Director, Business and Economic Research Center, (August 1999 - August 2003). | |
|
Maria Teresa Fighetti
7337 E. Doubletree Ranch Rd.
Scottsdale, Arizona 85258
Age: 64 | | Director/Trustee | | April 1994 - Present | | Retired. Formerly, Associate Commissioner/Attorney, New York City Department of Mental Health (June 1973 - October 2002). | | | 29 | | | None | |
|
Russell Jones
7337 E. Doubletree Ranch Rd.
Scottsdale, Arizona 85258
Age: 63 | | Director/Trustee | | December 2007 - Present | | Senior Vice President, Chief Investment Officer and Treasurer Kaman Corporation (1973 - Present) | | | 27 | | | None | |
|
Sidney Koch
7337 E. Doubletree Ranch Rd.
Scottsdale, Arizona 85258
Age: 72 | | Director/Trustee | | April 1994 - Present | | Retired. Self-Employed Consultant (June 2000 - Present). | | | 29 | | | None | |
|
127
DIRECTOR/TRUSTEE AND OFFICER INFORMATION (UNAUDITED) (CONTINUED)
Name, Address
and Age | | Position(s)
held
with the
Registrants | | Term of
Office and
Length of
Time
Served(1) | | Principal
Occupation(s)
during the
Past Five Years | | Number of
Portfolios
in Fund
Complex
Overseen by
Director/
Trustee | | Other
Directorships
held by
Director/
Trustee | |
Dr. Corine T. Norgaard
7337 E. Doubletree Ranch Rd.
Scottsdale, Arizona 85258
Age: 70 | | Director/Trustee | | June 1991 - Present | | Retired. Formerly, Dean of the Barney School of Business, University of Hartford (August 1996 - June 2004). Formerly, President, Thompson Enterprises (September 2004 - September 2005). | | | 29 | | | Member, Board of Directors, Mass Mutual Corporate and Participation Investors (April 1997 - Present); Mass Mutual Premier Series (December 2004 - Present); and Mass Mutual MML Series II (December 2005 - Present). | |
|
Edward T. O'Dell
7337 E. Doubletree Ranch Rd.
Scottsdale, Arizona 85258
Age: 72 | | Director/Trustee | | June 2002 - Present | | Retired. | | | 29 | | | None | |
|
Joseph E. Obermeyer
7337 E. Doubletree Ranch Rd.
Scottsdale, Arizona 85258
Age: 50 | | Director/Trustee | | January 2003 - Present | | President, Obermeyer & Associates, Inc. (November 1999 - Present). | | | 29 | | | None | |
|
| Directors/Trustees who are "Interested Persons:" | |
|
Shaun Mathews
7337 E. Doubletree Ranch Rd.
Scottsdale, Arizona 85258
Age: 52 | | Director/Trustee | | December 2007 - Present | | President and Chief Executive Officer, ING Investments, LLC (December 2006 - Present), and Head of ING USFS Mutual Funds and Investment Products (October 2004 - Present). Formerly, CMO, ING USFS (April 2002 - October 2004), and Head of Rollover/Payout (October 2001 - December 2003). | | | 27 | | | Mark Twain House & Museum (September 2002 - Present); Connecticut Forum (May 2002 - Present); Capital Community College Foundation (February 2002 - Present); ING Services Holding Company, Inc. (May 2000 - Present); Southland Life Insurance Company (June 2002 - Present); and ING Capital Corporation, LLC, ING Funds Distributor, LLC, ING Funds Services, LLC, ING Investments, LLC and ING Pilgrim Funding, Inc. (March 2006 - Present). | |
|
Fredric (Rick) A. Nelson III
ING Investment Management 230 Park Avenue 13th Floor New York, NY 10169
Age: 51 | | Director/Trustee | | December 2007 - Present | | Vice Chairman and Chief Investment Officer, ING Investment Management Americas. Formerly head of the U.S. Equity Group as well as a member of the Global and U.S. Executive Committees at JP Morgan Fleming Investment Management, Inc until 2003 | | | 27 | | | None | |
|
(1) Directors/Trustees serve until their successors are duly elected and qualified.
(2) "Interested person," as defined in the 1940 Act, by virtue of this Director's/Trustee's affiliation with any of the Portfolios, ING or any of ING's affiliates.
128
DIRECTOR/TRUSTEE AND OFFICER INFORMATION (UNAUDITED) (CONTINUED)
Name, Address
and Age | | Position(s) Held with
Companies | | Term of Office and
Length of Time Served(1) | | Principal Occupation(s) - During the
Past 5 Years | |
| Officers: | |
|
Shaun P. Mathews
7337 East Doubletree Ranch Rd.
Scottsdale, Arizona 85258
Age: 52 | | President and Chief Executive Officer | | December 2006 - Present | | President and Chief Executive Officer, ING Investments, LLC(2) and ING Funds Services, LLC(3) (December 2006 - Present); and Head of ING USFS Mutual Funds and Investment Products (October 2004 - Present). Formerly, CMO, ING USFS (April 2002 - October 2004); and Head of Rollover/Payout (October 2001 - December 2003). | |
|
Michael J. Roland
7337 East Doubletree Ranch Rd.
Scottsdale, Arizona 85258
Age: 49 | | Executive Vice President | | April 2002 - Present | | Head of Mutual Fund Platform (February 2007 - Present); and Executive Vice President, ING Investments, LLC(2) and ING Funds Services, LLC(3) (December 2001 - Present). Formerly, Head of Product Management (January 2005 - January 2007); Chief Compliance Officer, ING Investments, LLC(2) and Directed Services, LLC(5) (October 2004 - December 2005); and Chief Financial Officer and Treasurer, ING Investments, LLC(2) (December 2001 - March 2005). | |
|
Stanley D. Vyner
230 Park Avenue
New York, New York 10169
Age: 57 | | Executive Vice President | | March 2002 - Present | | Executive Vice President, ING Investments, LLC(2) (July 2000 - Present); and Chief Investment Risk Officer, ING Investments, LLC(2) (January 2003 - Present). Formerly, Chief Investment Officer of International Investments (August 2000 - January 2003). | |
|
Joseph M. O'Donnell
7337 East Doubletree Ranch Rd.
Scottsdale, Arizona 85258
Age: 53 | | Executive Vice President
Chief Compliance Officer | | March 2006 - Present
November 2004 - Present | | Chief Compliance Officer of the ING Funds (November 2004 - Present), ING Investments, LLC(2) and Directed Services, LLC(5) (March 2006 - Present); and Executive Vice President of the ING Funds (March 2006 - Present). Formerly, Chief Compliance Officer of ING Life Insurance and Annuity Company (March 2006 - December 2006); Vice President, Chief Legal Counsel, Chief Compliance Officer and Secretary of Atlas Securities, Inc., Atlas Advisers, Inc. and Atlas Funds (October 2001 - October 2004). | |
|
Todd Modic
7337 East Doubletree Ranch Rd
Scottsdale, Arizona 85258
Age: 40 | | Senior Vice President, Chief/Principle Financial Officer and Assistant Secretary | | March 2005 - Present | | Senior Vice President, ING Funds Services, LLC(3) (April 2005 - President). Formerly, Vice President, ING Funds Services, LLC(3) (September 2002 - March 2005); and Director of Financial Reporting, ING Investments, LLC(2) (March 2001 - September 2002) | |
|
Kimberly A. Anderson
7337 East Doubletree Ranch Rd.
Scottsdale, Arizona 85258
Age: 43 | | Senior Vice President | | December 2003 - Present | | Senior Vice President, ING Investments, LLC(2) (October 2003 - Present). Formerly, Vice President and Assistant Secretary, ING Investments, LLC(2) (January 2001 - October 2003). | |
|
Ernest J. C'DeBaca
7337 East Doubletree Ranch Rd.
Scottsdale, Arizona 85258
Age: 38 | | Senior Vice President | | June 2006 - Present | | Senior Vice President, ING Investments, LLC(2) (December 2006 - Present), and ING Funds Services, LLC(3) (April 2006 - Present). Formerly, Counsel, ING Americas, U.S. Legal Services (January 2004 - March 2006); and Attorney-Adviser, U.S. Securities and Exchange Commission (May 2001 - December 2003). | |
|
Robert Terris
7337 East Doubletree Ranch Rd. Scottsdale, Arizona 85258 Age: 37 | | Senior Vice President | | June 2006 - Present | | Senior Vice President, Head of Division Operations, ING Funds (May 2006 - Present); and Vice President, Head of Division Operations, ING Funds Services, LLC(3) (March 2006 - Present). Formerly, Vice President of Administration, ING Funds Services, LLC(3) (October 2001 - March 2006). | |
|
129
DIRECTOR/TRUSTEE AND OFFICER INFORMATION (UNAUDITED) (CONTINUED)
Name, Address
and Age | | Position(s) Held with
Companies | | Term of Office and
Length of Time Served(1) | | Principal Occupation(s) - During the
Past 5 Years | |
Robyn L. Ichilov
7337 East Doubletree Ranch Rd.
Scottsdale, Arizona 85258
Age: 40 | | Vice President and Treasurer | | March 2002 - Present | | Vice President and Treasurer, ING Funds Services, LLC(3) (October 2001 - Present) and ING Investments, LLC(2) (August 1997 - Present). | |
|
William Evans
10 State House Square
Hartford, Connecticut 06103
Age: 35 | | Vice President | | December 2007 - Present | | Vice President, Head of Mutual Fund Advisory Group (April 2007 - Present), Vice President, U.S. Mutual Funds and Investment Products (May 2005 - April 2007), Senior Fund Analyst, U.S. Mutual Funds and Investment Products (May 2002 - May 2005) | |
|
Lauren D. Bensinger
7337 East Doubletree Ranch Rd.
Scottsdale, Arizona 85258
Age: 54 | | Vice President | | March 2003 - Present | | Vice President and Chief Compliance Officer, ING Funds Distributor, LLC(4) (July 1995 - Present); and Vice President (February 1996 - Present); and Director of Compliance, ING Investments, LLC(2) (October 2004 - Present). Formerly, Chief Compliance Officer, ING Investments, LLC(2) (October 2001 - October 2004). | |
|
Maria M. Anderson
7337 East Doubletree Ranch Rd.
Scottsdale, Arizona 85258
Age: 49 | | Vice President | | September 2004 - Present | | Vice President, ING Funds Services, LLC(3) (September 2004 - Present). Formerly, Assistant Vice President, ING Funds Services, LLC(3) (October 2001 - September 2004); and Manager of Fund Accounting and Fund Compliance, ING Investments, LLC(2) (September 1999 - October 2001). | |
|
Denise Lewis
7337 East Doubletree Ranch Rd.
Scottsdale, Arizona 85258
Age: 44 | | Vice President | | April 2007 - Present | | Vice President, ING Funds Services, LLC(3) (December 2006 - Present). Formerly, Senior Vice President, UMB Investment Services Group, LLC (November 2003 - December 2006); and Vice President, Wells Fargo Funds Management, LLC (December 2000 - August 2003). | |
|
Kimberly K. Palmer
7337 East Doubletree Ranch Rd.
Scottsdale, Arizona 85258
Age: 50 | | Vice President | | March 2006 - Present | | Vice President, ING Funds Services, LLC(3) (March 2006 - Present). Formerly, Assistant Vice President, ING Funds Services, LLC(3) (August 2004 - March 2006); Manager, Registration Statements, ING Funds Services, LLC(3) (May 2003 - August 2004); Associate Partner, AMVESCAP PLC (October 2000 - May 2003); and Director of Federal Filings and Blue Sky Filings, INVESCO Funds Group, Inc. (March 1994 - May 2003). | |
|
Susan P. Kinens
7337 East Doubletree Ranch Rd. Scottsdale, Arizona 85258 Age: 31 | | Assistant Vice President | | March 2003 - Present | | Assistant Vice President, ING Funds Services, LLC(3) (December 2002 - Present); and has held various other positions with ING Funds Services, LLC(3) for more than the last five years. | |
|
Theresa K. Kelety
7337 East Doubletree Ranch Rd. Scottsdale, Arizona 85258 Age: 44 | | Secretary | | September 2003 - Present | | Counsel, ING Americas, U.S. Legal Services (April 2003 - Present). Formerly, Senior Associate with Shearman & Sterling (February 2000 - April 2003). | |
|
Huey P. Falgout, Jr.
7337 East Doubletree Ranch Rd. Scottsdale, Arizona 85258 Age: 44 | | Assistant Secretary | | September 2003 - Present | | Chief Counsel, ING Americas, U.S. Legal Services (September 2003 - Present). Formerly, Counsel, ING Americas, U.S. Legal Services (November 2002 - September 2003); and Associate General Counsel of AIG American General (January 1999 - November 2002). | |
|
(1) The officers hold office until the next annual meeting of the Trustees and until their successors shall have been elected and qualified.
(2) ING Investments, LLC was previously named ING Pilgrim Investments, LLC. ING Pilgrim Investments, LLC is the sucessor in interest to ING Pilgrim Investments, Inc., which was previously known as Pilgrim Investments, Inc. and before that was known as Pilgrim America Investments, Inc.
(3) ING Funds Services, LLC was previously named ING Pilgrim Group, LLC. ING Pilgrim Group, LLC is the sucessor in interest to ING Pilgrim Group, Inc., which was previously known as Pilgrim Group, Inc. and before that was known as Pilgrim America Group, Inc.
(4) ING Funds Distributor, LLC is the sucessor in interest to ING Funds Distributor, Inc., which was previously known as ING Pilgrim Securities, Inc., and before that was known as Pilgrim Securities, Inc., and before that was known as Pilgrim America Securities, Inc.
(5) Directed Services, LLC is the sucessor in interest to Directed Services, Inc.
130
ADVISORY CONTRACT APPROVAL DISCUSSION (UNAUDITED)
The Investment Company Act of 1940, as amended (the "1940 Act"), provides, in substance, that each investment advisory agreement and sub-advisory agreement for a mutual fund will terminate automatically after the initial term of the agreement (which term may not exceed two years), unless continuation of the agreement is approved annually by the Board of Trustees or Directors, as the case may be (the "Board") of the fund, including a majority of the Trustees/Directors who have no direct or indirect interest in the agreement and who are not "interested persons" of the fund (the "Independent Trustees"). Consistent with this requirement of the 1940 Act, the Board of ING VP Balanced Portfolio, Inc., ING Strategic Allocation Portfolios, Inc., ING VP Intermediate Bond Portfolio, ING VP Money Market Portfolio, ING Variable Funds, ING Variable Portfolios Inc., ING Series Fund, Inc. and ING GET Funds, with respect to each portfolio series thereof (col lectively, the "Funds") has established a process for considering on an annual basis approval of the continuation of the Investment Management Agreement for each Fund (the "Advisory Agreement") with ING Investments, LLC (the "Adviser") and the sub-advisory agreement for each Fund (collectively, the "Sub-Advisory Agreements") with each sub-adviser of the Funds (the "Sub-Advisers"). Set forth below is a description of the process followed by the Board in considering approval of the continuation of each Advisory and Sub-Advisory Agreement (collectively, the "Agreements"), together with an explanation of many of the factors considered and related conclusions reached by the Board in voting to approve the continuation of each Agreement for an additional one-year period commencing January 1, 2008, followed by specific considerations with respect to each portfolio series covered by this report (each, a "Portfolio").
Overview of the Review Process
At a meeting of the Board held on December 19, 2007, the Board, including all of the Independent Trustees, voted to approve continuation of each of the existing Advisory and Sub-Advisory Agreements for the Funds. Prior to voting such approvals, the Board received the affirmative recommendation of the Contracts Committee of the Board, which is a Committee of the Board comprised of all of the Independent Trustees and exclusively of the Independent Trustees. The Contracts Committee recommended approval of the Advisory and Sub-Advisory Agreements after completing an extensive review of information requested by the Committee from the Adviser and each Sub-Adviser, including the following: (1) comparative performance data for each Fund for various time periods; (2) comparative data regarding management fees, including data regarding the fees charged by the Adviser and Sub-Advisers for managing other mutual funds and institutional accounts using inv estment strategies and techniques similar to those used in managing the Funds; (3) comparative data regarding the total expenses of each Fund; (4) copies of each form of Advisory Agreement and Sub-Advisory Agreement; (5) copies of the codes of ethics of the Adviser and each Sub-Adviser, together with information relating to the manner in which each code is administered; (6) financial statements of the Adviser and each Sub-Adviser; (7) profitability analyses for the Adviser and each Sub-Adviser with respect to each Fund, and all Funds as a group; (8) descriptions of the qualifications of the investment personnel responsible for managing each Fund, their compensation and their responsibilities with respect to managing other accounts or mutual funds; (9) descriptions of the services provided to the Funds, including the investment strategies and techniques used by each Sub-Adviser in managing the Funds; (10) data relating to portfolio turnover and brokerage practices, including practices with respect to the acqu isition of research through "soft dollar" benefits received in connection with the Funds' brokerage; (11) data comparing the performance of certain Funds against "static portfolios" of the Funds over various time periods; (12) descriptions of the policies and procedures of the various service providers of the Funds for protecting the privacy of shareholder information; (13) information relating to projected sales and redemptions of Fund shares and business plans relating to the Adviser's mutual fund platform; (14) descriptions of the business continuity and disaster recovery plans of the Adviser and each Sub-Adviser; (15) descriptions of various compliance programs of the Adviser and Sub-Advisers, including the Adviser's programs for monitoring and enforcing compliance with the Funds' policies with respect to market-timing, late trading and selective portfolio disclosure; (16) independent reports analyzing the quality of the trade execution services performed by Sub-Advisers for the Funds; and (17) other inf ormation relevant to an evaluation of the nature, extent and quality of the services provided by the Adviser and each Sub-Adviser in response to a series of detailed questions posed by independent legal counsel on behalf of the Independent Trustees.
The Contracts Committee began the formal review process in July 2007 when it met separately with independent legal counsel to review the information to be requested from management and the methodology to be used in determining the selected peer groups for comparing performance and expenses. The Contracts Committee then held meetings on October 24-25, 2007, December 11, 2007 and December 17-18, 2007, during which the
131
ADVISORY CONTRACT APPROVAL DISCUSSION (UNAUDITED) (CONTINUED)
Independent Trustees, meeting separately with independent legal counsel, reviewed and evaluated the information described above. As part of the review process, the Contracts Committee also met with representatives from the Adviser and/or the Sub-Advisers to discuss the information provided to the Committee. The Contracts Committee also considered information that had been provided by the Adviser and Sub-Advisers throughout the year at other meetings of the Contracts Committee, the Audit Committee, the Compliance Committee and the full Board.
The Independent Trustees were assisted by Goodwin Procter LLP, their independent legal counsel, throughout the contract review process. The Independent Trustees relied upon the advice of such counsel and their own business judgment in determining the material factors to be considered in evaluating each Advisory and Sub-Advisory Agreement and the weight to be given to each such factor. The conclusions reached by the Independent Trustees were based on a comprehensive evaluation of all of the information provided and were not the result of any one factor. Moreover, each Independent Trustee may have afforded different weight to the various factors in reaching his or her conclusions with respect to each Advisory and Sub-Advisory Agreement.
Nature, Extent and Quality of Services
In considering whether to approve the Advisory and Sub-Advisory Agreements for the Funds for the year commencing January 1, 2008, the Board evaluated the nature, extent and quality of services provided to the Funds by the Adviser and Sub-Advisers. The Board considered the investment management and related services provided by the Adviser and Sub-Advisers, including the quantity and quality of the resources available to provide such services. Among other things, the Board considered the qualifications of the individuals responsible for performing various investment related services.
The Board also considered the quality of the compliance programs of the Adviser and each Sub-Adviser, including the manner in which the Adviser and each Sub-Adviser monitor for compliance with the investment policies and restrictions of a Fund and with the Codes of Ethics of the Funds, the Adviser and the Sub-Advisers with respect to personal trading by employees with access to portfolio information. The Board also considered the actions taken by the Adviser and Sub-Advisers to establish and maintain effective disaster recovery and business continuity plans.
The Board considered the actions taken by the Adviser and its affiliated companies to administer the Funds' policies and procedures for voting proxies, valuing the Funds' assets, selective disclosure of portfolio holdings and preventing late-trading and frequent trading of Fund shares. With respect to these and related compliance matters, the Board also considered the responsiveness of the Adviser and its affiliated companies over the course of the past several years to the inquiries of various regulatory authorities.
The Board also took into account the efforts of the Adviser and its affiliated companies to reduce the expenses of the Funds. With respect to those Funds that are sub-advised by an affiliate of the Adviser, the Board specifically noted that, in recent years, the Adviser and its affiliated companies have significantly reduced the Funds' brokerage costs and portfolio turnover rates, as well as the quantity of research acquired through the use of soft dollars from the Funds' brokerage. The Board also noted the efforts of the Adviser to optimize the number of Funds in the ING complex of mutual funds and to standardize the asset management characteristics and policies across the ING mutual fund platform. Consideration was also given to the benefits that shareholders of the Funds realize because the Funds are part of a larger ING family of mutual funds, including, in most cases, the ability of shareholders to exchange or transfer investments withi n the same class of shares among a wide variety of mutual funds without incurring additional sales charges.
The Board concluded that the nature, extent and quality of advisory and related services provided by the Adviser and each of the Sub-Advisers, taken as a whole, are consistent with the terms of the respective Advisory and Sub-Advisory Agreements and justify the fees paid by the Funds for such services.
Fund Performance
The Board reviewed each Fund's investment performance over various time periods on an absolute basis and relative to the performance of (i) one or more appropriate benchmark indexes (such as the S&P 500 Composite Stock Price Index), (ii) a group of similarly managed mutual funds identified by Lipper, Inc. and/or Morningstar, Inc., and (iii) similarly managed mutual funds within a specified peer group based upon a methodology approved by
132
ADVISORY CONTRACT APPROVAL DISCUSSION (UNAUDITED) (CONTINUED)
the Contracts Committee (each, a "Selected Peer Group"). The Board reviewed comparative performance data for the one-, three-, five- and ten-year periods, where applicable, ending June 30, 2007 and the one-, three-, and five-year periods ending September 30, 2007. Summaries of selected portions of the performance information reviewed by the Board, together with the Board's conclusions regarding the performance of each Portfolio covered by this report, are set forth below under "Fund-by-Fund Analysis."
Management Fees, Sub-Advisory Fees and Expenses
Consideration was given to the contractual investment advisory fee rates, inclusive of administrative fee rates, payable by the Funds to the Adviser and its affiliated companies (referred to collectively as "management fees") and the contractual sub-advisory fee rates payable by the Adviser to each Sub-Adviser for sub-advisory services. As part of its review, the Board considered each Fund's management fee and total expense ratio, as compared to its Selected Peer Group, both before and after giving effect to any undertaking by the Adviser to waive fees and/or limit the total expenses of a Fund. In addition, the Trustees received information regarding the fees charged by each Sub-Adviser to similarly-managed institutional accounts and other mutual funds, if any, and the comparability (or lack thereof) of the services provided by the Sub-Adviser in managing such accounts and other mutual funds to the services provided in managing the Funds. Wi th respect to the Funds sub-advised by an affiliate of the Adviser, the Board evaluated the reasonableness of the total fees received by the Adviser and its affiliate in the aggregate under the Advisory and Sub-Advisory Agreements. With respect to those Funds sub-advised by a Sub-Adviser that is not affiliated with the Adviser, the Board considered the reasonableness of the fees payable to the Sub-Adviser by the Adviser in light of the ability of the Adviser to negotiate such fees on an arm's-length basis. Summaries of selected portions of the fee and expense information reviewed with respect to each Portfolio covered by this report are set forth below under "Fund-by-Fund Analysis." After reviewing the foregoing information, and in light of the nature, extent and quality of the services provided by the Adviser and each Sub-Adviser, the Board concluded with respect to each Fund that the management fee charged to the Fund for advisory, sub-advisory and related services is fair and reasonable and that the total expense ratio of the Fund is reasonable.
Profitability
The Board considered information relating to revenues, expenses, and profits realized by the Adviser and each Sub-Adviser attributable to performing advisory, sub-advisory and administrative services for the Funds. With respect to Funds sub-advised by an unaffiliated Sub-Adviser, the Board did not consider the profitability of the Sub-Adviser to be a material factor because the Board believes that the Adviser negotiates sub-advisory fees with the unaffiliated Sub-Adviser on an arm's-length basis. The Board reviewed profitability data for the Adviser and its affiliated companies, including the distributor of the Funds, relating to (i) each Fund separately, (ii) all Funds as a group, (iii) all "retail" Funds as a group, and (iv) all variable insurance product Funds as a group, in each case for the one-year periods ended December 31, 2006 and December 31, 2005 and the nine-month period ended September 30, 2007. With respect to the Adviser and i ts affiliates, such information was prepared in accordance with a methodology approved by the Contracts Committee. The Board considered the profitability of the Adviser and its affiliated companies attributable to managing and operating each Fund both with and without the profitability of the distributor of the Funds and both before and after giving effect to any expenses incurred by the Adviser or any affiliated company in making revenue sharing or other payments to third parties, including affiliated insurance companies, for distribution and administrative services. With respect to Funds sub-advised by an affiliate of the Adviser, the Board considered the total profits derived by the Adviser and its affiliate in the aggregate attributable to managing and operating each Fund. The Board also considered other direct or indirect benefits that the Adviser and Sub-Advisers, and any affiliated companies thereof, derive from their relationships with the Funds, including the receipt by ING U.S. Financial Services, an affiliate of the Adviser, of fees relating to the offering of bundled financial products, such as annuity contracts, and the receipt by Sub-Advisers of "soft dollar" benefits from the Funds' brokerage. The Board concluded that, in light of the nature, extent and quality of the services provided, the profits realized by the Adviser and its affiliated companies, taken as a whole, with respect to providing advisory, sub-advisory and administrative services for each Fund are reasonable.
Economies of Scale
In considering the reasonableness of the management fee of each Fund, the Board considered the extent to which economies of scale can be expected to be realized by a Fund's Adviser and its affiliated companies, on the one
133
ADVISORY CONTRACT APPROVAL DISCUSSION (UNAUDITED) (CONTINUED)
hand, and by the Fund, on the other hand, as the assets of the Fund increase. The Board noted that the advisory fee schedule for certain Funds includes breakpoints such that, as the assets of the Fund increase, the Fund's management fee will decrease as a percentage of the Fund's total assets. The Board recognized the inherent difficulties in measuring precisely the impact of any economies of scale being realized by the Adviser and its affiliated companies with respect to their management of any one or more Funds. In an effort to determine the extent to which economies of scale, if any, will be realized by the Adviser and its affiliated companies as the assets of the Funds grow, the Board considered the profitability data described above relating to the Adviser and its affiliated companies in light of changes in the assets of the Funds over various time periods. The Board noted that the total assets under management of many Funds have decrea sed during the past several years and concluded that the economies of scale realized by the Adviser and its affiliated companies from managing the Funds have not increased with respect to such Funds. The Board also reviewed information regarding the expense ratio of each Fund in light of changes in the assets of the Funds over various time periods, noting that, as the assets of a Fund increase, the fixed expenses of the Fund, as a percentage of the total assets of the Fund, can be expected to decrease. The Board considered such expense information in light of projections provided by the Adviser with respect to the future growth of assets of the Funds. Based upon the foregoing, the Board concluded that the economies of scale being realized by the Adviser and its affiliated companies do not mandate the implementation of breakpoints or additional breakpoints, as the case may be, with respect to any Fund at this time.
Fund-by-Fund Analysis
In deciding to approve the continuation of each Advisory and Sub-Advisory Agreement for an additional one-year period beginning January 1, 2008, the Board took into account the specific data and factors identified below relating to the performance, fees and expenses of each Fund and actions being taken by the Adviser or Sub-Adviser, as the case may be, with respect to these matters. Except as otherwise indicated, the performance data described below for each Portfolio is for periods ended September 30, 2007 and the management fees and expense data described below are as of June 30, 2007.
ING VP Balanced Portfolio
In evaluating the investment performance of ING VP Balanced Portfolio, the Board noted that the Portfolio underperformed its Morningstar category median for the most recent calendar quarter, year-to-date, one-year, three-year and five-year periods. The Board received performance information relating to a benchmark index of fixed income securities (the "FISB") and equity securities (the "ESB") from which the Board could calculate a composite benchmark index (the "Composite Benchmark") comprised of 60% ESB and 40% FISB. The Board noted that the Portfolio underperformed the Composite Benchmark for all periods presented. The Board considered the fact that the Portfolio is ranked in its Morningstar category in the fourth quintile for the most recent calendar quarter, year-to-date, one-year, three-year, and five-year periods. The Board noted that the Sub-Adviser manages the equity portion of the Portfolio using a quantitative-based model for selec ting stocks based on static factor weightings and that the Sub-Adviser is in the process of developing a model with dynamic factor weightings, which is expected to be implemented in 2008. The Board concluded that appropriate actions are being taken to improve performance and that additional time is needed to evaluate the effectiveness of these actions.
In assessing the reasonableness of the management fee and expense ratio of ING VP Balanced Portfolio, the Board noted that the management fee for the Portfolio is below the median and average management fees of the funds in its Selected Peer Group and that the expense ratio for the Portfolio is below the median and average expense ratios of the funds in its Selected Peer Group.
ING VP Global Science and Technology Portfolio
In evaluating the investment performance of ING VP Global Science and Technology Portfolio, the Board noted that: (1) the Portfolio outperformed its Morningstar category median for the most recent calendar quarter, year-to-date and three-year periods, but underperformed for the one-year and five-year periods; (2) the Portfolio outperformed its benchmark index for the most recent calendar quarter, year-to-date, one-year and three-year periods but underperformed for the five-year period; and (3) the Portfolio is ranked in its Morningstar category in the second quintile for the most recent calendar quarter, year-to-date and three-year periods, in the third quintile for the five-year period and in the fourth quintile for the one-year period. The Board concluded that the performance of the Portfolio is satisfactory.
134
ADVISORY CONTRACT APPROVAL DISCUSSION (UNAUDITED) (CONTINUED)
In assessing the reasonableness of the management fee and expense ratio for ING VP Global Science and Technology Portfolio, the Board noted that the management fee for the Portfolio is above the median and average management fees of the funds in its Selected Peer Group and that the expense ratio for the Portfolio is above the median and the average expense ratios of the portfolios in its Selected Peer Group.
ING VP Growth Portfolio
In evaluating the investment performance of ING VP Growth Portfolio, the Board noted that: (1) the Portfolio outperformed its Morningstar category median for the most recent calendar quarter and year-to-date periods but underperformed for the one-year, three-year and five-year periods; (2) the Portfolio outperformed its benchmark index for the most recent calendar quarter, year-to-date and three-year periods but underperformed for the one-year and five-year periods; and (3) the Portfolio is ranked in its Morningstar category in the second quintile for the most recent calendar quarter, in the third quintile for the year-to-date and three-year periods and in the fourth quintile for the one-year and five-year periods. The Board further noted that in July 2007, the Board approved the transition to a quantitative, opportunistic large-cap growth strategy commencing in November 2007. The Board concluded that appropriate actions are being taken to i mprove performance and that additional time is needed to evaluate the effectiveness of these actions.
In assessing the reasonableness of the management fee and expense ratio for ING VP Growth Portfolio, the Board noted that the management fee for the Portfolio is below the median and average management fees of the funds in its Selected Peer Group and that the expense ratio for the Portfolio is below the median and average expense ratios of the funds in its Selected Peer Group.
ING VP Growth and Income Portfolio
In evaluating the investment performance of ING VP Growth and Income Portfolio, the Board noted that: (1) the Portfolio outperformed its Morningstar category median for year-to-date, one-year and three-year periods, but underperformed for the most recent calendar quarter and five-year periods; (2) the Portfolio outperformed its benchmark index for the three-year period but underperformed for the most recent calendar quarter, year-to-date, one-year and five-year periods; and (3) the Portfolio is ranked in its Morningstar category in the second quintile for the three-year period, in the third quintile for the year-to-date and one-year periods, in the fourth quintile for the most recent calendar quarter and in the fifth quintile for the five-year period. The Board concluded that the performance of the Portfolio is satisfactory.
In assessing the reasonableness of the management fee and expense ratio for ING VP Growth and Income Portfolio, the Board noted that the management fee for the Portfolio is below the median and average management fees of the funds in its Selected Peer Group and that the expense ratio for the Portfolio is below the median and average expense ratios of the funds in its Selected Peer Group.
ING VP Small Company Portfolio
In evaluating the investment performance of ING VP Small Company Portfolio, the Board noted that: (1) the Portfolio outperformed its Morningstar category median for all periods presented; (2) the Portfolio outperformed its benchmark index for the most recent calendar quarter, year-to-date, one-year and three-year periods but underperformed for the five-year period; and (3) the Portfolio is ranked in its Morningstar category in the first quintile for the most recent calendar quarter, year-to-date, one-year and three-year periods and in the third quintile for the five-year period. The Board concluded that the performance of the Portfolio is satisfactory.
In assessing the reasonableness of the management fee and expense ratio for ING VP Small Company Portfolio, the Board noted that the management fee for the Portfolio is below the median and average management fees of the funds in its Selected Peer Group, and that the expense ratio for the Portfolio is below the median and average expense ratios of the funds in its Selected Peer Group.
ING VP Value Opportunity Portfolio
In evaluating the investment performance of ING VP Value Opportunity Portfolio, the Board noted that: (1) the Portfolio outperformed its Morningstar category median and its benchmark index for the most recent calendar quarter, year-to-date and one-year periods but underperformed for the three-year and five-year periods; and (2) the Portfolio is ranked in its Morningstar category in the second quintile for the most recent calendar quarter,
135
ADVISORY CONTRACT APPROVAL DISCUSSION (UNAUDITED) (CONTINUED)
year-to-date and one-year periods, in the fourth quintile for the three-year period and in the fifth quintile for the five-year period. The Board further noted that in July 2007, the Board approved the transition of the Portfolio to a quantitative, opportunistic large-cap value strategy commencing in November 2007. The Board concluded that appropriate actions are being taken to improve the performance of the Portfolio and that additional time is needed to evaluate the effectiveness of these actions.
In assessing the reasonableness of the management fee and expense ratio for ING VP Value Opportunity Portfolio, the Board noted that the management fee for the Portfolio is below the median and average management fees of the funds in its Selected Peer Group, and that the expense ratio for the Portfolio is below the median and average expense ratios of the funds in its Selected Peer Group.
ING VP Intermediate Bond Portfolio
In evaluating the investment performance of ING VP Intermediate Bond Portfolio, the Board noted that: (1) the Portfolio outperformed its Morningstar category median for all periods presented; (2) the Portfolio outperformed its benchmark index for the three-year and five-year periods, but underperformed for the most recent calendar quarter, year-to-date and one-year periods; and (3) the Portfolio is ranked in its Morningstar category in the second quintile for the year-to-date, one-year, three-year and five-year periods and in the third quintile for the most recent calendar quarter. The Board concluded that the performance of the Portfolio is satisfactory.
In assessing the reasonableness of the management fee and expense ratio for ING VP Intermediate Bond Portfolio, the Board noted that the management fee for the Portfolio is below the median and the average management fees of the funds in its Selected Peer Group, and that the expense ratio for the Portfolio is below the median and the average expense ratios of the funds in its Selected Peer Group.
ING VP Money Market Portfolio
In evaluating the investment performance of ING VP Money Market Portfolio, the Board noted that: (1) the Portfolio outperformed its Morningstar category median and its benchmark index for all periods presented; and (2) although the Portfolio is not ranked by Morningstar, the Portfolio is ranked in its Lipper category in the first quintile for all periods presented. The Board concluded that the performance of the Portfolio is satisfactory.
In assessing the reasonableness of the management fee and expense ratio for ING VP Money Market Portfolio, the Board noted that the management fee for the Portfolio is below the median and average management fees of the funds in its Selected Peer Group, and that the expense ratio for the Portfolio is below the median and average expense ratios of the funds in its Selected Peer Group.
136
(THIS PAGE INTENTIONALLY LEFT BLANK)
(THIS PAGE INTENTIONALLY LEFT BLANK)
Investment Adviser
ING Investments, LLC
7337 East Doubletree Ranch Road
Scottsdale, Arizona 85258
Administrator
ING Funds Services, LLC
7337 East Doubletree Ranch Road
Scottsdale, Arizona 85258
Distributor
ING Funds Distributor, LLC
7337 East Doubletree Ranch Road
Scottsdale, Arizona 85258
Transfer Agent
DST Systems, Inc.
P.O. Box 419368
Kansas City, Missouri 64141
Independent Registered Public
Accounting Firm
KPMG LLP
99 High Street
Boston, Massachusetts 02110
Custodian
The Bank of New York Mellon Corporation
One Wall Street
New York, New York 10286
Legal Counsel
Goodwin Procter LLP
Exchange Place
53 State Street
Boston, Massachusetts 02109
Before investing, carefully consider the investment objectives, risks, charges and expenses of the variable annuity contract and the underlying variable investment options. This and other information is contained in the prospectus for the variable annuity contract and the underlying variable investment options. Obtain these prospectuses from your agent/registered representative and read them carefully before investing.

VPAR-ACAPAPADVIS (1207-022908)
Item 2. Code of Ethics.
As of the end of the period covered by this report, Registrant had adopted a code of ethics, as defined in Item 2 of Form N-CSR, that applies to the Registrant’s principal executive officer and principal financial officer. There were no amendments to the Code during the period covered by the report. The Registrant did not grant any waivers, including implicit waivers, from any provisions of the Code during the period covered by this report. The code of ethics is filed herewith pursuant to Item 10(a)(1), Exhibit 99.CODE ETH.
Item 3. Audit Committee Financial Expert.
The Board of Trustees has determined that Corine Norgaard and Joseph Obermeyer are each audit committee financial experts, as defined in Item 3 of Form N-CSR. Ms. Norgaard and Mr. Obermeyer are both “independent” for purposes of Item 3 of Form N-CSR.
Item 4. Principal Accountant Fees and Services.
(a) Audit Fees: The aggregate fees billed for each of the last two fiscal years for professional services rendered by KPMG LLP (“KPMG”), the principal accountant for the audit of the registrant’s annual financial statements, for services that are normally provided by the accountant in connection with statutory and regulatory filings or engagements for those fiscal years were $41,358 for year ended December 31, 2007 and $72,721 for year ended December 31, 2006.
(b) Audit-Related Fees: The aggregate fees billed in each of the last two fiscal years for assurance and related services by KPMG that are reasonably related to the performance of the audit of the registrant’s financial statements and are not reported under paragraph (a) of this Item were $5,874 for year ended December 31, 2007 and $0 for year ended December 31, 2006.
(c) Tax Fees: The aggregate fees billed in each of the last two fiscal years for professional services rendered by KPMG for tax compliance, tax advice, and tax planning were $3,819 in the year ended December 31, 2007 and $5,402 in the year ended December 31, 2006. Such services included review of excise distribution calculations (if applicable), preparation of the Funds’ federal, state and excise tax returns, tax services related to mergers and routine consulting.
(d) All Other Fees: The aggregate fees billed in each of the last two fiscal years for products and services provided by KPMG, other than the services reported in paragraphs (a) through (c) of this Item.
None
(e) (1) Audit Committee Pre-Approval Policies and Procedures
2
AUDIT AND NON-AUDIT SERVICES
PRE-APPROVAL POLICY
I. Statement of Principles
Under the Sarbanes-Oxley Act of 2002 (the “Act”), the Audit Committee of the Board of Directors or Trustees (the “Committee”) of the ING Funds (each a “Fund,” collectively, the “Funds”) set out under Paragraph I on Exhibit A to this Audit and Non-Audit Services Pre-Approval Policy (“Policy”) is responsible for the oversight of the work of the Funds’ independent auditors. As part of its responsibilities, the Committee must pre-approve the audit and non-audit services performed by the auditors in order to assure that the provision of these services does not impair the auditors’ independence from the Funds. The Committee has adopted, and the Board has ratified, this Policy, which sets out the procedures and conditions under which the services of the independent auditors may be pre-approved.
Under Securities and Exchange Commission (“SEC”) rules promulgated in accordance with the Act, the Funds’ may establish two different approaches to pre-approving audit and non-audit services. The Committee may approve services without consideration of specific case-by-case services (“general pre-approval”) or it may pre-approve specific services (“specific pre-approval”). The Committee believes that the combination of these approaches contemplated in this Policy results in an effective and efficient method for pre-approving audit and non-audit services to be performed by the Funds’ independent auditors. Under this Policy, services that are not of a type that may receive general pre-approval require specific pre-approval by the Committee. Any proposed services that exceed pre-approved cost levels or budgeted amounts will also require the Committee’s specific pre-approval.
For both types of approval, the Committee considers whether the subject services are consistent with the SEC’s rules on auditor independence and that such services are compatible with maintaining the auditors’ independence. The Committee also considers whether a particular audit firm is in the best position to provide effective and efficient services to the Funds. Reasons that the auditors are in the best position include the auditors’ familiarity with the Funds’ business, personnel, culture, accounting systems, risk profile, and other factors, and whether the services will enhance the Funds’ ability to manage and control risk or improve audit quality. Such factors will be considered as a whole, with no one factor being determinative.
The appendices attached to this Policy describe the audit, audit-related, tax-related, and other services that have the Committee’s general pre-approval. For any service that has been approved through general pre-approval, the general pre-approval will remain in place for a period 12 months from the date of pre-approval, unless the Committee determines that a different period is appropriate. The Committee will annually review and pre-approve the services that may be provided by the independent auditors without specific pre-approval. The Committee will revise the list of services subject to general pre-approval as appropriate. This Policy does not serve as a delegation to Fund management of the Committee’s duty to pre-approve services performed by the Funds’ independent auditors.
3
II. Audit Services
The annual audit services engagement terms and fees are subject to the Committee’s specific pre-approval. Audit services are those services that are normally provided by auditors in connection with statutory and regulatory filings or engagements or those that generally only independent auditors can reasonably provide. They include the Funds’ annual financial statement audit and procedures that the independent auditors must perform in order to form an opinion on the Funds’ financial statements (e.g., information systems and procedural reviews and testing). The Committee will monitor the audit services engagement and approve any changes in terms, conditions or fees deemed by the Committee to be necessary or appropriate.
The Committee may grant general pre-approval to other audit services, such as statutory audits and services associated with SEC registration statements, periodic reports and other documents filed with the SEC or issued in connection with securities offerings.
The Committee has pre-approved the audit services listed on Appendix A. The Committee must specifically approve all audit services not listed on Appendix A.
III. Audit-related Services
Audit-related services are assurance and related services that are reasonably related to the performance of the audit or the review of the Funds’ financial statements or are traditionally performed by the independent auditors. The Committee believes that the provision of audit-related services will not impair the independent auditors’ independence, and therefore may grant pre-approval to audit-related services. Audit-related services include accounting consultations related to accounting, financial reporting or disclosure matters not classified as “audit services;” assistance with understanding and implementing new accounting and financial reporting guidance from rulemaking authorities; agreed-upon or expanded audit procedures relating to accounting and/or billing records required to respond to or comply with financial, accounting or regulatory reporting matters; and assistance with internal control reporting requirements under Form N-SAR or Form N-CSR.
The Committee has pre-approved the audit-related services listed on Appendix B. The Committee must specifically approve all audit-related services not listed on Appendix B.
IV. Tax Services
The Committee believes the independent auditors can provide tax services to the Funds, including tax compliance, tax planning, and tax advice, without compromising the auditors’ independence. Therefore, the Committee may grant general pre-approval with respect to tax services historically provided by the Funds’ independent auditors that do not, in the Committee’s view, impair auditor independence and that are consistent with the SEC’s rules on auditor independence.
The Committee will not grant pre-approval if the independent auditors initially recommends a transaction the sole business purpose of which is tax avoidance and the tax treatment of which may
4
not be supported in the Internal Revenue Code and related regulations. The Committee may consult outside counsel to determine that tax planning and reporting positions are consistent with this Policy.
The Committee has pre-approved the tax-related services listed on Appendix C. The Committee must specifically approve all tax-related services not listed on Appendix C.
V. Other Services
The Committee believes it may grant approval of non-audit services that are permissible services for independent auditors to a Fund. The Committee has determined to grant general pre-approval to other services that it believes are routine and recurring, do not impair auditor independence, and are consistent with SEC rules on auditor independence.
The Committee has pre-approved the non-audit services listed on Appendix D. The Committee must specifically approve all non-audit services not listed on Appendix D.
A list of the SEC’s prohibited non-audit services is attached to this Policy as Appendix E. The SEC’s rules and relevant guidance should be consulted to determine the precise definitions of these impermissible services and the applicability of exceptions to certain of the SEC’s prohibitions.
VI. Pre-approval of Fee levels and Budgeted Amounts
The Committee will annually establish pre-approval fee levels or budgeted amounts for audit, audit-related, tax and non-audit services to be provided to the Funds by the independent auditors. Any proposed services exceeding these levels or amounts require the Committee’s specific pre-approval. The Committee considers fees for audit and non-audit services when deciding whether to pre-approve services. The Committee may determine, for a pre-approval period of 12 months, the appropriate ratio between the total amount of fees for the Fund’s audit, audit-related, and tax services (including fees for services provided to Fund affiliates that are subject to pre-approval), and the total amount of fees for certain permissible non-audit services for the Fund classified as other services (including any such services provided to Fund affiliates that are subject to pre-approval).
VII. Procedures
Requests or applications for services to be provided by the independent auditors will be submitted to management. If management determines that the services do not fall within those services generally pre-approved by the Committee and set out in the appendices to these procedures, management will submit the services to the Committee or its delagee. Any such submission will include a detailed description of the services to be rendered.
Notwithstanding this paragraph, the Committee will, on quarterly basis, receive from the independent auditors a list of services provided to date by the auditors during Pre-Approval Period.
5
VIII. Delegation
The Committee may delegate pre-approval authority to one or more of the Committee’s members. Any member or members to whom such pre-approval authority is delegated must report any pre-approval decisions, including any pre-approved services, to the Committee at its next scheduled meeting. The Committee will identify any member to whom pre-approval authority is delegated in writing. The member will retain such authority for a period of 12 months from the date of pre-approval unless the Committee determines that a different period is appropriate. The period of delegated authority may be terminated by the Committee or at the option of the member.
IX. Additional Requirements
The Committee will take any measures the Committee deems necessary or appropriate to oversee the work of the independent auditors and to assure the auditors’ independence from the Funds. This may include reviewing a formal written statement from the independent auditors delineating all relationships between the auditors and the Funds, consistent with Independence Standards Board No. 1, and discussing with the auditors their methods and procedures for ensuring independence.
Date last approved: April 4, 2007
6
Appendix A
Pre-Approved Audit Services for the Pre-Approval Period January 1, 2007 through December 31, 2007
Service
| | The Fund(s) | | Fee Range |
| | | | |
Statutory audits or financial audits (including tax services associated with audit services) | | x | | As presented to Audit Committee(1) |
| | | | |
Services associated with SEC registration statements, periodic reports and other documents filed with the SEC or other documents issued in connection with securities offerings (e.g., consents), and assistance in responding to SEC comment letters. | | x | | Not to exceed $9,750 per filing |
| | | | |
Consultations by Fund management with respect to accounting or disclosure treatment of transactions or events and/or the actual or potential effect of final or proposed rules, standards or interpretations by the SEC, Financial Accounting Standards Board, or other regulatory or standard setting bodies. | | x | | Not to exceed $8,000 during the Pre-Approval Period |
(1) For new Funds launched during the Pre-Approval Period, the fee ranges pre-approved will be the same as those for existing Funds, pro-rated in accordance with inception dates as provided in KPMG’s Proposal or any Engagement Letter covering the period at issue. Fees in the Engagement Letter will be controlling.
7
Appendix B
Pre-Approved Audit-Related Services for the Pre-Approval Period January 1, 2007 through December 31, 2007
Service
| | The
Fund(s) | | Fund Affiliates | | Fee Range |
| | | | | | |
Services related to Fund mergers (Excluding tax services – See Appendix C for tax services associated with fund mergers) | | x | | x | | Not to exceed $10,000 per merger |
| | | | | | |
Consultations by Fund management with respect to accounting or disclosure treatment of transactions or events and/or the actual or potential effect of final or proposed rules, standards or interpretations by the SEC, Financial Accounting Standards Board, or other regulatory or standard setting bodies. [Note: Under SEC rules some consultations may be “audit” services and others may be “audit-related” services.] | | x | | | | Not to exceed $5,000 per occurrence during the Pre-Approval Period |
| | | | | | |
Review of the Funds’ semi-annual financial statements | | x | | | | Not to exceed $2,200 per set of financial statements per fund |
| | | | | | |
Reports to regulatory or government agencies related to the annual engagement | | x | | | | Up to $5,000 per occurrence during the Pre-Approval Period |
| | | | | | |
Regulatory compliance assistance | | x | | x | | Not to exceed $5,000 per quarter |
| | | | | | |
Training courses | | | | x | | Not to exceed $2,000 per course |
8
Appendix C
Pre-Approved Tax Services for the Pre-Approval Period January 1, 2007 through December 31, 2007
Service
| | The Fund(s) | | Fund
Affiliates | | Fee Range |
| | | | | | |
Preparation of federal and state income tax returns and federal excise tax returns for the Funds including assistance and review with excise tax distributions. | | x | | | | As presented to Audit Committee(2) |
| | | | | | |
Review of IRC Sections 851(b) and 817(h) diversification testing on a real-time basis | | x | | | | As presented to Audit Committee(2) |
| | | | | | |
Assistance and advice regarding year-end reporting for 1099’s | | x | | | | As presented to Audit Committee(2) |
| | | | | | |
Tax assistance and advice regarding statutory, regulatory or administrative developments | | x | | x | | Not to exceed $5,000 in aggregate for the Funds or for the Funds’ investment adviser during the Pre-Approval Period |
| | | | | | |
Tax training courses | | | | x | | Not to exceed $2,000 per course during the Pre-Approval Period |
(2) For new Funds launched during the Pre-Approval Period, the fee ranges pre-approved will be the same as those for existing Funds, as provided in KPMG’s Proposal or any Engagement Letter covering the period at issue. Fees in the Engagement Letter will be controlling.
9
Appendix C, continued
Service
| | The Fund(s) | | Fund
Affiliates | | Fee Range |
| | | | | | |
Tax services associated with Fund mergers | | x | | x | | Not to exceed $4,000 per fund per merger during the Pre-Approval Period |
| | | | | | |
Other tax-related assistance and consultation, including, without limitation, assistance in evaluating derivative financial instruments and international tax issues, qualification and distribution issues, and similar routine tax consultations | | x | | | | Not to exceed $50,000 during the Pre-Approval Period |
10
Appendix D
Pre-Approved Other Services for the Pre-Approval Period January 1, 2007 through December 31, 2007
Service
| | The Fund(s) | | Fund Affiliates | | Fee Range |
| | | | | | |
Agreed-upon procedures for Class B share 12b-1 programs | | | | x | | Not to exceed $50,000 during the Pre-Approval Period |
| | | | | | |
Security counts performed pursuant to Rule 17f-2 of the 1940 Act (i.e., counts for Funds holding securities with affiliated sub-custodians) (Cost to be split 50% the funds and 50% ING Investments, LLC) | | x | | x | | Not to exceed $5,000 per Fund during the Pre-Approval Period |
11
Appendix E
Prohibited Non-Audit Services
Dated: 2007
· Bookkeeping or other services related to the accounting records or financial statements of the Funds
· Financial information systems design and implementation
· Appraisal or valuation services, fairness opinions, or contribution-in-kind reports
· Actuarial services
· Internal audit outsourcing services
· Management functions
· Human resources
· Broker-dealer, investment adviser, or investment banking services
· Legal services
· Expert services unrelated to the audit
· Any other service that the Public Company Accounting Oversight Board determines, by regulation, is impermissible
12
EXHIBIT A
ING VP BALANCED PORTFOLIO, INC.
ING STRATEGIC ALLOCATION PORTFOLIOS, INC.
ING GET FUND
ING VP INTERMEDIATE BOND PORTFOLIO
ING VP MONEY MARKET PORTFOLIO
ING VARIABLE FUNDS
ING VARIABLE PORTFOLIOS, INC.
ING SERIES FUND, INC.
13
(e) (2) Percentage of services referred to in 4(b) — (4)(d) that were approved by the audit committee
100% of the services were approved by the audit committee.
(f) Percentage of hours expended attributable to work performed by other than full time employees of KPMG if greater than 50%.
Not applicable.
(g) Non-Audit Fees: The non-audit fees billed by the registrant’s accountant for services rendered to the registrant, and rendered to the registrant’s investment adviser, and any entity controlling, controlled by, or under common control with the adviser that provides ongoing services to the registrant for each of the last two fiscal years of the registrant were $218,919 for year ended December 31, 2007 and $807,452 for year ended December 31, 2006.
(h) Principal Accountants Independence: The Registrant’s Audit committee has considered whether the provision of non-audit services that were rendered to the registrant’s investment adviser and any entity controlling, controlled by, or under common control with the investment adviser that provides ongoing services to the registrant that were not pre-approved pursuant to Rule 2-01(c)(7)(ii) of Regulation S-X is compatible with maintaining KPMG’s independence.
Item 5. Audit Committee of Listed Registrants.
Not applicable.
Item 6. Schedule of Investments
Schedule is included as part of the report to shareholders filed under Item 1 of this Form.
Item 7. Disclosure of Proxy Voting Policies and Procedures for Closed-End Management Investment Companies.
Not applicable.
Item 8. Portfolio Managers of Closed-End Management Investment Companies.
Not applicable.
Item 9. Purchases of Equity Securities by Closed-End Management Investment Company and Affiliated Purchasers
Not applicable.
Item 10. Submission of Matters to a Vote of Security Holders.
The Nominating Committee operates pursuant to a Charter approved by the Board. The primary purpose of the Nominating Committee is to consider, evaluate and make recommendations to the Board with respect to the nomination and selection of Independent Trustees. In evaluating candidates, the Nominating Committee may consider a variety of factors, but specific qualifications of candidates for Board membership will be based on the needs of the Board at the time of nomination.
The Nominating Committee is willing to consider nominations received from shareholders and shall assess shareholder nominees in the same manner as it reviews nominees it identifies. A shareholder nominee for director should be submitted in writing to the Fund’s Secretary. Any such shareholder nomination should include sufficient background information concerning the candidate and should be received in a timely manner. At a minimum, the following information as to each individual proposed for nomination as director should be included: the individual’s written consent to be named in the proxy statement as a nominee (if nominated) and to serve as a director (if elected), and all information relating to such individual that is required to be disclosed in a solicitation of proxies for election of directors, or is otherwise required, in each case under applicable federal securities laws, rules and regulations.
The Secretary shall submit all nominations received in a timely manner to the Nominating Committee. To be timely, any such submission must be delivered to the Fund’s Secretary not earlier than the 90th day prior to such meeting and not later than the close of business on the later of the 60th day prior to such meeting or the 10th day following the day on which public announcement of the date of the meeting is first made, by either disclosure in a press release or in a document publicly filed by the Fund with the SEC.
In evaluating a candidate for the position of Independent Trustee, including any candidate recommended by shareholders of the Fund, the Nominating Committee shall consider the following: (i) the candidate’s knowledge in matters relating to the mutual fund industry; (ii) any experience possessed by the candidate as a director or senior officer of other public companies; (iii) the candidate’s educational background, reputation for high ethical standards and professional integrity; (iv) any specific financial, technical or other expertise possessed by the candidate, and the extent to which such expertise would complement the Board’s existing mix of skills, core competencies and qualifications; (v) the candidate’s perceived ability to contribute to the ongoing functions of the Board, including the candidate’s ability and commitment to attend meetings regularly and work collaboratively with other members of the Board; (vi) the candidate’s ability to qualify as an Independent Trustee for purposes of the 1940 Act; and (vii) such other factors as the Committee determines to be relevant in light of the existing composition of the Board and any anticipated vacancies. Prior to making a final recommendation to the Board, the Committee shall conduct personal interviews with those candidates it concludes are the most qualified candidates.
14
Item 11. Controls and Procedures.
(a) Based on our evaluation conducted within 90 days of the filing date, hereof, the design and operation of the registrant’s disclosure controls and procedures are effective to ensure that material information relating to the registrant is made known to the certifying officers by others within the appropriate entities, particularly during the period in which Forms N-CSR are being prepared, and the registrant’s disclosure controls and procedures allow timely preparation and review of the information for the registrant’s Form N-CSR and the officer certifications of such Form N-CSR.
(b) There were no significant changes in the registrant’s internal controls that occurred during the second fiscal quarter of the period covered by this report that has materially affected, or is reasonably likely to materially affect, the registrant’s internal control over financial reporting.
Item 12. Exhibits.
(a)(1) | | Code of Ethics pursuant to Item 2 of Form N-CSR is filed and attached hereto as EX-99.CODE ETH. |
| | |
(a)(2) | | A separate certification for each principal executive officer and principal financial officer of the registrant as required by Rule 30a-2 under the Act (17 CFR 270.30a-2) is attached hereto as EX-99.CERT. |
| | |
(b) | | The officer certifications required by Section 906 of the Sarbanes-Oxley Act of 2002 are attached hereto as EX-99.906CERT |
| | |
(3) | | Not applicable. |
15
SIGNATURES
Pursuant to the requirements of the Securities Exchange Act of 1934 and the Investment Company Act of 1940, the registrant has duly caused this report to be signed on its behalf by the undersigned, thereunto duly authorized.
(Registrant): ING Variable Funds
By | /s/ Shaun P. Mathews | |
| Shaun P. Mathews | |
| President and Chief Executive Officer | |
Date: March 4, 2008
Pursuant to the requirements of the Securities Exchange Act of 1934 and the Investment Company Act of 1940, this report has been signed below by the following persons on behalf of the registrant and in the capacities and on the dates indicated.
By | /s/ Shaun P. Mathews | |
| Shaun P. Mathews | |
| President and Chief Executive Officer | |
Date: March 4, 2008
By | /s/ Todd Modic | |
| Todd Modic | |
| Senior Vice President and Chief Financial Officer | |
Date: March 4, 2008
16