EXHIBIT 99.1

| Dana Corporation 1st Quarter Conference Call April 21, 2004 (c) Dana Corporation, 2004 |
| Forward-Looking Statements Statements herein about our forecasts, beliefs, and expectations constitute "forward-looking" statements within the meaning of the Private Securities Litigation Reform Act of 1995. These statements are based on our current information and assumptions. Forward-looking statements are inherently subject to risks and uncertainties. Dana's actual results could differ materially from those that we anticipate or project due to a number of factors. These factors include the impact of national and international economic conditions; adverse effects from terrorism or hostilities; the strength of other currencies relative to the U.S. dollar; the cyclical nature of the global vehicular industry; the performance of the global aftermarket sector; changes in business relationships with our major customers and in the timing, size and continuation of their and our programs; the ability of our customers and suppliers to achieve their projected sales and production levels; competitive pressures on our sales and pricing; increases in production or material costs that cannot be recouped in product pricing; the impact of our collective bargaining negotiations; the continued success of our cost reduction and cash management programs and our long-term transformation strategy, and the success and timing of the contemplated divestiture of the automotive aftermarket business. Additional factors are contained in our public filings with the SEC. We do not undertake to update any forward-looking statements contained herein. (c) Dana Corporation, April 21, 2004 |
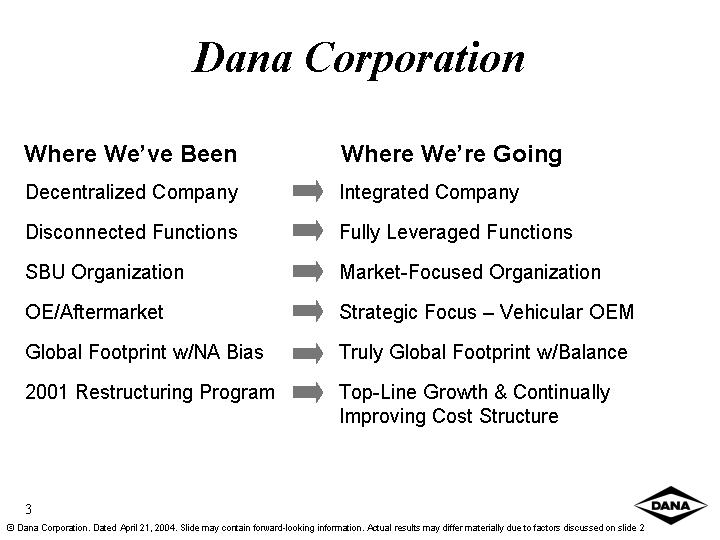
| Dana Corporation Where We've Been Where We're Going Decentralized Company Disconnected Functions SBU Organization OE/Aftermarket Global Footprint w/NA Bias 2001 Restructuring Program Integrated Company Top-Line Growth & Continually Improving Cost Structure Fully Leveraged Functions Market-Focused Organization Strategic Focus - Vehicular OEM Truly Global Footprint w/Balance 5 (c) Dana Corporation. Dated April 21, 2004. Slide may contain forward-looking information. Actual results may differ materially due to factors discussed on slide 2 |

| Future Success Requires Focus 1 3.3 2 4.8 2.178 5.1 1 1.9 3 6.1 3 4.7 3 5.3 3 6.2 3 6.3 Diverse Focused Source: Public Filings 7 (c) Dana Corporation. Dated April 21, 2004. Slide may contain forward-looking information. Actual results may differ materially due to factors discussed on slide 2 |
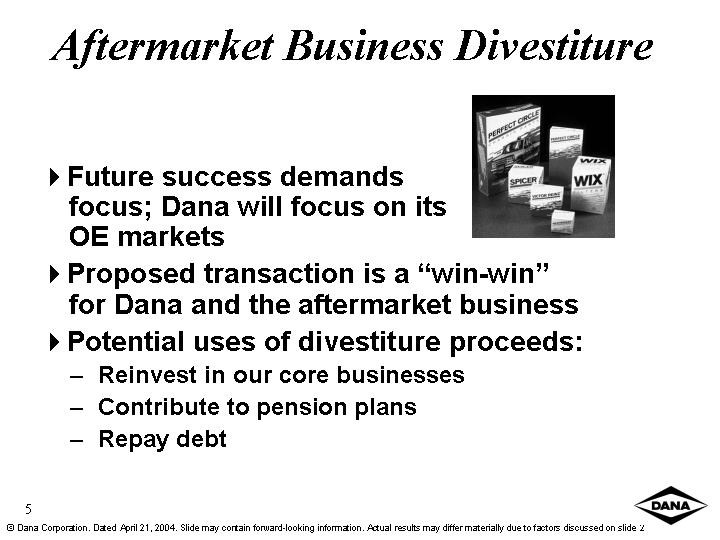
| Aftermarket Business Divestiture Future success demands focus; Dana will focus on its OE markets Proposed transaction is a "win-win" for Dana and the aftermarket business Potential uses of divestiture proceeds: Reinvest in our core businesses Contribute to pension plans Repay debt 9 (c) Dana Corporation. Dated April 21, 2004. Slide may contain forward-looking information. Actual results may differ materially due to factors discussed on slide 2 |

| Pleasant Surprises Excellent Quality Metrics Impressive Six Sigma Black Belt Program Dedicated People Unified by challenges Embracing change and, most importantly ... 11 (c) Dana Corporation. Dated April 21, 2004. Slide may contain forward-looking information. Actual results may differ materially due to factors discussed on slide 2 |
| Dana Customer Base Automotive 13 (c) Dana Corporation. Dated April 21, 2004. Slide may contain forward-looking information. Actual results may differ materially due to factors discussed on slide 2 |
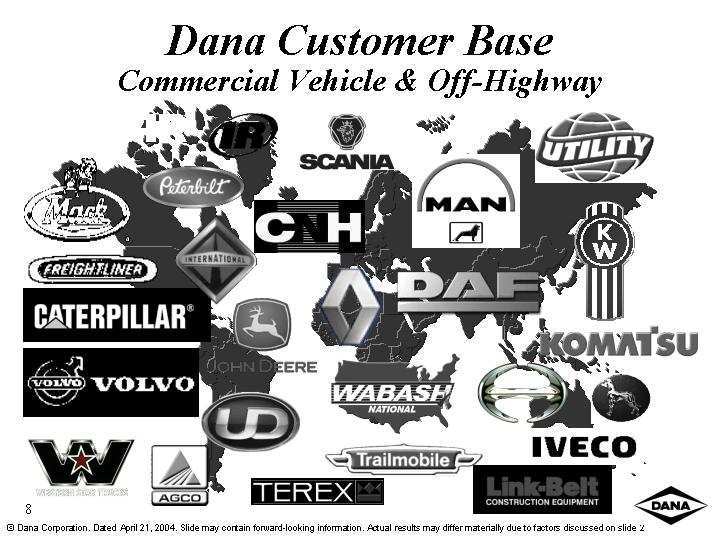
| Dana Customer Base Commercial Vehicle & Off-Highway 15 (c) Dana Corporation. Dated April 21, 2004. Slide may contain forward-looking information. Actual results may differ materially due to factors discussed on slide 2 |

| 17 (c) Dana Corporation. Dated April 21, 2004. Slide may contain forward-looking information. Actual results may differ materially due to factors discussed on slide 2 NAFTA Heavy-Truck Overview Backlog Net Orders Build Sales Inventory 2001 69963 14785 13119 13888 47703 70726 12300 12184 13042 47415 67233 11085 13633 15836 44381 65214 10947 12199 15688 40345 60894 9656 13629 16679 38557 58728 10710 12863 15684 35290 57415 9541 10800 13446 33297 53620 9043 12128 13833 31908 52796 10042 11086 12110 30938 47005 7932 13924 14543 29642 50737 14453 11439 12133 29018 52665 10988 8845 13446 24667 2002 59201 15261 10281 10474 24389 68722 20705 11815 10528 25980 83944 29139 12814 13393 25602 97028 28004 14514 14350 26706 95689 17806 17282 16960 26381 89647 10388 16952 15390 27250 76166 5973 17831 16770 28195 64701 7071 19800 17197 31089 54739 7823 18331 16709 33022 44856 9961 19120 18545 34226 42417 10729 12207 14858 31160 44537 11584 10136 13647 27980 2003 48364 15466 11840 10821 29474 51826 15702 11644 10799 31241 52219 13928 12418 11551 33014 52787 15435 14524 15594 31966 54760 17261 14957 15597 31892 56123 16872 15233 15550 32057 58055 17357 15150 16402 30924 56383 14845 15049 14166 31412 55179 15026 16161 16622 31180 52787 17437 19022 17915 33108 54419 17628 15188 15117 32827 64356 25732 15432 18525 29743 2004 81413 31752 15382 14008 30398 Backlog (000) Net Orders, Sales, Inventory & Build (000) |
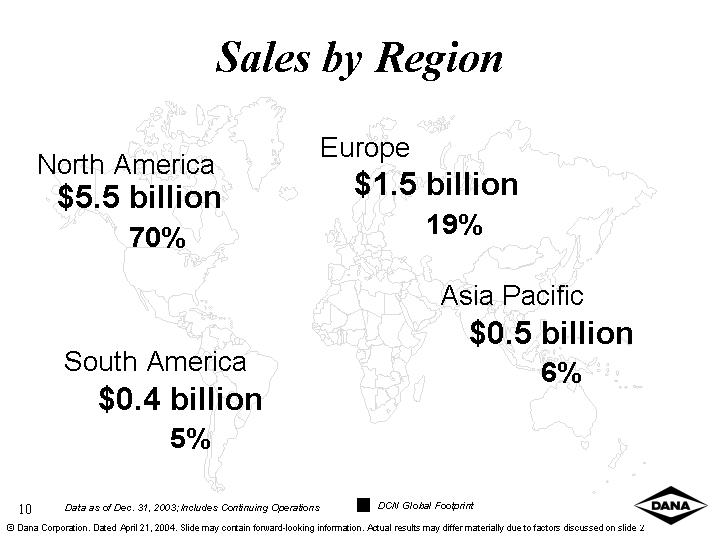
| Sales by Region North America South America Europe Asia Pacific $5.5 billion 70% $0.4 billion 5% $1.5 billion 19% $0.5 billion 6% Data as of Dec. 31, 2003; Includes Continuing Operations 19 (c) Dana Corporation. Dated April 21, 2004. Slide may contain forward-looking information. Actual results may differ materially due to factors discussed on slide 2 DCN Global Footprint |
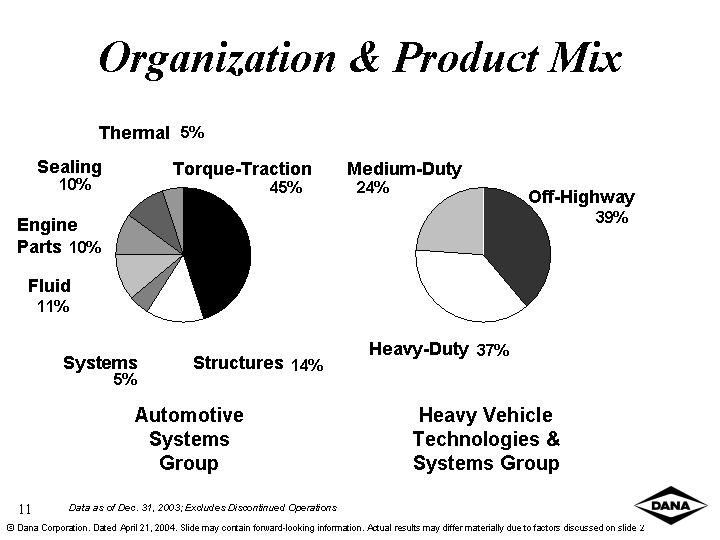
| Organization & Product Mix Engine Hard Parts 0.11 Fluid 0.1 Sealing 0.1 Thermal 0.05 Torque-Traction 0.45 Structures 0.14 Systems 0.05 Off-Highway 0.39 Heavy-Duty 0.37 Medium-Duty 0.24 Automotive Systems Group Heavy Vehicle Technologies & Systems Group Off-Highway Heavy-Duty Medium-Duty Torque-Traction Structures Systems Thermal Fluid Sealing Engine Parts 45% 14% 5% 10% 11% 10% 5% 39% 37% 24% Data as of Dec. 31, 2003; Excludes Discontinued Operations 21 (c) Dana Corporation. Dated April 21, 2004. Slide may contain forward-looking information. Actual results may differ materially due to factors discussed on slide 2 |
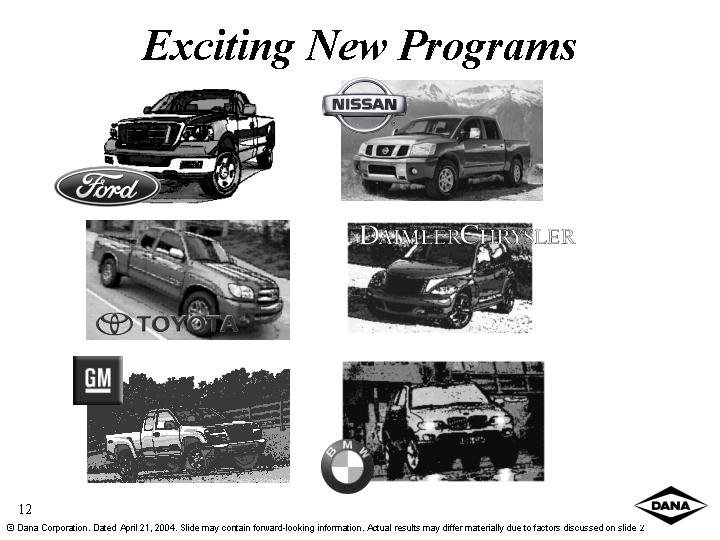
| Exciting New Programs 23 (c) Dana Corporation. Dated April 21, 2004. Slide may contain forward-looking information. Actual results may differ materially due to factors discussed on slide 2 |

| Financial Summary Q1 -2004 Q1 -2003 Sales $2.3 billion $2.0 billion Net Income Earnings per Share $63 million $0.42 $41 million $0.28 Net Income, excluding unusual items $61 million $31 million Earnings Per Share, excluding unusual items $0.41 $0.21 25 (c) Dana Corporation. Dated April 21, 2004. Slide may contain forward-looking information. Actual results may differ materially due to factors discussed on slide 2 |
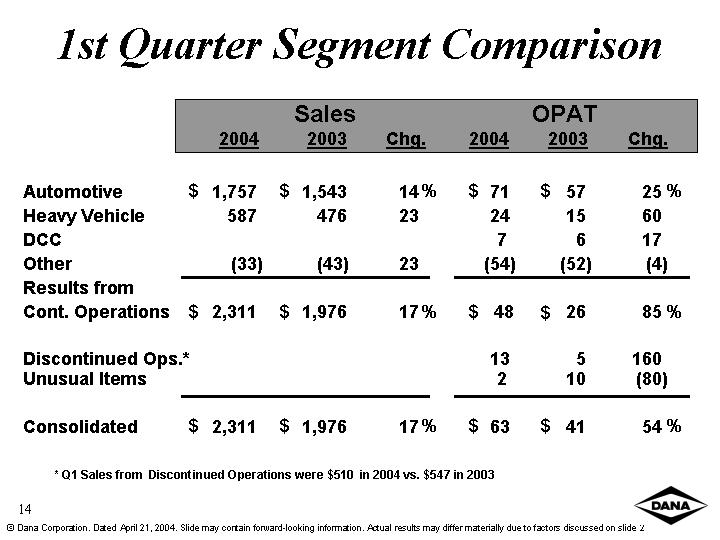
| 1st Quarter Segment Comparison Automotive 1,757 1,543 14 71 57 25 Heavy Vehicle 587 476 23 24 15 60 DCC 7 6 17 Other (33) (43) 23 (54) (52) (4) Results from Cont. Operations 2,311 1,976 17 48 26 85 Discontinued Ops.* 13 5 160 Unusual Items 2 10 (80) Consolidated 2,311 1,976 17 63 41 54 Sales OPAT 2004 2004 2003 2003 Chg. Chg. % % % % % $ $ $ $ $ $ $ $ $ $ $ $ (Millions) 27 (c) Dana Corporation. Dated April 21, 2004. Slide may contain forward-looking information. Actual results may differ materially due to factors discussed on slide 2 * Q1 Sales from Discontinued Operations were $510 in 2004 vs. $547 in 2003 % |

| 2003 2002 Income Statement With DCC on an Equity Basis* 29 (c) Dana Corporation. Dated April 21, 2004. Slide may contain forward-looking information. Actual results may differ materially due to factors discussed on slide 2 2004 2003 1st Quarter * NOTE: Comparable GAAP measures available at www.dana.com |
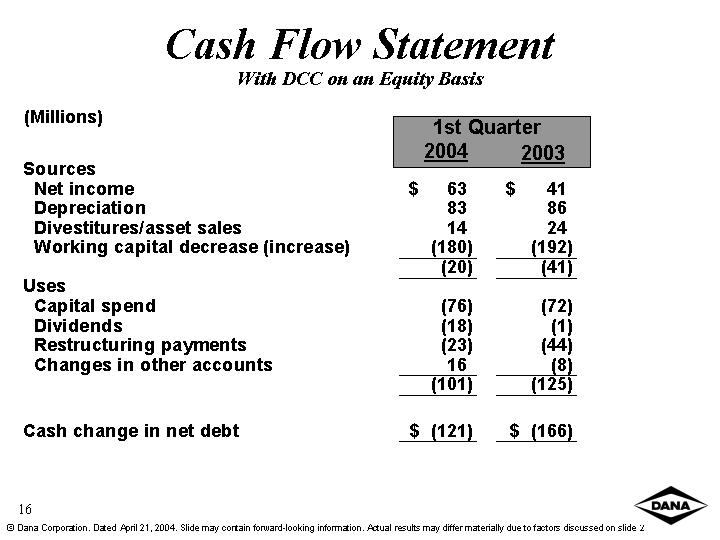
| Cash Flow Statement With DCC on an Equity Basis 2004 2003 1st Quarter (Millions) 31 (c) Dana Corporation. Dated April 21, 2004. Slide may contain forward-looking information. Actual results may differ materially due to factors discussed on slide 2 |

| Capital Structure With DCC on an Equity Basis 33 (c) Dana Corporation. Dated April 21, 2004. Slide may contain forward-looking information. Actual results may differ materially due to factors discussed on slide 2 |
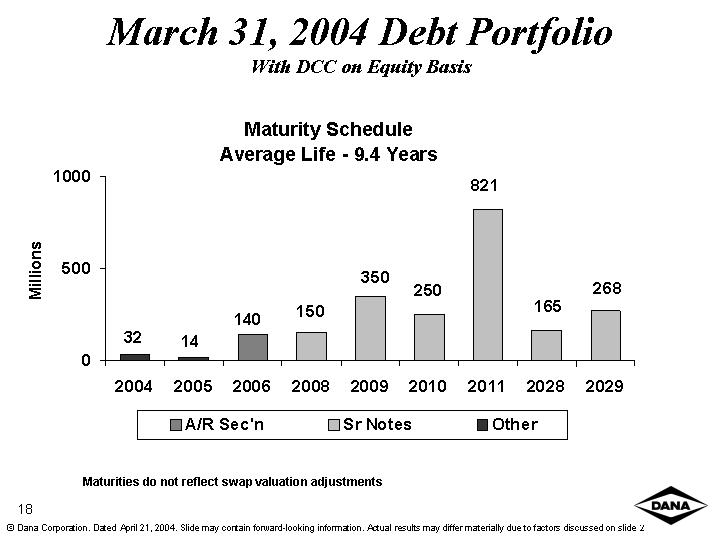
| Maturities do not reflect swap valuation adjustments March 31, 2004 Debt Portfolio With DCC on Equity Basis 2004 2005 2006 2008 2009 2010 2011 2028 2029 A/R Sec'n 140 Sr Notes 150 350 250 821.33 165.05 268.25 Other 31.855 15.544 14 32 140 35 (c) Dana Corporation. Dated April 21, 2004. Slide may contain forward-looking information. Actual results may differ materially due to factors discussed on slide 2 Millions |

| 5-year bank facility $400 $ - $ 400 Accts receivable program 400 140 260 Total short-term committed facilities $800 $ 140 $ 660 Plus: Cash 451 Total $1,111 Committed Drawn Available March 31, 2004 Liquidity With DCC on an Equity Basis 37 (c) Dana Corporation. Dated April 21, 2004. Slide may contain forward-looking information. Actual results may differ materially due to factors discussed on slide 2 (Millions) |

| 12/01 Total Portfolio Assets - $2,200 DCC Portfolio Analysis ($ Millions) VASG 90 50 12 RESG 170 740 0 CMG 480 Value-Added Services Retained Real Estate Capital Markets 3/04 Total Portfolio Assets - $1,260 VASG 120 10 50 RESG 170 900 0 CMG 410 Net of certain non-recourse debt 39 (c) Dana Corporation. Dated April 21, 2004. Slide may contain forward-looking information. Actual results may differ materially due to factors discussed on slide 2 |

| 2004 Guidance: Supporting Assumptions Market Forecasts Light-Vehicle: 16.2 million units Heavy-Vehicle: 245,000 units Net New Business $400 million in 2004 Lower Start-Up Costs Restructuring Benefits Debt Reduction Aftermarket Transaction Targeted for Completion by End of Q2 41 (c) Dana Corporation. Dated April 21, 2004. Slide may contain forward-looking information. Actual results may differ materially due to factors discussed on slide 2 |

| Income Statement Outlook ($ Millions, except per share data) 2003 2004 Actual Outlook Sales $ 7,918 > $8,500 Net Income 222 > 285 EPS 1.49 > 1.90 43 (c) Dana Corporation. Dated April 21, 2004. Slide may contain forward-looking information. Actual results may differ materially due to factors discussed on slide 2 Outlook excludes gains or losses from divestitures and asset sales |
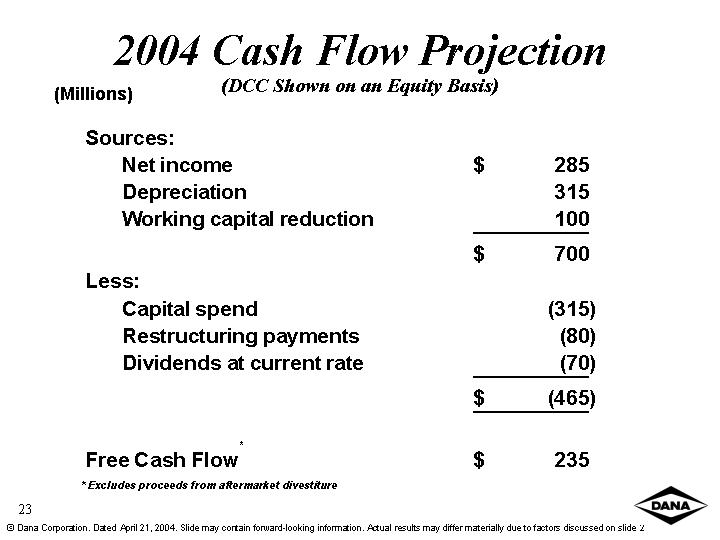
| 2004 Cash Flow Projection (DCC Shown on an Equity Basis) * Excludes proceeds from aftermarket divestiture * 45 (c) Dana Corporation. Dated April 21, 2004. Slide may contain forward-looking information. Actual results may differ materially due to factors discussed on slide 2 (Millions) |

| Peak Trough Greater Than 15% ROIC A/T Achieve at Least the Cost of Capital Shareholder Value 15% ROIC A/T Over the Cycle Restructuring Transformation 47 (c) Dana Corporation. Dated April 21, 2004. Slide may contain forward-looking information. Actual results may differ materially due to factors discussed on slide 2 |
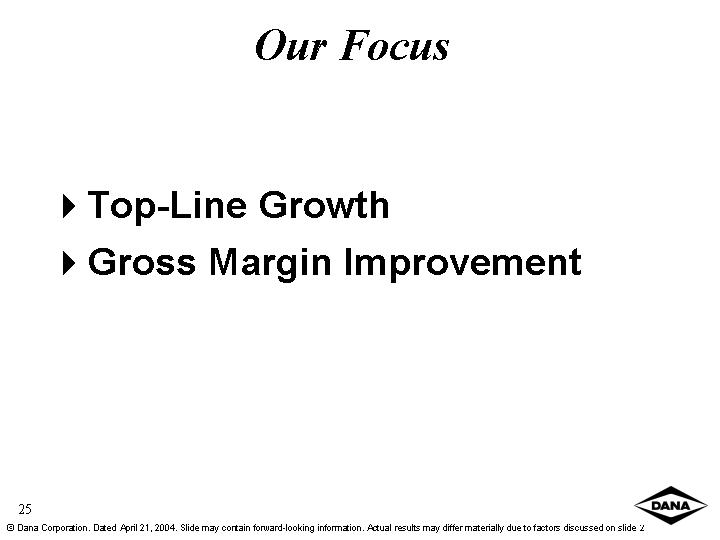
| Our Focus Top-Line Growth Gross Margin Improvement 49 (c) Dana Corporation. Dated April 21, 2004. Slide may contain forward-looking information. Actual results may differ materially due to factors discussed on slide 2 |
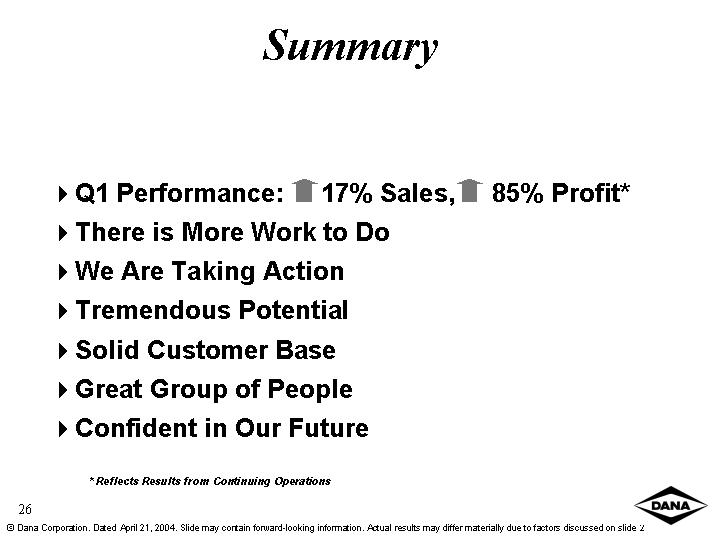
| Summary Q1 Performance: 17% Sales, 85% Profit* There is More Work to Do We Are Taking Action Tremendous Potential Solid Customer Base Great Group of People Confident in Our Future 51 (c) Dana Corporation. Dated April 21, 2004. Slide may contain forward-looking information. Actual results may differ materially due to factors discussed on slide 2 * Reflects Results from Continuing Operations |

| 53 (c)Dana Corporation. April 21, 2004. |
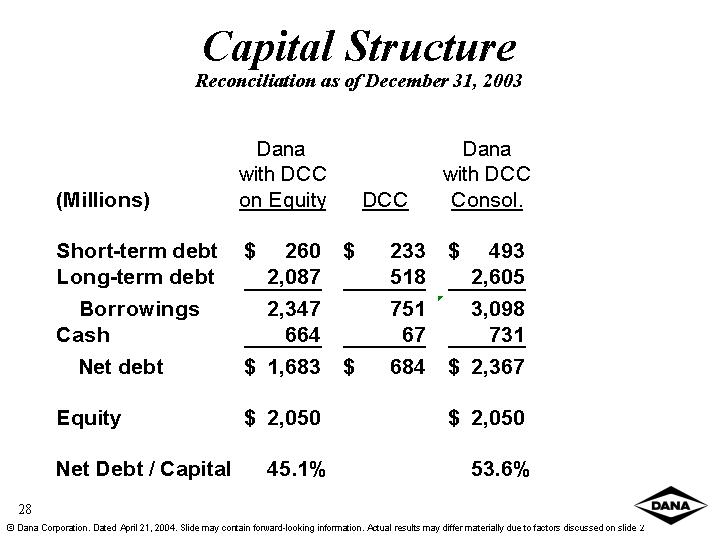
| Capital Structure Reconciliation as of December 31, 2003 55 (c) Dana Corporation. Dated April 21, 2004. Slide may contain forward-looking information. Actual results may differ materially due to factors discussed on slide 2 |

| Capital Structure Reconciliation as of March 31, 2004 57 (c) Dana Corporation. Dated April 21, 2004. Slide may contain forward-looking information. Actual results may differ materially due to factors discussed on slide 2 |