Exhibit 99.1
The Dana Story
Dana Holding Corporation
Bank of America Merrill Lynch Leveraged Finance Conference
Jim Yost
Executive Vice President & CFO
November 30, 2011
Safe Harbor Statement
Certain statements and projections contained in this presentation are, by their nature, forward-looking within the meaning of the Private Securities Litigation Reform Act of 1995. These forward-looking statements are based on our current expectations, estimates and projections about our industry and business, management’s beliefs, and certain assumptions made by us, all of which are subject to change. Forward-looking statements can often be identified by words such as “anticipates,” “expects,” “intends,” “plans,” “predicts,” “believes,” “seeks,” “estimates,” “may,” “will,” “should,” “would,” “could,” “potential,” “continue,” “ongoing,” similar expressions, and variations or negatives of these words. These forward-looking statements are not guarantees of future results and are subject to risks, uncertainties and assumptions that could cause our actual results to differ materially and adversely from those expressed in any forward-looking statement. Dana’s Annual Report on Form 10-K, subsequent Quarterly Reports on Form 10-Q, recent Current Reports on Form 8-K, and other Securities and Exchange Commission filings discuss important risk factors that could affect our business, results of operations and financial condition. The forward-looking statements in this presentation speak only as of this date. Dana does not undertake any obligation to revise or update publicly any forward-looking statement for any reason.
2 © Dana Limited
The Dana Story
Company Snapshot
• Founded in 1904
• Based in Maumee, Ohio
• 2010 sales: $6.1 billion
• Global customers and operations
• Production facilities in 26 countries
• 14 technical centers
• 87 manufacturing facilities
• Customers in 125 countries
• About 24,000 employees
3 © Dana Limited
The Dana Difference
Innovation and Technology Core Competencies
• Driveline Technologies
• Sealing Systems
• Thermal Management Solutions
Customer and market diversity
Global footprint
4 © Dana Limited
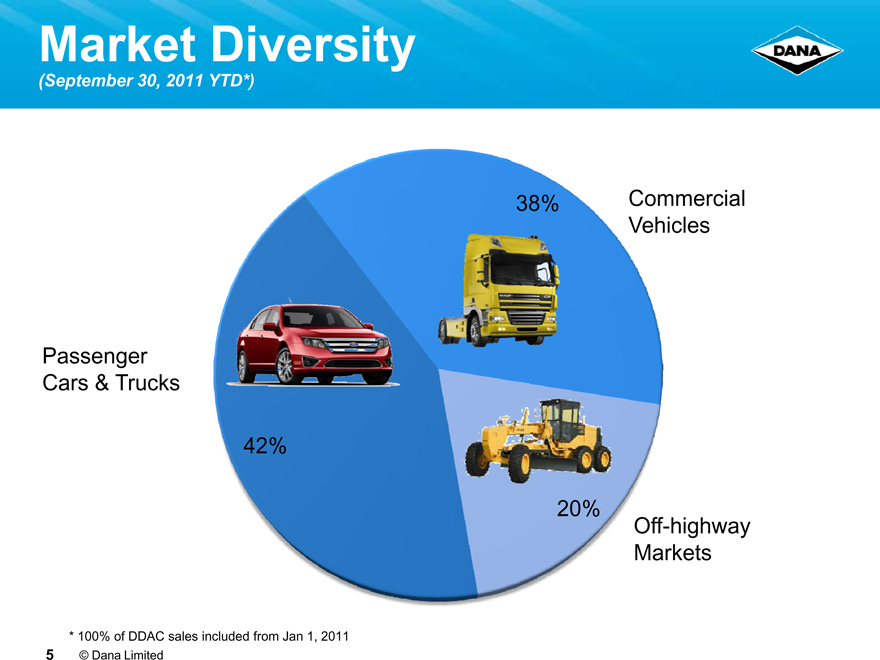
Market Diversity
(September 30, 2011 YTD*)
Passenger
Cars & Trucks
Commercial Vehicles
Off-highway Markets
42%
38%
20%
* 100% of DDAC sales included from Jan 1, 2011
5 © Dana Limited
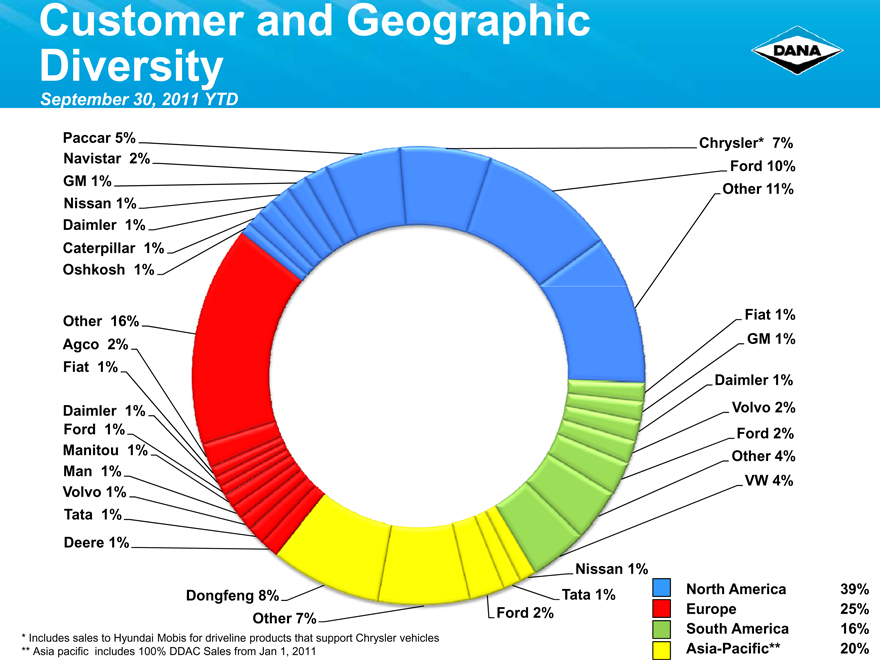
Customer and Geographic Diversity
September 30, 2011 YTD
Paccar 5% Navistar 2% GM 1% Nissan 1% Daimler 1% Caterpillar 1% Oshkosh 1%
Other 16% Agco 2% Fiat 1%
Daimler 1% Ford 1% Manitou 1% Man 1% Volvo 1% Tata 1% Deere 1%
Chrysler* 7%
Ford 10%
Other 11%
Fiat 1%
GM 1%
Daimler 1%
Volvo 2%
Ford 2%
Other 4%
VW 4%
Dongfeng 8% Other 7%
Nissan 1% Tata 1% Ford 2%
* Includes sales to Hyundai Mobis for driveline products that support Chrysler vehicles
** Asia pacific © Dana includes Limited 100% DDAC Sales from Jan 1, 2011
North America 39% Europe 25% South America 16% Asia-Pacific** 20%
Global Footprint
Our global manufacturing and engineering footprint is a competitive strength
Supports the growth of our global customers
Gains access to many new, non-traditional customers in emerging markets
7 © Dana Limited
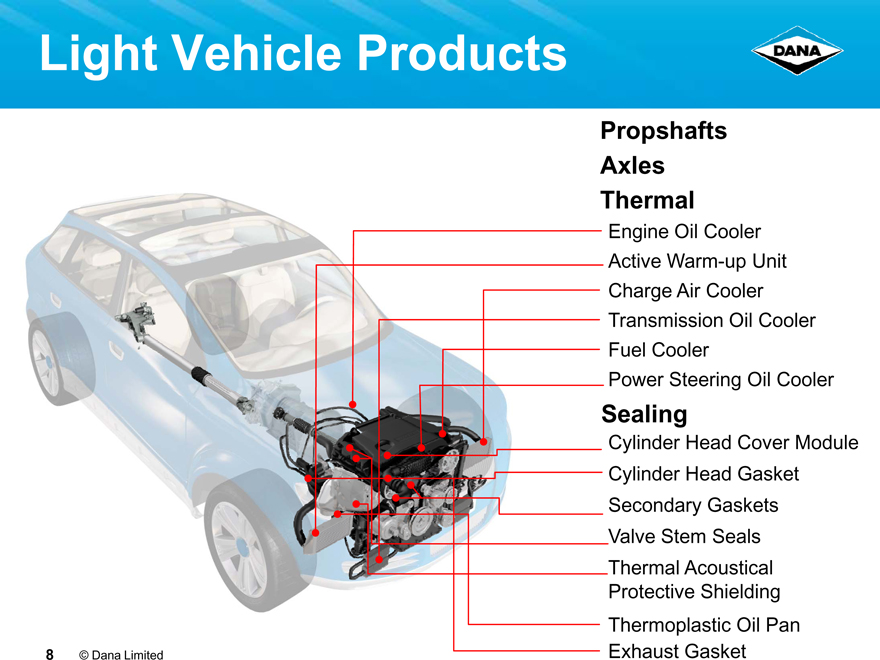
Light Vehicle Products
Propshafts Axles Thermal
Engine Oil Cooler Active Warm-up Unit
Charge Air Cooler
Transmission Oil Cooler Fuel Cooler
Power Steering Oil Cooler
Sealing
Cylinder Head Cover Module
Cylinder Head Gasket
Secondary Gaskets Valve Stem Seals Thermal Acoustical Protective Shielding Thermoplastic Oil Pan Exhaust Gasket
8 © Dana Limited
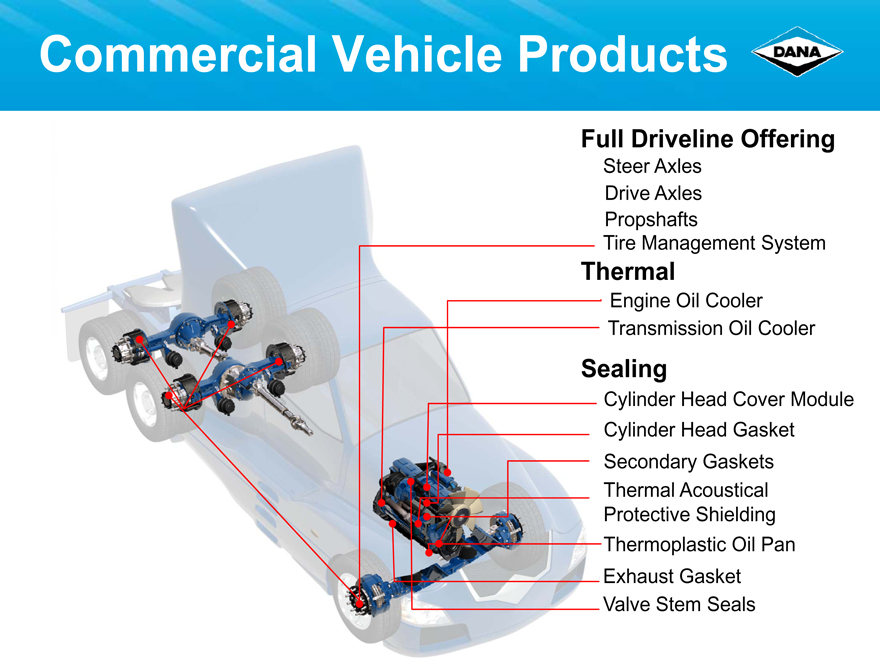
Commercial Vehicle Products
Full Driveline Offering
Steer Axles
Drive Axles
Propshafts
Tire Management System
Thermal
Engine Oil Cooler Transmission Oil Cooler
Sealing
Cylinder Head Cover Module Cylinder Head Gasket Secondary Gaskets
Thermal Acoustical Protective Shielding Thermoplastic Oil Pan Exhaust Gasket Valve Stem Seals
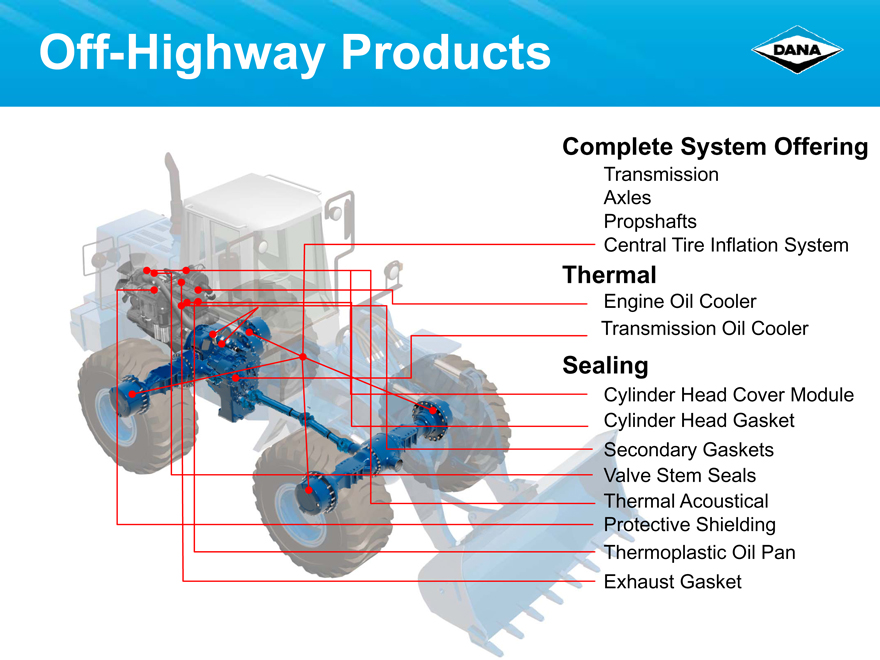
Off-Highway Products
Complete System Offering
Transmission
Axles Propshafts
Central Tire Inflation System
Thermal
Engine Oil Cooler Transmission Oil Cooler
Sealing
Cylinder Head Cover Module Cylinder Head Gasket Secondary Gaskets Valve Stem Seals Thermal Acoustical Protective Shielding Thermoplastic Oil Pan Exhaust Gasket
Battery Cooling Technology
20 Electric and Hybrid-Electric Platforms
Chevrolet Volt
Azure Dynamics (Ford Transit Connect EV)
Tesla Roadster
Ford Focus EV
11 © Dana Limited
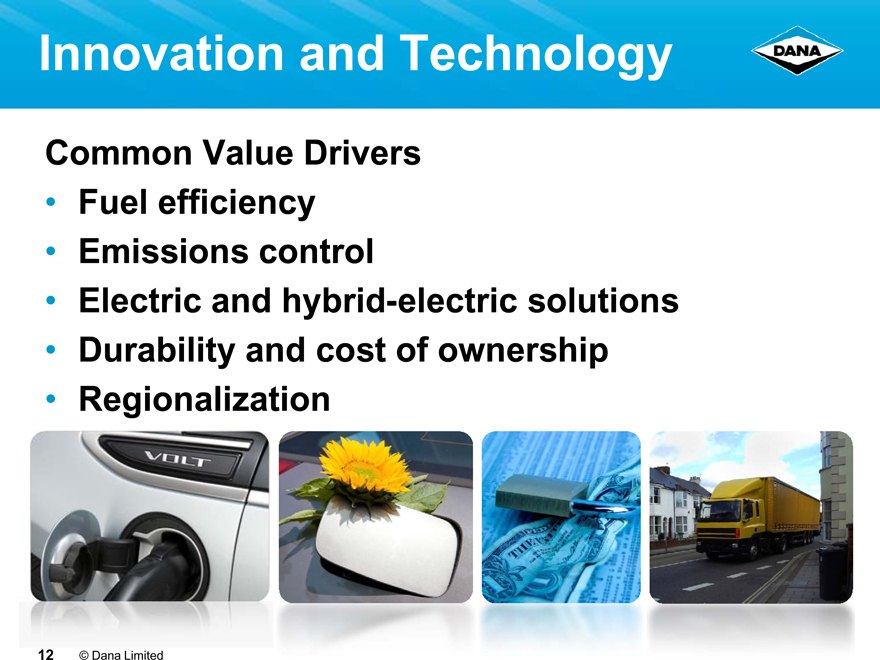
Innovation and Technology
Common Value Drivers
• Fuel efficiency
• Emissions control
• Electric and hybrid-electric solutions
• Durability and cost of ownership
• Regionalization
12 © Dana Limited
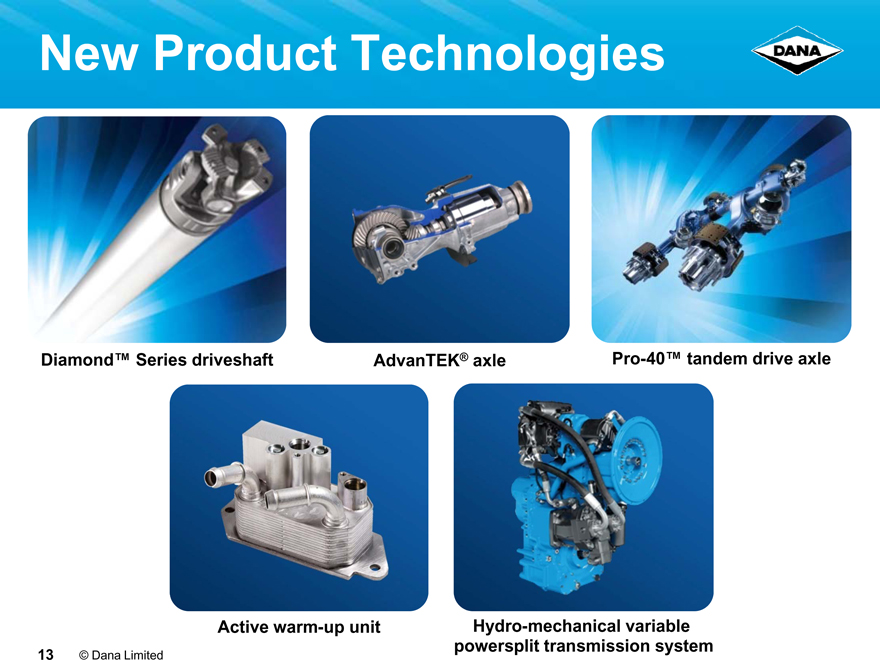
New Product Technologies
Diamond™ Series driveshaft
AdvanTEK® axle
Pro-40™ tandem drive axle
Active warm-up unit
Hydro-mechanical variable powersplit transmission system
13 © Dana Limited
Financial Flexibility
Sales and net income growth
Cost discipline
Strong balance sheet
14 © Dana Limited
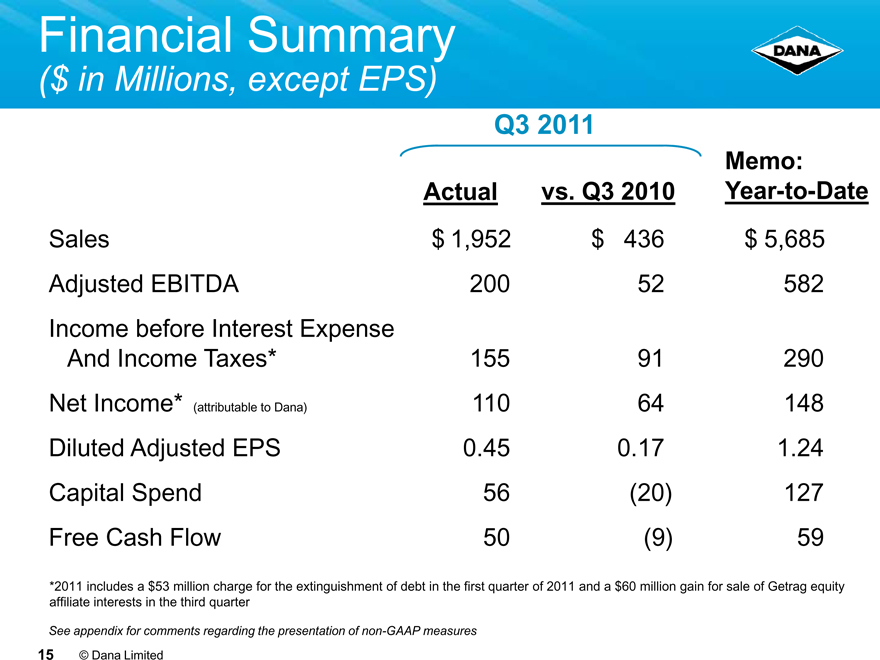
Financial Summary
($ in Millions, except EPS)
Q3 2011
Memo:
Actual vs. Q3 2010 Year-to-Date
Sales $ 1,952 $ 436 $ 5,685
Adjusted EBITDA 200 52 582
Income before Interest Expense
And Income Taxes* 155 91 290
Net Income* (attributable to Dana) 110 64 148
Diluted Adjusted EPS 0.45 0.17 1.24
Capital Spend 56 (20) 127
Free Cash Flow 50 (9) 59
*2011 includes a $53 million charge for the extinguishment of debt in the first quarter of 2011 and a $60 million gain for sale of Getrag equity affiliate interests in the third quarter
See appendix for comments regarding the presentation of non-GAAP measures
15 © Dana Limited
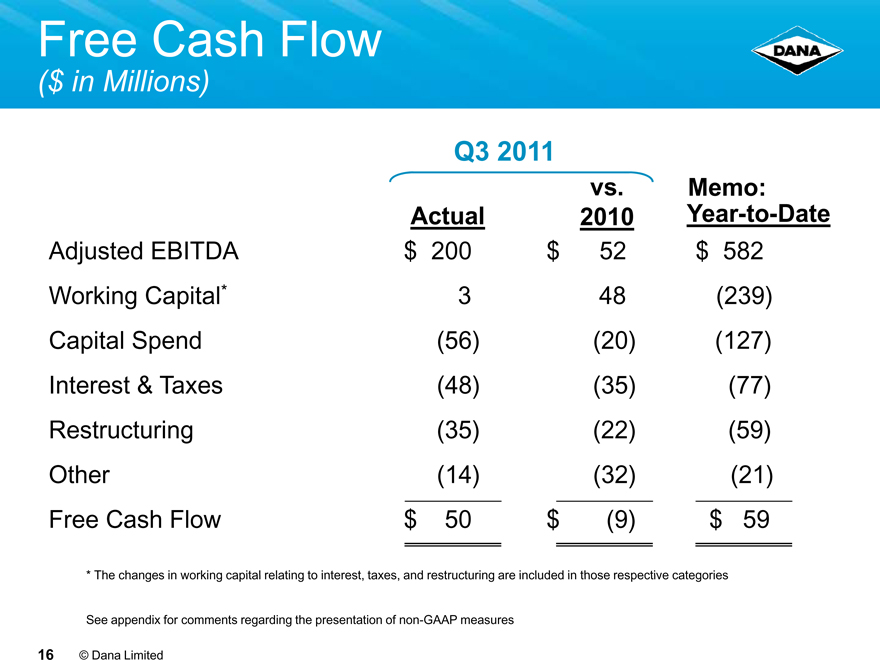
Free Cash Flow
($ in Millions)
Q3 2011
vs. Memo:
Actual 2010 Year-to-Date
Adjusted EBITDA $ 200 $ 52 $ 582
Working Capital* 3 48(239)
Capital Spend(56)(20)(127)
Interest & Taxes(48)(35)(77)
Restructuring(35)(22)(59)
Other(14)(32)(21)
Free Cash Flow $ 50 $(9) $ 59
* The changes in working capital relating to interest, taxes, and restructuring are included in those respective categories
See appendix for comments regarding the presentation of non-GAAP measures
16 © Dana Limited
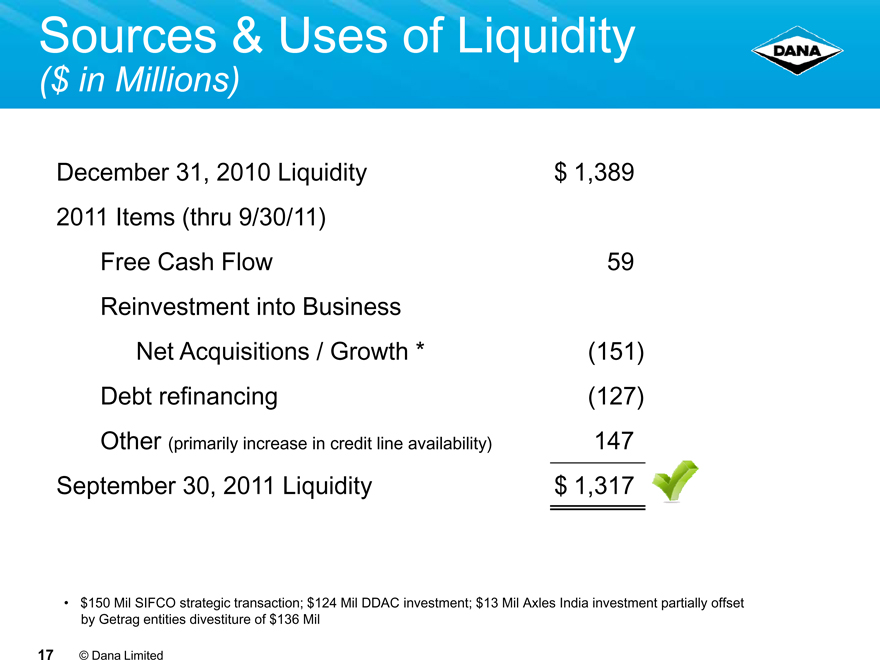
Sources & Uses of Liquidity
($ in Millions)
December 31, 2010 Liquidity $ 1,389
2011 Items (thru 9/30/11)
Free Cash Flow 59
Reinvestment into Business
Net Acquisitions / Growth *(151)
Debt refinancing(127)
Other (primarily increase in credit line availability) 147
September 30, 2011 Liquidity $ 1,317
• $150 Mil SIFCO strategic transaction; $124 Mil DDAC investment; $13 Mil Axles India investment partially offset by Getrag entities divestiture of $136 Mil
17 © Dana Limited
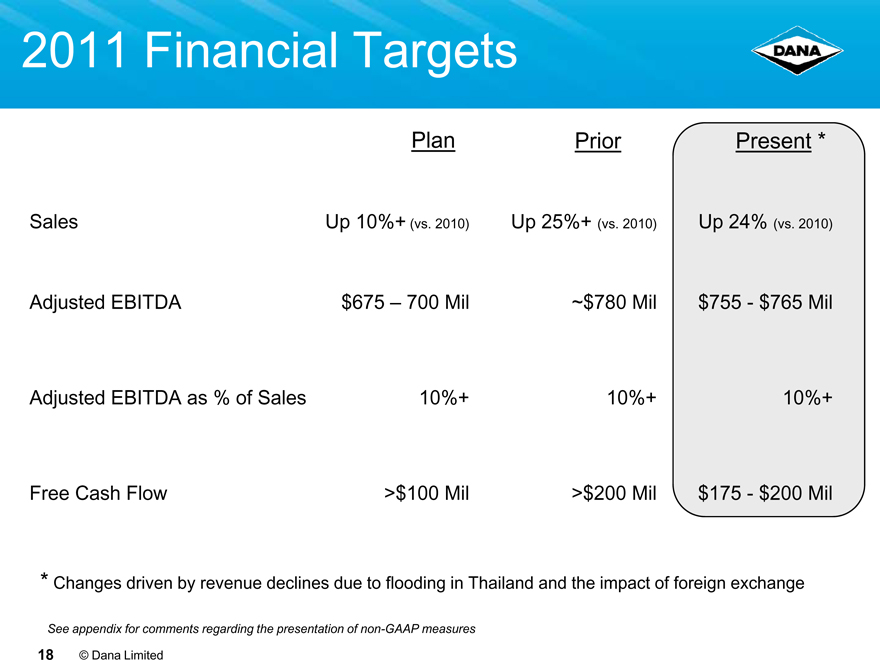
2011 Financial Targets
Plan Prior Present *
Sales Up 10%+ (vs. 2010) Up 25%+ (vs. 2010) Up 24% (vs. 2010)
Adjusted EBITDA $675 – 700 Mil ~$780 Mil $755—$765 Mil
Adjusted EBITDA as % of Sales 10%+ 10%+ 10%+
Free Cash Flow >$100 Mil >$200 Mil $175—$200 Mil
* Changes driven by revenue declines due to flooding in Thailand and the impact of foreign exchange
See appendix for comments regarding the presentation of non-GAAP measures
18 © Dana Limited
Financial flexibility + Abundance of opportunity + The Dana Difference =
Profitable, sustainable growth
Appendix: Non-GAAP Financial Information
The preceding slides refer to adjusted EBITDA, a non-GAAP financial measure we have defined as earnings before interest, taxes, depreciation, amortization, non-cash equity grant expense, restructuring expense and other nonrecurring items (gain/loss on debt extinguishment or divestitures, impairment, etc.). The most significant impact on Dana’s ongoing results of operations as a result of applying fresh start accounting is higher depreciation and amortization. By using adjusted EBITDA, a performance measure which excludes depreciation and amortization, the comparability of results is enhanced.
Management also believes that adjusted EBITDA is an important measure since the financial covenants in our debt agreements are based, in part, on adjusted EBITDA. Adjusted EBITDA should not be considered a substitute for income (loss) before income taxes, net income (loss) or other results reported in accordance with GAAP. Adjusted EBITDA may not be comparable to similarly titled measures reported by other companies.
Diluted adjusted EPS, another non-GAAP financial measure referenced in the preceding slides, is defined as adjusted net income divided by adjusted diluted shares. We define adjusted net income as net income (loss) attributable to the parent company excluding restructuring expense, amortization expense and nonrecurring items (as used in adjusted EBITDA), net of any associated income tax effects. We define adjusted diluted shares as diluted shares as determined in accordance with GAAP based on adjusted net income. This measure is considered useful for purposes of providing investors, analysts and other interested parties with an indicator of ongoing financial performance that provides enhanced comparability to EPS reported by other companies. Diluted adjusted EPS is neither intended to represent nor be an alternative measure to diluted EPS reported under GAAP.
Free cash flow is also a non-GAAP financial measure referenced in the preceding slides, which we have defined as cash provided by (used in) operating activities excluding any bankruptcy claim-related payments, less purchases of property, plant and equipment. We believe this measure is useful to investors in evaluating the operational cash flow of the company inclusive of the spending required to maintain the operations. Free cash flow is neither intended to represent nor be an alternative to the measure of net cash provided by (used in) operating activities reported under GAAP. Free cash flow may not be comparable to similarly titled measures reported by other companies.
Please reference the “Non-GAAP financial information” accompanying our quarterly earnings conference call presentations on our website at www.dana.com/investors for our GAAP results and reconciliations of adjusted EBITDA, diluted adjusted EPS and free cash flow to the most directly comparable financial measures calculated and presented in accordance with GAAP.
20 © Dana Limited