Exhibit 99.1

IMMEDIATE
Dana Incorporated Reports 2024 Adjusted EBITDA Growth of $40 Million,
Including Margin Improvement of 60 Basis Points;
Announces $300 Million Annualized Total Cost-Reduction Savings
Full-year Results
| • | Sales of $10.3 billion, a decrease of $271 million compared to last year |
| • | Net loss of $57 million, compared with a net income of $38 million in 2023 |
| • | Adjusted net income of $136 million compared with adjusted net income of $122 million last year |
| • | Adjusted EBITDA of $885 million, an increase of $40 million over last year |
| • | Adjusted EBITDA margin of 8.6 percent, a 60-basis-point improvement compared with 2023 |
| • | Free cash flow of $70 million, an increase of $95 million over 2023 |
| • | Three-year new business sales backlog of $650 million |
| • | 2025 guidance reflects 10 percent increase in adjusted EBITDA, $155 million increase in free cash flow |
MAUMEE, Ohio, Feb. 20, 2025 – Dana Incorporated (NYSE: DAN) today announced financial results for the fourth quarter and full-year 2024.
“Our 2024 results reflect the initial improvements we’ve implemented to streamline our cost structure, and we anticipate even greater progress in 2025,” said R. Bruce McDonald, Dana chairman and chief executive officer. “Dana continues to execute on our strategy and position the company for profitable growth and value creation. Our cost-savings actions are proceeding on schedule with over $100 million run-rate savings in place, and we are well on our way to our 2026 target of $300 million. Our 2025 outlook reflects accelerating savings and lower capital expenditures. We are confident that improving free cash flow generation will continue to create significant value for shareholders.”
Fourth-quarter 2024 Financial Results
Sales for the fourth quarter of 2024 totaled $2.3 billion, compared with $2.5 billion in the same period of 2023. Lower sales in 2024 were driven by lower market demand for electric vehicles, off-highway equipment, and lower vehicle production driven by higher inventory of certain light truck programs.
Adjusted EBITDA for the fourth quarter of 2024 was $186 million, compared with $156 million for the same period in 2023. Efficiency improvements, cost-savings actions, and recoveries from customers offset the margin impact of lower sales and inflation.
The net loss attributable to Dana was $80 million, or $0.55 per share, compared with a net loss of $39 million, or $0.27 per share, in the fourth quarter of 2023 due primarily to $31 million in higher restructuring charges to achieve cost-savings projects.
The adjusted net income attributable to Dana was $36 million, or $0.25 per share, for the fourth quarter of 2024, compared with an adjusted net loss of $11 million or $0.08 earnings per share in 2023.
1
Operating cash flow in the fourth quarter of 2024 was $302 million, compared with $278 million in the same period of 2023. Free cash flow was $149 million, compared with $136 million in the fourth quarter of 2023.
Full-year 2024 Financial Results
Sales for 2024 were $10.3 billion, compared with $10.6 billion in 2023. The decrease of $271 million was due to lower demand for vehicles in all end markets.
Adjusted EBITDA for 2024 was $885 million, compared with $845 million in 2023 driven by efficiency improvements and cost-savings actions; recoveries from customers offset the margin impact of lower sales and inflation.
The net loss attributable to Dana for 2024 was $57 million or $0.39 per share, compared with net income of $38 million or $0.26 per share in 2023. The 2024 loss was primarily due to $51 million in higher restructuring charges to achieve cost-savings projects and the $26 million loss on disposal of a business previously held for sale.
Adjusted net income attributable to Dana was $136 million and diluted adjusted earnings per share were $0.94 in 2024, compared with an adjusted net income of $122 million and $0.84 per share in 2023.
The company reported operating cash flow of $450 million in 2024 and free cash flow of $70 million, compared operating cash flow of $476 million and free cash flow use of $25 million in 2023. Improved free cash flow in 2024 was driven by increased profit, better working capital efficiency, and lower capital spending.
“Today we are affirming our previously announced guidance for 2025 financial targets,” said Timothy Kraus, senior vice president and chief financial officer. “Sales are expected to be lower for the year, mainly driven by lower demand for off-highway equipment and translation of foreign currency. The impact of our cost-savings actions, totaling $175 million in 2025, along with efficiency improvements will drive higher margins. Improved working capital efficiency and reduced capital expenditures will increase free cash flow.”
2025 Financial Targets
| • | Sales of $9.525 to $10.025 billion; |
| • | Adjusted EBITDA of $925 to $1,025 million, an implied adjusted EBITDA margin of approximately 10.0 percent at the midpoint of the range; |
| • | Operating cash flow of approximately $500 to $600 million; |
| • | Free cash flow of $175 to $275 million; and |
| • | Diluted Adjusted EPS of $1.40 to $1.90. |
Dana to Host Conference Call at 9 a.m. Thursday, Feb. 20
Dana will discuss its fourth-quarter and full-year results in a conference call at 9 a.m. EST on Thursday, Feb. 20. The conference call can be accessed by telephone from both domestic and international locations using the information provided below:
Conference ID: 9943139
Participant Toll-Free Dial-In Number: 1 (888) 440-5873
Participant Toll Dial-In Number: 1 (646) 960-0319
2
Audio streaming and slides will be available online via a link provided on the Dana investor website: www.dana.com/investors. Phone registration will be available beginning at 8:30 a.m. EST. A webcast replay can be accessed via Dana’s investor website following the call.
Non-GAAP Financial Information
Adjusted EBITDA is a non-GAAP financial measure which we have defined as net income (loss) before interest, income taxes, depreciation, amortization, equity grant expense, restructuring expense, non-service cost components of pension and other postretirement benefit costs and other adjustments not related to our core operations (gain/loss on debt extinguishment, pension settlements, divestitures, impairment, etc.). Adjusted EBITDA is a measure of our ability to maintain and continue to invest in our operations and provide shareholder returns. We use adjusted EBITDA in assessing the effectiveness of our business strategies, evaluating and pricing potential acquisitions and as a factor in making incentive compensation decisions. In addition to its use by management, we also believe adjusted EBITDA is a measure widely used by securities analysts, investors and others to evaluate financial performance of our company relative to other Tier 1 automotive suppliers. Adjusted EBITDA should not be considered a substitute for earnings (loss) before income taxes, net income (loss) or other results reported in accordance with GAAP. Adjusted EBITDA may not be comparable to similarly titled measures reported by other companies.
Adjusted net income (loss) attributable to the parent company is a non-GAAP financial measure which we have defined as net income (loss) attributable to the parent company, excluding any discrete income tax items, restructuring charges, amortization expense and other adjustments not related to our core operations (as used in adjusted EBITDA), net of any associated income tax effects. This measure is considered useful for purposes of providing investors, analysts and other interested parties with an indicator of ongoing financial performance that provides enhanced comparability to net income attributable to the parent company reported by other companies. Adjusted net income (loss) attributable to the parent company is neither intended to represent nor be an alternative measure to net income (loss) attributable to the parent company reported in accordance with GAAP.
Diluted adjusted EPS is a non-GAAP financial measure which we have defined as adjusted net income (loss) attributable to the parent company divided by adjusted diluted shares. We define adjusted diluted shares as diluted shares as determined in accordance with GAAP based on adjusted net income (loss) attributable to the parent company. This measure is considered useful for purposes of providing investors, analysts and other interested parties with an indicator of ongoing financial performance that provides enhanced comparability to EPS reported by other companies. Diluted adjusted EPS is neither intended to represent nor be an alternative measure to diluted EPS reported in accordance with GAAP.
Free cash flow is a non-GAAP financial measure which we have defined as net cash provided by (used in) operating activities less purchases of property, plant and equipment. We believe free cash flow is useful to investors in evaluating the operational cash flow of the company inclusive of the spending required to maintain the operations. Free cash flow is not intended to represent nor be an alternative to the measure of net cash provided by (used in) operating activities reported in accordance with GAAP. Free cash flow may not be comparable to similarly titled measures reported by other companies.
3
The accompanying financial information provides reconciliations of adjusted EBITDA, diluted adjusted EPS and free cash flow to the most directly comparable financial measures calculated and presented in accordance with GAAP. We have not provided a reconciliation of our adjusted EBITDA and diluted adjusted EPS outlook to the most comparable GAAP measures of net income (loss) and diluted EPS. Providing net income (loss) and diluted EPS guidance is potentially misleading and not practical given the difficulty of projecting event driven transactional and other non-core operating items that are included in net income (loss) and diluted EPS, including restructuring actions, asset impairments and certain income tax adjustments. The accompanying reconciliations of these non-GAAP measures with the most comparable GAAP measures for the historical periods presented are indicative of the reconciliations that will be prepared upon completion of the periods covered by the non-GAAP guidance.
Forward-Looking Statements
Certain statements and projections contained in this news release are, by their nature, forward-looking within the meaning of the Private Securities Litigation Reform Act of 1995. These forward-looking statements are based on our current expectations, estimates, and projections about our industry and business, management’s beliefs, and certain assumptions made by us, all of which are subject to change. Forward-looking statements can often be identified by words such as “anticipates,” “expects,” “intends,” “plans,” “predicts,” “believes,” “seeks,” “estimates,” “may,” “will,” “should,” “would,” “could,” “potential,” “continue,” “ongoing,” and similar expressions, and variations or negatives of these words. These forward-looking statements are not guarantees of future results and are subject to risks, uncertainties, and assumptions that could cause our actual results to differ materially and adversely from those expressed in any forward-looking statement.
Dana’s Annual Report on Form 10-K, subsequent Quarterly Reports on Form 10-Q, recent Current Reports on Form 8-K, and other Securities and Exchange Commission filings discuss important risk factors that could affect our business, results of operations and financial condition. The forward-looking statements in this news release speak only as of this date. Dana does not undertake any obligation to revise or update publicly any forward-looking statement for any reason.
About Dana Incorporated
Dana is a leader in the design and manufacture of highly efficient propulsion and energy-management solutions that power vehicles and machines in all mobility markets across the globe. The company is shaping sustainable progress through its conventional and clean-energy solutions that support nearly every vehicle manufacturer with drive and motion systems; electrodynamic technologies, including software and controls; and thermal, sealing, and digital solutions.
Based in Maumee, Ohio, USA, the company reported sales of $10.3 billion in 2024 with 39,000 people in 30 countries across six continents. With a history dating to 1904, Dana was named among the “World’s Most Ethical Companies” for 2024 by Ethisphere and as one of “America’s Most Responsible Companies 2025” by Newsweek. The company is driven by a high-performance culture that focuses on valuing others, inspiring innovation, growing responsibly, and winning together, earning it global recognition as a top employer. Learn more at dana.com.
###
| Contact: | Craig Barber | |
| +1-419-887-5166 | ||
| craig.barber@dana.com |
4
DANA INCORPORATED
Quarterly Financial Information and Reconciliations of Non-GAAP Financial Measures
Non-GAAP Financial Measures
Adjusted EBITDA is a non-GAAP financial measure which we have defined as net income (loss) before interest, income taxes, depreciation, amortization, equity grant expense, restructuring expense, non-service cost components of pension and other postretirement benefit costs and other adjustments not related to our core operations (gain/loss on debt extinguishment, pension settlements, divestitures, impairment, etc.). Adjusted EBITDA is a measure of our ability to maintain and continue to invest in our operations and provide shareholder returns. We use adjusted EBITDA in assessing the effectiveness of our business strategies, evaluating and pricing potential acquisitions and as a factor in making incentive compensation decisions. In addition to its use by management, we also believe adjusted EBITDA is a measure widely used by securities analysts, investors and others to evaluate financial performance of our company relative to other Tier 1 automotive suppliers. Adjusted EBITDA should not be considered a substitute for earnings (loss) before income taxes, net income (loss) or other results reported in accordance with GAAP. Adjusted EBITDA may not be comparable to similarly titled measures reported by other companies.
Adjusted net income (loss) attributable to the parent company is a non-GAAP financial measure which we have defined as net income (loss) attributable to the parent company, excluding any discrete income tax items, restructuring charges, amortization expense and other adjustments not related to our core operations (as used in adjusted EBITDA), net of any associated income tax effects. This measure is considered useful for purposes of providing investors, analysts and other interested parties with an indicator of ongoing financial performance that provides enhanced comparability to net income (loss) attributable to the parent company reported by other companies. Adjusted net income (loss) attributable to the parent company is neither intended to represent nor be an alternative measure to net income (loss) attributable to the parent company reported in accordance with GAAP.
Diluted adjusted EPS is a non-GAAP financial measure which we have defined as adjusted net income (loss) attributable to the parent company divided by adjusted diluted shares. We define adjusted diluted shares as diluted shares as determined in accordance with GAAP based on adjusted net income (loss) attributable to the parent company. This measure is considered useful for purposes of providing investors, analysts and other interested parties with an indicator of ongoing financial performance that provides enhanced comparability to EPS reported by other companies. Diluted adjusted EPS is neither intended to represent nor be an alternative measure to diluted EPS reported in accordance with GAAP.
Free cash flow is a non-GAAP financial measure which we have defined as net cash provided by (used in) operating activities less purchases of property, plant and equipment. We believe free cash flow is useful to investors in evaluating the operational cash flow of the company inclusive of the spending required to maintain the operations. Free cash flow is not intended to represent nor be an alternative to the measure of net cash provided by (used in) operating activities reported in accordance with GAAP. Free cash flow may not be comparable to similarly titled measures reported by other companies.
The accompanying financial information provides reconciliations of adjusted EBITDA, diluted adjusted EPS and free cash flow to the most directly comparable financial measures calculated and presented in accordance with GAAP. We have not provided a reconciliation of our adjusted EBITDA and diluted adjusted EPS outlook to the most comparable GAAP measures of net income (loss) and diluted EPS. Providing net income (loss) and diluted EPS guidance is potentially misleading and not practical given the difficulty of projecting event driven transactional and other non-core operating items that are included in net income (loss) and diluted EPS, including restructuring actions, asset impairments and certain income tax adjustments. The accompanying reconciliations of these non-GAAP measures with the most comparable GAAP measures for the historical periods presented are indicative of the reconciliations that will be prepared upon completion of the periods covered by the non-GAAP guidance.
DANA INCORPORATED
Consolidated Statement of Operations (Unaudited)
For the Three Months Ended December 31, 2024 and 2023
| Three Months Ended | ||||||||
| (In millions, except per share amounts) | December 31, | |||||||
| 2024 | 2023 | |||||||
Net sales | $ | 2,335 | $ | 2,494 | ||||
Costs and expenses | ||||||||
Cost of sales | 2,203 | 2,330 | ||||||
Selling, general and administrative expenses | 123 | 139 | ||||||
Amortization of intangibles | 3 | 3 | ||||||
Restructuring charges, net | 35 | 4 | ||||||
Other income (expense), net | (7 | ) | (7 | ) | ||||
|
|
|
| |||||
Earnings (loss) before interest and income taxes | (36 | ) | 11 | |||||
Interest income | 5 | 3 | ||||||
Interest expense | 43 | 40 | ||||||
|
|
|
| |||||
Loss before income taxes | (74 | ) | (26 | ) | ||||
Income tax expense | 5 | 3 | ||||||
Equity in earnings (loss) of affiliates | 3 | (15 | ) | |||||
|
|
|
| |||||
Net loss | (76 | ) | (44 | ) | ||||
Less: Noncontrolling interests net income | 4 | 5 | ||||||
Less: Redeemable noncontrolling interests net loss | — | (10 | ) | |||||
|
|
|
| |||||
Net loss attributable to the parent company | $ | (80 | ) | $ | (39 | ) | ||
|
|
|
| |||||
Net loss per share available to common stockholders | ||||||||
Basic | $ | (0.55 | ) | $ | (0.27 | ) | ||
Diluted | $ | (0.55 | ) | $ | (0.27 | ) | ||
Weighted-average shares outstanding - Basic | 145.3 | 144.5 | ||||||
Weighted-average shares outstanding - Diluted | 145.3 | 144.5 | ||||||
DANA INCORPORATED
Consolidated Statement of Operations
For the Year Ended December 31, 2024 and 2023
| Year Ended | ||||||||
| (In millions, except per share amounts) | December 31, | |||||||
| 2024 | 2023 | |||||||
Net sales | $ | 10,284 | $ | 10,555 | ||||
Costs and expenses | ||||||||
Cost of sales | 9,408 | 9,655 | ||||||
Selling, general and administrative expenses | 524 | 549 | ||||||
Amortization of intangibles | 13 | 13 | ||||||
Restructuring charges, net | 76 | 25 | ||||||
Loss on disposal group previously held for sale | (26 | ) | ||||||
Other income (expense), net | (11 | ) | 3 | |||||
|
|
|
| |||||
Earnings before interest and income taxes | 226 | 316 | ||||||
Loss on extinguishment of debt | (1 | ) | ||||||
Interest income | 15 | 17 | ||||||
Interest expense | 161 | 154 | ||||||
|
|
|
| |||||
Earnings before income taxes | 80 | 178 | ||||||
Income tax expense | 139 | 121 | ||||||
Equity in earnings (loss) of affiliates | 10 | (9 | ) | |||||
|
|
|
| |||||
Net income (loss) | (49 | ) | 48 | |||||
Less: Noncontrolling interests net income | 21 | 22 | ||||||
Less: Redeemable noncontrolling interests net loss | (13 | ) | (12 | ) | ||||
|
|
|
| |||||
Net income (loss) attributable to the parent company | $ | (57 | ) | $ | 38 | |||
|
|
|
| |||||
Net income (loss) per share available to common stockholders | ||||||||
Basic | $ | (0.39 | ) | $ | 0.26 | |||
Diluted | $ | (0.39 | ) | $ | 0.26 | |||
Weighted-average shares outstanding - Basic | 145.2 | 144.4 | ||||||
Weighted-average shares outstanding - Diluted | 145.2 | 144.6 | ||||||
DANA INCORPORATED
Consolidated Statement of Comprehensive Income (Unaudited)
For the Three Months Ended December 31, 2024 and 2023
| Three Months Ended | ||||||||
| December 31, | ||||||||
| (In millions) | 2024 | 2023 | ||||||
Net loss | $ | (76 | ) | $ | (44 | ) | ||
Other comprehensive income (loss), net of tax: | ||||||||
Currency translation adjustments | (65 | ) | 36 | |||||
Hedging gains and losses | (14 | ) | 2 | |||||
Defined benefit plans | 2 | (16 | ) | |||||
|
|
|
| |||||
Other comprehensive income (loss) | (77 | ) | 22 | |||||
|
|
|
| |||||
Total comprehensive loss | (153 | ) | (22 | ) | ||||
Less: Comprehensive income attributable to noncontrolling interests | (2 | ) | (6 | ) | ||||
Less: Comprehensive (income) loss attributable to redeemable noncontrolling interests | (1 | ) | 6 | |||||
|
|
|
| |||||
Comprehensive loss attributable to the parent company | $ | (156 | ) | $ | (22 | ) | ||
|
|
|
| |||||
DANA INCORPORATED
Consolidated Statement of Comprehensive Income
For the Year Ended December 31, 2024 and 2023
| Year Ended | ||||||||
| December 31, | ||||||||
| (In millions) | 2024 | 2023 | ||||||
Net income (loss) | $ | (49 | ) | $ | 48 | |||
Other comprehensive income (loss), net of tax: | ||||||||
Currency translation adjustments | (117 | ) | 30 | |||||
Hedging gains and losses | (49 | ) | (1 | ) | ||||
Defined benefit plans | 8 | (16 | ) | |||||
|
|
|
| |||||
Other comprehensive income (loss) | (158 | ) | 13 | |||||
|
|
|
| |||||
Total comprehensive income (loss) | (207 | ) | 61 | |||||
Less: Comprehensive income attributable to noncontrolling interests | (18 | ) | (22 | ) | ||||
Less: Comprehensive loss attributable to redeemable noncontrolling interests | 16 | 10 | ||||||
|
|
|
| |||||
Comprehensive income (loss) attributable to the parent company | $ | (209 | ) | $ | 49 | |||
|
|
|
| |||||
DANA INCORPORATED
Consolidated Balance Sheet
As of December 31, 2024 and December 31, 2023
| December 31, | December 31, | |||||||
| (In millions, except share and per share amounts) | 2024 | 2023 | ||||||
Assets | ||||||||
Current assets | ||||||||
Cash and cash equivalents | $ | 494 | $ | 529 | ||||
Accounts receivable | ||||||||
Trade, less allowance for doubtful accounts of $15 in 2024 and $16 in 2023 | 1,195 | 1,371 | ||||||
Other | 261 | 280 | ||||||
Inventories | 1,547 | 1,676 | ||||||
Other current assets | 206 | 247 | ||||||
|
|
|
| |||||
Total current assets | 3,703 | 4,103 | ||||||
Goodwill | 250 | 263 | ||||||
Intangibles | 150 | 182 | ||||||
Deferred tax assets | 560 | 516 | ||||||
Other noncurrent assets | 189 | 140 | ||||||
Investments in affiliates | 126 | 123 | ||||||
Operating lease assets | 293 | 327 | ||||||
Property, plant and equipment, net | 2,214 | 2,311 | ||||||
|
|
|
| |||||
Total assets | $ | 7,485 | $ | 7,965 | ||||
|
|
|
| |||||
Liabilities, redeemable noncontrolling interests and equity | ||||||||
Current liabilities | ||||||||
Short-term debt | $ | 8 | $ | 22 | ||||
Current portion of long-term debt | 214 | 35 | ||||||
Accounts payable | 1,522 | 1,756 | ||||||
Accrued payroll and employee benefits | 236 | 288 | ||||||
Taxes on income | 69 | 86 | ||||||
Current portion of operating lease liabilities | 44 | 42 | ||||||
Other accrued liabilities | 468 | 373 | ||||||
|
|
|
| |||||
Total current liabilities | 2,561 | 2,602 | ||||||
Long-term debt, less debt issuance costs of $19 in 2024 and $24 in 2023 | 2,389 | 2,598 | ||||||
Noncurrent operating lease liabilities | 258 | 284 | ||||||
Pension and postretirement obligations | 295 | 334 | ||||||
Other noncurrent liabilities | 397 | 319 | ||||||
|
|
|
| |||||
Total liabilities | 5,900 | 6,137 | ||||||
|
|
|
| |||||
Commitments and contingencies | ||||||||
Redeemable noncontrolling interests | 189 | 191 | ||||||
Parent company stockholders’ equity | ||||||||
Preferred stock, 50,000,000 shares authorized, $0.01 par value, no shares outstanding | — | — | ||||||
Common stock, 450,000,000 shares authorized, $0.01 par value, 144,993,614 and 144,386,484 shares outstanding | 2 | 2 | ||||||
Additional paid-in capital | 2,282 | 2,255 | ||||||
Retained earnings | 204 | 317 | ||||||
Treasury stock, at cost (837,803 and 474,981 shares) | (13 | ) | (9 | ) | ||||
Accumulated other comprehensive loss | (1,142 | ) | (990 | ) | ||||
|
|
|
| |||||
Total parent company stockholders’ equity | 1,333 | 1,575 | ||||||
Noncontrolling interests | 63 | 62 | ||||||
|
|
|
| |||||
Total equity | 1,396 | 1,637 | ||||||
|
|
|
| |||||
Total liabilities, redeemable noncontrolling interests and equity | $ | 7,485 | $ | 7,965 | ||||
|
|
|
| |||||
DANA INCORPORATED
Consolidated Statement of Cash Flows (Unaudited)
For the Three Months Ended December 31, 2024 and 2023
| (In millions) | Three Months Ended December 31, | |||||||
| 2024 | 2023 | |||||||
Operating activities | ||||||||
Net loss | $ | (76 | ) | $ | (44 | ) | ||
Depreciation | 97 | 106 | ||||||
Amortization | 5 | 6 | ||||||
Amortization of deferred financing charges | 2 | 1 | ||||||
Earnings of affiliates, net of dividends received | (3 | ) | 15 | |||||
Stock compensation expense | 9 | 7 | ||||||
Deferred income taxes | (47 | ) | (58 | ) | ||||
Pension expense, net | (1 | ) | ||||||
Change in working capital | 288 | 239 | ||||||
Change in other noncurrent assets and liabilities | 40 | (2 | ) | |||||
Other, net | (13 | ) | 9 | |||||
|
|
|
| |||||
Net cash provided by operating activities | 302 | 278 | ||||||
|
|
|
| |||||
Investing activities | ||||||||
Purchases of property, plant and equipment | (153 | ) | (142 | ) | ||||
Proceeds from sale of property, plant and equipment | 4 | 2 | ||||||
Settlements of undesignated derivatives | (3 | ) | ||||||
Other, net | 2 | (2 | ) | |||||
|
|
|
| |||||
Net cash used in investing activities | (147 | ) | (145 | ) | ||||
|
|
|
| |||||
Financing activities | ||||||||
Net change in short-term debt | (14 | ) | (15 | ) | ||||
Repayment of long-term debt | (2 | ) | (2 | ) | ||||
Dividends paid to common stockholders | (15 | ) | (15 | ) | ||||
Distributions to noncontrolling interests | (3 | ) | ||||||
Contributions from redeemable noncontrolling interests | 4 | |||||||
Other, net | (1 | ) | ||||||
|
|
|
| |||||
Net cash used in financing activities | (34 | ) | (29 | ) | ||||
|
|
|
| |||||
Net increase in cash, cash equivalents and restricted cash | 121 | 104 | ||||||
Cash, cash equivalents and restricted cash - beginning of period | 435 | 440 | ||||||
Effect of exchange rate changes on cash balances | (44 | ) | 19 | |||||
|
|
|
| |||||
Cash, cash equivalents and restricted cash - end of period | $ | 512 | $ | 563 | ||||
|
|
|
| |||||
DANA INCORPORATED
Consolidated Statement of Cash Flows
For the Year Ended December 31, 2024 and 2023
| Year Ended | ||||||||
| (In millions) | December 31, | |||||||
| 2024 | 2023 | |||||||
Operating activities | ||||||||
Net income (loss) | $ | (49 | ) | $ | 48 | |||
Depreciation | 401 | 393 | ||||||
Amortization | 21 | 23 | ||||||
Amortization of deferred financing charges | 6 | 5 | ||||||
Write-off of deferred financing costs | 1 | |||||||
Earnings of affiliates, net of dividends received | (7 | ) | 11 | |||||
Stock compensation expense | 30 | 26 | ||||||
Deferred income taxes | (29 | ) | (104 | ) | ||||
Pension expense, net | 1 | 3 | ||||||
Change in working capital | 27 | 70 | ||||||
Change in other noncurrent assets and liabilities | 25 | 11 | ||||||
Loss on disposal group previously held for sale | 26 | |||||||
Other, net | (2 | ) | (11 | ) | ||||
|
|
|
| |||||
Net cash provided by operating activities | 450 | 476 | ||||||
|
|
|
| |||||
Investing activities | ||||||||
Purchases of property, plant and equipment | (380 | ) | (501 | ) | ||||
Proceeds from sale of property, plant and equipment | 11 | 2 | ||||||
Settlements of undesignated derivatives | (5 | ) | (13 | ) | ||||
Other, net | 22 | (16 | ) | |||||
|
|
|
| |||||
Net cash used in investing activities | (352 | ) | (528 | ) | ||||
|
|
|
| |||||
Financing activities | ||||||||
Net change in short-term debt | (14 | ) | (30 | ) | ||||
Proceeds from long-term debt | 1 | 458 | ||||||
Repayment of long-term debt | (37 | ) | (209 | ) | ||||
Deferred financing payments | (9 | ) | ||||||
Dividends paid to common stockholders | (58 | ) | (58 | ) | ||||
Distributions to noncontrolling interests | (20 | ) | (10 | ) | ||||
Collection of note receivable from redeemable noncontrolling interest | 11 | |||||||
Contributions from redeemable noncontrolling interests | 18 | 22 | ||||||
Other, net | 9 | (4 | ) | |||||
|
|
|
| |||||
Net cash provided by (used in) financing activities | (90 | ) | 160 | |||||
|
|
|
| |||||
Net increase in cash, cash equivalents and restricted cash | 8 | 108 | ||||||
Cash, cash equivalents and restricted cash - beginning of period | 563 | 442 | ||||||
Effect of exchange rate changes on cash balances | (59 | ) | 13 | |||||
|
|
|
| |||||
Cash, cash equivalents and restricted cash - end of period | $ | 512 | $ | 563 | ||||
|
|
|
| |||||
DANA INCORPORATED
Reconciliation of Net Cash Provided By Operating Activities to
Free Cash Flow (Unaudited)
| Three Months Ended | ||||||||
| (In millions) | December 31, | |||||||
| 2024 | 2023 | |||||||
Net cash provided by operating activities | $ | 302 | $ | 278 | ||||
Purchases of property, plant and equipment | (153 | ) | (142 | ) | ||||
|
|
|
| |||||
Free cash flow | $ | 149 | $ | 136 | ||||
|
|
|
| |||||
| Year Ended | ||||||||
| (In millions) | December 31, | |||||||
| 2024 | 2023 | |||||||
Net cash provided by operating activities | $ | 450 | $ | 476 | ||||
Purchases of property, plant and equipment | (380 | ) | (501 | ) | ||||
|
|
|
| |||||
Free cash flow | $ | 70 | $ | (25 | ) | |||
|
|
|
| |||||
DANA INCORPORATED
Segment Sales and Segment EBITDA (Unaudited)
For the Three Months Ended December 31, 2024 and 2023
| Three Months Ended | ||||||||
| (In millions) | December 31, | |||||||
| 2024 | 2023 | |||||||
Sales | ||||||||
Light Vehicle | $ | 961 | $ | 923 | ||||
Commercial Vehicle | 460 | 509 | ||||||
Off-Highway | 613 | 762 | ||||||
Power Technologies | 301 | 300 | ||||||
|
|
|
| |||||
Total Sales | $ | 2,335 | $ | 2,494 | ||||
|
|
|
| |||||
Segment EBITDA | ||||||||
Light Vehicle | $ | 85 | $ | 22 | ||||
Commercial Vehicle | 1 | 13 | ||||||
Off-Highway | 85 | 106 | ||||||
Power Technologies | 17 | 19 | ||||||
|
|
|
| |||||
Total Segment EBITDA | 188 | 160 | ||||||
Corporate expense and other items, net | (2 | ) | (4 | ) | ||||
|
|
|
| |||||
Adjusted EBITDA | $ | 186 | $ | 156 | ||||
|
|
|
| |||||
DANA INCORPORATED
Segment Sales and Segment EBITDA
For the Year Ended December 31, 2024 and 2023
| Year Ended | ||||||||
| (In millions) | December 31, | |||||||
| 2024 | 2023 | |||||||
Sales | ||||||||
Light Vehicle | $ | 4,224 | $ | 4,035 | ||||
Commercial Vehicle | 2,005 | 2,092 | ||||||
Off-Highway | 2,767 | 3,185 | ||||||
Power Technologies | 1,288 | 1,243 | ||||||
|
|
|
| |||||
Total Sales | $ | 10,284 | $ | 10,555 | ||||
|
|
|
| |||||
Segment EBITDA | ||||||||
Light Vehicle | $ | 314 | $ | 212 | ||||
Commercial Vehicle | 67 | 87 | ||||||
Off-Highway | 419 | 465 | ||||||
Power Technologies | 92 | 89 | ||||||
|
|
|
| |||||
Total Segment EBITDA | 892 | 853 | ||||||
Corporate expense and other items, net | (7 | ) | (8 | ) | ||||
|
|
|
| |||||
Adjusted EBITDA | $ | 885 | $ | 845 | ||||
|
|
|
| |||||
DANA INCORPORATED
Reconciliation of Segment and Adjusted EBITDA to Earnings (Loss)
Before Income Taxes (Unaudited)
For the Three Months Ended December 31, 2024 and 2023
| Three Months Ended | ||||||||
| (In millions) | December 31, | |||||||
| 2024 | 2023 | |||||||
Segment EBITDA | $ | 188 | $ | 160 | ||||
Corporate expense and other items, net | (2 | ) | (4 | ) | ||||
|
|
|
| |||||
Adjusted EBITDA | 186 | 156 | ||||||
Depreciation | (97 | ) | (106 | ) | ||||
Amortization | (5 | ) | (6 | ) | ||||
Non-service cost components of pension and OPEB costs | (4 | ) | (3 | ) | ||||
Restructuring charges, net | (35 | ) | (4 | ) | ||||
Stock compensation expense | (9 | ) | (7 | ) | ||||
Strategic transaction expenses | (4 | ) | (1 | ) | ||||
Loss on sale of property, plant and equipment | (1 | ) | ||||||
Distressed supplier costs | (18 | ) | ||||||
Supplier capacity commitment charge | (46 | ) | ||||||
Amount attributable to previously divested/closed operations | (9 | ) | ||||||
Other items | (12 | ) | ||||||
|
|
|
| |||||
Earnings (loss) before interest and income taxes | (36 | ) | 11 | |||||
Interest income | 5 | 3 | ||||||
Interest expense | 43 | 40 | ||||||
|
|
|
| |||||
Loss before income taxes | $ | (74 | ) | $ | (26 | ) | ||
|
|
|
| |||||
DANA INCORPORATED
Reconciliation of Segment and Adjusted EBITDA to Earnings
Before Income Taxes
For the Year Ended December 31, 2024 and 2023
| Year Ended | ||||||||
| (In millions) | December 31, | |||||||
| 2024 | 2023 | |||||||
Segment EBITDA | $ | 892 | $ | 853 | ||||
Corporate expense and other items, net | (7 | ) | (8 | ) | ||||
|
|
|
| |||||
Adjusted EBITDA | 885 | 845 | ||||||
Depreciation | (401 | ) | (393 | ) | ||||
Amortization | (21 | ) | (23 | ) | ||||
Non-service cost components of pension and OPEB costs | (18 | ) | (13 | ) | ||||
Restructuring charges, net | (76 | ) | (25 | ) | ||||
Stock compensation expense | (30 | ) | (26 | ) | ||||
Strategic transaction expenses | (9 | ) | (5 | ) | ||||
Loss on sale of property, plant and equipment | (6 | ) | (1 | ) | ||||
Distressed supplier costs | (44 | ) | ||||||
Supplier capacity commitment charge | (46 | ) | ||||||
Loss on disposal group previously held for sale | (26 | ) | ||||||
Amount attributable to previously divested/closed operations | (9 | ) | ||||||
Other items | (17 | ) | 1 | |||||
|
|
|
| |||||
Earnings before interest and income taxes | 226 | 316 | ||||||
Loss on extinguishment of debt | (1 | ) | ||||||
Interest income | 15 | 17 | ||||||
Interest expense | 161 | 154 | ||||||
|
|
|
| |||||
Earnings before income taxes | $ | 80 | $ | 178 | ||||
|
|
|
| |||||
DANA INCORPORATED
Reconciliation of Net Loss Attributable to the Parent Company to
Adjusted Net Income (Loss) Attributable to the Parent Company and
Diluted Adjusted EPS (Unaudited)
For the Three Months Ended December 31, 2024 and 2023
| (In millions, except per share amounts) | ||||||||
| Three Months Ended | ||||||||
| December 31, | ||||||||
| 2024 | 2023 | |||||||
Net loss attributable to the parent company | $ | (80 | ) | $ | (39 | ) | ||
Items impacting income before income taxes: | ||||||||
Amortization | 5 | 5 | ||||||
Restructuring charges, net | 35 | 3 | ||||||
Strategic transaction expenses | 4 | 1 | ||||||
Distressed supplier costs | 18 | |||||||
Supplier capacity commitment charge | 46 | |||||||
Amount attributable to previously divested/closed operations | 9 | |||||||
Other items | 9 | (1 | ) | |||||
Items impacting income taxes: | ||||||||
Net income tax (expense) benefit on items above | (3 | ) | 6 | |||||
Income tax expense (benefit) attributable to various discrete tax matters | 11 | (4 | ) | |||||
|
|
|
| |||||
Adjusted net income (loss) attributable to the parent company | $ | 36 | $ | (11 | ) | |||
|
|
|
| |||||
Diluted shares - as reported | 145.3 | 144.5 | ||||||
Adjusted diluted shares | 145.9 | 144.5 | ||||||
Diluted adjusted EPS | $ | 0.25 | $ | (0.08 | ) | |||
DANA INCORPORATED
Reconciliation of Net Income (Loss) Attributable to the Parent Company to
Adjusted Net Income Attributable to the Parent Company and
Diluted Adjusted EPS (Unaudited)
For the Year Ended December 31, 2024 and 2023
| (In millions, except per share amounts) | ||||||||
| Year Ended | ||||||||
| December 31, | ||||||||
| 2024 | 2023 | |||||||
Net income (loss) attributable to the parent company | $ | (57 | ) | $ | 38 | |||
Items impacting income before income taxes: | ||||||||
Amortization | 20 | 20 | ||||||
Restructuring charges, net | 76 | 24 | ||||||
Strategic transaction expenses | 9 | 5 | ||||||
Distressed supplier costs | 44 | |||||||
Supplier capacity commitment charge | 46 | |||||||
Amount attributable to previously divested/closed operations | 9 | |||||||
Loss on disposal group previously held for sale | 26 | |||||||
Other items | 9 | 1 | ||||||
Items impacting income taxes: | ||||||||
Net income tax expense on items above | (37 | ) | (20 | ) | ||||
Income tax expense attributable to various discrete tax matters | 35 | 10 | ||||||
|
|
|
| |||||
Adjusted net income attributable to the parent company | $ | 136 | $ | 122 | ||||
|
|
|
| |||||
Diluted shares - as reported | 145.2 | 144.6 | ||||||
Adjusted diluted shares | 145.4 | 144.6 | ||||||
Diluted adjusted EPS | $ | 0.94 | $ | 0.84 | ||||

2024 Fourth-Quarter & Full-Year Earnings Conference Call February 20, 2025 Value Others | Inspire Innovation | Grow Responsibly | Win Together

Safe Harbor Statement Certain statements and projections contained in this presentation are, by their nature, forward-looking within the meaning of the Private Securities Litigation Reform Act of 1995. These forward-looking statements are based on our current expectations, estimates and projections about our industry and business, management’s beliefs, and certain assumptions made by us, all of which are subject to change. Forward-looking statements can often be identified by words such as “anticipates,” “expects,” “intends,” “plans,” “predicts,” “believes,” “seeks,” “estimates,” “may,” “will,” “should,” “would,” “could,” “potential,” “continue,” “ongoing,” similar expressions, and variations or negatives of these words. These forward-looking statements are not guarantees of future results and are subject to risks, uncertainties and assumptions that could cause our actual results to differ materially and adversely from those expressed in any forward-looking statement. Dana’s Annual Report on Form 10-K, subsequent Quarterly Reports on Form 10-Q, recent Current Reports on Form 8-K, and other Securities and Exchange Commission filings discuss © important risk factors that could affect our business, results of operations and financial 2025 condition. The forward-looking statements in this presentation speak only as of this date. Dana Dana does not undertake any obligation to revise or update publicly any forward-looking statement for any reason. 2
Agenda Craig Barber R. Bruce McDonald Timothy Kraus Senior Relations Director, and Corporate Investor Chairman and Senior Chief Financial Vice President Officerand Chief Executive Officer Communications Introduction Business Review Financial Review

2024 Financial Results Full-Year Financial Results Key Highlights sales End-Market ? Lower demand for EVs and $271 million Demand ICE vehicle programs from prior year? Weak off-highway equipment demand in 2nd half adjusted EBITDA $40 million from prior year Efficiency and ? Conversion on organic sales drove margin improvement margin Cost Savings ? Cost-savings actions underway 60 bps from prior year© 2025 free cash flow? Higher profit and lower capex Focus on drove improved FCF Dana Free Cash Flow? Better working capital efficiency $95 million in 2025 from prior year 4 Sales In-Line with Expectations, Profit Higher, Some FCF Delayed to 2025

Strategy for New Dana Dana Strategy Financial Commitments Focus on efficiency and generate value 1 Total 2026 cost-reduction target of $300M 1 Focus on core on-highway end markets ? Revised EV commercial strategy ? Divest Off-Highway business overhead Expect signing in early Q2; closing ? Downsizing corporate structure? by year end ? Complexity reduction ? New Dana will be a more streamlined organization 2 Measured approach to EV market 2 New Dana target adjusted EBITDA margins ? Lower volume and longer lead times allow for more ? 8.1%—8.6% in 2025 efficient program management 9.—10.5% in ? 5% 2026 ? Disciplined investment philosophy—Inclusive of $300M of cost savings less $40M of stranded cost from Off-Highway sale 3 Streamlined cost structure © Strong balance sheet, targeting net leverage 2025 ? Actions will yield ~$300M in annual savings 3 of 1x through the cycle Dana ? Moving to two business segments in new Dana Free cash of ~4% of sales—Power Technologies segment will be integrated? flow 5 Strategy Will Increase Profit, Reduce Leverage, and Add Significant Value

2025 Market Outlook and Backlog 2025 Market Outlook 3-Year Net New Sales Backlog: $650M ($ in millions) Light Vehicle Flat 2025 $150 $150 Commercial 2026 $150 $300 $450 Vehicle <(5%) 2027 $450 $200 $650 Off-Highway © <(5%) 2025 Market ‘25 Backlog Total Dana ~$435M ~$150M ~$285M Sales Impact 6 Weaker End-Market Demand Partially Offset by New Business Wins

Financial Review

2024 Q4 and Full-Year Financial Results ? Lower sales driven by Changes from Prior Year weakening market demand for electric vehicles, commercial ($ in millions, except EPS) Q4 ‘24 Q4 ‘23 Change FY ‘24 FY ‘23 Change trucks, off-highway equipment, and certain light-truck Sales $ 2,335 $ 2,494 $ (159) $ 10,284 $ 10,555 $ (271) programs, as well as currency impacts and lower commodity Adjusted EBITDA 186 156 (30) 885 845 40 recoveries Margin 8.0% 6.3% 170 bps 8.6% 8.0% 60 bps ? Increased production efficiency and company-wide cost Restructuring Charges, Net 35 4 31 76 25 51 improvement actions drove higher profitability Loss on Business Previously Held for Sale ——(26)—(26) ? Loss on European hydraulics business that was previously held for sale EBIT (36) 11 (47) 226 316 (90)? Net loss impacted primarily by Interest Expense, Net 38 37 1 146 137 9 higher restructuring charges Income Tax Expense 5 3 2 139 121 18 Net Income (Loss) (attributable to Dana) (80) (39) (41) (57) 38 (95) © 2025 GAAP Diluted EPS $ (0.55) $ (0.27) $ (0.28) $ (0.39) $ 0.26 $ (0.65) Dana Diluted Adjusted EPS $ 0.25 $ (0.08) $ 0.33 $ 0.94 $ 0.84 $ 0.10 Free Cash Flow 149 136 13 70 (25) 95 8 See appendix for comments regarding the presentation of non-GAAP measures Margin Improvement in Challenging Demand Environment

2024 Q4 Sales and Profit Changes Lower organic sales driven by Sales reduced demand in heavy- $2,494M vehicle markets $2,335M $0M ($135M) ($1M) ($15M) ($8M) Efficiency gains drove profit improvement despite organic sales headwinds Cost recoveries for delayed EV programs of ~$15 million Cost savings program benefiting margin by 40 basis points 2023 Organic Cost Savings Divestiture Currency Commodities 2024 Translation of foreign currency Adjusted EBITDA was a slight headwind to sales $33M $10M Lower commodity costs $0M $186M ($1M) resulted in lower sales $156M ($12M) recoveries; profit benefit of lower input cost is more than offset by the cost true-ups with © customers 2025 6.3% 8.0% Margin ~175 bps ~40 bps ~0 bps ~0 bps ~(45) bps MarginDana 2023 Organic Cost Savings Divestiture Currency Commodities 2024 See appendix for comments regarding the presentation of non-GAAP measures 9 Improved Magin Performance Driven by Strong Execution, Cost Savings, and Recoveries

2024 Full-Year Sales and Profit Changes ? Organic growth impacted by Sales lower end-market demand in $10,555M 2nd half $0M $10,284M ($164M) ($5M) ($49M) ($53M)? Margin benefiting from improved efficiencies and cost savings actions? Translation of foreign currency was a slight headwind to sales? Lower commodity costs resulting in lower sales recoveries; profit benefit of 2023 Organic Cost Savings Divestiture Currency Commodities 2024 lower input cost is more than offset by the cost true-ups with Adjusted EBITDA customers $10M $76M $0M ($6M) $885M $845M ($40M) © 8.0% ~90 bps 8.6% 2025 ~10 bps ~0 bps ~0 bps ~(40) bps Margin Margin Dana 2023 Organic Cost Savings Divestiture Currency Commodities 2024 See appendix for comments regarding the presentation of non-GAAP measures 10 Profit Driven by Efficiency Improvements and Cost Savings Actions

2024 Full-Year Free Cash Flow One-time costs increase due to Changes from Prior Year restructuring and strategic transaction ($ in millions) Higher cash taxes due to timing of payments and 2024 2023 Change jurisdictional mix Adjusted EBITDA $ 885 $ 845 $ 40 Reduced capital spending 1 required to support new One-Time Costs (46) (20) (26) business backlog and replacement business due to a Interest, Net (149) (116) (33) more normal launch cadence and timing of investment for future EV programs Taxes (172) (148) (24) Working Capital / Other² (68) (85) 17 Capital Spending (380) (501) 121 Free Cash Flow $ 70 $ (25) $ 95 © 2025 1 Includes costs associated with business acquisitions and divestitures and restructuring. 2 Changes in working capital relating to interest, taxes, Dana restructuring, and transaction costs are included in those respective categories. See appendix for comments regarding the presentation of non-GAAP measures. 11 Lower Capital Spending and Continued Focus on Working Capital

2025 Full-Year Financial Guide Guidance Ranges ? Guidance includes Off-Highway business for the full year and Change from does not include new tariffs Prior Year ~$9,775M ? Lower sales driven by lower -$510M end-market demand and Sales ±$250M ~1% currency translation ~$975M ? Efficiency improvements and +$90M cost-savings actions driving Adjusted EBITDA ±$50M ~2% higher profit and margins compared to last year ~9.7%—10.2% +140 bps Implied Profit Margin ? Expecting Q1 sales and adjusted EBITDA to be below last year; primarily due to lower ~$225M end-market demand ± +$155M 190 Free Cash Flow $50M ? YOY free cash flow improvement driven by higher profit, improved working capital ~$1.65 efficiency, and lower capital +$ $190 0.70 Diluted Adjusted EPS ±$0.25 © spending 2025 2025 Currency Assumptions ? 2025 net capital spend expected to be approximately ? EUR: 1.04/USD Dana $325 million ? INR: 86.50/USD? BRL: 6.03/USD See appendix for comments regarding the presentation of non-GAAP measures 12 Improving Profit and FCF Driven by Cost Savings and Operational Focus
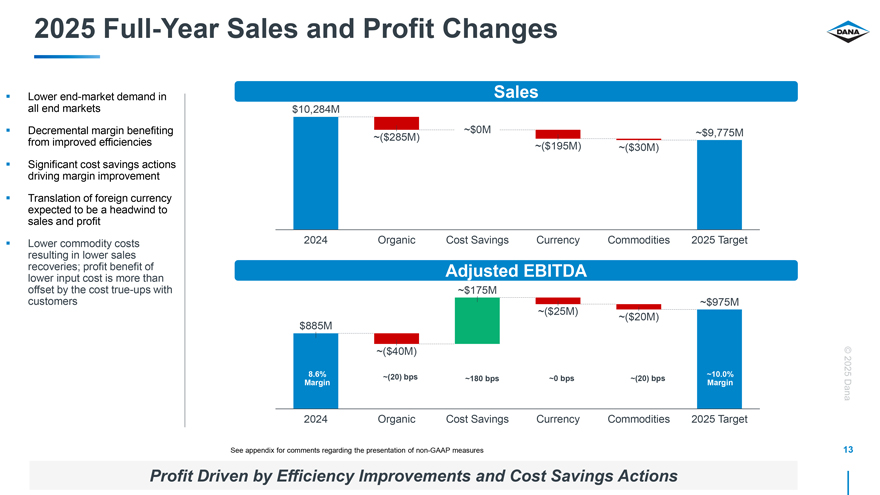
2025 Full-Year Sales and Profit Changes Lower end-market demand in Sales all end markets $10,284M Decremental margin benefiting ~$0M ~$9,775M from improved efficiencies ~($285M) ~($195M) ~($30M) Significant cost savings actions driving margin improvement Translation of foreign currency expected to be a headwind to sales and profit Lower commodity costs 2024 Organic Cost Savings Currency Commodities 2025 Target resulting in lower sales recoveries; profit benefit of Adjusted EBITDA lower input cost is more than offset by the cost true-ups with ~$175M customers ~$975M ~($25M) ~($20M) $885M ~($40M)© 8.6% ~(20) bps ~10.0% 2025 ~180 bps ~0 bps ~(20) bps Margin Margin Dana 2024 Organic Cost Savings Currency Commodities 2025 Target See appendix for comments regarding the presentation of non-GAAP measures 13 Profit Driven by Efficiency Improvements and Cost Savings Actions
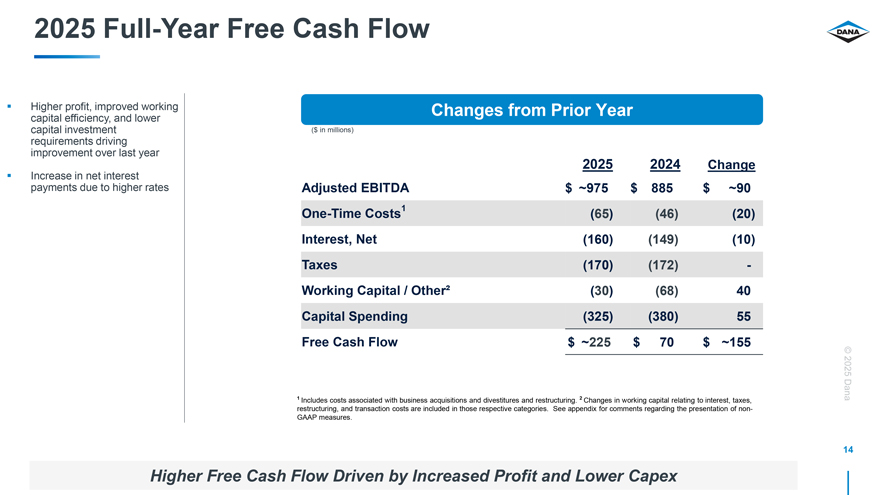
2025 Full-Year Free Cash Flow Higher profit, improved working Changes from Prior Year capital efficiency, and lower capital investment ($ in millions) requirements driving improvement over last year 2025 2024 Change Increase in net interest payments due to higher rates Adjusted EBITDA $ ~975 $ 885 $ ~90 One-Time Costs1 (65) (46) (20) Interest, Net (160) (149) (10) Taxes (170) (172) -Working Capital / Other² (30) (68) 40 Capital Spending (325) (380) 55 Free Cash Flow $ ~225 $ 70 $ ~155 © 2025 1 Includes costs associated with business acquisitions and divestitures and restructuring. 2 Changes in working capital relating to interest, taxes, Dana restructuring, and transaction costs are included in those respective categories. See appendix for comments regarding the presentation of non-GAAP measures. 14 Higher Free Cash Flow Driven by Increased Profit and Lower Capex

2025 Quarterly Phasing 2025 Sales Q1 Impact on Dana ($ in millions)? Sales down ~$500M ? Cost reductions benefit of $35-$40M? Adjusted EBITDA margin: ~8.0% Full-Year Guidance Q1 Q2 Q3 Q4 2024 2025 ? Sales: ~$9,775M (±$250M) ? Q1 2024: Light Vehicle UAW strike recovery © ? Q3-4 2024: Impact of heavy-vehicle market softness? EBITDA: ~$975M (±$50M) 2025? Q4 2024: Lower OEM production due to higher? Margin: ~9.7%—10.2% Dana vehicle inventories? Q3 2025: Off-highway market demand stabilizing? Capital Spending: ~$325M 15 ? Free cash flow: ~$225M (±$50M) See appendix for comments regarding the presentation of non-GAAP measures

© 2025 Dana 16 Appendix

2024 FY Sales and Profit Change by Segment Light Vehicle Systems Off-Highway Drive and Motion Systems $4,035M $197M $4,224M $3,185M $2,767M ($6M) ($2M) ($365M) ($5M) ($4M) ($44M) Sales Sales 2023 Organic Cost Savings Currency Commodities 2024 2023 Organic Innorganic Currency Commodities 2024 $99M $5M $314M $465M ($14M) ($1M) $419M $212M ($2M) ($31M) Adjusted 10.3% Adjusted 10. EBITDA EBITDA6.3% 5.3% 7.4% 14.6% 15.1% 2023 Organic Cost Savings Currency Commodities 2024 2023 Organic Inorganic Currency Commodities 2024 Commercial Vehicle Systems Power Technologies $2,092M $2,005M $1,243M $44M $6M $1,288M ($40M) ($34M) ($13M) ($5M) Sales Sales © 2023 Organic Cost Savings Currency Commodities 2024 2023 Organic Cost Savings Currency Commodities 2024 2025 $87M $3M Dana $67M ($9M) ($3M) $89M $2M $2M $92M Adjusted13 .5% ($11M) Adjusted 11 .9% EBITDA 10. EBITDA 10. ($1M) 4.2% 3.3% 7.0% 7.1% 2023 Organic Cost Savings Currency Commodities 2024 2023 Organic Cost Savings Currency Commodities 2024 17 See appendix for comments regarding the presentation of non-GAAP measures

Segment Profiles Light Systems Vehicle Commercial Systems Vehicle Drive and Off Motion Highway Systems Technologies Power Year to Date 12/31/2024 Year to Date 12/31/2024 Year to Date 12/31/2024 Year to Date 12/31/2024 Deere Other 9% 13% PACCAR GM Oshkosh 22% 20% 7% Renault / Nissan AGCO 6% Ford 6% SALES Other 50% 39% CNHi Tata 5% Other Ford 6% Traton 49% 16% 17% Manitou 5% Toyota 8% Other Cummins 68% Stellantis5% Stellantis* Ford Volvo 5% CUSTOMER 17% 4% Daimler 12% VW * Includes sales to systems integrators for 6% 5% driveline products in Stellantis vehicles Asia Pacific Asia Pacific North South Asia Pacific 8% Asia Pacific 6% 13% North America America 21% 13% America 2% 65% North North South America America America 55% 57% SALES 7% South South America 22% America © 1% Europe 2025 15% Europe Dana 35% Europe Europe 65% REGIONAL 15% 18

Diluted Adjusted EPS DANA INCORPORATED DANA INCORPORATED Reconciliation of Net Income (Loss) Attributable to the Parent Company to Reconciliation of Net Loss Attributable to the Parent Company to Adjusted Net Income Attributable to the Parent Company and Adjusted Net Income (Loss) Attributable to the Parent Company and Diluted Adjusted EPS (Unaudited) Diluted Adjusted EPS (Unaudited) For the Year Ended December 31, 2024 and 2023 For the Three Months Ended December 31, 2024 and 2023 (In millions, except per share amounts) (In millions, except per share amounts) Three Months Ended Year Ended December 31, December 31, 2024 2023 2024 2023 Net income (loss) attributable to the parent company $ (57) $ 38 Net loss attributable to the parent company $ (80) $ (39) Items impacting income before income taxes: Items impacting income before income taxes: Amortization 20 20 Amortization 5 5 Restructuring charges, net 76 24 Restructuring charges, net 35 3 Strategic transaction expenses 9 5 Strategic transaction expenses 4 1 Distressed supplier costs 44 Distressed supplier costs 18 Supplier capacity commitment charge 46 Supplier capacity commitment charge 46 Amount attributable to previously divested/closed operations 9 Amount attributable to previously divested/closed operations 9 Loss on disposal group previously held for sale 26 Other items 9 (1) Other items 9 1 Items impacting income taxes: Items impacting income taxes: Net income tax (expense) benefit on items above (3) 6 Net income tax expense on items above (37) (20) Income tax expense (benefit) attributable to various discrete tax matters 11 (4) Income tax expense attributable to various discrete tax matters 35 10 © Adjusted net income (loss) attributable to the parent company $ 36 $ (11) Adjusted net income attributable to the parent company $ 136 $ 122 2025 Diluted shares—as reported 145.3 144.5 Diluted shares—as reported 145.2 144.6 Dana Adjusted diluted shares 145.9 144.5 Adjusted diluted shares 145.4 144.6 Diluted adjusted EPS $ 0.25 $ (0.08) Diluted adjusted EPS $ 0.94 $ 0.84 19

Segment Data DANA INCORPORATED DANA INCORPORATED Segment Sales and Segment EBITDA (Unaudited) Segment Sales and Segment EBITDA For the Three Months Ended December 31, 2024 and 2023 For the Year Ended December 31, 2024 and 2023 Three Months Ended Year Ended (In millions) December 31, (In millions) December 31, 2024 2023 2024 2023 Sales Sales Light Vehicle $ 961 $ 923 Light Vehicle $ 4,224 $ 4,035 Commercial Vehicle 460 509 Commercial Vehicle 2,005 2,092 Off-Highway 613 762 Off-Highway 2,767 3,185 Power Technologies 301 300 Power Technologies 1,288 1,243 Total Sales $ 2,335 $ 2,494 Total Sales $ 10,284 $ 10,555 Segment EBITDA Segment EBITDA Light Vehicle $ 85 $ 22 Light Vehicle $ 314 $ 212 Commercial Vehicle 1 13 Commercial Vehicle 67 87 Off-Highway 85 106 Off-Highway 419 465 Power Technologies 17 19 Power Technologies 92 89 Total Segment EBITDA 188 160 Total Segment EBITDA 892 853 © Corporate expense and other items, net (2) (4) Corporate expense and other items, net (7) (8) 2025 Adjusted EBITDA $ 186 $ 156 Adjusted EBITDA $ 885 $ 845Dana 20
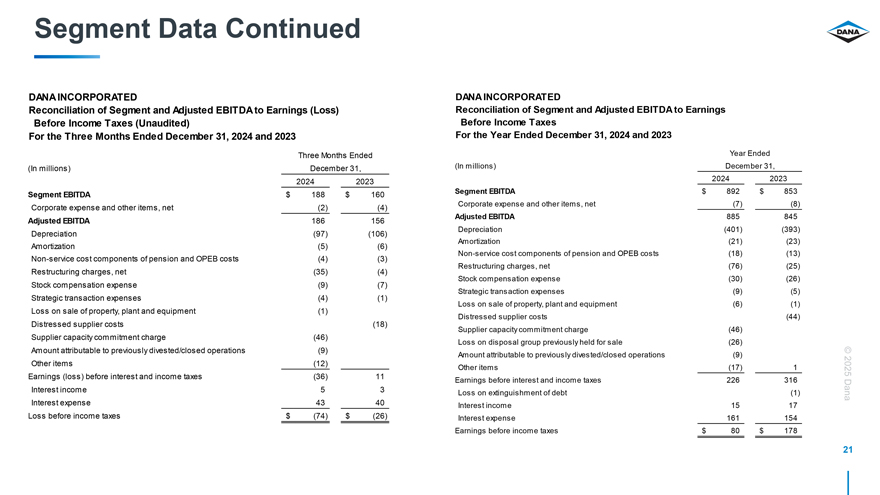
Segment Data Continued DANA INCORPORATED DANA INCORPORATED Reconciliation of Segment and Adjusted EBITDA to Earnings (Loss) Reconciliation of Segment and Adjusted EBITDA to Earnings Before Income Taxes (Unaudited) Before Income Taxes For the Three Months Ended December 31, 2024 and 2023 For the Year Ended December 31, 2024 and 2023 Three Months Ended Year Ended (In millions) December 31, (In millions) December 31, 2024 2023 2024 2023 Segment EBITDA $ 188 $ 160 Segment EBITDA $ 892 $ 853 Corporate expense and other items, net (2) (4) Corporate expense and other items, net (7) (8) Adjusted EBITDA Adjusted EBITDA 885 845 186 156 Depreciation (401) (393) Depreciation (97) (106) Amortization (21) (23) Amortization (5) (6) Non-service cost components of pension and OPEB costs (18) (13) Non-service cost components of pension and OPEB costs (4) (3) Restructuring charges, net (76) (25) Restructuring charges, net (35) (4) Stock compensation expense (30) (26) Stock compensation expense (9) (7) Strategic transaction expenses (9) (5) Strategic transaction expenses (4) (1) Loss on sale of property, plant and equipment (6) (1) Loss on sale of property, plant and equipment (1) Distressed supplier costs (44) Distressed supplier costs (18) Supplier capacity commitment charge (46) Supplier capacity commitment charge (46) Amount attributable to previously divested/closed operations (9) Loss on disposal group previously held for sale (26) Amount attributable to previously divested/closed operations (9) © Other items (12) Other items (17) 1 2025 Earnings (loss) before interest and income taxes (36) 11 Earnings before interest and income taxes 226 316 Interest income 5 3 Loss on extinguishment of debt (1) Dana Interest expense 43 40 Interest income 15 17 Loss before income taxes $ (74) $ (26) Interest expense 161 154 Earnings before income taxes $ 80 $ 178 21

Cash Flow DANA INCORPORATED Reconciliation of Net Cash Provided By Operating Activities to Free Cash Flow (Unaudited) Three Months Ended (In millions) December 31, 2024 2023 Net cash provided by operating activities $ 302 $ 278 Purchases of property, plant and equipment (153) (142) Free cash flow $ 149 $ 136 Year Ended (In millions) December 31, 2024 2023 Net cash provided by operating activities $ 450 $ 476 © Purchases of property, plant and equipment (380) (501) 2025 Free cash flow $ 70 $ (25)Dana 22

Non-GAAP Financial Information Adjusted EBITDA is a non-GAAP financial measure which we have defined as net income (loss) before interest, income taxes, depreciation, amortization, equity grant expense, restructuring expense, non-service cost components of pension and other postretirement benefit costs and other adjustments not related to our core operations (gain/loss on debt extinguishment, pension settlements, divestitures, impairment, etc.). Adjusted EBITDA is a measure of our ability to maintain and continue to invest in our operations and provide shareholder returns. We use adjusted EBITDA in assessing the effectiveness of our business strategies, evaluating and pricing potential acquisitions and as a factor in making incentive compensation decisions. In addition to its use by management, we also believe adjusted EBITDA is a measure widely used by securities analysts, investors and others to evaluate financial performance of our company relative to other Tier 1 automotive suppliers. Adjusted EBITDA should not be considered a substitute for earnings (loss) before income taxes, net income (loss) or other results reported in accordance with GAAP. Adjusted EBITDA may not be comparable to similarly titled measures reported by other companies. Adjusted net income (loss) attributable to the parent company is a non-GAAP financial measure which we have defined as net income (loss) attributable to the parent company, excluding any discrete income tax items, restructuring charges, amortization expense and other adjustments not related to our core operations (as used in adjusted EBITDA), net of any associated income tax effects. This measure is considered useful for purposes of providing investors, analysts and other interested parties with an indicator of ongoing financial performance that provides enhanced comparability to net income (loss) attributable to the parent company reported by other companies. Adjusted net income (loss) attributable to the parent company is neither intended to represent nor be an alternative measure to net income (loss) attributable to the parent company reported in accordance with GAAP. Diluted adjusted EPS is a non-GAAP financial measure which we have defined as adjusted net income (loss) attributable to the parent company divided by adjusted diluted shares. We define adjusted diluted shares as diluted shares as determined in accordance with GAAP based on adjusted net income (loss) attributable to the parent company. This measure is considered useful for purposes of providing investors, analysts and other interested parties with an indicator of ongoing financial performance that provides enhanced comparability to EPS reported by other companies. Diluted adjusted EPS is neither intended to represent nor be an alternative measure to diluted EPS reported in accordance with GAAP. Free cash flow is a non-GAAP financial measure which we have defined as net cash provided by (used in) operating activities less purchases of property, plant and equipment. We believe free cash flow is useful to investors in evaluating the operational cash flow of the company inclusive of the spending required to maintain the operations. Free cash © flow is not intended to represent nor be an alternative to the measure of net cash provided by (used in) operating activities reported in accordance with GAAP. Free cash flow 2025 may not be comparable to similarly titled measures reported by other companies.Dana The accompanying financial information provides reconciliations of adjusted EBITDA, diluted adjusted EPS and free cash flow to the most directly comparable financial measures calculated and presented in accordance with GAAP. We have not provided a reconciliation of our adjusted EBITDA and diluted adjusted EPS outlook to the most comparable GAAP measures of net income (loss) and diluted EPS. Providing net income (loss) and diluted EPS guidance is potentially misleading and not practical given the difficulty of projecting event driven transactional and other non-core operating items that are included in net income (loss) and diluted EPS, including restructuring actions, asset impairments and certain income tax adjustments. The accompanying reconciliations of these non-GAAP measures with the most comparable GAAP measures for the historical 23 periods presented are indicative of the reconciliations that will be prepared upon completion of the periods covered by the non-GAAP guidance.

Value Others | Inspire Innovation | Grow Responsibly | Win Together