QuickLinks -- Click here to rapidly navigate through this document
Exhibit 13
The value of convenience.
A store location near you.
| We continue to open Target stores across the country, adding net square footage at an average annual growth rate of 8-10%, steadily increasing market penetration. Since 1997, total store density has increased over 50%. Even in our most densely populated states, our market presence has expanded nearly 40%, indicating ample opportunity for profitable growth well into the future. | |  |
Year-end Store Count and Square Footage by State
| |
| | 2002
| | 1997
|
|---|
Density Group
| |
| | Sq. Ft per Thousand
Population
| | Number
of
Stores
| | Retail Sq. Ft. (in thousands)
| | Sq. Ft per Thousand
Population
| | Retail Sq. Ft. (in thousands)
|
|---|
 | | Minnesota | | 1,594 | | 62 | | 7,973 | | 1,131 | | 5,372 |
| | | Iowa | | 853 | | 19 | | 2,497 | | 614 | | 1,769 |
| | | Colorado | | 802 | | 28 | | 3,595 | | 592 | | 2,352 |
| | | North Dakota | | 793 | | 4 | | 505 | | 682 | | 437 |
| | | Arizona | | 748 | | 35 | | 4,050 | | 528 | | 2,451 |
| | | Nebraska | | 735 | | 10 | | 1,265 | | 642 | | 1,072 |
| | | Nevada | | 730 | | 13 | | 1,584 | | 490 | | 841 |
| | | Montana | | 704 | | 6 | | 639 | | 344 | | 299 |
| | | Indiana | | 647 | | 34 | | 3,969 | | 482 | | 2,853 |
| | | Wisconsin | | 619 | | 29 | | 3,358 | | 447 | | 2,334 |
| Group 1 total | | 845 | | 240 | | 29,435 | | 613 | | 19,780 |
| | | | |
| |
| |
| |
| |
|
 | | California | | 606 | | 175 | | 21,133 | | 469 | | 15,291 |
| | | Michigan | | 576 | | 52 | | 5,765 | | 492 | | 4,796 |
| | | Illinois | | 574 | | 59 | | 7,188 | | 451 | | 5,466 |
| | | Texas | | 568 | | 98 | | 12,273 | | 452 | | 8,854 |
| | | Utah | | 567 | | 8 | | 1,303 | | 511 | | 1,055 |
| | | Georgia | | 555 | | 37 | | 4,714 | | 366 | | 2,795 |
| | | Washington | | 545 | | 29 | | 3,293 | | 431 | | 2,401 |
| | | Missouri | | 535 | | 24 | | 3,021 | | 252 | | 1,374 |
| | | Kansas | | 531 | | 11 | | 1,435 | | 423 | | 1,109 |
| | | Florida | | 530 | | 73 | | 8,823 | | 456 | | 6,846 |
| Group 2 total | | 571 | | 566 | | 68,948 | | 445 | | 49,987 |
| | | | |
| |
| |
| |
| |
|
 | | Maryland | | 524 | | 23 | | 2,843 | | 294 | | 1,509 |
| | | South Dakota | | 520 | | 4 | | 394 | | 531 | | 391 |
| | | Oregon | | 504 | | 15 | | 1,766 | | 363 | | 1,174 |
| | | Virginia | | 496 | | 29 | | 3,597 | | 317 | | 2,153 |
| | | New Mexico | | 473 | | 8 | | 872 | | 424 | | 730 |
| | | Ohio | | 426 | | 41 | | 4,842 | | 233 | | 2,609 |
| | | Idaho | | 401 | | 5 | | 536 | | 338 | | 406 |
| | | Tennessee | | 392 | | 20 | | 2,266 | | 358 | | 1,945 |
| | | New Jersey | | 384 | | 26 | | 3,276 | | 62 | | 509 |
| | | Wyoming | | 377 | | 2 | | 187 | | 378 | | 182 |
| Group 3 total | | 445 | | 173 | | 20,579 | | 263 | | 11,608 |
| | | | |
| |
| |
| |
| |
|
 | | South Carolina | | 354 | | 12 | | 1,450 | | 102 | | 393 |
| | | Oklahoma | | 334 | | 9 | | 1,160 | | 235 | | 790 |
| | | Delaware | | 334 | | 2 | | 268 | | — | | 0 |
| | | North Carolina | | 326 | | 24 | | 2,694 | | 285 | | 2,161 |
| | | Kentucky | | 323 | | 12 | | 1,316 | | 287 | | 1,129 |
| | | Alabama | | 317 | | 9 | | 1,417 | | 27 | | 117 |
| | | New Hampshire | | 312 | | 3 | | 397 | | — | | 0 |
| | | Massachusetts | | 299 | | 15 | | 1,914 | | — | | 0 |
| | | Louisiana | | 291 | | 9 | | 1,303 | | 46 | | 203 |
| | | Pennsylvania | | 268 | | 26 | | 3,289 | | — | | 0 |
| Group 4 total | | 307 | | 121 | | 15,208 | | 100 | | 4,793 |
| | | | |
| |
| |
| |
| |
|
 | | Rhode Island | | 238 | | 2 | | 254 | | — | | 0 |
| | | New York | | 222 | | 32 | | 4,214 | | 38 | | 717 |
| | | Connecticut | | 189 | | 5 | | 649 | | — | | 0 |
| | | West Virginia | | 139 | | 2 | | 250 | | — | | 0 |
| | | Arkansas | | 131 | | 3 | | 354 | | 72 | | 186 |
| | | Maine | | 97 | | 1 | | 125 | | — | | 0 |
| | | Mississippi | | 83 | | 2 | | 239 | | 42 | | 116 |
| | | Vermont | | — | | 0 | | 0 | | — | | 0 |
| Group 5 total | | 189 | | 47 | | 6,085 | | 32 | | 1,019 |
| | | | |
| |
| |
| |
| |
|
| | | Total | | 494 | | 1,147 | | 140,255 | | 325 | | 87,187 |
16
MANAGEMENT'S DISCUSSION AND ANALYSIS
Analysis of Operations
Earnings
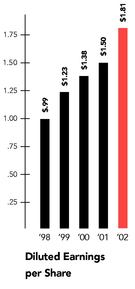
Our net earnings were $1,654 million in 2002, compared with $1,368 million in 2001 and $1,264 million in 2000. Earnings per share were $1.81 in 2002, $1.50 in 2001 and $1.38 in 2000. References to earnings per share refer to diluted earnings per share. Earnings per share, dividends per share and common shares outstanding reflect our 2000 two-for-one share split.
Earnings Analysis
(millions)
| | 2002
| | 2001
| | 2000
|
|---|
| Net earnings before unusual items | | $ | 1,654 | | $ | 1,410 | | $ | 1,264 |
| Unusual items, after tax | | | — | | | (42 | ) | | — |
| | |
| |
| |
|
| Net earnings | | $ | 1,654 | | $ | 1,368 | | $ | 1,264 |
| | |
| |
| |
|
Management uses net earnings before unusual items, among other standards, to measure operating performance. It supplements, and is not intended to represent a measure of performance in accordance with, disclosures required by accounting principles generally accepted in the United States (GAAP).
The $42 million after-tax ($.05 per share) unusual item in 2001 relates to the required adoption of a new accounting standard applicable to securitized accounts receivable (discussed in detail under Accounting for Accounts Receivable on page 19).
Management's discussion and analysis is based on our Consolidated Results of Operations as shown on page 24.
Revenues and Comparable-store Sales
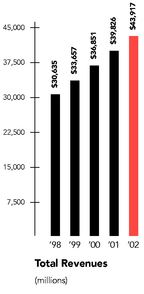
In 2002, total revenues increased 10.3 percent and comparable-store sales increased 1.1 percent. In 2001, total revenues increased 9.7 percent and comparable-store sales increased 2.7 percent over 2000, with both years' results on a similar 52-week basis (since 2000 was a 53-week year, the first week is removed for comparability). Total revenues include retail sales and net credit card revenues. Comparable-store sales are sales from stores open longer than one year. Revenue growth in 2002 and 2001 reflected Target's new store expansion, our overall comparable-store sales growth and growth in our credit card operations. The impact of price deflation in 2001 and 2000 was minimal and, as a result, the overall comparable-store sales increase closely approximated real growth. In 2002, price deflation was somewhat more significant than in the two prior years and had a negative impact of approximately 3 percent on the comparable-store sales increase.
Revenues and Comparable-store Sales Growth
(52-week basis)
| | 2002
| | 2001
| | 2000
| |
|---|
| | Revenues
| | Comparable-
store Sales
| | Revenues
| | Comparable-
store Sales
| | Revenues
| | Comparable-
store Sales
| |
|---|
| Target | | 13.3 | % | 2.2 | % | 13.1 | % | 4.1 | % | 10.5 | % | 3.4 | % |
| Mervyn's | | (5.2 | ) | (5.3 | ) | (1.7 | ) | (1.5 | ) | 0.2 | | 0.3 | |
| Marshall Field's | | (3.1 | ) | (3.7 | ) | (5.2 | ) | (5.7 | ) | (3.6 | ) | (4.0 | ) |
| | |
| |
| |
| |
| |
| |
| |
| Total | | 10.3 | % | 1.1 | % | 9.7 | % | 2.7 | % | 7.8 | % | 2.4 | % |
| | |
| |
| |
| |
| |
| |
| |
Revenues per Square Foot*
(52-week basis)
| | 2002
| | 2001
| | 2000
|
|---|
| Target | | $ | 278 | | $ | 274 | | $ | 268 |
| Mervyn's | | | 178 | | | 187 | | | 190 |
| Marshall Field's | | | 180 | | | 186 | | | 205 |
- *
- Thirteen-month average retail square feet.
Gross Margin Rate
Gross margin rate represents gross margin (sales less cost of sales) as a percent of sales. In 2002, our consolidated gross margin rate expanded by almost a full percentage point to a rate of 31.5 percent. The growth is attributable to rate expansion at both Target and Mervyn's, partially offset by the mix impact of growth at Target, our lowest gross margin rate division.
In 2001, our gross margin rate was essentially even with 2000, benefiting from improvement at both Target and Mervyn's, offset by unfavorable performance at Marshall Field's and the mix impact of growth at Target.
Operating Expense Rate
Operating expense rate represents selling, general and administrative expense (including buying and occupancy, advertising, start-up and other expense) as a percent of sales. Operating expense excludes depreciation and amortization and expenses associated with our credit card operations, which are separately reflected on our Consolidated Results of Operations. In 2002, our operating expense rate rose modestly compared to 2001 because certain items such as medical expenses increased at a faster pace than sales and this effect was only partially offset by the mix impact of growth at Target,
17
our lowest expense rate division. In 2001, our operating expense rate improved compared to 2000, principally benefiting from the mix impact of growth at Target.
Pre-tax Segment Profit
Pre-tax segment profit increased 16.7 percent in 2002 to $3,461 million, compared with $2,965 million in 2001. The increase was driven by growth at Target, which delivered 89 percent of consolidated pre-tax segment profit. Marshall Field's pre-tax segment profit was essentially equal to last year, while Mervyn's experienced a decline in pre-tax segment profit compared to last year. Target's full-year profit margin rate increased to 8.4 percent of revenues in 2002 from 7.8 percent in 2001.
In 2001, pre-tax segment profit increased 10.6 percent to $2,965 million, compared with $2,682 million in 2000. The increase was driven by growth at Target, which delivered 86 percent of consolidated pre-tax segment profit. Mervyn's also experienced an increase in pre-tax segment profit, while Marshall Field's experienced a decline compared to 2000. Target's full-year profit margin rate increased to 7.8 percent of revenues in 2001 from 7.6 percent in 2000.
We define pre-tax segment profit as earnings before interest, last-in, first-out (LIFO) provision, securitization effects, other expense and unusual items. A reconciliation of pre-tax segment profit to pre-tax earnings is provided in the Notes to Consolidated Financial Statements on page 35. Our segment disclosures may not be consistent with disclosures of other companies in the same line of business.
Pre-tax Segment Profit and as a Percent of Revenues
| | Pre-tax Segment Profit
| | As a Percent of Revenues
| |
|---|
(millions)
| |
|---|
| | 2002
| | 2001
| | 2000
| | 2002
| | 2001
| | 2000
| |
|---|
| Target | | $ | 3,088 | | $ | 2,546 | | $ | 2,223 | | 8.4 | % | 7.8 | % | 7.6 | % |
| Mervyn's | | | 238 | | | 286 | | | 269 | | 6.2 | | 7.1 | | 6.5 | |
| Marshall Field's | | | 135 | | | 133 | | | 190 | | 5.0 | | 4.8 | | 6.4 | |
| | |
| |
| |
| |
| |
| |
| |
| Total pre-tax segment profit | | $ | 3,461 | | $ | 2,965 | | $ | 2,682 | | 8.0 | % | 7.5 | % | 7.4 | % |
| | |
| |
| |
| |
| |
| |
| |
| Net earnings | | $ | 1,654 | | $ | 1,368 | | $ | 1,264 | | | | | | | |
| | |
| |
| |
| | | | | | | |
EBITDA
We provide the following EBITDA information derived from our financial statements because we believe it provides a meaningful aid to analysis of our performance by segment. We define segment EBITDA as pre-tax segment profit before depreciation and amortization expense. This presentation is not intended to be a substitute for GAAP required measures of profitability and cash flow. A reconciliation of pre-tax segment profit to pre-tax earnings is provided in the Notes to Consolidated Financial Statements on page 35. Our definition of EBITDA may differ from definitions used by other companies.
EBITDA and as a Percent of Revenues
| | EBITDA
| | As a Percent of Revenues
| |
|---|
(millions)
| |
|---|
| | 2002
| | 2001
| | 2000
| | 2002
| | 2001
| | 2000
| |
|---|
| Target | | $ | 4,013 | | $ | 3,330 | | $ | 2,883 | | 10.9 | % | 10.2 | % | 9.8 | % |
| Mervyn's | | | 360 | | | 412 | | | 400 | | 9.4 | | 10.2 | | 9.6 | |
| Marshall Field's | | | 260 | | | 268 | | | 323 | | 9.7 | | 9.7 | | 10.9 | |
| | |
| |
| |
| |
| |
| |
| |
| Total segment EBITDA | | $ | 4,633 | | $ | 4,010 | | $ | 3,606 | | 10.7 | % | 10.2 | % | 9.9 | % |
| | |
| |
| |
| |
| |
| |
| |
| Segment depreciation and amortization | | | (1,172 | ) | | (1,045 | ) | | (924 | ) | | | | | | |
| | |
| |
| |
| | | | | | | |
| Pre-tax segment profit | | $ | 3,461 | | $ | 2,965 | | $ | 2,682 | | | | | | | |
| Cash flows provided by/(used for): | | | | | | | | | | | | | | | | |
| | Operating activities | | $ | 1,590 | | $ | 2,012 | | $ | 2,134 | | | | | | | |
| | Investing activities | | | (3,189 | ) | | (3,310 | ) | | (2,692 | ) | | | | | | |
| | Financing activities | | | 1,858 | | | 1,441 | | | 694 | | | | | | | |
| | |
| |
| |
| | | | | | | |
| Net increase in cash and cash equivalents | | $ | 259 | | $ | 143 | | $ | 136 | | | | | | | |
| | |
| |
| |
| | | | | | | |
Depreciation and Amortization
In 2002, depreciation and amortization increased 12.4 percent to $1,212 million compared to 2001. In 2001, depreciation and amortization increased 14.8 percent to $1,079 million compared to 2000. The increase in both years is primarily due to new store growth at Target.
Interest Expense
In 2002, interest expense was $588 million, $88 million higher than the total of interest expense and interest equivalent in 2001. For analytical purposes, the amounts that represented payments accrued to holders of sold securitized receivables prior to August 22, 2001 (discussed in detail under Accounting for Accounts Receivable on page 19) are considered as interest equivalent. After that date such payments constituted interest expense. In 2002, $25 million of the increase in interest expense was due to the loss resulting from the early call or repurchase of $266 million of debt. The remaining $63 million increase in interest expense is attributable to higher average funded balances, partially offset by the favorable effect of lower average portfolio interest rates. The average portfolio interest rate in 2002 was 5.6 percent compared with 6.4 percent in 2001, and 7.4 percent in 2000. In 2001, the total of interest expense and interest equivalent was $24 million higher than in 2000 due to higher average funded balances partially offset by the favorable effect of lower average portfolio interest rates.
During 2002, we called or repurchased $266 million of debt resulting in a loss of $34 million ($.02 per share). The debt called or repurchased had a weighted average interest rate of 8.8 percent and an average remaining life of 19 years. In 2001 and 2000, we
18
called or repurchased $144 million and $35 million of debt, respectively, which resulted in losses of $9 million ($.01 per share) and $5 million (less than $.01 per share), respectively. Also in 2000, $371 million of puttable debt was put to us, resulting in a gain of $4 million (less than $.01 per share).
In April 2002, the Financial Accounting Standards Board issued Statement of Financial Accounting Standards (SFAS) No. 145, "Rescission of FASB Statements No. 4, 44 and 64, Amendment of FASB Statement No. 13, and Technical Corrections." We elected to early adopt this Statement in the first quarter of 2002. Previously, all gains and losses from the early extinguishment of debt were required to be aggregated and classified as an extraordinary item in the Consolidated Results of Operations, net of the related tax effect. Under SFAS No. 145, gains and losses from the early extinguishment of debt are included in interest expense. Prior year extraordinary items have been reclassified to reflect this change. The adoption of SFAS No. 145 had no impact on current year or previously reported net earnings, cash flows or financial position.
Accounting for Accounts Receivable
On August 22, 2001, Target Receivables Corporation (TRC) sold, through the Target Credit Card Master Trust (the Trust), $750 million of receivable-backed securities to the public. Prior to this transaction, the accounting guidance applicable to our receivable-backed securities transactions was SFAS No. 125, "Accounting for Transfers and Servicing of Financial Assets and Extinguishments of Liabilities," resulting in sale accounting treatment. Concurrent with this transaction, SFAS No. 140 (which replaced SFAS No. 125 in its entirety) became the applicable accounting guidance. Application of SFAS No. 140 resulted in secured financing accounting for all outstanding transactions. This new accounting treatment results from the fact that the Trust is not a qualifying special purpose entity under SFAS No. 140.
Beginning on August 22, 2001, our consolidated financial statements reflected the consolidation of these outstanding obligations. We reflected the obligation to holders of the $800 million (face value) of previously sold receivable-backed securities (Series 1997-1 and 1998-1, Class A Certificates) as debt of TRC, and we recorded the receivables at fair value in place of the previously recorded retained interests related to the sold securities. This resulted in an unusual pre-tax charge of $67 million ($.05 per share) in 2001.
Our Consolidated Results of Operations did not include finance charge revenues or loss provision related to the publicly held receivable-backed securities until August 22, 2001. Payments accrued to holders of our publicly held receivable-backed securities prior to August 22, 2001 are included in our Pre-tax Earnings Reconciliation on page 35 as interest equivalent. Interest equivalent was $27 million in 2001 and $50 million in 2000.
Fourth Quarter Results
Due to the seasonal nature of our business, fourth quarter operating results typically represent a substantially larger share of total year revenues and earnings due to the inclusion of the holiday shopping season.
Fourth quarter 2002 net earnings were $688 million, compared with $658 million in 2001. Earnings per share were $.75 for the quarter, compared with $.72 in 2001. Total revenues increased 6.4 percent and 13-week comparable-store sales decreased 2.2 percent. Our pre-tax segment profit increased 1.4 percent to $1,291 million, driven by growth at Target, partially offset by declines at Mervyn's and Marshall Field's.
Fourth Quarter Pre-tax Segment Profit and Percent Change from Prior Year
(millions)
| | 2002
| | 2001
| | 2000
| |
|---|
| Target | | $ | 1,165 | | 8.0 | % | $ | 1,078 | | 20.9 | % | $ | 892 | | 10.0 | % |
| Mervyn's | | | 75 | | (42.9 | ) | | 131 | | 20.8 | | | 108 | | 57.7 | |
| Marshall Field's | | | 51 | | (18.9 | ) | | 63 | | (20.2 | ) | | 79 | | (34.4 | ) |
| | |
| |
| |
| |
| |
| |
| |
| Total | | $ | 1,291 | | 1.4 | % | $ | 1,272 | | 17.9 | % | $ | 1,079 | | 7.9 | % |
| | |
| |
| |
| |
| |
| |
| |
| Net earnings | | $ | 688 | | 4.4 | % | $ | 658 | | 19.3 | % | $ | 552 | | 11.8 | % |
| | |
| |
| |
| |
| |
| |
| |
Critical Accounting Estimates
Our analysis of operations and financial condition are based upon our consolidated financial statements, which have been prepared in accordance with GAAP. The preparation of these financial statements requires us to make estimates and assumptions that affect the reported amounts of assets and liabilities at the date of the financial statements, the reported amounts of revenues and expenses during the reporting period, and the related disclosures of contingent assets and liabilities. In the Notes to Consolidated Financial Statements, we describe our significant accounting policies used in the preparation of the consolidated financial statements. We evaluate our estimates on an ongoing basis. We base our estimates on historical experience and on various other assumptions that we believe to be reasonable under the circumstances. Actual results could differ from these estimates under different assumptions or conditions.
The following items in our consolidated financial statements require significant estimation or judgment:
Inventory and cost of sales We account for inventory and the related cost of sales under the retail inventory method using the LIFO basis. Under the retail inventory method, inventory is stated at cost, which is determined by applying a cost-to-retail ratio to each similar merchandise grouping's ending retail value. Since this inventory value is adjusted regularly to reflect market conditions, our inventory methodology reflects the lower of cost or market. We also reduce inventory for estimated losses related to shortage, based upon historical losses verified by prior physical inventory counts.
19
Additionally, we reduce inventory for estimates of vendor allowances, such as rebates, volume allowances, shelving/slotting allowances and exclusivity allowances. Vendor allowances are recognized in the financial statements when we have fulfilled our performance obligations. Inventory also includes a LIFO provision that is calculated based on inventory levels, markup rates and internally generated retail price indices.
Allowance for doubtful accounts When receivables are recorded, an allowance for doubtful accounts in an amount equal to anticipated future write-offs is recognized. The estimated future write-offs are based on historical experience and other factors. The allowance for doubtful accounts was $399 million or 6.7 percent of year-end receivables at February 1, 2003, compared to $261 million or 6.4 percent of year-end receivables at February 2, 2002.
Pension and postretirement health care accounting We fund and maintain three qualified defined benefit pension plans and maintain certain non-qualified plans as well. Our pension costs are determined based on actuarial calculations using key assumptions including our expected long-term rate of return on qualified plan assets, discount rate and our estimate of future compensation increases. We also maintain a postretirement health care plan for certain retired employees. Postretirement health care costs are calculated based on actuarial calculations using key assumptions including a discount rate and health care cost trend rates. Our pension and postretirement health care benefits are further described in the Notes to Consolidated Financial Statements on page 34.
Insurance/self-insurance We retain a portion of the risk related to certain general liability, workers' compensation, property loss and employee medical and dental claims. Liabilities associated with these losses are calculated for claims filed, and claims incurred but not yet reported, at our estimate of their ultimate cost, based upon analysis of historical data and actuarial estimates. General liability and workers' compensation liabilities are then recorded at their net present value. Our expected loss accruals are based on estimates, and while we believe the amounts accrued are adequate, the ultimate loss may differ from the amounts provided. We maintain stop-loss coverage to limit the exposure related to certain risks.
Income taxes We pay income taxes based on the tax statutes, regulations and case law of the various jurisdictions in which we operate. Our effective income tax rate was 38.2 percent, 38.0 percent and 38.4 percent in 2002, 2001 and 2000, respectively. The income tax provision includes estimates for certain unresolved matters in dispute with state and federal tax authorities.
Analysis of Financial Condition
Our financial condition remains strong. Cash flow provided by operations was $1,590 million in 2002, driven by net income before depreciation and amortization expense and is net of our substantial growth in accounts receivable. Internally generated cash, along with our ability to access a variety of financial markets, provides capital for our expansion plans. We expect to continue to fund the growth in our business through a combination of internally generated funds and debt.

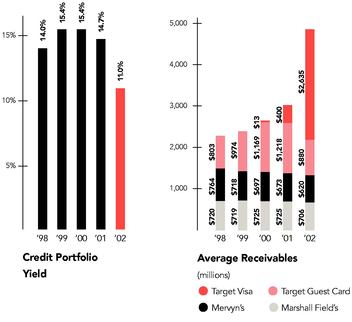
During 2002, our total gross year-end receivables (which includes all securitized receivables) increased 46 percent, or $1,872 million, to $5,964 million. The growth in year-end receivables was driven by continued growth in issuance and usage of the Target Visa credit card. Average total receivables increased 61 percent from 2001.
During 2002, inventory levels increased $311 million, or 7.0 percent. This growth was more than fully funded by the $524 million increase in accounts payable over the same period.
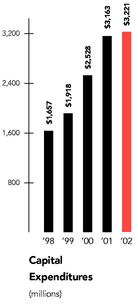
Capital expenditures were $3,221 million in 2002, compared with $3,163 million in 2001 and $2,528 in 2000. Investment in Target accounted for 92 percent of capital expenditures in both 2002 and 2001, and 89 percent in 2000. Net property and equipment increased $1,774 million in 2002, compared with an increase of $2,115 in 2001. Over the past five years, Target's net retail square footage has grown at a compound annual rate of 10 percent, consistent with our objective to expand Target's square footage in the range of 8 to 10 percent annually.
Approximately 66 percent of total expenditures in 2002 were for new stores, expansions and remodels.
20
Number of Stores
| | February 2, 2002
| | Opened
| | Closed
| | February 1, 2003
|
|---|
| Target | | 1,053 | | 114 | | 20 | | 1,147 |
| Mervyn's | | 264 | | 1 | | 1 | | 264 |
| Marshall Field's | | 64 | | 0 | | 0 | | 64 |
| | |
| |
| |
| |
|
| Total | | 1,381 | | 115 | | 21 | | 1,475 |
| | |
| |
| |
| |
|
Other capital investments were for information system hardware and software, distribution capacity and other infrastructure to support store growth, primarily at Target.
In January 1999 and March 2000, our Board of Directors authorized the aggregate repurchase of $2 billion of our common stock. Since that time, we have repurchased a total of 41 million shares of our common stock at a total cost of $1,199 million ($29.27 per share), net of the premium from exercised and expired put options. In 2001, common stock repurchases were essentially suspended. Consequently, common stock repurchases did not have a material impact on our 2002 or 2001 net earnings and financial position.
Our financing strategy is to ensure liquidity and access to capital markets, to manage the amount of floating-rate debt and to maintain a balanced spectrum of debt maturities. Within these parameters, we seek to minimize our cost of borrowing.
A key to our access to liquidity and capital markets is maintaining strong investment-grade debt ratings.
Credit Ratings
| | Moody's
| | Standard and Poor's
| | Fitch
|
|---|
| Long-term debt | | A2 | | A+ | | A |
| Commercial paper | | P-1 | | A-1 | | F1 |
| Securitized receivables | | Aaa | | AAA | | N/A |
We view interest coverage and debt ratio as important indicators of our creditworthiness. In 2002, interest coverage continued to improve to 5.1x and debt ratio remained constant at 52 percent.
Interest Coverage and Debt Ratio
| | 2002
| | 2001
| | 2000
| |
|---|
| Interest coverage | | 5.1 | x | 4.7 | x | 4.4 | x |
| Debt ratio | | 52 | % | 52 | % | 52 | % |
Interest coverage and debt ratio include the impact of any publicly held receivable-backed securities and off-balance sheet operating leases as if they were debt. Interest coverage represents the ratio of pre-tax earnings before unusual items and fixed charges to fixed charges (interest expense excluding loss on debt repurchase, interest equivalent and the interest portion of rent expense). Debt ratio represents the ratio of debt (debt and debt equivalents less cash equivalents) to total capitalization, including debt, deferred income taxes and other, and shareholders' investment.
Further liquidity is provided by $1.9 billion of committed lines of credit obtained through a group of 30 banks. Of these credit lines, a $1.1 billion credit facility matures in June 2003 but includes a one-year term-out option to June 2004. The remaining $800 million credit facility matures in June 2005. There were no balances outstanding at any time during 2002 or 2001 under these agreements. No debt instrument contains provisions requiring acceleration of payment upon a debt rating downgrade.
Commitments and Contingencies
At February 1, 2003, our debt and lease contractual obligations were as follows:
Payments Due by Period
(millions)
Contractual Obligations
| | Total
| | Less than 1 Year
| | After 1-3 Years
| | 3-5 Years
| | 5 Years
|
|---|
| Long-term debt* | | $ | 10,890 | | $ | 965 | | $ | 1,359 | | $ | 2,075 | | $ | 6,491 |
| Capital lease obligations** | | | 244 | | | 21 | | | 39 | | | 36 | | | 148 |
| Operating leases** | | | 1,528 | | | 147 | | | 265 | | | 208 | | | 908 |
| | |
| |
| |
| |
| |
|
| Total contractual cash obligations | | $ | 12,662 | | $ | 1,133 | | $ | 1,663 | | $ | 2,319 | | $ | 7,547 |
| | |
| |
| |
| |
| |
|
- *
- Required principal payments only. Excludes SFAS No. 133, "Accounting for Derivative Instruments and Hedging Activities," adjustments recorded in long-term debt.
- **
- Total contractual lease payments.
Commitments for the purchase, construction, lease or remodeling of real estate, facilities and equipment were approximately $509 million at year-end 2002.
We are exposed to claims and litigation arising out of the ordinary course of business. Management, after consulting with legal counsel, believes the currently identified claims and litigation will not have a material adverse effect on our results of operations or our financial condition taken as a whole.
Performance Objectives
Shareholder Return
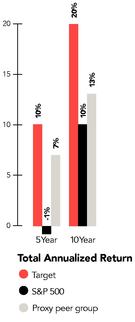
Our primary objective is to maximize shareholder value over time through a combination of share price appreciation and dividend income while maintaining a prudent and flexible capital structure. Our total return to shareholders (including reinvested dividends) over the last five years averaged 10.2 percent annually, returning about $162 for each $100 invested in our stock at the beginning of this period.
21
Measuring Value Creation
We measure value creation internally using a form of Economic Value Added (EVA), which we define as after-tax segment profit less a capital charge for all investment employed. The capital charge is an estimate of our after-tax cost of capital adjusted for the age of our stores, recognizing that mature stores inherently have higher returns than newly opened stores. We estimate that the after-tax cost of capital for our retail operations is approximately 9 percent, while our credit card operations' after-tax cost of capital is approximately 5 percent as a result of their ability to support higher debt levels. We expect to continue to generate returns in excess of these costs of capital, thereby producing EVA.
EVA is used to evaluate our performance and to guide capital investment decisions. A significant portion of executive incentive compensation is tied to the achievement of targeted levels of annual EVA generation. We believe that managing our business with a focus on EVA helps achieve our objective of average annual earnings per share growth of 15 percent or more over time. Earnings per share before unusual items have grown at a compound annual rate of 17 percent over the last five years.
Credit Card Operations
We offer credit to qualified guests in each of our business segments. These credit card programs strategically support our core retail operations and are an integral component of each business segment. Our credit card products support earnings growth by driving sales at our stores and through growth in credit card financial performance. In addition to our proprietary credit card programs that have been offered for many years, we began a national rollout of the Target Visa credit card during 2001.
The following tables reflect the financial performance of our credit card operations on a managed portfolio basis. Pre-tax credit contribution reflects pre-tax profit before funding costs. See discussion on Accounting for Accounts Receivable on page 19 for additional information on the treatment of securitized receivables in our consolidated financial statements.
The revenue from accounts receivable represents revenues derived from finance charges, late fees and other revenues. Intracompany merchant fees are fees charged to our retail operations on a basis similar to fees charged by third-party credit card issuers. These fees are eliminated in consolidation. Third-party merchant fees are fees paid to us by merchants that have accepted the Target Visa credit card, and are included in net credit card revenues. Credit card expenses include marketing and account service activities that support our credit card portfolio, as well as bad debt expense.
In 2002, pre-tax contribution from credit card operations increased approximately 20 percent over the prior year. This performance was driven primarily by the substantial growth in average receivables due to increases in the issuance and usage of the Target Visa credit card.
Credit Card Contribution to Segment Profit
(millions)
| | 2002
| | 2001
| | 2000
|
|---|
| Revenues: | | | | | | | | | |
| Finance charges, late fees and other revenues | | $ | 1,126 | | $ | 779 | | $ | 653 |
| Merchant fees | | | | | | | | | |
| | Intracompany | | | 102 | | | 102 | | | 99 |
| | Third-party | | | 69 | | | 18 | | | 1 |
| | |
| |
| |
|
| | Total revenues | | | 1,297 | | | 899 | | | 753 |
| | |
| |
| |
|
| Expenses: | | | | | | | | | |
| Bad debt provision | | | 460 | | | 230 | | | 148 |
| Operations and marketing | | | 305 | | | 224 | | | 205 |
| | |
| |
| |
|
| | Total expenses | | | 765 | | | 454 | | | 353 |
| | |
| |
| |
|
| Pre-tax credit card contribution | | $ | 532 | | $ | 445 | | $ | 400 |
| | |
| |
| |
|
Receivables
(millions)
| | 2002
| | 2001
| | 2000
| |
|---|
| Target | | | | | | | | | | |
| | Target Visa | | $ | 3,774 | | $ | 1,567 | | $ | 76 | |
| | Guest Card | | | 827 | | | 1,063 | | | 1,325 | |
| Mervyn's | | | 626 | | | 706 | | | 735 | |
| Marshall Field's | | | 737 | | | 756 | | | 769 | |
| | |
| |
| |
| |
| Total year-end receivables* | | $ | 5,964 | | $ | 4,092 | | $ | 2,905 | |
| Delinquent receivables** | | | 3.8 | % | | 3.2 | % | | 3.9 | % |
| | |
| |
| |
| |
| Total average receivables | | $ | 4,841 | | $ | 3,016 | | $ | 2,604 | |
| | |
| |
| |
| |
- *
- At year-end 2000, balance includes $800 million of publicly held receivable-backed securities (see discussion under Accounting for Accounts Receivable on page 19).
- **
- Balances on accounts that are delinquent by 60 days or more as a percent of total year-end receivables.
Allowance for Doubtful Accounts
(millions)
| | 2002
| | 2001
| | 2000
| |
|---|
| Allowance at beginning of year | | $ | 261 | | $ | 211 | | $ | 203 | |
| Bad debt provision | | | 460 | | | 230 | | | 148 | |
| Net write-offs | | | (322 | ) | | (180 | ) | | (140 | ) |
| | |
| |
| |
| |
| Allowance at end of year | | $ | 399 | | $ | 261 | | $ | 211 | |
| As a percent of year-end receivables | | | 6.7 | % | | 6.4 | % | | 7.3 | % |
| | |
| |
| |
| |
22
Fiscal Year 2003
As we look forward into 2003, we believe that we will deliver another year of profitable market share growth. We expect that this performance will be driven by increases in comparable-store sales, contributions from new store growth at Target, and continued growth in contribution from our credit card operations, primarily through the Target Visa credit card. Overall, gross margin rate and operating expense rate are expected to remain essentially even with 2002.
In 2003, we expect to invest $3.2 to $3.4 billion, mostly in new square footage for Target stores, and the distribution infrastructure and systems to support this growth. Our 2003 store opening program at Target reflects net square footage growth of approximately 8 to 10 percent or about 80 net new stores. We expect this incremental growth to include 23 SuperTargets, comprising about 30 percent of the net increase in square footage at Target. Funding sources for the growth of our business include internally generated funds and debt.
Interest expense in 2003 is expected to increase only modestly, if at all, from 2002, as continued growth in the funding necessary to support both Target's expansion and our credit card operations will moderate, and will likely be substantially offset by continued interest rate favorability.
Our effective income tax rate in 2003 is expected to approximate 38.0 percent.
Forward-looking Statements
This Annual Report, including the preceding management's discussion and analysis, contains forward-looking statements regarding our performance, liquidity and the adequacy of our capital resources. Those statements are based on our current assumptions and expectations and are subject to certain risks and uncertainties that could cause actual results to differ materially from those projected. We caution that the forward-looking statements are qualified by the risks and challenges posed by increased competition, shifting consumer demand, changing consumer credit markets, changing capital markets and general economic conditions, hiring and retaining effective team members, sourcing merchandise from domestic and international vendors, investing in new business strategies, achieving our growth objectives, the outbreak of war and other significant national and international events, and other risks and uncertainties. As a result, while we believe that there is a reasonable basis for the forward-looking statements, you should not place undue reliance on those statements. You are encouraged to review Exhibit (99)C attached to our Form 10-K Report for the year-ended February 1, 2003, which contains additional important factors that may cause actual results to differ materially from those projected in the forward-looking statements.
| Mervyn's Store Count | | 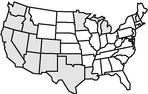 |
| |
Retail Sq. Ft.
| | No. of
Stores
|
|---|
| | (in thousands)
| |
|
|---|
| California | | 9,622 | | 124 |
| Texas | | 3,347 | | 42 |
| Washington | | 1,277 | | 14 |
| Arizona | | 1,203 | | 15 |
| Michigan | | 1,165 | | 15 |
| Minnesota | | 1,160 | | 9 |
| Colorado | | 855 | | 11 |
| Utah | | 754 | | 8 |
| Oregon | | 553 | | 7 |
| Louisiana | | 449 | | 6 |
| Nevada | | 422 | | 6 |
| Oklahoma | | 269 | | 3 |
| New Mexico | | 267 | | 3 |
| Idaho | | 82 | | 1 |
Total |
|
21,425 |
|
264 |
Marshall Field's Store Count | |
 |
| |
Retail Sq. Ft.
| | No. of
Stores
|
|---|
| | (in thousands)
| |
|
|---|
| Michigan | | 4,810 | | 21 |
| Illinois | | 4,917 | | 17 |
| Minnesota | | 3,071 | | 12 |
| Wisconsin | | 817 | | 5 |
| Ohio | | 593 | | 3 |
| North Dakota | | 295 | | 3 |
| Indiana | | 242 | | 2 |
| South Dakota | | 100 | | 1 |
Total |
|
14,845 |
|
64 |
23
CONSOLIDATED RESULTS OF OPERATIONS
(millions, except per share data)
| | 2002
| | 2001
| | 2000
|
|---|
| Sales | | $ | 42,722 | | $ | 39,114 | | $ | 36,310 |
| Net credit card revenues | | | 1,195 | | | 712 | | | 541 |
| | |
| |
| |
|
| | Total revenues | | | 43,917 | | | 39,826 | | | 36,851 |
| | |
| |
| |
|
| Cost of sales | | | 29,260 | | | 27,143 | | | 25,214 |
| Selling, general and administrative expense | | | 9,416 | | | 8,461 | | | 7,928 |
| Credit card expense | | | 765 | | | 463 | | | 290 |
| Depreciation and amortization | | | 1,212 | | | 1,079 | | | 940 |
| Interest expense | | | 588 | | | 473 | | | 426 |
| | |
| |
| |
|
| Earnings before income taxes | | | 2,676 | | | 2,207 | | | 2,053 |
| Provision for income taxes | | | 1,022 | | | 839 | | | 789 |
| | |
| |
| |
|
| Net earnings | | | 1,654 | | | 1,368 | | | 1,264 |
| | |
| |
| |
|
| Basic earnings per share | | $ | 1.82 | | $ | 1.52 | | $ | 1.40 |
| | |
| |
| |
|
| Diluted earnings per share | | $ | 1.81 | | $ | 1.50 | | $ | 1.38 |
| | |
| |
| |
|
| Weighted average common shares outstanding: | | | | | | | | | |
| | Basic | | | 908.0 | | | 901.5 | | | 903.5 |
| | Diluted | | | 914.0 | | | 909.8 | | | 913.0 |
| | |
| |
| |
|
See Notes to Consolidated Financial Statements throughout pages 28-36.
24
CONSOLIDATED STATEMENTS OF FINANCIAL POSITION
(millions)
| | February 1, 2003
| | February 2, 2002
| |
|---|
| Assets | | | | | | | |
| Cash and cash equivalents | | $ | 758 | | $ | 499 | |
| Accounts receivable, net | | | 5,565 | | | 3,831 | |
| Inventory | | | 4,760 | | | 4,449 | |
| Other | | | 852 | | | 869 | |
| | |
| |
| |
| | Total current assets | | | 11,935 | | | 9,648 | |
| Property and equipment | | | | | | | |
| | Land | | | 3,236 | | | 2,833 | |
| | Buildings and improvements | | | 11,527 | | | 10,103 | |
| | Fixtures and equipment | | | 4,983 | | | 4,290 | |
| | Construction-in-progress | | | 1,190 | | | 1,216 | |
| | Accumulated depreciation | | | (5,629 | ) | | (4,909 | ) |
| | |
| |
| |
| | Property and equipment, net | | | 15,307 | | | 13,533 | |
| Other | | | 1,361 | | | 973 | |
| | |
| |
| |
| Total assets | | $ | 28,603 | | $ | 24,154 | |
| | |
| |
| |
| Liabilities and shareholders' investment | | | | | | | |
| Accounts payable | | $ | 4,684 | | $ | 4,160 | |
| Accrued liabilities | | | 1,545 | | | 1,566 | |
| Income taxes payable | | | 319 | | | 423 | |
| Current portion of long-term debt and notes payable | | | 975 | | | 905 | |
| | |
| |
| |
| | Total current liabilities | | | 7,523 | | | 7,054 | |
| Long-term debt | | | 10,186 | | | 8,088 | |
| Deferred income taxes and other | | | 1,451 | | | 1,152 | |
| Shareholders' investment | | | | | | | |
| | Common stock* | | | 76 | | | 75 | |
| | Additional paid-in-capital | | | 1,256 | | | 1,098 | |
| | Retained earnings | | | 8,107 | | | 6,687 | |
| | Accumulated other comprehensive income | | | 4 | | | — | |
| | |
| |
| |
| | Total shareholders' investment | | | 9,443 | | | 7,860 | |
| | |
| |
| |
| Total liabilities and shareholders' investment | | $ | 28,603 | | $ | 24,154 | |
| | |
| |
| |
- *
- Authorized 6,000,000,000 shares, $.0833 par value; 909,801,560 shares issued and outstanding at February 1, 2003: 905,164,702 shares issued and outstanding at February 2, 2002.
See Notes to Consolidated Financial Statements throughout pages 28-36.
25
CONSOLIDATED STATEMENTS OF CASH FLOWS
(millions)
| | 2002
| | 2001
| | 2000
| |
|---|
| Operating activities | | | | | | | | | | |
| Net earnings | | $ | 1,654 | | $ | 1,368 | | $ | 1,264 | |
| Reconciliation to cash flow: | | | | | | | | | | |
| | Depreciation and amortization | | | 1,212 | | | 1,079 | | | 940 | |
| | Bad debt provision | | | 460 | | | 230 | | | — | |
| | Deferred tax provision | | | 248 | | | 49 | | | 1 | |
| | Other noncash items affecting earnings | | | 226 | | | 212 | | | 234 | |
| | Changes in operating accounts providing/(requiring) cash: | | | | | | | | | | |
| | | Accounts receivable | | | (2,194 | ) | | (1,193 | ) | | — | |
| | | Inventory | | | (311 | ) | | (201 | ) | | (450 | ) |
| | | Other current assets | | | 15 | | | (91 | ) | | (9 | ) |
| | | Other assets | | | (174 | ) | | (178 | ) | | 28 | |
| | | Accounts payable | | | 524 | | | 584 | | | 62 | |
| | | Accrued liabilities | | | (21 | ) | | 29 | | | (23 | ) |
| | | Income taxes payable | | | (79 | ) | | 124 | | | 87 | |
| | Other | | | 30 | | | — | | | — | |
| | |
| |
| |
| |
| | Cash flow provided by operations | | | 1,590 | | | 2,012 | | | 2,134 | |
| | |
| |
| |
| |
| Investing activities | | | | | | | | | | |
| | Expenditures for property and equipment | | | (3,221 | ) | | (3,163 | ) | | (2,528 | ) |
| | Increase in receivable-backed securities | | | — | | | (174 | ) | | (217 | ) |
| | Proceeds from disposals of property and equipment | | | 32 | | | 32 | | | 57 | |
| | Other | | | — | | | (5 | ) | | (4 | ) |
| | |
| |
| |
| |
| | Cash flow required for investing activities | | | (3,189 | ) | | (3,310 | ) | | (2,692 | ) |
| | |
| |
| |
| |
| | Net financing requirements | | | (1,599 | ) | | (1,298 | ) | | (558 | ) |
| | |
| |
| |
| |
| Financing activities | | | | | | | | | | |
| | (Decrease)/increase in notes payable, net | | | — | | | (808 | ) | | 245 | |
| | Additions to long-term debt | | | 3,153 | | | 3,250 | | | 2,000 | |
| | Reductions of long-term debt | | | (1,071 | ) | | (793 | ) | | (803 | ) |
| | Dividends paid | | | (218 | ) | | (203 | ) | | (190 | ) |
| | Repurchase of stock | | | (14 | ) | | (20 | ) | | (585 | ) |
| | Other | | | 8 | | | 15 | | | 27 | |
| | |
| |
| |
| |
| | Cash flow provided by financing activities | | | 1,858 | | | 1,441 | | | 694 | |
| | |
| |
| |
| |
| Net increase in cash and cash equivalents | | | 259 | | | 143 | | | 136 | |
| Cash and cash equivalents at beginning of year | | | 499 | | | 356 | | | 220 | |
| | |
| |
| |
| |
| Cash and cash equivalents at end of year | | $ | 758 | | $ | 499 | | $ | 356 | |
| | |
| |
| |
| |
Amounts presented herein are on a cash basis and therefore may differ from those shown in other sections of this Annual Report. Cash paid for income taxes was $853 million, $666 million and $700 million during 2002, 2001 and 2000, respectively. Cash paid for interest (including interest capitalized) was $526 million, $477 million, and $420 million during 2002, 2001 and 2000, respectively.
See Notes to Consolidated Financial Statements throughout pages 28-36.
26
CONSOLIDATED STATEMENTS OF SHAREHOLDERS' INVESTMENT
(millions, except footnotes)
| | Common Stock Shares
| | Common Stock
| | Additional Paid-in Capital
| | Retained Earnings
| | Accumulated Other Comprehensive Income
| | Total
| |
|---|
| January 29, 2000 | | 911.7 | | $ | 76 | | $ | 730 | | $ | 5,056 | | $ | — | | $ | 5,862 | |
| Consolidated net earnings | | — | | | — | | | — | | | 1,264 | | | — | | | 1,264 | |
| Dividends declared | | — | | | — | | | — | | | (194 | ) | | — | | | (194 | ) |
| Repurchase of stock | | (21.2 | ) | | (1 | ) | | — | | | (584 | ) | | — | | | (585 | ) |
| Issuance of stock for ESOP | | 2.4 | | | — | | | 86 | | | — | | | — | | | 86 | |
| Stock options and awards: | | | | | | | | | | | | | | | | | | |
| | Tax benefit | | — | | | — | | | 44 | | | — | | | — | | | 44 | |
| | Proceeds received, net | | 4.9 | | | — | | | 42 | | | — | | | — | | | 42 | |
| | |
| |
| |
| |
| |
| |
| |
| February 3, 2001 | | 897.8 | | | 75 | | | 902 | | | 5,542 | | | — | | | 6,519 | |
| Consolidated net earnings | | — | | | — | | | — | | | 1,368 | | | — | | | 1,368 | |
| Dividends declared | | — | | | — | | | — | | | (203 | ) | | — | | | (203 | ) |
| Repurchase of stock | | (.5 | ) | | — | | | — | | | (20 | ) | | — | | | (20 | ) |
| Issuance of stock for ESOP | | 2.6 | | | — | | | 89 | | | — | | | — | | | 89 | |
| Stock options and awards: | | | | | | | | | | | | | | | | | | |
| | Tax benefit | | — | | | — | | | 63 | | | — | | | — | | | 63 | |
| | Proceeds received, net | | 5.3 | | | — | | | 44 | | | — | | | — | | | 44 | |
| | |
| |
| |
| |
| |
| |
| |
| February 2, 2002 | | 905.2 | | | 75 | | | 1,098 | | | 6,687 | | | — | | | 7,860 | |
| Consolidated net earnings | | — | | | — | | | — | | | 1,654 | | | — | | | 1,654 | |
| Other comprehensive income | | — | | | — | | | — | | | — | | | 4 | | | 4 | |
| | | | | | | | | | | | | | | | |
| |
| Total comprehensive income | | | | | | | | | | | | | | | | | 1,658 | |
| Dividends declared | | — | | | — | | | — | | | (218 | ) | | — | | | (218 | ) |
| Repurchase of stock | | (.5 | ) | | — | | | — | | | (16 | ) | | — | | | (16 | ) |
| Issuance of stock for ESOP | | 3.0 | | | 1 | | | 105 | | | — | | | — | | | 106 | |
| Stock options and awards: | | | | | | | | | | | | | | | | | | |
| | Tax benefit | | — | | | — | | | 26 | | | — | | | — | | | 26 | |
| | Proceeds received, net | | 2.1 | | | — | | | 27 | | | — | | | — | | | 27 | |
| | |
| |
| |
| |
| |
| |
| |
| February 1, 2003 | | 909.8 | | $ | 76 | | $ | 1,256 | | $ | 8,107 | | $ | 4 | | $ | 9,443 | |
| | |
| |
| |
| |
| |
| |
| |
Common Stock Authorized 6,000,000,000 shares, $.0833 par value; 909,801,560 shares issued and outstanding at February 1, 2003; 905,164,702 shares issued and outstanding at February 2, 2002; 897,763,244 shares issued and outstanding at February 3, 2001.
In January 1999 and March 2000, our Board of Directors authorized the aggregate repurchase of $2 billion of our common stock. In 2001, common stock repurchases under our program were essentially suspended. Our common stock repurchases are recorded net of the premium received from put options. Repurchases are made primarily in open market transactions, subject to market conditions.
Our common stock repurchase program has included the sale of put options that entitle the holder to sell shares of our common stock to us, at a specified price, if the holder exercises the option. No put options were sold during or were outstanding at the end of 2002 or 2001. During 2000, we sold put options on 9.5 million shares. Premiums received from the sale of put options during 2000 were recorded in retained earnings and totaled $29 million, of which $12 million represent premiums received on put options outstanding at year-end.
Preferred Stock Authorized 5,000,000 shares,$.01 par value; no shares were issued or outstanding at February 1, 2003, February 2, 2002 or February 3, 2001.
Junior Preferred Stock Rights In 2001, we declared a distribution of preferred share purchase rights. Terms of the plan provide for a distribution of one preferred share purchase right for each outstanding share of our common stock. Each right will entitle shareholders to buy one twelve-hundredth of a share of a new series of junior participating preferred stock at an exercise price of $125.00, subject to adjustment. The rights will be exercisable only if a person or group acquires ownership of 20 percent or more of our common stock or announces a tender offer to acquire 30 percent or more of our common stock.
Dividends Dividends declared per share were $0.24, $0.225 and $0.215 in 2002, 2001 and 2000, respectively.
See Notes to Consolidated Financial Statements throughout pages 28-36.
27
NOTES TO CONSOLIDATED FINANCIAL STATEMENTS
Summary of Accounting Policies
Organization Target Corporation (the Corporation) is a general merchandise retailer, comprised of three operating segments: Target, Mervyn's and Marshall Field's. Target, an upscale discount chain located in 47 states, contributed 84 percent of our 2002 total revenues. Mervyn's, a middle-market promotional department store located in 14 states in the West, South and Midwest, contributed 9 percent of total revenues. Marshall Field's (including stores formerly named Dayton's and Hudson's), a traditional department store located in 8 states in the upper Midwest, contributed 6 percent of total revenues.
Consolidation The financial statements include the balances of the Corporation and its subsidiaries after elimination of material intercompany balances and transactions. All material subsidiaries are wholly owned.
Use of Estimates The preparation of our financial statements, in conformity with accounting principles generally accepted in the United States, requires management to make estimates and assumptions that affect the reported amounts in the financial statements and accompanying notes. Actual results may differ from those estimates.
Fiscal Year Our fiscal year ends on the Saturday nearest January 31. Unless otherwise stated, references to years in this report relate to fiscal years rather than to calendar years. Fiscal years 2002 and 2001 each consisted of 52 weeks. Fiscal year 2000 consisted of 53 weeks.
Reclassifications Certain prior year amounts have been reclassified to conform to the current year presentation.
Revenues
Revenue from retail sales is recognized at the time of sale. Commissions earned on sales generated by leased departments are included within sales and were $33 million in 2002, $37 million in 2001 and $33 million in 2000. Net credit card revenues are comprised of finance charges and late fees on credit card sales, as well as third-party merchant fees earned from the use of our Target Visa credit card. Prior to August 22, 2001, net credit card revenues are net of the effect of any publicly held receivable-backed securities. The amount of our retail sales charged to our credit cards were $5.4 billion, $5.6 billion and $5.5 billion in 2002, 2001 and 2000, respectively.
Consideration Received from Vendors
During 2002, the Emerging Issues Task Force reached a consensus on Issue No. 02-16, "Accounting by a Customer (Including a Reseller) for Certain Consideration Received from a Vendor." Under the new guidance, cash consideration received from a vendor should be classified as a reduction of cost of sales. If the consideration received represents a payment for assets delivered to the vendor, it should be classified as revenue. If the consideration is a reimbursement of a specific, incremental, identifiable cost incurred in selling the vendor's product, the cost should be characterized as a reduction of that cost incurred. The guidance is effective for fiscal periods beginning after December 15, 2002. We do not believe the adoption of this guidance will have a material impact on our net earnings, cash flows or financial position.
Advertising Costs
Advertising costs, included in selling, general and administrative expense, are expensed as incurred and were $962 million, $924 million and $824 million for 2002, 2001 and 2000, respectively.
Earnings per Share
Basic earnings per share (EPS) is net earnings divided by the average number of common shares outstanding during the period. Diluted EPS includes the incremental shares that are assumed to be issued on the exercise of stock options. Shares issuable upon exercise of approximately 13.2 million options outstanding at February 1, 2003 were not included in the dilutive earnings per share calculation because the effect would have been antidilutive. No such shares were excluded from the dilutive earnings per share calculation at February 2, 2002, and 3.7 million such shares were excluded at February 3, 2001. References herein to earnings per share refer to diluted EPS.
All earnings per share, dividends per share and common shares outstanding reflect our 2000 two-for-one share split.
| | Basic EPS
| | Diluted EPS
|
|---|
(millions, except per share data)
|
|---|
| | 2002
| | 2001
| | 2000
| | 2002
| | 2001
| | 2000
|
|---|
| Net earnings | | $ | 1,654 | | $ | 1,368 | | $ | 1,264 | | $ | 1,654 | | $ | 1,368 | | $ | 1,264 |
| Basic weighted average common shares outstanding | | | 908.0 | | | 901.5 | | | 903.5 | | | 908.0 | | | 901.5 | | | 903.5 |
| Stock options | | | — | | | — | | | — | | | 6.0 | | | 8.3 | | | 9.3 |
| Put warrants | | | — | | | — | | | — | | | — | | | — | | | .2 |
| | |
| |
| |
| |
| |
| |
|
| Weighted average common shares outstanding | | | 908.0 | | | 901.5 | | | 903.5 | | | 914.0 | | | 909.8 | | | 913.0 |
| | |
| |
| |
| |
| |
| |
|
| Earnings per share | | $ | 1.82 | | $ | 1.52 | | $ | 1.40 | | $ | 1.81 | | $ | 1.50 | | $ | 1.38 |
| | |
| |
| |
| |
| |
| |
|
Other Comprehensive Income
Other comprehensive income includes revenues, expenses, gains and losses that are excluded from net earnings under accounting principles generally accepted in the United States. In the current year, it primarily includes gains and losses on certain hedge transactions, net of related taxes.
28
Cash Equivalents
Cash equivalents represent short-term investments with a maturity of three months or less from the time of purchase.
Accounts Receivable and Receivable-backed Securities
Accounts receivable is recorded net of an allowance for expected losses. The allowance, recognized in an amount equal to the anticipated future write-offs based on historical experience and other factors, was $399 million at February 1, 2003 and $261 million at February 2, 2002.
Through our special purpose subsidiary, Target Receivables Corporation (TRC), we transfer, on an ongoing basis, substantially all of our receivables to the Target Credit Card Master Trust (the Trust) in return for certificates representing undivided interests in the Trust's assets. TRC owns the undivided interest in the Trust's assets, other than the Trust's assets securing the financing transactions entered into by the Trust and the 2 percent of Trust assets held by Retailers National Bank (RNB). RNB is a wholly owned subsidiary of the Corporation that also services receivables. The Trust assets and the related income and expenses are reflected in each operating segment's assets and operating results based on the origin of the credit card giving rise to the receivable.
Concurrent with our August 22, 2001 issuance of receivable-backed securities from the Trust, Statement of Financial Accounting Standards (SFAS) No. 140 (which replaced SFAS No. 125 in its entirety) became the accounting guidance applicable to such transactions. Application of SFAS No. 140 resulted in secured financing accounting for these transactions. This accounting treatment results from the fact that the Trust is not a qualifying special purpose entity under SFAS No. 140. While this accounting requires secured financing treatment of the securities issued by the Trust on our consolidated financial statements, the assets within the Trust are still considered sold to our wholly owned, bankruptcy remote subsidiary, TRC, and are not available to general creditors of the Corporation.
Beginning on August 22, 2001, our consolidated financial statements reflected the following accounting changes. First, we reflected the obligation to holders of the $800 million (face value) of previously sold receivable-backed securities (Series 1997-1 and 1998-1, Class A Certificates) as debt of TRC, and we recorded the receivables at fair value in place of the previously recorded retained interests related to the sold securities. This resulted in an unusual pre-tax charge of $67 million ($.05 per share). Next, we reclassified the owned receivable-backed securities to accounts receivable at fair value. This reclassification had no impact on our consolidated statements of operations because we had previously recorded permanent impairments to our portfolio of owned receivable-backed securities in amounts equal to the difference between face value and fair value of the underlying receivables. On August 22, 2001, the Trust's entire portfolio of receivables was reflected on our consolidated financial statements at its fair value, which was based upon the expected performance of the underlying receivables portfolio. At that point in time, fair value was equivalent in amount to face value, net of an appropriate allowance. By the end of 2001, a normalized relationship developed between the face value of receivables and the allowance for doubtful accounts through turnover of receivables within the portfolio. This process had no impact on our consolidated financial statements. As a result, at February 1, 2003 and at February 2, 2002, our allowance for doubtful accounts is attributable to our entire receivables portfolio.
Prior to August 22, 2001, income on the receivable-backed securities was accrued based on the effective interest rate applied to its cost basis, adjusted for accrued interest and principal paydowns. The effective interest rate approximates the yield on the underlying receivables. We monitored impairment of receivable-backed securities based on fair value. Permanent impairments were charged to earnings through credit expense in the period in which it was determined that the receivable-backed securities' carrying value was greater than their fair value. Permanent impairment charges on the receivables underlying the receivable-backed securities portfolio were $89 million in 2001 and $140 million in 2000. Permanent impairment charges in 2001 include only those losses prior to the consolidation of our special purpose entity on August 22, 2001.
Inventory
We account for inventory and the related cost of sales under the retail inventory accounting method using the last-in, first-out (LIFO) basis. Inventory is stated at the lower of LIFO cost or market. The cumulative LIFO provision was $52 million and $64 million at year-end 2002 and 2001, respectively.
Inventory
(millions)
| | February 1, 2003
| | February 2, 2002
|
|---|
| Target | | $ | 3,748 | | $ | 3,348 |
| Mervyn's | | | 486 | | | 523 |
| Marshall Field's | | | 324 | | | 348 |
| Other | | | 202 | | | 230 |
| | |
| |
|
| Total inventory | | $ | 4,760 | | $ | 4,449 |
| | |
| |
|
Property and Equipment
Property and equipment are recorded at cost, less accumulated depreciation. Depreciation is computed using the straight-line method over estimated useful lives. Depreciation expense for the years 2002, 2001 and 2000 was $1,183 million, $1,049 million and $913 million, respectively. Accelerated depreciation methods are generally used for income tax purposes.
Estimated useful lives by major asset category are as follows:
Asset
| | Life (in years)
|
|---|
| Buildings and improvements | | 8 - 50 |
| Fixtures and equipment | | 4 - 8 |
| Computer hardware and software | | 4 |
29
In 2001, the Financial Accounting Standards Board (FASB) issued SFAS No. 144, "Accounting for the Impairment or Disposal of Long-Lived Assets," superseding SFAS No. 121 in its entirety and the accounting and reporting provisions of Accounting Principles Board (APB) Opinion No. 30 for disposals of segments of a business. The statement retains the fundamental provisions of SFAS No. 121, clarifies guidance related to asset classification and impairment testing and incorporates guidance related to disposals of segments.
As required, we adopted SFAS No. 144 in the first quarter of 2002. All long-lived assets are reviewed when events or changes in circumstances indicate that the carrying value of the asset may not be recoverable. We review most assets at a store level basis, which is the lowest level of assets for which there are identifiable cash flows. The carrying amount of the store assets are compared to the related expected undiscounted future cash flows to be generated by those assets over the estimated remaining useful life of the primary asset. Cash flows are projected for each store based upon historical results and expectations. In cases where the expected future cash flows and fair value are less than the carrying amount of the assets, those stores are considered impaired and the assets are written down to fair value. Fair value is based on appraisals or other reasonable methods to estimate value. In 2002, impairment losses are included in depreciation expense and resulted in a financial statement impact of less than $.01 per share.
Goodwill and Intangible Assets
In 2001, the FASB issued SFAS No. 142, "Goodwill and Other Intangible Assets," which supersedes APB Opinion No. 17, "Intangible Assets." Under the new statement, goodwill and intangible assets that have indefinite useful lives are no longer amortized but rather reviewed at least annually for impairment. As required, we adopted this statement in the first quarter of 2002. The adoption of this statement reduced annual amortization expense by approximately $10 million ($.01 per share). At February 1, 2003 and February 2, 2002, net goodwill and intangible assets were $376 million and $250 million, respectively, including $155 million of goodwill and intangible assets with indefinite useful lives in both years.
Goodwill and intangible assets are recorded within other long-term assets at cost less accumulated amortization. Amortization is computed on intangible assets with definite useful lives using the straight-line method over estimated useful lives that range from three to 15 years. Amortization expense for the years 2002, 2001 and 2000 was $29 million, $30 million and $27 million, respectively.
Accounts Payable
Outstanding drafts included in accounts payable were $1,125 million and $958 million at year-end 2002 and 2001, respectively.
Lines of Credit
At February 1, 2003, two committed credit agreements totaling $1.9 billion were in place through a group of 30 banks at specified rates. There were no balances outstanding at any time during 2002 or 2001 under these agreements.
Commitments and Contingencies
At February 1, 2003, our obligations included notes payable, notes and debentures of $11,017 million (discussed in detail under Long-term Debt and Notes Payable on page 31) and the present value of capital and operating lease obligations of $144 million and $924 million, respectively (discussed in detail under Leases on page 32). In addition, commitments for the purchase, construction, lease or remodeling of real estate, facilities and equipment were approximately $509 million at year-end 2002.
In July 2001, the FASB issued SFAS No. 143, "Accounting for Asset Retirement Obligations." SFAS No. 143 addresses the accounting and reporting for obligations associated with the retirement of tangible long-lived assets and the associated asset retirement cost. SFAS No. 143 is effective for financial statements issued for fiscal years beginning after June 15, 2002. The adoption of SFAS No. 143 in the first quarter of 2003 will not have an impact on current year or previously reported net earnings, cash flows or financial position.
In July 2002, the FASB issued SFAS No. 146, "Accounting for Costs Associated with Exit or Disposal Activities." The provisions of SFAS No. 146 are effective for exit or disposal activities that are initiated after December 31, 2002. SFAS No. 146 requires that a liability for a cost associated with an exit or disposal activity be recognized when the liability is incurred instead of recognizing the liability at the date of commitment to an exit plan as was previously allowed. The adoption of SFAS No. 146 will not have an impact on current year or previously reported net earnings, cash flows or financial position.
We are exposed to claims and litigation arising out of the ordinary course of business. Management, after consulting with legal counsel, believes the currently identified claims and litigation will not have a material adverse effect on our results of operations or our financial condition taken as a whole.
30
Long-term Debt and Notes Payable
At February 1, 2003 and February 2, 2002, $100 million of notes payable were outstanding, representing financing secured by the Target Credit Card Master Trust Series 1996-1 Class A variable funding certificate. This certificate is debt of TRC and is classified in the current portion of long-term debt and notes payable. The average amount of secured and unsecured notes payable outstanding during 2002 was $170 million at a weighted average interest rate of 1.9 percent. The average amount of secured and unsecured notes payable outstanding during 2001 was $658 million at a weighted average interest rate of 4.4 percent.
In 2002, we issued $750 million of long-term debt maturing in 2009 at 5.38 percent, $1 billion of long-term debt maturing in 2012 at 5.88 percent, and $600 million of long-term debt maturing in 2032 at 6.35 percent. Also during 2002, the Trust issued $750 million of floating rate debt secured by credit card receivables, bearing interest at an initial rate of 1.99 percent maturing in 2007. We also called or repurchased $266 million of long-term debt with an average remaining life of 19 years and a weighted average interest rate of 8.8 percent, resulting in a loss of $34 million ($.02 per share).
In 2001, we issued $550 million of long-term debt maturing in 2006 at 5.95 percent, $500 million of long-term debt maturing in 2007 at 5.50 percent, $750 million of long-term debt maturing in 2008 at 5.40 percent, and $700 million of long-term debt maturing in 2031 at 7.00 percent. The Trust issued $750 million of floating rate debt secured by credit card receivables, bearing interest at an initial rate of 3.69 percent maturing in 2004. In addition, concurrent with this transaction, on August 22, 2001 we reflected the obligation to holders of the $800 million in previously sold receivable-backed securities as debt of TRC (discussed in detail under Accounts Receivable and Receivable-backed Securities on page 29). Also during 2001, we called or repurchased $144 million of long-term debt with an average remaining life of 7 years and a weighted average interest rate of 9.2 percent, resulting in a loss of $9 million ($.01 per share).
Subsequent to year-end 2002, we issued $500 million of long-term debt maturing in 2008 at 3.4 percent.
At year-end our debt portfolio was as follows:
Long-term Debt and Notes Payable
| | February 1, 2003
| | February 2, 2002
| |
|---|
(millions)
| |
|---|
| | Rate*
| | Balance
| | Rate*
| | Balance
| |
|---|
| Notes payable | | 1.4 | % | $ | 100 | | 1.8 | % | $ | 100 | |
| Notes and debentures: | | | | | | | | | | | |
| | Due 2002-2006 | | 3.7 | | | 3,072 | | 4.0 | | | 3,806 | |
| | Due 2007-2011 | | 5.1 | | | 4,572 | | 6.5 | | | 3,056 | |
| | Due 2012-2016 | | 6.0 | | | 1,060 | | 9.4 | | | 27 | |
| | Due 2017-2021 | | 9.4 | | | 155 | | 9.6 | | | 194 | |
| | Due 2022-2026 | | 8.0 | | | 358 | | 8.2 | | | 557 | |
| | Due 2027-2031 | | 6.9 | | | 1,100 | | 6.9 | | | 1,100 | |
| | Due 2032 | | 6.4 | | | 600 | | — | | | — | |
| | |
| |
| |
| |
| |
| Total notes payable, notes and debentures** | | 5.2 | % | $ | 11,017 | | 5.6 | % | $ | 8,840 | |
| Capital lease obligations | | | | | 144 | | | | | 153 | |
| Less: current portion | | | | | (975 | ) | | | | (905 | ) |
| | | | |
| | | |
| |
| Long-term debt and notes payable | | | | $ | 10,186 | | | | $ | 8,088 | |
| | | | |
| | | |
| |
- *
- Reflects the weighted average stated interest rate as of year-end, including the impact of interest rate swaps.
- **
- The estimated fair value of total notes payable and notes and debentures, using a discounted cash flow analysis based on our incremental interest rates for similar types of financial instruments, was $11,741 million at February 1, 2003 and $9,279 million at February 2, 2002.
Required principal payments on long-term debt and notes payable over the next five years, excluding capital lease obligations, are $965 million in 2003, $857 million in 2004, $502 million in 2005, $752 million in 2006 and $1,323 million in 2007.
Derivatives
At February 1, 2003 and February 2, 2002, interest rate swap agreements were outstanding in notional amounts totaling $1,450 million in both years. The swaps hedge the fair value of certain debt by effectively converting interest from fixed rate to variable. During the year, we entered into and terminated an interest rate swap with a notional amount of $500 million. We also entered into an interest rate swap with a notional amount of $400 million, and an interest rate swap with a notional amount of $400 million matured. Any hedge ineffectiveness related to our swaps is recognized in interest expense. We have previously entered into rate lock agreements to hedge the exposure to variability in future cash flows of forecasted debt transactions. When the transactions contemplated by these agreements occurred, the gain or loss was recorded as a component of other comprehensive income and will be reclassified into earnings in the periods during which the designated hedged cash flows affect earnings. The fair value of our outstanding derivatives was $110 million and $44 million at February 1, 2003 and February 2, 2002, respectively. These amounts are reflected in the Consolidated Statements of Financial Position. Cash flows from hedging transactions are classified consistent with the item being hedged.
31
Leases
Assets held under capital leases are included in property and equipment and are charged to depreciation and interest over the life of the lease. Operating leases are not capitalized and lease rentals are expensed. Rent expense on buildings, classified in selling, general and administrative expense, includes percentage rents that are based on a percentage of retail sales over stated levels. Total rent expense was $179 million in 2002, $171 million in 2001 and $168 million in 2000. Most of the long-term leases include options to renew, with terms varying from five to 30 years. Certain leases also include options to purchase the property.
Future minimum lease payments required under noncancelable lease agreements existing at February 1, 2003, were:
Future Minimum Lease Payments
(millions)
| | Operating Leases
| | Capital Leases
| |
|---|
| 2003 | | $ | 147 | | $ | 21 | |
| 2004 | | | 140 | | | 20 | |
| 2005 | | | 125 | | | 19 | |
| 2006 | | | 109 | | | 18 | |
| 2007 | | | 99 | | | 18 | |
| After 2007 | | | 908 | | | 148 | |
| | |
| |
| |
| Total future minimum lease payments | | $ | 1,528 | | $ | 244 | |
| Less: interest* | | | (604 | ) | | (100 | ) |
Present value of minimum lease payments |
|
$ |
924 |
|
$ |
144 |
** |
| | |
| |
| |
- *
- Calculated using the interest rate at inception for each lease (the weighted average interest rate was 8.7 percent).
- **
- Includes current portion of $10 million.
Owned and Leased Store Locations
At year-end 2002, owned, leased and "combined" (generally an owned building on leased land) store locations by operating segment were as follows:
| | Owned
| | Leased
| | Combined
| | Total
|
|---|
| Target | | 904 | | 96 | | 147 | | 1,147 |
| Mervyn's | | 156 | | 61 | | 47 | | 264 |
| Marshall Field's | | 51 | | 12 | | 1 | | 64 |
| | |
| |
| |
| |
|
| Total | | 1,111 | | 169 | | 195 | | 1,475 |
| | |
| |
| |
| |
|
Income Taxes
Reconciliation of tax rates is as follows:
Percent of Earnings Before Income Taxes
| | 2002
| | 2001
| | 2000
| |
|---|
| Federal statutory rate | | 35.0 | % | 35.0 | % | 35.0 | % |
| State income taxes, net of federal tax benefit | | 3.4 | | 3.3 | | 3.6 | |
| Dividends on ESOP stock | | (.2 | ) | (.1 | ) | (.2 | ) |
| Work opportunity tax credits | | (.2 | ) | (.2 | ) | (.2 | ) |
| Other | | .2 | | — | | .2 | |
| | |
| |
| |
| |
| Effective tax rate | | 38.2 | % | 38.0 | % | 38.4 | % |
| | |
| |
| |
| |
The components of the provision for income taxes were:
Income Tax Provision: Expense/(Benefit)
(millions)
| | 2002
| | 2001
| | 2000
| |
|---|
| Current: | | | | | | | | | | |
| | Federal | | $ | 663 | | $ | 683 | | $ | 675 | |
| | State | | | 111 | | | 107 | | | 113 | |
| | |
| |
| |
| |
| | | | 774 | | | 790 | | | 788 | |
| | |
| |
| |
| |
| Deferred: | | | | | | | | | | |
| | Federal | | | 220 | | | 43 | | | (1 | ) |
| | State | | | 28 | | | 6 | | | 2 | |
| | |
| |
| |
| |
| | | | 248 | | | 49 | | | 1 | |
| | |
| |
| |
| |
| Total | | $ | 1,022 | | $ | 839 | | $ | 789 | |
| | |
| |
| |
| |
The components of the net deferred tax asset/(liability) were:
Net Deferred Tax Asset/(Liability)
(millions)
| | February 1, 2003
| | February 2, 2002
| |
|---|
| Gross deferred tax assets: | | | | | | | |
| Self-insured benefits | | $ | 188 | | $ | 172 | |
| Deferred compensation | | | 184 | | | 160 | |
| Inventory | | | 106 | | | 138 | |
| Accounts receivable valuation allowance | | | 151 | | | 99 | |
| Postretirement health care obligation | | | 42 | | | 41 | |
| Other | | | 77 | | | 97 | |
| | |
| |
| |
| | | | 748 | | | 707 | |
| | |
| |
| |
| Gross deferred tax liabilities: | | | | | | | |
| Property and equipment | | | (730 | ) | | (519 | ) |
| Pension | | | (160 | ) | | (109 | ) |
| Other | | | (98 | ) | | (71 | ) |
| | |
| |
| |
| | | | (988 | ) | | (699 | ) |
| | |
| |
| |
| Total | | $ | (240 | ) | $ | 8 | |
| | |
| |
| |
Stock Option Plans
We have stock option plans for key employees and non-employee members of our Board of Directors. Our Long-Term Incentive Plans provide for the granting of stock options, performance share awards, restricted stock awards, or a combination of awards. Performance share awards represent shares issuable in the future based upon attainment of specified levels of future financial performance. A majority of the awards are non-qualified stock options that vest annually in equal amounts over a four-year period. These options expire no later than ten years after the date of the grant. Options granted to the non-employee members of our Board of Directors vest after one year and have a ten-year term. The number of unissued common shares reserved for future grants under the stock option plans was 24,091,318 at February 1, 2003 and 30,216,305 at February 2, 2002.
32
Options and Performance Shares Outstanding
| | Options
| |
|
|---|
| | Total Outstanding
| | Currently Exercisable
| |
|
|---|
| | Performance Shares Potentially Issuable
|
|---|
(options and shares in thousands)
| | Number of Options
| | Average Price*
| | Number of Options
| | Average Price*
|
|---|
| January 29, 2000 | | 32,061 | | $ | 15.32 | | 15,717 | | $ | 10.23 | | — |
| Granted | | 5,617 | | | 33.67 | | | | | | | |
| Canceled | | (481 | ) | | 25.34 | | | | | | | |
| Exercised | | (4,939 | ) | | 9.14 | | | | | | | |
| | |
| |
| |
| |
| |
|
| February 3, 2001 | | 32,258 | | $ | 19.30 | | 18,662 | | $ | 12.36 | | — |
| Granted | | 4,805 | | | 40.52 | | | | | | | |
| Canceled | | (437 | ) | | 30.41 | | | | | | | |
| Exercised | | (5,311 | ) | | 9.42 | | | | | | | |
| | |
| |
| |
| |
| |
|
| February 2, 2002 | | 31,315 | | $ | 24.07 | | 17,629 | | $ | 17.04 | | — |
| Granted | | 6,096 | | | 30.60 | | | | | | | 552 |
| Canceled | | (561 | ) | | 35.55 | | | | | | | |
| Exercised | | (2,063 | ) | | 12.22 | | | | | | | |
| | |
| |
| |
| |
| |
|
| February 1, 2003 | | 34,787 | | | 25.73 | | 21,931 | | $ | 20.89 | | 552 |
| | |
| |
| |
| |
| |
|
- *
- Weighted average exercise price.
Options Outstanding
| |
| |
| | Options Outstanding
| | Currently Exercisable
|
|---|
| | Range of Exercise Prices
| | Number Outstanding
| | Average Life*
| | Average Price**
| | Number Exercisable
| | Average Price**
|
|---|
(options in thousands)
|
|---|
| | | $ | 5.53-$ 9.99 | | 7,075 | | 3.0 | | $ | 7.66 | | 7,075 | | $ | 7.66 |
| | | $ | 10.00-$19.99 | | 5,024 | | 4.6 | | | 18.23 | | 5,024 | | | 18.23 |
| | | $ | 20.00-$29.99 | | 3,785 | | 5.4 | | | 25.93 | | 3,615 | | | 25.84 |
| | | $ | 30.00-$39.99 | | 14,520 | | 8.3 | | | 32.54 | | 5,045 | | | 33.93 |
| | | $ | 40.00-$44.83 | | 4,383 | | 8.9 | | | 40.83 | | 1,172 | | | 40.80 |
| | |
| |
| |
| |
| |
| |
|
| Total | | $ | 5.53-$44.83 | | 34,787 | | 6.5 | | $ | 25.73 | | 21,931 | | $ | 20.89 |
| | |
| |
| |
| |
| |
| |
|
- *
- Weighted average contractual life remaining in years.
- **
- Weighted average exercise price.
In December 2002, the FASB issued SFAS No. 148, "Accounting for Stock-Based Compensation—Transition and Disclosure." SFAS No. 148 amends SFAS No. 123, "Accounting for Stock-Based Compensation," to provide alternative methods of transition for a voluntary change to the fair value based method of accounting for stock-based compensation. We will adopt the fair value method of recording stock-based compensation in the first quarter of 2003. In accordance with the prospective transition method prescribed in SFAS No. 148, the fair value based method will be applied prospectively to awards granted subsequent to February 1, 2003. Awards granted prior to February 2, 2003 will continue to be accounted for under the intrinsic value method, and the pro forma impact of accounting for those awards at fair value will continue to be disclosed until the last of those awards vest in January of 2007. The adoption of this method is expected to increase compensation expense by less than $.01 per share in 2003.
Historically, and through February 1, 2003, we applied the intrinsic value method prescribed in APB No. 25, "Accounting for Stock Issued to Employees," to account for our stock option plans. No compensation expense related to options was recognized because the exercise price of our employee stock options equals the market price of the underlying stock on the grant date. The expense related to the intrinsic value of performance-based and restricted stock awards issued is not significant. If we had elected to recognize compensation cost based on the fair value of the awards at the grant date, net earnings would have been the pro forma amounts shown below.
Pro Forma Earnings
(millions, except per share data)
| | 2002
| | 2001
| | 2000
| |
|---|
| Net earnings—as reported | | $ | 1,654 | | $ | 1,368 | | $ | 1,264 | |
| Stock-based employee compensation expense determined under fair value based method, net of tax | | | (31 | ) | | (28 | ) | | (17 | ) |
| | |
| |
| |
| |
| Net earnings—pro forma | | $ | 1,623 | | $ | 1,340 | | $ | 1,247 | |
| Earnings per share: | | | | | | | | | | |
| | Basic—as reported | | $ | 1.82 | | $ | 1.52 | | $ | 1.40 | |
| | Basic—pro forma | | $ | 1.79 | | $ | 1.49 | | $ | 1.38 | |
| | Diluted—as reported | | $ | 1.81 | | $ | 1.50 | | $ | 1.38 | |
| | Diluted—pro forma | | $ | 1.78 | | $ | 1.47 | | $ | 1.37 | |
The Black-Scholes model was used to estimate the fair value of the options at grant date based on the following assumptions:
| | 2002
| | 2001
| | 2000
| |
|---|
| Dividend yield | | | .8 | % | | .6 | % | | .6 | % |
| Volatility | | | 35 | % | | 30 | % | | 30 | % |
| Risk-free interest rate | | | 3.0 | % | | 4.3 | % | | 4.8 | % |
| Expected life in years | | | 5.0 | | | 5.0 | | | 5.0 | |
| | |
| |
| |
| |
| Weighted average fair value at grant date | | $ | 10.07 | | $ | 13.09 | | $ | 11.15 | |
| | |
| |
| |
| |
Defined Contribution Plans
Employees who meet certain eligibility requirements can participate in a defined contribution 401(k) plan by investing up to 80 percent of their compensation. We match 100 percent of each employee's contribution up to 5 percent of respective total compensation. Our contribution to the plan is initially invested in Target Corporation common stock. Benefits expense related to these matching contributions was $111 million in 2002, $97 million in 2001 and $92 million in 2000.
In addition, we maintain a non-qualified defined contribution plan that allows participants who are otherwise limited by qualified plan statutes or regulations to defer compensation and earn returns tied to the results of our 401(k) plan investment choices. We manage the risk of offering this retirement savings plan to this group of employees through a variety of means, including investing in vehicles that effectively hedge a substantial portion of our exposure to these returns.
During the year, certain non-qualified pension and survivor benefits owed to current executives were exchanged for deferrals in this non-qualified plan. Additionally, certain retired executives accepted our offer to exchange our obligation to them in a frozen non-qualified plan for deferrals in this plan. These exchanges resulted in pre-tax net expense of $33 million ($.02 per share). These amounts reflect $47 million of additional non-qualified defined contribution plan benefits expense partially offset by reduced net
33
pension expense. We expect lower future expenses as a result of these transactions because they were designed to be economically neutral or slightly favorable to us.
Pension and Postretirement Health Care Benefits
We have qualified defined benefit pension plans that cover all employees who meet certain age, length of service and hours worked per year requirements. We also have unfunded non-qualified pension plans for employees who have qualified plan compensation restrictions. Benefits are provided based upon years of service and the employee's compensation. Retired employees also become eligible for certain health care benefits if they meet minimum age and service requirements and agree to contribute a portion of the cost. Additionally, as described above, certain non-qualified pension and survivor benefits owed to current executives were exchanged for deferrals in an existing non-qualified defined contribution employee benefit plan.
Change in Benefit Obligation
| | Pension Benefits
| |
| |
| |
|---|
| | Postretirement Health Care Benefits
| |
|---|
| | Qualified Plans
| | Non-qualified Plans
| |
|---|
(millions)
| |
|---|
| | 2002
| | 2001
| | 2002
| | 2001
| | 2002
| | 2001
| |
|---|
| Benefit obligation at beginning of measurement period | | $ | 1,014 | | $ | 863 | | $ | 53 | | $ | 54 | | $ | 114 | | $ | 99 | |
| Service cost | | | 57 | | | 48 | | | 1 | | | 2 | | | 2 | | | 2 | |
| Interest cost | | | 72 | | | 65 | | | 3 | | | 4 | | | 8 | | | 8 | |
| Actuarial (gain)/loss | | | 59 | | | 88 | | | — | | | 9 | | | 2 | | | 14 | |
| Benefits paid | | | (50 | ) | | (50 | ) | | (5 | ) | | (16 | ) | | (10 | ) | | (9 | ) |
| Plan amendments | | | (74 | ) | | — | | | — | | | — | | | — | | | — | |
| Settlement | | | — | | | — | | | (29 | ) | | — | | | — | | | — | |
| | |
| |
| |
| |
| |
| |
| |
| Benefit obligation at end of measurement period | | $ | 1,078 | | $ | 1,014 | | $ | 23 | | $ | 53 | | $ | 116 | | $ | 114 | |
| | |
| |
| |
| |
| |
| |
| |
Change in Plan Assets
|
|
|
|
|
|
|
|
|
|
|
|
|
|
|---|
Fair value of plan assets at beginning of measurement period |
|
$ |
1,033 |
|
$ |
1,020 |
|
$ |
— |
|
$ |
— |
|
$ |
— |
|
$ |
— |
|
| Actual return on plan assets | | | (79 | ) | | (100 | ) | | — | | | — | | | — | | | — | |
| Employer contribution | | | 154 | | | 163 | | | 5 | | | 16 | | | 10 | | | 9 | |
| Benefits paid | | | (50 | ) | | (50 | ) | | (5 | ) | | (16 | ) | | (10 | ) | | (9 | ) |
| | |
| |
| |
| |
| |
| |
| |
| Fair value of plan assets at end of measurement period | | $ | 1,058 | | $ | 1,033 | | $ | — | | $ | — | | $ | — | | $ | — | |
| | |
| |
| |
| |
| |
| |
| |
Reconciliation of Prepaid/(Accrued) Cost
|
|
|
|
|
|
|
|
|
|
|
|
|
|
|---|
Funded status |
|
$ |
(20 |
) |
$ |
19 |
|
$ |
(23 |
) |
$ |
(53 |
) |
$ |
(116 |
) |
$ |
(114 |
) |
| Unrecognized actuarial loss/(gain) | | | 530 | | | 292 | | | 6 | | | 21 | | | 7 | | | 11 | |
| Unrecognized prior service cost | | | (73 | ) | | 1 | | | 3 | | | 7 | | | 1 | | | 2 | |
| | |
| |
| |
| |
| |
| |
| |
| Net prepaid/(accrued) cost | | $ | 437 | | $ | 312 | | $ | (14 | ) | $ | (25 | ) | $ | (108 | ) | $ | (101 | ) |
| | |
| |
| |
| |
| |
| |
| |
Net Pension and Postretirement Health Care Benefits Expense
| |
| |
| |
| | Postretirement Health Care Benefits
|
|---|
| | Pension Benefits
|
|---|
(millions)
|
|---|
| | 2002
| | 2001
| | 2000
| | 2002
| | 2001
| | 2000
|
|---|
| Service cost benefits earned during the period | | $ | 58 | | $ | 50 | | $ | 47 | | $ | 2 | | $ | 2 | | $ | 2 |
| Interest cost on projected benefit obligation | | | 75 | | | 69 | | | 63 | | | 8 | | | 8 | | | 7 |
| Expected return on assets | | | (108 | ) | | (89 | ) | | (81 | ) | | 1 | | | — | | | — |
| Recognized gains and losses | | | 10 | | | 1 | | | 8 | | | — | | | — | | | — |
| Recognized prior service cost | | | 1 | | | 1 | | | 1 | | | — | | | — | | | — |
| Settlement/curtailment charges | | | (12 | ) | | — | | | — | | | — | | | — | | | — |
| | |
| |
| |
| |
| |
| |
|
| Total | | $ | 24 | | $ | 32 | | $ | 38 | | $ | 11 | | $ | 10 | | $ | 9 |
| | |
| |
| |
| |
| |
| |
|
The amortization of any prior service cost is determined using a straight-line amortization of the cost over the average remaining service period of employees expected to receive benefits under the plan.
Actuarial Assumptions
| | Pension Benefits
| | Postretirement Health Care Benefits
| |
|---|
| | 2002
| | 2001
| | 2000
| | 2002
| | 2001
| | 2000
| |
|---|
| Discount rate | | 7 | % | 71/4 | % | 73/4 | % | 7 | % | 71/4 | % | 73/4 | % |
| Expected long-term rate of return on plans' assets | | 9 | | 9 | | 9 | | n/a | | n/a | | n/a | |
| Average assumed rate of compensation increase | | 4 | | 41/4 | | 43/4 | | n/a | | n/a | | n/a | |
Our rate of return on qualified plans' assets has averaged 3.7 percent and 9.3 percent per year over the 5-year and 10-year periods ending October 31, 2002 (our measurement date). After that date, we reduced our expected long-term rate of return on plans' assets to 81/2 percent per year.
An increase in the cost of covered health care benefits of 6.0 percent is assumed for 2003. The rate is assumed to remain at 6.0 percent in the future. The health care cost trend rate assumption may have a significant effect on the amounts reported.
A one percent change in assumed health care cost trend rates would have the following effects:
| | 1% Increase
| | 1% Decrease
| |
|---|
| Effect on total of service and interest cost components of net periodic postretirement health care benefit cost | | $— | | $— | |
| Effect on the health care component of the postretirement benefit obligation | | $5 | | $(5 | ) |
34
Business Segment Comparisons
(millions)
| | 2002
| | 2001
| | 2000*
| | 1999
| | 1998
| | 1997
| |
|---|
| Revenues | | | | | | | | | | | | | | | | | | | |
| Target | | $ | 36,917 | | $ | 32,588 | | $ | 29,278 | | $ | 26,080 | | $ | 23,014 | | $ | 20,298 | |
| Mervyn's | | | 3,816 | | | 4,027 | | | 4,142 | | | 4,087 | | | 4,140 | | | 4,209 | |
| Marshall Field's | | | 2,691 | | | 2,778 | | | 2,969 | | | 3,041 | | | 3,047 | | | 2,959 | |
| Other | | | 493 | | | 433 | | | 462 | | | 449 | | | 434 | | | — | |
| | |
| |
| |
| |
| |
| |
| |
| Total revenues | | $ | 43,917 | | $ | 39,826 | | $ | 36,851 | | $ | 33,657 | | $ | 30,635 | | $ | 27,466 | |
| | |
| |
| |
| |
| |
| |
| |
| Pre-tax segment profit and earnings reconciliation | | | | | | | | | | | | | | | | | | | |
| Target | | $ | 3,088 | | $ | 2,546 | | $ | 2,223 | | $ | 2,022 | | $ | 1,578 | | $ | 1,287 | |
| Mervyn's | | | 238 | | | 286 | | | 269 | | | 205 | | | 240 | | | 280 | |
| Marshall Field's | | | 135 | | | 133 | | | 190 | | | 296 | | | 279 | | | 240 | |
| | |
| |
| |
| |
| |
| |
| |
| Total pre-tax segment profit | | $ | 3,461 | | $ | 2,965 | | $ | 2,682 | | $ | 2,523 | | $ | 2,097 | | $ | 1,807 | |
| | |
| |
| |
| |
| |
| |
| |
| LIFO provision (expense)/credit | | | 12 | | | (8 | ) | | (4 | ) | | 7 | | | 18 | | | (6 | ) |
| Securitization adjustments: | | | | | | | | | | | | | | | | | | | |
| | Unusual items | | | — | | | (67 | ) | | — | | | — | | | (3 | ) | | 45 | |
| | Interest equivalent | | | — | | | (27 | ) | | (50 | ) | | (49 | ) | | (48 | ) | | (33 | ) |
| Interest expense | | | (588 | ) | | (473 | ) | | (426 | ) | | (459 | ) | | (442 | ) | | (501 | ) |
| Mainframe outsourcing | | | — | | | — | | | — | | | (5 | ) | | (42 | ) | | — | |
| Other | | | (209 | ) | | (183 | ) | | (149 | ) | | (148 | ) | | (69 | ) | | (71 | ) |
| | |
| |
| |
| |
| |
| |
| |
| Earnings before income taxes | | $ | 2,676 | | $ | 2,207 | | | 2,053 | | $ | 1,869 | | $ | 1,511 | | $ | 1,241 | |
| | |
| |
| |
| |
| |
| |
| |
| Assets | | | | | | | | | | | | | | | | | | | |
| Target | | $ | 22,752 | | $ | 18,515 | | $ | 14,348 | | $ | 12,048 | | $ | 10,475 | | $ | 9,487 | |
| Mervyn's | | | 2,270 | | | 2,379 | | | 2,270 | | | 2,248 | | | 2,339 | | | 2,281 | |
| Marshall Field's | | | 2,202 | | | 2,284 | | | 2,114 | | | 2,149 | | | 2,123 | | | 2,188 | |
| Other | | | 1,379 | | | 976 | | | 758 | | | 698 | | | 729 | | | 235 | |
| | |
| |
| |
| |
| |
| |
| |
| Total assets | | $ | 28,603 | | $ | 24,154 | | $ | 19,490 | | $ | 17,143 | | $ | 15,666 | | $ | 14,191 | |
| | |
| |
| |
| |
| |
| |
| |
| Depreciation and amortization | | | | | | | | | | | | | | | | | | | |
| Target | | $ | 925 | | $ | 784 | | $ | 660 | | $ | 567 | | $ | 496 | | $ | 437 | |
| Mervyn's | | | 122 | | | 126 | | | 131 | | | 138 | | | 138 | | | 126 | |
| Marshall Field's | | | 125 | | | 135 | | | 133 | | | 133 | | | 135 | | | 128 | |
| Other | | | 40 | | | 34 | | | 16 | | | 16 | | | 11 | | | 2 | |
| | |
| |
| |
| |
| |
| |
| |
| Total depreciation and amortization | | $ | 1,212 | | $ | 1,079 | | $ | 940 | | $ | 854 | | $ | 780 | | $ | 693 | |
| | |
| |
| |
| |
| |
| |
| |
| Capital expenditures | | | | | | | | | | | | | | | | | | | |
| Target | | $ | 2,966 | | $ | 2,901 | | $ | 2,244 | | $ | 1,665 | | $ | 1,352 | | $ | 1,155 | |
| Mervyn's | | | 110 | | | 104 | | | 106 | | | 108 | | | 169 | | | 72 | |
| Marshall Field's | | | 105 | | | 125 | | | 143 | | | 124 | | | 127 | | | 124 | |
| Other | | | 40 | | | 33 | | | 35 | | | 21 | | | 9 | | | 3 | |
| | |
| |
| |
| |
| |
| |
| |
| Total capital expenditures | | $ | 3,221 | | $ | 3,163 | | $ | 2,528 | | $ | 1,918 | | $ | 1,657 | | $ | 1,354 | |
| | |
| |
| |
| |
| |
| |
| |
| Segment EBITDA | | | | | | | | | | | | | | | | | | | |
| Target | | $ | 4,013 | | $ | 3,330 | | $ | 2,883 | | $ | 2,589 | | $ | 2,074 | | $ | 1,724 | |
| Mervyn's | | | 360 | | | 412 | | | 400 | | | 343 | | | 378 | | | 406 | |
| Marshall Field's | | | 260 | | | 268 | | | 323 | | | 429 | | | 414 | | | 368 | |
| | |
| |
| |
| |
| |
| |
| |
| Total segment EBITDA | | $ | 4,633 | | $ | 4,010 | | $ | 3,606 | | $ | 3,361 | | $ | 2,866 | | $ | 2,498 | |
| | |
| |
| |
| |
| |
| |
| |
| Net assets** | | | | | | | | | | | | | | | | | | | |
| Target | | $ | 17,491 | | $ | 13,812 | | $ | 10,659 | | $ | 8,413 | | $ | 7,302 | | $ | 6,602 | |
| Mervyn's | | | 1,749 | | | 1,868 | | | 1,928 | | | 1,908 | | | 2,017 | | | 2,019 | |
| Marshall Field's | | | 1,822 | | | 1,764 | | | 1,749 | | | 1,795 | | | 1,785 | | | 1,896 | |
| Other | | | 636 | | | 477 | | | 463 | | | 428 | | | 470 | | | 169 | |
| | |
| |
| |
| |
| |
| |
| |
| Total net assets | | $ | 21,698 | | $ | 17,921 | | $ | 14,799 | | $ | 12,544 | | $ | 11,574 | | $ | 10,686 | |
| | |
| |
| |
| |
| |
| |
| |
Each operating segment's assets and operating results include accounts receivable and receivable-backed securities held by Target Receivables Corporation and Retailers National Bank, as well as related income and expense.
- *
- Consisted of 53 weeks.
- **
- Net assets represent total assets (including publicly held receivable-backed securities) less cash equivalents and non-interest bearing current liabilities.
35
Quarterly Results (Unaudited)
The same accounting policies are followed in preparing quarterly financial data as are followed in preparing annual data. The table below summarizes results by quarter for 2002 and 2001:
| | First Quarter
| | Second Quarter
| | Third Quarter
| | Fourth Quarter
| | Total Year
|
|---|
(millions, except per share data)
|
|---|
| | 2002
| | 2001
| | 2002
| | 2001
| | 2002
| | 2001
| | 2002
| | 2001
| | 2002
| | 2001
|
|---|
| Total revenues | | $ | 9,594 | | $ | 8,334 | | $ | 10,068 | | $ | 8,941 | | $ | 10,194 | | $ | 9,331 | | $ | 14,061 | | $ | 13,220 | | $ | 43,917 | | $ | 39,826 |
| Gross margin(a) | | $ | 3,014 | | $ | 2,583 | | $ | 3,151 | | $ | 2,713 | | $ | 3,148 | | $ | 2,811 | | $ | 4,149 | | $ | 3,864 | | $ | 13,462 | | $ | 11,971 |
| Net earnings(b) | | $ | 345 | | $ | 254 | | $ | 344 | | $ | 271 | | $ | 277 | | $ | 185 | | $ | 688 | | $ | 658 | | $ | 1,654 | | $ | 1,368 |
| Basic earnings per share(b)(c) | | $ | .38 | | $ | .28 | | $ | .38 | | $ | .30 | | $ | .31 | | $ | .20 | | $ | .76 | | $ | .73 | | $ | 1.82 | | $ | 1.52 |
| Diluted earnings per share(b)(c) | | $ | .38 | | $ | .28 | | $ | .38 | | $ | .30 | | $ | .30 | | $ | .20 | | $ | .75 | | $ | .72 | | $ | 1.81 | | $ | 1.50 |
| Dividends declared per share(c) | | $ | .060 | | $ | .055 | | $ | .060 | | $ | .055 | | $ | .060 | | $ | .055 | | $ | .060 | | $ | .060 | | $ | .240 | | $ | .225 |
| Closing common stock price(d) | | | | | | | | | | | | | | | | | | | | | | | | | | | | | | |
| | High | | $ | 45.72 | | $ | 39.25 | | $ | 44.94 | | $ | 39.93 | | $ | 37.25 | | $ | 39.03 | | $ | 35.74 | | $ | 44.41 | | $ | 45.72 | | $ | 44.41 |
| | Low | | $ | 41.45 | | $ | 33.95 | | $ | 30.46 | | $ | 32.74 | | $ | 26.15 | | $ | 26.68 | | $ | 27.00 | | $ | 34.11 | | $ | 26.15 | | $ | 26.68 |
- (a)
- Gross margin is sales less cost of sales.
- (b)
- Third quarter and total year 2001, net earnings and earnings per share include a pre-tax charge of $67 million ($.05 per share) that relates to the required adoption of a new accounting standard applicable to securitized accounts receivable (discussed in detail under Accounts Receivable and Receivable-backed Securities on page 29).
- (c)
- Per share amounts are computed independently for each of the quarters presented. The sum of the quarters may not equal the total year amount due to the impact of changes in average quarterly shares outstanding.
- (d)
- Our common stock is listed on the New York Stock Exchange and Pacific Exchange. At March 19, 2003, there were 17,108 registered shareholders and the closing common stock price was $29.60 per share.
36
SUMMARY FINANCIAL AND OPERATING DATA (UNAUDITED)
(dollars and shares outstanding
in millions, except per share data)
| | 2002
| | 2001
| | 2000(a)
| | 1999
| | 1998
| | 1997
|
|---|
| Results of operations | | | | | | | | | | | | | |
| Total revenues | | $ | 43,917 | | 39,826 | | 36,851 | | 33,657 | | 30,635 | | 27,466 |
| | |
| |
| |
| |
| |
| |
|
| Net earnings(c)(d) | | $ | 1,654 | | 1,368 | | 1,264 | | 1,144 | | 935 | | 751 |
| | |
| |
| |
| |
| |
| |
|
| Financial position data | | | | | | | | | | | | | |
| Total assets | | $ | 28,603 | | 24,154 | | 19,490 | | 17,143 | | 15,666 | | 14,191 |
| | |
| |
| |
| |
| |
| |
|
| Long-term debt | | $ | 10,186 | | 8,088 | | 5,634 | | 4,521 | | 4,452 | | 4,425 |
| | |
| |
| |
| |
| |
| |
|
| Per common share data(b) | | | | | | | | | | | | | |
| Diluted earnings per share(c)(d) | | $ | 1.81 | | 1.50 | | 1.38 | | 1.23 | | .99 | | .80 |
| | |
| |
| |
| |
| |
| |
|
| Cash dividends declared | | $ | .240 | | .225 | | .215 | | .200 | | .185 | | .170 |
| | |
| |
| |
| |
| |
| |
|
| Other data | | | | | | | | | | | | | |
| Weighted average common shares outstanding(b) | | | 908.0 | | 901.5 | | 903.5 | | 882.6 | | 880.0 | | 872.2 |
| | |
| |
| |
| |
| |
| |
|
| Diluted average common shares outstanding(b) | | | 914.0 | | 909.8 | | 913.0 | | 931.3 | | 934.6 | | 927.3 |
| | |
| |
| |
| |
| |
| |
|
| Capital expenditures | | $ | 3,221 | | 3,163 | | 2,528 | | 1,918 | | 1,657 | | 1,354 |
| | |
| |
| |
| |
| |
| |
|
| Number of stores: | | | | | | | | | | | | | |
| | Target | | | 1,147 | | 1,053 | | 977 | | 912 | | 851 | | 796 |
| | Mervyn's | | | 264 | | 264 | | 266 | | 267 | | 268 | | 269 |
| | Marshall Field's | | | 64 | | 64 | | 64 | | 64 | | 63 | | 65 |
| | |
| |
| |
| |
| |
| |
|
| Total stores | | | 1,475 | | 1,381 | | 1,307 | | 1,243 | | 1,182 | | 1,130 |
| | |
| |
| |
| |
| |
| |
|
| Total retail square footage (thousands): | | | | | | | | | | | | | |
| | Target | | | 140,255 | | 125,245 | | 112,975 | | 102,978 | | 94,586 | | 87,187 |
| | Mervyn's | | | 21,425 | | 21,425 | | 21,555 | | 21,635 | | 21,729 | | 21,810 |
| | Marshall Field's | | | 14,845 | | 14,954 | | 14,892 | | 14,784 | | 14,615 | | 14,815 |
| | |
| |
| |
| |
| |
| |
|
| Total retail square footage | | | 176,525 | | 161,624 | | 149,422 | | 139,397 | | 130,930 | | 123,812 |
| | |
| |
| |
| |
| |
| |
|
- (a)
- Consisted of 53 weeks.
- (b)
- Earnings per share, dividends per share and common shares outstanding reflect our 2000 and 1998 two-for-one common share splits.
- (c)
- 1999 included a mainframe outsourcing pre-tax charge of $5 million (less than $.01 per share). 1998 included a mainframe outsourcing pre-tax charge of $42 million ($.03 per share) and the beneficial effect of $20 million ($.02 per share) of the favorable outcome of our inventory shortage tax matter.
- (d)
- 2001 included a $67 million pre-tax charge ($.05 per share) that relates to the required adoption of a new accounting standard applicable to securitized accounts receivable (discussed in detail under Accounts Receivable and Receivable-backed Securities on page 29). 1998 included a $3 million pre-tax net loss (less than $.01 per share) related to securitization maturity and sale transactions. 1997 included a $45 million pre-tax gain ($.03 per share) related to securitization sale transactions.
The Summary Financial and Operating Data should be read in conjunction with the Notes to Consolidated Financial Statements throughout pages 28-36.
37
Report of Independent Auditors
Board of Directors and Shareholders
Target Corporation
We have audited the accompanying consolidated statements of financial position of Target Corporation and subsidiaries as of February 1, 2003 and February 2, 2002 and the related consolidated results of operations, cash flows and shareholders' investment for each of the three years in the period ended February 1, 2003. These financial statements are the responsibility of the Corporation's management. Our responsibility is to express an opinion on these financial statements based on our audits.
We conducted our audits in accordance with auditing standards generally accepted in the United States. Those standards require that we plan and perform the audit to obtain reasonable assurance about whether the financial statements are free of material misstatement. An audit includes examining, on a test basis, evidence supporting the amounts and disclosures in the financial statements. An audit also includes assessing the accounting principles used and significant estimates made by management, as well as evaluating the overall financial statement presentation. We believe that our audits provide a reasonable basis for our opinion.
In our opinion, the financial statements referred to above present fairly, in all material respects, the consolidated financial position of Target Corporation and subsidiaries at February 1, 2003 and February 2, 2002 and the consolidated results of their operations and their cash flows for each of the three years in the period ended February 1, 2003 in conformity with accounting principles generally accepted in the United States.
| | |  |
Minneapolis, Minnesota
February 20, 2003 | | |
Report of Management
Management is responsible for the consistency, integrity and presentation of the information in the Annual Report. The consolidated financial statements and other information presented in this Annual Report have been prepared in accordance with accounting principles generally accepted in the United States and include necessary judgments and estimates by management.
To fulfill our responsibility, we maintain comprehensive systems of internal control designed to provide reasonable assurance that assets are safeguarded and transactions are executed in accordance with established procedures. The concept of reasonable assurance is based upon a recognition that the cost of the controls should not exceed the benefit derived. We believe our systems of internal control provide this reasonable assurance.
The Board of Directors exercises its oversight role with respect to the Corporation's systems of internal control primarily through its Audit Committee, which is comprised of three independent directors. The Committee oversees the Corporation's systems of internal control, accounting practices, financial reporting and audits to assess whether their quality, integrity and objectivity are sufficient to protect shareholders' investments. The Committee's report appears on this page.
In addition, our consolidated financial statements have been audited by Ernst & Young LLP, independent auditors, whose report also appears on this page. As a part of its audit, Ernst & Young LLP develops and maintains an understanding of the Corporation's internal accounting controls and conducts such tests and employs such procedures as it considers necessary to render its opinion on the consolidated financial statements. Their report expresses an opinion as to the fair presentation, in all material respects, of the consolidated financial statements and is based on independent audits made in accordance with auditing standards generally accepted in the United States.
 | |  |
Robert J. Ulrich
Chairman of the Board and Chief Executive Officer | | Douglas A. Scovanner
Executive Vice President and Chief Financial Officer |
February 20, 2003
Report of Audit Committee
The Audit Committee met three times during fiscal 2002 to review the overall audit scope, plans for internal and independent audits, the Corporation's systems of internal control, emerging accounting issues, audit fees and benefit plans. The Committee also met individually with the independent auditors, without management present, to discuss the results of their audits. The Committee encourages the internal and independent auditors to communicate closely with the Committee.
Audit Committee results were reported to the full Board of Directors and the Corporation's annual financial statements were reviewed and approved by the Board of Directors before issuance. The Audit Committee also recommended to the Board of Directors that the independent auditors be reappointed for fiscal 2003, subject to the approval of the shareholders at the annual meeting.
February 20, 2003
38
QuickLinks
MANAGEMENT'S DISCUSSION AND ANALYSISCONSOLIDATED RESULTS OF OPERATIONSCONSOLIDATED STATEMENTS OF FINANCIAL POSITIONCONSOLIDATED STATEMENTS OF CASH FLOWSNOTES TO CONSOLIDATED FINANCIAL STATEMENTSSUMMARY FINANCIAL AND OPERATING DATA (UNAUDITED)