QuickLinks -- Click here to rapidly navigate through this document
UNITED STATES
SECURITIES AND EXCHANGE COMMISSION
Washington, D.C. 20549
FORM 10-K
| (Mark One) | |
ý |
ANNUAL REPORT PURSUANT TO SECTION 13 OR 15(d) OF THE SECURITIES EXCHANGE ACT OF 1934 |
For the fiscal year ended February 3, 2007 |
OR |
o |
TRANSITION REPORT PURSUANT TO SECTION 13 OR 15(d) OF THE SECURITIES EXCHANGE ACT OF 1934 |
For the transition period from to |
Commission file number1-6049

TARGET CORPORATION
(Exact name of registrant as specified in its charter)
Minnesota
(State or other jurisdiction of
incorporation or organization) | | 41-0215170
(I.R.S. Employer
Identification No.) |
1000 Nicollet Mall, Minneapolis, Minnesota
(Address of principal executive offices) |
|
55403
(Zip Code) |
Registrant's telephone number, including area code: 612/304-6073
Securities registered pursuant to Section 12(b) of the Act:
Title of Each Class
| | Name of Each Exchange on Which Registered
|
|---|
| Common Stock, par value $.0833 per share | | New York Stock Exchange |
| Preferred Share Purchase Rights | | New York Stock Exchange |
Securities registered pursuant to Section 12(g) of the Act:None
Indicate by check mark if the registrant is a well-known seasoned issuer, as defined in Rule 405 of the Securities Act. Yes ý No o
Indicate by check mark if the registrant is not required to file reports pursuant to Section 13 or Section 15(d) of the Act. Yes o No ý
Note – Checking the box above will not relieve any registrant required to file reports pursuant to Section 13 or 15(d) of the Exchange Act from their obligations under those Sections.
Indicate by check mark whether the registrant (1) has filed all reports required to be filed by Section 13 or 15(d) of the Securities Exchange Act of 1934 during the preceding 12 months (or for such shorter period that the registrant was required to file such reports), and (2) has been subject to such filing requirements for the past 90 days. Yes ý No o
Indicate by check mark if disclosure of delinquent filers pursuant to Item 405 of Regulation S-K (§229.405 of this chapter) is not contained herein, and will not be contained, to the best of registrant's knowledge, in definitive proxy or information statements incorporated by reference in Part III of this Form 10-K or any amendment to this Form 10-K. ý
Indicate by check mark whether the registrant is a large accelerated filer, an accelerated filer, or a non-accelerated filer (as defined in Rule 12b-2 of the Act).
Large accelerated filerý Accelerated filero Non-accelerated filero
Indicate by check mark whether the registrant is a shell company (as defined in Rule 12b-2 of the Act). Yes o No ý
Aggregate market value of the voting stock held by non-affiliates of the registrant on July 29, 2006 was $39,796,702,943.82, based on the closing price of $46.46 per share of Common Stock as reported on the New York Stock Exchange-Composite Index.
Indicate the number of shares outstanding of each of registrant's classes of Common Stock, as of the latest practicable date. Total shares of Common Stock, par value $.0833, outstanding at March 14, 2007 were 858,580,232.
DOCUMENTS INCORPORATED BY REFERENCE
1. Portions of Target's Proxy Statement to be filed on or about April 9, 2007 are incorporated into Part III.
(This page has been left blank intentionally.)
TARGET FISCAL 2007 FORM 10-K
TABLE OF CONTENTS
| PART I | | |
| | Item 1. | | Business. | | 4 |
| | Item 1A. | | Risk Factors. | | 6 |
| | Item 1B. | | Unresolved Staff Comments. | | 6 |
| | Item 2. | | Properties. | | 6 |
| | Item 3. | | Legal Proceedings. | | 7 |
| | Item 4. | | Submission of Matters to a Vote of Security Holders. | | 7 |
| | Item 4A. | | Executive Officers. | | 8 |
PART II |
|
|
| | Item 5. | | Market for Registrant's Common Equity, Related Stockholder Matters and Issuer Purchases of Equity Securities. | | 9 |
| | Item 6. | | Selected Financial Data. | | 11 |
| | Item 7. | | Management's Discussion and Analysis of Financial Condition and Results of Operations. | | 11 |
| | Item 7A. | | Quantitative and Qualitative Disclosures About Market Risk. | | 21 |
| | Item 8. | | Financial Statements and Supplementary Data. | | 22 |
| | Item 9. | | Changes in and Disagreements With Accountants on Accounting and Financial Disclosure. | | 48 |
| | Item 9A. | | Controls and Procedures. | | 48 |
| | Item 9B. | | Other Information. | | 48 |
PART III |
|
|
| | Item 10. | | Directors, Executive Officers and Corporate Governance. | | 49 |
| | Item 11. | | Executive Compensation. | | 49 |
| | Item 12. | | Security Ownership of Certain Beneficial Owners and Management and Related Stockholder Matters. | | 49 |
| | Item 13. | | Certain Relationships and Related Transactions, and Director Independence. | | 49 |
| | Item 14. | | Principal Accountant Fees and Services. | | 49 |
PART IV |
|
|
| | Item 15. | | Exhibits and Financial Statement Schedules. | | 50 |
Signatures |
|
52 |
| Schedule II – Valuation and Qualifying Accounts | | 53 |
| Exhibit Index | | 54 |
| Exhibit 12 – Computations of Ratios of Earnings to Fixed Charges for each of the Five Years in the Period Ended February 3, 2007 | | 55 |
| Shareholder Information | | 55 |
PART I
Item 1. Business.
General
Target Corporation (the Corporation or Target) was incorporated in Minnesota in 1902. We operate large-format general merchandise and food discount stores in the United States, which include Target and SuperTarget stores. We offer both everyday essentials and fashionable, differentiated merchandise at exceptional prices. Our ability to deliver a shopping experience that is preferred by our guests is supported by our strong supply chain and technology network, a devotion to innovation that is ingrained in our organization and culture, and our disciplined approach to managing our current business and investing in future growth. We operate as a single business segment.
Our credit card operations represent an integral component of our core retail business. Through our branded proprietary credit card products (REDcard), we strengthen the bond with our guests, drive incremental sales and contribute meaningfully to earnings. We also operate a fully integrated on-line business, Target.com. Although Target.com is small relative to our overall size, its sales are growing at a much more rapid annual pace than our other sales, and it provides important benefits to our stores and credit card operations.
We are committed to consistently delighting our guests, providing a workplace that is preferred by our team members and investing in the communities where we do business to improve the quality of life. We believe that this unwavering focus, combined with disciplined execution of the fundamentals of our strategy, will enable us to continue generating profitable market share growth and delivering superior shareholder value for many years to come.
Financial Highlights
Our fiscal year ends on the Saturday nearest January 31. Unless otherwise stated, references to years in this report relate to fiscal years, rather than to calendar years. Fiscal year 2006 (2006) ended February 3, 2007 and consisted of 53 weeks. Fiscal year 2005 (2005) ended January 28, 2006 and fiscal year 2004 (2004) ended January 29, 2005, and both consisted of 52 weeks.
For information on key financial highlights for 2006 (along with other years), see the items referenced in Item 6, Selected Financial Data, and Item 7, Management's Discussion and Analysis of Financial Condition and Results of Operations, of this Form 10-K.
Seasonality
Due to the seasonal nature of our business, a substantially larger share of total annual revenues and earnings occur in the fourth quarter because it includes the peak sales period from Thanksgiving to the end of December.
Merchandise
We operate Target general merchandise stores with a wide assortment of general merchandise and a more limited assortment of food items, as well as SuperTarget stores with a full line of food and general merchandise items. Target.com offers a wide assortment of general merchandise including many items found in our stores and a complementary assortment, such as extended sizes and colors, sold only on-line. A significant portion of our sales is from national brand merchandise. In addition, we sell merchandise under private-label brands including, but not limited to, Archer Farms®, Choxie™, Circo®, Embark®, Gilligan & O'Malley®, Kool Toyz®, Market Pantry®, Merona®, ProSpirit®, Room Essentials™, Target Limited Edition, Trutech® and Xhilaration®. We also sell merchandise through unique programs such as ClearRxSM, Global Bazaar and Go International. In addition, we also sell merchandise under licensed brands including, but not limited to, C9 by Champion, ChefMate, Cherokee, Eddie Bauer, Fieldcrest, Isaac Mizrahi for Target, Kitchen Essentials by Calphalon, Liz Lange for Target, Michael Graves Design, Mossimo, Nick and Nora, Genuine Kids by Osh Kosh, Sean Conway, Smith & Hawken, Simply Shabby Chic, Sonia Kashuk, Thomas O'Brien, Waverly, and Woolrich. We also generate revenue from in-store amenities such as Food Avenue®, Target ClinicSM, Target PharmacySM, and Target PhotoSM, and from leased or licensed departments such as Optical, Pizza Hut, Portrait Studio and Starbucks.
For 2006 and 2005, percentage of sales by product category were as follows:
|
| | Percentage of Sales
|
|---|
Category
| | 2006
| | 2005
|
|---|
|
| Consumables and commodities | | 32% | | 30% |
| Electronics, entertainment, sporting goods and toys | | 23% | | 23% |
| Apparel and accessories | | 22% | | 22% |
| Home furnishings and décor | | 19% | | 20% |
| Other | | 4% | | 5% |
|
| Total | | 100% | | 100% |
|
Distribution
The vast majority of our merchandise is distributed through a network of 25 regional distribution centers and four import warehouses. General merchandise is shipped to and from our distribution centers by common carriers. Certain food items are distributed by third parties. Merchandise sold through Target.com is either distributed through our own distribution network, through third parties, or shipped directly from vendors.
Employees
At February 3, 2007, we employed approximately 352,000 full-time, part-time and seasonal employees, referred to as "team members." We consider our team member relations to be good. We offer a broad range of company-paid benefits to our team members, including a pension plan, 401(k) plan, medical and dental plans, a retiree medical plan, short-term and long-term disability insurance, paid vacation, tuition reimbursement, various team member assistance programs, life insurance and merchandise discounts. Eligibility for and the level of these benefits varies depending on team members' full-time or part-time status and/or length of service.
Working Capital
Because of the seasonal nature of our business, our working capital needs are greater in the months leading up to our peak sales period from Thanksgiving to the end of December each year. The increase in working capital during this time is typically financed with cash flow from operations and short-term borrowings. See further description in the Liquidity and Capital Resources section in Item 7, Management's Discussion and Analysis of Financial Condition and Results of Operations.
Competition
Our business is conducted under highly-competitive conditions. Our stores compete with national and local department, specialty, off-price, discount, supermarket and drug store chains, independent retail stores and Internet businesses that sell similar lines of merchandise. We also compete with other companies for new store sites.
We believe the principal methods of competing in this industry include brand recognition, customer service, store location, differentiated offerings, value, quality, fashion, price, advertising, depth of selection and credit availability. We believe that we have a competitive advantage with regard to these factors. Additionally, we are a leader in supporting the communities where we do business.
Intellectual Property
Our brand image is a critical element of our business strategy. Our principal trademarks, including Target, SuperTarget and our "bullseye" design, have been registered with the U.S. Patent and Trademark Office.
Geographic Information
Substantially all of our revenues are generated in, and long-lived assets are located in, the United States.
Available Information
Our Annual Report on Form 10-K, quarterly reports on Form 10-Q, current reports on Form 8-K and amendments to those reports filed or furnished pursuant to Section 13(a) or 15(d) of the Exchange Act are available free of charge at www.Target.com (click on "Investors" and "SEC Filings") as soon as reasonably practicable after we file such material with, or furnish it to, the Securities and Exchange Commission (SEC). Our Corporate Governance Guidelines, Business Conduct Guide, Corporate Responsibility Report and the position descriptions for our Board of Directors and Board committees are also available free of charge in print upon request or at www.Target.com (click on "Investors" and "Corporate Governance").
Item 1A. Risk Factors.
A description of risk factors and cautionary statements relating to forward-looking information is included in Exhibit (99)A to this Form 10-K, which is incorporated herein by reference.
Item 1B. Unresolved Staff Comments.
Not Applicable.
Item 2. Properties.
The following table lists our retail stores as of February 3, 2007:
| |
|
State
| Number of Stores
| | Retail Sq. Ft.
(in thousands)
| | State
| Number of Stores
| | Retail Sq. Ft.
(in thousands)
|
|---|
| |
|
| Alabama | 13 | | 1,919 | | Montana | 7 | | 767 |
| Alaska | — | | — | | Nebraska | 12 | | 1,581 |
| Arizona | 41 | | 5,081 | | Nevada | 15 | | 1,863 |
| Arkansas | 6 | | 745 | | New Hampshire | 8 | | 1,023 |
| California | 209 | | 26,391 | | New Jersey | 36 | | 4,666 |
| Colorado | 36 | | 5,265 | | New Mexico | 9 | | 1,011 |
| Connecticut | 14 | | 1,834 | | New York | 55 | | 7,323 |
| Delaware | 2 | | 268 | | North Carolina | 44 | | 5,716 |
| Florida | 102 | | 13,532 | | North Dakota | 4 | | 554 |
| Georgia | 47 | | 6,222 | | Ohio | 56 | | 6,836 |
| Hawaii | — | | — | | Oklahoma | 11 | | 1,536 |
| Idaho | 6 | | 664 | | Oregon | 18 | | 2,166 |
| Illinois | 79 | | 10,589 | | Pennsylvania | 41 | | 5,220 |
| Indiana | 32 | | 4,207 | | Rhode Island | 3 | | 378 |
| Iowa | 21 | | 2,855 | | South Carolina | 17 | | 2,097 |
| Kansas | 18 | | 2,450 | | South Dakota | 4 | | 417 |
| Kentucky | 12 | | 1,383 | | Tennessee | 26 | | 3,210 |
| Louisiana | 12 | | 1,726 | | Texas | 130 | | 17,392 |
| Maine | 4 | | 503 | | Utah | 11 | | 1,679 |
| Maryland | 31 | | 3,935 | | Vermont | — | | — |
| Massachusetts | 26 | | 3,284 | | Virginia | 42 | | 5,498 |
| Michigan | 56 | | 6,466 | | Washington | 32 | | 3,714 |
| Minnesota | 66 | | 8,997 | | West Virginia | 5 | | 626 |
| Mississippi | 4 | | 489 | | Wisconsin | 32 | | 3,731 |
| Missouri | 31 | | 4,068 | | Wyoming | 2 | | 187 |
| |
|
| | | | | | Total | 1,488 | | 192,064 |
| | | | | |
|
The following table summarizes the number of owned or leased stores and distribution centers at February 3, 2007:
| |
| | Stores
| | Distribution
Centers
| |
|---|
| |
| Owned | | 1,260 | | 25 | |
| Leased | | 71 | | 1 | |
| Combined(a) | | 157 | | 3 | |
| |
| Total | | 1,488 | | 29 | (b) |
| |
- (a)
- Properties within the "combined" category are primarily owned buildings on leased land.
- (b)
- The 29 distribution centers have a total of 41,460 thousand square feet.
We own our corporate headquarters buildings located in Minneapolis, Minnesota, and we lease and own additional office space elsewhere in the United States. Our international merchandise sourcing operations headquartered in New York, New York, have 39 office locations in 27 countries, all of which are leased. We also lease office space in Bangalore, India, where we operate various support functions.
For additional information on our properties see also: Capital Expenditures section in Item 7, Management's Discussion and Analysis of Financial Condition and Results of Operations; Note 13 and Note 22 of the Notes to Consolidated Financial Statements in Item 8, Financial Statements and Supplementary Data.
Item 3. Legal Proceedings.
SEC Rule S-K Item 103 requires that companies disclose environmental legal proceedings involving a governmental authority when such proceedings involve potential monetary sanctions of $100,000 or more. We are a party to two administrative actions by governmental authorities involving environmental matters, each of which may involve potential monetary sanctions in excess of $100,000. The allegations, both made by the California Environmental Protection Agency Air Resources Board, each involve a non-food product we formerly sold that contained levels of a volatile organic compound in excess of permissible levels. The first allegation was made in March 2006, and we expect the sanctions for this matter will not exceed $200,000. The second allegation was made in April 2006, and we expect the sanctions for this matter will not exceed $500,000, for which the vendor is indemnifying Target. We previously reported an allegation made by the United States Environmental Protection Agency in September 2005 that a product we formerly sold contained a prohibited substance. This matter was settled in January 2007 with a payment of $120,000. For description of other legal proceedings see Note 18.
The American Jobs Creation Act of 2004 requires SEC registrants to disclose if they have been required to pay certain penalties for failing to disclose to the Internal Revenue Service their participation in listed transactions. We have not been required to pay any of the penalties set forth in Section 6707A(e)(2) of the Internal Revenue Code.
Item 4. Submission of Matters to a Vote of Security Holders.
Not Applicable.
Item 4A. Executive Officers.
The executive officers of Target as of March 14, 2007 and their positions and ages, are as follows:
|
Name
| | Title
| | Age
|
|---|
|
| Timothy R. Baer | | Executive Vice President, General Counsel and Corporate Secretary | | 46 |
| Michael R. Francis | | Executive Vice President, Marketing | | 44 |
| John D. Griffith | | Executive Vice President, Property Development | | 45 |
| Jodeen A. Kozlak | | Executive Vice President, Human Resources | | 43 |
| Troy H. Risch | | Executive Vice President, Stores | | 39 |
| Janet M. Schalk | | Executive Vice President and Chief Information Officer | | 48 |
| Douglas A. Scovanner | | Executive Vice President and Chief Financial Officer | | 51 |
| Terrence J. Scully | | President, Target Financial Services | | 54 |
| Gregg W. Steinhafel | | President and Director | | 52 |
| Robert J. Ulrich | | Chairman of the Board, Chief Executive Officer, Chairman of the Executive Committee and Director | | 63 |
|
Each officer is elected by and serves at the pleasure of the Board of Directors. There is neither a family relationship between any of the officers named and any other executive officer or member of the Board of Directors, nor is there any arrangement or understanding pursuant to which any person was selected as an officer. The period of service of each officer in the positions listed and other business experience for the past five years is listed below.
| Timothy R. Baer | | Executive Vice President, General Counsel and Corporate Secretary since March 2007. Senior Vice President, General Counsel and Corporate Secretary from June 2004 to March 2007. Senior Vice President from April 2004 to May 2004. Vice President from February 2002 to March 2004. |
Michael R. Francis |
|
Executive Vice President, Marketing since February 2003. Senior Vice President, Marketing from January 2001 to February 2003. |
John D. Griffith |
|
Executive Vice President, Property Development since February 2005. Senior Vice President, Property Development from February 2000 to January 2005. |
Jodeen A. Kozlak |
|
Executive Vice President, Human Resources since March 2007. Senior Vice President, Human Resources from February 2006 to March 2007. Vice President, Human Resources and Employee Relations General Counsel from November 2005 to February 2006. From June 2001 to November 2005 Ms. Kozlak held several positions in Employee Relations at Target. |
Troy H. Risch |
|
Executive Vice President, Stores since September 2006. Group Vice President from September 2005 to September 2006. Group Director from February 2002 to September 2005. |
Janet M. Schalk |
|
Executive Vice President and Chief Information Officer since March 2007. Senior Vice President and Chief Information Officer from September 2005 to March 2007. Vice President, Application Development from November 2004 to September 2005. Director, Target Technology Services from July 1997 to November 2004. |
Douglas A. Scovanner |
|
Executive Vice President and Chief Financial Officer since February 2000. |
Terrence J. Scully |
|
President, Target Financial Services since March 2003. Vice President, Target Financial Services, from April 1998 to February 2003. |
Gregg W. Steinhafel |
|
Director since January 2007. President since August 1999. |
Robert J. Ulrich |
|
Chairman of the Board, Chief Executive Officer, Chairman of the Executive Committee and Director of Target since 1994. |
PART II
Item 5. Market for the Registrant's Common Equity, Related Stockholder Matters and Issuer Purchases of Equity Securities.
Our common stock is listed on The New York Stock Exchange under the symbol "TGT." We are authorized to issue up to 6,000,000,000 shares of common stock, par value $.0833, and up to 5,000,000 shares of preferred stock, par value $.01. At March 14, 2007, there were 18,139 shareholders of record. Dividends declared per share and the high and low closing common stock price for each fiscal quarter during 2006 and 2005 are disclosed in Note 29.
The following table presents information with respect to purchases of Target common stock made during the fourteen weeks ended February 3, 2007, by Target or any "affiliated purchaser" of Target, as defined in Rule 10b-18(a)(3) under the Exchange Act.
|
Period
| | Total Number
of Shares
Purchased(b)(c)
| | Average
Price Paid
per Share(b)
| | Total Number of
Shares Purchased
as Part of
Publicly Announced
Program(a)(b)(c)
| | Approximate
Dollar Value of
Shares that May
Yet Be Purchased
Under the Program(a)
|
|---|
|
| October 29, 2006 through November 25, 2006 | | 140,000 | | $41.75 | | 70,813,275 | | $1,562,564,371 |
| November 26, 2006 through December 30, 2006 | | — | | — | | 70,813,275 | | 1,562,564,371 |
| December 31, 2006 through February 3, 2007 | | 231,569 | | 53.02 | | 71,044,844 | | 1,550,285,850 |
|
| Total | | 371,569 | | $48.77 | | 71,044,844 | | $1,550,285,850 |
|
- (a)
- In June 2004, our Board of Directors authorized the repurchase of $3 billion of our common stock. In November 2005, our Board increased the aggregate authorization by $2 billion, for a total authorization of $5 billion. We expect to continue to execute this share repurchase program primarily in open market transactions, subject to market conditions. We expect to complete the total program by fiscal year-end 2008 or sooner. Since the inception of this share repurchase program, we have repurchased a total of 71.0 million shares of our common stock for a total cash investment of $3,450 million ($48.56 per share).
- (b)
- In addition to shares purchased under our share repurchase program, we acquire shares of common stock held by team members who wish to tender owned shares to satisfy the exercise price on stock option exercises or tax withholding on equity awards as part of our long-term incentive plans. From October 29, 2006 through February 3, 2007, 1,683 shares were acquired at an average price of $59.41 pursuant to our long-term incentive plans.
- (c)
- Includes shares reacquired upon settlement of prepaid forward contracts. In 2006, 1.6 million shares were reacquired through these contracts. The details of our long positions in prepaid forward contracts is provided in Note 27.
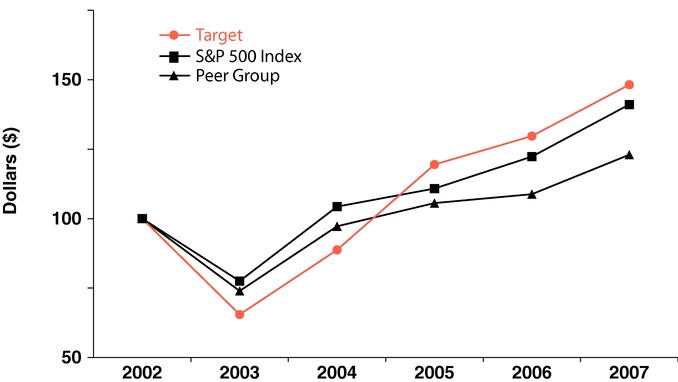
Comparision of Cumulative Five Year Total Return
|
| | Fiscal Years Ended
|
|---|
| | February 2,
2002
| | February 1,
2003
| | January 31,
2004
| | January 29,
2005
| | January 28,
2006
| | February 3,
2007
|
|---|
|
| Target | | $100.00 | | $65.49 | | $88.76 | | $119.49 | | $129.74 | | $148.22 |
| S&P 500 Index | | 100.00 | | 77.54 | | 104.34 | | 110.84 | | 122.35 | | 141.09 |
| Peer Group | | 100.00 | | 73.98 | | 97.26 | | 105.61 | | 108.82 | | 123.01 |
|
The graph above compares the cumulative total shareholder return on our common stock for the last five fiscal years with the cumulative total return on the S&P 500 Index and a peer group consisting of the companies comprising the S&P 500 Retailing Index and the S&P 500 Food and Staples Retailing Index (Peer Group) over the same period. The Peer Group index consists of 38 general merchandise, food and drug retailers and is weighted by the market capitalization of each component company. The graph assumes the investment of $100 in Target common stock, the S&P 500 Index and the Peer Group on February 2, 2002 and reinvestment of all dividends.
Item 6. Selected Financial Data.
|
| | 2006(a)
| | 2005
| | 2004
| | 2003
| | 2002
| | 2001
|
|---|
|
| Financial Results:(in millions) | | | | | | | | | | | | |
| Total revenues | | $59,490 | | $52,620 | | $46,839 | | $42,025 | | $37,410 | | $33,021 |
| Earnings from continuing operations | | $2,787 | | $2,408 | | $1,885 | | $1,619 | | $1,376 | | $1,101 |
Per Share: |
|
|
|
|
|
|
|
|
|
|
|
|
| Basic earnings per share | | $3.23 | | $2.73 | | $2.09 | | $1.78 | | $1.52 | | $1.22 |
| Diluted earnings per share | | $3.21 | | $2.71 | | $2.07 | | $1.76 | | $1.51 | | $1.21 |
| Cash dividends declared | | $.460 | | $.380 | | $.310 | | $.270 | | $.240 | | $.225 |
Financial Position:(in millions) |
|
|
|
|
|
|
|
|
|
|
|
|
| Total assets | | $37,349 | | $34,995 | | $32,293 | | $27,390 | | $24,506 | | $19,808 |
| Long-term debt, including current portion | | $10,037 | | $9,872 | | $9,538 | | $11,018 | | $11,090 | | $8,957 |
|
- (a)
- Consisted of 53 weeks.
Item 7. Management's Discussion and Analysis of Financial Condition and Results of Operations.
Executive Summary
Fiscal 2006, a 53 week period, was a year of substantial sales and earnings growth for Target. Earnings from continuing operations increased 15.8 percent to $2,787 million, and on this same basis, diluted earnings per share rose 18.5 percent to $3.21. Sales increased 12.9 percent, including comparable-store sales (as defined below) growth of 4.8 percent. The combination of strong performance in both our retail and credit card operations produced earnings from continuing operations before interest expense and income taxes of $5,069 million, an increase of more than 17 percent from 2005.
Net cash provided by operating activities was $4,862 million for 2006. During 2006 we repurchased 19.5 million shares of our common stock under our share repurchase program for a total investment of $977 million and paid dividends of $380 million. In addition, we opened 91 net new stores in 2006.
Management's Discussion and Analysis is based on our Consolidated Financial Statements in Item 8, Financial Statements and Supplementary Data.
Analysis of Continuing Operations
Revenues and Comparable-Store Sales
Sales include merchandise sales, net of expected returns, from our stores and our on-line business, as well as gift card breakage. Refer to Note 2 for a definition of gift card breakage. Total revenues include sales and net credit card revenues. Total revenues do not include sales tax as we consider ourselves a pass-through conduit for collecting and remitting sales taxes. Comparable-store sales are sales from general merchandise and SuperTarget stores open longer than one year, including:
- •
- sales from stores that have been remodeled or expanded while remaining open
- •
- sales from stores that have been relocated to new buildings of the same format within the same trade area, in which the new store opens at about the same time as the old store closes
Comparable-store sales do not include:
- •
- sales from our on-line business
- •
- sales from general merchandise stores that have been converted, or relocated within the same trade area, to a SuperTarget store format
- •
- sales from stores that were intentionally closed to be remodeled, expanded or reconstructed
Comparable-store sales increases or decreases are calculated by comparing sales in current year periods to comparable, prior fiscal-year periods of equivalent length. The method of calculating comparable-store sales varies across the retail industry.
|
Revenue Growth
| | 2006
| | 2005
| | 2004
|
|---|
|
| Comparable-store sales | | 4.8% | | 5.6% | | 5.3% |
| Sales | | 12.9% | (a) | 12.2% | | 11.6% |
| Net credit card revenues | | 19.5% | (a) | 16.5% | | 5.5% |
| Total revenues | | 13.1% | (a) | 12.3% | | 11.5% |
|
- (a)
- Consisted of 53 weeks.
In 2006, total revenues were $59,490 million compared to $52,620 in 2005, an increase of 13.1 percent. Total revenue growth was attributable to the opening of new stores, a comparable-store sales increase of 4.8 percent, the addition of the 53rd week and the 19.5 percent increase in net credit card revenues.
Comparable-store sales growth in 2006 and 2005 was attributable to growth in average transaction amount and the number of transactions in comparable stores. In each of the past several years, our comparable-store sales growth has experienced a modest negative impact due to the transfer of sales to new stores. In 2006, there was a deflationary impact of approximately 1 percent on sales growth compared to essentially no impact of inflation/deflation in 2005 and a deflationary impact of approximately 1 percent in 2004. In 2007, a 52-week year following a 53-week year, we expect to generate a high single-digit percent increase in revenues, reflecting contribution from new store expansion, continued growth in comparable-store sales due to increases in average transaction amount and the number of transactions in comparable stores and growth in net credit card revenues. We do not expect inflation/deflation to have a significant effect on sales growth in 2007.
Subsequent to year end, we changed our definition of comparable-store sales to include sales from our on-line business because we believe this combined measure represents a more useful disclosure in light of our fully-integrated, multi-channel approach to our business.
Gross Margin Rate
Gross margin rate represents gross margin (sales less cost of sales) as a percentage of sales. See Note 3 for a description of expenses included in cost of sales.
In 2006, our consolidated gross margin rate was 31.9 percent compared to 31.9 percent in 2005. Within our gross margin rate for the year, we experienced an increase in markup, which was offset by an increase in markdowns. Markup is the difference between an item's cost and its retail price (expressed as a percentage of its retail price). Factors that affect markup include vendor offerings and negotiations, vendor income, sourcing strategies, market forces like the cost of raw materials and freight, and competitive influences. Markdowns are the reduction in the original or previous price of retail merchandise. Factors that affect markdowns include inventory management and competitive influences. The definition and method of calculating markup, markdowns and gross margin varies across the retail industry.
In 2005, our consolidated gross margin rate was 31.9 percent compared to 31.2 percent in 2004. This change in gross margin rate primarily reflected an improvement in markup, including an increase in direct import penetration, as well as favorable inventory shrink performance.
We expect our consolidated gross margin rate in 2007 to be approximately equal to our 2006 gross margin rate. The factors affecting our outlook include: our introduction of new merchandising strategies, our growth in direct imports and our ability to leverage our increasing scale, offset by the more rapid pace of growth of lower margin categories like consumables and commodities.
Selling, General and Administrative Expense Rate
Our selling, general and administrative (SG&A) expense rate represents SG&A expenses as a percentage of sales. See Note 3 for a description of expenses included in SG&A expenses. SG&A expenses exclude depreciation and amortization, and SG&A expenses also exclude expenses associated with our credit card operations, which are reflected separately in our Consolidated Statements of Operations.
In 2006, our SG&A expense rate was 22.2 percent compared to 21.8 percent in 2005. This increase was primarily due to higher store payroll costs, the year-over-year impact of reduced transition services income related to our 2004 divestiture of Mervyn's and the $27 million Visa/MasterCard settlement that reduced SG&A expense in 2005.
In 2005, our consolidated SG&A expense rate was 21.8 percent compared to 21.4 percent in 2004. The expense rate increase was due to several factors including the year-over-year impact of reduced transition services income related to our 2004 divestitures of Marshall Field's and Mervyn's, higher utilities expense and the effects of stronger year-over-year performance on incentive and share-based compensation expense. Some of the expense rate increase was also attributable to growth in marketing expenses for which the corresponding vendor income is recorded as a reduction of inventory costs because it did not meet the criteria required for recording it as an element of SG&A expenses. The combination of all unfavorable expense items more than offset the year-over-year favorability from the $65 million lease accounting adjustment during 2004.
In 2007, we expect our SG&A expense rate to be approximately equal to our 2006 rate.
Credit Card Contribution
We offer credit to qualified guests through our REDcard products, the Target Visa and the Target Card. Our credit card program strategically supports our core retail operations and remains an important contributor to our overall profitability. Our credit card revenues are comprised of finance charges, late fees and other revenues. In addition, we receive fees from merchants who accept the Target Visa credit card. In 2006, our net credit card revenues primarily increased due to an 11.1 percent increase in average receivables.
Our credit card operations are allocated a portion of consolidated interest expense based on estimated funding costs for average net accounts receivable and other financial services assets. Our allocation methodology assumes that 90 percent of the sum of average net receivables and other financial services assets are debt-financed with a mix of fixed rate and variable rate debt in proportion to the mix of fixed and variable rate financial services assets. Beginning in 2005, the majority of our credit card portfolio began to earn interest at variable rates; thus, the majority of the interest allocation to the credit card business in 2006 and 2005 is at rates that are determined based upon our approximate marginal variable rate cost of borrowed funds.
Credit card expenses include a bad debt provision, as well as operations and marketing expenses supporting our credit card portfolio. In 2006 versus 2005, our bad debt provision decreased relative to our average receivables balance due to the favorable write-off experience and continued strength of the overall credit quality of the portfolio. Our 2006 year-end reserve balance as a percentage of average receivables increased as we reserved for the expected increase in future write-offs. Our delinquency rates increased in the last quarter of 2006 as compared to 2005 as we cycled the effects of the October 2005 federal bankruptcy legislation and experience the effects of the mandated increases in minimum payments for certain guests. Operations and marketing expenses increased primarily due to the growth of the Target Visa portfolio.
In 2005 versus 2004, our bad debt provision grew at a slower pace than our average receivables balance due to the aging of the portfolio and the favorable macro-economic credit card environment. However, our total reserve balance as a percentage of average receivables increased in 2005 as we reserved for the expected effects of the mandated increases in minimum payments for certain guests. Our net write-offs as a percentage of average receivables and our delinquency rates continued to improve, despite a significant increase in bankruptcy filings in advance of the October 2005 effective date of the related federal bankruptcy legislation. Operations and marketing expenses increased primarily due to the growth of the Target Visa portfolio.
In 2006, our credit card operations' contribution to earnings from continuing operations before income taxes (EBT) was $693 million, a 53.3 percent increase from 2005. The favorability in credit card contribution was attributable to strong growth in net interest income and the year-over-year reduction in bad debt expense.
In 2005, our credit card operations' contribution to EBT was $452 million, a 77.4 percent increase from 2004. The favorability in credit card contribution was attributable to strong growth in net interest income. Average receivables rose 12.5 percent from 2004, which was approximately equal to our sales growth.
We expect our 2007 credit card receivables to increase in line with 2007 sales growth, and we expect our overall credit card performance to remain strong. In 2007, our delinquency rate is expected to remain stable in the range of our recent experience, approximately 3.5 percent to 4.0 percent of average receivables, and we expect our net write-off experience to be closer to our 2004 and 2005 rates than our 2006 rate.
| |
Credit Card Contribution to EBT
(millions)
| | 2006
| | 2005
| | 2004
| |
|---|
| |
| Revenues | | | | | | | |
| Finance charges | | $1,117 | | $915 | | $772 | |
| Interest expense | | (286 | ) | (193 | ) | (230 | ) |
| |
| Net interest income | | 831 | | 722 | | 542 | |
| |
| Late fees and other revenues | | 356 | | 310 | | 287 | |
| Merchant fees | | | | | | | |
| | Intracompany | | 74 | | 72 | | 65 | |
| | Third-party | | 139 | | 124 | | 98 | |
| |
| Non-interest income | | 569 | | 506 | | 450 | |
| |
| Expenses | | | | | | | |
| Bad debt | | 380 | | 466 | | 451 | |
| Operations and marketing | | 327 | | 310 | | 286 | |
| |
| Total expenses | | 707 | | 776 | | 737 | |
| |
| Credit card contribution to EBT | | $693 | | $452 | | $255 | |
| |
| As a percentage of average receivables | | 11.0% | | 8.2% | | 5.2% | |
| Net interest margin(a) | | 13.2% | | 13.0% | | 11.0% | |
| |
- (a)
- Net interest income divided by average accounts receivable.
|
Receivables
(millions)
| | 2006
| | 2005
| | 2004
|
|---|
|
| Year-end receivables | | $6,711 | | $6,117 | | $5,456 |
| Average receivables | | $6,161 | | $5,544 | | $4,927 |
| Accounts with three or more payments past due as a percentage of year-end receivables | | 3.5% | | 2.8% | | 3.5% |
|
| |
Allowance for Doubtful Accounts
(millions)
| | 2006
| | 2005
| | 2004
| |
|---|
| |
| Allowance at beginning of year | | $451 | | $387 | | $352 | |
| Bad debt provision | | 380 | | 466 | | 451 | |
| Net write-offs | | (314 | ) | (402 | ) | (416 | ) |
| |
| Allowance at end of year | | $517 | | $451 | | $387 | |
| |
| As a percentage of year-end receivables | | 7.7% | | 7.4% | | 7.1% | |
| |
| Net write-offs as a percentage of average receivables | | 5.1% | | 7.2% | | 8.4% | |
| |
We offer new account discounts and rewards programs on our REDcard products. These discounts and rewards are redeemable only on purchases made at Target. The discounts associated with our REDcard products are included as reductions in sales in our Consolidated Statements of Operations and were $104 million, $97 million and $80 million in 2006, 2005 and 2004, respectively.
Depreciation and Amortization
During 2006, we adjusted the period over which we amortize leasehold acquisition costs to match the expected terms for individual leases, resulting in a cumulative benefit to depreciation and amortization expense of approximately $28 million. This change reduced depreciation and amortization expense during 2006, when depreciation and amortization expense totaled $1,496 million, compared to $1,409 million in 2005, an increase of 6.1 percent. In 2005, depreciation and amortization expense increased 11.9 percent, in line with our sales growth for the year, to $1,409 million. We expect 2007 depreciation and amortization expense to be approximately $1.7 billion.
Net Interest Expense
In 2006, net interest expense was $572 million compared to $463 million in 2005, an increase of 23.4 percent. This increase related primarily to growth in the cost of funding our credit card operations and was also unfavorably impacted by the 53rd week in the current fiscal year. The average portfolio interest rate was 6.2 percent in 2006 and 5.9 percent in 2005.
In 2005, net interest expense was $463 million, compared to $570 million in 2004. This decrease was primarily due to a significantly smaller loss on debt repurchase in 2005 (less than $1 million in 2005 compared to $89 million in 2004). The decrease in 2005 net interest expense also reflected the benefit of lower average net debt in the first half of the year due to the application of proceeds from the mid-2004 Marshall Field's and Mervyn's sale transactions. This benefit was partially offset by higher average net debt balances in the second half of the year and a higher annual average portfolio interest rate. For the full year, the average portfolio interest rate was 5.9 percent in 2005 and 5.5 percent in 2004.
Our 2007 net interest expense is expected to increase due to modestly higher average net debt. To preserve our net interest margin on our receivables, we intend to maintain a sufficient level of floating-rate debt to generate parallel changes in net interest expense and finance charge revenue.
Provision for Income Taxes
Our effective income tax rate from continuing operations was 38.0 percent in 2006, 37.6 percent in 2005 and 37.8 percent in 2004. Our lower 2005 effective rate was due to the favorable resolution of various tax matters in 2005. We expect our effective income tax rate in 2007 to rise modestly from 2006.
Analysis of Financial Condition
Liquidity and Capital Resources
Our financial condition remains strong. In assessing our financial condition, we consider factors such as cash flow provided by operations, capital expenditures and debt service obligations. Cash flow provided by operations was $4,862 million in 2006 compared to $4,451 million in 2005, primarily due to higher earnings from continuing operations.
We continue to fund our growth and execute our share repurchase program through a combination of internally-generated funds and debt financing.
Our year-end gross receivables were $6,711 million compared to $6,117 million in 2005, an increase of 9.7 percent. This growth was driven by increased issuance and usage of the Target Visa credit card by our guests during 2006. Average receivables in 2006 increased 11.1 percent. In 2007 we expect our credit card receivables to grow in line with our 2007 sales.
Year-end inventory levels increased $416 million, or 7.1 percent, reflecting the natural increase required to support additional square footage and comparable-store sales growth. This growth was largely funded by an increase in accounts payable over the same period.
In June 2004, our Board of Directors authorized the repurchase of $3 billion of our common stock. In November 2005, our Board increased the aggregate authorization by $2 billion for a total authorization of $5 billion. In 2006, we repurchased 19.5 million shares of our common stock for a total investment of $977 million ($50.16 per share), primarily through open market transactions. Since the inception of this share repurchase program, we have repurchased a total of 71.0 million shares of our common stock for a total investment of $3,450 million ($48.56 per share). Of the shares reacquired in 2006, a portion was delivered upon settlement of prepaid forward contracts. The details of prepaid forward contract settlements and our long positions in prepaid forward contracts have been provided in Note 25 and Note 27. In 2005 we reacquired 23.1 million shares for a total investment of $1,197 million ($51.88 per share). We expect to continue to execute our share repurchase program primarily in open market transactions, subject to market conditions, and to complete the total program by year-end 2008 or sooner.
Our financing strategy is to ensure liquidity and access to capital markets, to manage our net exposure to floating interest rate volatility and to maintain a balanced spectrum of debt maturities. Within these parameters, we seek to minimize our cost of borrowing.
In 2006 we declared dividends of $.46 per share totaling approximately $396 million, an increase of 18.6 percent over 2005. In 2005 we declared dividends of $.38 per share totaling approximately $334 million, an increase of 19.3 percent over 2004. We have paid dividends every quarter since our first dividend was declared following our 1967 initial public offering, and it is our intent to continue to do so in the future.
Management believes that cash flows from operations, together with current levels of cash and cash equivalents, proceeds from long-term financing activities and issuance of short-term debt will be sufficient in 2007 to fund planned capital expenditures, share repurchases, growth in receivables, maturities of long-term debt, and other cash requirements, including our seasonal inventory buildup.
Maintaining strong investment-grade debt ratings is a key part of our strategy. Our debt ratings as of February 3, 2007 were:
|
Debt Ratings
| |
| | Standard and
Poor's
| |
|
|---|
| | Moody's
| | Fitch
|
|---|
|
| Long-term debt | | A1 | | A+ | | A+ |
| Commercial paper | | P-1 | | A-1 | | F1 |
| Securitized receivables | | Aaa | | AAA | | n/a |
|
As described in Note 19, during 2006 we issued $750 million of long-term debt and issued $500 million of Variable Funding Certificates backed by credit card receivables through the Target Credit Card Master Trust. As of February 3, 2007, $100 million of the Variable Funding Certificates were outstanding. Further liquidity is provided by a committed $1.6 billion unsecured revolving credit facility obtained through a group of banks in June 2005, which is scheduled to expire in June 2010. No balances were outstanding at any time during 2006 or 2005 under this or previously existing revolving credit facilities. Most of our long-term debt obligations contain covenants related to secured debt levels. In addition, our credit facility contains a debt leverage covenant. We are, and expect to remain, in compliance with these covenants. At February 3, 2007, no notes or debentures contained provisions requiring acceleration of payment upon a debt rating downgrade.
Our interest coverage ratio represents the ratio of pre-tax earnings before fixed charges (interest expense and the interest portion of rent expense) to fixed charges. Our interest coverage ratio calculated as prescribed by Securities and Exchange Commission (SEC) rules was 7.1x, 7.2x, and 5.4x in 2006, 2005 and 2004, respectively. The ratio in 2004 was adversely affected by losses from discretionary debt repurchase transactions and excludes historical income from discontinued operations. Management believes adjustments for these items are necessary to make the coverage ratio a more useful and consistent indicator of creditworthiness.
Capital Expenditures
Capital expenditures were $3,928 million in 2006 compared to $3,388 million in 2005 and $3,068 million in 2004. This increase was primarily attributable to continued new store expansion, an increase in remodel program expenditures and growth in distribution center capital investment. Net property and equipment increased $2,393 in 2006 following an increase of $2,178 million in 2005.
Spending for new stores, store expansions and remodels, and information systems hardware and software, distribution capacity and other infrastructure to support store growth as a percentage of total capital expenditures are shown below for each of the last three fiscal years.
|
| | Percentage of Capital Expenditures
|
|---|
Capital Expenditures
|
|---|
| | 2006
| | 2005
| | 2004
|
|---|
|
| New stores | | 61% | | 60% | | 64% |
| Remodels and expansions | | 12% | | 12% | | 12% |
| Information technology, distribution and other | | 27% | | 28% | | 24% |
|
| Total | | 100% | | 100% | | 100% |
|
In 2007, we expect to invest $4.2 billion to $4.4 billion primarily in new stores, store expansions and remodels, as well as information systems hardware and software, distribution capacity and other infrastructure to support our planned growth. Our estimated 2007 store opening program reflects net square footage growth of approximately 8 percent, including 115 to 120 new stores partially offset by closings and relocations. We also expect to remodel approximately 40 to 45 stores, most of which will be expanded. In addition, we expect to open two distribution centers in 2007.
|
Number of Stores
| | February 3,
2007
| |
| |
| | January 28,
2006
|
|---|
| | Opened
| | Closed (a)
|
|---|
|
| Target general merchandise stores | | 1,311 | | 94 | | 22 | | 1,239 |
| SuperTarget stores | | 177 | | 19 | | — | | 158 |
|
| Total | | 1,488 | | 113 | | 22 | | 1,397 |
|
| Retail Square Feet(b) | | | | | | | | |
|
| Target general merchandise stores | | 160,806 | | 12,860 | | 2,372 | | 150,318 |
| SuperTarget stores | | 31,258 | | 3,316 | | — | | 27,942 |
|
| Total | | 192,064 | | 16,176 | | 2,372 | | 178,260 |
|
- (a)
- Includes 18 store relocations in the same trade area and four stores closed without replacement.
- (b)
- Reflects total square feet, less office, distribution center and vacant space.
Commitments and Contingencies
At February 3, 2007, our contractual obligations were as follows:
|
Contractual Obligations
| |
| |
| |
| |
| |
|
|---|
| | Payments Due by Period
|
|---|
(millions)
| | Total
| | Less than
1 Year
| | 1-3
Years
| | 3-5
Years
| | After 5
Years
|
|---|
|
| Long-term debt(a) | | $9,897 | | $1,355 | | $2,268 | | $2,343 | | $3,931 |
| Interest payments – long-term debt (b) | | 4,165 | | 547 | | 899 | | 625 | | 2,094 |
| Capital lease obligations | | 249 | | 15 | | 30 | | 32 | | 172 |
| Operating leases (c) | | 3,325 | | 142 | | 266 | | 235 | | 2,682 |
| Deferred compensation | | 691 | | 46 | | 205 | | 98 | | 342 |
| Real estate obligations | | 1,106 | | 1,106 | | — | | — | | — |
| Purchase obligations | | 1,613 | | 483 | | 605 | | 290 | | 235 |
|
| Contractual cash obligations | | $21,046 | | $3,694 | | $4,273 | | $3,623 | | $9,456 |
|
- (a)
- Required principal payments only. Excludes Statement of Financial Accounting Standards No. 133, "Accounting for Derivative Instruments and Hedging Activities," fair market value adjustments recorded in long-term debt.
- (b)
- Includes payments on $1,750 million of floating rate long-term debt secured by credit card receivables, $750 million of which matures in 2007, $900 million of which matures in 2010, and $100 million of which matures in 12 monthly installments beginning in October 2007. These payments are calculated assuming rates of approximately 5.5 percent, based on a spread over presumed LIBOR of 5.35%, for each year outstanding. Excludes payments received or made related to interest rate swaps. The fair value of outstanding interest rate swaps has been provided in Note 21.
- (c)
- Total contractual lease payments include $1,631 million related to certain options to extend the lease term that are reasonably assured of being exercised and also includes $188 million of legally binding minimum lease payments for stores opening in 2007 or later. Refer to Note 22 for further description of leases.
Real estate obligations include commitments for the purchase, construction or remodeling of real estate and facilities. Purchase obligations include all legally binding contracts such as firm minimum commitments for inventory purchases, merchandise royalties, purchases of equipment, marketing-related contracts, software acquisition/license commitments and service contracts.
We issue inventory purchase orders in the normal course of business, which represent authorizations to purchase that are cancelable by their terms. We do not consider purchase orders to be firm inventory commitments; therefore, they are excluded from the table above. We also issue trade letters of credit in the ordinary course of business, which are excluded from this table as these obligations are conditional on the purchase order not being cancelled. If we choose to cancel a purchase order, we may be obligated to reimburse the vendor for unrecoverable outlays incurred prior to cancellation, under certain circumstances.
We have not included obligations under our pension and postretirement health care benefit plans in the contractual obligations table above. Our historical practice regarding these plans has been to contribute amounts necessary to satisfy minimum pension funding requirements plus periodic discretionary amounts determined to be appropriate. Further information on these plans, including our expected contributions for 2007, is included in Note 28.
We have not provided any material financial guarantees as of February 3, 2007. We have not created and are not party to any off-balance sheet entities for the purpose of raising capital, incurring debt or operating our business. We do not have any arrangements or relationships with entities that are not consolidated into the financial statements that are reasonably likely to materially affect our liquidity or the availability of capital resources.
Analysis of Discontinued Operations
Marshall Field's and Mervyn's were divested in 2004; no financial results of discontinued operations are included for 2006 or 2005. In 2004, revenues and earnings from discontinued operations reflected only a partial year of results and excluded the holiday season. For 2004, total revenues included in discontinued operations were $3,095 million, and earnings from discontinued operations were $75 million, net of taxes of $46 million. In addition, we recorded a gain on the sale of discontinued operations of $1,238 million, net of taxes of $761 million, during 2004.
Critical Accounting Estimates
Our analysis of operations and financial condition is based on our consolidated financial statements, prepared in accordance with U.S. generally accepted accounting principles (GAAP). Preparation of these consolidated financial statements requires us to make estimates and assumptions affecting the reported amounts of assets and liabilities at the date of the financial statements, reported amounts of revenues and expenses during the reporting period and related disclosures of contingent assets and liabilities. In the Notes to Consolidated Financial Statements, we describe our significant accounting policies used in preparing the consolidated financial statements. Our estimates are evaluated on an ongoing basis and are drawn from historical experience and other assumptions that we believe to be reasonable under the circumstances. Actual results could differ under different assumptions or conditions. Our senior management has discussed the development and selection of our critical accounting estimates with the Audit Committee of our Board of Directors. The following items in our consolidated financial statements require significant estimation or judgment:
Inventory and cost of sales We use the retail inventory method to account for substantially all of our inventory and the related cost of sales. Under this method, inventory is stated at cost using the last-in, first-out (LIFO) method as determined by applying a cost-to-retail ratio to each merchandise grouping's ending retail value. Cost includes the purchase price as adjusted for vendor income. Since inventory value is adjusted regularly to reflect market conditions, our inventory methodology reflects the lower of cost or market. We reduce inventory for estimated losses related to shrink and markdowns. Our shrink estimate is based on historical losses verified by ongoing physical inventory counts. Markdowns designated for clearance activity are recorded when the salability of the merchandise has diminished. Inventory is at risk of obsolescence if economic conditions change. Examples of relevant economic conditions include shifting consumer demand, changing consumer credit markets or increasing competition. We believe these risks are largely mitigated because substantially all of our inventory turns in less than six months. Inventory is further described in Note 11.
Vendor income receivable Cost of sales and SG&A expenses are partially offset by various forms of consideration received from our vendors. This "vendor income" is earned for a variety of vendor-sponsored programs, such as volume rebates, markdown allowances, promotions and advertising, as well as for our compliance programs. We establish a receivable for the vendor income that is earned but not yet received. Based on provisions of the agreements in place, this receivable is computed by estimating the point at which we have completed our performance and the amount earned. We perform detailed analyses to determine the appropriate level of the receivable in aggregate. The majority of all year-end receivables associated with these activities are collected within the following fiscal quarter. See further description in Note 4.
Allowance for doubtful accounts When receivables are recorded, we recognize an allowance for doubtful accounts in an amount equal to anticipated future write-offs. This allowance includes provisions for uncollectible finance charges and other credit fees. We estimate future write-offs based on delinquencies, risk scores, aging trends, industry risk trends and our historical experience. Substantially all accounts continue to accrue finance charges until they are written off. Accounts are automatically written off when they become 180 days past due. Management believes the allowance for doubtful accounts is adequate to cover anticipated losses in our credit card accounts receivable under current conditions; however, significant deterioration in any of the factors mentioned above or in general economic conditions could materially change these expectations. Accounts receivable is described in Note 10.
Analysis of long-lived and intangible assets for impairment We review assets at the lowest level for which there are identifiable cash flows, usually at the store level. The carrying amount of assets is compared to the expected undiscounted future cash flows to be generated by those assets over their estimated remaining economic lives. Impairment testing of intangibles requires a comparison between the carrying value and the fair value. Discounted cash flow models are used in determining fair value for the purposes of the required annual impairment analysis. No material impairments were recorded in 2006, 2005 or 2004 as a result of the tests performed.
Insurance/self-insurance We retain a substantial portion of the risk related to certain general liability, workers' compensation, property loss and team member medical and dental claims. Liabilities associated with these losses include estimates of both claims filed and losses incurred but not yet reported. We estimate our ultimate cost based on an analysis of historical data and actuarial estimates. General liability and workers' compensation liabilities are recorded at our estimate of their net present value; other liabilities are not discounted. We believe that the amounts accrued are adequate, although actual losses may differ from the amounts provided. We maintain stop-loss coverage to limit the exposure related to certain risks.
Income taxes We pay income taxes based on the tax statutes, regulations and case law of the various jurisdictions in which we operate. Significant judgment is required in determining income tax provisions and in evaluating the ultimate resolution of tax matters in dispute with tax authorities. Historically, our assessments of the ultimate resolution of tax issues have been materially accurate. The current open tax issues are not dissimilar in size or substance from historical items. Management believes the resolution of the foregoing matters will not have a material impact on our consolidated financial statements. Income taxes are further described in Note 23.
Pension and postretirement health care accounting We fund and maintain a qualified defined benefit pension plan. We also maintain several smaller nonqualified plans and a postretirement health care plan for certain retired team members. The costs for these plans are calculated based on actuarial calculations using the assumptions described in the following paragraphs.
Our expected long-term rate of return on plan assets is determined by the composition of our asset portfolio, our historical long-term investment performance and current market conditions.
The discount rate used to determine benefit obligations is adjusted annually based on the interest rate for long-term high-quality corporate bonds as of the measurement date (October 31) using yields for maturities that are in line with the duration of our pension liabilities. Historically, this same discount rate has also been used to determine pension and postretirement health care expense for the following plan year. We are currently evaluating whether we will early adopt the measurement date provisions of SFAS No. 158, "Employers' Accounting for Defined Benefit Pension and Other Postretirement Plans, an amendment of FASB Statements No. 87, 88, 106, and 132(R)" (SFAS 158), as discussed below in the 2006 Adoptions section. In 2006, we increased our discount rate by 0.05 percentage points from the previous year for the purpose of calculating the October 31, 2006 benefit obligation.
Based on our experience, we use a graduated compensation growth schedule that assumes higher compensation growth for younger, shorter-service pension-eligible team members than it does for older, longer-service pension-eligible team members. In 2006, we increased the assumed rate of compensation increase by 0.50 percentage points for the purpose of calculating the October 31, 2006 benefit obligation. In 2005, we made a 0.75 percentage point increase in the assumed compensation rate increase, which impacted the net periodic benefit cost for 2006.
Pension and postretirement health care benefits are further described in Note 28.
New Accounting Pronouncements
2006 Adoptions
We adopted the recognition and disclosure provisions of SFAS 158 during 2006. Please refer to Note 28 (Pension and Postretirement Health Care Benefits) for further description of this adoption. We are currently evaluating whether we will adopt the SFAS 158 measurement date provisions in 2007 or 2008, including the potential impact on our results of operations and financial position.
In September 2006, the SEC staff published Staff Accounting Bulletin No. 108, "Considering the Effects of Prior Year Misstatements when Quantifying Misstatements in Current Year Financial Statements" (SAB 108). SAB 108 addresses quantifying the financial statement effects of misstatements, specifically, how the effects of prior year uncorrected errors must be considered in quantifying misstatements in the current year financial statements. We adopted SAB 108 during the fourth quarter of 2006. The adoption of this statement did not have any impact on our consolidated net earnings, cash flows or financial position.
2007 and Future Adoptions
In July 2006, the Financial Accounting Standards Board (FASB) issued FASB Interpretation No. 48, "Accounting for Uncertainty in Income Taxes—an interpretation of FASB Statement No. 109" (FIN 48). FIN 48 prescribes the financial statement recognition and measurement criteria for tax positions taken in a tax return, clarifies when tax benefits should be recorded and how they should be classified in financial statements, and requires certain disclosures of uncertain tax matters. FIN 48 is effective at the beginning of fiscal 2007. We are presently evaluating the impact of the adoption of FIN 48 on our results of operations and financial position.
In September 2006, the FASB issued Statement of Financial Accounting Standards No. 157, "Fair Value Measurement" (SFAS 157). SFAS 157 provides a definition of fair value, provides guidance for measuring fair value in U.S. GAAP and expands disclosures about fair value measurements. SFAS 157 will be effective at the beginning of fiscal 2008. We are presently evaluating the impact of the adoption of SFAS 157 on our results of operations and financial position.
In February 2007, the FASB issued Statement of Financial Accounting Standards No. 159, "The Fair Value Option for Financial Assets and Financial Liabilities" (SFAS 159). SFAS 159 permits entities to choose to measure many financial instruments and certain other items at fair value. SFAS 159 will be effective at the beginning of fiscal 2008. We are presently evaluating the impact of the adoption of SFAS 159 on our results of operations and financial position.
Forward-Looking Statements
This report, including the preceding Management's Discussion and Analysis, contains forward-looking statements regarding our performance, financial position, liquidity and adequacy of capital resources. Forward-looking statements are typically accompanied by the words "expect," "may," "could," "believe," "would," "might," "anticipates," or words of similar import. The forward-looking statements in this report include the anticipated impact of new and proposed accounting pronouncements, the expected outcome of pending and threatened litigation, our expectations with respect to our share repurchase program and our outlook in fiscal 2007. Forward-looking statements are based on our current assumptions and expectations and are subject to certain risks and uncertainties that could cause actual results to differ materially from those projected. We caution that the forward-looking statements are qualified by the risks and challenges posed by increased competition (including the effects of competitor liquidation activities), shifting consumer demand, changing consumer credit markets, changing wages, health care and other benefit costs, shifting capital markets and general economic conditions, hiring and retaining effective team members, sourcing merchandise from domestic and international vendors, investing in new business strategies, the outbreak of war or pandemics and other significant national and international events, and other risks and uncertainties. As a result, although we believe there is a reasonable basis for the forward- looking statements, you should not place undue reliance on those statements. You are encouraged to review Exhibit (99)A to this Form 10-K, which contains additional important factors that may cause actual results to differ materially from those predicted in the forward-looking statements.
Item 7A. Quantitative and Qualitative Disclosures About Market Risk.
Our exposure to market risk results primarily from interest rate changes on our debt obligations and on our credit card receivables, the majority of which are now assessed finance charges at a prime-based floating rate. To preserve our net interest margin, we intend to maintain sufficient levels of floating-rate debt to generate parallel changes in net interest expense as finance charge revenues fluctuate. At February 3, 2007, our level of floating-rate debt obligations exceeded our level of floating-rate credit card assets by approximately $1 billion. As a result, based on our balance sheet position at February 3, 2007, the annualized effect of a one percentage point increase in floating interest rates on our interest rate swap agreements and other floating rate debt obligations, net of our floating rate credit card assets, would be to decrease earnings from continuing operations before income taxes by approximately $10 million. See further description in Note 21.
We record our general liability and workers' compensation liabilities at net present value; therefore, these liabilities fluctuate with changes in interest rates. We economically hedge a portion of our exposure to these interest rate changes by entering into interest rate forward contracts that partially mitigate the effects of interest rate changes. As a result, we do not have significant net exposure to interest rate changes for these liabilities.
In addition, we are exposed to fluctuations of market returns on our qualified defined benefit pension and nonqualified defined contribution plans. The annualized effect of a one percentage point decrease in the return on pension plan assets would decrease plan assets by $21 million at February 3, 2007. The resulting impact on net pension expense would be calculated consistent with the provisions of SFAS No. 87, "Employers' Accounting for Pensions." See further description in Note 28.
As more fully described in Note 14 and Note 27, we are exposed to market returns on accumulated team member balances in our nonqualified, unfunded deferred compensation plans. We control our risk of offering the nonqualified plans by making investments in life insurance contracts and prepaid forward contracts on our own common stock that offset a substantial portion of our economic exposure to the returns on these plans. The annualized effect of a one percentage point change in market returns on our nonqualified defined contribution plans (inclusive of the effect of the investment vehicles used to manage our economic exposure) would not be significant.
We do not have significant direct exposure to foreign currency rates as all of our stores are located in the United States and the vast majority of imported merchandise is purchased in U.S. dollars.
Overall, there have been no material changes in our primary risk exposures or management of market risks since the prior year.
Item 8. Financial Statements and Supplementary Data.
Report of Management on the Consolidated Financial Statements
Management is responsible for the consistency, integrity and presentation of the information in the Annual Report. The consolidated financial statements and other information presented in this Annual Report have been prepared in accordance with accounting principles generally accepted in the United States and include necessary judgments and estimates by management.
To fulfill our responsibility, we maintain comprehensive systems of internal control designed to provide reasonable assurance that assets are safeguarded and transactions are executed in accordance with established procedures. The concept of reasonable assurance is based upon recognition that the cost of the controls should not exceed the benefit derived. We believe our systems of internal control provide this reasonable assurance.
The Board of Directors exercised its oversight role with respect to the Corporation's systems of internal control primarily through its Audit Committee, which is comprised of four independent directors. The Committee oversees the Corporation's systems of internal control, accounting practices, financial reporting and audits to assess whether their quality, integrity and objectivity are sufficient to protect shareholders' investments.
In addition, our consolidated financial statements have been audited by Ernst & Young LLP, independent registered public accounting firm, whose report also appears on this page.
 | |  |
Robert J. Ulrich
Chairman of the Board and
Chief Executive Officer
March 14, 2007 |
|
Douglas A. Scovanner
Executive Vice President and
Chief Financial Officer |
Report of Independent Registered Public Accounting Firm on Consolidated Financial Statements
The Board of Directors and Shareholders
Target Corporation
We have audited the accompanying consolidated statements of financial position of Target Corporation and subsidiaries (the Corporation) as of February 3, 2007 and January 28, 2006, and the related consolidated statements of operations, cash flows, and shareholders' investment for each of the three years in the period ended February 3, 2007. Our audits also included the financial statement schedule listed in Item 15(a). These financial statements and schedule are the responsibility of the Corporation's management. Our responsibility is to express an opinion on these financial statements and schedule based on our audits.
We conducted our audits in accordance with the standards of the Public Company Accounting Oversight Board (United States). Those standards require that we plan and perform the audit to obtain reasonable assurance about whether the financial statements are free of material misstatement. An audit includes examining, on a test basis, evidence supporting the amounts and disclosures in the financial statements. An audit also includes assessing the accounting principles used and significant estimates made by management, as well as evaluating the overall financial statement presentation. We believe that our audits provide a reasonable basis for our opinion.
In our opinion, the financial statements referred to above present fairly, in all material respects, the consolidated financial position of Target Corporation and subsidiaries at February 3, 2007 and January 28, 2006, and the consolidated results of their operations and their cash flows for each of the three years in the period ended February 3, 2007, in conformity with U.S. generally accepted accounting principles. Also, in our opinion, the related financial statement schedule, when considered in relation to the basic financial statements taken as a whole, presents fairly, in all material respects, the information set forth therein.
As discussed in Note 28, Pension and Postretirement Health Care Benefits, to the consolidated financial statements, effective February 3, 2007, the Corporation adopted the recognition and disclosure provisions of SFAS 158, "Employers' Accounting for Defined Benefit Pension and Other Postretirement Plans, an amendment of FASB Statements No. 87, 88, 106, and 132(R)."
We also have audited, in accordance with the standards of the Public Company Accounting Oversight Board (United States), the effectiveness of the Corporation's internal control over financial reporting as of February 3, 2007, based on criteria established inInternal Control – Integrated Framework, issued by the Committee of Sponsoring Organizations of the Treadway Commission and our report dated March 14, 2007, expressed an unqualified opinion thereon.

Minneapolis, Minnesota
March 14, 2007
Report of Management on Internal Control
Our management is responsible for establishing and maintaining adequate internal control over financial reporting, as such term is defined in Exchange Act Rules 13a-15(f). Under the supervision and with the participation of our management, including our chief executive officer and chief financial officer, we assessed the effectiveness of our internal control over financial reporting as of February 3, 2007, based on the framework inInternal Control – Integrated Framework, issued by the Committee of Sponsoring Organizations of the Treadway Commission. Based on our assessment, we conclude that the Corporation's internal control over financial reporting is effective based on those criteria.
Our management's assessment of the effectiveness of our internal control over financial reporting as of February 3, 2007, has been audited by Ernst & Young LLP, independent registered public accounting firm, whose report also appears on this page.
| | |
Robert J. Ulrich
Chairman of the Board and
Chief Executive Officer
March 14, 2007 |
|
Douglas A. Scovanner
Executive Vice President and
Chief Financial Officer |
Report of Independent Registered Public Accounting Firm on Internal Control over Financial Reporting
The Board of Directors and Shareholders
Target Corporation
We have audited management's assessment, included in the accompanying Report of Management on Internal Control, that Target Corporation and subsidiaries (the Corporation) maintained effective internal control over financial reporting as of February 3, 2007, based on criteria established inInternal Control – Integrated Framework, issued by the Committee of Sponsoring Organizations of the Treadway Commission (the COSO criteria). The Corporation's management is responsible for maintaining effective internal control over financial reporting and for its assessment of the effectiveness of internal control over financial reporting. Our responsibility is to express an opinion on management's assessment and an opinion on the effectiveness of the Corporation's internal control over financial reporting based on our audit.
We conducted our audit in accordance with the standards of the Public Company Accounting Oversight Board (United States). Those standards require that we plan and perform the audit to obtain reasonable assurance about whether effective internal control over financial reporting was maintained in all material respects. Our audit included obtaining an understanding of internal control over financial reporting, evaluating management's assessment, testing and evaluating the design and operating effectiveness of internal control, and performing such other procedures as we considered necessary in the circumstances. We believe that our audit provides a reasonable basis for our opinion.
A company's internal control over financial reporting is a process designed to provide reasonable assurance regarding the reliability of financial reporting and the preparation of financial statements for external purposes in accordance with generally accepted accounting principles. A company's internal control over financial reporting includes those policies and procedures that (1) pertain to the maintenance of records that, in reasonable detail, accurately and fairly reflect the transactions and dispositions of the assets of the company, (2) provide reasonable assurance that transactions are recorded as necessary to permit preparation of financial statements in accordance with generally accepted accounting principles and that receipts and expenditures of the company are being made only in accordance with authorizations of management and directors of the company, and (3) provide reasonable assurance regarding prevention or timely detection of unauthorized acquisition, use, or disposition of the company's assets that could have a material effect on the financial statements.
Because of its inherent limitations, internal control over financial reporting may not prevent or detect misstatements. Also, projections of any evaluation of effectiveness to future periods are subject to the risk that controls may become inadequate because of changes in conditions or that the degree of compliance with the policies or procedures may deteriorate.
In our opinion, management's assessment that Target Corporation and subsidiaries maintained effective internal control over financial reporting as of February 3, 2007, is fairly stated, in all material respects, based on the COSO criteria. Also, in our opinion, the Corporation maintained, in all material respects, effective internal control over financial reporting as of February 3, 2007, based on the COSO criteria.
We also have audited, in accordance with the standards of the Public Company Accounting Oversight Board (United States), the consolidated statements of financial position of Target Corporation and subsidiaries as of February 3, 2007 and January 28, 2006, and the related consolidated statements of operations, cash flows and shareholders' investment for each of the three years in the period ended February 3, 2007, and our report dated March 14, 2007, expressed an unqualified opinion thereon.
Minneapolis, Minnesota
March 14, 2007
Consolidated Statements of Operations
|
(millions, except per share data)
| | 2006
| | 2005
| | 2004
|
|---|
|
| Sales | | $57,878 | | $51,271 | | $45,682 |
| Net credit card revenues | | 1,612 | | 1,349 | | 1,157 |
|
| Total revenues | | 59,490 | | 52,620 | | 46,839 |
| Cost of sales | | 39,399 | | 34,927 | | 31,445 |
| Selling, general and administrative expenses | | 12,819 | | 11,185 | | 9,797 |
| Credit card expenses | | 707 | | 776 | | 737 |
| Depreciation and amortization | | 1,496 | | 1,409 | | 1,259 |
|
| Earnings from continuing operations before interest expense and income taxes | | 5,069 | | 4,323 | | 3,601 |
| Net interest expense | | 572 | | 463 | | 570 |
|
| Earnings from continuing operations before income taxes | | 4,497 | | 3,860 | | 3,031 |
| Provision for income taxes | | 1,710 | | 1,452 | | 1,146 |
|
| Earnings from continuing operations | | 2,787 | | 2,408 | | 1,885 |
| Earnings from discontinued operations, net of taxes of $46 | | — | | — | | 75 |
| Gain on disposal of discontinued operations, net of taxes of $761 | | — | | — | | 1,238 |
|
| Net earnings | | $2,787 | | $2,408 | | $3,198 |
|
| Basic earnings per share | | | | | | |
| | Continuing operations | | $3.23 | | $2.73 | | $2.09 |
| | Discontinued operations | | — | | — | | .08 |
| | Gain from discontinued operations | | — | | — | | 1.37 |
|
| Basic earnings per share | | $3.23 | | $2.73 | | $3.54 |
|
| Diluted earnings per share | | | | | | |
| | Continuing operations | | $3.21 | | $2.71 | | $2.07 |
| | Discontinued operations | | — | | — | | .08 |
| | Gain from discontinued operations | | — | | — | | 1.36 |
|
| Diluted earnings per share | | $3.21 | | $2.71 | | $3.51 |
|
| Weighted average common shares outstanding: | | | | | | |
| | Basic | | 861.9 | | 882.0 | | 903.8 |
| | Diluted | | 868.6 | | 889.2 | | 912.1 |
|
See accompanying Notes to Consolidated Financial Statements.
Consolidated Statements of Financial Position
| |
(millions, except footnotes)
| | February 3,
2007
| | January 28,
2006
| |
|---|
| |
| Assets | | | | | |
| Cash and cash equivalents | | $813 | | $1,648 | |
| Accounts receivable, net | | 6,194 | | 5,666 | |
| Inventory | | 6,254 | | 5,838 | |
| Other current assets | | 1,445 | | 1,253 | |
| |
| | Total current assets | | 14,706 | | 14,405 | |
| Property and equipment | | | | | |
| | Land | | 4,934 | | 4,449 | |
| | Buildings and improvements | | 16,110 | | 14,174 | |
| | Fixtures and equipment | | 3,553 | | 3,219 | |
| | Computer hardware and software | | 2,188 | | 2,214 | |
| | Construction-in-progress | | 1,596 | | 1,158 | |
| | Accumulated depreciation | | (6,950 | ) | (6,176 | ) |
| |
| | Property and equipment, net | | 21,431 | | 19,038 | |
| Other non-current assets | | 1,212 | | 1,552 | |
| |
| Total assets | | $37,349 | | $34,995 | |
| |
| Liabilities and shareholders' investment | | | | | |
| Accounts payable | | $6,575 | | $6,268 | |
| Accrued and other current liabilities | | 2,758 | | 2,193 | |
| Income taxes payable | | 422 | | 374 | |
| Current portion of long-term debt and notes payable | | 1,362 | | 753 | |
| |
| | Total current liabilities | | 11,117 | | 9,588 | |
| Long-term debt | | 8,675 | | 9,119 | |
| Deferred income taxes | | 577 | | 851 | |
| Other non-current liabilities | | 1,347 | | 1,232 | |
| |
| Shareholders' investment | | | | | |
| | Common stock | | 72 | | 73 | |
| | Additional paid-in-capital | | 2,387 | | 2,121 | |
| | Retained earnings | | 13,417 | | 12,013 | |
| | Accumulated other comprehensive loss | | (243 | ) | (2 | ) |
| |
| | Total shareholders' investment | | 15,633 | | 14,205 | |
| |
| Total liabilities and shareholders' investment | | $37,349 | | $34,995 | |
| |
Common Stock Authorized 6,000,000,000 shares, $.0833 par value; 859,771,157 shares issued and outstanding at February 3, 2007; 874,074,850 shares issued and outstanding at January 28, 2006.
Preferred Stock Authorized 5,000,000 shares, $.01 par value; no shares were issued or outstanding at February 3, 2007 or January 28, 2006.
See accompanying Notes to Consolidated Financial Statements.
Consolidated Statements of Cash Flows
| |
(millions)
| | 2006
| | 2005
| | 2004
| |
|---|
| |
| Operating activities | | | | | | | |
| Net earnings | | $2,787 | | $2,408 | | $3,198 | |
| Earnings from and gain on disposal of discontinued operations, net of taxes | | — | | — | | (1,313 | ) |
| |
| Earnings from continuing operations | | 2,787 | | 2,408 | | 1,885 | |
| Reconciliation to cash flow | | | | | | | |
| | Depreciation and amortization | | 1,496 | | 1,409 | | 1,259 | |
| | Share-based compensation expense | | 99 | | 93 | | 60 | |
| | Deferred income taxes | | (201 | ) | (122 | ) | 233 | |
| | Bad debt provision | | 380 | | 466 | | 451 | |
| | Loss on disposal of property and equipment, net | | 53 | | 70 | | 59 | |
| | Other non-cash items affecting earnings | | (35 | ) | (50 | ) | 73 | |
| | Changes in operating accounts providing / (requiring) cash: | | | | | | | |
| | | Accounts receivable originated at Target | | (226 | ) | (244 | ) | (209 | ) |
| | | Inventory | | (431 | ) | (454 | ) | (853 | ) |
| | | Other current assets | | (30 | ) | (28 | ) | (37 | ) |
| | | Other non-current assets | | 5 | | (24 | ) | (147 | ) |
| | | Accounts payable | | 435 | | 489 | | 823 | |
| | | Accrued liabilities | | 389 | | 351 | | 319 | |
| | | Income taxes payable | | 41 | | 70 | | (91 | ) |
| | | Other non-current liabilities | | 100 | | 2 | | (16 | ) |
| | Other | | — | | 15 | | (1 | ) |
| |
| Cash flow provided by operations | | 4,862 | | 4,451 | | 3,808 | |
| |
| Investing activities | | | | | | | |
| | Expenditures for property and equipment | | (3,928 | ) | (3,388 | ) | (3,068 | ) |
| | Proceeds from disposal of property and equipment | | 62 | | 58 | | 56 | |
| | Change in accounts receivable originated at third parties | | (683 | ) | (819 | ) | (690 | ) |
| | Other investments | | (144 | ) | — | | — | |
| | Proceeds from sale of discontinued operations | | — | | — | | 4,881 | |
| |
| Cash flow (required for) / provided by investing activities | | (4,693 | ) | (4,149 | ) | 1,179 | |
| |
| Financing activities | | | | | | | |
| | Additions to long-term debt | | 1,256 | | 913 | | 10 | |
| | Reductions of long-term debt | | (1,155 | ) | (527 | ) | (1,487 | ) |
| | Dividends paid | | (380 | ) | (318 | ) | (272 | ) |
| | Repurchase of stock | | (901 | ) | (1,197 | ) | (1,290 | ) |
| | Stock option exercises and related tax benefit | | 181 | | 231 | | 215 | |
| | Other | | (5 | ) | (1 | ) | — | |
| |
| Cash flow required for financing activities | | (1,004 | ) | (899 | ) | (2,824 | ) |
| |
| Cash flows of discontinued operations | | | | | | | |
| | Required for operations | | — | | — | | (549 | ) |
| | Required for investing activities | | — | | — | | (44 | ) |
| | Required for financing activities | | — | | — | | (33 | ) |
| |
| Net cash required for discontinued operations | | — | | — | | (626 | ) |
| |
| Net (decrease) / increase in cash and cash equivalents | | (835 | ) | (597 | ) | 1,537 | |
| Cash and cash equivalents at beginning of year | | 1,648 | | 2,245 | | 708 | |
| |
| Cash and cash equivalents at end of year | | $813 | | $1,648 | | $2,245 | |
| |
Amounts presented herein are on a cash basis and therefore may differ from those shown in other sections of this Annual Report. Consistent with the provisions of Statement of Financial Accounting Standards (SFAS) No. 95, "Statement of Cash Flows," cash flows related to accounts receivable are classified as either an operating activity or an investing activity, depending on their origin.
Cash paid for income taxes was $1,823, $1,448, and $1,742 during 2006, 2005, and 2004, respectively. Cash paid for interest (net of interest capitalized) was $584, $468, and $480 during 2006, 2005, and 2004, respectively.
See accompanying Notes to Consolidated Financial Statements.
Consolidated Statements of Shareholders' Investment
| |
(millions, except footnotes)
| | Common
Stock
Shares
| | Stock
Par
Value
| | Additional
Paid-in
Capital
| | Retained
Earnings
| | Accumulated
Other
Comprehensive
Income/(Loss)
| | Total
| |
|---|
| |
| January 31, 2004 | | 911.8 | | $76 | | $1,530 | | $9,523 | | $3 | | $11,132 | |
| Net earnings | | — | | — | | — | | 3,198 | | — | | 3,198 | |
| Other comprehensive loss | | — | | — | | — | | — | | (6 | ) | (6 | ) |
| | | | | | | | | | | | |
| |
| Total comprehensive income | | | | | | | | | | | | 3,192 | |
| Dividends declared | | — | | — | | — | | (280 | ) | — | | (280 | ) |
| Repurchase of stock | | (28.9 | ) | (3 | ) | — | | (1,293 | ) | — | | (1,296 | ) |
| Stock options and awards | | 7.7 | | 1 | | 280 | | — | | — | | 281 | |
| |
| January 29, 2005 | | 890.6 | | 74 | | 1,810 | | 11,148 | | (3 | ) | 13,029 | |
| Net earnings | | — | | — | | — | | 2,408 | | — | | 2,408 | |
| Other comprehensive income | | — | | — | | — | | — | | 1 | | 1 | |
| | | | | | | | | | | | |
| |
| Total comprehensive income | | | | | | | | | | | | 2,409 | |
| Dividends declared | | — | | — | | — | | (334 | ) | — | | (334 | ) |
| Repurchase of stock | | (23.1 | ) | (2 | ) | — | | (1,209 | ) | — | | (1,211 | ) |
| Stock options and awards | | 6.6 | | 1 | | 311 | | — | | — | | 312 | |
| |
| January 28, 2006 | | 874.1 | | 73 | | 2,121 | | 12,013 | | (2 | ) | 14,205 | |
| Net earnings | | — | | — | | — | | 2,787 | | — | | 2,787 | |
| Other comprehensive income, net of taxes of $5 | | — | | — | | — | | — | | (7 | ) | (7 | ) |
| | | | | | | | | | | | |
| |
| Total comprehensive income | | | | | | | | | | | | 2,780 | |
| Cumulative effect of adopting SFAS 158, net of taxes of $152 | | — | | — | | — | | — | | (234 | ) | (234 | ) |
| Dividends declared | | — | | — | | — | | (396 | ) | — | | (396 | ) |
| Repurchase of stock | | (19.5 | ) | (2 | ) | — | | (987 | ) | — | | (989 | ) |
| Stock options and awards | | 5.2 | | 1 | | 266 | | — | | — | | 267 | |
| |
| February 3, 2007 | | 859.8 | | $72 | | $2,387 | | $13,417 | | $(243 | ) | $15,633 | |
| |
Dividends declared per share were $.46, $.38, and $.31 in 2006, 2005, and 2004, respectively.
See accompanying Notes to Consolidated Financial Statements.
Notes to Consolidated Financial Statements
1. Summary of Accounting Policies
Organization Target Corporation (the Corporation or Target) operates large-format general merchandise and food discount stores in the United States and a fully integrated on-line business, Target.com. Our credit card operations represent an integral component of our core retail business, strengthening the bond with our guests, driving incremental sales and contributing meaningfully to earnings. We operate as a single business segment.
Consolidation The consolidated financial statements include the balances of the Corporation and its subsidiaries after elimination of intercompany balances and transactions. All material subsidiaries are wholly-owned.
Use of Estimates The preparation of our consolidated financial statements in conformity with U.S. Generally Accepted Accounting Principles (GAAP) requires management to make estimates and assumptions affecting reported amounts in the consolidated financial statements and accompanying notes. Actual results may differ significantly from those estimates.
Fiscal Year Our fiscal year ends on the Saturday nearest January 31. Unless otherwise stated, references to years in this report relate to fiscal years, rather than to calendar years. Fiscal year 2006 (2006) ended February 3, 2007 and consisted of 53 weeks. Fiscal year 2005 (2005) ended January 28, 2006 and fiscal year 2004 (2004) ended January 29, 2005, and both consisted of 52 weeks.
Reclassifications Certain prior year amounts have been reclassified to conform to the current year presentation.
Share-Based Compensation We adopted the provisions of SFAS No. 123(R), "Share-Based Payment," in 2004 under the modified retrospective transition method. Therefore, all prior period financial statements have been restated to recognize compensation cost in the amounts previously reported in the Notes to Consolidated Financial Statements under the provisions of SFAS 123. SFAS 123(R) requires that all share-based compensation be accounted for using a fair-value-based method.
We estimate the fair value of all share-based awards on the date of grant, which we define as the date the award is approved by our Board of Directors or, for a limited number of awards to team members who are not executive officers, the date the award is approved by management with appropriate delegated authority. The majority of granted awards are nonqualified stock options that vest annually in equal amounts over a four-year period, and all stock options have an exercise price equal to the fair market value of our common stock on the date of grant. Generally, we recognize compensation expense for awards on a straight-line basis over the four-year vesting period. However, in certain circumstances under our share-based compensation plans, we allow for the vesting of team member awards to continue post-employment. Accordingly, for awards granted subsequent to our adoption of SFAS 123(R) and to the extent the team member meets certain age and service requirements on the date of grant, we accelerate expense recognition such that the value of the award is fully expensed over the team member's minimum service period instead of over the explicit vesting period. Awards granted prior to the adoption of SFAS 123(R) continue to be expensed over the explicit vesting period. Information related to share-based awards is disclosed in Note 26.
Derivative Financial Instruments Derivative financial instruments are carried at fair value on the balance sheet. Our derivative instruments are primarily interest rate swaps that hedge the fair value of certain debt by effectively converting interest from a fixed rate to a floating rate. These instruments qualify for hedge accounting, and the associated assets and liabilities are recorded in the Consolidated Statements of Financial Position. The changes in market value of an interest rate swap, as well as the offsetting change in market value of the hedged debt, are recognized within earnings in the current period. Ineffectiveness would result when changes in the market value of the hedged debt are not completely offset by changes in the market value of the interest rate swap. There was no ineffectiveness recognized in 2006, 2005, or 2004 related to these instruments. Further information related to interest rate swaps is disclosed in Note 21.
During 2006, we entered into an interest rate forward contract in order to offset a portion of our exposure to our workers' compensation and general liability obligations, which are recorded on a discounted basis. This instrument has not been designated as an accounting hedge.
Nearly all of our inventory purchases are in U.S. dollars; therefore, we have immaterial foreign currency hedging activities.
Additionally, see the description of our prepaid forward contracts in Note 27.
2. Revenues
Our retail stores record revenue at the point of sale. Sales from our on-line business include shipping revenue and are recorded upon delivery to the guest. Total revenues do not include sales tax as we consider ourselves a pass through conduit for collecting and remitting sales taxes. Generally, guests may return merchandise within 90 days of purchase. Revenues are recognized net of expected returns, which we estimate using historical return patterns. Commissions earned on sales generated by leased departments are included within sales and were $15 million in 2006, $14 million in 2005 and $14 million in 2004.
Revenue from gift card sales is recognized upon redemption of the gift card. Our gift cards do not have expiration dates. Based on historical redemption rates, a small and relatively stable percentage of gift cards will never be redeemed, referred to as "breakage." Estimated breakage revenue is recognized over a period of time in proportion to actual gift card redemptions and was immaterial in 2006, 2005 and 2004.
Credit card revenues are recognized according to the contractual provisions of each applicable credit card agreement. When accounts are written-off, uncollected finance charges and late fees are recorded as a reduction of credit card revenues. Target retail store sales charged to our credit cards totaled $3,961 million, $3,655 million and $3,269 million in 2006, 2005, and 2004, respectively. We offer new account discounts and rewards programs on our REDcard products. These discounts are redeemable only on purchases made at Target. The discounts associated with our REDcard products are included as reductions in sales in our Consolidated Statements of Operations and were $104 million, $97 million and $80 million in 2006, 2005 and 2004, respectively.
3. Cost of Sales and Selling, General and Administrative Expenses
The following illustrates the primary costs classified in each major expense category:
|
Cost of Sales
| | Selling, General and Administrative Expenses
|
|---|
|
Total cost of products sold including:
• Freight expenses associated with moving merchandise from our vendors to our distribution centers and our retail stores, and among our distribution and retail facilities
• Vendor income that is not reimbursement of specific, incremental and identifiable costs
Inventory shrink
Markdowns
Shipping and handling expenses
Terms cash discount | | Compensation and benefit costs including:
• Stores
• Headquarters, including buying and merchandising
• Distribution operations
Occupancy and operating costs of retail, distribution and headquarters facilities
Advertising, offset by vendor income that is a reimbursement of specific, incremental and identifiable costs
Pre-opening costs of stores and other facilities
Other administrative costs |
|
The classification of these expenses varies across the retail industry.
Compensation, benefits and other expenses for buying, merchandising and distribution operations classified in selling, general and administrative expenses were approximately $1,274 million, $1,133 million and $980 million for 2006, 2005 and 2004, respectively.
4. Consideration Received from Vendors
We receive consideration for a variety of vendor-sponsored programs, such as volume rebates, markdown allowances, promotions and advertising and for our compliance programs, referred to as "vendor income." Vendor income reduces either our inventory costs or selling, general and administrative expenses based on the provisions of the arrangement. Promotional and advertising allowances are intended to offset our costs of promoting and selling the vendor's merchandise in our stores. Under our compliance programs, vendors are charged for merchandise shipments that do not meet our requirements ("violations"), such as late or incomplete shipments. These allowances are recorded when violations occur.
We establish a receivable for vendor income that is earned but not yet received. Based on provisions of the agreements in place, this receivable is computed by estimating the point at which we have completed our performance and the amount earned. We perform detailed analyses to determine the appropriate level of the receivable in the aggregate. The majority of year-end receivables associated with these activities are collected within the following fiscal quarter.
5. Advertising Costs
Advertising costs are expensed at first showing or distribution of the advertisement and were $1,170 million, $1,028 million, and $888 million for 2006, 2005 and 2004, respectively. Advertising vendor income that offset advertising expenses was approximately $118 million, $110 million, and $72 million for 2006, 2005 and 2004, respectively. Newspaper circulars and media broadcast made up the majority of our advertising costs in all three years.
6. Discontinued Operations
We completed the sale of our Marshall Field's and Mervyn's businesses during 2004, and the financial results of Marshall Field's and Mervyn's are reported as discontinued operations. For 2004, total revenues included in discontinued operations were $3,095 million, and earnings from discontinued operations were $75 million, net of taxes of $46 million. In addition, we recorded a gain on the sale of discontinued operations of $1,238 million, net of taxes of $761 million, during 2004. There were no assets or liabilities of Marshall Field's or Mervyn's included in our Consolidated Statements of Financial Position at February 3, 2007 or January 28, 2006.
7. Earnings per Share
Basic earnings per share (EPS) is net earnings divided by the weighted average number of common shares outstanding during the period. Diluted EPS includes the incremental shares assumed to be issued upon the exercise of stock options and the incremental shares assumed to be issued under performance share and restricted stock unit arrangements.
|
| | Basic EPS
| | Diluted EPS
|
|---|
(millions, except per share data)
| | 2006
| | 2005
| | 2004
| | 2006
| | 2005
| | 2004
|
|---|
|
| Net earnings | | $2,787 | | $2,408 | | $3,198 | | $2,787 | | $2,408 | | $3,198 |
| Basic weighted average common shares outstanding | | 861.9 | | 882.0 | | 903.8 | | 861.9 | | 882.0 | | 903.8 |
| Incremental stock options, performance share units and restricted stock units | | — | | — | | — | | 6.7 | | 7.2 | | 8.3 |
|
| Weighted average common shares outstanding | | 861.9 | | 882.0 | | 903.8 | | 868.6 | | 889.2 | | 912.1 |
|
| Earnings per share | | $3.23 | | $2.73 | | $3.54 | | $3.21 | | $2.71 | | $3.51 |
|
For the 2006, 2005 and 2004 EPS computations, 1.8 million, 4.4 million and 1.0 million stock options, respectively, were excluded from the calculation of weighted average shares for diluted EPS because their effects were antidilutive.
8. Other Comprehensive Income/(Loss)
Other comprehensive income/(loss) includes revenues, expenses, gains and losses that are excluded from net earnings under GAAP and are recorded directly to shareholders' investment. In 2006, 2005 and 2004, other comprehensive income/(loss) included gains and losses on certain hedge transactions and the change in our minimum pension liability, net of related taxes. These amounts were not material in any year presented.
9. Cash Equivalents
Cash equivalents include highly liquid investments with an original maturity of three months or less from the time of purchase. We carry these investments at cost, which approximates market value. These investments were $281 million and $1,172 million at February 3, 2007 and January 28, 2006, respectively. Also included in cash equivalents are proceeds due from credit and debit card transactions with settlement terms of less than five days. Credit and debit card receivables included within cash equivalents were $355 million and $290 million at February 3, 2007 and January 28, 2006, respectively.
10. Accounts Receivable
Accounts receivable are recorded net of an allowance for expected losses. The allowance, recognized in an amount equal to the anticipated future write-offs, was $517 million at February 3, 2007 and $451 million at January 28, 2006. We estimate future write-offs based on delinquencies, risk scores, aging trends, industry risk trends and our historical experience. Substantially all accounts continue to accrue finance charges until they are written off. Total accounts receivable past due ninety days or more and still accruing finance charges were $236 million at February 3, 2007 and $174 million at January 28, 2006. Accounts are written off when they become 180 days past due.
As a method of providing funding for our accounts receivable, we sell on an ongoing basis all of our consumer credit card receivables to Target Receivables Corporation (TRC), a wholly-owned bankruptcy remote subsidiary. TRC then transfers the receivables to the Target Credit Card Master Trust (the Trust), which from time to time will sell debt securities to third parties either directly or through a related trust. These debt securities represent undivided interests in the Trust assets. The servicer of the receivables, Target National Bank, a wholly-owned subsidiary of Target, holds a 2 percent undivided interest in the Trust assets. In addition, TRC retains an undivided interest in the Trust assets that is not represented by either the debt securities sold to third parties or the 2 percent held by Target National Bank. TRC uses the proceeds from the sale of debt securities and its share of collections on the receivables to pay the purchase price of the receivables to Target.
The accounting guidance for such transactions, SFAS No. 140, "Accounting for Transfers and Servicing of Financial Assets and Extinguishments of Liabilities (a replacement of SFAS No. 125)," requires the inclusion of the receivables within the Trust and any debt securities issued by the Trust, or a related trust, in our Consolidated Statements of Financial Position. Notwithstanding this accounting treatment, the receivables transferred to the Trust are not available to general creditors of Target. Upon termination of the securitization program and repayment of all debt securities issued from time to time by the Trust, or a related trust, any remaining assets could be distributed to Target in a liquidation of TRC.
11. Inventory
Substantially all of our inventory and the related cost of sales are accounted for under the retail inventory accounting method (RIM) using the last-in, first-out (LIFO) method. Inventory is stated at the lower of LIFO cost or market. Cost includes purchase price as adjusted for vendor income. Inventory is also reduced for estimated losses related to shrink and markdowns. The LIFO provision is calculated based on inventory levels, markup rates and internally measured retail price indices. At February 3, 2007 and January 28, 2006, our inventories valued at LIFO approximate those inventories as if they were valued at FIFO.
Under RIM, the valuation of inventory at cost and the resulting gross margins are calculated by applying a cost-to-retail ratio to the retail value inventory. RIM is an averaging method that has been widely used in the retail industry due to its practicality. The use of RIM will result in inventory being valued at the lower of cost or market since permanent markdowns are currently taken as a reduction of the retail value of inventory.
We routinely enter into arrangements with certain vendors whereby we do not purchase or pay for merchandise until the merchandise is ultimately sold to a guest. Revenues under this program are included in sales in the Consolidated Statements of Operations, but the merchandise received under the program is not included in inventory in our Consolidated Statements of Financial Position because of the virtually simultaneous timing of our purchase and sale of this inventory. Sales made under these arrangements totaled $1,178 million, $872 million and $357 million for 2006, 2005 and 2004, respectively.
12. Other Current Assets
|
(millions)
| | February 3,
2007
| | January 28,
2006
|
|---|
|
| Deferred taxes | | $427 | | $344 |
| Vendor income receivable | | 285 | | 277 |
| Other receivables(a) | | 278 | | 283 |
| Other | | 455 | | 349 |
|
| Total | | $1,445 | | $1,253 |
|
- (a)
- Other receivables relate primarily to pharmacy receivables and merchandise sourcing services provided to third parties.
13. Property and Equipment
Property and equipment are recorded at cost, less accumulated depreciation. Depreciation is computed using the straight-line method over estimated useful lives or lease term if shorter. We amortize leasehold improvements purchased after the beginning of the initial lease term over the shorter of the assets' useful lives or a term that includes the original lease term plus any renewals that are reasonably assured at the date the leasehold improvements are purchased. Depreciation expense for 2006, 2005 and 2004 was $1,509 million, $1,384 million and $1,232 million, respectively. For income tax purposes, accelerated depreciation methods are generally used. Repair and maintenance costs are expensed as incurred and were $532 million, $474 million and $453 million in 2006, 2005 and 2004, respectively. Pre-opening costs of stores and other facilities, including supplies, payroll and other start-up costs for store and other facility openings, are expensed as incurred.
Estimated useful lives by major asset category are:
|
Asset
| | Life (in years)
|
|---|
|
| Buildings and improvements | | 8-39 |
| Fixtures and equipment | | 3-15 |
| Computer hardware and software | | 4 |
|
Long-lived assets are reviewed for impairment annually and also when events or changes in circumstances indicate that the asset's carrying value may not be recoverable. No material impairments were recorded in 2006, 2005 or 2004 as a result of the tests performed.
14. Other Non-Current Assets
|
(millions)
| | February 3,
2007
| | January 28,
2006
|
|---|
|
| Cash value of life insurance(a) | | $559 | | $524 |
| Prepaid pension expense(b) | | 325 | | 752 |
| Goodwill and intangible assets | | 212 | | 183 |
| Other | | 116 | | 93 |
|
| Total | | $1,212 | | $1,552 |
|
- (a)
- Company-owned life insurance policies on approximately 3,000 team members who are designated highly-compensated under the Internal Revenue Code and have given their consent to be insured.
- (b)
- Prepaid pension expense at February 3, 2007 includes the effect of our adoption of SFAS No. 158, "Employers' Accounting for Defined Benefit Pension and Other Postretirement Plans, an amendment of FASB Statements No. 87, 88, 106, and 132(R)." Refer to Note 28 for more details.
15. Goodwill and Intangible Assets
Goodwill and intangible assets are recorded within other non-current assets at cost less accumulated amortization. Goodwill and intangible assets by major classes were:
| |
| | Goodwill
| | Leasehold acquisition costs
| | Other(a)
| | Total
| |
|---|
(millions)
| | Feb. 3,
2007
| | Jan. 28,
2006
| | Feb. 3,
2007
| | Jan. 28,
2006
| | Feb. 3,
2007
| | Jan. 28,
2006
| | Feb. 3,
2007
| | Jan. 28,
2006
| |
|---|
| |
| Gross asset | | $80 | | $80 | | $187 | | $182 | | $173 | | $205 | | $440 | | $467 | |
| Accumulated amortization | | (20 | ) | (20 | ) | (47 | ) | (70 | ) | (161 | ) | (194 | ) | (228 | ) | (284 | ) |
| |
| Net goodwill and intangible assets | | $60 | | $60 | | $140 | | $112 | | $12 | | $11 | | $212 | | $183 | |
| |
- (a)
- Other intangible assets relate primarily to acquired trade names and customer lists.
Amortization is computed on intangible assets with definite useful lives using the straight-line method over estimated useful lives that range from three to 39 years. During 2006, we adjusted the period over which we amortize leasehold acquisition costs to match the expected terms for individual leases resulting in a cumulative benefit to amortization expense of approximately $28 million. Amortization expense for 2006, 2005 and 2004 was $(13) million, $25 million and $27 million, respectively. The estimated aggregate amortization expense of our definite-lived intangible assets for each of the five succeeding fiscal years is:
|
(millions)
| | 2007
| | 2008
| | 2009
| | 2010
| | 2011
|
|---|
|
| Amortization expense | | $13 | | $12 | | $10 | | $9 | | $9 |
|
Goodwill is not amortized. Instead, it is subject to an annual impairment test. Discounted cash flow models are used in determining fair value for the purposes of the required annual impairment analysis. No material impairments were recorded in 2006, 2005 or 2004 as a result of the tests performed.
16. Accounts Payable
We reclassify book overdrafts to accounts payable at period end. At February 3, 2007 and January 28, 2006, $652 million and $645 million of such overdrafts, respectively, were reclassified to accounts payable.
17. Accrued Liabilities
|
(millions)
| | February 3,
2007
| | January 28,
2006
|
|---|
|
| Wages and benefits | | $674 | | $602 |
| Taxes payable (a) | | 450 | | 366 |
| Gift card liability (b) | | 338 | | 294 |
| Workers' compensation and general liability (c) | | 154 | | 142 |
| Other | | 1,142 | | 789 |
|
| Total | | $2,758 | | $2,193 |
|
- (a)
- Taxes payable consist of real estate, team member withholdings and sales tax liabilities.
- (b)
- Gift card liability represents the amount of gift cards that have been issued but have not been redeemed, net of estimated breakage.
- (c)
- The non-current portion of our liability for workers' compensation and general liability claims is shown in Note 24.
18. Commitments and Contingencies
At February 3, 2007, our obligations included notes and debentures of $9,897 million (further described in Note 19), excluding swap fair market value adjustments. At February 3, 2007, capital lease obligations were $249 million and total future minimum payments of operating leases were $3,325 million. The amount of future contractual lease payments includes certain options for lease term extension that are reasonably assured of being exercised in the amount of $1,631 million, and $188 million of legally binding minimum lease payments for stores that will open in 2007 or later (see additional detail in Note 22). Deferred compensation obligations were $691 million at February 3, 2007. In addition, real estate obligations, including commitments for the purchase, construction or remodeling of real estate and facilities, were approximately $1,106 million at February 3, 2007.
Purchase obligations, which include all legally binding contracts such as firm commitments for inventory purchases, merchandise royalties, purchases of equipment, marketing-related contracts, software acquisition/license commitments and service contracts, were approximately $1,613 million at February 3, 2007. We issue inventory purchase orders, which represent authorizations to purchase that are cancelable by their terms. We do not consider purchase orders to be firm inventory commitments. We also issue trade letters of credit in the ordinary course of business, which are not firm commitments as they are conditional on the purchase order not being cancelled. If we choose to cancel a purchase order, we may be obligated to reimburse the vendor for unrecoverable outlays incurred prior to cancellation under certain circumstances.
Trade letters of credit totaled $1,830 million at February 3, 2007, a portion of which is in accounts payable. Standby letters of credit, relating primarily to retained risk on our insurance claims, totaled $81 million at February 3, 2007.
The terms of a significant portion of the Visa/MasterCard antitrust litigation settlement were finalized during the third quarter of 2005. As a result, we recorded a $27 million ($.02 per share) gain in the third quarter of 2005 for our share of the proceeds, which we received during the second quarter of 2006. We also expect to receive an additional, smaller payment; however, the amount and timing of that payment are not certain at this time. Accordingly, no additional gain has been recorded as of February 3, 2007.
We are exposed to claims and litigation arising in the ordinary course of business and use various methods to resolve these matters in a manner that we believe serves the best interest of our shareholders and other constituents. We believe the recorded reserves in our consolidated financial statements are adequate in light of the probable and estimable liabilities. We do not believe that any of the currently identified claims or litigation matters will have a material adverse impact on our results of operations, cash flows or financial condition.
19. Notes Payable and Long-Term Debt
We obtain short-term financing throughout the year under our commercial paper program, a form of notes payable. Information on this program is as follows:
|
Commercial Paper
(dollars in millions)
| | 2006
| | 2005
|
|---|
|
| Maximum outstanding during the year | | $957 | | $994 |
| Average amount outstanding during the year | | $273 | | $77 |
| Outstanding at year-end | | $— | | $— |
| Weighted average interest rate | | 5.3% | | 4.0% |
|
At February 3, 2007, a committed unsecured credit facility totaling $1.6 billion was in place through a group of banks at specified rates and is scheduled to expire in June 2010. No balances were outstanding at any time during 2006 or 2005 under this or previously existing revolving credit facilities.
In 2006 we issued $750 million of long-term debt at 5.875 percent maturing in 2016. Concurrent with the issuance of this debt, we entered into two interest rate swaps, the details of which are disclosed in Note 21. In September 2006, TRC issued $500 million of Variable Funding Certificates (Certificates) backed by credit card receivables through the Target Credit Card Master Trust. At February 3, 2007, the outstanding amount of the Certificates was $100 million.
In November 2005 TRC issued to the public, through the Target Credit Card Owner Trust 2005-1, $900 million of debt backed by credit card receivables. This issue of receivable-backed securities had an expected initial maturity of five years and a floating interest rate set at 1-month LIBOR plus 0.06 percent. Refer to Note 10 for further description of our accounts receivable financing program.
The total amount of debt backed by credit card receivables held in the Target Credit Card Master Trust or related trusts was $1,750 million at February 3, 2007 and $1,650 million at January 28, 2006.
In 2004, we called or repurchased $542 million of long-term debt with an average remaining life of 24 years and a weighted average interest rate of 7.0 percent, resulting in a pre-tax loss of $89 million (approximately $.06 per share), reflected in net interest expense. We did not repurchase any significant amount of long-term debt during 2006 or 2005.
The carrying value of our debt portfolio, including swap valuation adjustments for our fair value hedges, was as follows:
| |
| | February 3, 2007
| | January 28, 2006
| |
|---|
Long-Term Debt
(dollars in millions)
| |
|---|
| | Rate (a)
| | Balance
| | Rate (a)
| | Balance
| |
|---|
| |
| Notes and debentures: | | | | | | | | | |
| | Due 2006-2010 | | 6.2 | % | $5,824 | | 5.7 | % | $6,480 | |
| | Due 2011-2015 | | 5.6 | | 1,637 | | 5.6 | | 1,636 | |
| | Due 2016-2020 | | 5.8 | | 1,078 | | 6.4 | | 307 | |
| | Due 2021-2025 | | 9.0 | | 120 | | 9.0 | | 119 | |
| | Due 2026-2030 | | 6.7 | | 326 | | 6.7 | | 325 | |
| | Due 2031-2036 | | 6.6 | | 905 | | 6.6 | | 904 | |
| |
| Total notes and debentures (b) | | 6.1 | % | 9,890 | | 5.9 | % | 9,771 | |
| Capital lease obligations and other | | | | 147 | | | | 101 | |
| Less: current portion | | | | (1,362 | ) | | | (753 | ) |
| |
| Long-term debt | | | | $8,675 | | | | $9,119 | |
| |
- (a)
- Reflects the weighted average stated interest rate as of year-end, including the impact of interest rate swaps.
- (b)
- The estimated fair value of total notes and debentures, excluding swap valuation adjustments, using a discounted cash flow analysis based on our incremental interest rates for similar types of financial instruments, was $10,058 million at February 3, 2007 and $10,229 million at January 28, 2006. See Note 21 for the estimated fair value of our interest rate swaps.
Required principal payments on notes and debentures over the next five years, excluding capital lease obligations and fair market value adjustments recorded in long-term debt, are:
|
(millions)
| | 2007
| | 2008
| | 2009
| | 2010
| | 2011
|
|---|
|
| Required principal payments | | $1,355 | | $1,517 | | $751 | | $2,236 | | $107 |
|
Most of our long-term debt obligations contain covenants related to secured debt levels. In addition, our credit facility contains a debt leverage covenant. We are, and expect to remain, in compliance with these covenants.
20. Net Interest Expense
| |
(millions)
| | 2006
| | 2005
| | 2004
| |
|---|
| |
| Interest expense on debt | | $635 | | $524 | | $509 | |
| Interest expense on capital leases | | 11 | | 8 | | 9 | |
| Loss on debt repurchase | | — | | — | | 89 | |
| Capitalized interest | | (49 | ) | (42 | ) | (18 | ) |
| Interest income | | (25 | ) | (27 | ) | (19 | ) |
| |
| Net interest expense | | $572 | | $463 | | $570 | |
| |
21. Derivative Financial Instruments
At February 3, 2007 and January 28, 2006, interest rate swaps were outstanding in notional amounts totaling $3,725 million and $3,300 million, respectively. The increase in swap exposure was executed to manage our mix of fixed-rate debt and floating-rate debt.
During 2006, we entered into three interest rate swaps with notional amounts of $225 million, $500 million and $250 million. During 2005, we entered into four interest rate swaps with notional amounts of $250 million, $350 million, $325 million and $225 million. In 2005 we also terminated an interest rate swap with a notional amount of $200 million, resulting in a gain of $24 million that will be amortized into net interest expense over the then remaining 13-year life of the hedged debt. In 2006, 2005 and 2004, the total net gains amortized into net interest expense for terminated swaps were $9 million, $8 million and $7 million, respectively.
| |
Interest Rate Swaps
(dollars in millions)
| |
| |
| |
| |
| |
| |
|---|
| |
| | Notional Amount Outstanding at
| |
| | Pay Floating Rate at(a)
| |
|---|
Maturity(b)
| | Feb. 3, 2007
| | Jan. 28, 2006
| | Receive Fixed
| | Feb. 3, 2007
| | Jan. 28, 2006
| |
|---|
| |
| May 2006 | | $— | | $550 | | 4.6 | % | — | | 4.8 | % |
| Mar. 2008 | | 250 | | 250 | | 3.9 | | 5.3 | % | 4.4 | |
| Mar. 2008 | | 250 | | 250 | | 3.8 | | 5.3 | | 4.4 | |
| Oct. 2008 | | 500 | | 500 | | 4.4 | | 5.4 | | 4.8 | |
| Oct. 2008 | | 250 | | 250 | | 3.8 | | 5.3 | | 4.4 | |
| Nov. 2008 | | 200 | | 200 | | 3.9 | | 5.3 | | 4.4 | |
| Jun. 2009 | | 400 | | 400 | | 4.4 | | 5.3 | | 4.8 | |
| Jun. 2009 | | 350 | | 350 | | 4.2 | | 5.3 | | 4.5 | |
| Aug. 2010 | | 325 | | 325 | | 4.8 | | 5.3 | | 4.5 | |
| Aug. 2010 | | 225 | | 225 | | 4.5 | | 5.3 | | 4.5 | |
| Jan. 2011 | | 225 | | — | | 5.5 | | 5.3 | | — | |
| Jul. 2016 | | 500 | | — | | 5.7 | | 5.3 | | — | |
| Jul. 2016 | | 250 | | — | | 5.7 | | 5.3 | | — | |
| |
| | | $3,725 | | $3,300 | | | | | | | |
| |
- (a)
- Reflects the year end floating interest rate.
- (b)
- The weighted average life of the interest rate swaps was approximately 3.7 years at February 3, 2007.
The market value of outstanding interest rate swaps and net unamortized gains/(losses) from terminated interest rate swaps was $(7) million and $(21) million at February 3, 2007 and January 28, 2006, respectively. No ineffectiveness was recognized related to these instruments in 2006, 2005 or 2004.
During 2006, we entered into an interest rate forward contract with a $300 million notional amount to offset a portion of the interest rate exposure on our discounted workers' compensation and general liability obligations. See Note 17 and Note 24 for details of our workers' compensation and general liability accruals.
22. Leases
We lease certain retail locations, warehouses, distribution centers, office space, equipment and land. Assets held under capital lease are included in property and equipment. Operating lease rentals are expensed on a straight-line basis over the life of the lease. At the inception of a lease, we determine the lease term by assuming the exercise of those renewal options that are reasonably assured because of the significant economic penalty that exists for not exercising those options. The exercise of lease renewal options is at our sole discretion. The expected lease term is used to determine whether a lease is capital or operating and is used to calculate straight-line rent expense. Additionally, the useful life of buildings and leasehold improvements are limited by the expected lease term.
Rent expense on buildings, included in selling, general and administrative expenses, includes rental payments based on a percentage of retail sales over contractual levels for certain stores. Total rent expense was $158 million in 2006, $154 million in 2005 and $240 million in 2004, including percentage rent expense of $5 million in 2006, $5 million in 2005 and $3 million in 2004. We adjusted our method of accounting for leases related to a specific category of owned store locations on leased land, resulting in a non-cash adjustment primarily attributable to an increase in the straight-line rent accrual of $65 million ($.04 per share) in the fourth quarter of 2004. Certain leases require us to pay real estate taxes, insurance, maintenance and other operating expenses associated with the leased premises. These expenses are classified in selling, general and administrative expenses consistent with similar costs for owned locations. Most long-term leases include one or more options to renew, with renewal terms that can extend the lease term from one to more than 50 years. Certain leases also include options to purchase the leased property.
Future minimum lease payments required under noncancelable lease agreements existing at February 3, 2007 were:
| |
Future Minimum Lease Payments
(millions)
| | Operating Leases
| | Capital Leases
| |
|---|
| |
| 2007 | | $142 | | $15 | |
| 2008 | | 136 | | 15 | |
| 2009 | | 130 | | 15 | |
| 2010 | | 122 | | 16 | |
| 2011 | | 113 | | 16 | |
| After 2011 | | 2,682 | | 172 | |
| |
| Total future minimum lease payments | | 3,325 | (a) | 249 | |
| Less: Interest(b) | | | | (126 | ) |
| |
| Present value of minimum capital lease payments | | | | $123 | (c) |
| |
- (a)
- Total contractual lease payments include $1,631 million related to options to extend lease terms that are reasonably assured of being exercised and also includes $188 million of legally binding minimum lease payments for stores that will open 2007 or later.
- (b)
- Calculated using the interest rate at inception for each lease.
- (c)
- Includes current portion of $3 million.
23. Income Taxes
We account for income taxes under the asset and liability method. We have recognized deferred tax assets and liabilities for the estimated future tax consequences attributable to differences between the financial statement carrying amounts of existing assets and liabilities and their respective tax bases. Deferred tax assets and liabilities are measured using enacted income tax rates in effect for the year the temporary differences are expected to be recovered or settled. Tax rate changes affecting deferred tax assets and liabilities are recognized in income at the enactment date. In the Consolidated Statements of Financial Position, the current deferred tax asset balance is the net of all current deferred tax assets and current deferred tax liabilities. The non-current deferred tax liability is the net of all non-current deferred tax assets and non-current deferred tax liabilities.
To determine our quarterly provision for income taxes we use annual effective tax rates based on expected annual income and statutory tax rates, adjusted for discrete tax events that occur during the quarter.
Reconciliation of tax rates is as follows:
| |
Tax Rate Reconciliation
| | 2006
| | 2005
| | 2004
| |
|---|
| |
| Federal statutory rate | | 35.0 | % | 35.0 | % | 35.0 | % |
| State income taxes, net of federal tax benefit | | 4.0 | | 3.3 | | 3.3 | |
| Other | | (1.0 | ) | (0.7 | ) | (0.5 | ) |
| |
| Effective tax rate | | 38.0 | % | 37.6 | % | 37.8 | % |
| |
The components of the provision for income taxes were:
|
Provision for Income Taxes: Expense (Benefit)
(millions)
| | 2006
| | 2005
| | 2004
|
|---|
|
| Current | | | | | | |
| | Federal | | $1,627 | | $1,361 | | $908 |
| | State/other | | 284 | | 213 | | 144 |
|
| | | 1,911 | | 1,574 | | 1,052 |
|
| Deferred | | | | | | |
| | Federal | | (174 | ) | (110 | ) | 83 |
| | State/other | | (27 | ) | (12 | ) | 11 |
|
| | | (201 | ) | (122 | ) | 94 |
|
| Total | | $1,710 | | $1,452 | | $1,146 |
|
The components of the net deferred tax asset/(liability) were:
| |
Net Deferred Tax Asset/(Liability)
(millions)
| | February 3,
2007
| | January 28,
2006
| |
|---|
| |
| Gross deferred tax assets | | | | | |
| | Accrued and deferred compensation | | $466 | | $399 | |
| | Self-insured claims | | 238 | | 217 | |
| | Allowance for doubtful accounts | | 191 | | 167 | |
| | Inventory | | 13 | | 1 | |
| | Postretirement health care obligation | | 39 | | 39 | |
| | Other | | 179 | | 151 | |
| |
| | | 1,126 | | 974 | |
| |
| Gross deferred tax liabilities | | | | | |
| | Property and equipment | | (1,041 | ) | (1,080 | ) |
| | Pension | | (100 | ) | (287 | ) |
| | Deferred credit card income | | (119 | ) | (103 | ) |
| | Other | | (16 | ) | (11 | ) |
| |
| | | (1,276 | ) | (1,481 | ) |
| |
| Total | | $(150 | ) | $(507 | ) |
| |
The change in the 2006 year end deferred tax balance includes the effect of adopting SFAS No. 158, "Employers' Accounting for Defined Benefit Pension and Other Postretirement Plans, an amendment of FASB Statements No. 87, 88, 106, and 132(R)," in addition to the annual provision for deferred income tax expense.
During the year ended January 29, 2005, $566 million of the proceeds attributable to the real properties sold in the Marshall Field's and Mervyn's dispositions were used to acquire replacement properties that are being used in our business. $373 million of the gain related to the sold real properties was deferred for income tax purposes as allowed by Section 1031 of the Internal Revenue Code until the replacement properties are disposed.
In 2006 the Financial Accounting Standards Board (FASB) issued FASB Interpretation No. 48 (FIN 48). FIN 48 prescribes the financial statement recognition and measurement criteria for tax positions taken in a tax return, clarifies when tax benefits should be recorded and how they should be classified in financial statements, and requires certain disclosures of uncertain tax matters. We will adopt the provisions of FIN 48 at the beginning of fiscal 2007. We are presently evaluating the impact of the adoption of FIN 48 on our results of operations and financial position.
24. Other Non-Current Liabilities
|
(millions)
| | February 3,
2007
| | January 28,
2006
|
|---|
|
| Deferred compensation | | $645 | | $596 |
| Workers' compensation and general liability | | 418 | | 362 |
| Other | | 284 | | 274 |
|
| Total | | $1,347 | | $1,232 |
|
We retain a substantial portion of the risk related to certain general liability and workers' compensation claims. Liabilities associated with these losses include estimates of both claims filed and losses incurred but not yet reported. We estimate our ultimate cost based on analysis of historical data and actuarial estimates. General liability and workers' compensation liabilities are recorded at our estimate of their net present value.
25. Share Repurchase
In June 2004, our Board of Directors authorized the repurchase of $3 billion of our common stock. In November 2005, our Board increased the aggregate authorization by $2 billion, for a total authorization of $5 billion. Share repurchases for the last three years, repurchased primarily through open market transactions, were as follows:
|
Share Repurchases
(millions, except per share data)
| | Total Number of
Shares Purchased
| | Average Price
Paid per Share
| | Total Investment
|
|---|
|
| 2004 | | 28.4 | | $44.77 | | $1,276 |
| 2005 | | 23.1 | | $51.88 | | $1,197 |
| 2006 | | 19.5 | | $50.16 | | $977 |
|
| Total program-to-date | | 71.0 | | $48.56 | | $3,450 |
|
Of the shares reacquired in 2006, a portion was delivered upon settlement of prepaid forward contracts. The prepaid forward contracts settled in 2006 had a total cash investment of $76 million and an aggregate market value of $88 million at their respective settlement dates. The prepaid forward contracts settled in 2005 had a total cash investment of $65 million and an aggregate market value of $79 million at their respective settlement dates. The prepaid forward contracts settled in 2004 had a total cash investment of $17 million and an aggregate market value of $21 million at their respective settlement dates. These contracts are among the investment vehicles used to reduce our economic exposure related to our nonqualified deferred compensation plans. The details of our long positions in prepaid forward contracts have been provided in Note 27.
26. Share-Based Compensation
We maintain a long-term incentive plan for key team members and non-employee members of our Board of Directors. Our long-term incentive plan allows us to grant equity-based compensation awards, including stock options, performance share unit awards, restricted stock unit awards, or a combination of awards. A majority of granted awards are nonqualified stock options that vest annually in equal amounts over a four-year period and expire no later than 10 years after the grant date. Options granted to the non-employee members of our Board of Directors become exercisable after one year and have a 10-year term. We have issued performance share or performance share unit awards annually since January 2003. These awards represent shares potentially issuable in the future based upon the attainment of performance criteria including compound annual growth rates in revenue and EPS. In 2006, we issued restricted stock units with three-year cliff vesting to our executive officers other than our chief executive officer. We also issued restricted stock and restricted stock units to our Board of Directors. The number of unissued common shares reserved for future grants under the share-based compensation plans was 42,974,387 at February 3, 2007 and 47,659,572 at January 28, 2006.
|
Share-Based Compensation Awards
| |
| |
| |
|
|---|
| | Stock Options
| |
| |
|
|---|
| | Total Outstanding
| | Currently Exercisable
| |
| |
|
|---|
(number of options and shares in thousands)
| |
| |
|
|---|
| | Number
of Options
| | Exercise
Price (a)
| | Intrinsic
Value (b)
| | Number
of Options
| | Exercise
Price (a)
| | Intrinsic
Value (b)
| | Performance
Share Units
| | Restricted
Stock Units
|
|---|
|
| January 31, 2004 | | 36,159 | | $28.28 | | $363 | | 23,689 | | $24.48 | | $326 | | 1,125 | (c) | |
| Granted | | 4,072 | | 49.12 | | | | | | | | | | 629 | (d) | |
| Canceled/forfeited | | (513 | ) | 35.32 | | | | | | | | | | (73 | ) | |
| Exercised | | (7,727 | ) | 20.95 | | | | | | | | | | (73 | ) | |
|
| January 29, 2005 | | 31,991 | | $32.59 | | $540 | | 22,102 | | $28.79 | | $458 | | 1,608 | | |
| Granted | | 4,057 | | 53.94 | | | | | | | | | | 597 | (e) | |
| Canceled/forfeited | | (691 | ) | 40.67 | | | | | | | | | | (252 | ) | |
| Exercised | | (6,643 | ) | 26.58 | | | | | | | | | | — | | |
|
| January 28, 2006 | | 28,714 | | $36.82 | | $505 | | 19,229 | | $31.64 | | $438 | | 1,953 | | — |
| Granted | | 4,980 | | 56.84 | | | | | | | | | | 119 | (e) | 221 |
| Canceled/forfeited | | (607 | ) | 48.06 | | | | | | | | | | (177 | ) | — |
| Exercised | | (5,177 | ) | 27.08 | | | | | | | | | | — | | — |
|
| February 3, 2007 | | 27,910 | | $41.95 | | $558 | | 17,659 | | $35.32 | | $470 | | 1,895 | (f) | 221 |
|
- (a)
- Weighted average.
- (b)
- Represents stock price appreciation subsequent to the grant date, in millions.
- (c)
- Awards will be earned based on performance during four years ending February 3, 2007 and February 2, 2008.
- (d)
- Awards will be earned based on performance during three years ending February 2, 2008.
- (e)
- Awards will be earned based on performance during three years ending January 31, 2009.
- (f)
- Approximately 32 percent of these performance share units, if and when earned, will be paid in cash or deferred through a credit to the deferred compensation accounts of the participants in an amount equal to the value of any earned performance shares.
The Black-Scholes valuation model was used to estimate the fair value of the options at grant date based on the assumptions noted in the following table. Volatility represents an average of market quotes for implied volatility of 5.5-year options on Target common stock. The expected life is estimated based on analysis of options already exercised and any foreseeable trends or changes in behavior. The risk-free interest rate is an interpolation of the relevant U.S. Treasury security maturities as of each applicable grant date. The assumptions disclosed below represent a weighted average of the assumptions used for all of our stock option grants throughout the year.
|
Valuation of Share-Based Compensation
| | 2006
| | 2005
| | 2004
|
|---|
|
| Stock option valuation assumptions: | | | | | | |
| | Dividend yield | | 0.8% | | 0.7% | | 0.7% |
| | Volatility | | 23% | | 27% | | 22% |
| | Risk-free interest rate | | 4.7% | | 4.4% | | 3.8% |
| | Expected life in years | | 5.5 | | 5.5 | | 5.5 |
| Grant date weighted average fair value | | $16.52 | | $16.85 | | $13.10 |
| Performance share units grant date weighted average fair value | | $49.98 | | $53.96 | | $49.43 |
| Restricted stock units grant date weighted average fair value | | $57.60 | | — | | — |
| Compensation expense recognized in Statements of Operations (millions) | | $99 | | $93 | | $60 |
| | Related income tax benefit (millions) | | $39 | | $37 | | $23 |
| Compensation realized by team members upon option exercises (millions) | | $142 | | $180 | | $201 |
| | Related income tax benefit (millions) | | $56 | | $71 | | $77 |
|
As of February 3, 2007, there was $116 million of total unrecognized compensation expense related to nonvested stock options. That cost is expected to be recognized over a weighted average period of 1.5 years. The weighted average remaining life of currently exercisable options is 4.8 years, while total outstanding options have a weighted average remaining life of 6.3 years.
Holders of performance share units will receive shares of our common stock if we meet certain EPS and revenue growth targets and the holders also satisfy service-based vesting requirements. Compensation expense associated with outstanding performance share units is recorded over the life of the awards. The amount of expense recorded each period is dependent upon our estimate of the number of shares that will ultimately be issued and, for some awards, the current Target common stock price. Future compensation expense for currently outstanding awards could range from a credit of $76 million for previously recognized amounts up to a maximum of approximately $24 million of expense assuming full payout under all outstanding awards.
Total unrecognized compensation expense related to restricted stock unit awards was $12 million as of February 3, 2007.
27. Defined Contribution Plans
Team members who meet certain eligibility requirements can participate in a defined contribution 401(k) plan by investing up to 80 percent of their compensation, as limited by statute or regulation. Generally, we match 100 percent of each team member's contribution up to 5 percent of total compensation. Our contribution to the plan is initially invested in Target common stock. These amounts are free to be diversified by the team member immediately.
In addition, we maintain nonqualified, unfunded deferred compensation plans for approximately 4,900 current and retired team members whose participation in our 401(k) plan is limited by statute or regulation. These team members choose from a menu of crediting rate alternatives that are the same as the investment choices in our 401(k) plan, including Target common stock. Through the end of 2005, we credited an additional 2 percent per year to the accounts of all active participants, in part to recognize the risks inherent to their participation in a plan of this nature. Effective in 2006, the additional 2 percent per year was credited only to the accounts of active participants who were not executive officers. We also maintain a nonqualified, unfunded deferred compensation plan that was frozen during 1996, covering 15 current and 49 retired participants. In this plan deferred compensation earns returns tied to market levels of interest rates plus an additional 6 percent return, with a minimum of 12 percent and a maximum of 20 percent, as determined by the plan's terms.
We control some of our risk of offering the nonqualified plans through investing in vehicles, including prepaid forward contracts in our own common stock, that offset a substantial portion of our economic exposure to the returns of these plans. These investment vehicles are general corporate assets and are marked-to-market with the related gains and losses recognized in the Consolidated Statements of Operations in the period they occur. The total change in fair value for contracts indexed to our own common stock recorded in earnings was pre-tax income of $37 million in 2006, $7 million in 2005 and $29 million in 2004. During 2006, we invested approximately $111 million in such investment instruments, and these investments are included in the Consolidated Statement of Cash Flows within other investing activities. The counterparty to these contracts may deliver Target common shares or cash to us at the settlement dates at their discretion. At times, adjusting our position in these investment vehicles includes repurchasing shares of Target common stock, including shares delivered by counterparties when settling the forward contracts. In 2006, 2005 and 2004, these repurchases totaled 1.6 million, 1.5 million and 0.5 million shares, respectively, and are included in the total share repurchases disclosed in Note 25.
|
Prepaid Forward Contracts on Target Common Stock
(dollars in millions, except per share data)
| |
| |
|
|---|
|
| | Number of Shares
| |
| | Current Fair Value at
|
|---|
Settlement Date
| | February 3, 2007
| | January 28, 2006
| | Contract Price
per Share
| | February 3, 2007
| | January 28, 2006
|
|---|
|
| Nov. 2006 | | — | | 140,000 | | $41.70 | | $— | | $7 |
| Jan. 2007 | | — | | 165,025 | | 54.54 | | — | | 9 |
| Oct. 2007 | | 257,000 | | 257,000 | | 38.95 | | 16 | | 14 |
| Oct. 2007 | | 516,033 | | 516,033 | | 29.07 | | 32 | | 28 |
| Oct. 2007 | | 228,276 | | 228,276 | | 43.81 | | 14 | | 12 |
| Oct. 2007 | | 189,479 | | 189,479 | | 52.78 | | 12 | | 10 |
| Oct. 2007 | | 250,000 | | 250,000 | | 53.41 | | 15 | | 14 |
| Oct. 2007 | | 250,000 | | 250,000 | | 53.41 | | 15 | | 14 |
| Oct. 2007 | | 1,025,400 | | — | | 48.76 | | 64 | | — |
|
| | | 2,716,188 | | 1,995,813 | | | | $168 | | $108 |
|
| |
Defined Contribution Plan Expenses
(millions)
| | 2006
| | 2005
| | 2004
| |
|---|
| |
| 401(k) Defined Contribution Plan | | | | | | | |
| 401(k) matching contributions | | $141 | | $118 | | $118 | |
Nonqualified Deferred Compensation Plans |
|
|
|
|
|
|
|
| Benefits expense | | $98 | | $64 | | $63 | |
| Related investment income | | (68 | ) | (34 | ) | (40 | ) |
| |
| Nonqualified plan net expense | | $30 | | $30 | | $23 | |
| |
In 2005 and 2004, certain retired executives accepted our offer to exchange our obligation to them under certain frozen nonqualified plans for cash or deferrals in our current nonqualified deferred compensation plan. These exchange transactions resulted in expense of $7 million and $17 million, respectively. We expect lower future expenses as a result of these transactions. There were no such exchange transactions during 2006.
Expenses for Marshall Field's and Mervyn's team members are included in the table above to the extent we retained the related assets and obligations of their plans subsequent to the 2004 divestiture of those businesses.
28. Pension and Postretirement Health Care Benefits
We have qualified defined benefit pension plans covering all U.S. team members who meet age and service requirements. We also have unfunded nonqualified pension plans for team members with qualified plan compensation restrictions. Benefits are provided based on years of service and team member compensation. Upon retirement, team members also become eligible for certain health care benefits if they meet minimum age and service requirements and agree to contribute a portion of the cost.
In 2005, certain nonqualified pension and survivor benefits owed to current officers were exchanged for cash or deferrals in our current nonqualified deferred compensation plan, which resulted in expense of $11 million. The effect of these exchange transactions is included in the pension tables below. There were no such exchange transactions during 2006 or 2004.
In September 2006, the FASB issued SFAS No. 158, "Employers' Accounting for Defined Benefit Pension and Other Postretirement Plans, an amendment of FASB Statements No. 87, 88, 106, and 132(R)" (SFAS 158). SFAS 158 requires plan sponsors of defined benefit pension and other postretirement benefit plans (collectively postretirement benefit plans) to: recognize the funded status of their postretirement benefit plans in the statement of financial position, measure the fair value of plan assets and benefit obligations as of the date of the fiscal year-end statement of financial position and provide additional disclosures. On February 3, 2007, we adopted the recognition and disclosure provisions of SFAS 158. The effect of adopting SFAS 158 on our financial condition at February 3, 2007 has been included in the accompanying consolidated financial statements as described below. SFAS 158 did not have an effect on our consolidated financial condition at January 28, 2006 or January 29, 2005. SFAS 158's provisions regarding the change in the measurement date of postretirement benefit plans will require us to change our measurement date from October 31 to our fiscal year end date beginning with fiscal year 2008; however, we are currently evaluating whether we will early adopt the measurement date provisions in fiscal 2007.
SFAS 158 required us to recognize the funded status, which is the difference between the fair value of plan assets and the projected benefit obligations, of our postretirement benefit plans in the February 3, 2007 Consolidated Statement of Financial Position, with a corresponding adjustment to accumulated other comprehensive loss, net of tax. The adjustment to accumulated other comprehensive loss at adoption represents the net unrecognized actuarial losses and unrecognized prior service costs, both of which were previously netted against the plans' funded status in our Consolidated Statements of Financial Position pursuant to the provisions of SFAS No. 87, "Employers' Accounting for Pensions" (SFAS 87). These amounts will be subsequently recognized as net periodic pension expense pursuant to our historical accounting policy for amortizing such amounts. Further, actuarial gains and losses that arise in subsequent periods and are not recognized as net periodic pension expense in the same periods will be recognized as a component of other comprehensive income. Those amounts will be subsequently recognized as a component of net periodic pension expense on the same basis as the amounts recognized in accumulated other comprehensive loss at adoption of SFAS 158.
The effects of adopting the provisions of SFAS 158 on our Consolidated Statement of Financial Position at February 3, 2007 are presented in the following table. The adoption of SFAS 158 had no effect on our Consolidated Statement of Operations for the year ended February 3, 2007, or for any prior period. Had we not been required to adopt SFAS 158 at February 3, 2007, we would have recognized an additional minimum liability pursuant to the provisions of SFAS 87. The effect of recognizing the additional minimum liability is included in the table below in the column labeled "Prior to Adopting SFAS 158."
| |
| | At February 3, 2007
| |
| |
|---|
(millions)
| | Prior to Adopting
SFAS 158
| | Effect of Adopting
SFAS 158
| | As Reported at
February 3, 2007
| |
|---|
Pension and Postretirement Balances Recorded
| |
|---|
| |
| Other non-current assets | | 1,569 | | (357 | ) | 1,212 | |
Accrued and other current liabilities |
|
2,742 |
|
16 |
|
2,758 |
|
| Deferred income taxes | | 729 | | (152 | ) | 577 | |
| Other non-current liabilities | | 1,334 | | 13 | | 1,347 | |
| Accumulated other comprehensive loss | | (9 | ) | (234 | ) | (243 | ) |
| |
| |
Obligations and Funded Status
| |
| |
| |
| |
|---|
| | Pension Benefits
| |
| |
| |
|---|
| | Qualified Plans
| | Nonqualified Plans
| | Postretirement
Health Care Benefits
| |
|---|
(millions)
| | 2006
| | 2005
| | 2006
| | 2005
| | 2006
| | 2005
| |
|---|
| |
| Change in Projected Benefit Obligation | | | | | | | | | | | | | |
| Benefit obligation at beginning of measurement period (a) | | $1,626 | | $1,515 | | $33 | | $34 | | $105 | | $107 | |
| Service cost | | 82 | | 66 | | 1 | | 1 | | 3 | | 2 | |
| Interest cost | | 91 | | 85 | | 2 | | 2 | | 6 | | 6 | |
| Actuarial loss | | 32 | | 55 | | 5 | | 4 | | 13 | | 3 | |
| Participant contributions | | — | | — | | — | | — | | 9 | | 17 | |
| Benefits paid | | (76 | ) | (94 | ) | (5 | ) | (5 | ) | (21 | ) | (30 | ) |
| Plan amendments | | 9 | | (1 | ) | — | | (3 | ) | — | | — | |
| |
| Benefit obligation at end of measurement period | | $1,764 | | $1,626 | | $36 | | $33 | | $115 | | $105 | |
| |
- (a)
- Measurement date is October 31 of each year.
| |
| | Pension Benefits
| |
| |
| |
|---|
| | Qualified Plans
| | Nonqualified Plans
| | Postretirement
Health Care Benefits
| |
|---|
(millions)
| | 2006
| | 2005
| | 2006
| | 2005
| | 2006
| | 2005
| |
|---|
| |
| Change in Plan Assets | | | | | | | | | | | | | |
| Fair value of plan assets at beginning of measurement period | | $1,845 | | $1,698 | | $— | | $— | | $— | | $— | |
| Actual return on plan assets | | 303 | | 174 | | — | | — | | — | | — | |
| Employer contribution | | 3 | | 67 | | 5 | | 5 | | 12 | | 13 | |
| Participant contributions | | — | | — | | — | | — | | 9 | | 17 | |
| Benefits paid | | (76 | ) | (94 | ) | (5 | ) | (5 | ) | (21 | ) | (30 | ) |
| |
| Fair value of plan assets at end of measurement period | | $2,075 | | $1,845 | | $— | | $— | | $— | | $— | |
| |
| Funded status | | $311 | | $219 | | $(36 | ) | $(33 | ) | $(115 | ) | $(105 | ) |
| |
The net overfunded status of the qualified plans of $311 million at February 3, 2007 is recognized in the accompanying Consolidated Statement of Financial Position as $325 million within other non-current assets and $14 million within other non-current liabilities. The underfunded amount for the nonqualified plans, including the postretirement health care benefits liability, of $151 million at February 3, 2007 is recognized as $16 million within accrued and other current liabilities and $135 million within other non-current liabilities.
No plan assets are expected to be returned to us during 2007.
Included in accumulated other comprehensive loss at February 3, 2007 are the following amounts that have not yet been recognized in net periodic pension expense: unrecognized actuarial losses $425 million ($259 million net of tax) partially offset by unrecognized prior service costs of $20 million ($12 million net of tax). The actuarial loss included in accumulated other comprehensive loss and expected to be recognized in net periodic pension expense during 2007 is $46 million ($28 million net of tax), which will be offset by prior service cost of $4 million ($2 million net of tax) and respectively.
| |
2005 Reconciliation of Prepaid (Accrued) Pension and Benefit Expense to Funded Status
| |
|---|
| | Pension Benefits
| |
| |
|---|
| | Postretirement
Health Care Benefits
2005
| |
|---|
(millions)
| | Qualified Plans
2005
| | Nonqualified Plans
2005
| |
|---|
| |
| Funded status | | $219 | | $(33 | ) | $(105 | ) |
| Unrecognized actuarial loss | | 561 | | 16 | | 8 | |
| Unrecognized prior service cost | | (32 | ) | — | | — | |
| |
| Net amount recognized | | $748 | | $(17 | ) | $(97 | ) |
| |
| |
2005 Reconciliation of Amounts Recognized in Consolidated Statement of Financial Position
| |
|---|
| | Pension Benefits
| |
| |
|---|
| | Postretirement
Health Care Benefits
2005
| |
|---|
| | Qualified Plans
2005
| | Nonqualified Plans
2005
| |
|---|
| |
| Prepaid pension expense | | $752 | | $— | | $— | |
| Accrued pension and benefit expense | | (9 | ) | (22 | ) | (97 | ) |
| Accumulated other comprehensive income | | 5 | | 5 | | — | |
| |
| Net amount recognized | | $748 | | $(17 | ) | $(97 | ) |
| |
| |
Net Pension and Postretirement Health Care Benefits Expense
| |
| |
| |
| |
|---|
| | Pension Benefits
| | Postretirement Health Care Benefits
| |
|---|
(millions)
| | 2006
| | 2005
| | 2004
| | 2006
| | 2005
| | 2004
| |
|---|
| |
| Service cost benefits earned during the period | | $83 | | $67 | | $79 | | $3 | | $2 | | $3 | |
| Interest cost on projected benefit obligation | | 93 | | 87 | | 84 | | 6 | | 6 | | 7 | |
| Expected return on assets | | (141 | ) | (137 | ) | (122 | ) | — | | — | | — | |
| Recognized losses | | 47 | | 43 | | 36 | | 1 | | 1 | | 1 | |
| Recognized prior service cost | | (5 | ) | (5 | ) | (7 | ) | — | | — | | — | |
| Settlement/curtailment charges | | — | | — | | 1 | | — | | — | | (7 | ) |
| |
| Total | | $77 | | $55 | | $71 | | $10 | | $9 | | $4 | |
| |
The amortization of prior service cost is determined using the straight-line method over the average remaining service period of team members expected to receive benefits under the plan. As a result of freezing the benefits for Marshall Field's and Mervyn's team members at the time of their respective dispositions and retaining the related assets and obligations of the plans, we were required to record curtailment charges in 2004. These charges are included in the gain on disposal of discontinued operations in the Consolidated Statements of Operations.
Other information related to defined benefit pension plans is as follows:
|
(millions)
| | 2006
| | 2005
|
|---|
|
| Accumulated benefit obligation (ABO) for all plans (a) | | $1,674 | | $1,534 |
| Projected benefit obligation for pension plans with an ABO in excess of plan assets (b) | | 51 | | 46 |
| Total ABO for pension plans with an ABO in excess of plan assets | | 44 | | 41 |
| Fair value of plan assets for pension plans with an ABO in excess of plan assets | | 2 | | 3 |
|
- (a)
- The present value of benefits earned to date assuming no future salary growth.
- (b)
- The present value of benefits earned to date by plan participants, including the effect of assumed future salary increases.
Assumptions
Weighted average assumptions used to determine benefit obligations at October 31:
| |
| | Pension Benefits
| | Postretirement
Health Care Benefits
| |
|---|
| | 2006
| | 2005
| | 2006
| | 2005
| |
|---|
| |
| Discount rate | | 5.80 | % | 5.75 | % | 5.80 | % | 5.75 | % |
| Average assumed rate of compensation increase | | 4.00 | % | 3.50 | % | n/a | | n/a | |
| |
Weighted average assumptions used to determine net periodic benefit expense for years ended October 31:
| |
| | Pension Benefits
| | Postretirement Health Care Benefits
| |
|---|
| | 2006
| | 2005
| | 2004
| | 2006
| | 2005
| | 2004
| |
|---|
| |
| Discount rate | | 5.75 | % | 5.75 | % | 6.25 | % | 5.75 | % | 5.75 | % | 6.25 | % |
| Expected long-term rate of return on plan assets | | 8.00 | % | 8.00 | % | 8.00 | % | n/a | | n/a | | n/a | |
| Average assumed rate of compensation increase | | 3.50 | % | 2.75 | % | 3.25 | % | n/a | | n/a | | n/a | |
| |
The discount rate used to measure net periodic benefit expense each year is the rate as of the beginning of the year (i.e., the prior measurement date). With an essentially stable asset allocation over the following time periods, our annualized rate of return on qualified plans' assets has averaged 10.6 percent, 10.1 percent and 10.9 percent for the 5-year, 10-year and 15-year periods, respectively, ending October 31, 2006.
An increase in the cost of covered health care benefits of 9 percent was assumed for 2006. In 2007, the rate is assumed to be 8 percent for non-Medicare eligible individuals and 9 percent for Medicare eligible individuals. Both rates will be reduced to 5 percent in 2012 and thereafter.
A one percent change in assumed health care cost trend rates would have the following effects:
| |
(millions)
| | 1% Increase
| | 1% Decrease
| |
|---|
| |
| Effect on total of service and interest cost components of net periodic postretirement health care benefit expense | | $— | | $— | |
| Effect on the health care component of the postretirement benefit obligation | | $9 | | $(8 | ) |
| |
Additional Information
Our pension plan weighted average asset allocations at October 31, 2006 and 2005 by asset category were as follows:
| |
Asset Category
| | 2006
| | 2005
| |
|---|
| |
| Domestic equity securities | | 35 | % | 36 | % |
| International equity securities | | 20 | | 20 | |
| Debt securities | | 26 | | 26 | |
| Other | | 19 | | 18 | |
| |
| Total | | 100 | % | 100 | % |
| |
Our asset allocation strategy targets 35 percent in domestic equity securities, 20 percent in international equity securities, 25 percent in debt securities and 20 percent in other assets. Equity securities include our common stock in amounts substantially less than 1 percent of total plan assets at October 31, 2006 and 2005. Other assets include private equity, mezzanine and distressed debt, timber-related assets and less than a 5 percent allocation to real estate. Our expected long-term rate of return assumptions as of October 31, 2006 were 8.5 percent, 8.5 percent, 5 percent and 10 percent for domestic equity securities, international equity securities, debt securities and other assets, respectively.
Contributions
Given the qualified pension plan's funded position, we are not required to make any contributions in 2007, although we may choose to make discretionary contributions of up to $100 million. We expect to make contributions in the range of $5 million to $15 million to our postretirement health care benefit plan in 2007.
Estimated Future Benefit Payments
Benefit payments by the plans, which reflect expected future service as appropriate, are expected to be paid as follows:
|
(millions)
| | Pension Benefits
| | Postretirement Health Care Benefits
|
|---|
|
| 2007 | | $83 | | $12 |
| 2008 | | 94 | | 13 |
| 2009 | | 99 | | 13 |
| 2010 | | 104 | | 14 |
| 2011 | | 110 | | 14 |
| 2012-2016 | | 653 | | 78 |
|
29. Quarterly Results (Unaudited)
Due to the seasonal nature of our business, fourth quarter operating results typically represent a substantially larger share of total year revenues and earnings because they include our peak sales period from Thanksgiving through the end of December. We follow the same accounting policies for preparing quarterly and annual financial data. The table below summarizes quarterly results for 2006 and 2005:
|
| | First Quarter
| | Second Quarter
| | Third Quarter
| | Fourth Quarter
| | Total Year
|
|---|
(millions, except per share data)
|
|---|
| | 2006
| | 2005
| | 2006
| | 2005
| | 2006
| | 2005
| | 2006
| | 2005
| | 2006
| | 2005
|
|---|
|
| Total revenues | | $12,863 | | $11,477 | | $13,347 | | $11,990 | | $13,570 | | $12,206 | | $19,710 | | $16,947 | | $59,490 | | $52,620 |
| Gross margin | | $4,020 | | $3,615 | | $4,273 | | $3,839 | | $4,265 | | $3,829 | | $5,920 | | $5,061 | | $18,479 | | $16,344 |
| Net earnings | | $554 | | $494 | | $609 | | $540 | | $506 | | $435 | | $1,119 | | $939 | | $2,787 | | $2,408 |
| Basic earnings per share (a) | | $.64 | | $.56 | | $.71 | | $.61 | | $.59 | | $.49 | | $1.30 | | $1.07 | | $3.23 | | $2.73 |
| Diluted earnings per share (a) | | $.63 | | $.55 | | $.70 | | $.61 | | $.59 | | $.49 | | $1.29 | | $1.06 | | $3.21 | | $2.71 |
| Dividends declared per share | | $.10 | | $.08 | | $.12 | | $.10 | | $.12 | | $.10 | | $.12 | | $.10 | | $.46 | | $.38 |
| Closing common stock price | | | | | | | | | | | | | | | | | | | | |
| | High | | $55.80 | | $52.50 | | $54.71 | | $59.98 | | $59.72 | | $57.80 | | $62.35 | | $58.85 | | $62.35 | | $59.98 |
| | Low | | $50.85 | | $46.41 | | $45.53 | | $46.28 | | $45.28 | | $50.84 | | $56.03 | | $52.61 | | $45.28 | | $46.28 |
|
- (a)
- Per share amounts are computed independently for each of the quarters presented. The sum of the quarters may not equal the total year amount due to the impact of changes in average quarterly shares outstanding.
Item 9. Changes in and Disagreements with Accountants on Accounting and Financial Disclosure.
Not Applicable.
Item 9A. Controls and Procedures.
As of the end of the period covered by this annual report, we conducted an evaluation, under supervision and with the participation of management, including the chief executive officer and chief financial officer, of the effectiveness of the design and operation of our disclosure controls and procedures pursuant to Rules 13a-15 and 15d-15 of the Securities Exchange Act of 1934, as amended (Exchange Act). Based upon that evaluation, our chief executive officer and chief financial officer concluded that our disclosure controls and procedures are effective. Disclosure controls and procedures are defined by Rules 13a-15(e) and 15d-15(e) of the Exchange Act as controls and other procedures that are designed to ensure that information required to be disclosed by us in reports filed with the SEC under the Exchange Act is recorded, processed, summarized and reported within the time periods specified in the SEC's rules and forms. Disclosure controls and procedures include, without limitation, controls and procedures designed to ensure that information required to be disclosed by us in reports filed under the Exchange Act is accumulated and communicated to our management, including our principal executive and principal financial officers, or person performing similar functions, as appropriate to allow timely decisions regarding required disclosure.
There were no changes in our internal control over financial reporting during the fourth quarter of fiscal year 2006 that have materially affected, or are reasonably likely to materially affect, our internal control over financial reporting.
For the Report of Management on Internal Control and the Report of Independent Registered Public Accounting Firm on Internal Control over Financial Reporting, see Item 8, Financial Statements and Supplementary Data.
Item 9B. Other Information.
Not applicable.
PART III
Certain information required by Part III is incorporated by reference from Target's definitive Proxy Statement to be filed on or about April 9, 2007. Except for those portions specifically incorporated in this Form 10-K by reference to Target's Proxy Statement, no other portions of the Proxy Statement are deemed to be filed as part of this Form 10-K.
Item 10. Directors, Executive Officers and Corporate Governance.
Election of Directors, Section 16(a) Beneficial Ownership Reporting Compliance, Additional Information – Business Ethics and Conduct and General Information About the Board of Directors – Board Meetings and Committees, of Target's Proxy Statement to be filed on or about April 9, 2007, are incorporated herein by reference. See also Item 4A, Executive Officers of Part I hereof.
Item 11. Executive Compensation.
Executive and Director Compensation, of Target's Proxy Statement to be filed on or about April 9, 2007, is incorporated herein by reference.
Item 12. Security Ownership of Certain Beneficial Owners and Management and Related Stockholder Matters.
|
Equity Compensation Plan Information
|
|---|
| | Number of securities to be issued upon exercise of outstanding options, warrants and rights as of February 3, 2007
| | Weighted average exercise price of outstanding options, warrants and rights as of February 3, 2007
| | Number of securities remaining available for future issuance under equity compensation plans as of February 3, 2007 (excluding securities reflected in column (a))
|
|---|
Plan Category
| | (a)
| | (b)
| | (c)
|
|---|
|
| Equity compensation plans approved by security holders | | 30,025,530 | (1) | $41.95 | | 42,974,387 |
| Equity compensation plans not approved by security holders | | — | | — | | — |
|
| Total | | 30,025,530 | | $41.95 | | 42,974,387 |
|
- (1)
- This amount includes 2,115,595 performance shares and RSU shares potentially issuable under our Long-Term Incentive Plan. According to the existing plan provisions and compensation deferral elections, approximately 32 percent of these potentially issuable performance shares, if and when earned, will be paid in cash or deferred through a credit to the deferred compensation accounts of the participants in an amount equal to the value of any earned performance shares. The actual number of performance shares to be issued, cash to be paid, or credits to be made to deferred compensation accounts, if any, depends on our financial performance over a period of time. Performance shares do not have an exercise price and thus they have been excluded from the weighted average exercise price calculation in column (b).
Beneficial Ownership of Certain Shareholders, of Target's Proxy Statement to be filed on or about April 9, 2007, is incorporated herein by reference.
Item 13. Certain Relationships and Related Transactions, and Director Independence.
Certain Relationships and General Information About the Board of Directors – Director Independence, of Target's Proxy Statement to be filed on or about April 9, 2007, are incorporated herein by reference.
Item 14. Principal Accountant Fees and Services.
Audit and Non-audit Fees, of Target's Proxy Statement to be filed on or about April 9, 2007, is incorporated herein by reference.
PART IV
Item 15. Exhibits and Financial Statement Schedules.
The following information required under this item is filed as part of this report:
- a)
- Financial Statements
| Consolidated Statements of Operations for the Years Ended February 3, 2007, January 28, 2006 and January 29, 2005 |
| Consolidated Statements of Financial Position at February 3, 2007 and January 28, 2006 |
| Consolidated Statements of Cash Flows for the Years Ended February 3, 2007, January 28, 2006 and January 29, 2005 |
| Consolidated Statements of Shareholders' Investment for the Years Ended February 3, 2007, January 28, 2006 and January 29, 2005 |
| Notes to Consolidated Financial Statements |
| Report of Independent Registered Public Accounting Firm on Consolidated Financial Statements |
Target, through its special purpose subsidiary, Target Receivables Corporation (TRC), has entered into a securitization transaction under which it transfers, on an ongoing basis, substantially all of its credit card receivables to a trust. Separate financial information is filed for TRC in its separate Annual Report on Form 10-K.
Financial Statement Schedules
For the Years Ended February 3, 2007, January 28, 2006 and January 29, 2005:
II – Valuation and Qualifying Accounts
Other schedules have not been included either because they are not applicable or because the information is included elsewhere in this Report.
- b)
- Exhibits
| (3)A. | | | | Restated Articles of Incorporation (as amended January 9, 2002) (1) |
| B. | | | | By-Laws (as amended through November 11, 1998) (2) |
| (4)A. | | | | Indenture, dated August 4, 2000 between Target Corporation and Bank One Trust Company, N.A. (3) |
| B. | | | | Registrant agrees to furnish to the Commission on request copies of other instruments with respect to long-term debt. |
| (10)A. | | * | | Executive Short-Term Incentive Plan (4) |
| C. | | * | | Amended and Restated Director Stock Option Plan of 1995 |
| D. | | * | | Supplemental Pension Plan I (5) |
| E. | | * | | Amended and Restated Executive Long-Term Incentive Plan of 1981 |
| F. | | * | | Supplemental Pension Plan II (6) |
| G. | | * | | Supplemental Pension Plan III (7) |
| H. | | * | | Amended and Restated Deferred Compensation Plan Senior Management Group |
| I. | | * | | Amended and Restated Deferred Compensation Plan Directors |
| J. | | * | | Income Continuance Policy Statement (8) |
| K. | | * | | SMG Income Continuance Policy Statement (9) |
| L. | | * | | Amended and Restated SMG Executive Deferred Compensation Plan |
| N. | | * | | Amended and Restated Director Deferred Compensation Plan |
| O. | | * | | Executive Excess Long-Term Disability Plan (10) |
| P. | | * | | Amended and Restated Long-Term Incentive Plan |
| R. | | * | | Director Retirement Program (11) |
| S. | | * | | Deferred Compensation Trust Agreement |
| T. | | | | Five-year credit agreement dated as of June 9, 2005 among Target Corporation, Bank of America, N.A. as Administrative Agent and the Banks listed therein (12) |
| (12) | | | | Statements re: Computations of Ratios |
| (21) | | | | List of Subsidiaries |
| (23) | | | | Consent of Independent Registered Public Accounting Firm |
| (24) | | | | Powers of Attorney |
| (31)A. | | | | Certification of the Chief Executive Officer Pursuant to Section 302 of the Sarbanes-Oxley Act of 2002 |
| (31)B. | | | | Certification of the Chief Financial Officer Pursuant to Section 302 of the Sarbanes-Oxley Act of 2002 |
| (32)A. | | | | Certification of the Chief Executive Officer Pursuant to Section 18 U.S.C. Section 1350 Pursuant to Section 906 of the Sarbanes-Oxley Act of 2002 |
| (32)B. | | | | Certification of the Chief Financial Officer Pursuant to Section 18 U.S.C. Section 1350 Pursuant to Section 906 of the Sarbanes-Oxley Act of 2002 |
| (99)A. | | | | Risk Factors and Cautionary Statements Relating to Forward-Looking Information |
Copies of exhibits will be furnished upon written request and payment of Registrant's reasonable expenses in furnishing the exhibits.
- *
- Management contract or compensation plan or arrangement required to be filed as an exhibit to this Form 10-K.
- (1)
- Incorporated by reference to Exhibit (3)A to Target's Form 10-K Report for the year ended February 2, 2002.
- (2)
- Incorporated by reference to Exhibit (3)(ii) to Target's Form 10-Q Report for the quarter ended October 31, 1998.
- (3)
- Incorporated by reference to Exhibit 4.1 to Target's Form 8-K Report filed August 10, 2000.
- (4)
- Incorporated by reference to Exhibit (10)A to Target's Form 10-K Report for the year ended February 2, 2002.
- (5)
- Incorporated by reference to Exhibit 10(E) to Target's Form 10-K Report for the year ended February 1, 1997, and Amendment thereto, incorporated by reference to Exhibit (10)G to Target's Form 10-Q Report for the quarter ended November 2, 2002.
- (6)
- Incorporated by reference to Exhibit (10) G to Target's Form 10-K Report for the year ended February 1, 1997, and Amendment thereto, incorporated by reference to Exhibit (10)G to Target's Form 10-Q Report for the quarter ended November 2, 2002.
- (7)
- Incorporated by reference to Exhibit (10) H to Target's Form 10-K Report for the year ended February 1, 1997, and Amendment thereto, incorporated by reference to Exhibit (10)G to Target's Form 10-Q Report for the quarter ended November 2, 2002.
- (8)
- Incorporated by reference to Exhibit (10) K to Target's Form 10-K Report for the year ended January 30, 1999.
- (9)
- Incorporated by reference to Exhibit (10)L to Target's Form 10-K Report for the year ended January 30, 1999.
- (10)
- Incorporated by reference to Exhibit (10)O to Target's Form 10-K Report for the year ended February 3, 2001.
- (11)
- Incorporated by reference to Exhibit (10)O to Target's Form 10-K Report for the year ended January 29, 2005.
- (12)
- Incorporated by reference to Exhibit (10) to Target's Form 10-Q Report for the quarter ended July 29, 2005.
SIGNATURES
Pursuant to the requirements of Section 13 or 15(d) of the Securities Exchange Act of 1934, Target has duly caused this report to be signed on its behalf by the undersigned, thereunto duly authorized.
| | | TARGET CORPORATION |
|
|
By: |
|
| Dated: March 15, 2007 | | |
Douglas A. Scovanner
Executive Vice President, Chief Financial
Officer and Chief Accounting Officer |
Pursuant to the requirements of the Securities Exchange Act of 1934, the report has been signed below by the following persons on behalf of Target and in the capacities and on the dates indicated.
| | | | |
| Dated: March 15, 2007 | | |
Robert J. Ulrich
Chairman of the Board and Chief Executive Officer |
|
|
|
|
| | | |
|
| Dated: March 15, 2007 | | |
Douglas A. Scovanner
Executive Vice President, Chief Financial Officer and
Chief Accounting Officer |
| ROXANNE S. AUSTIN | | STEPHEN W. SANGER | | |
| CALVIN DARDEN | | WARREN R. STALEY | | |
| JAMES A. JOHNSON | | GREGG W. STEINHAFEL | | |
| RICHARD M. KOVACEVICH | | GEORGE W. TAMKE | | |
| MARY E. MINNICK | | SOLOMON D. TRUJILLO | | |
| ANNE M. MULCAHY | | ROBERT J. ULRICH | | Directors |
Douglas A. Scovanner, by signing his name hereto, does hereby sign this document pursuant to powers of attorney duly executed by the Directors named, filed with the Securities and Exchange Commission on behalf of such Directors, all in the capacities and on the date stated.
| | | By: | |
| Dated: March 15, 2007 | | |
Douglas A. Scovanner
Attorney-in-fact |
TARGET CORPORATION
Schedule II – Valuation and Qualifying Accounts
Fiscal Years 2006, 2005 and 2004
(in millions)
|
Column A
|
|
Column B
|
|
Column C
|
|
Column D
|
|
Column E
|
|---|
|
Description
|
|
Balance at beginning of period
|
|
Additions charged to cost, expenses, revenues
|
|
Deductions
|
|
Balance at end of period
|
|---|
|
| Allowance for doubtful accounts: | | | | | | | | |
| | 2006 | | $451 | | $380 | | $(314 | ) | $517 |
| | 2005 | | $387 | | $466 | | $(402 | ) | $451 |
| | 2004 | | $352 | | $451 | | $(416 | ) | $387 |
|
|
|
|
|
|
|
|
|
| Sales returns reserves: | | | | | | | | |
| | 2006 | | $11 | | $1,123 | | $(1,103 | ) | $31 |
| | 2005 | | $11 | | $968 | | $(968 | ) | $11 |
| | 2004 | | $— | | $843 | | $(832 | ) | $11 |
|
Exhibit Index
|
Exhibit
| | Description
| | Manner of Filing
|
|---|
|
| (3)A. | | Restated Articles of Incorporation (as amended January 9, 2002) | | Incorporated by Reference |
| (3)B. | | By-Laws (as amended through November 11, 1998) | | Incorporated by Reference |
| (4)A. | | Indenture, dated August 4, 2000 between Target Corporation and Bank One Trust Company, N.A. | | Incorporated by Reference |
| (10)A. | | Executive Short-Term Incentive Plan | | Incorporated by Reference |
| (10)C. | | Amended and Restated Director Stock Option Plan of 1995 | | Filed Electronically |
| (10)D. | | Supplemental Pension Plan I | | Incorporated by Reference |
| (10)E. | | Amended and Restated Executive Long-Term Incentive Plan of 1981 | | Filed Electronically |
| (10)F. | | Supplemental Pension Plan II | | Incorporated by Reference |
| (10)G. | | Supplemental Pension Plan III | | Incorporated by Reference |
| (10)H. | | Amended and Restated Deferred Compensation Plan Senior Management Group | | Filed Electronically |
| (10)I. | | Amended and Restated Deferred Compensation Plan Directors | | Filed Electronically |
| (10)J. | | Income Continuance Policy Statement | | Incorporated by Reference |
| (10)K. | | SMG Income Continuance Policy Statement | | Incorporated by Reference |
| (10)L. | | Amended and Restated SMG Executive Deferred Compensation Plan | | Filed Electronically |
| (10)N. | | Amended and Restated Director Deferred Compensation Plan | | Filed Electronically |
| (10)O. | | Executive Excess Long-Term Disability Plan | | Incorporated by Reference |
| (10)P. | | Amended and Restated Long-Term Incentive Plan | | Filed Electronically |
| (10)R. | | Director Retirement Program | | Incorporated by Reference |
| (10)S. | | Deferred Compensation Trust Agreement | | Filed Electronically |
| (10)T. | | Five-year credit agreement dated as of June 9, 2005 among Target Corporation, Bank of America, N.A. as Administrative Agent and the Banks listed therein | | Incorporated by Reference |
| (12) | | Statements re: Computations of Ratios | | Filed Electronically |
| (21) | | List of Subsidiaries | | Filed Electronically |
| (23) | | Consent of Independent Registered Public Accounting Firm | | Filed Electronically |
| (24) | | Powers of Attorney | | Filed Electronically |
| (31)A. | | Certification of the Chief Executive Officer Pursuant to Section 302 of the Sarbanes-Oxley Act of 2002 | | Filed Electronically |
| (31)B. | | Certification of the Chief Financial Officer Pursuant to Section 302 of the Sarbanes-Oxley Act of 2002 | | Filed Electronically |
| (32)A. | | Certification of the Chief Executive Officer Pursuant to Section 18 U.S.C. Section 1350 Pursuant to Section 906 of the Sarbanes-Oxley Act of 2002 | | Filed Electronically |
| (32)B. | | Certification of the Chief Financial Officer Pursuant to Section 18 U.S.C. Section 1350 Pursuant to Section 906 of the Sarbanes-Oxley Act of 2002 | | Filed Electronically |
| (99)A. | | Risk Factors and Cautionary Statements Relating to Forward-Looking Information | | Filed Electronically |
SHAREHOLDER INFORMATION
|
Annual Meeting
The Annual Meeting of Shareholders is scheduled for May 24, 2007, at 1:00 p.m. EDT at the Target store located at 3100 West 117th Street, Cleveland, Ohio 44111. |
|
Transfer Agent, Registrar and Dividend Disbursing Agent
Mellon Investor Services |
|
Shareholder Information
Quarterly and annual shareholder information, including the Form 10-Q and Form 10-K Annual Report, which are filed with the Securities and Exchange Commission, is available at no charge to shareholders. To obtain copies of these materials, you may send an e-mail to Investorrelations@Target.com, or write to: Vice President, Investor Relations (TPN-1448), Target Corporation, 1000 Nicollet Mall, Minneapolis, Minnesota 55403. These documents as well as other information about Target Corporation, including our Business Conduct Guide, Corporate Governance Profile, Corporate Responsibility Report and Board of Director Committee Position Descriptions, are also available on the internet at www.Target.com/investors. |
|
Trustee, Employee Savings 401(k) and Pension Plans
State Street Bank and Trust Company
Stock Exchange Listings
Trading symbol: TGT
New York Stock Exchange
Shareholder Assistance
For assistance regarding individual stock records, lost certificates, name or address changes, dividend or tax questions, call Mellon Investor Services at 1-800-794-9871, access their website at www.melloninvestor.com, or write to: Mellon Investor Services, P.O. Box 3315, South Hackensack, NJ 07606-1915. |
|
Sales Information
Comments regarding our sales results are provided periodically throughout the year on a recorded telephone message accessible by calling 612-761-6500. Our current sales disclosure practice includes a sales recording on the day of our monthly sales release and one mid-month sales update.
Officer Certifications
In accordance with the rules of the New York Stock Exchange (NYSE), the Chief Executive Officer of Target submitted the required annual certification to the NYSE regarding the NYSE's Corporate Governance listing standards on May 25, 2006. Target's Form 10-K for its fiscal year ended February 3, 2007, as filed with the U.S. Securities and Exchange Commission, includes the certifications of Target's Chief Executive Officer and Chief Financial Officer required by Section 302 of the Sarbanes Oxley Act of 2002. |
|
Direct Stock Purchase/Dividend Reinvestment Plan
Mellon Investor Services administers a direct service investment plan that allows interested investors to purchase Target Corporation stock directly, rather than through a broker, and become a registered shareholder of the company. The program offers many features including dividend reinvestment. For detailed information regarding this program, call Mellon Investor Services toll free at 1-800-842-7629 or write to: Mellon Investor Services, P.O. Box 3338, South Hackensack, NJ 07606-1938. |
|
Archer Farms, the Bullseye Design, the Bullseye Dog, Channel Red, Choxie, Circo, ClearRx, Expect More. Pay Less., Embark, Fast, Fun and Friendly, Gilligan & O'Malley, Global Bazaar, Go International, Kool Toyz, Market Pantry, Merona, Perfect Pieces, ProSpirit, Ready. Sit. Read!, REDcard, Room Essentials, Safe City, SuperTarget, Take Charge of Education, Target & Blue, Target Credit Card, Target House, Target Limited Edition, Target Pharmacy, Target Rewards, Target, Trutech, Wine Cube and Xhilaration are trademarks of Target Brands, Inc.
C9 by Champion is a trademark of HBI Branded Apparel Enterprises, LLC. ChefMate is a registered trademark of Herald Housewares Limited. Cherokee is a registered trademark of Cherokee Inc. DSN Retailing Today is a registered trademark of Lebhar-Friedman, Inc. Eddie Bauer is a registered trademark of Eddie Bauer, Inc. Fieldcrest is a registered trademark of Official Pillowtex, LLC. Isaac Mizrahi is a trademark of IM Ready Made LLC. Kitchen Essentials by Calphalon is a registered trademark of Calphalon Corporation. Liz Lange for Target is a registered trademark of Elizabeth Lange, Inc. Michael Graves Design is a trademark of Michael Graves, Architect, P.A. Mossimo is a registered trademark of Mossimo, Inc. Newsweek is a registered trademark of Weekly Publications, Inc. Nick and Nora is a registered trademark of American Genius & Co., Inc. Genuine Kids by Osh Kosh is a registered trademark of Oshkosh B'Gosh Inc. Paul & Joe is a registered trademark of Sofrane (France Corp.) Rafe is a registered trademark of Rafe Totengco. Rolling Stone is a registered trademark of Straight Arrow Publishers Company, L.P. St. Jude Children's Research Hospital is a registered trademark of St. Jude Children's Research Hospital. Smith & Hawken is a registered trademark of Smith & Hawken, Ltd. Simply Shabby Chic is a trademark of Rachel Ashwell Designs, Inc. Sonia Kashuk is a trademark of Sonia Kashuk, Inc. Starbucks is a trademark of Starbucks U.S. Brands, LLC. Sutton & Dodge is a registered trademark of Hormel Foods, LLC. Thomas O'Brien is a registered trademark of TOB International Marketing Corp. Visa is a trademark of Visa International Service Association. Waverly is a registered trademark of F. Schumacher & Co. Woolrich is a registered trademark of John Rich & Sons Investment Holding Company. All rights reserved.
Copyright 2007 Target
QuickLinks
PART IPART IIPART IIIPART IVSIGNATURESSchedule II – Valuation and Qualifying AccountsExhibit Index