We are highly regulated by both federal and state regulatory authorities. Regulation includes, among other things, capital and reserve requirements, permissible investments and line of business, dividend limitations, limitations on products and services offered, loan limits, geographical limits, consumer credit regulations, community reinvestment requirements and restrictions on transactions with affiliated parties. The system of supervision and regulation applicable to us establishes a comprehensive framework for our operations and is intended primarily for the protection of the FDIC’s deposit funds, our depositors and the public, rather than our stockholders. We are also subject to regulation by the SEC. Failure to comply with laws, regulations or policies could result in sanction by regulatory agencies, civil monetary penalties, and/or damage to our reputation, which could have a material adverse effect on our business, consolidated financial condition and results of operations. In addition, any change in government regulation may have a material adverse effect on our business.
In response to the recent financial crisis, the United States government, specifically the Department of Treasury, FRB and FDIC, working in cooperation with foreign governments and other central banks, has taken a variety of extraordinary measures designed to restore confidence in the financial markets and to strengthen financial institutions, including measures available under the Emergency Economic Stability Act (“EESA”). The EESA followed, and has been followed by, numerous actions by the FRB, United States Congress, Department of Treasury, FDIC, SEC and others to address the current liquidity and credit crisis. These measures include homeowner relief that encourages loan restructuring and modification; the establishment of significant liquidity and credit facilities for financial institutions and investment banks; the lowering of the federal funds rate; emergency action against short selling practices; a temporary guaranty program for money market funds; the establishment of a commercial paper funding facility to provide back-stop liquidity to commercial paper issuers; and coordinated international efforts to address illiquidity and other weaknesses in the financial sector. The purpose of these legislative and regulatory actions is to stabilize the U.S. banking system. However, there can be no assurance as to the actual impact the EESA will have on the financial markets, including the extreme levels of volatility and limited credit availability currently being experienced by some institutions, and they may not have the desired effects. If the volatility in the markets continues and economic conditions fail to improve or worsen, our business and consolidated financial condition and results of operations could be materially adversely affected.
The Department of Treasury is currently developing additional programs to further alleviate the ongoing financial crisis. There can be no assurance that we will be able to participate in future programs. If we are unable to participate or choose not to participate, it may have a material adverse effect on our competitive position and consolidated financial condition and results of operations.
Effective January 1, 2007, the FDIC adopted a risk-based system for assessment of deposit insurance premiums under which all institutions are required to pay at least minimum annual premiums. In addition, in an effort to replenish the Deposit Insurance Fund in the wake of the recent increase in bank failures in the United States, the FDIC changed its rate structure in December 2008 to increase premiums effective for assessments in the first quarter of 2009. Further, in February 2009, the FDIC issued a proposed interim rule to impose a special one-time 20 basis points (“bps”) assessment against all financial institutions in the second quarter of 2009, payable in the third quarter of 2009. This proposed rule is open to public comment and is subject to change. The system categorizes institutions into one of four risk categories depending on capitalization and supervisory rating criteria. Due to our bank’s performance in 2008 and these changes to the FDIC rate structure, our FDIC insurance expense could increase significantly for 2009 and have a material adverse effect on our consolidated results of operation.
Table of Contents
Unauthorized disclosure of sensitive or confidential client or customer information, whether through a breach of our computer system or otherwise, could severely harm our business.
As part of our financial and data processing products and services, we collect, process and retain sensitive and confidential client and customer information. Despite the security measures we have in place, our facilities and systems, and those of third party service providers, may be vulnerable to security breaches, acts of vandalism, computer viruses, misplaced or lost data, programming and/or human error, or other similar events. Any security breach involving the misappropriation, loss or other unauthorized disclosure of confidential information, whether by us or our vendors, could severely damage our reputation, expose us to the risks of litigation and liability, disrupt our operations and harm our business.
Customers may decide not to use banks to complete their financial transactions, which could result in a loss of income to us.
Technology and other changes are allowing customers to complete financial transactions that historically have involved banks at one or both ends of the transaction. For example, customers can now pay bills and transfer funds directly without going through a bank. The process of eliminating banks as intermediaries, known as disintermediation, could result in the loss of fee income, as well as the loss of customer deposits.
Our controls and procedures may fail or be circumvented.
Management regularly reviews and updates our internal controls, disclosure controls and procedures, and corporate governance policies and procedures. Any system of controls, however well designed and operated, is based in part on certain assumptions and can provide only reasonable assurances that the objectives of the system are met. Any failure or circumvention of our controls and procedures or failure to comply with regulations related to controls and procedures could have a material adverse effect on our business, financial condition and results of operations.
We rely on the accuracy and completeness of information about customers or counterparties, and inaccurate or incomplete information could negatively impact our financial condition and results of operations.
In deciding whether to extend credit or enter into other transactions with customers and counterparties, we may rely on information provided to us by such customers and counterparties, including financial statements and other financial information. We may also rely on representations of customers and counterparties as to the accuracy and completeness of that information and, with respect to financial statements, on reports of independent auditors. Our financial condition and results of operations could be negatively impacted to the extent we rely on financial statements that do not comply with generally accepted accounting principles or that are inaccurate or misleading.
We are subject to examinations and challenges by taxing authorities.
In the normal course of business, we are routinely subjected to examinations and challenges from federal and state taxing authorities regarding the amount of taxes due in connection with our investments and the businesses in which we engage. Federal and state taxing authorities have recently become increasingly aggressive in challenging tax positions taken by financial institutions. These tax positions may relate to tax compliance, sales and use, franchise, gross receipts, payroll, property or income tax issues, including tax base, apportionment and tax planning. The challenges made by taxing authorities may result in adjustments to the timing or amount of taxable income or deductions or the allocations of income among tax jurisdictions. If any such challenges are not resolved in our favor, they could have a material adverse impact on our consolidated financial condition and results of operations.
Like many Wisconsin financial institutions, our bank has a subsidiary in Nevada which holds and manages investments and other earning assets (“Nevada Subsidiary”); the income on these assets has not been subject to Wisconsin tax. The Wisconsin Department of Revenue (“WDOR”) instituted an audit program specifically aimed at out-of-state subsidiaries. During 2007, WDOR performed an audit of our subsidiary and subsequently issued a proposed assessment to us. We recently negotiated a settlement with WDOR to resolve all open Wisconsin tax matters through 2006 related to our Nevada Subsidiary. However, as a result of recent combined reporting legislation passed in Wisconsin, we will be subject to higher Wisconsin taxes going forward with respect to income generated by our Nevada Subsidiary.
12
Table of Contents
Our regulatory capital ratios and those of our bank do not meet the guidelines established by our regulators for “well-capitalized” institutions.
As a result of recent operating losses we have experienced, our regulatory capital ratios, and those of our bank, fell below thresholds established by our regulators for “well capitalized” institutions under the regulatory framework for prompt corrective action. While our bank’s capital ratios remain in excess of levels established for “adequately capitalized” financial institutions, as a result of falling below the “well capitalized” level, our bank will be required, among other things, to obtain the approval of its regulator before further participating in the brokered deposit market, which could have a material adverse impact on its liquidity and, in turn, our consolidated financial condition and results of operations.
We could experience an unexpected inability to obtain needed liquidity.
Liquidity measures the ability to meet current and future cash flow needs as they become due. The liquidity of a financial institution reflects its ability to meet loan requests, to accommodate possible outflows in deposits, and to take advantage of interest rate market opportunities. The ability of a financial institution to meet its current financial obligations is a function of its balance sheet structure, its ability to liquidate assets and its access to alternative sources of funds. We seek to ensure our funding needs are met by maintaining a level of liquidity through asset/liability management. If we become unable to obtain funds when needed, it could have a material adverse effect on our business and, in turn, our consolidated financial condition and results of operations.
Continued decline in our stock price could require a write-down of some portion or all of our goodwill.
If our stock price continues to decline, or remains below our tangible book value for an extended period of time, we could be required to write off all or a portion of our goodwill, which represents the value in excess of our tangible book value. Such write-off would reduce earnings in the period in which it is recorded. Our stock price is subject to market conditions that can be impacted by forces outside the control of management, such as a perceived weakness in financial institutions in general, and may not be a direct result of our performance. A write-off of goodwill could have a material adverse effect on our consolidated financial condition and results of operations.
Future growth or operating results may require us to raise additional capital but that capital may not be available or it may be dilutive.
We are required by federal and state regulatory authorities to maintain adequate levels of capital to support our operations. To the extent our future operating results erode capital or we elect to expand through loan growth or acquisition, we may be required to raise capital.
Our ability to raise capital will depend on conditions in the capital markets, which are outside of our control, and on our financial performance. Accordingly, we cannot be assured of our ability to raise capital when needed or on favorable terms. If we cannot raise additional capital when needed, we will be subject to increased regulatory supervision and the imposition of restrictions on our growth and business. These could negatively impact our ability to operate or further expand our operations and may result in increases in operating expenses and reductions in revenues that could have a material effect on our consolidated financial condition and results of operations.
ITEM 1B. UNRESOLVED STAFF COMMENTS
None.
ITEM 2.PROPERTIES
Our bank owns its headquarters and twenty-six branches and leases one branch office from a third party. The main office is located in Sturgeon Bay, Wisconsin and the branches are distributed by county as follows: eight in Brown County, seven in Door County, one in Green Lake County, four in Kewaunee County, one in Manitowoc County, one in Outagamie County, four in Waupaca County and one in Waushara County.
The main office building located in Sturgeon Bay serves as our corporate headquarters and main banking office. The main office also accommodates our expanded business, primarily an insurance agency (Baylake Insurance Agency) and brokerage services. The twenty-seven branches owned or leased by our bank are in good condition and considered adequate for present and near term requirements. In addition, our bank owns other real property that we do not consider in the aggregate to be material to our consolidated financial position. All of such other real property is reserved for future expansion and is located in the following Wisconsin municipalities: Berlin, Appleton, Neenah, and Oshkosh.
13
Table of Contents
ITEM 3.LEGAL PROCEEDINGS
We may be involved from time to time in various routine legal proceedings incidental to our business. Neither we nor any of our subsidiaries is currently engaged in any legal proceedings that are expected to have a material adverse effect on our consolidated results of operations or financial position.
ITEM 4.SUBMISSION OF MATTERS TO A VOTE OF SECURITY HOLDERS
There were no matters submitted to a vote of security holders during the fourth quarter of fiscal year 2008.
PART II
ITEM 5.MARKET FOR REGISTRANT’S COMMON EQUITY, RELATED STOCKHOLDER MATTERS AND ISSUER PURCHASES OF EQUITY SECURITIES
Historically, trading in shares of our common stock has been limited. Since mid-1993, our common stock has been listed on the OTC Bulletin Board (Trading symbol: bylk), an electronic interdealer quotation system providing real-time quotations on eligible securities.
The following table summarizes high and low bid prices and cash dividends declared for our common stock for the periods indicated. Bid prices are as reported from the OTC Bulletin Board. The reported high and low prices represent interdealer bid prices, without retail mark-up, mark-downs or commission, and may not necessarily represent actual transactions.
| | | | | | | | | | | | | | |
| | Calendar period | | High | | Low | | Cash dividends per
share | |
2007 | | | 1st Quarter | | $ | 16.65 | | $ | 15.00 | | $ | 0.16 | | |
| | | 2nd Quarter | | $ | 15.45 | | $ | 13.75 | | $ | 0.16 | | |
| | | 3rd Quarter | | $ | 13.85 | | $ | 12.00 | | $ | 0.16 | | |
| | | 4th Quarter | | $ | 13.65 | | $ | 10.25 | | $ | 0.16 | | |
| | | | | | | | | | | | | | |
2008 | | | 1st Quarter | | $ | 11.75 | | $ | 8.55 | | $ | — | | |
| | | 2nd Quarter | | $ | 9.05 | | $ | 6.00 | | $ | — | | |
| | | 3rd Quarter | | $ | 6.75 | | $ | 4.00 | | $ | — | | |
| | | 4th Quarter | | $ | 6.75 | | $ | 3.50 | | $ | — | | |
We had approximately 1,723 shareholders of record at March 10, 2009. The number of shareholders does not reflect persons or entities that hold their stock in nominee or “street” name through various brokerage firms.
The holders of our common stock are entitled to receive such dividends when and as declared by our Board of Directors and approved by our regulators. In determining the payment of cash dividends, our Board of Directors considers the earnings, capital and debt servicing requirements, financial ratio guidelines issued by the FRB and other banking regulators, our financial condition, and other relevant factors.
14
Table of Contents
Our ability to pay dividends is dependent upon our receipt of dividends from our subsidiary bank, which is subject to regulatory restrictions. Such restrictions, which govern state-chartered banks, generally limit the payment of dividends on bank stock to our bank’s undivided profits after all payments of all necessary expenses, provided that our bank’s surplus equals or exceeds its capital, as discussed further in Item 7. “Management Discussion and Analysis of Financial Condition and Results of Operation-Capital Resources”. In addition, under the terms of our Junior Subordinated Debentures due 2036, we would be precluded from paying dividends on the common stock if we were in default under the Debentures, if we exercised our right to defer payments of interest on the Debentures, or if certain related defaults occurred.
Through 2007, cash dividends on our common stock had historically been paid on a quarterly basis in March, June, September and January. No cash dividends were declared during 2008 versus cash dividends of $0.64 per share declared during 2007. Beginning in February 2008, our Board of Directors, in consultation with our federal and state bank regulators, elected to forego the payment of cash dividends on our common stock. The payment of dividends in relationship to our financial position continues to be monitored on a quarterly basis and our intentions are to reinstate payment of dividends at the earliest appropriate opportunity, however, there is no assurance if or when we will be able to do so or if we do, in what amounts. In order to pay dividends, we will need to seek approval from the Wisconsin Department of Financial Institutions as well as the Federal Reserve Board.
We did not sell any equity securities without registration during the fourth quarter of 2008.
In the event and at such time as we do resume payment of quarterly dividends, we maintain a dividend reinvestment plan enabling participating shareholders to elect to purchase shares of our common stock in lieu of receiving cash dividends. Such shares may be newly issued or acquired by us in the open market. New shares issued under this plan are limited to 1 million.
In June 2006, our Board of Directors authorized management, in its discretion, to repurchase up to 300,000 shares, representing approximately 3.8% of our common stock, by no later than June 30, 2007. The program allowed us to repurchase our shares as opportunities arose at prevailing market prices in open market or privately negotiated transactions. Shares repurchased are held as treasury stock and accordingly, are accounted for as a reduction of stockholder’s equity. We repurchased the final 50,000 shares authorized under this program prior to June 30, 2007. In July 2007, our Board of Directors approved a reimplementation of this program, for an additional 300,000 shares, through June 30, 2008. We repurchased 79,000 shares under this extended program between July 1 and December 31, 2007. No shares were repurchased in 2008 and this program expired on June 30, 2008.
15
Table of Contents
Performance Graph
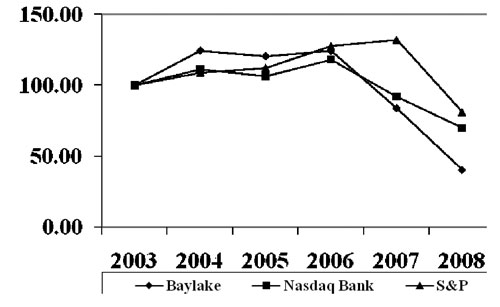
The following graph shows the cumulative stockholder return on our common stock over the last five fiscal years compared to the returns of Standard & Poors 500 Stock Index and the NASDAQ Bank Index, prepared for NASDAQ by the Center for Research in Securities Prices at the University of Chicago.
Cumulative Total Return
| | | | | | | | | | | | | | | | | | | |
| | At December 31, | |
| | 2003 | | 2004 | | 2005 | | 2006 | | 2007 | | 2008 | |
Baylake Corp. | | | 100.00 | | | 124.17 | | | 120.32 | | | 124.01 | | | 83.71 | | | 40.44 | |
NASDAQ Bank Index | | | 100.00 | | | 110.99 | | | 106.18 | | | 117.87 | | | 91.85 | | | 69.88 | |
S&P 500 | | | 100.00 | | | 108.99 | | | 112.26 | | | 127.55 | | | 132.06 | | | 81.23 | |
| |
(1) | Assumes $100 invested on December 31, 2003 in each of Baylake Corp. common stock, the Standard & Poors 500 Stock Index and the NASDAQ Bank Index. Dividends are assumed to be reinvested. |
16
Table of Contents
ITEM 6.SELECTED FINANCIAL DATA
BAYLAKE CORP.
FIVE YEAR SELECTED CONSOLIDATED FINANCIAL DATA
| | | | | | | | | | | | | | | | |
| | Year Ended December 31, | | | | | | | |
| | 2008 | | 2007 | | 2006 | | 2005 | | 2004 | |
| | (dollars in thousands, except per share data) | |
|
Results of operations: | | | | | | | | | | | | | | | | |
Interest and dividend income | | $ | 57,276 | | $ | 69,668 | | $ | 70,014 | | $ | 61,538 | | $ | 50,362 | |
Interest expense | | | 28,227 | | | 38,753 | | | 36,378 | | | 26,660 | | | 16,357 | |
Net interest income | | | 29,049 | | | 30,915 | | | 33,636 | | | 34,878 | | | 34,005 | |
Provision for loan losses | | | 17,961 | | | 9,761 | | | 903 | | | 3,217 | | | 1,599 | |
Net interest income after provision for loan losses | | | 11,088 | | | 21,154 | | | 32,733 | | | 31,661 | | | 32,406 | |
| | | | | | | | | | | | | | | | |
Non-interest income | | | 9,257 | | | 9,174 | | | 9,737 | | | 11,597 | | | 9,526 | |
Non-interest expense: | | | 38,022 | | | 32,578 | | | 32,329 | | | 30,519 | | | 26,479 | |
Income (loss) before provision (benefit) for income taxes | | | (17,677 | ) | | (2,250 | ) | | 10,141 | | | 12,739 | | | 15,453 | |
| | | | | | | | | | | | | | | | |
Income tax provision (benefit) | | | (7,860 | ) | | (2,416 | ) | | 2,765 | | | 3,836 | | | 4,680 | |
| | | | | | | | | | | | | | | | |
Net income (loss) | | $ | (9,817 | ) | $ | 166 | | $ | 7,376 | | $ | 8,903 | | $ | 10,773 | |
| | | | | | | | | | | | | | | | |
Per Share Data:(1) | | | | | | | | | | | | | | | | |
| | | | | | | | | | | | | | | | |
Net income (loss) per share (basic) | | $ | (1.24 | ) | $ | 0.02 | | $ | 0.95 | | $ | 1.15 | | $ | 1.41 | |
Net income (loss) per share (diluted) | | | (1.24 | ) | | 0.02 | | | 0.94 | | | 1.14 | | | 1.40 | |
Cash dividends per common share | | | — | | | 0.64 | | | 0.64 | | | 0.61 | | | 0.57 | |
Book value per share at end of period | | | 8.72 | | | 10.18 | | | 10.50 | | | 10.09 | | | 9.91 | |
| | | | | | | | | | | | | | | | |
Selected Financial Condition
Data (at December 31): | | | | | | | | | | | | | | | | |
Total assets | | $ | 1,062,913 | | $ | 1,106,616 | | $ | 1,111,684 | | $ | 1,089,408 | | $ | 1,047,748 | |
Securities | | | 225,417 | | | 222,475 | | | 188,315 | | | 171,638 | | | 197,392 | |
Gross loans | | | 728,722 | | | 760,210 | | | 819,568 | | | 812,296 | | | 757,228 | |
Total deposits | | | 849,758 | | | 884,185 | | | 878,911 | | | 856,711 | | | 844,541 | |
|
Short-term borrowings (2) | | | 30,174 | | | 27,174 | | | 4,480 | | | 1,315 | | | 1,284 | |
|
Other borrowings (3) | | | 85,095 | | | 85,172 | | | 115,179 | | | 125,185 | | | 100,192 | |
Subordinated debentures | | | 16,100 | | | 16,100 | | | 16,100 | | | 16,100 | | | 16,100 | |
Total shareholders’ equity | | | 68,954 | | | 80,262 | | | 82,193 | | | 78,544 | | | 76,205 | |
| | | | | | | | | | | | | | | | |
Performance Ratios: | | | | | | | | | | | | | | | | |
Return on average assets | | | (0.91 | %) | | 0.02 | % | | 0.67 | % | | 0.82 | % | | 1.07 | % |
Return on average total shareholders’ equity | | | (12.35 | %) | | 0.21 | % | | 9.33 | % | | 11.51 | % | | 14.88 | % |
Dividend payout ratio | | | — | | | 3,030.48 | % | | 67.67 | % | | 52.99 | % | | 40.49 | % |
Net interest margin (4) | | | 3.11 | % | | 3.21 | % | | 3.44 | % | | 3.60 | % | | 3.76 | % |
Net interest spread (4) | | | 2.89 | % | | 2.80 | % | | 3.05 | % | | 3.27 | % | | 3.52 | % |
Non-interest income to average assets | | | 0.86 | % | | 0.83 | % | | 0.89 | % | | 1.07 | % | | 0.94 | % |
Non-interest expense to average assets | | | 3.53 | % | | 2.96 | % | | 2.94 | % | | 2.81 | % | | 2.63 | % |
Net overhead ratio (5) | | | 2.67 | % | | 2.12 | % | | 2.06 | % | | 1.74 | % | | 1.68 | % |
Average loan-to-average deposit ratio | | | 87.18 | % | | 91.24 | % | | 94.73 | % | | 94.16 | % | | 93.63 | % |
Average interest-earning assets to average interest-bearing liabilities | | | 107.41 | % | | 110.58 | % | | 111.09 | % | | 112.73 | % | | 113.59 | % |
Efficiency ratio (6) | | | 97.54 | % | | 78.93 | % | | 72.48 | % | | 63.88 | % | | 52.23 | % |
| | | | | | | | | | | | | | | | |
Asset Quality Ratios:(7) | | | | | | | | | | | | | | | | |
Non-performing loans to total loans | | | 6.04 | % | | 4.94 | % | | 3.40 | % | | 0.85 | % | | 0.78 | % |
Allowance for loan losses to: | | | | | | | | | | | | | | | | |
Gross loans | | | 1.86 | % | | 1.56 | % | | 0.98 | % | | 1.18 | % | | 1.38 | % |
Non-performing loans | | | 30.78 | % | | 31.53 | % | | 29.46 | % | | 137.58 | % | | 176.44 | % |
Net charge-offs to average loans | | | 2.18 | % | | 0.74 | % | | 0.29 | % | | 0.52 | % | | 0.45 | % |
Non-performing assets to total assets | | | 4.82 | % | | 3.86 | % | | 3.02 | % | | 0.94 | % | | 0.81 | % |
| | | | | | | | | | | | | | | | |
Capital Ratios:(8) | | | | | | | | | | | | | | | | |
Shareholders’ equity to assets | | | 6.49 | % | | 7.25 | % | | 7.39 | % | | 7.21 | % | | 7.27 | % |
Tier 1 risk-based capital | | | 8.47 | % | | 10.07 | % | | 10.00 | % | | 9.70 | % | | 9.75 | % |
Total risk-based capital | | | 9.72 | % | | 11.32 | % | | 10.87 | % | | 10.73 | % | | 10.95 | % |
Leverage ratio | | | 6.68 | % | | 8.34 | % | | 8.53 | % | | 8.27 | % | | 8.27 | % |
17
Table of Contents
| |
(1) | Earnings per share are based on the weighted average number of shares outstanding for the period. |
(2) | Consists of federal funds purchased and repurchase agreements. |
(3) | Consists of Federal Home Loan Bank term notes and borrowings from unaffiliated correspondent bank. |
(4) | Net interest margin represents net interest income as a percentage of average interest-earning assets, and net interest rate spread represents the difference between the weighted average yield on interest-earning assets and the weighted average cost of interest-bearing liabilities. |
(5) | Net overhead ratio represents the difference between non-interest expense and non-interest income, divided by average assets. |
(6) | Efficiency ratio represents non-interest expense, excluding gains/losses from sales of fixed assets divided by the sum of tax equivalent interest income and non-interest income, excluding gains/losses from sales of securities. |
(7) | Non-performing loans consist of non-accrual loans, guaranteed loans 90 days or more past due but still accruing interest and restructured loans. Non-performing assets include non-performing loans and foreclosed assets. |
(8) | The capital ratios are presented on a consolidated basis. For information on our regulatory capital requirements, see Item 7. “Management’s Discussion and Analysis of Financial Condition and Results of Operations-Capital Resources” and Item 1. “Business-Regulation and Supervision”. |
ITEM 7.MANAGEMENT’S DISCUSSION AND ANALYSIS OF FINANCIAL CONDITION AND RESULTS OF OPERATIONS
General
The following sets forth management’s discussion and analysis of our consolidated financial condition and results of operations that should be read in conjunction with our consolidated financial statements, related notes, the selected financial data and the statistical information presented elsewhere in this report for a more complete understanding of the following discussion and analysis.
Critical Accounting Policies
In the course of our normal business activity, management must select and apply many accounting policies and methodologies that are the basis for the financial results presented in our consolidated financial statements. Some of these policies are more critical than others.
18
Table of Contents
Allowance for Loan Losses: The ALL represents management’s estimate of probable and inherent credit losses in the loan portfolio. Estimating the amount of the ALL requires the exercise of significant judgment and the use of estimates related to the amount and timing of expected future cash flows on impaired loans, estimated losses on pools of homogeneous loans based on historical loss experience, and consideration of current economic trends and conditions, all of which may be susceptible to significant change. The loan portfolio also represents the largest asset on the consolidated balance sheet. Loan losses are charged off against the ALL while recoveries of amounts previously charged off are credited to the ALL. A provision for loan losses (“PFLL”) is charged to operations based on management’s periodic evaluation of the factors previously mentioned, as well as other pertinent factors.
The ALL consists of an allocated component on specific loans and an unallocated component for loans without specific reserves. The components of the ALL represent estimations pursuant to either SFAS No. 5,Accounting for Contingencies, or SFAS No. 114,Accounting by Creditors for Impairment of a Loan. The allocated component of the ALL for loan losses reflects estimated losses from analyses developed through specific credit allocations for individual loans and historical loss experience for each loan category. The specific credit allocations are based on regular analyses of all impaired non-homogenous loans. These analyses involve a high degree of judgment in estimating the amount of loss associated with specific loans, including estimating the amount and timing of future cash flows and collateral values. The unallocated component is based on our historical loss experience which is updated quarterly. The unallocated component of the allowance for loan losses also includes consideration of concentrations, changes in portfolio mix and volume and other qualitative factors.
There are many factors affecting the ALL; some are quantitative while others require qualitative judgment. The process for determining the ALL (which management believes adequately considers potential factors which might possibly result in credit losses) includes subjective elements and, therefore, may be susceptible to significant change. To the extent actual outcomes differ from management estimates, additional PFLL could be required that could adversely affect our earnings or financial position in future periods. Allocations of the ALL may be made for specific loans but the entire ALL is available for any loan that, in management’s judgment, should be charged-off or for which an actual loss is realized.
Foreclosed Assets: Foreclosed assets acquired through or in lieu of loan foreclosure are initially recorded at fair value when acquired, less estimated costs to sell, establishing a new cost basis. Fair value is determined using a variety of market information including but not limited to appraisals, professional market assessments and real estate tax assessment information. If fair value declines subsequent to foreclosure, a valuation allowance is recorded through expense. Costs after acquisition are expensed.
Provision for Impairment of Standby Letters of Credit: The provision for impairment of standby letters of credit represents management’s estimate of probable incurred losses on off-balance sheet standby letters of credit which are used to support our customers’ business arrangements with an unrelated third party. In the event of further impairment, a provision for impairment of standby letter of credit is charged to operations based on management’s periodic evaluation of the factors affecting the standby letters of credit. See the Non-Interest Expense discussion in this Management’s Discussion and Analysis of Financial Condition and Results of Operations for further information.
Income Tax Accounting: The assessment of tax assets and liabilities involves the use of estimates, assumptions, interpretations, and judgments concerning certain accounting pronouncements and federal and state tax codes. There can be no assurance that future events, such as court decisions or positions of federal and state taxing authorities, will not differ from management’s current assessment, the impact of which could be significant to the consolidated results of our operations and reported earnings. We believe that the tax assets and liabilities are adequate and properly recorded in the consolidated financial statements. See Note 16-”Income Tax Expense” to our consolidated financial statements for further information.
19
Table of Contents
Income tax expense may be affected by developments in the state of Wisconsin. Like many financial institutions that are located in Wisconsin, a subsidiary of our bank located in the state of Nevada holds and manages various investment securities. Because these subsidiaries are located outside Wisconsin, income from their operations has not historically been subject to Wisconsin state taxation. Although the WDOR issued favorable tax rulings regarding Nevada subsidiaries of Wisconsin financial institutions at the time such subsidiaries were formed, WDOR representatives have stated that the WDOR intends to revoke those rulings and tax some or all these subsidiaries’ income, even though there has been no intervening change in the law. The WDOR also implemented a program in 2003 for the audit of Wisconsin financial institutions that have formed and contributed assets to subsidiaries located in Nevada.
We continue to believe that we have reported income and paid Wisconsin taxes correctly in accordance with applicable tax laws and the WDOR’s prior longstanding interpretations thereof, including interpretations issued specifically to it. However, in view of the WDOR’s subsequent change in position (even if that change does not have a basis in law), the aggressive stance taken by the WDOR, the settlements by many other banks, and the potential effect that decisions by other similarly situated institutions may have on our alternatives going forward, we determined that we would consider a settlement proposal from the WDOR. In July 2007, WDOR notified us that they would be auditing our tax returns for the years 2002 through 2006. During the third and fourth quarter of 2007, a formal audit of our bank was commenced by WDOR. In February 2008, the only proposed adjustment made during the course of the audit was to reallocate income of the Nevada subsidiary to our bank and WDOR issued a proposed assessment. However, no formal final assessment was issued.
Management, in coordination with outside counsel, negotiated a settlement with WDOR to resolve all Wisconsin tax matters for all tax years through and including 2006, and 2007 for all issues arising in connection with our Nevada Subsidiary. This settlement amount agreed to by our bank will be paid over three years in equal installments (the “Settlement Payments”). We previously accrued more than a sufficient amount to cover the Settlement Payments; accordingly, the Settlement Payments will not have a material impact on our operations going forward. The first installment was paid to WDOR during the fourth quarter of 2008.
In February 2009, the State of Wisconsin passed legislation that requires tax reporting on a consolidated basis (known as “combined reporting”) effective January 1, 2009. We are evaluating this legislation and have not yet determined its effect on the recorded value of our deferred tax assets or its overall financial impact.
Overview
We are a full-service financial services company, providing a wide variety of loan, deposit and other banking products and services to our business, individual or retail, and municipal customers, as well as a full range of trust, investment and cash management services. We are the bank holding company of Baylake Bank, chartered as a state bank in Wisconsin and a member bank of the Federal Reserve and Federal Home Loan Bank.
Our profitability, like most financial institutions, is dependent to a large extent upon net interest income. Results of operations are also affected by the provision for loan losses, operating expenses, income taxes and, to a lesser extent, non-interest income. Economic conditions, competition and the monetary and fiscal policies of the Federal government in general, significantly affect financial institutions, including us. During the latter half of 2004 continuing through mid-year 2006, the FRB steadily increased interest rates intending to stabilize the current economy and keep inflation under control, since the general health of the United States economy was strong. From mid-year 2006 through mid-year 2007, the FRB kept interest rates stable. Since September 2007, however, the FRB has significantly decreased interest rates. Net interest income decreased for 2007 due to our high level of non-performing, non-accrual loans and reduced interest income. Lending activities are also influenced by regional and local economic factors, including specifically the demand for and supply of housing, competition among lenders, interest rate conditions and prevailing market rates on competing investments, customer preferences and levels of personal income and savings in our market area.
In the last several years, we have initiated strategic changes to our bank operations intended to enhance utilization of resources and the effectiveness of customer services within our market areas. We have developed an internal customer relationship management system (“CRM”) to more effectively manage and market to our internal customer base.
20
Table of Contents
Throughout the first three quarters of 2008, our regulatory capital ratios and those of our bank were in excess of the levels established by regulatory agencies for “well capitalized” financial institutions. During the fourth quarter of 2008, our regulatory capital ratios and those of our bank fell below “well capitalized” levels, but remained in excess of levels established for “adequately capitalized” financial institutions. We continue our emphasis on improving asset quality, especially related to our level of non-performing commercial loans.
Performance Summary
The following is a brief summary of some of the factors that affected our operating results in 2008. See the remainder of this section for a more thorough discussion.
We reported a net loss of $9.8 million for the year ended December 31, 2008, a decrease of $10.0 million compared to $0.2 million earned in 2007. Both basic and diluted loss per share were $1.24 for 2008 compared to $0.02 basic and diluted earnings per share for 2007. Return on average assets for the year ended December 31, 2008 was -.91% and 0.02% for the year ended December 31, 2007. The return on average equity was -12.35% for 2008 and 0.21% for 2007. No cash dividends were declared in 2008, compared to $0.64 per share in 2007. Key factors behind these results were:
| | |
| § | Net interest income and net interest margin were impacted in 2008 by a decreasing interest rate environment for most of the year, thereby decreasing interest spread. |
| § | Tax-equivalent net interest income was $30.5 million for 2008, a decrease of $1.9 million or 5.9% from $32.4 million for 2007. Tax-equivalent interest income decreased $12.4 million, while interest expense decreased $10.5 million. The decrease in tax-equivalent net interest income was attributable to unfavorable volume variances with balance sheet reduction and differences in the mix of average earning assets and average interest-bearing liabilities negatively impacting tax-equivalent net interest income by $1.9 million. The net interest margin for 2008 was 3.11%, compared to 3.21% in 2007. The 10 bps decrease in net interest margin largely resulted from a 9 bps increase in interest rate spread caused by a 106 bps decrease in the return on interest-bearing assets which was more than offset by a 115 bps decrease in the cost of interest-earning liabilities. |
| § | Total loans were $728.7 million at December 31, 2008, a decrease of $31.5 million, or 4.1%, from December 31, 2007. Commercial real estate loans decreased $5.2 million (1.3%) and represented 52.4% of total loans at December 31, 2008, compared to 50.9% at year-end 2007. Total deposits were $849.8 million at December 31, 2008, a decrease of $34.4 million, or 3.9%, from year-end 2007. |
| § | Charge-offs increased from a year ago. Net loan charge-offs were $16.2 million in 2008, an increase of $10.2 million over 2007 results. Net loan charge-offs for commercial loans represented $11.2 million of the $16.2 million total in 2008. Net loan charge-offs represented 2.18% of average loans in 2008 compared to 0.74% in 2007. The provision for loan losses increased to $18.0 million for 2008 compared to $9.8 million in 2007. |
| § | Non-interest income was $9.3 million for 2008, an increase of $0.1 million or 0.9% from 2007 results. A $0.4 million increase in net gains from sales of securities, an increase in equity earnings of our UFS subsidiary of $0.3 million, a $0.4 million increase in fees for services to customers and a settlement favoring the Company of $0.5 million were offset by a $0.8 million lower increase in the cash surrender value of life insurance. In addition, fees from loan servicing and net gains from sales of loans declined $0.3 million each during 2008. |
| § | Non-interest expense was $38.0 million for 2008, an increase of $5.4 million over 2007 results. This was primarily the result of a provision on a standby letter of credit of $2.5 million, a provision for other than temporary impairment of securities of $1.9 million and increases in the areas of operation of foreclosed properties and loan and collection expenses of $3.1 million and $0.2 million, respectively, offset by a decline of $2.3 million in salaries and employee benefits due to management restructuring, reduced staffing levels and reduced bonus expense. |
| § | Provision for income taxes resulted in a tax benefit of $7.9 million versus a tax benefit of $2.4 million for 2007. |
21
Table of Contents
STATEMENT OF OPERATIONS ANALYSIS
2008 compared to 2007
Net Interest Income
Net interest income represents the difference between interest earned on interest-earning assets and interest paid on interest-bearing liabilities. The interest income and interest expense of financial institutions are significantly affected by general economic conditions, competition, policies of regulatory authorities and other factors.
Interest rate spread and net interest margin are used to measure and explain changes in net interest income. Interest rate spread is the difference between the yield on earning assets and the rate paid for interest-bearing liabilities that fund those assets. Net interest margin is expressed as the percentage of net interest income to average earning assets. Net interest margin exceeds interest rate spread because non-interest bearing sources of funds (“net free funds”), principally demand deposits and stockholders’ equity, also support earning assets. To compare tax-exempt asset yields to taxable yields, the yield on tax-exempt loans and securities is computed on a tax equivalent basis. The narrative below discusses net interest income, interest rate spread and net interest margin on a tax equivalent basis.
Table 1 provides average balances of interest-earning assets and interest-bearing liabilities, interest income and expense, and the corresponding interest rates earned and paid, as well as net interest income, interest spread, and net interest margin on a tax-equivalent basis for the years ended December 31, 2008, 2007 and 2006.
Net interest income in the consolidated statements of operations (which excludes the tax equivalent adjustment) was $29.0 million for 2008, compared to $30.9 million for 2007. Net interest income in both 2008 and 2007 was negatively impacted by the high level of non-performing loans for which interest income is not recognized. In addition, the high level of non-performing loans further decreased net interest income. The tax equivalent adjustments (adjustments needed to bring tax-exempt interest to a level that would yield the same after-tax income had that income been subject to taxation using a 34% tax rate) of $1.5 million for both 2008 and for 2007 resulted in a tax-equivalent net interest income of $30.5 million and $32.5 million, respectively. The decrease in 2008 net interest income was also impacted by a reduced level of earning assets. The net interest margin for 2008 was 3.11% compared to 3.21% in 2007. The 10 bps decrease in net interest margin is attributable to a 9 bps increase in interest rate spread resulting from a 106 bps decline in return on interest-bearing assets, which was more than offset by a 115 bps decrease in the cost of interest-earning liabilities in 2008.
We had positioned the balance sheet to be slightly asset sensitive (which means that assets will re-price faster than liabilities); thus, the rate decreases impacted net interest income negatively. We expect that in a gradually increasing rate environment, our income statement would benefit from asset sensitivity over the long term, although changes in the portfolio or the pace of increases could affect that trend.
As shown in the rate/volume analysis in Table 2, volume changes resulted in a $1.9 million decrease to tax equivalent net interest income in 2008. The decrease and composition of earning assets resulted in a $12.4 million decrease to tax equivalent net interest income in 2008 offset by a $10.5 million decrease and composition change in interest-bearing liabilities. Rate changes on earning assets decreased interest income by $10.3 million but were offset by rate changes on interest-bearing liabilities that decreased interest expense by $10.3 million, for no net rate impact.
For 2008, the yield on earning assets declined to 5.98%, attributable to a decrease of 133 bps in the loan yield, a 7 bps decline in the yield on tax-exempt securities, a 282 bps decrease in the yield on federal funds sold and a 217 bps decrease in the yield on money market instruments. These decreases were offset by a 34 bps increase in the yield achieved on agency securities and a 179 bps increase in yield on other securities. The average loan yield was 6.27% in 2008 and 7.60% in 2007. Competitive pricing on new and refinanced loans, as well as tightened credit underwriting standards, dampened efforts for improvements in loan yields in 2008.
22
Table of Contents
For 2008, the cost of interest-bearing liabilities decreased by 115 bps compared to 2007, to 3.09%, resulting, in part, from a significant decrease in interest rates in 2008. The combined average cost of interest-bearing deposits was 3.06%, down 99 bps from 2007, primarily resulting from an average decrease in the short-term interest rate environment during 2008. Also contributing to the decrease was the cost of wholesale funding (comprised of federal funds purchased; repurchase agreements; FHLB advances and subordinated debentures) which decreased by 213 bps to 3.26% for 2008, impacted favorably by a decreasing interest rate environment for wholesale funding costs during the year on reduced borrowings.
Average earning assets were $ 982.3 million in 2008, as compared to $1.0 billion in 2007. Average loans outstanding declined to $743.9 million in 2008 from $804.5 million in 2007, a decrease of 7.5%. Average loans to average total assets decreased to 69.0% in 2008 from 73.0% in 2007. For 2008, tax-equivalent interest income on loans decreased $14.5 million, of which $3.3 million related to the decline in average outstanding balances and $11.2 million decrease related to the lower yields on such loans. Balances of securities and short-term investments increased $31.4 million on average. Tax equivalent interest income on securities and short-term investments increased $1.2 million from volume changes, and $0.9 million from the impact of the rate environment, for a combined $2.1 million increase in tax equivalent interest income.
Average interest-bearing liabilities decreased $0.2 million from 2007, while net free funds (the total of demand deposits, accrued expenses, other liabilities and stockholders’ equity less non-interest earning assets) decreased $23.2 million. The decrease in net free funds is primarily attributable to a decrease in demand deposits. Average non-interest bearing demand deposits decreased by $20.9 million, or 22.3%. Average interest-bearing deposits declined $7.5 million, or 1.0%, to $780.5 million. This decline resulted from a decline in savings deposits and time deposits greater than $100,000 offset by increases in interest-bearing demand deposits and time deposits less than $100,000. Interest expense on interest-bearing deposits decreased $0.2 million from the volume and mix changes and $7.9 million from impact of the rate environment, resulting in an aggregate decrease of $8.1 million in interest expense on interest-earning deposits. Average wholesale-funding sources decreased by $7.3 million during 2008. For 2008, interest expense on wholesale funding sources decreased by $2.5 million from declining rates versus 2007 results.
23
Table of Contents
Table 1: Average Balances and Interest Rates (interest and rates on a tax-equivalent basis)
| | | | | | | | | | | | | | | | | | | | | | | | | |
| | Year ended December 31, | |
| | 2008 | | 2007 | | 2006 | |
| | Average
Balance (1) | | Interest | | Average
Rate | | Average
Balance (1) | | Interest | | Average
Rate | | Average
Balance (1) | | Interest | | Average
Rate | |
| | (dollars in thousands) | |
ASSETS: | | | | | | | | | | | | | | | | | | | | | | | | | |
Earning Assets | | | | | | | | | | | | | | | | | | | | | | | | | |
Loans (2)(3)(4) | | $ | 743,930 | | | 46,640 | | 6.27 | % | $ | 804,493 | | | 61,165 | | 7.60 | % | $ | 818,086 | | | 61,909 | | 7.57 | % |
U.S. Treasuries | | | — | | | — | | 0.00 | % | | — | | | — | | 0.00 | % | | 72 | | | 3 | | 4.17 | % |
US government approved agencies | | | 151,622 | | | 7,122 | | 4.70 | % | | 135,372 | | | 5,898 | | 4.36 | % | | 136,226 | | | 5,928 | | 4.35 | % |
State and municipal obligations (2) | | | 55,268 | | | 3,368 | | 6.09 | % | | 52,330 | | | 3,225 | | 6.16 | % | | 39,728 | | | 2,573 | | 6.48 | % |
Other Securities | | | 21,488 | | | 1,400 | | 6.52 | % | | 12,635 | | | 598 | | 4.73 | % | | 10,671 | | | 450 | | 4.22 | % |
Federal funds sold | | | 7,003 | | | 149 | | 2.13 | % | | 3,211 | | | 159 | | 4.95 | % | | 5,694 | | | 290 | | 5.09 | % |
Other money market instruments | | | 2,988 | | | 76 | | 2.55 | % | | 3,373 | | | 159 | | 4.71 | % | | 1,983 | | | 89 | | 4.49 | % |
Total earning assets | | $ | 982,299 | | $ | 58,755 | | 5.98 | % | $ | 1,011,414 | | $ | 71,204 | | 7.04 | % | $ | 1,012,460 | | $ | 71,242 | | 7.04 | % |
Non-interest earning assets | | | 96,137 | | | | | | | | 90,376 | | | | | | | | 85,640 | | | | | | |
Total assets | | $ | 1,078,436 | | | | | | | $ | 1,101,790 | | | | | | | $ | 1,098,100 | | | | | | |
LIABILITIES AND STOCKHOLDERS’ EQUITY | | | | | | | | | | | | | | | | | | | | | | | | | |
Interest bearing Liabilities | | | | | | | | | | | | | | | | | | | | | | | | | |
NOW accounts | | $ | 123,404 | | $ | 1,556 | | 1.26 | % | $ | 110,322 | | $ | 2,798 | | 2.54 | % | $ | 103,740 | | $ | 2,353 | | 2.27 | % |
Savings accounts | | | 232,495 | | | 4,312 | | 1.85 | % | | 262,026 | | | 9,125 | | 3.48 | % | | 263,018 | | | 8,970 | | 3.41 | % |
Time deposits> $100M | | | 211,476 | | | 9,322 | | 4.41 | % | | 212,133 | | | 10,420 | | 4.91 | % | | 218,116 | | | 9,558 | | 4.38 | % |
Time deposits<$100M | | | 213,147 | | | 8,671 | | 4.07 | % | | 203,547 | | | 9,587 | | 4.71 | % | | 183,755 | | | 7,604 | | 4.14 | % |
Total interest-bearing deposits | | | 780,522 | | | 23,861 | | 3.06 | % | | 788,028 | | | 31,930 | | 4.05 | % | | 768,629 | | | 28,485 | | 3.71 | % |
Federal funds purchased | | | 2,888 | | | 86 | | 2.98 | % | | 9,067 | | | 497 | | 5.48 | % | | 7,496 | | | 394 | | 5.26 | % |
Repurchase agreements | | | 29,861 | | | 695 | | 2.33 | % | | 7,981 | | | 387 | | 4.85 | % | | 1,207 | | | 48 | | 3.98 | % |
FHLB advances | | | 85,145 | | | 2,791 | | 3.28 | % | | 93,504 | | | 4,850 | | 5.19 | % | | 117,702 | | | 5,745 | | 4.88 | % |
Subordinated debentures | | | 16,100 | | | 794 | | 4.93 | % | | 16,100 | | | 1,089 | | 6.76 | % | | 16,365 | | | 1,705 | | 10.42 | % |
Long term debt | | | — | | | — | | — | | | — | | | — | | — | | | — | | | — | | — | |
Total interest-bearing liabilities | | $ | 914,516 | | $ | 28,227 | | 3.09 | % | $ | 914,680 | | $ | 38,753 | | 4.24 | % | $ | 911,399 | | $ | 36,377 | | 3.99 | % |
Demand deposits | | | 72,852 | | | | | | | | 93,706 | | | | | | | | 94,938 | | | | | | |
Accrued expenses and other liabilities | | | 11,546 | | | | | | | | 12,587 | | | | | | | | 12,672 | | | | | | |
Stockholders’ equity | | | 79,522 | | | | | | | | 80,817 | | | | | | | | 79,091 | | | | | | |
Total liabilities and shareholders’ equity | | $ | 1,078,436 | | | | | | | $ | 1,101,790 | | | | | | | $ | 1,098,100 | | | | | | |
Net interest income and rate spread | | | | | $ | 30,528 | | 2.89 | % | | | | $ | 32,451 | | 2.80 | % | | | | $ | 34,865 | | 3.05 | % |
Net interest margin | | | | | | | | 3.11 | % | | | | | | | 3.21 | % | | | | | | | 3.44 | % |
| | |
| (1) | Average balances were generally computed using daily balances. |
| (2) | The yield on tax exempt loans and securities is computed on a tax-equivalent basis using a tax rate of 34% for all periods presented. |
| (3) | Nonaccrual loans and loans held for sale have been included in the average balances. |
| (4) | Interest income includes loan fees, net of amortization. |
24
Table of Contents
Table 2: Rate/Volume Analysis (1)
| | | | | | | | | | | | | | | | | | | |
| | 2008 compared to 2007
Increase (Decrease) due to | | 2007 compared to 2006
Increase (Decrease) due to | |
| | Volume | | Rate | | Net | | Volume | | Rate | | Net | |
| | (dollars in thousands) | |
Interest income: | | | | | | | | | | | | | | | | | | | |
Loans (2) | | $ | (3,306 | ) | $ | (11,219 | ) | $ | (14,525 | ) | $ | (1,070 | ) | $ | 326 | | $ | (744 | ) |
U.S. treasuries | | | — | | | — | | | — | | | (3 | ) | | — | | | (3 | ) |
US government approved agencies | | | 556 | | | 668 | | | 1,224 | | | (37 | ) | | 7 | | | (30 | ) |
State and municipal obligations (2) | | | 135 | | | 8 | | | 143 | | | 782 | | | (130 | ) | | 652 | |
Other securities | | | 391 | | | 411 | | | 802 | | | 89 | | | 59 | | | 148 | |
Federal funds sold | | | 87 | | | (97 | ) | | (10 | ) | | (123 | ) | | (8 | ) | | (131 | ) |
Other money market instruments | | | (12 | ) | | (71 | ) | | (83 | ) | | 65 | | | 5 | | | 70 | |
Total earning assets | | | (2,149 | ) | | (10,300 | ) | | (12,449 | ) | | (297 | ) | | 259 | | | (38 | ) |
Interest expense: | | | | | | | | | | | | | | | | | | | |
NOW accounts | | | 225 | | | (1,467 | ) | | (1,242 | ) | | 155 | | | 290 | | | 445 | |
Savings accounts | | | (701 | ) | | (4,112 | ) | | (4,813 | ) | | (34 | ) | | 189 | | | 155 | |
Time deposits | | | 303 | | | (2,317 | ) | | (2,014 | ) | | 601 | | | 2,244 | | | 2,845 | |
Federal funds purchased | | | (185 | ) | | (226 | ) | | (411 | ) | | 85 | | | 18 | | | 103 | |
Repurchase agreements | | | 448 | | | (140 | ) | | 308 | | | 326 | | | 13 | | | 339 | |
FHLB advances | | | (302 | ) | | (1,757 | ) | | (2,059 | ) | | (1,238 | ) | | 343 | | | (895 | ) |
Subordinated debentures | | | — | | | (295 | ) | | (295 | ) | | (27 | ) | | (589 | ) | | (616 | ) |
Long term debt | | | — | | | — | | | — | | | — | | | — | | | — | |
Total interest-bearing liabilities | | | (212 | ) | | (10,314 | ) | | (10,526 | ) | | (132 | ) | | 2,508 | | | 2,376 | |
Net interest income | | $ | (1,937 | ) | $ | 14 | | $ | (1,923 | ) | $ | (165 | ) | $ | (2,249 | ) | $ | (2,414 | ) |
| | |
| (1) | The change in interest due to both rate and volume has been allocated proportional to the relationship to the dollar amounts of the change in each. |
| (2) | The yield on tax-exempt loans and securities is computed on a tax equivalent basis using a tax rate of 34% for all periods presented. |
Provision for Loan Losses
The PFLL is the cost of providing an allowance for probable and inherent losses. The allowance consists of specific and general components. Our internal risk system is used to identify loans that meet the criteria for being “impaired” under the definition of SFAS 114. The specific component relates to loans that are individually classified as impaired. These loans identified for impairment are assigned a loss allocation based upon that analysis. The general component covers non-impaired loans and is based on historical loss experience adjusted for qualitative factors. These qualitative factors include repayment risk, employment and inflation statistics, concentration risk based on industry type, new product growth and portfolio growth.
Net loan charge-offs for the year ended December 31, 2008 were $16.2 million compared to net charge-offs of $6.0 million for the same period in 2007. Net charge-offs to average loans were 2.18% for 2008 compared to 0.74% in 2007. For 2008, non-performing loans increased by $6.5 million, 17.3% to $44.1 million from $37.6 million at December 31, 2007. Refer to the “Financial Condition - Risk Management and the Allowance for Loan Losses” and “Financial Condition - Non-Performing Loans and Foreclosed Properties” sections below for more information related to non-performing loans.
25
Table of Contents
Our management believes that the PFLL taken for the year ended December 31, 2008 is adequate in view of the present condition of the loan portfolio and the amount and quality of the collateral supporting non-performing loans. We are continually monitoring non-performing loan relationships and will make provisions, as necessary, if the facts and circumstances change. In addition, a decline in the quality of our loan portfolio as a result of general economic conditions, factors affecting particular borrowers or our market area, or otherwise, could affect the adequacy of the ALL. If there are significant charge-offs against the ALL or we otherwise determine that the ALL is inadequate, we will need to make additional PFLLs in the future. See “Financial Condition - Risk Management and the Allowance for Loan Losses” below for more information related to non-performing loans
Non-Interest Income
Trust service fees, fees from loan servicing, gains from sales of loans, securities gains, income from UFS subsidiary and service charges are the primary components of non-interest income. Total non-interest income for 2008 was $9.3 million, a $0.1 million or 0.9% increase from 2007. The non-interest income to average assets ratio was 0.86% for the year ended December 31, 2008 compared to 0.83% for the same period in 2007.
In 2008, gains from sales of loans were curtailed by a slowdown in refinancing activity throughout the industry as well as a slowdown in the Small Business Administration loan sales activity. Loan servicing fees decreased $0.3 million and gains from sales of loans decreased $0.3 million from 2007 to 2008. The decrease is the result of a decline in the outstanding portfolio balance of the loans being serviced. Secondary market loan production declined 40.9% from 2007 to 2008 ($40.8 million in 2007 versus $24.1 million in 2008).
Service charges on deposit accounts increased $0.4 million in 2008 due in part to the continuation of the High Performance Checking program (“HPC”). This has resulted in additional overdraft income and increased service charges on commercial checking accounts, as the earnings credit rate has decreased partially offset by a reduction in the number of service charge paying personal checking accounts. In addition, interchange income on debit card transactions increased from $0.5 million in 2007 to $0.6 million in 2008.
For 2008, a gain of $0.1 million was realized on the sale of vacant land to an unrelated third party.
Non-Interest Expense
Non-interest expense in 2008 increased to $38.0 million, a $5.4 million or 16.7% increase compared to 2007, primarily as a result of a provision for impairment of standby letters of credit, an other than temporary impairment of securities charge, an increase in expenses related to the operation of foreclosed properties and costs related to loans and collections, offset by a decrease in salary and employee benefit expenses.
Salaries and employee benefits expense is the largest component of non-interest expense, totaling $16.4 million in 2008, a decrease of $2.3 million, or 12.4%, from 2007 as a result of management restructuring and reduced staffing. The number of full-time equivalent employees decreased from 327 in 2007 to 315 in 2008, a decrease of 3.7%. In addition, due to our disappointing financial results in 2008 and 2007, there were no management incentive bonuses earned in either year.
Also, contributing to the decrease in salary and employee benefits were lower expenses related to the Baylake Bank Supplemental Executive Retirement Plan (“Plan”), which is intended to provide certain management and highly compensated employees of the Bank who have contributed and are expected to continue to contribute to our success with deferred compensation, in addition to that available under our other retirement programs. Costs associated with the Plan amounted to $0.2 million for 2008, a decline of $0.6 million from 2007 due to the decision by the Bank to forego a contribution to the Plan in 2008, of which a significant portion would have been accrued for during 2007. No contribution is planned in 2009 based on our 2008 financial performance. Accrued benefit costs, principally for health insurance, pension costs and bonus expense represent the remaining portion of personnel-related costs. An increase in health insurance costs is expected for 2009.
26
Table of Contents
Net occupancy expense for 2008 totaled $2.5 million, reflecting a minimal increase compared to 2007. The increase was primarily due to normal occupancy-related expense increases.
Data processing and courier expense in 2008 reflected a decrease of $0.1 million, or 6.9% compared to 2007. Management estimates that data processing expense should continue to show minimal increases in the future with adjustments related only to any volume-related increases incurred. Outsourcing of courier responsibilities contributed to the reduction in 2008.
Foreclosed property expenses are netted against income received from such properties in the determination of net foreclosed property expense. Foreclosed property reflected a net expense from the operation of such real estate of $4.2 million in 2008. Provision for valuation reductions of foreclosed properties were charged to 2008 operations in the amount of $3.6 million, reflecting a decline in perceived market values of properties obtained by us in collection efforts. A net loss of $0.1 million was recognized on the sale of foreclosed properties in 2008.
The provision for impairment loss on the letters of credit in 2008 of $2.5 million relates to a liability for our exposure on a standby letter of credit. The letter of credit supports secondary market financing on behalf of the borrower. We believe the collateral and cash flows will be sufficient to support the balance of the standby letter of credit at December 31, 2008. We continue to monitor the financial condition of the borrower on an ongoing basis and if it continues to deteriorate, we may need to provide additional reserves with respect to this off-balance sheet commitment.
Other operating expenses in 2008 increased 7.4% to $5.8 million compared to $5.4 million in 2007. Included in other operating expenses is FDIC insurance expense of $0.9 million for 2008 compared to $0.5 million for 2007. FDIC insurance consists of two components, deposit insurance premiums and payments for servicing obligations of the Financing Corporation (“FICO”) that were issued in connection with the resolution of savings and loan associations. With the enactment in early 2006 of the Federal Deposit Insurance Reform Act of 2005, major changes were introduced in the calculation of FDIC deposit insurance premiums. Such changes were effective January 1, 2007 and included establishment by the FDIC of a target reserve ratio range for the Deposit Insurance Fund (DIF) between 1.15% and 1.50%, as opposed to the prior fixed reserve ratio of 1.25%. For 2008, the FDIC approved 1.25% as the target ratio. At the same time, the FDIC adopted a new risk-based system for assessment of deposit insurance premiums under which all such institutions are required to pay at least minimum annual premiums. The system categorizes institutions in one of four risk categories, depending on capitalization and supervisory rating criteria. Our bank’s assessment rate, like that of other financial institutions, is confidential and may not be directly disclosed, except to the extent required by law. To ease the transition to the new system, insured institutions that had paid deposit insurance prior to 1997 were eligible for a one-time assessment credit based on their respective share of the aggregate assessment base. Our FDIC assessment for 2007 was offset by a portion of our one-time assessment credit with the remaining portion of the credit applied to our FDIC assessment in the first two quarters of 2008. Payments for the FICO portion will continue as long as FICO obligations remain outstanding. Due to the Bank’s performance in 2008, a change to the FDIC’s rate structure in December 2008 that will impact assessments for the first quarter of 2009 and decreases in the DIF due to recent bank failures resulting in a recently proposed 20 bps special assessment to be levied against all financial institutions in the second quarter of 2009, we expect FDIC insurance expense to increase significantly in 2009.
Loan and collection expenses were $0.2 million higher in 2008 than in 2007. This is primarily related to costs on loans that are in the collection process that have not been transferred to foreclosed properties and includes costs incurred for property management fees, real estate taxes, insurance, and operating expenses. A majority of our legal services deemed appropriate in resolving nonperforming loans were outsourced during 2008 and 2007, services that had been provided by our internal legal staff in prior years. These external legal costs totaled $0.7 million in 2008 compared to $0.8 million in 2007. In 2009, loan and collection costs are expected to continue at a comparable level, unless and until the volume of nonperforming loans declines further.
Costs related to other outside services totaled $1.0 million in 2008, $0.1 million lower than in 2007. The primary component of this expense was $0.3 million in both 2008 and 2007 related to the High Performance Checking program, including mailing, consulting fees, and material costs. This program was discontinued in October of 2008; therefore no further costs associated with the program are anticipated.
27
Table of Contents
Off-Balance Sheet Arrangements
We do not use interest rate contracts (e.g. swaps), forward loan sales or other derivatives to manage interest rate risk and do not have any of these instruments outstanding. Our bank does have, through its normal operations, loan commitments and standby letters of credit outstanding as of December 31, 2008 and 2007 in the amount of $193.8 million and $207.8 million, respectively. These are further explained in Note 13 of the Notes to our Consolidated Financial Statements.
Provision for Income Taxes
Income tax benefit totaled $7.9 million in 2008, compared to income tax benefit of $2.4 million in 2007. The increased tax benefit in 2008 reflected the increase in our loss before income taxes in 2008 compared to 2007.
See Note 1, “Summary of Significant Accounting Policies,” and Note 16, “Income Tax Expense,” of the Notes to our Consolidated Financial Statements for a further discussion of income tax accounting. Income tax expense recorded in the consolidated statements of operations involves interpretation and application of certain accounting pronouncements and federal and state tax codes and is, therefore, considered a critical accounting policy. We undergo examination by various taxing authorities. Such taxing authorities may require that changes in the amount of tax expense or valuation allowance be recognized when their interpretations differ from those of management, based on their judgments about information available to them at the time of their examinations.
2007 compared to 2006
Net Interest Income
Net interest income in the consolidated statements of operations (which excludes the tax equivalent adjustment) was $30.9 million, compared to $33.6 million in 2006. Net interest income in 2007 was negatively impacted by the high level of non-performing loans for which interest income is not recognized. Tax equivalent adjustments of $1.6 million for 2007 and $1.3 million for 2006 resulted in tax-equivalent net interest income of $32.5 million and $34.9 million, respectively. The decrease in 2007 net interest income was also impacted by increased wholesale funding costs. The net interest margin for 2007 was 3.21% compared to 3.44% in 2006. The 23 bps decrease in net interest margin is attributable to a 25 bps decrease in interest rate spread resulting from a higher cost of interest-bearing liabilities in 2007.
As shown in the rate/volume analysis in Table 2, volume changes resulted in a $0.2 million decrease to tax equivalent net interest income in 2007, while rate changes resulted in a $2.2 million decrease, for a total decrease of $2.4 million. The decrease and composition of earning assets resulted in a $0.3 million decrease to tax equivalent net interest income in 2007 offset by a $0.1 million decrease and composition change in interest-bearing liabilities. Rate changes on earning assets increased interest income by $0.3 million but were more than offset by rate changes on interest-bearing liabilities that increased interest expense by $2.5 million, for an unfavorable net rate impact of $2.2 million.
For 2007, the yield on earning assets remained unchanged from 2006 at 7.04%. The average loan yield was 7.60% in 2007 versus 7.57% in 2006. Competitive pricing on new and refinanced loans, as well as tightened credit underwriting standards, dampened efforts for improvements in loan yields in 2007.
For 2007, the cost of interest-bearing liabilities increased 25 bps compared to 2006, to 4.24%, resulting in part from a higher average interest rate environment through the first half of 2007. The combined average cost of interest-bearing deposits was 4.05%, up 34 bps from 2006, primarily resulting from an average increase in the short-term interest rate environment during 2007, as well as by an increase in the mix of deposits towards higher-cost time deposit accounts. This increase was partially offset by the cost of wholesale funding (federal funds purchased; repurchase agreements; FHLB advances and subordinated debentures) which decreased by 14 bps to 5.39% for 2007 and was impacted favorably by a decreasing interest rate environment for wholesale funding costs during 2007 on reduced borrowings.
28
Table of Contents
Average earning assets remained at $1.0 billion in 2007, the same as in 2006. Average loans outstanding also remained stable at $804.5 million and $818.1 million at year end 2007 and 2006, respectively. Average loans to average total assets decreased to 73.0% in 2007 from 74.5% in 2006. For 2007, tax equivalent interest income on loans decreased $1.1 million related to the decline in average outstanding balances, offset by a $0.3 million increase related to a slight improvement in the yields on such loans. Balances of securities and short-term investments increased $12.5 million on average. Tax equivalent interest income on securities and short-term investments increased $0.7 million from volume changes, and decreased $0.1 million from the impact of the rate environment, for a net $0.7 million increase to tax equivalent interest income.
Average interest-bearing liabilities increased $3.3 million, or 0.4%, from 2006, while net free funds (the total of demand deposits, accrued expenses, other liabilities and stockholders’ equity less non-interest earning assets) decreased $4.2 million. The decrease in net free funds is attributable to an increase in non-interest earning assets. Average non-interest bearing demand deposits decreased by $1.2 million, or 1.3%. Average interest-bearing deposits grew $19.4 million, or 2.5%, to $788.0 million. This growth resulted from increases in interest-bearing demand deposits and time deposits less than $100,000 offset by a decline in savings deposits and time deposits greater than $100,000. Interest expense on interest-bearing deposits increased $2.7 million from the impact of the rate environment and $0.7 million from volume and mix changes, resulting in an aggregate increase of $3.4 million in interest expense on interest-earning deposits. Average wholesale-funding sources decreased by $16.1 million during 2007. For 2007, interest expense on wholesale funding sources decreased by $0.9 million due to volume changes and by $0.2 million from declining rates, for an aggregate decrease of $1.1 million versus 2006 results.
BALANCE SHEET ANALYSIS
Loans
Gross loans outstanding declined to $728.7 million at December 31, 2008, a 4.1% decrease from December 31, 2007. This follows a 7.2% decrease from the end of 2006.
Table 3 reflects composition (mix) of the loan portfolio at December 31 for the previous five fiscal years:
Table 3: Loan Composition
| | | | | | | | | | | | | | | | | | | | | | | | | | |
| | As of December 31,
(dollars in thousands) | |
| | 2008 | | 2007 | | 2006 | | 2005 | | 2004 | |
| | Amount | | % of Total | | Amount | | % of Total | | Amount | | % of Total | | Amount | | % of Total | | Amount | | % of Total | |
| | | | | | | | | | | | | | | | | | | | | | | | | | |
Amount of loans by type | | | | | | | | | | | | | | | | | | | | | | | | | | |
| | | | | | | | | | | | | | | | | | | | | | | | | | |
Real estate-mortgage | | | | | | | | | | | | | | | | | | | | | | | | | | |
Commercial | | $ | 381,765 | | 52.4 | % | $ | 386,981 | | 50.9 | % | $ | 464,843 | | 56.7 | % | $ | 467,956 | | 57.6 | % | $ | 424,712 | | 56.1 | % |
1-4 Family residential | | | 134,436 | | 18.4 | % | | 119,932 | | 15.8 | % | | 143,873 | | 17.6 | % | | 148,736 | | 18.3 | % | | 134,350 | | 17.8 | % |
Construction | | | 69,838 | | 9.6 | % | | 93,047 | | 12.2 | % | | 94,082 | | 11.5 | % | | 85,729 | | 10.6 | % | | 80,384 | | 10.6 | % |
Commercial, financial and agricultural | | | 110,432 | | 15.2 | % | | 127,549 | | 16.8 | % | | 82,619 | | 10.1 | % | | 80,260 | | 9.9 | % | | 83,787 | | 11.1 | % |
| | | | | | | | | | | | | | | | | | | | | | | | | | |
Consumer installment | | | 12,876 | | 1.8 | % | | 14,388 | | 1.9 | % | | 14,893 | | 1.8 | % | | 14,263 | | 1.8 | % | | 13,936 | | 1.8 | % |
Municipal loans | | | 19,858 | | 2.7 | % | | 18,663 | | 2.5 | % | | 19,633 | | 2.4 | % | | 15,785 | | 1.9 | % | | 20,457 | | 2.7 | % |
Less: deferred fees, net of costs | | | (483 | ) | (0.1 | )% | | (350 | ) | (0.1 | )% | | (375 | ) | (0.1 | )% | | (433 | ) | (0.1 | )% | | (398 | ) | (0.1 | %) |
Total loans (net of unearned income) | | $ | 728,722 | | 100.0 | % | $ | 760,210 | | 100.0 | % | $ | 819,568 | | 100.0 | % | $ | 812,296 | | 100.0 | % | $ | 757,228 | | 100.0 | % |
29
Table of Contents
Commercial real estate loans totaled $381.8 million at year-end 2008 and comprised 52.4% of the loan portfolio, secured by farmland, multifamily property, and nonfarm/nonresidential real estate property. Loans of this type are mainly for business property, multifamily property, and community purpose property. The credit risk related to these types of loans is greatly influenced by general economic conditions, especially those applicable to the Northeast Wisconsin market area, and the resulting impact on a borrower’s operations. Many times, we will take additional real estate collateral to further secure the overall lending relationship. A decline in the tourism industry, or other economic effects, (such as increased interest rates affecting demand for real estate) could affect both our lending opportunities in this area as well as potentially affect the value of collateral held for these loans.
Commercial, financial and agricultural loans not secured by real estate totaled $110.4 million at year-end 2008, a decline of $17.1 million or 13.4% since year-end 2007. The commercial, financial, and agricultural loan classification primarily consists of commercial loans to small businesses. Loans of this type are in a broad range of industries and include service, retail, wholesale, and manufacturing concerns. Agricultural loans are made principally to farmers engaged in dairy, cherry and apple production. Borrowers are primarily concentrated in Door, Brown, Outagamie, Waupaca, Waushara and Kewaunee Counties, Wisconsin. The origination of commercial and commercial real estate loans was primarily from our market area in Brown County. Growth in tourism-related business in Door County was slow again in 2008 compared to growth experienced in years prior to 2006. The credit risk related to our bank’s commercial loans is largely influenced by general economic conditions, especially those applicable to the Northeast Wisconsin market area, and the resulting impact on a borrower’s operations.
Management uses an active credit risk management process for commercial loans to ensure that sound and consistent credit decisions are made. Management attempts to control credit risk by adhering to detailed underwriting procedures, performing comprehensive loan administration, and undertaking periodic review of borrowers’ outstanding loans and commitments. Borrower relationships are formally reviewed periodically during the life of the loan. Further analyses by customer, industry, and location are performed to monitor trends, financial performance and concentrations.
Real estate construction loans declined $23.2 million or 24.9% to $69.8 million at December 31, 2008 from December 31, 2007. Loans in this classification are primarily short-term interim loans that provide financing for the acquisition or development of commercial real estate, such as multifamily or other commercial development projects. Real estate construction loans are generally made to developers who are well known to us, have prior experience, and are well capitalized. Construction projects undertaken by these developers are carefully reviewed by us to assess their economic feasibility. The credit risk related to real estate construction loans is generally limited to specific geographic areas, but it is also influenced by general economic conditions. We attempt to control the credit risk on these types of loans by making loans to developers in familiar markets, reviewing the merits of the individual project, controlling loan structure and monitoring project progress and advances of construction proceeds.
Our loan portfolio is diversified by types of borrowers and industry groups within the market areas that we serve. Significant loan concentrations are considered to exist for a financial entity when such amounts are loans to multiple borrowers engaged in similar activities that cause them to be similarly impacted by economic or other conditions. We have identified certain industry groups within our market area, including lodging, restaurants, retail shops, small manufacturing, real estate rental properties and real estate development. At December 31, 2008, there existed one industry group concentration in our loans that exceeded 10% of total loans. At year-end 2008, loans on non-residential real estate rental properties located throughout our market area totaled $99.7 million or 13.7% of total loans.
In addition, loans to tourism-related businesses remain a significant part of the business and loans in other sectors are affected by the tourism-driven economy of Door County. As a result, a decrease in tourism could adversely affect one or more industry groups in our loan portfolio, which could have a corresponding adverse effect on our earnings. Additionally, a decline in tourism may have an indirect effect on our operations because other types of business (grocery and convenience stores, for example) rely on tourism to provide cash flow for their operations. Loans to individuals who are employed by tourism related business could also be affected in the event of a downturn in the industry.
30
Table of Contents
Although growth was slow in 2008 for the tourism business in the Door County market, management believes that business activity will remain adequate to enable our customers in general to service their debt and to make improvements to their operations.
At the end of 2008, residential real estate mortgage loans totaled $134.4 million and comprised 18.4% of the loan portfolio. These loans increased $14.5 million or 12.1% during 2008. Given current trends, we do not anticipate growth in mortgage loans during 2009. Residential real estate loans consist of conventional home mortgages, adjustable indexed interest rate mortgage loans, home equity loans, and secondary home mortgages. Loans are primarily for properties within the market areas we serve. Residential real estate loans generally contain a limit for the maximum loan to collateral value of 75% to 80% of fair market value. Private mortgage insurance may be required when the loan to value exceeds these limits.
We offer adjustable-rate mortgage loans based upon market demands. At year-end 2008, those loans totaled $28.9 million, an increase of $8.5 million over 2007. Adjustable rate mortgage loans contain an interest rate adjustment provision tied to the weekly average yield on U.S. Treasury securities adjusted to a constant maturity of one year (the “index”), plus an additional spread of up to 2.75%. Interest rates on indexed mortgage loans are adjusted, up or down, on predetermined dates fixed by contract, in relation to and based on the index or market interest rates as of a predetermined time prior to the adjustment date.
Adjustable rate mortgage loans have an initial period, ranging from one to three years, during which the interest rate is fixed, with adjustments permitted thereafter, subject to annual and lifetime interest rate caps which vary with the product type. Annual limits on interest rate changes are 2% while aggregate lifetime interest rate increases over the term of the loan are currently at 6% above the original mortgage loan interest rate.
We also participate in a fixed rate mortgage program under the Federal Home Loan Mortgage Corporation (“FHLMC”) guidelines. These loans are sold in the secondary market and we retain servicing rights. At December 31, 2008, these loans totaled $80.1 million compared to $89.7 million at December 31, 2007.
In addition, we also offer fixed rate mortgages through participation in fixed rate mortgage programs with private investors. These loans also are sold in the secondary market with servicing rights released to the buyer. In 2008, we sold $22.6 million in mortgage loans through the secondary programs compared to $36.6 million in 2007.
Installment loans to individuals totaled $12.9 million, or 1.8% of the total loan portfolio at December 31, 2008 compared to $14.4 million, or 1.9%, at December 31, 2007. Installment loans include short-term installment loans, direct and indirect automobile loans, recreational vehicle loans, credit card loans, and other personal loans. Individual borrowers may be required to provide collateral or a satisfactory endorsement or guaranty from another party, depending upon the specific type of loan and the creditworthiness of the borrower. Loans are made to individual borrowers located in the market areas we serve. Credit risks for loans of this type are generally influenced by general economic conditions (especially in the market areas served), the characteristics of individual borrowers and the nature of the loan collateral. Reviewing the creditworthiness of the borrowers, as well as taking the appropriate collateral and guaranty positions on such loans primarily controls credit risk.
Municipal loans totaled $19.9 million at December 31, 2008 compared to $18.7 million at year-end 2007. Municipal loans are short or long term loans to municipalities for the funding of various projects. The proceeds of these loans are collateralized by the backing of the corresponding taxing authority and can be used for general or revenue producing projects.
Table 4 details expected maturities by loan purpose as of December 31, 2008. Those loans with expected maturities over one year are further scheduled by fixed rate or variable rate interest sensitivity.
31
Table of Contents
Table 4: Loan Maturity and Interest Rate Sensitivity
| | | | | | | | | | | | | |
| | Maturity | |
December 31, 2008 | | Within 1 Year | | 1-5 Years | | After 5 Years | | Total | |
| | (dollars in thousands) | |
Loans secured primarily by real estate: | | | | | | | | | | | | | |
Secured by 1 to 4 family residential | | $ | 31,716 | | $ | 58,940 | | $ | 43,780 | | $ | 134,436 | |
Construction | | | 46,049 | | | 19,045 | | | 4,744 | | | 69,838 | |
Commercial real estate | | | 136,083 | | | 175,444 | | | 69,755 | | | 381,282 | |
Commercial, financial and agricultural | | | 35,625 | | | 40,212 | | | 34,595 | | | 110,432 | |
Tax-exempt | | | 6,982 | | | 3,394 | | | 9,482 | | | 19,858 | |
Consumer | | | 8,273 | | | 4,462 | | | 141 | | | 12,876 | |
Total | | $ | 264,728 | | $ | 301,497 | | $ | 162,497 | | $ | 728,722 | |
| | | | | | | | | | | | | |
| | Interest sensitivity | |
| | | | | Fixed rate | | Variable rate | | | | |
Due after one year | | | | | $ | 276,754 | | $ | 187,240 | | | | |
Note that commercial real estate loans have been adjusted for deferred fees, net of costs in this analysis.
Critical factors in the overall management of credit quality are sound loan underwriting and administration, systematic monitoring of existing loans and commitments, effective loan review on an ongoing basis, allowance to provide for anticipated loan losses, and non-accrual and charge-off policies.
Risk Management and the Allowance for Loan Losses
The loan portfolio is our primary asset subject to credit risk. To address this credit risk, we set aside an allowance for probable and inherent credit losses through periodic charges to our earnings. These charges are shown in our consolidated statement of operations as provision for loan losses. See “Provision For Loan Losses” in this Report. We attempt to control, monitor and minimize credit risk through the use of prudent lending standards, a thorough review of potential borrowers prior to lending, and ongoing and timely review of payment performance. Asset quality administration, including early identification of loans performing in a substandard manner as well as timely and active resolution of problems, further enhances management of credit risk and minimization of loan losses. Any losses that occur and are charged off against the ALL are periodically reviewed with specific efforts focused on achieving maximum recovery of both principal and interest.
In 2007 we shifted our management philosophy to focus on being substantially more proactive than in the past with respect to managing the credit risk inherent in our loan portfolio. In January 2007 we created the position of Chief Credit Officer (“CCO”) to be responsible for overseeing the credit underwriting, loan processing and documentation, problem loan monitoring, credit review and collection areas.
When the CCO was hired, we initiated a review of our written loan policy, which provides guidelines for loan origination applicable to all bank officers with lending authority, and we began implementing significant enhancements and improvements to the policy. In general, our loan policy establishes underwriting guidelines for each of our major loan categories. In addition to requiring financial statements, applications, credit histories and credit analyses for underwriting our loans, some of the more significant guidelines for specific types of loans are:
| | |
| • | For commercial real estate loans; maximum loan-to-value ratios range from 50% to 80% depending on the collateral securing the loan. Loan terms have a maximum amortization period of 20 years. Hazard insurance is required on collateral securitizing the loan and appropriate legal work is performed to verify our lien position. |
| • | For single and 2-4 family residential loans; maximum loan-to-value ratios do not exceed 80%, unless private mortgage insurance is purchased by the borrower. Loan terms have a maximum amortization period of 25 years. Hazard insurance is required on collateral securing the loan and appropriate legal work is performed to verify our lien position. |
32
Table of Contents
| | |
| • | For commercial and industrial loans, loan-to-value ratios and loan terms will vary, reflecting varied collateral securitizing the loan. Documentation required for the loan transaction may include income tax returns, financial statements, profit and loss budgets and cash flow projections. Loans included in this type are short-term loans, lines of credit, term loans and floor plans. |
As part of the improvements and enhancements to our loan policies, among other things, we expanded prior existing protocols to require additional due diligence in investigating potential borrowers and additional detail in loan presentations. We addressed more in-depth and critical consideration of credit histories, borrower stability, management expertise, collateral and asset quality, loan term and loan-to-collateral ratios. All new credits and, depending on risk profile, existing credits seeking new money, are subject to these expanded procedures.
The CCO was also tasked with evaluating the loan portfolio with a view toward being proactive in removing or minimizing problem credits in the portfolio. As part of this philosophical shift toward a more proactive approach to credit risk management during 2007, we instructed the CCO to be much more critical in his review, identification and monitoring of problem loans and of potential problem loans, in particular those that may be marginal in terms of collateral adequacy.
Our philosophical shift did not affect the overall methodology by which we calculate our ALL, although we did become more proactive in our efforts to identify and remove or minimize problem credits in the portfolio. In particular, we enhanced the impairment analysis process by requiring and obtaining substantially more evidentiary support (including supplemental market data and routine site visits) for our conclusions as to future payment expectations and collateral values and, in general, are more conservative in our analysis. In conjunction with our ongoing analysis, the weakening economy in our lending markets, as well as national markets, and FRB’s reduction of market rates have negatively impacted the performance of our loan portfolio for 2008 both in earnings and collateral-to-value ratios.
On a quarterly basis, management reviews the adequacy of the ALL. Based on an estimation computed pursuant to the requirements of Financial Accounting Standards Board (FASB) Statement No. 5, “Accounting for Contingencies,” and FASB Statements No. 114 and 118, “Accounting by Creditors for Impairment of a Loan,” the analysis of the ALL consists of three components: (i) specific credit allocation established for expected losses relating to specific individual loans for which the recorded investment in the loans exceeds its fair value; (ii) general portfolio allocation based on historical loan loss experience for significant loan categories; and (iii) general portfolio allocation based on economic conditions as well as specific factors in the markets in which we operate.
The specific credit allocation for the ALL is based on a regular analysis by the loan officers of all commercial credits. The loan officers grade commercial credits and the loan review function validates the grades assigned. In the event that the loan review function downgrades the loan, it is included in the ALL analysis process at the lower grade. This grading system is in compliance with regulatory classifications. At least quarterly, all commercial loans over a fixed dollar amount that have been deemed impaired are evaluated. In compliance with FASB Statement No. 114, the fair value of the loan is determined based on either the present value of expected future cash flows discounted at the loan’s effective interest rate, the market price of the loan, or, if the loan is collateral dependent, the fair value of the underlying collateral less the cost of sale. This evaluation may include obtaining supplemental market data and/or routine site visits to offer support to the evaluation process. A specific allowance is then allocated to the loans based on this assessment. Such allocations or impairments are reviewed by the CCO and management familiar with the credits.
During 2008, $18.0 million was added to the ALL and charged to operating expense, compared to $9.8 million in 2007. Of the $18.0 million charge taken in 2008, $3.2 million was taken during the third quarter and $13.6 million was taken during the fourth quarter.
Based upon information obtained subsequent to the close of our 2007 fiscal year, we completed an impairment evaluation of two loan relationships, which comprised approximately 27% of our non-performing loan balances outstanding at December 31, 2007. As a result of this evaluation, we recorded an additional impairment charge of $2.0 million relating specifically to these two loans in the fourth quarter of 2007. In addition to the $2.0 million impairment charge described above, a $1.3 million provision was taken in the fourth quarter of 2007 for unrelated loans. During 2008, an additional PFLL in the amount of $1.2 million was charged to earnings relating to the more significant of the two loan relationships. Prior to December 31, 2008, the collateral underlying this loan was sold resulting in a total charge-off of $3.1 million. The lesser relationship was charged off during 2008 in the amount of $0.3 million.
33
Table of Contents
During the fourth quarter of 2008, two related credit relationships totaling $19.3 million experienced significant cash flow concerns. Prior to the fourth quarter, these relationships had been paying as agreed and in management’s opinion, did not represent increased credit risk. As a result of our evaluation of these relationships prior to December 31, 2008, a provision of $10.2 million was charged to earnings of which $5.9 million relating to one of the relationships was charged off against the ALL. We continue to monitor both credits and believe that the remaining ALL of $4.3 million relating to these credits is appropriate and adequate based on all information available to us as of the date of this Report.
We have two other major components of the ALL that do not pertain to specific loans: “General Reserves – Historical” and “General Reserves – Other”. During 2007, we continued to utilize the same methodology of determining historical loss factors for the portfolio of loans to which there are no specific loss allocations. We determine General Reserves – Historical based on our historical recorded charge-offs of loans in particular categories, analyzed as a group. We determine General Reserves – Other by taking into account other factors, such as the concentration of loans in a particular industry or geographic area, adjustments for economic indicators, and so on. By nature, our general reserve changes with our fluid lending environment and the overall economic environment in which we lend. As such, we are continually attempting to enhance this portion of the allocation process to reflect anticipated losses in our portfolio driven by these changing factors. During 2007, management further enhanced the general component analysis to more specifically identify the inherent risks in the loan portfolio. Expanded economic statistics, specifically unemployment and inflation rates for national, state and local markets are monitored and factored into the allocation to address repayment risk. Further identification and management of portfolio concentration risks, both by loan category and by specific markets was enhanced and is reflected in the general allocation component.
All of the factors we take into account in determining loan loss provisions in the general categories are subject to change; thus, the allocations are not necessarily indicative of the loan categories in which future loan losses will occur As loan balances and estimated losses in a particular loan type decrease or increase and as the factors and resulting allocations are monitored by management, changes in the risk profile of the various parts of the loan portfolio may be reflected in the allowance allocated.
When comparing the period-to-period changes, our provision of $0.3 million in the first quarter of 2008 increased our ALL to $12.0 million at March 31, 2008. In the second quarter, a provision of $0.9 million and net charge-offs of $0.6 million were realized increasing the ALL to $12.3 million at June 30, 2008. During the third quarter of 2008, net charge-offs of $2.9 million were taken, partially offsetting a loan loss provision charged to earnings of $3.2 million. This resulted in an ALL balance of $12.6 million at September 30, 2008. Net charge-offs of $12.6 million were taken in the fourth quarter, offset by a provision of $13.6 million, resulting in an ALL balance of $13.6 million at year-end 2008.
Table 5: Quarterly Allowance for Loan Loss Components
| | | | | | | | | | | | | | | | |
| | As of | |
| | 12/31/07 | | 03/31/08 | | 06/30/08 | | 09/30/08 | | 12/31/08 | |
| | (dollars in thousands) | |
Component 1 – Specific credit allocation | | $ | 6,051 | | $ | 6,339 | | $ | 6,826 | | $ | 6,855 | | $ | 6,019 | |
Component 2 – General reserves: historical | | | 4,721 | | | 4,508 | | | 4,366 | | | 4,591 | | | 6,408 | |
General reserves: other | | | 1,068 | | | 1,167 | | | 1,135 | | | 1,157 | | | 1,064 | |
Unallocated | | | — | | | — | | | — | | | 1 | | | 70 | |
Allowance for Loan Losses | | $ | 11,840 | | $ | 12,014 | | $ | 12,327 | | $ | 12,604 | | $ | 13,561 | |
34
Table of Contents
Management believes the ALL is at an appropriate level to absorb probable and inherent losses in the loan portfolio at December 31, 2008. Proactive efforts to collect on all non-performing loans, including use of the legal process when deemed appropriate to minimize the risk of further deterioration of such loans will be ongoing. In the event that the facts and circumstances relating to these non-performing loans change, additions to the ALL may become necessary. With respect to the remainder of the loan portfolio, while management uses available information to recognize losses on loans, future adjustments to the ALL may become necessary based on changes in economic conditions and the impact of such changes on our borrowers. Management remains watchful of credit quality issues and believes that issues within the portfolio are reflective of the challenging economic environment experienced over the past few years. Should the economic climate deteriorate further, the level of non-performing loans, charge-offs and delinquencies could rise, warranting an increase in the provision.
As an integral part of their examination process, various regulatory agencies review the ALL as well. Such agencies may require that changes in the ALL be recognized when their credit evaluations differ from those of management, based on their judgments regarding information available to them at the time of their examinations.
As Table 6 indicates, the ALL at December 31, 2008 was $13.6 million compared with $11.8 million at year-end 2007. Loans decreased 4.1% in 2008, while the allowance as a percent of gross loans increased to 1.9% from 1.6% at year-end 2007. Net commercial mortgage loan charge-offs represented 69.0% of the total net charge-offs for 2008. Net commercial loan charge-offs represented 13.3% of the total net charge-offs in 2008 while residential real estate-mortgage loan net charge-offs represented 2.6% of the total net charge-offs for 2008. Although net loan charge-offs increased significantly in 2008, the ALL as a percent of total loans increased as a result of the higher amount of increased PFLL. Loans charged-off are subject to periodic review and specific efforts are taken to achieve maximum recovery of principal, accrued interest and related expenses.
Table 6: Loan Loss Experience
| | | | | | | | | | | | | | | | |
| | Years Ended December 31, | |
| | 2008 | | 2007 | | 2006 | | 2005 | | 2004 | |
| | (dollars in thousands) | |
|
Daily average amount of loans | | $ | 743,930 | | $ | 804,494 | | $ | 818,086 | | $ | 789,316 | | $ | 740,605 | |
Loans, end of period | | $ | 728,722 | | $ | 760,210 | | $ | 819,568 | | $ | 812,296 | | $ | 757,228 | |
|
ALL, at beginning of year | | $ | 11,840 | | $ | 8,058 | | $ | 9,551 | | $ | 10,445 | | $ | 12,159 | |
Loans charged off: | | | | | | | | | | | | | | | | |
Real estate-mortgage | | | 587 | | | 437 | | | 204 | | | 537 | | | 226 | |
Real estate-construction | | | 2,355 | | | 25 | | | 624 | | | — | | | 3 | |
Real estate-commercial | | | 11,289 | | | 2,154 | | | 1,341 | | | 3,363 | | | 1,039 | |
Commercial/agricultural loans | | | 2,301 | | | 3,627 | | | 847 | | | 651 | | | 2,781 | |
Consumer loans | | | 135 | | | 215 | | | 401 | | | 320 | | | 240 | |
| | | | | | | | | | | | | | | | |
Total loans charged off | | $ | 16,667 | | $ | 6,458 | | $ | 3,417 | | $ | 4,871 | | $ | 4,289 | |
| | | | | | | | | | | | | | | | |
Recoveries of loans previously charged off: | | | | | | | | | | | | | | | | |
Real estate-mortgage | | | 164 | | | 63 | | | 409 | | | 392 | | | 79 | |
Real estate-construction | | | — | | | — | | | — | | | — | | | 1 | |
Real estate-commercial | | | 78 | | | 113 | | | 127 | | | 91 | | | 79 | |
Commercial/agricultural loans | | | 143 | | | 206 | | | 134 | | | 163 | | | 741 | |
Consumer loans | | | 42 | | | 97 | | | 351 | | | 114 | | | 76 | |
| | | | | | | | | | | | | | | | |
Total loans recovered | | | 427 | | | 479 | | | 1,021 | | | 760 | | | 976 | |
Net loans charged off (“NCOs”) | | | 16,240 | | | 5,979 | | | 2,396 | | | 4,111 | | | 3,313 | |
Additions to allowance for loan losses charged to operating expense | | | 17,961 | | | 9,761 | | | 903 | | | 3,217 | | | 1,599 | |
ALL, at end of year | | $ | 13,561 | | $ | 11,840 | | $ | 8,058 | | $ | 9,551 | | $ | 10,445 | |
Ratio of NCOs during period to average loans outstanding | | | 2.18 | % | | 0.74 | % | | 0.29 | % | | 0.52 | % | | 0.45 | % |
Ratio of ALL to NCOs | | | 0.8 | % | | 2.0 | % | | 3.4 | % | | 2.3 | % | | 3.2 | % |
Ratio of ALL to total loans end of period | | | 1.86 | % | | 1.56 | % | | 0.98 | % | | 1.18 | % | | 1.38 | % |
35
Table of Contents
The change in ALL is a function of a number of factors, including but not limited to changes in the loan portfolio, loan loss provision, net charge-offs, and non-performing loans.
Table 7 shows the amount of the ALL allocated on the dates indicated to each loan type as described. It also shows the percentage of balances for each loan type to total loans. In general, it would be expected that those types of loans which have historically more loss associated with them will have a proportionally larger amount of the allowance allocated to them than do loans that have less risk.
Table 7: Allocation of the Allowance for Loan Losses
| | | | | | | | | | | | | | | | | | | | | | | | | | | | | | | |
| | As of December 31, | |
| | (dollars in thousands) | |
| | 2008 | | 2007 | | 2006 | | 2005 | | 2004 | |
| | Amount | | % of total
loans | | Amount | | % of total
loans | | Amount | | % of total
loans | | Amount | | % of total
loans | | Amount | | % of total
loans | |
Commercial, financial & agricultural | | $ | 6,375 | | | 15.2 | % | $ | 3,405 | | | 16.8 | % | $ | 2,082 | | | 10.1 | % | $ | 2,317 | | | 9.9 | % | $ | 1,982 | | | 11.1 | % |
Commercial real estate | | | 4,726 | | | 52.3 | % | | 5,367 | | | 50.8 | % | | 4,280 | | | 56.6 | % | | 5,633 | | | 57.5 | % | | 6,374 | | | 56.0 | % |
Real estate | | | | | | | | | | | | | | | | | | | | | | | | | | | | | | | |
Construction | | | 806 | | | 9.6 | % | | 1,774 | | | 12.2 | % | | 597 | | | 11.5 | % | | 454 | | | 10.6 | % | | 998 | | | 10.6 | % |
Residential | | | 1,308 | | | 18.4 | % | | 987 | | | 15.8 | % | | 755 | | | 17.6 | % | | 482 | | | 18.3 | % | | 539 | | | 17.8 | % |
Consumer | | | 259 | | | 1.8 | % | | 306 | | | 1.9 | % | | 342 | | | 1.8 | % | | 243 | | | 1.8 | % | | 198 | | | 1.8 | % |
Tax exempt loans | | | 17 | | | 2.7 | % | | — | | | 2.5 | % | | — | | | 2.4 | % | | — | | | 1.9 | % | | — | | | 2.7 | % |
Not specifically Allocated | | | 70 | | | | | | 1 | | | | | | 2 | | | | | | 422 | | | | | | 354 | | | | |
Total allowance | | $ | 13,561 | | | 100.0 | % | $ | 11,840 | | | 100.0 | % | $ | 8,058 | | | 100.0 | % | $ | 9,551 | | | 100.0 | % | $ | 10,445 | | | 100.0 | % |
Non-Performing Loans and Foreclosed Properties
Management encourages early identification of non-accrual and problem loans in order to minimize the risk of loss.
Non-performing loans are defined as non-accrual loans, loans 90 days or more past due but still accruing, and restructured loans. Additionally, whenever management becomes aware of facts or circumstances that may adversely impact the collection of principal or interest on loans, it is the practice of management to place such loans on non-accrual status immediately rather than waiting until the loans become 90 days past due. The accrual of interest income is discontinued when a loan becomes 90 days past due as to principal or interest. When interest accruals are discontinued, unpaid interest credited to income is reversed. If collection is in doubt, cash receipts on non-accrual loans are used to reduce principal rather than recorded as interest income.
Restructuring loans involves the granting of some concession to the borrower involving a loan modification, such as payment schedule or interest rate changes.
Table 8 details non-performing loans and non-performing assets by type for 2008 and the preceding four years.
36
Table of Contents
Table 8: Nonperforming Loans and Foreclosed properties
| | | | | | | | | | | | | | | | |
| | December 31, | |
| | 2008 | | 2007 | | 2006 | | 2005 | | 2004 | |
| | (dollars in thousands) | |
|
Nonaccrual loans | | $ | 43,687 | | $ | 37,555 | | $ | 27,352 | | $ | 6,942 | | $ | 5,920 | |
Accruing loans past due 90 days or more | | | — | | | — | | | — | | | — | | | — | |
Restructured loans | | | 367 | | | — | | | 496 | | | — | | | — | |
Total non-performing loans (NPLs) | | $ | 44,054 | | $ | 37,555 | | $ | 27,848 | | $ | 6,942 | | $ | 5,920 | |
Foreclosed properties/operating subsidiaries | | | 7,143 | | | 5,167 | | | 5,760 | | | 3,333 | | | 2,572 | |
Total non-performing assets (NPAs) | | $ | 51,197 | | $ | 42,722 | | $ | 33,608 | | $ | 10,275 | | $ | 8,492 | |
| | | | | | | | | | | | | | | | |
Ratios: | | | | | | | | | | | | | | | | |
NPLs to total loans | | | 6.04 | % | | 4.94 | % | | 3.40 | % | | 0.85 | % | | 0.78 | % |
NPAs to total assets | | | 4.82 | % | | 3.86 | % | | 3.02 | % | | 0.94 | % | | 0.81 | % |
ALL to NPLs | | | 30.78 | % | | 31.53 | % | | 28.94 | % | | 137.58 | % | | 176.44 | % |
Non-performing loans at December 31, 2008 were $44.1 million compared to $37.6 million at December 31, 2007. Management believes collateral is currently sufficient to collect the net carrying value of those loans in the event of foreclosure or repossession. Our assessment is based on recent appraisals, professional market valuations and/or sales agreements with respect to each of the properties. Management is continually monitoring these relationships and in the event facts and circumstances change, additional PFLLs may be necessary.
Table 9: Quarterly Nonaccrual and Restructured Loans
| | | | | | | | | | | | | | | | |
| | Quarters Ended | |
| | 12/31/07 | | 03/31/08 | | 06/30/08 | | 09/30/08 | | 12/31/08 | |
| | (dollars in thousands) | |
Nonaccrual Loans | | $ | 37,555 | | $ | 37,243 | | $ | 36,312 | | $ | 38,234 | | $ | 43,687 | |
Loans restructured in a troubled debt restructuring | | | — | | | — | | | — | | | — | | | 367 | |
Total Nonperforming Loans | | $ | 37,555 | | $ | 37,243 | | $ | 36,312 | | $ | 38,234 | | $ | 44,054 | |
The following table shows, for those loans accounted for on a non-accrual basis for the years ended as indicated, the gross interest that would have been recorded if the loans had been current in accordance with their original terms and the amount of interest income that was included in interest income for the period.
Table 10: Foregone Loan Interest
| | | | | | | | | | |
| | Years ended December 31, | |
| | 2008 | | 2007 | | 2006 | |
| | (dollars in thousands) | |
Interest income in accordance with original terms | | $ | 2,887 | | $ | 3,971 | | $ | 2,555 | |
Interest income recognized | | | (213 | ) | | (565 | ) | | (670 | ) |
Reduction in interest income | | $ | 2,674 | | $ | 3,406 | | $ | 1,885 | |
Foreclosed properties, which represent properties that we acquired through foreclosure or in satisfaction of debt, consisted of 28 properties totaling $7.1 million at end of year 2008. This compared to 14 properties totaling $5.2 million at year-end 2007. Management actively seeks to ensure that properties held are administered to minimize any risk of loss.
37
Table of Contents
Activity for foreclosed properties for 2008, 2007 and 2006, including costs of operation are shown in Table 11:
Table 11: Foreclosed Properties Summary
| | | | | | | | | | |
| | Years ended December 31, | |
| | 2008 | | 2007 | | 2006 | |
|
Income from operation of foreclosed properties | | $ | 153 | | $ | 64 | | $ | 43 | |
Expense from operation of foreclosed properties | | | (4,228 | ) | | (966 | ) | | (495 | ) |
Net gains (losses) from sale of foreclosed properties | | | (119 | ) | | (232 | ) | | 76 | |
|
Cost of operation and sale of foreclosed properties | | $ | (4,194 | ) | $ | (1,134 | ) | $ | (376 | ) |
Investment Portfolio
Our investment portfolio is intended to provide us with adequate liquidity, flexibility in asset/liability management and earning potential.
Table 12: Investment Portfolio
| | | | | | | | | | |
| | December 31, | |
| | 2008 | | 2007 | | 2006 | |
| | (dollars in thousands) | |
Securities Available for Sale (AFS): | | | | | | | | | | |
U.S. Treasury and U.S. government approved agency securities | | $ | 4,489 | | $ | 29,222 | | $ | 58,412 | |
Obligations of states and political subdivisions | | | 53,854 | | | 55,741 | | | 49,695 | |
Mortgage-backed securities | | | 152,118 | | | 118,848 | | | 79,655 | |
Private placement and corporate bonds | | | 15,130 | | | 15,141 | | | 999 | |
Other equity securities | | | 2,679 | | | 3,419 | | | 1,487 | |
Total amortized cost | | $ | 228,270 | | $ | 222,371 | | $ | 190,248 | |
Total fair value and carrying value | | $ | 225,417 | | $ | 222,475 | | $ | 188,315 | |
Securities are classified as available for sale. Gains or losses on disposition of securities are based on the net proceeds and the adjusted carrying amount of the securities sold, using the specific identification method.
Securities classified as available for sale are those securities which we have determined might be sold to manage interest rates, reposition holdings to increase returns or modify durations, or in response to changes in interest rates or other economic factors. They may not be held until maturity. Securities available for sale are carried at market value. Such market values are monitored at least quarterly and more frequently as economic conditions warrant. As part of such monitoring, the credit quality of individual securities and their issuers are assessed. Adjustments to market value that are considered temporary at December 31, 2008 and 2007 are recorded as a separate component of equity, net of tax. If an impairment of a security is identified as other-than-temporary based on information available such as the decline in the credit worthiness of the issuer, external market ratings or the anticipated or realized elimination of associated dividends, such impairments are recorded in the consolidated statement of operations. Subsequent to December 31, 2008, a security held in the amount of $1.9 million was determined to be impaired on an other-than-temporary basis. The book value of the security was eliminated from the balance sheet and charged to earnings in the amount of $1.9 million. This expense is identified as such on the statement of operations for the year ended December 31, 2008. Premium amortization and discount accretion are recognized as adjustments to interest income using the interest method. Realized gains or losses on disposition are based on the net proceeds and the adjusted carrying amount of the securities sold using the specific identification method.
38
Table of Contents
No securities gains were realized in 2006. In November 2007, our investment subsidiary sold agency securities with a total market value of $30.0 million. In 2008, the Bank sold agency securities with a total market value of $19.1 million and our investment subsidiary sold similar securities with a total market value of $10.8 million to reposition our investment portfolio and improve the yields we were receiving on these type of securities. Replacement agency securities were subsequently purchased that provided a higher yield and allowed us to take advantage of opportunities in the market.
During the first quarter of 2009, as of the date of this Report, securities with a market value of $29.9 million were sold and $21.5 million of other securities were purchased to take advantage of opportunities in the market.
Table 13: Securities Portfolio Maturity Distribution(dollars in thousands, rates on a tax-equivalent basis)
| | | | | | | | | | | | | | | | | | | | | | | | | | | | | | | |
| | Securities AFS – maturity distribution and weighted average yield | |
| | Within one year | | After one year but
Within five years | | After five years but
Within ten years | | After ten years | | Total | |
| | Amount | | Yield | | Amount | | Yield | | Amount | | Yield | | Amount | | Yield | | Amount | | Yield | |
|
U.S. Treasury | | $ | — | | | — | | $ | — | | | — | | $ | — | | | — | | $ | — | | | — | | $ | — | | | — | |
U.S. government approved agency securities | | | — | | | — | | | 1,005 | | | 4.53 | % | | 3,099 | | | 5.33 | % | | 501 | | | 5.55 | % | | 4,605 | | | 5.18 | % |
Mortgage-backed securities | | | 23,445 | | | 3.98 | % | | 87,564 | | | 4.89 | % | | 42,661 | | | 5.06 | % | | 1,463 | | | 4.89 | % | | 155,133 | | | 4.79 | % |
Tax exempt obligations of states and political subdivisions | | | 141 | | | 4.90 | % | | 3,093 | | | 4.49 | % | | 26,498 | | | 4.00 | % | | 23,915 | | | 4.01 | % | | 53,647 | | | 4.04 | % |
Private placement and corporate bonds | | | — | | | — | | | — | | | — | | | — | | | — | | | 9,353 | | | 7.59 | % | | 9,353 | | | 7.59 | % |
| | | | | | | | | | | | | | | | | | | | | | | | | | | | | | | |
Other | | | 2,679 | | | 3.87 | % | | — | | | — | | | — | | | — | | | — | | | — | | | 2,679 | | | 3.87 | % |
Total carrying value | | $ | 26,265 | | | 3.97 | % | $ | 91,662 | | | 5.80 | % | $ | 72,258 | | | 4.68 | % | $ | 35,232 | | | 5.02 | % | $ | 225,417 | | | 4.72 | % |
Securities averaged $231.4 million in 2008 compared with $203.7 million in 2007. In 2008, taxable securities comprised approximately 76.1% of the total average investments compared to 74.3% in 2007. Tax-exempt securities for 2008 accounted for 23.9% of the total average investments compared to 25.7% in 2007.
Goodwill
Goodwill is not amortized but is subject to impairment tests on an annual basis or more frequently if deemed appropriate. For 2008, market value of our stock was determined by using a three-year quarterly average multiple of market value to book value. Based on the results of this analysis, no impairment was identified at December 31, 2008.
Deposits
Deposits are our largest source of funds. Average total deposits for 2008 were $853.4 million, a decrease of 3.2% from 2007. At December 31, 2008, deposits were $849.8 million, a decrease of $34.4 million (3.9%) from $884.2 million at December 31, 2007. While average brokered deposits increased $9.8 million, (8.4%) between 2007 and 2008, total brokered deposits decreased $17.0 million to $113.9 million at year-end 2008 from $130.9 million at year-end 2007. Management views these as a stable source of funds. If liquidity concerns arose, we believe (but cannot assure) that we have alternative sources of funds, such as lines with correspondent banks and borrowing arrangements with the FHLB should the need present itself. Typically, overall deposits for the first six months tend to decline slightly as a result of the seasonality of our customer base, as customers draw down deposits during the first half of the year in anticipation of the summer tourist season.
39
Table of Contents
Table 14: Average Deposits Distribution
| | | | | | | | | | | | | | | | | | | |
| | 2008 | | 2007 | | 2006 | |
| | Amount | | % of Total | | Amount | | % of Total | | Amount | | % of Total | |
| | (dollars in thousands) | |
Noninterest-bearing demand deposits | | $ | 72,852 | | 8.5 | % | | $ | 93,706 | | 10.6 | % | | $ | 94,938 | | 11.0 | % | |
Interest-bearing demand deposits | | | 123,404 | | 14.5 | % | | | 110,322 | | 12.5 | % | | | 103,740 | | 12.0 | % | |
Savings deposits | | | 232,495 | | 27.2 | % | | | 262,026 | | 29.7 | % | | | 263,018 | | 30.4 | % | |
Other time deposits (excluding brokered deposits) | | | 194,648 | | 22.8 | % | | | 184,479 | | 20.9 | % | | | 167,552 | | 19.4 | % | |
Time deposits $100,000 and over (excluding brokered deposits) | | | 104,123 | | 12.2 | % | | | 115,120 | | 13.1 | % | | | 84,307 | | 9.8 | % | |
Brokered certificates of deposit | | | 125,852 | | 14.8 | % | | | 116,081 | | 13.2 | % | | | 150,012 | | 17.4 | % | |
Total deposits | | $ | 853,374 | | 100.0 | % | | $ | 881,734 | | 100.0 | % | | $ | 863,567 | | 100.0 | % | |
Table 15: Maturity Distribution-Certificates of Deposit and Other Time Deposits of $100,000 or More
| | | | | | | | | | | | | | | | |
| | December 31, 2008 | |
| | Certificates of Deposit | | Other Time Deposits | | Total | |
| | (Dollars in thousands) | |
Three months or less | | | $ | 28,805 | | | | $ | 903 | | | | $ | 29,708 | | |
Over three months through six months | | | | 43,205 | | | | | 613 | | | | | 43,818 | | |
Over six months through twelve months | | | | 57,593 | | | | | 1,705 | | | | | 59,298 | | |
Over twelve months | | | | 56,193 | | | | | 4,911 | | | | | 61,104 | | |
Total | | | $ | 185,796 | | | | $ | 8,132 | | | | $ | 193,928 | | |
As shown in Table 14, non-interest bearing demand deposits in 2008 averaged $72.9 million, down 22.3% from $93.7 million in 2007. This $20.8 million decrease reflects the shift from non-interest bearing to interest-bearing accounts. As of December 31, 2008, non-interest-bearing demand deposits totaled $73.6 million compared to $94.1 million at year-end 2007.
Interest-bearing deposits generally consist of interest-bearing checking, savings deposits, money market accounts, individual retirement accounts (“IRAs”) and certificates of deposit (“CDs”). In 2008, interest-bearing deposits averaged $780.5 million, a decrease of 1.0% from 2007. Average balances of NOW accounts, savings deposits and money market accounts decreased $16.4 million (4.4%) as a result of customer preference to longer terms in a down interest rate environment. During the same period, time deposits, including CDs and IRAs (other than brokered time deposits and time deposits over $100,000) increased in average deposits $10.2 million (5.5%), primarily in response to customer reaction to aggressive short-term rate declines in national markets. Average time deposits over $100,000 other than brokered time deposits decreased by $11.0 million (9.6%). These deposits were priced within the framework of our rate structure and did not materially increase the average rates on deposit liabilities. Increased competition for consumer deposits and customer awareness of interest rates continue to limit our core deposit growth in these types of deposits. This reduced growth resulted in average brokered deposits increasing $9.8 million, (8.4%) in 2008 compared to 2007.
Emphasis will be placed on generating additional core deposits in 2009 through competitive pricing of deposit products and through the branch delivery systems that have already been established. We will also attempt to attract and retain core deposit accounts through new product offerings and customer service. In the event that core deposit growth goals are not accomplished, we will continue to look at other wholesale sources of funds.
40
Table of Contents
Other funding sources
Total other funding sources, including short-term borrowings, Federal Home Loan Bank (“FHLB”) advances and subordinated debentures, were $131.4 million at December 31, 2008, an increase of $2.9 million, (2.3%), from $128.5 million at December 31, 2007.
Table 16: Short-term Borrowings
| | | | | | | | | | |
| | December 31, | |
| | 2008 | | 2007 | | 2006 | |
| | (Dollars in thousands) | |
Federal funds purchased and securities sold under agreements to repurchase: | | | | | | | | | | |
Balance end of year | | $ | 30,174 | | $ | 27,174 | | $ | 4,480 | |
Average amounts outstanding during year | | $ | 32,750 | | $ | 17,048 | | $ | 8,703 | |
Maximum month-end amounts outstanding | | $ | 45,659 | | $ | 41,107 | | $ | 29,778 | |
Average interest rates on amounts outstanding at end of year | | | 1.15 | % | | 4.73 | % | | 5.28 | % |
Average interest rates on amounts outstanding during year | | | 2.38 | % | | 5.18 | % | | 5.08 | % |
Federal funds are purchased from money center banks and correspondent banks at prevailing overnight interest rates. Securities are sold to bank customers under repurchase agreements at prevailing market rates. Borrowings from the FHLB are secured by our portfolio of one to four family residential mortgages, home equity lines of credit and eligible investment securities allowing us to use FHLB borrowings for additional funding purposes. Substantially all of our FHLB advances are included as short-term borrowings.
Long-term Debt
In connection with the issuance of Trust Preferred Securities in 2001 (see “Capital Resources”), we issued long-term subordinated debentures to Baylake Capital Trust I, Delaware Business Trust subsidiary. On March 31, 2006, we redeemed the debentures and funded the redemption through the issuance of $16.1 million of trust preferred securities and $498,000 of trust common securities under the name Baylake Capital Trust II. Subordinated debentures totaled $16.1 million at December 31, 2008, 2007 and 2006. For additional details, see Note 11, “Subordinated Debentures”, to the Consolidated Financial Statements.
Contractual Obligations
As of December 31, 2008, we were contractually obligated under long-term agreements as follows:
Table 17: Contractual Obligations
| | | | | | | | | | | | | | | | |
| | Payments due by period | |
(dollars in thousands) | | Total | | Less than 1 year | | 1 to 3 years | | 3 to 5 years | | More than 5 years | |
Certificates of deposit and other time deposit obligations | | $ | 410,054 | | $ | 285,507 | | $ | 108,825 | | $ | 15,722 | | $ | — | |
Subordinated debentures | | | 16,100 | | | — | | | — | | | — | | | 16,100 | |
FHLB advances | | | 85,095 | | | 20,095 | | | 65,000 | | | — | | | — | |
Operating leases | | | 61 | | | 35 | | | 26 | | | — | | | — | |
Totals | | $ | 511,310 | | $ | 305,637 | | $ | 173,851 | | $ | 15,722 | | $ | 16,100 | |
41
Table of Contents
Further discussion of these contractual obligations, see Note 5, “Bank Premises and Equipment” and Note 10, “Subordinated Debentures” to Consolidated Financial Statements.
Liquidity
Liquidity management refers to our ability to ensure that cash is available in a timely manner to meet loan demand and depositors’ needs, and to service other liabilities as they become due, without undue cost or risk, or causing a disruption to normal operating activities. We and our subsidiary bank have different liquidity considerations.
Our primary sources of funds are dividends from our subsidiary bank, investment income, and net proceeds from borrowings and the offerings of subordinated debentures, in addition to the issuance of our common stock. We generally manage our liquidity position in order to provide funds necessary to pay dividends to our shareholders. Dividends received from our bank totaled $2.3 million in 2007 and were our main source of liquidity in 2008. After consultation with our federal and state regulators, our Board of Directors elected to forego paying the dividend normally paid to our shareholders beginning in the first quarter of 2008. In order to begin paying dividends in the future, we will need to seek prior approval from the Wisconsin Department of Financial Institutions as well as the Federal Reserve Board.
Our bank meets its cash flow needs by having funding sources available to it to satisfy the credit needs of customers as well as having available funds to satisfy deposit withdrawal requests. Liquidity at our bank is derived from deposit growth, maturing loans, the maturity and marketability of our investment portfolio, access to other funding sources, marketability of certain of our assets, the ability to use our loan and investment portfolios as collateral for secured borrowings and strong capital positions.
Maturing investments have been a primary source of liquidity at our bank. Principal payments on investments totaling $28.8 million were made in 2008 and $91.8 million in investments were purchased in 2008. At December 31, 2008, the carrying value of investment securities maturing within one year was $26.3 million, or 11.7% of the total investment securities portfolio. This compares to 11.6% of our investment securities with one year or less maturities as of December 31, 2007. At the end of 2008, the investment portfolio contained $159.7 million of U.S. Treasury, U.S. government approved agency securities and mortgage backed securities representing 70.7% of the total investment portfolio. These securities tend to be highly marketable and had a fair value approximately $3.1 million below amortized cost at year-end 2008.
Deposit growth is another source of liquidity for our bank. As a financing activity reflected in the 2008 Consolidated Statements of Cash Flows, deposit reduction consumed $34.4 million in cash during 2008. Our bank’s overall average deposit base declined $28.4 million or 3.2% during 2008. Deposit growth is the most stable source of liquidity for our bank, although brokered deposits are inherently less stable than locally generated core deposits. In addition, as a result of our bank recently falling below the “well capitalized” regulatory capital threshold, it will become more difficult for us to obtain brokered deposits in the future. Affecting liquidity are core deposit growth levels, certificate of deposit maturity structure and retention, and characteristics and diversification of wholesale funding sources affecting the channels by which brokered deposits are acquired. Conversely, deposit outflow would require our bank to develop alternative sources of funds which may not be as liquid and may be potentially a more costly alternative.
Federal funds sold averaged $7.0 million in 2008 compared to $3.2 million in 2007. Funds provided from the maturity of these assets typically are used as funding sources for seasonal loan growth, which typically has higher yields. Short-term and liquid by nature, federal funds sold generally provide a yield lower than other earning assets. Our bank has a strategy of maintaining a sufficient level of liquidity to accommodate fluctuations in funding sources and will at times take advantage of specific opportunities to temporarily invest excess funds at narrower than normal rate spreads while still generating additional interest revenue. At December 31, 2008, our bank had $0.4 million in federal funds sold.
The scheduled maturity of loans can provide a source of additional liquidity. Our bank has $264.7 million of loans maturing within one year, or 36.3% of total loans. Factors affecting liquidity relative to loans are loan origination volumes, loan prepayment rates and the maturity structure of existing loans. Our bank’s liquidity position is influenced by changes in interest rates, economic conditions and competition. Conversely, loan demand as a need for liquidity will cause us to acquire other sources of funding which could be harder to find and, therefore, more costly to acquire.
42
Table of Contents
Within the classification of short-term borrowings at year-end 2008 and 2007, federal funds purchased and securities sold under agreements to repurchase totaled $30.2 million. At December 31, 2008, our bank had no federal funds purchased. Federal funds are purchased from various upstream correspondent banks while securities sold under agreements to repurchase are obtained from a base of business customers. At December 31, 2008, our bank had $49.6 million available in the form of federal funds lines. Short-term and long-term FHLB advances are another source of funds, totaling $85.1 million at year-end 2008. At December 31, 2008, our bank had $6.8 million in the form of additional available FHLB advances.
Our bank’s liquidity resources were sufficient in 2008 to fund the growth in investments and meet other cash needs when necessary.
Management expects that deposit growth will continue to be the primary funding source of our bank’s liquidity on a long-term basis, along with a stable earnings base, the resulting cash generated by operating activities, and a strong capital position. Although federal funds purchased and borrowings from the FHLB provided funds in 2008, management expects deposit growth resulting from branch expansion efforts and marketing efforts to attract and retain core deposits, as well as brokered deposits, to be a reliable funding source in the future. Shorter-term liquidity needs will mainly be derived from growth in short-term borrowings, maturing federal funds sold and portfolio investments, loan maturities and access to other funding sources.
In assessing liquidity, historical information such as seasonality (loan demand’s effect on liquidity which starts before and during the tourist season and deposit draw down which affects liquidity shortly before and during the early part of the tourist season), local economic cycles and the economy in general are considered along with the current ratios, management goals and our resources available to meet anticipated liquidity needs. Management believes that, in the current economic environment, our liquidity position is adequate. To management’s knowledge, there are no known trends nor any known demands, commitments, events or uncertainties that will result or are reasonably likely to result in a material increase or decrease in our liquidity.
Interest Rate Sensitivity Management
Our business and the composition of our consolidated balance sheet consist of investments in interest-earning assets (including loans and securities) which are primarily funded by interest-bearing liabilities (deposits and borrowings). We maintain all of our financial instruments for non-trading purposes. Such financial instruments have varying levels of sensitivity to changes in market rates of interest. Our operating income and net income depends, to a substantial extent, on “rate differentials” (i.e., the differences between the income we receive from loans, securities, and other earning assets and the interest expense we pay to obtain deposits and other liabilities). These rates are highly sensitive to many factors that are beyond our control, including general economic conditions and the policies of various governmental and regulatory authorities.
We measure our overall interest rate sensitivity through a net interest income analysis. The net interest income analysis measures the changes in net interest income in the event of hypothetical changes in interest rates. This analysis assesses the risk of changes in net interest income in the event of an immediate and sustained 100 and 200 bps increases in market interest rates or a 100 and 200 bps decreases in market rates. The interest rates scenarios are used for analytical purposes and do not necessarily represent management’s view of future market movements. The tables below present our projected changes in net interest income for 2009 based on financial data at December 31, 2008, for the various rate shock levels indicated.
43
Table of Contents
Table 18: Net Interest Income Sensitivity Analysis
| | | | | | | | | | | | | | |
Potential impact on 2009 net interest income | | Net Interest Income | |
| | Amount | | Potential Change in Net
Interest Income ($) | | Potential Change in Net
Interest Income (%) | |
| | (Dollars in thousands) | |
+ 200 bps | | $ | 26,892 | | | ($ | 2,464 | ) | | | | (8.4 | %) | |
+ 100 bps | | $ | 28,023 | | | ($ | 1,333 | ) | | | | (4.5 | %) | |
Base | | $ | 29,356 | | | | — | | | | | — | | |
- 100 bps | | $ | 31,340 | | | $ | 1,984 | | | | | 6.8 | % | |
- 200 bps | | $ | 30,519 | | | $ | 1,163 | | | | | 4.0 | % | |
Note: The table above may not be indicative of future results.
Based on our model at December 31, 2008, the effect on an immediate 100 bps increase in interest rates would decrease our net interest income by 4.5% or approximately $1.3 million. The effect of an immediate 100 bps decrease in rates would increase our net interest income by 6.8% or approximately $2.0 million.
In order to limit exposure to interest rate risk, we have developed strategies to manage our liquidity, shorten the effective maturities of certain interest-earning assets, and increase the effective maturities of certain interest-bearing liabilities. The origination of floating rate loans such as business, construction and other prime or LIBOR-based loans is emphasized. The majority of fixed rate loans have re-pricing periods less than five years. The mix of floating and fixed rate assets is designed to mitigate the impact of rate changes on our net interest income. Virtually all fixed rate residential mortgage loans with maturities greater than five years are sold into the secondary market.
There can be no assurance that the results of operations would be impacted as indicated if interest rates did move by the amounts discussed above. Management continually reviews its interest risk position through its Asset/Liability Management Committee. Management’s philosophy is to maintain relatively matched rate sensitive asset and liability positions within the range described above in order to provide earnings stability in the event of significant interest rate changes.
Capital Resources
Stockholders’ equity at December 31, 2008 decreased $11.3 million or 14.1% to $69.0 million, compared to $80.3 million at the end of 2007. Accumulated other comprehensive loss increased to $1.6 million at year-end 2008 versus accumulated other comprehensive loss of $0.1 million at year-end 2007. The ratio of stockholders’ equity to assets at December 31, 2008 was 6.5%, compared to 7.3% at year-end 2007.
On June 5, 2006, our Board of Directors authorized management, in its discretion, to repurchase up to 300,000 shares, representing approximately 3.8% of our common stock for a period not to exceed June 30, 2007. The program allowed us to repurchase our shares as opportunities arose at prevailing market prices in open market or privately negotiated transactions. Shares repurchased are held as treasury stock and accordingly, are accounted for as a reduction of stockholders’ equity. During 2007, the final 50,000 shares authorized were repurchased. In July 2007, our Board of Directors approved a reimplementation of this program, for the repurchase of an additional 300,000 shares through June 30, 2008. We repurchased 79,000 shares under this new program between July 1 and December 31, 2007. No shares were purchased in 2008 and the program expired June 30, 2008.
Under applicable regulatory guidelines, the Trust Preferred Securities qualify as Tier 1 capital up to a maximum of 25% of Tier 1 capital. Any additional portion of Trust Preferred Securities would qualify as Tier 2 capital. As of December 31, 2008, all $16.1 million of the Trust Preferred Securities qualify as Tier 1 Capital.
No cash dividends were declared in 2008 while cash dividends declared in 2007 were $0.64 per share.
44
Table of Contents
The adequacy of our capital is regularly reviewed to ensure that sufficient capital is available for current and future needs and is in compliance with regulatory guidelines. The assessment of overall capital adequacy depends upon a variety of factors, including asset quality, liquidity, stability of earnings, changing competitive forces, economic conditions in markets served and strength of management.
The FRB has established capital adequacy rules which take into account risks attributable to balance sheet assets and off-balance sheet activities. All banks and bank holding companies must meet a minimum total risk-based capital ratio of 8%. Of the 8% required, at least half must consist of core capital elements defined as Tier 1 capital. The federal banking agencies also have adopted leverage capital guidelines which banking organizations must meet. Under these guidelines, the most highly rated banking organizations must meet a leverage ratio of at least 3% Tier 1 capital to assets, while lower rated banking organizations must maintain a ratio of at least 4% to 5%. Failure to meet minimum capital requirements can initiate certain mandatory and possible additional discretionary actions by regulators that, if undertaken, could have a direct material effect on the consolidated financial statements.
Throughout 2007 and the first three quarters of 2008, our regulatory capital ratios and those of our bank were in excess of the levels established for “well capitalized” institutions. To be “well capitalized” under the regulatory framework, the Tier 1 capital ratio must meet or exceed 6%, the total capital ratio must meet or exceed 10% and the leverage ratio must meet or exceed 5%. During the fourth quarter of 2008, our regulatory capital ratios and those of our bank fell below “well capitalized” levels, but remained in excess of levels established for “adequately capitalized” financial institutions under the regulatory framework for prompt corrective action. There are no conditions or events since December 31, 2008 that management believes have changed our category.
Management believes that a strong capital position is necessary to take advantage of opportunities for profitable expansion of product and market share and to provide depositor and investor confidence. Our capital level must be maintained at an appropriate level to provide the opportunity for an adequate return on the capital employed. Management actively reviews our capital strategies to ensure that capital levels are appropriate based on the perceived business risks, further growth opportunities, industry standards, and regulatory requirements.
Table 19: Selected Quarterly Financial Data
The following is selected financial data summarizing the results of operations for each quarter in the years ended December 31, 2008 and 2007:
| | | | | | | | | | | | | |
| | 2008 Quarter Ended | |
| | March 31 | | June 30 | | September 30 | | December 31 | |
| | (In thousands, except per share data) | |
Interest income | | $ | 15,607 | | $ | 14,302 | | $ | 13,947 | | $ | 13,420 | |
Interest expense | | | 8,404 | | | 7,115 | | | 6,628 | | | 6,080 | |
Net interest income | | | 7,203 | | | 7,187 | | | 7,319 | | | 7,340 | |
Provision for loan losses | | | 300 | | | 861 | | | 3,200 | | | 13,600 | |
Net interest income after PLL | | | 6,903 | | | 6,326 | | | 4,119 | | | (6,260 | ) |
Non-interest income | | | 2,315 | | | 2,199 | | | 2,102 | | | 2,641 | |
Non-interest expense | | | 7,842 | | | 9,014 | | | 8,712 | | | 12,454 | |
Income before income tax expense | | | 1,376 | | | (489 | ) | | (2,491 | ) | | (16,073 | ) |
Provision (benefit) for income tax | | | 211 | | | (584 | ) | | (1,317 | ) | | (6,170 | ) |
Net income (loss) | | | 1,165 | | | 95 | | | (1,174 | ) | | (9,903 | ) |
| | | | | | | | | | | | | |
Basic earnings (loss) per share | | $ | 0.15 | | $ | 0.01 | | ($ | 0.15 | ) | ($ | 1.25 | ) |
Diluted earnings (loss) per share | | $ | 0.15 | | $ | 0.01 | | ($ | 0.15 | ) | ($ | 1.25 | ) |
45
Table of Contents
| | | | | | | | | | | | | |
| | 2007 Quarter Ended | |
| | March 31 | | June 30 | | September 30 | | December 31 | |
| | (In thousands, except per share data) | |
Interest income | | $ | 17,651 | | $ | 17,367 | | $ | 17,515 | | $ | 17,136 | |
Interest expense | | | 9,806 | | | 9,893 | | | 9,784 | | | 9,270 | |
Net interest income | | | 7,845 | | | 7,474 | | | 7,731 | | | 7,866 | |
Provision for loan losses | | | 5,985 | | | — | | | 500 | | | 3,276 | |
Net interest income after PLL | | | 1,860 | | | 7,474 | | | 7,231 | | | 4,590 | |
Non-interest income | | | 2,245 | | | 2,417 | | | 2,032 | | | 2,484 | |
Non-interest expense | | | 8,466 | | | 8,248 | | | 7,651 | | | 8,217 | |
Income before income tax expense | | | (4,361 | ) | | 1,643 | | | 1,612 | | | (1,143 | ) |
Provision for income tax | | | (2,064 | ) | | 229 | | | 225 | | | (804 | ) |
Net income | | | (2,297 | ) | | 1,414 | | | 1,387 | | | (339 | ) |
| | | | | | | | | | | | | |
Basic earnings per share | | ($ | 0.29 | ) | $ | 0.18 | | $ | 0.18 | | ($ | 0.04 | ) |
Diluted earnings per share | | ($ | 0.29 | ) | $ | 0.18 | | $ | 0.18 | | ($ | 0.04 | ) |
Recent Accounting Pronouncements
See Note 1 to the Notes to Consolidated Financial Statements titled “Effects of Newly Issued But Not Yet Effective Accounting Standards” for additional detail.
ITEM 7A.QUANTITATIVE AND QUALITATIVE DISCLOSURE ABOUT MARKET RISK.
Information required by this item is set forth in Item 7 under the caption “Interest Rate Sensitivity Management” and is incorporated in this schedule by reference.
ITEM 8.FINANCIAL STATEMENTS AND SUPPLEMENTARY DATA
Our Consolidated Financial Statements and notes to related statements thereto are set forth on the following pages.
46
Table of Contents
REPORT BY BAYLAKE CORP.’S MANAGEMENT
ON INTERNAL CONTROL OVER FINANCIAL REPORTING
Our management is responsible for establishing and maintaining an effective system of internal control over financial reporting, as such term is defined in Exchange Act 13a-15(f). The Company’s system of internal control over financial reporting is designed to provide reasonable assurance regarding the reliability of financial reporting and the preparation of financial statements for external purposes in accordance with generally accepted accounting principles. There are inherent limitations in the effectiveness of any system of internal control over financial reporting, including the possibility of human error and circumvention or overriding of controls. Accordingly, even an effective system of internal control over financial reporting can provide only reasonable assurance with respect to financial statement preparation. Projections of any evaluation of effectiveness to future periods are subject to the risks that controls may become inadequate because of changes in conditions or that the degree of compliance with the policies or procedures may deteriorate.
Management assessed the Company’s systems of internal control over financial reporting as of December 31, 2007. This assessment was based on criteria for effective internal control over financial reporting described inInternal Control – Integrated Frameworkissued by the CommitteeofSponsoring Organizations of the Treadway Commission. Based on this assessment, management believes that as of December 31, 2008, the Company maintained effective internal control over financial reporting based on those criteria.
The Company’s independent auditors have issued an audit report on the effectiveness of the Company’s internal control over financial reporting.
BAYLAKE CORP.
March 17, 2009
47
Table of Contents
REPORT OF INDEPENDENT REGISTERED PUBLIC ACCOUNTING FIRM
Board of Directors and Stockholders
Baylake Corp.
Sturgeon Bay, Wisconsin
We have audited the accompanying consolidated balance sheet of Baylake Corp. (the Company) as of December 31, 2008, and the related consolidated statements of operations, changes in stockholders’ equity and cash flows for the year then ended. We have also audited the Company’s internal control over financial reporting as of December 31, 2008, based on criteria established inInternal Control-Integrated Framework issued by the Committee of Sponsoring Organizations of the Treadway Commission (COSO). The Company’s management is responsible for these consolidated financial statements, for maintaining effective internal control over financial reporting and for its assessment of the effectiveness of internal control over financial reporting in the accompanying Report by Baylake Corp.’s Management on Internal Control over Financial Reporting. Our responsibility is to express an opinion on these consolidated financial statements and an opinion on the effectiveness of the Company’s internal control over financial reporting based on our audits.
We conducted our audits in accordance with the standards of the Public Company Accounting Oversight Board (United States). Those standards require that we plan and perform the audits to obtain reasonable assurance about whether the consolidated financial statements are free of material misstatement and whether effective internal control over financial reporting was maintained in all material respects. Our audit of the consolidated financial statements included examining, on a test basis, evidence supporting the amounts and disclosures in the consolidated financial statements, assessing the accounting principles used and significant estimates made by management, and evaluating the overall consolidated financial statement presentation. Our audit of internal control over financial reporting included obtaining an understanding of internal control over financial reporting, assessing the risk that a material weakness exists, and testing and evaluating the design and operating effectiveness of internal control based on the assessed risk. Our audit also included performing other procedures as we considered necessary in the circumstances. We believe that our audits provide a reasonable basis for our opinions.
A company’s internal control over financial reporting is a process designed to provide reasonable assurance regarding the reliability of financial reporting and the preparation of financial statements for external purposes in accordance with generally accepted accounting principles. A company’s internal control over financial reporting includes those policies and procedures that (1) pertain to the maintenance of records that, in reasonable detail, accurately and fairly reflect the transactions and dispositions of the assets of the company; (2) provide reasonable assurance that transactions are recorded as necessary to permit preparation of financial statements in accordance with generally accepted accounting principles, and that receipts and expenditures of the company are being made only in accordance with authorizations of management and directors of the company; and (3) provide reasonable assurance regarding prevention or timely detection of unauthorized acquisition, use, or disposition of the company’s assets that could have a material effect on the financial statements.
48
Table of Contents
Because of its inherent limitations, internal control over financial reporting may not prevent or detect misstatements. Also, projections of any evaluation of effectiveness to future periods are subject to the risk that controls may become inadequate because of changes in conditions, or that the degree of compliance with the policies or procedures may deteriorate.
In our opinion, the consolidated financial statements referred to above present fairly, in all material respects, the consolidated financial position of Baylake Corp. as of December 31, 2008, and the consolidated results of its operations, changes in stockholder’s equity and its cash flows for the year then ended in conformity with accounting principles generally accepted in the United States of America. Also, in our opinion, the Company maintained, in all material respects, effective internal control over financial reporting as of December 31, 2008, based on criteria established in COSO.
| |
| /s/Virchow, Krause & Company, LLP |
| Virchow, Krause & Company, LLP |
Milwaukee, Wisconsin
March 17, 2009
49
Table of Contents
REPORT OF INDEPENDENT REGISTERED PUBLIC ACCOUNTING FIRM
Board of Directors and Shareholders
Baylake Corp.
Sturgeon Bay, Wisconsin
We have audited the accompanying consolidated balance sheet of Baylake Corp. as of December 31, 2007, and the related consolidated statements of operations, changes in stockholders’ equity and cash flows for each of the two years in the period ended December 31, 2007. These financial statements are the responsibility of the Company’s management. Our responsibility is to express an opinion on these financial statements based on our audits.
We conducted our audits in accordance with the standards of the Public Company Accounting Oversight Board (United States). Those standards require that we plan and perform the audit to obtain reasonable assurance about whether the financial statements are free of material misstatement. An audit includes examining, on a test basis, evidence supporting the amounts and disclosures in the financial statements. An audit also includes assessing the accounting principles used and significant estimates made by management, as well as evaluating the overall financial statement presentation. We believe that our audits provide a reasonable basis for our opinion.
In our opinion, the consolidated financial statements referred to above present fairly, in all material respects, the financial position of Baylake Corp. as of December 31, 2007, and the results of its operations and its cash flows for each of the two years in the period ended December 31, 2007, in conformity with accounting principles generally accepted in the United States of America.
As discussed in Note 1 to the consolidated financial statements, the Company adopted FASB Interpetation (FIN) 48, “Accounting for Uncertainy in Income Taxes” and FASB Statement 156, “Accounting for Servicing of Financial Assets”.
Oak Brook, Illinois
March 29, 2008
50
Table of Contents
|
BAYLAKE CORP.
CONSOLIDATED BALANCE SHEETS
December 31, 2008 and 2007
(Dollar amounts in thousands, except per share data) |
| |
| | | | | | | |
| | 2008 | | 2007 | |
ASSETS | | | | | | | |
Cash and due from financial institutions | | $ | 23,085 | | $ | 46,381 | |
Federal funds sold | | | 397 | | | — | |
Securities available for sale | | | 225,417 | | | 222,475 | |
Loans held for sale | | | 368 | | | 741 | |
Loans, net of allowance of $13,561 and $11,840 | | | 715,161 | | | 748,370 | |
Cash value of life insurance | | | 23,435 | | | 23,404 | |
Premises, held for sale | | | 2,006 | | | 673 | |
Premises and equipment, net | | | 24,451 | | | 26,597 | |
Federal Home Loan Bank stock | | | 6,792 | | | 6,792 | |
Foreclosed properties, net | | | 7,143 | | | 5,167 | |
Goodwill | | | 6,108 | | | 6,108 | |
Deferred income taxes | | | 13,501 | | | 6,338 | |
Accrued interest receivable | | | 3,968 | | | 5,394 | |
Other assets | | | 11,081 | | | 8,176 | |
| | | | | | | |
Total assets | | $ | 1,062,913 | | $ | 1,106,616 | |
| | | | | | | |
LIABILITIES AND STOCKHOLDERS’ EQUITY | | | | | | | |
Deposits | | | | | | | |
Non-interest-bearing | | $ | 73,537 | | $ | 94,120 | |
Interest-bearing | | | 776,221 | | | 790,065 | |
Total deposits | | | 849,758 | | | 884,185 | |
| | | | | | | |
Federal Home Loan Bank advances | | | 85,095 | | | 85,172 | |
Federal funds purchased and repurchase agreements | | | 30,174 | | | 27,174 | |
Subordinated debentures | | | 16,100 | | | 16,100 | |
Accrued expenses and other liabilities | | | 12,832 | | | 12,461 | |
Dividends payable | | | — | | | 1,262 | |
Total liabilities | | | 993,959 | | | 1,026,354 | |
| | | | | | | |
Common stock, $5 par value, authorized 50,000,000; issued-8,132,552 shares in 2008, 8,106,973 shares in 2007; outstanding-7,911,539 shares in 2008, 7,885,960 shares in 2007 | | | 40,662 | | | 40,535 | |
Additional paid-in capital | | | 11,977 | | | 11,875 | |
Retained earnings | | | 21,499 | | | 31,316 | |
Treasury stock (221,013 shares in 2008 and 2007) | | | (3,549 | ) | | (3,549 | ) |
Accumulated other comprehensive income (loss) | | | (1,635 | ) | | 85 | |
Total stockholders’ equity | | | 68,954 | | | 80,262 | |
| | | | | | | |
Total liabilities and stockholders’ equity | | $ | 1,062,913 | | $ | 1,106,616 | |
See accompanying notes to the consolidated financial statements.
51
Table of Contents
|
BAYLAKE CORP.
CONSOLIDATED STATEMENTS OF OPERATIONS
Years ended December 31, 2008, 2007, and 2006
(Dollar amounts in thousands, except per share data) |
| |
| | | | | | | | | | |
| | 2008 | | 2007 | | 2006 | |
Interest and dividend income | | | | | | | | | | |
Loans, including fees | | $ | 46,304 | | $ | 60,727 | | $ | 61,556 | |
Taxable securities | | | 8,523 | | | 6,495 | | | 6,382 | |
Tax exempt securities | | | 2,223 | | | 2,128 | | | 1,697 | |
Federal funds sold and other | | | 226 | | | 318 | | | 379 | |
Total interest and dividend income | | | 57,276 | | | 69,668 | | | 70,014 | |
Interest expense | | | | | | | | | | |
Deposits | | | 23,861 | | | 31,930 | | | 28,486 | |
Federal funds purchased and repurchase agreements | | | 781 | | | 884 | | | 442 | |
Federal Home Loan Bank advances and other debt | | | 2,791 | | | 4,850 | | | 5,745 | |
Subordinated debentures | | | 794 | | | 1,089 | | | 1,705 | |
Total interest expense | | | 28,227 | | | 38,753 | | | 36,378 | |
| | | | | | | | | | |
Net interest income | | | 29,049 | | | 30,915 | | | 33,636 | |
| | | | | | | | | | |
Provision for loan losses | | | 17,961 | | | 9,761 | | | 903 | |
| | | | | | | | | | |
Net interest income after provision for loan losses | | | 11,088 | | | 21,154 | | | 32,733 | |
Non-interest income | | | | | | | | | | |
Fees from fiduciary activities | | | 756 | | | 956 | | | 1,025 | |
Fees from loan servicing | | | 720 | | | 1,019 | | | 1,092 | |
Fees for other services to customers | | | 5,673 | | | 5,253 | | | 4,988 | |
Gains from sales of loans | | | 325 | | | 630 | | | 825 | |
Net change in valuation of servicing rights | | | (535 | ) | | (595 | ) | | — | |
Securities gains, net | | | 765 | | | 352 | | | — | |
Net gains (losses) from sale and disposal of premises and equipment | | | 39 | | | (7 | ) | | 287 | |
Increase in cash surrender value of life insurance | | | 31 | | | 863 | | | 922 | |
Income in equity of UFS subsidiary | | | 830 | | | 556 | | | 512 | |
Other income | | | 653 | | | 147 | | | 86 | |
Total non-interest income | | | 9,257 | | | 9,174 | | | 9,737 | |
Non-interest expenses | | | | | | | | | | |
Salaries and employee benefits | | | 16,353 | | | 18,662 | | | 19,414 | |
Occupancy expense | | | 2,471 | | | 2,456 | | | 2,373 | |
Equipment expense | | | 1,372 | | | 1,517 | | | 1,658 | |
Data processing and courier | | | 1,210 | | | 1,299 | | | 1,269 | |
Operation of other real estate | | | 4,194 | | | 1,134 | | | 376 | |
Provision for impairment of standby letters of credit | | | 2,539 | | | — | | | 27 | |
Other than temporary impairment of securities | | | 1,900 | | | — | | | — | |
Loan and collection expense | | | 1,185 | | | 1,006 | | | 777 | |
Other outside services | | | 988 | | | 1,104 | | | 1,040 | |
Other operating expenses | | | 5,810 | | | 5,400 | | | 5,395 | |
Total non-interest expenses | | | 38,022 | | | 32,578 | | | 32,329 | |
Income (loss) before provision for income taxes | | | (17,677 | ) | | (2,250 | ) | | 10,141 | |
Provision for (benefit from) income taxes | | | (7,860 | ) | | (2,416 | ) | | 2,765 | |
| | | | | | | | | | |
Net income (loss) | | $ | (9,817 | ) | $ | 166 | | $ | 7,376 | |
| | | | | | | | | | |
Basic earnings (loss) per common share | | $ | (1.24 | ) | $ | 0.02 | | $ | 0.95 | |
Diluted earnings (loss) per common share | | $ | (1.24 | ) | $ | 0.02 | | $ | 0.94 | |
See accompanying notes to the consolidated financial statements.
52
Table of Contents
|
BAYLAKE CORP. |
CONSOLIDATED STATEMENTS OF CHANGES IN STOCKHOLDERS’ EQUITY |
Years ended December 31, 2008, 2007 and 2006 |
(Dollar amounts in thousands, except per share data) |
|
| |
| | | | | | | | | | | | | | | | | | | | | | |
| | | | | | Additional
Paid-in
Capital | | | | | | Accumulated
Other
Comprehensive
Income (loss) | | | |
| | | | | | | | | | | | | |
| | Common Stock
| | | Retained
Earnings | | Treasury
Stock | | | Total
Equity | |
| | Shares
| | Amount
| | | | | | |
| | | | | | | | | | | | | | | | | | | | | | |
Balance, January 1, 2006 | | | 7,782,427 | | $ | 39,028 | | $ | 9,466 | | $ | 32,461 | | $ | (625 | ) | $ | (1,786 | ) | $ | 78,544 | |
| | | | | | | | | | | | | | | | | | | | | | |
Prior year adjustment to recognize mortgage servicing rights understatement, net of tax of $188 (see Note 1) | | | — | | | — | | | — | | | 289 | | | — | | | — | | | 289 | |
Net income for the year | | | — | | | — | | | — | | | 7,376 | | | — | | | — | | | 7,376 | |
Net changes in unrealized gain on securities available for sale, net of ($315) deferred taxes | | | — | | | — | | | — | | | — | | | — | | | 557 | | | 557 | |
Total comprehensive income | | | | | | | | | | | | | | | | | | | | | 7,933 | |
Stock compensation expense recognized, net of $19 deferred taxes | | | — | | | — | | | 48 | | | — | | | — | | | — | | | 48 | |
Common stock issued under Dividend Reinvestment Plan | | | 17,024 | | | 85 | | | 183 | | | — | | | — | | | — | | | 268 | |
Treasury stock repurchases | | | (68,854 | ) | | — | | | — | | | — | | | (1,101 | ) | | — | | | (1,101 | ) |
Stock options exercised | | | 99,544 | | | 498 | | | 434 | | | — | | | — | | | — | | | 932 | |
Tax benefit from exercise of stock options | | | — | | | — | | | 272 | | | — | | | — | | | — | | | 272 | |
Cash dividends declared ($0.64 per share) | | | — | | | — | | | — | | | (4,992 | ) | | — | | | — | | | (4,992 | ) |
Balance, December 31, 2006 | | | 7,830,141 | | | 39,611 | | | 10,403 | | | 35,134 | | | (1,726 | ) | | (1,229 | ) | | 82,193 | |
| | | | | | | | | | | | | | | | | | | | | | |
Net income for the year | | | — | | | — | | | — | | | 166 | | | — | | | — | | | 166 | |
Net changes in unrealized gain on securities available for sale, net of ($723) deferred taxes | | | — | | | — | | | — | | | — | | | — | | | 1,314 | | | 1,314 | |
Total comprehensive income | | | | | | | | | | | | | | | | | | | | | 1,480 | |
Stock compensation expense recognized, net of $8 deferred taxes | | | — | | | — | | | 21 | | | — | | | — | | | — | | | 21 | |
Stock options exercised | | | 110,005 | | | 551 | | | 634 | | | — | | | — | | | — | | | 1,185 | |
UFS stock options exercised | | | — | | | — | | | — | | | (50 | ) | | — | | | — | | | (50 | ) |
Common stock issued under Dividend Reinvestment Plan | | | 74,814 | | | 373 | | | 723 | | | — | | | — | | | — | | | 1,096 | |
Treasury stock repurchases | | | (129,000 | ) | | — | | | — | | | — | | | (1,823 | ) | | — | | | (1,823 | ) |
See accompanying notes to the consolidated financial statements.
53
Table of Contents
|
BAYLAKE CORP. |
CONSOLIDATED STATEMENTS OF CHANGES IN STOCKHOLDERS’ EQUITY |
Years ended December 31, 2008, 2007 and 2006 |
(Dollar amounts in thousands, except per share data) |
|
| |
| | | | | | | | | | | | | | | | | | | | | | |
| | | | | | | | | | | | Accumulated
Other
Comprehensive
Income (loss) | | | |
| | | | | | Additional
Paid-in
Capital | | | | | | | | |
| | Common Stock | | | Retained
Earnings | | Treasury
Stock | | | Total
Equity | |
| | Shares | | Amount | | | | | | |
| | | | | | | | | | | | | | | | | | | | | | |
Tax benefit from exercise of stock options | | | — | | | — | | | 94 | | | — | | | — | | | — | | | 94 | |
Cumulative effect adjustments | | | | | | | | | | | | | | | | | | | | | | |
Adjustment for adoption of FIN 48 | | | — | | | — | | | — | | | 980 | | | — | | | — | | | 980 | |
Adjustment for adoption of SFAS No. 156, net of $74 tax | | | — | | | — | | | — | | | 117 | | | — | | | — | | | 117 | |
| | | | | | | | | | | | | | | | | | | | | | |
Cash dividends declared ($0.64 per share) | | | — | | | — | | | — | | | (5,031 | ) | | — | | | — | | | (5,031 | ) |
Balance, December 31, 2007 | | | 7,885,960 | | $ | 40,535 | | $ | 11,875 | | $ | 31,316 | | $ | (3,549 | ) | $ | 85 | | $ | 80,262 | |
| | | | | | | | | | | | | | | | | | | | | | |
Net loss for the year | | | — | | | — | | | — | | | (9,817 | ) | | — | | | — | | | (9,817 | ) |
Changes in unrealized loss on securities available for sale, net of ($1,237) deferred taxes | | | — | | | — | | | — | | | — | | | — | | | (4,092 | ) | | (4,092 | ) |
Reclassification adjustment for net gains realized in income | | | | | | | | | | | | | | | | | | (765 | ) | | (765 | ) |
Reclassification adjustment for other than temporary impairment realized in income | | | | | | | | | | | | | | | | | | 1,900 | | | 1,900 | |
Tax effect | | | | | | | | | | | | | | | | | | 1,237 | | | 1,237 | |
Total comprehensive loss | | | | | | | | | | | | | | | | | | | | | (1,720 | ) |
Stock compensation expense recognized, net of $8 deferred taxes | | | — | | | — | | | (36 | ) | | — | | | — | | | | | | (36 | ) |
Common stock issued under Dividend Reinvestment Plan | | | 25,579 | | | 127 | | | 138 | | | — | | | — | | | — | | | 265 | |
| | | | | | | | | | | | | | | | | | | | | | |
Balance, December 31, 2008 | | | 7,911,539 | | $ | 40,662 | | $ | 11,977 | | $ | 21,499 | | $ | (3,549 | ) | $ | (1,635 | ) | $ | 68,954 | |
See accompanying notes to the consolidated financial statements.
54
Table of Contents
|
CONSOLIDATED STATEMENTS OF CASH FLOWS |
Years ended December 31, 2008, 2007, and 2006 |
(Dollar amounts in thousands) |
|
| |
| | | | | | | | | | |
| | 2008 | | 2007 | | 2006 | |
Cash flows from operating activities: | | | | | | | | | | |
Reconciliation of net income (loss) to net cash provided by operating activities: | | | | | | | | | | |
Net income (loss) | | $ | (9,817 | ) | $ | 166 | | $ | 7,376 | |
Adjustments to reconcile net income (loss) to net cash provided to operating activities: | | | | | | | | | | |
Depreciation and amortization | | | 1,394 | | | 1,534 | | | 1,609 | |
Amortization of debt issuance costs | | | — | | | — | | | 475 | |
Amortization of core deposit intangible | | | 52 | | | 52 | | | 52 | |
Provision for losses on loans | | | 17,961 | | | 9,761 | | | 903 | |
Provision for impairment of letters of credit | | | 2,539 | | | — | | | 27 | |
Other than temporary impairment of securities | | | 1,900 | | | — | | | — | |
Net amortization of securities | | | (124 | ) | | 112 | | | 125 | |
Increase in cash surrender value of life insurance | | | (31 | ) | | (863 | ) | | (922 | ) |
Net realized gain on sale of securities | | | (765 | ) | | (352 | ) | | — | |
Net gain on sale of loans | | | (325 | ) | | (630 | ) | | (825 | ) |
Proceeds from sale of loans held for sale | | | 24,737 | | | 42,976 | | | 41,483 | |
Origination of loans held for sale | | | (24,068 | ) | | (42,198 | ) | | (41,175 | ) |
Net change in valuation of mortgage servicing rights | | | 535 | | | 595 | | | — | |
Provision for valuation allowance on foreclosed properties | | | 3,610 | | | 133 | | | 90 | |
Net (gain) loss from sale and disposal of premises and equipment | | | (39 | ) | | 7 | | | (287 | ) |
Net (gain) loss from disposal of other real estate owned | | | 119 | | | 232 | | | (76 | ) |
Benefit from deferred tax expense | | | (5,926 | ) | | (2,205 | ) | | (840 | ) |
Stock option compensation expense recognized | | | (44 | ) | | 21 | | | 48 | |
Income in equity of UFS subsidiary | | | (830 | ) | | (556 | ) | | (512 | ) |
Tax benefit (expense) from exercise/forfeiture of stock options | | | 8 | | | (94 | ) | | (272 | ) |
Changes in assets and liabilities: | | | | | | | | | | |
Accrued interest receivable and other assets | | | (1,199 | ) | | (454 | ) | | (50 | ) |
Accrued expenses and other liabilities | | | (2,168 | ) | | (1,048 | ) | | 3,258 | |
Net cash provided by operating activities | | | 7,519 | | | 7,189 | | | 10,487 | |
| | | | | | | | | | |
Cash flows from investing activities: | | | | | | | | | | |
Proceeds from sale of securities available-for-sale | | | 56,089 | | | 34,479 | | | — | |
Principal payments on securities available-for-sale | | | 28,760 | | | 26,454 | | | 20,029 | |
Purchase of securities available-for-sale | | | (91,759 | ) | | (92,816 | ) | | (35,959 | ) |
Proceeds from sale of other real estate owned | | | 2,623 | | | 6,160 | | | 3,958 | |
Proceeds from sale of premises and equipment | | | 97 | | | — | | | 690 | |
Loan originations and payments, net | | | 6,920 | | | 47,447 | | | (16,067 | ) |
Proceeds from redemption of FHLB Stock | | | — | | | — | | | 1,289 | |
Additions to premises and equipment | | | (639 | ) | | (406 | ) | | (5,041 | ) |
Proceeds from life insurance death benefit | | | — | | | 2,431 | | | — | |
Net change in federal funds sold | | | (397 | ) | | — | | | — | |
Investment in bank-owned life insurance | | | — | | | (732 | ) | | (503 | ) |
Net cash provided by (used in) investing activities | | | 1,694 | | | 23,017 | | | (31,604 | ) |
See accompanying notes to the consolidated financial statements.
Table of Contents
|
BAYLAKE CORP. |
CONSOLIDATED STATEMENTS OF CASH FLOWS
Years ended December 31, 2008, 2007, and 2006
(Dollar amounts in thousands)
|
| |
| | | | | | | | | | |
| | 2008 | | 2007 | | 2006 | |
Cash flows from financing activities: | | | | | | | | | | |
Net change in deposits | | $ | (34,427 | ) | $ | 5,274 | | $ | 22,200 | |
Net change in federal funds purchased and repurchase agreements | | | 3,000 | | | 22,694 | | | 3,165 | |
Proceeds from Federal Home Loan Bank advances | | | 85,000 | | | 50,000 | | | 100,000 | |
Repayments on Federal Home Loan Bank advances | | | (85,077 | ) | | (80,007 | ) | | (110,006 | ) |
Redemption of subordinated debt | | | — | | | — | | | (16,100 | ) |
Proceeds from issuance of subordinated debt | | | — | | | — | | | 16,100 | |
Proceeds from exercise of stock options | | | — | | | 1,184 | | | 932 | |
Tax benefit (expense) from exercise/forfeiture of options | | | (8 | ) | | 94 | | | 272 | |
Treasury stock repurchases | | | — | | | (1,823 | ) | | (1,101 | ) |
Dividend reinvestment plan | | | 265 | | | 1,096 | | | 268 | |
Cash dividends paid | | | (1,262 | ) | | (5,022 | ) | | (4,982 | ) |
Net cash provided by (used in) financing activities | | | (32,509 | ) | | (6,510 | ) | | 10,748 | |
| | | | | | | | | | |
Net change in cash and cash equivalents | | | (23,296 | ) | | 23,696 | | | (10,369 | ) |
| | | | | | | | | | |
Beginning cash and cash equivalents | | | 46,381 | | | 22,685 | | | 33,054 | |
| | | | | | | | | | |
Ending cash and cash equivalents | | $ | 23,085 | | $ | 46,381 | | $ | 22,685 | |
| | | | | | | | | | |
Supplemental cash flow information: | | | | | | | | | | |
Interest paid | | $ | 30,119 | | $ | 38,511 | | $ | 35,926 | |
Income taxes paid | | | 47 | | | 1,589 | | | 2,345 | |
| | | | | | | | | | |
Supplemental noncash disclosures: | | | | | | | | | | |
Transfers from loans to foreclosed properties | | $ | 8,328 | | $ | 5,932 | | $ | 6,399 | |
Mortgage servicing rights resulting from sale of loans | | | 29 | | | 116 | | | 180 | |
Transfer of premises to premises held for sale | | | 1,357 | | | — | | | — | |
See accompanying notes to the consolidated financial statements.
Table of Contents
|
BAYLAKE CORP. |
NOTES TO CONSOLIDATED FINANCIAL STATEMENTS
December 31, 2008, 2007 and 2006
(Dollar amounts in thousands) |
NOTE 1 - NATURE OF BUSINESS AND SUMMARY OF SIGNIFICANT ACCOUNTING POLICIES
The consolidated financial statements of Baylake Corp. (the Company) include the accounts of the Company, its wholly owned subsidiary Baylake Bank, (the Bank), and the Bank’s wholly owned subsidiaries: Baylake Investments, Inc., Baylake Insurance Agency, Inc., and Baylake City Center LLC. All significant intercompany items and transactions have been eliminated.
The Bank owns a 49.8% interest (500 shares) in United Financial Services, Inc., (UFS) a data processing service. In addition to the ownership interest, UFS and the Company have a common member on each respective Board of Directors. The investment in this entity is carried under the equity method of accounting, and the pro rata share of its income is included in other income. On June 27, 2006, UFS amended an earlier agreement for employment with a key employee of UFS allowing that individual the option to purchase up to 20%, or 240 shares, of the authorized shares of UFS. The option price is $1,000 per share less dividends or distributions to owners. The current book value of UFS is approximately $8,745 per share. During 2007, options for 120 shares were exercised by the key employee. The exercise of all or a portion of the remaining options will have the effect of reducing the Company’s share of the future earnings. There will not be a material impact to the carrying value of the asset on Baylake Bank’s consolidated balance sheet. Income recognized by the Company was $830, $556, and $512 for 2008, 2007, and 2006, respectively. Amounts paid to UFS for data processing services by Baylake Bank were $1,107, $1,208, and $1,157 in 2008, 2007, and 2006, respectively.
Baylake Bank makes commercial, mortgage, and installment loans to customers substantially all of whom are located in Door, Brown, Kewaunee, Manitowoc, Waushara, Outagamie, Green Lake, and Waupaca Counties of Wisconsin. Although Baylake Bank has a diversified portfolio, a substantial portion of its debtors’ ability to honor their contracts is dependent upon the economic condition of the local industrial businesses, as well as the commercial, agricultural and tourism industries.
Use of Estimates: To prepare financial statements in conformity with U.S. generally accepted accounting principles, management makes estimates and assumptions based on available information. These estimates and assumptions affect the amounts reported in the consolidated financial statements and the disclosures provided, and actual results could differ. The allowance for loan losses, provision for letter of credit impairment loss, foreclosed assets, other than temporary impairment of securities, income tax expense, and fair values of financial instruments are particularly subject to change.
Cash Flows: Cash and cash equivalents include cash and deposits with other financial institutions. Net cash flows are reported for customer loan and deposit transactions, and federal funds purchased and repurchase agreements.
Securities: Debt securities are classified as available for sale when they might be sold before maturity. Equity securities with readily determinable fair values are classified as available for sale. Securities available for sale are carried at fair value, with unrealized holding gains and losses reported in other comprehensive income, net of tax. Interest income includes amortization of purchase premium or accretion of purchase discount. Premiums and discounts on securities are amortized on the level-yield method without anticipating prepayments. Gains and losses on sales are recorded on the trade date and determined using the specific identification method.
Table of Contents
|
BAYLAKE CORP. |
NOTES TO CONSOLIDATED FINANCIAL STATEMENTS
December 31, 2008, 2007 and 2006
(Dollar amounts in thousands) |
NOTE 1 – NATURE OF BUSINESS AND SUMMARY OF SIGNIFICANT ACCOUNTING POLICIES(Continued)
Declines in the fair value of securities below their cost that are other than temporary are reflected as “Other than temporary impairment of securities” in the statement of operations. In estimating other-than-temporary losses, management considers: (1) the length of time and extent that fair value has been less than cost, (2) the financial condition and near-term prospects of the issuer, and (3) the Company’s ability and intent to hold the security for a period sufficient to allow for any anticipated recovery in fair value.
Federal Home Loan Bank (FHLB) stock: The Bank is a member of the FHLB system. Members are required to own a certain amount of stock based on the level of borrowings and other factors, and may invest in additional amounts. FHLB stock is carried at cost, classified as a restricted security, and periodically evaluated for impairment based on ultimate recovery of par value. Both cash and stock dividends are reported as income.
Loans Held for Sale: Mortgage loans originated and intended for sale in the secondary market are carried at the lower of aggregate cost or market, as determined by outstanding commitments from investors. Net unrealized losses, if any, are recorded as a valuation allowance and charged to earnings.
Mortgage loans held for sale may be sold with servicing rights retained. The carrying value of mortgage loans sold is reduced by the amount allocated to the servicing right at the time of sale. Gains and losses on sales of mortgage loans are based on the difference between the selling price and the carrying value of the related loan sold.
Loans: Loans that management has the intent and ability to hold for the foreseeable future or until maturity or payoff are reported at the principal balance outstanding, net of unearned interest, deferred loan fees and costs, and an allowance for loan losses. Interest income is accrued on the unpaid principal balance. Loan origination fees, net of certain direct origination costs, are deferred and recognized in interest income using the level-yield method without anticipating prepayments.
Interest income on mortgage and commercial loans is discontinued at the time the loan is 90 days delinquent. Past due status is based on the contractual terms of the loan. In all cases, loans are placed on nonaccrual or charged off at an earlier date if collection of principal or interest is considered doubtful.
All interest accrued but not received for loans placed on nonaccrual is reversed against interest income. Interest received on such loans is accounted for on the cash-basis or cost-recovery method until qualifying for return to accrual. Loans are returned to accrual status when all the Principal and interest amounts contractually due are brought current and future payments are reasonably assured.
Table of Contents
|
BAYLAKE CORP. |
NOTES TO CONSOLIDATED FINANCIAL STATEMENTS |
December 31, 2008, 2007 and 2006 |
(Dollar amounts in thousands) |
NOTE 1 – NATURE OF BUSINESS AND SUMMARY OF SIGNIFICANT ACCOUNTING POLICIES(Continued)
Allowance for Loan Losses: The allowance for loan losses is a valuation allowance for probable and inherent credit losses. Loan losses are charged against the allowance when management believes the non-collectability of a loan balance is confirmed. Subsequent recoveries, if any, are credited to the allowance. Management estimates the allowance balance required using past loan loss experience, the nature and volume of the portfolio, information about specific borrower situations and estimated collateral values, economic conditions, and other factors. Allocations of the allowance may be made for specific loans, but the entire allowance is available for any loan that, in management’s judgment, should be charged-off.
The allowance consists of specific and general components. The specific component relates to loans that are individually classified as impaired. The general component covers non-impaired loans and is based on historical loss experience adjusted for current factors.
A loan is impaired when full payment under the loan terms is not expected. Commercial and commercial real estate loans are individually evaluated for impairment. If a loan is impaired, a specific allowance is established so that the loan is reported, net, at the present value of estimated future cash flows using the loan’s existing rate or at the fair value of collateral if repayment is expected solely from the collateral. Large groups of smaller balance homogeneous loans, such as consumer and residential real estate loans are collectively evaluated for impairment, and accordingly, they are not separately identified for impairment disclosures.
Servicing Rights: Servicing rights are recognized separately when they are acquired through sales of loans. For sales of loans prior to January 1, 2007, a portion of the cost of the loan was allocated to the servicing right based on relative fair values. The Company adopted SFAS No. 156 on January 1, 2007, and for sales of loans beginning in 2007, servicing rights are initially recorded at fair value with the income statement effect recorded as a reduction to gain/loss on sale of loans. Fair value is based on market prices for comparable servicing contracts, when available, or alternatively, is based on a valuation model that calculates the present value of estimated future net servicing income. The valuation model incorporates assumptions that market participants would use in estimating future net servicing income, such as the cost to service, the discount rate, prepayment speeds and default rates and losses. The Company compares the valuation model inputs and results to published industry data in order to validate the model results and assumptions.
Upon adoption of SFAS No. 156, the Company elected to measure all classes of servicing assets at fair value resulting in a cumulative-effect adjustment increasing retained earnings by $117 as of January 1, 2007. Under the fair value measurement method, the Company measures servicing earnings in the period in which the changes occur, and the changes in fair value are indicated as net change in valuation of servicing rights on the statement of operations. The fair values of servicing rights are subject to significant fluctuations as a result of changes in estimated and actual prepayment speeds and default rates and losses.
Table of Contents
|
BAYLAKE CORP. |
NOTES TO CONSOLIDATED FINANCIAL STATEMENTS |
December 31, 2008, 2007 and 2006 |
(Dollar amounts in thousands) |
NOTE 1 – NATURE OF BUSINESS AND SUMMARY OF SIGNIFICANT ACCOUNTING POLICIES(Continued)
Prior to January 1, 2007, all servicing assets were measured using the amortization method which required servicing rights to be amortized into non-interest income in proportion to, and over the period of, the estimated future net servicing income of the underlying loans. Additionally, prior to January 1, 2007, servicing assets were evaluated for impairment based upon the fair value of the rights as compared to carrying amount. Impairment was determined by stratifying rights into groupings based on predominant risk characteristics, such as interest rate, loan type and investor type. Impairment was recognized through a valuation allowance for an individual grouping, to the extent that fair value was less than the carrying amount. If the Company later determined that all or a portion of the impairment no longer existed for a particular grouping, a reduction of the allowance may have been recorded as an increase to income.
Servicing fee income, which is reported on the statement of operations as fees from loan servicing, is recorded for fees earned for servicing loans. The fees are based on a contractual percentage of the outstanding principal; or a fixed amount per loan and are recorded as income when earned. Servicing fees totaled $510, $665 and $736 for the years ended December 31, 2008, 2007 and 2006, respectively. Late fees and ancillary fees related to loan servicing are not material.
Loan servicing rights are carried in other assets on the balance sheet and amount to $860 and $1,366 on loans serviced for others totaling $93,617 and $115,698 in 2008 and 2007, respectively. Capitalized servicing rights totaled $29, $116, and $180, during 2008, 2007, and 2006, respectively. Amortization of servicing rights, which is included in other expense, totaled $357 during 2006. The decrease in fair value of servicing rights recognized in income in 2008 and 2007 was $535 and $595, respectively.
The Company adopted Staff Accounting Bulletin (“SAB”) No. 108 issued by the Securities and Exchange Commission on June 1, 2006. As a result of this adoption, the Company recorded an adjustment to servicing rights in the amount of $477, or $289 net of tax effect, which is reflected as an adjustment to the opening balance of retained earnings in 2006.
Bank Owned Life Insurance: The Company has purchased life insurance policies on certain key executives. Upon adoption of EITF 06-5, which is discussed further below, Bank owned life insurance is recorded at the amount that can be realized under the insurance contract at the balance sheet date, which is the cash surrender value adjusted for other charges or other amounts due that are probable at settlement. Prior to adoption of EITF 06-5, the Company recorded owned life insurance at its cash surrender value.
Table of Contents
|
BAYLAKE CORP. |
NOTES TO CONSOLIDATED FINANCIAL STATEMENTS |
December 31, 2008, 2007 and 2006 |
(Dollar amounts in thousands) |
NOTE 1 – NATURE OF BUSINESS AND SUMMARY OF SIGNIFICANT ACCOUNTING POLICIES(Continued)
In September 2006, the FASB Emerging Issues Task Force finalized Issue No. 06-5,Accounting for Purchases of Life Insurance – Determining the Amount That Could Be Realized in Accordance with FASB Technical Bulletin No. 85-4 (Accounting for Purchases of Life Insurance). EITF 06-5 requires that a policyholder consider contractual terms of a life insurance policy in determining the amount that could be realized under the insurance contract. It also requires that if the contract provides for a greater surrender value if all individual policies in a group are surrendered at the same time, that the surrender value be determined based on the assumption that policies will be surrendered on an individual basis. Lastly, EITF 06-5 requires disclosure when there are contractual restrictions on the Company’s ability to surrender a policy. The adoption of EITF 06-5 on January 1, 2007 had no impact on the Company’s consolidated financial condition or results of operation.
Transfers of Financial Assets: Transfers of financial assets are accounted for as sales when control over the assets has been surrendered. Control over transferred assets is deemed to be surrendered when (1) the assets have been isolated from the Company, (2) the transferee obtains the right (free of conditions that constrain it from taking advantage of that right) to pledge or exchange the transferred assets, and (3) the Company does not maintain effective control over the transferred assets through an agreement to repurchase them before their maturity.
Foreclosed Assets: Assets acquired through or instead of loan foreclosure are initially recorded at fair value when acquired, less estimated costs to sell, establishing a new cost basis. If fair value declines subsequent to foreclosure, a valuation allowance is recorded through expense. Costs after acquisition are expensed.
Premises, held for sale: Premises held for sale consist of development property in the Green Bay area and vacant land. Property held for sale is carried at the lower of cost or fair value.
Premises and Equipment: Land is carried at cost. Premises and equipment are stated at cost less accumulated depreciation. Buildings and related components are depreciated using the straight-line method with useful lives ranging from 5 to 40 years. Furniture, fixtures, and equipment are depreciated using the straight-line (or accelerated) method with useful lives ranging from 3 to 12 years.
Goodwill and Other Intangible Assets: Goodwill results from business acquisitions and represents the excess of the purchase price over the fair value of acquired tangible assets and impairment, and any such impairment is recognized in the period identified.
Other intangible assets consist of core deposit intangible assets arising from a branch acquisition. They are initially measured at fair value and then are amortized over their estimated useful lives, determined to be seven years. The balance of the core deposit intangible, which is included in other assets in the consolidated balance sheet, was $99 and $150 at December 31, 2008 and 2007, respectively. Scheduled amortization expense related to the core deposit intangible is $52 for 2009 and $47 in the 2010.
Table of Contents
|
BAYLAKE CORP. |
NOTES TO CONSOLIDATED FINANCIAL STATEMENTS |
December 31, 2008, 2007 and 2006 |
(Dollar amounts in thousands) |
NOTE 1 – NATURE OF BUSINESS AND SUMMARY OF SIGNIFICANT ACCOUNTING POLICIES(Continued)
Long-Term Assets: Premises and equipment, goodwill, core deposit and other intangible assets, and other long-term assets are reviewed for impairment when events indicate that their carrying amount may not be recoverable from future undiscounted cash flows. If impaired, the assets are recorded at fair value. Management has determined that such assets have not been impaired as of December 31, 2008.
Loan Commitments and Related Financial Instruments: Financial instruments include off-balance-sheet credit instruments, such as commitments to make loans and commercial letters of credit, issued to meet customer financing needs. The face amount for these items represents the exposure to loss, before considering customer collateral or ability to repay. Such financial instruments are recorded when they are funded. Instruments, such as standby letters of credit, that are considered financial guarantees in accordance with FASB Interpretation No. 45 are recorded at fair value.
Trust Fee Income: The Company provides trust services to customers and in return charges fees using terms customary in its industry, including charging fees based on the agreed-upon percentages of assets managed or as otherwise specified in the underlying agreements. Income from trust services is recognized when the services are provided.
Advertising Expense: The Company expenses all advertising costs as they are incurred. Total advertising costs for the years ended December 31, 2008, 2007, and 2006 were $288, $291, and $273, respectively.
Stock Based Compensation: Effective January 1, 2006, the Company adopted Statement of Financial Accounting Standards (“SFAS”) No. 123(R),Share-based Payments, using the modified prospective transition method. Accordingly, the Company has recorded stock-based employee compensation cost using the fair value method starting in 2006.
Provision for Income Taxes: Income tax expense is the total of the current year income tax due or refundable and the change in deferred tax assets and liabilities. Deferred tax assets and liabilities are the expected future tax amounts for the temporary differences between carrying amounts and tax basis of assets and liabilities, computed using enacted tax rates. A valuation allowance, if needed, reduces deferred tax assets to the amount expected to be realized.
The Company adopted FASB Interpretation 48,Accounting for Uncertainty in Income Taxes (“Fin 48”), as of January 1, 2007. A tax position is recognized as a benefit only if it is “more likely than not” that the tax position would be sustained in a tax examination, with a tax examination presumed to occur. The amount recognized is the largest amount of tax benefit that is greater than 50% likely being realized on examination. For tax positions not meeting the “more likely than not” test, no tax benefit is recorded.
Table of Contents
|
BAYLAKE CORP. |
NOTES TO CONSOLIDATED FINANCIAL STATEMENTS |
December 31, 2008, 2007 and 2006 |
(Dollar amounts in thousands) |
NOTE 1 – NATURE OF BUSINESS AND SUMMARY OF SIGNIFICANT ACCOUNTING POLICIES(Continued)
In 2002, the Company purchased Bank Owned Life Insurance (BOLI) in two separate issuances. At the time of our purchases, there were uncertainties with respect to the tax treatment of these BOLI products in general that served as a basis for establishing a tax liability. The primary concern revolved around the taxability of the income derived from the separate account BOLI product due to issues surrounding the concept of investor control and other issues that arose in Corporate-Owned-Life Insurance. As of January 1, 2007, the Company conducted a review of that analysis and concluded that no tax liability was required. Consequently, the Company recorded a cumulative effect adjustment of $980 to increase retained earnings and reduce tax liabilities. This adjustment included interest but not penalties.
A roll-forward of the activity in the Company’s remaining accrual for uncertain tax positions is as follows:
| | | | | | | |
| | For the year ended December 31, | |
| | 2008 | | 2007 | |
Gross tax liability, beginning of year | | $ | 639 | | $ | 1,552 | |
Reduction in tax liability due to adoption of FIN 48 | | | — | | | (980 | ) |
Adjusted tax liability, beginning of year | | | 639 | | | 572 | |
Current period change in tax benefits | | | — | | | 67 | |
Reduction in tax liability settlement | | | (108 | ) | | — | |
Settlement payment | | | (177 | ) | | — | |
Gross tax liability, end of year | | $ | 354 | | $ | 639 | |
The gross tax liability, at December 31, 2008, is related to income earned by our subsidiary located in the state of Nevada. Due to the State of Wisconsin Department of Revenue’s (WDOR) change in position on the taxability of income from Nevada subsidiaries, and based on the Company’s analysis of FIN 48, there was an accrued liability of $354 and $639 at December 31, 2008 and 2007, respectively. On November 10, 2008, the Company entered into a settlement agreement with the WDOR related to this issue. The Company anticipates that corresponding tax benefits will be decreased by approximately $177 during 2009 as a result of the WDOR settlement.
The Company and its subsidiaries are subject to U.S. federal and Wisconsin state income tax. The Company and its subsidiaries file a consolidated federal income tax return and separate state income tax returns as appropriate. They are no longer subject to examination by U.S. Federal taxing authorities for years before 2004 and for Wisconsin state income taxes through 2001. They do not expect the total amount of unrecognized tax benefits to significantly increase or decrease in the next twelve months.
The Company recognizes interest and/or penalties related to income tax matters in income tax expense. Included in the $354 referred to above is $103 of interest, net of federal tax benefit.
Earnings Per Common Share: Basic earnings per common share is net income or loss divided by the weighted average number of common shares outstanding during the period. Diluted earnings per common share includes the dilutive effect of additional potential common shares issuable under stock options.
Table of Contents
|
BAYLAKE CORP. |
NOTES TO CONSOLIDATED FINANCIAL STATEMENTS |
December 31, 2008, 2007 and 2006 |
(Dollar amounts in thousands) |
NOTE 1 – NATURE OF BUSINESS AND SUMMARY OF SIGNIFICANT ACCOUNTING POLICIES(Continued)
Other Comprehensive Income: Comprehensive income consists of net income or loss and other comprehensive income. Other comprehensive income includes unrealized gains and losses on securities available for sale, which is also recognized as a separate component of equity.
Recent Accounting Pronouncements: In September 2006, the FASB issued Statement No. 157,Fair Value Measurements. This Statement defines fair value, establishes a framework for measuring fair value and expands disclosures about fair value measurements. This Statement establishes a fair value hierarchy about the assumptions used to measure fair value and clarifies assumptions about risk and the effect of a restriction on the sale or use of an asset. The standard was effective for the Company beginning January 1, 2008. In February 2008, the FASB issued Staff Position (FSP) 157-2,Effective Date of FASB Statement No. 157. This FSP delays the effective date of FAS 157 for all nonfinancial assets and nonfinancial liabilities, except those that are recognized or disclosed at fair value on a recurring basis (at least annually) to fiscal years beginning after November 15, 2008, and interim periods within those fiscal years. The impact of adoption was not material.
In February 2007, the FASB issued Statement No. 159,The Fair Value Option for Financial Assets and Liabilities.The statement provides companies with an option to report selected financial assets and liabilities at fair value and establishes presentation and disclosure requirements designed to facilitate comparisons between companies that choose different measurement attributes for similar types of assets and liabilities. The statement was effective for the Company on January 1, 2008. The impact of adoption was not material.
On November 5, 2007, the SEC issued Staff Accounting Bulletin No. 109,Written Loan Commitments Recorded at Fair Value through Earnings(“SAB 109”). Previously, SAB 105,Application of Accounting Principles to Loan Commitments, stated that in measuring the fair value of a derivative loan commitment, a company should not incorporate the expected net future cash flows related to the associated servicing of the loan. SAB 109 supersedes SAB 105 and indicates that the expected net future cash flows related to the associated servicing of the loan should be included in measuring fair value of all written loan commitments that are accounted for a fair value through earnings. SAB 105 also indicated that internally-developed intangible assets should not be recorded as part of the fair value of a derivative loan commitment, and SAB 109 retains that view. SAB 109 was effective for derivative loan commitments issued or modified in fiscal quarters beginning after December 15, 2007. The impact of adoption was not material.
In September 2006, the FASB Emerging Issues Task Force finalized Issue No. 06-4,Accounting for Deferred Compensation and Postretirement Benefit Aspects of Endorsement Split-Dollar Life Insurance Arrangements. This Issue requires that a liability be recorded during the service period when a split-dollar life insurance agreement continues after participants’ employment or retirement. The required accrued liability will be based on either the post-employment benefit cost for the continuing life insurance or based on the future death benefit depending on the contractual terms of the underlying agreement. This Issue is effective for fiscal years beginning after December 15, 2007. The impact of adoption on the Company’s consolidated financial statements was not material.
Table of Contents
|
BAYLAKE CORP. |
NOTES TO CONSOLIDATED FINANCIAL STATEMENTS |
December 31, 2008, 2007 and 2006 |
(Dollar amounts in thousands) |
NOTE 1 – NATURE OF BUSINESS AND SUMMARY OF SIGNIFICANT ACCOUNTING POLICIES(Continued)
In October 2008, the FASB issued FSP 157-3,Determining the Fair Value of a Financial Asset When the Market for That Asset Is Not Active.FSP 157-3 clarifies the application of SFAS 157 in an inactive market and provides key considerations in determining the fair value of an asset where the market is not active. FSP 157-3 was effective immediately upon issuance. The adoption of FSP 157-3 did not have a material impact on the Company’s consolidated financial condition, results of operations or liquidity.
Loss Contingencies: Loss contingencies, including claims and legal actions arising in the ordinary course of business, are recorded as liabilities when the likelihood of loss is probable and an amount or range of loss can be reasonably estimated.
Restrictions on Cash: Cash on hand or on deposit with the Federal Reserve Bank of $1,704 and $7,362 was required to meet regulatory reserve and clearing requirements at year-end 2008 and 2007. Effective October 1, 2008, these balances began earning interest.
Fair Value of Financial Instruments: Fair values of financial instruments are estimated using relevant market information and other assumptions, as more fully disclosed in Note 19. Fair value estimates involve uncertainties and matters of significant judgment regarding interest rates, credit risk, prepayments, and other factors, especially in the absence of broad markets for particular items. Changes in assumptions or in market conditions could significantly affect the estimates.
Dividend Reinvestment Plan: The Company administers a dividend reinvestment plan (DRIP), whereby, the Company allocates applicable dividends to acquire, on the participant’s behalf, shares of The Company’s common stock. Shares issued in 2008 and 2007 were 25,579 and 74,814 respectively.
Operating Segments: While the chief decision makers monitor the revenue streams of the various products and services, the identifiable segments are not material and operations are managed and financial performance is evaluated on a Company-wide basis. Accordingly, all of the financial service operations are considered by management to be aggregated in one reportable operating segment.
Reclassifications: Some items in the prior year consolidated financial statements were reclassified to conform to the current presentation.
Table of Contents
|
BAYLAKE CORP. |
NOTES TO CONSOLIDATED FINANCIAL STATEMENTS |
December 31, 2008, 2007 and 2006 |
(Dollar amounts in thousands) |
NOTE 2 – FAIR VALUE ACCOUNTING
Statement 157 establishes a fair value hierarchy which requires an entity to maximize the use of observable inputs and minimize the use of unobservable inputs when measuring fair value. The statement describes three levels of inputs that may be used to measure fair value:
| | |
| Level 1: | Quoted prices (unadjusted) or identical assets or liabilities in active markets that the entity has the ability to access as of the measurement date. |
| Level 2: | Significant other observable inputs other than Level 1 prices such as quoted prices for similar assets or liabilities; quoted prices in markets that are not active; or other inputs that are observable or can be corroborated by observable market data. |
| Level 3: | Significant unobservable inputs that reflect a reporting entity’s own assumptions about the assumptions that market participants would use in pricing an asset or liability. |
The fair value of securities available for sale is determined by obtaining quoted prices on nationally recognized securities exchanges (Level 1 inputs) or matrix pricing, which is a mathematical technique widely used in the industry to value debt securities without relying exclusively on quoted prices for the specific securities but rather by relying on the securities’ relationship to other benchmark quoted securities (Level 2 inputs). None of the Company’s securities available for sale at December 31, 2008 were measured using Level 1 inputs.
The fair value of mortgage servicing rights is based on a valuation model that calculates the present value of estimated net servicing income. The valuation model incorporates assumptions that market participants would use in estimating future net servicing income. We are able to compare the valuation model inputs and results to widely available published industry data for reasonableness (Level 2 inputs).
The fair value of both Foreclosed Properties and Impaired Loans is based on review of comparable collateral in the similar marketplaces and analysis of expected cash flows of the loan in relationship to the agreed terms of the loan. (Level 3 inputs).
Assets measured at fair value on a recurring basis are summarized below:
| | | | | | | | | | | | | |
ASSETS MEASURED ON A RECURRING BASIS | |
($ in thousands) | |
|
| | December 31,
2008 | | Quoted Prices in
Active Markets
For Identical Assets
(Level 1) | | Significant
Other
Observable
Inputs
(Level 2) | | Significant
Unobservable
Inputs
(Level 3) | |
Assets: | | | | | | | | | | | | | |
Securities available for sale | | $ | 225,417 | | $ | — | | $ | 225,417 | | $ | — | |
Table of Contents
|
BAYLAKE CORP. |
NOTES TO CONSOLIDATED FINANCIAL STATEMENTS |
December 31, 2008, 2007 and 2006 |
(Dollar amounts in thousands) |
NOTE 2 – FAIR VALUE ACCOUNTING(continued)
Assets measured at fair value on a non-recurring basis are summarized below:
| | | | | | | | | | | | | |
ASSETS MEASURED ON A NON-RECURRING BASIS | |
($ in thousands) | |
|
| | December 31,
2008 | | Quoted Prices in
Active Markets
For Identical Assets
(Level 1) | | Significant
Other
Observable
Inputs
(Level 2) | | Significant
Unobservable
Inputs
(Level 3) | |
Assets: | | | | | | | | | | | | | |
Servicing rights | | $ | 860 | | $ | — | | $ | 860 | | $ | — | |
Impaired loans | | | 26,299 | | | — | | | — | | | 26,299 | |
Foreclosed properties | | | 7,143 | | | — | | | — | | | 7,143 | |
| | $ | 34,302 | | $ | — | | $ | 860 | | $ | 33,442 | |
NOTE 3 - SECURITIES
The fair value of securities available for sale and the related unrealized gains and losses as of December 31, 2008 and 2007 are as follows:
| | | | | | | | | | |
| | 2008 | |
| | Fair
Value | | Gross
Unrealized
Gains | | Gross
Unrealized
Losses | |
U.S. Treasury and other
U.S. government approved agency securities | | $ | 4,605 | | $ | 116 | | $ | — | |
Obligations of states and political subdivisions | | | 53,647 | | | 724 | | | (931 | ) |
Mortgage-backed securities | | | 155,133 | | | 3,051 | | | (36 | ) |
Private placement and corporate bonds | | | 9,353 | | | — | | | (5,777 | ) |
Other securities | | | 2,679 | | | — | | | — | |
| | $ | 225,417 | | $ | 3,891 | | $ | (6,744 | ) |
| | | | | | | | | | |
| | 2007 | |
| | Fair
Value | | Gross
Unrealized
Gains | | Gross
Unrealized
Losses | |
U.S. Treasury and other
U.S. government approved agency securities | | $ | 29,268 | | $ | 104 | | $ | (58 | ) |
Obligations of states and political subdivisions | | | 56,228 | | | 612 | | | (125 | ) |
Mortgage-backed securities | | | 118,696 | | | 539 | | | (691 | ) |
Private placement and corporate bonds | | | 14,864 | | | — | | | (277 | ) |
Other securities | | | 3,419 | | | — | | | — | |
| | $ | 222,475 | | $ | 1,255 | | $ | (1,151 | ) |
Table of Contents
|
BAYLAKE CORP. |
NOTES TO CONSOLIDATED FINANCIAL STATEMENTS |
December 31, 2008, 2007 and 2006 |
(Dollar amounts in thousands) |
NOTE 3 - SECURITIES (Continued)
Other securities consist of short-term money market mutual funds and equity securities in the Federal Reserve Bank and other nonmarketable equity securities, which are carried at cost.
A summary of sales of securities available for sale were as follows:
| | | | | | | | | | |
| | 2008 | | 2007 | | 2006 | |
| | | | | | | | | | |
Proceeds | | $ | 56,089 | | $ | 34,479 | | $ | — | |
Gross realized gains | | | 774 | | | 353 | | | — | |
Gross realized losses | | | 9 | | | 1 | | | — | |
The estimated market value of investments at December 31, 2008, by contractual maturity, is shown below. Expected maturities will differ from contractual maturities because borrowers may have the right to call or prepay obligations with or without call or prepayment penalties.
| | | | |
| | EstimatedFair
Value | |
Due in one year or less | | $ | 141 | |
Due after one year through five years | | | 4,098 | |
Due after five years through ten years | | | 29,597 | |
Due after ten years | | | 33,769 | |
| | | 67,605 | |
Other equity securities | | | 2,679 | |
Mortgage-backed securities | | | 155,133 | |
| | $ | 225,417 | |
Securities pledged to secure public deposits and borrowed funds had a carrying value of $134,029 and $123,602 at December 31, 2008 and 2007, respectively.
Securities with unrealized losses at December 31, 2008 and 2007, aggregated by investment category and length of time that individual securities have been in a continuous unrealized loss position, are as follows:
| | | | | | | | | | | | | | | | | | | |
| | Less than 12 Months | | 12 Months or More | | Total | |
Description of Securities | | Fair
Value | | Unrealized
Loss | | Fair
Value | | Unrealized
Loss | | Fair
Value | | Unrealized
Loss | |
2008 | | | | | | | | | | | | | | | | | | | |
U.S. Treasury and other | | | | | | | | | | | | | | | | | | | |
U.S. government approved agency securities | | $ | — | | $ | — | | $ | — | | $ | — | | $ | — | | $ | — | |
Obligations states and political subdivisions | | | 24,005 | | | (931 | ) | | — | | | — | | | 24,005 | | | (931 | ) |
Mortgage-backed securities | | | 16,925 | | | (33 | ) | | 3,717 | | | (3 | ) | | 20,642 | | | (36 | ) |
Private placement and corporate bonds | | | 7,901 | | | (4,133 | ) | | 1,452 | | | (1,644 | ) | | 9,353 | | | (5,777 | ) |
Total temporarily impaired | | $ | 48,831 | | $ | (5,097 | ) | $ | 5,169 | | $ | (1,647 | ) | $ | 54,000 | | $ | (6,744 | ) |
| | | | | | | | | | | | | | | | | | | |
2007 | | | | | | | | | | | | | | | | | | | |
U.S. Treasury and other | | | | | | | | | | | | | | | | | | | |
U.S. government approved agency securities | | $ | 16,672 | | $ | (58 | ) | $ | — | | $ | — | | $ | 16,672 | | $ | (58 | ) |
Obligations states and political subdivisions | | | 13,892 | | | (125 | ) | | — | | | — | | | 13,892 | | | (125 | ) |
Mortgage-backed securities | | | 74,818 | | | (691 | ) | | — | | | — | | | 74,818 | | | (691 | ) |
Private placement and corporate bonds | | | 2,811 | | | (277 | ) | | — | | | — | | | 2,811 | | | (277 | ) |
Total temporarily impaired | | $ | 108,193 | | $ | (1,151 | ) | $ | — | | $ | — | | $ | 108,193 | | $ | (1,151 | ) |
Table of Contents
|
BAYLAKE CORP. |
NOTES TO CONSOLIDATED FINANCIAL STATEMENTS |
December 31, 2008, 2007 and 2006 |
(Dollar amounts in thousands) |
NOTE 3 - SECURITIES (Continued)
At December 31, 2008, the mortgage-backed securities category with continuous unrealized losses for twelve months or more comprises two securities and the private placement and corporate bond category with continuous unrealized losses for twelve months or more comprises one security. At December 31, 2007, no securities in any category had continuous unrealized losses for twelve months or more.
The Company evaluates securities for other-than-temporary impairment at least on a quarterly basis, and more frequently when economic or market concerns warrant such evaluation. As part of such monitoring, the credit quality of individual securities and their issuers are assessed. Adjustments to market value that are considered temporary are recorded as a separate component of equity, net of tax. If an impairment of a security is identified as other than temporary based on information available such as the decline in the credit worthiness of the issuer, external market ratings or the anticipated or realized elimination of associated dividends, such impairments are recorded in the statement of operations. At December 31, 2008 and 2007, securities with temporary unrealized losses had depreciated in value by approximately 11% and 1%, respectively, in aggregate, from the amortized cost basis. Unrealized losses reflected in the preceding tables have not been included in results of operations because the affected securities are of high credit quality and management has the intent and ability to hold these securities until recovery or maturity. The losses on these securities are expected to dissipate as they approach their maturity dates and/or if interest rates decline.
At year end 2008 and 2007, there were no holdings of securities of any one issuer, other than the U.S. Government and its agencies, in an amount greater than 10% of stockholders’ equity.
Table of Contents
|
BAYLAKE CORP. |
NOTES TO CONSOLIDATED FINANCIAL STATEMENTS |
December 31, 2008, 2007 and 2006 |
(Dollar amounts in thousands) |
NOTE 4 - LOANS
Major classifications of loans as of December 31, 2008 and 2007 are as follows:
| | | | | | | |
| | 2008 | | 2007 | |
| | | | | | | |
Commercial | | $ | 110,432 | | $ | 127,549 | |
Real estate | | | | | | | |
Residential | | | 134,436 | | | 119,932 | |
Commercial | | | 381,765 | | | 386,981 | |
Construction | | | 69,838 | | | 93,047 | |
Consumer | | | 12,876 | | | 14,388 | |
Municipal loans | | | 19,858 | | | 18,663 | |
| | | 729,205 | | | 760,560 | |
Less: | | | | | | | |
Deferred loan origination fees, net of costs | | | 483 | | | 350 | |
Allowance for loan losses | | | 13,561 | | | 11,840 | |
| | | | | | | |
Net loans | | $ | 715,161 | | $ | 748,370 | |
Loans having a carrying value of $49,948 and $27,407 are pledged as collateral for borrowings from the Federal Home Loan Bank at December 31, 2008 and 2007, respectively.
Certain directors and officers of the Company and the Bank, including their immediate families, companies in which they are principal owners, and trusts in which they are involved, were loan customers of the Bank during 2008 and 2007.
A summary of the changes in those loans is as follows:
| | | | |
| | For the
year ended
December 31,
2008 | |
| | | | |
Balance at beginning of year | | $ | 4,544 | |
New loans made | | | 5,185 | |
Repayments received | | | (4,028 | ) |
Reclassification for loans related to former officers and directors | | | (178 | ) |
Balance at end of year | | $ | 5,523 | |
Changes in the allowance for loan losses were as follows:
| | | | | | | | | | |
| | For the year ended December 31, | |
| | 2008 | | 2007 | | 2006 | |
Balance at beginning of year | | $ | 11,840 | | $ | 8,058 | | $ | 9,551 | |
Provision charged to operations | | | 17,961 | | | 9,761 | | | 903 | |
Recoveries | | | 427 | | | 479 | | | 1,021 | |
Loans charged off | | | (16,667 | ) | | (6,458 | ) | | (3,417 | ) |
Balance at end of year | | $ | 13,561 | | $ | 11,840 | | $ | 8,058 | |
Table of Contents
|
BAYLAKE CORP. |
NOTES TO CONSOLIDATED FINANCIAL STATEMENTS |
December 31, 2008, 2007 and 2006 |
(Dollar amounts in thousands) |
NOTE 4 – LOANS(continued)
Information regarding impaired loans is as follows:
| | | | | | | |
| | December 31, | |
| | 2008 | | 2007 | |
| | | | | | | |
Impaired loans with no allocated allowance for loan loss | | $ | 17,755 | | $ | 4,805 | |
Impaired loans with allocated allowance for loan loss | | | 26,299 | | | 32,754 | |
Allowance allocated to impaired loans | | | 6,019 | | | 6,051 | |
| | | | | | | | | | |
| | For the year ended December 31, | |
| | | | | | | | | | |
| | 2008 | | 2007 | | 2006 | |
| | | | | | | | | | |
Average impaired loans during the period | | $ | 39,492 | | $ | 34,231 | | $ | 23,952 | |
Interest income recognized during impairment | | | 213 | | | 565 | | | 364 | |
Cash-basis interest income recognized | | | 106 | | | 505 | | | 339 | |
Nonperforming loans were as follows:
| | | | | | | |
| | December 31, | |
| | 2008 | | 2007 | |
Loans past due over 90 days still on accrual | | $ | — | | $ | — | |
Loans restructured in a troubled debt restructuring | | | 367 | | | — | |
Non-accrual loans | | | 43,687 | | | 37,555 | |
Total nonperforming loans | | $ | 44,054 | | $ | 37,555 | |
If these loans had been current throughout their terms, interest income for the non-accrual period would have approximated $2,887, $3,971 and $2,555 for 2008, 2007 and 2006, respectively.
Table of Contents
|
BAYLAKE CORP. |
NOTES TO CONSOLIDATED FINANCIAL STATEMENTS |
December 31, 2008, 2007 and 2006 |
(Dollar amounts in thousands) |
NOTE 5 - PREMISES AND EQUIPMENT
| | | | | | | |
| | December 31, | |
| | 2008 | | 2007 | |
| | | | | | | |
Land | | $ | 5,357 | | $ | 6,715 | |
Buildings and improvements | | | 24,836 | | | 24,704 | |
Equipment | | | 11,931 | | | 12,253 | |
| | | 42,124 | | | 43,672 | |
Less accumulated depreciation | | | 17,673 | | | 17,075 | |
| | | | | | | |
Premises and equipment | | $ | 24,451 | | $ | 26,597 | |
Depreciation expense was $1,394, $1,534, and $1,609 for 2008, 2007, and 2006, respectively.
The Company has a three-year lease to rent space for a branch bank location in a mall in Howard, Wisconsin that was extended in 2007. The Company must also pay its proportional share of costs for common areas at the mall. Rent expense for these facilities for 2008, 2007, and 2006 was $38, $37, and $39, respectively. Future minimum lease payments under the remaining lease agreement that expires in 2010 is $61.
During 2008 and 2006, vacant property owned by the Company was sold with realized gains totaling $63 and $190 respectively. At December 31, 2008, approximately 12 acres of land were held for sale with a cost basis of $1,541.
During 2006, gains of $103 were realized on the sale of office space under a condominium development arrangement. At year-end 2008, there is still one unit held for sale with a cost basis of $465.
NOTE 6 – FORECLOSED PROPERTIES, NET
Foreclosed properties are summarized as follows:
| | | | | | | | | | |
| | For the year ended December 31, | |
| | 2008 | | 2007 | | 2006 | |
Beginning balance | | $ | 5,167 | | $ | 5,760 | | $ | 3,333 | |
Transfer of net realizable value to foreclosed properties | | | 8,328 | | | 5,932 | | | 6,399 | |
Sale proceeds, net | | | (2,623 | ) | | (6,160 | ) | | (3,958 | ) |
Net gain (loss) from sale of foreclosed properties | | | (119 | ) | | (232 | ) | | 76 | |
Provision for foreclosed properties | | | (3,610 | ) | | (133 | ) | | (90 | ) |
Total Foreclosed properties | | $ | 7,143 | | $ | 5,167 | | $ | 5,760 | |
Table of Contents
|
BAYLAKE CORP. |
NOTES TO CONSOLIDATED FINANCIAL STATEMENTS |
December 31, 2008, 2007 and 2006 |
(Dollar amounts in thousands) |
NOTE 6 – FORECLOSED PROPERTIES, NET(continued)
Changes in the valuation allowance for losses on other real estate were as follows:
| | | | | | | | | | |
| | For the year ended December 31, | |
| | 2008 | | 2007 | | 2006 | |
Beginning balance | | $ | 207 | | $ | 108 | | $ | 267 | |
Provision charged to operations | | | 3,610 | | | 133 | | | 90 | |
Amounts related to properties disposed | | | (426 | ) | | (34 | ) | | (249 | ) |
| | | | | | | | | | |
Balance at end of year | | $ | 3,391 | | $ | 207 | | $ | 108 | |
NOTE 7 - GOODWILL
The change in balance for goodwill during the year is as follows:
| | | | | | | |
| | For the year ended
December 31, | |
| | 2008 | | 2007 | |
| | | | | | | |
Beginning of year | | $ | 6,108 | | $ | 5,723 | |
UFS stock options exercised | | | — | | | 385 | |
Impairment | | | — | | | — | |
| | | | | | | |
End of year | | $ | 6,108 | | $ | 6,108 | |
During 2007, additional goodwill resulted from the exercise of stock options and subsequent redemption of the stock held by a key employee of UFS, a data processing company in whom the Bank has an ownership interest. Refer to Note 1.
NOTE 8 - DEPOSITS
| | | | | | | |
The following is a summary of deposits by type at December 31: | | | | | | | |
| | | | | | | |
| | 2008 | | 2007 | |
| | | | | | | |
Non-interest-bearing demand deposits | | $ | 73,537 | | $ | 94,120 | |
Interest-bearing demand deposits | | | 129,136 | | | 118,122 | |
Savings deposits | | | 30,473 | | | 28,250 | |
Money market deposits | | | 206,558 | | | 208,027 | |
Time deposits $100,000 and greater | | | 193,928 | | | 226,088 | |
Other time deposits | | | 216,126 | | | 209,578 | |
Total deposits | | $ | 849,758 | | $ | 884,185 | |
| | | | | | | |
Brokered certificates of deposit included above: | | $ | 113,863 | | $ | 130,856 | |
Table of Contents
|
BAYLAKE CORP. |
NOTES TO CONSOLIDATED FINANCIAL STATEMENTS |
December 31, 2008, 2007 and 2006 |
(Dollar amounts in thousands) |
NOTE 8 – DEPOSITS (continued)
At December 31, 2008, the scheduled maturities of time deposits were as follows:
| | | | |
2009 | | | 285,507 | |
2010 | | | 100,042 | |
2011 | | | 8,783 | |
2012 | | | 9,717 | |
2013 | | | 6,005 | |
| | $ | 410,054 | |
Deposits from the Company’s directors and officers held by the Bank at December 31, 2008 and 2007 amounted to $4,559 and $4,688, respectively.
NOTE 9 - FEDERAL FUNDS PURCHASED AND REPURCHASE AGREEMENTS
Short-term borrowings consisted of the following at December 31:
| | | | | | | |
| | 2008 | | 2007 | |
Federal funds purchased | | $ | — | | $ | 16,141 | |
Securities sold under agreements to repurchase | | | 30,174 | | | 11,033 | |
| | $ | 30,174 | | $ | 27,174 | |
| | | | | | | |
Average amounts outstanding during year | | $ | 32,750 | | $ | 17,048 | |
Maximum month-end amounts outstanding | | | 45,659 | | | 41,107 | |
Average interest rates on amounts outstanding at end of year | | | 1.18 | % | | 4.73 | % |
Average interest rates on amounts outstanding during year | | | 2.38 | % | | 5.18 | % |
NOTE 10 - FEDERAL HOME LOAN BANK ADVANCES
A summary of Federal Home Loan Bank advances at December 31 is as follows:
| | | | | | | | | | | | | | |
Year of
Maturity | | | 2008 | | Weighted
Average
Rate | | 2007 | | Weighted
Average
Rate | |
| | | | | | | | | | | | | |
2008 | | $ | — | | | — | | $ | 85,000 | | | 4.40 | % |
2009 | | | 20,000 | | | 1.62 | % | | — | | | — | |
2010 | | | — | | | — | | | — | | | — | |
2011 | | | 65,000 | | | 2.85 | % | | — | | | — | |
Total fixed maturity | | | 85,000 | | | 2.56 | % | | 85,000 | | | 4.40 | % |
Advances with amortizing principal | | | 95 | | | 3.64 | % | | 172 | | | 3.78 | % |
| | | | | | | | | | | | | |
Total | | $ | 85,095 | | | 2.56 | % | $ | 85,172 | | | 4.40 | % |
Table of Contents
|
BAYLAKE CORP. |
NOTES TO CONSOLIDATED FINANCIAL STATEMENTS |
December 31, 2008, 2007 and 2006 |
(Dollar amounts in thousands) |
NOTE 10 - FEDERAL HOME LOAN BANK ADVANCES(continued)
Maximum month-end amounts outstanding were $85,171 and $115,179 at December 31, 2008 and 2007, respectively.
Each advance is payable at its maturity date, with a prepayment penalty for fixed rate advances. Federal Home Loan Bank advances are secured by $49,948 of real estate mortgages and $71,122 of mortgage-backed and U.S. government approved agency securities. A $40 million advance with a rate of 2.055% maturing in 2011 is putable by the FHLB in March 2009. The advances in the table above maturing in 2009 are at variable rates priced at three month LIBOR plus 10 basis points and the interest rate is reset quarterly. Those advances maturing in 2011 are fixed rate.
NOTE 11 - SUBORDINATED DEBENTURES
In 2001, the Company formed Baylake Capital Trust I (the Trust) as a statutory business trust organized for the sole purpose of issuing $16,100 of 10% fixed rate cumulative trust-preferred securities and investing the proceeds thereof in junior subordinated debentures of the Company, the sole asset of the Trust.
On March 31, 2006, the Company redeemed its outstanding junior subordinated indentures and trust preferred securities for a total of $16.5 million which constitutes the $16.1 million stated principal values of those amounts plus $0.4 million in accrued interest.
The redemption of these securities were funded through the issuance of $16.1 million of trust preferred securities and $0.5 million of trust common securities issued under the name Baylake Capital Trust II (“Trust II”) that will adjust quarterly at a rate equal to 1.35% over the three month LIBOR (2.82% at December 31, 2008). For banking regulatory purposes, these securities are considered Tier 1 capital.
Trust II’s ability to pay amounts due on the trust-preferred securities is solely dependent upon the Company making payment on the related subordinated debentures to the Trust. The Company’s obligations under the subordinated debentures include a conditional guarantee by the Company of the Trust’s obligations under the trust securities issued by the trust. In addition, under the terms of the Debentures, the Company would be precluded from paying dividends on the Company’s common stock if the Company was in default under the Debentures, if the Company exercised its right to defer payments of interest on the Debentures or if certain related defaults occurred.
Table of Contents
|
BAYLAKE CORP. |
NOTES TO CONSOLIDATED FINANCIAL STATEMENTS |
December 31, 2008, 2007 and 2006 |
(Dollar amounts in thousands) |
NOTE 12 - CAPITAL MATTERS
Banks and bank holding companies are subject to regulatory capital requirements administered by federal banking agencies. Capital adequacy guidelines and, additionally for banks, prompt corrective action regulations involve quantitative measures of assets, liabilities, and certain off-balance-sheet items calculated under regulatory accounting practices. Capital amounts and classifications are also subject to qualitative judgments by regulators. Failure to meet capital requirements can initiate regulatory action.
Prompt corrective action regulations provide five classifications: well capitalized, adequately capitalized, undercapitalized, significantly undercapitalized, and critically undercapitalized, although these terms are not used to represent overall financial condition. If adequately capitalized, regulatory approval is required to accept brokered deposits. If undercapitalized, capital distributions are limited, as is asset growth and expansion, and capital restoration plans are required. At year-end 2008 and 2007, regulatory notifications categorized the Bank as adequately and well capitalized, respectively, under the regulatory framework for prompt corrective action. There are no conditions or events since that notification that management believes have changed the Bank’s category.
Regulatory restrictions, which govern all state chartered banks, preclude the payment of dividends without the prior written consent of the Wisconsin Department of Financial Institutions Division of Banking (“WDFI”) if dividends declared and paid by such bank in either of the two immediately preceding years exceeded that bank’s net income for those years. During 2008, no dividends were declared. During 2007, $4.5 million in dividends were declared and $2.3 million in dividends were paid to the Company by the Bank, which was in excess of the Bank’s net income for the year. In order to pay dividends in the future, the Bank needs to seek prior approval from WDFI, as well as the Federal Reserve Board. Future dividends will be subject to improved earnings and the reduction of non-performing loans.
The Company’s and the Bank’s risk-based capital and leverage ratios at December 31, 2008 and 2007 are presented below.
| | | | | | | | | | | | | | | | | | | |
| | Actual | | For Capital
Adequacy Purposes | | To Be Well
Capitalized Under
Prompt Corrective
Action Provisions | |
| | Amount | | Ratio | | Amount | | Ratio | | Amount | | Ratio | |
2008 | | | | | | | | | | | | | | | | | | | |
Total Capital to risk-weighted assets | | | | | | | | | | | | | | | | | | | |
Consolidated | | $ | 80,787 | | | 9.72 | % | $ | 66,471 | | | 8.00 | % | | N/A | | | N/A | |
Bank | | | 79,566 | | | 9.56 | % | | 66,524 | | | 8.00 | | $ | 83,155 | | | 10.00 | % |
Tier 1 (Core) Capital to risk-weighted assets | | | | | | | | | | | | | | | | | | | |
Consolidated | | | 70,362 | | | 8.47 | % | | 33,235 | | | 4.00 | | | N/A | | | N/A | |
Bank | | | 69,132 | | | 8.31 | % | | 33,262 | | | 4.00 | | | 49,893 | | | 6.00 | |
Tier 1 (Core) Capital to average assets | | | | | | | | | | | | | | | | | | | |
Consolidated | | | 70,362 | | | 6.68 | % | | 42,110 | | | 4.00 | | | N/A | | | N/A | |
Bank | | | 69,132 | | | 6.56 | % | | 42,161 | | | 4.00 | | | 52,701 | | | 5.00 | |
|
2007 | | | | | | | | | | | | | | | | | | | |
Total Capital to risk-weighted assets | | | | | | | | | | | | | | | | | | | |
Consolidated | | $ | 101,050 | | | 11.32 | % | $ | 71,421 | | | 8.00 | % | | N/A | | | N/A | |
Bank | | | 99,483 | | | 11.13 | % | | 71,477 | | | 8.00 | | $ | 89,346 | | | 10.00 | % |
Tier 1 (Core) Capital to risk-weighted assets | | | | | | | | | | | | | | | | | | | |
Consolidated | | | 89,882 | | | 10.07 | % | | 35,710 | | | 4.00 | | | N/A | | | N/A | |
Bank | | | 88,306 | | | 9.88 | % | | 37,739 | | | 4.00 | | | 53,607 | | | 6.00 | |
Tier 1 (Core) Capital to average assets | | | | | | | | | | | | | | | | | | | |
Consolidated | | | 89,882 | | | 8.34 | % | | 43,125 | | | 4.00 | | | N/A | | | N/A | |
Bank | | | 88,306 | | | 8.19 | % | | 43,153 | | | 4.00 | | | 53,941 | | | 5.00 | |
Table of Contents
|
BAYLAKE CORP. |
NOTES TO CONSOLIDATED FINANCIAL STATEMENTS
December 31, 2008, 2007 and 2006
(Dollar amounts in thousands) |
NOTE 13 - OTHER COMPREHENSIVE INCOME (LOSS)
Other comprehensive income (loss) components and related tax effects were as follows:
| | | | | | | | | | |
| | For the year ended December 31, | |
| | 2008 | | 2007 | | 2006 | |
| | | | | | | | | | |
Unrealized holding gains (losses) on securities available for sale arising during period | | $ | (4,092 | ) | $ | 2,389 | | $ | 872 | |
Reclassification adjustment for net gains realized in income | | | (765 | ) | | (352 | ) | | — | |
Reclassification adjustment for other than temporary impairment realized in income | | | 1,900 | | | — | | | — | |
Net unrealized gains(losses) | | | (2,957 | ) | | 2,037 | | | 872 | |
Tax effect | | | 1,237 | | | (723 | ) | | (315 | ) |
| | | | | | | | | | |
Other comprehensive income (loss) | | $ | (1,720 | ) | $ | 1,314 | | $ | 557 | |
NOTE 14 - FINANCIAL INSTRUMENTS WITH OFF-BALANCE-SHEET RISK
The Company is party to financial instruments with off-balance-sheet risk in the normal course of business to meet the financing needs of its customers. These financial instruments include commitments to extend credit, standby letters of credit, and financial guarantees. The Company does not use forward loan sale commitments.
Table of Contents
|
BAYLAKE CORP. |
NOTES TO CONSOLIDATED FINANCIAL STATEMENTS
December 31, 2008, 2007 and 2006
(Dollar amounts in thousands) |
NOTE14 - FINANCIAL INSTRUMENTS WITH OFF-BALANCE-SHEET RISK (Continued)
The Company’s exposure to credit loss in the event of nonperformance by the other party to the financial instrument for commitments to extend credit and standby letters of credit is represented by the contract or notional amount of those instruments. The Company uses the same credit policies in making commitments and conditional obligations as it does for on-balance-sheet instruments.
| | | | | | | |
| | Contract or
Notional Amount
at December 31, | |
| | 2008 | | 2007 | |
Financial instruments whose contract amounts represent credit risk: | | | | | | | |
Commitments to extend credit | | $ | 177,487 | | $ | 188,457 | |
Standby letters of credit | | | 16,325 | | | 19,386 | |
Commitments to extend credit are agreements to lend to a customer as long as there is no violation of any condition established in the contract. Commitments generally have fixed expiration dates or other termination clauses and may require payment of a fee. Since many of the commitments are expected to expire without being drawn upon, the total commitment amounts do not necessarily represent future cash requirements. The Company evaluates each customers’ creditworthiness on a case-by-case basis. The amount of collateral obtained, if deemed necessary by the Company upon extension of credit, is based on management’s credit evaluation of the counter-party. Collateral held varies but may include accounts receivable; inventory; property, plant, and equipment; and income-producing commercial properties. Fixed rate commitments totaled $9,716 and $14,712 at December 31, 2008 and 2007, respectively, with rates ranging from 3.33% to 9.25% in 2008 and 3.0% to 12.0% in 2007.
Standby letters of credit are conditional commitments issued by the Company to guarantee the performance of customers to a third party. These are primarily issued to support private borrowing arrangements and expire in decreasing amounts through 2010. The credit risk involved in issuing letters of credit is essentially the same as that involved in extending loan facilities to customers. The Company does not require collateral as support for the commitments. Collateral is secured as commitments are funded.
In 2008, 2007 and 2006, impairment charges of $2,539, $0 and $27 were taken on standby letters of credit which were issued by the Company on behalf of customers to accommodate their borrowings with third parties. The provision for impairment charges relates to the establishment of a liability for the Company’s expected losses on outstanding letters of credit. The Company continues to monitor the financial condition of the borrowers on an ongoing basis, and if they continue to deteriorate, may need to provide additional reserves with respect to the off-balance commitment. The balance of the letters of credit totaled $6,831 and $7,029 at December 31, 2008 and 2007, respectively. At December 31, 2008 and 2007, the carrying value recorded by the Company as a liability for those guarantees was $2,957 and $419, respectively.
The Company does not use interest rate contracts (e.g. swaps) or other derivatives to manage interest rate risk and does not have any of these outstanding at December 31, 2008.
Table of Contents
|
BAYLAKE CORP. |
NOTES TO CONSOLIDATED FINANCIAL STATEMENTS
December 31, 2008, 2007 and 2006
(Dollar amounts in thousands) |
NOTE 15 - POST-RETIREMENT PLANS
The subsidiaries have 401(k) Profit Sharing Plans covering all employees who qualify as to age and length of service. The employer contributions paid and expensed under all plans totaled $1,103 in 2008, $1,184 in 2007, and $1,173 in 2006.
Certain officers and directors of the Company and its subsidiaries are covered by nonqualified deferred compensation plans. Payments to be made under these plans are accrued over the anticipated years of service of the individuals covered. Amounts charged to expense were $(512) in 2008, $467 in 2007, and $1,051 in 2006. The aggregate amount of deferred compensation included in other liabilities in the consolidated balance sheets is $3,100 and $3,845 in 2008 and 2007, respectively. In March 2005, the Company established the Baylake Bank Supplemental Executive Retirement Plan (“Plan”) which is intended to provide certain management and highly compensated employees of the Company who have contributed and are expected to continue to contribute, to the Company’s success by providing for deferred compensation in addition to that available under the Company’s other retirement programs. Costs amounting to $(640), $246, and $799 are included in the amounts charged to expense for 2008, 2007, and 2006, respectively. The Company has ceased contributions to the Plan for the foreseeable future.
NOTE 16 - INCOME TAX EXPENSE
Income tax expense (benefit) consists of the following:
| | | | | | | | | | |
| | For the year ended December 31, | |
| | 2008 | | 2007 | | 2006 | |
Current income taxes | | | | | | | | | | |
Federal | | $ | (1,792 | ) | $ | (215 | ) | $ | 3,013 | |
State | | | (142 | ) | | 4 | | | 592 | |
| | | (1,934 | ) | | (211 | ) | | 3,605 | |
Deferred income taxes | | | | | | | | | | |
Federal | | | (4,254 | ) | | (1,636 | ) | | (688 | ) |
State | | | (1,672 | ) | | (569 | ) | | (152 | ) |
| | | (5,926 | ) | | (2,205 | ) | | (840 | ) |
Income tax expense (benefit) | | $ | (7,860 | ) | $ | (2,416 | ) | $ | 2,765 | |
The provision for income taxes differs from the amount of income tax determined by applying the statutory federal income tax rate to pretax income as a result of the following differences:
| | | | | | | | | | |
| | For the year ended December 31, | |
| | 2008 | | 2007 | | 2006 | |
Income tax expense (benefit) based on statutory rate (34%) | | $ | (6,010 | ) | $ | (712 | ) | $ | 3,448 | |
State income tax expense (benefit) net of federal tax expense (benefit) | | | (1,103 | ) | | (427 | ) | | 253 | |
| | | (7,113 | ) | | (1,139 | ) | | 3,701 | |
Effect of tax-exempt interest income | | | (935 | ) | | (833 | ) | | (691 | ) |
Life insurance death benefit and earnings | | | (11 | ) | | (294 | ) | | (304 | ) |
Equity in income of UFS subsidiary | | | (80 | ) | | (189 | ) | | (174 | ) |
Other | | | 279 | | | 39 | | | 233 | |
| | | | | | | | | | |
Expense (benefit) based on effective tax rates | | $ | (7,860 | ) | $ | (2,416 | ) | $ | 2,765 | |
Table of Contents
|
BAYLAKE CORP. |
NOTES TO CONSOLIDATED FINANCIAL STATEMENTS
December 31, 2008, 2007 and 2006
(Dollar amounts in thousands) |
NOTE 16 - INCOME TAX EXPENSE(continued)
Deferred income taxes reflect the net tax effects of temporary differences between the carrying amounts of assets and liabilities for financial reporting purposes and the amounts used for income tax purposes.
The following is a summary of the significant components of the Company’s deferred tax assets and liabilities as of December 31, 2008 and 2007:
| | | | | | | |
| | 2008 | | 2007 | |
| | | | | | | |
Deferred tax assets | | | | | | | |
Allowance for loan losses | | $ | 5,318 | | $ | 4,643 | |
Off-balance sheet credit losses | | | 1,160 | | | 164 | |
Deferred loan fees | | | 190 | | | 137 | |
Deferred compensation | | | 1,600 | | | 1,927 | |
Non accrual loans | | | 2,311 | | | 1,919 | |
Accrued vacation pay | | | 362 | | | 344 | |
OREO property valuation | | | 1,330 | | | 81 | |
Net unrealized loss on securities available for sale | | | 1,218 | | | — | |
Donations | | | 47 | | | 90 | |
Deferred tax credits – AMT | | | 680 | | | — | |
Federal net operating loss carryforwards (NOLs) | | | 1,100 | | | — | |
State net operating loss carryforwards (NOLs) | | | 1,487 | | | 794 | |
Other than temporary impairment of securities | | | 745 | | | — | |
Other | | | 65 | | | 11 | |
Gross deferred tax assets before valuation allowance | | | 17,613 | | | 10,110 | |
Valuation allowance (state NOLs) | | | (659 | ) | | (610 | ) |
Net deferred tax assets | | | 16,954 | | | 9,500 | |
Deferred tax liabilities | | | | | | | |
Depreciation | | | 1,927 | | | 1,976 | |
FHLB stock dividends | | | 791 | | | 791 | |
Mortgage loan servicing | | | 63 | | | 177 | |
Net unrealized gain on securities available for sale | | | — | | | 19 | |
Equity in UFS subsidiary | | | 524 | | | — | |
Prepaid expenditures | | | 110 | | | 109 | |
Other | | | 38 | | | 90 | |
Gross deferred tax liabilities | | | 3,453 | | | 3,162 | |
Net deferred tax asset | | $ | 13,501 | | $ | 6,338 | |
Table of Contents
|
BAYLAKE CORP. |
NOTES TO CONSOLIDATED FINANCIAL STATEMENTS
December 31, 2008, 2007 and 2006
(Dollar amounts in thousands) |
NOTE 16 - INCOME TAX EXPENSE(continued)
At December 31, 2008, the Company has federal and state NOL carryforwards of approximately $3.2 million and $28.5 million respectively. The federal NOL carryforwards expire in 2028. At December 31, 2007, the Company had no federal NOL carryforwards and $15.0 million of state NOL carryforwards. These NOLs expire at various times through 2023.
The Company carries a valuation allowance to reduce deferred tax assets related to state net operating loss carryforwards (NOLs) to an amount which the Company believes the benefit will more likely than not be realized. The Company will continue to assess the amount of tax benefits it may realize.
During the fourth quarter of 2008, the Company changed its approach for treating UFS income as a temporary difference instead of a permanent difference. The effect of this change was not material to the Company’s consolidated financial condition and results of operations.
Income tax expense recorded in the consolidated statement of income involves the interpretation and application of certain accounting pronouncements and federal and state tax codes. The Company undergoes examination by various regulatory taxing agencies. Such agencies may require that changes in the amount of tax expense be recognized when their interpretations differ from those of management, based on their judgment about information available to them at the time of their examination. The Company has not accrued any penalties for unrecognized tax benefits.
As of January 1, 2007, the Company adopted Fin 48 as discussed in Note 1 and recorded an adjustment to beginning retained earnings in the amount of $980.
Table of Contents
|
BAYLAKE CORP. |
NOTES TO CONSOLIDATED FINANCIAL STATEMENTS
December 31, 2008, 2007 and 2006
(Dollar amounts in thousands except per share data) |
NOTE 17 - EARNINGS PER SHARE
Earnings (loss) per share is based on the weighted average number of shares outstanding for the year. A reconciliation of the basic and diluted earnings per share amounts is as follows:
| | | | | | | | | | |
| | For the year ended December 31, | |
| | 2008 | | 2007 | | 2006 | |
Basic | | | | | | | | | | |
Net income (loss) | | $ | (9,817 | ) | $ | 166 | | $ | 7,376 | |
Weighted average common shares outstanding | | | 7,911,469 | | | 7,851,508 | | | 7,802,208 | |
| | | | | | | | | | |
Basic earnings (loss) per common share | | $ | (1.24 | ) | $ | 0.02 | | $ | 0.95 | |
| | | | | | | | | | |
Diluted | | | | | | | | | | |
Net income (loss) | | $ | (9,817 | ) | $ | 166 | | $ | 7,376 | |
Weighted average common shares outstanding for basic earnings per share | | | 7,911,469 | | | 7,851,508 | | | 7,802,208 | |
Add: Dilutive effects of assumed exercises of stock options | | | — | | | 1,271 | | | 33,315 | |
Average shares and dilutive potential common shares | | | 7,911,469 | | | 7,852,779 | | | 7,835,523 | |
| | | | | | | | | | |
Diluted earnings (loss) per common share | | $ | (1.24 | ) | $ | 0.02 | | $ | 0.94 | |
| | | | | | | | | | |
Additional common stock option shares that have not been included due to their antidilutive effect | | | 126,628 | | | 166,700 | | | 60,000 | |
NOTE 18 - STOCK OPTION PLAN
The Company has a non-qualified stock option plan under which certain officers and key salaried employees may purchase shares of the Company’s stock at an established exercise price. Unless earlier terminated, these options will expire ten years from the date of grant. The options vest over a five-year period, becoming exercisable 20% per year, commencing one year from date of grant. Subsequent to the expiration of the Plan, options were granted in 2004 under the same terms as would have applied under the Plan. Total compensation cost (benefit), net of income tax, that has been charged against income for the plan was $(36), $21, and $48 for 2008, 2007, and 2006, respectively. The total income tax benefit was $(8), $8, and $19 for the respective periods.
There were no stock options granted in 2008, 2007 or 2006.
Table of Contents
|
BAYLAKE CORP. |
NOTES TO CONSOLIDATED FINANCIAL STATEMENTS |
December 31, 2008, 2007 and 2006 |
(Dollar amounts in thousands except per share data) |
NOTE 18 - STOCK OPTION PLAN(continued)
Activity in the stock option plan during 2008 follows:
| | | | | | | | | | | | | |
| | Shares | | Weighted
Average
Exercise
Price | | Weighted
Average
Remaining
Contractual
Term | | Aggregate
Intrinsic
Value | |
|
Outstanding at beginning of year | | | 212,134 | | $ | 16.60 | | | | | | | |
Granted | | | — | | | — | | | | | | | |
Exercised | | | — | | | — | | | | | | | |
Forfeited or expired | | | (85,506 | ) | | 16.75 | | | | | | | |
Outstanding at end of year | | | 126,628 | | $ | 16.50 | | | 1.42 | | $ | — | |
| | | | | | | | | | | | | |
Exercisable at end of year | | | 124,628 | | $ | 16.54 | | | 1.38 | | $ | — | |
| | | | | | | | | | | | | |
Fully vested and expected to vest | | | 126,628 | | $ | 16.50 | | | 1.42 | | $ | — | |
Activity in the stock option plan during 2007 follows:
| | | | | | | | | | | | | |
| | Shares | | Weighted
Average
Exercise
Price | | Weighted
Average
Remaining
Contractual
Term | | Aggregate
Intrinsic
Value | |
Outstanding at beginning of year | | | 387,325 | | $ | 15.10 | | | | | | | |
Granted | | | — | | | — | | | | | | | |
Exercised | | | (110,005 | ) | | 10.78 | | | | | | | |
Forfeited or expired | | | (65,186 | ) | | 17.48 | | | | | | | |
Outstanding at end of year | | | 212,134 | | $ | 16.60 | | | 2.80 | | $ | — | |
| | | | | | | | | | | | | |
Exercisable at end of year | | | 203,370 | | $ | 16.72 | | | 2.62 | | $ | — | |
| | | | | | | | | | | | | |
Fully vested and expected to vest | | | 211,886 | | $ | 16.60 | | | 2.80 | | $ | — | |
Table of Contents
|
BAYLAKE CORP. |
NOTES TO CONSOLIDATED FINANCIAL STATEMENTS |
December 31, 2008, 2007 and 2006 |
(Dollar amounts in thousands except per share data) |
NOTE 18 - STOCK OPTION PLAN (continued)
Activity in the stock option plan during 2006 follows:
| | | | | | | | | | | | | |
| | Shares | | Weighted
Average
Exercise
Price | | Weighted
Average
Remaining
Contractual
Term | | Aggregate
Intrinsic
Value | |
Outstanding at beginning of year | | | 486,869 | | $ | 13.95 | | | | | | | |
Granted | | | — | | | — | | | | | | | |
Exercised | | | — | | | — | | | | | | | |
Forfeited or expired | | | (99,544 | ) | | 9.35 | | | | | | | |
Outstanding at end of year | | | 387,325 | | $ | 15.10 | | | 3.00 | | $ | 923 | |
| | | | | | | | | | | | | |
Exercisable at end of year | | | 352,264 | | $ | 15.24 | | | 2.70 | | $ | 835 | |
Information related to the stock option plan during each year follows:
| | | | | | | | | | |
| | 2008 | | 2007 | | 2006 | |
Intrinsic value of options exercised | | $ | — | | $ | 239 | | $ | 648 | |
Cash received from option exercises | | | — | | | 1,184 | | | 932 | |
Tax benefit realized from option exercises | | | — | | | 94 | | | 272 | |
As of December 31, 2008, there was $2 of total unrecognized compensation cost related to nonvested stock options granted under the Plan. The cost is expected to be recognized over a weighted-average period of 3 months.
NOTE 19 - DISCLOSURES ABOUT FAIR VALUE OF FINANCIAL INSTRUMENTS
The methods and assumptions used to estimate fair value are described as follows.
Carrying amount is the estimated fair value for cash and cash equivalents, accrued interest receivable and payable, demand deposits, short-term debt, and variable rate loans or deposits that reprice frequently and fully. Security fair values are based on market prices or dealer quotes and, if no such information is available, on the rate and term of the security and information about the issuer. For fixed rate loans and deposits and variable rate loans or deposits with infrequent repricing or repricing limits, fair value is based on discounted cash flows using current market rates applied to the estimated life and credit risk. Fair values for impaired loans are estimated using discounted cash flow analysis or underlying collateral values. Fair value of loans held for sale is based on market quotes. Fair value of long- term debt is based on current rates for similar financing. It is not practical to determine the fair value of Federal Home Loan Bank stock due to restrictions placed on its transferability. The fair value of off-balance sheet items is measured based on the present value of expected future cash flows for instruments where the Bank is obligated to fund such commitments.
Table of Contents
|
BAYLAKE CORP. |
NOTES TO CONSOLIDATED FINANCIAL STATEMENTS |
December 31, 2008, 2007 and 2006 |
(Dollar amounts in thousands) |
NOTE 19 - DISCLOSURES ABOUT FAIR VALUE OF FINANCIAL INSTRUMENTS (continued)
| | | | | | | | | | | | | |
| | December 31, | |
| | 2008 | | 2007 | |
| | Carrying
Amount | | Fair
Value | | Carrying
Amount | | Fair
Value | |
Financial assets | | | | | | | | | | | | | |
Cash and cash equivalents | | $ | 23,085 | | $ | 23,085 | | $ | 46,381 | | $ | 46,381 | |
Federal funds sold | | | 397 | | | 397 | | | — | | | — | |
Securities available for sale | | | 225,417 | | | 225,417 | | | 222,475 | | | 222,475 | |
Loans held for sale | | | 368 | | | 373 | | | 741 | | | 749 | |
Loans, net | | | 715,161 | | | 721,569 | | | 748,370 | | | 746,084 | |
Federal Home Loan Bank stock | | | 6,792 | | | n/a | | | 6,792 | | | n/a | |
Accrued interest receivable | | | 3,968 | | | 3,968 | | | 5,394 | | | 5,394 | |
| | | | | | | | | | | | | |
Financial liabilities | | | | | | | | | | | | | |
Deposits | | | 849,758 | | | 854,228 | | | 884,185 | | | 885,795 | |
Federal funds purchased and repurchase agreements | | | 30,174 | | | 30,174 | | | 27,174 | | | 27,174 | |
Federal Home Loan Bank advances | | | 85,095 | | | 86,228 | | | 85,172 | | | 85,247 | |
Subordinated debentures | | | 16,100 | | | 16,100 | | | 16,100 | | | 16,100 | |
Accrued interest payable | | | 2,857 | | | 2,857 | | | 4,743 | | | 4,743 | |
| | | | | | | | | | | | | |
Off balance sheet credit related items Letter of credit | | | 2,957 | | | 2,957 | | | 418 | | | 418 | |
Table of Contents
|
BAYLAKE CORP. |
NOTES TO CONSOLIDATED FINANCIAL STATEMENTS |
December 31, 2008, 2007 and 2006 |
(Dollar amounts in thousands) |
NOTE 20 - CONDENSED FINANCIAL INFORMATION - PARENT COMPANY ONLY
CONDENSED BALANCE SHEETS
December 31
| | | | | | | |
| | 2008 | | 2007 | |
ASSETS | | | | | | | |
Cash and cash equivalents | | $ | 1,208 | | $ | 588 | |
Receivable from subsidiary | | | 28 | | | 2,231 | |
Deferred income taxes | | | 15 | | | 25 | |
Investment in subsidiaries | | | 83,826 | | | 94,787 | |
| | | | | | | |
Total assets | | $ | 85,077 | | $ | 97,631 | |
| | | | | | | |
LIABILITIES AND STOCKHOLDERS’ EQUITY | | | | | | | |
Liabilities | | | | | | | |
Dividends payable | | $ | — | | $ | 1,262 | |
Other payables | | | 18 | | | — | |
Interest Payable | | | 3 | | | 7 | |
Debentures | | | 16,100 | | | 16,100 | |
Total liabilities | | | 16,121 | | | 17,369 | |
| | | | | | | |
Stockholders’ equity | | | 68,956 | | | 80,262 | |
| | | | | | | |
Total liabilities and stockholders’ equity | | $ | 85,077 | | $ | 97,631 | |
Table of Contents
|
BAYLAKE CORP. |
NOTES TO CONSOLIDATED FINANCIAL STATEMENTS |
December 31, 2008, 2007 and 2006 |
(Dollar amounts in thousands) |
NOTE 20 - CONDENSED FINANCIAL INFORMATION - PARENT COMPANY ONLY (continued)
CONDENSED STATEMENTS OF OPERATIONS
Years ended December 31
| | | | | | | | | | |
| | 2008 | | 2007 | | 2006 | |
Income | | | | | | | | | | |
Dividends from subsidiaries | | $ | — | | $ | 4,500 | | $ | 5,400 | |
Interest income | | | 37 | | | 87 | | | 152 | |
Total income | | | 37 | | | 4,587 | | | 5,552 | |
|
Expenses | | | | | | | | | | |
Interest | | | 794 | | | 1,089 | | | 1,705 | |
Other | | | 116 | | | 70 | | | 175 | |
Total expenses | | | 910 | | | 1,159 | | | 1,880 | |
| | | | | | | | | | |
Income (loss) before equity in undistributed net income of subsidiaries | | | (873 | ) | | 3,428 | | | 3,672 | |
| | | | | | | | | | |
Equity in undistributed net income (loss) of subsidiaries (dividends in excess of earnings) | | | (9,241 | ) | | (3,627 | ) | | 3,117 | |
Income (loss) before income taxes | | | (10,114 | ) | | (199 | ) | | 6,789 | |
Income tax benefit | | | (297 | ) | | (365 | ) | | (587 | ) |
| | | | | | | | | | |
Net income (loss) | | $ | (9,817 | ) | $ | 166 | | $ | 7,376 | |
Table of Contents
|
BAYLAKE CORP. |
NOTES TO CONSOLIDATED FINANCIAL STATEMENTS |
December 31, 2008, 2007 and 2006 |
(Dollar amounts in thousands) |
NOTE 20 - CONDENSED FINANCIAL INFORMATION - PARENT COMPANY ONLY (continued)
CONDENSED STATEMENT OF CASH FLOWS
Years ended December 31
| | | | | | | | | | |
| | 2008 | | 2007 | | 2006 | |
Cash flows from operating activities: | | | | | | | | | | |
Net income (loss) | | $ | (9,817 | ) | $ | 166 | | $ | 7,376 | |
Adjustments to reconcile net income to net cash provided by operating activities: | | | | | | | | | | |
Undistributed (earnings) loss of subsidiary (dividends in excess of earnings) | | | 9,241 | | | 3,627 | | | (3,117 | ) |
Stock Compensation Expense | | | (44 | ) | | 21 | | | 48 | |
Amortization of debt issue costs | | | — | | | — | | | 475 | |
Net amortization of securities | | | — | | | (1 | ) | | (3 | ) |
Net change in intercompany receivable | | | 2,203 | | | (2,205 | ) | | 142 | |
Tax benefit from exercise of stock options | | | 8 | | | (94 | ) | | (272 | ) |
Other changes, net | | | 34 | | | 92 | | | 261 | |
Net cash provided by operating activities | | | 1,625 | | | 1,606 | | | 4,910 | |
| | | | | | | | | | |
Cash flows from investing activities: | | | | | | | | | | |
Proceeds from sale of securities | | | — | | | 1,000 | | | — | |
| | | | | | | | | | |
Cash flows from financing activities: | | | | | | | | | | |
Redemption of subordinated debt | | | — | | | — | | | (16,100 | ) |
Proceeds from issue of subordinated debt | | | — | | | — | | | 16,100 | |
Proceeds from exercise of stock options | | | — | | | 1,184 | | | 932 | |
Tax benefit (expense) from exercise of stock options | | | (8 | ) | | 94 | | | 272 | |
Treasury stock repurchases | | | — | | | (1,823 | ) | | (1,101 | ) |
Dividend reinvestment plan | | | 265 | | | 1,096 | | | 268 | |
Dividends paid | | | (1,262 | ) | | (5,022 | ) | | (4,982 | ) |
Net cash used in financing activities | | | (1,005 | ) | | (4,471 | ) | | (4,611 | ) |
| | | | | | | | | | |
Net change in cash and cash equivalents | | | 620 | | | (1,865 | ) | | 299 | |
| | | | | | | | | | |
Beginning cash and cash equivalents | | | 588 | | | 2,453 | | | 2,154 | |
| | | | | | | | | | |
Ending cash and cash equivalents | | $ | 1,208 | | $ | 588 | | $ | 2,453 | |
Table of Contents
ITEM 9.CHANGES IN AND DISAGREEMENTS WITH ACCOUNTANTS ON ACCOUNTING AND FINANCIAL DISCLOSURE
None.
ITEM 9A.CONTROLS AND PROCEDURES
Disclosures Controls and Procedures:Our management, with the participation of our Chief Executive Officer and Chief Financial Officer, has evaluated the effectiveness of our disclosure controls and procedures (as such term is defined in Rules 13a-15(e) and 15d-15(e) under the Securities Exchange Act of 1934, as amended (the “Exchange Act”)) as of December 31, 2008. Based on such evaluation, our Chief Executive Officer and Chief Financial Officer have concluded that, as of the end of such period, our disclosure controls and procedures are effective in recording, processing, summarizing and reporting, on a timely basis, information required to be disclosed by us in the reports that we file or submit under the Exchange Act.
There are inherent limitations in the effectiveness of any system of internal control over financial reporting, including the possibility of human error and circumvention or overriding of controls. Accordingly, even an effective system of internal control over financial reporting can provide only reasonable assurance with respect to financial statement preparation. Projections of any evaluation of effectiveness to future periods are subject to the risks that controls may become inadequate because of changes in conditions or that the degree of compliance with the policies or procedures may deteriorate.
Management’s Report on Internal Control over Financial Reporting: The report of our management on our internal control over financial reporting appears on page 47 of this Annual Report on Form 10-K.
Changes in Internal Control Over Financial Reporting:There have not been any changes in our internal control over financial reporting (as such term is defined in Rules 13a-15(f) and 15d-15(f) under the Exchange Act) that have occurred during the quarter ended December 31, 2008, that have materially affected or are reasonably likely to materially affect our internal control over financial reporting.
ITEM 9B.OTHER INFORMATION
None.
PART III
ITEM 10.DIRECTORS, EXECUTIVE OFFICERS AND CORPORATE GOVERNANCE
The information set forth under the sections titled “Proposal No. 1, Election of Directors,” “Information on Executive Officers” and “Compliance with Section 16(a) of the Exchange Act” contained in the definitive proxy statement for our 2009 Annual Meeting of Stockholders is incorporated herein by reference.
ITEM 11.EXECUTIVE COMPENSATION
The information set forth under the sections titled “Director Fees and Benefits”, “Compensation Discussion and Analysis”, “Board of Directors Compensation Committee Report on Management Compensation”, and “Compensation Committee Interlocks and Insider Participation” contained in the definitive proxy statement for our 2009 Annual Meeting of Stockholders is incorporated herein by reference.
ITEM 12.SECURITY OWNERSHIP OF CERTAIN BENEFICIAL OWNERS AND MANAGEMENT AND RELATED STOCKHOLDER MATTERS
The information set forth under the section titled “Ownership of Baylake Common” contained in the definitive proxy statement for our 2009 Annual Meeting of Stockholders is incorporated herein by reference.
Table of Contents
Equity compensation plan information:
The following table sets forth information regarding options and shares reserved for future issuance under the equity compensation plans as of December 31, 2008.
| | | | | | | | | | |
Plan Category | | Number of securities to
be issued upon exercise
of outstanding options,
warrants and rights
(a) | | Weighted-average
exercise price of
outstanding options,
warrants and rights
(b) | | Number of securities
remaining available for
future issuance under
equity compensation
plans (excluding
securities reflected in
column (a))
(c) | |
Equity compensation plans approved by security holders | | | 116,628 | | $ | 16.70 | | | — | |
Equity compensation plans not approved by security holders ** | | | 10,000 | | | 14.15 | | | — | |
Total | | | 126,628 | | $ | 16.50 | | | — | |
** These options represent options granted with the same terms and conditions as those granted under the 1993 Stock Option Plan, as amended, but after expiration of that Plan. The total number of options granted was less than the total authorized under the Plan, which was adopted with shareholder approval. We previously announced that we do not intend to grant further stock options.
ITEM 13.CERTAIN RELATIONSHIPS AND RELATED TRANSACTIONS, AND DIRECTOR INDEPENDENCE
Information set forth in the section titled “Certain Transactions with Management” in the definitive proxy statement for our 2009 Annual Meeting of Stockholders is incorporated herein by reference.
ITEM 14.PRINCIPAL ACCOUNTANT FEES AND SERVICES
Information set forth in the section titled “Principal Accountant Fees and Services” in the definitive proxy statement for our 2009 Annual Meeting of Stockholders is incorporated herein by reference.
Table of Contents
PART IV
ITEM 15.EXHIBITS AND FINANCIAL STATEMENT SCHEDULES
(a) 1 and 2
The consolidated financial statements and supplementary data contained in Item 8 of this report are filed as part of this report. All schedules are omitted because of the absence of the conditions under which they are required or because the required information is included in the consolidated financial statements or related notes.
(a) 3
See Item 15(b) below
(b) Exhibits Required by Item 601 of Regulation S-K
Reference is made to the Exhibit Index following the signatures for exhibits filed as part of this report.
SIGNATURES
Pursuant to the requirements of Section 13 or 15 (d) of the Securities Exchange Act of 1934, the registrant has duly caused this report to be signed on its behalf by the undersigned, thereunto duly authorized.
| | | |
| BAYLAKE CORP. |
| By: | /s/Robert J. Cera | |
| | Robert J. Cera | |
| | President and Chief Executive Officer and |
| | Director (Principal Executive Officer) |
| | |
| By: | /s/Kevin L. LaLuzerne | |
| | Kevin L. LaLuzerne | |
| | Chief Financial Officer and Treasurer |
| | (Principal Financial and Accounting Officer) |
Date:March 17, 2009
POWER OF ATTORNEY
KNOW ALL MEN BY THESE PRESENTS, that each individual whose signature appears below hereby designates and appoints Robert J. Cera and Kevin L. LaLuzerne, and each of them, any one of whom may act without the joinder of the other, as such person’s true and lawful attorney-in-fact and agents (the “Attorneys-in-Fact”) with full power of substitution and resubstitution, for such person and in such person’s name, place and stead, in any and all capacities, to sign any and all amendments to this report, and to file the same, with all exhibits thereto, and other documents in connection therewith, the Securities and Exchange Commission and any state securities commission, granting unto said Attorneys-in-Fact and agents, and each of them, full power and authority to do and perform each and every act and thing requisite and necessary to be done in and about the premises, as fully to all intents and purposes as he might or could do in person, hereby ratifying and conforming all that said Attorneys-in-Fact and agents or any of them, or their or his substitutes, may lawfully do or cause to be done by virtue hereof.
Table of Contents
Pursuant to the requirements of the Securities Exchange Act of 1934, as amended, this report has been signed by the following persons in the capacities and on these dates indicated.
| | | |
/s/ Thomas L. Herlache | | /s/ Richard A. Braun | |
Thomas L. Herlache, Director | Richard A. Braun, Director |
Chairman of the Board | Vice-Chairman of the Board |
| | | |
/s/ Kevin L. LaLuzerne | | /s/ Robert W. Agnew | |
Kevin L. LaLuzerne, Chief Financial Officer | Robert W. Agnew, Director |
and Treasurer (Principal Financial and | | |
Accounting Officer) | | |
| | | |
/s/ Dee Geurts-Bengtson | | /s/ Robert J. Cera | |
Dee Geurts-Bengtson, Director | Robert J. Cera, President and Chief Executive |
| | Officer and Director (Principal Executive |
| | Officer) | |
| | | |
/s/ George Delveaux, Jr. | | /s/ Roger G. Ferris | |
George Delveaux, Jr., Director | Roger G. Ferris, Director |
| | | |
/s/ Joseph J. Morgan | | /s/ William Parsons | |
Joseph J. Morgan, Director | William Parsons, Director |
| | | |
/s/ Paul Jay Sturm | | | |
Paul Jay Sturm, Director | | |
* Each of the above signatures is affixed as of March 17, 2009.
Table of Contents
| | | |
Exhibit No. | | Description | |
3.1 | | Articles of Incorporation, as amended through July 3, 2001, incorporated by reference to Exhibit 4.1 from the Company’s Registration Statement on Form S-3 (File No. 333-118857) filed on September 8, 2004 |
| | |
3.2 | | Articles of Amendment to Articles of Incorporation, incorporated by reference to Exhibit 3.1 from the Company’s Quarterly Report on Form 10-Q for the quarter ended June 30, 2007 |
| | |
3.3 | | Composite Articles of Incorporation, incorporated by reference to Exhibit 3.2 from the Company’s Quarterly Report on Form 10-Q for the quarter ended June 30, 2007 |
| | |
3.4 | | Bylaws, as amended through February 21, 1996, incorporated by reference to Exhibit 4.2 from the Company’s Registration Statement on Form S-3 (File No. 333-118857) filed on September 8, 2004 |
| | |
4.1 | | Advances, Collateral Pledge, and Security Agreement dated as of August 8, 1997 between Baylake Bank and Federal Home Loan Bank of Chicago, incorporated by reference to Exhibit 4.1 from the Company’s Annual Report on Form 10-K for the fiscal year ended December 31, 2006 |
| | |
10.1 | | Baylake Bank’s Deferred Compensation Program with Thomas L. Herlache*, incorporated by reference to Exhibit 10.3 from the Company’s Annual Report on Form 10-K for the fiscal year ended December 31, 1993 |
| | |
10.2 | | Baylake Bank’s Deferred Compensation and Salary Continuation Agreement with Richard A. Braun*, incorporated by reference to Exhibit 10.5 from the Company’s Annual Report on Form 10-K for the fiscal year ended December 31, 1993 |
| | |
10.3 | | Deferred Compensation Plan for Selected Directors of Baylake Bank (Money Purchase Compensation Plan) dated December 19, 1995*, incorporated by reference to Exhibit 10.3 from the Company’s Annual Report on Form 10-K for the fiscal year ended December 31, 2006 |
| | |
10.4 | | Baylake Corp. Stock Purchase Plan*, incorporated by reference to Exhibit 4 from the Company’s Form S-8 filed on February 10, 1998 |
| | |
10.5 | | Baylake Corp. 1993 Stock Option Plan, as amended in 1998*, incorporated by reference to Exhibit 99.1 from the Company’s Form S-8 filed on September 21, 1998 |
| | |
10.6 | | Baylake Bank Supplemental Executive Retirement Plan*, incorporated by reference to Exhibit 10.8 from the Company’s Annual Report on Form 10-K for the fiscal year ended December 31, 2004 |
| | |
10.7 | | Employment Agreement dated as of June 30, 2006 between Baylake Bank and Robert J. Cera*, incorporated by reference to Exhibit 10.7 from the Company’s Annual Report on Form 10-K for the fiscal year ended December 31, 2006 |
| | |
10.8 | | Separation Agreement dated January 30, 2007 between Baylake Bank and Steven Jennerjohn*, incorporated by reference to Exhibit 10.1 from the Company’s Current Report on Form 8-K filed on February 15, 2007 |
Table of Contents
| | |
10.9 | | Executive Employee Salary Continuation Agreement for Thomas L. Herlache dated October 1, 1999*, incorporated by reference to Exhibit 10.9 from the Company’s Annual Report on Form 10-K for the Fiscal year ended December 31, 2006 |
| | |
10.10 | | Preferred Compensation Agreement, incorporated by reference to Exhibit 10.1 from the Company’s Quarterly Report on Form 10-Q for the quarter ended March 31, 2007* |
| | |
10.11 | | Non-Qualified Retirement Trust incorporated by reference from the Company’s Quarterly Report on Form 10-Q for the quarter ended March 31, 2007* |
| | |
10.12 | | Amendments to Deferred Compensation Agreements with Thomas L. Herlache and Summary of Benefits for serving as Chairman, incorporated by reference from the Company’s Quarterly Report on Form 10-Q for the quarter ended June 30, 2007* |
| | |
10.13 | | Description of employment arrangement between the Company and Joseph L. Hoffmeyer, incorporated by reference to the Company’s Current Report on For 8-K dated December 5, 2008* |
| | |
16.1 | | Letter of Crowe Chizek and Company LLC regarding change in independent registered public accounting firm, incorporated by reference to Exhibit 16.1 of the Company’s Current Report on Form 8-K filed on May 5, 2008 |
| | |
21.1 | | List of Subsidiaries |
| | |
23.1 | | Consent of Virchow, Krause & Company, LLP |
| | |
23.2 | | Consent of Crowe Horwath LLP |
| | |
24.1 | | Power of Attorney (contained on the Signature Page) |
| | |
31.1 | | Certification of the Chief Executive Officer pursuant to Rule 13a-14(a) under the Securities Exchange Act of 1934, as amended |
| | |
31.2 | | Certification of the Chief Financial Officer pursuant to Rule 13a-14(a) under the Securities Exchange Act of 1934, as amended |
| | |
32.1 | | Certification of the Chief Executive Officer pursuant to Rule 13a-14(b) under the Securities Exchange Act of 1934, as amended and 18 U.S.C. Section 1350 |
| | |
32.2 | | Certification of the Chief Financial Officer pursuant to Rule 13a-14(b) under the Securities Exchange Act of 1934, as amended and 18 U.S.C. Section 1350 |
| | |
| | *Designates compensation plans or agreements |