UNITED STATES
SECURITIES AND EXCHANGE COMMISSION
WASHINGTON, D.C. 20549
FORM 10-K
(Mark One)
| x | ANNUAL REPORT PURSUANT TO SECTION 13 OR 15(d) OF THE SECURITIES EXCHANGE ACT OF 1934 |
For the fiscal year ended December 31, 2006
| ¨ | TRANSITION REPORT PURSUANT TO SECTION 13 OR 15(d) OF THE SECURITIES EXCHANGE ACT OF 1934 |
For the transition period from to
Commission file number 0-8679
BAYLAKE CORP.
(Exact name of Registrant as specified in its charter)
| | |
| Wisconsin | | 39-1268055 |
(State or other jurisdiction of incorporation or organization) | | (I.R.S. Employer Identification No.) |
| | |
| 217 North Fourth Avenue, Sturgeon Bay, WI | | 54235 |
| (Address of principal executive offices) | | (Zip Code) |
Registrant’s Telephone number, including area code: (920)-743-5551
Securities registered pursuant to Section 12(b) of the Act: None
Securities registered pursuant to Section 12(g) of the Act: Common Stock $5.00 Par Value Per Share
Indicate by check mark if the registrant is a well-known seasoned issuer, as defined in Rule 405 of the Securities Act. Yes ¨ No x
Indicate by check mark if the registrant is not required to file reports pursuant to Section 13 or Section 15(d) of the Act. Yes ¨ No x
Indicate by check mark whether the registrant (1) has filed all reports required to be filed by Section 13 or 15(d) of the Securities Exchange Act of 1934 during the preceding 12 months (or for such shorter period that the registrant was required to file such reports), and (2) has been subject to such filing requirements for the past 90 days. Yes x No ¨
Indicate by check mark if disclosure of delinquent filers pursuant to Item 405 of Regulation S-K is not contained herein, and will not be contained, to the best of registrant’s knowledge, in definitive proxy or information statements incorporated by reference in Part III of this Form 10-K or any amendment to this Form 10-K ¨
Indicate by check mark whether the registrant is a large accelerated filer, an accelerated filer, or a non-accelerated filer. See definition of “accelerated filer” and “large accelerated filer” in Rule 12b-2 of the Exchange Act. (Check one):
Large accelerated filer ¨ Accelerated filer x Non-accelerated filer ¨
Indicate by check mark whether the registrant is a shell company (as defined in Rule 12b-2 of the Exchange Act.) Yes ¨ No x
As of June 30, 2006 (the last business day of the Registrant’s most recently completed second fiscal quarter), the aggregate market value of the Common Stock (based upon the $15.95 reported bid price on that date) held by non-affiliates (excludes a total of444,509 shares reported as beneficially owned by directors and executive officers-does not constitute an admission as to affiliate status) was approximately $117,401,857. As of March 6, 2007, 7,867,645 shares of Common Stock were outstanding.
DOCUMENTS INCORPORATED BY REFERENCE
| | |
Document | | Part of Form 10-K Into Which Portions of Documents are Incorporated |
| Definitive Proxy Statement for 2007 Annual Meeting of Shareholders to be filed within 120 days of the fiscal year ended December 31, 2006 | | Part III |
2006 FORM 10-K
TABLE OF CONTENTS
2
General
Baylake Corp. is a Wisconsin corporation organized in 1976, registered as a bank holding company under the Bank Holding Company Act of 1956, as amended (the “BHCA”). Our primary activities consist of holding indirectly the stock of our wholly-owned subsidiary bank, Baylake Bank, and providing a wide range of banking and related business activities through our bank and our other subsidiaries.
Baylake Bank
Baylake Bank is a Wisconsin state bank originally chartered in 1876. We conduct our community banking business through 28 full-service financial centers located throughout Northeast Wisconsin, in Brown, Door, Green Lake, Kewaunee, Manitowoc, Outagamie, Waupaca, and Waushara Counties. We have eight financial centers in Door County, which is known for its tourism related services. We have eight financial centers in Brown County, which includes the city of Green Bay. We serve a broader range of service, manufacturing and retail job segments in this market. The balance of our financial centers are located in the remaining locations, which include a combination of small cities and smaller communities. Other principal industries in our market area include light industry and manufacturing, agriculture, food related products, and, to a lesser degree, lumber and furniture.
Baylake Bank is an independent community bank offering a full range of financial services primarily to small businesses and individuals located in our market area. To complement our traditional banking products, such as demand deposit accounts, various savings account plans, certificates of deposit and real estate, consumer, commercial/industrial and agricultural loans, we offer our customers a variety of services including transfer agency, personal and corporate trust, insurance agency, brokerage, financial planning, cash management and electronic banking services.
Non-Bank Subsidiaries
In addition to our banking operations, Baylake Bank owns three non-bank subsidiaries: Baylake Investments, Inc., located in Las Vegas, Nevada, which holds and manages an investment and loan portfolio; Baylake City Center LLC, which owns 10.9% of a commercial building condominium in Green Bay, currently being offered for sale; and Baylake Insurance Agency, Inc., which offers various types of insurance products to the general public as an independent agent. Baylake Bank also owns a minority interest (49.8% of the outstanding common stock) in United Financial Services, Inc. (“UFS”), a data processing services company, located in Grafton, Wisconsin, that provides data processing services to approximately 35 banks (including Baylake Bank) and ATM processing services to approximately 50 banks.
At December 31, 2006, we had total assets of $1.1 billion. For additional financial information, see our Consolidated Financial Statements and Notes at Item 8 of this Form 10-K.
Corporate Governance Matters
We maintain a website at www.baylake.com. We make available through that website, free of charge, copies of our Annual Reports on Form 10-K, Quarterly Reports on Form 10-Q, Current Reports on Form 8-K and amendments to those reports, as soon as reasonably practical after Baylake electronically files those materials with, or furnishes them to, the Securities and Exchange Commission (“SEC”). Our SEC reports can be accessed through the Baylake Corp. link of our website. The SEC also maintains a website at www.sec.gov that contains reports, proxy statements and other information regarding SEC registrants.
Lending
We offer short-term and long-term loans on a secured and unsecured basis for business and personal purposes. We make real estate, commercial/industrial, agricultural and consumer loans in accordance with the basic lending policies established by our board of directors. We focus lending activities on individuals and small businesses in our market area. Lending activity has been concentrated primarily within the State of Wisconsin. We do not conduct any substantial business with foreign obligors. We serve a wide variety of industries including, on a limited basis, a concentration on businesses directly and indirectly related to the tourism related industries. Loans to customers in the restaurant and lodging business totaled $128.4 million at December 31, 2006, or 15.8% of our loans at that date. Although competitive and economic pressures exist in this market segment, business remains relatively steady in the markets we serve. However, any deterioration in the economy of Northeastern Wisconsin (as a result, for example, of a decline in its
3
manufacturing or tourism industries or otherwise) could have a material adverse effect on our business and operations. In particular, a decline in the Door County tourism business would not only affect our customers in the restaurant and lodging business, and therefore loans to them as described above, but could also affect loans and other business relationships with persons employed in that industry and real estate values (including collateral values) in the area.
Our total outstanding loans as of December 31, 2006 amounted to approximately $819.6 million, consisting of 56.7% commercial real estate loans, 17.6% residential real estate loans, 11.5% construction and land development real estate loans, 10.1% commercial and industrial loans, 1.8% installment and 2.4% municipal loans.
Investments
We maintain a portfolio of investments, primarily consisting of U.S. Treasury securities, U.S. Government Agency securities, mortgage-backed securities and obligations of states and their political subdivisions. We attempt to balance our portfolio to manage interest rate risks, maximize tax advantages and meet its liquidity needs while endeavoring to maximize investment income.
Deposits
We offer a broad range of depository products, including non-interest bearing demand deposits, interest-bearing demand deposits, various savings and money market accounts and certificates of deposit. Deposits are insured by the Deposit Insurance Fund of the Federal Deposit Insurance Corporation (“FDIC”) up to statutory limits. At December 31, 2006, our total deposits amounted to $878.9 million, including interest bearing deposits of $782.0 million and non-interest bearing deposits of $96.9 million.
Other Customer Services and Products
Other services and products we offer include transfer agency, safe deposit box services, personal and corporate trust services, conference center facilities, insurance agency and brokerage services, cash management, private banking, financial planning and electronic banking services, including eBanc, an Internet banking product for our customers.
Seasonality
The tourism industry, particularly in the Door County market, substantially affects our business with our customers, particularly those customers in the restaurant and lodging businesses. The tourist business of Door County is seasonal, with the season beginning in early spring and continuing until late fall. The seasonal nature of the tourist business tends to result in increased demands for loans shortly before and during the tourist season and causes reduced deposits shortly before and during the early part of the tourist season. Nonetheless, the financial needs of those involved in the delivery of tourist related services is a year around concern.
Our expansion into other market areas has reduced the concentration level of tourism-related businesses, but these types of businesses still remain an important element of the customer base that we serve.
Competition
The financial services industry is highly competitive. We compete with other financial institutions and businesses in both attracting and retaining deposits and making loans in all of our principal markets. The primary factors in competing for deposits are interest rates, personalized services, the quality and range of financial services, convenience of office locations and office hours. Competition for deposit products comes primarily from other commercial banks, savings banks, credit unions and non-bank competitors, including insurance companies, money market and mutual funds, and other investment alternatives. The primary factors in competing for loans are interest rates, loan origination fees, the quality and range of lending services and personalized services. Competition for loans comes primarily from other commercial banks, savings banks, mortgage banking firms, credit unions, finance companies, leasing companies and other financial intermediaries. Some of our competitors are not subject to the same degree of regulation as that imposed on bank holding companies or Federally insured state-chartered banks, and may be able to price loans and deposits more aggressively. We also face direct competition from members of bank holding company systems that have greater assets and resources than ours.
4
Regulation and Supervision
Baylake Corp.As a financial holding company, we are subject to regulation by the Federal Reserve Board under the BHCA. Under the BHCA, we are subject to examination by the Board of Governors of the Federal Reserve System (the “FRB”) and are required to file reports of its operations and such additional information as the FRB may require. Under FRB policy, we are expected to act as a source of financial strength to our subsidiary bank and to commit resources to support the bank in circumstances where we might not do so, absent such policy.
With certain limited exceptions, the BHCA prohibits bank holding companies from acquiring direct or indirect ownership or control of voting shares or assets of any company other than a bank, unless the company involved is engaged solely in one or more activities which the FRB has determined to be financial in nature or incidental to such financial activity. In 1999, Congress enacted the GLB Act, which eliminated certain barriers to and restrictions on affiliations between banks and securities firms, insurance companies and other financial services organizations. Among other things, the GLB Act amended the BHCA to permit bank holding companies that qualify as “financial holding companies” to engage in a broad list of “financial activities,” and any non-financial activity that the FRB, in consultation with the Secretary of the Treasury, determines is “complementary” to a financial activity and poses no substantial risk to the safety and soundness of depository institutions or the financial system. The GLB Act treats various lending, insurance underwriting, insurance company, portfolio investment, financial advisory, securities underwriting, dealing and market-making, and merchant banking activities as financial in nature for this purpose.
Under the GLB Act, a bank holding company may become certified as a financial holding company by filing a notice with the FRB, together with a certification that the bank holding company meets certain criteria, including capital, management and Community Reinvestment Act requirements. We have not elected to be certified as a financial holding company.
The FRB uses capital adequacy guidelines in its examination and regulation of bank holding companies. If capital falls below minimum guidelines, a bank holding company may, among other things, be denied approval to acquire or establish banks, non-bank businesses or other bank holding companies.
The FRB has issued a policy statement on the payment of cash dividends by bank holding companies, which expresses the FRB’s view that a bank holding company should pay cash dividends only to the extent that our net income for the past year is sufficient to cover both the cash dividend and a rate of retention consistent with our needs. The FRB also indicated that it would be inappropriate for a bank holding company experiencing serious financial problems to borrow to pay dividends. In addition, compliance with capital adequacy guidelines at both a bank subsidiary and a bank holding company could affect our ability to pay dividends, if our capital levels were to decrease.
The Sarbanes-Oxley Act of 2002 (“SOA”), addresses, among other issues, director and officer responsibilities for proper corporate governance of publicly traded companies, including the establishment of audit committees, certification of financial statements, auditor independence and accounting standards, executive compensation, insider loans, whistleblower protection, and enhanced and timely disclosure of corporate information. In general, SOA is intended to allow stockholders to monitor more effectively the performance of publicly traded companies and their management. The SEC has enacted rules to implement various provisions of SOA which affect us as a publicly-held entity. The federal banking regulators also have adopted generally similar requirements concerning the certification of financial statements. Among these requirements is the identification of a company-wide code of conduct for our bank. SOA also imposes additional corporate governance requirements on publicly-held companies, particularly relating to the functioning of audit committees. We are subject to the requirement of annual attestation and review of our internal control on financial reporting.
Baylake Bank.As a FRB member Wisconsin-chartered bank, Baylake Bank is subject to supervision and regulation by the Wisconsin Department of Financial Institutions, Division of Banking (the “WDFI”), the Board of Governors of the Federal Reserve System and the FDIC. Federal law and regulations establish supervisory standards applicable to the lending activities of our Bank, including internal controls, credit underwriting, loan documentation and loan-to-value ratios for loans secured by real property.
Our bank is subject to federal and state statutory and regulatory restrictions on any extension of credit to us or our subsidiaries, on investments in our stock or other securities of our subsidiaries, on the payment of dividends to us, and on the acceptance of our stock or other securities of our subsidiaries as collateral for loans to any person. Limitations and reporting requirements are also placed on extension of credit by our bank to our directors and officers, to our directors and officers and to the directors and officers of our subsidiaries, to our principal shareholders, and to “related interests” of such directors, officers and principal shareholders.
5
Under the Community Reinvestment Act, or (“CRA”) and the implementing regulations, our bank has a continuing and affirmative obligation to help meet the credit needs of its local community including low and moderate-income neighborhoods, consistent with the safe and sound operation of the institution. The CRA requires the boards of directors of financial institutions, such as our bank, to adopt a CRA statement for each assessment area that, among other things, describes its efforts to help meet community credit needs and the specific types of credit that the institution is willing to extend. Our bank’s service area is designated and comprised of the eight counties within the geographic area of Central and Northeast Wisconsin. Our bank’s board of directors is required to review the appropriateness of this delineation at least annually.
Our bank’s business includes making a variety of types of loans to individuals. In making these loans, we are subject to state usury and regulatory laws and to various federal statutes, such as the Equal Credit Opportunity Act, the Fair Credit Reporting Act, the Truth in Lending Act, the Real Estate Settlement Procedures Act and the Home Mortgage Disclosure Act, and the regulations promulgated thereunder, which prohibit discrimination, specify disclosures to be made to borrowers regarding credit and settlement costs and regulate the mortgage loan servicing activities of our bank, including the maintenance and operation of escrow accounts and the transfer of mortgage loan servicing. In receiving deposits, we are subject to extensive regulation under state and federal law and regulations, including the Truth in Savings Act, the Expedited Funds Availability Act, the Bank Secrecy Act, the Electronic Funds Transfer Act and the Federal Deposit Insurance Act. Violation of these laws could result in the imposition of significant damages and fines upon us, our directors and officers.
Under the GLB Act, all financial institutions are required to adopt privacy policies, restrict the sharing of non public customer data with nonaffiliated parties at the customer’s request and establish procedures and practices to protect customer data from unauthorized access.
Under Title III of the USA PATRIOT Act (“PATRIOT Act”), also known as the International Money Laundering Abatement and Anti-Terrorism Financing Act of 2001, all financial institutions are required to take certain measures to identify customers, prevent money laundering, monitor certain customer transactions and report suspicious activity to U.S. law enforcement agencies, and to scrutinize or prohibit altogether certain transactions of special concern. Financial institutions are also required to respond to requests for information from federal banking regulatory agencies and law enforcement agencies concerning their customers and their transactions.
In addition to general requirements that banks retain specified levels of capital and otherwise conduct their business in a safe and sound manner, Wisconsin law requires that dividends of Wisconsin banks declared and paid without approval of the WDFI be paid out of current earnings or, no more than once within the immediate preceding two years, out of undivided profits in the event that there have been insufficient net profits. Any other dividends require the prior written consent of the WDFI.
Federal law provides that adequately managed bank holding companies from any state may acquire banks and bank holding companies located in any other state, subject to certain conditions. Wisconsin law generally permits establishment of full service bank branch offices statewide.
Financial institution regulatory agencies are given substantial powers to take corrective actions, which may include restrictions on methods of doing business and the prohibition of certain actions.
Employees
At December 31, 2006, we had 336 full-time equivalent employees company-wide. We consider our relationship with our employees to be good.
6
Forward-Looking Statements
This report contains statements that may constitute forward-looking statements within the meaning of the safe-harbor provisions for forward-looking statements contained in the Private Securities Litigation Reform Act of 1995, such as statements other than historical facts contained or incorporated by reference in this report. These forward-looking statement include statements with respect to our financial condition, results of operations, plans, objective, future performance and business, including statement preceded by, followed by or that include the words “believes,” “expects,” or “anticipates,” references to estimates or similar expressions. Future filings by us with the Securities Exchange Commission, and future statements other than historical facts contained in written material, press releases and oral statements issued by us, or on our behalf, may also constitute forward-looking statements.
All forward-looking statements contained in this report or which may be contained in future statements made for or on our behalf are based upon information available at the time the statement is made and we assume no obligation to update any forward-looking statements. Forward-looking statements are subject to significant risks and uncertainties, and our actual results may differ materially from the results discussed in such forward-looking statements. Factors that might cause actual results to differ from the results discussed above include, but are not limited to, the risk factors set forth below.
Risk Factors
The following risk factors and other information included in this Annual Report on Form 10-K should be carefully considered. The risks and uncertainties described below are not the only ones we face. Additional risks and uncertainties not presently known to us or that we presently deem less significant may also adversely affect our business, operating results, cash flows, and financial condition. If any of the following risks actually occur, our business, operating results, cash flows and financial condition could be materially adversely affected.
If we have significant loan losses, we would need to further increase our Allowance for Loan Losses and our earnings would decrease; impairment charges on letters of credit could have similar effects.
Our loan customers may not repay their loans according to their terms, and the collateral securing the payment of these loans may be insufficient to pay any remaining loan balance. We may also be required to make payments on letters of credit, which we have issued on behalf of our customers. In recent periods, we have experienced problems with some lending and letter of credit arrangements which have affected our results. We may continue to experience losses, which could have a material adverse effect on our operating results.
Material additions to our allowance or charges related to letters of credit also would materially decrease our net income, and the charge-off of loans may lead us to increase the allowance. We must make assumptions and judgments about the quality and collectibility of our loan portfolio, including the creditworthiness of our borrowers and the value of assets serving as collateral for the repayment of many of our loans. If our assumptions are incorrect, our allowance for loan losses may not be sufficient to cover losses inherent in our loan portfolio, resulting in additions to our allowance.
Our operations are geographically limited and significantly concentrated in the tourism industry, which makes us more at risk for downturns in those areas.
Most of our operations, business and customer base are in Northeastern Wisconsin, particularly in Door and Brown Counties. As a result of this geographical concentration, we are more at risk in the event of downturns or other factors that affect the local economy or decrease demand for our services than if our operations were conducted over a wider area. Other local factors, such as natural disasters and the local regulatory climate, could also significantly affect our results because of our lack of geographical diversity.
In addition, a significant percentage of our customer base is in the tourism industry, particularly lodging and restaurants, especially in our Door County market. Many of our other customers depend indirectly on the tourism industry. This concentration in a single industry could cause any downturn or other issues affecting local tourism to reduce the demand for our services, increase problem loans and thus disproportionately affect our results.
A significant portion of our lending is concentrated in the commercial real estate sector, which makes us more at risk for downturns in those areas.
Approximately 56.7% of our loans are concentrated in commercial real estate lending. At year-end 2006, $108.4 million represented loans for purposes of rental properties and $67.9 million for development loans. A downturn in the economy on the pricing of these development type properties could affect the values of these properties, increase the potential for problem loans and thus have a direct impact on our financial results.
7
The banking industry is a highly regulated environment, which could increase our cost structure or have other negative impacts on our operations.
We are highly regulated by both federal and state regulatory authorities. Regulation includes, among other things, capital and reserve requirements, permissible investments and lines of business, dividend limitations, limitations on products and services offered, loan limits, geographical limits, consumer credit regulations, community reinvestment requirements and restrictions on transactions with affiliated parties. The system of supervision and regulation applicable to us establishes a comprehensive framework for our respective operations and is intended primarily for the protection of the FDIC’s deposit funds, our depositors and the public, rather than our shareholders. Any change in government regulation may have a material adverse effect on our business.
An increasing interest rate environment could affect our results and our equity.
In recent periods, the Federal Reserve Board has increased the Federal Funds target rate multiple times and additional increases are possible. Increases to the middle- and long-term interest rates which we are able to charge have not been commensurate with the short-term interest rate moves by the Federal Reserve, resulting in a flattened yield curve. The flattening of the yield curve, together with competitive market pressures, has resulted in a compressed interest margin by limiting our ability to obtain reasonable returns on middle- and long-term earning assets. We expect this factor to continue to have an effect on the growth in net interest margin. In turn, net income and return on equity would be adversely affected.
We hold $188.3 million of securities available-for-sale at December 31, 2006. We must carry these securities at fair value on our balance sheet under generally accepted accounting principles, and unrealized gains or losses on those securities are one component of stockholders’ equity. When market interest rates increase, the fair value of our securities available-for-sale generally decreases, which results in a corresponding decrease in equity.
Competition may affect our results.
We face strong competition in originating loans, in seeking deposits and in offering our other services. We must compete with commercial banks, savings institutions, trust companies, mortgage banking firms, credit unions, finance companies, mutual funds, insurance companies, and brokerage and investment banking firms. Our market area is also served by several commercial banks and savings institutions that are substantially larger than us in terms of deposits and loans.
This competitive climate can make it more difficult to establish and retain relationships with customers and can lower the rates we are able to charge on loans, increase the rates we must offer on deposits, and affect our charges for other services. Those factors can in turn affect our results and profitability.
Customers may decide not to use banks to complete their financial transactions, which could result in a loss of income to us.
Technology and other changes are allowing parties to complete financial transactions that historically have involved banks at one or both ends the transaction. For example, consumers can now pay bills and transfer funds directly without banks. The process of eliminating banks as intermediaries, known as disintermediation, could result in the loss of fee income, as well as the loss of customer deposits and income generated from those deposits.
We rely on the accuracy and completeness of information about customers and counterparties, and inaccurate or incomplete information could negatively impact our financial condition and results of operations.
In deciding whether to extend credit or enter into other transactions with customers and counterparties, we may rely on information provided to us by customers and counterparties, including financial statements and other financial information. We may also rely on representations of customers and counterparties as to the accuracy and completeness of that information and, with respect to financial statements, on reports of independent auditors. Our financial condition and results of operations could be negatively impacted to the extent we rely on financial statements that do not comply with generally accepted accounting principles or that are materially misleading.
Unauthorized disclosure of sensitive or confidential client or customer information, whether through a breach of our computer system or otherwise, could severely harm our business.
8
As part of our financial and data processing products and services, we collect, process and retain sensitive and confidential client and customer information. Despite the security measures we have in place, our facilities and systems, and those of our third party service providers, may be vulnerable to security breaches, acts of vandalism, computer viruses, misplaced or lost data, programming and/or human errors, or other similar events. Any security breach involving the misappropriation, loss or other unauthorized disclosure of confidential information, whether by us or our vendors, could severely damage its reputation, expose us to the risks of litigation and liability, disrupt our operations and harm our business.
Wisconsin tax developments could reduce our earnings.
Like many Wisconsin financial institutions, our bank has a subsidiary in Nevada which holds and manages investment and other earning assets; the income on these assets has not been subject to Wisconsin tax. The Wisconsin Department of Revenue has instituted an audit program specifically aimed at out-of-state subsidiaries, although it has not audited our subsidiary. Although we believe that we have complied with requirements previously established by the Department, depending upon the terms and circumstances, an adverse resolution of these matters could result in additional Wisconsin tax obligations for prior periods and/or higher Wisconsin taxes going forward, with a negative impact on our earnings. We also may incur additional costs in the future to address state tax issues.
| ITEM 1B. | UNRESOLVED STAFF COMMENTS |
None.
Our bank owns its headquarters and twenty-six branches and leases one branch office from a third party.
The main office building located in Sturgeon Bay serves as our corporate headquarters and main banking office. The main office also accommodates our expanded business, primarily an insurance agency (Baylake Insurance Agency) and financial services. The twenty-seven branches owned or leased by our bank are in good condition and considered adequate for present and near term requirements. In addition, our bank owns other real property that, when considered in the aggregate, is not material to our financial position. All of the real property is reserved for future expansion and is located in the following Wisconsin locations: Berlin, Appleton, Neenah, and Oshkosh.
We may be involved from time to time in various routine legal proceedings incidental to our business. Neither we nor any of our subsidiaries is currently engaged in any legal proceedings that are expected to have a material adverse effect on our results of operations or financial position.
| ITEM 4. | SUBMISSION OF MATTERS TO A VOTE OF SECURITY HOLDERS |
There were no matters submitted to a vote of security holders during the fourth quarter of fiscal year 2006.
9
PART II
| ITEM 5. | MARKET FOR THE REGISTRANT’S COMMON EQUITY, RELATED STOCKHOLDER MATTERS AND ISSUER PURCHASES OF EQUITY SECURITIES |
Historically, trading in shares of our common stock has been limited. Since mid-1993, our common stock has been listed on the OTC Bulletin Board (Trading symbol: bylk.ob), an electronic interdealer quotation system providing real-time quotations on eligible securities.
The following table summarizes high and low bid prices and cash dividends paid for our common stock for the periods indicated. Bid prices are as reported from the OTC Bulletin Board. The reported high and low prices represent interdealer bid prices, without retail mark-up, mark-downs or commission, and may not necessarily represent actual transactions.
| | | | | | | | |
| | | Calendar period | | High | | Low | | Cash dividends per share |
| 2005 | | 1st Quarter | | $18.50 | | $17.25 | | $0.15 |
| | 2nd Quarter | | $18.50 | | $17.95 | | $0.15 |
| | 3rd Quarter | | $18.60 | | $17.85 | | $0.15 |
| | 4th Quarter | | $18.25 | | $16.05 | | $0.16 |
| | | | |
| 2006 | | 1st Quarter | | $17.00 | | $16.20 | | $0.16 |
| | 2nd Quarter | | $16.50 | | $15.55 | | $0.16 |
| | 3rd Quarter | | $15.95 | | $15.65 | | $0.16 |
| | 4th Quarter | | $16.15 | | $15.70 | | $0.16 |
We had approximately 1,783 shareholders of record at December 31, 2006. The number of shareholders does not reflect persons or entities that hold their stock in nominee or “street” name through various brokerage firms.
Dividends on our common stock have historically been paid in cash on a quarterly basis in March, June, September and January, and we expect to continue this practice for the immediate future. The holders of our common stock are entitled to receive such dividends when and as declared by our Board of Directors. In determining the payment of cash dividends, our Board of Directors considers the earnings, capital and debt servicing requirements, financial ratio guidelines issued by the FRB and other banking regulators, our financial condition, and other relevant factors.
Our ability to pay dividends is dependent upon our receipt of dividends from our subsidiary bank, which is subject to regulatory restrictions. Such restrictions, which govern state chartered banks, generally limit the payment of dividends on bank stock to our bank’s undivided profits after all payments of all necessary expenses, provided that our bank’s surplus equals or exceeds its capital, as discussed further in Item 7. “Management Discussion and Analysis of Financial Condition and Results of Operation-Capital Resources”. In addition, under the terms of our Junior Subordinated Debentures due 2036, we would be precluded from paying dividends on the common stock if we were in default under the Debentures, if we exercised our right to defer payments of interest on the Debentures, or if certain related defaults occurred.
We maintain a dividend reinvestment plan enabling participating shareholders to elect to purchase shares of our common stock in lieu of receiving cash dividends. Such shares may be newly issued securities or acquired in the market on behalf of participating shareholders at their then fair market value.
In June 2006 our Board of Directors authorized management, in its discretion, to repurchase up to 300,000 share, representing approximately 3.8% of our common stock by no later than June 30, 2007. Although we may not repurchase all 300,000 within the allotted time period, the program will allow us to repurchase our shares as opportunities arise at prevailing market prices in open market or privately negotiated transactions. Shares repurchased are held as treasury stock and accordingly, are accounted for as a reduction of stockholder’s equity. There were no repurchases of shares in the fourth quarter.
10
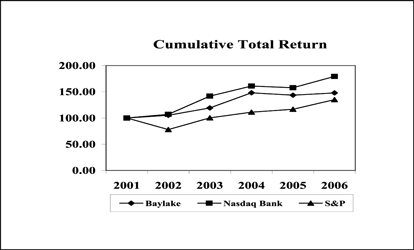
Performance Graph
The following graph shows the cumulative stockholder return on our common stock over the last five fiscal years compared to the returns of Standard & Poors 500 Stock Index and the Nasdaq Bank Index, prepared for Nasdaq by the Center for Research in Securities Prices at the University of Chicago.
| | | | | | | | | | | | |
| | | 2001 | | 2002 | | 2003 | | 2004 | | 2005 | | 2006 |
| Baylake Corp. | | 100.00 | | 105.30 | | 119.30 | | 148.10 | | 143.50 | | 147.90 |
| Nasdaq Bank Index | | 100.00 | | 107.00 | | 141.80 | | 160.90 | | 157.70 | | 179.20 |
| S&P 500 | | 100.00 | | 77.90 | | 100.20 | | 111.20 | | 116.60 | | 135.00 |
| (1) | Assumes $100 invested on December 31, 2001 in each of Baylake Corp. common stock, the Standard & Poors 500 Stock Index and the Nasdaq Bank Index. Dividends are assumed to be reinvested. |
11
| ITEM 6. | SELECTED FINANCIAL DATA |
BAYLAKE CORP.
FIVE YEAR SELECTED CONSOLIDATED FINANCIAL DATA
| | | | | | | | | | | | | | | | |
| | | Year Ended December 31, |
| | | 2006 | | 2005 | | 2004 | | 2003 | | | 2002 |
| | | (dollars in thousands, except per share data) |
Results of operations: | | | | | | | | | | | | | | | | |
Interest and dividend income | | $ | 70,014 | | $ | 61,538 | | $ | 50,362 | | $ | 47,474 | | | $ | 51,564 |
Interest expense | | | 36,378 | | | 26,660 | | | 16,357 | | | 18,416 | | | | 22,188 |
| | | | | | | | | | | | | | | | |
Net interest income | | | 33,636 | | | 34,878 | | | 34,005 | | | 29,058 | | | | 29,376 |
Provision for loan losses | | | 903 | | | 3,217 | | | 1,599 | | | 5,650 | | | | 5,700 |
| | | | | | | | | | | | | | | | |
Net interest income after provision for loan losses | | | 32,733 | | | 31,661 | | | 32,406 | | | 23,408 | | | | 23,676 |
Other income: | | | | | | | | | | | | | | | | |
Fees from fiduciary activities | | | 1,025 | | | 780 | | | 703 | | | 677 | | | | 637 |
Fees from loan servicing | | | 1,092 | | | 1,131 | | | 1,079 | | | 1,470 | | | | 1,587 |
Fees for other services to customers | | | 4,988 | | | 4,759 | | | 4,608 | | | 4,053 | | | | 3,573 |
Gain from sale of loans | | | 825 | | | 1,013 | | | 1,372 | | | 2,449 | | | | 1,425 |
Securities gains, net | | | — | | | 52 | | | — | | | — | | | | 509 |
Increase in cash surrender value of life insurance | | | 922 | | | 784 | | | 772 | | | 821 | | | | 450 |
Gains (losses), net from sales and disposals of fixed assets | | | 287 | | | 2,383 | | | 475 | | | (1 | ) | | | — |
Gain on sale of Arborview | | | — | | | — | | | — | | | 538 | | | | — |
Rental income | | | — | | | — | | | — | | | 67 | | | | 705 |
Death benefit of life insurance | | | 23 | | | — | | | — | | | — | | | | 754 |
Other | | | 575 | | | 695 | | | 517 | | | 566 | | | | 1,373 |
| | | | | | | | | | | | | | | | |
Total other income | | | 9,737 | | | 11,597 | | | 9,526 | | | 10,640 | | | | 11,013 |
Non-interest expense: | | | | | | | | | | | | | | | | |
Salaries and employee benefits | | | 19,414 | | | 16,733 | | | 15,283 | | | 14,183 | | | | 13,743 |
Occupancy | | | 2,373 | | | 2,441 | | | 2,156 | | | 2,087 | | | | 2,163 |
Equipment | | | 1,658 | | | 1,564 | | | 1,373 | | | 1,438 | | | | 1,422 |
Data processing and courier | | | 1,269 | | | 1,163 | | | 1,125 | | | 1,087 | | | | 1,040 |
Provision for impairment of letter of credit | | | 27 | | | 2,191 | | | — | | | — | | | | — |
Operation of other real estate | | | 376 | | | 399 | | | 599 | | | 378 | | | | 203 |
Other operating expenses | | | 7,212 | | | 6,028 | | | 5,943 | | | 4,858 | | | | 4,820 |
| | | | | | | | | | | | | | | | |
Total non-interest expense | | | 32,329 | | | 30,519 | | | 26,479 | | | 24,031 | | | | 23,391 |
| | | | | | | | | | | | | | | | |
Income before income tax | | | 10,141 | | | 12,739 | | | 15,453 | | | 10,017 | | | | 11,298 |
| | | | | |
Income tax provision | | | 2,765 | | | 3,836 | | | 4,680 | | | 2,060 | | | | 2,575 |
| | | | | | | | | | | | | | | | |
Net income | | $ | 7,376 | | $ | 8,903 | | $ | 10,773 | | $ | 7,957 | | | $ | 8,723 |
| | | | | | | | | | | | | | | | |
Per Share Data:(1) | | | | | | | | | | | | | | | | |
| | | | | |
Net income per share (basic) | | $ | 0.95 | | $ | 1.15 | | $ | 1.41 | | $ | 1.06 | | | $ | 1.17 |
Net income per share (diluted) | | | 0.94 | | | 1.14 | | | 1.40 | | | 1.04 | | | | 1.15 |
Cash dividends per common share | | | 0.64 | | | 0.61 | | | 0.57 | | | 0.53 | | | | 0.49 |
Book value per share | | | 10.50 | | | 10.09 | | | 9.91 | | | 9.16 | | | | 8.74 |
12
| | | | | | | | | | | | | | | | | | | | |
| | | Year Ended December 31, | |
| | | 2006 | | | 2005 | | | 2004 | | | 2003 | | | 2002 | |
Selected Financial Condition Data (at end of period): | | | | | | | | | | | | | | | | | | | | |
Total assets | | $ | 1,111,684 | | | $ | 1,089,408 | | | $ | 1,047,748 | | | $ | 974,740 | | | $ | 904,656 | |
Securities | | | 188,315 | | | | 171,638 | | | | 197,392 | | | | 176,815 | | | | 133,139 | |
Gross loans | | | 819,568 | | | | 812,296 | | | | 757,228 | | | | 715,022 | | | | 682,512 | |
Total deposits | | | 878,911 | | | | 856,711 | | | | 844,541 | | | | 783,292 | | | | 740,324 | |
Short-term borrowings (2) | | | 4,480 | | | | 1,315 | | | | 1,284 | | | | 23,359 | | | | 10,056 | |
Other borrowings (3) | | | 115,179 | | | | 125,185 | | | | 100,192 | | | | 75,092 | | | | 65,000 | |
Subordinated debentures | | | 16,100 | | | | 16,100 | | | | 16,100 | | | | 16,100 | | | | 16,100 | |
Total shareholders’ equity | | | 82,193 | | | | 78,544 | | | | 76,205 | | | | 69,628 | | | | 65,400 | |
Performance Ratios: | | | | | | | | | | | | | | | | | | | | |
Return on average assets | | | 0.67 | % | | | 0.82 | % | | | 1.07 | % | | | 0.87 | % | | | 1.00 | % |
Return on average total shareholders’ equity | | | 9.33 | % | | | 11.51 | % | | | 14.88 | % | | | 11.86 | % | | | 13.82 | % |
Dividend payout ratio | | | 67.67 | % | | | 52.99 | % | | | 40.49 | % | | | 50.22 | % | | | 41.99 | % |
Net interest margin (4) | | | 3.44 | % | | | 3.60 | % | | | 3.76 | % | | | 3.56 | % | | | 3.80 | % |
Net interest spread (4) | | | 3.05 | % | | | 3.27 | % | | | 3.52 | % | | | 3.27 | % | | | 3.47 | % |
Non-interest income to average assets | | | 0.89 | % | | | 1.07 | % | | | 0.94 | % | | | 1.16 | % | | | 1.26 | % |
Non-interest expense to average assets | | | 2.94 | % | | | 2.81 | % | | | 2.63 | % | | | 2.62 | % | | | 2.68 | % |
Net overhead ratio (5) | | | 2.06 | % | | | 1.74 | % | | | 1.68 | % | | | 1.46 | % | | | 1.42 | % |
Average loan-to-average deposit ratio | | | 94.73 | % | | | 94.16 | % | | | 93.63 | % | | | 93.01 | % | | | 94.71 | % |
Average interest-earning assets to average interest-bearing liabilities | | | 111.09 | % | | | 112.73 | % | | | 113.59 | % | | | 113.19 | % | | | 111.71 | % |
Asset Quality Ratios:(6) | | | | | | | | | | | | | | | | | | | | |
Non-performing loans to total loans | | | 3.40 | % | | | 0.85 | % | | | 0.78 | % | | | 2.27 | % | | | 3.24 | % |
Allowance for loan losses to: | | | | | | | | | | | | | | | | | | | | |
Gross loans | | | 0.98 | % | | | 1.18 | % | | | 1.38 | % | | | 1.70 | % | | | 1.67 | % |
Non-performing loans | | | 29.46 | % | | | 137.58 | % | | | 176.44 | % | | | 74.95 | % | | | 51.66 | % |
Net charge-offs to average loans | | | 0.29 | % | | | 0.52 | % | | | 0.45 | % | | | 0.70 | % | | | 0.35 | % |
Non-performing assets to total assets | | | 3.02 | % | | | 0.94 | % | | | 0.81 | % | | | 1.90 | % | | | 2.76 | % |
Capital Ratios:(7) | | | | | | | | | | | | | | | | | | | | |
Shareholders’ equity to assets | | | 7.39 | % | | | 7.21 | % | | | 7.27 | % | | | 7.14 | % | | | 7.23 | % |
Tier 1 risk-based capital | | | 9.77 | % | | | 9.70 | % | | | 9.75 | % | | | 9.53 | % | | | 9.74 | % |
Total risk-based capital | | | 10.63 | % | | | 10.73 | % | | | 10.95 | % | | | 10.78 | % | | | 10.99 | % |
Leverage ratio | | | 8.33 | % | | | 8.27 | % | | | 8.27 | % | | | 8.38 | % | | | 8.24 | % |
| (1) | Earnings per share are based on the weighted average number of shares outstanding for the period. |
| (2) | Consists of federal funds purchased and repurchase agreements. |
| (3) | Consists of Federal Home Loan Bank term notes and borrowings from unaffiliated correspondent bank. |
| (4) | Net interest margin represents net interest income as a percentage of average interest-earning assets, and net interest rate spread represents the difference between the weighted average yield on interest-earning assets and the weighted average cost of interest-bearing liabilities. |
| (5) | Net overhead ratio represents the difference between non-interest expense and non-interest income, divided by average assets. |
| (6) | Non-performing loans consist of non-accrual loans, guaranteed loans 90 days or more past due but still accruing interest and restructured loans. Non-performing assets include non-performing loans and foreclosed assets. |
| (7) | The capital ratios are presented on a consolidated basis. For information on our regulatory capital requirements, see Item 7. “Management’s Discussion and Analysis of Financial Condition and Results of Operations-Capital Resources” and Item 1. “Business-Regulation and Supervision”. |
13
| ITEM 7. | MANAGEMENT’S DISCUSSION AND ANALYSIS OF FINANCIAL CONDITION AND RESULTS OF OPERATIONS |
General
The following sets forth management’s discussion and analysis of our consolidated financial condition and results of operations, which may not be otherwise apparent from the consolidated financial statements included in this report at Item 8. This discussion and analysis should be read in conjunction with those financial statements, related notes, the selected financial data and the statistical information presented elsewhere in this report for a more complete understanding of the following discussion and analysis.
Critical Accounting Policies
In the course of our normal business activity, management must select and apply many accounting policies and methodologies that lead to the financial results presented in our consolidated financial statements. Some of these policies are more critical than others.
Allowance for Loan Losses: The allowance for loan losses (“ALL”) represents management’s estimate of probable incurred credit losses in the loan portfolio. Estimating the amount of the allowance for loan losses requires significant judgment and the use of estimates related to the amount and timing of expected future cash flows on impaired loans, estimated losses on pools of homogeneous loans based on historical loss experience, and consideration of current economic trends and conditions, all of which may be susceptible to significant change. The loan portfolio also represents the largest asset type on the consolidated balance sheet. Loan losses are charged off against the allowance, while recoveries of amounts previously charged off are credited to the allowance. A provision for loan losses is charged to operations based on management’s periodic evaluation of the factors previously mentioned, as well as other pertinent factors.
14
The allowance for loan losses consists of an allocated component and an unallocated component. The components of the allowance represent an estimation pursuant to either Statement of Financial Accounting Standards No. (“SFAS”) 5, Accounting for Contingencies, or SFAS 114, Accounting by Creditors for Impairment of a Loan. The allocated component of the allowance for loan losses reflects expected losses from analyses developed through specific credit allocations for individual loans and historical loss experience for each loan category. The specific credit allocations are based on regular analyses of all loans over a fixed-dollar amount where the internal credit rating is at or below a predetermined classification. These analyses involve a high degree of judgment in estimating the amount of loss associated with specific loans, including estimating the amount and timing of future cash flows and collateral values. Our historical loss experience is updated quarterly. The allocated component of the allowance for loan losses also includes consideration of concentrations and changes in portfolio mix and volume and other qualitative factors.
There are many factors affecting the allowance for loan losses; some are quantitative while others require qualitative judgment. The process for determining the allowance (which management believes adequately considers all of the potential factors which might possibly result in credit losses) includes subjective elements and, therefore, may be susceptible to significant change. To the extent actual outcomes differ from management estimates, additional provision for credit losses could be required that could adversely affect our earnings or financial position in future periods. Allocations of the allowance may be made for specific loans, but the entire allowance is available for any loan that, in management’s judgment, should be charged-off.
Foreclosed Assets: Foreclosed assets acquired through or instead of loan foreclosure are initially recorded at fair value when acquired, less estimated costs to sell, establishing a new cost basis. If fair value declines subsequent to foreclosure, a valuation allowance is recorded through expense. Costs after acquisition are expensed.
Provision for Impairment of Standby Letter of Credit: The provision for impairment of letter of credit represents management’s estimate of probable incurred losses on an off-balance sheet standby letter of credit which is used to accommodate our customer’s borrowing arrangements with an unrelated third party. In the event of further impairment, a provision for impairment of standby letter of credit is charged to operations based on management’s periodic evaluation of the factors affecting this standby letter of credit. See the Non-Interest Expense discussion in the Management’s Discussion and Analysis of Financial Condition and Results of Operations for further information.
Income Tax Accounting: The assessment of tax assets and liabilities involves the use of estimates, assumptions, interpretations, and judgments concerning certain accounting pronouncements and federal and state tax codes. There can be no assurance that future events, such as court decisions or positions of federal and state taxing authorities, will not differ from management’s current assessment, the impact of which could be significant to the consolidated results of our operations and reported earnings. We believe that the tax assets and liabilities are adequate and properly recorded in the consolidated financial statements. See Note 15-”Income Tax Expense” for further information. For a discussion of certain Wisconsin income tax developments that could affect us, see the discussion in the “Income Statement Analysis-2006 compared to 2005-Income Taxes.”
Income tax expense may be affected by developments in the state of Wisconsin. Like many financial institutions that are located in Wisconsin, a subsidiary of our bank located in the state of Nevada holds and manages various investment securities. Due to that fact that these subsidiaries are out of state, income from their operations has not been subject to Wisconsin state taxation. Although the Wisconsin Department of Revenue (“Department”) issued favorable tax rulings regarding Nevada subsidiaries of Wisconsin financial institutions, the Department representatives have stated that the Department intends to revoke those rulings and tax some or all these subsidiaries’ income, even though there has been no intervening change in the law. The Department also implemented a program in 2003 for the audit of Wisconsin financial institutions who have formed and contributed assets to subsidiaries located in Nevada; to date, we have not been audited on these matters.
The Department sent letters in late July 2004 to financial institutions in Wisconsin, whether or not they are undergoing an audit, reporting on settlements involving 17 banks and their out-of-state investment subsidiaries. The letter provided a summary of currently available settlement parameters. For periods before 2004, they include: restrictions on the types of subsidiary income excluded from Wisconsin taxation; assessment of certain back taxes for a limited period of time; and interest (but not penalties) on any past-due
15
taxes. For 2004 and going forward, there are similar provisions plus limits on the amount of subsidiaries’ assets as to which their income will be excluded from Wisconsin tax. Settlement on the terms outlined would result in the Department’s rescission of related prior letter rulings, and would purport to be binding going forward except for future legislation or change by mutual agreement. By implication, the Department appears to accept the general proposition that some out-of-state investment subsidiary income is not subject to Wisconsin taxes.
We continue to believe that we have reported income and paid Wisconsin taxes correctly in accordance with applicable tax laws and the Department’s prior longstanding interpretations thereof, including interpretations issued specifically to it. However, in view of the Department’s subsequent change in position (even if that change does not have a basis in law), the aggressive stance now being taken by the Department, the settlements by some other banks, and the potential effect that decisions by other similarly situated institutions may have on our alternatives going forward, we have determined that we would consider a settlement proposal from the Department; however, we have not yet received a specific proposal nor has any assessment been made against us. The Department made contact with our outside counsel in June 2006 with the intention of gathering various financial data from us for the purpose of preparing a formal settlement proposal for us. To this point, the Department has not provided counsel with any formal request. We will respond to the Department’s request once a formal request is provided. We will need to review any settlement proposal in more specific detail to quantify in any definitive way the Department’s view of its exposure and to evaluate alternatives. Although there will likely be challenges to the Department’s actions and interpretations, our net income could be reduced if the Department succeeds in its actions and interpretations. We could also incur costs in the future to address any action taken against it by the Department. As of March 5, 2007 there has been no change in the status of this tax matter.
Overview
We are a full-service financial services company, providing a wide variety of loan, deposit and other banking products and services to our business, individual or retail, and municipal customers, as well as a full range of trust, investment and cash management services. We are the bank holding company of Baylake Bank, chartered as a state bank in Wisconsin and a member bank of the Federal Reserve and Federal Home Loan Bank.
From an industry and national perspective, our profitability, like most financial institutions, is dependent to a large extent upon net interest income. Results of operations are also affected by the provision for loan losses, operating expenses such as salaries and employee benefits, occupancy and other operating expenses, including income taxes, and to a lesser extent, non-interest income such as trust revenues, loan servicing fees and service charge income derived from deposit accounts. Economic conditions, competition and the monetary and fiscal policies of the Federal government in general, significantly affect financial institutions, including us. During the latter half of 2004 continuing through mid-year 2006, the Federal Reserve Board (“FRB”) steadily increased interest rates intended to stabilize the current economy and keep inflation under control, since the general health of the United States economy had recovered. Since mid-year 2006, the Fed has kept interest rates stable, with no further changes occurring. Net interest income decreased for 2006, as the increasing rate environment compressed our interest spread for the period. Lending activities are also influenced by regional and local economic factors. Some specific factors may include the demand for and supply of housing, competition among lenders, interest rate conditions and prevailing market rates on competing investments, customer preferences and levels of personal income and savings in our market area.
In the last several years, we have initiated strategic changes to our bank operations intended to enhance our utilization of resources, and the effectiveness of customer services within our primary market area. We have developed an internal customer relationship management system (“CRM”) to manage and to more effectively market to our internal customer base.
We continue to dedicate resources to our goal of improving asset quality, especially related to our level of non-performing commercial loans. Changes are being implemented to our regional and overall bank credit approval structure, which we believe will strengthen and improve our credit underwriting process. As part of these changes, a newly created position of Chief Credit Officer has been added to the management team. This position will be primarily responsible for credit quality.
Performance Summary
The following is a brief summary of some of the factors, which have affected our earnings in 2006. See the balance of this section for a more thorough discussion.
16
The Company reported net income of $7.4 million for the year ended December 31, 2006, a decrease of $1.5 million or 17.2% compared to $8.9 million earned in 2005. Basic and diluted earnings per share were $0.95 and $0.94, respectively, for 2006 compared to $1.15 and $1.14 for 2005. Return on average assets for the year ended December 31, 2006 was 0.67% and 0.82% for 2005. The return on average equity was 9.33% for 2006 and 11.51% for 2005. Cash dividends declared in 2006 increased 4.9% to $0.64 per share compared with $0.61 in 2005. Key factors behind these results were:
| | • | | Net interest income and net interest margin were impacted in 2006 by an increasing interest rate environment for the first half of 2006, thereby decreasing interest spread. The continued pressure from the rise in short-term interest rates resulting in a flattening of the yield curve negatively affected net interest margin for 2006 relative to a year earlier. |
| | • | | Tax-equivalent net interest income was $34.9 million for 2006, a decrease of $1.3 million or 3.6% from 2005. Tax-equivalent interest income increased $8.4 million, while interest expense increased $9.7 million. The decrease in tax-equivalent net interest income was attributable to unfavorable rate variances reducing tax-equivalent net interest income by $2.5 million. Offsetting the decrease were favorable volume variances (with balance sheet growth and differences in the mix of average earning assets and average interest-bearing liabilities adding $1.2 million to tax-equivalent net interest income). The primary reason for the overall decrease was due to an increase in non-performing loans. Non-performing loans are placed in non-accrual status and interest income not yet paid is reversed, thus decreasing interest income. In addition, an increase in short-term interest rates had a direct influence on wholesale and retail funding costs for 2006. Average earning assets remained relatively stable at $1.0 billion, while interest-bearing liabilities increased $21.2 million to $911.4 million. |
| | • | | The net interest margin for 2006 was 3.44%, compared to 3.60% in 2005. The 16 basis points (“bps”) decrease in net interest margin is the result of a 22 bps decrease in interest rate spread (the net of a 100 bps increase in the cost of interest-bearing liabilities, offset by a 78 bps increase in the yields on earning assets), and a 6 bps higher contribution from net free funds. |
| | • | | Total loans were $819.6 million at December 31, 2006, an increase of $7.3 million or 0.9%, from December 31, 2005. Commercial real estate loans decreased $3.1 million (0.7%) and represented 56.6% of total loans at December 31, 2006, compared to 57.6% at year-end 2005. Total deposits were $878.9 million at December 31, 2006, an increase of $22.2 million or 2.6% from year-end 2005. |
| | • | | Asset quality had mixed results during 2006. Charge-offs were down from a year ago. Net loan charge-offs were $2.4 million in 2006, a decrease of $1.7 million over 2005 results. Net loan charge-offs for commercial loans represented $1.0 million of the $2.4 million total in 2006. Net loan charge-offs represented 0.20% of average loans in 2006 compared to 0.52% in 2005. Because we had reserved for a majority of these charge-offs prior to 2006, the provision for loan losses decreased to $903,000 at December 31, 2006 compared to $3.2 million at December 31, 2005. The ratio of allowance for loan losses to total loans was 0.98% and 1.18% at December 31, 2006 and 2005, respectively. Non-performing loans were $27.8 million at December 31, 2006, representing 3.4% of total loans, compared to $6.9 million or 0.85% at year-end 2005. Non-performing loans were impacted by six relationships which represent $17.4 million of the increase. While management has concerns over the ability of the borrowers to repay in accordance with contractual terms, and has put these loans on non accrual, management currently believes that the collateral is sufficient to repay the unpaid principal balance of these loans. We are continually monitoring these relationships and will make provisions as necessary if the facts and circumstances change. |
| | • | | Non-interest income was $9.7 million for 2006, a decrease of $1.9 million or 16.0% from 2005 results. A $2.1 million decrease in net gains from sales of fixed assets and a gain on the sale of Pulse stock in 2005 totaling $200,000 accounted for much of the decrease from 2005. An increase in fees for other services to customers of $229,000 and a $245,000 increase in fiduciary fees were primarily attributable for the remainder of the change in non-interest income. |
| | • | | Non-interest expense was $32.3 million, an increase of $1.8 million over 2005 results. This was the result of increases in personnel expense, occupancy and equipment expense and professional services expense. This was partially offset by a reduction in the provision for impairment expense on an off-balance sheet letter of credit. |
| | • | | Income tax expense decreased to $2.8 million, a decrease of $1.1 million from 2005. The decrease was primarily attributable to lower taxable income. The effective tax rate was 27.3% in 2006 compared to 30.1% in 2005. |
17
INCOME STATEMENT ANALYSIS
2006 compared to 2005
Net Interest Income
Net interest income in the consolidated statements of income (which excludes the tax equivalent adjustment) was $33.6 million, compared to $34.9 million in 2005. Net interest income in 2006 was negatively impacted by the high level of non-performing loans. Interest income is not recognized on these loans until paid, thus reducing our earnings. The tax equivalent adjustments (adjustments needed to bring tax-exempt interest to a level that would yield the same after-tax income had that income been subject to taxation using a 34% tax rate) of $1.2 million for 2006 and $1.3 million for 2005 resulted in a tax-equivalent net interest income of $34.9 million and $36.2 million, respectively.
Net interest income is impacted by the difference between rates earned on interest-earning assets and rates paid on interest-bearing liabilities (interest rate spread) and the relative amounts of interest-earning assets and interest-bearing liabilities. The interest income and interest expense of financial institutions are significantly affected by general economic conditions, competition, policies of regulatory authorities and other factors.
Interest rate spread and net interest margin are utilized to measure and explain changes in net interest income. Interest rate spread is the difference between the yield on earning assets and the rate paid for interest-bearing liabilities that fund those assets. The net interest margin is expressed as the percentage of net interest income to average earning assets. The net interest margin exceeds interest rate spread because non-interest bearing sources of funds (“net free funds”), principally demand deposits and stockholders’ equity, also support earning assets. To compare tax-exempt asset yields to taxable yields, the yield on tax-exempt loans and securities is computed on a tax equivalent basis. The narrative discusses net interest income, interest rate spread and net interest margin on a tax equivalent basis.
Table 1 provides average balances of earning assets and interest-bearing liabilities, interest income and expense, and the corresponding interest rates earned and paid, as well as net interest income, interest spread, and net interest margin on a tax-equivalent basis for the three years ended December 31, 2006, 2005 and 2004.
Net interest income in the consolidated statements of income (including tax equivalent adjustment) was $34.9 million in 2006, compared to $36.2 million in 2005. The decrease in 2006 net interest income of $1.3 million was a function of unfavorable interest rate changes, partially offset by a higher level of earning assets. The net interest margin for 2006 was 3.44% compared to 3.60% in 2005. The 16 bps decrease in net interest margin is attributable to a 22 bps decrease in interest rate spread (with a 78 bps increase in the yield on earning assets, substantially offset by a 100 bps higher cost of interest-bearing liabilities), and a 6 bps higher contribution from net free funds. Interest rates generally rose during the first half of 2006, increasing 100 bps as the FRB attempted to keep inflation in control.
The Federal Funds rate at December 31, 2006, was at 5.17% compared to 4.16% at year-end 2005. We had positioned the balance sheet to be slightly asset sensitive (which means that assets will re-price faster than liabilities); thus, the rate increases would impact net interest income positively. However, the high level of non-performing loans limited the benefit we anticipated in the rising rate environment. We expect that in a gradually increasing rate environment, our income statement would benefit from asset sensitivity over the long term, although changes in the portfolio or the pace of increases could affect that trend.
As shown in the rate/volume analysis in Table 2, volume changes added $1.2 million to tax equivalent net interest income in 2006, while rate changes resulted in a $2.5 million decrease, for a net decrease of $1.3 million. Relative to changes in balance sheet mix, the growth and composition change of earning assets added $1.2 million to tax equivalent net interest income in 2006 with no offsetting growth and composition change in interest-bearing liabilities. Rate changes on earning assets increased interest income by $7.3 million but were more than offset by changes in rates on interest-bearing liabilities that increased interest expense by $9.7 million, for an unfavorable impact of $2.4 million.
For 2006, the yield on earning assets improved 78 bps to 7.04%, in large part attributable to an increase of 86 bps in the loan yield. The average loan yield was 7.57% in 2006. Increases during 2006 in the interest rate environment were a primary factor in the improvement in loan yields. Competitive pricing on new and refinanced loans dampened efforts for further improvements in loan yields in 2006. The yield on securities and short-term investments combined was up 18 bps to 4.80%.
18
For 2006, the cost of interest-bearing liabilities increased 100 bps compared to 2005, to 3.99%, aided by an increasing interest rate environment through the first half of the year. The combined average cost of interest-bearing deposits was 3.71%, up 106 bps from 2005, primarily from increases in the short-term interest rate environment during 2006 offset to a lesser degree by an increase in the mix of lower-cost transaction accounts. The cost of wholesale funding (comprised of federal funds purchased; repurchase agreements; FHLB advances and subordinated debentures) increased by 97 bps to 5.53% for 2006, impacted unfavorably by an increase in the interest rate environment and its affect on wholesale funding costs during the year.
Average earning assets were $1.0 billion in 2006, an increase of $9.0 million, or 0.9%, from 2005. Average loans outstanding grew to $818.1 million in 2006 from $789.3 million in 2005, an increase of 3.6%. The increase in the interest rate environment was a significant contributing factor to net interest income. The mix of average loans to average total assets increased to 74.50% in 2006 from 72.7% in 2005. For 2006, tax equivalent interest income on loans increased $2.0 million from growth and increased $7.0 million from the impact of the interest rate and competitive environment. Balances of securities and short-term investments decreased $19.8 million on average. Tax equivalent interest income on securities and short-term investments decreased $851,000 from volume changes, and increased $293,000 from the impact of the rate environment, for a net $558,000 decrease to tax equivalent interest income.
Average interest-bearing liabilities increased $21.2 million, or 2.4%, from 2005, while net free funds (the total of demand deposits, accrued expenses, other liabilities and stockholders’ equity less non-interest earning assets) decreased $12.2 million. The decrease in net free funds is attributable to the shift from demand deposits to NOW accounts. The primary reason for this is the High Performance Checking (HPC) account product offering that originally started in October of 2005. Average non-interest bearing demand deposits decreased by $12.6 million, or 11.7%. Average interest-bearing deposits grew $37.8 million, or 5.2%, to $768.6 million. This growth resulted from increases in interest-bearing demand deposits, savings accounts, and time deposits less than $100,000 offset by a decline in time deposits greater than $100,000. Interest expense on interest-bearing deposits increased $8.4 million from the impact of the rate environment and increased $698,000 from volume and mix changes resulting in an increase of $9.1 million in interest expense. Average wholesale-funding sources decreased by $16.7 million during 2006. For 2006, interest expense on wholesale funding sources decreased by $740,000 due to volume changes and increased by $1.4 million from higher rates, for a net increase of $611,000 versus 2005 results.
19
Table 1: Average Balances and Interest Rates (interest and rates on a tax-equivalent basis)
| | | | | | | | | | | | | | | | | | | | | | | | | | | |
| | | Year ended December 31, | |
| | | 2006 | | | 2005 | | | 2004 | |
| | | Average Balance(1) | | Interest | | Average Rate | | | Average Balance(1) | | Interest | | Average Rate | | | Average Balance (1) | | Interest | | Average Rate | |
| | | (dollars in thousands) | |
| | | | | | | | | |
ASSETS: | | | | | | | | | | | | | | | | | | | | | | | | | | | |
Earning Assets | | | | | | | | | | | | | | | | | | | | | | | | | | | |
Loans (2)(3)(4) | | $ | 818,086 | | | 61,909 | | 7.57 | % | | $ | 789,316 | | | 52,946 | | 6.71 | % | | $ | 740,605 | | | 42,583 | | 5.75 | % |
U.S. Treasuries | | | 72 | | | 3 | | 4.17 | % | | | 195 | | | 9 | | 4.62 | % | | | 195 | | | 9 | | 4.62 | % |
Agencies | | | 136,226 | | | 5,928 | | 4.35 | % | | | 157,293 | | | 6,326 | | 4.02 | % | | | 148,874 | | | 5,922 | | 3.98 | % |
State and Municipal Obligations (2) | | | 39,728 | | | 2,573 | | 6.48 | % | | | 41,766 | | | 2,835 | | 6.79 | % | | | 31,974 | | | 2,252 | | 7.04 | % |
Other Securities | | | 10,671 | | | 450 | | 4.22 | % | | | 11,077 | | | 598 | | 5.40 | % | | | 10,649 | | | 664 | | 6.24 | % |
Federal funds sold | | | 5,694 | | | 290 | | 5.09 | % | | | 876 | | | 29 | | 3.31 | % | | | 170 | | | 4 | | 2.35 | % |
Other money market Instruments | | | 1,983 | | | 89 | | 4.49 | % | | | 3,010 | | | 94 | | 3.12 | % | | | 2,148 | | | 24 | | 1.12 | % |
| | | | | | | | | | | | | | | | | | | | | | | | | | | |
Total earning assets | | $ | 1,012,460 | | $ | 71,242 | | 7.04 | % | | $ | 1,003,533 | | $ | 62,837 | | 6.26 | % | | $ | 934,615 | | $ | 51,458 | | 5.51 | % |
| | | | | | | | | | | | | | | | | | | | | | | | | | | |
Non-interest earning Assets | | | 85,640 | | | | | | | | | 81,671 | | | | | | | | | 73,919 | | | | | | |
| | | | | | | | | | | | | | | | | | | | | | | | | | | |
Total assets | | $ | 1,098,100 | | | | | | | | $ | 1,085,204 | | | | | | | | $ | 1,008,534 | | | | | | |
| | | | | | | | | | | | | | | | | | | | | | | | | | | |
LIABILITIES AND STOCKHOLDERS’ EQUITY | | | | | | | | | | | | | | | | | | | | | | | | | | | |
Interest bearing Liabilities | | | | | | | | | | | | | | | | | | | | | | | | | | | |
NOW accounts | | $ | 103,740 | | $ | 2,353 | | 2.27 | % | | $ | 90,782 | | $ | 1,500 | | 1.65 | % | | $ | 89,648 | | $ | 782 | | 0.87 | % |
Savings accounts | | | 263,018 | | | 8,970 | | 3.41 | % | | | 221,414 | | | 4,998 | | 2.26 | % | | | 199,942 | | | 1,875 | | 0.94 | % |
Time deposits> $100M | | | 218,116 | | | 9,558 | | 4.38 | % | | | 239,682 | | | 7,752 | | 3.23 | % | | | 207,750 | | | 4,983 | | 2.40 | % |
Time deposits<$100M | | | 183,755 | | | 7,604 | | 4.14 | % | | | 178,912 | | | 5,132 | | 2.87 | % | | | 188,571 | | | 4,328 | | 2.30 | % |
| | | | | | | | | | | | | | | | | | | | | | | | | | | |
Total interest-bearing Deposits | | | 768,629 | | | 28,485 | | 3.71 | % | | | 730,790 | | | 19,382 | | 2.65 | % | | | 685,911 | | | 11,968 | | 1.74 | % |
Federal funds Purchased | | | 7,496 | | | 394 | | 5.26 | % | | | 25,526 | | | 891 | | 3.49 | % | | | 24,402 | | | 388 | | 1.59 | % |
Repurchase Agreements | | | 1,207 | | | 48 | | 3.98 | % | | | 1,419 | | | 39 | | 2.75 | % | | | 1,127 | | | 13 | | 1.15 | % |
FHLB advances | | | 117,702 | | | 5,745 | | 4.88 | % | | | 116,407 | | | 4,309 | | 3.70 | % | | | 95,291 | | | 2,293 | | 2.41 | % |
Subordinated Debentures | | | 16,365 | | | 1,705 | | 10.42 | % | | | 16,100 | | | 2,039 | | 12.66 | % | | | 16,100 | | | 1,695 | | 10.53 | % |
Long term debt | | | — | | | — | | — | | | | — | | | — | | — | | | | — | | | — | | — | |
| | | | | | | | | | | | | | | | | | | | | | | | | | | |
Total interest-bearing Liabilities | | $ | 911,399 | | $ | 36,377 | | 3.99 | % | | $ | 890,242 | | $ | 26,660 | | 2.99 | % | | $ | 822,831 | | $ | 16,357 | | 1.99 | % |
| | | | | | | | | | | | | | | | | | | | | | | | | | | |
Demand deposits | | | 94,938 | | | | | | | | | 107,506 | | | | | | | | | 105,134 | | | | | | |
Accrued expenses and other liabilities | | | 12,672 | | | | | | | | | 10,091 | | | | | | | | | 8,182 | | | | | | |
Stockholders’ equity | | | 79,091 | | | | | | | | | 77,365 | | | | | | | | | 72,387 | | | | | | |
| | | | | | | | | | | | | | | | | | | | | | | | | | | |
Total liabilities and Stockholders’ equity | | | 1,098,100 | | | | | | | | $ | 1,085,204 | | | | | | | | $ | 1,008,534 | | | | | | |
| | | | | | | | | | | | | | | | | | | | | | | | | | | |
Net interest income and rate spread | | | | | $ | 34,865 | | 3.05 | % | | | | | $ | 36,177 | | 3.27 | % | | | | | $ | 35,101 | | 3.52 | % |
Net interest margin | | | | | | | | 3.44 | % | | | | | | | | 3.60 | % | | | | | | | | 3.76 | % |
| (1) | Average balances were generally computed using daily balances. |
| (2) | The yield on tax exempt loans and securities is computed on a tax-equivalent basis using a tax rate of 34% for all periods presented. |
| (3) | Nonaccrual loans and loans held for sale have been included in the average balances. |
| (4) | Interest income includes loan fees, net of amortization. |
20
Table 2: Rate/Volume Analysis (1)
| | | | | | | | | | | | | | | | | | | | | | | |
| | | 2006 compared to 2005 Increase
(Decrease) due to | | | 2005 compared to 2004 Increase
(Decrease) due to | |
| | Volume | | | Rate | | | Net | | | Volume | | Rate | | | Net | |
| | (dollars in thousands) | |
Interest income: | | | | | | | | | | | | | | | | | | | | | | | |
Loans (2) | | $ | 1,994 | | | $ | 6,969 | | | $ | 8,963 | | | $ | 2,949 | | $ | 7,414 | | | $ | 10,363 | |
U.S. treasuries | | | (5 | ) | | | (1 | ) | | | (6 | ) | | | — | | | — | | | | — | |
Agencies | | | (890 | ) | | | 492 | | | | (398 | ) | | | 338 | | | 66 | | | | 404 | |
State and municipal obligations (2) | | | (21 | ) | | | (127 | ) | | | (148 | ) | | | 667 | | | (84 | ) | | | 583 | |
Other securities | | | (135 | ) | | | (127 | ) | | | (262 | ) | | | 26 | | | (92 | ) | | | (66 | ) |
Federal funds sold | | | 238 | | | | 23 | | | | 261 | | | | 23 | | | 2 | | | | 25 | |
Other money market instruments | | | (38 | ) | | | 33 | | | | (5 | ) | | | 13 | | | 57 | | | | 70 | |
| | | | | | | | | | | | | | | | | | | | | | | |
Total earning assets | | $ | 1,143 | | | $ | 7,262 | | | $ | 8,405 | | | $ | 4,016 | | $ | 7,363 | | | $ | 11,379 | |
| | | | | | | | | | | | | | | | | | | | | | | |
Interest expense: | | | | | | | | | | | | | | | | | | | | | | | |
NOW accounts | | $ | 236 | | | $ | 617 | | | $ | 853 | | | $ | 10 | | $ | 708 | | | $ | 718 | |
Savings accounts | | | 1,068 | | | | 2,904 | | | | 3,972 | | | | 221 | | | 2,902 | | | | 3,123 | |
Time deposits | | | (606 | ) | | | 4,884 | | | | 4,278 | | | | 617 | | | 2,956 | | | | 3,573 | |
Federal funds purchased | | | (815 | ) | | | 318 | | | | (497 | ) | | | 19 | | | 484 | | | | 503 | |
Repurchase agreements | | | (6 | ) | | | 15 | | | | 9 | | | | 4 | | | 22 | | | | 26 | |
FHLB advances | | | 48 | | | | 1,388 | | | | 1,436 | | | | 588 | | | 1,428 | | | | 2,016 | |
Subordinated debentures | | | 33 | | | | (367 | ) | | | (334 | ) | | | — | | | 344 | | | | 344 | |
Long term debt | | | — | | | | — | | | | — | | | | — | | | — | | | | — | |
| | | | | | | | | | | | | | | | | | | | | | | |
Total interest-bearing liabilities | | $ | (42 | ) | | $ | 9,759 | | | $ | 9,717 | | | $ | 1,459 | | $ | 8,844 | | | $ | 10,303 | |
Net interest income | | $ | 1,185 | | | $ | (2,497 | ) | | $ | (1,312 | ) | | $ | 2,557 | | $ | (1,481 | ) | | $ | 1,076 | |
| | | | | | | | | | | | | | | | | | | | | | | |
| (1) | The change in interest due to both rate and volume has been allocated proportional to the relationship to the dollar amounts of the change in each. |
| (2) | The yield on tax-exempt loans and securities is computed on an FTE basis using a tax rate of 34% for all periods presented. |
Provision for Loan Losses
The provision for loan losses (“PFLL”) is the periodic cost of providing an allowance for probable incurred losses. As previously discussed, the allowance consists of specific and general components. Our internal risk system is used to identify loans that meet the criteria as being “impaired” under the definition of SFAS 114. The specific component relates to loans that are individually classified as impaired or loans otherwise classified as substandard or doubtful. These identified loans for potential impairment are assigned a loss allocation based upon that analysis. The general component covers non-classified loans and is based on historical loss experience adjusted for current factors. These current factors include loan growth, net charge-offs, changes in the composition of the loan portfolio, delinquencies, management’s evaluation of loan quality, general economic factors and collateral values.
The PFLL in 2006 was $903,000. The PFLL in 2005 and 2004 was $3.2 million and $1.6 million, respectively. At December 31, 2006, the allowance for loan losses (ALL) was $8.1 million, compared to $9.6 million at December 31, 2005. Net charge-offs were $2.4 million for 2006, compared to $4.1 million for 2005 and $3.3 million for 2004. During 2005 we had reserved on a majority of the loans charged-off in 2006. As such, these charge-offs did not have a significant impact on the current year provision. In addition, even though the non-performing and impaired loans increased year over year, the amount allocated to impaired loans decreased by $1.1 million. This is primarily due to the fact that there are $17.4 million of these loans that management currently believes the collateral is sufficient to repay the unpaid principal balance of these loans.
For additional discussion, see Note 3 in the Notes to Consolidated Financial Statements. Net charge-offs as a percent of average loans were 0.29%, 0.52%, and 0.45% for 2006, 2005, and 2004, respectively. The ratio of the ALL to gross loans was 0.98% at December 31, 2006, compared to 1.18% at December 31, 2005 and 1.38% at December 31, 2004.
Management believes that the current provision conforms to our loan loss reserve policy and is adequate in view of the present condition of the loan portfolio and the amount and quality of the collateral supporting non-performing loans. We are continually monitoring the non-performing relationships and will make provisions, as necessary, if the facts and circumstances change. In addition, notwithstanding the non-performing loans, a decline in the quality of our loan portfolio, as a result of general economic conditions, factors affecting particular borrowers or our market area, or otherwise, could affect the adequacy of the allowance. If there are significant charge-offs against the allowance, or we otherwise determine that the allowance is inadequate, we will need to make higher provisions in the future. See “Risk Management and the Allowance for Loan Losses” below for more information related to non-performing loans.
21
Non-Interest Income
Total non-interest income for 2006 was $9.7 million, a $1.9 million or 16.0% decrease from 2005. Non-interest income in 2005 included income from the sale of two properties. The non-interest income to average assets ratio was 0.89% for the year ended December 31, 2006 compared to 1.07% for the same period in 2005. Trust service fees, fees from loan servicing, gains from sales of loans and service charges continue to be the primary components of non-interest income.
In 2006, gains from sales of loans were curtailed by a slowdown in refinancing activity throughout the industry due to higher mortgage rates, similar to the year 2005, as well as a slowdown in the Small Business Administration loan sales activity. Loan servicing fees decreased $39,000 and gains from sales of loans decreased $188,000 between the comparable periods of 2006 and 2005. As interest rates increased over the first half of the year, we have continued to experience a decline in the number of loan applications. Secondary loan production declined 14.1% between the comparable twelve-month periods ($41.2 million in 2006 versus $48.3 million in 2005).
The 2006 increase of $110,000 in service charges on deposit accounts was due in part to the implementation of a High Performance Checking program (“HPC”) in the fourth quarter of 2005. This has resulted in additional overdraft income, partially offset by a reduction in the number of service charge paying personal checking accounts and reduced service charges on commercial checking accounts as the earnings credit rate has increased.
Financial service income increased $139,000 as a result of additional brokerage business generated.
For 2006, a gain of $103,000 was realized on the sale of a condominium unit at Baylake City Center to an unrelated third party. Also, a gain of $188,000 was realized in the sale of bank land located in the Green Bay market area.
In 2005, non-interest income included gains totaling $2.7 million from two property sales. These gains were offset by losses of $379,000 on various bank properties sold or written down during the period. These losses relate primarily to the sale of two buildings and land formerly used as branch offices. In addition, the bank closed one leased facility during the year, for which leasehold improvements were written off.
Non-Interest Expense
Non-interest expense in 2006 increased to $32.3 million, a $1.8 million or 5.9% increase compared to 2005 results, primarily as a result of increased personnel expense, professional services, other operating expense and recruiting fees, offset by a reduction in the provision taken for the impairment of an off-balance sheet letter of credit. In 2005, a $2.2 million charge was taken for impairment related to an off-balance sheet letter of credit compared to a provision of $27,000 in 2006. This followed a $4.0 million or 15.3% increase of non-interest expense in 2005 as compared to 2004.
Salaries and employee benefits expense is the largest component of non-interest expense and totaled $19.4 million in 2006, an increase of $2.7 million, or 16.1%, as compared to 2005 results. The increase in 2006 primarily resulted from staffing increases, increased benefit costs and normal salary increases partially offset by a decrease in bonus expense. Salary costs increased $2.1 million, or 17.6 %, for 2006 compared to 2005 results as a result of increased staffing and normal salary increases. Also impacting the increase in salary expenses were severance costs related to the termination of certain executives resulting from a recently implemented management restructuring. This accounted for $266,000 or 2.3% of the increase. The number of full-time equivalent employees increased to 336 in 2006 from 317 in 2005, an increase of 6.0%.
Contributing to the increase in salary and employee benefits were expenses related to the Baylake Bank Supplemental Executive Retirement Plan (“Plan”), which is intended to provide certain management and highly compensated employees of the Bank who have contributed, and are expected to continue to contribute to our success by providing for deferred compensation in addition to that available under our other retirement programs. Costs associated with the Plan amounted to $799,000 for 2006. Accrued benefit costs, principally for health insurance, pension costs and bonus expense, represent the remaining increase in personnel-related costs. The increase in health insurance costs is expected to continue for 2007. Management will continue its efforts to control salaries and employee benefit expense, although increases in these expenses are likely to continue in future years as the Company continues to grow.
Net occupancy expense for 2006 totaled $2.4 million, showing a decrease of $68,000 compared to 2005. Additional costs were incurred for real estate tax expense for properties purchased in the Fox Valley area, as well as normal occupancy-related expense increases. However, 2005 results included costs of $265,000 for lease termination costs that did not recur in 2006.
22
Data processing and courier expense in 2006 increased $106,000 due to an increase in the volume of accounts processed. Management estimates that data processing expense should show minimal increases in the future with adjustments related only to any volume increases incurred.
Other real estate expenses are netted against income received in the determination of net other real estate owned expense. Other real estate owned showed net expense from the operation of other real estate of $376,000 in 2006. Gains of $242,000 from seven commercial property sales and one residential property sale were realized in 2006 and offset by losses of $166,000 from the sale of four commercial properties and one residential property during 2006 for a net gain of $76,000.
The provision for impairment loss on the letter of credit of $27,000 relates to a liability for our exposure on a standby letter of credit. This compares to an impairment change of $2.2 million in 2005 on that same letter of credit. The letter of credit supports secondary market financing on behalf of the borrower. We believe the collateral and cash flows will be sufficient to support the balance of the standby letter of credit at December 31, 2006. We continue to monitor the financial condition of the borrower on an ongoing basis and if it continues to deteriorate, may need to provide additional reserves with respect to the off-balance sheet commitment.
Other operating expenses in 2006 increased $683,000 or 11.9% to $6.4 million as compared to $5.8 million in 2005. Loan and collection expenses were $501,000 higher than a year ago. This is primarily related to costs on two loans that are in the collection process. In addition, costs totaling $589,000 were incurred in 2006 for property management fees, real estate taxes, legal fees, insurance, and operating expenses. In 2007, these costs are expected to continue until the properties are sold.
Employee acquisition expenses are up $279,000 compared to 2005. The increased costs are attributed to $286,000 of recruiting fees that were paid for the hiring of employees for key positions, including the hiring of the new president. These costs are not expected to continue in 2007.
Costs related to other outside services were $368,000 higher in 2006. The primary item increasing these costs were expenses of $378,000 related to the High Performance Checking program, including mailing, consulting fees, and material costs. Since the program was renewed for another year in October 2006, a majority of these costs are expected to continue in 2007. Other costs of $89,000 for consulting expenses related to the Wealth Management restructure are not expected to continue in 2007.
Off-Balance Sheet Arrangements
We do not use interest rate contracts (e.g. swaps) or other derivatives to manage interest rate risk and have none of these instruments outstanding. Our bank does have, through its normal operations, loan commitments and standby letters of credit outstanding as of December 31, 2006 in the amount of $227.9 million and $21.3 million, respectively. These are further explained in Note 13 of the notes to our Consolidated Financial Statements.
Income Taxes
Income tax expense totaled $2.8 million in 2006, a decrease of $1.1 million compared to 2005 results. The lower tax expense in 2006 reflected the decrease in our income before income tax expense in 2006.
Our effective tax rate, income tax expense divided by income before taxes, was 27.3% in 2006 compared to 30.1% in 2005. Taxable income decreased while tax-exempt interest income from municipal loans and investments remained relatively constant causing the change in the effective tax rate.
See Note 1, “Summary of Significant Accounting Policies,” and Note 15, “Income Tax Expense,” of the notes to our consolidated financial statements for a further discussion of income tax accounting. Income tax expense recorded in the consolidated statements of income involves interpretation and application of certain accounting pronouncements and federal and state tax codes, and is, therefore, considered a critical accounting policy. We undergo examination by various taxing authorities. Such taxing authorities may require that changes in the amount of tax expense or valuation allowance be recognized when their interpretations differ from those of management, based on their judgments about information available to them at the time of their examinations.
23
2005 compared to 2004
General
We reported net income of $8.9 million in 2005 compared to $10.8 million for 2004. Basic and diluted earnings per share were $1.15 and $1.14, respectively, for 2005 compared to $1.41 and $1.40 for 2004. Return on average assets for the year ended December 31, 2005 was 0.82% and 1.07% for 2004. The return on average equity was 11.51% for 2005 and 14.88% for 2004. Cash dividends declared in 2005 increased 7.0% to $0.61 per share compared with $0.57 in 2004.
Net Interest Income
We earned net interest income of $34.9 million and $34.0 million in 2005 and 2004, respectively. Net interest income and net interest margin were impacted in 2005 by an increasing interest rate environment. The changes in the loan and security portfolios, discussed later, generally reflect upward trends in rates associated with lower risk assets in addition to the current market rates.
The year 2005 saw a decrease in our interest rate spread. Interest rates generally rose during much of 2005, increasing 200 bps over the year as the FRB attempted to keep inflation in control. The interest rate spread decreased 25 basis points in 2005 to 3.27% from 3.52% in 2004, as the average yield on earning assets increased 75 bps while the average rate paid on interest-bearing liabilities increased 100 bps over the same period. The increase in our earning assets yield reflects a higher rate environment impacting rates on the variable priced loans and re-pricing fixed rate loans (for competitive reasons). Increased investment interest income, which resulted from an increased investment portfolio, and higher yields on the investment portfolio, have contributed to an increase in the yields on interest earning assets. A higher rate environment also affected the funding side of the balance sheet. Yields on interest-paying liabilities increased 100 bps. Increased interest costs resulted from a higher rate environment offset to a lesser extent by increased competition for retail deposits and increased balances in time deposit accounts. Yields on interest bearing deposits increased 91 bps to 2.65% in 2005 from 1.74% in 2004.
The higher rate environment also had an effect in increasing yields on the wholesale funding side of the balance sheet. Yields on short-term borrowings increased 188 bps in 2005 compared to 2004, while yields on other borrowings increased 129 bps to 3.70% in 2005 from 2.41% in 2004.
The net interest margin for 2005 was 3.60% compared to 3.76% in 2004. The decrease in net interest margin was in part related to a rising interest rate environment in 2005, an increase in non-accrual loans, and a decrease in the free funds ratio. The interest rate environment increased in 2005, including the effect on our commercial loan Prime Rate. The overall environment in comparison to the second half of 2004, continued to drive the yield on commercial and other variable type loans higher into the year 2005.
Provision for Loan Losses
The provision for loan losses in 2005 was $3.2 million compared to $1.6 million in 2004. The provision was impacted by an increase in net loan charge-offs, an increase in the level of non-performing loans, risk levels inherent in the loan portfolio and the changing mix of the overall loan portfolio.
Non-Interest Income
Non-interest income during 2005 increased $2.1 million or 21.7% when compared to 2004. The primary factors increasing non-interest income were two property sales in 2005, with an aggregate gain of $2.7 million. A subsidiary sold property adjacent to a bank branch for $2.5 million to a third party resulting in a $2.2 million gain. In addition, a space related to the Baylake City Center project was sold to an unrelated third party resulting an a $410,000 gain. These gains were offset by losses of $379,000 on various bank properties sold or written down during the period.
A slowdown in loan refinancing activities throughout the industry impacted results. Gains from sales of loans decreased $359,000 between the comparable periods while loan servicing fees increased $52,000. In 2004, non-interest income included a gain recognized on the sale of bank land located at one of the Bank’s branch locations in the Green Bay market area totaling $484,000.
24
Financial Service income increased $39,000 as a result of additional brokerage business generated.
Non-Interest Expense
Non-interest expense increased $4.0 million during 2005, or 15.3% over 2004 levels. Factors contributing to the increase were increased personnel and benefits expenses, professional services, and a provision of $2.2 million taken for the impairment of an off-balance sheet letter of credit. Salaries and employee benefit expense increased $1.5 million, or 9.5%, compared to 2004 results. The increase in 2005 resulted from staffing increases, increased benefit costs, and normal salary increases, offset by a decrease in bonus expense.
Other items impacting non-interest expense were: (1) increase of $191,000 in equipment expense due to increases in depreciation expense and maintenance contract costs, (2) decrease of $366,000 in charitable contribution expense due to a reduction in long-term commitments made in the 2005, and (3) an increase of $144,000 in legal and professional expenses as a result of increased costs relative to SEC compliance imposed by the Sarbanes-Oxley Act of 2002.
Income Taxes
Income tax expense totaled $3.8 million in 2005 and $4.7 million in 2004. The decreased tax expense in 2005 reflected the decrease in our before tax earnings in addition to an increase in tax-exempt interest income.
Our effective tax rate, income tax expense divided by income before taxes, was 30.1% in 2005 compared with 30.3% in 2004. Of the 30.1% effective tax rate for 2005, the federal effective tax rate was 24.8% while the Wisconsin State effective tax rate was 5.3%.
BALANCE SHEET ANALYSIS
Loans
Gross loans outstanding grew to $819.6 million at December 31, 2006, a 0.9% increase from the end of 2005. This follows a 7.3% increase from the end of 2004.
Table 3 reflects composition (mix) of the loan portfolio at December 31 for the previous five fiscal years:
Table 3: Loan Composition
| | | | | | | | | | | | | | | | | | | | | | | | | | | | | | | | | | | |
| | | As of December 31, | |
| | | 2006 | | | 2005 | | | 2004 | | | 2003 | | | 2002 | |
| | | Amount | | | % of Total | | | Amount | | | % of Total | | | Amount | | | % of Total | | | Amount | | | % of Total | | | Amount | | | % of Total | |
| | | (dollars in thousands) | |
Amount of loans by type | | | | | | | | | | | | | | | | | | | | | | | | | | | | | | | | | | | |
Real estate-mortgage | | | | | | | | | | | | | | | | | | | | | | | | | | | | | | | | | | | |
Commercial | | $ | 464,843 | | | 56.7 | % | | $ | 467,956 | | | 57.6 | % | | $ | 424,712 | | | 56.1 | % | | $ | 387,778 | | | 54.2 | % | | $ | 351,425 | | | 51.5 | % |
1-4 Family residential | | | 143,873 | | | 17.6 | | | | 148,736 | | | 18.3 | | | | 134,350 | | | 17.7 | | | | 125,700 | | | 17.6 | | | | 133,365 | | | 19.5 | |
Construction | | | 94,082 | | | 11.5 | | | | 85,729 | | | 10.6 | | | | 80,384 | | | 10.6 | | | | 77,350 | | | 10.8 | | | | 75,688 | | | 11.1 | |
Commercial, financial and agricultural | | | 82,619 | | | 10.1 | | | | 80,260 | | | 9.9 | | | | 83,787 | | | 11.1 | | | | 91,051 | | | 12.7 | | | | 89,207 | | | 13.1 | |
| | | | | | | | | | |
Consumer | | | 14,893 | | | 1.8 | | | | 14,263 | | | 1.8 | | | | 13,936 | | | 1.8 | | | | 14,460 | | | 2.0 | | | | 14,916 | | | 2.2 | |
Tax exempt | | | 19,633 | | | 2.4 | | | | 15,785 | | | 1.9 | | | | 20,457 | | | 2.7 | | | | 19,032 | | | 2.7 | | | | 18,227 | | | 2.7 | |
Less: deferred fees, net of costs | | | (375 | ) | | -0.1 | | | | (433 | ) | | -0.1 | | | | (398 | ) | | 0.0 | | | | (349 | ) | | 0.0 | | | | (316 | ) | | 0.0 | |
| | | | | | | | | | | | | | | | | | | | | | | | | | | | | | | | | | | |
Total loans (net of unearned income) | | $ | 819,568 | | | 100.0 | % | | $ | 812,296 | | | 100.0 | % | | $ | 757,228 | | | 100.0 | % | | $ | 715,022 | | | 100.0 | % | | $ | 682,512 | | | 100.0 | % |
| | | | | | | | | | | | | | | | | | | | | | | | | | | | | | | | | | | |
Commercial real estate loans totaled $464.8 million at year-end 2006 and comprised 56.7% of the loan portfolio secured by farmland, multifamily properties, and nonfarm/nonresidential real estate properties. Loans of this type are mainly for business properties, multifamily properties, and community purpose properties. The credit risk related to these types of loans is greatly influenced by general economic conditions, especially those applicable to the Northeast Wisconsin market area, and the resulting impact on a borrower’s operations. Many times, we will take additional real estate collateral to further secure the overall lending relationship. A decline in the tourism industry, or other economic effects, (such as increased interest rates affecting demand for real estate) could affect both our lending opportunities in this area as well as potentially affect the value of collateral held for these loans.
25
Commercial, financial and agricultural loans totaled $82.6 million at the end of 2006, up $2.4 million or 2.9% since year-end 2005. The commercial, financial, and agricultural loan classification primarily consists of commercial loans to small businesses. Loans of this type are in a broad range of industries and include service, retail, wholesale, and manufacturing concerns. Agricultural loans are made principally to farmers engaged in dairy, cherry and apple production. Borrowers are primarily concentrated in Door, Brown, Outagamie, Waupaca, Waushara and Kewaunee Counties, Wisconsin. The origination of commercial and commercial real estate loans was primarily from our market area in Brown County. Growth in tourism related business in Door County was slow again in 2006 compared to growth experienced in years prior to 2005. The credit risk related to commercial loans made is largely influenced by general economic conditions, especially those applicable to the Northeast Wisconsin market area, and the resulting impact on a borrower’s operations.
Management uses an active credit risk management process for commercial loans to ensure that sound and consistent credit decisions are made. Management attempts to control credit risk by adhering to detailed underwriting procedures, performing comprehensive loan administration, and undertaking periodic review of borrowers’ outstanding loans and commitments. Borrower relationships are formally reviewed periodically during the life of the loan. Further analyses by customer, industry, and location are performed to monitor trends, financial performance and concentrations.
Real estate construction loans grew $8.4 million or 9.7% to $94.1 million at December 31, 2006. Loans in this classification are primarily short-term interim loans that provide financing for the acquisition or development of commercial real estate, such as multifamily or other commercial development projects. Real estate construction loans generally are made to developers who are well known to us, have prior experience, and are well capitalized. Construction projects undertaken by these developers are carefully reviewed by us to ensure the economic feasibility. The credit risk related to real estate construction loans is generally limited to specific geographic areas, but it is also influenced by general economic conditions. We control the credit risk on these types of loans by making loans to developers in familiar markets, reviewing the merits of the individual project, controlling loan structure and monitoring project progress and advances of construction proceeds.
Our loan portfolio is diversified by types of borrowers and industry groups within the market areas that we serve. Significant loan concentrations are considered to exist for a financial entity when such amounts are loans to a multiple of borrowers engaged in similar activities that cause them to be similarly impacted by economic or other conditions. We have identified certain industry groups within our market area, including lodging, restaurants, retail shops, small manufacturing, real estate rental properties and real estate development. At December 31, 2006, there existed one industry group concentration in our loans that exceeded 10% of total loans. At year-end 2006, loans to real estate rental properties totaled $103.2 million and are located in various areas of our market area.
In addition, loans to tourism related businesses remain a significant part of the business and loans in other sectors are affected by the tourism driven economy of Door County. As a result, a decrease in tourism could adversely affect one or more industry groups in our loan portfolio, which could have a corresponding adverse effect on our earnings. Additionally, a decline in tourism has an indirect effect in that other types of business (grocery and convenience stores, for example) rely on the tourism to provide cash flow to their operations. Loans to individuals who are employed by tourism related business could also be affected in the event of a downturn in the market.
Although growth was slow in 2006 for tourism business in the Door County market, management believes that business activity still appears to remain adequate to service debt of the customers and for customers in general to make improvements to their operations. To date, these types of loans have experienced some downgrade in loss potential relative to credit risk.
At the end of 2006, residential real estate mortgage loans totaled $143.9 million and comprised 17.6% of the loan portfolio. These loans decreased $4.9 million or 3.3% during 2006. The rising interest rate environment during the first half of 2006 caused consumer preference to remain with fixed-rate residential loans. Refinancing activity slowed in 2006, as interest rates have increased. We expect the trend to continue into 2007, and given current trends, growth in mortgage loans is not anticipated. Residential real estate loans consist of conventional home mortgages, adjustable indexed interest rate mortgage loans, home equity loans, and secondary home mortgages. Loans are primarily for properties within the market areas we serve. Residential real estate loans generally contain a limit for the maximum loan to collateral value of 75% to 80% of fair market value. Private mortgage insurance may be required when the loan to value exceeds these limits.
26
We offer adjustable rate mortgage loans based upon market demands. At year-end 2006, those loans totaled $25.1 million dollars, an increase of $300,000. Adjustable rate mortgage loans contain an interest rate adjustment provision tied to the weekly average yield on U.S. Treasury securities adjusted to a constant maturity of one year (the “index”), plus an additional spread of up to 2.75%. Interest rates on indexed mortgage loans are adjusted, up or down, on predetermined dates fixed by contract, in relation to and based on the index or market interest rates as of a predetermined time prior to the adjustment date.
Adjustable rate mortgage loans have an initial period, ranging from one to three years, during which the interest rate is fixed, with adjustments permitted thereafter, subject to annual and lifetime interest rate caps which vary with the product. Annual limits on interest rate changes are 2% while aggregate lifetime interest rate increases over the term of the loan are currently at 6% above the original mortgage loan interest rate. We also participate in a fixed rate mortgage program under the Federal Home Loan Mortgage Corporation (“FHLMC”) guidelines. These loans are sold in the secondary market and we retain servicing rights. At December 31, 2006, these loans totaled $101.5 million compared to $109.0 million at December 31, 2005.
We also offer fixed rate mortgages through participation in fixed rate mortgage programs under private investors. These loans also are sold in the secondary market with servicing rights released to the buyer.
In 2006, we sold $38.9 million in mortgage loans through the secondary programs compared to $48.3 million in 2005.
Installment loans to individuals totaled $14.9 million, or 1.8%, of the total loan portfolio at December 31, 2006 compared to $14.3 million, or 1.8%, at end of 2005. Installment loans include short-term installment loans, direct and indirect automobile loans, recreational vehicle loans, credit card loans, and other personal loans. Individual borrowers may be required to provide collateral or a satisfactory endorsement or guaranty from another party, depending upon the specific type of loan and the creditworthiness of the borrower. Loans are made to individual borrowers located in the market areas we serve. Credit risks for loans of this type are generally influenced by general economic conditions (especially in the market areas served), the characteristics of individual borrowers and the nature of the loan collateral. Reviewing the credit worthiness of the borrowers, as well as taking the appropriate collateral and guaranty positions on such loans primarily control credit risk.
Tax-exempt loans totaled $19.6 million at December 31, 2006 compared to $15.8 million at year-end 2005. Tax-exempt loans are short or long term loans to municipalities for the funding of various projects. The proceeds of these loans are collateralized by the backing of the taxing authority and can be used for general or revenue producing projects.
Table 4 details expected maturities by loan purpose as of December 31, 2006. Those loans with expected maturities over one year are further scheduled by re-pricing opportunities.
Table 4: Loan Maturity and Interest Rate Sensitivity
| | | | | | | | | | | | |
| | | Maturity |
December 31, 2006 | | Within 1 Year | | 1-5 Years | | After 5 Years | | Total |
| | | (dollars in thousands) |
Loans secured primarily by real estate: | | | | | | | | | | | | |
Secured by 1 to 4 family residential | | $ | 39,974 | | $ | 67,112 | | $ | 36,787 | | $ | 143,873 |
Construction | | | 57,228 | | | 34,451 | | | 2,403 | | | 94,082 |
Commercial real estate | | | 146,090 | | | 237,021 | | | 81,357 | | | 464,468 |
Commercial | | | 23,847 | | | 37,273 | | | 21,499 | | | 82,619 |
Tax-exempt | | | 5,316 | | | 4,751 | | | 9,566 | | | 19,633 |
Consumer | | | 8,430 | | | 6,386 | | | 77 | | | 14,893 |
| | | | | | | | | | | | |
Total | | $ | 280,885 | | $ | 386,994 | | $ | 151,689 | | $ | 819,568 |
27
| | | | | | |
| | | Interest sensitivity |
| | | Fixed rate | | Variable rate |
Due after one year | | $ | 287,228 | | $ | 251,455 |
Note that commercial real estate loans have been adjusted for deferred fees, net of costs in this analysis.
Critical factors in the overall management of credit quality are sound loan underwriting and administration, systematic monitoring of existing loans and commitments, effective loan review on an ongoing basis, adequate allowance for loan losses, and conservative non-accrual and charge-off policies.
Risk Management and the Allowance for Loan Losses
The loan portfolio is our primary asset subject to credit risk. To reflect this credit risk, we set aside an allowance for probable incurred credit losses through periodic charges to earnings. These charges are shown in our consolidated income statement as provision for loan losses. See “Provision for Loan Losses” above. Credit risk is controlled and monitored through the use of lending standards, a thorough review of potential borrowers, and an ongoing review of payment performance. Asset quality administration, including early identification of problem loans and timely resolution of problems, further enhances management of credit risk and minimization of loan losses. All specifically identifiable and quantifiable losses are charged off against the allowance. Charged-off loans are subject to periodic review, and specific efforts are taken to achieve maximum recovery of principal and interest.
As Table 5 indicates, the ALL at December 31, 2006 was $8.1 million compared with $9.6 million at the end of 2005. Loans increased 0.9% in 2006, while the allowance as a percent of gross loans decreased to 0.98% from 1.18% at year-end 2005. Commercial mortgage loan charge-offs represented 50.6% of the total net charge-offs for the year 2006. Commercial loan charge-offs represented 29.8% of the total net charge-offs in 2006 while real estate-construction charge-offs represented 26.1% of the total net charge-offs for the year 2006. Although net loan charge-offs decreased in 2006, the ALL as a percent of total loans decreased as a result of the lower allocation of specific reserves to impaired loans. Loans charged-off are subject to periodic review and specific efforts are taken to achieve maximum recovery of principal, accrued interest and related expenses.
Table 5. Loan Loss Experience
| | | | | | | | | | | | | | | | | | | | |
| | | Years Ended December 31, | |
| | | 2006 | | | 2005 | | | 2004 | | | 2003 | | | 2002 | |
| | | (dollars in thousands) | |
| | | | | |
Daily average amount of loans | | $ | 818,086 | | | $ | 789,316 | | | $ | 740,605 | | | $ | 695,669 | | | $ | 655,464 | |
| | | | | | | | | | | | | | | | | | | | |
Loans, end of period | | $ | 819,568 | | | $ | 812,296 | | | $ | 757,228 | | | $ | 715,022 | | | $ | 682,512 | |
| | | | | | | | | | | | | | | | | | | | |
ALL, at beginning of year | | $ | 9,551 | | | $ | 10,445 | | | $ | 12,159 | | | $ | 11,410 | | | $ | 7,992 | |
Loans charged off: | | | | | | | | | | | | | | | | | | | | |
Real estate-mortgage | | | 204 | | | | 537 | | | | 226 | | | | 946 | | | | 178 | |
Real estate-construction | | | 624 | | | | — | | | | 3 | | | | 79 | | | | — | |
Real estate-commercial | | | 1,341 | | | | 3,363 | | | | 1,039 | | | | 649 | | | | 1,681 | |
Commercial/agricultural loans | | | 847 | | | | 651 | | | | 2,781 | | | | 4,369 | | | | 789 | |
Consumer loans | | | 401 | | | | 320 | | | | 240 | | | | 302 | | | | 407 | |
| | | | | | | | | | | | | | | | | | | | |
Total loans charged off | | $ | 3,417 | | | $ | 4,871 | | | $ | 4,289 | | | $ | 6,345 | | | $ | 3,055 | |
| | | | | |
Recoveries of loans previously charged off: | | | | | | | | | | | | | | | | | | | | |
Real estate-mortgage | | | 409 | | | | 392 | | | | 79 | | | | 263 | | | | 126 | |
Real estate-construction | | | — | | | | — | | | | 1 | | | | — | | | | — | |
Real estate-commercial | | | 127 | | | | 91 | | | | 79 | | | | 107 | | | | 49 | |
Commercial/agricultural loans | | | 134 | | | | 163 | | | | 741 | | | | 950 | | | | 524 | |
Consumer loans | | | 351 | | | | 114 | | | | 76 | | | | 124 | | | | 74 | |
| | | | | | | | | | | | | | | | | | | | |
Total loans recovered | | | 1,021 | | | | 760 | | | | 976 | | | | 1,444 | | | | 773 | |
| | | | | | | | | | | | | | | | | | | | |
Net loans charged off (“NCOs”) | | | 2,396 | | | | 4,111 | | | | 3,313 | | | | 4,901 | | | | 2,282 | |
| | | | | | | | | | | | | | | | | | | | |
Additions to allowance for loan losses charged to operating expense | | $ | 903 | | | $ | 3,217 | | | $ | 1,599 | | | $ | 5,650 | | | $ | 5,700 | |
Allowance to related assets acquired | | | — | | | | — | | | | — | | | | — | | | | — | |
ALL, at end of year | | $ | 8,058 | | | $ | 9,551 | | | $ | 10,445 | | | $ | 12,159 | | | $ | 11,410 | |
| | | | | |
Ratio of NCOs during period to average loans outstanding | | | 0.29 | % | | | 0.52 | % | | | 0.45 | % | | | 0.70 | % | | | 0.35 | % |
Ratio of ALL to NCOs | | | 3.4 | | | | 2.3 | | | | 3.2 | | | | 2.5 | | | | 5.0 | |
Ratio of ALL to total loans end of period | | | 0.98 | % | | | 1.18 | % | | | 1.38 | % | | | 1.70 | % | | | 1.67 | % |
28
The change in ALL is a function of a number of factors, including but not limited to changes in the loan portfolio, net charge-offs, and non-performing loans.
On a quarterly basis, management reviews the adequacy of the ALL. The loan officers grade commercial credits and the loan review function validates the officers’ grades. In the event that the loan review function downgrades the loan, it is included in the allowance analysis at the lower grade. The grading system is in compliance with regulatory classifications and the allowance is allocated to the loans based on the regulatory grading, except in instances where there are known differences (i.e., collateral value is nominal, etc.). To establish the appropriate level of the allowance, a sample of loans (including impaired and non-performing loans) are reviewed and classified as to potential loss exposure.
Based on an estimation computed pursuant to the requirements of Financial Accounting Standards Board (“FASB”) Statement No. 5, “Accounting for Contingencies,” and FASB Statements No. 114 and 118, “Accounting by Creditors for Impairment of a Loan,” the analysis of the ALL consists of two components: (i) specific credit allocation established for expected losses resulting from analysis developed through specific credit allocations on individual loans for which the recorded investment in the loan exceeds its fair value; (ii) general portfolio allocation based on historical loan loss experience for each loan category and adjusted for economic conditions as well as specific and other factors in the markets in which we operate.
The specific credit allocation of the ALL is based on a regular analysis of loans over a fixed-dollar amount where the internal credit rating is at or below a predetermined classification. The fair value of the loan is determined based on either the present value of expected future cash flows discounted at the loan’s effective interest rate, the market price of the loan, or, if the loan is collateral dependent, the fair value of the underlying collateral less cost of sale.
The general portfolio allocation component of the ALL is determined statistically using a loss migration analysis that examines historical loan loss experience. The loss migration analysis is performed quarterly and loss factors are updated regularly based on actual experience. The general portfolio allocation element of the ALL also includes consideration of the amounts necessary for concentrations and changes in portfolio mix and volume.
Management remains watchful of credit quality issues and believes that issues within the portfolio are reflective of the challenging economic environment experienced over the past few years. Should the economic climate deteriorate from current levels, borrowers may experience difficulty, and the level of non-performing loans, charge-offs and delinquencies could rise. This would cause management to review the allowance for loan losses to determine if increases in the provision are required.
Table 6 shows the amount of the ALL allocated for the time periods indicated to each loan type as described. It also shows the percentage of balances for each loan type to total loans. In general, it would be expected that those types of loans which have historically more loss associated with them will have a proportionally larger amount of the allowance allocated to them than do loans that have less risk.
Consideration for making such allocations is consistent with the factors discussed above, and all of the factors are subject to change; thus, the allocation is not necessarily indicative of the loan categories in which future loan losses will occur. It would also be expected that the amount allocated for any particular type of loan will increase or decrease proportionately to both the changes in the loan balances and to increases or decreases in the estimated loss in loans of that type. In other words, changes in the risk profile of the various parts of the loan portfolio should be reflected in the allowance allocated.
29
Table 6:Allocation of the Allowance for Loan Losses
| | | | | | | | | | | | | | | | | | | | | | | | | | | | | | |
| | | As of December 31, (dollars in thousands) | |
| | | 2006 | | | 2005 | | | 2004 | | | 2003 | | | 2002 | |
| | | Amount | | % of total loans | | | Amount | | % of total loans | | | Amount | | % of total
loans | | | Amount | | % of total loans | | | Amount | | % of total loans | |
Commercial, financial & agricultural | | $ | 2,082 | | 10.1 | % | | $ | 2,317 | | 9.99 | % | | $ | 1,982 | | 13.0 | % | | $ | 2,386 | | 14.1 | % | | $ | 3,679 | | 13.0 | % |
Commercial real estate | | | 4,280 | | 56.6 | | | | 5,633 | | 57.50 | | | | 6,374 | | 51.5 | | | | 6,772 | | 46.0 | | | | 4,639 | | 51.5 | |
Real estate | | | | | | | | | | | | | | | | | | | | | | | | | | | | | | |
Construction | | | 597 | | 11.5 | | | | 454 | | 10.6 | | | | 998 | | 11.1 | | | | 702 | | 10.8 | | | | 814 | | 11.1 | |
Residential | | | 755 | | 17.6 | | | | 482 | | 18.3 | | | | 539 | | 19.5 | | | | 1,325 | | 22.9 | | | | 1,695 | | 19.5 | |
Consumer | | | 342 | | 1.8 | | | | 243 | | 1.8 | | | | 198 | | 2.2 | | | | 346 | | 2.7 | | | | 222 | | 2.2 | |
| | | | | | | | | | | | | | | | | | | | | | | | | | | | | | |
Tax exempt loans | | | — | | 2.4 | | | | — | | 1.9 | | | | — | | 2.7 | | | | — | | 3.5 | | | | — | | 2.7 | |
Not specifically allocated | | | 2 | | | | | | 422 | | | | | | 354 | | | | | | 628 | | | | | | 361 | | | |
| | | | | | | | | | | | | | | | | | | | | | | | | | | | | | |
Total allowance | | $ | 8,058 | | 100 | % | | $ | 9,551 | | 100.0 | % | | $ | 10,445 | | 100.0 | % | | $ | 12,159 | | 100.0 | % | | $ | 11,410 | | 100.0 | % |
In years prior to 2006, management considered the unallocated portion of the allowance to be necessary to allow for inherent subjective reserves based on the nature of the portfolio, general economic conditions and specific economic factors. In 2006 management further enhanced their overall process to include more of these considerations as a part of the allocation process to the respective loan categories. Management does not deem this process to be a change in methodology, but rather a refinement in their loan loss calculation. Management believes that there would be no change in the balance of the allowance for loan losses if this approach was used in all of the years presented. In addition, the reduction in the allocated amounts in 2006 for commercial real estate relates to the decrease in impaired loans in this category at end of year 2006.
Management believes sufficient reserves have been provided in the ALL to absorb probable incurred losses in the loan portfolio at December 31, 2006. Ongoing efforts are being made to collect on all non-performing loans, including starting the legal process, when we believe it is necessary to minimize the risk of further deterioration of these loans for full collection. In the event that facts and circumstances change on any of these non-performing loans, additional provisions may be necessary.
As it relates to the rest of the portfolio, while management uses available information to recognize losses on loans, future adjustments to the ALL may be necessary based on changes in economic conditions and the impact of such change on our borrowers. As an integral part of their examination process, various regulatory agencies also review the ALL. Such agencies may require that changes in the ALL be recognized when their credit evaluations differ from those of management, based on their judgments about information available to them at the time of their examination.
Non-Performing Loans and Other Real Estate
Management encourages early identification of non-accrual and problem loans in order to minimize the risk of loss.
Non-performing loans are defined as non-accrual loans, loans 90 days or more past due but still accruing, and restructured loans. Additionally, whenever management becomes aware of facts or circumstances that may adversely impact on the collection of principal or interest on loans, it is the practice of management to place such loans on non-accrual status immediately rather than waiting until the loans become 90 days past due. The accrual of interest income is discontinued when a loan becomes 90 days past due as to principal or interest. When interest accruals are discontinued, interest credited to income is reversed. If collection is in doubt, cash receipts on non-accrual loans are used to reduce principal rather than recorded as interest income.
Restructuring loans involve the granting of some concession to the borrower involving a loan modification, such as payment schedule or interest rate changes. Restructured loans involve loans that have had a charge-off taken against the loan to reduce the carrying amount of the loan to fair market value as determined using a SFAS 114 analysis.
Table 7 details non-performing loans and non-performing assets by type for 2006 and the preceding four years.
30
Table 7: Nonperforming Loans and Other Real Estate Owned
| | | | | | | | | | | | | | | | | | | | |
| | | December 31, | |
| | | 2006 | | | 2005 | | | 2004 | | | 2003 | | | 2002 | |
| | | (dollars in thousands) | |
| | | | | |
Nonaccrual loans | | $ | 27,352 | | | $ | 6,942 | | | $ | 5,920 | | | $ | 11,079 | | | $ | 12,244 | |
Accruing loans past due 90 days or more | | | — | | | | — | | | | — | | | | — | | | | — | |
Restructured loans | | | 496 | | | | — | | | | — | | | | 5,144 | | | | 9,844 | |
| | | | | | | | | | | | | | | | | | | | |
Total non-performing loans (NPLs) | | $ | 27,848 | | | $ | 6,942 | | | $ | 5,920 | | | $ | 16,223 | | | $ | 22,088 | |
| | | | | | | | | | | | | | | | | | | | |
Investment subsidiaries | | | — | | | | — | | | | — | | | | — | | | | 1,994 | |
Other real estate owned/operating subsidiaries | | | 5,760 | | | | 3,333 | | | | 2,572 | | | | 2,271 | | | | 896 | |
| | | | | | | | | | | | | | | | | | | | |
Total non-performing assets (NPAs) | | $ | 33,608 | | | $ | 10,275 | | | $ | 8,492 | | | $ | 18,494 | | | $ | 24,978 | |
| | | | | | | | | | | | | | | | | | | | |
Ratios: | | | | | | | | | | | | | | | | | | | | |
NPL’s to total loans | | | 3.40 | % | | | 0.85 | % | | | 0.78 | % | | | 2.27 | % | | | 3.24 | % |
NPA’s to total assets | | | 3.02 | % | | | 0.94 | % | | | 0.81 | % | | | 1.90 | % | | | 2.76 | % |
ALL to NPL’s | | | 28.94 | % | | | 137.58 | % | | | 176.44 | % | | | 74.95 | % | | | 51.66 | % |
Non-performing loans at December 31, 2006 were $27.8 million compared to $6.9 million at December 31, 2005. Impacting the increase were six large commercial credits that moved to non-accrual status during 2006. These borrowers account for $17.4 million of the increase. Management believes collateral is sufficient to offset losses in the event foreclosure or repossession would be warranted to collect these non-accrual loans. Our assessment is based on recent appraisals and/or sales agreements with respect to each of the properties. Management is continually monitoring these relationships and in the event facts and circumstances change, additional provisions may be necessary. As a result, the ratio of non-performing loans to total loans at the end of 2006 was 3.40% compared to 0.85% at end of year 2005. The Company’s ALL was 28.9% of total non-performing loans at December 31, 2006 compared to 137.6% at end of year 2005.
The following table shows, for those loans accounted for on a non-accrual basis for the years ended as indicated, the gross interest that would have been recorded if the loans had been current in accordance with their original terms and the amount of interest income that was included in interest income for the period.
Table 8: Foregone Loan Interest
| | | | | | | | | | | | |
| | | Years ended December 31, | |
| | 2006 | | | 2005 | | | 2004 | |
| | (dollars in thousands) | |
Interest income in accordance with original terms | | $ | 2,555 | | | $ | 605 | | | $ | 688 | |
Interest income recognized | | | (670 | ) | | | (300 | ) | | | (383 | ) |
| | | | | | | | | | | | |
Reduction in interest income | | $ | 1,885 | | | $ | 305 | | | $ | 305 | |
| | | | | | | | | | | | |
Other real estate owned, which represents property that we acquired through foreclosure or in satisfaction of debt, consisted of sixteen properties totaling $5.8 million at end of year 2006. This compared to seventeen properties totaling $3.3 million at end of year 2005. Management actively seeks to ensure that properties held are administered to minimize any risk of loss.
31
Activity for other real estate for 2006, 2005, and 2004, including costs of operation are shown in Table 9:
Table 9: Other Real Estate Operation Summary
| | | | | | | | | | | | |
| | | 2006 | | | 2005 | | | 2004 | |
Income from operation of ORE | | $ | 43 | | | $ | 182 | | | $ | 279 | |
Expense from operation of ORE | | $ | (421 | ) | | $ | (556 | ) | | $ | (935 | ) |
Net Gains (Losses) from sale of ORE | | $ | 2 | | | $ | (25 | ) | | $ | 57 | |
| | | | | | | | | | | | |
Cost of Operation of ORE | | $ | (376 | ) | | $ | (399 | ) | | $ | (599 | ) |
| | | | | | | | | | | | |
Investment Portfolio
The investment portfolio is intended to provide the Company with adequate liquidity, flexibility in asset/liability management and earning potential.
Table 10: Investment Portfolio
| | | | | | | | | |
| | | 2006 | | 2005 | | 2004 |
| | (dollars in thousands) |
Securities Available for Sale (AFS): | | | | | | | | | |
U.S. Treasury and other agency securities | | $ | 58,412 | | $ | 60,793 | | $ | 58,796 |
Obligations of states and political subdivisions | | | 49,695 | | | 33,689 | | | 32,417 |
Mortgage-backed securities | | | 79,655 | | | 74,544 | | | 99,964 |
Private placement | | | 999 | | | 996 | | | 994 |
Other equity securities | | | 1,487 | | | 4,421 | | | 3,442 |
| | | | | | | | | |
Total amortized cost | | $ | 190,248 | | $ | 174,443 | | $ | 195,613 |
| | | | | | | | | |
Total fair value and carrying value | | $ | 188,315 | | $ | 171,638 | | $ | 197,392 |
| | | | | | | | | |
Securities are classified as available for sale. Gains or losses on disposition are based on the net proceeds and the adjusted carrying amount of the securities sold, using the specific identification method.
Securities classified as available for sale are those securities, which we have determined might be sold to manage interest rates, or in response to changes in interest rates or other economic factors. While we have no current intention of selling those securities, they may not be held until maturity. Securities available for sale are carried at market value. Adjustments to market value at December 31, 2006 and 2005 are recorded as a separate component of equity, net of tax. Premium amortization and discount accretion are recognized as adjustments to interest income using the interest method. Realized gains or losses on disposition are based on the net proceeds and the adjusted carrying amount of the securities sold using the specific identification method.
In December 2005, our investment subsidiary sold securities with a total carrying value of $36.5 million. These were sold as a result of the flat yield curve that combined with the premium paid to obtain wholesale funding meant that we were paying more in costs to borrow money than to hold securities that had lesser yields. From a funding standpoint, it was less expensive to raise money by the sale of certain securities than to borrow funds in the wholesale market.
32
Table 11: Securities Portfolio Maturity Distribution(dollars in thousands, rates on a tax-equivalent basis)
| | | | | | | | | | | | | | | | | | | | | | | | | | | | | | |
| | | Securities AFS – maturity distribution and weighted average yield | |
| | Within one year | | | After one year But within five Years | | | After five years
But within ten years | | | After ten years | | | Total | |
| | Amount | | Yield | | | Amount | | Yield | | | Amount | | Yield | | | Amount | | Yield | | | Amount | | Yield | |
Treasury | | $ | — | | — | | | $ | — | | — | % | | $ | — | | — | | | $ | — | | — | | | $ | — | | — | |
Agencies | | | 3,938 | | 3.32 | % | | | 53,591 | | 4.31 | % | | | — | | — | | | | — | | — | | | | 57,528 | | 4.24 | % |
Mortgage-backed securities | | | 9,161 | | 3.77 | % | | | 59,362 | | 4.35 | % | | | 9,036 | | 5.42 | % | | | 666 | | 4.91 | % | | | 78,226 | | 4.41 | % |
Tax exempt obligations of states and political subdivisions | | | 2,929 | | 7.72 | % | | | 3,275 | | 6.92 | % | | | 16,772 | | 6.22 | % | | | 26,506 | | 6.13 | % | | | 49,483 | | 6.31 | % |
Taxable obligations of states and political subdivisions | | | | | | | | | 576 | | 7.50 | % | | | | | | | | | | | | | | | 576 | | 7.50 | % |
Private placement | | | — | | — | | | | — | | — | | | | — | | — | | | | 1,015 | | 8.74 | % | | | 1,015 | | 8.74 | % |
Other | | | 1,487 | | 5.66 | % | | | — | | — | | | | — | | — | | | | — | | — | | | | 1,487 | | 5.66 | % |
Total carrying value | | $ | 17,517 | | 4.49 | % | | $ | 116,804 | | 4.42 | % | | $ | 25,808 | | 5.94 | % | | $ | 28,187 | | 6.20 | % | | | 188,315 | | 4.90 | % |
| | | | | | | | | | | | | | | | | | | | | | | | | | | | | | |
At December 31, 2006 and 2005, mortgage-backed securities represented 41.5% and 42.3%, respectively of total investments based on carrying value. The fair value of mortgage-backed securities are subject to inherent risks based upon the future performance of the underlying collateral (i.e. mortgage loans) for these securities, such as prepayment risk and interest rate changes.
At December 31, 2006 and 2005, our investment portfolio did not contain, other than U.S. treasury and federal agencies, securities of any single issuer that were payable from and secured by the same source of revenue of taxing authority where the aggregate book value of such securities exceed 10% of stockholders’ equity.
Securities averaged $188.7 million in 2006 compared with $213.3 million in 2005. In 2006, taxable securities comprised approximately 78.9% of the total average investments compared to 80.4% in 2005. Tax-exempt securities on average for 2006 accounted for 21.1% of the total average investments compared to 19.6% in 2005.
Deposits
Deposits are our largest source of funds. At December 31, 2006, deposits were $878.9 million, an increase of $22.2 million or 2.6% from $856.7 million recorded at December 31, 2005. Brokered deposits decreased $51.5 million to $103.6 million at year-end 2006 from $155.1 million at year-end 2005. Average total deposits for 2006 were $863.5 million, an increase of 3.0% over 2005. The decrease in brokered time deposits occurred throughout 2006 as the determination was made that this funding source was not needed to the degree it had been in prior years. The acquisition of brokered time deposits may occur in the future as needs arise. Typically it is accomplished at funding rates that we encounter in our own market area. Management views these as a stable source of funds. If liquidity concerns arose, we believe (but cannot assure) that we have alternative sources of funds such as lines with correspondent banks and borrowing arrangements with FHLB should the need present itself. Typically, overall deposits for the first six months tend to decline slightly as a result of the seasonality of our customer base as customers draw down deposits during the first half of the year in anticipation of the summer tourist season.
33
Table 12: Average Deposits Distribution
| | | | | | | | | | | | | | | | | | |
| | | 2006 | | | 2005 | | | 2004 | |
| | | Amount | | % of Total | | | Amount | | % of Total | | | Amount | | % of Total | |
| | | (dollars in thousands) | |
| | | | | | |
Noninterest-bearing demand deposits | | $ | 94,938 | | 11 | % | | $ | 107,506 | | 13 | % | | $ | 105,134 | | 13 | % |
Interest-bearing demand deposits | | | 103,740 | | 12 | % | | | 90,782 | | 11 | % | | | 89,648 | | 11 | % |
Savings deposits | | | 263,018 | | 30 | % | | | 221,414 | | 26 | % | | | 199,942 | | 25 | % |
Other time deposits | | | 167,552 | | 20 | % | | | 178,912 | | 21 | % | | | 188,571 | | 24 | % |
Time deposits $100,000 and over (excluding brokered deposits) | | | 84,307 | | 10 | % | | | 64,180 | | 8 | % | | | 75,177 | | 10 | % |
Brokered certificates of deposit | | | 150,012 | | 17 | % | | | 175,502 | | 21 | % | | | 132,573 | | 17 | % |
| | | | | | | | | | | | | | | | | | |
Total deposits | | $ | 863,567 | | 100 | % | | $ | 838,296 | | 100 | % | | $ | 791,045 | | 100 | % |
| | | | | | | | | | | | | | | | | | |
Table 13: Maturity Distribution-Certificates of Deposit and Other Time Deposits of $100,000 or More
| | | |
December 31, 2006 |
Certificates of Deposit |
Three months or less | | $ | 34,169 |
Over three months through six months | | | 34,923 |
Over six months through twelve months | | | 59,174 |
Over twelve months | | | 66,398 |
| | | |
Total | | $ | 194,664 |
As shown in Table 12, non-interest bearing demand deposits in 2006 averaged $94.9 million, down 11.7% from $107.5 million recorded in 2005. This $12.6 million decrease is attributable to the shift from non-interest bearing to interest-bearing HPC accounts. At December 31, 2006, non-interest-bearing demand deposits were $96.9 million compared with $110.6 million at year-end 2005.
Interest bearing deposits generally consist of interest-bearing checking, savings deposits, money market accounts, individual retirement accounts (“IRAs”) and certificates of deposit (“CDs”). In 2006, interest-bearing deposits averaged $768.6 million, an increase of 5.2%. Within the category of interest bearing deposits, (including NOW accounts, savings deposits and money market accounts), these accounts increased $54.6 million or 17.5% as a result of customer preference to stay liquid in a rising interest rate environment. Also impacting the increase was a shift from demand deposits to the HPC NOW account product. This shift approximated $13 million. During the same period, time deposits, including CDs and IRAs (other than brokered time and time over $100,000) decreased in average deposits $11.4 million or 6.4%, primarily the result of a shift in customer preferences. Average time deposits over $100,000 other than brokered time deposits increased by $20.1 million or 31.4%. Time deposits greater than $100,000 and brokered time deposits were priced within the framework of our rate structure and did not materially increase the average rates on deposit liabilities. Increased competition for consumer deposits and customer awareness of interest rates continue to limit our core deposit growth in these types of deposits.
Emphasis will be placed on generating additional core deposits in 2007 through competitive pricing of deposit products and through the branch delivery systems that have already been established. We will also attempt to attract and retain core deposit accounts through new product offerings and customer service. We also may continue to increase brokered CDs during the 2007 fiscal year as an additional source of funds to provide for loan growth in the event that core deposit growth goals would not be accomplished. Under that scenario, we will continue to look at other wholesale sources of funds, if the brokered CD market became illiquid or more costly in terms of rate.
34
Other funding sources
Total other funding sources, including short-term borrowings, Federal Home Loan Bank Advances and subordinated debentures, were $135.8 million at December 31, 2006, a decrease of $6.8 million, or 4.8%, from $142.6 million at December 31, 2005. As indicated in Table 14, average 2006 short-term borrowings were $117.7 million compared to $116.4 million during 2005, for an increase of $1.3 million.
Table 14: Short-term Borrowings
| | | | | | | | | | | | |
| | | December 31, | |
| | 2006 | | | 2005 | | | 2004 | |
Federal Home Loan Bank advances: | | | | | | | | | | | | |
| | | |
Balance end of year | | $ | 115,179 | | | $ | 125,185 | | | $ | 100,192 | |
Average amounts outstanding during year | | $ | 117,702 | | | $ | 116,407 | | | $ | 95,291 | |
Maximum month-end amounts outstanding | | $ | 125,185 | | | $ | 125,188 | | | $ | 100,196 | |
Average interest rates on amounts outstanding at end of year | | | 5.23 | % | | | 4.35 | % | | | 2.88 | % |
Average interest rates on amounts outstanding during year | | | 4.88 | % | | | 3.70 | % | | | 2.41 | % |
Federal funds are purchased from money center banks and correspondent banks at prevailing overnight interest rates. Securities are sold to bank customers under repurchase agreements at prevailing market rates. Borrowings with the FHLB are secured by one to four family residential mortgages and eligible investment securities allowing us to use it for additional funding purposes. FHLB advances are included as short-term borrowings.
Long-term Debt
In connection with the issuance of Trust Preferred Securities in 2001 (see “Capital Resources”), we issued long-term subordinated debentures to Baylake Capital Trust I, Delaware Business Trust subsidiary. On March 31, 2006, we redeemed the debentures and funded the redemption through the issuance of $16.1 million of trust preferred securities and $498,000 of trust common securities under the name Baylake Capital Trust II. Subordinated debentures totaled $16.1 million at December 31, 2006 and 2005. For additional details, please make reference to the Consolidated Financial Statements and Note 10 in the accompanying footnotes.
Contractual Obligations
As of December 31, 2006, we were contractually obligated under long-term agreements as follows:
Table 15: Contractual Obligations
| | | | | | | | | | | | | | | |
| | | Payments due by period |
(dollars in thousands) | | Total | | Less than 1 year | | 1 to 3 years | | 3 to 5 years | | More than
5 years |
Certificates of deposit and other time deposit obligations | | $ | 383,570 | | $ | 275,242 | | $ | 103,057 | | $ | 5,271 | | | — |
Subordinated debentures | | $ | 16,100 | | | — | | | — | | | — | | | 16,100 |
FHLB advances | | | 115,179 | | | 75,000 | | | 40,179 | | | — | | | — |
Operating leases | | | 24 | | | 24 | | | — | | | — | | | — |
| | | | | | | | | | | | | | | |
Totals | | $ | 514,873 | | $ | 350,266 | | $ | 143,236 | | $ | 5,271 | | $ | 16,100 |
35
Further discussion of these contractual obligations is included in Note 4, “ Bank Premises and Equipment” and Note 10, “Subordinated Debentures” of the notes to consolidated financial statements.
Liquidity
Liquidity management refers to our ability to ensure that cash is available in a timely manner to meet loan demand and depositors’ needs, and to service other liabilities as they become due, without undue cost or risk, and without causing a disruption to normal operating activities. We and our subsidiary bank have different liquidity considerations.
Our primary sources of funds are dividends from our subsidiary bank, investment income, and net proceeds from borrowings and the offerings of subordinated debentures, in addition to the issuance of its common stock securities. We manage our liquidity position in order to provide funds necessary to pay dividends to our shareholders. Dividends received from our bank totaled $5.4 million in 2006 and will continue to be our main source of liquidity. The dividends from our bank were sufficient to pay cash dividends to our shareholders of $5.0 million in 2006.
Our bank meets its cash flow needs by having funding sources available to it to satisfy the credit needs of customers as well as having available funds to satisfy deposit withdrawal requests. Liquidity at our bank is derived from deposit growth, maturing loans, the maturity and marketability of the investment portfolio, access to other funding sources, marketability of certain of their assets, the ability to use its loan and investment portfolios as collateral for secured borrowings and strong capital positions.
Maturing investments have been a primary source of liquidity at our bank. Principal payments on investments totaling $20.0 million were made in 2006. $36.0 million in investments were purchased in 2006. At December 31, 2006, the carrying book value of investment securities maturing within one year amounted to $17.5 million or 9.3% of the total investment securities portfolio. This compares to a 10.1% level for investment securities with one year or less maturities as of December 31, 2005. At the end of 2006, the investment portfolio contained $135.8 million of U.S. Treasury and federal agency backed securities representing 72.1% of the total investment portfolio. These securities tend to be highly marketable and had a market value below amortized cost at end of year 2006 amounting to $2.3 million.
Deposit growth is another source of liquidity for our bank. As a financing activity reflected in the 2006 Consolidated Statements of Cash Flows, deposits provided $22.2 million in cash inflow during 2006. Our bank’s overall average deposit base grew $25.3 million or 3.0% during 2006. Deposit growth is the most stable source of liquidity for our bank, although brokered deposits are inherently less stable than locally generated core deposits. Affecting liquidity are core deposit growth levels, certificate of deposit maturity structure and retention, and characteristics and diversification of wholesale funding sources affecting the channels by which brokered deposits are acquired. Conversely, deposit outflow would require our bank to develop alternative sources of funds which may not be as liquid and, potentially, may be a more costly alternative.
Federal funds sold averaged $5.7 million in 2006 compared to $876,000 in 2005. Funds provided from the maturity of these assets typically are used as funding sources for seasonal loan growth, which typically have higher yields. Short-term and liquid by nature, federal funds sold generally provide a yield lower than other earning assets. Our bank has a strategy of maintaining a sufficient level of liquidity to accommodate fluctuations in funding sources and will at times take advantage of specific opportunities to temporarily invest excess funds at narrower than normal rate spreads while still generating additional interest revenue. At December 31, 2006, our bank did not have any federal funds sold.
The scheduled maturity of loans can provide a source of additional liquidity. Our bank has $280.9 million of loans maturing within one year, or 34.3% of total loans. Factors affecting liquidity relative to loans are loan origination volumes, loan prepayment rates and the maturity structure of existing loans. Our bank’s liquidity position is influenced by changes in interest rates, economic conditions and competition. Conversely, loan demand as a need for liquidity will cause us to acquire other sources of funding which could be harder to find and, therefore, more costly to acquire.
Within the classification of short-term borrowings at year-end 2006 and 2005, federal funds purchased and securities sold under agreements to repurchase totaled $4.5 million and $1.3 million, respectively. Federal funds are purchased from various upstream correspondent banks while securities sold under agreements to repurchase are obtained from a base of business customers. At December 31, 2006, our bank had $72.2 million available in the form of federal funds lines. FHLB Advances, short-term or long-term, are another source of funds. They totaled $115.2 million at end of year 2006. At December 31, 2006, our bank had available $3.5 million in the form of additional FHLB advances to draw on.
36
Our bank’s liquidity resources were sufficient in 2006 to fund the growth in loans and investments, increase the volume of interest earning assets and meet other cash needs when necessary.
Management expects that deposit growth will continue to be the primary funding source of our bank’s liquidity on a long-term basis, along with a stable earnings base, the resulting cash generated by operating activities, and a strong capital position. Although federal funds purchased and borrowings from the FHLB provided funds in 2006, management expects deposit growth, including brokered CD’s, to be a reliable funding source in the future as a result of branch expansion efforts and marketing efforts to attract and retain core deposits. Shorter-term liquidity needs will mainly be derived from growth in short-term borrowings, maturing federal funds sold and portfolio investments, loan maturities and access to other funding sources.
In assessing liquidity, historical information such as seasonality (loan demand’s affect on liquidity which starts before and during the tourist season and deposit draw down which affects liquidity shortly before and during the early part of the tourist season), local economic cycles and the economy in general are considered along with the current ratios, management goals and our unique characteristics. Management believes that, in the current economic environment, our liquidity position is adequate. To management’s knowledge, there are no known trends nor any known demands, commitments, events or uncertainties that will result or are reasonably likely to result in a material increase or decrease in our liquidity.
Interest Rate Sensitivity Management
Our business and the composition of our balance sheet consist of investments in interest-earning assets (primarily loans and securities) which are primarily funded by interest-bearing liabilities (deposits and borrowings). All of our financial instruments are for other than trading purposes. Such financial instruments have varying levels of sensitivity to changes in market rates of interest. Our operating income and net income depends, to a substantial extent, on “rate differentials”, i.e., the differences between the income we receive from loans, securities, and other earning assets and the interest expense we pay to obtain deposits and other liabilities. These rates are highly sensitive to many factors that are beyond our control, including general economic conditions and the policies of various governmental and regulatory authorities.
We measure our overall interest rate sensitivity through a net interest income analysis. The net interest income analysis measures the changes in net interest income in the event of hypothetical changes in interest rates. This analysis assesses the risk of changes in net interest income in the event of an immediate and sustained 100 to 200 bps increase in market interest rates or a 100 bps to 200 bps decrease in market rates. The interest rates scenarios are used for analytical purposes and do not necessarily represent management’s view of future market movements. The tables below present our projected changes in net interest income for 2006 and 2005, respectively, based on financial data at December 31, 2006 and 2005, respectively, for the various rate shock levels indicated.
Table 16: Net Interest Income Sensitivity Analysis
| | | | | | | | | | |
| | | Net Interest Income | |
Potential impact on 2007 net interest income | | Amount | | Potential Change in Net Interest Income ($) | | | Potential Change in Net Interest Income (%) | |
| | | (Dollars in thousands) | |
+ 200 bps | | $ | 34,469 | | $ | 164 | | | 0.5 | % |
+ 100 bps | | $ | 34,392 | | $ | 87 | | | 0.3 | % |
Base | | $ | 34,305 | | | — | | | — | |
- 100 bps | | $ | 33,241 | | $ | (1,064 | ) | | (3.1 | )% |
- 200 bps | | $ | 31,783 | | $ | (2,522 | ) | | (7.3 | )% |
Note: The table above may not be indicative of future results due to the high level of non-performing loans.
Based on our model at December 31, 2006, the effect on an immediate 100 bps increase in interest rates would increase our net interest income by 0.3% or approximately $87,000. The effect of an immediate 100 bps decrease in rates would decrease our net interest income by 3.1% or approximately $1.1 million.
37
| | | | | | | | | | |
| Potential impact on 2006 | | Net Interest Income | |
net interest income | | Amount | | Change ($) | | | Change (%) | |
| | | (Dollars in thousands) | |
+ 200 bps | | $ | 40,444 | | $ | 2,572 | | | 6.8 | % |
+ 100 bps | | $ | 39,714 | | $ | 1,842 | | | 4.9 | % |
Base | | $ | 37,872 | | | — | | | — | |
- 100 bps | | $ | 35,521 | | $ | (2,351 | ) | | (6.2 | )% |
- 200 bps | | $ | 32,967 | | $ | (4,905 | ) | | (13.0 | )% |
Based on our model at December 31, 2005, the effect on an immediate 100 bps increase in interest rates would increase our net interest income by 4.9% or approximately $1.8 million. The effect of an immediate 100 bps decrease in rates would decrease our net interest income by 6.2% or approximately $2.4 million.
In order to limit exposure to interest rate risk, we have developed strategies to manage our liquidity, shorten the effective maturities of certain interest-earning assets, and increase the effective maturities of certain interest-bearing liabilities. The origination of floating rate loans such as business, construction and other prime based loans is emphasized. The vast majority of fixed rate loans have re-pricing periods less than five years. The mix of floating and fixed rate assets is designed to mitigate the impact of rate changes on our net interest income. Virtually all fixed rate residential mortgage loans with maturities greater than five years are sold into the secondary market.
There can be no assurance that the results of operations would be impacted as indicated if interest rates did move by the amounts discussed above. Management continually reviews its interest risk position through the ALCO process. Management’s philosophy is to maintain relatively matched rate sensitive asset and liability positions within the range described above in order to provide earnings stability in the event of significant interest rate changes.
Capital Resources
Stockholders’ equity at December 31, 2006 increased $3.6 million or 4.7% to $82.2 million, compared with $78.5 million at the end of 2005. The increase in stockholders’ equity in 2006 was primarily composed of the retention of earnings, proceeds from the exercise of stock options, and common stock issued under the Dividend Reinvestment Plan, with offsetting decreases to stockholders’ equity from the payment of cash dividends and Treasury Stock repurchases. Additionally, other comprehensive loss improved by $557,000 during 2006 resulting in $1.2 million of accumulated other comprehensive loss at year-end. At December 31, 2005, stockholders’ equity included $1.8 million of comprehensive loss related to unrealized losses on securities. Stockholders’ equity to assets at December 31, 2006 was 7.39%, compared to 7.21% at the end of 2005.
On June 5, 2006, our Board of Directors authorized management, in its discretion, to repurchase up to 300,000 shares, representing approximately 3.8% of our common stock in a time frame not to exceed June 30, 2007. Although we may not repurchase all 300,000 shares within the allotted time period, the program will allow us to repurchase its shares as opportunities arise at prevailing market prices in open market or privately negotiated transactions. Shares repurchased are held as treasury stock and accordingly, are accounted for as a reduction of stockholders’ equity. We did not repurchase any common shares in the fourth quarter of 2006.
Under applicable regulatory guidelines, the Trust Preferred Securities qualify as Tier 1 capital up to a maximum of 25% of Tier 1 capital. Any additional portion of Trust Preferred Securities would qualify as Tier 2 capital. As of December 31, 2006, all $16.1 million of the Trust Preferred Securities qualify as Tier 1 Capital.
Cash dividends paid in 2006 were $0.64 per share compared with $0.61 in 2005. We provided a 4.9% increase in normal dividends per share in 2006 over 2005.
The adequacy of our capital is regularly reviewed to ensure that sufficient capital is available for current and future needs and is in compliance with regulatory guidelines. The assessment of overall capital adequacy depends upon a variety of factors, including asset quality, liquidity, stability of earnings, changing competitive forces, economic conditions in markets served and strength of management. Management is confident that because of current capital levels and projected earnings levels, capital levels are more than adequate to meet our ongoing and future concerns.
38
The FRB has established capital adequacy rules which take into account risks attributable to balance sheet assets and off-balance sheet activities. All banks and bank holding companies must meet a minimum total risk-based capital ratio of 8%. Of the 8% required, at least half must be comprised of core capital elements defined as Tier 1 capital. The federal banking agencies also have adopted leverage capital guidelines which banking organizations must meet. Under these guidelines, the most highly rated banking organizations must meet a leverage ratio of at least 3% Tier 1 capital to assets, while lower rated banking organizations must maintain a ratio of at least 4% to 5%. Failure to meet minimum capital requirements can initiate certain mandatory -and possible additional discretionary- actions by regulators that, if undertaken, could have a direct material effect on the consolidated financial statements.
To be “well capitalized” under the regulatory framework, the Tier 1 capital ratio must meet or exceed 6%, the total capital ratio must meet or exceed 10% and the leverage ratio must meet or exceed 5%. At December 31, 2006 and 2005, our bank was categorized as “well capitalized” under the regulatory framework for prompt corrective action. There are no conditions or events since that notification that management believes have changed our category.
Management believes that a strong capital position is necessary to take advantage of opportunities for profitable expansion of product and market share, and to provide depositor and investor confidence. Our capital level is strong, but also must be maintained at an appropriate level to provide the opportunity for an adequate return on the capital employed. Management actively reviews our capital strategies to ensure that capital levels are appropriate based on the perceived business risks, further growth opportunities, industry standards, and regulatory requirements.
Table 17: Selected Quarterly Financial Data
The following is selected financial data summarizing the results of operations for each quarter in the years ended December 31, 2006 and 2005:
| | | | | | | | | | | | |
| | | 2006 Quarter Ended |
| | March 31 | | June 30 | | September 30 | | December 31 |
| | (In thousands, except per share data) |
Interest income | | $ | 16,646 | | $ | 17,522 | | $ | 18,094 | | $ | 17,752 |
Interest expense | | | 8,768 | | | 8,835 | | | 9,288 | | | 9,487 |
| | | | | | | | | | | | |
Net interest income | | | 7,878 | | | 8,687 | | | 8,806 | | | 8,265 |
Provision for loan losses | | | 200 | | | 61 | | | 371 | | | 271 |
| | | | | | | | | | | | |
Net interest income after PLL | | | 7,678 | | | 8,626 | | | 8,435 | | | 7,994 |
Non-interest income | | | 2,238 | | | 2,481 | | | 2,477 | | | 2,541 |
Non-interest expense | | | 8,124 | | | 7,693 | | | 8,326 | | | 8,186 |
| | | | | | | | | | | | |
Income before income tax expense | | | 1,792 | | | 3,414 | | | 2,586 | | | 2,349 |
Provision for income tax | | | 468 | | | 1,044 | | | 703 | | | 550 |
| | | | | | | | | | | | |
Net income | | | 1,324 | | | 2,370 | | | 1,883 | | | 1,799 |
Basic earnings per share | | $ | 0.17 | | $ | 0.30 | | $ | 0.24 | | $ | 0.23 |
Diluted earnings per share | | | 0.17 | | | 0.30 | | | 0.24 | | | 0.23 |
39
| | | | | | | | | | | | | |
| | | 2005 Quarter Ended |
| | March 31 | | June 30 | | September 30 | | | December 31 |
| | (In thousands, except per share data) |
Interest income | | $ | 13,812 | | $ | 15,178 | | $ | 15,885 | | | $ | 16,663 |
Interest expense | | | 5,198 | | | 6,288 | | | 7,093 | | | | 8,081 |
| | | | | | | | | | | | | |
Net interest income | | | 8,614 | | | 8,890 | | | 8,792 | | | | 8,582 |
Provision for loan losses | | | 30 | | | 91 | | | 1,547 | | | | 1,549 |
| | | | | | | | | | | | | |
Net interest income after PLL | | | 8,584 | | | 8,799 | | | 7,245 | | | | 7,033 |
Non-interest income | | | 2,263 | | | 2,026 | | | 2,343 | | | | 4,965 |
Non-interest expense | | | 7,045 | | | 7,091 | | | 8,943 | | | | 7,440 |
| | | | | | | | | | | | | |
Income before income tax Expense | | | 3,802 | | | 3,734 | | | 645 | | | | 4,558 |
Provision for income tax | | | 1,218 | | | 1,174 | | | (62 | ) | | | 1,506 |
| | | | | | | | | | | | | |
Net income | | | 2,584 | | | 2,560 | | | 707 | | | | 3,052 |
Basic earnings per share | | $ | 0.34 | | $ | 0.33 | | $ | 0.09 | | | $ | 0.39 |
Diluted earnings per share | | | 0.33 | | | 0.33 | | | 0.09 | | | | 0.39 |
Recent Accounting Pronouncements
See Note 1 to the Notes to Consolidated Financial Statements titled “Effects of Newly Issued But Not Yet Effective Accounting Standards” for additional detail.
| ITEM 7A. | QUANTITATIVE AND QUALITATIVE DISCLOSURE ABOUT MARKET RISK. |
Information required by this item is set forth in Item 7 under the caption “Interest Rate Sensitivity Management” and is incorporated in this schedule by reference.
| ITEM 8. | FINANCIAL STATEMENTS AND SUPPLEMENTARY DATA |
Our Consolidated Financial Statements and notes to related statements thereto are set forth on the following pages.
40
REPORT BY BAYLAKE CORP.’S MANAGEMENT
ON INTERNAL CONTROL OVER FINANCIAL REPORTING
Our management is responsible for establishing and maintaining an effective system of internal control over financial reporting, as such term is defined in Exchange Act 13a-15(f). The Company’s system of internal control over financial reporting is designed to provide reasonable assurance regarding the reliability of financial reporting and the preparation of financial statements for external purposes in accordance with generally accepted accounting principles. There are inherent limitations in the effectiveness of any system of internal control over financial reporting, including the possibility of human error and circumvention or overriding of controls. Accordingly, even an effective system of internal control over financial reporting can provide only reasonable assurance with respect to financial statement preparation. Projections of any evaluation of effectiveness to future periods are subject to the risks that controls may become inadequate because of changes in conditions or that the degree of compliance with the policies or procedures may deteriorate.
Management assessed the Company’s systems of internal control over financial reporting as of December 31, 2006. This assessment was based on criteria for effective internal control over financial reporting described inInternal Control – Integrated Framework issued by the Committee of Sponsoring Organizations of the Treadway Commission. Based on this assessment, management believes that as of December 31, 2006, the Company maintained effective internal control over financial reporting based on those criteria.
The Company’s independent auditors have issued an audit report on management’s assessment of the Company’s internal control over financial reporting.
BAYLAKE CORP.
March 14, 2007
41
REPORT OF INDEPENDENT REGISTERED PUBLIC ACCOUNTING FIRM
Baylake Corp.
Sturgeon Bay, Wisconsin
We have audited the accompanying balance sheets of Baylake Corp. (the Company) as of December 31, 2006 and 2005, and the related statements of income, changes in stockholders’ equity and cash flows for each of the years in the three year period ended December 31, 2006. We have also audited management’s assessment, included in the accompanying Report By Baylake Corp.’s Management on Internal Control Over Financial Reporting, that the Company maintained effective internal control over financial reporting as of December 31, 2006, based on criteria established inInternal Control-Integrated Framework issued by the Committee of Sponsoring Organizations of the Treadway Commission (COSO). The Company’s management is responsible for these financial statements, for maintaining effective internal control over financial reporting and for its assessment of the effectiveness of internal control over financial reporting. Our responsibility is to express an opinion on these financial statements, an opinion on management’s assessment, and an opinion on the effectiveness of the company’s internal control over financial reporting based on our audits.
We conducted our audits in accordance with the standards of the Public Company Accounting Oversight Board (United States). Those standards require that we plan and perform the audits to obtain reasonable assurance about whether the financial statements are free of material misstatement and whether effective internal control over financial reporting was maintained in all material respects. Our audit of financial statements included examining, on a test basis, evidence supporting the amounts and disclosures in the financial statements, assessing the accounting principles used and significant estimates made by management, and evaluating the overall financial statement presentation. Our audit of internal control over financial reporting included obtaining and understanding of internal control over financial reporting, evaluating management’s assessment, testing and evaluating the design and operating effectiveness of internal control, and performing such other procedures as we considered necessary in the circumstances. We believe that our audits provide a reasonable basis for our opinions.
A company’s internal control over financial reporting is a process designed to provide reasonable assurance regarding the reliability of financial reporting and the preparation of financial statements for external purposes in accordance with generally accepted accounting principles. A company’s internal control over financial reporting includes those policies and procedures that (1) pertain to the maintenance of records that, in reasonable detail, accurately and fairly reflect the transactions and dispositions of the assets of the company; (2) provide reasonable assurance that transactions are recorded as necessary to permit preparation of financial statements in accordance with generally accepted accounting principles, and that receipts and expenditures of the company are being made only in accordance with authorizations of management and directors of the company; and (3) provide reasonable assurance regarding prevention or timely detection of unauthorized acquisition, use, or disposition of the company’s assets that could have a material effect on the financial statements.
Because of its inherent limitations, internal control over financial reporting may not prevent or detect misstatements. Also, projections of any evaluation of effectiveness to future periods are subject to the risk that controls may become inadequate because of changes in conditions, or that the degree of compliance with the policies or procedures may deteriorate.
42
In our opinion, the financial statements referred to above present fairly, in all material respects, the financial position of Baylake Corp. as of December 31, 2006 and 2005, and the results of its operations and its cash flows for each of the years in the three year period ended December 31, 2006 in conformity with accounting principles generally accepted in the United States of America. Also in our opinion, management’s assessment that the Company maintained effective internal control over financial reporting as of December 31, 2006, is fairly stated, in all material respects, based on criteria established in COSO. Furthermore, in our opinion, the Company maintained, in all material respects, effective internal control over financial reporting as of December 31, 2006, based on criteria established in COSO.
As discussed in Note 1 to the consolidated financial statements, the Company adopted Staff Accounting Bulletin No. 108, “Considering the Effects of Prior Year Misstatements when Quantifying Misstatements in the Current Year Financial Statements” and accordingly adjusted assets and liabilities at the beginning of 2006 with an offsetting adjustment to the opening balance of retained earnings.
| | |
| | | /s/ Crowe Chizek and Company LLC |
| | Crowe Chizek and Company LLC |
| |
| Oak Brook, Illinois | | |
| March 14, 2007 | | |
43
BAYLAKE CORP.
CONSOLIDATED BALANCE SHEETS
December 31, 2006 and 2005
(Dollar amounts in thousands)
| | | | | | | | |
| | | 2006 | | | 2005 | |
ASSETS | | | | | | | | |
Cash and due from financial institutions | | $ | 22,685 | | | $ | 32,855 | |
Federal funds sold | | | — | | | | 199 | |
| | | | | | | | |
Cash and cash equivalents | | | 22,685 | | | | 33,054 | |
| | |
Securities available for sale | | | 188,315 | | | | 171,638 | |
Loans held for sale | | | 889 | | | | 374 | |
Loans, net of allowance after $8,058 and $9,551 | | | 811,510 | | | | 802,745 | |
Cash value of life insurance | | | 24,239 | | | | 22,814 | |
Premises, held for sale | | | 673 | | | | 1,167 | |
Premises and equipment, net | | | 27,732 | | | | 24,703 | |
Federal Home Loan Bank stock | | | 6,792 | | | | 8,081 | |
Foreclosed assets, net | | | 5,760 | | | | 3,333 | |
Goodwill | | | 5,723 | | | | 5,723 | |
Accrued interest receivable | | | 6,183 | | | | 5,354 | |
Other assets | | | 11,183 | | | | 10,422 | |
| | | | | | | | |
Total assets | | $ | 1,111,684 | | | $ | 1,089,408 | |
| | | | | | | | |
LIABILITIES AND STOCKHOLDERS’ EQUITY | | | | | | | | |
Deposits | | | | | | | | |
Non-interest-bearing | | $ | 96,895 | | | $ | 110,641 | |
Interest-bearing | | | 782,016 | | | | 746,070 | |
Total deposits | | | 878,911 | | | | 856,711 | |
| | |
Federal Home Loan Bank advances | | | 115,179 | | | | 125,185 | |
Federal funds purchased and repurchase agreements | | | 4,480 | | | | 1,315 | |
Subordinated debentures | | | 16,100 | | | | 16,100 | |
Accrued expenses and other liabilities | | | 13,568 | | | | 10,310 | |
Dividends payable | | | 1,253 | | | | 1,243 | |
| | | | | | | | |
Total liabilities | | | 1,029,491 | | | | 1,010,864 | |
| | |
Common stock, $5 par value, authorized 50,000,000; issued- 7,922,154 shares in 2006, 7,805,586 shares in 2005; outstanding- 7,830,141 shares in 2006, 7,782,427 shares in 2005 | | | 39,611 | | | | 39,028 | |
Additional paid-in capital | | | 10,403 | | | | 9,466 | |
Retained earnings | | | 35,134 | | | | 32,461 | |
Treasury stock (92,013 shares in 2006 and 23,159 shares in 2005) | | | (1,726 | ) | | | (625 | ) |
Accumulated other comprehensive loss | | | (1,229 | ) | | | (1,786 | ) |
| | | | | | | | |
Total stockholders’ equity | | | 82,193 | | | | 78,544 | |
| | | | | | | | |
Total liabilities and stockholders’ equity | | $ | 1,111,684 | | | $ | 1,089,408 | |
| | | | | | | | |
See accompanying notes to the consolidated financial statements.
44
BAYLAKE CORP.
CONSOLIDATED STATEMENTS OF INCOME
Years ended December 31, 2006, 2005, and 2004
(Dollar amounts in thousands, except per share data)
| | | | | | | | | |
| | | 2006 | | 2005 | | 2004 |
Interest and dividend income | | | | | | | | | |
Loans, including fees | | $ | 61,556 | | $ | 52,609 | | $ | 42,254 |
Taxable securities | | | 6,382 | | | 6,932 | | | 6,594 |
Tax exempt securities | | | 1,697 | | | 1,874 | | | 1,486 |
Federal funds sold and other | | | 379 | | | 123 | | | 28 |
| | | | | | | | | |
Total interest and dividend income | | | 70,014 | | | 61,538 | | | 50,362 |
| | | |
Interest expense | | | | | | | | | |
Deposits | | | 28,486 | | | 19,382 | | | 11,968 |
Federal funds purchased and repurchase agreements | | | 442 | | | 930 | | | 401 |
Federal Home Loan Bank advances and other debt | | | 5,745 | | | 4,309 | | | 2,293 |
Subordinated debentures | | | 1,705 | | | 2,039 | | | 1,695 |
| | | | | | | | | |
Total interest expense | | | 36,378 | | | 26,660 | | | 16,357 |
| | | | | | | | | |
Net interest income | | | 33,636 | | | 34,878 | | | 34,005 |
| | | |
Provision for loan losses | | | 903 | | | 3,217 | | | 1,599 |
| | | | | | | | | |
Net interest income after provision for loan losses | | | 32,733 | | | 31,661 | | | 32,406 |
| | | |
Other income | | | | | | | | | |
Fees from fiduciary activities | | | 1,025 | | | 780 | | | 703 |
Fees from loan servicing | | | 1,092 | | | 1,131 | | | 1,079 |
Fees for other services to customers | | | 4,988 | | | 4,759 | | | 4,608 |
Gains from sales of loans | | | 825 | | | 1,013 | | | 1,372 |
Securities gains, net | | | — | | | 52 | | | — |
Net gains from sale and disposal of premises and equipment | | | 287 | | | 2,383 | | | 475 |
Increase in cash surrender value of life insurance | | | 922 | | | 784 | | | 772 |
Other income | | | 598 | | | 695 | | | 517 |
| | | | | | | | | |
Total other income | | | 9,737 | | | 11,597 | | | 9,526 |
| | | |
Noninterest expenses | | | | | | | | | |
Salaries and employee benefits | | | 19,414 | | | 16,733 | | | 15,283 |
Occupancy expense | | | 2,373 | | | 2,441 | | | 2,156 |
Equipment expense | | | 1,658 | | | 1,564 | | | 1,373 |
Data processing and courier | | | 1,269 | | | 1,163 | | | 1,125 |
Operation of other real estate | | | 376 | | | 399 | | | 599 |
Provision for impairment of standby letter of credit | | | 27 | | | 2,191 | | | — |
Loan and Collection Expense | | | 777 | | | 276 | | | 365 |
Other operating expenses | | | 6,435 | | | 5,752 | | | 5,578 |
| | | | | | | | | |
Total other expenses | | | 32,329 | | | 30,519 | | | 26,479 |
| | | | | | | | | |
Income before income tax expense | | | 10,141 | | | 12,739 | | | 15,453 |
| | | |
Income tax expense | | | 2,765 | | | 3,836 | | | 4,680 |
| | | | | | | | | |
Net income | | $ | 7,376 | | $ | 8,903 | | $ | 10,773 |
| | | | | | | | | |
Basic earnings per common share | | $ | 0.95 | | $ | 1.15 | | $ | 1.41 |
Diluted earnings per common share | | $ | 0.94 | | $ | 1.14 | | $ | 1.40 |
See accompanying notes to the consolidated financial statements.
45
BAYLAKE CORP.
CONSOLIDATED STATEMENTS OF CHANGES IN STOCKHOLDERS’ EQUITY
Years ended December 31, 2006, 2005 and 2004
(Dollar amounts in thousands, except for share data)
| | | | | | | | | | | | | | | | | | | | | | | | | |
| | | | | | | | | | | | | | | | Accumulated | | | | |
| | | | | | | | Additional | | | | | | | | Other | | | | |
| | | Common Stock | | Paid-in | | Retained | | | Treasury | | | Comprehensive | | | Total | |
| | | Shares | | | Amount | | Capital | | Earnings | | | Stock | | | Income | | | Equity | |
Balance, January 1, 2004 | | 7,604,977 | | | $ | 38,141 | | $ | 8,163 | | $ | 21,864 | | | $ | (625 | ) | | $ | 2,085 | | | $ | 69,628 | |
Net income for the year | | — | | | | — | | | — | | | 10,773 | | | | — | | | | — | | | | 10,773 | |
Net changes in unrealized gain (loss) on securities available for sale, net of $483 deferred taxes | | — | | | | — | | | — | | | — | | | | — | | | | (916 | ) | | | (916 | ) |
| | | | | | | | | | | | | | | | | | | | | | | | | |
Total comprehensive income | | | | | | | | | | | | | | | | | | | | | | | | 9,857 | |
Stock options exercised | | 87,800 | | | | 439 | | | 499 | | | — | | | | — | | | | — | | | | 938 | |
Tax benefit from exercise of stock options | | — | | | | — | | | 144 | | | — | | | | — | | | | — | | | | 144 | |
Cash dividends declared ($0.57 per share) | | — | | | | — | | | — | | | (4,362 | ) | | | — | | | | — | | | | (4,362 | ) |
| | | | | | | | | | | | | | | | | | | | | | | | | |
Balance, December 31, 2004 | | 7,692,777 | | | | 38,580 | | | 8,806 | | | 28,275 | | | | (625 | ) | | | 1,169 | | | | 76,205 | |
Net income for the year | | — | | | | — | | | — | | | 8,903 | | | | — | | | | — | | | | 8,903 | |
Net changes in unrealized gain (loss) on securities available for sale, net of $1,629 deferred taxes | | — | | | | — | | | — | | | — | | | | — | | | | (2,955 | ) | | | (2,955 | ) |
| | | | | | | | | | | | | | | | | | | | | | | | | |
Total comprehensive income | | | | | | | | | | | | | | | | | | | | | | | | 5,948 | |
Stock options exercised | | 89,650 | | | | 448 | | | 364 | | | — | | | | — | | | | — | | | | 812 | |
Tax benefit from exercise of stock options | | — | | | | — | | | 296 | | | — | | | | — | | | | — | | | | 296 | |
Cash dividends declared ($0.61 per share) | | — | | | | — | | | — | | | (4,717 | ) | | | — | | | | — | | | | (4,717 | ) |
| | | | | | | | | | | | | | | | | | | | | | | | | |
Balance, December 31, 2005 | | 7,782,427 | | | | 39,028 | | | 9,466 | | | 32,461 | | | | (625 | ) | | | (1,786 | ) | | | 78,544 | |
Prior year adjustment to recognize mortgage servicing | | | | | | | | | | | | | | | | | | | | | | | | | |
Rights understatement, net of tax of $188 (see Note 1) | | — | | | | — | | | — | | | 289 | | | | — | | | | — | | | | 289 | |
Net income for the year | | — | | | | — | | | — | | | 7,376 | | | | — | | | | — | | | | 7,376 | |
Net changes in unrealized gain (loss) on securities available for sale, net of ($315) deferred taxes | | — | | | | — | | | — | | | — | | | | — | | | | 557 | | | | 557 | |
| | | | | | | | | | | | | | | | | | | | | | | | | |
Total comprehensive income | | | | | | | | | | | | | | | | | | | | | | | | 7,933 | |
Stock compensation expense recognized, net of $19 deferred taxes | | — | | | | — | | | 48 | | | — | | | | — | | | | — | | | | 48 | |
Stock options exercised | | 99,544 | | | | 498 | | | 434 | | | — | | | | — | | | | — | | | | 932 | |
Common stock issued under Dividend Reinvestment Plan | | 17,024 | | | | 85 | | | 183 | | | — | | | | — | | | | — | | | | 268 | |
Treasury stock repurchases | | (68,854 | ) | | | — | | | — | | | — | | | | (1,101 | ) | | | — | | | | (1,101 | ) |
Tax benefit from exercise of stock options | | — | | | | — | | | 272 | | | — | | | | — | | | | — | | | | 272 | |
| | | | | | | |
Cash dividends declared ($0.64 per share) | | — | | | | — | | | — | | | (4,992 | ) | | | — | | | | — | | | | (4,992 | ) |
| | | | | | | | | | | | | | | | | | | | | | | | | |
Balance, December 31, 2006 | | 7,830,141 | | | $ | 39,611 | | $ | 10,403 | | $ | 35,134 | | | $ | (1,726 | ) | | $ | (1,229 | ) | | $ | 82,193 | |
| | | | | | | | | | | | | | | | | | | | | | | | | |
See accompanying notes to the consolidated financial statements
46
BAYLAKE CORP.
CONSOLIDATED STATEMENTS OF CASH FLOWS
Years ended December 31, 2006, 2005, and 2004
(Dollar amounts in thousands)
| | | | | | | | | | | | |
| | | 2006 | | | 2005 | | | 2004 | |
Cash flows from operating activities: | | | | | | | | | | | | |
Reconciliation of net income to net cash provided by operating activities: | | | | | | | | | | | | |
Net income | | $ | 7,376 | | | $ | 8,903 | | | $ | 10,773 | |
Adjustments to reconcile net income to net cash provided to operating activities: | | | | | | | | | | | | |
Depreciation and amortization | | | 1,609 | | | | 1,585 | | | | 1,482 | |
Amortization of debt issuance costs | | | 475 | | | | 429 | | | | 85 | |
Amortization of core deposit intangible | | | 52 | | | | 52 | | | | 49 | |
Provision for losses on loans | | | 903 | | | | 3,217 | | | | 1,599 | |
Provision for impairment of letter of credit | | | 27 | | | | 2,191 | | | | — | |
Net amortization of securities | | | 125 | | | | 578 | | | | 567 | |
Increase in cash surrender value of life insurance | | | (922 | ) | | | (784 | ) | | | (772 | ) |
Federal Home Loan Bank stock dividend | | | — | | | | (384 | ) | | | (450 | ) |
Net realized gain on sale of securities | | | — | | | | (52 | ) | | | — | |
Net gain on sale of loans | | | (825 | ) | | | (1,013 | ) | | | (1,372 | ) |
Proceeds from sale of loans held for sale | | | 41,483 | | | | 50,333 | | | | 63,204 | |
Origination of loans held for sale | | | (41,175 | ) | | | (48,345 | ) | | | (63,410 | ) |
Provision for valuation allowance on other real estate owned | | | 90 | | | | 186 | | | | 196 | |
Net gain from sale and disposal of premises and equipment | | | (287 | ) | | | (2,383 | ) | | | (475 | ) |
Net gain from disposal of other real estate owned | | | (76 | ) | | | 25 | | | | (173 | ) |
Provision for deferred tax expense | | | (840 | ) | | | 910 | | | | 119 | |
Stock option compensation expense recognized | | | 48 | | | | — | | | | — | |
Changes in assets and liabilities: | | | | | | | | | | | | |
Accrued interest receivable and other assets | | | (834 | ) | | | (892 | ) | | | 532 | |
Accrued expenses and other liabilities | | | 3,258 | | | | 1,021 | | | | 2,117 | |
| | | | | | | | | | | | |
Net cash provided by operating activities | | | 10,487 | | | | 15,577 | | | | 14,071 | |
| | | |
Cash flows from investing activities: | | | | | | | | | | | | |
Proceeds from sale of securities available-for-sale | | | — | | | | 36,516 | | | | — | |
Principal payments on securities available-for-sale | | | 20,029 | | | | 20,228 | | | | 16,859 | |
Purchase of securities available-for-sale | | | (35,959 | ) | | | (36,101 | ) | | | (39,402 | ) |
Proceeds from sale of other real estate owned | | | 3,958 | | | | 1,280 | | | | 2,992 | |
Cash paid in completion of acquisition | | | — | | | | — | | | | (754 | ) |
Proceeds from sale of premises and equipment | | | 690 | | | | 5,428 | | | | 774 | |
Loan originations and payments, net | | | (16,067 | ) | | | (63,232 | ) | | | (48,884 | ) |
Proceeds from redemption of FHLB Stock | | | 1,289 | | | | — | | | | — | |
Additions to premises and equipment | | | (5,041 | ) | | | (5,723 | ) | | | (4,600 | ) |
Investment in bank-owned life insurance | | | (503 | ) | | | (469 | ) | | | — | |
| | | | | | | | | | | | |
Net cash used in investing activities | | | (31,604 | ) | | | (42,073 | ) | | | (73,015 | ) |
See accompanying notes to the consolidated financial statements.
47
BAYLAKE CORP.
CONSOLIDATED STATEMENTS OF CASH FLOWS
Years ended December 31, 2006, 2005, and 2004
(Dollar amounts in thousands)
| | | | | | | | | | | | |
| | | 2006 | | | 2005 | | | 2004 | |
Cash flows from financing activities: | | | | | | | | | | | | |
Net change in deposits | | $ | 22,200 | | | $ | 12,170 | | | $ | 61,249 | |
Net change in federal funds purchased and repurchase agreements | | | 3,165 | | | | 31 | | | | (22,075 | ) |
Proceeds from Federal Home Loan Bank advances | | | 100,000 | | | | 100,000 | | | | 125,105 | |
Repayments on Federal Home Loan Bank advances | | | (110,006 | ) | | | (75,007 | ) | | | (100,005 | ) |
Payments on other borrowings and long-term debt | | | — | | | | — | | | | (53 | ) |
Redemption of subordinated debt | | | (16,100 | ) | | | — | | | | — | |
Proceeds from issuance of subordinated debt | | | 16,100 | | | | — | | | | — | |
Proceeds from exercise of stock options | | | 932 | | | | 812 | | | | 938 | |
Tax benefit from exercise of options | | | 272 | | | | — | | | | — | |
Treasury stock repurchases | | | (1,101 | ) | | | — | | | | — | |
Dividend reinvestment plan | | | 268 | | | | — | | | | — | |
Cash dividends paid | | | (4,982 | ) | | | (4,628 | ) | | | (4,269 | ) |
| | | | | | | | | | | | |
Net cash provided by financing activities | | | 10,748 | | | | 33,378 | | | | 60,890 | |
| | | | | | | | | | | | |
Net change in cash and cash equivalents | | | (10,369 | ) | | | 6,882 | | | | 1,946 | |
| | | |
Beginning cash and cash equivalents | | | 33,054 | | | | 26,172 | | | | 24,226 | |
| | | | | | | | | | | | |
Ending cash and cash equivalents | | $ | 22,685 | | | $ | 33,054 | | | $ | 26,172 | |
| | | | | | | | | | | | |
Supplemental cash flow information: | | | | | | | | | | | | |
Interest paid | | $ | 35,926 | | | $ | 25,186 | | | $ | 16,078 | |
Income taxes paid | | | 2,345 | | | | 3,257 | | | | 3,405 | |
| | | |
Supplemental noncash disclosures: | | | | | | | | | | | | |
Transfers from loans to other real estate owned | | | 6,399 | | | | 2,252 | | | | 3,316 | |
See accompanying notes to the consolidated financial statements.
48
BAYLAKE CORP.
NOTES TO CONSOLIDATED FINANCIAL STATEMENTS
December 31, 2006, 2005 and 2004
(Dollar amounts in thousands, except share and per share data)
NOTE 1 – NATURE OF BUSINESS AND SUMMARY OF SIGNIFICANT ACCOUNTING POLICIES
The consolidated financial statements of Baylake Corp. (the Company) include the accounts of the Company, its wholly owned subsidiary Baylake Bank, (the Bank), and the Bank’s wholly owned subsidiaries: Baylake Investments, Inc., Baylake Insurance Agency, Inc., and Baylake City Center. All significant intercompany items and transactions have been eliminated.
The Bank owns a 49% interest in United Financial Services, Inc., (UFS) a data processing service. In addition to the ownership interest, UFS and the Company have a common member on each respective Board of Directors. The investment in this entity is carried under the equity method of accounting, and the pro rata share of its income is included in other income. On June 27, 2006, UFS amended an earlier agreement for employment with a key employee of UFS allowing that individual the option to purchase up to 20%, or 240 shares, of the authorized shares of UFS. The option price is $1,000 per share less-dividends or distributions to owners. The current book value of UFS is approximately $6,800 per share. The exercise of all or a portion of the options will have an effect of reducing the Company’s share of the future earnings. There will not be a material impact to the carrying value of the asset on Baylake’s Balance Sheet. Subsequent to year-end 120 shares were exercised by the key employee. Income recognized by the Company was $512, $392, and $387 for 2006, 2005, and 2004, respectively. Amounts paid to UFS for data processing services for Baylake Bank were $1,157, $1,043, and $992, in 2006, 2005, and 2004, respectively.
Baylake Bank makes commercial, mortgage, and installment loans to customers substantially all of whom are located in Door, Brown, Kewaunee, Manitowoc, Waushara, Outagamie, Green Lake, and Waupaca Counties of Wisconsin. Although Baylake Bank has a diversified portfolio, a substantial portion of its debtors’ ability to honor their contracts is dependent upon the economic condition of the local industrial businesses, as well as commercial, agricultural and tourism industries.
Use of Estimates: To prepare financial statements in conformity with U.S. generally accepted accounting principles, management makes estimates and assumptions based on available information. These estimates and assumptions affect the amounts reported in the financial statements and the disclosures provided, and actual results could differ. The allowance for loan losses, provision for letter of credit impairment loss, foreclosed assets, income tax expense, and fair values of financial instruments are particularly subject to change.
Cash Flows: Cash and cash equivalents includes cash, deposits with other financial institutions, and federal funds sold. Net cash flows are reported for customer loan and deposit transactions, and federal funds purchased and repurchase agreements.
49
BAYLAKE CORP.
NOTES TO CONSOLIDATED FINANCIAL STATEMENTS
December 31, 2006, 2005 and 2004
(Dollar amounts in thousands, except share and per share data)
NOTE 1 �� NATURE OF BUSINESS AND SUMMARY OF SIGNIFICANT ACCOUNTING POLICIES(Continued)
Securities: Debt securities are classified as available for sale when they might be sold before maturity. Equity securities with readily determinable fair values are classified as available for sale. Securities available for sale are carried at fair value, with unrealized holding gains and losses reported in other comprehensive income, net of tax.
Interest income includes amortization of purchase premium or discount. Premiums and discounts on securities are amortized on the level-yield method without anticipating prepayments. Gains and losses on sales are recorded on the trade date and determined using the specific identification method.
Declines in the fair value of securities below their cost that are other than temporary are reflected as realized losses. In estimating other-than-temporary losses, management considers: (1) the length of time and extent that fair value has been less than cost, (2) the financial condition and near-term prospects of the issuer, and (3) the Company’s ability and intent to hold the security for a period sufficient to allow for any anticipated recovery in fair value.
Federal Home Loan Bank (FHLB) stock: The Bank is a member of the FHLB system. Members are required to own a certain amount of stock based on the level of borrowings and other factors, and may invest in additional amounts. FHLB stock is carried at cost, classified as a restricted security, and periodically evaluated for impairment based on ultimate recovery of par value. Both cash and stock dividends are reported as income.
Loans Held for Sale: Mortgage loans originated and intended for sale in the secondary market are carried at the lower of aggregate cost or market, as determined by outstanding commitments from investors. Net unrealized losses, if any, are recorded as a valuation allowance and charged to earnings.
Mortgage loans held for sale may be sold with servicing rights retained. The carrying value of mortgage loans sold is reduced by the cost allocated to the servicing right. Gains and losses on sales of mortgage loans are based on the difference between the selling price and the carrying value of the related loan sold.
Loans: Loans that management has the intent and ability to hold for the foreseeable future or until maturity or payoff are reported at the principal balance outstanding, net of unearned interest, deferred loan fees and costs, and an allowance for loan losses. Interest income is accrued on the unpaid principal balance. Loan origination fees, net of certain direct origination costs, are deferred and recognized in interest income using the level-yield method without anticipating prepayments.
50
BAYLAKE CORP.
NOTES TO CONSOLIDATED FINANCIAL STATEMENTS
December 31, 2006, 2005 and 2004
(Dollar amounts in thousands, except share and per share data)
NOTE 1 – NATURE OF BUSINESS AND SUMMARY OF SIGNIFICANT ACCOUNTING POLICIES(Continued)
Interest income on mortgage and commercial loans is discontinued at the time the loan is 90 days delinquent. Past due status is based on the contractual terms of the loan. In all cases, loans are placed on nonaccrual or charged off at an earlier date if collection of principal or interest is considered doubtful.
All interest accrued but not received for loans placed on nonaccrual is reversed against interest income. Interest received on such loans is accounted for on the cash-basis or cost-recovery method, until qualifying for return to accrual. Loans are returned to accrual status when all the principal and interest amounts contractually due are brought current and future payments are reasonably assured.
Allowance for Loan Losses: The allowance for loan losses is a valuation allowance for probable incurred credit losses. Loan losses are charged against the allowance when management believes the uncollectibility of a loan balance is confirmed. Subsequent recoveries, if any, are credited to the allowance. Management estimates the allowance balance required using past loan loss experience, the nature and volume of the portfolio, information about specific borrower situations and estimated collateral values, economic conditions, and other factors. Allocations of the allowance may be made for specific loans, but the entire allowance is available for any loan that, in management’s judgment, should be charged-off.
The allowance consists of specific and general components. The specific component relates to loans that are individually classified as impaired or loans otherwise classified as substandard or doubtful. The general component covers non-classified loans and is based on historical loss experience adjusted for current factors.
A loan is impaired when full payment under the loan terms is not expected. Commercial and commercial real estate loans are individually evaluated for impairment. If a loan is impaired, a portion of the allowance is allocated so that the loan is reported, net, at the present value of estimated future cash flows using the loan’s existing rate or at the fair value of collateral if repayment is expected solely from the collateral. Large groups of smaller balance homogeneous loans, such as consumer and residential real estate loans, are collectively evaluated for impairment, and accordingly, they are not separately identified for impairment disclosures.
51
BAYLAKE CORP.
NOTES TO CONSOLIDATED FINANCIAL STATEMENTS
December 31, 2006, 2005 and 2004
(Dollar amounts in thousands, except share and per share data)
NOTE 1 – NATURE OF BUSINESS AND SUMMARY OF SIGNIFICANT ACCOUNTING POLICIES(Continued)
Servicing Rights: Servicing rights represent the allocated value of retained servicing rights on loans sold. Servicing assets are expensed in proportion to, and over the period of, estimated net servicing revenues. Impairment is evaluated based on the fair value of the assets, using groupings of the underlying loans as to interest rates and then, secondarily, as to loan type and investor. Fair value is determined using prices for similar assets with similar characteristics, when available, or based upon discounted cash flows using market-based assumptions. Any impairment of a grouping is reported as a valuation allowance, to the extent that fair value is less than the capitalized amount for a grouping.
Servicing fee income is recorded for fees earned for servicing loans. The fees are based on a contractual percentage of the outstanding principal and are recorded as income when earned.
Loan servicing rights are carried in other assets on the balance sheet and amount to $1,655 and $1,211 on loans serviced for others totaling $133,820 and $145,763 in 2006 and 2005, respectively. Servicing rights capitalized totaled $180, $281, and $394, during 2006, 2005, and 2004, respectively. Amortization of servicing rights, which is included in other expense, totaled $357, $257, and $273 during 2006, 2005, and 2004, respectively.
Cash Value of Life Insurance: Life insurance is carried at the cash surrender value of the underlying policies. Certain policies owned by the Company include provisions which could reduce the amount of cash surrender value the Company could realize. At December 31, 2006 and 2005, $419 and $492, respectively, of the cash surrender value of the life insurance policies would not be realizable by the Company if the Company did not transact a full and complete surrender for the policies and (1) conducts an IRC 1035 exchange, (2) does not surrender all other Bank-owned life insurance simultaneously, (3) does not maintain a well-capitalized status, and (4) undergoes a change of control within 30 months prior to the date of such surrender. Refer to page 59 of these financial statements for further discussion of the impact of adopting EITF 06-5.
Transfers of Financial Assets: Transfers of financial assets are accounted for as sales when control over the assets has been surrendered. Control over transferred assets is deemed to be surrendered when (1) the assets have been isolated from the Company, (2) the transferee obtains the right (free of conditions that constrain it from taking advantage of that right) to pledge or exchange the transferred assets, and (3) the Company does not maintain effective control over the transferred assets through an agreement to repurchase them before their maturity.
Foreclosed Assets: Assets acquired through or instead of loan foreclosure are initially recorded at fair value when acquired, less estimated costs to sell, establishing a new cost basis. If fair value declines subsequent to foreclosure, a valuation allowance is recorded through expense. Costs after acquisition are expensed.
52
BAYLAKE CORP.
NOTES TO CONSOLIDATED FINANCIAL STATEMENTS
December 31, 2006, 2005 and 2004
(Dollar amounts in thousands, except share and per share data)
NOTE 1 – NATURE OF BUSINESS AND SUMMARY OF SIGNIFICANT ACCOUNTING POLICIES(Continued)
Premises, held for sale: Consists of development property in the Green Bay area. Property held for sale is carried at the lower of cost or fair value.
Premises and Equipment: Land is carried at cost. Premises and equipment are stated at cost less accumulated depreciation. Buildings and related components are depreciated using the straight-line method with useful lives ranging from 5 to 40 years.Furniture, fixtures, and equipment are depreciated using the straight-line (or accelerated) method with useful lives ranging from 3 to 12 years.
Goodwill and Other Intangible Assets: Goodwill results from business acquisitions and represents the excess of the purchase price over the fair value of acquired tangible assets and liabilities and identifiable intangible assets. Goodwill is assessed at least annually for impairment, and any such impairment will be recognized in the period identified.
Other intangible assets consist of core deposit intangible assets arising from a branch acquisition. They are initially measured at fair value and then are amortized over their estimated useful lives, which was determined to be seven years. The balance of the core deposit intangible, which is included in other assets in the consolidated balance sheet was $202 and $254 at December 31, 2006 and 2005, respectively. Scheduled amortization expense related to the core deposit intangible is $52 for each of the next three years and $46 in the fourth year.
Long-Term Assets:Premises and equipment, core deposit and other intangible assets, and other long-term assets are reviewed for impairment when events indicate that their carrying amount may not be recoverable from future undiscounted cash flows. If impaired, the assets are recorded at fair value.
Loan Commitments and Related Financial Instruments: Financial instruments include off-balance-sheet credit instruments, such as commitments to make loans and commercial letters of credit, issued to meet customer financing needs. The face amount for these items represents the exposure to loss, before considering customer collateral or ability to repay. Such financial instruments are recorded when they are funded. Instruments, such as standby letters of credit, that are considered financial guarantees in accordance with FASB Interpretation No. 45 are recorded at fair value.
Trust Fee Income: The Company provides trust services to customers and in return charges fees using terms customary in its industry, including charging fees based on the agreed-upon percentages of assets managed or as otherwise specified in the underlying agreements. Income from trust services is recognized when the services are provided.
53
BAYLAKE CORP.
NOTES TO CONSOLIDATED FINANCIAL STATEMENTS
December 31, 2006, 2005 and 2004
(Dollar amounts in thousands, except share and per share data)
NOTE 1 – NATURE OF BUSINESS AND SUMMARY OF SIGNIFICANT ACCOUNTING POLICIES(Continued)
Advertising Expense: The Company expenses all advertising costs as they are incurred. Total advertising costs for the years ended December 31, 2006, 2005, and 2004 were $273, $351, and $310, respectively.
Stock Based Compensation: Effective January 1, 2006, the Company adopted Statement of Financial Accounting Standards (“SFAS”) No. 123(R),share-based Payment, using the modified prospective transition method. Accordingly, the Company has recorded stock-based employee compensation cost using the fair value method starting in 2006. For 2006, adopting this standard resulted in a reduction of income before income taxes of $67, and a reduction in net income of $48, and a decrease in basic earnings per share of $.01.
Prior to January 1, 2006 employee compensation expense under stock options was reported using the intrinsic value method; therefore, no stock-based compensation cost is reflected in net income for the years ending December 31, 2005 and 2004, as all options granted had an exercise price equal to or greater than the market price of the underlying common stock at date of grant.
The following table illustrates the effect on net income and earnings per share if expense was measured using the fair value recognition provisions of Financial Accounting Standards Board (“FASB”) Statement No. 123,Accounting for Stock-BasedCompensation, for the years ending December 31.
| | | | | | |
| | | 2005 | | 2004 |
Net income as reported | | $ | 8,903 | | $ | 10,773 |
Deduct: Stock-based compensation expense | | | | | | |
Determined under fair value based method | | | 57 | | | 110 |
| | | | | | |
Pro forma net income | | | 8,846 | | | 10,663 |
| | | | | | |
Basic earnings per common share as reported | | $ | 1.15 | | $ | 1.41 |
Pro forma basic earnings per share | | | 1.14 | | | 1.39 |
| | |
Diluted earnings per share as reported | | $ | 1.14 | | $ | 1.40 |
Pro forma diluted earnings per share | | | 1.13 | | | 1.38 |
Income Taxes: Income tax expense is the total of the current year income tax due or refundable and the change in deferred tax assets and liabilities. Deferred tax assets and liabilities are the expected future tax amounts for the temporary differences between carrying amounts and tax basis of assets and liabilities, computed using enacted tax rates. A valuation allowance, if needed, reduces deferred tax assets to the amount expected to be realized.
54
BAYLAKE CORP.
NOTES TO CONSOLIDATED FINANCIAL STATEMENTS
December 31, 2006, 2005 and 2004
(Dollar amounts in thousands, except share and per share data)
NOTE 1 – NATURE OF BUSINESS AND SUMMARY OF SIGNIFICANT ACCOUNTING POLICIES(Continued)
Earnings Per Common Share: Basic earnings per common share is net income divided by the weighted average number of common shares outstanding during the period. Diluted earnings per common share include the dilutive effect of additional potential common shares issuable under stock options.
Comprehensive Income: Comprehensive income consists of net income and other comprehensive income. Other comprehensive income includes unrealized gains and losses on securities available for sale, which are also recognized as separate components of equity.
Adoption of New Accounting Standards: In September 2006, the Securities and Exchange Commission (SEC) released Staff Accounting Bulletin No. 108, Considering the Effects of Prior Year Misstatements when Quantifying Misstatements in Current Year Financial Statements (SAB 108), which is effective for fiscal years ending on or after November 15, 2006. SAB 108 provides guidance on how the effects of prior-year uncorrected financial statement misstatements should be considered in quantifying a current year misstatement. SAB 108 requires public companies to quantify misstatements using both an income statement (rollover) and balance sheet (iron curtain) approach and evaluate whether either approach results in a misstatement that, when all relevant quantitative and qualitative factors are considered, is material. If prior year errors that had been previously considered immaterial now are considered material based on either approach, no restatement is required so long as management properly applied its previous approach and all relevant facts and circumstances were considered. Adjustments considered immaterial in prior years under the method previously used, but now considered material under the dual approach required by SAB 108, are to be recorded upon initial adoption of SAB 108. The amount so recorded is shown as a cumulative effect adjustment and is recorded in opening retained earnings as of January 1, 2006. Included in this cumulative effect adjustment is the following item:
The Company recorded mortgage servicing rights of $477 at January 1, 2006. Had the Company recorded these in the previous year in accordance with Statement of Financial Accounting Standards No. 140, the impact on 2005 and 2004 earnings would have been an increase of $33 and $42, net of tax expense. This misstatement has arisen over the course of the period since inception of the original standard governing servicing rights, (SFAS 125) in 1995. The financial statement impact in any single year was considered immaterial by management of the Company.
Effect of Newly Issued But Not Yet Effective Accounting Standards: In March 2006, the FASB issued Statement No. 156, Accounting for Servicing of Financial Assets-an amendment of FASB Statement No. 140. This Statement provides the following: 1) revised guidance on when a servicing asset and servicing liability should be recognized; 2) requires all separately recognized servicing assets and servicing liabilities to be initially measured at fair value, if practicable; 3) permits an entity to elect to measure servicing assets and servicing liabilities at fair value each reporting date and report changes in fair value in earnings in the period in which the changes occur; 4) upon initial adoption, permits a onetime reclassification of available-for-sale securities to trading
55
BAYLAKE CORP.
NOTES TO CONSOLIDATED FINANCIAL STATEMENTS
December 31, 2006, 2005 and 2004
(Dollar amounts in thousands, except share and per share data)
NOTE 1 – NATURE OF BUSINESS AND SUMMARY OF SIGNIFICANT ACCOUNTING POLICIES(Continued)
securities for securities which are identified as offsetting the entity’s exposure to changes in the fair value of servicing assets or liabilities that a servicer elects to subsequently measure at fair value; and 5) requires separate presentation of servicing assets and servicing liabilities subsequently measured at fair value in the statement of financial position and additional footnote disclosures. This standard is effective as of the beginning of an entity’s first fiscal year that begins after September 15, 2006 with the effects of initial adoption being reported as a cumulative-effect adjustment to retained earnings. Management does not expect the adoption of this statement will have a material impact on its consolidated financial position or results of operations.
In September 2006, the FASB issued Statement No. 157,Fair Value Measurements.This Statement defines fair value, establishes a framework for measuring fair value and expands disclosures about fair value measurements. This Statement establishes a fair value hierarchy about the assumptions used to measure fair value and clarifies assumptions about risk and the effect of restriction on the sale or use of an asset. The standard is effective for fiscal years beginning after November 15, 2007. The Company has not completed its evaluation of the impact of the adoption of this standard.
In July 2006, the FASB issued FASB Interpretation No. 48,Accounting for Uncertainty in Income Taxes – an interpretation of FASB Statement No. 109 (FIN 48), which prescribes a recognition threshold and measurement attribute for a tax position taken or expected to be taken in a tax return. FIN 48 also provides guidance on derecognition, classification, interest and penalties, accounting in interim periods, disclosure and transition. FIN 48 is effective for fiscal years beginning after December 15, 2006. The Company has determined that the adoption of FIN 48 will not have a material effect on the financial statements.
In September 2006, the FASB Emerging Issues Task Force finalized Issue No. 06-4,Accounting for Deferred Compensation and Postretirement Benefit Aspects of Endorsement Split-Dollar Life Insurance Arrangements.This issue requires that a liability be recorded during the service period when a split-dollar life insurance agreement continues after participants’ employment or retirement. The required accrued liability will be based on either the post–employment benefit cost for the continuing life insurance or based on the future death benefit depending on the contractual terms of the underlying agreement. This issue is effective for fiscal years beginning after December 15, 2007. The Company has not completed its evaluation of the impact of adoption of EITF 06-4.
In September 2006, the FASB Emerging Issues Task Force finalized Issue No. 06-5,Accounting for Purchases of Life Insurance – Determining the Amount That Could Be Realized in Accordance with FASB Technical Bulletin No. 85-4 (Accounting for Purchases of Life Insurance).This issue requires that a policyholder consider contractual terms of a life insurance policy in determining the amount that could be realized under the insurance contract. It also requires that if the contract provides for a greater surrender value if all
56
BAYLAKE CORP.
NOTES TO CONSOLIDATED FINANCIAL STATEMENTS
December 31, 2006, 2005 and 2004
(Dollar amounts in thousands, except share and per share data)
NOTE 1 – NATURE OF BUSINESS AND SUMMARY OF SIGNIFICANT ACCOUNTING POLICIES(Continued)
individual policies in a group are surrendered at the same time, that the surrender value be determined based on the assumption that policies will be surrendered on an individual basis. Lastly, the issue discusses whether the cash surrender value should be discounted when the policyholder is contractually limited in its ability to surrender a policy. This issue is effective for fiscal years beginning after December 15, 2006. The Company has not completed its evaluation of the impact of the adoption of this standard but expects the maximum exposure to be a reduction in the currently recognized cash surrender value of approximately $419.
Loss Contingencies: Loss contingencies, including claims and legal actions arising in the ordinary course of business, are recorded as liabilities when the likelihood of loss is probable and an amount or range of loss can be reasonably estimated.
Restrictions on Cash: Cash on hand or on deposit with the Federal Reserve Bank of $6,916 and $6,475 was required to meet regulatory reserve and clearing requirements at year-end 2006 and 2005. These balances do not earn interest.
Fair Value of Financial Instruments: Fair values of financial instruments are estimated using relevant market information and other assumptions, as more fully disclosed in a separate note. Fair value estimates involve uncertainties and matters of significant judgment regarding interest rates, credit risk, prepayments, and other factors, especially in the absence of broad markets for particular items. Changes in assumptions or in market conditions could significantly affect the estimates.
Dividend Reinvestment Plan: The Company administers a dividend reinvestment plan (DRIP), whereby, the Company allocates applicable dividends to acquire, on the participant’s behalf, shares of Baylake common stock. In September of 2006, the Company began issuing additional shares for the DRIP. Shares issued in 2006 were 17,024. Prior to September, shares were acquired through the open market.
Operating Segments: While the chief decision makers monitor the revenue streams of the various products and services, the identifiable segments are not material and operations are managed and financial performance is evaluated on a Company-wide basis. Accordingly, all of the financial service operations are considered by management to be aggregated in one reportable operating segment.
Reclassifications: Some items in the prior year financial statements were reclassified to confirm to the current presentation.
57
BAYLAKE CORP.
NOTES TO CONSOLIDATED FINANCIAL STATEMENTS
December 31, 2006, 2005 and 2004
(Dollar amounts in thousands, except share and per share data)
NOTE 2 – SECURITIES
The fair value of securities available for sale and the related unrealized gains and losses as of December 31, 2006 and 2005 are as follows:
| | | | | | | | | | |
| | | 2006 | |
| | Fair Value | | Gross
Unrealized
Gains | | Gross
Unrealized
Losses | |
U.S. Treasury and other U.S. government agencies | | $ | 57,528 | | $ | 69 | | $ | (953 | ) |
Obligations of states and political subdivisions | | | 50,059 | | | 512 | | | (148 | ) |
Mortgage-backed securities | | | 78,226 | | | 154 | | | (1,583 | ) |
Private placement | | | 1,015 | | | 16 | | | — | |
Other equity securities | | | 1,487 | | | — | | | — | |
| | | | | | | | | | |
| | $ | 188,315 | | $ | 751 | | $ | (2,684 | ) |
| | | | | | | | | | |
| |
| | | 2005 | |
| | Fair Value | | Gross
Unrealized
Gains | | Gross
Unrealized
Losses | |
U.S. Treasury and other U.S. government agencies | | $ | 59,819 | | $ | 179 | | $ | (1,153 | ) |
Obligations of states and political subdivisions | | | 33,827 | | | 407 | | | (269 | ) |
Mortgage-backed securities | | | 72,531 | | | 2 | | | (2,015 | ) |
Private placements | | | 1,040 | | | 44 | | | — | |
Other equity securities | | | 4,421 | | | — | | | — | |
| | | | | | | | | | |
| | $ | 171,638 | | $ | 632 | | $ | (3,437 | ) |
| | | | | | | | | | |
Other equity securities consist of short-term money market mutual funds and equity securities in the Federal Reserve Bank and other nonmarketable equity securities, which are carried at cost.
A summary of sales of securities available for sale were as follows:
| | | | | | | | | |
| | | 2006 | | 2005 | | 2004 |
Proceeds | | $ | — | | $ | 36,516 | | $ | — |
Gross realized gains | | | — | | | 465 | | | — |
Gross realized losses | | | — | | | 413 | | | — |
58
BAYLAKE CORP.
NOTES TO CONSOLIDATED FINANCIAL STATEMENTS
December 31, 2006, 2005 and 2004
(Dollar amounts in thousands, except share and per share data)
NOTE 2 – SECURITIES (Continued)
The estimated market value of investments at December 31, 2006, by contractual maturity, is shown below. Expected maturities will differ from contractual maturities because borrowers may have the right to call or prepay obligations with or without call or prepayment penalties.
| | | |
| | | Estimated Market Value |
Due in one year or less | | $ | 6,867 |
Due after one year through five years | | | 57,442 |
Due after five years through ten years | | | 16,772 |
Due after ten years | | | 27,521 |
| | | |
| | | 108,602 |
Other equity securities | | | 1,487 |
Mortgage-backed securities | | | 78,226 |
| | | |
| | $ | 188,315 |
| | | |
Securities pledged to secure public deposits and borrowed funds had a carrying value of $124,469 and $131,511 at December 31, 2006 and 2005, respectively.
Securities with unrealized losses at year-end 2006 and 2005, aggregated by investment category and length of time that individual securities have been in a continuous unrealized loss position, are as follows:
| | | | | | | | | | | | | | | | | | | | | |
Description of Securities | | Less than 12 Months | | | 12 Months or More | | | Total | |
| | Fair
Value | | Unrealized
Loss | | | Fair
Value | | Unrealized
Loss | | | Fair
Value | | Unrealized
Loss | |
| 2006 | | | | | | | | | | | | | | | | | | | | | |
U.S. Treasury and other U.S. government agencies | | $ | 6,011 | | $ | (19 | ) | | $ | 44,721 | | $ | (934 | ) | | $ | 50,732 | | $ | (953 | ) |
Mortgage-backed securities | | | 25 | | | — | | | | 67,857 | | | (1,583 | ) | | | 67,882 | | | (1,583 | ) |
Obligations states and political subdivisions | | | 5,188 | | | (59 | ) | | | 9,388 | | | (89 | ) | | | 14,576 | | | (148 | ) |
| | | | | | | | | | | | | | | | | | | | | |
Total temporarily impaired | | $ | 11,224 | | $ | (78 | ) | | $ | 121,966 | | $ | (2,606 | ) | | $ | 133,190 | | $ | (2,684 | ) |
| | | | | | | | | | | | | | | | | | | | | |
| 2005 | | | | | | | | | | | | | | | | | | | | | |
| | | | | | |
U.S. Treasury and other U.S. government agencies | | $ | 24,356 | | $ | (440 | ) | | $ | 20,199 | | $ | (713 | ) | | $ | 44,555 | | $ | (1,153 | ) |
Mortgage-backed securities | | | 26,535 | | | (495 | ) | | | 45,801 | | | (1,520 | ) | | | 72,336 | | | (2,015 | ) |
Obligations states and political subdivisions | | | 14,182 | | | (267 | ) | | | 498 | | | (2 | ) | | | 14,680 | | | (269 | ) |
| | | | | | | | | | | | | | | | | | | | | |
Total temporarily impaired | | $ | 65,073 | | $ | (1,202 | ) | | $ | 66,498 | | $ | (2,235 | ) | | $ | 131,571 | | $ | (3,437 | ) |
| | | | | | | | | | | | | | | | | | | | | |
59
BAYLAKE CORP.
NOTES TO CONSOLIDATED FINANCIAL STATEMENTS
December 31, 2006, 2005 and 2004
(Dollar amounts in thousands, except share and per share data)
NOTE 2 – SECURITIES (Continued)
At December 31, 2006 and 2005, securities with unrealized losses had depreciated in value by approximately 2% and 3%, respectively, in aggregate, from the amortized cost basis. Unrealized losses reflected in the preceding tables have not been included in results of operations because the affected securities are of high credit quality, management has the intent and ability to hold these securities for the foreseeable future, and the decline in fair value is largely due to an increase in interest rates since the time the securities were purchased. The losses on these securities are expected to dissipate as they approach their maturity dates and/or if interest rates decline.
The Company evaluates securities for other-than-temporary impairment at least on a quarterly basis, and more frequently when economic or market concerns warrant such evaluation. At year end 2006 and 2005, there were no holdings of securities of any one issuer, other than the U.S. Government and its agencies, in an amount greater than 10% of shareholders’ equity.
NOTE 3 – LOANS
Major classifications of loans as of December 31, 2006 and 2005 are as follows:
| | | | | | |
| | | 2006 | | 2005 |
Commercial | | $ | 82,619 | | $ | 80,260 |
Real estate | | | | | | |
Residential | | | 143,873 | | | 148,736 |
Commercial | | | 464,843 | | | 467,956 |
Construction | | | 94,082 | | | 85,729 |
Consumer | | | 14,893 | | | 14,263 |
Tax exempt loans | | | 19,633 | | | 15,785 |
| | | | | | |
| | | 819,943 | | | 812,729 |
Less: Deferred loan origination fees, net of costs | | | 375 | | | 433 |
Allowance for loan losses | | | 8,058 | | | 9,551 |
| | | | | | |
Net loans | | $ | 811,510 | | $ | 802,745 |
| | | | | | |
60
BAYLAKE CORP.
NOTES TO CONSOLIDATED FINANCIAL STATEMENTS
December 31, 2006, 2005 and 2004
(Dollar amounts in thousands, except share and per share data)
NOTE 3 – LOANS (Continued)
Loans having a carrying value of $32,556 and $30,630 are pledged as collateral for borrowings from the Federal Home Loan Bank at December 31, 2006 and 2005, respectively.
Certain directors and officers of the Company and the Bank, including their immediate families, companies in which they are principal owners, and trusts in which they are involved, were loan customers of the Bank during 2006 and 2005.
A summary of the changes in those loans is as follows:
| | | | |
| | | 2006 | |
Balance at beginning of year | | $ | 5,475 | |
New loans made | | | 3,614 | |
Repayments received | | | (3,021 | ) |
Reclassification for loans related to former officers and directors | | | (136 | ) |
| | | | |
Balance at end of year | | $ | 5,932 | |
| | | | |
Changes in the allowance for loan losses were as follows:
| | | | | | | | | | | | |
| | | 2006 | | | 2005 | | | 2004 | |
Balance at beginning of year | | $ | 9,551 | | | $ | 10,445 | | | $ | 12,159 | |
Provision charged to operations | | | 903 | | | | 3,217 | | | | 1,599 | |
Recoveries | | | 1,021 | | | | 760 | | | | 976 | |
Loans charged off | | | (3,417 | ) | | | (4,871 | ) | | | (4,289 | ) |
| | | | | | | | | | | | |
Balance at end of year | | $ | 8,058 | | | $ | 9,551 | | | $ | 10,445 | |
| | | | | | | | | | | | |
Information regarding impaired loans is as follows:
| | | | | | |
| | | 2006 | | 2005 |
Impaired loans with no allocated allowance for loan loss | | $ | 12,118 | | $ | — |
Impaired loans with allocated allowance for loan loss | | | 15,614 | | | 14,637 |
Allowance allocated to impaired loans | | | 2,176 | | | 3,233 |
61
BAYLAKE CORP.
NOTES TO CONSOLIDATED FINANCIAL STATEMENTS
December 31, 2006, 2005 and 2004
(Dollar amounts in thousands, except share and per share data)
NOTE 3 – LOANS (Continued)
| | | | | | | | | |
| | | 2006 | | 2005 | | 2004 |
Average impaired loans during the period | | $ | 23,952 | | $ | 18,973 | | $ | 48,412 |
Interest income recognized during impairment | | | 364 | | | 979 | | | 2,338 |
Cash-basis interest income recognized | | | 339 | | | 928 | | | 2,338 |
Nonperforming loans were as follows:
| | | | | | |
| | | 2006 | | 2005 |
Loans past due over 90 days still on accrual | | $ | — | | $ | — |
Loans restructured in a troubled debt restructuring | | | 496 | | | — |
Non-accrual loans | | | 27,352 | | | 6,942 |
| | | | | | |
Total nonperforming loans | | $ | 27,848 | | $ | 6,942 |
| | | | | | |
If these loans had been current throughout their terms, interest income for the non-accrual period would have approximated $2,555, $605 and $688 for 2006, 2005 and 2004, respectively.
NOTE 4 – PREMISES AND EQUIPMENT
| | | | | | |
| | | 2006 | | 2005 |
Land | | $ | 6,715 | | $ | 3,973 |
Buildings and improvements | | | 24,632 | | | 23,354 |
Equipment | | | 12,041 | | | 11,543 |
| | | | | | |
| | | 43,388 | | | 38,870 |
Less accumulated depreciation | | | 15,656 | | | 14,167 |
| | | | | | |
Premises and equipment | | $ | 27,732 | | $ | 24,703 |
| | | | | | |
Depreciation expense was $1,609, $1,585, and $1,482 for 2006, 2005, and 2004, respectively.
The Company had a ten-year lease on office space that had been formerly used as a branch and was vacated in the middle of 2005. The lease was to expire on November 30, 2009. This lease was terminated in December 2005 at which time the Company negotiated with the lessor to buyout the remainder of the lease at a cost of $265. These costs are reflected in the 2005 Consolidated Statements of Income under Occupancy Expense. There are no further costs on this obligation. In addition to these lease costs, leasehold improvements with a book basis of $193 were written off in 2005 on this property. The Company has a two-year lease to rent space for a branch bank location in a mall in Howard, Wisconsin that was extended in 2004. The Company must also pay its proportional share of costs for common areas at the mall. Rent expense for these two facilities for 2006, 2005, and 2004 was $39, $120, and $123, respectively.
62
BAYLAKE CORP.
NOTES TO CONSOLIDATED FINANCIAL STATEMENTS
December 31, 2006, 2005 and 2004
(Dollar amounts in thousands, except share and per share data)
NOTE 4 – PREMISES AND EQUIPMENT (Continued)
Future minimum lease payments under the remaining lease agreement that expires in 2007 is $24.
During 2006, 2005, and 2004, vacant property owned by the Company was sold. Gains totaling $190, $2,200 and $487, were realized in 2006, 2005, and 2004, respectively. At year-end, approximately 12 acres of land were held for sale with a cost basis of $208.
During 2006 and 2005, gains of $103 and $411 were realized on the sale of office space under a condominium development arrangement. At year-end 2006, there is still one unit held for sale with a cost basis of $465.
NOTE 5 – FORECLOSED ASSETS, NET
Other real estate is summarized as follows:
| | | | | | | | | | | | |
| | | 2006 | | | 2005 | | | 2004 | |
Beginning balance | | $ | 3,333 | | | $ | 2,572 | | | $ | 2,271 | |
Transfer of net realizable value to other real estate | | | 6,399 | | | | 2,252 | | | | 3,316 | |
Sale proceeds, net | | | (3,958 | ) | | | (1,280 | ) | | | (2,992 | ) |
Net gain (loss) from sale of other real estate | | | 76 | | | | (25 | ) | | | 173 | |
Provision for other real estate | | | (90 | ) | | | (186 | ) | | | (196 | ) |
| | | | | | | | | | | | |
Total Other Real Estate | | $ | 5,760 | | | $ | 3,333 | | | $ | 2,572 | |
| | | | | | | | | | | | |
Changes in the valuation allowance for losses on other real estate were as follows:
| | | | | | | | | | | | |
| | | 2006 | | | 2005 | | | 2004 | |
Beginning balance | | $ | 267 | | | $ | 216 | | | $ | 47 | |
Provision charged to operations | | | 90 | | | | 186 | | | | 196 | |
Amounts related to properties disposed | | | (249 | ) | | | (135 | ) | | | (27 | ) |
| | | | | | | | | | | | |
Balance at end of year | | $ | 108 | | | $ | 267 | | | $ | 216 | |
| | | | | | | | | | | | |
63
BAYLAKE CORP.
NOTES TO CONSOLIDATED FINANCIAL STATEMENTS
December 31, 2006, 2005 and 2004
(Dollar amounts in thousands, except share and per share data)
NOTE 6 – GOODWILL
The change in balance for goodwill during the year is as follows:
| | | | | | |
| | | 2006 | | 2005 |
Beginning of year | | $ | 5,723 | | $ | 5,723 |
Impairment | | | — | | | — |
| | | | | | |
End of year | | $ | 5,723 | | $ | 5,723 |
| | | | | | |
NOTE 7 – DEPOSITS
The following is a summary of deposits by type at December 31:
| | | | | | |
| | | 2006 | | 2005 |
Non-interest-bearing demand deposits | | $ | 96,895 | | $ | 110,641 |
Interest-bearing demand deposits | | | 113,763 | | | 104,074 |
Savings deposits | | | 29,235 | | | 33,696 |
Money market deposits | | | 255,448 | | | 209,743 |
Time deposits $100,000 and greater | | | 194,664 | | | 224,163 |
Other time deposits | | | 188,906 | | | 174,394 |
| | | | | | |
Total deposits | | $ | 878,911 | | $ | 856,711 |
| | | | | | |
Brokered certificates of deposit included above: | | $ | 103,671 | | $ | 155,136 |
| | | | | | |
At December 31, 2006, the scheduled maturities of time deposits were as follows:
| | | |
2007 | | $ | 275,242 |
2008 | | | 94,150 |
2009 | | | 8,907 |
2010 | | | 5,142 |
2011 | | | 129 |
| | | |
| | $ | 383,570 |
| | | |
Deposits from the Company’s directors and officers held by the Bank at December 31, 2006 and 2005, amounted to $4,847 and $4,474, respectively.
64
BAYLAKE CORP.
NOTES TO CONSOLIDATED FINANCIAL STATEMENTS
December 31, 2006, 2005 and 2004
(Dollar amounts in thousands, except share and per share data)
NOTE 8 – FEDERAL FUNDS PURCHASED AND REPURCHASE AGREEMENTS
Short-term borrowings consisted of the following at December 31:
| | | | | | | | |
| | | 2006 | | | 2005 | |
Federal funds purchased | | $ | 3,383 | | | $ | — | |
Securities sold under agreements to repurchase | | | 1,097 | | | | 1,315 | |
| | | | | | | | |
| | $ | 4,480 | | | $ | 1,315 | |
| | | | | | | | |
Average amounts outstanding during year | | $ | 8,703 | | | $ | 26,945 | |
Maximum month-end amounts outstanding | | | 29,778 | | | | 48,804 | |
Average interest rates on amounts Outstanding at end of year | | | 5.28 | % | | | 3.70 | % |
Average interest rates on amounts Outstanding during year | | | 5.08 | % | | | 3.45 | % |
NOTE 9 – FEDERAL HOME LOAN BANK ADVANCES
A summary of Federal Home Loan Bank advances at December 31 is as follows:
| | | | | | | | | | | | |
Year of
Maturity | | 2006 | | Weighted
Average
Rate | | | 2005 | | Weighted
Average
Rate | |
2006 | | $ | — | | 0 | % | | | 85,000 | | 4.27 | % |
2007 | | | 75,000 | | 5.16 | | | | 15,000 | | 4.06 | |
2008 | | | 40,000 | | 5.36 | | | | 25,000 | | 4.80 | |
| | | | | | | | | | | | |
Total fixed maturity | | | 115,000 | | 5.23 | | | | 125,000 | | 4.35 | |
Amortizing | | | 179 | | 3.78 | | | | 185 | | 3.78 | |
| | | | | | | | | | | | |
Total | | $ | 115,179 | | 5.23 | % | | $ | 125,185 | | 4.35 | % |
| | | | | | | | | | | | |
Maximum month-end amounts outstanding were $125,185 and $125,188 at December 31, 2006 and 2005, respectively.
Each advance is payable at its maturity date, with a prepayment penalty for fixed rate advances. Federal Home Loan Bank advances are secured by $32,556 of real estate mortgages and $111,735 of mortgage-backed and U.S. agency securities. Of the advances, $30,000 have call provisions at December 31, 2006. All advances in the table above are at fixed rates with the exception of $35,000 due June 2007 priced at three month Libor plus 2 basis points and the interest rate is reset monthly; $25,000 due July 2007 priced at one month Libor plus 2 basis points and the interest rate is reset monthly and $30,000 due July 2008 priced at one month Libor plus 3 basis points and the interest rate is reset monthly.
NOTE 10 – SUBORDINATED DEBENTURES
In 2001, Baylake Corp. formed Baylake Capital Trust I (the Trust) as a statutory business trust organized for the sole purpose of issuing $16,100 of 10% fixed rate Cumulative Trust-Preferred Securities (the “Trust Preferred Securities”) and investing the proceeds thereof in junior subordinated debentures of the Company, the sole asset of the Trust.
65
BAYLAKE CORP.
NOTES TO CONSOLIDATED FINANCIAL STATEMENTS
December 31, 2006, 2005 and 2004
(Dollar amounts in thousands, except share and per share data)
On March 31, 2006, the Company redeemed its outstanding junior subordinated indentures and trust preferred securities for a total of $16.6 million which constitutes the $16.1 million stated principal values of those amounts plus $415 in accrued interest.
The redemption of these securities were funded through the issuance of $16.1 million of trust preferred securities and $498 of trust common securities issued under the names Baylake Capital Trust II (“Trust II”) that will adjust quarterly at a rate equal to 1.35% over the three month LIBOR. For banking regulatory purposes, these securities are considered Tier 1 capital.
The trust’s ability to pay amounts due on the trust-preferred securities is solely dependent upon the Company making payment on the related subordinated debentures to the trust. The Company’s obligations under the subordinated debentures constitute a full and unconditional guarantee by the Company of the trust’s obligations under the trust securities issued by the trust.
NOTE 11 – CAPITAL MATTERS
Banks and bank holding companies are subject to regulatory capital requirements administered by federal banking agencies. Capital adequacy guidelines and, additionally for banks, prompt corrective action regulations involve quantitative measures of assets, liabilities, and certain off-balance-sheet items calculated under regulatory accounting practices. Capital amounts and classifications are also subject to qualitative judgments by regulators. Failure to meet capital requirements can initiate regulatory action.
Prompt corrective action regulations provide five classifications: well capitalized, adequately capitalized, undercapitalized, significantly undercapitalized, and critically undercapitalized, although these terms are not used to represent overall financial condition. If adequately capitalized, regulatory approval is required to accept brokered deposits. If undercapitalized, capital distributions are limited, as is asset growth and expansion, and capital restoration plans are required. At year-end 2006 and 2005, the most recent regulatory notifications categorized the Bank as well capitalized under the regulatory framework for prompt corrective action. There are no conditions or events since that notification that management believes have changed the institution’s category.
66
BAYLAKE CORP.
NOTES TO CONSOLIDATED FINANCIAL STATEMENTS
December 31, 2006, 2005 and 2004
(Dollar amounts in thousands, except share and per share data)
NOTE 11 – CAPITAL MATTERS (Continued)
The Company’s and Baylake Bank’s risk-based capital and leverage ratios are presented below at year-end as follows:
| | | | | | | | | | | | | | | | | | |
| | | Actual | | | For Capital
Adequacy Purposes | | | To Be Well
Capitalized Under
Prompt Corrective
Action Provisions | |
| | Amount | | Ratio | | | Amount | | Ratio | | | Amount | | Ratio | |
| 2006 | | | | | | | | | | | | | | | | | | |
Total Capital to risk-weighted assets | | | | | | | | | | | | | | | | | | |
Consolidated | | $ | 101,489 | | 10.87 | % | | $ | 74,721 | | 8.00 | % | | | N/A | | N/A | |
Bank | | | 99,249 | | 10.63 | | | | 74,685 | | 8.00 | | | $ | 93,356 | | 10.00 | % |
Tier 1 (Core) Capital to risk-weighted assets | | | | | | | | | | | | | | | | | | |
Consolidated | | | 93,430 | | 10.00 | | | | 37,360 | | 4.00 | | | | N/A | | N/A | |
Bank | | | 91,191 | | 9.77 | | | | 37,342 | | 4.00 | | | | 56,014 | | 6.00 | |
Tier 1 (Core) Capital to average assets | | | | | | | | | | | | | | | | | | |
Consolidated | | | 93,430 | | 8.53 | | | | 43,826 | | 4.00 | | | | N/A | | N/A | |
Bank | | | 91,191 | | 8.33 | | | | 43,789 | | 4.00 | | | | 54,736 | | 5.00 | |
| 2005 | | | | | | | | | | | | | | | | | | |
Total Capital to risk-weighted assets | | | | | | | | | | | | | | | | | | |
Consolidated | | $ | 99,882 | | 10.73 | % | | $ | 74,472 | | 8.00 | % | | | N/A | | N/A | |
Bank | | | 97,329 | | 10.51 | | | | 74,404 | | 8.00 | | | $ | 93,006 | | 10.00 | % |
Tier 1 (Core) Capital to risk-weighted assets | | | | | | | | | | | | | | | | | | |
Consolidated | | | 90,332 | | 9.70 | | | | 37,236 | | 4.00 | | | | N/A | | N/A | |
Bank | | | 87,778 | | 9.44 | | | | 37,202 | | 4.00 | | | | 55,803 | | 6.00 | |
Tier 1 (Core) Capital to average assets | | | | | | | | | | | | | | | | | | |
Consolidated | | | 90,332 | | 8.27 | | | | 43,692 | | 4.00 | | | | N/A | | N/A | |
Bank | | | 87,778 | | 8.11 | | | | 43,590 | | 4.00 | | | | 54,488 | | 5.00 | |
67
BAYLAKE CORP.
NOTES TO CONSOLIDATED FINANCIAL STATEMENTS
December 31, 2006, 2005 and 2004
(Dollar amounts in thousands, except share and per share data)
NOTE 12 – OTHER COMPREHENSIVE INCOME
Other comprehensive income (loss) components and related tax effects were as follows:
| | | | | | | | | | | | |
| | | 2006 | | | 2005 | | | 2004 | |
Unrealized holding gains/(losses) on securities available for sale arising during period | | $ | 872 | | | $ | (4,636 | ) | | $ | (1,399 | ) |
Reclassification adjustment for net gains realized in income | | | — | | | | 52 | | | | — | |
| | | | | | | | | | | | |
Net unrealized gains/(losses) | | | 872 | | | | (4,584 | ) | | | (1,399 | ) |
Tax effect | | | (315 | ) | | | 1,629 | | | | 483 | |
| | | | | | | | | | | | |
Comprehensive (loss) income | | $ | 557 | | | $ | (2,955 | ) | | $ | (916 | ) |
| | | | | | | | | | | | |
NOTE 13 – FINANCIAL INSTRUMENTS WITH OFF-BALANCE-SHEET RISK
The Company is party to financial instruments with off-balance-sheet risk in the normal course of business to meet the financing needs of its customers. These financial instruments include commitments to extend credit, standby letters of credit, and financial guarantees.
The Company’s exposure to credit loss in the event of nonperformance by the other party to the financial instrument for commitments to extend credit and standby letters of credit is represented by the contract or notional amount of those instruments. The Bank uses the same credit policies in making commitments and conditional obligations as it does for on-balance-sheet instruments.
| | | | | | |
| | | Contract or
Notional Amount |
| | 2006 | | 2005 |
Financial instruments whose contract amounts represent credit risk: | | | | | | |
Commitments to extend credit | | $ | 227,872 | | $ | 212,956 |
Standby letters of credit | | | 21,327 | | | 22,160 |
Commitments to extend credit are agreements to lend to a customer as long as there is no violation of any condition established in the contract. Commitments generally have fixed expiration dates or other termination clauses and may require payment of a fee. Since many of the commitments are expected to expire without being drawn upon, the total commitment amounts do not necessarily represent future cash requirements. The Bank evaluates each customer’s creditworthiness on a case-by-case basis. The amount of collateral obtained, if deemed necessary by the Bank upon extension of credit, is based on management’s credit evaluation of the counter-party. Collateral held varies but may include accounts receivable; inventory; property, plant, and equipment; and income-producing commercial properties. Fixed rate commitments totaled $11,514 and $14,026 at December 31, 2006 and 2005 respectively, with rates ranging from 4.0% to 10.0% in 2006 and 3.95% to 18.0% in 2005.
68
BAYLAKE CORP.
NOTES TO CONSOLIDATED FINANCIAL STATEMENTS
December 31, 2006, 2005 and 2004
(Dollar amounts in thousands, except share and per share data)
NOTE 13 – FINANCIAL INSTRUMENTS WITH OFF-BALANCE-SHEET RISK (Continued)
Standby letters of credit are conditional commitments issued by the Bank to guarantee the performance of customers to a third party. These are primarily issued to support private borrowing arrangements and expire in decreasing amounts through 2010. The credit risk involved in issuing letters of credit is essentially the same as that involved in extending loan facilities to customers. The Bank does not require collateral as support for the commitments. Collateral is secured as commitments are funded.
In 2006 and 2005, impairment charges of $27 and $2,191 were taken on a standby letter of credit which was issued by the Company on behalf of a customer to accommodate their borrowings with a third party. The provision for impairment charges relates to the establishment of a liability for the Company’s exposure on that letter of credit. The initial letter of credit to the third party was for $8.8 million but prior to year-end 2005, the Company distributed $1.8 million to reduce the outstanding balance to $7.0 million. The Company continues to monitor the financial condition of the borrower on an ongoing basis, and if it continues to deteriorate, may need to provide additional reserves with respect to the off-balance sheet commitment.
NOTE 14 – POST-RETIREMENT PLANS
The subsidiaries have 401(k) Profit Sharing Plans covering all employees who qualify as to age and length of service. The employer contributions paid and expensed under all plans totaled $1,173 in 2006, $1,066 in 2005, and $959 in 2004.
Certain officers and directors of the Company and its subsidiaries are covered by nonqualified deferred compensation plans. Payments to be made under these plans are accrued over the anticipated years of service of the individuals covered. Amounts charged to expense were $1,051 in 2006, $767 in 2005, and $236 in 2004. The aggregate amount of deferred compensation included in other liabilities in the consolidated balance sheets is $3,494 and $2,461 in 2006 and 2005, respectively. In March 2005, the Company established the Baylake Bank Supplemental Executive Retirement Plan (“Plan”) which is intended to provide certain management and highly compensated employees of the Company who have contributed, and are expected to continue to contribute to the Company’s success by providing for deferred compensation in addition to that available under the Company’s other retirement programs. Costs amounted to $799 and $534 are included in the amounts charged to expense for 2006 and 2005, respectively.
69
BAYLAKE CORP.
NOTES TO CONSOLIDATED FINANCIAL STATEMENTS
December 31, 2006, 2005 and 2004
(Dollar amounts in thousands, except share and per share data)
NOTE 15 – INCOME TAX EXPENSE
Income taxes consist of the following:
| | | | | | | | | | |
| | | 2006 | | | 2005 | | 2004 |
Taxes currently payable | | | | | | | | | | |
Federal | | $ | 3,013 | | | $ | 2,592 | | $ | 3,953 |
State | | | 592 | | | | 335 | | | 608 |
| | | | | | | | | | |
| | | 3,605 | | | | 2,927 | | | 4,561 |
| | | |
Deferred income taxes | | | | | | | | | | |
Federal | | | (688 | ) | | | 605 | | | 80 |
State | | | (152 | ) | | | 304 | | | 39 |
| | | | | | | | | | |
| | | (840 | ) | | | 909 | | | 119 |
| | | | | | | | | | |
Income tax expense | | $ | 2,765 | | | $ | 3,836 | | $ | 4,680 |
| | | | | | | | | | |
The provision for income taxes differs from the amount of income tax determined by applying the statutory federal income tax rate to pretax income as a result of the following differences:
| | | | | | | | | | | | |
| | | 2006 | | | 2005 | | | 2004 | |
Income tax based on statutory rate | | $ | 3,448 | | | $ | 4,331 | | | $ | 5,254 | |
State income taxes net of federal tax benefit | | | 253 | | | | 341 | | | | 485 | |
| | | | | | | | | | | | |
| | | 3,701 | | | | 4,672 | | | | 5,739 | |
| | | |
Effect of tax-exempt interest income | | | (691 | ) | | | (760 | ) | | | (668 | ) |
Life insurance death benefit and earnings | | | (304 | ) | | | (265 | ) | | | (262 | ) |
Equity in income of service center | | | (174 | ) | | | (133 | ) | | | (131 | ) |
Other | | | 233 | | | | 322 | | | | 2 | |
| | | | | | | | | | | | |
Provision based on effective tax rates | | $ | 2,765 | | | $ | 3,836 | | | $ | 4,680 | |
| | | | | | | | | | | | |
Deferred income taxes reflect the net tax effects of temporary differences between the carrying amounts of assets and liabilities for financial reporting purposes and the amounts used for income tax purposes.
70
BAYLAKE CORP.
NOTES TO CONSOLIDATED FINANCIAL STATEMENTS
December 31, 2006, 2005 and 2004
(Dollar amounts in thousands, except share and per share data)
NOTE 15 – INCOME TAX EXPENSE (Continued)
The following is a summary of the significant components of the Company’s deferred tax assets and liabilities as of December 31, 2006 and 2005:
| | | | | | |
| | | 2006 | | 2005 |
Deferred tax assets | | | | | | |
Allowance for loan losses | | $ | 3,158 | | $ | 3,718 |
Off-balance sheet credit losses | | | 164 | | | 153 |
Deferred loan fees | | | 147 | | | 170 |
Deferred compensation | | | 1,746 | | | 1,268 |
Mortgage loan servicing | | | — | | | 91 |
Non accrual loans | | | 981 | | | 184 |
Accrued vacation pay | | | 374 | | | 321 |
OREO property valuation | | | 43 | | | 105 |
Net unrealized loss on securities available for sale | | | 704 | | | 1,019 |
Donations | | | 138 | | | 167 |
Other | | | 380 | | | 21 |
| | | | | | |
Gross deferred tax assets | | | 7,835 | | | 7,217 |
| | |
Deferred tax liabilities | | | | | | |
Depreciation | | | 1,930 | | | 1,849 |
FHLB stock dividends | | | 791 | | | 942 |
Mortgage Loan servicing | | | 157 | | | — |
Net unrealized gain on securities available for sale | | | — | | | — |
Prepaid expenditures | | | 97 | | | 116 |
Other | | | 103 | | | 78 |
| | | | | | |
Gross deferred tax liabilities | | | 3,078 | | | 2,985 |
| | | | | | |
Net deferred asset | | $ | 4,757 | | $ | 4,232 |
| | | | | | |
Income tax expense recorded in the consolidated statement of income involves the interpretation and application of certain accounting pronouncements and federal and state tax codes. The Company undergoes examination by various regulatory taxing agencies. Such agencies may require that changes in the amount of tax expense be recognized when their interpretations differ from those of management, based on their judgment about information available to them at the time of their examination.
71
BAYLAKE CORP.
NOTES TO CONSOLIDATED FINANCIAL STATEMENTS
December 31, 2006, 2005 and 2004
(Dollar amounts in thousands, except share and per share data)
NOTE 16 – EARNINGS PER SHARE
Earnings per share are based on the weighted average number of shares outstanding for the year. A reconciliation of the basic and diluted earnings per share amounts is as follows:
| | | | | | | | | |
| | | 2006 | | 2005 | | 2004 |
Basic | | | | | | | | | |
Net income | | $ | 7,376 | | $ | 8,903 | | $ | 10,773 |
| | | | | | | | | |
Weighted average common shares outstanding | | | 7,802,208 | | | 7,727,636 | | | 7,657,143 |
| | | | | | | | | |
Basic earnings per common share | | $ | .95 | | $ | 1.15 | | $ | 1.41 |
| | | | | | | | | |
Diluted | | | | | | | | | |
Net income | | $ | 7,376 | | $ | 8,903 | | $ | 10,773 |
| | | | | | | | | |
Weighted average common shares outstanding for basic earnings per share | | | 7,802,208 | | | 7,727,636 | | | 7,657,143 |
Add: Dilutive effects of assumed exercises of stock options | | | 33,315 | | | 74,713 | | | 41,237 |
| | | | | | | | | |
Average shares and dilutive potential common shares | | | 7,835,523 | | | 7,802,349 | | | 7,698,380 |
| | | | | | | | | |
Diluted earnings per common share | | $ | .94 | | $ | 1.14 | | $ | 1.40 |
| | | | | | | | | |
Additional common stock option shares that have not been included due to their antidilutive effect | | | 60,000 | | | 60,000 | | | 216,450 |
| | | | | | | | | |
NOTE 17 – STOCK OPTION PLAN
The Company has a non-qualified stock option plan under which certain officers and key salaried employees may purchase shares of the Company’s stock at an established exercise price. Unless earlier terminated, these options will expire ten years from the date of grant. The options vest over a five-year period, becoming exercisable 20% per year, commencing one year from date of grant. Subsequent to the expiration of the Plan, options were granted in 2004 under the same terms as would have applied under the Plan. Total compensation cost, net of income tax, that has been charged against income for the plan was $48, $0, and $0 for 2006, 2005, and 2004, respectively. The total income tax benefit was $19, $0, and $0.
72
BAYLAKE CORP.
NOTES TO CONSOLIDATED FINANCIAL STATEMENTS
December 31, 2006, 2005 and 2004
(Dollar amounts in thousands, except share and per share data)
NOTE 17 – STOCK OPTION PLAN (Continued)
The fair values and assumptions used to determine such values are as follows:
| | | | | | | | |
| | | 2006 | | 2005 | | 2004 | |
Weighted average grant date fair value | | n/a | | n/a | | $ | 1.53 | |
Assumptions: | | | | | | | | |
Risk-free interest rates | | n/a | | n/a | | | 2.25 | % |
Expected volatility | | n/a | | n/a | | | 17.03 | % |
Expected term (in years) | | n/a | | n/a | | | 6.98 | |
Expected dividend yield | | n/a | | n/a | | | 3.75 | % |
There were no stock options granted in 2006 or 2005.
Activity in the stock option plan for 2006 follows:
| | | | | | | | | | | |
| | | Shares | | | Weighted
Average
Exercise
Price | | Weighted
Average
Remaining
Contractual
Term | | Aggregate
Intrinsic
Value |
Outstanding at beginning of year | | 486,869 | | | $ | 13.95 | | | | | |
Granted | | — | | | | — | | | | | |
Exercised | | (99,544 | ) | | | 9.35 | | | | | |
Forfeited or expired | | — | | | | — | | | | | |
| | | | | | | | | | | |
Outstanding at end of year | | 387,325 | | | $ | 15.10 | | 3.00 | | $ | 923 |
| | | | | | | | | | | |
Exercisable at end of year | | 352,264 | | | $ | 15.24 | | 2.70 | | $ | 835 |
| | | | | | | | | | | |
Information related to the stock option plan during each year follows:
| | | | | | | | | |
| | | 2006 | | 2005 | | 2004 |
Intrinsic value of options exercised | | $ | 648 | | $ | 789 | | $ | 364 |
Cash received from option exercises | | | 932 | | | 812 | | | 938 |
Tax benefit realized from option exercises | | | 272 | | | 296 | | | 144 |
| | | |
Weighted average fair value of options granted per share | | | — | | | — | | $ | 1.53 |
As of December 31, 2006, there was $21 of total unrecognized compensation cost related to nonvested stock options granted under the Plan. The cost is expected to be recognized over a weighted-average period of 1.7 years.
NOTE 18 – DISCLOSURES ABOUT FAIR VALUE OF FINANCIAL INSTRUMENTS
The methods and assumptions used to estimate fair value are described as follows.
Carrying amount is the estimated fair value for cash and cash equivalents, Federal Home Loan Bank stock, accrued interest receivable and payable, demand deposits, short-term debt, and variable rate loans or deposits that reprice frequently and fully. Security fair values are based on market prices or dealer quotes and, if no such information is available, on the rate and term of the security and
73
BAYLAKE CORP.
NOTES TO CONSOLIDATED FINANCIAL STATEMENTS
December 31, 2006, 2005 and 2004
(Dollar amounts in thousands, except share and per share data)
information about the issuer. For fixed rate loans or deposits and for variable rate loans or deposits with infrequent repricing or repricing limits, fair value is based on discounted cash flows using current market rates applied to the estimated life and credit risk. Fair values for impaired loans are estimated using discounted cash flow analysis or underlying collateral values. Fair value of loans held for sale is based on market quotes. Fair value of long- term debt is based on current rates for similar financing.
| | | | | | | | | | | | |
| | | 2006 | | 2005 |
| | Carrying
Amount | | Fair
Value | | Carrying
Amount | | Fair
Value |
Financial assets | | | | | | | | | | | | |
Cash and cash equivalents | | $ | 22,685 | | $ | 22,685 | | $ | 33,054 | | $ | 33,054 |
Securities available for sale | | | 188,315 | | | 188,315 | | | 171,638 | | | 171,638 |
Loans held for sale | | | 889 | | | 901 | | | 374 | | | 377 |
Loans, net | | | 811,510 | | | 802,908 | | | 802,745 | | | 796,364 |
Federal Home Loan Bank stock | | | 6,792 | | | 6,792 | | | 8,081 | | | 8,081 |
Accrued interest receivable | | | 6,183 | | | 6,183 | | | 5,354 | | | 5,354 |
| | | | |
Financial liabilities | | | | | | | | | | | | |
Deposits | | | 878,911 | | | 878,344 | | | 856,711 | | | 855,766 |
Federal funds purchased and repurchase agreements | | | 4,480 | | | 4,480 | | | 1,315 | | | 1,315 |
Federal Home Loan Bank advances | | | 115,179 | | | 115,264 | | | 125,185 | | | 124,889 |
Subordinated debentures | | | 16,100 | | | 16,100 | | | 16,100 | | | 16,551 |
Accrued interest payable | | | 4,501 | | | 4,501 | | | 4,049 | | | 4,049 |
74
BAYLAKE CORP.
NOTES TO CONSOLIDATED FINANCIAL STATEMENTS
December 31, 2006, 2005 and 2004
(Dollar amounts in thousands, except share and per share data)
NOTE 19 – CONDENSED FINANCIAL INFORMATION – PARENT COMPANY ONLY
CONDENSED BALANCE SHEETS
December 31
| | | | | | |
| | | 2006 | | 2005 |
ASSETS | | | | | | |
Cash and cash equivalents | | $ | 2,453 | | $ | 2,154 |
Securities available for sale | | | 1,016 | | | 1,040 |
Interest receivable | | | 4 | | | 4 |
Receivable from subsidiary | | | 26 | | | 168 |
Prepaid expenses | | | — | | | 475 |
Deferred income taxes | | | 10 | | | — |
Investment in subsidiaries | | | 96,044 | | | 92,061 |
| | | | | | |
Total assets | | $ | 99,553 | | $ | 95,902 |
| | | | | | |
| | | | | | |
LIABILITIES AND STOCKHOLDERS’ EQUITY | | | | | | |
Liabilities | | | | | | |
Dividends payable | | $ | 1,253 | | $ | 1,243 |
Interest Payable | | | 7 | | | — |
Debentures | | | 16,100 | | | 16,100 |
Deferred income taxes | | | — | | | 15 |
| | | | | | |
Total liabilities | | | 17,360 | | | 17,358 |
| | |
Stockholders’ equity | | | 82,193 | | | 78,544 |
| | | | | | |
Total liabilities and stockholders’ equity | | $ | 99,553 | | $ | 95,902 |
| | | | | | |
75
BAYLAKE CORP.
NOTES TO CONSOLIDATED FINANCIAL STATEMENTS
December 31, 2006, 2005 and 2004
(Dollar amounts in thousands, except share and per share data)
NOTE 19 – CONDENSED FINANCIAL INFORMATION – PARENT COMPANY ONLY (Continued)
CONDENSED STATEMENTS OF INCOME
Years ended December 31
| | | | | | | | | | | | |
| | | 2006 | | | 2005 | | | 2004 | |
Income | | | | | | | | | | | | |
Dividends from subsidiaries | | $ | 5,400 | | | $ | 3,600 | | | $ | 4,600 | |
Interest income | | | 152 | | | | 149 | | | | 113 | |
| | | | | | | | | | | | |
Total income | | | 5,552 | | | | 3,749 | | | | 4,713 | |
| | | |
Expenses | | | | | | | | | | | | |
Interest | | | 1,705 | | | | 2,039 | | | | 1,695 | |
Other | | | 175 | | | | 154 | | | | 126 | |
Income tax benefit | | | (587 | ) | | | (695 | ) | | | (581 | ) |
| | | | | | | | | | | | |
Total expenses | | | 1,293 | | | | 1,498 | | | | 1,240 | |
| | | | | | | | | | | | |
Income before equity in undistributed net income of subsidiaries | | | 4,259 | | | | 2,251 | | | | 3,473 | |
| | | |
Equity in undistributed net income of subsidiaries | | | 3,117 | | | | 6,652 | | | | 7,300 | |
| | | | | | | | | | | | |
Net income | | $ | 7,376 | | | $ | 8,903 | | | $ | 10,773 | |
| | | | | | | | | | | | |
76
BAYLAKE CORP.
NOTES TO CONSOLIDATED FINANCIAL STATEMENTS
December 31, 2006, 2005 and 2004
(Dollar amounts in thousands, except share and per share data)
NOTE 19 – CONDENSED FINANCIAL INFORMATION – PARENT COMPANY ONLY(Continued)
CONDENSED STATEMENT OF CASH FLOWS
Years ended December 31
| | | | | | | | | | | | |
| | | 2006 | | | 2005 | | | 2004 | |
Cash flows from operating activities: | | | | | | | | | | | | |
Net income | | $ | 7,376 | | | $ | 8,903 | | | $ | 10,773 | |
Adjustments to reconcile net income to net cash provided by operating activities: | | | | | | | | | | | | |
Undistributed earnings of subsidiary | | | (3,117 | ) | | | (6,652 | ) | | | (7,300 | ) |
Stock Compensation Expense | | | 48 | | | | — | | | | — | |
Amortization of debt issue costs | | | 475 | | | | 429 | | | | 85 | |
Net amortization of securities | | | (3 | ) | | | (2 | ) | | | (3 | ) |
Net change in intercompany receivable | | | 142 | | | | (115 | ) | | | 81 | |
Accrued expenses and other liabilities | | | (11 | ) | | | 296 | | | | 141 | |
| | | | | | | | | | | | |
Net cash provided by operating activities | | | 4,910 | | | | 2,859 | | | | 3,777 | |
| | | |
Cash flows from financing activities: | | | | | | | | | | | | |
Redemption of subordinated debt | | | (16,100 | ) | | | — | | | | — | |
Proceeds from issue of subordinated debt | | | 16,100 | | | | — | | | | — | |
Proceeds from exercise of stock options | | | 932 | | | | 812 | | | | 938 | |
Tax benefit from exercise of stock options | | | 272 | | | | — | | | | — | |
Payments to repurchase common stock | | | (1,101 | ) | | | — | | | | — | |
Dividend Reinvestment Plan | | | 268 | | | | — | | | | — | |
Dividends paid | | | (4,982 | ) | | | (4,628 | ) | | | (4,269 | ) |
| | | | | | | | | | | | |
Net cash used in financing activities | | | (4,611 | ) | | | (3,816 | ) | | | (3,331 | ) |
| | | | | | | | | | | | |
Net change in cash and cash equivalents | | | 299 | | | | (957 | ) | | | 446 | |
Beginning cash and cash equivalents | | | 2,154 | | | | 3,111 | | | | 2,665 | |
| | | | | | | | | | | | |
Ending cash and cash equivalents | | $ | 2,453 | | | $ | 2,154 | | | $ | 3,111 | |
| | | | | | | | | | | | |
77
| ITEM 9. | CHANGES IN AND DISAGREEMENTS WITH ACCOUNTANTS ON ACCOUNTING AND FINANCIAL DISCLOSURE |
Not applicable.
| ITEM 9A. | CONTROLS AND PROCEDURES |
Disclosures Controls and Procedures:Our management, with the participation of Chief Executive Officer and Acting Chief Financial Officer, has evaluated the effectiveness of our disclosure controls and procedures (as such term is defined in Rules 13a-15(e) and 15d-15(e) under the Securities Exchange Act of 1934, as amended (the “Exchange Act”)) as of December 31, 2006. Based on such evaluation, our Chief Executive Officer and Acting Chief Financial Officer have concluded that, as of the end of such period, our disclosure controls and procedures are effective in recording, processing, summarizing and reporting, on a timely basis, information required to be disclosed by us in the reports that we file or submit under the Exchange Act.
Changes in Internal Control Over Financial Reporting:There have not been any changes in our internal control over financial reporting (as such term is defined in Rules 13a-15(f) and 15d-15(f) under the Exchange Act) subsequent to the date of the evaluation performed by our Chief Executive Officer and Acting Chief Financial Officer.
| ITEM 9B. | OTHER INFORMATION |
None.
PART III
| ITEM 10. | DIRECTORS, EXECUTIVE OFFICERS AND CORPORATE GOVERNANCE |
The information set forth under the sections titled “Proposal No. 1, Election of Directors,” “Information on Executive Officers” and “Compliance with Section 16(a) of the Exchange Act” contained in the definitive proxy statement for our 2007 Annual Meeting of Stockholders is incorporated herein by reference.
| ITEM 11. | EXECUTIVE COMPENSATION |
The information set forth under the sections titled “Director Fees and Benefits”, “Compensation Discussion and Analysis”, “Board of Directors Compensation Committee Report on Management Compensation”, and “Compensation Committee Interlocks and Insider Participation” contained in the definitive proxy statement for our 2007 Annual Meeting of Stockholders is incorporated herein by reference.
| ITEM 12. | SECURITY OWNERSHIP OF CERTAIN BENEFICIAL OWNERS AND MANAGEMENT AND RELATED STOCKHOLDER MATTERS |
The information set forth under the section titled “Ownership of Baylake Common” contained in the definitive proxy statement for our 2007 Annual Meeting of Stockholders is incorporated herein by reference.
Equity compensation plan information:
The following table sets forth information regarding options and shares reserved for future issuance under the equity compensation plans as of December 31, 2006.
78
| | | | | | |
| | | Number of securities to
be issued upon exercise
of outstanding options,
warrants and rights | | Weighted-average
exercise price of
outstanding options,
warrants and rights | | Number of securities
remaining available for
future issuance under
equity compensation
plans (excluding
securities reflected in
column (a) |
Plan Category | | (a) | | (b) | | (c) |
Equity compensation plans approved by security holders | | 362,835 | | $15.16 | | — |
Equity compensation plans not approved by security holders ** | | 24,490 | | 14.15 | | — |
Total | | 387,325 | | $15.10 | | — |
| ** | These options represent options granted with the same terms and conditions as those granted under the 1993 Stock Option Plan, as amended, but after expiration of that Plan. The total number of options granted was less than the total authorized under the Plan, which was adopted with shareholder approval. We previously announced that we do not intend to grant further stock options. |
| ITEM 13. | CERTAIN RELATIONSHIPS AND RELATED TRANSACTIONS, AND DIRECTOR INDEPENDENCE |
Information set forth in the section titled “Certain Transactions with Management” in the definitive proxy statement for our 2007 Annual Meeting of Stockholders is incorporated herein by reference.
| ITEM 14. | PRINCIPAL ACCOUNTANT FEES AND SERVICES |
Information set forth in the section titled “Principal Accountant Fees and Services” in the definitive proxy statement for our 2007 Annual Meeting of Stockholders is incorporated herein by reference.
79
PART IV
| ITEM 15. | EXHIBITS AND FINANCIAL STATEMENT SCHEDULES |
(a) 1 and 2
The consolidated financial statements and supplementary data contained in Item 8 of this report are filed as part of this report. All schedules are omitted because of the absence of the conditions under which they are required or because the required information is included in the consolidated financial statements or related notes.
(a) 3
See Item 15(b) below
(b) Exhibits Required by Item 601 of Regulation S-K
Reference is made to the Exhibit Index following the signatures for exhibits filed as part of this report.
80
SIGNATURES
Pursuant to the requirements of Section 13 or 15 (d) of the Securities Exchange Act of 1934, the Registrant has duly caused this report to be signed on its behalf by the undersigned, thereunto duly authorized.
| | | | |
| | BAYLAKE CORP. |
| | |
| | By: | | /s/ Kevin L. LaLuzerne |
| | | | Kevin L. LaLuzerne |
| | | | Treasurer |
|
| Date: March 14, 2007 |
POWER OF ATTORNEY
KNOW ALL MEN BY THESE PRESENTS, that each individual whose signature appears below hereby designates and appoints Robert J. Cera and Kevin L. LaLuzerne, and each of them, any one of whom may act without the joinder of the other, as such person’s true and lawful attorney-in-fact and agents (the “Attorneys-in-Fact”) with full power of substitution and resubstitution, for such person and in such person’s name, place and stead, in any and all capacities, to sign any and all amendments to this report, and to file the same, with all exhibits thereto, and other documents in connection therewith, the Securities and Exchange Commission and any state securities commission, granting unto said Attorneys-in-Fact and agents, and each of them, full power and authority to do and perform each and every act and thing requisite and necessary to be done in and about the premises, as fully to all intents and purposes as he might or could do in person, hereby ratifying and conforming all that said Attorneys-in-Fact and agents or any of them, or their or his substitutes, may lawfully do or cause to be done by virtue hereof.
Pursuant to the requirements of the Securities Exchange Act of 1934, as amended, this report has been signed by the following persons in the capacities and on these dates indicated.*
| | |
/s/ Thomas L. Herlache | | /s/ Richard A. Braun |
Thomas L. Herlache Chief Executive Officer and Director (Principal Executive Officer) | | Richard A. Braun, Director Vice-Chairman of the Board |
| |
/s/ Kevin L. LaLuzerne | | /s/ Robert W. Agnew |
Kevin L. LaLuzerne Treasurer (Principal Financial and Accounting Officer) | | Robert W. Agnew, Director |
| |
/s/ Dee Geurts-Bengtson | | /s/ Robert J. Cera |
Dee Geurts-Bengtson, Director | | Robert J. Cera, President and Chief Operating Officer and Director |
| |
| | | /s/ George Delveaux, Jr. |
John W. Bunda, Director | | George Delveaux, Jr., Director |
| |
| | | |
Roger G. Ferris, Director | | Joseph J. Morgan, Director |
| |
| /s/ William Parsons | | /s/ Paul Jay Sturm |
William Parsons, Director | | Paul Jay Sturm, Director |
| * | Each of the above signatures is affixed as of March 14, 2007. |
81
| | |
| Exhibit No. | | Description |
| 3.1 | | Articles of Incorporation, as amended through July 3, 2001, incorporated by reference to Exhibit 4.1 from the Company’s Registration Statement on Form S-3 (File No. 333-118857) filed on September 8, 2004 |
| |
| 3.2 | | Bylaws, as amended through February 21, 1996, incorporated by reference to Exhibit 4.2 from the Company’s Registration Statement on Form S-3 (File No. 333-118857) filed on September 8, 2004 |
| |
| 4.1 | | Advances, Collateral Pledge, and Security Agreement dated as of August 8, 1997 between Baylake Bank and Federal Home Loan Bank of Chicago. |
| |
| 10.1 | | Baylake Bank’s Deferred Compensation Program with Thomas L. Herlache*, incorporated by reference to Exhibit 10.3 from the Company’s Annual Report on Form 10-K for the fiscal year ended December 31, 1993 |
| |
| 10.2 | | Baylake Bank’s Deferred Compensation and Salary Continuation Agreement with Richard A. Braun*, incorporated by reference to Exhibit 10.5 from the Company’s Annual Report on Form 10-K for the fiscal year ended December 31, 1993 |
| |
| 10.3 | | Deferred Compensation Plan for Selected Directors of Baylake Bank (Money Purchase Compensation Plan) dated December 19, 1995.* |
| |
| 10.4 | | Baylake Corp. Stock Purchase Plan*, incorporated by reference to Exhibit 4 from the Company’s Form S-8 filed on February 10, 1998 |
| |
| 10.5 | | Baylake Corp. 1993 Stock Option Plan, as amended in 1998*, incorporated by reference to Exhibit 99.1 from the Company’s Form S-8 filed on September 21, 1998 |
| |
| 10.6 | | Baylake Bank Supplemental Executive Retirement Plan*, incorporated by reference to Exhibit 10.8 from the Company’s Annual Report on Form 10-K for the fiscal year ended December 31, 2004 |
| |
| 10.7 | | Employment Agreement dated as of June 30, 2006 between Baylake Bank and Robert J. Cera* |
| |
| 10.8 | | Separation Agreement dated January 30, 2007 between Baylake Bank and Steven Jennerjohn*, incorporated by reference to Exhibit 10.1 from the Company’s Current Report on Form 8-K filed on February 15, 2007 |
| |
| 10.9 | | Executive Employee Salary Continuation Ageement for Thomas L. Herlache dated October 1, 1999 |
| |
| 21.1 | | List of Subsidiaries |
| |
| 23.1 | | Consent of Crowe Chizek and Company LLC |
| |
| 24.1 | | Power of Attorney (contained on the Signature Page) |
| |
| 31.1 | | Certification of the Chief Executive Officer pursuant to Rule 13a-14(a) under the Securities Exchange Act of 1934, as amended |
| |
| 31.2 | | Certification of the Acting Chief Financial Officer pursuant to Rule 13a-14(a) under the Securities Exchange Act of 1934, as amended |
82
| | |
| |
| 32.1 | | Certification of the Chief Executive Officer pursuant to Rule 13a-14(b) under the Securities Exchange Act of 1934, as amended and 18 U.S.C. Section 1350 |
| |
| 32.2 | | Certification of the Acting Chief Financial Officer pursuant to Rule 13a-14(b) under the Securities Exchange Act of 1934, as amended and 18 U.S.C. Section 1350 |
| * | Designates compensation plans or agreements |
83