UNITED STATES
SECURITIES AND EXCHANGE COMMISSION
Washington, D.C. 20549
FORM N-CSR
CERTIFIED SHAREHOLDER REPORT OF REGISTERED
MANAGEMENT INVESTMENT COMPANIES
Investment Company Act file number 811-2841
Fidelity Capital Trust
(Exact name of registrant as specified in charter)
82 Devonshire St., Boston, Massachusetts 02109
(Address of principal executive offices) (Zip code)
Eric D. Roiter, Secretary
82 Devonshire St.
Boston, Massachusetts 02109
(Name and address of agent for service)
Registrant's telephone number, including area code: 617-563-7000
Date of fiscal year end: | October 31 |
| |
Date of reporting period: | April 30, 2006 |
Item 1. Reports to Stockholders
| | Fidelity®
Capital Appreciation
Fund
|
| | Semiannual Report
April 30, 2006
|


| Contents | | | | |
| |
| Chairman’s Message | | 3 | | Ned Johnson’s message to shareholders. |
| Shareholder Expense | | 4 | | An example of shareholder expenses. |
| Example | | | | |
| Investment Changes | | 6 | | A summary of major shifts in the fund’s |
| | | | | investments over the past six months. |
| Investments | | 7 | | A complete list of the fund’s investments |
| | | | | with their market values. |
| Financial Statements | | 18 | | Statements of assets and liabilities, |
| | | | | operations, and changes in net assets, |
| | | | | as well as financial highlights. |
| Notes | | 22 | | Notes to the financial statements. |
| Board Approval of | | 28 | | |
| Investment Advisory | | | | |
| Contracts and | | | | |
| Management Fees | | | | |
To view a fund’s proxy voting guidelines and proxy voting record for the 12 month period ended
June 30, visit www.fidelity.com/proxyvotingresults or visit the Securities and Exchange Commis
sion’s (SEC) web site at www.sec.gov. You may also call 1-800-544-8544 to request a free copy of
the proxy voting guidelines.
Standard & Poor’s, S&P and S&P 500 are registered service marks of The McGraw Hill Companies,
Inc. and have been licensed for use by Fidelity Distributors Corporation.
Other third party marks appearing herein are the property of their respective owners.
All other marks appearing herein are registered or unregistered trademarks or service marks
of FMR Corp. or an affiliated company.
|
| | This report and the financial statements contained herein are submitted for the general information
of the shareholders of the fund. This report is not authorized for distribution to prospective investors in
the fund unless preceded or accompanied by an effective prospectus.
A fund files its complete schedule of portfolio holdings with the SEC for the first and third quarters of
each fiscal year on Form N Q. Forms N Q are available on the SEC’s web site at http://www.sec.gov.
A fund’s Forms N Q may be reviewed and copied at the SEC’s Public Reference Room in
Washington, DC. Information regarding the operation of the SEC’s Public Reference Room may be
obtained by calling 1-800-SEC-0330. For a complete list of a fund’s portfolio holdings, view the most
recent quarterly holdings report, semiannual report, or annual report on Fidelity’s web site at
http://www.fidelity.com/holdings.
NOT FDIC INSURED · MAY LOSE VALUE · NO BANK GUARANTEE
Neither the fund nor Fidelity Distributors Corporation is a bank.
|
Chairman’s Message
(photograph of Edward C. Johnson 3d)
Dear Shareholder:
Although many securities markets made gains in early 2006, there is only one certainty when it comes to investing: There is no sure thing. There are, however, a number of time tested, fundamental investment principles that can put the historical odds in your favor.
One of the basic tenets is to invest for the long term. Over time, riding out the markets’ inevitable ups and downs has proven much more effective than selling into panic or chasing the hottest trend. Even missing only a few of the markets’ best days can significantly diminish investor returns. Patience also affords the benefits of compounding of earning interest on additional income or reinvested dividends and capital gains. There are tax advantages and cost benefits to consider as well. The more you sell, the more taxes you pay, and the more you trade, the higher the costs. While staying the course doesn’t eliminate risk, it can considerably lessen the effect of short term declines.
You can further manage your investing risk through diversification. And today, more than ever, geographic diversification should be taken into account. Studies indicate that asset allocation is the single most important determinant of a portfolio’s long term success. The right mix of stocks, bonds and cash aligned to your particular risk tolerance and investment objective is very important. Age appropriate rebalancing is also an essential aspect of asset allocation. For younger investors, an emphasis on equities which historically have been the best performing asset class over time is encouraged. As investors near their specific goal, such as retirement or sending a child to college, consideration may be given to replacing volatile assets (e.g. common stocks) with more stable fixed investments (bonds or savings plans).
A third investment principle investing regularly can help lower the average cost of your purchases. Investing a certain amount of money each month or quarter helps ensure you won’t pay for all your shares at market highs. This strategy known as dollar cost averaging also reduces unconstructive “emotion” from investing, helping shareholders avoid selling weak per formers just prior to an upswing, or chasing a hot performer just before a correction.
We invite you to contact us via the Internet, through our Investor Centers or over the phone. It is our privilege to provide you the information you need to make the investments that are right for you.
Sincerely,
/s/ Edward C. Johnson 3d
Edward C. Johnson 3d
3 Semiannual Report
Shareholder Expense Example
As a shareholder of the Fund, you incur two types of costs: (1) transaction costs, including sales charges (loads) on purchase payments or redemption proceeds, and (2) ongoing costs, including management fees and other Fund expenses. This Example is intended to help you understand your ongoing costs (in dollars) of investing in the Fund and to compare these costs with the ongoing costs of investing in other mutual funds.
The Example is based on an investment of $1,000 invested at the beginning of the period and held for the entire period (November 1, 2005 to April 30, 2006).
The first line of the table below provides information about actual account values and actual expenses. You may use the information in this line, together with the amount you invested, to estimate the expenses that you paid over the period. Simply divide your account value by $1,000.00 (for example, an $8,600 account value divided by $1,000.00 = 8.6), then multiply the result by the number in the first line under the heading entitled “Expenses Paid During Period” to estimate the expenses you paid on your account during this period. A small balance maintenance fee of $12.00 that is charged once a year may apply for certain accounts with a value of less than $2,000. This fee is not included in the table below. If it was, the estimate of expenses you paid during the period would be higher, and your ending account value lower, by this amount.
Hypothetical Example for Comparison Purposes
The second line of the table below provides information about hypothetical account values and hypothetical expenses based on the Fund’s actual expense ratio and an assumed rate of return of 5% per year before expenses, which is not the Fund’s actual return. The hypothetical account values and expenses may not be used to estimate the actual ending account balance or expenses you paid for the period. You may use this information to compare the ongoing costs of investing in the Fund and other funds. To do so, compare this 5% hypothetical example with the 5% hypothetical examples that appear in the share holder reports of the other funds. A small balance maintenance fee of $12.00 that is charged once a year may apply for certain accounts with a value of less than $2,000. This fee is not included in the table below. If it was, the estimate of expenses you paid during the period would be higher, and your ending account value lower, by this amount.
Please note that the expenses shown in the table are meant to highlight your ongoing costs only and do not reflect any transaction costs. Therefore, the second line of the table is useful in comparing ongoing costs only, and will not help you determine the relative total costs of owning different funds. In addition, if these transactional costs were included, your costs would have been higher.
| | | | | | | | | | | Expenses Paid |
| | | Beginning | | Ending | | During Period* |
| | | Account Value | | Account Value | | November 1, 2005 |
| | | November 1, 2005 | | April 30, 2006 | | to April 30, 2006 |
| Actual | | | | $ 1,000.00 | | | | $ 1,163.70 | | | | $ 5.04 |
| Hypothetical (5% return per year | | | | | | | | | | | | |
| before expenses) | | | | $ 1,000.00 | | | | $ 1,020.13 | | | | $ 4.71 |
* Expenses are equal to the Fund’s annualized expense ratio of .94%; multiplied by the average account value over the period, multiplied by 181/365 (to reflect the one half year period).
5 Semiannual Report
| Investment Changes | | | | |
| |
| Top Ten Stocks as of April 30, 2006 | | | | |
| | | % of fund’s | | % of fund’s net assets |
| | | net assets | | 6 months ago |
| The Walt Disney Co. | | 3.3 | | 1.1 |
| QUALCOMM, Inc. | | 2.9 | | 1.4 |
| Motorola, Inc. | | 2.9 | | 1.3 |
| Morgan Stanley | | 2.9 | | 0.0 |
| Abercrombie & Fitch Co. Class A | | 2.3 | | 0.2 |
| Qwest Communications International, Inc. | | 2.1 | | 0.1 |
| Broadcom Corp. Class A | | 2.0 | | 0.0 |
| Advanced Micro Devices, Inc. | | 2.0 | | 0.4 |
| Schlumberger Ltd. (NY Shares) | | 2.0 | | 0.1 |
| American Tower Corp. Class A | | 1.8 | | 0.8 |
| | | 24.2 | | |
Top Five Market Sectors as of April 30, 2006 | | |
| | | % of fund’s | | % of fund’s net assets |
| | | net assets | | 6 months ago |
| Information Technology | | 20.7 | | 26.5 |
| Industrials | | 18.7 | | 7.5 |
| Consumer Discretionary | | 17.6 | | 20.1 |
| Energy | | 9.2 | | 8.9 |
| Health Care | | 8.6 | | 8.3 |

Semiannual Report 6
| Investments April 30, 2006 (Unaudited) |
| Showing Percentage of Net Assets | | | | | | |
| |
| Common Stocks 95.5% | | | | | | |
| | | Shares | | Value (Note 1) |
| | | | | (000s) |
| |
| CONSUMER DISCRETIONARY – 17.6% | | | | | | |
| Auto Components 1.3% | | | | | | |
| Goodyear Tire & Rubber Co. (a)(d) | | 2,208,400 | | | | $ 30,918 |
| Johnson Controls, Inc. | | 953,400 | | | | 77,750 |
| | | | | | | 108,668 |
| Diversified Consumer Services – 1.2% | | | | | | |
| Apollo Group, Inc. Class A (a) | | 757,200 | | | | 41,373 |
| Career Education Corp. (a) | | 1,064,600 | | | | 39,252 |
| Corinthian Colleges, Inc. (a) | | 1,164,200 | | | | 17,335 |
| ITT Educational Services, Inc. (a) | | 47,300 | | | | 3,006 |
| | | | | | | 100,966 |
| Hotels, Restaurants & Leisure 2.8% | | | | | | |
| Ambassadors Group, Inc. | | 574,501 | | | | 15,339 |
| P.F. Chang’s China Bistro, Inc. (a)(d) | | 331,300 | | | | 14,117 |
| Starbucks Corp. (a)(d) | | 3,500,000 | | | | 130,445 |
| The Cheesecake Factory, Inc. (a) | | 126,300 | | | | 3,986 |
| Vail Resorts, Inc. (a) | | 195,000 | | | | 7,332 |
| Wynn Resorts Ltd. (a)(d) | | 793,500 | | | | 60,393 |
| | | | | | | 231,612 |
| Household Durables – 1.2% | | | | | | |
| Ethan Allen Interiors, Inc. | | 94,800 | | | | 4,256 |
| Garmin Ltd. | | 236,600 | | | | 20,433 |
| Koninklijke Philips Electronics NV (NY Shares) | | 402,300 | | | | 13,871 |
| Whirlpool Corp. | | 652,400 | | | | 58,553 |
| | | | | | | 97,113 |
| Leisure Equipment & Products – 0.2% | | | | | | |
| SCP Pool Corp. | | 380,631 | | | | 17,783 |
| Media – 5.2% | | | | | | |
| Carmike Cinemas, Inc. | | 229,700 | | | | 5,676 |
| Grupo Televisa SA de CV (CPO) sponsored ADR | | 1,615,600 | | | | 34,251 |
| Interpublic Group of Companies, Inc. (a) | | 94,700 | | | | 907 |
| Lamar Advertising Co. Class A (a) | | 652,500 | | | | 35,881 |
| McGraw Hill Companies, Inc. | | 674,700 | | | | 37,554 |
| Meredith Corp. | | 225,700 | | | | 11,195 |
| Regal Entertainment Group Class A | | 284,700 | | | | 5,984 |
| The McClatchy Co. Class A | | 94,600 | | | | 4,276 |
| The New York Times Co. Class A (d) | | 673,765 | | | | 16,703 |
| The Walt Disney Co. (d) | | 9,674,893 | | | | 270,504 |
| | | | | | | 422,931 |
| |
| |
| See accompanying notes which are an integral part of the financial statements. | | | | |
| |
| 7 | | Semiannual Report |
| Investments (Unaudited) continued | | | | | | |
| |
| |
| Common Stocks continued | | | | | | | | |
| | | | | Shares | | Value (Note 1) |
| | | | | | | (000s) |
| |
| CONSUMER DISCRETIONARY – continued | | | | | | | | |
| Multiline Retail – 0.2% | | | | | | | | |
| Family Dollar Stores, Inc. | | | | 592,000 | | | | $ 14,800 |
| Specialty Retail – 4.4% | | | | | | | | |
| Abercrombie & Fitch Co. Class A | | | | 3,112,200 | | | | 189,004 |
| American Eagle Outfitters, Inc. | | | | 1,332,500 | | | | 43,173 |
| CarMax, Inc. (a) | | | | 112,100 | | | | 3,958 |
| Chico’s FAS, Inc. (a) | | | | 241,500 | | | | 8,950 |
| Cost Plus, Inc. (a)(e) | | | | 1,323,472 | | | | 23,293 |
| Guitar Center, Inc. (a) | | | | 127,800 | | | | 6,871 |
| Gymboree Corp. (a) | | | | 1,631,082 | | | | 49,063 |
| Urban Outfitters, Inc. (a) | | | | 1,154,700 | | | | 26,789 |
| Wet Seal, Inc. Class A (a) | | | | 943,900 | | | | 5,427 |
| | | | | | | | | 356,528 |
| Textiles, Apparel & Luxury Goods – 1.1% | | | | | | | | |
| Carter’s, Inc. (a) | | | | 226,600 | | | | 15,264 |
| Crocs, Inc. (d) | | | | 901,700 | | | | 26,961 |
| Deckers Outdoor Corp. (a)(d)(e) | | | | 791,600 | | | | 33,793 |
| Wolverine World Wide, Inc. | | | | 485,800 | | | | 12,067 |
| | | | | | | | | 88,085 |
| |
| TOTAL CONSUMER DISCRETIONARY | | | | | | | | 1,438,486 |
| |
| CONSUMER STAPLES 1.3% | | | | | | | | |
| Beverages – 0.3% | | | | | | | | |
| Hansen Natural Corp. (a) | | | | 179,096 | | | | 23,186 |
| Food Products 0.6% | | | | | | | | |
| Archer-Daniels Midland Co. | | | | 1,318,700 | | | | 47,922 |
| Household Products – 0.0% | | | | | | | | |
| Colgate-Palmolive Co. | | | | 94,600 | | | | 5,593 |
| Tobacco 0.4% | | | | | | | | |
| Reynolds American, Inc. | | | | 275,100 | | | | 30,165 |
| |
| TOTAL CONSUMER STAPLES | | | | | | | | 106,866 |
| |
| ENERGY 9.2% | | | | | | | | |
| Energy Equipment & Services – 4.3% | | | | | | | | |
| BJ Services Co. | | | | 2,473,200 | | | | 94,105 |
| Grant Prideco, Inc. (a) | | | | 755,000 | | | | 38,656 |
| National Oilwell Varco, Inc. (a) | | | | 320,870 | | | | 22,130 |
| Pride International, Inc. (a) | | | | 755,500 | | | | 26,359 |
See accompanying notes which are an integral part of the financial statements.
| Common Stocks continued | | | | | | |
| | | Shares | | Value (Note 1) |
| | | | | (000s) |
| |
| ENERGY – continued | | | | | | |
| Energy Equipment & Services – continued | | | | | | |
| Schlumberger Ltd. (NY Shares) | | 2,351,400 | | | | $ 162,576 |
| Weatherford International Ltd. (a) | | 94,600 | | | | 5,007 |
| | | | | | | 348,833 |
| Oil, Gas & Consumable Fuels – 4.9% | | | | | | |
| Arch Coal, Inc. | | 960,800 | | | | 91,266 |
| Cameco Corp. | | 3,348,800 | | | | 136,258 |
| Occidental Petroleum Corp. | | 283,900 | | | | 29,168 |
| Peabody Energy Corp. | | 1,445,500 | | | | 92,310 |
| Valero Energy Corp. | | 828,100 | | | | 53,611 |
| | | | | | | 402,613 |
| |
| TOTAL ENERGY | | | | | | 751,446 |
| |
| FINANCIALS – 8.3% | | | | | | |
| Capital Markets 6.5% | | | | | | |
| E*TRADE Financial Corp. (a) | | 2,077,300 | | | | 51,683 |
| Janus Capital Group, Inc. | | 1,195,150 | | | | 23,258 |
| Jefferies Group, Inc. | | 227,700 | | | | 15,131 |
| Lehman Brothers Holdings, Inc. (d) | | 333,100 | | | | 50,348 |
| Merrill Lynch & Co., Inc. | | 1,718,800 | | | | 131,076 |
| Morgan Stanley | | 3,612,000 | | | | 232,252 |
| TD Ameritrade Holding Corp. | | 1,242,817 | | | | 23,067 |
| | | | | | | 526,815 |
| Commercial Banks – 0.1% | | | | | | |
| Bank of America Corp. | | 189,300 | | | | 9,450 |
| Consumer Finance – 0.1% | | | | | | |
| Capital One Financial Corp. | | 142,000 | | | | 12,303 |
| Diversified Financial Services – 0.7% | | | | | | |
| Chicago Mercantile Exchange Holdings, Inc. Class A | | 94,800 | | | | 43,418 |
| Moody’s Corp. | | 236,700 | | | | 14,678 |
| | | | | | | 58,096 |
| Insurance – 0.6% | | | | | | |
| Brown & Brown, Inc. | | 94,900 | | | | 2,964 |
| Prudential Financial, Inc. | | 124,800 | | | | 9,751 |
| RLI Corp. | | 160,800 | | | | 7,976 |
| The Chubb Corp. | | 189,300 | | | | 9,757 |
| Willis Group Holdings Ltd. | | 429,200 | | | | 15,086 |
| | | | | | | 45,534 |
See accompanying notes which are an integral part of the financial statements.
| Investments (Unaudited) continued | | | | | | |
| |
| |
| Common Stocks continued | | | | | | |
| | | Shares | | Value (Note 1) |
| | | | | (000s) |
| |
| FINANCIALS – continued | | | | | | |
| Real Estate 0.2% | | | | | | |
| CB Richard Ellis Group, Inc. Class A (a) | | 179,400 | | | | $ 15,767 |
| Thrifts & Mortgage Finance – 0.1% | | | | | | |
| Clayton Holdings, Inc. | | 244,700 | | | | 5,278 |
| |
| TOTAL FINANCIALS | | | | | | 673,243 |
| |
| HEALTH CARE – 8.6% | | | | | | |
| Biotechnology – 2.2% | | | | | | |
| Biogen Idec, Inc. (a) | | 2,687,500 | | | | 120,534 |
| Charles River Laboratories International, Inc. (a) | | 533,400 | | | | 25,203 |
| Cytogen Corp. (a) | | 248,400 | | | | 805 |
| Diversa Corp. (a) | | 28,400 | | | | 299 |
| Gilead Sciences, Inc. (a) | | 331,300 | | | | 19,050 |
| Origin Agritech Ltd. (a) | | 131,300 | | | | 2,282 |
| Pharmion Corp. (a)(d) | | 355,628 | | | | 6,885 |
| | | | | | | 175,058 |
| Health Care Equipment & Supplies – 2.0% | | | | | | |
| Alcon, Inc. | | 379,000 | | | | 38,548 |
| Aspect Medical Systems, Inc. (a) | | 209,060 | | | | 5,950 |
| Cytyc Corp. (a) | | 1,586,310 | | | | 41,006 |
| Intuitive Surgical, Inc. (a) | | 284,300 | | | | 36,106 |
| Thermo Electron Corp. (a) | | 1,126,300 | | | | 43,408 |
| | | | | | | 165,018 |
| Health Care Providers & Services – 2.6% | | | | | | |
| American Retirement Corp. (a) | | 926,800 | | | | 23,541 |
| Brookdale Senior Living, Inc. | | 551,400 | | | | 20,975 |
| Healthways, Inc. (a) | | 398,000 | | | | 19,526 |
| Omnicare, Inc. | | 378,900 | | | | 21,487 |
| UnitedHealth Group, Inc. | | 1,726,300 | | | | 85,866 |
| VCA Antech, Inc. (a) | | 1,103,500 | | | | 34,308 |
| Visicu, Inc. | | 131,100 | | | | 3,120 |
| Vital Images, Inc. (a) | | 157,769 | | | | 5,274 |
| | | | | | | 214,097 |
See accompanying notes which are an integral part of the financial statements.
| Common Stocks continued | | | | | | |
| | | Shares | | Value (Note 1) |
| | | | | (000s) |
| |
| HEALTH CARE – continued | | | | | | |
| Pharmaceuticals – 1.8% | | | | | | |
| Allergan, Inc. | | 682,000 | | | | $ 70,055 |
| Elan Corp. PLC sponsored ADR (a)(d) | | 5,414,600 | | | | 79,649 |
| | | | | | | 149,704 |
| |
| TOTAL HEALTH CARE | | | | | | 703,877 |
| |
| INDUSTRIALS – 18.7% | | | | | | |
| Aerospace & Defense – 0.1% | | | | | | |
| Rockwell Collins, Inc. | | 189,300 | | | | 10,828 |
| Airlines – 2.6% | | | | | | |
| AMR Corp. (a)(d) | | 3,405,500 | | | | 83,912 |
| Continental Airlines, Inc. Class B (a)(d) | | 1,812,900 | | | | 47,208 |
| Ryanair Holdings PLC sponsored ADR (a) | | 886,100 | | | | 41,718 |
| UAL Corp. (a) | | 724,000 | | | | 26,071 |
| US Airways Group, Inc. (a) | | 285,000 | | | | 12,329 |
| | | | | | | 211,238 |
| Building Products 0.2% | | | | | | |
| Goodman Global, Inc. | | 669,700 | | | | 13,260 |
| Kingspan Group PLC (Ireland) | | 303,200 | | | | 5,011 |
| | | | | | | 18,271 |
| Commercial Services & Supplies – 2.3% | | | | | | |
| Advisory Board Co. (a) | | 143,900 | | | | 8,076 |
| Allied Waste Industries, Inc. (a) | | 2,803,201 | | | | 39,693 |
| Corporate Executive Board Co. | | 236,900 | | | | 25,379 |
| Covanta Holding Corp. (a) | | 875,400 | | | | 14,602 |
| RPS Group PLC | | 851,900 | | | | 3,076 |
| Synagro Technologies, Inc. | | 181,425 | | | | 871 |
| Tetra Tech, Inc. (a) | | 420,690 | | | | 8,174 |
| Waste Management, Inc. | | 2,336,300 | | | | 87,518 |
| | | | | | | 187,389 |
| Construction & Engineering – 2.0% | | | | | | |
| Empresas ICA Sociedad Controladora SA de CV sponsored | | | | | | |
| ADR (a) | | 490,425 | | | | 18,342 |
| Granite Construction, Inc. | | 572,493 | | | | 26,541 |
| McDermott International, Inc. (a) | | 1,319,900 | | | | 80,250 |
| Quanta Services, Inc. (a) | | 1,708,000 | | | | 27,704 |
| Shaw Group, Inc. (a) | | 276,000 | | | | 8,446 |
| | | | | | | 161,283 |
See accompanying notes which are an integral part of the financial statements.
11 Semiannual Report
| Investments (Unaudited) continued | | | | | | |
| |
| |
| Common Stocks continued | | | | | | | | |
| | | | | Shares | | Value (Note 1) |
| | | | | | | (000s) |
| |
| INDUSTRIALS – continued | | | | | | | | |
| Electrical Equipment – 2.8% | | | | | | | | |
| ABB Ltd. sponsored ADR | | | | 5,987,700 | | | | $ 85,145 |
| Rockwell Automation, Inc. | | | | 1,988,000 | | | | 144,050 |
| | | | | | | | | 229,195 |
| Machinery – 3.8% | | | | | | | | |
| Caterpillar, Inc. | | | | 776,760 | | | | 58,832 |
| Deere & Co. (d) | | | | 1,201,900 | | | | 105,503 |
| Flow International Corp. (a)(d) | | | | 1,450,872 | | | | 19,616 |
| Flowserve Corp. (a) | | | | 712,100 | | | | 40,960 |
| Pentair, Inc. | | | | 2,196,800 | | | | 84,094 |
| | | | | | | | | 309,005 |
| Road & Rail 3.5% | | | | | | | | |
| Burlington Northern Santa Fe Corp. | | | | 1,016,000 | | | | 80,802 |
| Canadian National Railway Co. | | | | 749,000 | | | | 33,584 |
| Norfolk Southern Corp. | | | | 2,283,650 | | | | 123,317 |
| Union Pacific Corp. | | | | 568,300 | | | | 51,835 |
| | | | | | | | | 289,538 |
| Trading Companies & Distributors – 1.4% | | | | | | | | |
| Fastenal Co. | | | | 475,200 | | | | 22,244 |
| Finning International, Inc. | | | | 845,200 | | | | 30,467 |
| Interline Brands, Inc. (a) | | | | 553,200 | | | | 14,826 |
| MSC Industrial Direct Co., Inc. Class A | | | | 284,200 | | | | 14,739 |
| WESCO International, Inc. (a) | | | | 393,302 | | | | 29,498 |
| | | | | | | | | 111,774 |
| |
| TOTAL INDUSTRIALS | | | | | | | | 1,528,521 |
| |
| INFORMATION TECHNOLOGY – 20.7% | | | | | | | | |
| Communications Equipment – 9.2% | | | | | | | | |
| Alcatel SA sponsored ADR (a) | | | | 4,765,000 | | | | 68,711 |
| CIENA Corp. (a) | | | | 3,338,700 | | | | 13,655 |
| CommScope, Inc. (a)(d) | | | | 2,023,900 | | | | 66,890 |
| Corning, Inc. (a) | | | | 2,084,000 | | | | 57,581 |
| Finisar Corp. (a) | | | | 4,171,100 | | | | 19,604 |
| JDS Uniphase Corp. (a) | | | | 3,992,700 | | | | 13,935 |
| Motorola, Inc. | | | | 10,935,300 | | | | 233,469 |
| Nortel Networks Corp. (a) | | | | 1,895,400 | | | | 5,041 |
| Oplink Communications, Inc. (a) | | | | 594,447 | | | | 11,461 |
| QUALCOMM, Inc. | | | | 4,651,100 | | | | 238,787 |
See accompanying notes which are an integral part of the financial statements.
| Common Stocks continued | | | | | | |
| | | Shares | | Value (Note 1) |
| | | | | (000s) |
| |
| INFORMATION TECHNOLOGY – continued | | | | | | |
| Communications Equipment – continued | | | | | | |
| Sycamore Networks, Inc. (a) | | 4,646,000 | | | | $ 21,836 |
| Tellabs, Inc. (a) | | 283,900 | | | | 4,500 |
| | | | | | | 755,470 |
| Computers & Peripherals – 1.8% | | | | | | |
| Apple Computer, Inc. (a) | | 1,918,400 | | | | 135,036 |
| Diebold, Inc. | | 247,500 | | | | 10,531 |
| | | | | | | 145,567 |
| Electronic Equipment & Instruments – 0.5% | | | | | | |
| Aeroflex, Inc. (a) | | 1,893,900 | | | | 23,882 |
| Vishay Intertechnology, Inc. (a) | | 972,800 | | | | 15,195 |
| | | | | | | 39,077 |
| Internet Software & Services – 2.3% | | | | | | |
| Akamai Technologies, Inc. (a) | | 667,700 | | | | 22,495 |
| DealerTrack Holdings, Inc. | | 273,200 | | | | 6,092 |
| Equinix, Inc. (a) | | 369,000 | | | | 24,317 |
| Google, Inc. Class A (sub. vtg.) (a) | | 182,838 | | | | 76,415 |
| Homestore, Inc. (a) | | 4,606,099 | | | | 28,281 |
| iPass, Inc. (a) | | 872,400 | | | | 7,258 |
| RealNetworks, Inc. (a) | | 2,414,584 | | | | 24,194 |
| | | | | | | 189,052 |
| IT Services – 1.1% | | | | | | |
| Electronic Data Systems Corp. | | 1,447,100 | | | | 39,187 |
| Paychex, Inc. | | 1,251,300 | | | | 50,540 |
| | | | | | | 89,727 |
| Semiconductors & Semiconductor Equipment – 5.7% | | | | | | |
| Advanced Micro Devices, Inc. (a) | | 5,066,200 | | | | 163,892 |
| ATI Technologies, Inc. (a) | | 2,970,700 | | | | 46,097 |
| Atmel Corp. (a) | | 2,222,600 | | | | 11,646 |
| Broadcom Corp. Class A (a) | | 4,049,248 | | | | 166,465 |
| Ikanos Communications, Inc. | | 615,946 | | | | 11,407 |
| Integrated Device Technology, Inc. (a) | | 1,078,300 | | | | 16,412 |
| Marvell Technology Group Ltd. (a) | | 275,700 | | | | 15,740 |
| Omnivision Technologies, Inc. (a) | | 178,800 | | | | 5,200 |
| RF Micro Devices, Inc. (a) | | 94,600 | | | | 880 |
| Texas Instruments, Inc. | | 888,000 | | | | 30,822 |
| | | | | | | 468,561 |
See accompanying notes which are an integral part of the financial statements.
13 Semiannual Report
| Investments (Unaudited) continued | | | | | | |
| |
| |
| Common Stocks continued | | | | | | |
| | | Shares | | Value (Note 1) |
| | | | | (000s) |
| |
| INFORMATION TECHNOLOGY – continued | | | | | | |
| Software 0.1% | | | | | | |
| Aspen Technology, Inc. (a) | | 391,600 | | | | $ 5,036 |
| |
| TOTAL INFORMATION TECHNOLOGY | | | | | | 1,692,490 |
| |
| MATERIALS 5.2% | | | | | | |
| Chemicals – 3.1% | | | | | | |
| Airgas, Inc. | | 1,160,700 | | | | 46,950 |
| Arch Chemicals, Inc. | | 182,000 | | | | 5,362 |
| Material Sciences Corp. (a) | | 2,400 | | | | 25 |
| Monsanto Co. | | 1,736,100 | | | | 144,791 |
| Syngenta AG sponsored ADR | | 2,066,300 | | | | 57,402 |
| | | | | | | 254,530 |
| Metals & Mining – 2.0% | | | | | | |
| Allegheny Technologies, Inc. | | 1,800,100 | | | | 124,819 |
| Carpenter Technology Corp. | | 88,400 | | | | 10,515 |
| United States Steel Corp. | | 426,500 | | | | 29,215 |
| | | | | | | 164,549 |
| Paper & Forest Products 0.1% | | | | | | |
| P.H. Glatfelter Co. | | 255,500 | | | | 4,783 |
| |
| TOTAL MATERIALS | | | | | | 423,862 |
| |
| TELECOMMUNICATION SERVICES – 5.6% | | | | | | |
| Diversified Telecommunication Services – 2.2% | | | | | | |
| Cbeyond Communications, Inc. | | 212,548 | | | | 4,198 |
| Qwest Communications International, Inc. (a) | | 26,176,500 | | | | 175,644 |
| | | | | | | 179,842 |
| Wireless Telecommunication Services – 3.4% | | | | | | |
| America Movil SA de CV Series L sponsored ADR | | 1,042,200 | | | | 38,468 |
| American Tower Corp. Class A (a) | | 4,373,400 | | | | 149,308 |
| Centennial Communications Corp. Class A | | 1,111,821 | | | | 7,583 |
| Dobson Communications Corp. Class A (a) | | 4,683,000 | | | | 42,147 |
| NII Holdings, Inc. (a) | | 700,400 | | | | 41,954 |
| | | | | | | 279,460 |
| |
| TOTAL TELECOMMUNICATION SERVICES | | | | | | 459,302 |
See accompanying notes which are an integral part of the financial statements.
| Common Stocks continued | | | | | | |
| | | Shares | | Value (Note 1) |
| | | | | (000s) |
| |
| UTILITIES – 0.3% | | | | | | |
| Independent Power Producers & Energy Traders – 0.3% | | | | | | |
| Mirant Corp. (a) | | 758,500 | | | | $ 18,629 |
| TOTAL COMMON STOCKS | | | | | | |
| (Cost $6,546,278) | | | | | | 7,796,722 |
| Convertible Preferred Stocks 0.0% | | | | | | |
| |
| INFORMATION TECHNOLOGY – 0.0% | | | | | | |
| Communications Equipment – 0.0% | | | | | | |
| Chorum Technologies, Inc. Series E (a)(f) | | 15,100 | | | | 0 |
| TOTAL CONVERTIBLE PREFERRED STOCKS | | | | | | |
| (Cost $227) | | | | | | 0 |
| Money Market Funds 10.0% | | | | | | |
| Fidelity Cash Central Fund, 4.8% (b) | | 574,506,639 | | | | 574,507 |
| Fidelity Securities Lending Cash Central Fund, 4.83% (b)(c) | | 241,375,865 | | | | 241,376 |
| TOTAL MONEY MARKET FUNDS | | | | | | |
| (Cost $815,883) | | | | | | 815,883 |
| |
| TOTAL INVESTMENT PORTFOLIO – 105.5% | | | | | | |
| (Cost $7,362,388) | | | | | | 8,612,605 |
| |
| NET OTHER ASSETS – (5.5)% | | | | | | (446,476) |
| NET ASSETS 100% | | | | | | $ 8,166,129 |
Legend
(a) Non-income producing
(b) Affiliated fund that is available only to
investment companies and other
accounts managed by Fidelity
Investments. The rate quoted is the
annualized seven-day yield of the fund
at period end. A complete unaudited
listing of the fund’s holdings as of its
most recent quarter end is available
upon request.
|
(c) Investment made with cash collateral
received from securities on loan.
(d) Security or a portion of the security is on
loan at period end.
(e) Affiliated company
|
See accompanying notes which are an integral part of the financial statements.
15 Semiannual Report
Investments (Unaudited) continued
(f) Restricted securities – Investment in
securities not registered under the
Securities Act of 1933 (excluding 144A
issues). At the end of the period, the
value of restricted securities (excluding
144A issues) amounted to $0 or 0.0% of
net assets.
|
Additional information on each holding is as follows:
| | | Acquisition | | Acquisition |
| Security | | Date | | Cost (000s) |
| Chorum | | | | | | |
| Technologies, Inc. | | | | | | |
| Series E | | 9/19/00 | | | | $ 227 |
Affiliated Central Funds
Information regarding fiscal year to date income earned by the fund from the affiliated Central funds is as follows:
| Fund | | Income earned |
| | | (Amounts in thousands) |
| Fidelity Cash Central Fund | | | | $ 11,206 |
| Fidelity Securities Lending Cash Central Fund | | | | 1,094 |
| Total | | | | $ 12,300 |
Other Affiliated Issuers
An affiliated company is a company in which the fund has ownership of at least 5% of the voting securities. Fiscal year to date transactions with companies which are or were affiliates are as follows:
| | | Value, | | Purchases | | | | Sales | | | | Dividend | | Value, end of |
| Affiliate | | beginning of | | | | | | | | Proceeds | | | | Income | | period |
| (Amounts in thousands) | | period | | | | | | | | | | | | | | | | |
| Cost Plus, Inc. | | $ — | | | | $ 23,662 | | | | $ — | | | | $ — | | | | $ 23,293 |
| Deckers Outdoor Corp. | | — | | | | 28,935 | | | | | | | | | | | | 33,793 |
| Gymboree Corp. | | 5,260 | | | | 29,020 | | | | 1,016 | | | | — | | | | — |
| Monster Worldwide, | | | | | | | | | | | | | | | | | | |
| Inc. | | 218,042 | | | | — | | | | 225,153 | | | | — | | | | — |
| New York Mortgage | | | | | | | | | | | | | | | | | | |
| Trust, Inc. | | 7,975 | | | | — | | | | 7,471 | | | | 196 | | | | — |
| Total | | $ 231,277 | | | | $ 81,617 | | | | $ 233,640 | | | | $ 196 | | | | $ 57,086 |
See accompanying notes which are an integral part of the financial statements.
Semiannual Report 16
Other Information
Distribution of investments by country of issue, as a percentage of total net assets, is as follows:
| United States of America | | 87.4% |
| Canada | | 3.2% |
| Switzerland | | 2.2% |
| Netherlands Antilles | | 2.0% |
| Ireland | | 1.5% |
| Mexico | | 1.1% |
| Panama | | 1.0% |
| Others (individually less than 1%) . | | 1.6% |
| | | 100.0% |
See accompanying notes which are an integral part of the financial statements.
17 Semiannual Report
| Financial Statements | | | | | | |
| |
| Statement of Assets and Liabilities | | | | | | |
| Amounts in thousands (except per share amount) | | | | April 30, 2006 (Unaudited) |
| |
| Assets | | | | | | |
| Investment in securities, at value (including securities | | | | | | |
| loaned of $235,809) See accompanying schedule: | | | | | | |
| Unaffiliated issuers (cost $6,493,908) | | | | $ 7,739,636 | | |
| Affiliated Central Funds (cost $815,883) | | | | 815,883 | | |
| Other affiliated issuers (cost $52,597) | | | | 57,086 | | |
| Total Investments (cost $7,362,388) | | | | | | $ 8,612,605 |
| Receivable for investments sold | | | | | | 25,908 |
| Receivable for fund shares sold | | | | | | 12,795 |
| Dividends receivable | | | | | | 1,232 |
| Interest receivable | | | | | | 2,086 |
| Prepaid expenses | | | | | | 20 |
| Other affiliated receivables | | | | | | 35 |
| Other receivables | | | | | | 576 |
| Total assets | | | | | | 8,655,257 |
| |
| Liabilities | | | | | | |
| Payable for investments purchased | | | | $ 234,612 | | |
| Payable for fund shares redeemed | | | | 6,665 | | |
| Accrued management fee | | | | 4,756 | | |
| Other affiliated payables | | | | 1,564 | | |
| Other payables and accrued expenses | | | | 155 | | |
| Collateral on securities loaned, at value | | | | 241,376 | | |
| Total liabilities | | | | | | 489,128 |
| |
| Net Assets | | | | | | $ 8,166,129 |
| Net Assets consist of: | | | | | | |
| Paid in capital | | | | | | $ 6,550,824 |
| Undistributed net investment income | | | | | | 10,656 |
| Accumulated undistributed net realized gain (loss) on | | | | | | |
| investments and foreign currency transactions | | | | | | 354,423 |
| Net unrealized appreciation (depreciation) on | | | | | | |
| investments and assets and liabilities in foreign | | | | | | |
| currencies | | | | | | 1,250,226 |
| Net Assets, for 293,652 shares outstanding | | | | | | $ 8,166,129 |
| Net Asset Value, offering price and redemption price per | | | | | | |
| share ($8,166,129 ÷ 293,652 shares) | | | | | | $ 27.81 |
See accompanying notes which are an integral part of the financial statements.
Semiannual Report 18
| Statement of Operations | | | | | | |
| Amounts in thousands | | Six months ended April 30, 2006 (Unaudited) |
| |
| Investment Income | | | | | | |
| Dividends (including $196 received from other | | | | | | |
| affiliated issuers) | | | | | | $ 31,263 |
| Interest | | | | | | 578 |
| Income from affiliated Central Funds | | | | | | 12,300 |
| Total income | | | | | | 44,141 |
| |
| Expenses | | | | | | |
| Management fee | | | | | | |
| Basic fee | | | | $ 21,551 | | |
| Performance adjustment | | | | 5,239 | | |
| Transfer agent fees | | | | 7,965 | | |
| Accounting and security lending fees | | | | 587 | | |
| Independent trustees’ compensation | | | | 15 | | |
| Appreciation in deferred trustee compensation account | | | | 7 | | |
| Custodian fees and expenses | | | | 122 | | |
| Registration fees | | | | 155 | | |
| Audit | | | | 52 | | |
| Legal | | | | 31 | | |
| Miscellaneous | | | | 33 | | |
| Total expenses before reductions | | | | 35,757 | | |
| Expense reductions | | | | (2,361) | | 33,396 |
| |
| Net investment income (loss) | | | | | | 10,745 |
| Realized and Unrealized Gain (Loss) | | | | | | |
| Net realized gain (loss) on: | | | | | | |
| Investment securities: | | | | | | |
| Unaffiliated issuers | | | | 328,039 | | |
| Other affiliated issuers | | | | 29,981 | | |
| Foreign currency transactions | | | | (284) | | |
| Futures contracts | | | | 7,164 | | |
| Total net realized gain (loss) | | | | | | 364,900 |
| Change in net unrealized appreciation (depreciation) on: | | | | | | |
| Investment securities | | | | 760,624 | | |
| Assets and liabilities in foreign currencies | | | | (3) | | |
| Futures contracts | | | | 1,508 | | |
| Total change in net unrealized appreciation | | | | | | |
| (depreciation) | | | | | | 762,129 |
| Net gain (loss) | | | | | | 1,127,029 |
| Net increase (decrease) in net assets resulting from | | | | | | |
| operations | | | | | | $ 1,137,774 |
See accompanying notes which are an integral part of the financial statements.
19 Semiannual Report
| Financial Statements continued | | | | | | | | |
| |
| |
| Statement of Changes in Net Assets | | | | | | | | |
| | | Six months ended | | | | Year ended |
| | | April 30, 2006 | | | | October 31, |
| Amounts in thousands | | (Unaudited) | | | | 2005 |
| Increase (Decrease) in Net Assets | | | | | | | | |
| Operations | | | | | | | | |
| Net investment income (loss) | | | | $ 10,745 | | | | $ (3,320) |
| Net realized gain (loss) | | | | 364,900 | | | | 682,010 |
| Change in net unrealized appreciation (depreciation) . | | | | 762,129 | | | | (103,351) |
| Net increase (decrease) in net assets resulting | | | | | | | | |
| from operations | | | | 1,137,774 | | | | 575,339 |
| Distributions to shareholders from net investment income . | | | | — | | | | (2,359) |
| Distributions to shareholders from net realized gain | | | | (656,523) | | | | (285,485) |
| Total distributions | | | | (656,523) | | | | (287,844) |
| Share transactions | | | | | | | | |
| Proceeds from sales of shares | | | | 1,100,035 | | | | 2,301,286 |
| Reinvestment of distributions | | | | 631,915 | | | | 276,903 |
| Cost of shares redeemed | | | | (1,016,663) | | | | (1,757,319) |
| Net increase (decrease) in net assets resulting from | | | | | | | | |
| share transactions | | | | 715,287 | | | | 820,870 |
| Total increase (decrease) in net assets | | | | 1,196,538 | | | | 1,108,365 |
| |
| Net Assets | | | | | | | | |
| Beginning of period | | | | 6,969,591 | | | | 5,861,226 |
| End of period (including undistributed net investment | | | | | | | | |
| income of $10,656 and accumulated net investment | | | | | | | | |
| loss of $89, respectively) | | | | $ 8,166,129 | | | | $ 6,969,591 |
| |
| Other Information | | | | | | | | |
| Shares | | | | | | | | |
| Sold | | | | 41,241 | | | | 89,960 |
| Issued in reinvestment of distributions | | | | 24,967 | | | | 10,812 |
| Redeemed | | | | (38,380) | | | | (68,970) |
| Net increase (decrease) | | | | 27,828 | | | | 31,802 |
See accompanying notes which are an integral part of the financial statements.
| Financial Highlights | | | | | | | | | | | | |
| | | Six months ended | | | | | | | | | | |
| | | April 30, 2006 | | Years ended October 31, |
| | | (Unaudited) | | 2005 | | 2004 | | 2003 | | 2002 | | 2001 |
| Selected Per Share Data | | | | | | | | | | | | | | |
| Net asset value, | | | | | | | | | | | | | | |
| beginning of period | | | | $ 26.22 | | $ 25.05 | | $ 23.53 | | $ 16.28 | | $ 18.57 | | $ 25.82 |
| Income from Investment | | | | | | | | | | | | | | |
| Operations | | | | | | | | | | | | | | |
| Net investment | | | | | | | | | | | | | | |
| income (loss)E | | | | .04 | | (.01)F | | (.03) | | (.06) | | (.07) | | .04 |
| Net realized and un | | | | | | | | | | | | | | |
| realized gain (loss) | | | | 4.01 | | 2.40 | | 1.58 | | 7.31 | | (2.22) | | (5.01) |
| Total from investment | | | | | | | | | | | | | | |
| operations | | | | 4.05 | | 2.39 | | 1.55 | | 7.25 | | (2.29) | | (4.97) |
| Distributions from net | | | | | | | | | | | | | | |
| investment income | | | | — | | (.01) | | (.01) | | — | | — | | (.15) |
| Distributions from net | | | | | | | | | | | | | | |
| realized gain | | | | (2.46) | | (1.21) | | (.02) | | — | | — | | (2.13) |
| Total distributions | | | | (2.46) | | (1.22) | | (.03) | | — | | — | | (2.28) |
| Net asset value, | | | | | | | | | | | | | | |
| end of period | | | | $ 27.81 | | $ 26.22 | | $ 25.05 | | $ 23.53 | | $ 16.28 | | $ 18.57 |
| Total ReturnB,C,D | | | | 16.37% | | 9.66% | | 6.60% | | 44.53% | | (12.33)% | | (20.86)% |
| Ratios to Average Net AssetsG | | | | | | | | | | | | | | |
| Expenses before | | | | | | | | | | | | | | |
| reductions | | | | .94%A | | .94% | | .94% | | .91% | | 1.07% | | .94% |
| Expenses net of fee | | | | | | | | | | | | | | |
| waivers, if any | | | | .94%A | | .94% | | .94% | | .91% | | 1.07% | | .94% |
| Expenses net of all | | | | | | | | | | | | | | |
| reductions | | | | .88%A | | .90% | | .91% | | .88% | | 1.03% | | .91% |
| Net investment in | | | | | | | | | | | | | | |
| come (loss) | | | | .28%A | | (.05)%F | | (.12)% | | (.31)% | | (.35)% | | .17% |
| Supplemental Data | | | | | | | | | | | | | | |
| Net assets, end of | | | | | | | | | | | | | | |
| period (in millions) | | | | $ 8,166 | | $ 6,970 | | $ 5,861 | | $ 3,943 | | $ 1,705 | | $ 2,118 |
| Portfolio turnover | | | | | | | | | | | | | | |
| rate | | | | 198%A | | 109% | | 72% | | 54% | | 80% | | 120% |
A Annualized
B Total returns for periods of less than one year are not annualized.
C Total returns would have been lower had certain expenses not been reduced during the periods shown.
D Total returns do not include the effect of the former contingent deferred sales charge.
E Calculated based on average shares outstanding during the period.
F Investment income per share reflects a special dividend which amounted to $.03 per share. Excluding the special dividend, the ratio of net investment
income (loss) to average net assets would have been (.19)%.
G Expense ratios reflect operating expenses of the fund. Expenses before reductions do not reflect amounts reimbursed by the investment adviser or reduc
tions from brokerage service arrangements or other expense offset arrangements and do not represent the amount paid by the fund during periods when
reimbursements or reductions occur. Expenses net of fee waivers reflect expenses after reimbursement by the investment adviser but prior to reductions
from brokerage service arrangements or other expense offset arrangements. Expenses net of all reductions represent the net expenses paid by the fund.
|
See accompanying notes which are an integral part of the financial statements.
21 Semiannual Report
Notes to Financial Statements
For the period ended April 30, 2006 (Unaudited)
(Amounts in thousands except ratios)
1. Significant Accounting Policies.
Fidelity Capital Appreciation Fund (the fund) is a fund of Fidelity Capital Trust (the trust) and is authorized to issue an unlimited number of shares. The trust is registered under the Investment Company Act of 1940, as amended (the 1940 Act), as an open end management investment company organized as a Massachusetts business trust. The fund may invest in affiliated money market central funds (Money Market Central Funds), which are open end investment companies available to investment companies and other accounts managed by Fidelity Management & Research Company (FMR) and its affili ates. The financial statements have been prepared in conformity with accounting principles generally accepted in the United States of America, which require manage ment to make certain estimates and assumptions at the date of the financial statements. The following summarizes the significant accounting policies of the fund:
Security Valuation. Investments are valued and net asset value (NAV) per share is calculated (NAV calculation) as of the close of business of the New York Stock Exchange (NYSE), normally 4:00 p.m. Eastern time. Wherever possible, the fund uses independent pricing services approved by the Board of Trustees to value its investments.
Equity securities, including restricted securities, for which market quotations are readily available, are valued at the last reported sale price or official closing price as reported by an independent pricing service on the primary market or exchange on which they are traded. In the event there were no sales during the day or closing prices are not available, securities are valued at the last quoted bid price. Debt securities, including restricted securities, for which quotations are readily available, are valued by independent pricing services or by dealers who make markets in such securities. Pricing services consider yield or price of bonds of comparable quality, coupon, maturity and type as well as dealer supplied prices. Investments in open end mutual funds, are valued at their closing net asset value each business day. Short term securities with remaining maturities of sixty days or less for which quotations are not readily available are valued at amortized cost, which approximates value.
When current market prices or quotations are not readily available or do not accurately reflect fair value, valuations may be determined in accordance with procedures adopted by the Board of Trustees. For example, when developments occur between the close of a market and the close of the NYSE that may materially affect the value of some or all of the securities, or when trading in a security is halted, those securities may be fair valued. Factors used in the determination of fair value may include monitoring news to identify significant market or security specific events such as changes in the value of U.S. securi ties markets, reviewing developments in foreign markets and evaluating the performance of ADRs, futures contracts and exchange traded funds. Because the fund’s utilization of
| 1. Significant Accounting Policies continued |
Security Valuation continued | | |
fair value pricing depends on market activity, the frequency with which fair value pricing is used can not be predicted and may be utilized to a significant extent. The value of securities used for NAV calculation under fair value pricing may differ from published prices for the same securities.
Foreign Currency. The fund uses foreign currency contracts to facilitate transactions in foreign denominated securities. Losses from these transactions may arise from changes in the value of the foreign currency or if the counterparties do not perform under the contracts’ terms.
Foreign denominated assets, including investment securities, and liabilities are trans lated into U.S. dollars at the exchange rate at period end. Purchases and sales of invest ment securities, income and dividends received and expenses denominated in foreign currencies are translated into U.S. dollars at the exchange rate in effect on the transaction date.
The effects of exchange rate fluctuations on investments are included with the net realized and unrealized gain (loss) on investment securities. Other foreign currency transactions resulting in realized and unrealized gain (loss) are disclosed separately.
Investment Transactions and Income. Security transactions are accounted for as of trade date. Gains and losses on securities sold are determined on the basis of identified cost and may include proceeds received from litigation. Dividend income is recorded on the ex dividend date, except for certain dividends from foreign securities where the ex dividend date may have passed, which are recorded as soon as the fund is informed of the ex dividend date. Non cash dividends included in dividend income, if any, are recorded at the fair market value of the securities received. Distributions received on securities that represent a return of capital or capital gain are recorded as a reduction of cost of investments and/or as a realized gain. The fund estimates the components of distributions received that may be considered return of capital distributions or capital gain distributions. Interest income is accrued as earned. Interest income includes coupon interest and amortization of premium and accretion of discount on debt securi ties. Investment income is recorded net of foreign taxes withheld where recovery of such taxes is uncertain.
Expenses. Most expenses of the trust can be directly attributed to a fund. Expenses which cannot be directly attributed are apportioned among each fund in the trust.
23 Semiannual Report
| Notes to Financial Statements (Unaudited) continued |
| (Amounts in thousands except ratios) |
| |
| 1. Significant Accounting Policies continued |
Deferred Trustee Compensation. Under a Deferred Compensation Plan (the Plan), independent Trustees must defer receipt of a portion of, and may elect to defer receipt of an additional portion of, their annual compensation. Deferred amounts are treated as though equivalent dollar amounts had been invested in shares of the fund or are invested in a cross section of other Fidelity funds, and are marked to market. Deferred amounts remain in the fund until distributed in accordance with the Plan.
Income Tax Information and Distributions to Shareholders. Each year, the fund intends to qualify as a regulated investment company by distributing all of its taxable income and realized gains under Subchapter M of the Internal Revenue Code. As a result, no provision for income taxes is required in the accompanying financial statements. Foreign taxes are provided for based on the fund’s understanding of the tax rules and rates that exist in the foreign markets in which it invests.
Distributions are recorded on the ex dividend date. Income and capital gain distribu tions are determined in accordance with income tax regulations, which may differ from generally accepted accounting principles. In addition, the fund claimed a portion of the payment made to redeeming shareholders as a distribution for income tax purposes.
Capital accounts within the financial statements are adjusted for permanent book tax differences. These adjustments have no impact on net assets or the results of operations. Temporary book tax differences will reverse in a subsequent period.
Book tax differences are primarily due to futures transactions, foreign currency transac tions, passive foreign investment companies (PFIC), deferred trustees compensation and losses deferred due to wash sales.
The federal tax cost of investments and unrealized appreciation (depreciation) as of period end were as follows:
| Unrealized appreciation | | | | $ 1,349,471 |
| Unrealized depreciation | | | | (102,696) |
| Net unrealized appreciation (depreciation) | | | | $ 1,246,775 |
| Cost for federal income tax purposes | | | | $ 7,365,830 |
| |
| 2. Operating Policies. | | | | |
Repurchase Agreements. FMR has received an Exemptive Order from the Securities and Exchange Commission (the SEC) which permits the fund and other affiliated entities of FMR to transfer uninvested cash balances into joint trading accounts which are then invested in repurchase agreements. The fund may also invest directly with institutions in repurchase agreements. Repurchase agreements are collateralized by
2. Operating Policies continued
Repurchase Agreements continued
government or non government securities. Upon settlement date, collateral is held in segregated accounts with custodian banks and may be obtained in the event of a default of the counterparty. The fund monitors, on a daily basis, the value of the collateral to ensure it is at least equal to the principal amount of the repurchase agreement (including accrued interest). In the event of a default by the counterparty, realization of the collateral proceeds could be delayed, during which time the value of the collateral may decline.
Futures Contracts. The fund may use futures contracts to manage its exposure to the stock market. Buying futures tends to increase a fund’s exposure to the underlying instrument, while selling futures tends to decrease a fund’s exposure to the underlying instrument or hedge other fund investments. Upon entering into a futures contract, a fund is required to deposit with a clearing broker, no later than the following business day, an amount (“initial margin”) equal to a certain percentage of the face value of the contract. The initial margin may be in the form of cash or securities and is transferred to a segregated account on settlement date. Subsequent payments (“variation margin”) are made or received by a fund depending on the daily fluctuations in the value of the futures contract and are accounted for as unrealized gains or losses. Realized gains (losses) are recorded upon the expiration or closing of the futures contract. Securities deposited to meet margin requirements are identified in the Schedule of Investments. Losses may arise from changes in the value of the underlying instruments or if the counterparties do not perform under the contract’s terms. Futures contracts are valued at the settlement price established each day by the board of trade or exchange on which they are traded.
Restricted Securities. The fund may invest in securities that are subject to legal or contractual restrictions on resale. These securities generally may be resold in transac tions exempt from registration or to the public if the securities are registered. Disposal of these securities may involve time consuming negotiations and expense, and prompt sale at an acceptable price may be difficult. Information regarding restricted securities is included at the end of the fund’s Schedule of Investments.
3. Purchases and Sales of Investments.
Purchases and sales of securities, other than short term securities and U.S. government securities, aggregated $7,655,012 and $6,945,207, respectively.
25 Semiannual Report
| Notes to Financial Statements (Unaudited) continued |
| (Amounts in thousands except ratios) |
| |
| 4. Fees and Other Transactions with Affiliates. |
Management Fee. FMR and its affiliates provide the fund with investment manage ment related services for which the fund pays a monthly management fee. The manage ment fee is the sum of an individual fund fee rate that is based on an annual rate of .30% of the fund’s average net assets and a group fee rate that averaged .27% during the period. The group fee rate is based upon the average net assets of all the mutual funds advised by FMR. The group fee rate decreases as assets under management increase and increases as assets under management decrease. In addition, the management fee is subject to a performance adjustment (up to a maximum of .20% of the fund’s average net assets over a 36 month performance period). The upward or downward adjustment to the management fee is based on the fund’s relative investment performance as compared to an appropriate benchmark index. For the period, the total annualized management fee rate, including the performance adjustment, was .71% of the fund’s average net assets.
Transfer Agent Fees. Fidelity Service Company, Inc. (FSC), an affiliate of FMR, is the fund’s transfer, dividend disbursing and shareholder servicing agent. FSC receives account fees and asset based fees that vary according to account size and type of account. FSC pays for typesetting, printing and mailing of shareholder reports, except proxy statements. For the period, the transfer agent fees were equivalent to an annualized rate of .21% of average net assets.
Accounting and Security Lending Fees. FSC maintains the fund’s accounting re cords. The accounting fee is based on the level of average net assets for the month. Under a separate contract, FSC administers the security lending program. The security lending fee is based on the number and duration of lending transactions.
Affiliated Central Funds. The fund may invest in Money Market Central Funds which seek preservation of capital and current income and are managed by Fidelity Invest ments Money Management, Inc. (FIMM), an affiliate of FMR.
The Money Market Central Funds do not pay a management fee.
Brokerage Commissions. The fund placed a portion of its portfolio transactions with brokerage firms which are affiliates of the investment adviser. The commissions paid to these affiliated firms were $78 for the period.
5. Committed Line of Credit.
|
The fund participates with other funds managed by FMR in a $4.2 billion credit facility (the “line of credit”) to be utilized for temporary or emergency purposes to fund share holder redemptions or for other short term liquidity purposes. The fund has agreed to pay commitment fees on its pro rata portion of the line of credit, which amounts to $11 and is reflected in Miscellaneous Expense on the Statement of Operations. During the period, there were no borrowings on this line of credit.
The fund lends portfolio securities from time to time in order to earn additional income. On the settlement date of the loan, the fund receives collateral (in the form of U.S. Treasury obligations, letters of credit and/or cash) against the loaned securities and maintains collateral in an amount not less than 100% of the market value of the loaned securities during the period of the loan. The market value of the loaned securities is determined at the close of business of the fund and any additional required collateral is delivered to the fund on the next business day. If the borrower defaults on its obligation to return the securities loaned because of insolvency or other reasons, a fund could experience delays and costs in recovering the securities loaned or in gaining access to the collateral. Any cash collateral received is invested in the Fidelity Securities Lending Cash Central Fund. The value of loaned securities and cash collateral at period end are disclosed on the fund’s Statement of Assets and Liabilities. Security lending income represents the income earned on investing cash collateral, less fees and expenses associated with the loan, plus any premium payments that may be received on the loan of certain types of securities. Security lending income is presented in the Statement of Operations as a component of income from affiliated central funds. Net income from lending portfolio securities during the period amounted to $1,094.
Many of the brokers with whom FMR places trades on behalf of the fund provided services to the fund in addition to trade execution. These services included payments of certain expenses on behalf of the fund totaling $2,216 for the period. In addition, through arrangements with the fund’s custodian and transfer agent, credits realized as a result of uninvested cash balances were used to reduce the fund’s expenses. During the period, these credits reduced the fund’s custody and transfer agent expenses by $3 and $142 respectively.
The fund’s organizational documents provide former and current trustees and officers with a limited indemnification against liabilities arising in connection with the performance of their duties to the fund. In the normal course of business, the fund may also enter into contracts that provide general indemnifications. The fund’s maximum exposure under these arrangements is unknown as this would be dependent on future claims that may be made against the fund. The risk of material loss from such claims is considered remote.
27 Semiannual Report
Board Approval of Investment Advisory Contracts and Management Fees
Fidelity Capital Appreciation Fund
On January 19, 2006, the Board of Trustees, including the Independent Trustees (together, the Board), voted to approve a general research services agreement (the Agreement) between FMR, FMR Co., Inc. (FMRC), Fidelity Investments Money Manage ment, Inc. (FIMM), and Fidelity Research & Analysis Company (FRAC) (together, the Investment Advisers) for the fund, effective January 20, 2006, pursuant to which FRAC may provide general research and investment advisory support services to FMRC and FIMM. The Board considered that it has approved previously various sub advisory agreements for the fund with affiliates of FMR that allow FMR to obtain research, non discretionary advice, or discretionary portfolio management at no additional expense to the fund. The Board, assisted by the advice of fund counsel and independent Trustees’ counsel, considered a broad range of information and determined that it would be beneficial for the fund to access the research and investment advisory support services supplied by FRAC at no additional expense to the fund.
The Board reached this determination in part because the new arrangement will involve no changes in (i) the contractual terms of and fees payable under the fund’s manage ment contract or sub advisory agreements; (ii) the investment process or strategies employed in the management of the fund’s assets; (iii) the nature or level of services provided under the fund’s management contract or sub advisory agreements; (iv) the day to day management of the fund or the persons primarily responsible for such man agement; or (v) the ultimate control or beneficial ownership of FMR, FMRC, or FIMM. The Board also considered that the establishment of the Agreement would not necessi tate prior shareholder approval of the Agreement or result in an assignment and termination of the fund’s management contract or sub advisory agreements under the Investment Company Act of 1940.
Because the Board was approving an arrangement with FRAC under which the fund will not bear any additional management fees or expenses and under which the fund’s portfolio manager would not change, it did not consider the fund’s investment perfor mance, competitiveness of management fee and total expenses, costs of services and profitability, or economies of scale to be significant factors in its decision.
In connection with its future renewal of the fund’s management contract and sub advisory agreements, the Board will consider: (i) the nature, extent, and quality of services provided to the fund, including shareholder and administrative services and investment performance; (ii) the competitiveness of the fund’s management fee and total expenses; (iii) the costs of the services and profitability, including the revenues earned and the expenses incurred by Fidelity in conducting the business of developing, marketing, distributing, managing, administering, and servicing the fund and its shareholders; and (iv) whether there have been economies of scale in respect of the management of the Fidelity funds, whether the Fidelity funds (including the fund) have
appropriately benefited from any such economies of scale, and whether there is potential for realization of any further economies.
Based on its evaluation of all of the conclusions noted above, and after considering all material factors, the Board ultimately concluded that the fund’s Agreement is fair and reasonable, and that the fund’s Agreement should be approved.
29 Semiannual Report
Managing Your Investments
Fidelity offers several ways to conveniently manage your personal investments via your telephone or PC. You can access your account information, conduct trades and research your investments 24 hours a day.
By Phone
Fidelity Automated Service Telephone provides a single toll free number to access account balances, positions, quotes and trading. It’s easy to navigate the service, and on your first call, the system will help you create a personal identification number (PIN) for security.


By PC
Fidelity’s web site on the Internet provides a wide range of information, including daily financial news, fund performance, interactive planning tools and news about Fidelity products and services.

* When you call the quotes line, please remember that a fund’s yield and return will vary and, except for money market funds, share price will also vary. This means that you may have a gain or loss when you sell your shares. There is no assurance that money market funds will be able to maintain a stable $1 share price; an investment in a money market fund is not insured or guar anteed by the U.S. government. Total returns are historical and include changes in share price, reinvestment of dividends and capital gains, and the effects of any sales charges.
Semiannual Report 30
To Write Fidelity
We’ll give your correspondence immediate attention and send you written confirmation upon completion of your request.

(such as changing name, address, bank, etc.)
Fidelity Investments
P.O. Box 770001
Cincinnati, OH 45277-0002
|

Buying shares
Fidelity Investments
P.O. Box 770001
Cincinnati, OH 45277-0003
Overnight Express
Fidelity Investments
Attn: Distribution Services
100 Crosby Parkway KC1H
Covington, KY 41015
Selling shares
Fidelity Investments
P.O. Box 770001
Cincinnati, OH 45277-0035
Overnight Express
Fidelity Investments
Attn: Distribution Services
100 Crosby Parkway KC1H
Covington, KY 41015
General Correspondence
Fidelity Investments
P.O. Box 500
Merrimack, NH 03054-0500
|

Buying shares
Fidelity Investments
P.O. Box 770001
Cincinnati, OH 45277-0003
Selling shares
Fidelity Investments
P.O. Box 770001
Cincinnati, OH 45277-0035
Overnight Express
Fidelity Investments
Attn: Distribution Services
100 Crosby Parkway KC1H
Covington, KY 41015
General Correspondence
Fidelity Investments
P.O. Box 500
Merrimack, NH 03054-0500
|
31 Semiannual Report
| | Investment Adviser
Fidelity Management & Research Company
Boston, MA
Investment Sub Advisers
FMR Co., Inc.
Fidelity Management & Research
(U.K.) Inc.
Fidelity Research & Analysis Company
(formerly Fidelity Management &
Research (Far East) Inc.)
Fidelity Investments Japan Limited
Fidelity International Investment
Advisors
Fidelity International Investment
Advisors (U.K.) Limited
General Distributor
Fidelity Distributors Corporation
Boston, MA
Transfer and Service Agent
Fidelity Service Company, Inc.
Boston, MA
Custodian
Brown Brothers Harriman & Co.
Boston, MA
|
| The Fidelity Telephone Connection |
| Mutual Fund 24-Hour Service |
| Exchanges/Redemptions | | |
| and Account Assistance | | 1-800-544-6666 |
| Product Information | | 1-800-544-6666 |
| Retirement Accounts | | 1-800-544-4774 |
| (8 a.m. - 9 p.m.) | | |
| TDD Service | | 1-800-544-0118 |
| for the deaf and hearing impaired | | |
| (9 a.m. - 9 p.m. Eastern time) | | |
| Fidelity Automated Service | | |
| Telephone (FAST®) (automated phone logo) | | 1-800-544-5555 |
| (automated phone logo) Automated line for quickest service |
CAF USAN-0606
1.784911.103
|

| | Fidelity®
Disciplined Equity
Fund
|
| | Semiannual Report
April 30, 2006
|


| Contents | | | | |
| |
| Chairman’s Message | | 3 | | Ned Johnson’s message to shareholders. |
| Shareholder Expense | | 4 | | An example of shareholder expenses. |
| Example | | | | |
| Investment Changes | | 5 | | A summary of major shifts in the fund’s |
| | | | | investments over the past six months. |
| Investments | | 6 | | A complete list of the fund’s investments |
| | | | | with their market values. |
| Financial Statements | | 15 | | Statements of assets and liabilities, |
| | | | | operations, and changes in net assets, as |
| | | | | well as financial highlights. |
| Notes | | 19 | | Notes to the financial statements. |
| Board Approval of | | 25 | | |
| Investment Advisory | | | | |
| Contracts and | | | | |
| Management Fees | | | | |
To view a fund’s proxy voting guidelines and proxy voting record for the 12 month period ended
June 30, visit www.fidelity.com/proxyvotingresults or visit the Securities and Exchange Commis
sion’s (SEC) web site at www.sec.gov. You may also call 1-800-544-8544 to request a free copy of
the proxy voting guidelines.
Standard & Poor’s, S&P and S&P 500 are registered service marks of The McGraw Hill Companies, Inc.
and have been licensed for use by Fidelity Distributors Corporation.
Other third party marks appearing herein are the property of their respective owners.
All other marks appearing herein are registered or unregistered trademarks or service marks
of FMR Corp. or an affiliated company.
|
| | This report and the financial statements contained herein are submitted for the general information
of the shareholders of the fund. This report is not authorized for distribution to prospective investors
in the fund unless preceded or accompanied by an effective prospectus.
A fund files its complete schedule of portfolio holdings with the SEC for the first and third
quarters of each fiscal year on Form N Q. Forms N Q are available on the SEC’s web site at
http://www.sec.gov. A fund’s Forms N Q may be reviewed and copied at the SEC’s Public Refer
ence Room in Washington, DC. Information regarding the operation of the SEC’s Public Reference
Room may be obtained by calling 1-800-SEC-0330. For a complete list of a fund’s portfolio
holdings, view the most recent quarterly holdings report, semiannual report, or annual report
on Fidelity’s web site at http://www.fidelity.com/holdings.
NOT FDIC INSURED · MAY LOSE VALUE · NO BANK GUARANTEE
Neither the fund nor Fidelity Distributors Corporation is a bank.
|
Chairman’s Message
(photograph of Edward C. Johnson)
Dear Shareholder:
Although many securities markets made gains in early 2006, there is only one certainty when it comes to investing: There is no sure thing. There are, however, a number of time tested, funda mental investment principles that can put the historical odds in your favor.
One of the basic tenets is to invest for the long term. Over time, riding out the markets’ inevitable ups and downs has proven much more effective than selling into panic or chasing the hottest trend. Even missing only a few of the markets’ best days can significantly diminish investor returns. Patience also affords the benefits of compounding of earning interest on additional income or reinvested dividends and capital gains. There are tax advantages and cost benefits to consider as well. The more you sell, the more taxes you pay, and the more you trade, the higher the costs. While staying the course doesn’t eliminate risk, it can considerably lessen the effect of short term declines.
You can further manage your investing risk through diversification. And today, more than ever, geographic diversification should be taken into account. Studies indicate that asset allocation is the single most important determinant of a portfolio’s long term success. The right mix of stocks, bonds and cash aligned to your particular risk tolerance and investment objective is very important. Age appropriate rebalancing is also an essential aspect of asset allocation. For younger investors, an emphasis on equities which historically have been the best performing asset class over time is encouraged. As investors near their specific goal, such as retirement or sending a child to college, consideration may be given to replacing volatile assets (e.g. common stocks) with more stable fixed investments (bonds or savings plans).
A third investment principle investing regularly can help lower the average cost of your purchases. Investing a certain amount of money each month or quarter helps ensure you won’t pay for all your shares at market highs. This strategy known as dollar cost averaging also reduces unconstructive “emotion” from investing, helping shareholders avoid selling weak performers just prior to an upswing, or chasing a hot performer just before a correction.
We invite you to contact us via the Internet, through our Investor Centers or over the phone. It is our privilege to provide you the information you need to make the investments that are right for you.
Sincerely,
/s/ Edward C. Johnson 3d
Edward C. Johnson 3d
3 Semiannual Report
Shareholder Expense Example
As a shareholder of the Fund, you incur two types of costs: (1) transaction costs, and (2) ongoing costs, including management fees and other Fund expenses. This Example is intended to help you understand your ongoing costs (in dollars) of investing in the Fund and to compare these costs with the ongoing costs of investing in other mutual funds. The Example is based on an investment of $1,000 invested at the beginning of the period and held for the entire period (November 1, 2005 to April 30, 2006).
The first line of the table below provides information about actual account values and actual expenses. You may use the information in this line, together with the amount you invested, to estimate the expenses that you paid over the period. Simply divide your account value by $1,000.00 (for example, an $8,600 account value divided by $1,000.00 = 8.6), then multiply the result by the number in the first line under the heading entitled “Expenses Paid During Period” to estimate the expenses you paid on your account during this period. A small balance maintenance fee of $12.00 that is charged once a year may apply for certain accounts with a value of less than $2,000. This fee is not included in the table below. If it was, the estimate of expenses you paid during the period would be higher, and your ending account value lower, by this amount.
Hypothetical Example for Comparison Purposes
The second line of the table below provides information about hypothetical account values and hypothetical expenses based on the Fund’s actual expense ratio and an assumed rate of return of 5% per year before expenses, which is not the Fund’s actual return. The hypothetical account values and expenses may not be used to estimate the actual ending account balance or expenses you paid for the period. You may use this information to compare the ongoing costs of investing in the Fund and other funds. To do so, compare this 5% hypothetical example with the 5% hypothetical examples that appear in the share holder reports of the other funds. A small balance maintenance fee of $12.00 that is charged once a year may apply for certain accounts with a value of less than $2,000. This fee is not included in the table below. If it was, the estimate of expenses you paid during the period would be higher, and your ending account value lower, by this amount.
Please note that the expenses shown in the table are meant to highlight your ongoing costs only and do not reflect any transaction costs. Therefore, the second line of the table is useful in comparing ongoing costs only, and will not help you determine the relative total costs of owning different funds.
| | | | | | | | | | | Expenses Paid |
| | | Beginning | | Ending | | During Period* |
| | | Account Value | | Account Value | | November 1, 2005 |
| | | November 1, 2005 | | April 30, 2006 | | to April 30, 2006 |
| Actual | | | | $ 1,000.00 | | | | $ 1,108.10 | | | | $ 4.81 |
| Hypothetical (5% return per year | | | | | | | | | | | | |
| before expenses) | | | | $ 1,000.00 | | | | $ 1,020.23 | | | | $ 4.61 |
* Expenses are equal to the Fund’s annualized expense ratio of .92%; multiplied by the average account value over the period, multiplied by 181/365 (to reflect the one half year period).
| Investment Changes | | | | |
| |
| |
| Top Ten Stocks as of April 30, 2006 | | | | |
| | | % of fund’s | | % of fund’s net assets |
| | | net assets | | 6 months ago |
| Exxon Mobil Corp. | | 4.5 | | 3.3 |
| Hewlett Packard Co. | | 2.5 | | 1.2 |
| JCPenney Co., Inc. | | 2.4 | | 0.3 |
| Citigroup, Inc. | | 2.4 | | 0.4 |
| Prudential Financial, Inc. | | 2.2 | | 2.4 |
| International Business Machines Corp. | | 2.1 | | 2.0 |
| MetLife, Inc. | | 2.1 | | 2.4 |
| Bank of America Corp. | | 2.1 | | 2.1 |
| Home Depot, Inc. | | 1.7 | | 1.1 |
| Goldman Sachs Group, Inc. | | 1.7 | | 1.6 |
| | | 23.7 | | |
Top Five Market Sectors as of April 30, 2006 | | |
| | | % of fund’s | | % of fund’s net assets |
| | | net assets | | 6 months ago |
| Financials | | 23.0 | | 21.5 |
| Information Technology | | 13.5 | | 16.8 |
| Energy | | 12.2 | | 11.0 |
| Consumer Discretionary | | 11.2 | | 8.9 |
| Industrials | | 10.9 | | 10.6 |
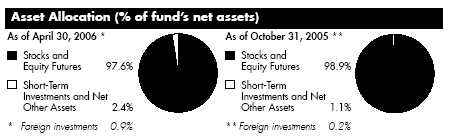
5 Semiannual Report
| Investments April 30, 2006 (Unaudited) |
| Showing Percentage of Net Assets | | | | |
| |
| Common Stocks 96.8% | | | | |
| | | Shares | | Value (Note 1) |
| | | | | (000s) |
| |
| CONSUMER DISCRETIONARY – 11.2% | | | | | | |
| Automobiles – 0.1% | | | | | | |
| Thor Industries, Inc. | | 150,000 | | | | $ 7,572 |
| Hotels, Restaurants & Leisure 0.9% | | | | | | |
| Darden Restaurants, Inc. | | 280,000 | | | | 11,088 |
| Jack in the Box, Inc. (a) | | 104,300 | | | | 4,360 |
| McDonald’s Corp. | | 1,075,000 | | | | 37,163 |
| Starbucks Corp. (a) | | 310,000 | | | | 11,554 |
| | | | | | | 64,165 |
| Household Durables – 1.0% | | | | | | |
| Champion Enterprises, Inc. (a) | | 195,000 | | | | 2,976 |
| Toll Brothers, Inc. (a) | | 1,544,400 | | | | 49,652 |
| Whirlpool Corp. | | 150,000 | | | | 13,463 |
| | | | | | | 66,091 |
| Media – 1.4% | | | | | | |
| McGraw Hill Companies, Inc. | | 300,000 | | | | 16,698 |
| Time Warner, Inc. | | 4,528,900 | | | | 78,803 |
| | | | | | | 95,501 |
| Multiline Retail – 4.0% | | | | | | |
| JCPenney Co., Inc. | | 2,581,300 | | | | 168,972 |
| Nordstrom, Inc. | | 1,792,400 | | | | 68,703 |
| Target Corp. | | 750,000 | | | | 39,825 |
| | | | | | | 277,500 |
| Specialty Retail – 3.4% | | | | | | |
| American Eagle Outfitters, Inc. | | 581,600 | | | | 18,844 |
| Dress Barn, Inc. (a) | | 1,586,400 | | | | 40,120 |
| Gymboree Corp. (a) | | 433,000 | | | | 13,025 |
| Home Depot, Inc. | | 3,033,600 | | | | 121,132 |
| Lowe’s Companies, Inc. | | 263,000 | | | | 16,582 |
| Payless ShoeSource, Inc. (a) | | 158,100 | | | | 3,632 |
| Sports Authority, Inc. (a) | | 186,900 | | | | 6,945 |
| The Men’s Wearhouse, Inc. | | 515,000 | | | | 18,252 |
| | | | | | | 238,532 |
| Textiles, Apparel & Luxury Goods – 0.4% | | | | |
| Coach, Inc. (a) | | 423,400 | | | | 13,981 |
| Phillips Van Heusen Corp. | | 115,000 | | | | 4,623 |
| Timberland Co. Class A (a) | | 170,000 | | | | 5,789 |
| | | | | | | 24,393 |
| |
| TOTAL CONSUMER DISCRETIONARY | | | | | | 773,754 |
See accompanying notes which are an integral part of the financial statements.
Semiannual Report 6
| Common Stocks continued | | | | | | |
| | | | | Shares | | Value (Note 1) |
| | | | | | | (000s) |
| |
| CONSUMER STAPLES 7.3% | | | | | | | | |
| Beverages – 1.8% | | | | | | | | |
| Pepsi Bottling Group, Inc. | | 500,000 | | | | $ 16,050 |
| PepsiCo, Inc. | | | | 1,085,800 | | | | 63,237 |
| The Coca-Cola Co. | | | | 1,045,300 | | | | 43,861 |
| | | | | | | | | 123,148 |
| Food & Staples Retailing – 2.1% | | | | | | | | |
| Costco Wholesale Corp. | | 375,000 | | | | 20,411 |
| CVS Corp. | | | | 1,423,700 | | | | 42,312 |
| Kroger Co. | | | | 1,500,000 | | | | 30,390 |
| Longs Drug Stores Corp. | | 390,000 | | | | 18,490 |
| Performance Food Group Co. (a) | | | | 190,000 | | | | 5,833 |
| Safeway, Inc. | | | | 800,000 | | | | 20,104 |
| SUPERVALU, Inc. | | | | 400,000 | | | | 11,604 |
| | | | | | | | | 149,144 |
| Food Products 2.1% | | | | | | | | |
| Archer-Daniels Midland Co. | | | | 3,100,000 | | | | 112,654 |
| General Mills, Inc. | | | | 600,000 | | | | 29,604 |
| Hormel Foods Corp. | | | | 150,000 | | | | 5,034 |
| | | | | | | | | 147,292 |
| Household Products – 0.7% | | | | | | | | |
| Energizer Holdings, Inc. (a) | | | | 150,000 | | | | 7,673 |
| Procter & Gamble Co. | | | | 649,200 | | | | 37,790 |
| | | | | | | | | 45,463 |
| Tobacco 0.6% | | | | | | | | |
| Altria Group, Inc. | | | | 350,000 | | | | 25,606 |
| Loews Corp. – Carolina Group | | | | 350,000 | | | | 17,934 |
| | | | | | | | | 43,540 |
| |
| TOTAL CONSUMER STAPLES | | | | | | | | 508,587 |
| |
| ENERGY 12.2% | | | | | | | | |
| Energy Equipment & Services – 1.4% | | | | | | | | |
| Baker Hughes, Inc. | | | | 720,700 | | | | 58,254 |
| Schlumberger Ltd. (NY Shares) | | | | 600,000 | | | | 41,484 |
| | | | | | | | | 99,738 |
| Oil, Gas & Consumable Fuels – 10.8% | | | | | | | | |
| Amerada Hess Corp. | | | | 564,700 | | | | 80,905 |
| Chevron Corp. (d) | | | | 1,446,004 | | | | 88,235 |
| ConocoPhillips | | | | 1,697,268 | | | | 113,547 |
See accompanying notes which are an integral part of the financial statements.
| Investments (Unaudited) continued | | | | | | |
| |
| |
| Common Stocks continued | | | | | | | | |
| | | | | Shares | | Value (Note 1) |
| | | | | | | (000s) |
| |
| ENERGY – continued | | | | | | | | |
| Oil, Gas & Consumable Fuels – continued | | | | | | | | |
| Exxon Mobil Corp. | | | | 4,961,900 | | | | $ 312,989 |
| Marathon Oil Corp. | | | | 260,000 | | | | 20,634 |
| Occidental Petroleum Corp. | | | | 250,000 | | | | 25,685 |
| Sunoco, Inc. | | | | 250,000 | | | | 20,260 |
| Valero Energy Corp. | | | | 1,300,000 | | | | 84,162 |
| | | | | | | | | 746,417 |
| |
| TOTAL ENERGY | | | | | | | | 846,155 |
| |
| FINANCIALS – 23.0% | | | | | | | | |
| Capital Markets 7.4% | | | | | | | | |
| Affiliated Managers Group, Inc. (a) | | | | 100,000 | | | | 10,130 |
| Bear Stearns Companies, Inc. | | | | 259,100 | | | | 36,924 |
| Charles Schwab Corp. | | | | 320,000 | | | | 5,728 |
| Franklin Resources, Inc. | | | | 284,900 | | | | 26,530 |
| Goldman Sachs Group, Inc. | | | | 750,000 | | | | 120,218 |
| Legg Mason, Inc. | | | | 260,000 | | | | 30,805 |
| Lehman Brothers Holdings, Inc. | | | | 531,900 | | | | 80,397 |
| Merrill Lynch & Co., Inc. | | | | 1,440,200 | | | | 109,830 |
| Morgan Stanley | | | | 1,465,700 | | | | 94,245 |
| | | | | | | | | 514,807 |
| Commercial Banks – 2.7% | | | | | | | | |
| Bank of America Corp. | | | | 2,868,300 | | | | 143,186 |
| KeyCorp | | | | 200,000 | | | | 7,644 |
| PNC Financial Services Group, Inc. | | | | 215,000 | | | | 15,366 |
| Wachovia Corp. | | | | 303,500 | | | | 18,164 |
| | | | | | | | | 184,360 |
| Consumer Finance – 0.1% | | | | | | | | |
| AmeriCredit Corp. (a) | | | | 175,000 | | | | 5,299 |
| Diversified Financial Services – 4.1% | | | | | | | | |
| CIT Group, Inc. | | | | 250,000 | | | | 13,503 |
| Citigroup, Inc. | | | | 3,296,500 | | | | 164,660 |
| JPMorgan Chase & Co. | | | | 2,041,685 | | | | 92,652 |
| Moody’s Corp. | | | | 237,600 | | | | 14,734 |
| | | | | | | | | 285,549 |
| Insurance – 7.4% | | | | | | | | |
| American International Group, Inc. | | | | 1,360,000 | | | | 88,740 |
| Assurant, Inc. | | | | 300,000 | | | | 14,451 |
| First American Corp., California | | | | 100,000 | | | | 4,260 |
See accompanying notes which are an integral part of the financial statements.
| Common Stocks continued | | | | | | |
| | | Shares | | Value (Note 1) |
| | | | | (000s) |
| |
| FINANCIALS – continued | | | | | | |
| Insurance – continued | | | | | | |
| Hartford Financial Services Group, Inc. | | 525,500 | | | | $ 48,309 |
| Lincoln National Corp. | | 460,000 | | | | 26,717 |
| MetLife, Inc. | | 2,832,900 | | | | 147,594 |
| Principal Financial Group, Inc. | | 257,800 | | | | 13,228 |
| Prudential Financial, Inc. | | 1,941,400 | | | | 151,682 |
| The Chubb Corp. | | 373,200 | | | | 19,235 |
| | | | | | | 514,216 |
| Real Estate 0.3% | | | | | | |
| CB Richard Ellis Group, Inc. Class A (a) | | 230,000 | | | | 20,215 |
| Thrifts & Mortgage Finance – 1.0% | | | | | | |
| FirstFed Financial Corp., Delaware (a) | | 160,000 | | | | 10,062 |
| Golden West Financial Corp., Delaware | | 260,600 | | | | 18,729 |
| Washington Mutual, Inc. | | 852,084 | | | | 38,395 |
| | | | | | | 67,186 |
| |
| TOTAL FINANCIALS | | | | | | 1,591,632 |
| |
| HEALTH CARE – 10.0% | | | | | | |
| Biotechnology – 1.7% | | | | | | |
| Amgen, Inc. (a) | | 1,200,000 | | | | 81,240 |
| Genentech, Inc. (a) | | 485,000 | | | | 38,659 |
| | | | | | | 119,899 |
| Health Care Equipment & Supplies – 0.2% | | | | | | |
| Waters Corp. (a) | | 330,000 | | | | 14,956 |
| Health Care Providers & Services – 5.8% | | | | | | |
| Aetna, Inc. | | 2,274,600 | | | | 87,572 |
| AmerisourceBergen Corp. | | 750,000 | | | | 32,363 |
| CIGNA Corp. | | 475,000 | | | | 50,825 |
| Coventry Health Care, Inc. (a) | | 511,500 | | | | 25,406 |
| Humana, Inc. (a) | | 520,200 | | | | 23,503 |
| Magellan Health Services, Inc. (a) | | 122,000 | | | | 4,959 |
| McKesson Corp. | | 330,000 | | | | 16,035 |
| Quest Diagnostics, Inc. | | 140,000 | | | | 7,802 |
| Sierra Health Services, Inc. (a) | | 100,000 | | | | 3,921 |
| UnitedHealth Group, Inc. | | 1,564,600 | | | | 77,823 |
| WellPoint, Inc. (a) | | 956,000 | | | | 67,876 |
| | | | | | | 398,085 |
| Pharmaceuticals – 2.3% | | | | | | |
| Johnson & Johnson | | 292,900 | | | | 17,167 |
See accompanying notes which are an integral part of the financial statements.
| Investments (Unaudited) continued | | | | | | |
| |
| |
| Common Stocks continued | | | | | | | | |
| | | | | Shares | | Value (Note 1) |
| | | | | | | (000s) |
| |
| HEALTH CARE – continued | | | | | | | | |
| Pharmaceuticals – continued | | | | | | | | |
| King Pharmaceuticals, Inc. (a) | | | | 1,375,000 | | | | $ 23,911 |
| Merck & Co., Inc. | | | | 686,600 | | | | 23,633 |
| Pfizer, Inc. | | | | 1,683,200 | | | | 42,635 |
| Wyeth | | | | 1,094,700 | | | | 53,279 |
| | | | | | | | | 160,625 |
| |
| TOTAL HEALTH CARE | | | | | | | | 693,565 |
| |
| INDUSTRIALS – 10.9% | | | | | | | | |
| Aerospace & Defense – 3.6% | | | | | | | | |
| General Dynamics Corp. | | | | 360,000 | | | | 23,623 |
| Lockheed Martin Corp. | | | | 500,000 | | | | 37,950 |
| Northrop Grumman Corp. | | | | 391,800 | | | | 26,211 |
| Precision Castparts Corp. | | | | 240,000 | | | | 15,115 |
| Raytheon Co. | | | | 636,700 | | | | 28,187 |
| Rockwell Collins, Inc. | | | | 139,600 | | | | 7,985 |
| The Boeing Co. | | | | 1,038,300 | | | | 86,646 |
| United Technologies Corp. | | | | 425,000 | | | | 26,694 |
| | | | | | | | | 252,411 |
| Commercial Services & Supplies – 0.3% | | | | | | | | |
| FTI Consulting, Inc. (a) | | | | 364,400 | | | | 10,473 |
| Labor Ready, Inc. (a) | | | | 380,500 | | | | 10,057 |
| | | | | | | | | 20,530 |
| Construction & Engineering – 0.3% | | | | | | | | |
| McDermott International, Inc. (a) | | | | 300,000 | | | | 18,240 |
| Electrical Equipment – 0.1% | | | | | | | | |
| Lamson & Sessions Co. (a)(d) | | | | 317,580 | | | | 7,987 |
| Industrial Conglomerates – 1.6% | | | | | | | | |
| General Electric Co. | | | | 3,267,100 | | | | 113,009 |
| Machinery – 2.2% | | | | | | | | |
| Caterpillar, Inc. | | | | 536,000 | | | | 40,597 |
| Cummins, Inc. | | | | 80,000 | | | | 8,360 |
| Illinois Tool Works, Inc. | | | | 400,000 | | | | 41,080 |
| Ingersoll-Rand Co. Ltd. Class A | | | | 785,200 | | | | 34,353 |
| JLG Industries, Inc. | | | | 400,000 | | | | 11,472 |
| PACCAR, Inc. | | | | 225,000 | | | | 16,184 |
| | | | | | | | | 152,046 |
See accompanying notes which are an integral part of the financial statements.
| Common Stocks continued | | | | | | |
| | | Shares | | Value (Note 1) |
| | | | | (000s) |
| |
| INDUSTRIALS – continued | | | | | | |
| Road & Rail 2.6% | | | | | | |
| Burlington Northern Santa Fe Corp. | | 490,800 | | | | $ 39,033 |
| Con-way, Inc. | | 66,600 | | | | 3,711 |
| CSX Corp. | | 1,673,300 | | | | 114,604 |
| Norfolk Southern Corp. | | 422,000 | | | | 22,788 |
| | | | | | | 180,136 |
| Trading Companies & Distributors – 0.2% | | | | | | |
| WESCO International, Inc. (a) | | 150,000 | | | | 11,250 |
| |
| TOTAL INDUSTRIALS | | | | | | 755,609 |
| |
| INFORMATION TECHNOLOGY – 13.5% | | | | | | |
| Communications Equipment – 2.4% | | | | | | |
| Corning, Inc. (a) | | 326,000 | | | | 9,007 |
| Harris Corp. | | 540,000 | | | | 25,148 |
| Motorola, Inc. | | 3,790,400 | | | | 80,925 |
| QUALCOMM, Inc. | | 1,000,000 | | | | 51,340 |
| | | | | | | 166,420 |
| Computers & Peripherals – 6.2% | | | | | | |
| Apple Computer, Inc. (a) | | 1,361,700 | | | | 95,850 |
| Hewlett-Packard Co. | | 5,250,000 | | | | 170,468 |
| International Business Machines Corp. | | 1,805,700 | | | | 148,681 |
| Komag, Inc. (a) | | 300,000 | | | | 12,612 |
| | | | | | | 427,611 |
| Electronic Equipment & Instruments – 0.1% | | | | | | |
| Arrow Electronics, Inc. (a) | | 178,300 | | | | 6,454 |
| IT Services – 0.3% | | | | | | |
| Ceridian Corp. (a) | | 120,000 | | | | 2,908 |
| Electronic Data Systems Corp. | | 800,000 | | | | 21,664 |
| | | | | | | 24,572 |
| Semiconductors & Semiconductor Equipment – 3.6% | | | | | | |
| Applied Materials, Inc. | | 1,500,000 | | | | 26,925 |
| Freescale Semiconductor, Inc. Class B (a) | | 488,300 | | | | 15,464 |
| Lam Research Corp. (a) | | 698,000 | | | | 34,118 |
| National Semiconductor Corp. | | 2,311,200 | | | | 69,290 |
| Texas Instruments, Inc. | | 3,036,000 | | | | 105,380 |
| | | | | | | 251,177 |
| Software 0.9% | | | | | | |
| BMC Software, Inc. (a) | | 500,000 | | | | 10,770 |
See accompanying notes which are an integral part of the financial statements.
11 Semiannual Report
| Investments (Unaudited) continued | | | | | | |
| |
| |
| Common Stocks continued | | | | | | |
| | | Shares | | Value (Note 1) |
| | | | | (000s) |
| |
| INFORMATION TECHNOLOGY – continued | | | | | | |
| Software – continued | | | | | | |
| Lawson Software, Inc. (a)(d) | | 724,300 | | | | $ 5,563 |
| Microsoft Corp. | | 1,837,900 | | | | 44,385 |
| | | | | | | 60,718 |
| |
| TOTAL INFORMATION TECHNOLOGY | | | | | | 936,952 |
| |
| MATERIALS 3.5% | | | | | | |
| Chemicals – 0.1% | | | | | | |
| A. Schulman, Inc. | | 154,000 | | | | 3,687 |
| H.B. Fuller Co. | | 90,000 | | | | 4,707 |
| | | | | | | 8,394 |
| Metals & Mining – 3.4% | | | | | | |
| Carpenter Technology Corp. | | 53,700 | | | | 6,388 |
| Commercial Metals Co. | | 561,800 | | | | 30,562 |
| Nucor Corp. | | 725,400 | | | | 78,938 |
| Phelps Dodge Corp. | | 1,074,400 | | | | 92,603 |
| Quanex Corp. | | 210,000 | | | | 8,980 |
| Reliance Steel & Aluminum Co. | | 160,000 | | | | 14,232 |
| | | | | | | 231,703 |
| |
| TOTAL MATERIALS | | | | | | 240,097 |
| |
| TELECOMMUNICATION SERVICES – 3.0% | | | | | | |
| Diversified Telecommunication Services – 2.6% | | | | | | |
| AT&T, Inc. | | 3,711,000 | | | | 97,265 |
| BellSouth Corp. | | 1,950,000 | | | | 65,871 |
| Qwest Communications International, Inc. (a) | | 2,500,000 | | | | 16,775 |
| | | | | | | 179,911 |
| Wireless Telecommunication Services – 0.4% | | | | | | |
| Sprint Nextel Corp. | | 1,215,000 | | | | 30,132 |
| |
| TOTAL TELECOMMUNICATION SERVICES | | | | | | 210,043 |
| |
| UTILITIES – 2.2% | | | | | | |
| Electric Utilities – 0.3% | | | | | | |
| Edison International | | 369,400 | | | | 14,927 |
| FirstEnergy Corp. | | 125,000 | | | | 6,339 |
| | | | | | | 21,266 |
See accompanying notes which are an integral part of the financial statements.
| Common Stocks continued | | | | | | | | | | |
| | | | | | | Shares | | Value (Note 1) |
| | | | | | | | | (000s) |
| |
| UTILITIES – continued | | | | | | | | | | |
| Independent Power Producers & Energy Traders – 1.3% | | | | | | | | | | |
| TXU Corp. | | | | | | 1,712,200 | | | | $ 84,976 |
| Multi-Utilities – 0.6% | | | | | | | | | | |
| Duke Energy Corp. | | | | | | 716,300 | | | | 20,859 |
| PG&E Corp. | | | | | | 130,000 | | | | 5,179 |
| Sempra Energy | | | | | | 372,800 | | | | 17,156 |
| | | | | | | | | | | 43,194 |
| |
| TOTAL UTILITIES | | | | | | | | | | 149,436 |
| |
| TOTAL COMMON STOCKS | | | | | | | | | | |
| (Cost $5,465,726) | | | | | | | | | | 6,705,830 |
| |
| U.S. Treasury Obligations 0.1% | | | | | | | | |
| | | | | | | Principal | | | | |
| | | | | | | Amount (000s) | | | | |
| U.S. Treasury Bills, yield at date of purchase 4.54% to | | | | | | | | |
| 4.6% 6/8/06 to 7/6/06 (e) | | | | | | | | | | |
| (Cost $6,948) | | | | | | $ 7,000 | | | | 6,949 |
| |
| Money Market Funds 5.5% | | | | | | | | |
| | | | | | | Shares | | | | |
| Fidelity Cash Central Fund, 4.8% (b) | | | | | | 357,596,755 | | | | 357,597 |
| Fidelity Securities Lending Cash Central Fund, 4.83% (b)(c) | | | | | | 22,285,450 | | | | 22,285 |
| TOTAL MONEY MARKET FUNDS | | | | | | | | | | |
| (Cost $379,882) | | | | | | | | | | 379,882 |
| |
| TOTAL INVESTMENT PORTFOLIO 102.4% | | | | | | | | | | |
| (Cost $5,852,556) | | | | | | | | | | 7,092,661 |
| |
| |
| NET OTHER ASSETS – (2.4)% | | | | | | | | | | (168,299) |
| NET ASSETS 100% | | | | | | | | | | $ 6,924,362 |
See accompanying notes which are an integral part of the financial statements.
13 Semiannual Report
| Investments (Unaudited) continued | | | | | | |
| |
| |
| Futures Contracts | | | | | | | | |
| | | Expiration | | Underlying | | Unrealized |
| | | Date | | Face Amount | | Appreciation/ |
| | | | | at Value (000s) | | (Depreciation) |
| | | | | | | (000s) |
| Purchased | | | | | | | | |
| Equity Index Contracts | | | | | | | | |
| 158 S&P 500 Index Contracts | | June 2006 | | $ 51,978 | | | | $ 866 |
The face value of futures purchased as a percentage of net assets – 0.8%
Legend
(a) Non-income producing
(b) Affiliated fund that is available only to
investment companies and other
accounts managed by Fidelity
Investments. The rate quoted is the
annualized seven-day yield of the fund
at period end. A complete unaudited
listing of the fund’s holdings as of its
most recent quarter end is available
upon request.
|
(c) Investment made with cash collateral
received from securities on loan.
(d) Security or a portion of the security is on
loan at period end.
(e) Security or a portion of the security was
pledged to cover margin requirements
for futures contracts. At the period end,
the value of securities pledged
amounted to $6,949,000.
|
Affiliated Central Funds
Information regarding fiscal year to date income earned by the fund from the affiliated Central funds is as follows:
| Fund | | Income earned |
| | | (Amounts in thousands) |
| Fidelity Cash Central Fund | | | | $ 3,833 |
| Fidelity Securities Lending Cash Central Fund | | | | 56 |
| Total | | | | $ 3,889 |
Income Tax Information
At October 31, 2005, the fund had a capital loss carryforward of approximately $70,866,000 of which $47,095,000 and $23,771,000 will expire on October 31, 2010 and 2011, respectively.
See accompanying notes which are an integral part of the financial statements.
Semiannual Report 14
| Financial Statements | | | | | | |
| |
| Statement of Assets and Liabilities | | | | | | |
| Amounts in thousands (except per share amount) | | | | April 30, 2006 (Unaudited) |
| |
| Assets | | | | | | |
| Investment in securities, at value (including securities | | | | | | |
| loaned of $21,522) See accompanying schedule: | | | | | | |
| Unaffiliated issuers (cost $5,472,674) | | | | $ 6,712,779 | | |
| Affiliated Central Funds (cost $379,882) | | | | 379,882 | | |
| Total Investments (cost $5,852,556) | | | | | | $ 7,092,661 |
| Receivable for investments sold | | | | | | 366,250 |
| Receivable for fund shares sold | | | | | | 11,493 |
| Dividends receivable | | | | | | 4,447 |
| Interest receivable | | | | | | 1,191 |
| Receivable for daily variation on futures contracts | | | | | | 32 |
| Prepaid expenses | | | | | | 17 |
| Other receivables | | | | | | 50 |
| Total assets | | | | | | 7,476,141 |
| |
| Liabilities | | | | | | |
| Payable for investments purchased | | | | $ 521,446 | | |
| Payable for fund shares redeemed | | | | 2,678 | | |
| Accrued management fee | | | | 3,899 | | |
| Other affiliated payables | | | | 1,366 | | |
| Other payables and accrued expenses | | | | 105 | | |
| Collateral on securities loaned, at value | | | | 22,285 | | |
| Total liabilities | | | | | | 551,779 |
| |
| Net Assets | | | | | | $ 6,924,362 |
| Net Assets consist of: | | | | | | |
| Paid in capital | | | | | | $ 5,575,024 |
| Undistributed net investment income | | | | | | 8,584 |
| Accumulated undistributed net realized gain (loss) on | | | | | | |
| investments | | | | | | 99,783 |
| Net unrealized appreciation (depreciation) on | | | | | | |
| investments | | | | | | 1,240,971 |
| Net Assets, for 235,478 shares outstanding | | | | | | $ 6,924,362 |
| Net Asset Value, offering price and redemption price per | | | | | | |
| share ($6,924,362 ÷ 235,478 shares) | | | | | | $ 29.41 |
See accompanying notes which are an integral part of the financial statements.
15 Semiannual Report
| Financial Statements continued | | | | | | |
| |
| |
| Statement of Operations | | | | | | |
| Amounts in thousands | | Six months ended April 30, 2006 (Unaudited) |
| |
| Investment Income | | | | �� | | |
| Dividends | | | | | | $ 50,096 |
| Interest | | | | | | 65 |
| Income from affiliated Central Funds | | | | | | 3,889 |
| Total income | | | | | | 54,050 |
| |
| Expenses | | | | | | |
| Management fee | | | | | | |
| Basic fee | | | | $ 18,124 | | |
| Performance adjustment | | | | 3,434 | | |
| Transfer agent fees | | | | 6,994 | | |
| Accounting and security lending fees | | | | 553 | | |
| Independent trustees’ compensation | | | | 13 | | |
| Appreciation in deferred trustee compensation account | | | | 3 | | |
| Custodian fees and expenses | | | | 53 | | |
| Registration fees | | | | 79 | | |
| Audit | | | | 45 | | |
| Legal | | | | 26 | | |
| Miscellaneous | | | | 27 | | |
| Total expenses before reductions | | | | 29,351 | | |
| Expense reductions | | | | (250) | | 29,101 |
| |
| Net investment income (loss) | | | | | | 24,949 |
| Realized and Unrealized Gain (Loss) | | | | | | |
| Net realized gain (loss) on: | | | | | | |
| Investment securities: | | | | | | |
| Unaffiliated issuers | | | | 174,126 | | |
| Futures contracts | | | | 1,331 | | |
| Total net realized gain (loss) | | | | | | 175,457 |
| Change in net unrealized appreciation (depreciation) on: | | | | | | |
| Investment securities | | | | 438,301 | | |
| Futures contracts | | | | 2,065 | | |
| Total change in net unrealized appreciation | | | | | | |
| (depreciation) | | | | | | 440,366 |
| Net gain (loss) | | | | | | 615,823 |
| Net increase (decrease) in net assets resulting from | | | | | | |
| operations | | | | | | $ 640,772 |
See accompanying notes which are an integral part of the financial statements.
| Statement of Changes in Net Assets | | | | | | | | |
| | | | | Six months ended | | | | Year ended |
| | | | | April 30, 2006 | | | | October 31, |
| Amounts in thousands | | | | (Unaudited) | | | | 2005 |
| Increase (Decrease) in Net Assets | | | | | | | | |
| Operations | | | | | | | | |
| Net investment income (loss) | | | | $ 24,949 | | | | $ 42,091 |
| Net realized gain (loss) | | | | 175,457 | | | | 440,256 |
| Change in net unrealized appreciation (depreciation) . | | | | 440,366 | | | | 215,352 |
| Net increase (decrease) in net assets resulting | | | | | | | | |
| from operations | | | | 640,772 | | | | 697,699 |
| Distributions to shareholders from net investment income . | | | | (39,181) | | | | (34,684) |
| Share transactions | | | | | | | | |
| Proceeds from sales of shares | | | | 730,458 | | | | 1,140,712 |
| Reinvestment of distributions | | | | 38,498 | | | | 34,006 |
| Cost of shares redeemed | | | | (291,094) | | | | (459,923) |
| Net increase (decrease) in net assets resulting from | | | | | | | | |
| share transactions | | | | 477,862 | | | | 714,795 |
| Total increase (decrease) in net assets | | | | 1,079,453 | | | | 1,377,810 |
| |
| Net Assets | | | | | | | | |
| Beginning of period | | | | 5,844,909 | | | | 4,467,099 |
| End of period (including undistributed net investment | | | | | | | | |
| income of $8,584 and undistributed net investment | | | | | | | | |
| income of $22,960, respectively) | | | | $ 6,924,362 | | | | $ 5,844,909 |
| |
| Other Information | | | | | | | | |
| Shares | | | | | | | | |
| Sold | | | | 25,519 | | | | 44,473 |
| Issued in reinvestment of distributions | | | | 1,366 | | | | 1,371 |
| Redeemed | | | | (10,257) | | | | (17,831) |
| Net increase (decrease) | | | | 16,628 | | | | 28,013 |
See accompanying notes which are an integral part of the financial statements.
17 Semiannual Report
| Financial Highlights | | | | | | | | | | | | | | | | | | | | |
| |
| | | Six months ended | | | | | | | | | | | | | | | | | | | | |
| | | April 30, 2006 | | | | Years ended October 31, |
| | | (Unaudited) | | | | 2005 | | | | 2004 | | | | 2003 | | | | 2002 | | | | 2001 |
| Selected Per Share Data | | | | | | | | | | | | | | | | | | | | | | |
| Net asset value, | | | | | | | | | | | | | | | | | | | | | | |
| beginning of | | | | | | | | | | | | | | | | | | | | | | |
| period | | $ 26.71 | | | | $ 23.41 | | | | $ 21.78 | | | | $ 18.41 | | | | $ 20.56 | | | | $ 31.14 |
| Income from | | | | | | | | | | | | | | | | | | | | | | |
| Investment | | | | | | | | | | | | | | | | | | | | | | |
| Operations | | | | | | | | | | | | | | | | | | | | | | |
| Net investment | | | | | | | | | | | | | | | | | | | | | | |
| income (loss)D | | .11 | | | | .20E | | | | .12 | | | | .10 | | | | .03 | | | | .10 |
| Net realized and | | | | | | | | | | | | | | | | | | | | | | |
| unrealized | | | | | | | | | | | | | | | | | | | | | | |
| gain (loss) | | 2.77 | | | | 3.28 | | | | 1.62 | | | | 3.30 | | | | (2.13) | | | | (6.95) |
| Total from | | | | | | | | | | | | | | | | | | | | | | |
| investment | | | | | | | | | | | | | | | | | | | | | | |
| operations | | 2.88 | | | | 3.48 | | | | 1.74 | | | | 3.40 | | | | (2.10) | | | | (6.85) |
| Distributions from | | | | | | | | | | | | | | | | | | | | | | |
| net investment | | | | | | | | | | | | | | | | | | | | | | |
| income | | (.18) | | | | (.18) | | | | (.11) | | | | (.03) | | | | (.05) | | | | (.16) |
| Distributions from | | | | | | | | | | | | | | | | | | | | | | |
| net realized gain | | — | | | | — | | | | — | | | | — | | | | | | | | (3.57) |
| Total distributions | | (.18) | | | | (.18) | | | | (.11) | | | | (.03) | | | | (.05) | | | | (3.73) |
| Net asset value, | | | | | | | | | | | | | | | | | | | | | | |
| end of period . | | $ 29.41 | | | | $ 26.71 | | | | $ 23.41 | | | | $ 21.78 | | | | $ 18.41 | | | | $ 20.56 |
| Total ReturnB,C | | 10.81% | | | | 14.92% | | | | 8.03% | | | | 18.50% | | | | (10.25)% | | | | (24.70)% |
| Ratios to Average Net AssetsF | | | | | | | | | | | | | | | | | | | | | | |
| Expenses before | | | | | | | | | | | | | | | | | | | | | | |
| reductions | | .92%A | | | | .89% | | | | .89% | | | | .92% | | | | 1.01% | | | | .85% |
| Expenses net of | | | | | | | | | | | | | | | | | | | | | | |
| fee waivers, | | | | | | | | | | | | | | | | | | | | | | |
| if any | | .92%A | | | | .89% | | | | .89% | | | | .92% | | | | 1.01% | | | | .85% |
| Expenses net of | | | | | | | | | | | | | | | | | | | | | | |
| all reductions | | .91%A | | | | .87% | | | | .88% | | | | .90% | | | | 1.00% | | | | .84% |
| Net investment | | | | | | | | | | | | | | | | | | | | | | |
| income (loss) | | .78%A | | | | .79% E | | | | .51% | | | | .50% | | | | .16% | | | | .42% |
| Supplemental Data | | | | | | | | | | | | | | | | | | | | | | |
| Net assets, end | | | | | | | | | | | | | | | | | | | | | | |
| of period | | | | | | | | | | | | | | | | | | | | | | |
| (in millions) | | $ 6,924 | | | | $ 5,845 | | | | $ 4,467 | | | | $ 3,720 | | | | $ 2,777 | | | | $ 2,792 |
| Portfolio turnover | | | | | | | | | | | | | | | | | | | | | | |
| rate | | 56%A | | | | 80% | | | | 42% | | | | 64% | | | | 68% | | | | 101% |
A Annualized
B Total returns for periods of less than one year are not annualized.
C Total returns would have been lower had certain expenses not been reduced during the periods shown.
D Calculated based on average shares outstanding during the period.
E Investment income per share reflects a special dividend which amounted to $.06 per share. Excluding the special dividend, the ratio of net investment
income (loss) to average net assets would have been .57%.
F Expense ratios reflect operating expenses of the fund. Expenses before reductions do not reflect amounts reimbursed by the investment adviser or reduc
tions from brokerage service arrangements or other expense offset arrangements and do not represent the amount paid by the fund during periods when
reimbursements or reductions occur. Expenses net of fee waivers reflect expenses after reimbursement by the investment adviser but prior to reductions
from brokerage service arrangements or other expense offset arrangements. Expenses net of all reductions represent the net expenses paid by the fund.
|
See accompanying notes which are an integral part of the financial statements.
Notes to Financial Statements
For the period ended April 30, 2006 (Unaudited)
(Amounts in thousands except ratios)
1. Significant Accounting Policies.
Fidelity Disciplined Equity Fund (the fund) is a fund of Fidelity Capital Trust (the trust) and is authorized to issue an unlimited number of shares. The trust is registered under the Investment Company Act of 1940, as amended (the 1940 Act), as an open end management investment company organized as a Massachusetts business trust. The fund may invest in affiliated money market central funds (Money Market Central Funds), which are open end investment companies available to investment companies and other accounts managed by Fidelity Management & Research Company (FMR) and its affili ates. The financial statements have been prepared in conformity with accounting principles generally accepted in the United States of America, which require manage ment to make certain estimates and assumptions at the date of the financial statements. The following summarizes the significant accounting policies of the fund:
Security Valuation. Investments are valued and net asset value (NAV) per share is calculated (NAV calculation) as of the close of business of the New York Stock Exchange (NYSE), normally 4:00 p.m. Eastern time. Wherever possible, the fund uses independent pricing services approved by the Board of Trustees to value its investments.
Equity securities, including restricted securities, for which market quotations are readily available, are valued at the last reported sale price or official closing price as reported by an independent pricing service on the primary market or exchange on which they are traded. In the event there were no sales during the day or closing prices are not available, securities are valued at the last quoted bid price. Investments in open end mutual funds, are valued at their closing net asset value each business day. Short term securities with remaining maturities of sixty days or less for which quotations are not readily available are valued at amortized cost, which approximates value.
When current market prices or quotations are not readily available or do not accurately reflect fair value, valuations may be determined in accordance with procedures adopted by the Board of Trustees. For example, when developments occur between the close of a market and the close of the NYSE that may materially affect the value of some or all of the securities, or when trading in a security is halted, those securities may be fair valued. Factors used in the determination of fair value may include monitoring news to identify significant market or security specific events such as changes in the value of U.S. securi ties markets, reviewing developments in foreign markets and evaluating the perfor mance of ADRs, futures contracts and exchange traded funds. Because the fund’s utilization of fair value pricing depends on market activity, the frequency with which fair value pricing is used can not be predicted and may be utilized to a significant extent. The value of securities used for NAV calculation under fair value pricing may differ from published prices for the same securities.
19 Semiannual Report
| Notes to Financial Statements (Unaudited) continued |
| (Amounts in thousands except ratios) |
| |
| 1. Significant Accounting Policies continued |
Investment Transactions and Income. Security transactions are accounted for as of trade date. Gains and losses on securities sold are determined on the basis of identified cost and may include proceeds received from litigation. Dividend income is recorded on the ex dividend date, except for certain dividends from foreign securities where the ex dividend date may have passed, which are recorded as soon as the fund is informed of the ex dividend date. Non cash dividends included in dividend income, if any, are recorded at the fair market value of the securities received. Distributions received on securities that represent a return of capital or capital gain are recorded as a reduction of cost of investments and/or as a realized gain. The fund estimates the components of distributions received that may be considered return of capital distributions or capital gain distributions. Interest income is accrued as earned. Interest income includes coupon interest and amortization of premium and accretion of discount on debt securities.
Expenses. Most expenses of the trust can be directly attributed to a fund. Expenses which cannot be directly attributed are apportioned among each fund in the trust.
Deferred Trustee Compensation. Under a Deferred Compensation Plan (the Plan), independent Trustees must defer receipt of a portion of, and may elect to defer receipt of an additional portion of, their annual compensation. Deferred amounts are treated as though equivalent dollar amounts had been invested in shares of the fund or are invested in a cross section of other Fidelity funds, and are marked to market. Deferred amounts remain in the fund until distributed in accordance with the Plan.
Income Tax Information and Distributions to Shareholders. Each year, the fund intends to qualify as a regulated investment company by distributing all of its taxable income and realized gains under Subchapter M of the Internal Revenue Code. As a result, no provision for income taxes is required in the accompanying financial statements.
Distributions are recorded on the ex dividend date. Income and capital gain distribu tions are determined in accordance with income tax regulations, which may differ from generally accepted accounting principles. In addition, the fund claimed a portion of the payment made to redeeming shareholders as a distribution for income tax purposes.
Capital accounts within the financial statements are adjusted for permanent book tax differences. These adjustments have no impact on net assets or the results of operations. Temporary book tax differences will reverse in a subsequent period.
Book tax differences are primarily due to futures transactions, capital loss carryforwards and losses deferred due to wash sales.
| 1. Significant Accounting Policies continued | | |
Income Tax Information and Distributions to Shareholders continued |
The federal tax cost of investments and unrealized appreciation (depreciation) as of period end were as follows:
| Unrealized appreciation | | | | $ 1,403,417 |
| Unrealized depreciation | | | | (163,759) |
| Net unrealized appreciation (depreciation) | | | | $ 1,239,658 |
| Cost for federal income tax purposes | | | | $ 5,853,003 |
| |
| 2. Operating Policies. | | | | |
Repurchase Agreements. FMR has received an Exemptive Order from the Securities and Exchange Commission (the SEC) which permits the fund and other affiliated entities of FMR to transfer uninvested cash balances into joint trading accounts which are then invested in repurchase agreements. The fund may also invest directly with institutions in repurchase agreements. Repurchase agreements are collateralized by government or non government securities. Upon settlement date, collateral is held in segregated accounts with custodian banks and may be obtained in the event of a default of the counterparty. The fund monitors, on a daily basis, the value of the collateral to ensure it is at least equal to the principal amount of the repurchase agreement (includ ing accrued interest). In the event of a default by the counterparty, realization of the collateral proceeds could be delayed, during which time the value of the collateral may decline.
Futures Contracts. The fund may use futures contracts to manage its exposure to the stock market. Buying futures tends to increase a fund’s exposure to the underlying instrument, while selling futures tends to decrease a fund’s exposure to the underlying instrument or hedge other fund investments. Upon entering into a futures contract, a fund is required to deposit with a clearing broker, no later than the following business day, an amount (“initial margin”) equal to a certain percentage of the face value of the contract. The initial margin may be in the form of cash or securities and is transferred to a segregated account on settlement date. Subsequent payments (“variation margin”) are made or received by a fund depending on the daily fluctuations in the value of the futures contract and are accounted for as unrealized gains or losses. Realized gains (losses) are recorded upon the expiration or closing of the futures contract. Securities deposited to meet margin requirements are identified in the Schedule of Investments. Futures contracts involve, to varying degrees, risk of loss in excess of any futures variation margin reflected in the Statement of Assets and Liabilities. The underlying face amount at value of any open futures contracts at period end is shown in the Schedule of Investments under the caption “Futures Contracts.” This amount reflects each contract’s exposure to the underlying instrument at period end. Losses may arise from changes in the value of
21 Semiannual Report
| Notes to Financial Statements (Unaudited) continued |
| (Amounts in thousands except ratios) | | |
2. Operating Policies continued | | |
Futures Contracts continued | | |
the underlying instruments or if the counterparties do not perform under the contract’s terms. Futures contracts are valued at the settlement price established each day by the board of trade or exchange on which they are traded.
3. Purchases and Sales of Investments.
Purchases and sales of securities, other than short term securities, aggregated $2,112,384 and $1,751,022, respectively.
4. Fees and Other Transactions with Affiliates.
Management Fee. FMR and its affiliates provide the fund with investment manage ment related services for which the fund pays a monthly management fee. The manage ment fee is the sum of an individual fund fee rate that is based on an annual rate of .30% of the fund’s average net assets and a group fee rate that averaged .27% during the period. The group fee rate is based upon the average net assets of all the mutual funds advised by FMR. The group fee rate decreases as assets under management increase and increases as assets under management decrease. In addition, the management fee is subject to a performance adjustment (up to a maximum of ±.20% of the fund’s average net assets over a 36 month performance period). The upward or downward adjustment to the management fee is based on the fund’s relative investment performance as compared to an appropriate benchmark index. For the period, the total annualized management fee rate, including the performance adjustment, was .68% of the fund’s average net assets.
Transfer Agent Fees. Fidelity Service Company, Inc. (FSC), an affiliate of FMR, is the fund’s transfer, dividend disbursing and shareholder servicing agent. FSC receives account fees and asset based fees that vary according to account size and type of account. FSC pays for typesetting, printing and mailing of shareholder reports, except proxy statements. For the period, the transfer agent fees were equivalent to an annual ized rate of .22% of average net assets.
Accounting and Security Lending Fees. FSC maintains the fund’s accounting records. The accounting fee is based on the level of average net assets for the month. Under a separate contract, FSC administers the security lending program. The security lending fee is based on the number and duration of lending transactions.
4. Fees and Other Transactions with Affiliates continued
Affiliated Central Funds. The fund may invest in Money Market Central Funds which seek preservation of capital and current income and are managed by Fidelity Invest ments Money Management, Inc. (FIMM), an affiliate of FMR.
The Money Market Central Funds do not pay a management fee.
Brokerage Commissions. The fund placed a portion of its portfolio transactions with brokerage firms which are affiliates of the investment adviser. The commissions paid to these affiliated firms were $6 for the period.
5. Committed Line of Credit.
|
The fund participates with other funds managed by FMR in a $4.2 billion credit facility (the “line of credit”) to be utilized for temporary or emergency purposes to fund share holder redemptions or for other short term liquidity purposes. The fund has agreed to pay commitment fees on its pro rata portion of the line of credit, which amounts to $9 and is reflected in Miscellaneous Expense on the Statement of Operations. During the period, there were no borrowings on this line of credit.
The fund lends portfolio securities from time to time in order to earn additional income. On the settlement date of the loan, the fund receives collateral (in the form of U.S. Treasury obligations, letters of credit and/or cash) against the loaned securities and maintains collateral in an amount not less than 100% of the market value of the loaned securities during the period of the loan. The market value of the loaned securities is determined at the close of business of the fund and any additional required collateral is delivered to the fund on the next business day. If the borrower defaults on its obligation to return the securities loaned because of insolvency or other reasons, a fund could experience delays and costs in recovering the securities loaned or in gaining access to the collateral. Any cash collateral received is invested in the Fidelity Securities Lending Cash Central Fund. The value of loaned securities and cash collateral at period end are disclosed on the fund’s Statement of Assets and Liabilities. Security lending income represents the income earned on investing cash collateral, less fees and expenses associated with the loan, plus any premium payments that may be received on the loan of certain types of securities. Security lending income is presented in the Statement of Operations as a component of interest income. Net income from lending portfolio securities during the period amounted to $56.
23 Semiannual Report
| Notes to Financial Statements (Unaudited) continued |
| (Amounts in thousands except ratios) | | |
| |
| 7. Expense Reductions. | | |
Many of the brokers with whom FMR places trades on behalf of the fund provided services to the fund in addition to trade execution. These services included payments of certain expenses on behalf of the fund totaling $69 for the period. In addition, through arrangements with the fund’s transfer agent, credits realized as a result of uninvested cash balances were used to reduce the fund’s expenses. During the period, these credits reduced the fund’s custody and transfer agent expenses by $1 and $180, respectively.
The fund’s organizational documents provide former and current trustees and officers with a limited indemnification against liabilities arising in connection with the performance of their duties to the fund. In the normal course of business, the fund may also enter into contracts that provide general indemnifications. The fund’s maximum exposure under these arrangements is unknown as this would be dependent on future claims that may be made against the fund. The risk of material loss from such claims is considered remote.
At the end of the period, Fidelity Freedom 2020 Fund and Fidelity Freedom 2030 Fund were the owners of record of approximately 17% and 13%, respectively, of the total outstanding shares of the fund. The Fidelity Freedom Funds were the owners of record, in the aggregate, of approximately 55% of the total outstanding shares of the fund.
Board Approval of Investment Advisory Contracts and Management Fees
Fidelity Disciplined Equity Fund
On January 19, 2006, the Board of Trustees, including the Independent Trustees (together, the Board), voted to approve a general research services agreement (the Agreement) between FMR, FMR Co., Inc. (FMRC), Fidelity Investments Money Manage ment, Inc. (FIMM), and Fidelity Research & Analysis Company (FRAC) (together, the Investment Advisers) for the fund, effective January 20, 2006, pursuant to which FRAC may provide general research and investment advisory support services to FMRC and FIMM. The Board considered that it has approved previously various sub advisory agreements for the fund with affiliates of FMR that allow FMR to obtain research, non discretionary advice, or discretionary portfolio management at no additional expense to the fund. The Board, assisted by the advice of fund counsel and independent Trustees’ counsel, considered a broad range of information and determined that it would be beneficial for the fund to access the research and investment advisory support services supplied by FRAC at no additional expense to the fund.
The Board reached this determination in part because the new arrangement will involve no changes in (i) the contractual terms of and fees payable under the fund’s manage ment contract or sub advisory agreements; (ii) the investment process or strategies employed in the management of the fund’s assets; (iii) the nature or level of services provided under the fund’s management contract or sub advisory agreements; (iv) the day to day management of the fund or the persons primarily responsible for such man agement; or (v) the ultimate control or beneficial ownership of FMR, FMRC, or FIMM. The Board also considered that the establishment of the Agreement would not necessi tate prior shareholder approval of the Agreement or result in an assignment and termination of the fund’s management contract or sub advisory agreements under the Investment Company Act of 1940.
Because the Board was approving an arrangement with FRAC under which the fund will not bear any additional management fees or expenses and under which the fund’s portfolio manager would not change, it did not consider the fund’s investment perfor mance, competitiveness of management fee and total expenses, costs of services and profitability, or economies of scale to be significant factors in its decision.
In connection with its future renewal of the fund’s management contract and sub advisory agreements, the Board will consider: (i) the nature, extent, and quality of services provided to the fund, including shareholder and administrative services and investment performance; (ii) the competitiveness of the fund’s management fee and total expenses; (iii) the costs of the services and profitability, including the revenues earned and the expenses incurred by Fidelity in conducting the business of developing, marketing, distributing, managing, administering, and servicing the fund and its shareholders; and (iv) whether there have been economies of scale in respect of the management of the Fidelity funds, whether the Fidelity funds (including the fund) have
25 Semiannual Report
Board Approval of Investment Advisory Contracts and Management Fees continued
appropriately benefited from any such economies of scale, and whether there is potential for realization of any further economies.
Based on its evaluation of all of the conclusions noted above, and after considering all material factors, the Board ultimately concluded that the fund’s Agreement is fair and reasonable, and that the fund’s Agreement should be approved.
Managing Your Investments
Fidelity offers several ways to conveniently manage your personal investments via your telephone or PC. You can access your account information, conduct trades and research your investments 24 hours a day.
By Phone
Fidelity Automated Service Telephone provides a single toll free number to access account balances, positions, quotes and trading. It’s easy to navigate the service, and on your first call, the system will help you create a personal identification number (PIN) for security.


By PC
Fidelity’s web site on the Internet provides a wide range of information, including daily financial news, fund performance, interactive planning tools and news about Fidelity products and services.

* When you call the quotes line, please remember that a fund’s yield and return will vary and, except for money market funds, share price will also vary. This means that you may have a gain or loss when you sell your shares. There is no assurance that money market funds will be able to maintain a stable $1 share price; an investment in a money market fund is not insured or guar anteed by the U.S. government. Total returns are historical and include changes in share price, reinvestment of dividends and capital gains, and the effects of any sales charges.
27 Semiannual Report
To Visit Fidelity
For directions and hours,
please call 1-800-544-9797.
Arizona
7001 West Ray Road
Chandler, AZ
7373 N. Scottsdale Road
Scottsdale, AZ
California
815 East Birch Street
Brea, CA
1411 Chapin Avenue
Burlingame, CA
851 East Hamilton Avenue
Campbell, CA
19200 Von Karman Avenue
Irvine, CA
601 Larkspur Landing Circle
Larkspur, CA
10100 Santa Monica Blvd.
Los Angeles, CA
27101 Puerta Real
Mission Viejo, CA
73 575 El Paseo
Palm Desert, CA
251 University Avenue
Palo Alto, CA
123 South Lake Avenue
Pasadena, CA
16995 Bernardo Ctr. Drive
Rancho Bernardo, CA
1740 Arden Way
Sacramento, CA
7676 Hazard Center Drive
San Diego, CA
8 Montgomery Street
San Francisco, CA
3793 State Street
Santa Barbara, CA
21701 Hawthorne Boulevard
Torrance, CA
2001 North Main Street
Walnut Creek, CA
6300 Canoga Avenue
Woodland Hills, CA
|
Colorado
1625 Broadway
Denver, CO
9185 East Westview Road
Littleton, CO
Connecticut
48 West Putnam Avenue
Greenwich, CT
265 Church Street
New Haven, CT
300 Atlantic Street
Stamford, CT
29 South Main Street
West Hartford, CT
Delaware
222 Delaware Avenue
Wilmington, DE
Florida
4400 N. Federal Highway
Boca Raton, FL
121 Alhambra Plaza
Coral Gables, FL
2948 N. Federal Highway
Ft. Lauderdale, FL
1907 West State Road 434
Longwood, FL
8880 Tamiami Trail, North
Naples, FL
3550 Tamiami Trail, South
Sarasota, FL
1502 N. Westshore Blvd.
Tampa, FL
2465 State Road 7
Wellington, FL
3501 PGA Boulevard
West Palm Beach, FL
Georgia
3445 Peachtree Road, N.E.
Atlanta, GA
1000 Abernathy Road
Atlanta, GA
Illinois
One North LaSalle Street
Chicago, IL
875 North Michigan Ave.
Chicago, IL
|
1415 West 22nd Street
Oak Brook, IL
1572 East Golf Road
Schaumburg, IL
3232 Lake Avenue
Wilmette, IL
Indiana
4729 East 82nd Street
Indianapolis, IN
Kansas
5400 College Boulevard
Overland Park, KS
Maine
Three Canal Plaza
Portland, ME
Maryland
7315 Wisconsin Avenue
Bethesda, MD
One W. Pennsylvania Ave.
Towson, MD
Massachusetts
801 Boylston Street
Boston, MA
155 Congress Street
Boston, MA
300 Granite Street
Braintree, MA
44 Mall Road
Burlington, MA
405 Cochituate Road
Framingham, MA
416 Belmont Street
Worcester, MA
Michigan
500 E. Eisenhower Pkwy.
Ann Arbor, MI
280 Old N. Woodward Ave.
Birmingham, MI
43420 Grand River Avenue
Novi, MI
29155 Northwestern Hwy.
Southfield, MI
Minnesota
7600 France Avenue South
Edina, MN
|
Semiannual Report 28
Missouri
8885 Ladue Road
Ladue, MO
Nevada
2225 Village Walk Drive
Henderson, NV
New Jersey
150 Essex Street
Millburn, NJ
56 South Street
Morristown, NJ
396 Route 17, North
Paramus, NJ
3518 Route 1 North
Princeton, NJ
530 Highway 35
Shrewsbury, NJ
New York
1055 Franklin Avenue
Garden City, NY
37 West Jericho Turnpike
Huntington Station, NY
1271 Avenue of the Americas
New York, NY
61 Broadway
New York, NY
350 Park Avenue
New York, NY
200 Fifth Avenue
New York, NY
733 Third Avenue
New York, NY
11 Penn Plaza
New York, NY
2070 Broadway
New York, NY
1075 Northern Blvd.
Roslyn, NY
North Carolina
4611 Sharon Road
Charlotte, NC
Ohio
3805 Edwards Road
Cincinnati, OH
1324 Polaris Parkway
Columbus, OH
28699 Chagrin Boulevard
Woodmere Village, OH
|
Oregon
16850 SW 72nd Avenue
Tigard, OR
Pennsylvania
600 West DeKalb Pike
King of Prussia, PA
1735 Market Street
Philadelphia, PA
12001 Perry Highway
Wexford, PA
Rhode Island
47 Providence Place
Providence, RI
Tennessee
6150 Poplar Avenue
Memphis, TN
Texas
10000 Research Boulevard
Austin, TX
4001 Northwest Parkway
Dallas, TX
12532 Memorial Drive
Houston, TX
2701 Drexel Drive
Houston, TX
6500 N. MacArthur Blvd.
Irving, TX
6005 West Park Boulevard
Plano, TX
14100 San Pedro
San Antonio, TX
1576 East Southlake Blvd.
Southlake, TX
19740 IH 45 North
Spring, TX
Utah
215 South State Street
Salt Lake City, UT
Virginia
1861 International Drive
McLean, VA
Washington
411 108th Avenue, N.E.
Bellevue, WA
1518 6th Avenue
Seattle, WA
|
Washington, DC
1900 K Street, N.W.
Washington, DC
Wisconsin
595 North Barker Road
Brookfield, WI
|
Fidelity Brokerage Services, Inc., 100 Summer St., Boston, MA 02110 Member NYSE/SIPC
29 Semiannual Report
29
To Write Fidelity
We’ll give your correspondence immediate attention and send you written confirmation upon completion of your request.

(such as changing name, address, bank, etc.)
Fidelity Investments
P.O. Box 770001
Cincinnati, OH 45277-0002
|

Buying shares
Fidelity Investments
P.O. Box 770001
Cincinnati, OH 45277-0003
Overnight Express
Fidelity Investments
Attn: Distribution Services
100 Crosby Parkway KC1H
Covington, KY 41015
Selling shares
Fidelity Investments
P.O. Box 770001
Cincinnati, OH 45277-0035
Overnight Express
Fidelity Investments
Attn: Distribution Services
100 Crosby Parkway KC1H
Covington, KY 41015
General Correspondence
Fidelity Investments
P.O. Box 500
Merrimack, NH 03054-0500
|

Buying shares
Fidelity Investments
P.O. Box 770001
Cincinnati, OH 45277-0003
Selling shares
Fidelity Investments
P.O. Box 770001
Cincinnati, OH 45277-0035
Overnight Express
Fidelity Investments
Attn: Distribution Services
100 Crosby Parkway KC1H
Covington, KY 41015
General Correspondence
Fidelity Investments
P.O. Box 500
Merrimack, NH 03054-0500
|
Semiannual Report 30
31 Semiannual Report
Investment Adviser
Fidelity Management & Research Company
Boston, MA
Investment Sub Advisers
FMR Co., Inc.
Fidelity Management & Research
(U.K.) Inc.
Fidelity Research & Analysis Company
(formerly Fidelity Management &
Research (Far East) Inc.)
Fidelity Investments Japan Limited
Fidelity International Investment
Advisors
Fidelity International Investment
Advisors (U.K.) Limited
General Distributor
Fidelity Distributors Corporation
Boston, MA
Transfer and Service Agent
Fidelity Service Company, Inc.
Boston, MA
Custodian
State Street Bank and Trust Company
Quincy, MA
|
| The Fidelity Telephone Connection |
| Mutual Fund 24-Hour Service |
| Exchanges/Redemptions | | |
| and Account Assistance | | 1-800-544-6666 |
| Product Information | | 1-800-544-6666 |
| Retirement Accounts | | 1-800-544-4774 |
| (8 a.m. - 9 p.m.) | | |
| TDD Service | | 1-800-544-0118 |
| for the deaf and hearing impaired | | |
| (9 a.m. - 9 p.m. Eastern time) | | |
| Fidelity Automated Service | | |
| Telephone (FAST®) (automated phone logo) | | 1-800-544-5555 |
| (automated phone logo) Automated line for quickest service |
FDE-USAN-0606
1.784913.103
|

| | Fidelity®
Focused Stock
Fund
|
| | Semiannual Report
April 30, 2006
|


| Contents | | | | |
| |
| Chairman’s Message | | 3 | | Ned Johnson’s message to shareholders. |
| Shareholder Expense | | 4 | | An example of shareholder expenses. |
| Example | | | | |
| Investment Changes | | 5 | | A summary of major shifts in the fund’s |
| | | | | investments over the past six months. |
| Investments | | 6 | | A complete list of the fund’s investments |
| | | | | with their market values. |
| Financial Statements | | 10 | | Statements of assets and liabilities, |
| | | | | operations, and changes in net assets, |
| | | | | as well as financial highlights. |
| Notes | | 14 | | Notes to the financial statements. |
| Board Approval of | | 20 | | |
| Investment Advisory | | | | |
| Contracts and | | | | |
| Management Fees | | | | |
To view a fund’s proxy voting guidelines and proxy voting record for the 12 month period ended
June 30, visit www.fidelity.com/proxyvotingresults or visit the Securities and Exchange Commis
sion’s (SEC) web site at www.sec.gov. You may also call 1-800-544-8544 to request a free copy of
the proxy voting guidelines.
Standard & Poor’s, S&P and S&P 500 are registered service marks of The McGraw Hill Companies,
Inc. and have been licensed for use by Fidelity Distributors Corporation.
Other third party marks appearing herein are the property of their respective owners.
All other marks appearing herein are registered or unregistered trademarks or service marks
of FMR Corp. or an affiliated company.
|
| | This report and the financial statements contained herein are submitted for the general information
of the shareholders of the fund. This report is not authorized for distribution to prospective investors
in the fund unless preceded or accompanied by an effective prospectus.
A fund files its complete schedule of portfolio holdings with the SEC for the first and third
quarters of each fiscal year on Form N Q. Forms N Q are available on the SEC’s web site at
http://www.sec.gov. A fund’s Forms N Q may be reviewed and copied at the SEC’s Public Refer
ence Room in Washington, DC. Information regarding the operation of the SEC’s Public Reference
Room may be obtained by calling 1-800-SEC-0330. For a complete list of a fund’s portfolio
holdings, view the most recent quarterly holdings report, semiannual report, or annual report
on Fidelity’s web site at http://www.fidelity.com/holdings.
NOT FDIC INSURED · MAY LOSE VALUE · NO BANK GUARANTEE
Neither the fund nor Fidelity Distributors Corporation is a bank.
|
Chairman’s Message
(photograph of Edward C. Johnson 3d)
Dear Shareholder:
Although many securities markets made gains in early 2006, there is only one certainty when it comes to investing: There is no sure thing. There are, however, a number of time tested, fundamental investment principles that can put the historical odds in your favor.
One of the basic tenets is to invest for the long term. Over time, riding out the markets’ inevitable ups and downs has proven much more effective than selling into panic or chasing the hottest trend. Even missing only a few of the markets’ best days can significantly diminish investor returns. Patience also affords the benefits of compounding of earning interest on additional income or reinvested dividends and capital gains. There are tax advantages and cost benefits to consider as well. The more you sell, the more taxes you pay, and the more you trade, the higher the costs. While staying the course doesn’t eliminate risk, it can considerably lessen the effect of short term declines.
You can further manage your investing risk through diversification. And today, more than ever, geographic diversification should be taken into account. Studies indicate that asset allocation is the single most important determinant of a portfolio’s long term success. The right mix of stocks, bonds and cash aligned to your particular risk tolerance and investment objective is very important. Age appropriate rebalancing is also an essential aspect of asset allocation. For younger investors, an emphasis on equities which historically have been the best performing asset class over time is encouraged. As investors near their specific goal, such as retirement or sending a child to college, consideration may be given to replacing volatile assets (e.g. common stocks) with more stable fixed investments (bonds or savings plans).
A third investment principle investing regularly can help lower the average cost of your purchases. Investing a certain amount of money each month or quarter helps ensure you won’t pay for all your shares at market highs. This strategy known as dollar cost averaging also reduces unconstructive “emotion” from investing, helping shareholders avoid selling weak performers just prior to an upswing, or chasing a hot performer just before a correction.
We invite you to contact us via the Internet, through our Investor Centers or over the phone. It is our privilege to provide you the information you need to make the investments that are right for you.
Sincerely,
/s/ Edward C. Johnson 3d
Edward C. Johnson 3d
3 Semiannual Report
Shareholder Expense Example
As a shareholder of the Fund, you incur two types of costs: (1) transaction costs, including redemption fees, and (2) ongoing costs, including management fees and other Fund expenses. This Example is intended to help you understand your ongoing costs (in dollars) of investing in the Fund and to compare these costs with the ongoing costs of investing in other mutual funds.
The Example is based on an investment of $1,000 invested at the beginning of the period and held for the entire period (November 1, 2005 to April 30, 2006).
Actual Expenses
The first line of the table below provides information about actual account values and actual expenses. You may use the information in this line, together with the amount you invested, to estimate the expenses that you paid over the period. Simply divide your account value by $1,000.00 (for example, an $8,600 account value divided by $1,000.00 = 8.6), then multiply the result by the number in the first line under the heading entitled “Expenses Paid During Period” to estimate the expenses you paid on your account during this period. A small balance maintenance fee of $12.00 that is charged once a year may apply for certain accounts with a value of less than $2,000. This fee is not included in the table below. If it was, the estimate of expenses you paid during the period would be higher, and your ending account value lower, by this amount.
Hypothetical Example for Comparison Purposes
The second line of the table below provides information about hypothetical account values and hypothetical expenses based on the Fund’s actual expense ratio and an assumed rate of return of 5% per year before expenses, which is not the Fund’s actual return. The hypothetical account values and expenses may not be used to estimate the actual ending account balance or expenses you paid for the period. You may use this information to compare the ongoing costs of investing in the Fund and other funds. To do so, compare this 5% hypothetical example with the 5% hypothetical examples that appear in the shareholder reports of the other funds. A small balance maintenance fee of $12.00 that is charged once a year may apply for certain accounts with a value of less than $2,000. This fee is not included in the table below. If it was, the estimate of expenses you paid during the period would be higher, and your ending account value lower, by this amount.
Please note that the expenses shown in the table are meant to highlight your ongoing costs only and do not reflect any transaction costs. Therefore, the second line of the table is useful in comparing ongoing costs only, and will not help you determine the relative total costs of owning different funds. In addition, if these transactional costs were included, your costs would have been higher.
| | | | | | | | | | | Expenses Paid |
| | | Beginning | | | | Ending | | During Period* |
| | | Account Value | | | | Account Value | | November 1, 2005 |
| | | November 1, 2005 | | | | April 30, 2006 | | to April 30, 2006 |
| Actual | | | | $ 1,000.00 | | | | $ 1,099.50 | | | | $ 5.21 |
| Hypothetical (5% return per year | | | | | | | | | | | | |
| before expenses) | | | | $ 1,000.00 | | | | $ 1,019.84 | | | | $ 5.01 |
* Expenses are equal to the Fund’s annualized expense ratio of 1.00%; multiplied by the average account value over the period, multiplied by 181/365 (to reflect the one half year period).
| Investment Changes | | | | |
| |
| |
| Top Ten Stocks as of April 30, 2006 | | | | |
| | | % of fund’s | | % of fund’s net assets |
| | | net assets | | 6 months ago |
| Hewlett Packard Co. | | 4.9 | | 2.1 |
| MetLife, Inc. | | 4.4 | | 4.3 |
| Kroger Co. | | 4.3 | | 3.9 |
| Valero Energy Corp. | | 4.2 | | 4.0 |
| Prudential Financial, Inc. | | 4.2 | | 0.0 |
| Fidelity National Financial, Inc. | | 4.2 | | 0.0 |
| JCPenney Co., Inc. | | 4.1 | | 0.0 |
| Radian Group, Inc. | | 4.1 | | 3.9 |
| Tesoro Corp. | | 3.9 | | 3.6 |
| AMR Corp. | | 3.8 | | 0.0 |
| | | 42.1 | | |
Top Five Market Sectors as of April 30, 2006 | | |
| | | % of fund’s | | % of fund’s net assets |
| | | net assets | | 6 months ago |
| Financials | | 21.1 | | 22.3 |
| Information Technology | | 18.6 | | 11.3 |
| Energy | | 11.7 | | 11.4 |
| Industrials | | 10.9 | | 8.6 |
| Consumer Staples | | 9.2 | | 9.0 |

5 Semiannual Report
| Investments April 30, 2006 (Unaudited) |
| Showing Percentage of Net Assets | | | | | | |
| |
| Common Stocks 98.6% | | | | | | |
| | | Shares | | Value (Note 1) |
| |
| CONSUMER DISCRETIONARY – 8.4% | | | | | | |
| Hotels, Restaurants & Leisure 0.7% | | | | | | |
| Domino’s Pizza, Inc. | | 11,100 | | | | $ 292,263 |
| McDonald’s Corp. | | 11,700 | | | | 404,469 |
| | | | | | | 696,732 |
| Multiline Retail – 6.6% | | | | | | |
| JCPenney Co., Inc. | | 67,100 | | | | 4,392,366 |
| Nordstrom, Inc. | | 70,800 | | | | 2,713,764 |
| | | | | | | 7,106,130 |
| Specialty Retail – 1.1% | | | | | | |
| The Men’s Wearhouse, Inc. | | 26,100 | | | | 924,984 |
| The Pantry, Inc. (a) | | 4,500 | | | | 297,855 |
| | | | | | | 1,222,839 |
| |
| TOTAL CONSUMER DISCRETIONARY | | | | | | 9,025,701 |
| |
| CONSUMER STAPLES 9.2% | | | | | | |
| Food & Staples Retailing – 6.0% | | | | | | |
| BJ’s Wholesale Club, Inc. (a) | | 30,700 | | | | 940,034 |
| Kroger Co. | | 228,500 | | | | 4,629,410 |
| Safeway, Inc. | | 35,400 | | | | 889,602 |
| | | | | | | 6,459,046 |
| Food Products 3.2% | | | | | | |
| General Mills, Inc. | | 68,200 | | | | 3,364,988 |
| |
| TOTAL CONSUMER STAPLES | | | | | | 9,824,034 |
| |
| ENERGY 11.7% | | | | | | |
| Oil, Gas & Consumable Fuels – 11.7% | | | | | | |
| Exxon Mobil Corp. | | 22,700 | | | | 1,431,916 |
| Frontier Oil Corp. | | 19,400 | | | | 1,174,282 |
| Sunoco, Inc. | | 15,780 | | | | 1,278,811 |
| Tesoro Corp. | | 59,390 | | | | 4,152,549 |
| Valero Energy Corp. | | 69,300 | | | | 4,486,482 |
| | | | | | | 12,524,040 |
| |
| FINANCIALS – 21.1% | | | | | | |
| Insurance – 17.0% | | | | | | |
| ACE Ltd. | | 15,600 | | | | 866,424 |
| American Equity Investment Life Holding Co. | | 17,300 | | | | 234,588 |
| Assurant, Inc. | | 6,300 | | | | 303,471 |
| Fidelity National Financial, Inc. | | 106,100 | | | | 4,454,078 |
See accompanying notes which are an integral part of the financial statements.
Semiannual Report 6
| Common Stocks continued | | | | |
| | | Shares | | Value (Note 1) |
| |
| FINANCIALS – continued | | | | |
| Insurance – continued | | | | |
| MetLife, Inc. | | 91,230 | | $ 4,753,083 |
| Prudential Financial, Inc. | | 57,300 | | 4,476,849 |
| SAFECO Corp. | | 200 | | 10,380 |
| W.R. Berkley Corp. | | 84,500 | | 3,161,990 |
| | | | | 18,260,863 |
| Thrifts & Mortgage Finance – 4.1% | | | | |
| Radian Group, Inc. | | 69,800 | | 4,377,856 |
| |
| TOTAL FINANCIALS | | | | 22,638,719 |
| |
| HEALTH CARE – 8.6% | | | | |
| Health Care Providers & Services – 8.6% | | | | |
| Aetna, Inc. | | 98,700 | | 3,799,950 |
| Humana, Inc. (a) | | 37,000 | | 1,671,660 |
| Sierra Health Services, Inc. (a) | | 16,100 | | 631,281 |
| UnitedHealth Group, Inc. | | 63,004 | | 3,133,819 |
| | | | | 9,236,710 |
| |
| INDUSTRIALS – 10.9% | | | | |
| Aerospace & Defense – 0.9% | | | | |
| AAR Corp. (a) | | 37,300 | | 995,164 |
| Air Freight & Logistics – 1.0% | | | | |
| Hub Group, Inc. Class A (a) | | 21,956 | | 1,079,577 |
| Airlines – 6.1% | | | | |
| AMR Corp. (a)(d) | | 165,000 | | 4,065,600 |
| Continental Airlines, Inc. Class B (a) | | 95,600 | | 2,489,424 |
| | | | | 6,555,024 |
| Industrial Conglomerates – 1.2% | | | | |
| General Electric Co. | | 36,400 | | 1,259,076 |
| Machinery – 0.7% | | | | |
| Ingersoll-Rand Co. Ltd. Class A | | 18,400 | | 805,000 |
| Trading Companies & Distributors – 1.0% | | | | |
| WESCO International, Inc. (a) | | 14,000 | | 1,050,000 |
| |
| TOTAL INDUSTRIALS | | | | 11,743,841 |
| |
| INFORMATION TECHNOLOGY – 18.6% | | | | |
| Computers & Peripherals – 11.0% | | | | |
| Apple Computer, Inc. (a) | | 25,800 | | 1,816,062 |
| Hewlett-Packard Co. | | 160,700 | | 5,217,928 |
See accompanying notes which are an integral part of the financial statements.
| Investments (Unaudited) continued | | | | |
| |
| |
| Common Stocks continued | | | | |
| | | Shares | | Value (Note 1) |
| |
| INFORMATION TECHNOLOGY – continued | | | | |
| Computers & Peripherals – continued | | | | |
| Komag, Inc. (a) | | 24,000 | | $ 1,008,960 |
| Seagate Technology | | 38,900 | | 1,033,184 |
| Western Digital Corp. (a) | | 131,170 | | 2,759,817 |
| | | | | 11,835,951 |
| Internet Software & Services – 1.0% | | | | |
| RealNetworks, Inc. (a) | | 101,600 | | 1,018,032 |
| Semiconductors & Semiconductor Equipment – 5.3% | | | | |
| Conexant Systems, Inc. (a)(d) | | 530,400 | | 1,877,616 |
| Lam Research Corp. (a) | | 25,600 | | 1,251,328 |
| NVIDIA Corp. (a) | | 88,600 | | 2,588,892 |
| | | | | 5,717,836 |
| Software 1.3% | | | | |
| Informatica Corp. (a)(d) | | 90,700 | | 1,394,059 |
| |
| TOTAL INFORMATION TECHNOLOGY | | | | 19,965,878 |
| |
| MATERIALS 4.0% | | | | |
| Metals & Mining – 4.0% | | | | |
| Nucor Corp. | | 3,900 | | 424,398 |
| United States Steel Corp. | | 55,700 | | 3,815,450 |
| | | | | 4,239,848 |
| |
| TELECOMMUNICATION SERVICES – 2.4% | | | | |
| Diversified Telecommunication Services – 0.7% | | | | |
| Qwest Communications International, Inc. (a) | | 120,100 | | 805,871 |
| Wireless Telecommunication Services – 1.7% | | | | |
| Sprint Nextel Corp. | | 50,569 | | 1,254,111 |
| Syniverse Holdings, Inc. (a) | | 30,200 | | 534,842 |
| | | | | 1,788,953 |
| |
| TOTAL TELECOMMUNICATION SERVICES | | | | 2,594,824 |
| |
| UTILITIES – 3.7% | | | | |
| Independent Power Producers & Energy Traders – 3.7% | | | | |
| TXU Corp. | | 79,540 | | 3,947,570 |
| TOTAL COMMON STOCKS | | | | |
| (Cost $97,086,234) | | | | 105,741,165 |
See accompanying notes which are an integral part of the financial statements.
| Money Market Funds 7.9% | | | | | | | | |
| | | | | Shares | | | | Value (Note 1) |
| Fidelity Cash Central Fund, 4.8% (b) | | | | 1,706,383 | | | | $ 1,706,383 |
| Fidelity Securities Lending Cash Central Fund, | | | | | | | | |
| 4.83% (b)(c) | | | | 6,713,500 | | | | 6,713,500 |
| TOTAL MONEY MARKET FUNDS | | | | | | | | |
| (Cost $8,419,883) | | | | | | | | 8,419,883 |
| TOTAL INVESTMENT PORTFOLIO 106.5% | | | | | | |
| (Cost $105,506,117) | | | | | | | | 114,161,048 |
| |
| NET OTHER ASSETS – (6.5)% | | | | | | | | (6,923,780) |
| NET ASSETS 100% | | | | | | | | $ 107,237,268 |
Legend
(a) Non-income producing
(b) Affiliated fund that is available only to
investment companies and other
accounts managed by Fidelity
Investments. The rate quoted is the
annualized seven-day yield of the fund
at period end. A complete unaudited
listing of the fund’s holdings as of its
most recent quarter end is available
upon request.
|
(c) Investment made with cash collateral
received from securities on loan.
(d) Security or a portion of the security is on
loan at period end.
|
Affiliated Central Funds
Information regarding fiscal year to date income earned by the fund from the affiliated Central funds is as follows:
| Fund | | | | Income earned |
| Fidelity Cash Central Fund | | | | $ 78,826 |
| Fidelity Securities Lending Cash Central Fund | | | | 1,414 |
| Total | | | | $ 80,240 |
Income Tax Information
At October 31, 2005, the fund had a capital loss carryforward of approximately $12,142,008 of which $7,919,335 and $4,222,673 will expire on October 31, 2010 and 2011, respectively.
See accompanying notes which are an integral part of the financial statements.
9 Semiannual Report
| Financial Statements | | | | | | |
| |
| Statement of Assets and Liabilities | | | | | | |
| | | | | April 30, 2006 (Unaudited) |
| |
| Assets | | | | | | |
| Investment in securities, at value (including securities | | | | | | |
| loaned of $6,267,596) See accompanying | | | | | | |
| schedule: | | | | | | |
| Unaffiliated issuers (cost $97,086,234) | | | | $ 105,741,165 | | |
| Affiliated Central Funds (cost $8,419,883) | | | | 8,419,883 | | |
| Total Investments (cost $105,506,117) | | | | | �� | $ 114,161,048 |
| Receivable for investments sold | | | | | | 2,094,076 |
| Receivable for fund shares sold | | | | | | 131,518 |
| Dividends receivable | | | | | | 40,616 |
| Interest receivable | | | | | | 4,372 |
| Prepaid expenses | | | | | | 266 |
| Receivable from investment adviser for expense | | | | | | |
| reductions | | | | | | 4,774 |
| Other receivables | | | | | | 8,113 |
| Total assets | | | | | | 116,444,783 |
| |
| Liabilities | | | | | | |
| Payable for investments purchased | | | | $ 1,684,568 | | |
| Payable for fund shares redeemed | | | | 695,052 | | |
| Accrued management fee | | | | 62,691 | | |
| Other affiliated payables | | | | 30,020 | | |
| Other payables and accrued expenses | | | | 21,684 | | |
| Collateral on securities loaned, at value | | | | 6,713,500 | | |
| Total liabilities | | | | | | 9,207,515 |
| |
| Net Assets | | | | | | $ 107,237,268 |
| Net Assets consist of: | | | | | | |
| Paid in capital | | | | | | $ 100,243,809 |
| Distributions in excess of net investment income | | | | | | (121,767) |
| Accumulated undistributed net realized gain (loss) on | | | | | | |
| investments | | | | | | (1,539,705) |
| Net unrealized appreciation (depreciation) on | | | | | | |
| investments | | | | | | 8,654,931 |
| Net Assets, for 8,607,043 shares outstanding | | | | | | $ 107,237,268 |
| Net Asset Value, offering price and redemption price per | | | | | | |
| share ($107,237,268 ÷ 8,607,043 shares) | | | | | | $ 12.46 |
See accompanying notes which are an integral part of the financial statements.
| Statement of Operations | | | | | | |
| | | Six months ended April 30, 2006 (Unaudited) |
| |
| Investment Income | | | | | | |
| Dividends | | | | | | $ 687,859 |
| Interest | | | | | | 3,859 |
| Income from affiliated Central Funds | | | | | | 80,240 |
| Total income | | | | | | 771,958 |
| |
| Expenses | | | | | | |
| Management fee | | | | | | |
| Basic fee | | | | $ 357,806 | | |
| Performance adjustment | | | | 55,678 | | |
| Transfer agent fees | | | | 170,203 | | |
| Accounting and security lending fees | | | | 23,700 | | |
| Independent trustees’ compensation | | | | 251 | | |
| Custodian fees and expenses | | | | 5,876 | | |
| Registration fees | | | | 20,805 | | |
| Audit | | | | 23,454 | | |
| Legal | | | | 493 | | |
| Miscellaneous | | | | 487 | | |
| Total expenses before reductions | | | | 658,753 | | |
| Expense reductions | | | | (47,699) | | 611,054 |
| |
| Net investment income (loss) | | | | | | 160,904 |
| Realized and Unrealized Gain (Loss) | | | | | | |
| Net realized gain (loss) on: | | | | | | |
| Investment securities: | | | | | | |
| Unaffiliated issuers | | | | 10,492,848 | | |
| Futures contracts | | | | 153,695 | | |
| Total net realized gain (loss) | | | | | | 10,646,543 |
| Change in net unrealized appreciation (depreciation) on: | | | | | | |
| Investment securities | | | | 528,443 | | |
| Futures contracts | | | | (35,815) | | |
| Total change in net unrealized appreciation | | | | | | |
| (depreciation) | | | | | | 492,628 |
| Net gain (loss) | | | | | | 11,139,171 |
| Net increase (decrease) in net assets resulting from | | | | | | |
| operations | | | | | | $ 11,300,075 |
See accompanying notes which are an integral part of the financial statements.
11 Semiannual Report
| Financial Statements continued | | | | | | | | |
| |
| |
| Statement of Changes in Net Assets | | | | | | | | |
| | | | | Six months ended | | | | Year ended |
| | | | | April 30, 2006 | | | | October 31, |
| | | | | (Unaudited) | | | | 2005 |
| Increase (Decrease) in Net Assets | | | | | | | | |
| Operations | | | | | | | | |
| Net investment income (loss) | | | | $ 160,904 | | | | $ 288,186 |
| Net realized gain (loss) | | | | 10,646,543 | | | | 6,995,947 |
| Change in net unrealized appreciation (depreciation) . | | | | 492,628 | | | | 5,083,659 |
| Net increase (decrease) in net assets resulting | | | | | | | | |
| from operations | | | | 11,300,075 | | | | 12,367,792 |
| Distributions to shareholders from net investment income . | | | | (442,449) | | | | (128,489) |
| Share transactions | | | | | | | | |
| Proceeds from sales of shares | | | | 54,099,964 | | | | 97,160,584 |
| Reinvestment of distributions | | | | 418,321 | | | | 122,574 |
| Cost of shares redeemed | | | | (68,399,334) | | | | (38,158,401) |
| Net increase (decrease) in net assets resulting from | | | | | | | | |
| share transactions | | | | (13,881,049) | | | | 59,124,757 |
| Redemption fees | | | | 5,652 | | | | 17,708 |
| Total increase (decrease) in net assets | | | | (3,017,771) | | | | 71,381,768 |
| |
| Net Assets | | | | | | | | |
| Beginning of period | | | | 110,255,039 | | | | 38,873,271 |
| End of period (including distributions in excess of net | | | | | | | | |
| investment income of $121,767 and undistributed | | | | | | | | |
| net investment income of $159,778, respectively) | | | | $ 107,237,268 | | | | $ 110,255,039 |
| |
| Other Information | | | | | | | | |
| Shares | | | | | | | | |
| Sold | | | | 4,513,826 | | | | 8,970,777 |
| Issued in reinvestment of distributions | | | | 35,006 | | | | 12,482 |
| Redeemed | | | | (5,639,911) | | | | (3,538,668) |
| Net increase (decrease) | | | | (1,091,079) | | | | 5,444,591 |
See accompanying notes which are an integral part of the financial statements.
| Financial Highlights | | | | | | | | | | | | | | |
| | | Six months ended | | | | | | | | | | | | | | |
| | | April 30, 2006 | | Years ended October 31, |
| | | (Unaudited) | | 2005 | | | | 2004 | | | | 2003 | | 2002 | | 2001 |
| Selected Per Share Data | | | | | | | | | | | | | | | | |
| Net asset value, | | | | | | | | | | | | | | | | |
| beginning of period | | $ 11.37 | | $ 9.14 | | | | $ 8.29 | | | | $ 7.26 | | $ 10.54 | | $ 15.92 |
| Income from Investment | | | | | | | | | | | | | | | | |
| Operations | | | | | | | | | | | | | | | | |
| Net investment in | | | | | | | | | | | | | | | | |
| come (loss)D | | .02 | | .04E | | | | —G | | | | .02 | | (.07) | | .01 |
| Net realized and un | | | | | | | | | | | | | | | | |
| realized gain (loss) | | 1.11 | | 2.22 | | | | .87 | | | | 1.01 | | (3.21) | | (4.12) |
| Total from investment | | | | | | | | | | | | | | | | |
| operations | | 1.13 | | 2.26 | | | | .87 | | | | 1.03 | | (3.28) | | (4.11) |
| Distributions from net | | | | | | | | | | | | | | | | |
| investment income . | | (.04) | | (.03) | | | | (.02) | | | | — | | — | | (.02) |
| Distributions from net | | | | | | | | | | | | | | | | |
| realized gain | | — | | — | | | | — | | | | — | | — | | (1.25) |
| Total distributions | | (.04) | | (.03) | | | | (.02) | | | | — | | — | | (1.27) |
| Redemption fees added | | | | | | | | | | | | | | | | |
| to paid in capitalD,G . | | — | | — | | | | — | | | | — | | — | | — |
| Net asset value, end of | | | | | | | | | | | | | | | | |
| period | | $ 12.46 | | $ 11.37 | | | | $ 9.14 | | | | $ 8.29 | | $ 7.26 | | $ 10.54 |
| Total ReturnB,C | | 9.95% | | 24.78% | | | | 10.51% | | | | 14.19% | | (31.12)% | | (27.74)% |
| Ratios to Average Net AssetsF | | | | | | | | | | | | | | | | |
| Expenses before | | | | | | | | | | | | | | | | |
| reductions | | 1.05%A | | 1.01% | | | | 1.07% | | | | 1.08% | | 1.33% | | 1.26% |
| Expenses net of fee | | | | | | | | | | | | | | | | |
| waivers, if any | | 1.00%A | | 1.01% | | | | 1.07% | | | | 1.08% | | 1.33% | | 1.26% |
| Expenses net of all | | | | | | | | | | | | | | | | |
| reductions | | .97%A | | .98% | | | | 1.02% | | | | 1.03% | | 1.20% | | 1.22% |
| Net investment in | | | | | | | | | | | | | | | | |
| come (loss) | | .26%A | | .40E | | | | .01% | | | | .20% | | (.71)% | | .09% |
| Supplemental Data | | | | | | | | | | | | | | | | |
| Net assets, end of | | | | | | | | | | | | | | | | |
| period (000 | | | | | | | | | | | | | | | | |
| omitted) | | $107,237 | | $110,255 | | | | $38,873 | | | | $33,581 | | $33,214 | | $49,135 |
| Portfolio turnover rate | | 201%A | | 158% | | | | 201% | | | | 199% | | 256% | | 309% |
A Annualized
B Total returns for periods of less than one year are not annualized.
C Total returns would have been lower had certain expenses not been reduced during the periods shown.
D Calculated based on average shares outstanding during the period.
E Investment income per share reflects an in kind dividend received in a corporate reorganization which amounted to $.02 per share. Excluding this
dividend, the ratio of net investment income to average net assets would have been .24%.
F Expense ratios reflect operating expenses of the fund. Expenses before reductions do not reflect amounts reimbursed by the investment adviser or
reductions from brokerage service arrangements or other expense offset arrangements and do not represent the amount paid by the fund during
periods when reimbursements or reductions occur. Expenses net of fee waivers reflect expenses after reimbursement by the investment adviser but
prior to reductions from brokerage service arrangements or other expense offset arrangements. Expenses net of all reductions represent the net
expenses paid by the fund.
G Amount represents less than $.01 per share.
|
See accompanying notes which are an integral part of the financial statements.
Notes to Financial Statements
For the period ended April 30, 2006 (Unaudited)
1. Significant Accounting Policies.
Fidelity Focused Stock Fund (the fund) is a fund of Fidelity Capital Trust (the trust) and is authorized to issue an unlimited number of shares. The trust is registered under the Investment Company Act of 1940, as amended (the 1940 Act), as an open end manage ment investment company organized as a Massachusetts business trust. The fund may invest in affiliated money market central funds (Money Market Central Funds), which are open end investment companies available to investment companies and other accounts managed by Fidelity Management & Research Company (FMR) and its affili ates. The financial statements have been prepared in conformity with accounting principles generally accepted in the United States of America, which require manage ment to make certain estimates and assumptions at the date of the financial statements. The following summarizes the significant accounting policies of the fund:
Security Valuation. Investments are valued and net asset value (NAV) per share is calculated (NAV calculation) as of the close of business of the New York Stock Exchange (NYSE), normally 4:00 p.m. Eastern time. Wherever possible, the fund uses independent pricing services approved by the Board of Trustees to value its investments.
Equity securities, including restricted securities, for which market quotations are readily available, are valued at the last reported sale price or official closing price as reported by an independent pricing service on the primary market or exchange on which they are traded. In the event there were no sales during the day or closing prices are not available, securities are valued at the last quoted bid price. Investments in open end mutual funds, are valued at their closing net asset value each business day. Short term securities with remaining maturities of sixty days or less for which quotations are not readily available are valued at amortized cost, which approximates value.
When current market prices or quotations are not readily available or do not accurately reflect fair value, valuations may be determined in accordance with procedures adopted by the Board of Trustees. For example, when developments occur between the close of a market and the close of the NYSE that may materially affect the value of some or all of the securities, or when trading in a security is halted, those securities may be fair valued. Factors used in the determination of fair value may include monitoring news to identify significant market or security specific events such as changes in the value of U.S. securi ties markets, reviewing developments in foreign markets and evaluating the perfor mance of ADRs, futures contracts and exchange traded funds.
| 1. Significant Accounting Policies continued |
Security Valuation continued | | |
Because the fund’s utilization of fair value pricing depends on market activity, the frequency with which fair value pricing is used can not be predicted and may be utilized to a significant extent. The value of securities used for NAV calculation under fair value pricing may differ from published prices for the same securities.
Investment Transactions and Income. Security transactions are accounted for as of trade date. Gains and losses on securities sold are determined on the basis of identified cost and may include proceeds received from litigation. Dividend income is recorded on the ex dividend date, except for certain dividends from foreign securities where the ex dividend date may have passed, which are recorded as soon as the fund is informed of the ex dividend date. Non cash dividends included in dividend income, if any, are recorded at the fair market value of the securities received. Distributions received on securities that represent a return of capital or capital gain are recorded as a reduction of cost of investments and/or as a realized gain. The fund estimates the components of distributions received that may be considered return of capital distributions or capital gain distributions. Interest income is accrued as earned. Interest income includes coupon interest and amortization of premium and accretion of discount on debt securities.
Expenses. Most expenses of the trust can be directly attributed to a fund. Expenses which cannot be directly attributed are apportioned among each fund in the trust.
Income Tax Information and Distributions to Shareholders. Each year, the fund intends to qualify as a regulated investment company by distributing all of its taxable income and realized gains under Subchapter M of the Internal Revenue Code. As a result, no provision for income taxes is required in the accompanying financial statements.
Distributions are recorded on the ex dividend date. Income and capital gain distribu tions are determined in accordance with income tax regulations, which may differ from generally accepted accounting principles.
Capital accounts within the financial statements are adjusted for permanent book tax differences. These adjustments have no impact on net assets or the results of operations. Temporary book tax differences will reverse in a subsequent period.
Book tax differences are primarily due to futures transactions, capital loss carryforwards and losses deferred due to wash sales.
15 Semiannual Report
| Notes to Financial Statements (Unaudited) continued |
| |
| 1. Significant Accounting Policies continued |
Income Tax Information and Distributions to Shareholders continued |
The federal tax cost of investments and unrealized appreciation (depreciation) as of period end were as follows:
| Unrealized appreciation | | | | $ 11,363,924 |
| Unrealized depreciation | | | | (2,750,135) |
| Net unrealized appreciation (depreciation) | | | | $ 8,613,789 |
| Cost for federal income tax purposes | | | | $ 105,547,259 |
Short Term Trading (Redemption) Fees. Shares held in the fund less than 30 days are subject to a redemption fee equal to .75% of the proceeds of the redeemed shares. All redemption fees, including any estimated redemption fees paid by FMR, are retained by the fund and accounted for as an addition to paid in capital.
Repurchase Agreements. FMR has received an Exemptive Order from the Securities and Exchange Commission (the SEC) which permits the fund and other affiliated entities of FMR to transfer uninvested cash balances into joint trading accounts which are then invested in repurchase agreements. The fund may also invest directly with institutions in repurchase agreements. Repurchase agreements are collateralized by government or non government securities. Upon settlement date, collateral is held in segregated accounts with custodian banks and may be obtained in the event of a default of the counterparty. The fund monitors, on a daily basis, the value of the collateral to ensure it is at least equal to the principal amount of the repurchase agreement (includ ing accrued interest). In the event of a default by the counterparty, realization of the collateral proceeds could be delayed, during which time the value of the collateral may decline.
Futures Contracts. The fund may use futures contracts to manage its exposure to the stock market. Buying futures tends to increase a fund’s exposure to the underlying instrument, while selling futures tends to decrease a fund’s exposure to the underlying instrument or hedge other fund investments. Upon entering into a futures contract, a fund is required to deposit with a clearing broker, no later than the following business day, an amount (“initial margin”) equal to a certain percentage of the face value of the contract. The initial margin may be in the form of cash or securities and is transferred to a segregated account on settlement date. Subsequent payments (“variation margin”) are made or received by a fund depending on the daily fluctuations in the value of the futures contract and are accounted for as unrealized gains or losses. Realized gains (losses) are recorded upon the expiration or closing of the futures contract. Securities deposited to meet margin requirements are identified in the Schedule of Investments. Losses may
2. Operating Policies continued
Futures Contracts continued
arise from changes in the value of the underlying instruments or if the counterparties do not perform under the contract’s terms. Futures contracts are valued at the settlement price established each day by the board of trade or exchange on which they are traded.
3. Purchases and Sales of Investments.
Purchases and sales of securities, other than short term securities and U.S. government securities, aggregated $120,312,768 and $129,154,706, respectively.
4. Fees and Other Transactions with Affiliates.
Management Fee. FMR and its affiliates provide the fund with investment manage ment related services for which the fund pays a monthly management fee. The manage ment fee is the sum of an individual fund fee rate that is based on an annual rate of .30% of the fund’s average net assets and a group fee rate that averaged .27% during the period. The group fee rate is based upon the average net assets of all the mutual funds advised by FMR. The group fee rate decreases as assets under management increase and increases as assets under management decrease. In addition, the management fee is subject to a performance adjustment (up to a maximum of ±.20% of the fund’s average net assets over a 36 month performance period). The upward or downward adjustment to the management fee is based on the fund’s relative investment performance as compared to an appropriate benchmark index. For the period, the total annualized management fee rate, including the performance adjustment, was .66% of the fund’s average net assets.
Transfer Agent Fees. Fidelity Service Company, Inc. (FSC), an affiliate of FMR, is the fund’s transfer, dividend disbursing and shareholder servicing agent. FSC receives account fees and asset based fees that vary according to account size and type of ac count. FSC pays for typesetting, printing and mailing of shareholder reports, except proxy statements. For the period, the transfer agent fees were equivalent to an annual ized rate of .27% of average net assets.
Accounting and Security Lending Fees. FSC maintains the fund’s accounting re cords. The accounting fee is based on the level of average net assets for the month. Under a separate contract, FSC administers the security lending program. The security lending fee is based on the number and duration of lending transactions.
17 Semiannual Report
| Notes to Financial Statements (Unaudited) continued |
4. Fees and Other Transactions with Affiliates continued |
Affiliated Central Funds. The fund may invest in Money Market Central Funds which seek preservation of capital and current income and are managed by Fidelity Invest ments Money Management, Inc. (FIMM), an affiliate of FMR.
The Money Market Central Funds do not pay a management fee.
Brokerage Commissions. The fund placed a portion of its portfolio transactions with brokerage firms which are affiliates of the investment adviser. The commissions paid to these affiliated firms were $6,293 for the period.
5. Committed Line of Credit.
|
The fund participates with other funds managed by FMR in a $4.2 billion credit facility (the “line of credit”) to be utilized for temporary or emergency purposes to fund share holder redemptions or for other short term liquidity purposes. The fund has agreed to pay commitment fees on its pro rata portion of the line of credit, which amounts to $188 and is reflected in Miscellaneous Expense on the Statement of Operations. During the period, there were no borrowings on this line of credit.
The fund lends portfolio securities from time to time in order to earn additional income. On the settlement date of the loan, the fund receives collateral (in the form of U.S. Treasury obligations, letters of credit and/or cash) against the loaned securities and maintains collateral in an amount not less than 100% of the market value of the loaned securities during the period of the loan. The market value of the loaned securities is determined at the close of business of the fund and any additional required collateral is delivered to the fund on the next business day. If the borrower defaults on its obligation to return the securities loaned because of insolvency or other reasons, a fund could experience delays and costs in recovering the securities loaned or in gaining access to the collateral. Any cash collateral received is invested in the Fidelity Securities Lending Cash Central Fund. The value of loaned securities and cash collateral at period end are disclosed on the fund’s Statement of Assets and Liabilities. Security lending income represents the income earned on investing cash collateral, less fees and expenses associated with the loan, plus any premium payments that may be received on the loan of certain types of securities. Security lending income is presented in the Statement of Operations as a component of income from affiliated central funds. Net income from lending portfolio securities during the period amounted to $1,414.
FMR voluntarily agreed to reimburse the fund to the extent annual operating expenses exceeded 1.00% of average net assets. Some expenses, for example interest expense, are excluded from this reimbursement. During the period, this reimbursement reduced the fund’s expenses by $28,026.
Many of the brokers with whom FMR places trades on behalf of the fund provided services to the fund in addition to trade execution. These services included payments of certain expenses on behalf of the fund totaling $18,745 for the period. In addition, through arrangements with the fund’s custodian, credits realized as a result of unin vested cash balances were used to reduce the fund’s expenses. During the period, these credits reduced the fund’s custody expenses by $928.
The fund’s organizational documents provide former and current trustees and officers with a limited indemnification against liabilities arising in connection with the performance of their duties to the fund. In the normal course of business, the fund may also enter into contracts that provide general indemnifications. The fund’s maximum exposure under these arrangements is unknown as this would be dependent on future claims that may be made against the fund. The risk of material loss from such claims is considered remote.
19 Semiannual Report
Board Approval of Investment Advisory Contracts and Management Fees
Fidelity Focused Stock Fund
On January 19, 2006, the Board of Trustees, including the Independent Trustees (together, the Board), voted to approve a general research services agreement (the Agreement) between FMR, FMR Co., Inc. (FMRC), Fidelity Investments Money Manage ment, Inc. (FIMM), and Fidelity Research & Analysis Company (FRAC) (together, the Investment Advisers) for the fund, effective January 20, 2006, pursuant to which FRAC may provide general research and investment advisory support services to FMRC and FIMM. The Board considered that it has approved previously various sub advisory agreements for the fund with affiliates of FMR that allow FMR to obtain research, non discretionary advice, or discretionary portfolio management at no additional expense to the fund. The Board, assisted by the advice of fund counsel and independent Trustees’ counsel, considered a broad range of information and determined that it would be beneficial for the fund to access the research and investment advisory support services supplied by FRAC at no additional expense to the fund.
The Board reached this determination in part because the new arrangement will involve no changes in (i) the contractual terms of and fees payable under the fund’s manage ment contract or sub advisory agreements; (ii) the investment process or strategies employed in the management of the fund’s assets; (iii) the nature or level of services provided under the fund’s management contract or sub advisory agreements; (iv) the day to day management of the fund or the persons primarily responsible for such man agement; or (v) the ultimate control or beneficial ownership of FMR, FMRC, or FIMM. The Board also considered that the establishment of the Agreement would not necessi tate prior shareholder approval of the Agreement or result in an assignment and termination of the fund’s management contract or sub advisory agreements under the Investment Company Act of 1940.
Because the Board was approving an arrangement with FRAC under which the fund will not bear any additional management fees or expenses and under which the fund’s portfolio manager would not change, it did not consider the fund’s investment perfor mance, competitiveness of management fee and total expenses, costs of services and profitability, or economies of scale to be significant factors in its decision.
In connection with its future renewal of the fund’s management contract and sub advisory agreements, the Board will consider: (i) the nature, extent, and quality of services provided to the fund, including shareholder and administrative services and investment performance; (ii) the competitiveness of the fund’s management fee and total expenses; (iii) the costs of the services and profitability, including the revenues earned and the expenses incurred by Fidelity in conducting the business of developing, marketing, distributing, managing, administering, and servicing the fund and its shareholders; and (iv) whether there have been economies of scale in respect of the management of the Fidelity funds, whether the Fidelity funds (including the fund) have
appropriately benefited from any such economies of scale, and whether there is potential for realization of any further economies.
Based on its evaluation of all of the conclusions noted above, and after considering all material factors, the Board ultimately concluded that the fund’s Agreement is fair and reasonable, and that the fund’s Agreement should be approved.
21 Semiannual Report
Managing Your Investments
Fidelity offers several ways to conveniently manage your personal investments via your telephone or PC. You can access your account information, conduct trades and research your investments 24 hours a day.
By Phone
Fidelity Automated Service Telephone provides a single toll free number to access account balances, positions, quotes and trading. It’s easy to navigate the service, and on your first call, the system will help you create a personal identification number (PIN) for security.


By PC
Fidelity’s web site on the Internet provides a wide range of information, including daily financial news, fund performance, interactive planning tools and news about Fidelity products and services.

* When you call the quotes line, please remember that a fund’s yield and return will vary and, except for money market funds, share price will also vary. This means that you may have a gain or loss when you sell your shares. There is no assurance that money market funds will be able to maintain a stable $1 share price; an investment in a money market fund is not insured or guar anteed by the U.S. government. Total returns are historical and include changes in share price, reinvestment of dividends and capital gains, and the effects of any sales charges.
Semiannual Report 22
To Write Fidelity
We’ll give your correspondence immediate attention and send you written confirmation upon completion of your request.

(such as changing name, address, bank, etc.)
Fidelity Investments
P.O. Box 770001
Cincinnati, OH 45277-0002
|

Buying shares
Fidelity Investments
P.O. Box 770001
Cincinnati, OH 45277-0003
Overnight Express
Fidelity Investments
Attn: Distribution Services
100 Crosby Parkway KC1H
Covington, KY 41015
Selling shares
Fidelity Investments
P.O. Box 770001
Cincinnati, OH 45277-0035
Overnight Express
Fidelity Investments
Attn: Distribution Services
100 Crosby Parkway KC1H
Covington, KY 41015
General Correspondence
Fidelity Investments
P.O. Box 500
Merrimack, NH 03054-0500
|

Buying shares
Fidelity Investments
P.O. Box 770001
Cincinnati, OH 45277-0003
Selling shares
Fidelity Investments
P.O. Box 770001
Cincinnati, OH 45277-0035
Overnight Express
Fidelity Investments
Attn: Distribution Services
100 Crosby Parkway KC1H
Covington, KY 41015
General Correspondence
Fidelity Investments
P.O. Box 500
Merrimack, NH 03054-0500
|
23 Semiannual Report
| | Investment Adviser
Fidelity Management &
Research Company
Boston, MA
Investment Sub Advisers
FMR Co., Inc.
Fidelity Management & Research
(U.K.) Inc.
Fidelity Research & Analysis Company
(formerly Fidelity Management &
Research (Far East) Inc.)
Fidelity Investments Japan Limited
Fidelity International Investment Advisors
Fidelity International Investment Advisors
(U.K.) Limited
General Distributor
Fidelity Distributors Corporation
Boston, MA
Transfer and Service Agent
Fidelity Service Company, Inc.
Boston, MA
Custodian
JPMorgan Chase Bank
New York, NY
|
| The Fidelity Telephone Connection |
| Mutual Fund 24-Hour Service |
| Exchanges/Redemptions | | |
| and Account Assistance | | 1-800-544-6666 |
| Product Information | | 1-800-544-6666 |
| Retirement Accounts | | 1-800-544-4774 |
| (8 a.m. - 9 p.m.) | | |
| TDD Service | | 1-800-544-0118 |
| for the deaf and hearing impaired | | |
| (9 a.m. - 9 p.m. Eastern time) | | |
| Fidelity Automated Service | | |
| Telephone (FAST®) (automated phone logo) | | 1-800-544-5555 |
| (automated phone logo) Automated line for quickest service |
TQG USAN-0606
1.784914.103
|

| | Fidelity®
Small Cap Independence
Fund
|
| | Semiannual Report
April 30, 2006
|


| Contents | | | | |
| |
| Chairman’s Message | | 3 | | Ned Johnson’s message to shareholders. |
| Shareholder Expense | | 4 | | An example of shareholder expenses. |
| Example | | | | |
| Investment Changes | | 5 | | A summary of major shifts in the fund’s |
| | | | | investments over the past six months. |
| Investments | | 6 | | A complete list of the fund’s investments |
| | | | | with their market values. |
| Financial Statements | | 16 | | Statements of assets and liabilities, |
| | | | | operations, and changes in net assets, |
| | | | | as well as financial highlights. |
| Notes | | 20 | | Notes to the financial statements. |
| Board Approval of | | 26 | | |
| Investment Advisory | | | | |
| Contracts and | | | | |
| Management Fees | | | | |
To view a fund’s proxy voting guidelines and proxy voting record for the 12 month period ended
June 30, visit www.fidelity.com/proxyvotingresults or visit the Securities and Exchange Commis
sion’s (SEC) web site at www.sec.gov. You may also call 1-800-544-8544 to request a free copy of
the proxy voting guidelines.
Standard & Poor’s, S&P and S&P 500 are registered service marks of The McGraw Hill Companies,
Inc. and have been licensed for use by Fidelity Distributors Corporation.
Other third party marks appearing herein are the property of their respective owners.
All other marks appearing herein are registered or unregistered trademarks or service marks
of FMR Corp. or an affiliated company.
|
| | This report and the financial statements contained herein are submitted for the general information
of the shareholders of the fund. This report is not authorized for distribution to prospective investors
in the fund unless preceded or accompanied by an effective prospectus.
A fund files its complete schedule of portfolio holdings with the SEC for the first and third
quarters of each fiscal year on Form N Q. Forms N Q are available on the SEC’s web site at
http://www.sec.gov. A fund’s Forms N Q may be reviewed and copied at the SEC’s Public Refer
ence Room in Washington, DC. Information regarding the operation of the SEC’s Public Reference
Room may be obtained by calling 1-800-SEC-0330. For a complete list of a fund’s portfolio
holdings, view the most recent quarterly holdings report, semiannual report, or annual report
on Fidelity’s web site at http://www.fidelity.com/holdings.
NOT FDIC INSURED · MAY LOSE VALUE · NO BANK GUARANTEE
Neither the fund nor Fidelity Distributors Corporation is a bank.
|
Chairman’s Message
(photograph of Edward C. Johnson 3d)
Dear Shareholder:
Although many securities markets made gains in early 2006, there is only one certainty when it comes to investing: There is no sure thing. There are, however, a number of time tested, fundamental investment principles that can put the historical odds in your favor.
One of the basic tenets is to invest for the long term. Over time, riding out the markets’ inevitable ups and downs has proven much more effective than selling into panic or chasing the hottest trend. Even missing only a few of the markets’ best days can significantly diminish investor returns. Patience also affords the benefits of compounding of earning interest on additional income or reinvested dividends and capital gains. There are tax advantages and cost benefits to consider as well. The more you sell, the more taxes you pay, and the more you trade, the higher the costs. While staying the course doesn’t eliminate risk, it can considerably lessen the effect of short term declines.
You can further manage your investing risk through diversification. And today, more than ever, geographic diversification should be taken into account. Stud ies indicate that asset allocation is the single most important determinant of a portfolio’s long term success. The right mix of stocks, bonds and cash aligned to your particular risk tolerance and investment objective is very important. Age appropriate rebalancing is also an essential aspect of asset allocation. For younger investors, an emphasis on equities which historically have been the best performing asset class over time is encouraged. As investors near their specific goal, such as retirement or sending a child to college, consideration may be given to replacing volatile assets (e.g. common stocks) with more stable fixed investments (bonds or savings plans).
A third investment principle investing regularly can help lower the average cost of your purchases. Investing a certain amount of money each month or quarter helps ensure you won’t pay for all your shares at market highs. This strategy known as dollar cost averaging also reduces unconstructive “emotion” from investing, helping shareholders avoid selling weak performers just prior to an upswing, or chasing a hot performer just before a correction.
We invite you to contact us via the Internet, through our Investor Centers or over the phone. It is our privilege to provide you the information you need to make the investments that are right for you.
Sincerely,
/s/ Edward C. Johnson 3d
Edward C. Johnson 3d
3 Semiannual Report
Shareholder Expense Example
As a shareholder of the Fund, you incur two types of costs: (1) transaction costs, including redemption fees, and (2) ongoing costs, including management fees and other Fund expenses. This Example is intended to help you understand your ongoing costs (in dollars) of investing in the Fund and to compare these costs with the ongoing costs of investing in other mutual funds.
The Example is based on an investment of $1,000 invested at the beginning of the period and held for the entire period (November 1, 2005 to April 30, 2006).
The first line of the table below provides information about actual account values and actual expenses. You may use the information in this line, together with the amount you invested, to estimate the expenses that you paid over the period. Simply divide your account value by $1,000.00 (for example, an $8,600 account value divided by $1,000.00 = 8.6), then multiply the result by the number in the first line under the heading entitled “Expenses Paid During Period” to estimate the expenses you paid on your account during this period. A small balance maintenance fee of $12.00 that is charged once a year may apply for certain accounts with a value of less than $2,000. This fee is not included in the table below. If it was, the estimate of expenses you paid during the period would be higher, and your ending account value lower, by this amount.
Hypothetical Example for Comparison Purposes
The second line of the table below provides information about hypothetical account values and hypothetical expenses based on the Fund’s actual expense ratio and an assumed rate of return of 5% per year before expenses, which is not the Fund’s actual return. The hypothetical account values and expenses may not be used to estimate the actual ending account balance or expenses you paid for the period. You may use this information to compare the ongoing costs of investing in the Fund and other funds. To do so, compare this 5% hypothetical example with the 5% hypothetical examples that appear in the share holder reports of the other funds. A small balance maintenance fee of $12.00 that is charged once a year may apply for certain accounts with a value of less than $2,000. This fee is not included in the table below. If it was, the estimate of expenses you paid during the period would be higher, and your ending account value lower, by this amount.
Please note that the expenses shown in the table are meant to highlight your ongoing costs only and do not reflect any transaction costs. Therefore, the second line of the table is useful in comparing ongoing costs only, and will not help you determine the relative total costs of owning different funds. In addition, if these transactional costs were included, your costs would have been higher.
| | | | | | | | | | | Expenses Paid |
| | | Beginning | | | | Ending | | During Period* |
| | | Account Value | | | | Account Value | | November 1, 2005 |
| | | November 1, 2005 | | | | April 30, 2006 | | to April 30, 2006 |
| Actual | | | | $ 1,000.00 | | | | $ 1,187.00 | | | | $ 4.45 |
| Hypothetical (5% return per year | | | | | | | | | | | | |
| before expenses) | | | | $ 1,000.00 | | | | $ 1,020.73 | | | | $ 4.11 |
* Expenses are equal to the Fund’s annualized expense ratio of .82%; multiplied by the average account value over the period, multiplied by 181/365 (to reflect the one half year period).
| Investment Changes | | | | |
| |
| |
| Top Ten Stocks as of April 30, 2006 | | | | |
| | | % of fund’s | | % of fund’s net assets |
| | | net assets | | 6 months ago |
| Medicis Pharmaceutical Corp. Class A | | 1.8 | | 0.0 |
| RSA Security, Inc. | | 1.7 | | 0.0 |
| The Restaurant Group PLC | | 1.6 | | 0.0 |
| Allegheny Technologies, Inc. | | 1.5 | | 0.0 |
| Pier 1 Imports, Inc. | | 1.5 | | 0.0 |
| Fourlis Holdings SA | | 1.5 | | 0.0 |
| Maverick Tube Corp. | | 1.5 | | 0.0 |
| NETeller PLC | | 1.4 | | 0.0 |
| SolarWorld AG | | 1.4 | | 0.0 |
| Hydril Co. | | 1.3 | | 0.0 |
| | | 15.2 | | |
Top Five Market Sectors as of April 30, 2006 | | |
| | | % of fund’s | | % of fund’s net assets |
| | | net assets | | 6 months ago |
| Information Technology | | 22.9 | | 11.8 |
| Consumer Discretionary | | 19.8 | | 16.6 |
| Energy | | 14.4 | | 12.6 |
| Industrials | | 13.6 | | 11.8 |
| Health Care | | 11.5 | | 19.4 |

5 Semiannual Report
| Investments April 30, 2006 (Unaudited) |
| Showing Percentage of Net Assets | | | | | | |
| |
| Common Stocks 99.3% | | | | | | |
| | | Shares | | Value (Note 1) |
| | | | | (000s) |
| |
| CONSUMER DISCRETIONARY – 19.8% | | | | | | |
| Auto Components 0.5% | | | | | | |
| Gentex Corp. | | 879,900 | | | | $ 12,899 |
| Noble International Ltd. | | 1 | | | | 0 |
| | | | | | | 12,899 |
| Distributors – 1.6% | | | | | | |
| Keystone Automotive Industries, Inc. (a) | | 656,100 | | | | 27,097 |
| Prestige Brands Holdings, Inc. (a) | | 1,038,200 | | | | 12,697 |
| | | | | | | 39,794 |
| Hotels, Restaurants & Leisure 4.6% | | | | | | |
| BJ’s Restaurants, Inc. (a) | | 411,200 | | | | 10,827 |
| Chipotle Mexican Grill, Inc. Class A | | 1,400 | | | | 73 |
| Gaming Partners International Corp. | | 153,205 | | | | 2,559 |
| Isle of Capri Casinos, Inc. (a) | | 516,900 | | | | 16,127 |
| P.F. Chang’s China Bistro, Inc. (a)(d) | | 212,600 | | | | 9,059 |
| Pinnacle Entertainment, Inc. (a) | | 764,800 | | | | 20,879 |
| St. Marc Holdings Co. Ltd. | | 159,600 | | | | 11,002 |
| The Restaurant Group PLC (e) | | 10,181,822 | | | | 40,295 |
| Vail Resorts, Inc. (a) | | 147,410 | | | | 5,543 |
| WMS Industries, Inc. (a) | | 42,300 | | | | 1,322 |
| | | | | | | 117,686 |
| Household Durables – 2.4% | | | | | | |
| Fourlis Holdings SA | | 2,476,760 | | | | 38,435 |
| Ryland Group, Inc. | | 192,300 | | | | 12,136 |
| Standard Pacific Corp. | | 381,300 | | | | 12,091 |
| | | | | | | 62,662 |
| Internet & Catalog Retail 0.7% | | | | | | |
| NutriSystem, Inc. (a)(d) | | 270,800 | | | | 18,376 |
| Leisure Equipment & Products – 0.4% | | | | | | |
| MarineMax, Inc. (a) | | 321,800 | | | | 10,542 |
| Media – 3.6% | | | | | | |
| Carmike Cinemas, Inc. (d)(e) | | 906,500 | | | | 22,400 |
| Focus Media Holding Ltd. ADR | | 236,500 | | | | 14,282 |
| Metal Bulletin PLC | | 798,943 | | | | 4,521 |
| Modern Times Group AB (MTG) (B Shares) (a) | | 314,600 | | | | 17,272 |
| Regal Entertainment Group Class A (d) | | 1,584,700 | | | | 33,310 |
| | | | | | | 91,785 |
| Multiline Retail – 0.2% | | | | | | |
| Conn’s, Inc. (a)(d) | | 137,000 | | | | 4,681 |
See accompanying notes which are an integral part of the financial statements.
Semiannual Report 6
| Common Stocks continued | | | | | | |
| | | Shares | | Value (Note 1) |
| | | | | (000s) |
| |
| CONSUMER DISCRETIONARY – continued | | | | | | |
| Specialty Retail – 4.4% | | | | | | |
| Charlotte Russe Holding, Inc. (a) | | 673,600 | | | | $ 14,550 |
| Cost Plus, Inc. (a) | | 950,201 | | | | 16,724 |
| New York & Co., Inc. (a) | | 281,700 | | | | 4,386 |
| Pacific Sunwear of California, Inc. (a) | | 50,000 | | | | 1,165 |
| Pier 1 Imports, Inc. (d) | | 3,225,500 | | | | 38,932 |
| The Men’s Wearhouse, Inc. | | 293,150 | | | | 10,389 |
| Williams Sonoma, Inc. | | 626,800 | | | | 26,244 |
| | | | | | | 112,390 |
| Textiles, Apparel & Luxury Goods – 1.4% | | | | | | |
| Timberland Co. Class A (a) | | 447,200 | | | | 15,227 |
| True Religion Apparel, Inc. (a)(d) | | 1,097,851 | | | | 21,353 |
| | | | | | | 36,580 |
| |
| TOTAL CONSUMER DISCRETIONARY | | | | | | 507,395 |
| |
| CONSUMER STAPLES 2.6% | | | | | | |
| Beverages – 0.9% | | | | | | |
| Hansen Natural Corp. (a)(d) | | 171,800 | | | | 22,241 |
| Food & Staples Retailing – 1.2% | | | | | | |
| Itochushokuhin Co. Ltd. | | 245,200 | | | | 10,443 |
| United Natural Foods, Inc. (a) | | 678,100 | | | | 21,679 |
| | | | | | | 32,122 |
| Food Products 0.5% | | | | | | |
| Corn Products International, Inc. | | 218,800 | | | | 6,126 |
| Imperial Sugar Co. | | 198,100 | | | | 6,769 |
| | | | | | | 12,895 |
| |
| TOTAL CONSUMER STAPLES | | | | | | 67,258 |
| |
| ENERGY 14.4% | | | | | | |
| Energy Equipment & Services – 9.0% | | | | | | |
| Carbo Ceramics, Inc. (d) | | 501,900 | | | | 29,075 |
| Compagnie Generale de Geophysique SA sponsored ADR | | 325,000 | | | | 10,472 |
| Core Laboratories NV (a) | | 498,100 | | | | 30,509 |
| Dawson Geophysical Co. (a) | | 137,000 | | | | 3,973 |
| Hydril Co. (a) | | 421,400 | | | | 33,779 |
| Maverick Tube Corp. (a)(d) | | 697,400 | | | | 37,953 |
| Oil States International, Inc. (a) | | 789,900 | | | | 31,888 |
| Petroleum Geo-Services ASA sponsored ADR (a) | | 310,700 | | | | 17,443 |
See accompanying notes which are an integral part of the financial statements.
| Investments (Unaudited) continued | | | | | | |
| |
| |
| Common Stocks continued | | | | | | | | |
| | | | | Shares | | Value (Note 1) |
| | | | | | | (000s) |
| |
| ENERGY – continued | | | | | | | | |
| Energy Equipment & Services – continued | | | | | | | | |
| Superior Energy Services, Inc. (a) | | | | 469,900 | | | | $ 15,107 |
| TGS Nopec Geophysical Co. ASA (a) | | | | 300,500 | | | | 20,190 |
| | | | | | | | | 230,389 |
| Oil, Gas & Consumable Fuels – 5.4% | | | | | | | | |
| Encore Acquisition Co. (a) | | | | 388,550 | | | | 11,905 |
| Energy Partners Ltd. (a) | | | | 338,300 | | | | 8,725 |
| Forest Oil Corp. (a) | | | | 231,700 | | | | 8,473 |
| Goodrich Petroleum Corp. (a)(d) | | | | 567,500 | | | | 15,345 |
| Holly Corp. | | | | 210,600 | | | | 16,252 |
| Houston Exploration Co. (a) | | | | 284,000 | | | | 15,881 |
| KCS Energy, Inc. (a) | | | | 421,300 | | | | 12,365 |
| Mariner Energy, Inc. (a) | | | | 187,514 | | | | 3,647 |
| Overseas Shipholding Group, Inc. | | | | 349,100 | | | | 17,047 |
| Petroleum Development Corp. (a) | | | | 245,800 | | | | 9,834 |
| Plains Exploration & Production Co. (a) | | | | 500,100 | | | | 18,439 |
| Range Resources Corp. | | | | 62,400 | | | | 1,655 |
| | | | | | | | | 139,568 |
| |
| TOTAL ENERGY | | | | | | | | 369,957 |
| |
| FINANCIALS – 8.8% | | | | | | | | |
| Commercial Banks – 1.9% | | | | | | | | |
| East West Bancorp, Inc. | | | | 424,500 | | | | 16,840 |
| Hanmi Financial Corp. | | | | 789,882 | | | | 15,387 |
| Signature Bank, New York (a) | | | | 50,203 | | | | 1,776 |
| UCBH Holdings, Inc. | | | | 865,300 | | | | 15,307 |
| | | | | | | | | 49,310 |
| Diversified Financial Services – 3.1% | | | | | | | | |
| African Bank Investments Ltd. | | | | 5,064,498 | | | | 28,302 |
| IntercontinentalExchange, Inc. | | | | 219,500 | | | | 15,653 |
| NETeller PLC (a) | | | | 2,504,500 | | | | 35,399 |
| | | | | | | | | 79,354 |
| Insurance – 3.1% | | | | | | | | |
| Aspen Insurance Holdings Ltd. | | | | 987,900 | | | | 24,055 |
| Montpelier Re Holdings Ltd. | | | | 734,924 | | | | 11,869 |
| Navigators Group, Inc. (a) | | | | 434,300 | | | | 20,547 |
See accompanying notes which are an integral part of the financial statements.
| Common Stocks continued | | | | | | |
| | | Shares | | Value (Note 1) |
| | | | | (000s) |
| |
| FINANCIALS – continued | | | | | | |
| Insurance – continued | | | | | | |
| Philadelphia Consolidated Holdings Corp. (a) | | 504,948 | | | | $ 16,729 |
| Scottish Re Group Ltd. | | 332,350 | | | | 7,720 |
| | | | | | | 80,920 |
| Real Estate 0.3% | | | | | | |
| Unite Group PLC | | 976,587 | | | | 7,195 |
| Thrifts & Mortgage Finance – 0.4% | | | | | | |
| Farmer Mac Class C (non-vtg.) | | 331,100 | | | | 9,526 |
| |
| TOTAL FINANCIALS | | | | | | 226,305 |
| |
| HEALTH CARE – 11.5% | | | | | | |
| Biotechnology – 0.1% | | | | | | |
| Alnylam Pharmaceuticals, Inc. (a) | | 39,000 | | | | 601 |
| Protherics PLC (a) | | 2,161,710 | | | | 3,430 |
| | | | | | | 4,031 |
| Health Care Equipment & Supplies – 3.2% | | | | | | |
| Conceptus, Inc. (a) | | 576,603 | | | | 7,923 |
| Cynosure, Inc. Class A (e) | | 500,000 | | | | 9,015 |
| Fisher Scientific International, Inc. (a) | | 227,681 | | | | 16,063 |
| Somanetics Corp. (a) | | 174,809 | | | | 2,869 |
| SonoSite, Inc. (a) | | 574,700 | | | | 21,695 |
| Stereotaxis, Inc. (a) | | 1,572,292 | | | | 18,616 |
| Syneron Medical Ltd. (a) | | 221,900 | | | | 5,741 |
| | | | | | | 81,922 |
| Health Care Providers & Services – 4.6% | | | | | | |
| American Retirement Corp. (a) | | 417,400 | | | | 10,602 |
| Brookdale Senior Living, Inc. | | 324,300 | | | | 12,336 |
| Capital Senior Living Corp. (a)(e) | | 1,467,000 | | | | 16,108 |
| Chemed Corp. | | 414,604 | | | | 22,592 |
| Emeritus Corp. (a) | | 701,300 | | | | 15,190 |
| Healthways, Inc. (a) | | 595,500 | | | | 29,215 |
| Vital Images, Inc. (a) | | 360,900 | | | | 12,065 |
| | | | | | | 118,108 |
| Pharmaceuticals – 3.6% | | | | | | |
| Allergan, Inc. | | 172,100 | | | | 17,678 |
See accompanying notes which are an integral part of the financial statements.
| Investments (Unaudited) continued | | | | | | |
| |
| |
| Common Stocks continued | | | | | | |
| | | Shares | | Value (Note 1) |
| | | | | (000s) |
| |
| HEALTH CARE – continued | | | | | | |
| Pharmaceuticals – continued | | | | | | |
| Medicis Pharmaceutical Corp. Class A (d) | | 1,380,100 | | | | $ 45,381 |
| New River Pharmaceuticals, Inc. (a) | | 845,800 | | | | 28,757 |
| | | | | | | 91,816 |
| |
| TOTAL HEALTH CARE | | | | | | 295,877 |
| |
| INDUSTRIALS – 13.6% | | | | | | |
| Aerospace & Defense – 2.1% | | | | | | |
| Alliant Techsystems, Inc. (a) | | 345,930 | | | | 27,671 |
| Hawk Corp. Class A (a) | | 326,500 | | | | 4,894 |
| United Industrial Corp. (d) | | 312,300 | | | | 20,518 |
| | | | | | | 53,083 |
| Airlines – 0.3% | | | | | | |
| ACE Aviation Holdings, Inc. Class A (a) | | 279,400 | | | | 7,722 |
| Building Products 1.1% | | | | | | |
| Insteel Industries, Inc. | | 88,300 | | | | 3,299 |
| Jacuzzi Brands, Inc. (a) | | 2,480,857 | | | | 24,238 |
| | | | | | | 27,537 |
| Commercial Services & Supplies – 3.4% | | | | | | |
| AgCert International | | 196,400 | | | | 901 |
| Carter & Carter Group PLC | | 501,600 | | | | 5,420 |
| Corrections Corp. of America (a) | | 339,619 | | | | 15,242 |
| Huron Consulting Group, Inc. (a) | | 831,400 | | | | 29,556 |
| ITE Group PLC | | 4,096,900 | | | | 9,340 |
| Tele Atlas NV (Netherlands) (a) | | 1,056,500 | | | | 26,792 |
| | | | | | | 87,251 |
| Construction & Engineering – 0.6% | | | | | | |
| ENGlobal Corp. (a)(d) | | 357,757 | | | | 3,667 |
| Infrasource Services, Inc. (a) | | 669,800 | | | | 12,653 |
| | | | | | | 16,320 |
| Electrical Equipment – 2.5% | | | | | | |
| Capstone Turbine Corp. (a)(d) | | 1,618,082 | | | | 6,116 |
| Genlyte Group, Inc. (a) | | 174,300 | | | | 12,011 |
| GrafTech International Ltd. (a) | | 1,024,200 | | | | 6,924 |
| SolarWorld AG | | 113,400 | | | | 35,339 |
| Suntech Power Holdings Co. Ltd. sponsored ADR | | 138,000 | | | | 4,732 |
| | | | | | | 65,122 |
See accompanying notes which are an integral part of the financial statements.
| Common Stocks continued | | | | | | |
| | | Shares | | Value (Note 1) |
| | | | | (000s) |
| |
| INDUSTRIALS – continued | | | | | | |
| Machinery – 0.6% | | | | | | |
| Valmont Industries, Inc. | | 258,000 | | | | $ 13,868 |
| Road & Rail 0.5% | | | | | | |
| Old Dominion Freight Lines, Inc. (a) | | 371,800 | | | | 11,972 |
| Trading Companies & Distributors – 2.5% | | | | | | |
| Ashtead Group PLC | | 6,041,687 | | | | 25,894 |
| Beacon Roofing Supply, Inc. (a) | | 333,300 | | | | 12,332 |
| Bergman & Beving AB (B Shares) | | 603,459 | | | | 12,793 |
| Watsco, Inc. | | 220,600 | | | | 13,997 |
| | | | | | | 65,016 |
| |
| TOTAL INDUSTRIALS | | | | | | 347,891 |
| |
| INFORMATION TECHNOLOGY – 22.9% | | | | | | |
| Communications Equipment – 1.8% | | | | | | |
| Bookham, Inc. (a)(d)(e) | | 3,533,716 | | | | 21,520 |
| MasTec, Inc. (a) | | 1,391,600 | | | | 17,158 |
| TANDBERG ASA (d) | | 606,870 | | | | 6,180 |
| | | | | | | 44,858 |
| Computers & Peripherals – 2.1% | | | | | | |
| NCR Corp. (a) | | 422,800 | | | | 16,658 |
| QLogic Corp. (a) | | 858,500 | | | | 17,865 |
| Rackable Systems, Inc. | | 393,400 | | | | 20,217 |
| | | | | | | 54,740 |
| Electronic Equipment & Instruments – 2.0% | | | | | | |
| FARO Technologies, Inc. (a)(d)(e) | | 1,029,000 | | | | 15,631 |
| FLIR Systems, Inc. (a) | | 238,749 | | | | 5,837 |
| Itron, Inc. (a) | | 180,000 | | | | 12,069 |
| Optimal Group, Inc. Class A (a)(e) | | 1,174,300 | | | | 18,072 |
| | | | | | | 51,609 |
| Internet Software & Services – 5.6% | | | | | | |
| Aladdin Knowledge Systems Ltd. (a)(e) | | 1,082,900 | | | | 25,253 |
| aQuantive, Inc. (a)(d) | | 694,500 | | | | 17,404 |
| Bankrate, Inc. (a)(d) | | 615,808 | | | | 29,725 |
| CyberSource Corp. (a) | | 298,948 | | | | 2,792 |
| Digitas, Inc. (a) | | 2,228,100 | | | | 31,438 |
| SonicWALL, Inc. (a) | | 1,756,400 | | | | 14,912 |
| ValueClick, Inc. (a) | | 1,303,500 | | | | 21,964 |
| | | | | | | 143,488 |
See accompanying notes which are an integral part of the financial statements.
11 Semiannual Report
| Investments (Unaudited) continued | | | | | | |
| |
| |
| Common Stocks continued | | | | | | |
| | | Shares | | Value (Note 1) |
| | | | | (000s) |
| |
| INFORMATION TECHNOLOGY – continued | | | | | | |
| IT Services – 1.1% | | | | | | |
| MoneyGram International, Inc. | | 857,753 | | | | $ 29,078 |
| Semiconductors & Semiconductor Equipment – 6.8% | | | | | | |
| Actel Corp. (a) | | 90,300 | | | | 1,451 |
| ATI Technologies, Inc. (a) | | 1,041,900 | | | | 16,167 |
| Broadcom Corp. Class A (a) | | 523,950 | | | | 21,540 |
| Cypress Semiconductor Corp. (a) | | 881,000 | | | | 15,118 |
| DSP Group, Inc. (a) | | 814,200 | | | | 22,016 |
| Intersil Corp. Class A | | 554,100 | | | | 16,407 |
| Leadis Technology, Inc. (a) | | 8,540 | | | | 53 |
| O2Micro International Ltd. sponsored ADR (a) | | 700,400 | | | | 7,522 |
| Q Cells AG (d) | | 156,000 | | | | 14,397 |
| Saifun Semiconductors Ltd. | | 87,400 | | | | 2,991 |
| Silicon Laboratories, Inc. (a) | | 277,500 | | | | 12,934 |
| Silicon On Insulator Technologies SA (SOITEC) (a) | | 800,100 | | | | 26,114 |
| SiRF Technology Holdings, Inc. (a) | | 517,948 | | | | 17,688 |
| | | | | | | 174,398 |
| Software 3.5% | | | | | | |
| Fair, Isaac & Co., Inc. | | 148,200 | | | | 5,500 |
| JDA Software Group, Inc. (a) | | 256,473 | | | | 3,503 |
| KongZhong Corp. sponsored ADR (a) | | 1,133,500 | | | | 15,427 |
| Napster, Inc. (a) | | 1,410,700 | | | | 6,532 |
| NAVTEQ Corp. (a) | | 115,864 | | | | 4,811 |
| Open Solutions, Inc. (a) | | 399,000 | | | | 10,861 |
| RSA Security, Inc. (a) | | 2,014,900 | | | | 42,192 |
| | | | | | | 88,826 |
| |
| TOTAL INFORMATION TECHNOLOGY | | | | | | 586,997 |
| |
| MATERIALS 4.7% | | | | | | |
| Chemicals – 0.0% | | | | | | |
| Lawrence PLC | | 30,031 | | | | 168 |
| Metals & Mining – 4.7% | | | | | | |
| Allegheny Technologies, Inc. | | 567,700 | | | | 39,364 |
| Brush Engineered Materials, Inc. (a) | | 538,100 | | | | 12,543 |
| Carpenter Technology Corp. | | 247,100 | | | | 29,393 |
See accompanying notes which are an integral part of the financial statements.
| Common Stocks continued | | | | | | |
| | | Shares | | Value (Note 1) |
| | | | | (000s) |
| |
| MATERIALS – continued | | | | | | |
| Metals & Mining – continued | | | | | | |
| Oregon Steel Mills, Inc. (a) | | 340,425 | | | | $ 16,861 |
| Shore Gold, Inc. (a) | | 3,671,300 | | | | 21,016 |
| | | | | | | 119,177 |
| |
| TOTAL MATERIALS | | | | | | 119,345 |
| |
| TELECOMMUNICATION SERVICES – 0.6% | | | | | | |
| Diversified Telecommunication Services – 0.6% | | | | | | |
| Level 3 Communications, Inc. (a)(d) | | 2,643,300 | | | | 14,274 |
| UTILITIES – 0.4% | | | | | | |
| Electric Utilities – 0.4% | | | | | | |
| AES Tiete SA (PN) (non-vtg.) | | 366,000,000 | | | | 10,303 |
| TOTAL COMMON STOCKS | | | | | | |
| (Cost $2,212,167) | | | | | | 2,545,602 |
| |
| Money Market Funds 9.3% | | | | | | |
| |
| Fidelity Cash Central Fund, 4.8% (b) | | 43,279,365 | | | | 43,279 |
| Fidelity Securities Lending Cash Central Fund, 4.83% (b)(c) | | 194,132,381 | | | | 194,132 |
| TOTAL MONEY MARKET FUNDS | | | | | | |
| (Cost $237,411) | | | | | | 237,411 |
| |
| TOTAL INVESTMENT PORTFOLIO 108.6% | | | | | | |
| (Cost $2,449,578) | | | | | | 2,783,013 |
| |
| NET OTHER ASSETS – (8.6)% | | | | | | (219,249) |
| NET ASSETS 100% | | | | | | $ 2,563,764 |
Legend
(a) Non-income producing
|
(b) Affiliated fund that is available only to
investment companies and other
accounts managed by Fidelity
Investments. The rate quoted is the
annualized seven-day yield of the fund
at period end. A complete unaudited
listing of the fund’s holdings as of its
most recent quarter end is available
upon request.
|
See accompanying notes which are an integral part of the financial statements.
13 Semiannual Report
Investments (Unaudited) continued
(c) Investment made with cash collateral
received from securities on loan.
|
(d) Security or a portion of the security is on loan at period end.
(e) Affiliated company
Affiliated Central Funds
Information regarding fiscal year to date income earned by the fund from the affiliated Central funds is as follows:
| Fund | | Income earned |
| | | (amounts in thousands) |
| Fidelity Cash Central Fund | | | | $ 1,615 |
| Fidelity Securities Lending Cash Central Fund | | | | 1,199 |
| Total | | | | $ 2,814 |
Other Affiliated Issuers
An affiliated company is a company in which the fund has ownership of at least 5% of the voting securities. Fiscal year to date transactions with companies which are or were affiliates are as follows:
| | | | | Value, | | Purchases | | | | Sales | | | | Dividend | | | | Value, end |
| Affiliate | | | | beginning of | | | | | | Proceeds | | | | Income | | | | of period |
| (amounts in thousands) | | | | period | | | | | | | | | | | | | | |
| Aladdin Knowledge | | | | | | | | | | | | | | | | | | |
| Systems Ltd. | | | | $ — | | $ 21,817 | | | | $ — | | | | $ — | | | | 25,253 |
| Allied Healthcare | | | | | | | | | | | | | | | | | | |
| International, Inc. | | | | 14,067 | | — | | | | 15,153 | | | | — | | | | — |
| Anika Therapeutics, Inc. | | | | — | | 9,263 | | | | 8,251 | | | | — | | | | — |
| Bookham, Inc. | | | | — | | 28,810 | | | | — | | | | — | | | | 21,520 |
| Capital Senior Living | | | | | | | | | | | | | | | | | | |
| Corp. | | | | — | | 14,161 | | | | — | | | | — | | | | 16,108 |
| Carmike Cinemas, Inc. | | | | — | | 21,375 | | | | — | | | | 317 | | | | 22,400 |
| CAS Medical Systems, | | | | | | | | | | | | | | | | | | |
| Inc. | | | | — | | 11,288 | | | | 6,521 | | | | — | | | | — |
| Cynosure, Inc. Class A | | | | — | | 10,865 | | | | — | | | | — | | | | 9,015 |
| FARO Technologies, Inc. | | | | — | | 21,271 | | | | — | | | | — | | | | 15,631 |
| New Frontier Media, | | | | | | | | | | | | | | | | | | |
| Inc. | | | | 6,560 | | — | | | | 7,248 | | | | — | | | | — |
| Optimal Group, Inc. | | | | | | | | | | | | | | | | | | |
| Class A | | | | — | | 20,210 | | | | — | | | | — | | | | 18,072 |
| Packaging Dynamics | | | | | | | | | | | | | | | | | | |
| Corp. | | | | 7,425 | | — | | | | 7,259 | | | | — | | | | — |
| SOURCECORP, Inc. | | | | 18,054 | | — | | | | 19,763 | | | | — | | | | — |
| Stereotaxis, Inc. | | | | — | | 22,225 | | | | 134 | | | | — | | | | — |
| The Geo Group, Inc. | | | | 16,299 | | — | | | | 17,300 | | | | — | | | | — |
| The Restaurant Group | | | | | | | | | | | | | | | | | | |
| PLC | | | | — | | 29,679 | | | | — | | | | 2,245 | | | | 40,295 |
| Whitehall Jewellers, Inc. | | | | 790 | | — | | | | 728 | | | | — | | | | — |
| Total | | | | $ 63,195 | | $ 210,964 | | | | $ 82,357 | | | | $ 2,562 | | | | $ 168,294 |
See accompanying notes which are an integral part of the financial statements.
Semiannual Report 14
Other Information
Distribution of investments by country of issue, as a percentage of total net assets, is as follows:
| United States of America | | 75.4% |
| United Kingdom | | 5.2% |
| Canada | | 2.4% |
| Netherlands | | 2.2% |
| Germany | | 2.0% |
| Norway | | 1.8% |
| Greece | | 1.5% |
| France | | 1.4% |
| Bermuda | | 1.4% |
| Cayman Islands | | 1.4% |
| Israel | | 1.3% |
| Sweden | | 1.2% |
| South Africa | | 1.1% |
| Others (individually less than 1%) . | | 1.7% |
| | | 100.0% |
See accompanying notes which are an integral part of the financial statements.
15 Semiannual Report
| Financial Statements | | | | | | |
| |
| Statement of Assets and Liabilities | | | | | | |
| Amounts in thousands (except per share amount) | | | | April 30, 2006 (Unaudited) |
| |
| Assets | | | | | | |
| Investment in securities, at value (including securities | | | | | | |
| loaned of $189,542) See accompanying schedule: | | | | | | |
| Unaffiliated issuers (cost $2,043,981) | | | | $ 2,377,308 | | |
| Affiliated Central Funds (cost $237,411) | | | | 237,411 | | |
| Other affiliated issuers (cost $168,186) | | | | 168,294 | | |
| Total Investments (cost $2,449,578) | | | | | | $ 2,783,013 |
| Cash | | | | | | 1,089 |
| Foreign currency held at value (cost $797) | | | | | | 794 |
| Receivable for investments sold | | | | | | 35,370 |
| Receivable for fund shares sold | | | | | | 6,233 |
| Dividends receivable | | | | | | 521 |
| Interest receivable | | | | | | 156 |
| Prepaid expenses | | | | | | 4 |
| Other receivables | | | | | | 631 |
| Total assets | | | | | | 2,827,811 |
| |
| Liabilities | | | | | | |
| Payable for investments purchased | | | | 66,659 | | |
| Payable for fund shares redeemed | | | | 1,398 | | |
| Accrued management fee | | | | 1,162 | | |
| Other affiliated payables | | | | 557 | | |
| Other payables and accrued expenses | | | | 139 | | |
| Collateral on securities loaned, at value | | | | 194,132 | | |
| Total liabilities | | | | | | 264,047 |
| |
| Net Assets | | | | | | $ 2,563,764 |
| Net Assets consist of: | | | | | | |
| Paid in capital | | | | | | $ 2,026,172 |
| Undistributed net investment income | | | | | | 1,930 |
| Accumulated undistributed net realized gain (loss) on | | | | | | |
| investments and foreign currency transactions | | | | | | 202,235 |
| Net unrealized appreciation (depreciation) on | | | | | | |
| investments and assets and liabilities in foreign | | | | | | |
| currencies | | | | | | 333,427 |
| Net Assets, for 110,856 shares outstanding | | | | | | $ 2,563,764 |
| Net Asset Value, offering price and redemption price per | | | | | | |
| share ($2,563,764 ÷ 110,856 shares) | | | | | | $ 23.13 |
See accompanying notes which are an integral part of the financial statements.
Semiannual Report 16
| Statement of Operations | | | | | | |
| Amounts in thousands | | Six months ended April 30, 2006 (Unaudited) |
| |
| Investment Income | | | | | | |
| Dividends (including $2,562 received from other | | | | | | |
| affiliated issuers) | | | | | | $ 4,758 |
| Special dividends | | | | | | 2,245 |
| Interest | | | | | | 86 |
| Income from affiliated Central Funds (including $1,199 | | | | | | |
| from security lending) | | | | | | 2,814 |
| Total income | | | | | | 9,903 |
| |
| Expenses | | | | | | |
| Management fee | | | | | | |
| Basic fee | | | | $ 6,423 | | |
| Performance adjustment | | | | (1,019) | | |
| Transfer agent fees | | | | 2,547 | | |
| Accounting and security lending fees | | | | 314 | | |
| Independent trustees’ compensation | | | | 4 | | |
| Custodian fees and expenses | | | | 122 | | |
| Registration fees | | | | 93 | | |
| Audit | | | | 29 | | |
| Legal | | | | 8 | | |
| Interest | | | | 2 | | |
| Miscellaneous | | | | 6 | | |
| Total expenses before reductions | | | | 8,529 | | |
| Expense reductions | | | | (848) | | 7,681 |
| |
| Net investment income (loss) | | | | | | 2,222 |
| Realized and Unrealized Gain (Loss) | | | | | | |
| Net realized gain (loss) on: | | | | | | |
| Investment securities: | | | | | | |
| Unaffiliated issuers | | | | 211,863 | | |
| Other affiliated issuers | | | | (10,556) | | |
| Foreign currency transactions | | | | 176 | | |
| Futures contracts | | | | 3,165 | | |
| Total net realized gain (loss) | | | | | | 204,648 |
| Change in net unrealized appreciation (depreciation) on: | | | | | | |
| Investment securities | | | | 140,902 | | |
| Assets and liabilities in foreign currencies | | | | (8) | | |
| Total change in net unrealized appreciation | | | | | | |
| (depreciation) | | | | | | 140,894 |
| Net gain (loss) | | | | | | 345,542 |
| Net increase (decrease) in net assets resulting from | | | | | | |
| operations | | | | | | $ 347,764 |
See accompanying notes which are an integral part of the financial statements.
17 Semiannual Report
| Financial Statements continued | | | | | | | | |
| |
| |
| Statement of Changes in Net Assets | | | | | | | | |
| | | | | Six months ended | | | | Year ended |
| | | | | April 30, 2006 | | | | October 31, |
| Amounts in thousands | | | | (Unaudited) | | | | 2005 |
| Increase (Decrease) in Net Assets | | | | | | | | |
| Operations | | | | | | | | |
| Net investment income (loss) | | | | $ 2,222 | | | | $ 5,929 |
| Net realized gain (loss) | | | | 204,648 | | | | 119,721 |
| Change in net unrealized appreciation (depreciation) . | | | | 140,894 | | | | 54,939 |
| Net increase (decrease) in net assets resulting from | | | | | | | | |
| operations | | | | 347,764 | | | | 180,589 |
| Distributions to shareholders from net investment income . | | | | (5,739) | | | | |
| Distributions to shareholders from net realized gain | | | | (109,861) | | | | (46,445) |
| Total distributions | | | | (115,600) | | | | (46,445) |
| Share transactions | | | | | | | | |
| Proceeds from sales of shares | | | | 774,728 | | | | 715,075 |
| Reinvestment of distributions | | | | 113,855 | | | | 45,487 |
| Cost of shares redeemed | | | | (166,254) | | | | (230,542) |
| Net increase (decrease) in net assets resulting from | | | | | | | | |
| share transactions | | | | 722,329 | | | | 530,020 |
| Redemption fees | | | | (212) | | | | 198 |
| Total increase (decrease) in net assets | | | | 954,281 | | | | 664,362 |
| |
| Net Assets | | | | | | | | |
| Beginning of period | | | | 1,609,483 | | | | 945,121 |
| End of period (including undistributed net investment | | | | | | | | |
| income of $1,930 and undistributed net investment | | | | | | | | |
| income of $5,927, respectively) | | | | $ 2,563,764 | | | | $ 1,609,483 |
| |
| Other Information | | | | | | | | |
| Shares | | | | | | | | |
| Sold | | | | 35,689 | | | | 34,937 |
| Issued in reinvestment of distributions | | | | 5,524 | | | | 2,370 |
| Redeemed | | | | (7,673) | | | | (11,624) |
| Net increase (decrease) | | | | 33,540 | | | | 25,683 |
See accompanying notes which are an integral part of the financial statements.
| Financial Highlights | | | | | | | | | | | | |
| | | Six months ended | | | | | | | | | | |
| | | April 30, 2006 | | Years ended October 31, |
| | | (Unaudited) | | 2005 | | 2004 | | 2003 | | 2002 | | 2001 |
| Selected Per Share Data | | | | | | | | | | | | | | |
| Net asset value, | | | | | | | | | | | | | | |
| beginning of period . | | | | $ 20.82 | | $ 18.30 | | $ 16.87 | | $ 13.56 | | $ 15.40 | | $ 16.87 |
| Income from Investment | | | | | | | | | | | | | | |
| Operations | | | | | | | | | | | | | | |
| Net investment | | | | | | | | | | | | | | |
| income (loss)D | | | | .02E | | .10F | | (.09) | | (.08) | | (.08) | | .10G |
| Net realized and un | | | | | | | | | | | | | | |
| realized gain (loss) | | | | 3.70 | | 3.31 | | 1.52 | | 3.38 | | (1.33) | | (.81) |
| Total from investment | | | | | | | | | | | | | | |
| operations | | | | 3.72 | | 3.41 | | 1.43 | | 3.30 | | (1.41) | | (.71) |
| Distributions from net | | | | | | | | | | | | | | |
| investment income | | | | (.07) | | — | | — | | — | | — | | (.03) |
| Distributions from net | | | | | | | | | | | | | | |
| realized gain | | | | (1.34) | | (.89) | | — | | — | | (.44) | | (.74) |
| Total distributions | | | | (1.41) | | (.89) | | — | | — | | (.44) | | (.77) |
| Redemption fees added | | | | | | | | | | | | | | |
| to paid in capitalD | | | | —I | | —I | | —I | | .01 | | .01 | | .01 |
| Net asset value, end of | | | | | | | | | | | | | | |
| period | | | | $ 23.13 | | $ 20.82 | | $ 18.30 | | $ 16.87 | | $ 13.56 | | $ 15.40 |
| Total ReturnB,C | | | | 18.70% | | 19.05% | | 8.48% | | 24.41% | | (9.58)% | | (4.29)% |
| Ratios to Average Net AssetsH | | | | | | | | | | | | | | |
| Expenses before | | | | | | | | | | | | | | |
| reductions | | | | .82%A | | .78% | | .95% | | 1.06% | | 1.12% | | .86% |
| Expenses net of fee | | | | | | | | | | | | | | |
| waivers, if any | | | | .82%A | | .78% | | .95% | | 1.06% | | 1.12% | | .86% |
| Expenses net of all | | | | | | | | | | | | | | |
| reductions | | | | .74%A | | .75% | | .91% | | .93% | | .91% | | .74% |
| Net investment | | | | | | | | | | | | | | |
| income (loss) | | | | .21%A,E | | .49%F | | (.49)% | | (.59)% | | (.52)% | | .66% |
| Supplemental Data | | | | | | | | | | | | | | |
| Net assets, end of | | | | | | | | | | | | | | |
| period (in millions) | | | | $ 2,564 | | $1,609 | | $ 945 | | $ 933 | | $ 892 | | $ 773 |
| Portfolio turnover rate | | | | 195%A | | 61% | | 95% | | 220% | | 290% | | 450% |
A Annualized
B Total returns for periods of less than one year are not annualized.
C Total returns would have been lower had certain expenses not been reduced during the periods shown.
D Calculated based on average shares outstanding during the period.
E Investment income per share reflects a special dividend which amounted to $.02 per share. Excluding the special dividend, the ratio of net
investment income (loss) to average net assets would have been (.02)%.
F Investment income per share reflects special dividends which amounted to $.12 per share. Excluding these special dividends, the ratio of net
investment income (loss) to average net assets would have been (.10)%.
G Investment income per share reflects a special dividend which amounted to $.05 per share.
H Expense ratios reflect operating expenses of the fund. Expenses before reductions do not reflect amounts reimbursed by the investment adviser or
reductions from brokerage service arrangements or other expense offset arrangements and do not represent the amount paid by the fund during
periods when reimbursements or reductions occur. Expenses net of fee waivers reflect expenses after reimbursement by the investment adviser but
prior to reductions from brokerage service arrangements or other expense offset arrangements. Expenses net of all reductions represent the net
expenses paid by the fund.
I Amount represents less than $.01 per share.
|
See accompanying notes which are an integral part of the financial statements.
19 Semiannual Report
Notes to Financial Statements
For the period ended April 30, 2006 (Unaudited)
(Amounts in thousands except ratios)
1. Significant Accounting Policies.
Fidelity Small Cap Independence Fund (the fund) is a fund of Fidelity Capital Trust (the trust) and is authorized to issue an unlimited number of shares. The trust is regis tered under the Investment Company Act of 1940, as amended (the 1940 Act), as an open end management investment company organized as a Massachusetts business trust. The fund may invest in affiliated money market central funds (Money Market Central Funds), which are open end investment companies available to investment companies and other accounts managed by Fidelity Management & Research Company (FMR) and its affiliates. The financial statements have been prepared in conformity with accounting principles generally accepted in the United States of America, which require management to make certain estimates and assumptions at the date of the financial statements. The following summarizes the significant accounting policies of the fund:
Security Valuation. Investments are valued and net asset value (NAV) per share is calculated (NAV calculation) as of the close of business of the New York Stock Exchange (NYSE), normally 4:00 p.m. Eastern time. Wherever possible, the fund uses independent pricing services approved by the Board of Trustees to value its investments.
Equity securities, including restricted securities, for which market quotations are readily available, are valued at the last reported sale price or official closing price as reported by an independent pricing service on the primary market or exchange on which they are traded. In the event there were no sales during the day or closing prices are not available, securities are valued at the last quoted bid price. Investments in open end mutual funds, are valued at their closing net asset value each business day. Short term securities with remaining maturities of sixty days or less for which quotations are not readily available are valued at amortized cost, which approximates value.
When current market prices or quotations are not readily available or do not accurately reflect fair value, valuations may be determined in accordance with procedures adopted by the Board of Trustees. For example, when developments occur between the close of a market and the close of the NYSE that may materially affect the value of some or all of the securities, or when trading in a security is halted, those securities may be fair valued. Factors used in the determination of fair value may include monitoring news to identify significant market or security specific events such as changes in the value of U.S. securi ties markets, reviewing developments in foreign markets and evaluating the perfor mance of ADRs, futures contracts and exchange traded funds. Because the fund’s utilization of fair value pricing depends on market activity, the frequency with which fair value pricing is used can not be predicted and may be utilized to a significant extent. The value of securities used for NAV calculation under fair value pricing may differ from published prices for the same securities.
1. Significant Accounting Policies continued
Foreign Currency. The fund uses foreign currency contracts to facilitate transactions in foreign denominated securities. Losses from these transactions may arise from changes in the value of the foreign currency or if the counterparties do not perform under the contracts’ terms.
Foreign denominated assets, including investment securities, and liabilities are trans lated into U.S. dollars at the exchange rate at period end. Purchases and sales of invest ment securities, income and dividends received and expenses denominated in foreign currencies are translated into U.S. dollars at the exchange rate in effect on the transac tion date.
The effects of exchange rate fluctuations on investments are included with the net realized and unrealized gain (loss) on investment securities. Other foreign currency transactions resulting in realized and unrealized gain (loss) are disclosed separately.
Investment Transactions and Income. Security transactions are accounted for as of trade date. Gains and losses on securities sold are determined on the basis of identified cost and may include proceeds received from litigation. Dividend income is recorded on the ex dividend date, except for certain dividends from foreign securities where the ex dividend date may have passed, which are recorded as soon as the fund is informed of the ex dividend date. Non cash dividends included in dividend income, if any, are recorded at the fair market value of the securities received. Distributions received on securities that represent a return of capital or capital gain are recorded as a reduction of cost of investments and/or as a realized gain. The fund estimates the components of distributions received that may be considered return of capital distributions or capital gain distributions. Large, non recurring dividends recognized by the fund are presented separately on the Statement of Operations as “Special Dividends” and the impact of these dividends is presented in the Financial Highlights. Interest income is accrued as earned. Interest income includes coupon interest and amortization of premium and accretion of discount on debt securities. Investment income is recorded net of foreign taxes withheld where recovery of such taxes is uncertain.
Expenses. Most expenses of the trust can be directly attributed to a fund. Expenses which cannot be directly attributed are apportioned among each fund in the trust.
Income Tax Information and Distributions to Shareholders. Each year, the fund intends to qualify as a regulated investment company by distributing all of its taxable income and realized gains under Subchapter M of the Internal Revenue Code. As a result, no provision for income taxes is required in the accompanying financial statements. Foreign taxes are provided for based on the fund’s understanding of the tax rules and rates that exist in the foreign markets in which it invests.
21 Semiannual Report
| Notes to Financial Statements (Unaudited) continued |
| (Amounts in thousands except ratios) |
1. Significant Accounting Policies continued |
Income Tax Information and Distributions to Shareholders continued |
Distributions are recorded on the ex dividend date. Income and capital gain distribu tions are determined in accordance with income tax regulations, which may differ from generally accepted accounting principles. In addition, the fund claimed a portion of the payment made to redeeming shareholders as a distribution for income tax purposes.
Capital accounts within the financial statements are adjusted for permanent book tax differences. These adjustments have no impact on net assets or the results of operations. Temporary book tax differences will reverse in a subsequent period.
Book tax differences are primarily due to short term capital gains and losses deferred due to wash sales.
The federal tax cost of investments and unrealized appreciation (depreciation) as of period end were as follows:
| Unrealized appreciation | | | | $ 402,340 |
| Unrealized depreciation | | | | (70,513) |
| Net unrealized appreciation (depreciation) | | | | $ 331,827 |
| Cost for federal income tax purposes | | | | $ 2,451,186 |
Short Term Trading (Redemption) Fees. Shares held in the fund less than 90 days are subject to a redemption fee equal to 1.50% of the proceeds of the redeemed shares. All redemption fees, including any estimated redemption fees paid by FMR, are retained by the fund and accounted for as an addition to paid in capital.
Repurchase Agreements. FMR has received an Exemptive Order from the Securities and Exchange Commission (the SEC) which permits the fund and other affiliated entities of FMR to transfer uninvested cash balances into joint trading accounts which are then invested in repurchase agreements. The fund may also invest directly with institutions in repurchase agreements. Repurchase agreements are collateralized by government or non government securities. Upon settlement date, collateral is held in segregated accounts with custodian banks and may be obtained in the event of a default of the counterparty. The fund monitors, on a daily basis, the value of the collateral to ensure it is at least equal to the principal amount of the repurchase agreement (includ ing accrued interest). In the event of a default by the counterparty, realization of the collateral proceeds could be delayed, during which time the value of the collateral may decline.
2. Operating Policies continued
Futures Contracts. The fund may use futures contracts to manage its exposure to the stock market and to fluctuations in currency values. Buying futures tends to increase a fund’s exposure to the underlying instrument, while selling futures tends to decrease a fund’s exposure to the underlying instrument or hedge other fund investments. Upon entering into a futures contract, a fund is required to deposit with a clearing broker, no later than the following business day, an amount (“initial margin”) equal to a certain percentage of the face value of the contract. The initial margin may be in the form of cash or securities and is transferred to a segregated account on settlement date. Subsequent payments (“variation margin”) are made or received by a fund depending on the daily fluctuations in the value of the futures contract and are accounted for as unrealized gains or losses. Realized gains (losses) are recorded upon the expiration or closing of the futures contract. Securities deposited to meet margin requirements are identified in the Schedule of Investments. Losses may arise from changes in the value of the underlying instruments or if the counterparties do not perform under the contract’s terms. Futures contracts are valued at the settlement price established each day by the board of trade or exchange on which they are traded.
3. Purchases and Sales of Investments.
Purchases and sales of securities, other than short term securities, aggregated $2,575,977 and $1,971,471, respectively.
4. Fees and Other Transactions with Affiliates.
Management Fee. FMR and its affiliates provide the fund with investment manage ment related services for which the fund pays a monthly management fee. The manage ment fee is the sum of an individual fund fee rate that is based on an annual rate of .35% of the fund’s average net assets and a group fee rate that averaged .27% during the period. The group fee rate is based upon the average net assets of all the mutual funds advised by FMR. The group fee rate decreases as assets under management increase and increases as assets under management decrease. In addition, the management fee is subject to a performance adjustment (up to a maximum of ±.20% of the fund’s average net assets over a 36 month performance period). The upward or downward adjustment to the management fee is based on the fund’s relative investment performance as compared to an appropriate benchmark index. For the period, the total annualized management fee rate, including the performance adjustment, was .52% of the fund’s average net assets.
23 Semiannual Report
| Notes to Financial Statements (Unaudited) continued |
| (Amounts in thousands except ratios) | | |
| |
| 4. Fees and Other Transactions with Affiliates continued |
Transfer Agent Fees. Fidelity Service Company, Inc. (FSC), an affiliate of FMR, is the fund’s transfer, dividend disbursing and shareholder servicing agent. FSC receives account fees and asset based fees that vary according to account size and type of ac count. FSC pays for typesetting, printing and mailing of shareholder reports, except proxy statements. For the period, the transfer agent fees were equivalent to an annual ized rate of .25% of average net assets.
Accounting and Security Lending Fees. FSC maintains the fund’s accounting re cords. The accounting fee is based on the level of average net assets for the month. Under a separate contract, FSC administers the security lending program. The security lending fee is based on the number and duration of lending transactions.
Affiliated Central Funds. The fund may invest in Money Market Central Funds which seek preservation of capital and current income and are managed by Fidelity Invest ments Money Management, Inc. (FIMM), an affiliate of FMR.
The Money Market Central Funds do not pay a management fee.
Brokerage Commissions. The fund placed a portion of its portfolio transactions with brokerage firms which are affiliates of the investment adviser. The commissions paid to these affiliated firms were $24 for the period.
Interfund Lending Program. Pursuant to an Exemptive Order issued by the SEC, the fund, along with other registered investment companies having management contracts with FMR, may participate in an interfund lending program. This program provides an alternative credit facility allowing the funds to borrow from, or lend money to, other participating affiliated funds. At period end, there were no interfund loans outstanding. The fund’s activity in this program during the period for which loans were outstanding was as follows:
| | | | | Average Daily | | Weighted Average | | | | |
| Borrower or Lender | | | | Loan Balance | | Interest Rate | | | | Interest Expense |
| Borrower | | | | $ 3,166 | | 4.90% | | | | $ 2 |
| |
| 5. Committed Line of Credit. | | | | | | |
The fund participates with other funds managed by FMR in a $4.2 billion credit facility (the “line of credit”) to be utilized for temporary or emergency purposes to fund share holder redemptions or for other short term liquidity purposes. The fund has agreed to pay commitment fees on its pro rata portion of the line of credit, which amounts to $3 and is reflected in Miscellaneous Expense on the Statement of Operations. During the period, there were no borrowings on this line of credit.
The fund lends portfolio securities from time to time in order to earn additional income. On the settlement date of the loan, the fund receives collateral (in the form of U.S. Treasury obligations, letters of credit and/or cash) against the loaned securities and maintains collateral in an amount not less than 100% of the market value of the loaned securities during the period of the loan. The market value of the loaned securities is determined at the close of business of the fund and any additional required collateral is delivered to the fund on the next business day. If the borrower defaults on its obligation to return the securities loaned because of insolvency or other reasons, a fund could experience delays and costs in recovering the securities loaned or in gaining access to the collateral. Any cash collateral received is invested in the Fidelity Securities Lending Cash Central Fund. The value of loaned securities and cash collateral at period end are disclosed on the fund’s Statement of Assets and Liabilities. Security lending income represents the income earned on investing cash collateral, less fees and expenses associated with the loan, plus any premium payments that may be received on the loan of certain types of securities. Security lending income is presented in the Statement of Operations as a component of income from affiliated central funds.
Many of the brokers with whom FMR places trades on behalf of the fund provided services to the fund in addition to trade execution. These services included payments of certain expenses on behalf of the fund totaling $797 for the period. In addition, through arrangements with the fund’s custodian and transfer agent, credits realized as a result of uninvested cash balances were used to reduce the fund’s expenses. During the period, these credits reduced the fund’s custody and transfer agent expenses by $5 and $46, respectively.
The fund’s organizational documents provide former and current trustees and officers with a limited indemnification against liabilities arising in connection with the performance of their duties to the fund. In the normal course of business, the fund may also enter into contracts that provide general indemnifications. The fund’s maximum exposure under these arrangements is unknown as this would be dependent on future claims that may be made against the fund. The risk of material loss from such claims is considered remote.
25 Semiannual Report
Board Approval of Investment Advisory Contracts and Management Fees
Fidelity Small Cap Independence Fund
On January 19, 2006, the Board of Trustees, including the Independent Trustees (together, the Board), voted to approve a general research services agreement (the Agreement) between FMR, FMR Co., Inc. (FMRC), Fidelity Investments Money Manage ment, Inc. (FIMM), and Fidelity Research & Analysis Company (FRAC) (together, the Investment Advisers) for the fund, effective January 20, 2006, pursuant to which FRAC may provide general research and investment advisory support services to FMRC and FIMM. The Board considered that it has approved previously various sub advisory agreements for the fund with affiliates of FMR that allow FMR to obtain research, non discretionary advice, or discretionary portfolio management at no additional expense to the fund. The Board, assisted by the advice of fund counsel and independent Trustees’ counsel, considered a broad range of information and determined that it would be beneficial for the fund to access the research and investment advisory support services supplied by FRAC at no additional expense to the fund.
The Board reached this determination in part because the new arrangement will involve no changes in (i) the contractual terms of and fees payable under the fund’s manage ment contract or sub advisory agreements; (ii) the investment process or strategies employed in the management of the fund’s assets; (iii) the nature or level of services provided under the fund’s management contract or sub advisory agreements; (iv) the day to day management of the fund or the persons primarily responsible for such man agement; or (v) the ultimate control or beneficial ownership of FMR, FMRC, or FIMM. The Board also considered that the establishment of the Agreement would not necessi tate prior shareholder approval of the Agreement or result in an assignment and termination of the fund’s management contract or sub advisory agreements under the Investment Company Act of 1940.
Because the Board was approving an arrangement with FRAC under which the fund will not bear any additional management fees or expenses and under which the fund’s portfolio manager would not change, it did not consider the fund’s investment perfor mance, competitiveness of management fee and total expenses, costs of services and profitability, or economies of scale to be significant factors in its decision.
In connection with its future renewal of the fund’s management contract and sub advisory agreements, the Board will consider: (i) the nature, extent, and quality of services provided to the fund, including shareholder and administrative services and investment performance; (ii) the competitiveness of the fund’s management fee and total expenses; (iii) the costs of the services and profitability, including the revenues earned and the expenses incurred by Fidelity in conducting the business of developing, marketing, distributing, managing, administering, and servicing the fund and its shareholders; and (iv) whether there have been economies of scale in respect of the management of the Fidelity funds, whether the Fidelity funds (including the fund) have
appropriately benefited from any such economies of scale, and whether there is potential for realization of any further economies.
Based on its evaluation of all of the conclusions noted above, and after considering all material factors, the Board ultimately concluded that the fund’s Agreement is fair and reasonable, and that the fund’s Agreement should be approved.
27 Semiannual Report
Managing Your Investments
Fidelity offers several ways to conveniently manage your personal investments via your telephone or PC. You can access your account information, conduct trades and research your investments 24 hours a day.
By Phone
Fidelity Automated Service Telephone provides a single toll free number to access account balances, positions, quotes and trading. It’s easy to navigate the service, and on your first call, the system will help you create a personal identification number (PIN) for security.


By PC
Fidelity’s web site on the Internet provides a wide range of information, including daily financial news, fund performance, interactive planning tools and news about Fidelity products and services.

* When you call the quotes line, please remember that a fund’s yield and return will vary and, except for money market funds, share price will also vary. This means that you may have a gain or loss when you sell your shares. There is no assurance that money market funds will be able to maintain a stable $1 share price; an investment in a money market fund is not insured or guar anteed by the U.S. government. Total returns are historical and include changes in share price, reinvestment of dividends and capital gains, and the effects of any sales charges.
Semiannual Report 28
To Write Fidelity
We’ll give your correspondence immediate attention and send you written confirmation upon completion of your request.

(such as changing name, address, bank, etc.)
Fidelity Investments
P.O. Box 770001
Cincinnati, OH 45277-0002
|

Buying shares
Fidelity Investments
P.O. Box 770001
Cincinnati, OH 45277-0003
Overnight Express
Fidelity Investments
Attn: Distribution Services
100 Crosby Parkway KC1H
Covington, KY 41015
Selling shares
Fidelity Investments
P.O. Box 770001
Cincinnati, OH 45277-0035
Overnight Express
Fidelity Investments
Attn: Distribution Services
100 Crosby Parkway KC1H
Covington, KY 41015
General Correspondence
Fidelity Investments
P.O. Box 500
Merrimack, NH 03054-0500
|

Buying shares
Fidelity Investments
P.O. Box 770001
Cincinnati, OH 45277-0003
Selling shares
Fidelity Investments
P.O. Box 770001
Cincinnati, OH 45277-0035
Overnight Express
Fidelity Investments
Attn: Distribution Services
100 Crosby Parkway KC1H
Covington, KY 41015
General Correspondence
Fidelity Investments
P.O. Box 500
Merrimack, NH 03054-0500
|
29 Semiannual Report
To Visit Fidelity
For directions and hours,
please call 1-800-544-9797.
Arizona
7001 West Ray Road
Chandler, AZ
7373 N. Scottsdale Road
Scottsdale, AZ
California
815 East Birch Street
Brea, CA
1411 Chapin Avenue
Burlingame, CA
851 East Hamilton Avenue
Campbell, CA
19200 Von Karman Avenue
Irvine, CA
601 Larkspur Landing Circle
Larkspur, CA
10100 Santa Monica Blvd.
Los Angeles, CA
27101 Puerta Real
Mission Viejo, CA
73 575 El Paseo
Palm Desert, CA
251 University Avenue
Palo Alto, CA
123 South Lake Avenue
Pasadena, CA
16995 Bernardo Ctr. Drive
Rancho Bernardo, CA
1740 Arden Way
Sacramento, CA
7676 Hazard Center Drive
San Diego, CA
8 Montgomery Street
San Francisco, CA
3793 State Street
Santa Barbara, CA
21701 Hawthorne Boulevard
Torrance, CA
2001 North Main Street
Walnut Creek, CA
6300 Canoga Avenue
Woodland Hills, CA
|
Colorado
1625 Broadway
Denver, CO
9185 East Westview Road
Littleton, CO
Connecticut
48 West Putnam Avenue
Greenwich, CT
265 Church Street
New Haven, CT
300 Atlantic Street
Stamford, CT
29 South Main Street
West Hartford, CT
Delaware
222 Delaware Avenue
Wilmington, DE
Florida
4400 N. Federal Highway
Boca Raton, FL
121 Alhambra Plaza
Coral Gables, FL
2948 N. Federal Highway
Ft. Lauderdale, FL
1907 West State Road 434
Longwood, FL
8880 Tamiami Trail, North
Naples, FL
3550 Tamiami Trail, South
Sarasota, FL
1502 N. Westshore Blvd.
Tampa, FL
2465 State Road 7
Wellington, FL
3501 PGA Boulevard
West Palm Beach, FL
Georgia
3445 Peachtree Road, N.E.
Atlanta, GA
1000 Abernathy Road
Atlanta, GA
Illinois
One North LaSalle Street
Chicago, IL
875 North Michigan Ave.
Chicago, IL
|
1415 West 22nd Street
Oak Brook, IL
1572 East Golf Road
Schaumburg, IL
3232 Lake Avenue
Wilmette, IL
Indiana
4729 East 82nd Street
Indianapolis, IN
Kansas
5400 College Boulevard
Overland Park, KS
Maine
Three Canal Plaza
Portland, ME
Maryland
7315 Wisconsin Avenue
Bethesda, MD
One W. Pennsylvania Ave.
Towson, MD
Massachusetts
801 Boylston Street
Boston, MA
155 Congress Street
Boston, MA
300 Granite Street
Braintree, MA
44 Mall Road
Burlington, MA
405 Cochituate Road
Framingham, MA
416 Belmont Street
Worcester, MA
Michigan
500 E. Eisenhower Pkwy.
Ann Arbor, MI
280 Old N. Woodward Ave.
Birmingham, MI
43420 Grand River Avenue
Novi, MI
29155 Northwestern Hwy.
Southfield, MI
Minnesota
7600 France Avenue South
Edina, MN
|
Semiannual Report 30
Missouri
8885 Ladue Road
Ladue, MO
Nevada
2225 Village Walk Drive
Henderson, NV
New Jersey
150 Essex Street
Millburn, NJ
56 South Street
Morristown, NJ
396 Route 17, North
Paramus, NJ
3518 Route 1 North
Princeton, NJ
530 Highway 35
Shrewsbury, NJ
New York
1055 Franklin Avenue
Garden City, NY
37 West Jericho Turnpike
Huntington Station, NY
1271 Avenue of the Americas
New York, NY
61 Broadway
New York, NY
350 Park Avenue
New York, NY
200 Fifth Avenue
New York, NY
733 Third Avenue
New York, NY
11 Penn Plaza
New York, NY
2070 Broadway
New York, NY
1075 Northern Blvd.
Roslyn, NY
North Carolina
4611 Sharon Road
Charlotte, NC
Ohio
3805 Edwards Road
Cincinnati, OH
1324 Polaris Parkway
Columbus, OH
28699 Chagrin Boulevard
Woodmere Village, OH
|
Oregon
16850 SW 72nd Avenue
Tigard, OR
Pennsylvania
600 West DeKalb Pike
King of Prussia, PA
1735 Market Street
Philadelphia, PA
12001 Perry Highway
Wexford, PA
Rhode Island
47 Providence Place
Providence, RI
Tennessee
6150 Poplar Avenue
Memphis, TN
Texas
10000 Research Boulevard
Austin, TX
4001 Northwest Parkway
Dallas, TX
12532 Memorial Drive
Houston, TX
2701 Drexel Drive
Houston, TX
6500 N. MacArthur Blvd.
Irving, TX
6005 West Park Boulevard
Plano, TX
14100 San Pedro
San Antonio, TX
1576 East Southlake Blvd.
Southlake, TX
19740 IH 45 North
Spring, TX
Utah
215 South State Street
Salt Lake City, UT
Virginia
1861 International Drive
McLean, VA
Washington
411 108th Avenue, N.E.
Bellevue, WA
1518 6th Avenue
Seattle, WA
|
Washington, DC
1900 K Street, N.W.
Washington, DC
Wisconsin
595 North Barker Road
Brookfield, WI
|
Fidelity Brokerage Services, Inc., 100 Summer St., Boston, MA 02110 Member NYSE/SIPC
31 Semiannual Report
31
| | Investment Adviser
Fidelity Management & Research Company
Boston, MA
Investment Sub Advisers
FMR Co., Inc.
Fidelity Research & Analysis Company
(formerly Fidelity Management &
Research (Far East) Inc.)
Fidelity Management & Research
(U.K.) Inc.
Fidelity Investments Japan Limited
Fidelity International
Investment Advisors
Fidelity International Investment
Advisors (U.K.) Limited
General Distributor
Fidelity Distributors Corporation
Boston, MA
Transfer and Service Agent
Fidelity Service Company, Inc.
Boston, MA
Custodian
Brown Brothers Harriman & Co.
Boston, MA
|
| The Fidelity Telephone Connection |
| Mutual Fund 24-Hour Service |
| Exchanges/Redemptions | | |
| and Account Assistance | | 1-800-544-6666 |
| Product Information | | 1-800-544-6666 |
| Retirement Accounts | | 1-800-544-4774 |
| (8 a.m. - 9 p.m.) | | |
| TDD Service | | 1-800-544-0118 |
| for the deaf and hearing impaired | | |
| (9 a.m. - 9 p.m. Eastern time) | | |
| Fidelity Automated Service | | |
| Telephone (FAST®)(automated phone logo) | | 1-800-544-5555 |
| (automated phone logo) Automated line for quickest service |
SCS-USAN-0606
1.784915.103
|

| | Semiannual Report
April 30, 2006
|


| Contents | | | | |
| |
| Chairman’s Message | | 3 | | Ned Johnson’s message to shareholders. |
| Shareholder Expense | | 4 | | An example of shareholder expenses. |
| Example | | | | |
| Investment Changes | | 5 | | A summary of major shifts in the fund’s |
| | | | | investments over the past six months. |
| Investments | | 6 | | A complete list of the fund’s investments |
| | | | | with their market values. |
| Financial Statements | | 16 | | Statements of assets and liabilities, |
| | | | | operations, and changes in net assets, as |
| | | | | well as financial highlights. |
| Notes | | 20 | | Notes to the financial statements. |
| Board Approval of | | 26 | | |
| Investment Advisory | | | | |
| Contracts and | | | | |
| Management Fees | | | | |
To view a fund’s proxy voting guidelines and proxy voting record for the 12 month period ended
June 30, visit www.fidelity.com/proxyvotingresults or visit the Securities and Exchange Commis
sion’s (SEC) web site at www.sec.gov. You may also call 1-800-544-8544 to request a free copy of
the proxy voting guidelines.
Standard & Poor’s, S&P and S&P 500 are registered service marks of The McGraw Hill Companies,
Inc. and have been licensed for use by Fidelity Distributors Corporation.
Other third party marks appearing herein are the property of their respective owners.
All other marks appearing herein are registered or unregistered trademarks or service marks
of FMR Corp. or an affiliated company.
|
| | This report and the financial statements contained herein are submitted for the general information
of the shareholders of the fund. This report is not authorized for distribution to prospective investors
in the fund unless preceded or accompanied by an effective prospectus.
A fund files its complete schedule of portfolio holdings with the SEC for the first and third
quarters of each fiscal year on Form N Q. Forms N Q are available on the SEC’s web site at
http://www.sec.gov. A fund’s Forms N Q may be reviewed and copied at the SEC’s Public
Reference Room in Washington, DC. Information regarding the operation of the SEC’s Public
Reference Room may be obtained by calling 1-800-SEC-0330. For a complete list of a fund’s port
folio holdings, view the most recent quarterly holdings report, semiannual report, or annual
report on Fidelity’s web site at http://www.fidelity.com/holdings.
NOT FDIC INSURED · MAY LOSE VALUE · NO BANK GUARANTEE
Neither the fund nor Fidelity Distributors Corporation is a bank.
|
Chairman’s Message
(photograph of Edward C. Johnson 3d)
Dear Shareholder:
Although many securities markets made gains in early 2006, there is only one certainty when it comes to investing: There is no sure thing. There are, however, a number of time tested, fundamental investment principles that can put the historical odds in your favor.
One of the basic tenets is to invest for the long term. Over time, riding out the markets’ inevitable ups and downs has proven much more effective than selling into panic or chasing the hottest trend. Even missing only a few of the markets’ best days can significantly diminish investor returns. Patience also affords the benefits of compounding of earn ing interest on additional income or reinvested dividends and capital gains. There are tax advantages and cost benefits to consider as well. The more you sell, the more taxes you pay, and the more you trade, the higher the costs. While staying the course doesn’t elimi nate risk, it can considerably lessen the effect of short term declines.
You can further manage your investing risk through diversification. And today, more than ever, geographic diversification should be taken into account. Studies indicate that asset allocation is the single most important determinant of a portfolio’s long term success. The right mix of stocks, bonds and cash aligned to your particular risk tolerance and investment objective is very important. Age appropriate rebalancing is also an essential aspect of asset allocation. For younger investors, an emphasis on equities which historically have been the best performing asset class over time is encouraged. As investors near their specific goal, such as retirement or sending a child to college, consideration may be given to replacing volatile assets (e.g. common stocks) with more stable fixed investments (bonds or savings plans).
A third investment principle investing regularly can help lower the average cost of your purchases. Investing a certain amount of money each month or quarter helps ensure you won’t pay for all your shares at market highs. This strategy known as dollar cost averaging also reduces unconstructive “emotion” from investing, helping shareholders avoid selling weak performers just prior to an upswing, or chasing a hot performer just before a correction.
We invite you to contact us via the Internet, through our Investor Centers or over the phone. It is our privilege to provide you the information you need to make the investments that are right for you.
Sincerely,
/s/ Edward C. Johnson 3d
Edward C. Johnson 3d
3 Semiannual Report
Shareholder Expense Example
As a shareholder of the Fund, you incur two types of costs: (1) transaction costs, and (2) ongoing costs, including management fees and other Fund expenses. This Example is intended to help you understand your ongoing costs (in dollars) of investing in the Fund and to compare these costs with the ongoing costs of investing in other mutual funds. The Example is based on an investment of $1,000 invested at the beginning of the period and held for the entire period (November 1, 2005 to April 30, 2006).
The first line of the table below provides information about actual account values and actual expenses. You may use the information in this line, together with the amount you invested, to estimate the expenses that you paid over the period. Simply divide your account value by $1,000.00 (for example, an $8,600 account value divided by $1,000.00 = 8.6), then multiply the result by the number in the first line under the heading entitled “Expenses Paid During Period” to estimate the expenses you paid on your account during this period. A small balance maintenance fee of $12.00 that is charged once a year may apply for certain accounts with a value of less than $2,000. This fee is not included in the table below. If it was, the estimate of expenses you paid during the period would be higher, and your ending account value lower, by this amount.
Hypothetical Example for Comparison Purposes
The second line of the table below provides information about hypothetical account values and hypothetical expenses based on the Fund’s actual expense ratio and an assumed rate of return of 5% per year before expenses, which is not the Fund’s actual return. The hypothetical account values and expenses may not be used to estimate the actual ending account balance or expenses you paid for the period. You may use this information to compare the ongoing costs of investing in the Fund and other funds. To do so, compare this 5% hypothetical example with the 5% hypothetical examples that appear in the share holder reports of the other funds. A small balance maintenance fee of $12.00 that is charged once a year may apply for certain accounts with a value of less than $2,000. This fee is not included in the table below. If it was, the estimate of expenses you paid during the period would be higher, and your ending account value lower, by this amount.
Please note that the expenses shown in the table are meant to highlight your ongoing costs only and do not reflect any transaction costs. Therefore, the second line of the table is useful in comparing ongoing costs only, and will not help you determine the relative total costs of owning different funds.
| | | | | | | | | | | Expenses Paid |
| | | Beginning | | | | Ending | | During Period* |
| | | Account Value | | | | Account Value | | November 1, 2005 |
| | | November 1, 2005 | | | | April 30, 2006 | | to April 30, 2006 |
| Actual | | | | $ 1,000.00 | | | | $ 1,111.40 | | | | $ 4.71 |
| Hypothetical (5% return per year | | | | | | | | | | | | |
| before expenses) | | | | $ 1,000.00 | | | | $ 1,020.33 | | | | $ 4.51 |
* Expenses are equal to the Fund’s annualized expense ratio of .90%; multiplied by the average account value over the period, multiplied by 181/365 (to reflect the one half year period).
| Investment Changes | | | | |
| |
| |
| Top Ten Stocks as of April 30, 2006 | | | | |
| | | % of fund’s | | % of fund’s net assets |
| | | net assets | | 6 months ago |
| General Electric Co. | | 4.9 | | 4.1 |
| American International Group, Inc. | | 3.0 | | 2.9 |
| Microsoft Corp. | | 3.0 | | 4.7 |
| Exxon Mobil Corp. | | 2.4 | | 2.2 |
| Johnson & Johnson | | 2.2 | | 2.3 |
| Bank of America Corp. | | 2.0 | | 1.7 |
| UnitedHealth Group, Inc. | | 1.7 | | 2.3 |
| United Technologies Corp. | | 1.6 | | 1.3 |
| Halliburton Co. | | 1.5 | | 1.1 |
| Wells Fargo & Co. | | 1.5 | | 1.0 |
| | | 23.8 | | |
Top Five Market Sectors as of April 30, 2006 | | |
| | | % of fund’s | | % of fund’s net assets |
| | | net assets | | 6 months ago |
| Financials | | 21.9 | | 19.6 |
| Information Technology | | 17.2 | | 20.6 |
| Industrials | | 15.1 | | 13.6 |
| Health Care | | 14.2 | | 15.6 |
| Energy | | 9.7 | | 9.9 |
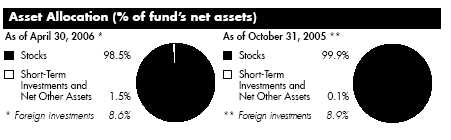
5 Semiannual Report
| Investments April 30, 2006 (Unaudited) |
| Showing Percentage of Net Assets | | | | | | |
| |
| Common Stocks 98.5% | | | | | | |
| | | Shares | | Value (Note 1) |
| | | | | (000s) |
| |
| CONSUMER DISCRETIONARY – 8.4% | | | | | | |
| Hotels, Restaurants & Leisure 0.9% | | | | | | |
| Ctrip.com International Ltd. sponsored ADR | | 10,300 | | | | $ 463 |
| Kerzner International Ltd. (a) | | 9,800 | | | | 766 |
| Sonic Corp. (a) | | 59,200 | | | | 2,007 |
| Starbucks Corp. (a) | | 96,100 | | | | 3,582 |
| Wynn Resorts Ltd. (a) | | 9,900 | | | | 753 |
| | | | | | | 7,571 |
| Household Durables – 0.0% | | | | | | |
| Beazer Homes USA, Inc. | | 200 | | | | 12 |
| Sony Corp. sponsored ADR | | 200 | | | | 10 |
| | | | | | | 22 |
| Media – 2.4% | | | | | | |
| Clear Channel Communications, Inc. | | 41,260 | | | | 1,177 |
| E.W. Scripps Co. Class A | | 64,040 | | | | 2,951 |
| Lamar Advertising Co. Class A (a) | | 57,400 | | | | 3,156 |
| News Corp. Class B (d) | | 293,550 | | | | 5,351 |
| The Walt Disney Co. | | 75,900 | | | | 2,122 |
| Time Warner, Inc. | | 148,860 | | | | 2,590 |
| Univision Communications, Inc. Class A (a) | | 73,600 | | | | 2,627 |
| | | | | | | 19,974 |
| Multiline Retail – 1.6% | | | | | | |
| JCPenney Co., Inc. | | 28,400 | | | | 1,859 |
| Kohl’s Corp. (a) | | 57,000�� | | | | 3,183 |
| Target Corp. | | 163,220 | | | | 8,667 |
| | | | | | | 13,709 |
| Specialty Retail – 3.3% | | | | | | |
| Bed Bath & Beyond, Inc. (a) | | 55,400 | | | | 2,125 |
| Best Buy Co., Inc. | | 103,900 | | | | 5,887 |
| Esprit Holdings Ltd. | | 146,000 | | | | 1,166 |
| Home Depot, Inc. | | 83,600 | | | | 3,338 |
| Lowe’s Companies, Inc. | | 52,800 | | | | 3,329 |
| PETsMART, Inc. | | 76,600 | | | | 2,119 |
| Staples, Inc. | | 207,682 | | | | 5,485 |
| Tiffany & Co., Inc. | | 54,100 | | | | 1,888 |
| TJX Companies, Inc. | | 73,700 | | | | 1,778 |
| | | | | | | 27,115 |
See accompanying notes which are an integral part of the financial statements.
Semiannual Report 6
| Common Stocks continued | | | | | | |
| | | Shares | | Value (Note 1) |
| | | | | (000s) |
| |
| CONSUMER DISCRETIONARY – continued | | | | | | |
| Textiles, Apparel & Luxury Goods – 0.2% | | | | | | |
| Liz Claiborne, Inc. | | 46,900 | | | | $ 1,831 |
| |
| TOTAL CONSUMER DISCRETIONARY | | | | | | 70,222 |
| |
| CONSUMER STAPLES 5.9% | | | | | | |
| Beverages – 1.1% | | | | | | |
| PepsiCo, Inc. | | 160,700 | | | | 9,359 |
| Food & Staples Retailing – 0.8% | | | | | | |
| CVS Corp. | | 192,000 | | | | 5,706 |
| Safeway, Inc. | | 39,200 | | | | 985 |
| Sysco Corp. | | 200 | | | | 6 |
| | | | | | | 6,697 |
| Food Products 0.7% | | | | | | |
| Nestle SA sponsored ADR | | 79,300 | | | | 6,062 |
| Household Products – 2.1% | | | | | | |
| Colgate-Palmolive Co. | | 160,450 | | | | 9,486 |
| Procter & Gamble Co. | | 138,855 | | | | 8,083 |
| | | | | | | 17,569 |
| Tobacco 1.2% | | | | | | |
| Altria Group, Inc. | | 137,980 | | | | 10,095 |
| |
| TOTAL CONSUMER STAPLES | | | | | | 49,782 |
| |
| ENERGY 9.7% | | | | | | |
| Energy Equipment & Services – 5.1% | | | | | | |
| Cooper Cameron Corp. (a) | | 151,700 | | | | 7,621 |
| ENSCO International, Inc. | | 62,300 | | | | 3,332 |
| Halliburton Co. | | 159,300 | | | | 12,449 |
| Schlumberger Ltd. (NY Shares) | | 166,000 | | | | 11,477 |
| Smith International, Inc. | | 186,200 | | | | 7,863 |
| | | | | | | 42,742 |
| Oil, Gas & Consumable Fuels – 4.6% | | | | | | |
| ConocoPhillips | | 126,700 | | | | 8,476 |
| Exxon Mobil Corp. | | 313,610 | | | | 19,783 |
| OMI Corp. | | 69,300 | | | | 1,336 |
See accompanying notes which are an integral part of the financial statements.
| Investments (Unaudited) continued | | | | | | |
| |
| |
| Common Stocks continued | | | | | | |
| | | Shares | | Value (Note 1) |
| | | | | (000s) |
| |
| ENERGY – continued | | | | | | |
| Oil, Gas & Consumable Fuels – continued | | | | | | |
| Peabody Energy Corp. | | 67,600 | | | | $ 4,317 |
| Valero Energy Corp. | | 63,980 | | | | 4,142 |
| | | | | | | 38,054 |
| |
| TOTAL ENERGY | | | | | | 80,796 |
| |
| FINANCIALS – 21.9% | | | | | | |
| Capital Markets 3.1% | | | | | | |
| Ameriprise Financial, Inc. | | 60,480 | | | | 2,966 |
| Charles Schwab Corp. | | 115,000 | | | | 2,059 |
| E*TRADE Financial Corp. (a) | | 113,700 | | | | 2,829 |
| Franklin Resources, Inc. | | 19,000 | | | | 1,769 |
| Goldman Sachs Group, Inc. | | 16,000 | | | | 2,565 |
| Merrill Lynch & Co., Inc. | | 34,720 | | | | 2,648 |
| Nomura Holdings, Inc. sponsored ADR | | 145,700 | | | | 3,304 |
| State Street Corp. | | 124,400 | | | | 8,126 |
| | | | | | | 26,266 |
| Commercial Banks – 5.5% | | | | | | |
| Bank of America Corp. | | 341,320 | | | | 17,039 |
| Mitsui Trust Holdings, Inc. | | 61,000 | | | | 843 |
| Mizuho Financial Group, Inc. | | 44 | | | | 375 |
| Nishi-Nippon City Bank Ltd. | | 107,000 | | | | 543 |
| Standard Chartered PLC (United Kingdom) | | 134,000 | | | | 3,558 |
| Sumitomo Mitsui Financial Group, Inc. | | 168 | | | | 1,844 |
| Wachovia Corp. | | 158,400 | | | | 9,480 |
| Wells Fargo & Co. | | 177,700 | | | | 12,206 |
| | | | | | | 45,888 |
| Consumer Finance – 1.6% | | | | | | |
| American Express Co. | | 108,500 | | | | 5,838 |
| Capital One Financial Corp. | | 83,400 | | | | 7,226 |
| | | | | | | 13,064 |
| Diversified Financial Services – 1.0% | | | | | | |
| Citigroup, Inc. | | 147,900 | | | | 7,388 |
| NETeller PLC (a) | | 72,600 | | | | 1,026 |
| | | | | | | 8,414 |
| Insurance – 8.8% | | | | | | |
| ACE Ltd. | | 80,300 | | | | 4,460 |
| AFLAC, Inc. | | 53,900 | | | | 2,562 |
See accompanying notes which are an integral part of the financial statements.
| Common Stocks continued | | | | | | |
| | | Shares | | Value (Note 1) |
| | | | | (000s) |
| |
| FINANCIALS – continued | | | | | | |
| Insurance – continued | | | | | | |
| American International Group, Inc. | | 389,130 | | | | $ 25,391 |
| Berkshire Hathaway, Inc. Class A (a) | | 38 | | | | 3,382 |
| Endurance Specialty Holdings Ltd. | | 30,100 | | | | 932 |
| Everest Re Group Ltd. | | 41,280 | | | | 3,756 |
| Fidelity National Financial, Inc. | | 29,500 | | | | 1,238 |
| Fidelity National Title Group, Inc. Class A (d) | | 75,182 | | | | 1,628 |
| Hartford Financial Services Group, Inc. | | 88,430 | | | | 8,129 |
| Lincoln National Corp. | | 50,100 | | | | 2,910 |
| National Financial Partners Corp. | | 68,200 | | | | 3,546 |
| PartnerRe Ltd. | | 38,400 | | | | 2,402 |
| Prudential Financial, Inc. | | 64,200 | | | | 5,016 |
| PXRE Group Ltd. | | 62,300 | | | | 222 |
| W.R. Berkley Corp. | | 138,382 | | | | 5,178 |
| XL Capital Ltd. Class A | | 47,620 | | | | 3,138 |
| | | | | | | 73,890 |
| Real Estate 0.3% | | | | | | |
| Equity Residential (SBI) | | 37,700 | | | | 1,692 |
| Vornado Realty Trust | | 7,900 | | | | 756 |
| | | | | | | 2,448 |
| Thrifts & Mortgage Finance – 1.6% | | | | | | |
| Countrywide Financial Corp. | | 26,528 | | | | 1,079 |
| Freddie Mac | | 50,800 | | | | 3,102 |
| Golden West Financial Corp., Delaware | | 80,700 | | | | 5,800 |
| Hudson City Bancorp, Inc. | | 201,800 | | | | 2,706 |
| Washington Mutual, Inc. | | 17,700 | | | | 798 |
| | | | | | | 13,485 |
| |
| TOTAL FINANCIALS | | | | | | 183,455 |
| |
| HEALTH CARE – 14.2% | | | | | | |
| Biotechnology – 2.5% | | | | | | |
| Affymetrix, Inc. (a) | | 23,000 | | | | 659 |
| Alexion Pharmaceuticals, Inc. (a) | | 6,500 | | | | 221 |
| Amgen, Inc. (a) | | 50,990 | | | | 3,452 |
| Biogen Idec, Inc. (a) | | 31,800 | | | | 1,426 |
| Cephalon, Inc. (a) | | 21,200 | | | | 1,392 |
| Charles River Laboratories International, Inc. (a) | | 50,800 | | | | 2,400 |
| Genentech, Inc. (a) | | 260 | | | | 21 |
| Gilead Sciences, Inc. (a) | | 38,500 | | | | 2,214 |
See accompanying notes which are an integral part of the financial statements.
| Investments (Unaudited) continued | | | | | | |
| |
| |
| Common Stocks continued | | | | | | |
| | | Shares | | Value (Note 1) |
| | | | | (000s) |
| |
| HEALTH CARE – continued | | | | | | |
| Biotechnology – continued | | | | | | |
| Invitrogen Corp. (a) | | 79,770 | | | | $ 5,266 |
| MedImmune, Inc. (a) | | 7,500 | | | | 236 |
| PDL BioPharma, Inc. (a) | | 124,800 | | | | 3,592 |
| | | | | | | 20,879 |
| Health Care Equipment & Supplies – 2.8% | | | | | | |
| Alcon, Inc. | | 9,300 | | | | 946 |
| Baxter International, Inc. | | 118,600 | | | | 4,471 |
| Becton, Dickinson & Co. | | 72,500 | | | | 4,570 |
| Boston Scientific Corp. (a) | | 4,500 | | | | 105 |
| C.R. Bard, Inc. | | 37,400 | | | | 2,785 |
| Cooper Companies, Inc. | | 42,300 | | | | 2,319 |
| DJ Orthopedics, Inc. (a) | | 65,700 | | | | 2,612 |
| Millipore Corp. (a) | | 21,400 | | | | 1,579 |
| St. Jude Medical, Inc. (a) | | 50,300 | | | | 1,986 |
| Waters Corp. (a) | | 38,800 | | | | 1,758 |
| | | | | | | 23,131 |
| Health Care Providers & Services – 3.0% | | | | | | |
| American Retirement Corp. (a) | | 31,400 | | | | 798 |
| Brookdale Senior Living, Inc. | | 9,000 | | | | 342 |
| Chemed Corp. | | 12,800 | | | | 697 |
| Emdeon Corp. (a) | | 94,900 | | | | 1,083 |
| Health Net, Inc. (a) | | 52,200 | | | | 2,125 |
| Healthways, Inc. (a) | | 4,440 | | | | 218 |
| Henry Schein, Inc. (a) | | 71,200 | | | | 3,319 |
| I-trax, Inc. (a)(d) | | 126,300 | | | | 404 |
| IMS Health, Inc. | | 49,300 | | | | 1,340 |
| UnitedHealth Group, Inc. | | 291,400 | | | | 14,494 |
| | | | | | | 24,820 |
| Pharmaceuticals – 5.9% | | | | | | |
| Johnson & Johnson | | 321,310 | | | | 18,832 |
| Novartis AG sponsored ADR | | 58,400 | | | | 3,359 |
| Pfizer, Inc. | | 417,940 | | | | 10,586 |
| Roche Holding AG (participation certificate) | | 32,032 | | | | 4,925 |
| Sepracor, Inc. (a) | | 18,200 | | | | 812 |
See accompanying notes which are an integral part of the financial statements.
| Common Stocks continued | | | | | | |
| | | Shares | | Value (Note 1) |
| | | | | (000s) |
| |
| HEALTH CARE – continued | | | | | | |
| Pharmaceuticals – continued | | | | | | |
| Teva Pharmaceutical Industries Ltd. sponsored ADR | | 51,600 | | | | $ 2,090 |
| Wyeth | | 188,000 | | | | 9,150 |
| | | | | | | 49,754 |
| |
| TOTAL HEALTH CARE | | | | | | 118,584 |
| |
| INDUSTRIALS – 15.1% | | | | | | |
| Aerospace & Defense – 3.6% | | | | | | |
| Aviall, Inc. (a) | | 140,650 | | | | 5,303 |
| EDO Corp. | | 94,500 | | | | 2,469 |
| Honeywell International, Inc. | | 180,460 | | | | 7,670 |
| The Boeing Co. | | 21,030 | | | | 1,755 |
| United Technologies Corp. | | 208,620 | | | | 13,103 |
| | | | | | | 30,300 |
| Air Freight & Logistics – 0.6% | | | | | | |
| FedEx Corp. | | 46,400 | | | | 5,342 |
| Airlines – 0.5% | | | | | | |
| AirTran Holdings, Inc. (a) | | 90,000 | | | | 1,258 |
| Southwest Airlines Co. | | 53,500 | | | | 868 |
| UAL Corp. (a) | | 48,100 | | | | 1,732 |
| | | | | | | 3,858 |
| Commercial Services & Supplies – 0.6% | | | | | | |
| Aramark Corp. Class B | | 44,000 | | | | 1,237 |
| Robert Half International, Inc. | | 55,500 | | | | 2,346 |
| Services Acquisition Corp. International (a)(d) | | 99,300 | | | | 1,120 |
| | | | | | | 4,703 |
| Construction & Engineering – 0.8% | | | | | | |
| McDermott International, Inc. (a) | | 112,700 | | | | 6,852 |
| Electrical Equipment – 0.2% | | | | | | |
| Evergreen Solar, Inc. (a) | | 63,200 | | | | 877 |
| Suntech Power Holdings Co. Ltd. sponsored ADR | | 32,200 | | | | 1,104 |
| | | | | | | 1,981 |
| Industrial Conglomerates – 5.5% | | | | | | |
| 3M Co. | | 44,230 | | | | 3,779 |
| General Electric Co. | | 1,188,500 | | | | 41,111 |
| Tyco International Ltd. | | 47,880 | | | | 1,262 |
| | | | | | | 46,152 |
See accompanying notes which are an integral part of the financial statements.
11 Semiannual Report
| Investments (Unaudited) continued | | | | | | |
| |
| |
| Common Stocks continued | | | | | | |
| | | Shares | | Value (Note 1) |
| | | | | (000s) |
| |
| INDUSTRIALS – continued | | | | | | |
| Machinery – 1.4% | | | | | | |
| Danaher Corp. | | 36,600 | | | | $ 2,346 |
| Deere & Co. | | 78,800 | | | | 6,917 |
| Pentair, Inc. | | 67,200 | | | | 2,572 |
| | | | | | | 11,835 |
| Marine – 0.1% | | | | | | |
| Alexander & Baldwin, Inc. | | 12,221 | | | | 609 |
| Road & Rail 1.7% | | | | | | |
| Laidlaw International, Inc. | | 96,200 | | | | 2,381 |
| Landstar System, Inc. | | 75,600 | | | | 3,212 |
| Norfolk Southern Corp. | | 157,400 | | | | 8,500 |
| | | | | | | 14,093 |
| Transportation Infrastructure 0.1% | | | | | | |
| Grupo Aeroportuario del Pacifico SA de CV sponsored ADR | | 13,500 | | | | 449 |
| |
| TOTAL INDUSTRIALS | | | | | | 126,174 |
| |
| INFORMATION TECHNOLOGY – 17.2% | | | | | | |
| Communications Equipment – 4.3% | | | | | | |
| Alcatel SA sponsored ADR (a) | | 79,900 | | | | 1,152 |
| Cisco Systems, Inc. (a) | | 556,040 | | | | 11,649 |
| Comverse Technology, Inc. (a) | | 54,800 | | | | 1,241 |
| Corning, Inc. (a) | | 258,760 | | | | 7,150 |
| Juniper Networks, Inc. (a) | | 75,580 | | | | 1,397 |
| Lucent Technologies, Inc. (a) | | 372,700 | | | | 1,040 |
| Motorola, Inc. | | 139,940 | | | | 2,988 |
| Nortel Networks Corp. (a) | | 681,900 | | | | 1,814 |
| QUALCOMM, Inc. | | 145,300 | | | | 7,460 |
| Research In Motion Ltd. (a) | | 6,550 | | | | 502 |
| | | | | | | 36,393 |
| Computers & Peripherals – 2.4% | | | | | | |
| Apple Computer, Inc. (a) | | 89,700 | | | | 6,314 |
| Dell, Inc. (a) | | 100 | | | | 3 |
| EMC Corp. (a) | | 560,900 | | | | 7,578 |
| Hewlett-Packard Co. | | 180,500 | | | | 5,861 |
| Sun Microsystems, Inc. (a) | | 57,200 | | | | 286 |
| | | | | | | 20,042 |
| Electronic Equipment & Instruments – 0.6% | | | | | | |
| Agilent Technologies, Inc. (a) | | 120,714 | | | | 4,638 |
See accompanying notes which are an integral part of the financial statements.
| Common Stocks continued | | | | | | |
| | | Shares | | Value (Note 1) |
| | | | | (000s) |
| |
| INFORMATION TECHNOLOGY – continued | | | | | | |
| Internet Software & Services – 1.7% | | | | | | |
| eBay, Inc. (a) | | 57,080 | | | | $ 1,964 |
| Google, Inc. Class A (sub. vtg.) (a) | | 19,500 | | | | 8,150 |
| Homestore, Inc. (a) | | 285,446 | | | | 1,753 |
| Yahoo!, Inc. (a) | | 81,310 | | | | 2,665 |
| | | | | | | 14,532 |
| IT Services – 0.9% | | | | | | |
| First Data Corp. | | 93,100 | | | | 4,440 |
| Paychex, Inc. | | 74,980 | | | | 3,028 |
| | | | | | | 7,468 |
| Semiconductors & Semiconductor Equipment – 3.0% | | | | | | |
| Altera Corp. (a) | | 119,700 | | | | 2,614 |
| Analog Devices, Inc. | | 64,900 | | | | 2,461 |
| Applied Materials, Inc. | | 352,600 | | | | 6,329 |
| ARM Holdings PLC sponsored ADR | | 190,900 | | | | 1,415 |
| ASML Holding NV (NY Shares) (a) | | 400 | | | | 8 |
| FormFactor, Inc. (a) | | 33,200 | | | | 1,384 |
| Freescale Semiconductor, Inc. Class A (a) | | 118,800 | | | | 3,756 |
| Intel Corp. | | 240 | | | | 5 |
| KLA Tencor Corp. | | 300 | | | | 14 |
| Lam Research Corp. (a) | | 24,900 | | | | 1,217 |
| Microchip Technology, Inc. | | 47,000 | | | | 1,751 |
| National Semiconductor Corp. | | 110,700 | | | | 3,319 |
| Samsung Electronics Co. Ltd. | | 1,820 | | | | 1,243 |
| | | | | | | 25,516 |
| Software 4.3% | | | | | | |
| Adobe Systems, Inc. | | 14,800 | | | | 580 |
| BEA Systems, Inc. (a) | | 128,800 | | | | 1,707 |
| Cognos, Inc. (a) | | 44,700 | | | | 1,666 |
| FileNET Corp. (a) | | 75,700 | | | | 2,106 |
| Microsoft Corp. | | 1,047,960 | | | | 25,308 |
| Oracle Corp. (a) | | 158,050 | | | | 2,306 |
| Symantec Corp. (a) | | 126,702 | | | | 2,075 |
| | | | | | | 35,748 |
| |
| TOTAL INFORMATION TECHNOLOGY | | | | | | 144,337 |
| |
| MATERIALS 3.4% | | | | | | |
| Chemicals – 2.1% | | | | | | |
| Ashland, Inc. | | 73,900 | | | | 4,864 |
See accompanying notes which are an integral part of the financial statements.
13 Semiannual Report
| Investments (Unaudited) continued | | | | | | |
| |
| |
| Common Stocks continued | | | | | | |
| | | Shares | | Value (Note 1) |
| | | | | (000s) |
| |
| MATERIALS – continued | | | | | | |
| Chemicals – continued | | | | | | |
| Lyondell Chemical Co. | | 39,300 | | | | $ 947 |
| Monsanto Co. | | 47,700 | | | | 3,978 |
| Praxair, Inc. | | 131,900 | | | | 7,404 |
| | | | | | | 17,193 |
| Containers & Packaging – 0.4% | | | | | | |
| Owens Illinois, Inc. (a) | | 104,753 | | | | 1,915 |
| Smurfit-Stone Container Corp. (a) | | 113,500 | | | | 1,470 |
| | | | | | | 3,385 |
| Metals & Mining – 0.9% | | | | | | |
| Alcoa, Inc. | | 138,500 | | | | 4,679 |
| Newmont Mining Corp. | | 48,700 | | | | 2,842 |
| | | | | | | 7,521 |
| |
| TOTAL MATERIALS | | | | | | 28,099 |
| |
| TELECOMMUNICATION SERVICES – 1.8% | | | | | | |
| Diversified Telecommunication Services – 1.5% | | | | | | |
| AT&T, Inc. | | 211,100 | | | | 5,533 |
| Covad Communications Group, Inc. (a)(d) | | 524,400 | | | | 1,316 |
| Qwest Communications International, Inc. (a) | | 409,800 | | | | 2,750 |
| Verizon Communications, Inc. | | 90,700 | | | | 2,996 |
| | | | | | | 12,595 |
| Wireless Telecommunication Services – 0.3% | | | | | | |
| Sprint Nextel Corp. | | 107,410 | | | | 2,664 |
| |
| TOTAL TELECOMMUNICATION SERVICES | | | | | | 15,259 |
| |
| UTILITIES – 0.9% | | | | | | |
| Electric Utilities – 0.2% | | | | | | |
| Exelon Corp. | | 29,600 | | | | 1,598 |
| Independent Power Producers & Energy Traders – 0.5% | | | | | | |
| TXU Corp. | | 94,700 | | | | 4,700 |
| Multi-Utilities – 0.2% | | | | | | |
| Public Service Enterprise Group, Inc. | | 24,700 | | | | 1,549 |
| |
| TOTAL UTILITIES | | | | | | 7,847 |
| |
| TOTAL COMMON STOCKS | | | | | | |
| (Cost $750,931) | | | | | | 824,555 |
See accompanying notes which are an integral part of the financial statements.
| Money Market Funds 1.5% | | | | | | |
| | | Shares | | Value (Note 1) |
| | | | | (000s) |
| Fidelity Cash Central Fund, 4.8% (b) | | 9,163,361 | | | | $ 9,163 |
| Fidelity Securities Lending Cash Central Fund, 4.83% (b)(c) | | 3,284,750 | | | | 3,285 |
| TOTAL MONEY MARKET FUNDS | | | | | | |
| (Cost $12,448) | | | | | | 12,448 |
| |
| TOTAL INVESTMENT PORTFOLIO 100.0% | | | | | | |
| (Cost $763,379) | | | | | | 837,003 |
| |
| NET OTHER ASSETS – 0.0% | | | | | | (115) |
| NET ASSETS 100% | | | | | | $ 836,888 |
Legend
(a) Non-income producing
(b) Affiliated fund that is available only to
investment companies and other
accounts managed by Fidelity
Investments. The rate quoted is the
annualized seven-day yield of the fund
at period end. A complete unaudited
listing of the fund’s holdings as of its
most recent quarter end is available
upon request.
|
(c) Investment made with cash collateral
received from securities on loan.
(d) Security or a portion of the security is on
loan at period end.
|
Affiliated Central Funds
Information regarding fiscal year to date income earned by the fund from the affiliated Central funds is as follows:
| Fund | | Income earned |
| | | (Amounts in thousands) |
| Fidelity Cash Central Fund | | | | $ 85 |
| Fidelity Securities Lending Cash Central Fund | | | | 22 |
| Total | | | | $ 107 |
Income Tax Information
At October 31, 2005, the fund had a capital loss carryforward of approximately $47,228,000 all of which will expire on October 31, 2010.
See accompanying notes which are an integral part of the financial statements.
15 Semiannual Report
| Financial Statements | | | | | | |
| |
| Statement of Assets and Liabilities | | | | | | |
| Amounts in thousands (except per share amount) | | | | April 30, 2006 (Unaudited) |
| |
| Assets | | | | | | |
| Investment in securities, at value (including securities | | | | | | |
| loaned of $3,085) See accompanying schedule: | | | | | | |
| Unaffiliated issuers (cost $750,931) | | | | $ 824,555 | | |
| Affiliated Central Funds (cost $12,448) | | | | 12,448 | | |
| Total Investments (cost $763,379) | | | | | | $ 837,003 |
| Receivable for investments sold | | | | | | 32,443 |
| Receivable for fund shares sold | | | | | | 573 |
| Dividends receivable | | | | | | 563 |
| Interest receivable | | | | | | 9 |
| Prepaid expenses | | | | | | 2 |
| Other receivables | | | | | | 34 |
| Total assets | | | | | | 870,627 |
| |
| Liabilities | | | | | | |
| Payable for investments purchased | | | | $ 29,056 | | |
| Payable for fund shares redeemed | | | | 756 | | |
| Accrued management fee | | | | 439 | | |
| Other affiliated payables | | | | 170 | | |
| Other payables and accrued expenses | | | | 33 | | |
| Collateral on securities loaned, at value | | | | 3,285 | | |
| Total liabilities | | | | | | 33,739 |
| |
| Net Assets | | | | | | $ 836,888 |
| Net Assets consist of: | | | | | | |
| Paid in capital | | | | | | $ 782,051 |
| Undistributed net investment income | | | | | | 635 |
| Accumulated undistributed net realized gain (loss) on | | | | | | |
| investments and foreign currency transactions | | | | | | (19,422) |
| Net unrealized appreciation (depreciation) on | | | | | | |
| investments and assets and liabilities in foreign | | | | | | |
| currencies | | | | | | 73,624 |
| Net Assets, for 31,870 shares outstanding | | | | | | $ 836,888 |
| Net Asset Value, offering price and redemption price per | | | | | | |
| share ($836,888 ÷ 31,870 shares) | | | | | | $ 26.26 |
See accompanying notes which are an integral part of the financial statements.
| Statement of Operations | | | | | | |
| Amounts in thousands | | Six months ended April 30, 2006 (Unaudited) |
| |
| Investment Income | | | | | | |
| Dividends | | | | | | $ 5,258 |
| Income from affiliated Central Funds | | | | | | 107 |
| Total income | | | | | | 5,365 |
| |
| Expenses | | | | | | |
| Management fee | | | | | | |
| Basic fee | | | | $ 2,320 | | |
| Performance adjustment | | | | 274 | | |
| Transfer agent fees | | | | 847 | | |
| Accounting and security lending fees | | | | 136 | | |
| Independent trustees’ compensation | | | | 2 | | |
| Custodian fees and expenses | | | | 33 | | |
| Registration fees | | | | 13 | | |
| Audit | | | | 29 | | |
| Legal | | | | 4 | | |
| Miscellaneous | | | | 3 | | |
| Total expenses before reductions | | | | 3,661 | | |
| Expense reductions | | | | (102) | | 3,559 |
| |
| Net investment income (loss) | | | | | | 1,806 |
| Realized and Unrealized Gain (Loss) | | | | | | |
| Net realized gain (loss) on: | | | | | | |
| Investment securities: | | | | | | |
| Unaffiliated issuers | | | | 45,007 | | |
| Foreign currency transactions | | | | 12 | | |
| Total net realized gain (loss) | | | | | | 45,019 |
| Change in net unrealized appreciation (depreciation) on: | | | | |
| Investment securities | | | | | | 37,628 |
| Net gain (loss) | | | | | | 82,647 |
| Net increase (decrease) in net assets resulting from | | | | | | |
| operations | | | | | | $ 84,453 |
See accompanying notes which are an integral part of the financial statements.
17 Semiannual Report
| Financial Statements continued | | | | | | | | |
| |
| |
| Statement of Changes in Net Assets | | | | | | | | |
| | | | | Six months ended | | | | Year ended |
| | | | | April 30, 2006 | | | | October 31, |
| Amounts in thousands | | | | (Unaudited) | | | | 2005 |
| Increase (Decrease) in Net Assets | | | | | | | | |
| Operations | | | | | | | | |
| Net investment income (loss) | | | | $ 1,806 | | | | $ 8,731 |
| Net realized gain (loss) | | | | 45,019 | | | | 65,400 |
| Change in net unrealized appreciation (depreciation) . | | | | 37,628 | | | | 16,325 |
| Net increase (decrease) in net assets resulting from | | | | | | | | |
| operations | | | | 84,453 | | | | 90,456 |
| Distributions to shareholders from net investment income . | | | | (3,858) | | | | (9,003) |
| Share transactions | | | | | | | | |
| Proceeds from sales of shares | | | | 46,837 | | | | 65,665 |
| Reinvestment of distributions | | | | 3,687 | | | | 8,598 |
| Cost of shares redeemed | | | | (64,415) | | | | (162,412) |
| Net increase (decrease) in net assets resulting from | | | | | | | | |
| share transactions | | | | (13,891) | | | | (88,149) |
| Total increase (decrease) in net assets | | | | 66,704 | | | | (6,696) |
| |
| Net Assets | | | | | | | | |
| Beginning of period | | | | 770,184 | | | | 776,880 |
| End of period (including undistributed net investment | | | | | | | | |
| income of $635 and undistributed net investment | | | | | | | | |
| income of $2,687, respectively) | | | | $ 836,888 | | | | $ 770,184 |
| |
| Other Information | | | | | | | | |
| Shares | | | | | | | | |
| Sold | | | | 1,820 | | | | 2,910 |
| Issued in reinvestment of distributions | | | | 147 | | | | 383 |
| Redeemed | | | | (2,533) | | | | (7,146) |
| Net increase (decrease) | | | | (566) | | | | (3,853) |
See accompanying notes which are an integral part of the financial statements.
| Financial Highlights | | | | | | | | | | | | | | | | | | | | |
| |
| | | Six months ended | | | | | | | | | | | | | | | | | | | | |
| | | April 30, 2006 | | | | Years ended October 31, |
| | | (Unaudited) | | | | 2005 | | | | 2004 | | | | 2003 | | | | 2002 | | | | 2001 |
| Selected Per Share Data | | | | | | | | | | | | | | | | | | | | | | |
| Net asset value, | | | | | | | | | | | | | | | | | | | | | | |
| beginning of | | | | | | | | | | | | | | | | | | | | | | |
| period | | $ 23.74 | | | | $ 21.41 | | | | $ 19.96 | | | | $ 16.83 | | | | $ 19.54 | | | | $ 31.80 |
| Income from | | | | | | | | | | | | | | | | | | | | | | |
| Investment | | | | | | | | | | | | | | | | | | | | | | |
| Operations | | | | | | | | | | | | | | | | | | | | | | |
| Net investment | | | | | | | | | | | | | | | | | | | | | | |
| income (loss)D | | .06 | | | | .25E | | | | .10 | | | | .11 | | | | .07 | | | | .14 |
| Net realized and | | | | | | | | | | | | | | | | | | | | | | |
| unrealized | | | | | | | | | | | | | | | | | | | | | | |
| gain (loss) | | 2.58 | | | | 2.33 | | | | 1.47 | | | | 3.08 | | | | (2.64) | | | | (7.33) |
| Total from invest | | | | | | | | | | | | | | | | | | | | | | |
| ment operations | | 2.64 | | | | 2.58 | | | | 1.57 | | | | 3.19 | | | | (2.57) | | | | (7.19) |
| Distributions from | | | | | | | | | | | | | | | | | | | | | | |
| net investment | | | | | | | | | | | | | | | | | | | | | | |
| income | | (.12) | | | | (.25) | | | | (.12) | | | | (.06) | | | | (.14) | | | | (.13) |
| Distributions from | | | | | | | | | | | | | | | | | | | | | | |
| net realized gain | | — | | | | — | | | | — | | | | — | | | | | | | | (4.94) |
| Total distributions | | (.12) | | | | (.25) | | | | (.12) | | | | (.06) | | | | (.14) | | | | (5.07) |
| Net asset value, | | | | | | | | | | | | | | | | | | | | | | |
| end of period | | $ 26.26 | | | | $ 23.74 | | | | $ 21.41 | | | | $ 19.96 | | | | $ 16.83 | | | | $ 19.54 |
| Total ReturnB,C | | 11.14% | | | | 12.12% | | | | 7.91% | | | | 19.01% | | | | (13.30)% | | | | (26.41)% |
| Ratios to Average Net AssetsF | | | | | | | | | | | | | | | | | | | | | | |
| Expenses before | | | | | | | | | | | | | | | | | | | | | | |
| reductions | | .90%A | | | | .84% | | | | .85% | | | | .86% | | | | .94% | | | | .67% |
| Expenses net of | | | | | | | | | | | | | | | | | | | | | | |
| fee waivers, if | | | | | | | | | | | | | | | | | | | | | | |
| any | | .90%A | | | | .84% | | | | .85% | | | | .86% | | | | .94% | | | | .67% |
| Expenses net of | | | | | | | | | | | | | | | | | | | | | | |
| all reductions | | .87%A | | | | .79% | | | | .81% | | | | .82% | | | | .83% | | | | .63% |
| Net investment | | | | | | | | | | | | | | | | | | | | | | |
| income (loss) | | .44%A | | | | 1.11%E | | | | .46% | | | | .63% | | | | .39% | | | | .62% |
| Supplemental Data | | | | | | | | | | | | | | | | | | | | | | |
| Net assets, | | | | | | | | | | | | | | | | | | | | | | |
| end of period | | | | | | | | | | | | | | | | | | | | | | |
| (in millions) | | $ 837 | | | | $ 770 | | | | $ 777 | | | | $ 790 | | | | $ 744 | | | | $ 1,017 |
| Portfolio turnover | | | | | | | | | | | | | | | | | | | | | | |
| rate | | 108%A | | | | 136% | | | | 134% | | | | 159% | | | | 255% | | | | 137% |
A Annualized
B Total returns for periods of less than one year are not annualized.
C Total returns would have been lower had certain expenses not been reduced during the periods shown.
D Calculated based on average shares outstanding during the period.
E Investment income per share reflects a special dividend which amounted to $.14 per share. Excluding the special dividend, the ratio of net
investment income (loss) to average net assets would have been .49%.
F Expense ratios reflect operating expenses of the fund. Expenses before reductions do not reflect amounts reimbursed by the investment adviser or
reductions from brokerage service arrangements or other expense offset arrangements and do not represent the amount paid by the fund during
periods when reimbursements or reductions occur. Expenses net of fee waivers reflect expenses after reimbursement by the investment adviser but
prior to reductions from brokerage service arrangements or other expense offset arrangements. Expenses net of all reductions represent the net
expenses paid by the fund.
|
See accompanying notes which are an integral part of the financial statements.
19 Semiannual Report
Notes to Financial Statements
For the period ended April 30, 2006 (Unaudited)
(Amounts in thousands except ratios)
1. Significant Accounting Policies.
Fidelity Stock Selector (the fund) is a fund of Fidelity Capital Trust (the trust) and is authorized to issue an unlimited number of shares. The trust is registered under the Investment Company Act of 1940, as amended (the 1940 Act), as an open end manage ment investment company organized as a Massachusetts business trust. The fund may invest in affiliated money market central funds (Money Market Central Funds), which are open end investment companies available to investment companies and other accounts managed by Fidelity Management & Research Company (FMR) and its affili ates. The financial statements have been prepared in conformity with accounting principles generally accepted in the United States of America, which require manage ment to make certain estimates and assumptions at the date of the financial statements. The following summarizes the significant accounting policies of the fund:
Security Valuation. Investments are valued and net asset value (NAV) per share is calculated (NAV calculation) as of the close of business of the New York Stock Exchange (NYSE), normally 4:00 p.m. Eastern time. Wherever possible, the fund uses independent pricing services approved by the Board of Trustees to value its investments.
Equity securities, including restricted securities, for which market quotations are readily available, are valued at the last reported sale price or official closing price as reported by an independent pricing service on the primary market or exchange on which they are traded. In the event there were no sales during the day or closing prices are not available, securities are valued at the last quoted bid price. Investments in open end mutual funds, are valued at their closing net asset value each business day. Short term securities with remaining maturities of sixty days or less for which quotations are not readily available are valued at amortized cost, which approximates value.
When current market prices or quotations are not readily available or do not accurately reflect fair value, valuations may be determined in accordance with procedures adopted by the Board of Trustees. For example, when developments occur between the close of a market and the close of the NYSE that may materially affect the value of some or all of the securities, or when trading in a security is halted, those securities may be fair valued. Factors used in the determination of fair value may include monitoring news to identify significant market or security specific events such as changes in the value of U.S. securi ties markets, reviewing developments in foreign markets and evaluating the perfor mance of ADRs, futures contracts and exchange traded funds. Because the fund’s utilization of fair value pricing depends on market activity, the frequency with which fair value pricing is used can not be predicted and may be utilized to a significant extent. The value of securities used for NAV calculation under fair value pricing may differ from published prices for the same securities.
1. Significant Accounting Policies continued
Foreign Currency. The fund uses foreign currency contracts to facilitate transactions in foreign denominated securities. Losses from these transactions may arise from changes in the value of the foreign currency or if the counterparties do not perform under the contracts’ terms.
Foreign denominated assets, including investment securities, and liabilities are trans lated into U.S. dollars at the exchange rate at period end. Purchases and sales of invest ment securities, income and dividends received and expenses denominated in foreign currencies are translated into U.S. dollars at the exchange rate in effect on the transac tion date.
The effects of exchange rate fluctuations on investments are included with the net realized and unrealized gain (loss) on investment securities. Other foreign currency transactions resulting in realized and unrealized gain (loss) are disclosed separately.
Investment Transactions and Income. Security transactions are accounted for as of trade date. Gains and losses on securities sold are determined on the basis of identified cost and may include proceeds received from litigation. Dividend income is recorded on the ex dividend date, except for certain dividends from foreign securities where the ex dividend date may have passed, which are recorded as soon as the fund is informed of the ex dividend date. Non cash dividends included in dividend income, if any, are recorded at the fair market value of the securities received. Distributions received on securities that represent a return of capital or capital gain are recorded as a reduction of cost of investments and/or as a realized gain. The fund estimates the components of distributions received that may be considered return of capital distributions or capital gain distributions. Interest income is accrued as earned. Interest income includes coupon interest and amortization of premium and accretion of discount on debt securi ties. Investment income is recorded net of foreign taxes withheld where recovery of such taxes is uncertain.
Expenses. Most expenses of the trust can be directly attributed to a fund. Expenses which cannot be directly attributed are apportioned among each fund in the trust.
Income Tax Information and Distributions to Shareholders. Each year, the fund intends to qualify as a regulated investment company by distributing all of its taxable income and realized gains under Subchapter M of the Internal Revenue Code. As a result, no provision for income taxes is required in the accompanying financial statements. Foreign taxes are provided for based on the fund’s understanding of the tax rules and rates that exist in the foreign markets in which it invests.
Distributions are recorded on the ex dividend date. Income and capital gain distributions are determined in accordance with income tax regulations, which may differ from generally accepted accounting principles.
21 Semiannual Report
| Notes to Financial Statements (Unaudited) continued |
| (Amounts in thousands except ratios) |
1. Significant Accounting Policies continued |
Income Tax Information and Distributions to Shareholders continued |
Capital accounts within the financial statements are adjusted for permanent book tax differences. These adjustments have no impact on net assets or the results of operations. Temporary book tax differences will reverse in a subsequent period.
Book tax differences are primarily due to futures transactions, foreign currency transac tions, capital loss carryforwards, and losses deferred due to wash sales.
The federal tax cost of investments and unrealized appreciation (depreciation) as of period end were as follows:
| Unrealized appreciation | | | | $ 93,092 |
| Unrealized depreciation | | | | (33,581) |
| Net unrealized appreciation (depreciation) | | | | $ 59,511 |
| |
| Cost for federal income tax purposes | | | | $ 777,492 |
| |
| 2. Operating Policies. | | | | |
Repurchase Agreements. FMR has received an Exemptive Order from the Securities and Exchange Commission (the SEC) which permits the fund and other affiliated entities of FMR to transfer uninvested cash balances into joint trading accounts which are then invested in repurchase agreements. The fund may also invest directly with institutions in repurchase agreements. Repurchase agreements are collateralized by government or non government securities. Upon settlement date, collateral is held in segregated accounts with custodian banks and may be obtained in the event of a default of the counterparty. The fund monitors, on a daily basis, the value of the collateral to ensure it is at least equal to the principal amount of the repurchase agreement (includ ing accrued interest). In the event of a default by the counterparty, realization of the collateral proceeds could be delayed, during which time the value of the collateral may decline.
3. Purchases and Sales of Investments.
Purchases and sales of securities, other than short term securities, aggregated $435,447 and $463,080, respectively.
4. Fees and Other Transactions with Affiliates.
Management Fee. FMR and its affiliates provide the fund with investment manage ment related services for which the fund pays a monthly management fee. The manage ment fee is the sum of an individual fund fee rate that is based on an annual rate of .30% of the fund’s average net assets and a group fee rate that averaged .27% during the period. The group fee rate is based upon the average net assets of all the mutual funds advised by FMR. The group fee rate decreases as assets under management increase and increases as assets under management decrease. In addition, the management fee is subject to a performance adjustment (up to a maximum of ±.20% of the fund’s average net assets over a 36 month performance period). The upward or downward adjustment to the management fee is based on the fund’s relative investment performance as compared to an appropriate benchmark index. For the period, the total annualized management fee rate, including the performance adjustment, was .63% of the fund’s average net assets.
Transfer Agent Fees. Fidelity Service Company, Inc. (FSC), an affiliate of FMR, is the fund’s transfer, dividend disbursing and shareholder servicing agent. FSC receives account fees and asset based fees that vary according to account size and type of ac count. FSC pays for typesetting, printing and mailing of shareholder reports, except proxy statements. For the period, the transfer agent fees were equivalent to an annual ized rate of .21% of average net assets.
Accounting and Security Lending Fees. FSC maintains the fund’s accounting re cords. The accounting fee is based on the level of average net assets for the month. Under a separate contract, FSC administers the security lending program. The security lending fee is based on the number and duration of lending transactions.
Affiliated Central Funds. The fund may invest in Money Market Central Funds which seek preservation of capital and current income and are managed by Fidelity Invest ments Money Management, Inc. (FIMM), an affiliate of FMR.
The Money Market Central Funds do not pay a management fee.
Brokerage Commissions. The fund placed a portion of its portfolio transactions with brokerage firms which are affiliates of the investment adviser. The commissions paid to these affiliated firms were $6 for the period.
23 Semiannual Report
| Notes to Financial Statements (Unaudited) continued |
| (Amounts in thousands except ratios) | | |
| |
| 5. Committed Line of Credit. | | |
The fund participates with other funds managed by FMR in a $4.2 billion credit facility (the “line of credit”) to be utilized for temporary or emergency purposes to fund share holder redemptions or for other short term liquidity purposes. The fund has agreed to pay commitment fees on its pro rata portion of the line of credit, which amounts to $1 and is reflected in Miscellaneous Expense on the Statement of Operations. During the period, there were no borrowings on this line of credit.
The fund lends portfolio securities from time to time in order to earn additional income. On the settlement date of the loan, the fund receives collateral (in the form of U.S. Treasury obligations, letters of credit and/or cash) against the loaned securities and maintains collateral in an amount not less than 100% of the market value of the loaned securities during the period of the loan. The market value of the loaned securities is determined at the close of business of the fund and any additional required collateral is delivered to the fund on the next business day. If the borrower defaults on its obligation to return the securities loaned because of insolvency or other reasons, a fund could experience delays and costs in recovering the securities loaned or in gaining access to the collateral. Any cash collateral received is invested in the Fidelity Securities Lending Cash Central Fund. The value of loaned securities and cash collateral at period end are disclosed on the fund’s Statement of Assets and Liabilities. Security lending income represents the income earned on investing cash collateral, less fees and expenses associated with the loan, plus any premium payments that may be received on the loan of certain types of securities. Security lending income is presented in the Statement of Operations as a component of income from affiliated central funds. Net income from lending portfolio securities during the period amounted to $22.
Many of the brokers with whom FMR places trades on behalf of the fund provided services to the fund in addition to trade execution. These services included payments of certain expenses on behalf of the fund totaling $99 for the period. In addition, through arrangements with the fund’s transfer agent, credits realized as a result of uninvested cash balances were used to reduce the fund’s expenses. During the period, these credits reduced the fund’s expenses by $3.
The fund’s organizational documents provide former and current trustees and officers with a limited indemnification against liabilities arising in connection with the performance of their duties to the fund. In the normal course of business, the fund may also enter into contracts that provide general indemnifications. The fund’s maximum exposure under these arrangements is unknown as this would be dependent on future claims that may be made against the fund. The risk of material loss from such claims is considered remote.
25 Semiannual Report
Board Approval of Investment Advisory Contracts and Management Fees
Fidelity Stock Selector
On January 19, 2006, the Board of Trustees, including the Independent Trustees (together, the Board), voted to approve a general research services agreement (the Agreement) between FMR, FMR Co., Inc. (FMRC), Fidelity Investments Money Manage ment, Inc. (FIMM), and Fidelity Research & Analysis Company (FRAC) (together, the Investment Advisers) for the fund, effective January 20, 2006, pursuant to which FRAC may provide general research and investment advisory support services to FMRC and FIMM. The Board considered that it has approved previously various sub advisory agreements for the fund with affiliates of FMR that allow FMR to obtain research, non discretionary advice, or discretionary portfolio management at no additional expense to the fund. The Board, assisted by the advice of fund counsel and independent Trustees’ counsel, considered a broad range of information and determined that it would be beneficial for the fund to access the research and investment advisory support services supplied by FRAC at no additional expense to the fund.
The Board reached this determination in part because the new arrangement will involve no changes in (i) the contractual terms of and fees payable under the fund’s manage ment contract or sub advisory agreements; (ii) the investment process or strategies employed in the management of the fund’s assets; (iii) the nature or level of services provided under the fund’s management contract or sub advisory agreements; (iv) the day to day management of the fund or the persons primarily responsible for such man agement; or (v) the ultimate control or beneficial ownership of FMR, FMRC, or FIMM. The Board also considered that the establishment of the Agreement would not necessi tate prior shareholder approval of the Agreement or result in an assignment and termination of the fund’s management contract or sub advisory agreements under the Investment Company Act of 1940.
Because the Board was approving an arrangement with FRAC under which the fund will not bear any additional management fees or expenses and under which the fund’s portfolio manager would not change, it did not consider the fund’s investment perfor mance, competitiveness of management fee and total expenses, costs of services and profitability, or economies of scale to be significant factors in its decision.
In connection with its future renewal of the fund’s management contract and sub advisory agreements, the Board will consider: (i) the nature, extent, and quality of services provided to the fund, including shareholder and administrative services and investment performance; (ii) the competitiveness of the fund’s management fee and total expenses; (iii) the costs of the services and profitability, including the revenues earned and the expenses incurred by Fidelity in conducting the business of developing, marketing, distributing, managing, administering, and servicing the fund and its shareholders; and (iv) whether there have been economies of scale in respect of the management of the Fidelity funds, whether the Fidelity funds (including the fund) have
appropriately benefited from any such economies of scale, and whether there is potential for realization of any further economies.
Based on its evaluation of all of the conclusions noted above, and after considering all material factors, the Board ultimately concluded that the fund’s Agreement is fair and reasonable, and that the fund’s Agreement should be approved.
27 Semiannual Report
Managing Your Investments
Fidelity offers several ways to conveniently manage your personal investments via your telephone or PC. You can access your account information, conduct trades and research your investments 24 hours a day.
By Phone
Fidelity Automated Service Telephone provides a single toll free number to access account balances, positions, quotes and trading. It’s easy to navigate the service, and on your first call, the system will help you create a personal identification number (PIN) for security.


By PC
Fidelity’s web site on the Internet provides a wide range of information, including daily financial news, fund performance, interactive planning tools and news about Fidelity products and services.

* When you call the quotes line, please remember that a fund’s yield and return will vary and, except for money market funds, share price will also vary. This means that you may have a gain or loss when you sell your shares. There is no assurance that money market funds will be able to maintain a stable $1 share price; an investment in a money market fund is not insured or guar anteed by the U.S. government. Total returns are historical and include changes in share price, reinvestment of dividends and capital gains, and the effects of any sales charges.
Semiannual Report 28
To Write Fidelity
We’ll give your correspondence immediate attention and send you written confirmation upon completion of your request.

(such as changing name, address, bank, etc.)
Fidelity Investments
P.O. Box 770001
Cincinnati, OH 45277-0002
|

Buying shares
Fidelity Investments
P.O. Box 770001
Cincinnati, OH 45277-0003
Overnight Express
Fidelity Investments
Attn: Distribution Services
100 Crosby Parkway KC1H
Covington, KY 41015
Selling shares
Fidelity Investments
P.O. Box 770001
Cincinnati, OH 45277-0035
Overnight Express
Fidelity Investments
Attn: Distribution Services
100 Crosby Parkway KC1H
Covington, KY 41015
General Correspondence
Fidelity Investments
P.O. Box 500
Merrimack, NH 03054-0500
|

Buying shares
Fidelity Investments
P.O. Box 770001
Cincinnati, OH 45277-0003
Selling shares
Fidelity Investments
P.O. Box 770001
Cincinnati, OH 45277-0035
Overnight Express
Fidelity Investments
Attn: Distribution Services
100 Crosby Parkway KC1H
Covington, KY 41015
General Correspondence
Fidelity Investments
P.O. Box 500
Merrimack, NH 03054-0500
|
29 Semiannual Report
To Visit Fidelity
For directions and hours,
please call 1-800-544-9797.
Arizona
7001 West Ray Road
Chandler, AZ
7373 N. Scottsdale Road
Scottsdale, AZ
California
815 East Birch Street
Brea, CA
1411 Chapin Avenue
Burlingame, CA
851 East Hamilton Avenue
Campbell, CA
19200 Von Karman Avenue
Irvine, CA
601 Larkspur Landing Circle
Larkspur, CA
10100 Santa Monica Blvd.
Los Angeles, CA
27101 Puerta Real
Mission Viejo, CA
73 575 El Paseo
Palm Desert, CA
251 University Avenue
Palo Alto, CA
123 South Lake Avenue
Pasadena, CA
16995 Bernardo Ctr. Drive
Rancho Bernardo, CA
1740 Arden Way
Sacramento, CA
7676 Hazard Center Drive
San Diego, CA
8 Montgomery Street
San Francisco, CA
3793 State Street
Santa Barbara, CA
21701 Hawthorne Boulevard
Torrance, CA
2001 North Main Street
Walnut Creek, CA
6300 Canoga Avenue
Woodland Hills, CA
|
Colorado
1625 Broadway
Denver, CO
9185 East Westview Road
Littleton, CO
Connecticut
48 West Putnam Avenue
Greenwich, CT
265 Church Street
New Haven, CT
300 Atlantic Street
Stamford, CT
29 South Main Street
West Hartford, CT
Delaware
222 Delaware Avenue
Wilmington, DE
Florida
4400 N. Federal Highway
Boca Raton, FL
121 Alhambra Plaza
Coral Gables, FL
2948 N. Federal Highway
Ft. Lauderdale, FL
1907 West State Road 434
Longwood, FL
8880 Tamiami Trail, North
Naples, FL
3550 Tamiami Trail, South
Sarasota, FL
1502 N. Westshore Blvd.
Tampa, FL
2465 State Road 7
Wellington, FL
3501 PGA Boulevard
West Palm Beach, FL
Georgia
3445 Peachtree Road, N.E.
Atlanta, GA
1000 Abernathy Road
Atlanta, GA
Illinois
One North LaSalle Street
Chicago, IL
875 North Michigan Ave.
Chicago, IL
|
1415 West 22nd Street
Oak Brook, IL
1572 East Golf Road
Schaumburg, IL
3232 Lake Avenue
Wilmette, IL
Indiana
4729 East 82nd Street
Indianapolis, IN
Kansas
5400 College Boulevard
Overland Park, KS
Maine
Three Canal Plaza
Portland, ME
Maryland
7315 Wisconsin Avenue
Bethesda, MD
One W. Pennsylvania Ave.
Towson, MD
Massachusetts
801 Boylston Street
Boston, MA
155 Congress Street
Boston, MA
300 Granite Street
Braintree, MA
44 Mall Road
Burlington, MA
405 Cochituate Road
Framingham, MA
416 Belmont Street
Worcester, MA
Michigan
500 E. Eisenhower Pkwy.
Ann Arbor, MI
280 Old N. Woodward Ave.
Birmingham, MI
43420 Grand River Avenue
Novi, MI
29155 Northwestern Hwy.
Southfield, MI
Minnesota
7600 France Avenue South
Edina, MN
|
Semiannual Report 30
Missouri
8885 Ladue Road
Ladue, MO
Nevada
2225 Village Walk Drive
Henderson, NV
New Jersey
150 Essex Street
Millburn, NJ
56 South Street
Morristown, NJ
396 Route 17, North
Paramus, NJ
3518 Route 1 North
Princeton, NJ
530 Highway 35
Shrewsbury, NJ
New York
1055 Franklin Avenue
Garden City, NY
37 West Jericho Turnpike
Huntington Station, NY
1271 Avenue of the Americas
New York, NY
61 Broadway
New York, NY
350 Park Avenue
New York, NY
200 Fifth Avenue
New York, NY
733 Third Avenue
New York, NY
11 Penn Plaza
New York, NY
2070 Broadway
New York, NY
1075 Northern Blvd.
Roslyn, NY
North Carolina
4611 Sharon Road
Charlotte, NC
Ohio
3805 Edwards Road
Cincinnati, OH
1324 Polaris Parkway
Columbus, OH
28699 Chagrin Boulevard
Woodmere Village, OH
|
Oregon
16850 SW 72nd Avenue
Tigard, OR
Pennsylvania
600 West DeKalb Pike
King of Prussia, PA
1735 Market Street
Philadelphia, PA
12001 Perry Highway
Wexford, PA
Rhode Island
47 Providence Place
Providence, RI
Tennessee
6150 Poplar Avenue
Memphis, TN
Texas
10000 Research Boulevard
Austin, TX
4001 Northwest Parkway
Dallas, TX
12532 Memorial Drive
Houston, TX
2701 Drexel Drive
Houston, TX
6500 N. MacArthur Blvd.
Irving, TX
6005 West Park Boulevard
Plano, TX
14100 San Pedro
San Antonio, TX
1576 East Southlake Blvd.
Southlake, TX
19740 IH 45 North
Spring, TX
Utah
215 South State Street
Salt Lake City, UT
Virginia
1861 International Drive
McLean, VA
Washington
411 108th Avenue, N.E.
Bellevue, WA
1518 6th Avenue
Seattle, WA
|
Washington, DC
1900 K Street, N.W.
Washington, DC
Wisconsin
595 North Barker Road
Brookfield, WI
|
Fidelity Brokerage Services, Inc., 100 Summer St., Boston, MA 02110 Member NYSE/SIPC
31 Semiannual Report
31
Investment Adviser
Fidelity Management & Research Company
Boston, MA
Investment Sub Advisers
FMR Co., Inc.
Fidelity Management & Research
(U.K.) Inc.
Fidelity Research & Analysis Company
(formerly Fidelity Management &
Research (Far East) Inc.)
Fidelity Investments Japan Limited
Fidelity International Investment
Advisors
Fidelity International Investment
Advisors (U.K.) Limited
General Distributor
Fidelity Distributors Corporation
Boston, MA
Transfer and Service Agent
Fidelity Service Company, Inc.
Boston, MA
Custodian
Brown Brothers Harriman & Co.
Boston, MA
|
| The Fidelity Telephone Connection |
| Mutual Fund 24-Hour Service |
| Exchanges/Redemptions | | |
| and Account Assistance | | 1-800-544-6666 |
| Product Information | | 1-800-544-6666 |
| Retirement Accounts | | 1-800-544-4774 |
| (8 a.m. - 9 p.m.) | | |
| TDD Service | | 1-800-544-0118 |
| for the deaf and hearing impaired | | |
| (9 a.m. - 9 p.m. Eastern time) | | |
| Fidelity Automated Service | | |
| Telephone (FAST®) (automated phone logo) | | 1-800-544-5555 |
| (automated phone logo) Automated line for quickest service |
FSS-USAN-0606
1.784916.103
|

| | Semiannual Report
April 30, 2006
|


| Contents | | | | |
| |
| Chairman’s Message | | 3 | | Ned Johnson’s message to shareholders. |
| Shareholder Expense | | 4 | | An example of shareholder expenses. |
| Example | | | | |
| Investment Changes | | 5 | | A summary of major shifts in the fund’s |
| | | | | investments over the past six months. |
| Investments | | 6 | | A complete list of the fund’s investments |
| | | | | with their market values. |
| Financial Statements | | 20 | | Statements of assets and liabilities, |
| | | | | operations, and changes in net assets, |
| | | | | as well as financial highlights. |
| Notes | | 24 | | Notes to the financial statements. |
| Board Approval of | | 30 | | |
| Investment Advisory | | | | |
| Contracts and | | | | |
| Management Fees | | | | |
To view a fund’s proxy voting guidelines and proxy voting record for the 12 month period
ended June 30, visit www.fidelity.com/proxyvotingresults or visit the Securities and Exchange
Commission’s (SEC) web site at www.sec.gov. You may also call 1-800-544-8544 to request a free
copy of the proxy voting guidelines.
Standard & Poor’s, S&P and S&P 500 are registered service marks of The McGraw Hill Companies,
Inc. and have been licensed for use by Fidelity Distributors Corporation.
Other third party marks appearing herein are the property of their respective owners.
All other marks appearing herein are registered or unregistered trademarks or service marks
of FMR Corp. or an affiliated company.
|
| | This report and the financial statements contained herein are submitted for the general information
of the shareholders of the fund. This report is not authorized for distribution to prospective investors
in the fund unless preceded or accompanied by an effective prospectus.
A fund files its complete schedule of portfolio holdings with the SEC for the first and third
quarters of each fiscal year on Form N Q. Forms N Q are available on the SEC’s web site at
http://www.sec.gov. A fund’s Forms N Q may be reviewed and copied at the SEC’s Public Refer
ence Room in Washington, DC. Information regarding the operation of the SEC’s Public Reference
Room may be obtained by calling 1-800-SEC-0330. For a complete list of a fund’s portfolio
holdings, view the most recent quarterly holdings report, semiannual report, or annual report
on Fidelity’s web site at http://www.fidelity.com/holdings.
NOT FDIC INSURED · MAY LOSE VALUE · NO BANK GUARANTEE
Neither the fund nor Fidelity Distributors Corporation is a bank.
|
Semiannual Report 2
Chairman’s Message
(photograph of Edward C. Johnson 3d)
Dear Shareholder:
Although many securities markets made gains in early 2006, there is only one certainty when it comes to investing: There is no sure thing. There are, however, a number of time tested, funda mental investment principles that can put the historical odds in your favor.
One of the basic tenets is to invest for the long term. Over time, riding out the markets’ inevitable ups and downs has proven much more effective than selling into panic or chasing the hottest trend. Even missing only a few of the markets’ best days can significantly diminish investor returns. Patience also affords the benefits of compounding of earning interest on additional income or reinvested dividends and capital gains. There are tax advantages and cost benefits to consider as well. The more you sell, the more taxes you pay, and the more you trade, the higher the costs. While staying the course doesn’t eliminate risk, it can considerably lessen the effect of short term declines.
You can further manage your investing risk through diversification. And today, more than ever, geographic diversification should be taken into account. Studies indicate that asset allocation is the single most important determinant of a portfolio’s long term success. The right mix of stocks, bonds and cash aligned to your particular risk tolerance and investment objective is very important. Age appropriate rebalancing is also an essential aspect of asset allocation. For younger investors, an emphasis on equities which historically have been the best performing asset class over time is encouraged. As investors near their specific goal, such as retirement or sending a child to college, consideration may be given to replacing volatile assets (e.g. common stocks) with more stable fixed investments (bonds or savings plans).
A third investment principle investing regularly can help lower the average cost of your purchases. Investing a certain amount of money each month or quarter helps ensure you won’t pay for all your shares at market highs. This strategy known as dollar cost averaging also reduces unconstructive “emotion” from investing, helping shareholders avoid selling weak performers just prior to an upswing, or chasing a hot performer just before a correction.
We invite you to contact us via the Internet, through our Investor Centers or over the phone. It is our privilege to provide you the information you need to make the investments that are right for you.
Sincerely,
/s/ Edward C. Johnson 3d
Edward C. Johnson 3d
3 Semiannual Report
Shareholder Expense Example
As a shareholder of the Fund, you incur two types of costs: (1) transaction costs, and (2) ongoing costs, including management fees and other Fund expenses. This Example is intended to help you understand your ongoing costs (in dollars) of investing in the Fund and to compare these costs with the ongoing costs of investing in other mutual funds. The Example is based on an investment of $1,000 invested at the beginning of the period and held for the entire period (November 1, 2005 to April 30, 2006).
The first line of the table below provides information about actual account values and actual expenses. You may use the information in this line, together with the amount you invested, to estimate the expenses that you paid over the period. Simply divide your account value by $1,000.00 (for example, an $8,600 account value divided by $1,000.00 = 8.6), then multiply the result by the number in the first line under the heading entitled “Expenses Paid During Period” to estimate the expenses you paid on your account during this period. A small balance maintenance fee of $12.00 that is charged once a year may apply for certain accounts with a value of less than $2,000. This fee is not included in the table below. If it was, the estimate of expenses you paid during the period would be higher, and your ending account value lower, by this amount.
Hypothetical Example for Comparison Purposes
The second line of the table below provides information about hypothetical account values and hypothetical expenses based on the Fund’s actual expense ratio and an assumed rate of return of 5% per year before expenses, which is not the Fund’s actual return. The hypothetical account values and expenses may not be used to estimate the actual ending account balance or expenses you paid for the period. You may use this information to compare the ongoing costs of investing in the Fund and other funds. To do so, compare this 5% hypothetical example with the 5% hypothetical examples that appear in the share holder reports of the other funds. A small balance maintenance fee of $12.00 that is charged once a year may apply for certain accounts with a value of less than $2,000. This fee is not included in the table below. If it was, the estimate of expenses you paid during the period would be higher, and your ending account value lower, by this amount.
Please note that the expenses shown in the table are meant to highlight your ongoing costs only and do not reflect any transaction costs. Therefore, the second line of the table is useful in comparing ongoing costs only, and will not help you determine the relative total costs of owning different funds.
| | | | | | | | | | | Expenses Paid |
| | | Beginning | | | | Ending | | During Period* |
| | | Account Value | | | | Account Value | | November 1, 2005 |
| | | November 1, 2005 | | | | April 30, 2006 | | to April 30, 2006 |
| Actual | | | | $ 1,000.00 | | | | $ 1,159.90 | | | | $ 3.70 |
| Hypothetical (5% return per year | | | | | | | | | | | | |
| before expenses) | | | | $ 1,000.00 | | | | $ 1,021.37 | | | | $ 3.46 |
* Expenses are equal to the Fund’s annualized expense ratio of .69%; multiplied by the average account value over the period, multiplied by 181/365 (to reflect the one half year period).
| Investment Changes | | | | |
| |
| Top Ten Stocks as of April 30, 2006 | | | | |
| | | % of fund’s | | % of fund’s net assets |
| | | net assets | | 6 months ago |
| Baxter International, Inc. | | 1.7 | | 1.4 |
| Safeway, Inc. | | 1.3 | | 1.1 |
| Xerox Corp. | | 1.3 | | 1.5 |
| Western Digital Corp. | | 1.2 | | 0.9 |
| Tyco International Ltd. | | 1.2 | | 1.1 |
| Halliburton Co. | | 1.1 | | 1.0 |
| Avon Products, Inc. | | 1.0 | | 0.1 |
| National Oilwell Varco, Inc. | | 1.0 | | 1.0 |
| Ceridian Corp. | | 1.0 | | 1.2 |
| Agilent Technologies, Inc. | | 0.9 | | 0.9 |
| | | 11.7 | | |
Top Five Market Sectors as of April 30, 2006 | | |
| | | % of fund’s | | % of fund’s net assets |
| | | net assets | | 6 months ago |
| Information Technology | | 18.7 | | 19.9 |
| Consumer Discretionary | | 16.1 | | 14.5 |
| Financials | | 12.8 | | 12.1 |
| Health Care | | 12.5 | | 13.9 |
| Industrials | | 9.2 | | 10.3 |
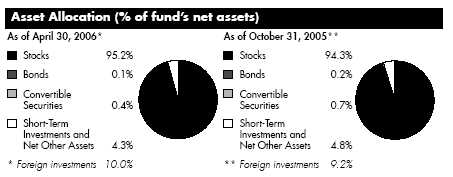
5 Semiannual Report
| Investments April 30, 2006 (Unaudited) |
| Showing Percentage of Net Assets | | | | | | |
| |
| Common Stocks 95.1% | | | | | | |
| | | Shares | | Value (Note 1) |
| | | | | (000s) |
| |
| CONSUMER DISCRETIONARY – 15.9% | | | | | | |
| Auto Components 0.2% | | | | | | |
| BorgWarner, Inc. | | 545,500 | | | | $ 33,128 |
| Automobiles – 0.3% | | | | | | |
| Monaco Coach Corp. | | 706,800 | | | | 9,839 |
| Nissan Motor Co. Ltd. | | 2,913,684 | | | | 38,359 |
| | | | | | | 48,198 |
| Diversified Consumer Services – 0.1% | | | | | | |
| Service Corp. International (SCI) | | 1,361,500 | | | | 10,960 |
| Hotels, Restaurants & Leisure 3.7% | | | | | | |
| Applebee’s International, Inc. | | 718,600 | | | | 16,679 |
| Brinker International, Inc. (d) | | 2,306,600 | | | | 90,326 |
| Carnival Corp. unit | | 2,877,900 | | | | 134,743 |
| Domino’s Pizza, Inc. | | 352,700 | | | | 9,287 |
| Gaylord Entertainment Co. (a) | | 839,032 | | | | 37,127 |
| Harrah’s Entertainment, Inc. | | 211,735 | | | | 17,286 |
| OSI Restaurant Partners, Inc. | | 2,167,920 | | | | 92,570 |
| Rare Hospitality International, Inc. (a) | | 759,900 | | | | 23,648 |
| Royal Caribbean Cruises Ltd. | | 3,330,520 | | | | 139,182 |
| WMS Industries, Inc. (a) | | 1,476,300 | | | | 46,134 |
| | | | | | | 606,982 |
| Household Durables – 1.6% | | | | | | |
| Jarden Corp. (a) | | 1,181,900 | | | | 40,185 |
| Leggett & Platt, Inc. | | 2,955,050 | | | | 78,397 |
| Matsushita Electric Industrial Co. Ltd. | | 1,169,000 | | | | 28,301 |
| Newell Rubbermaid, Inc. | | 2,220,200 | | | | 60,878 |
| Sealy Corp., Inc. | | 452,700 | | | | 7,221 |
| Sony Corp. sponsored ADR | | 371,600 | | | | 18,186 |
| The Stanley Works | | 757,400 | | | | 39,574 |
| | | | | | | 272,742 |
| Leisure Equipment & Products – 1.5% | | | | | | |
| Brunswick Corp. | | 2,469,100 | | | | 96,838 |
| Eastman Kodak Co. (d) | | 4,838,900 | | | | 130,457 |
| K2, Inc. (a) | | 2,010,204 | | | | 23,700 |
| | | | | | | 250,995 |
| Media – 3.2% | | | | | | |
| CBS Corp. Class B | | 557,987 | | | | 14,212 |
| Clear Channel Communications, Inc. | | 2,795,800 | | | | 79,764 |
| E.W. Scripps Co. Class A | | 846,600 | | | | 39,011 |
| Gannett Co., Inc. | | 2,047,800 | | | | 112,629 |
See accompanying notes which are an integral part of the financial statements.
Semiannual Report 6
| Common Stocks continued | | | | | | |
| | | Shares | | Value (Note 1) |
| | | | | (000s) |
| |
| CONSUMER DISCRETIONARY – continued | | | | | | |
| Media – continued | | | | | | |
| Lamar Advertising Co. Class A (a) | | 1,069,500 | | | | $ 58,812 |
| Live Nation, Inc. (a) | | 615,962 | | | | 11,703 |
| Omnicom Group, Inc. | | 361,400 | | | | 32,530 |
| The New York Times Co. Class A (d) | | 2,499,200 | | | | 61,955 |
| The Reader’s Digest Association, Inc. (non-vtg.) | | 2,618,371 | | | | 36,081 |
| Tribune Co. | | 1,150,900 | | | | 33,180 |
| Viacom, Inc. Class B (non-vtg.) (a) | | 1,043,987 | | | | 41,582 |
| | | | | | | 521,459 |
| Multiline Retail – 1.3% | | | | | | |
| Big Lots, Inc. (a) | | 4,374,360 | | | | 63,210 |
| Dollar General Corp. | | 2,714,000 | | | | 47,386 |
| Family Dollar Stores, Inc. | | 3,952,500 | | | | 98,813 |
| | | | | | | 209,409 |
| Specialty Retail – 3.4% | | | | | | |
| AnnTaylor Stores Corp. (a) | | 3,218,900 | | | | 120,162 |
| AutoNation, Inc. (a) | | 837,722 | | | | 18,865 |
| AutoZone, Inc. (a) | | 26,700 | | | | 2,499 |
| Best Buy Co., Inc. | | 404,200 | | | | 22,902 |
| Gap, Inc. | | 3,337,600 | | | | 60,377 |
| Hot Topic, Inc. (a) | | 1,658,900 | | | | 24,601 |
| Office Depot, Inc. (a) | | 646,500 | | | | 26,235 |
| OfficeMax, Inc. | | 2,590,600 | | | | 100,256 |
| Pier 1 Imports, Inc. (d)(e) | | 5,099,000 | | | | 61,545 |
| RadioShack Corp. | | 179,100 | | | | 3,045 |
| Sports Authority, Inc. (a)(e) | | 1,592,400 | | | | 59,174 |
| Tiffany & Co., Inc. | | 1,854,000 | | | | 64,686 |
| | | | | | | 564,347 |
| Textiles, Apparel & Luxury Goods – 0.6% | | | | | | |
| Liz Claiborne, Inc. | | 2,327,600 | | | | 90,893 |
| Warnaco Group, Inc. (a) | | 559,780 | | | | 12,472 |
| | | | | | | 103,365 |
| |
| TOTAL CONSUMER DISCRETIONARY | | | | | | 2,621,585 |
| |
| CONSUMER STAPLES 5.1% | | | | | | |
| Beverages – 0.7% | | | | | | |
| Coca-Cola Enterprises, Inc. | | 2,634,744 | | | | 51,457 |
See accompanying notes which are an integral part of the financial statements.
| Investments (Unaudited) continued | | | | | | |
| |
| |
| Common Stocks continued | | | | | | | | |
| | | | | Shares | | Value (Note 1) |
| | | | | | | (000s) |
| |
| CONSUMER STAPLES – continued | | | | | | | | |
| Beverages – continued | | | | | | | | |
| Cott Corp. (a) | | | | 1,652,900 | | | | $ 24,705 |
| SABMiller PLC | | | | 1,538,100 | | | | 32,455 |
| | | | | | | | | 108,617 |
| Food & Staples Retailing – 1.6% | | | | | | | | |
| Kroger Co. | | | | 2,338,300 | | | | 47,374 |
| Safeway, Inc. | | | | 8,660,056 | | | | 217,627 |
| | | | | | | | | 265,001 |
| Food Products 0.7% | | | | | | | | |
| Corn Products International, Inc. | | | | 2,387,100 | | | | 66,839 |
| McCormick & Co., Inc. (non-vtg.) | | | | 605,900 | | | | 21,103 |
| TreeHouse Foods, Inc. (a) | | | | 970,679 | | | | 25,432 |
| | | | | | | | | 113,374 |
| Household Products – 0.6% | | | | | | | | |
| Colgate-Palmolive Co. | | | | 1,633,400 | | | | 96,567 |
| Personal Products 1.0% | | | | | | | | |
| Avon Products, Inc. | | | | 5,301,900 | | | | 172,895 |
| Tobacco 0.5% | | | | | | | | |
| Altria Group, Inc. | | | | 1,190,600 | | | | 87,104 |
| |
| TOTAL CONSUMER STAPLES | | | | | | | | 843,558 |
| |
| ENERGY 8.9% | | | | | | | | |
| Energy Equipment & Services – 8.1% | | | | | | | | |
| Baker Hughes, Inc. | | | | 927,060 | | | | 74,934 |
| BJ Services Co. | | | | 1,727,400 | | | | 65,728 |
| Cooper Cameron Corp. (a) | | | | 2,525,100 | | | | 126,861 |
| ENSCO International, Inc. | | | | 1,198,000 | | | | 64,081 |
| FMC Technologies, Inc. (a) | | | | 1,806,100 | | | | 98,577 |
| GlobalSantaFe Corp. | | | | 1,164,520 | | | | 71,280 |
| Halliburton Co. | | | | 2,385,900 | | | | 186,458 |
| Helmerich & Payne, Inc. | | | | 829,800 | | | | 60,360 |
| Nabors Industries Ltd. (a) | | | | 631,600 | | | | 23,578 |
| National Oilwell Varco, Inc. (a) | | | | 2,498,970 | | | | 172,354 |
| Noble Corp. | | | | 967,600 | | | | 76,382 |
| Pride International, Inc. (a) | | | | 790,600 | | | | 27,584 |
| Smith International, Inc. | | | | 2,768,800 | | | | 116,926 |
| Transocean, Inc. (a) | | | | 1,092,900 | | | | 88,601 |
| Weatherford International Ltd. (a) | | | | 1,462,548 | | | | 77,413 |
| | | | | | | | | 1,331,117 |
See accompanying notes which are an integral part of the financial statements.
| Common Stocks continued | | | | | | |
| | | Shares | | Value (Note 1) |
| | | | | (000s) |
| |
| ENERGY – continued | | | | | | |
| Oil, Gas & Consumable Fuels – 0.8% | | | | | | |
| Double Hull Tankers, Inc. | | 432,800 | | | | $ 5,540 |
| El Paso Corp. | | 1,447,900 | | | | 18,692 |
| EOG Resources, Inc. | | 1,174,500 | | | | 82,485 |
| EXCO Resources, Inc. | | 1,201,700 | | | | 15,418 |
| McMoRan Exploration Co. (a)(d) | | 576,400 | | | | 9,983 |
| | | | | | | 132,118 |
| |
| TOTAL ENERGY | | | | | | 1,463,235 |
| |
| FINANCIALS – 12.7% | | | | | | |
| Capital Markets 1.3% | | | | | | |
| Ameriprise Financial, Inc. | | 225,700 | | | | 11,068 |
| Janus Capital Group, Inc. | | 1,953,700 | | | | 38,019 |
| Lehman Brothers Holdings, Inc. | | 41,730 | | | | 6,307 |
| Merrill Lynch & Co., Inc. | | 1,352,300 | | | | 103,126 |
| State Street Corp. | | 617,900 | | | | 40,361 |
| TD Ameritrade Holding Corp. | | 1,089,900 | | | | 20,229 |
| | | | | | | 219,110 |
| Commercial Banks – 1.5% | | | | | | |
| Bank of America Corp. | | 905,460 | | | | 45,201 |
| FirstRand Ltd. | | 3,076,200 | | | | 10,130 |
| National Australia Bank Ltd. | | 541,000 | | | | 15,451 |
| Popular, Inc. | | 144,000 | | | | 2,978 |
| UnionBanCal Corp. | | 712,828 | | | | 49,962 |
| Wachovia Corp. | | 1,918,867 | | | | 114,844 |
| | | | | | | 238,566 |
| Consumer Finance – 0.1% | | | | | | |
| Capital One Financial Corp. | | 173,500 | | | | 15,032 |
| Diversified Financial Services – 0.3% | | | | | | |
| JPMorgan Chase & Co. | | 1,089,500 | | | | 49,442 |
| NETeller PLC (a) | | 355,200 | | | | 5,020 |
| | | | | | | 54,462 |
| Insurance – 3.7% | | | | | | |
| AFLAC, Inc. | | 1,547,320 | | | | 73,560 |
| AMBAC Financial Group, Inc. | | 1,221,500 | | | | 100,603 |
| Genworth Financial, Inc. Class A (non-vtg.) | | 804,400 | | | | 26,706 |
| Marsh & McLennan Companies, Inc. | | 878,800 | | | | 26,953 |
| MBIA, Inc. | | 1,720,900 | | | | 102,617 |
| MetLife, Inc. | | 857,890 | | | | 44,696 |
See accompanying notes which are an integral part of the financial statements.
| Investments (Unaudited) continued | | | | | | |
| |
| |
| Common Stocks continued | | | | | | |
| | | Shares | | Value (Note 1) |
| | | | | (000s) |
| |
| FINANCIALS – continued | | | | | | |
| Insurance – continued | | | | | | |
| Montpelier Re Holdings Ltd. | | 435,400 | | | | $ 7,032 |
| Prudential Financial, Inc. | | 708,400 | | | | 55,347 |
| Reinsurance Group of America, Inc. | | 342,500 | | | | 16,474 |
| Scottish Re Group Ltd. | | 1,138,760 | | | | 26,453 |
| The St. Paul Travelers Companies, Inc. | | 1,710,820 | | | | 75,327 |
| Universal American Financial Corp. (a) | | 451,600 | | | | 6,657 |
| Willis Group Holdings Ltd. | | 1,152,200 | | | | 40,500 |
| | | | | | | 602,925 |
| Real Estate 3.8% | | | | | | |
| Alexandria Real Estate Equities, Inc. | | 425,800 | | | | 38,577 |
| American Financial Realty Trust (SBI) | | 1,946,500 | | | | 22,151 |
| Annaly Mortgage Management, Inc. (d) | | 904,000 | | | | 12,177 |
| Apartment Investment & Management Co. Class A | | 500 | | | | 22 |
| Developers Diversified Realty Corp. | | 788,600 | | | | 41,954 |
| Digital Realty Trust, Inc. | | 397,400 | | | | 11,207 |
| Duke Realty Corp. | | 951,300 | | | | 33,676 |
| Education Realty Trust, Inc. | | 1,052,400 | | | | 15,702 |
| Equity Office Properties Trust | | 894,300 | | | | 28,886 |
| Equity Residential (SBI) | | 1,194,000 | | | | 53,575 |
| General Growth Properties, Inc. | | 1,644,450 | | | | 77,207 |
| GMH Communities Trust | | 980,700 | | | | 12,063 |
| Kimco Realty Corp. | | 1,371,600 | | | | 50,928 |
| Pennsylvania (REIT) (SBI) | | 881,200 | | | | 35,741 |
| Reckson Associates Realty Corp. | | 1,017,300 | | | | 41,384 |
| SL Green Realty Corp. | | 222,200 | | | | 21,998 |
| Trizec Properties, Inc. | | 1,143,100 | | | | 28,600 |
| United Dominion Realty Trust, Inc. (SBI) | | 1,953,200 | | | | 53,108 |
| Vornado Realty Trust | | 529,100 | | | | 50,603 |
| | | | | | | 629,559 |
| Thrifts & Mortgage Finance – 2.0% | | | | | | |
| Countrywide Financial Corp. | | 1,776,766 | | | | 72,243 |
| Fannie Mae | | 2,670,100 | | | | 135,107 |
| Freddie Mac | | 1,558,800 | | | | 95,180 |
| Hudson City Bancorp, Inc. | | 1,842,300 | | | | 24,705 |
| | | | | | | 327,235 |
| |
| TOTAL FINANCIALS | | | | | | 2,086,889 |
See accompanying notes which are an integral part of the financial statements.
| Common Stocks continued | | | | | | |
| | | Shares | | Value (Note 1) |
| | | | | (000s) |
| |
| HEALTH CARE – 12.4% | | | | | | |
| Biotechnology – 1.2% | | | | | | |
| Biogen Idec, Inc. (a) | | 446,465 | | | | $ 20,024 |
| Cephalon, Inc. (a)(d) | | 988,800 | | | | 64,925 |
| Charles River Laboratories International, Inc. (a) | | 1,655,600 | | | | 78,227 |
| MedImmune, Inc. (a) | | 741,600 | | | | 23,338 |
| ONYX Pharmaceuticals, Inc. (a) | | 374,100 | | | | 8,735 |
| | | | | | | 195,249 |
| Health Care Equipment & Supplies – 4.2% | | | | | | |
| Baxter International, Inc. | | 7,515,882 | | | | 283,350 |
| Becton, Dickinson & Co. | | 1,339,460 | | | | 84,440 |
| Boston Scientific Corp. (a) | | 2,618,600 | | | | 60,856 |
| CONMED Corp. (a) | | 687,900 | | | | 15,003 |
| Dade Behring Holdings, Inc. | | 336,624 | | | | 13,128 |
| Fisher Scientific International, Inc. (a) | | 1,090,332 | | | | 76,923 |
| Hospira, Inc. (a) | | 417,000 | | | | 16,075 |
| Varian, Inc. (a)(e) | | 2,142,500 | | | | 92,706 |
| Waters Corp. (a) | | 871,700 | | | | 39,505 |
| | | | | | | 681,986 |
| Health Care Providers & Services – 5.8% | | | | | | |
| AmerisourceBergen Corp. | | 1,736,080 | | | | 74,912 |
| Chemed Corp. | | 497,700 | | | | 27,120 |
| Community Health Systems, Inc. (a) | | 3,174,300 | | | | 115,037 |
| Emdeon Corp. (a) | | 3,191,850 | | | | 36,419 |
| HCA, Inc. | | 2,026,040 | | | | 88,923 |
| Health Net, Inc. (a) | | 1,633,900 | | | | 66,500 |
| Laboratory Corp. of America Holdings (a) | | 530,300 | | | | 30,280 |
| McKesson Corp. | | 2,759,400 | | | | 134,079 |
| Omnicare, Inc. | | 405,700 | | | | 23,007 |
| Quest Diagnostics, Inc. | | 2,678,320 | | | | 149,263 |
| Sunrise Senior Living, Inc. (a) | | 1,319,400 | | | | 49,082 |
| Triad Hospitals, Inc. (a) | | 1,086,750 | | | | 44,774 |
| Universal Health Services, Inc. Class B | | 2,243,080 | | | | 113,926 |
| | | | | | | 953,322 |
| Pharmaceuticals – 1.2% | | | | | | |
| Forest Laboratories, Inc. (a) | | 273,700 | | | | 11,052 |
| Schering-Plough Corp. | | 6,610,250 | | | | 127,710 |
See accompanying notes which are an integral part of the financial statements.
11 Semiannual Report
| Investments (Unaudited) continued | | | | | | |
| |
| |
| Common Stocks continued | | | | | | |
| | | Shares | | Value (Note 1) |
| | | | | (000s) |
| |
| HEALTH CARE – continued | | | | | | |
| Pharmaceuticals – continued | | | | | | |
| Teva Pharmaceutical Industries Ltd. sponsored ADR | | 1,362,200 | | | | $ 55,169 |
| Wyeth | | 185,500 | | | | 9,028 |
| | | | | | | 202,959 |
| |
| TOTAL HEALTH CARE | | | | | | 2,033,516 |
| |
| INDUSTRIALS – 9.2% | | | | | | |
| Aerospace & Defense – 0.5% | | | | | | |
| EADS NV | | 369,200 | | | | 14,570 |
| Honeywell International, Inc. | | 1,064,100 | | | | 45,224 |
| Lockheed Martin Corp. | | 195,190 | | | | 14,815 |
| Precision Castparts Corp. | | 302,320 | | | | 19,040 |
| | | | | | | 93,649 |
| Airlines – 0.7% | | | | | | |
| ACE Aviation Holdings, Inc. Class A (a) | | 588,800 | | | | 16,274 |
| Ryanair Holdings PLC sponsored ADR (a) | | 902,400 | | | | 42,485 |
| Southwest Airlines Co. | | 1,814,000 | | | | 29,423 |
| TAM SA (PN) sponsored ADR (ltd. vtg.) | | 1,050,600 | | | | 26,423 |
| | | | | | | 114,605 |
| Building Products 1.1% | | | | | | |
| American Standard Companies, Inc. | | 782,600 | | | | 34,067 |
| Masco Corp. | | 4,472,500 | | | | 142,673 |
| | | | | | | 176,740 |
| Commercial Services & Supplies – 1.9% | | | | | | |
| Allied Waste Industries, Inc. (a) | | 993,208 | | | | 14,064 |
| Aramark Corp. Class B | | 2,859,000 | | | | 80,366 |
| Cendant Corp. | | 1,174,600 | | | | 20,473 |
| Manpower, Inc. | | 702,000 | | | | 45,735 |
| Navigant Consulting, Inc. (a) | | 1,681,400 | | | | 35,444 |
| Pike Electric Corp. | | 885,300 | | | | 16,936 |
| Steelcase, Inc. Class A | | 2,022,200 | | | | 37,856 |
| The Brink’s Co. | | 1,212,100 | | | | 61,575 |
| | | | | | | 312,449 |
| Construction & Engineering – 0.8% | | | | | | |
| Fluor Corp. | | 1,372,480 | | | | 127,517 |
| Industrial Conglomerates – 1.2% | | | | | | |
| Tyco International Ltd. | | 7,361,170 | | | | 193,967 |
See accompanying notes which are an integral part of the financial statements.
| Common Stocks continued | | | | | | |
| | | Shares | | Value (Note 1) |
| | | | | (000s) |
| |
| INDUSTRIALS – continued | | | | | | |
| Machinery – 1.5% | | | | | | |
| Albany International Corp. Class A | | 850,689 | | | | $ 33,262 |
| Briggs & Stratton Corp. | | 1,731,800 | | | | 58,431 |
| Deere & Co. | | 239,100 | | | | 20,988 |
| Harsco Corp. | | 76,200 | | | | 6,351 |
| Kennametal, Inc. | | 167,388 | | | | 10,353 |
| SPX Corp. | | 1,898,330 | | | | 103,934 |
| Wabash National Corp | | 874,630 | | | | 15,831 |
| | | | | | | 249,150 |
| Road & Rail 1.4% | | | | | | |
| Canadian National Railway Co. | | 912,100 | | | | 40,898 |
| Con-way, Inc. | | 950,200 | | | | 52,945 |
| Laidlaw International, Inc. | | 4,085,100 | | | | 101,106 |
| Old Dominion Freight Lines, Inc. (a) | | 987,309 | | | | 31,791 |
| | | | | | | 226,740 |
| Transportation Infrastructure 0.1% | | | | | | |
| Grupo Aeroportuario del Pacifico SA de CV sponsored ADR | | 51,300 | | | | 1,707 |
| Macquarie Infrastructure Co. Trust | | 516,395 | | | | 15,079 |
| | | | | | | 16,786 |
| |
| TOTAL INDUSTRIALS | | | | | | 1,511,603 |
| |
| INFORMATION TECHNOLOGY – 18.7% | | | | | | |
| Communications Equipment – 1.6% | | | | | | |
| Alcatel SA sponsored ADR (a) | | 3,104,400 | | | | 44,765 |
| Andrew Corp. (a) | | 1,885,800 | | | | 19,952 |
| Dycom Industries, Inc. (a)(e) | | 3,906,100 | | | | 85,583 |
| Lucent Technologies, Inc. (a) | | 4,552,100 | | | | 12,700 |
| Motorola, Inc. | | 1,452,900 | | | | 31,019 |
| Nokia Corp. sponsored ADR | | 2,700,700 | | | | 61,198 |
| Nortel Networks Corp. (a) | | 4,334,000 | | | | 11,526 |
| | | | | | | 266,743 |
| Computers & Peripherals – 3.9% | | | | | | |
| Diebold, Inc. | | 951,300 | | | | 40,478 |
| Emulex Corp. (a) | | 2,613,700 | | | | 47,439 |
| Intermec, Inc. (a) | | 1,448,200 | | | | 38,363 |
| Maxtor Corp. (a) | | 8,016,300 | | | | 77,598 |
| NCR Corp. (a) | | 2,198,100 | | | | 86,605 |
| Seagate Technology | | 4,859,600 | | | | 129,071 |
See accompanying notes which are an integral part of the financial statements.
13 Semiannual Report
| Investments (Unaudited) continued | | | | | | |
| |
| |
| Common Stocks continued | | | | | | |
| | | Shares | | Value (Note 1) |
| | | | | (000s) |
| |
| INFORMATION TECHNOLOGY – continued | | | | | | |
| Computers & Peripherals – continued | | | | | | |
| Sun Microsystems, Inc. (a) | | 3,758,500 | | | | $ 18,793 |
| Western Digital Corp. (a) | | 9,632,380 | | | | 202,665 |
| | | | | | | 641,012 |
| Electronic Equipment & Instruments – 5.8% | | | | | | |
| Agilent Technologies, Inc. (a) | | 3,961,400 | | | | 152,197 |
| Arrow Electronics, Inc. (a) | | 2,011,700 | | | | 72,824 |
| Avnet, Inc. (a) | | 4,273,035 | | | | 111,740 |
| Celestica, Inc. (sub. vtg.) (a) | | 8,817,200 | | | | 99,134 |
| Flextronics International Ltd. (a) | | 13,004,800 | | | | 147,735 |
| Ingram Micro, Inc. Class A (a) | | 2,237,300 | | | | 41,144 |
| Mettler-Toledo International, Inc. (a) | | 689,175 | | | | 44,659 |
| Molex, Inc. | | 2,611,576 | | | | 96,942 |
| Solectron Corp. (a) | | 8,456,600 | | | | 33,826 |
| Symbol Technologies, Inc. | | 12,323,100 | | | | 131,241 |
| Tech Data Corp. (a) | | 682,900 | | | | 25,076 |
| Tektronix, Inc. | | 65,030 | | | | 2,297 |
| | | | | | | 958,815 |
| IT Services – 1.8% | | | | | | |
| Accenture Ltd. Class A | | 334,800 | | | | 9,733 |
| Ceridian Corp. (a) | | 7,021,960 | | | | 170,142 |
| Hewitt Associates, Inc. Class A (a) | | 2,972,800 | | | | 86,181 |
| Satyam Computer Services Ltd. sponsored ADR | | 723,900 | | | | 26,046 |
| | | | | | | 292,102 |
| Office Electronics – 1.3% | | | | | | |
| Xerox Corp. (a) | | 15,123,510 | | | | 212,334 |
| Semiconductors & Semiconductor Equipment – 2.7% | | | | | | |
| Actel Corp. (a) | | 270,900 | | | | 4,353 |
| AMIS Holdings, Inc. (a) | | 1,669,000 | | | | 17,207 |
| Amkor Technology, Inc. (a) | | 2,158,600 | | | | 26,097 |
| Applied Materials, Inc. | | 5,035,200 | | | | 90,382 |
| ASM International NV (NASDAQ) (a) | | 1,420,000 | | | | 27,335 |
| ASML Holding NV (NY Shares) (a) | | 4,446,900 | | | | 94,052 |
| DSP Group, Inc. (a) | | 484,431 | | | | 13,099 |
| Fairchild Semiconductor International, Inc. (a) | | 2,845,010 | | | | 58,806 |
| Microsemi Corp. (a) | | 15,200 | | | | 415 |
| MKS Instruments, Inc. (a) | | 1,440,000 | | | | 34,373 |
| National Semiconductor Corp. | | 2,909,700 | | | | 87,233 |
| | | | | | | 453,352 |
See accompanying notes which are an integral part of the financial statements.
| Common Stocks continued | | | | | | |
| | | Shares | | Value (Note 1) |
| | | | | (000s) |
| |
| INFORMATION TECHNOLOGY – continued | | | | | | |
| Software 1.6% | | | | | | |
| Cadence Design Systems, Inc. (a) | | 2,852,700 | | | | $ 54,002 |
| Hyperion Solutions Corp. (a) | | 937,022 | | | | 28,692 |
| JDA Software Group, Inc. (a) | | 564,100 | | | | 7,706 |
| Sybase, Inc. (a) | | 861,300 | | | | 18,751 |
| Symantec Corp. (a) | | 3,882,655 | | | | 63,598 |
| Take-Two Interactive Software, Inc. (a) | | 2,092,500 | | | | 35,677 |
| THQ, Inc. (a) | | 2,032,550 | | | | 52,094 |
| | | | | | | 260,520 |
| |
| TOTAL INFORMATION TECHNOLOGY | | | | | | 3,084,878 |
| |
| MATERIALS 5.1% | | | | | | |
| Chemicals – 2.5% | | | | | | |
| Albemarle Corp. | | 567,810 | | | | 27,153 |
| Ashland, Inc. | | 1,075,520 | | | | 70,791 |
| Bayer AG (d) | | 180,200 | | | | 8,323 |
| Celanese Corp. Class A | | 1,700,200 | | | | 37,319 |
| Chemtura Corp. | | 7,249,132 | | | | 88,439 |
| Cytec Industries, Inc. | | 1,572,800 | | | | 95,107 |
| Ferro Corp. | | 1,321,000 | | | | 25,469 |
| Georgia Gulf Corp. | | 421,700 | | | | 12,508 |
| Israel Chemicals Ltd. | | 3,103,700 | | | | 12,280 |
| OM Group, Inc. (a) | | 444,200 | | | | 12,722 |
| OMNOVA Solutions, Inc. (a) | | 1,746,088 | | | | 10,337 |
| PolyOne Corp. (a) | | 1,107,221 | | | | 9,832 |
| Spartech Corp. | | 368,100 | | | | 8,698 |
| | | | | | | 418,978 |
| Containers & Packaging – 1.2% | | | | | | |
| Owens Illinois, Inc. (a)(e) | | 7,848,700 | | | | 143,474 |
| Packaging Corp. of America | | 2,312,960 | | | | 51,995 |
| | | | | | | 195,469 |
| Metals & Mining – 1.4% | | | | | | |
| Agnico-Eagle Mines Ltd. (d) | | 44,200 | | | | 1,621 |
| Alcan, Inc. | | 1,644,160 | | | | 85,855 |
| Alcoa, Inc. | | 2,410,240 | | | | 81,418 |
See accompanying notes which are an integral part of the financial statements.
15 Semiannual Report
| Investments (Unaudited) continued | | | | | | |
| |
| |
| Common Stocks continued | | | | | | |
| | | Shares | | Value (Note 1) |
| | | | | (000s) |
| |
| MATERIALS – continued | | | | | | |
| Metals & Mining – continued | | | | | | |
| Newmont Mining Corp. | | 681,300 | | | | $ 39,761 |
| Oregon Steel Mills, Inc. (a) | | 426,243 | | | | 21,112 |
| | | | | | | 229,767 |
| |
| TOTAL MATERIALS | | | | | | 844,214 |
| |
| TELECOMMUNICATION SERVICES – 3.4% | | | | | | |
| Diversified Telecommunication Services – 2.2% | | | | | | |
| Alaska Communication Systems Group, Inc. (e) | | 3,374,500 | | | | 42,552 |
| AT&T, Inc. | | 2,441,900 | | | | 64,002 |
| BellSouth Corp. | | 2,219,200 | | | | 74,965 |
| Citizens Communications Co. | | 3,278,300 | | | | 43,536 |
| Iowa Telecommunication Services, Inc. (e) | | 2,135,143 | | | | 38,518 |
| NTELOS Holding Corp. (e) | | 869,800 | | | | 12,169 |
| Philippine Long Distance Telephone Co. sponsored ADR | | 466,100 | | | | 18,527 |
| Verizon Communications, Inc. | | 2,050,000 | | | | 67,712 |
| | | | | | | 361,981 |
| Wireless Telecommunication Services – 1.2% | | | | | | |
| ALLTEL Corp. | | 1,347,800 | | | | 86,758 |
| Dobson Communications Corp. Class A (a) | | 4,553,100 | | | | 40,978 |
| Sprint Nextel Corp. | | 3,041,500 | | | | 75,429 |
| | | | | | | 203,165 |
| |
| TOTAL TELECOMMUNICATION SERVICES | | | | | | 565,146 |
| |
| UTILITIES – 3.7% | | | | | | |
| Electric Utilities – 1.8% | | | | | | |
| Edison International | | 2,055,280 | | | | 83,054 |
| Entergy Corp. | | 848,060 | | | | 59,313 |
| Exelon Corp. | | 952,100 | | | | 51,413 |
| FPL Group, Inc. | | 1,261,600 | | | | 49,959 |
| PPL Corp. | | 2,016,000 | | | | 58,545 |
| | | | | | | 302,284 |
| Independent Power Producers & Energy Traders – 1.2% | | | | | | |
| AES Corp. (a) | | 2,502,500 | | | | 42,467 |
| Constellation Energy Group, Inc. | | 653,700 | | | | 35,901 |
| NRG Energy, Inc. (a) | | 1,263,800 | | | | 60,144 |
| TXU Corp. | | 1,175,800 | | | | 58,355 |
| | | | | | | 196,867 |
See accompanying notes which are an integral part of the financial statements.
| Common Stocks continued | | | | | | | | |
| | | | | Shares | | Value (Note 1) |
| | | | | | | (000s) |
| |
| UTILITIES – continued | | | | | | | | |
| Multi-Utilities – 0.7% | | | | | | | | |
| CMS Energy Corp. (a) | | | | 631,900 | | | | $ 8,417 |
| PG&E Corp. | | | | 1,657,400 | | | | 66,031 |
| Public Service Enterprise Group, Inc. | | | | 634,900 | | | | 39,808 |
| | | | | | | | | 114,256 |
| |
| TOTAL UTILITIES | | | | | | | | 613,407 |
| |
| TOTAL COMMON STOCKS | | | | | | | | |
| (Cost $12,769,285) | | | | | | 15,668,031 |
| |
| Preferred Stocks 0.5% | | | | | | | | |
| |
| Convertible Preferred Stocks 0.4% | | | | | | | | |
| |
| CONSUMER DISCRETIONARY – 0.2% | | | | | | | | |
| Automobiles – 0.2% | | | | | | | | |
| General Motors Corp. Series A, 4.50% | | | | 893,800 | | | | 21,094 |
| Hotels, Restaurants & Leisure 0.0% | | | | | | | | |
| Six Flags, Inc. 7.25% PIERS | | | | 114,200 | | | | 2,616 |
| |
| TOTAL CONSUMER DISCRETIONARY | | | | | | | | 23,710 |
| |
| MATERIALS 0.1% | | | | | | | | |
| Containers & Packaging – 0.1% | | | | | | | | |
| Owens Illinois, Inc. 4.75% | | | | 681,200 | | | | 23,672 |
| UTILITIES – 0.1% | | | | | | | | |
| Multi-Utilities – 0.1% | | | | | | | | |
| Dominion Resources, Inc. 8.75% | | | | 410,000 | | | | 21,078 |
| |
| TOTAL CONVERTIBLE PREFERRED STOCKS | | | | | | | | 68,460 |
| Nonconvertible Preferred Stocks 0.1% | | | | | | | | |
| |
| FINANCIALS – 0.1% | | | | | | | | |
| Thrifts & Mortgage Finance – 0.1% | | | | | | | | |
| Fannie Mae 7.00% | | | | 209,400 | | | | 11,391 |
| TOTAL PREFERRED STOCKS | | | | | | | | |
| (Cost $85,482) | | | | | | | | 79,851 |
See accompanying notes which are an integral part of the financial statements.
17 Semiannual Report
| Investments (Unaudited) continued | | | | | | | | | | |
| |
| |
| Nonconvertible Bonds 0.1% | | | | | | | | | | |
| | | | | | | Principal | | | | Value (Note 1) |
| | | | | | | Amount (000s) | | | | (000s) |
| |
| CONSUMER DISCRETIONARY – 0.0% | | | | | | | | | | | | |
| Leisure Equipment & Products – 0.0% | | | | | | | | | | | | |
| K2, Inc. 7.375% 7/1/14 | | | | | | $ 80 | | | | | | $ 80 |
| HEALTH CARE – 0.1% | | | | | | | | | | | | |
| Health Care Providers & Services – 0.1% | | | | | | | | | | | | |
| Tenet Healthcare Corp. 6.375% 12/1/11 | | | | | | 15,515 | | | | | | 14,390 |
| INFORMATION TECHNOLOGY – 0.0% | | | | | | | | | | | | |
| Electronic Equipment & Instruments – 0.0% | | | | | | | | | | | | |
| Celestica, Inc. 7.875% 7/1/11 | | | | | | 10,040 | | | | | | 10,266 |
| TOTAL NONCONVERTIBLE BONDS | | | | | | | | | | | | |
| (Cost $24,032) | | | | | | | | | | | | 24,736 |
| Money Market Funds 5.0% | | | | | | | | | | | | |
| | | | | | | Shares | | | | | | |
| Fidelity Cash Central Fund, 4.8% (b) | | | | | | 748,377,651 | | | | | | 748,378 |
| Fidelity Securities Lending Cash Central Fund, 4.83% (b)(c) | | | | | | 81,957,625 | | | | | | 81,958 |
| TOTAL MONEY MARKET FUNDS | | | | | | | | | | | | |
| (Cost $830,336) | | | | | | | | | | | | 830,336 |
| TOTAL INVESTMENT PORTFOLIO 100.7% | | | | | | | | | | | | |
| (Cost $13,709,135) | | | | | | | | | | | | 16,602,954 |
| |
| NET OTHER ASSETS – (0.7)% | | | | | | | | | | | | (119,564) |
| NET ASSETS 100% | | | | | | | | | | | | $ 16,483,390 |
| Security Type Abbreviation |
| PIERS | — | Preferred Income Equity |
| | Redeemable Securities |
Legend
(a) Non-income producing
(b) Affiliated fund that is available only to
investment companies and other accounts
managed by Fidelity Investments. The
rate quoted is the annualized seven day
yield of the fund at period end. A
complete unaudited listing of the fund’s
holdings as of its most recent quarter end
is available upon request.
|
(c) Investment made with cash collateral
received from securities on loan.
(d) Security or a portion of the security is on
loan at period end.
(e) Affiliated company
|
See accompanying notes which are an integral part of the financial statements.
Semiannual Report 18
Affiliated Central Funds
Information regarding fiscal year to date income earned by the fund from the affiliated Central funds is as follows:
| Fund | | Income earned |
| | | (Amounts in thousands) |
| Fidelity Cash Central Fund | | | | $ 17,711 |
| Fidelity Securities Lending Cash Central Fund | | | | 486 |
| Total | | | | $ 18,197 |
Other Affiliated Issuers
An affiliated company is a company in which the fund has ownership of at least 5% of the voting securities. Fiscal year to date transactions with companies which are or were affiliates are as follows:
| | | Value, | | Purchases | | | | Sales | | | | Dividend | | Value, end of |
| Affiliate | | beginning of | | | | | | Proceeds | | | | Income | | period |
| (Amounts in thousands) | | period | | | | | | | | | | | | |
| Alaska Communication | | | | | | | | | | | | | | |
| Systems Group, Inc. | | $ 7,897 | | $ 27,825 | | | | $ — | | | | $ 1,147 | | $ 42,552 |
| Albany International Corp. | | | | | | | | | | | | | | |
| Class A | | 61,599 | | — | | | | 28,432 | | | | 177 | | — |
| Dycom Industries, Inc. | | 77,183 | | 665 | | | | — | | | | — | | 85,583 |
| Iowa Telecommunication | | | | | | | | | | | | | | |
| Services, Inc. | | 35,230 | | — | | | | — | | | | 1,729 | | 38,518 |
| NTELOS Holding Corp. | | — | | 10,706 | | | | — | | | | — | | 12,169 |
| OMNOVA Solutions, Inc. | | 10,916 | | — | | | | 4,510 | | | | — | | — |
| Owens Illinois, Inc. | | 81,316 | | 64,087 | | | | — | | | | — | | 143,474 |
| Pier 1 Imports, Inc. | | 49,754 | | 2,963 | | | | — | | | | 482 | | 61,545 |
| Spartech Corp. | | 33,522 | | — | | | | 32,948 | | | | 301 | | — |
| Sports Authority, Inc. | | 44,332 | | — | | | | — | | | | — | | 59,174 |
| THQ, Inc. | | 97,923 | | — | | | | 55,953 | | | | — | | — |
| Varian, Inc. | | 74,827 | | 4,558 | | | | — | | | | — | | 92,706 |
| Total | | $ 574,499 | | $ 110,804 | | | | $ 121,843 | | | | $ 3,836 | | $ 535,721 |
Distribution of investments by country of issue, as a percentage of total net assets, is as follows:
| United States of America | | 90.0% |
| Cayman Islands | | 1.9% |
| Canada | | 1.7% |
| Others (individually less than 1%) . | | 6.4% |
| | | 100.0% |
See accompanying notes which are an integral part of the financial statements.
19 Semiannual Report
| Financial Statements | | | | | | |
| |
| Statement of Assets and Liabilities | | | | | | |
| Amounts in thousands (except per share amount) | | | | April 30, 2006 (Unaudited) |
| |
| Assets | | | | | | |
| Investment in securities, at value (including securities | | | | | | |
| loaned of $79,775) See accompanying schedule: | | | | | | |
| Unaffiliated issuers (cost $12,391,577) | | | | $ 15,236,897 | | |
| Affiliated Central Funds (cost $830,336) | | | | 830,336 | | |
| Other affiliated issuers (cost $487,222) | | | | 535,721 | | |
| Total Investments (cost $13,709,135) | | | | | | $ 16,602,954 |
| Receivable for investments sold | | | | | | 35,259 |
| Receivable for fund shares sold | | | | | | 28,249 |
| Dividends receivable | | | | | | 9,279 |
| Interest receivable | | | | | | 4,162 |
| Prepaid expenses | | | | | | 38 |
| Other affiliated receivables | | | | | | 94 |
| Other receivables | | | | | | 435 |
| Total assets | | | | | | 16,680,470 |
| |
| Liabilities | | | | | | |
| Payable for investments purchased | | | | $ 89,466 | | |
| Payable for fund shares redeemed | | | | 16,001 | | |
| Accrued management fee | | | | 6,435 | | |
| Other affiliated payables | | | | 2,886 | | |
| Other payables and accrued expenses | | | | 334 | | |
| Collateral on securities loaned, at value | | | | 81,958 | | |
| Total liabilities | | | | | | 197,080 |
| |
| Net Assets | | | | | | $ 16,483,390 |
| Net Assets consist of: | | | | | | |
| Paid in capital | | | | | | $ 12,652,424 |
| Undistributed net investment income | | | | | | 36,407 |
| Accumulated undistributed net realized gain (loss) on | | | | | | |
| investments and foreign currency transactions | | | | | | 900,738 |
| Net unrealized appreciation (depreciation) on | | | | | | |
| investments and assets and liabilities in foreign | | | | | | |
| currencies | | | | | | 2,893,821 |
| Net Assets, for 201,784 shares outstanding | | | | | | $ 16,483,390 |
| Net Asset Value, offering price and redemption price per | | | | | | |
| share ($16,483,390 ÷ 201,784 shares) | | | | | | $ 81.69 |
See accompanying notes which are an integral part of the financial statements.
Semiannual Report 20
| Statement of Operations | | | | | | |
| Amounts in thousands | | Six months ended April 30, 2006 (Unaudited) |
| |
| Investment Income | | | | | | |
| Dividends (including $3,836 received from other | | | | | | |
| affiliated issuers) | | | | | | $ 83,353 |
| Interest | | | | | | 1,052 |
| Income from affiliated Central Funds | | | | | | 18,197 |
| Total income | | | | | | 102,602 |
| |
| Expenses | | | | | | |
| Management fee | | | | | | |
| Basic fee | | | | $ 42,737 | | |
| Performance adjustment | | | | (6,577) | | |
| Transfer agent fees | | | | 14,026 | | |
| Accounting and security lending fees | | | | 728 | | |
| Independent trustees’ compensation | | | | 29 | | |
| Appreciation in deferred trustee compensation account | | | | 14 | | |
| Custodian fees and expenses | | | | 136 | | |
| Registration fees | | | | 345 | | |
| Audit | | | | 69 | | |
| Legal | | | | 53 | | |
| Miscellaneous | | | | 60 | | |
| Total expenses before reductions | | | | 51,620 | | |
| Expense reductions | | | | (1,044) | | 50,576 |
| |
| Net investment income (loss) | | | | | | 52,026 |
| Realized and Unrealized Gain (Loss) | | | | | | |
| Net realized gain (loss) on: | | | | | | |
| Investment securities: | | | | | | |
| Unaffiliated issuers | | | | 880,091 | | |
| Other affiliated issuers | | | | 20,793 | | |
| Foreign currency transactions | | | | (80) | | |
| Total net realized gain (loss) | | | | | | 900,804 |
| Change in net unrealized appreciation (depreciation) on: | | | | | | |
| Investment securities | | | | 1,184,191 | | |
| Assets and liabilities in foreign currencies | | | | 17 | | |
| Total change in net unrealized appreciation | | | | | | |
| (depreciation) | | | | | | 1,184,208 |
| Net gain (loss) | | | | | | 2,085,012 |
| Net increase (decrease) in net assets resulting from | | | | | | |
| operations | | | | | | $ 2,137,038 |
See accompanying notes which are an integral part of the financial statements.
21 Semiannual Report
| Financial Statements continued | | | | | | | | |
| |
| |
| Statement of Changes in Net Assets | | | | | | | | |
| | | | | Six months ended | | | | Year ended |
| | | | | April 30, 2006 | | | | October 31, |
| Amounts in thousands | | | | (Unaudited) | | | | 2005 |
| Increase (Decrease) in Net Assets | | | | | | | | |
| Operations | | | | | | | | |
| Net investment income (loss) | | | | $ 52,026 | | | | $ 66,115 |
| Net realized gain (loss) | | | | 900,804 | | | | 985,829 |
| Change in net unrealized appreciation (depreciation) . | | | | 1,184,208 | | | | 467,396 |
| Net increase (decrease) in net assets resulting | | | | | | | | |
| from operations | | | | 2,137,038 | | | | 1,519,340 |
| Distributions to shareholders from net investment income . | | | | (74,656) | | | | (21,476) |
| Distributions to shareholders from net realized gain | | | | (892,814) | | | | (497,964) |
| Total distributions | | | | (967,470) | | | | (519,440) |
| Share transactions | | | | | | | | |
| Proceeds from sales of shares | | | | 2,925,932 | | | | 4,888,658 |
| Reinvestment of distributions | | | | 938,673 | | | | 502,873 |
| Cost of shares redeemed | | | | (1,590,939) | | | | (2,253,711) |
| Net increase (decrease) in net assets resulting from | | | | | | | | |
| share transactions | | | | 2,273,666 | | | | 3,137,820 |
| Total increase (decrease) in net assets | | | | 3,443,234 | | | | 4,137,720 |
| |
| Net Assets | | | | | | | | |
| Beginning of period | | | | 13,040,156 | | | | 8,902,436 |
| End of period (including undistributed net investment | | | | | | | | |
| income of $36,407 and undistributed net investment | | | | | | | | |
| income of $63,523, respectively) | | | | $ 16,483,390 | | | | $ 13,040,156 |
| |
| Other Information | | | | | | | | |
| Shares | | | | | | | | |
| Sold | | | | 37,061 | | | | 66,494 |
| Issued in reinvestment of distributions | | | | 12,395 | | | | 7,187 |
| Redeemed | | | | (20,137) | | | | (30,784) |
| Net increase (decrease) | | | | 29,319 | | | | 42,897 |
See accompanying notes which are an integral part of the financial statements.
| Financial Highlights | | | | | | | | | | | | | | | | | | |
| | | Six months ended | | | | | | | | | | | | | | | | | | |
| | | April 30, 2006 | | Years ended October 31, |
| | | (Unaudited) | | 2005 | | | | 2004 | | | | 2003 | | | | 2002 | | | | 2001 |
| Selected Per Share Data | | | | | | | | | | | | | | | | | | | | |
| Net asset value, | | | | | | | | | | | | | | | | | | | | |
| beginning of | | | | | | | | | | | | | | | | | | | | |
| period | | $ 75.61 | | $ 68.71 | | | | $ 57.91 | | | | $ 44.71 | | | | $ 46.64 | | | | $ 42.79 |
| Income from | | | | | | | | | | | | | | | | | | | | |
| Investment | | | | | | | | | | | | | | | | | | | | |
| Operations | | | | | | | | | | | | | | | | | | | | |
| Net investment | | | | | | | | | | | | | | | | | | | | |
| income (loss)D | | .27 | | .43 | | | | .24 | | | | .33 | | | | .52F | | | | .63 |
| Net realized and | | | | | | | | | | | | | | | | | | | | |
| unrealized gain | | | | | | | | | | | | | | | | | | | | |
| (loss) | | 11.38 | | 10.34 | | | | 10.84 | | | | 13.23 | | | | (1.94)F | | | | 4.17 |
| Total from invest | | | | | | | | | | | | | | | | | | | | |
| ment operations | | 11.65 | | 10.77 | | | | 11.08 | | | | 13.56 | | | | (1.42) | | | | 4.80 |
| Distributions from net | | | | | | | | | | | | | | | | | | | | |
| investment income | | (.43) | | (.16) | | | | (.23) | | | | (.36) | | | | (.51) | | | | (.95) |
| Distributions from net | | | | | | | | | | | | | | | | | | | | |
| realized gain | | (5.14) | | (3.71) | | | | (.05) | | | | — | | | | — | | | | — |
| Total distributions . | | (5.57) | | (3.87) | | | | (.28) | | | | (.36) | | | | (.51) | | | | (.95) |
| Net asset value, | | | | | | | | | | | | | | | | | | | | |
| end of period | | $ 81.69 | | $ 75.61 | | | | $ 68.71 | | | | $ 57.91 | | | | $ 44.71 | | | | $ 46.64 |
| |
| Total ReturnB,C | | 15.99% | | 16.13% | | | | 19.21% | | | | 30.52% | | | | (3.18)% | | | | 11.37% |
| Ratios to Average Net AssetsE | | | | | | | | | | | | | | | | | | | | |
| Expenses before | | | | | | | | | | | | | | | | | | | | |
| reductions | | .69%A | | .73% | | | | .95% | | | | 1.00% | | | | .97% | | | | .81% |
| Expenses net of fee | | | | | | | | | | | | | | | | | | | | |
| waivers, if any | | .69%A | | .73% | | | | .95% | | | | 1.00% | | | | .97% | | | | .81% |
| Expenses net of all | | | | | | | | | | | | | | | | | | | | |
| reductions | | .67%A | | .72% | | | | .93% | | | | .98% | | | | .95% | | | | .77% |
| Net investment | | | | | | | | | | | | | | | | | | | | |
| income (loss) | | .69%A | | .58% | | | | .37% | | | | .66% | | | | 1.02%F | | | | 1.29% |
| Supplemental Data | | | | | | | | | | | | | | | | | | | | |
| Net assets, | | | | | | | | | | | | | | | | | | | | |
| end of period | | | | | | | | | | | | | | | | | | | | |
| (in millions) | | $16,483 | | $13,040 | | | | $ 8,902 | | | | $ 6,328 | | | | $ 4,984 | | | | $ 4,567 |
| Portfolio turnover | | | | | | | | | | | | | | | | | | | | |
| rate | | 38%A | | 29% | | | | 40% | | | | 40% | | | | 42% | | | | 49% |
A Annualized
B Total returns for periods of less than one year are not annualized.
C Total returns would have been lower had certain expenses not been reduced during the periods shown.
D Calculated based on average shares outstanding during the period.
E Expense ratios reflect operating expenses of the fund. Expenses before reductions do not reflect amounts reimbursed by the investment adviser or reduc
tions from brokerage service arrangements or expense offset arrangements and do not represent the amount paid by the fund during periods when
reimbursements or reductions occur. Expenses net of fee waivers reflect expenses after reimbursement by the investment adviser but prior to reductions
from brokerage service arrangements or other expense offset arrangements. Expenses net of all reductions represent the net expenses paid by the fund.
F Effective November 1, 2001, the fund adopted the provisions of the AICPA Audit and Accounting Guide for Investment Companies and began amortizing
premium and discount on all debt securities. Per share data and ratios for periods prior to adoption have not been restated to reflect this change.
|
See accompanying notes which are an integral part of the financial statements.
23 Semiannual Report
Notes to Financial Statements
For the period ended April 30, 2006 (Unaudited)
(Amounts in thousands except ratios)
1. Significant Accounting Policies.
Fidelity Value Fund (the fund) is a fund of Fidelity Capital Trust (the trust) and is authorized to issue an unlimited number of shares. The trust is registered under the Investment Company Act of 1940, as amended (the 1940 Act), as an open end manage ment investment company organized as a Massachusetts business trust. The fund may invest in affiliated money market central funds (Money Market Central Funds), which are open end investment companies available to investment companies and other accounts managed by Fidelity Management & Research Company (FMR) and its affili ates. The financial statements have been prepared in conformity with accounting principles generally accepted in the United States of America, which require manage ment to make certain estimates and assumptions at the date of the financial statements. The following summarizes the significant accounting policies of the fund:
Security Valuation. Investments are valued and net asset value (NAV) per share is calculated (NAV calculation) as of the close of business of the New York Stock Exchange (NYSE), normally 4:00 p.m. Eastern time. Wherever possible, the fund uses independent pricing services approved by the Board of Trustees to value its investments.
Equity securities, including restricted securities, for which market quotations are readily available, are valued at the last reported sale price or official closing price as reported by an independent pricing service on the primary market or exchange on which they are traded. In the event there were no sales during the day or closing prices are not available, securities are valued at the last quoted bid price. Debt securities, including restricted securities, for which quotations are readily available, are valued by independent pricing services or by dealers who make markets in such securities. Pricing services consider yield or price of bonds of comparable quality, coupon, maturity and type as well as dealer supplied prices. Investments in open end mutual funds, are valued at their closing net asset value each business day. Short term securities with remaining maturities of sixty days or less for which quotations are not readily available are valued at amortized cost, which approximates value.
When current market prices or quotations are not readily available or do not accurately reflect fair value, valuations may be determined in accordance with procedures adopted by the Board of Trustees. For example, when developments occur between the close of a market and the close of the NYSE that may materially affect the value of some or all of the securities, or when trading in a security is halted, those securities may be fair valued. Factors used in the determination of fair value may include monitoring news to identify significant market or security specific events such as changes in the value of U.S. securi ties markets, reviewing developments in foreign markets and evaluating the perfor mance of ADRs, futures contracts and exchange traded funds. Because the fund’s utilization of fair value pricing depends on market activity, the frequency with which fair
| 1. Significant Accounting Policies continued |
Security Valuation continued | | |
value pricing is used can not be predicted and may be utilized to a significant extent. The value of securities used for NAV calculation under fair value pricing may differ from published prices for the same securities.
Foreign Currency. The fund uses foreign currency contracts to facilitate transactions in foreign denominated securities. Losses from these transactions may arise from changes in the value of the foreign currency or if the counterparties do not perform under the contracts’ terms.
Foreign denominated assets, including investment securities, and liabilities are translated into U.S. dollars at the exchange rate at period end. Purchases and sales of investment securities, income and dividends received and expenses denominated in foreign currencies are translated into U.S. dollars at the exchange rate in effect on the transaction date.
The effects of exchange rate fluctuations on investments are included with the net realized and unrealized gain (loss) on investment securities. Other foreign currency transactions resulting in realized and unrealized gain (loss) are disclosed separately.
Investment Transactions and Income. Security transactions are accounted for as of trade date. Gains and losses on securities sold are determined on the basis of identified cost and may include proceeds received from litigation. Dividend income is recorded on the ex dividend date, except for certain dividends from foreign securities where the ex dividend date may have passed, which are recorded as soon as the fund is informed of the ex dividend date. Non cash dividends included in dividend income, if any, are recorded at the fair market value of the securities received. Distributions received on securities that represent a return of capital or capital gain are recorded as a reduction of cost of invest ments and/or as a realized gain. The fund estimates the components of distributions received that may be considered return of capital distributions or capital gain distributions. Interest income is accrued as earned. Interest income includes coupon interest and amortization of premium and accretion of discount on debt securities. Investment income is recorded net of foreign taxes withheld where recovery of such taxes is uncertain.
Expenses. Most expenses of the trust can be directly attributed to a fund. Expenses which cannot be directly attributed are apportioned among each fund in the trust.
Deferred Trustee Compensation. Under a Deferred Compensation Plan (the Plan), independent Trustees must defer receipt of a portion of, and may elect to defer receipt of an additional portion of, their annual compensation. Deferred amounts are treated as though equivalent dollar amounts had been invested in shares of the fund or are invested in a cross section of other Fidelity funds, and are marked to market. Deferred amounts remain in the fund until distributed in accordance with the Plan.
25 Semiannual Report
| Notes to Financial Statements (Unaudited) continued |
| (Amounts in thousands except ratios) |
| |
| 1. Significant Accounting Policies continued |
Income Tax Information and Distributions to Shareholders. Each year, the fund intends to qualify as a regulated investment company by distributing all of its taxable income and realized gains under Subchapter M of the Internal Revenue Code. As a result, no provision for income taxes is required in the accompanying financial statements. Foreign taxes are provided for based on the fund’s understanding of the tax rules and rates that exist in the foreign markets in which it invests.
Distributions are recorded on the ex dividend date. Income and capital gain distribu tions are determined in accordance with income tax regulations, which may differ from generally accepted accounting principles. In addition, the fund claimed a portion of the payment made to redeeming shareholders as a distribution for income tax purposes.
Capital accounts within the financial statements are adjusted for permanent book tax differences. These adjustments have no impact on net assets or the results of operations. Temporary book tax differences will reverse in a subsequent period.
Book tax differences are primarily due to foreign currency transactions, market discount, deferred trustees compensation, and losses deferred due to wash sales.
The federal tax cost of investments and unrealized appreciation (depreciation) as of period end were as follows:
| Unrealized appreciation | | | | $ 3,352,517 |
| Unrealized depreciation | | | | (458,554) |
| Net unrealized appreciation (depreciation) | | | | $ 2,893,963 |
| Cost for federal income tax purposes | | | | $ 13,708,991 |
| |
| 2. Operating Policies. | | | | |
Repurchase Agreements. FMR has received an Exemptive Order from the Securities and Exchange Commission (the SEC) which permits the fund and other affiliated entities of FMR to transfer uninvested cash balances into joint trading accounts which are then invested in repurchase agreements. The fund may also invest directly with institutions in repurchase agreements. Repurchase agreements are collateralized by government or non government securities. Upon settlement date, collateral is held in segregated accounts with custodian banks and may be obtained in the event of a default of the counterparty. The fund monitors, on a daily basis, the value of the collateral to ensure it is at least equal to the principal amount of the repurchase agreement (including accrued interest). In the event of a default by the counterparty, realization of the collateral proceeds could be delayed, during which time the value of the collateral may decline.
3. Purchases and Sales of Investments.
Purchases and sales of securities, other than short term securities, aggregated $3,962,849 and $2,679,675, respectively.
4. Fees and Other Transactions with Affiliates.
Management Fee. FMR and its affiliates provide the fund with investment manage ment related services for which the fund pays a monthly management fee. The manage ment fee is the sum of an individual fund fee rate that is based on an annual rate of .30% of the fund’s average net assets and a group fee rate that averaged .27% during the period. The group fee rate is based upon the average net assets of all the mutual funds advised by FMR. The group fee rate decreases as assets under management increase and increases as assets under management decrease. In addition, the management fee is subject to a performance adjustment (up to a maximum of .20% of the fund’s average net assets over a 36 month performance period). The upward or downward adjustment to the management fee is based on the fund’s relative investment performance as compared to an appropriate benchmark index. For the period, the total annualized management fee rate, including the performance adjustment, was .48% of the fund’s average net assets.
Transfer Agent Fees. Fidelity Service Company, Inc. (FSC), an affiliate of FMR, is the fund’s transfer, dividend disbursing and shareholder servicing agent. FSC receives account fees and asset based fees that vary according to account size and type of account. FSC pays for typesetting, printing and mailing of shareholder reports, except proxy statements. For the period, the transfer agent fees were equivalent to an annual ized rate of .19% of average net assets.
Accounting and Security Lending Fees. FSC maintains the fund’s accounting records. The accounting fee is based on the level of average net assets for the month. Under a separate contract, FSC administers the security lending program. The security lending fee is based on the number and duration of lending transactions.
Affiliated Central Funds. The fund may invest in Money Market Central Funds which seek preservation of capital and current income and are managed by Fidelity Investments Money Management, Inc. (FIMM), an affiliate of FMR.
The Money Market Central Funds do not pay a management fee.
Brokerage Commissions. The fund placed a portion of its portfolio transactions with brokerage firms which are affiliates of the investment adviser. The commissions paid to these affiliated firms were $41 for the period.
27 Semiannual Report
| Notes to Financial Statements (Unaudited) continued |
| (Amounts in thousands except ratios) | | |
| |
| 5. Committed Line of Credit. | | |
The fund participates with other funds managed by FMR in a $4.2 billion credit facility (the “line of credit”) to be utilized for temporary or emergency purposes to fund share holder redemptions or for other short term liquidity purposes. The fund has agreed to pay commitment fees on its pro rata portion of the line of credit, which amounts to $22 and is reflected in Miscellaneous Expense on the Statement of Operations. During the period, there were no borrowings on this line of credit.
The fund lends portfolio securities from time to time in order to earn additional income. On the settlement date of the loan, the fund receives collateral (in the form of U.S. Treasury obligations, letters of credit and/or cash) against the loaned securities and maintains collateral in an amount not less than 100% of the market value of the loaned securities during the period of the loan. The market value of the loaned securities is determined at the close of business of the fund and any additional required collateral is delivered to the fund on the next business day. If the borrower defaults on its obligation to return the securities loaned because of insolvency or other reasons, a fund could experience delays and costs in recovering the securities loaned or in gaining access to the collateral. Any cash collateral received is invested in the Fidelity Securities Lending Cash Central Fund. The value of loaned securities and cash collateral at period end are disclosed on the fund’s Statement of Assets and Liabilities. Security lending income represents the income earned on investing cash collateral, less fees and expenses associated with the loan, plus any premium payments that may be received on the loan of certain types of securities. Security lending income is presented in the Statement of Operations as a component of income from affiliated central funds. Net income from lending portfolio securities during the period amounted to $486.
Many of the brokers with whom FMR places trades on behalf of the fund provided services to the fund in addition to trade execution. These services included payments of certain expenses on behalf of the fund totaling $818 for the period. In addition, through arrangements with the fund’s custodian and transfer agent, credits realized as a result of uninvested cash balances were used to reduce the fund’s expenses. During the period, these credits reduced the fund’s custody and transfer agent expenses by $17 and $209, respectively.
The fund’s organizational documents provide former and current trustees and officers with a limited indemnification against liabilities arising in connection with the performance of their duties to the fund. In the normal course of business, the fund may also enter into contracts that provide general indemnifications. The fund’s maximum exposure under these arrangements is unknown as this would be dependent on future claims that may be made against the fund. The risk of material loss from such claims is considered remote.
29 Semiannual Report
Board Approval of Investment Advisory Contracts and Management Fees
Fidelity Value Fund
On January 19, 2006, the Board of Trustees, including the Independent Trustees (together, the Board), voted to approve a general research services agreement (the Agreement) between FMR, FMR Co., Inc. (FMRC), Fidelity Investments Money Manage ment, Inc. (FIMM), and Fidelity Research & Analysis Company (FRAC) (together, the Investment Advisers) for the fund, effective January 20, 2006, pursuant to which FRAC may provide general research and investment advisory support services to FMRC and FIMM. The Board considered that it has approved previously various sub advisory agreements for the fund with affiliates of FMR that allow FMR to obtain research, non discretionary advice, or discretionary portfolio management at no additional expense to the fund. The Board, assisted by the advice of fund counsel and independent Trustees’ counsel, considered a broad range of information and determined that it would be beneficial for the fund to access the research and investment advisory support services supplied by FRAC at no additional expense to the fund.
The Board reached this determination in part because the new arrangement will involve no changes in (i) the contractual terms of and fees payable under the fund’s manage ment contract or sub advisory agreements; (ii) the investment process or strategies employed in the management of the fund’s assets; (iii) the nature or level of services provided under the fund’s management contract or sub advisory agreements; (iv) the day to day management of the fund or the persons primarily responsible for such man agement; or (v) the ultimate control or beneficial ownership of FMR, FMRC, or FIMM. The Board also considered that the establishment of the Agreement would not necessi tate prior shareholder approval of the Agreement or result in an assignment and termination of the fund’s management contract or sub advisory agreements under the Investment Company Act of 1940.
Because the Board was approving an arrangement with FRAC under which the fund will not bear any additional management fees or expenses and under which the fund’s portfolio manager would not change, it did not consider the fund’s investment perfor mance, competitiveness of management fee and total expenses, costs of services and profitability, or economies of scale to be significant factors in its decision.
In connection with its future renewal of the fund’s management contract and sub advisory agreements, the Board will consider: (i) the nature, extent, and quality of services provided to the fund, including shareholder and administrative services and investment performance; (ii) the competitiveness of the fund’s management fee and total expenses; (iii) the costs of the services and profitability, including the revenues earned and the expenses incurred by Fidelity in conducting the business of developing, marketing, distributing, managing, administering, and servicing the fund and its shareholders; and (iv) whether there have been economies of scale in respect of the management of the Fidelity funds, whether the Fidelity funds (including the fund) have
appropriately benefited from any such economies of scale, and whether there is potential for realization of any further economies.
Based on its evaluation of all of the conclusions noted above, and after considering all material factors, the Board ultimately concluded that the fund’s Agreement is fair and reasonable, and that the fund’s Agreement should be approved.
31 Semiannual Report
| | Investment Adviser
Fidelity Management & Research Company
Boston, MA
Investment Sub Advisers
FMR Co., Inc.
Fidelity Management & Research
(U.K.) Inc.
Fidelity Research & Analysis Company
(formerly Fidelity Management &
Research (Far East) Inc.)
Fidelity Investments Japan Limited
Fidelity International Investment Advisors
Fidelity International Investment Advisors
(U.K.) Limited
General Distributor
Fidelity Distributors Corporation
Boston, MA
Transfer and Service Agent
Fidelity Service Company, Inc.
Boston, MA
Custodian
Mellon Bank, N.A.
Pittsburgh, PA
|
| The Fidelity Telephone Connection |
| Mutual Fund 24-Hour Service |
| Exchanges/Redemptions | | |
| and Account Assistance | | 1-800-544-6666 |
| Product Information | | 1-800-544-6666 |
| Retirement Accounts | | 1-800-544-4774 |
| (8 a.m. - 9 p.m.) | | |
| TDD Service | | 1-800-544-0118 |
| for the deaf and hearing impaired | | |
| (9 a.m. - 9 p.m. Eastern time) | | |
| Fidelity Automated Service | | |
| Telephone (FAST®) (automated phone logo) | | 1-800-544-5555 |
| (automated phone logo) Automated line for quickest service |
VAL-USAN-0606
1.784919.103
|

Item 2. Code of Ethics
Not applicable.
Item 3. Audit Committee Financial Expert
Not applicable.
Item 4. Principal Accountant Fees and Services
Not applicable.
Item 5. Audit Committee of Listed Registrants
Not applicable.
Item 6. Schedule of Investments
Not applicable.
Item 7. Disclosure of Proxy Voting Policies and Procedures for Closed-End Management Investment Companies
Not applicable.
Item 8. Portfolio Managers of Closed-End Management Investment Companies
Not applicable.
Item 9. Purchase of Equity Securities by Closed-End Management Investment Company and Affiliated Purchasers
Not applicable.
Item 10. Submission of Matters to a Vote of Security Holders
There were no material changes to the procedures by which shareholders may recommend nominees to the Fidelity Capital Trust's Board of Trustees.
Item 11. Controls and Procedures
(a)(i) The President and Treasurer and the Chief Financial Officer have concluded that the Fidelity Capital Trust's (the "Trust") disclosure controls and procedures (as defined in Rule 30a-3(c) under the Investment Company Act) provide reasonable assurances that material information relating to the Trust is made known to them by the appropriate persons, based on their evaluation of these controls and procedures as of a date within 90 days of the filing date of this report.
(a)(ii) There was no change in the Trust's internal control over financial reporting (as defined in Rule 30a-3(d) under the Investment Company Act) that occurred during the second fiscal quarter of the period covered by this report that has materially affected, or is reasonably likely to materially affect, the Trust's internal control over financial reporting.
Item 12. Exhibits
(a) | (1) | Not applicable. |
(a) | (2) | Certification pursuant to Rule 30a-2(a) under the Investment Company Act of 1940 (17 CFR 270.30a-2(a)) is filed and attached hereto as Exhibit 99.CERT. |
(a) | (3) | Not applicable. |
(b) | | Certification pursuant to Rule 30a-2(b) under the Investment Company Act of 1940 (17 CFR 270.30a-2(b)) is furnished and attached hereto as Exhibit 99.906CERT. |
SIGNATURES
Pursuant to the requirements of the Securities Exchange Act of 1934 and the Investment Company Act of 1940, the registrant has duly caused this report to be signed on its behalf by the undersigned, thereunto duly authorized.
Fidelity Capital Trust
By: | /s/Christine Reynolds |
| Christine Reynolds |
| President and Treasurer |
| |
Date: | |
Pursuant to the requirements of the Securities Exchange Act of 1934 and the Investment Company Act of 1940, this report has been signed below by the following persons on behalf of the registrant and in the capacities and on the dates indicated.
By: | /s/Christine Reynolds |
| Christine Reynolds |
| President and Treasurer |
| |
Date: | |
By: | /s/Paul M. Murphy |
| Paul M. Murphy |
| Chief Financial Officer |
| |
Date: | |