UNITED STATES
SECURITIES AND EXCHANGE COMMISSION
Washington, D.C. 20549
FORM N-CSR
CERTIFIED SHAREHOLDER REPORT OF REGISTERED
MANAGEMENT INVESTMENT COMPANIES
Investment Company Act file number 811-02841
Fidelity Capital Trust
(Exact name of registrant as specified in charter)
245 Summer St., Boston, Massachusetts 02210
(Address of principal executive offices) (Zip code)
Cynthia Lo Bessette, Secretary
245 Summer St.
Boston, Massachusetts 02210
(Name and address of agent for service)
Registrant's telephone number, including area code:
617-563-7000
| |
Date of fiscal year end: | October 31 |
|
|
Date of reporting period: | October 31, 2022 |
Item 1.
Reports to Stockholders
Fidelity® Stock Selector Small Cap Fund
Annual Report
October 31, 2022
Includes Fidelity and Fidelity Advisor share classes
Contents
To view a fund's proxy voting guidelines and proxy voting record for the 12-month period ended June 30, visit http://www.fidelity.com/proxyvotingresults or visit the Securities and Exchange Commission's (SEC) web site at http://www.sec.gov.
You may also call 1-800-544-8544 if you're an individual investing directly with Fidelity, call 1-800-835-5092 if you're a plan sponsor or participant with Fidelity as your recordkeeper or call 1-877-208-0098 on institutional accounts or if you're an advisor or invest through one to request a free copy of the proxy voting guidelines.
Standard & Poor's, S&P and S&P 500 are registered service marks of The McGraw-Hill Companies, Inc. and have been licensed for use by Fidelity Distributors Corporation.
Other third-party marks appearing herein are the property of their respective owners.
All other marks appearing herein are registered or unregistered trademarks or service marks of FMR LLC or an affiliated company. © 2022 FMR LLC. All rights reserved.
This report and the financial statements contained herein are submitted for the general information of the shareholders of the Fund. This report is not authorized for distribution to prospective investors in the Fund unless preceded or accompanied by an effective prospectus.
A fund files its complete schedule of portfolio holdings with the SEC for the first and third quarters of each fiscal year on Form N-PORT. Forms N-PORT are available on the SEC's web site at http://www.sec.gov. A fund's Forms N-PORT may be reviewed and copied at the SEC's Public Reference Room in Washington, DC. Information regarding the operation of the SEC's Public Reference Room may be obtained by calling 1-800-SEC-0330.
For a complete list of a fund's portfolio holdings, view the most recent holdings listing, semiannual report, or annual report on Fidelity's web site at http://www.fidelity.com, http://www.institutional.fidelity.com, or http://www.401k.com, as applicable.
NOT FDIC INSURED •MAY LOSE VALUE •NO BANK GUARANTEE
Neither the Fund nor Fidelity Distributors Corporation is a bank.
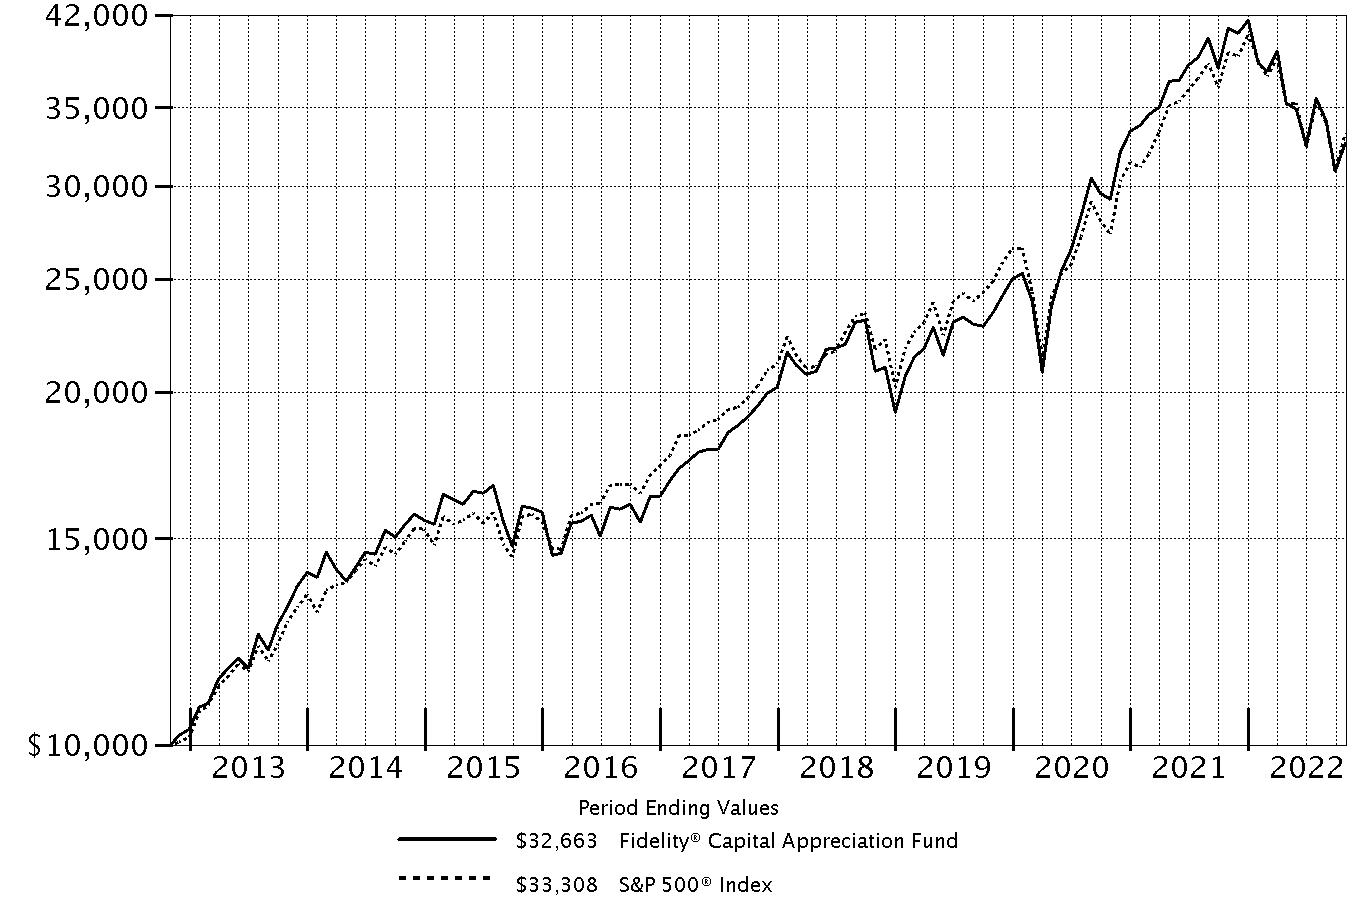
Average annual total return reflects the change in the value of an investment, assuming reinvestment of distributions from dividend income and capital gains (the profits earned upon the sale of securities that have grown in value, if any) and assuming a constant rate of performance each year. The hypothetical investment and the average annual total returns do not reflect the deduction of taxes that a shareholder would pay on fund distributions or the redemption of fund shares. During periods of reimbursement by Fidelity, a fund's total return will be greater than it would be had the reimbursement not occurred. How a fund did yesterday is no guarantee of how it will do tomorrow.
| Average Annual Total Returns |
| | | | |
Periods ended October 31, 2022 | Past 1 year | Past 5 years | Past 10 years |
| Class A (incl.5.75% sales charge) | -21.71% | 7.36% | 9.96% |
| Class M (incl.3.50% sales charge) | -20.09% | 7.54% | 9.87% |
Class C (incl. contingent deferred sales charge) | -18.34% | 7.77% | 9.90% |
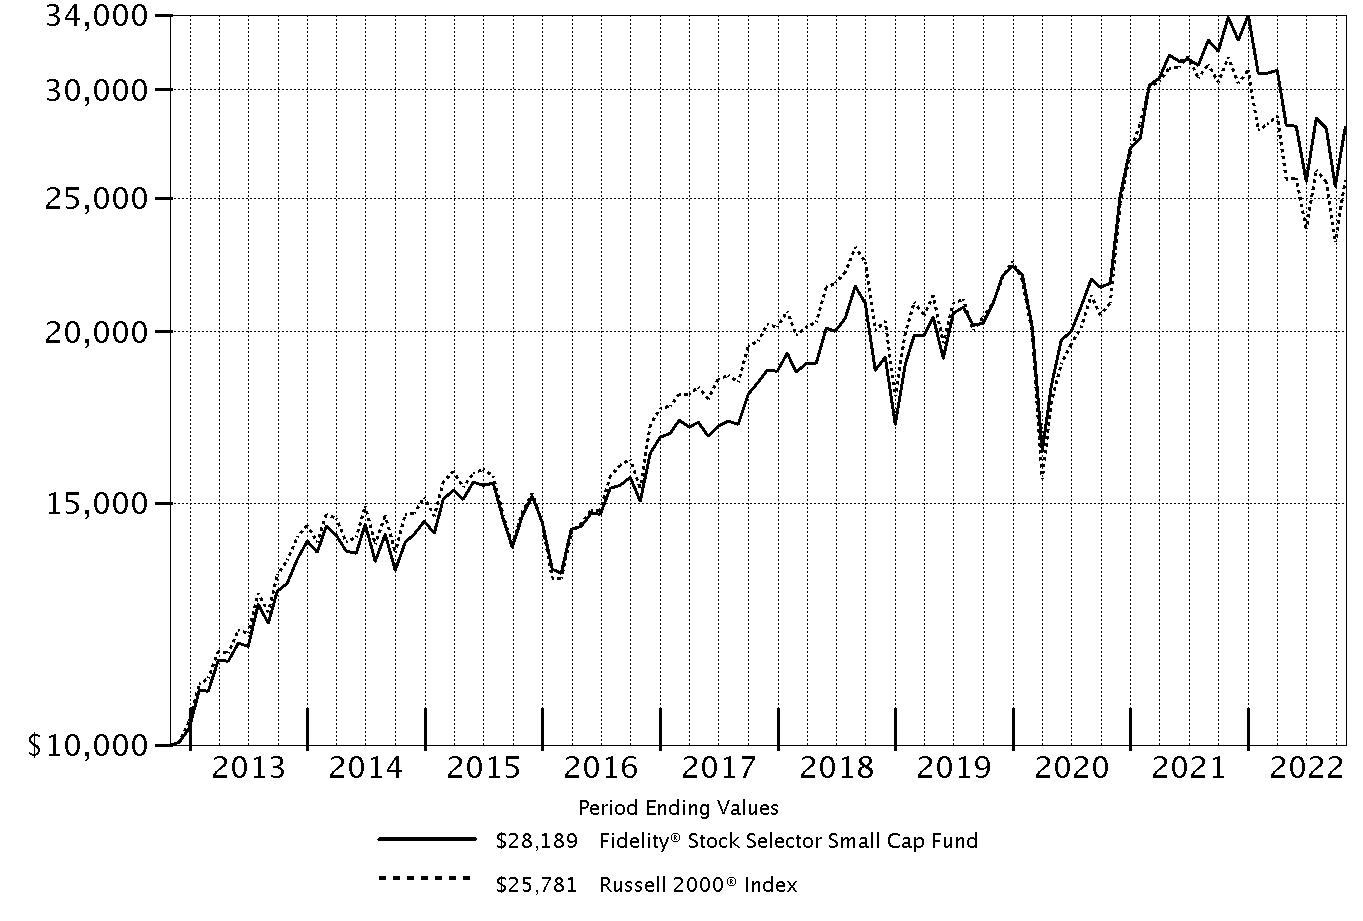
| Fidelity® Stock Selector Small Cap Fund | -16.73% | 8.95% | 10.92% |
| Class I | -16.72% | 8.94% | 10.92% |
| Class Z | -16.62% | 9.09% | 11.01% |
Class C shares' contingent deferred sales charges included in the past one year, past five years and past ten years total return figures are 1%, 0% and 0%, respectively.
The initial offering of Class Z shares took place on February 1, 2017. Returns prior to February 1, 2017, are those of Class I.
| $10,000 Over 10 Years |
| |
Let's say hypothetically that $10,000 was invested in Fidelity® Stock Selector Small Cap Fund, a class of the fund, on October 31, 2012. The chart shows how the value of your investment would have changed, and also shows how the Russell 2000® Index performed over the same period. |
|
|
Market Recap:
U.S. equities returned -14.61% for the 12 months ending October 31, 2022, according to the S&P 500 ® index, as a multitude of risk factors challenged the global economy and financial markets. Persistently high inflation prompted the Federal Reserve to aggressively tighten monetary policy, and market interest rates eclipsed their highest level in roughly a decade, stoking recession fears and sending stocks into bear market territory. In late 2021, the Fed shifted to a more "hawkish" (restrictive) policy stance and proceeded to hike its benchmark rate five times, by a total of 3%, between March and September - the fastest-ever pace of monetary tightening - while taking substantive steps to shrink its massive asset portfolio. Against this hostile backdrop for risk assets, the S&P 500 ® posted its worst year-to-date result (-23.87%) in 20 years through September, a seasonally weak month for stocks that stayed true to form, and then some, with volatility spiking due to growing certainty the Fed would persist in its effort to cool inflation, even at the expense of economic growth. Three of the index's worst monthly returns ever were recorded this period, with the S&P 500 shedding 8% to 9% in April, June and September. Gains of similar proportion were made in July and October, amid optimism on inflation and policy easing. For the full 12 months, the growth-oriented communication services (-41%) and consumer discretionary (-29%) sectors lagged most. In sharp contrast, energy (+65%) had a strong run, followed by consumer staples (+5%).
Comments from Co-Lead Managers Morgen Peck and Shadman Riaz:
For the fiscal year ending October 31, 2022, the fund's share classes (excluding sales charges, if applicable) returned about -18% to -17%, outpacing the -18.54% result of the benchmark Russell 2000 ® Index. Versus the benchmark, stock selection was the primary contributor, led by the consumer discretionary sector, particularly the retailing area. Security selection in industrials and an overweighting in energy also bolstered the fund's relative result. The fund's largest individual relative contributor was an outsized stake in Antero Resources, which gained 82% the past year and was the portfolio's largest holding. The fund's non-benchmark stake in HF Sinclair, another one of our biggest holdings at period end, gained roughly 75%. Another notable relative contributor was an overweighting in EXL Service (+48%), also among our largest holdings. In contrast, the largest detractor from performance versus the benchmark was stock selection in the financials sector, particularly within the banks category. Also hampering the fund's relative result was an underweighting in utilities and an overweighting in consumer discretionary. The fund's biggest individual relative detractor was an outsized stake in Crocs, which returned -56% the past 12 months. Also hurting performance was an overweighting in SiTime, which returned about -66%. We decreased our position the past year. Our overweighting in Figs, which returned approximately -72%, further detracted. This was a position we established the past 12 months. Notable changes in positioning include a higher allocation to the energy and materials sectors.
Note to Shareholders: On November 16, 2021, Jennifer Fo Cardillo assumed co-management responsibilities for the fund. Shadman Riaz transitioned from co-manager to co-lead manager, joining Morgen Peck.
The views expressed above reflect those of the portfolio manager(s) only through the end of the period as stated on the cover of this report and do not necessarily represent the views of Fidelity or any other person in the Fidelity organization. Any such views are subject to change at any time based upon market or other conditions and Fidelity disclaims any responsibility to update such views. These views may not be relied on as investment advice and, because investment decisions for a Fidelity fund are based on numerous factors, may not be relied on as an indication of trading intent on behalf of any Fidelity fund.
Top Holdings (% of Fund's net assets) |
| |
| Antero Resources Corp. | 1.7 | |
| ExlService Holdings, Inc. | 1.7 | |
| Denbury, Inc. | 1.6 | |
| HF Sinclair Corp. | 1.5 | |
| Commercial Metals Co. | 1.5 | |
| Northern Oil & Gas, Inc. | 1.4 | |
| Atkore, Inc. | 1.3 | |
| Murphy U.S.A., Inc. | 1.3 | |
| SPX Technologies, Inc. | 1.2 | |
| Academy Sports & Outdoors, Inc. | 1.2 | |
| | 14.4 | |
| |
| Market Sectors (% of Fund's net assets) |
| |
| Industrials | 16.8 | |
| Financials | 15.2 | |
| Health Care | 14.9 | |
| Information Technology | 11.9 | |
| Consumer Discretionary | 11.8 | |
| Energy | 8.7 | |
| Materials | 5.6 | |
| Real Estate | 5.3 | |
| Consumer Staples | 4.1 | |
| Utilities | 2.1 | |
| Communication Services | 1.8 | |
| |
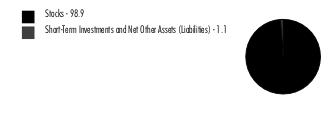
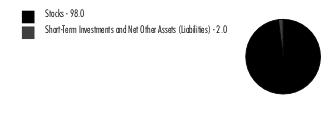
Asset Allocation (% of Fund's net assets) |
|
Foreign investments - 11.9% |
|
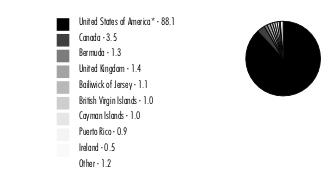
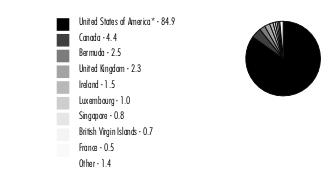
Geographic Diversification (% of Fund's net assets) |
|
* Includes Short-Term investments and Net Other Assets (Liabilities). Percentages are based on country or territory of incorporation and are adjusted for the effect of futures contracts, if applicable. |
| |
Showing Percentage of Net Assets
| Common Stocks - 98.0% |
| | | Shares | Value ($) (000s) |
| COMMUNICATION SERVICES - 1.8% | | | |
| Interactive Media & Services - 0.4% | | | |
| Ziff Davis, Inc. (a) | | 90,000 | 6,965 |
| Media - 1.3% | | | |
| Nexstar Broadcasting Group, Inc. Class A | | 78,500 | 13,447 |
| TechTarget, Inc. (a) | | 108,798 | 7,023 |
| Thryv Holdings, Inc. (a) | | 275,800 | 5,643 |
| | | | 26,113 |
| Wireless Telecommunication Services - 0.1% | | | |
| Gogo, Inc. (a) | | 155,800 | 2,215 |
TOTAL COMMUNICATION SERVICES | | | 35,293 |
| CONSUMER DISCRETIONARY - 11.8% | | | |
| Auto Components - 1.8% | | | |
| Adient PLC (a) | | 313,700 | 10,973 |
| Fox Factory Holding Corp. (a) | | 108,800 | 9,558 |
| Gentherm, Inc. (a) | | 76,400 | 4,463 |
| LCI Industries | | 57,300 | 6,080 |
| Patrick Industries, Inc. | | 123,700 | 5,654 |
| | | | 36,728 |
| Diversified Consumer Services - 0.4% | | | |
| Laureate Education, Inc. Class A | | 584,900 | 7,393 |
| Hotels, Restaurants & Leisure - 2.4% | | | |
| Brinker International, Inc. (a) | | 316,500 | 10,568 |
| Churchill Downs, Inc. | | 80,900 | 16,820 |
| Everi Holdings, Inc. (a) | | 270,800 | 5,140 |
| Hilton Grand Vacations, Inc. (a) | | 167,600 | 6,577 |
| Jack in the Box, Inc. | | 75,500 | 6,661 |
| Lindblad Expeditions Holdings (a) | | 150,700 | 1,264 |
| | | | 47,030 |
| Household Durables - 1.3% | | | |
| M.D.C. Holdings, Inc. (b) | | 165,104 | 5,029 |
| Skyline Champion Corp. (a) | | 260,500 | 15,164 |
| Tempur Sealy International, Inc. | | 213,500 | 5,741 |
| | | | 25,934 |
| Internet & Direct Marketing Retail - 0.2% | | | |
| Vivid Seats, Inc. Class A (b) | | 581,967 | 4,772 |
| Leisure Products - 0.6% | | | |
| Acushnet Holdings Corp. (b) | | 133,700 | 6,226 |
| Clarus Corp. (b) | | 442,137 | 5,354 |
| | | | 11,580 |
| Specialty Retail - 3.1% | | | |
| Academy Sports & Outdoors, Inc. (b) | | 528,400 | 23,265 |
| Dick's Sporting Goods, Inc. | | 77,500 | 8,816 |
| Murphy U.S.A., Inc. | | 83,050 | 26,120 |
| Rent-A-Center, Inc. | | 179,300 | 3,738 |
| | | | 61,939 |
| Textiles, Apparel & Luxury Goods - 2.0% | | | |
| Capri Holdings Ltd. (a) | | 143,200 | 6,541 |
| Crocs, Inc. (a) | | 198,300 | 14,030 |
| Deckers Outdoor Corp. (a) | | 25,400 | 8,888 |
| Kontoor Brands, Inc. (b) | | 278,800 | 9,953 |
| | | | 39,412 |
TOTAL CONSUMER DISCRETIONARY | | | 234,788 |
| CONSUMER STAPLES - 4.1% | | | |
| Beverages - 0.5% | | | |
| Primo Water Corp. | | 713,600 | 10,411 |
| Food & Staples Retailing - 2.0% | | | |
| BJ's Wholesale Club Holdings, Inc. (a) | | 286,600 | 22,183 |
| Performance Food Group Co. (a) | | 224,800 | 11,699 |
| Sprouts Farmers Market LLC (a) | | 183,700 | 5,419 |
| | | | 39,301 |
| Food Products - 1.3% | | | |
| Darling Ingredients, Inc. (a) | | 72,500 | 5,690 |
| Nomad Foods Ltd. (a) | | 887,900 | 13,674 |
| The Simply Good Foods Co. (a) | | 180,900 | 6,928 |
| | | | 26,292 |
| Personal Products - 0.3% | | | |
| BellRing Brands, Inc. (a) | | 262,600 | 6,360 |
TOTAL CONSUMER STAPLES | | | 82,364 |
| ENERGY - 8.7% | | | |
| Energy Equipment & Services - 1.5% | | | |
| Liberty Oilfield Services, Inc. Class A | | 1,201,048 | 20,310 |
| TechnipFMC PLC (a) | | 862,700 | 9,136 |
| | | | 29,446 |
| Oil, Gas & Consumable Fuels - 7.2% | | | |
| Antero Resources Corp. (a) | | 958,188 | 35,133 |
| Denbury, Inc. (a) | | 349,209 | 31,921 |
| Enviva, Inc. (b) | | 121,300 | 7,259 |
| HF Sinclair Corp. | | 480,200 | 29,374 |
| Magnolia Oil & Gas Corp. Class A | | 517,100 | 13,279 |
| Northern Oil & Gas, Inc. | | 800,722 | 27,337 |
| | | | 144,303 |
TOTAL ENERGY | | | 173,749 |
| FINANCIALS - 15.2% | | | |
| Banks - 8.9% | | | |
| East West Bancorp, Inc. | | 129,300 | 9,254 |
| First Bancorp, Puerto Rico | | 1,121,900 | 17,715 |
| Glacier Bancorp, Inc. (b) | | 196,200 | 11,238 |
| Independent Bank Group, Inc. | | 152,800 | 9,640 |
| Metropolitan Bank Holding Corp. (a) | | 83,700 | 5,524 |
| PacWest Bancorp | | 573,400 | 14,255 |
| Pathward Financial, Inc. | | 287,400 | 12,079 |
| Pinnacle Financial Partners, Inc. | | 101,800 | 8,448 |
| Preferred Bank, Los Angeles | | 131,500 | 10,108 |
| ServisFirst Bancshares, Inc. | | 109,800 | 8,271 |
| Synovus Financial Corp. | | 449,100 | 17,897 |
| Trico Bancshares | | 327,317 | 18,955 |
| United Community Bank, Inc. (b) | | 551,500 | 21,233 |
| Webster Financial Corp. | | 141,464 | 7,676 |
| Western Alliance Bancorp. | | 77,000 | 5,172 |
| | | | 177,465 |
| Capital Markets - 2.4% | | | |
| Focus Financial Partners, Inc. Class A (a) | | 154,200 | 5,365 |
| Houlihan Lokey | | 103,600 | 9,254 |
| Lazard Ltd. Class A | | 332,400 | 12,535 |
| LPL Financial | | 32,200 | 8,232 |
| TMX Group Ltd. | | 131,900 | 12,681 |
| | | | 48,067 |
| Consumer Finance - 0.7% | | | |
| FirstCash Holdings, Inc. | | 133,500 | 13,143 |
| Insurance - 1.7% | | | |
| Assurant, Inc. | | 58,600 | 7,961 |
| Primerica, Inc. | | 100,200 | 14,499 |
| Selective Insurance Group, Inc. | | 127,270 | 12,483 |
| | | | 34,943 |
| Thrifts & Mortgage Finance - 1.5% | | | |
| Essent Group Ltd. | | 370,300 | 14,656 |
| Walker & Dunlop, Inc. | | 163,642 | 14,721 |
| | | | 29,377 |
TOTAL FINANCIALS | | | 302,995 |
| HEALTH CARE - 14.7% | | | |
| Biotechnology - 7.3% | | | |
| ADC Therapeutics SA (a) | | 103,581 | 460 |
| ALX Oncology Holdings, Inc. (a) | | 149,800 | 1,819 |
| Arcutis Biotherapeutics, Inc. (a) | | 221,100 | 3,909 |
| Argenx SE ADR (a) | | 25,131 | 9,749 |
| Ascendis Pharma A/S sponsored ADR (a) | | 32,406 | 3,727 |
| Blueprint Medicines Corp. (a) | | 172,600 | 8,948 |
| Celldex Therapeutics, Inc. (a) | | 128,600 | 4,518 |
| Cerevel Therapeutics Holdings (a) | | 219,300 | 6,132 |
| Cytokinetics, Inc. (a) | | 258,300 | 11,277 |
| Day One Biopharmaceuticals, Inc. (a) | | 337,100 | 7,126 |
| Erasca, Inc. (a) | | 470,800 | 3,846 |
| Exelixis, Inc. (a) | | 350,300 | 5,808 |
| Imago BioSciences, Inc. (a) | | 241,600 | 4,107 |
| Instil Bio, Inc. (a)(b) | | 468,725 | 1,547 |
| Janux Therapeutics, Inc. (a)(b) | | 266,500 | 4,818 |
| Keros Therapeutics, Inc. (a) | | 185,100 | 9,318 |
| Mirati Therapeutics, Inc. (a) | | 69,600 | 4,685 |
| Morphic Holding, Inc. (a) | | 104,238 | 2,920 |
| PTC Therapeutics, Inc. (a) | | 135,800 | 5,136 |
| Relay Therapeutics, Inc. (a)(b) | | 213,100 | 4,735 |
| Scholar Rock Holding Corp. warrants 12/31/25 (a)(c) | | 7,350 | 35 |
| Tango Therapeutics, Inc. (a) | | 620,500 | 4,989 |
| Tyra Biosciences, Inc. (a) | | 457,100 | 3,163 |
| Vaxcyte, Inc. (a) | | 133,739 | 5,832 |
| Vera Therapeutics, Inc. (a) | | 206,100 | 3,842 |
| Verve Therapeutics, Inc. (a)(b) | | 286,439 | 10,799 |
| Xenon Pharmaceuticals, Inc. (a) | | 193,871 | 7,090 |
| Zentalis Pharmaceuticals, Inc. (a) | | 196,548 | 4,931 |
| | | | 145,266 |
| Health Care Equipment & Supplies - 1.8% | | | |
| Envista Holdings Corp. (a) | | 225,900 | 7,457 |
| Figs, Inc. Class A (a)(b) | | 618,900 | 4,567 |
| Globus Medical, Inc. (a) | | 42,200 | 2,827 |
| Inspire Medical Systems, Inc. (a) | | 30,300 | 5,907 |
| Integer Holdings Corp. (a) | | 46,563 | 2,902 |
| Omnicell, Inc. (a) | | 46,800 | 3,619 |
| TransMedics Group, Inc. (a) | | 188,200 | 9,075 |
| | | | 36,354 |
| Health Care Providers & Services - 3.2% | | | |
| Acadia Healthcare Co., Inc. (a) | | 192,300 | 15,634 |
| agilon health, Inc. (a) | | 391,400 | 7,769 |
| Molina Healthcare, Inc. (a) | | 50,100 | 17,979 |
| Owens & Minor, Inc. | | 245,560 | 4,175 |
| R1 Rcm, Inc. (a) | | 431,500 | 7,620 |
| Surgery Partners, Inc. (a) | | 167,800 | 4,562 |
| Tenet Healthcare Corp. (a) | | 91,400 | 4,055 |
| The Oncology Institute, Inc. (a)(c) | | 373,842 | 1,697 |
| | | | 63,491 |
| Health Care Technology - 0.6% | | | |
| Evolent Health, Inc. (a) | | 385,540 | 12,264 |
| Life Sciences Tools & Services - 0.5% | | | |
| Olink Holding AB ADR (a) | | 231,373 | 4,241 |
| Syneos Health, Inc. (a) | | 88,500 | 4,459 |
| | | | 8,700 |
| Pharmaceuticals - 1.3% | | | |
| Arvinas Holding Co. LLC (a) | | 147,200 | 7,317 |
| DICE Therapeutics, Inc. (a) | | 138,700 | 4,925 |
| Edgewise Therapeutics, Inc. (a) | | 552,500 | 5,254 |
| Enliven Therapeutics, Inc. (d) | | 378,877 | 1,514 |
| Fulcrum Therapeutics, Inc. (a) | | 253,100 | 1,407 |
| Theseus Pharmaceuticals, Inc. | | 137,146 | 738 |
| Ventyx Biosciences, Inc. (b) | | 155,000 | 5,017 |
| | | | 26,172 |
TOTAL HEALTH CARE | | | 292,247 |
| INDUSTRIALS - 16.8% | | | |
| Aerospace & Defense - 0.3% | | | |
| V2X, Inc. (a) | | 120,500 | 4,939 |
| Building Products - 1.7% | | | |
| Builders FirstSource, Inc. (a) | | 226,837 | 13,987 |
| Masonite International Corp. (a) | | 110,800 | 7,926 |
| Simpson Manufacturing Co. Ltd. | | 136,210 | 11,643 |
| | | | 33,556 |
| Commercial Services & Supplies - 0.7% | | | |
| Casella Waste Systems, Inc. Class A (a) | | 112,500 | 9,204 |
| The Brink's Co. | | 92,400 | 5,510 |
| | | | 14,714 |
| Construction & Engineering - 4.1% | | | |
| Comfort Systems U.S.A., Inc. | | 100,476 | 12,387 |
| Construction Partners, Inc. Class A (a) | | 327,200 | 10,189 |
| Dycom Industries, Inc. (a) | | 86,600 | 10,234 |
| EMCOR Group, Inc. | | 139,040 | 19,619 |
| Granite Construction, Inc. | | 232,600 | 7,846 |
| IES Holdings, Inc. (a) | | 295,215 | 9,754 |
| NV5 Global, Inc. (a) | | 86,000 | 12,466 |
| | | | 82,495 |
| Electrical Equipment - 1.7% | | | |
| Atkore, Inc. (a) | | 278,470 | 26,538 |
| Regal Rexnord Corp. | | 29,700 | 3,758 |
| Thermon Group Holdings, Inc. (a) | | 157,855 | 2,804 |
| | | | 33,100 |
| Machinery - 3.4% | | | |
| Federal Signal Corp. | | 372,900 | 17,396 |
| ITT, Inc. | | 86,020 | 6,571 |
| Kadant, Inc. | | 40,500 | 7,207 |
| Oshkosh Corp. | | 77,900 | 6,855 |
| SPX Technologies, Inc. (a) | | 360,300 | 23,722 |
| Timken Co. | | 91,000 | 6,487 |
| | | | 68,238 |
| Professional Services - 2.6% | | | |
| ASGN, Inc. (a) | | 200,300 | 16,981 |
| CACI International, Inc. Class A (a) | | 24,600 | 7,479 |
| CRA International, Inc. | | 67,100 | 6,894 |
| KBR, Inc. | | 189,700 | 9,441 |
| TriNet Group, Inc. (a) | | 168,274 | 10,934 |
| | | | 51,729 |
| Trading Companies & Distributors - 2.3% | | | |
| Beacon Roofing Supply, Inc. (a) | | 177,200 | 9,985 |
| Finning International, Inc. | | 177,000 | 3,764 |
| GMS, Inc. (a) | | 162,800 | 7,684 |
| Rush Enterprises, Inc. Class A | | 396,088 | 19,761 |
| Univar Solutions, Inc. (a) | | 197,600 | 5,035 |
| | | | 46,229 |
TOTAL INDUSTRIALS | | | 335,000 |
| INFORMATION TECHNOLOGY - 11.9% | | | |
| Communications Equipment - 0.5% | | | |
| Extreme Networks, Inc. (a) | | 502,200 | 9,009 |
| Electronic Equipment & Components - 3.4% | | | |
| Advanced Energy Industries, Inc. | | 231,200 | 18,184 |
| Fabrinet (a) | | 168,340 | 19,258 |
| Insight Enterprises, Inc. (a) | | 157,900 | 14,923 |
| Napco Security Technologies, Inc. | | 252,300 | 7,170 |
| TD SYNNEX Corp. | | 88,500 | 8,099 |
| | | | 67,634 |
| IT Services - 3.8% | | | |
| Cyxtera Technologies, Inc. Class A (a) | | 1,085,727 | 2,627 |
| Endava PLC ADR (a) | | 101,000 | 7,700 |
| ExlService Holdings, Inc. (a) | | 189,133 | 34,394 |
| Perficient, Inc. (a) | | 138,600 | 9,282 |
| WNS Holdings Ltd. sponsored ADR (a) | | 259,850 | 22,368 |
| | | | 76,371 |
| Semiconductors & Semiconductor Equipment - 1.4% | | | |
| FormFactor, Inc. (a) | | 127,200 | 2,571 |
| MACOM Technology Solutions Holdings, Inc. (a) | | 170,300 | 9,855 |
| Onto Innovation, Inc. (a) | | 122,450 | 8,185 |
| SiTime Corp. (a) | | 29,800 | 2,676 |
| Synaptics, Inc. (a) | | 51,000 | 4,519 |
| | | | 27,806 |
| Software - 2.6% | | | |
| Five9, Inc. (a) | | 46,600 | 2,808 |
| Intapp, Inc. (a) | | 233,448 | 5,243 |
| Manhattan Associates, Inc. (a) | | 55,200 | 6,716 |
| NCR Corp. (a) | | 137,200 | 2,917 |
| Qualys, Inc. (a) | | 34,400 | 4,904 |
| Rapid7, Inc. (a) | | 175,300 | 7,936 |
| SPS Commerce, Inc. (a) | | 54,700 | 6,921 |
| Tenable Holdings, Inc. (a) | | 334,100 | 13,578 |
| | | | 51,023 |
| Technology Hardware, Storage & Peripherals - 0.2% | | | |
| Avid Technology, Inc. (a) | | 177,369 | 4,876 |
TOTAL INFORMATION TECHNOLOGY | | | 236,719 |
| MATERIALS - 5.6% | | | |
| Chemicals - 1.3% | | | |
| Element Solutions, Inc. | | 490,500 | 8,437 |
| Huntsman Corp. | | 475,800 | 12,732 |
| Tronox Holdings PLC | | 407,400 | 4,889 |
| | | | 26,058 |
| Construction Materials - 0.7% | | | |
| Eagle Materials, Inc. | | 118,900 | 14,543 |
| Containers & Packaging - 0.5% | | | |
| O-I Glass, Inc. (a) | | 549,400 | 8,961 |
| Metals & Mining - 2.5% | | | |
| Arconic Corp. (a) | | 210,700 | 4,374 |
| Commercial Metals Co. | | 641,800 | 29,202 |
| Constellium NV (a) | | 527,800 | 5,816 |
| Warrior Metropolitan Coal, Inc. | | 163,090 | 6,057 |
| Yamana Gold, Inc. | | 1,148,500 | 5,030 |
| | | | 50,479 |
| Paper & Forest Products - 0.6% | | | |
| Louisiana-Pacific Corp. | | 115,500 | 6,543 |
| Sylvamo Corp. | | 102,200 | 4,923 |
| | | | 11,466 |
TOTAL MATERIALS | | | 111,507 |
| REAL ESTATE - 5.3% | | | |
| Equity Real Estate Investment Trusts (REITs) - 4.6% | | | |
| EastGroup Properties, Inc. | | 56,100 | 8,790 |
| Elme Communities (SBI) | | 599,800 | 11,450 |
| Equity Commonwealth | | 346,700 | 9,070 |
| Essential Properties Realty Trust, Inc. | | 388,400 | 8,358 |
| Lamar Advertising Co. Class A | | 77,500 | 7,148 |
| LXP Industrial Trust (REIT) | | 1,360,800 | 13,173 |
| Sunstone Hotel Investors, Inc. | | 936,800 | 10,445 |
| Terreno Realty Corp. | | 388,800 | 22,216 |
| | | | 90,650 |
| Real Estate Management & Development - 0.7% | | | |
| Cushman & Wakefield PLC (a) | | 408,300 | 4,716 |
| Jones Lang LaSalle, Inc. (a) | | 59,400 | 9,450 |
| | | | 14,166 |
TOTAL REAL ESTATE | | | 104,816 |
| UTILITIES - 2.1% | | | |
| Gas Utilities - 1.8% | | | |
| Brookfield Infrastructure Corp. A Shares | | 538,200 | 23,207 |
| ONE Gas, Inc. (b) | | 150,500 | 11,661 |
| | | | 34,868 |
| Independent Power and Renewable Electricity Producers - 0.3% | | | |
| Clearway Energy, Inc. Class C | | 189,300 | 6,576 |
TOTAL UTILITIES | | | 41,444 |
| TOTAL COMMON STOCKS (Cost $1,667,747) | | | 1,950,922 |
| | | | |
| Convertible Preferred Stocks - 0.2% |
| | | Shares | Value ($) (000s) |
| HEALTH CARE - 0.2% | | | |
| Biotechnology - 0.1% | | | |
| Dianthus Therapeutics, Inc. Series A (c)(e) | | 422,467 | 1,577 |
| ValenzaBio, Inc. Series A (a)(c)(e) | | 125,214 | 743 |
| | | | 2,320 |
| Pharmaceuticals - 0.1% | | | |
| Aristea Therapeutics, Inc. Series B (a)(c)(e) | | 186,831 | 1,465 |
| TOTAL CONVERTIBLE PREFERRED STOCKS (Cost $3,980) | | | 3,785 |
| | | | |
| U.S. Treasury Obligations - 0.1% |
| | | Principal Amount (f) (000s) | Value ($) (000s) |
U.S. Treasury Bills, yield at date of purchase 2.59% to 2.89% 11/17/22 to 12/1/22 (g) (Cost $1,618) | | 1,620 | 1,617 |
| | | | |
| Money Market Funds - 4.6% |
| | | Shares | Value ($) (000s) |
| Fidelity Cash Central Fund 3.10% (h) | | 34,188,569 | 34,195 |
| Fidelity Securities Lending Cash Central Fund 3.10% (h)(i) | | 57,123,293 | 57,129 |
| TOTAL MONEY MARKET FUNDS (Cost $91,324) | | | 91,324 |
| | | | |
| TOTAL INVESTMENT IN SECURITIES - 102.9% (Cost $1,764,669) | 2,047,648 |
NET OTHER ASSETS (LIABILITIES) - (2.9)% | (57,466) |
| NET ASSETS - 100.0% | 1,990,182 |
| | |
| Futures Contracts |
| | Number of contracts | Expiration Date | Notional Amount ($) (000s) | Value ($) (000s) | Unrealized Appreciation/ (Depreciation) ($) (000s) |
| Purchased | | | | | |
| | | | | | |
| Equity Index Contracts | | | | | |
| CME E-mini Russell 2000 Index Contracts (United States) | 51 | Dec 2022 | 4,725 | 332 | 332 |
| | | | | | |
| The notional amount of futures purchased as a percentage of Net Assets is 0.2% |
Any values shown as $0 in the Schedule of Investments may reflect amounts less than $500.
Legend
| (b) | Security or a portion of the security is on loan at period end. |
| (c) | Restricted securities (including private placements) - Investment in securities not registered under the Securities Act of 1933 (excluding 144A issues). At the end of the period, the value of restricted securities (excluding 144A issues) amounted to $5,517,000 or 0.3% of net assets. |
| (d) | Security or a portion of the security purchased on a delayed delivery or when-issued basis. |
| (f) | Amount is stated in United States dollars unless otherwise noted. |
| (g) | Security or a portion of the security was pledged to cover margin requirements for futures contracts. At period end, the value of securities pledged amounted to $446,000. |
| (h) | Affiliated fund that is generally available only to investment companies and other accounts managed by Fidelity Investments. The rate quoted is the annualized seven-day yield of the fund at period end. A complete unaudited listing of the fund's holdings as of its most recent quarter end is available upon request. In addition, each Fidelity Central Fund's financial statements, which are not covered by the Fund's Report of Independent Registered Public Accounting Firm, are available on the SEC's website or upon request. |
| (i) | Investment made with cash collateral received from securities on loan. |
| Additional information on each restricted holding is as follows: |
| Security | Acquisition Date | Acquisition Cost ($) (000s) |
| Aristea Therapeutics, Inc. Series B | 10/06/20 - 7/27/21 | 1,030 |
| | | |
| Dianthus Therapeutics, Inc. Series A | 4/06/22 | 1,836 |
| | | |
| Scholar Rock Holding Corp. warrants 12/31/25 | 6/17/22 | 0 |
| | | |
| The Oncology Institute, Inc. | 6/28/21 | 3,738 |
| | | |
| ValenzaBio, Inc. Series A | 3/25/21 | 1,114 |
| | | |
Affiliated Central Funds
Fiscal year to date information regarding the Fund's investments in Fidelity Central Funds, including the ownership percentage, is presented below.
| Affiliate (Amounts in thousands) | Value, beginning of period ($) | Purchases ($) | Sales Proceeds ($) | Dividend Income ($) | Realized Gain (loss) ($) | Change in Unrealized appreciation (depreciation) ($) | Value, end of period ($) | % ownership, end of period |
| Fidelity Cash Central Fund 3.10% | 57,248 | 747,091 | 770,144 | 375 | - | - | 34,195 | 0.1% |
| Fidelity Securities Lending Cash Central Fund 3.10% | 49,434 | 660,730 | 653,035 | 249 | - | - | 57,129 | 0.2% |
| Total | 106,682 | 1,407,821 | 1,423,179 | 624 | - | - | 91,324 | |
| | | | | | | | | |
Amounts in the income column in the above table include any capital gain distributions from underlying funds, which are presented in the corresponding line item in the Statement of Operations, if applicable.
Amount for Fidelity Securities Lending Cash Central Fund represents the income earned on investing cash collateral, less rebates paid to borrowers and any lending agent fees associated with the loan, plus any premium payments received for lending certain types of securities.
Investment Valuation
The following is a summary of the inputs used, as of October 31, 2022, involving the Fund's assets and liabilities carried at fair value. The inputs or methodology used for valuing securities may not be an indication of the risk associated with investing in those securities. For more information on valuation inputs, and their aggregation into the levels used below, please refer to the Investment Valuation section in the accompanying Notes to Financial Statements.
| Valuation Inputs at Reporting Date: |
Description (Amounts in thousands) | Total ($) | Level 1 ($) | Level 2 ($) | Level 3 ($) |
Investments in Securities: | | | | |
|
| Equities: | | | | |
Communication Services | 35,293 | 35,293 | - | - |
Consumer Discretionary | 234,788 | 234,788 | - | - |
Consumer Staples | 82,364 | 82,364 | - | - |
Energy | 173,749 | 173,749 | - | - |
Financials | 302,995 | 302,995 | - | - |
Health Care | 296,032 | 290,698 | 1,549 | 3,785 |
Industrials | 335,000 | 335,000 | - | - |
Information Technology | 236,719 | 236,719 | - | - |
Materials | 111,507 | 111,507 | - | - |
Real Estate | 104,816 | 104,816 | - | - |
Utilities | 41,444 | 41,444 | - | - |
|
| U.S. Government and Government Agency Obligations | 1,617 | - | 1,617 | - |
|
| Money Market Funds | 91,324 | 91,324 | - | - |
| Total Investments in Securities: | 2,047,648 | 2,040,697 | 3,166 | 3,785 |
Derivative Instruments: | | | | |
|
| Assets | | | | |
Futures Contracts | 332 | 332 | - | - |
| Total Assets | 332 | 332 | - | - |
| Total Derivative Instruments: | 332 | 332 | - | - |
Value of Derivative Instruments
The following table is a summary of the Fund's value of derivative instruments by primary risk exposure as of October 31, 2022. For additional information on derivative instruments, please refer to the Derivative Instruments section in the accompanying Notes to Financial Statements.
Primary Risk Exposure / Derivative Type | Value |
| (Amounts in thousands) | Asset ($) | Liability ($) |
| Equity Risk | | |
Futures Contracts (a) | 332 | 0 |
| Total Equity Risk | 332 | 0 |
| Total Value of Derivatives | 332 | 0 |
(a)Reflects gross cumulative appreciation (depreciation) on futures contracts as presented in the Schedule of Investments. In the Statement of Assets and Liabilities, the period end daily variation margin is included in receivable or payable for daily variation margin on futures contracts, and the net cumulative appreciation (depreciation) is included in Total accumulated earnings (loss).
| Statement of Assets and Liabilities |
| Amounts in thousands (except per-share amounts) | | | | October 31, 2022 |
| | | | | |
| Assets | | | | |
| Investment in securities, at value (including securities loaned of $53,893) - See accompanying schedule: | | | | |
Unaffiliated issuers (cost $1,673,345) | | $1,956,324 | | |
Fidelity Central Funds (cost $91,324) | | 91,324 | | |
| | | | | |
| Total Investment in Securities (cost $1,764,669) | | | $ | 2,047,648 |
| Receivable for investments sold | | | | 3,192 |
| Receivable for fund shares sold | | | | 1,317 |
| Dividends receivable | | | | 167 |
| Distributions receivable from Fidelity Central Funds | | | | 72 |
| Receivable for daily variation margin on futures contracts | | | | 4 |
| Prepaid expenses | | | | 3 |
Total assets | | | | 2,052,403 |
| Liabilities | | | | |
| Payable for investments purchased | | | | |
Regular delivery | | $838 | | |
Delayed delivery | | 1,455 | | |
| Payable for fund shares redeemed | | 1,223 | | |
| Accrued management fee | | 1,195 | | |
| Distribution and service plan fees payable | | 38 | | |
| Other affiliated payables | | 300 | | |
| Other payables and accrued expenses | | 48 | | |
| Collateral on securities loaned | | 57,124 | | |
| Total Liabilities | | | | 62,221 |
| Net Assets | | | $ | 1,990,182 |
| Net Assets consist of: | | | | |
| Paid in capital | | | $ | 1,730,440 |
| Total accumulated earnings (loss) | | | | 259,742 |
| Net Assets | | | $ | 1,990,182 |
| | | | | |
| Net Asset Value and Maximum Offering Price | | | | |
| Class A : | | | | |
Net Asset Value and redemption price per share ($98,903 ÷ 3,596 shares) (a)(b) | | | $ | 27.51 |
| Maximum offering price per share (100/94.25 of $27.51) | | | $ | 29.19 |
| Class M : | | | | |
Net Asset Value and redemption price per share ($14,222 ÷ 541 shares) (a)(b) | | | $ | 26.28 |
| Maximum offering price per share (100/96.50 of $26.28) | | | $ | 27.23 |
| Class C : | | | | |
Net Asset Value and offering price per share ($15,666 ÷ 655 shares) (a)(b) | | | $ | 23.91 |
| Stock Selector Small Cap : | | | | |
Net Asset Value , offering price and redemption price per share ($1,339,623 ÷ 47,041 shares) | | | $ | 28.48 |
| Class I : | | | | |
Net Asset Value , offering price and redemption price per share ($296,360 ÷ 10,338 shares) | | | $ | 28.67 |
| Class Z : | | | | |
Net Asset Value , offering price and redemption price per share ($225,408 ÷ 7,879 shares) | | | $ | 28.61 |
(a)Redemption price per share is equal to net asset value less any applicable contingent deferred sales charge. |
(b)Corresponding Net Asset Value does not calculate due to rounding of fractional net assets and/or units |
| Statement of Operations |
| Amounts in thousands | | | | Year ended October 31, 2022 |
| Investment Income | | | | |
| Dividends | | | $ | 18,328 |
| Special dividends | | | | 3,994 |
| Interest | | | | 13 |
| Income from Fidelity Central Funds (including $249 from security lending) | | | | 624 |
| Total Income | | | | 22,959 |
| Expenses | | | | |
| Management fee | | | | |
| Basic fee | $ | 11,904 | | |
| Performance adjustment | | 3,115 | | |
| Transfer agent fees | | 3,207 | | |
| Distribution and service plan fees | | 498 | | |
| Accounting fees | | 597 | | |
| Custodian fees and expenses | | 35 | | |
| Independent trustees' fees and expenses | | 7 | | |
| Registration fees | | 163 | | |
| Audit | | 56 | | |
| Legal | | 5 | | |
| Miscellaneous | | 8 | | |
| Total expenses before reductions | | 19,595 | | |
| Expense reductions | | (67) | | |
| Total expenses after reductions | | | | 19,528 |
| Net Investment income (loss) | | | | 3,431 |
| Realized and Unrealized Gain (Loss) | | | | |
| Net realized gain (loss) on: | | | | |
| Investment Securities: | | | | |
| Unaffiliated issuers | | (15,631) | | |
| Foreign currency transactions | | 4 | | |
| Futures contracts | | (4,477) | | |
| Total net realized gain (loss) | | | | (20,104) |
| Change in net unrealized appreciation (depreciation) on: | | | | |
| Investment Securities: | | | | |
| Unaffiliated issuers | | (379,148) | | |
| Unfunded commitments | | 374 | | |
| Futures contracts | | (611) | | |
| Total change in net unrealized appreciation (depreciation) | | | | (379,385) |
| Net gain (loss) | | | | (399,489) |
| Net increase (decrease) in net assets resulting from operations | | | $ | (396,058) |
| Statement of Changes in Net Assets |
| |
| Amount in thousands | | Year ended October 31, 2022 | | Year ended October 31, 2021 |
| Increase (Decrease) in Net Assets | | | | |
| Operations | | | | |
| Net investment income (loss) | $ | 3,431 | $ | (3,430) |
| Net realized gain (loss) | | (20,104) | | 255,965 |
| Change in net unrealized appreciation (depreciation) | | (379,385) | | 464,504 |
| Net increase (decrease) in net assets resulting from operations | | (396,058) | | 717,039 |
| Distributions to shareholders | | (226,161) | | (21,097) |
| Share transactions - net increase (decrease) | | 339,216 | | 417,871 |
| Total increase (decrease) in net assets | | (283,003) | | 1,113,813 |
| | | | | |
| Net Assets | | | | |
| Beginning of period | | 2,273,185 | | 1,159,372 |
| End of period | $ | 1,990,182 | $ | 2,273,185 |
| | | | | |
| | | | | |
Financial Highlights
| Fidelity Advisor® Stock Selector Small Cap Fund Class A |
| |
| Years ended October 31, | | 2022 | | 2021 | | 2020 | | 2019 | | 2018 |
Selected Per-Share Data | | | | | | | | | | |
| Net asset value, beginning of period | $ | 36.93 | $ | 24.09 | $ | 23.82 | $ | 25.94 | $ | 28.16 |
| Income from Investment Operations | | | | | | | | | | |
Net investment income (loss) A,B | | (.03) C | | (.15) | | (.07) | | .01 | | .04 D |
| Net realized and unrealized gain (loss) | | (5.76) | | 13.42 | | .83 | | 2.30 | | .43 |
| Total from investment operations | | (5.79) | | 13.27 | | .76 | | 2.31 | | .47 |
| Distributions from net investment income | | - | | - | | (.02) E | | (.01) | | (.03) |
| Distributions from net realized gain | | (3.63) | | (.43) | | (.47) E | | (4.42) | | (2.65) |
| Total distributions | | (3.63) | | (.43) | | (.49) | | (4.43) | | (2.69) F |
Redemption fees added to paid in capital A | | - | | - | | - | | - | | - G |
| Net asset value, end of period | $ | 27.51 | $ | 36.93 | $ | 24.09 | $ | 23.82 | $ | 25.94 |
Total Return H,I | | (16.94)% | | 55.62% | | 3.15% | | 11.55% | | 1.73% |
Ratios to Average Net Assets B,J,K | | | | | | | | | | |
| Expenses before reductions | | 1.21% | | 1.19% | | 1.32% | | 1.04% | | .97% |
| Expenses net of fee waivers, if any | | 1.21% | | 1.19% | | 1.32% | | 1.04% | | .97% |
| Expenses net of all reductions | | 1.21% | | 1.19% | | 1.31% | | 1.04% | | .95% |
| Net investment income (loss) | | (.10)% C | | (.45)% | | (.29)% | | .06% | | .14% D |
| Supplemental Data | | | | | | | | | | |
| Net assets, end of period (in millions) | $ | 99 | $ | 108 | $ | 52 | $ | 37 | $ | 23 |
Portfolio turnover rate L | | 38% | | 59% | | 70% | | 56% M | | 68% |
A Calculated based on average shares outstanding during the period.
B Net investment income (loss) is affected by the timing of the declaration of dividends by any underlying mutual funds or exchange-traded funds (ETFs). Net investment income (loss) of any mutual funds or ETFs is not included in the Fund's net investment income (loss) ratio.
C Net investment income per share reflects one or more large, non-recurring dividend(s) which amounted to $.06 per share. Excluding such non-recurring dividend(s), the ratio of net investment income (loss) to average net assets would have been (.29)%.
D Net investment income per share reflects one or more large, non-recurring dividend(s) which amounted to $.03 per share. Excluding such non-recurring dividend(s), the ratio of net investment income (loss) to average net assets would have been .04%.
E The amount shown reflects reclassifications related to book to tax differences that were made in the year shown.
F Total distributions per share do not sum due to rounding.
G Amount represents less than $.005 per share.
H Total returns would have been lower if certain expenses had not been reduced during the applicable periods shown.
I Total returns do not include the effect of the sales charges.
J Fees and expenses of any underlying mutual funds or exchange-traded funds (ETFs) are not included in the Fund's expense ratio. The Fund indirectly bears its proportionate share of these expenses. For additional expense information related to investments in Fidelity Central Funds, please refer to the "Investments in Fidelity Central Funds" note found in the Notes to Financial Statements section of the most recent Annual or Semi-Annual report.
K Expense ratios reflect operating expenses of the class. Expenses before reductions do not reflect amounts reimbursed, waived, or reduced through arrangements with the investment adviser, brokerage services, or other offset arrangements, if applicable, and do not represent the amount paid by the class during periods when reimbursements, waivers or reductions occur.
L Amount does not include the portfolio activity of any underlying mutual funds or exchange-traded funds (ETFs).
M Portfolio turnover rate excludes securities received or delivered in-kind.
| Fidelity Advisor® Stock Selector Small Cap Fund Class M |
| |
| Years ended October 31, | | 2022 | | 2021 | | 2020 | | 2019 | | 2018 |
Selected Per-Share Data | | | | | | | | | | |
| Net asset value, beginning of period | $ | 35.46 | $ | 23.20 | $ | 23.00 | $ | 25.21 | $ | 27.49 |
| Income from Investment Operations | | | | | | | | | | |
Net investment income (loss) A,B | | (.10) C | | (.23) | | (.13) | | (.05) | | (.06) D |
| Net realized and unrealized gain (loss) | | (5.53) | | 12.92 | | .80 | | 2.21 | | .43 |
| Total from investment operations | | (5.63) | | 12.69 | | .67 | | 2.16 | | .37 |
| Distributions from net realized gain | | (3.55) | | (.43) | | (.46) E | | (4.37) | | (2.65) |
| Total distributions | | (3.55) | | (.43) | | (.46) | | (4.37) | | (2.65) |
Redemption fees added to paid in capital A | | - | | - | | - | | - | | - F |
| Net asset value, end of period | $ | 26.28 | $ | 35.46 | $ | 23.20 | $ | 23.00 | $ | 25.21 |
Total Return G,H | | (17.19)% | | 55.24% | | 2.83% | | 11.20% | | 1.40% |
Ratios to Average Net Assets B,I,J | | | | | | | | | | |
| Expenses before reductions | | 1.48% | | 1.46% | | 1.61% | | 1.35% | | 1.33% |
| Expenses net of fee waivers, if any | | 1.48% | | 1.45% | | 1.60% | | 1.35% | | 1.33% |
| Expenses net of all reductions | | 1.48% | | 1.45% | | 1.60% | | 1.35% | | 1.32% |
| Net investment income (loss) | | (.37)% C | | (.71)% | | (.58)% | | (.24)% | | (.22)% D |
| Supplemental Data | | | | | | | | | | |
| Net assets, end of period (in millions) | $ | 14 | $ | 17 | $ | 8 | $ | 7 | $ | 5 |
Portfolio turnover rate K | | 38% | | 59% | | 70% | | 56% L | | 68% |
A Calculated based on average shares outstanding during the period.
B Net investment income (loss) is affected by the timing of the declaration of dividends by any underlying mutual funds or exchange-traded funds (ETFs). Net investment income (loss) of any mutual funds or ETFs is not included in the Fund's net investment income (loss) ratio.
C Net investment income per share reflects one or more large, non-recurring dividend(s) which amounted to $.05 per share. Excluding such non-recurring dividend(s), the ratio of net investment income (loss) to average net assets would have been (.56)%.
D Net investment income per share reflects one or more large, non-recurring dividend(s) which amounted to $.03 per share. Excluding such non-recurring dividend(s), the ratio of net investment income (loss) to average net assets would have been (.32)%.
E The amount shown reflects reclassifications related to book to tax differences that were made in the year shown. Amount has been revised from previously reported amount of $.47 per share.
F Amount represents less than $.005 per share.
G Total returns would have been lower if certain expenses had not been reduced during the applicable periods shown.
H Total returns do not include the effect of the sales charges.
I Fees and expenses of any underlying mutual funds or exchange-traded funds (ETFs) are not included in the Fund's expense ratio. The Fund indirectly bears its proportionate share of these expenses. For additional expense information related to investments in Fidelity Central Funds, please refer to the "Investments in Fidelity Central Funds" note found in the Notes to Financial Statements section of the most recent Annual or Semi-Annual report.
J Expense ratios reflect operating expenses of the class. Expenses before reductions do not reflect amounts reimbursed, waived, or reduced through arrangements with the investment adviser, brokerage services, or other offset arrangements, if applicable, and do not represent the amount paid by the class during periods when reimbursements, waivers or reductions occur.
K Amount does not include the portfolio activity of any underlying mutual funds or exchange-traded funds (ETFs).
L Portfolio turnover rate excludes securities received or delivered in-kind.
| Fidelity Advisor® Stock Selector Small Cap Fund Class C |
| |
| Years ended October 31, | | 2022 | | 2021 | | 2020 | | 2019 | | 2018 |
Selected Per-Share Data | | | | | | | | | | |
| Net asset value, beginning of period | $ | 32.61 | $ | 21.48 | $ | 21.43 | $ | 23.79 | $ | 26.20 |
| Income from Investment Operations | | | | | | | | | | |
Net investment income (loss) A,B | | (.23) C | | (.36) | | (.23) | | (.16) | | (.17) D |
| Net realized and unrealized gain (loss) | | (5.05) | | 11.92 | | .75 | | 2.06 | | .41 |
| Total from investment operations | | (5.28) | | 11.56 | | .52 | | 1.90 | | .24 |
| Distributions from net realized gain | | (3.42) | | (.43) | | (.46) E | | (4.26) | | (2.65) |
| Total distributions | | (3.42) | | (.43) | | (.46) | | (4.26) | | (2.65) |
Redemption fees added to paid in capital A | | - | | - | | - | | - | | - F |
| Net asset value, end of period | $ | 23.91 | $ | 32.61 | $ | 21.48 | $ | 21.43 | $ | 23.79 |
Total Return G,H | | (17.61)% | | 54.40% | | 2.33% | | 10.64% | | .94% |
Ratios to Average Net Assets B,I,J | | | | | | | | | | |
| Expenses before reductions | | 2.00% | | 1.98% | | 2.13% | | 1.86% | | 1.79% |
| Expenses net of fee waivers, if any | | 1.99% | | 1.97% | | 2.13% | | 1.86% | | 1.79% |
| Expenses net of all reductions | | 1.99% | | 1.97% | | 2.12% | | 1.86% | | 1.78% |
| Net investment income (loss) | | (.88)% C | | (1.23)% | | (1.10)% | | (.76)% | | (.68)% D |
| Supplemental Data | | | | | | | | | | |
| Net assets, end of period (in millions) | $ | 16 | $ | 19 | $ | 8 | $ | 8 | $ | 6 |
Portfolio turnover rate K | | 38% | | 59% | | 70% | | 56% L | | 68% |
A Calculated based on average shares outstanding during the period.
B Net investment income (loss) is affected by the timing of the declaration of dividends by any underlying mutual funds or exchange-traded funds (ETFs). Net investment income (loss) of any mutual funds or ETFs is not included in the Fund's net investment income (loss) ratio.
C Net investment income per share reflects one or more large, non-recurring dividend(s) which amounted to $.05 per share. Excluding such non-recurring dividend(s), the ratio of net investment income (loss) to average net assets would have been (1.08)%.
D Net investment income per share reflects one or more large, non-recurring dividend(s) which amounted to $.03 per share. Excluding such non-recurring dividend(s), the ratio of net investment income (loss) to average net assets would have been (.78)%.
E The amount shown reflects reclassifications related to book to tax differences that were made in the year shown. Amount has been revised from previously reported amount of $.47 per share.
F Amount represents less than $.005 per share.
G Total returns would have been lower if certain expenses had not been reduced during the applicable periods shown.
H Total returns do not include the effect of the contingent deferred sales charge.
I Fees and expenses of any underlying mutual funds or exchange-traded funds (ETFs) are not included in the Fund's expense ratio. The Fund indirectly bears its proportionate share of these expenses. For additional expense information related to investments in Fidelity Central Funds, please refer to the "Investments in Fidelity Central Funds" note found in the Notes to Financial Statements section of the most recent Annual or Semi-Annual report.
J Expense ratios reflect operating expenses of the class. Expenses before reductions do not reflect amounts reimbursed, waived, or reduced through arrangements with the investment adviser, brokerage services, or other offset arrangements, if applicable, and do not represent the amount paid by the class during periods when reimbursements, waivers or reductions occur.
K Amount does not include the portfolio activity of any underlying mutual funds or exchange-traded funds (ETFs).
L Portfolio turnover rate excludes securities received or delivered in-kind.
| Fidelity® Stock Selector Small Cap Fund |
| |
| Years ended October 31, | | 2022 | | 2021 | | 2020 | | 2019 | | 2018 |
Selected Per-Share Data | | | | | | | | | | |
| Net asset value, beginning of period | $ | 38.11 | $ | 24.77 | $ | 24.47 | $ | 26.50 | $ | 28.71 |
| Income from Investment Operations | | | | | | | | | | |
Net investment income (loss) A,B | | .06 C | | (.05) | | - D | | .08 | | .12 E |
| Net realized and unrealized gain (loss) | | (5.96) | | 13.82 | | .84 | | 2.36 | | .43 |
| Total from investment operations | | (5.90) | | 13.77 | | .84 | | 2.44 | | .55 |
| Distributions from net investment income | | (.06) | | - | | (.07) F | | (.06) | | (.11) |
| Distributions from net realized gain | | (3.67) | | (.43) | | (.47) F | | (4.42) | | (2.65) |
| Total distributions | | (3.73) | | (.43) | | (.54) | | (4.47) G | | (2.76) |
Redemption fees added to paid in capital A | | - | | - | | - | | - | | - D |
| Net asset value, end of period | $ | 28.48 | $ | 38.11 | $ | 24.77 | $ | 24.47 | $ | 26.50 |
Total Return H | | (16.73)% | | 56.11% | | 3.42% | | 11.90% | | 2.04% |
Ratios to Average Net Assets B,I,J | | | | | | | | | | |
| Expenses before reductions | | .93% | | .90% | | 1.02% | | .75% | | .68% |
| Expenses net of fee waivers, if any | | .93% | | .90% | | 1.02% | | .75% | | .68% |
| Expenses net of all reductions | | .93% | | .90% | | 1.01% | | .75% | | .67% |
| Net investment income (loss) | | .18% C | | (.16)% | | -% K | | .36% | | .43% E |
| Supplemental Data | | | | | | | | | | |
| Net assets, end of period (in millions) | $ | 1,340 | $ | 1,654 | $ | 960 | $ | 938 | $ | 1,035 |
Portfolio turnover rate L | | 38% | | 59% | | 70% | | 56% M | | 68% |
A Calculated based on average shares outstanding during the period.
B Net investment income (loss) is affected by the timing of the declaration of dividends by any underlying mutual funds or exchange-traded funds (ETFs). Net investment income (loss) of any mutual funds or ETFs is not included in the Fund's net investment income (loss) ratio.
C Net investment income per share reflects one or more large, non-recurring dividend(s) which amounted to $.06 per share. Excluding such non-recurring dividend(s), the ratio of net investment income (loss) to average net assets would have been (.01)%.
D Amount represents less than $.005 per share.
E Net investment income per share reflects one or more large, non-recurring dividend(s) which amounted to $.03 per share. Excluding such non-recurring dividend(s), the ratio of net investment income (loss) to average net assets would have been .33%.
F The amount shown reflects reclassifications related to book to tax differences that were made in the year shown.
G Total distributions per share do not sum due to rounding.
H Total returns would have been lower if certain expenses had not been reduced during the applicable periods shown.
I Fees and expenses of any underlying mutual funds or exchange-traded funds (ETFs) are not included in the Fund's expense ratio. The Fund indirectly bears its proportionate share of these expenses. For additional expense information related to investments in Fidelity Central Funds, please refer to the "Investments in Fidelity Central Funds" note found in the Notes to Financial Statements section of the most recent Annual or Semi-Annual report.
J Expense ratios reflect operating expenses of the class. Expenses before reductions do not reflect amounts reimbursed, waived, or reduced through arrangements with the investment adviser, brokerage services, or other offset arrangements, if applicable, and do not represent the amount paid by the class during periods when reimbursements, waivers or reductions occur.
K Amount represents less than .005%.
L Amount does not include the portfolio activity of any underlying mutual funds or exchange-traded funds (ETFs).
M Portfolio turnover rate excludes securities received or delivered in-kind.
| Fidelity Advisor® Stock Selector Small Cap Fund Class I |
| |
| Years ended October 31, | | 2022 | | 2021 | | 2020 | | 2019 | | 2018 |
Selected Per-Share Data | | | | | | | | | | |
| Net asset value, beginning of period | $ | 38.34 | $ | 24.93 | $ | 24.54 | $ | 26.57 | $ | 28.78 |
| Income from Investment Operations | | | | | | | | | | |
Net investment income (loss) A,B | | .05 C | | (.06) | | - D | | .08 | | .12 E |
| Net realized and unrealized gain (loss) | | (5.99) | | 13.90 | | .86 | | 2.37 | | .43 |
| Total from investment operations | | (5.94) | | 13.84 | | .86 | | 2.45 | | .55 |
| Distributions from net investment income | | (.06) | | - | | - D,F | | (.06) | | (.11) |
| Distributions from net realized gain | | (3.67) | | (.43) | | (.47) F | | (4.42) | | (2.65) |
| Total distributions | | (3.73) | | (.43) | | (.47) | | (4.48) | | (2.76) |
Redemption fees added to paid in capital A | | - | | - | | - | | - | | - D |
| Net asset value, end of period | $ | 28.67 | $ | 38.34 | $ | 24.93 | $ | 24.54 | $ | 26.57 |
Total Return G | | (16.72)% | | 56.03% | | 3.49% | | 11.87% | | 2.02% |
Ratios to Average Net Assets B,H,I | | | | | | | | | | |
| Expenses before reductions | | .94% | | .92% | | 1.01% | | .76% | | .69% |
| Expenses net of fee waivers, if any | | .94% | | .91% | | 1.00% | | .76% | | .69% |
| Expenses net of all reductions | | .94% | | .91% | | 1.00% | | .75% | | .68% |
| Net investment income (loss) | | .17% C | | (.17)% | | .02% | | .35% | | .42% E |
| Supplemental Data | | | | | | | | | | |
| Net assets, end of period (in millions) | $ | 296 | $ | 308 | $ | 79 | $ | 9 | $ | 40 |
Portfolio turnover rate J | | 38% | | 59% | | 70% | | 56% K | | 68% |
A Calculated based on average shares outstanding during the period.
B Net investment income (loss) is affected by the timing of the declaration of dividends by any underlying mutual funds or exchange-traded funds (ETFs). Net investment income (loss) of any mutual funds or ETFs is not included in the Fund's net investment income (loss) ratio.
C Net investment income per share reflects one or more large, non-recurring dividend(s) which amounted to $.06 per share. Excluding such non-recurring dividend(s), the ratio of net investment income (loss) to average net assets would have been (.02)%.
D Amount represents less than $.005 per share.
E Net investment income per share reflects one or more large, non-recurring dividend(s) which amounted to $.03 per share. Excluding such non-recurring dividend(s), the ratio of net investment income (loss) to average net assets would have been .31%.
F The amount shown reflects reclassifications related to book to tax differences that were made in the year shown.
G Total returns would have been lower if certain expenses had not been reduced during the applicable periods shown.
H Fees and expenses of any underlying mutual funds or exchange-traded funds (ETFs) are not included in the Fund's expense ratio. The Fund indirectly bears its proportionate share of these expenses. For additional expense information related to investments in Fidelity Central Funds, please refer to the "Investments in Fidelity Central Funds" note found in the Notes to Financial Statements section of the most recent Annual or Semi-Annual report.
I Expense ratios reflect operating expenses of the class. Expenses before reductions do not reflect amounts reimbursed, waived, or reduced through arrangements with the investment adviser, brokerage services, or other offset arrangements, if applicable, and do not represent the amount paid by the class during periods when reimbursements, waivers or reductions occur.
J Amount does not include the portfolio activity of any underlying mutual funds or exchange-traded funds (ETFs).
K Portfolio turnover rate excludes securities received or delivered in-kind.
| Fidelity Advisor® Stock Selector Small Cap Fund Class Z |
| |
| Years ended October 31, | | 2022 | | 2021 | | 2020 | | 2019 | | 2018 |
Selected Per-Share Data | | | | | | | | | | |
| Net asset value, beginning of period | $ | 38.27 | $ | 24.85 | $ | 24.55 | $ | 26.59 | $ | 28.81 |
| Income from Investment Operations | | | | | | | | | | |
Net investment income (loss) A,B | | .09 C | | (.02) | | .03 | | .12 | | .16 D |
| Net realized and unrealized gain (loss) | | (5.98) | | 13.87 | | .86 | | 2.36 | | .43 |
| Total from investment operations | | (5.89) | | 13.85 | | .89 | | 2.48 | | .59 |
| Distributions from net investment income | | (.11) | | - | | (.12) E | | (.10) | | (.16) |
| Distributions from net realized gain | | (3.67) | | (.43) | | (.47) E | | (4.42) | | (2.65) |
| Total distributions | | (3.77) F | | (.43) | | (.59) | | (4.52) | | (2.81) |
Redemption fees added to paid in capital A | | - | | - | | - | | - | | - G |
| Net asset value, end of period | $ | 28.61 | $ | 38.27 | $ | 24.85 | $ | 24.55 | $ | 26.59 |
Total Return H | | (16.62)% | | 56.26% | | 3.58% | | 12.05% | | 2.17% |
Ratios to Average Net Assets B,I,J | | | | | | | | | | |
| Expenses before reductions | | .81% | | .79% | | .89% | | .61% | | .55% |
| Expenses net of fee waivers, if any | | .81% | | .79% | | .88% | | .61% | | .55% |
| Expenses net of all reductions | | .81% | | .79% | | .88% | | .61% | | .54% |
| Net investment income (loss) | | .30% C | | (.04)% | | .14% | | .49% | | .56% D |
| Supplemental Data | | | | | | | | | | |
| Net assets, end of period (in millions) | $ | 225 | $ | 167 | $ | 53 | $ | 30 | $ | 6 |
Portfolio turnover rate K | | 38% | | 59% | | 70% | | 56% L | | 68% |
A Calculated based on average shares outstanding during the period.
B Net investment income (loss) is affected by the timing of the declaration of dividends by any underlying mutual funds or exchange-traded funds (ETFs). Net investment income (loss) of any mutual funds or ETFs is not included in the Fund's net investment income (loss) ratio.
C Net investment income per share reflects one or more large, non-recurring dividend(s) which amounted to $.06 per share. Excluding such non-recurring dividend(s), the ratio of net investment income (loss) to average net assets would have been .11%.
D Net investment income per share reflects one or more large, non-recurring dividend(s) which amounted to $.03 per share. Excluding such non-recurring dividend(s), the ratio of net investment income (loss) to average net assets would have been .46%.
E The amount shown reflects reclassifications related to book to tax differences that were made in the year shown.
F Total distributions per share do not sum due to rounding.
G Amount represents less than $.005 per share.
H Total returns would have been lower if certain expenses had not been reduced during the applicable periods shown.
I Fees and expenses of any underlying mutual funds or exchange-traded funds (ETFs) are not included in the Fund's expense ratio. The Fund indirectly bears its proportionate share of these expenses. For additional expense information related to investments in Fidelity Central Funds, please refer to the "Investments in Fidelity Central Funds" note found in the Notes to Financial Statements section of the most recent Annual or Semi-Annual report.
J Expense ratios reflect operating expenses of the class. Expenses before reductions do not reflect amounts reimbursed, waived, or reduced through arrangements with the investment adviser, brokerage services, or other offset arrangements, if applicable, and do not represent the amount paid by the class during periods when reimbursements, waivers or reductions occur.
K Amount does not include the portfolio activity of any underlying mutual funds or exchange-traded funds (ETFs).
L Portfolio turnover rate excludes securities received or delivered in-kind.
For the period ended October 31, 2022
( Amounts in thousands except percentages)
1. Organization.
Fidelity Stock Selector Small Cap Fund (the Fund) is a fund of Fidelity Capital Trust (the Trust) and is authorized to issue an unlimited number of shares. The Trust is registered under the Investment Company Act of 1940, as amended (the 1940 Act), as an open-end management investment company organized as a Massachusetts business trust. The Fund offers Class A, Class M, Class C, Stock Selector Small Cap, Class I and Class Z shares, each of which has equal rights as to assets and voting privileges. Each class has exclusive voting rights with respect to matters that affect that class. Class C shares will automatically convert to Class A shares after a holding period of eight years from the initial date of purchase, with certain exceptions.
2. Investments in Fidelity Central Funds.
Funds may invest in Fidelity Central Funds, which are open-end investment companies generally available only to other investment companies and accounts managed by the investment adviser and its affiliates. The Schedule of Investments lists any Fidelity Central Funds held as an investment as of period end, but does not include the underlying holdings of each Fidelity Central Fund. An investing fund indirectly bears its proportionate share of the expenses of the underlying Fidelity Central Funds.
Based on its investment objective, each Fidelity Central Fund may invest or participate in various investment vehicles or strategies that are similar to those of the investing fund. These strategies are consistent with the investment objectives of the investing fund and may involve certain economic risks which may cause a decline in value of each of the Fidelity Central Funds and thus a decline in the value of the investing fund.
| Fidelity Central Fund | Investment Manager | Investment Objective | Investment Practices | Expense Ratio A |
| Fidelity Money Market Central Funds | Fidelity Management & Research Company LLC (FMR) | Each fund seeks to obtain a high level of current income consistent with the preservation of capital and liquidity. | Short-term Investments | Less than .005% |
A Expenses expressed as a percentage of average net assets and are as of each underlying Central Fund's most recent annual or semi-annual shareholder report.
A complete unaudited list of holdings for each Fidelity Central Fund is available upon request or at the Securities and Exchange Commission website at www.sec.gov. In addition, the financial statements of the Fidelity Central Funds which contain the significant accounting policies (including investment valuation policies) of those funds, and are not covered by the Report of Independent Registered Public Accounting Firm, are available on the Securities and Exchange Commission website or upon request.
3. Significant Accounting Policies.
The Fund is an investment company and applies the accounting and reporting guidance of the Financial Accounting Standards Board (FASB) Accounting Standards Codification Topic 946 Financial Services - Investment Companies . The financial statements have been prepared in conformity with accounting principles generally accepted in the United States of America (GAAP), which require management to make certain estimates and assumptions at the date of the financial statements. Actual results could differ from those estimates. Subsequent events, if any, through the date that the financial statements were issued have been evaluated in the preparation of the financial statements. The Fund's Schedule of Investments lists any underlying mutual funds or exchange-traded funds (ETFs) but does not include the underlying holdings of these funds. The following summarizes the significant accounting policies of the Fund:
Investment Valuation. Investments are valued as of 4:00 p.m. Eastern time on the last calendar day of the period. The Board of Trustees (the Board) has designated the Fund's investment adviser as the valuation designee responsible for the fair valuation function and performing fair value determinations as needed. The investment adviser has established a Fair Value Committee (the Committee) to carry out the day-to-day fair valuation responsibilities and has adopted policies and procedures to govern the fair valuation process and the activities of the Committee. In accordance with these fair valuation policies and procedures, which have been approved by the Board, the Fund attempts to obtain prices from one or more third party pricing services or brokers to value its investments. When current market prices, quotations or currency exchange rates are not readily available or reliable, investments will be fair valued in good faith by the Committee, in accordance with the policies and procedures. Factors used in determining fair value vary by investment type and may include market or investment specific events, transaction data, estimated cash flows, and market observations of comparable investments. The frequency that the fair valuation procedures are used cannot be predicted and they may be utilized to a significant extent. The Committee manages the Fund's fair valuation practices and maintains the fair valuation policies and procedures. The Fund's investment adviser reports to the Board information regarding the fair valuation process and related material matters.
The Fund categorizes the inputs to valuation techniques used to value its investments into a disclosure hierarchy consisting of three levels as shown below:
Level 1 - unadjusted quoted prices in active markets for identical investments
Level 2 - other significant observable inputs (including quoted prices for similar investments, interest rates, prepayment speeds, etc.)
Level 3 - unobservable inputs (including the Fund's own assumptions based on the best information available)
Valuation techniques used to value the Fund's investments by major category are as follows:
Equity securities, including restricted securities, for which market quotations are readily available, are valued at the last reported sale price or official closing price as reported by a third party pricing service on the primary market or exchange on which they are traded and are categorized as Level 1 in the hierarchy. In the event there were no sales during the day or closing prices are not available, securities are valued at the last quoted bid price or may be valued using the last available price and are generally categorized as Level 2 in the hierarchy. For foreign equity securities, when market or security specific events arise, comparisons to the valuation of American Depositary Receipts (ADRs), futures contracts, Exchange-Traded Funds (ETFs) and certain indexes as well as quoted prices for similar securities may be used and would be categorized as Level 2 in the hierarchy. For equity securities, including restricted securities, where observable inputs are limited, assumptions about market activity and risk are used and these securities may be categorized as Level 3 in the hierarchy.
Debt securities, including restricted securities, are valued based on evaluated prices received from third party pricing services or from brokers who make markets in such securities. U.S. government and government agency obligations are valued by pricing services who utilize matrix pricing which considers yield or price of bonds of comparable quality, coupon, maturity and type or by broker-supplied prices. When independent prices are unavailable or unreliable, debt securities may be valued utilizing pricing methodologies which consider similar factors that would be used by third party pricing services. Debt securities are generally categorized as Level 2 in the hierarchy but may be Level 3 depending on the circumstances.
Futures contracts are valued at the settlement price established each day by the board of trade or exchange on which they are traded and are categorized as Level 1 in the hierarchy. Investments in open-end mutual funds, including the Fidelity Central Funds, are valued at their closing net asset value (NAV) each business day and are categorized as Level 1 in the hierarchy.
Changes in valuation techniques may result in transfers in or out of an assigned level within the disclosure hierarchy. The aggregate value of investments by input level as of October 31, 2022 is included at the end of the Fund's Schedule of Investments.
Foreign Currency. Certain Funds may use foreign currency contracts to facilitate transactions in foreign-denominated securities. Gains and losses from these transactions may arise from changes in the value of the foreign currency or if the counterparties do not perform under the contracts' terms.
Foreign-denominated assets, including investment securities, and liabilities are translated into U.S. dollars at the exchange rates at period end. Purchases and sales of investment securities, income and dividends received, and expenses denominated in foreign currencies are translated into U.S. dollars at the exchange rate in effect on the transaction date.
The effects of exchange rate fluctuations on investments are included with the net realized and unrealized gain (loss) on investment securities. Other foreign currency transactions resulting in realized and unrealized gain (loss) are disclosed separately.
Investment Transactions and Income. For financial reporting purposes, the Fund's investment holdings and NAV include trades executed through the end of the last business day of the period. The NAV per share for processing shareholder transactions is calculated as of the close of business of the New York Stock Exchange (NYSE), normally 4:00 p.m. Eastern time and includes trades executed through the end of the prior business day. Gains and losses on securities sold are determined on the basis of identified cost and include proceeds received from litigation. Commissions paid to certain brokers with whom the investment adviser, or its affiliates, places trades on behalf of a fund include an amount in addition to trade execution, which may be rebated back to a fund. Any such rebates are included in net realized gain (loss) on investments in the Statement of Operations. Dividend income is recorded on the ex-dividend date, except for certain dividends from foreign securities where the ex-dividend date may have passed, which are recorded as soon as the Fund is informed of the ex-dividend date. Non-cash dividends included in dividend income, if any, are recorded at the fair market value of the securities received. Income and capital gain distributions from Fidelity Central Funds, if any, are recorded on the ex-dividend date. Certain distributions received by the Fund represent a return of capital or capital gain. The Fund determines the components of these distributions subsequent to the ex-dividend date, based upon receipt of tax filings or other correspondence relating to the underlying investment. These distributions are recorded as a reduction of cost of investments and/or as a realized gain. Large, non-recurring dividends recognized by the Fund are presented separately on the Statement of Operations as "Special Dividends" and the impact of these dividends is presented in the Financial Highlights. Interest income is accrued as earned and includes coupon interest and amortization of premium and accretion of discount on debt securities as applicable. Investment income is recorded net of foreign taxes withheld where recovery of such taxes is uncertain. Funds may file withholding tax reclaims in certain jurisdictions to recover a portion of amounts previously withheld. Any withholding tax reclaims income is included in the Statement of Operations in dividends. Any receivables for withholding tax reclaims are included in the Statement of Assets and Liabilities in dividends receivable.
Class Allocations and Expenses. Investment income, realized and unrealized capital gains and losses, common expenses of a fund, and certain fund-level expense reductions, if any, are allocated daily on a pro-rata basis to each class based on the relative net assets of each class to the total net assets of a fund. Each class differs with respect to transfer agent and distribution and service plan fees incurred, as applicable. Certain expense reductions may also differ by class, if applicable. For the reporting period, the allocated portion of income and expenses to each class as a percent of its average net assets may vary due to the timing of recording these transactions in relation to fluctuating net assets of the classes. Expenses directly attributable to a fund are charged to that fund. Expenses attributable to more than one fund are allocated among the respective funds on the basis of relative net assets or other appropriate methods. Expenses included in the accompanying financial statements reflect the expenses of that fund and do not include any expenses associated with any underlying mutual funds or exchange-traded funds. Although not included in a fund's expenses, a fund indirectly bears its proportionate share of these expenses through the net asset value of each underlying mutual fund or exchange-traded fund. Expense estimates are accrued in the period to which they relate and adjustments are made when actual amounts are known.
Income Tax Information and Distributions to Shareholders. Each year, the Fund intends to qualify as a regulated investment company under Subchapter M of the Internal Revenue Code, including distributing substantially all of its taxable income and realized gains. As a result, no provision for U.S. Federal income taxes is required. As of October 31, 2022, the Fund did not have any unrecognized tax benefits in the financial statements; nor is the Fund aware of any tax positions for which it is reasonably possible that the total amounts of unrecognized tax benefits will significantly change in the next twelve months. The Fund files a U.S. federal tax return, in addition to state and local tax returns as required. The Fund's federal income tax returns are subject to examination by the Internal Revenue Service (IRS) for a period of three fiscal years after they are filed. State and local tax returns may be subject to examination for an additional fiscal year depending on the jurisdiction. Foreign taxes are provided for based on the Fund's understanding of the tax rules and rates that exist in the foreign markets in which it invests.
Distributions are declared and recorded on the ex-dividend date. Income and capital gain distributions are declared separately for each class. Income and capital gain distributions are determined in accordance with income tax regulations, which may differ from GAAP.
Capital accounts within the financial statements are adjusted for permanent book-tax differences. These adjustments have no impact on net assets or the results of operations. Capital accounts are not adjusted for temporary book-tax differences which will reverse in a subsequent period.
Book-tax differences are primarily due to futures contracts, foreign currency transactions, partnerships, capital loss carryforwards and losses deferred due to wash sales and excise tax regulations.
As of period end, the cost and unrealized appreciation (depreciation) in securities, and derivatives if applicable, for federal income tax purposes were as follows:
| Gross unrealized appreciation | $495,478 |
| Gross unrealized depreciation | (215,738) |
| Net unrealized appreciation (depreciation) | $279,740 |
| Tax Cost | $1,767,908 |
The tax-based components of distributable earnings as of period end were as follows:
| Capital loss carryforward | $(19,028) |
| Net unrealized appreciation (depreciation) on securities and other investments | $279,082 |
Capital loss carryforwards are only available to offset future capital gains of the Fund to the extent provided by regulations and may be limited. The capital loss carryforward information presented below, including any applicable limitation, is estimated as of fiscal period end and is subject to adjustment.
The Fund intends to elect to defer to its next fiscal year $311 of ordinary losses recognized during the period January 1, 2022 to October 31, 2022.
The tax character of distributions paid was as follows:
| | October 31, 2022 | October 31, 2021 |
| | | |
| Ordinary Income | $43,104 | $- |
| Long-term Capital Gains | 183,057 | 21,097 |
| Total | $226,161 | $21,097 |
Delayed Delivery Transactions and When-Issued Securities. During the period, certain Funds transacted in securities on a delayed delivery or when-issued basis. Payment and delivery may take place after the customary settlement period for that security. The price of the underlying securities and the date when the securities will be delivered and paid for are fixed at the time the transaction is negotiated. Securities purchased on a delayed delivery or when-issued basis are identified as such in the Schedule of Investments. Compensation for interest forgone in the purchase of a delayed delivery or when-issued debt security may be received. With respect to purchase commitments, each applicable Fund identifies securities as segregated in its records with a value at least equal to the amount of the commitment. Payables and receivables associated with the purchases and sales of delayed delivery securities having the same coupon, settlement date and broker are offset. Delayed delivery or when-issued securities that have been purchased from and sold to different brokers are reflected as both payables and receivables in the Statement of Assets and Liabilities under the caption "Delayed delivery", as applicable. Losses may arise due to changes in the value of the underlying securities or if the counterparty does not perform under the contract's terms, or if the issuer does not issue the securities due to political, economic, or other factors.
Restricted Securities (including Private Placements). Funds may invest in securities that are subject to legal or contractual restrictions on resale. These securities generally may be resold in transactions exempt from registration or to the public if the securities are registered. Disposal of these securities may involve time-consuming negotiations and expense, and prompt sale at an acceptable price may be difficult. Information regarding restricted securities held at period end is included at the end of the Schedule of Investments, if applicable.
Special Purpose Acquisition Companies. Funds may invest in stock, warrants, and other securities of special purpose acquisition companies (SPACs) or similar special purpose entities. A SPAC is a publicly traded company that raises investment capital via an initial public offering (IPO) for the purpose of acquiring the equity securities of one or more existing companies via merger, business combination, acquisition or other similar transactions within a designated time frame.
Private Investment in Public Equity. Funds may acquire equity securities of an issuer through a private investment in a public equity (PIPE) transaction, including through commitments to purchase securities on a when-issued basis. A PIPE typically involves the purchase of securities directly from a publicly traded company in a private placement transaction. Securities purchased through PIPE transactions will be restricted from trading and considered illiquid until a resale registration statement for the shares is filed and declared effective.
At the current and/or prior period end, the Fund had commitments to purchase when-issued securities through PIPE transactions with SPACs. The commitments are contingent upon the SPACs acquiring the securities of target companies. Unrealized appreciation (depreciation) on any commitments outstanding at period end is separately presented in the Statements of Assets and Liabilities as Unrealized appreciation (depreciation) on unfunded commitments, and any change in unrealized appreciation (depreciation) on unfunded commitments during the period is separately presented in the Statement of Operations, as applicable.
4. Derivative Instruments.
Risk Exposures and the Use of Derivative Instruments. The Fund's investment objectives allow for various types of derivative instruments, including futures contracts. Derivatives are investments whose value is primarily derived from underlying assets, indices or reference rates and may be transacted on an exchange or over-the-counter (OTC). Derivatives may involve a future commitment to buy or sell a specified asset based on specified terms, to exchange future cash flows at periodic intervals based on a notional principal amount, or for one party to make one or more payments upon the occurrence of specified events in exchange for periodic payments from the other party.
Derivatives were used to increase returns and to manage exposure to certain risks as defined below. The success of any strategy involving derivatives depends on analysis of numerous economic factors, and if the strategies for investment do not work as intended, the objectives may not be achieved.
Derivatives were used to increase or decrease exposure to the following risk(s):
| | |
| Equity Risk | Equity risk relates to the fluctuations in the value of financial instruments as a result of changes in market prices (other than those arising from interest rate risk or foreign exchange risk), whether caused by factors specific to an individual investment, its issuer, or all factors affecting all instruments traded in a market or market segment. |
Funds are also exposed to additional risks from investing in derivatives, such as liquidity risk and counterparty credit risk. Liquidity risk is the risk that a fund will be unable to close out the derivative in the open market in a timely manner. Counterparty credit risk is the risk that the counterparty will not be able to fulfill its obligation to a fund. Counterparty credit risk related to exchange-traded contracts may be mitigated by the protection provided by the exchange on which they trade.
Investing in derivatives may involve greater risks than investing in the underlying assets directly and, to varying degrees, may involve risk of loss in excess of any initial investment and collateral received and amounts recognized in the Statement of Assets and Liabilities. In addition, there may be the risk that the change in value of the derivative contract does not correspond to the change in value of the underlying instrument.
Futures Contracts. A futures contract is an agreement between two parties to buy or sell a specified underlying instrument for a fixed price at a specified future date. Futures contracts were used to manage exposure to the stock market.
Upon entering into a futures contract, a fund is required to deposit either cash or securities (initial margin) with a clearing broker in an amount equal to a certain percentage of the face value of the contract. Futures contracts are marked-to-market daily and subsequent daily payments are made or received by a fund depending on the daily fluctuations in the value of the futures contracts and are recorded as unrealized appreciation or (depreciation). This receivable and/or payable, if any, is included in daily variation margin on futures contracts in the Statement of Assets and Liabilities. Realized gain or (loss) is recorded upon the expiration or closing of a futures contract. The net realized gain (loss) and change in net unrealized appreciation (depreciation) on futures contracts during the period is presented in the Statement of Operations.
Any open futures contracts at period end are presented in the Schedule of Investments under the caption "Futures Contracts". The notional amount at value reflects each contract's exposure to the underlying instrument or index at period end, and is representative of volume of activity during the period unless an average notional amount is presented. Any securities deposited to meet initial margin requirements are identified in the Schedule of Investments. Any cash deposited to meet initial margin requirements is presented as segregated cash with brokers for derivative instruments in the Statement of Assets and Liabilities.
5. Purchases and Sales of Investments.
Purchases and sales of securities, other than short-term securities, U.S. government securities and in-kind transactions, as applicable, are noted in the table below.
| | Purchases ($) | Sales ($) |
| Fidelity Stock Selector Small Cap Fund | 907,317 | 779,802 |
6. Fees and Other Transactions with Affiliates.
Management Fee. Fidelity Management & Research Company LLC (the investment adviser) and its affiliates provide the Fund with investment management related services for which the Fund pays a monthly management fee. The management fee is the sum of an individual fund fee rate that is based on an annual rate of .35% of the Fund's average net assets and an annualized group fee rate that averaged .23% during the period. The group fee rate is based upon the monthly average net assets of a group of registered investment companies with which the investment adviser has management contracts. The group fee rate decreases as assets under management increase and increases as assets under management decrease. In addition, the management fee is subject to a performance adjustment (up to a maximum of +/- .20% of the Fund's average net assets over a 36 month performance period). The upward or downward adjustment to the management fee is based on the relative investment performance of Stock Selector Small Cap Fund as compared to its benchmark index, the Russell 2000 Index, over the same 36 month performance period. For the reporting period, the total annual management fee rate, including the performance adjustment, was .73% of the Fund's average net assets. The performance adjustment included in the management fee rate may be higher or lower than the maximum performance adjustment rate due to the difference between the average net assets for the reporting and performance periods.
Distribution and Service Plan Fees. In accordance with Rule 12b-1 of the 1940 Act, the Fund has adopted separate Distribution and Service Plans for each class of shares. Certain classes pay Fidelity Distributors Company LLC (FDC), an affiliate of the investment adviser, separate Distribution and Service Fees, each of which is based on an annual percentage of each class' average net assets. In addition, FDC may pay financial intermediaries for selling shares of the Fund and providing shareholder support services. For the period, the Distribution and Service Fee rates, total fees and amounts retained by FDC were as follows:
| | Distribution Fee | Service Fee | Total Fees | Retained by FDC |
| Class A | - % | .25% | $256 | $15 |
| Class M | .25% | .25% | 75 | - |
| Class C | .75% | .25% | 167 | 54 |
| | | | $498 | $69 |
Sales Load. FDC may receive a front-end sales charge of up to 5.75% for selling Class A shares and 3.50% for selling Class M shares, some of which is paid to financial intermediaries for selling shares of the Fund. Depending on the holding period, FDC may receive contingent deferred sales charges levied on Class A, Class M and Class C redemptions. The deferred sales charges are 1.00% for Class C shares, 1.00% for certain purchases of Class A shares and .25% for certain purchases of Class M shares.
For the period, sales charge amounts retained by FDC were as follows:
| | Retained by FDC |
| Class A | $59 |
| Class M | 5 |
Class C (a) | - (b) |
| | $64 |
a When Class C shares are initially sold, FDC pays commissions from its own resources to financial intermediaries through which the sales are made.
b In the amount of less than five-hundred dollars.
Transfer Agent Fees. Fidelity Investments Institutional Operations Company LLC (FIIOC), an affiliate of the investment adviser, is the transfer, dividend disbursing and shareholder servicing agent for each class of the Fund. FIIOC receives account fees and asset-based fees that vary according to the account size and type of account of the shareholders of the respective classes of the Fund except for Class Z. FIIOC receives an asset-based fee of Class Z's average net assets. FIIOC pays for typesetting, printing and mailing of shareholder reports, except proxy statements.
For the period, transfer agent fees for each class were as follows:
| | Amount | % of Class-Level Average Net Assets |
| Class A | $199 | .19 |
| Class M | 32 | .22 |
| Class C | 38 | .23 |
| Stock Selector Small Cap | 2,346 | .16 |
| Class I | 511 | .17 |
| Class Z | 81 | .04 |
| | $3,207 | |
Accounting Fees. Fidelity Service Company, Inc. (FSC), an affiliate of the investment adviser, maintains the Fund's accounting records. The accounting fee is based on the level of average net assets for each month. For the period, the fees were equivalent to the following annual rates:
| | % of Average Net Assets |
| Fidelity Stock Selector Small Cap Fund | .03 |
Brokerage Commissions. A portion of portfolio transactions were placed with brokerage firms which are affiliates of the investment adviser. Brokerage commissions are included in net realized gain (loss) and change in net unrealized appreciation (depreciation) in the Statement of Operations. The commissions paid to these affiliated firms were as follows:
| | Amount |
| Fidelity Stock Selector Small Cap Fund | $33 |
Interfund Trades. Funds may purchase from or sell securities to other Fidelity Funds under procedures adopted by the Board. The procedures have been designed to ensure these interfund trades are executed in accordance with Rule 17a-7 of the 1940 Act. Any interfund trades are included within the respective purchases and sales amounts shown in the Purchases and Sales of Investments note. Interfund trades during the period are noted in the table below.
| | Purchases ($) | Sales ($) | Realized Gain (Loss) ($) |
| Fidelity Stock Selector Small Cap Fund | 70,965 | 56,623 | 691 |
7. Committed Line of Credit.
Certain Funds participate with other funds managed by the investment adviser or an affiliate in a $4.25 billion credit facility (the "line of credit") to be utilized for temporary or emergency purposes to fund shareholder redemptions or for other short-term liquidity purposes. The participating funds have agreed to pay commitment fees on their pro-rata portion of the line of credit, which are reflected in Miscellaneous expenses on the Statement of Operations, and are listed below. During the period, there were no borrowings on this line of credit.
| | Amount |
| Fidelity Stock Selector Small Cap Fund | $4 |
8. Security Lending.
Funds lend portfolio securities from time to time in order to earn additional income. Lending agents are used, including National Financial Services (NFS), an affiliate of the investment adviser. Pursuant to a securities lending agreement, NFS will receive a fee, which is capped at 9.9% of a fund's daily lending revenue, for its services as lending agent. A fund may lend securities to certain qualified borrowers, including NFS. On the settlement date of the loan, a fund receives collateral (in the form of U.S. Treasury obligations, letters of credit and/or cash) against the loaned securities and maintains collateral in an amount not less than 100% of the market value of the loaned securities during the period of the loan. The market value of the loaned securities is determined at the close of business of a fund and any additional required collateral is delivered to a fund on the next business day. A fund or borrower may terminate the loan at any time, and if the borrower defaults on its obligation to return the securities loaned because of insolvency or other reasons, a fund may apply collateral received from the borrower against the obligation. A fund may experience delays and costs in recovering the securities loaned. Any cash collateral received is invested in the Fidelity Securities Lending Cash Central Fund. Any loaned securities are identified as such in the Schedule of Investments, and the value of loaned securities and cash collateral at period end, as applicable, are presented in the Statement of Assets and Liabilities. Security lending income represents the income earned on investing cash collateral, less rebates paid to borrowers and any lending agent fees associated with the loan, plus any premium payments received for lending certain types of securities. Security lending income is presented in the Statement of Operations as a component of income from Fidelity Central Funds. Affiliated security lending activity, if any, was as follows:
| | Total Security Lending Fees Paid to NFS | Security Lending Income From Securities Loaned to NFS | Value of Securities Loaned to NFS at Period End |
| Fidelity Stock Selector Small Cap Fund | $26 | $- (a) | $- |
a Amount represents less than five-hundred dollars.
9. Expense Reductions.
During the period the investment adviser or an affiliate reimbursed and/or waived a portion of fund-level operating expenses in the amount of $67.
10. Distributions to Shareholders.
Distributions to shareholders of each class were as follows:
| | Year ended October 31, 2022 | Year ended October 31, 2021 |
| Fidelity Stock Selector Small Cap Fund | | |
| Distributions to shareholders | | |
| Class A | $10,910 | $931 |
| Class M | 1,718 | 148 |
| Class C | 2,017 | 166 |
| Stock Selector Small Cap | 163,524 | 16,978 |
| Class I | 30,970 | 1,721 |
| Class Z | 17,022 | 1,153 |
Total | $226,161 | $21,097 |
11. Share Transactions.
Share transactions for each class were as follows and may contain in-kind transactions, automatic conversions between classes or exchanges between affiliated funds:
| | Shares | Shares | Dollars | Dollars |
| | Year ended October 31, 2022 | Year ended October 31, 2021 | Year ended October 31, 2022 | Year ended October 31, 2021 |
| Fidelity Stock Selector Small Cap Fund | | | | |
| Class A | | | | |
| Shares sold | 1,133 | 1,228 | $34,122 | $40,693 |
| Reinvestment of distributions | 335 | 31 | 10,563 | 885 |
| Shares redeemed | (787) | (483) | (22,689) | (16,024) |
| Net increase (decrease) | 681 | 776 | $21,996 | $25,554 |
| Class M | | | | |
| Shares sold | 105 | 183 | $3,024 | $5,810 |
| Reinvestment of distributions | 57 | 5 | 1,718 | 148 |
| Shares redeemed | (101) | (54) | (2,857) | (1,685) |
| Net increase (decrease) | 61 | 134 | $1,885 | $4,273 |
| Class C | | | | |
| Shares sold | 188 | 320 | $4,875 | $9,363 |
| Reinvestment of distributions | 73 | 7 | 2,015 | 166 |
| Shares redeemed | (186) | (102) | (4,677) | (3,021) |
| Net increase (decrease) | 75 | 225 | $2,213 | $6,508 |
| Stock Selector Small Cap | | | | |
| Shares sold | 8,023 | 13,890 | $252,902 | $464,016 |
| Reinvestment of distributions | 4,730 | 557 | 154,140 | 16,281 |
| Shares redeemed | (9,125) | (9,792) | (276,721) | (333,526) |
| Net increase (decrease) | 3,628 | 4,655 | $130,321 | $146,771 |
| Class I | | | | |
| Shares sold | 5,918 | 6,912 | $182,536 | $230,376 |
| Reinvestment of distributions | 921 | 56 | 30,204 | 1,648 |
| Shares redeemed | (4,531) | (2,098) | (138,056) | (70,410) |
| Net increase (decrease) | 2,308 | 4,870 | $74,684 | $161,614 |
| Class Z | | | | |
| Shares sold | 5,266 | 2,962 | $158,315 | $99,043 |
| Reinvestment of distributions | 462 | 37 | 15,122 | 1,098 |
| Shares redeemed | (2,223) | (770) | (65,320) | (26,990) |
| Net increase (decrease) | 3,505 | 2,229 | $108,117 | $73,151 |
12. Other.
A fund's organizational documents provide former and current trustees and officers with a limited indemnification against liabilities arising in connection with the performance of their duties to the fund. In the normal course of business, a fund may also enter into contracts that provide general indemnifications. A fund's maximum exposure under these arrangements is unknown as this would be dependent on future claims that may be made against a fund. The risk of material loss from such claims is considered remote.
13. Risk and Uncertainties.
Many factors affect a fund's performance. Developments that disrupt global economies and financial markets, such as pandemics, epidemics, outbreaks of infectious diseases, war, terrorism, and environmental disasters, may significantly affect a fund's investment performance. The effects of these developments to a fund will be impacted by the types of securities in which a fund invests, the financial condition, industry, economic sector, and geographic location of an issuer, and a fund's level of investment in the securities of that issuer.
To the Board of Trustees of Fidelity Capital Trust and Shareholders of Fidelity Stock Selector Small Cap Fund:
Opinion on the Financial Statements and Financial Highlights
We have audited the accompanying statement of assets and liabilities of Fidelity Stock Selector Small Cap Fund (the "Fund"), a fund of Fidelity Capital Trust, including the schedule of investments, as of October 31, 2022, the related statement of operations for the year then ended, the statement of changes in net assets for each of the two years in the period then ended, the financial highlights for each of the five years in the period then ended, and the related notes. In our opinion, the financial statements and financial highlights present fairly, in all material respects, the financial position of the Fund as of October 31, 2022, and the results of its operations for the year then ended, the changes in its net assets for each of the two years in the period then ended, and the financial highlights for each of the five years in the period then ended in conformity with accounting principles generally accepted in the United States of America.
Basis for Opinion
These financial statements and financial highlights are the responsibility of the Fund's management. Our responsibility is to express an opinion on the Fund's financial statements and financial highlights based on our audits. We are a public accounting firm registered with the Public Company Accounting Oversight Board (United States) (PCAOB) and are required to be independent with respect to the Fund in accordance with the U.S. federal securities laws and the applicable rules and regulations of the Securities and Exchange Commission and the PCAOB.
We conducted our audits in accordance with the standards of the PCAOB. Those standards require that we plan and perform the audit to obtain reasonable assurance about whether the financial statements and financial highlights are free of material misstatement, whether due to error or fraud. The Fund is not required to have, nor were we engaged to perform, an audit of its internal control over financial reporting. As part of our audits we are required to obtain an understanding of internal control over financial reporting but not for the purpose of expressing an opinion on the effectiveness of the Fund's internal control over financial reporting. Accordingly, we express no such opinion.
Our audits included performing procedures to assess the risks of material misstatement of the financial statements and financial highlights, whether due to error or fraud, and performing procedures that respond to those risks. Such procedures included examining, on a test basis, evidence regarding the amounts and disclosures in the financial statements and financial highlights. Our audits also included evaluating the accounting principles used and significant estimates made by management, as well as evaluating the overall presentation of the financial statements and financial highlights. Our procedures included confirmation of securities owned as of October 31, 2022, by correspondence with the custodian and brokers; when replies were not received from brokers, we performed other auditing procedures. We believe that our audits provide a reasonable basis for our opinion.
/s/ Deloitte & Touche LLP
Boston, Massachusetts
December 14, 2022
We have served as the auditor of one or more of the Fidelity investment companies since 1999.
The Trustees, Members of the Advisory Board (if any), and officers of the trust and fund, as applicable, are listed below. The Board of Trustees governs the fund and is responsible for protecting the interests of shareholders. The Trustees are experienced executives who meet periodically throughout the year to oversee the fund's activities, review contractual arrangements with companies that provide services to the fund, oversee management of the risks associated with such activities and contractual arrangements, and review the fund's performance. Each of the Trustees oversees 316 funds.
The Trustees hold office without limit in time except that (a) any Trustee may resign; (b) any Trustee may be removed by written instrument, signed by at least two-thirds of the number of Trustees prior to such removal; (c) any Trustee who requests to be retired or who has become incapacitated by illness or injury may be retired by written instrument signed by a majority of the other Trustees; and (d) any Trustee may be removed at any special meeting of shareholders by a two-thirds vote of the outstanding voting securities of the trust. Each Trustee who is not an interested person (as defined in the 1940 Act) of the trust and the fund is referred to herein as an Independent Trustee. Each Independent Trustee shall retire not later than the last day of the calendar year in which his or her 75th birthday occurs. The Independent Trustees may waive this mandatory retirement age policy with respect to individual Trustees. Officers and Advisory Board Members hold office without limit in time, except that any officer or Advisory Board Member may resign or may be removed by a vote of a majority of the Trustees at any regular meeting or any special meeting of the Trustees. Except as indicated, each individual has held the office shown or other offices in the same company for the past five years.
The fund's Statement of Additional Information (SAI) includes more information about the Trustees. To request a free copy, call Fidelity at 1-800-544-8544 if you're an individual investing directly with Fidelity, call 1-800-835-5092 if you're a plan sponsor or participant with Fidelity as your recordkeeper or call 1-877-208-0098 on institutional accounts or if you're an advisor or invest through one.
Experience, Skills, Attributes, and Qualifications of the Trustees. The Governance and Nominating Committee has adopted a statement of policy that describes the experience, qualifications, attributes, and skills that are necessary and desirable for potential Independent Trustee candidates (Statement of Policy). The Board believes that each Trustee satisfied at the time he or she was initially elected or appointed a Trustee, and continues to satisfy, the standards contemplated by the Statement of Policy. The Governance and Nominating Committee also engages professional search firms to help identify potential Independent Trustee candidates who have the experience, qualifications, attributes, and skills consistent with the Statement of Policy. From time to time, additional criteria based on the composition and skills of the current Independent Trustees, as well as experience or skills that may be appropriate in light of future changes to board composition, business conditions, and regulatory or other developments, have also been considered by the professional search firms and the Governance and Nominating Committee. In addition, the Board takes into account the Trustees' commitment and participation in Board and committee meetings, as well as their leadership of standing and ad hoc committees throughout their tenure.
In determining that a particular Trustee was and continues to be qualified to serve as a Trustee, the Board has considered a variety of criteria, none of which, in isolation, was controlling. The Board believes that, collectively, the Trustees have balanced and diverse experience, qualifications, attributes, and skills, which allow the Board to operate effectively in governing the fund and protecting the interests of shareholders. Information about the specific experience, skills, attributes, and qualifications of each Trustee, which in each case led to the Board's conclusion that the Trustee should serve (or continue to serve) as a trustee of the fund, is provided below.
Board Structure and Oversight Function. Robert A. Lawrence is an interested person and currently serves as Chair. The Trustees have determined that an interested Chair is appropriate and benefits shareholders because an interested Chair has a personal and professional stake in the quality and continuity of services provided to the fund. Independent Trustees exercise their informed business judgment to appoint an individual of their choosing to serve as Chair, regardless of whether the Trustee happens to be independent or a member of management. The Independent Trustees have determined that they can act independently and effectively without having an Independent Trustee serve as Chair and that a key structural component for assuring that they are in a position to do so is for the Independent Trustees to constitute a substantial majority for the Board. The Independent Trustees also regularly meet in executive session. David M. Thomas serves as Lead Independent Trustee and as such (i) acts as a liaison between the Independent Trustees and management with respect to matters important to the Independent Trustees and (ii) with management prepares agendas for Board meetings.
Fidelity ® funds are overseen by different Boards of Trustees. The fund's Board oversees Fidelity's high income and certain equity funds, and other Boards oversee Fidelity's investment-grade bond, money market, asset allocation, and other equity funds. The asset allocation funds may invest in Fidelity ® funds overseen by the fund's Board. The use of separate Boards, each with its own committee structure, allows the Trustees of each group of Fidelity ® funds to focus on the unique issues of the funds they oversee, including common research, investment, and operational issues. On occasion, the separate Boards establish joint committees to address issues of overlapping consequences for the Fidelity ® funds overseen by each Board.
The Trustees operate using a system of committees to facilitate the timely and efficient consideration of all matters of importance to the Trustees, the fund, and fund shareholders and to facilitate compliance with legal and regulatory requirements and oversight of the fund's activities and associated risks. The Board, acting through its committees, has charged FMR and its affiliates with (i) identifying events or circumstances the occurrence of which could have demonstrably adverse effects on the fund's business and/or reputation; (ii) implementing processes and controls to lessen the possibility that such events or circumstances occur or to mitigate the effects of such events or circumstances if they do occur; and (iii) creating and maintaining a system designed to evaluate continuously business and market conditions in order to facilitate the identification and implementation processes described in (i) and (ii) above. Because the day-to-day operations and activities of the fund are carried out by or through FMR, its affiliates, and other service providers, the fund's exposure to risks is mitigated but not eliminated by the processes overseen by the Trustees. While each of the Board's committees has responsibility for overseeing different aspects of the fund's activities, oversight is exercised primarily through the Operations, Audit, and Compliance Committees. Appropriate personnel, including but not limited to the fund's Chief Compliance Officer (CCO), FMR's internal auditor, the independent accountants, the fund's Treasurer and portfolio management personnel, make periodic reports to the Board's committees, as appropriate, including an annual review of Fidelity's risk management program for the Fidelity ® funds. The responsibilities of each standing committee, including their oversight responsibilities, are described further under "Standing Committees of the Trustees."
Interested Trustees*:
Correspondence intended for a Trustee who is an interested person may be sent to Fidelity Investments, 245 Summer Street, Boston, Massachusetts 02210.
Name, Year of Birth; Principal Occupations and Other Relevant Experience+
Bettina Doulton (1964)
Year of Election or Appointment: 2020
Trustee
Ms. Doulton also serves as Trustee of other Fidelity ® funds. Prior to her retirement, Ms. Doulton served in a variety of positions at Fidelity Investments, including as a managing director of research (2006-2007), portfolio manager to certain Fidelity ® funds (1993-2005), equity analyst and portfolio assistant (1990-1993), and research assistant (1987-1990). Ms. Doulton currently owns and operates Phi Builders + Architects and Cellardoor Winery. Previously, Ms. Doulton served as a member of the Board of Brown Capital Management, LLC (2014-2018).
Robert A. Lawrence (1952)
Year of Election or Appointment: 2020
Trustee
Chair of the Board of Trustees
Mr. Lawrence also serves as Trustee of other funds. Previously, Mr. Lawrence served as a Trustee and Member of the Advisory Board of certain funds. Prior to his retirement in 2008, Mr. Lawrence served as Vice President of certain Fidelity ® funds (2006-2008), Senior Vice President, Head of High Income Division of Fidelity Management & Research Company (investment adviser firm, 2006-2008), and President of Fidelity Strategic Investments (investment adviser firm, 2002-2005).
* Determined to be an "Interested Trustee" by virtue of, among other things, his or her affiliation with the trust or various entities under common control with FMR.
+ The information includes the Trustee's principal occupation during the last five years and other information relating to the experience, attributes, and skills relevant to the Trustee's qualifications to serve as a Trustee, which led to the conclusion that the Trustee should serve as a Trustee for the fund.
Independent Trustees:
Correspondence intended for an Independent Trustee may be sent to Fidelity Investments, P.O. Box 55235, Boston, Massachusetts 02205-5235.
Name, Year of Birth; Principal Occupations and Other Relevant Experience+
Thomas P. Bostick (1956)
Year of Election or Appointment: 2021
Trustee
Lieutenant General Bostick also serves as Trustee of other Fidelity ® funds. Prior to his retirement, General Bostick (United States Army, Retired) held a variety of positions within the U.S. Army, including Commanding General and Chief of Engineers, U.S. Army Corps of Engineers (2012-2016) and Deputy Chief of Staff and Director of Human Resources, U.S. Army (2009-2012). General Bostick currently serves as a member of the Board and Finance and Governance Committees of CSX Corporation (transportation, 2020-present) and a member of the Board and Corporate Governance and Nominating Committee of Perma-Fix Environmental Services, Inc. (nuclear waste management, 2020-present). General Bostick serves as Chief Executive Officer of Bostick Global Strategies, LLC (consulting, 2016-present) and as a member of the Board of HireVue, Inc. (video interview and assessment, 2020-present). Previously, General Bostick served as a Member of the Advisory Board of certain Fidelity® funds (2021), President, Intrexon Bioengineering (2018-2020) and Chief Operating Officer (2017-2020) and Senior Vice President of the Environment Sector (2016-2017) of Intrexon Corporation (biopharmaceutical company).
Dennis J. Dirks (1948)
Year of Election or Appointment: 2005
Trustee
Mr. Dirks also serves as Trustee of other Fidelity ® funds. Prior to his retirement in May 2003, Mr. Dirks served as Chief Operating Officer and as a member of the Board of The Depository Trust & Clearing Corporation (financial markets infrastructure), President, Chief Operating Officer and a member of the Board of The Depository Trust Company (DTC), President and a member of the Board of the National Securities Clearing Corporation (NSCC), Chief Executive Officer and a member of the Board of the Government Securities Clearing Corporation and Chief Executive Officer and a member of the Board of the Mortgage-Backed Securities Clearing Corporation. Mr. Dirks currently serves as a member of the Finance Committee (2016-present) and Board (2017-present) and is Treasurer (2018-present) of the Asolo Repertory Theatre.
Donald F. Donahue (1950)
Year of Election or Appointment: 2018
Trustee
Mr. Donahue also serves as Trustee of other Fidelity ® funds. Mr. Donahue serves as President and Chief Executive Officer of Miranda Partners, LLC (risk consulting for the financial services industry, 2012-present). Previously, Mr. Donahue served as Chief Executive Officer (2006-2012), Chief Operating Officer (2003-2006) and Managing Director, Customer Marketing and Development (1999-2003) of The Depository Trust & Clearing Corporation (financial markets infrastructure). Mr. Donahue currently serves as a member (2007-present) and Co-Chairman (2016-present) of the Board of United Way of New York and a member of the Board of The Leadership Academy (previously NYC Leadership Academy) (2012-present). Mr. Donahue previously served as a member of the Advisory Board of certain Fidelity® funds (2015-2018).
Vicki L. Fuller (1957)
Year of Election or Appointment: 2020
Trustee
Ms. Fuller also serves as Trustee of other Fidelity ® funds. Previously, Ms. Fuller served as a member of the Advisory Board of certain Fidelity ® funds (2018-2020), Chief Investment Officer of the New York State Common Retirement Fund (2012-2018) and held a variety of positions at AllianceBernstein L.P. (global asset management, 1985-2012), including Managing Director (2006-2012) and Senior Vice President and Senior Portfolio Manager (2001-2006). Ms. Fuller currently serves as a member of the Board, Audit Committee and Nominating and Governance Committee of two Blackstone business development companies (2020-present), as a member of the Board of Treliant, LLC (consulting, 2019-present), as a member of the Advisory Board of Ariel Alternatives, LLC (private equity, 2021-present) and as a member of the Board and Chair of the Audit Committee of Gusto, Inc. (software, 2021-present). In addition, Ms. Fuller currently serves as a member of the Board of Roosevelt University (2019-present) and as a member of the Executive Board of New York University's Stern School of Business. Ms. Fuller previously served as a member of the Board, Audit Committee and Nominating and Governance Committee of The Williams Companies, Inc. (natural gas infrastructure, 2018-2021).
Patricia L. Kampling (1959)
Year of Election or Appointment: 2020
Trustee
Ms. Kampling also serves as Trustee of other Fidelity ® funds. Prior to her retirement, Ms. Kampling served as Chairman of the Board and Chief Executive Officer (2012-2019), President and Chief Operating Officer (2011-2012) and Executive Vice President and Chief Financial Officer (2010-2011) of Alliant Energy Corporation. Ms. Kampling currently serves as a member of the Board, Finance Committee and Governance, Compensation and Nominating Committee of Xcel Energy Inc. (utilities company, 2020-present) and as a member of the Board, Audit, Finance and Risk Committee and Safety, Environmental, Technology and Operations Committee and Chair of the Executive Development and Compensation Committee of American Water Works Company, Inc. (utilities company, 2019-present). In addition, Ms. Kampling currently serves as a member of the Board of the Nature Conservancy, Wisconsin Chapter (2019-present). Previously, Ms. Kampling served as a Member of the Advisory Board of certain Fidelity® funds (2020), a member of the Board, Compensation Committee and Executive Committee and Chair of the Audit Committee of Briggs & Stratton Corporation (manufacturing, 2011-2021), a member of the Board of Interstate Power and Light Company (2012-2019) and Wisconsin Power and Light Company (2012-2019) (each a subsidiary of Alliant Energy Corporation) and as a member of the Board and Workforce Development Committee of the Business Roundtable (2018-2019).
Thomas A. Kennedy (1955)
Year of Election or Appointment: 2021
Trustee
Mr. Kennedy also serves as Trustee of other Fidelity ® funds. Previously, Mr. Kennedy served as a Member of the Advisory Board of certain Fidelity ® funds (2020) and held a variety of positions at Raytheon Company (aerospace and defense, 1983-2020), including Chairman and Chief Executive Officer (2014-2020) and Executive Vice President and Chief Operating Officer (2013-2014). Mr. Kennedy currently serves as Executive Chairman of the Board of Directors of Raytheon Technologies Corporation (aerospace and defense, 2020-present). He is also a member of the Rutgers School of Engineering Industry Advisory Board (2011-present) and a member of the UCLA Engineering Dean's Executive Board (2016-present).
Oscar Munoz (1959)
Year of Election or Appointment: 2021
Trustee
Mr. Munoz also serves as Trustee of other Fidelity ® funds. Prior to his retirement, Mr. Munoz served as Executive Chairman (2020-2021), Chief Executive Officer (2015-2020), President (2015-2016) and a member of the Board (2010-2021) of United Airlines Holdings, Inc. Mr. Munoz currently serves as a member of the Board of CBRE Group, Inc. (commercial real estate, 2020-present), a member of the Board of Univision Communications, Inc. (Hispanic media, 2020-present) and a member of the Advisory Board of Salesforce.com, Inc. (cloud-based software, 2020-present). Previously, Mr. Munoz served as a Member of the Advisory Board of certain Fidelity ® funds (2021).
Garnett A. Smith (1947)
Year of Election or Appointment: 2018
Trustee
Mr. Smith also serves as Trustee of other Fidelity ® funds. Prior to his retirement, Mr. Smith served as Chairman and Chief Executive Officer (1990-1997) and President (1986-1990) of Inbrand Corp. (manufacturer of personal absorbent products). Prior to his employment with Inbrand Corp., he was employed by a retail fabric chain and North Carolina National Bank (now Bank of America). Mr. Smith previously served as a member of the Advisory Board of certain Fidelity ® funds (2012-2013).
David M. Thomas (1949)
Year of Election or Appointment: 2008
Trustee
Lead Independent Trustee
Mr. Thomas also serves as Trustee of other Fidelity ® funds. Previously, Mr. Thomas served as Executive Chairman (2005-2006) and Chairman and Chief Executive Officer (2000-2005) of IMS Health, Inc. (pharmaceutical and healthcare information solutions). Mr. Thomas currently serves as a member of the Board of Fortune Brands Home and Security (home and security products, 2004-present) and as Director (2013-present) and Non-Executive Chairman of the Board (2022-present) of Interpublic Group of Companies, Inc. (marketing communication).
Susan Tomasky (1953)
Year of Election or Appointment: 2020
Trustee
Ms. Tomasky also serves as Trustee of other Fidelity ® funds. Prior to her retirement, Ms. Tomasky served in various executive officer positions at American Electric Power Company, Inc. (1998-2011), including most recently as President of AEP Transmission (2007-2011). Ms. Tomasky currently serves as a member of the Board and Sustainability Committee and as Chair of the Audit Committee of Marathon Petroleum Corporation (2018-present) and as a member of the Board, Executive Committee, Corporate Governance Committee and Organization and Compensation Committee and as Chair of the Audit Committee of Public Service Enterprise Group, Inc. (utilities company, 2012-present) and as a member of the Board of its subsidiary company, Public Service Electric and Gas Co. (2021-present). In addition, Ms. Tomasky currently serves as a member (2009-present) and President (2020-present) of the Board of the Royal Shakespeare Company - America (2009-present), as a member of the Board of the Columbus Association for the Performing Arts (2011-present) and as a member of the Board and Kenyon in the World Committee of Kenyon College (2016-present). Previously, Ms. Tomasky served as a Member of the Advisory Board of certain Fidelity ® funds (2020), as a member of the Board of the Columbus Regional Airport Authority (2007-2020), as a member of the Board (2011-2018) and Lead Independent Director (2015-2018) of Andeavor Corporation (previously Tesoro Corporation) (independent oil refiner and marketer) and as a member of the Board of Summit Midstream Partners LP (energy, 2012-2018).
Michael E. Wiley (1950)
Year of Election or Appointment: 2018
Trustee
Mr. Wiley also serves as Trustee of other Fidelity ® funds. Previously, Mr. Wiley served as a member of the Advisory Board of certain Fidelity ® funds (2018-2020), Chairman, President and CEO of Baker Hughes, Inc. (oilfield services, 2000-2004). Mr. Wiley also previously served as a member of the Board of Andeavor Corporation (independent oil refiner and marketer, 2005-2018), a member of the Board of Andeavor Logistics LP (natural resources logistics, 2015-2018) and a member of the Board of High Point Resources (exploration and production, 2005-2020).
+ The information includes the Trustee's principal occupation during the last five years and other information relating to the experience, attributes, and skills relevant to the Trustee's qualifications to serve as a Trustee, which led to the conclusion that the Trustee should serve as a Trustee for the fund.
Advisory Board Members and Officers:
Correspondence intended for a Member of the Advisory Board (if any) may be sent to Fidelity Investments, P.O. Box 55235, Boston, Massachusetts 02205-5235. Correspondence intended for an officer or Peter S. Lynch may be sent to Fidelity Investments, 245 Summer Street, Boston, Massachusetts 02210. Officers appear below in alphabetical order.
Name, Year of Birth; Principal Occupation
Peter S. Lynch (1944)
Year of Election or Appointment: 2003
Member of the Advisory Board
Mr. Lynch also serves as a Member of the Advisory Board of other Fidelity ® funds. Mr. Lynch is Vice Chairman and a Director of Fidelity Management & Research Company LLC (investment adviser firm). In addition, Mr. Lynch serves as a Trustee of Boston College and as the Chairman of the Inner-City Scholarship Fund. Previously, Mr. Lynch served as Vice Chairman and a Director of FMR Co., Inc. (investment adviser firm) and on the Special Olympics International Board of Directors (1997-2006).
Craig S. Brown (1977)
Year of Election or Appointment: 2022
Deputy Treasurer
Mr. Brown also serves as an officer of other funds. Mr. Brown serves as Assistant Treasurer of FIMM, LLC (2021-present) and is an employee of Fidelity Investments (2013-present). Previously, Mr. Brown served as Assistant Treasurer of certain Fidelity ® funds (2019-2022).
John J. Burke III (1964)
Year of Election or Appointment: 2018
Chief Financial Officer
Mr. Burke also serves as Chief Financial Officer of other funds. Mr. Burke serves as Head of Investment Operations for Fidelity Fund and Investment Operations (2018-present) and is an employee of Fidelity Investments (1998-present). Previously Mr. Burke served as head of Asset Management Investment Operations (2012-2018).
William C. Coffey (1969)
Year of Election or Appointment: 2019
Assistant Secretary
Mr. Coffey also serves as Assistant Secretary of other funds. He is Senior Vice President and Deputy General Counsel of FMR LLC (diversified financial services company, 2010-present), and is an employee of Fidelity Investments. Previously, Mr. Coffey served as Secretary and CLO of certain funds (2018-2019); CLO, Secretary, and Senior Vice President of Fidelity Management & Research Company and FMR Co., Inc. (investment adviser firms, 2018-2019); Secretary of Fidelity SelectCo, LLC and Fidelity Investments Money Management, Inc. (investment adviser firms, 2018-2019); CLO of Fidelity Management & Research (Hong Kong) Limited, FMR Investment Management (UK) Limited, and Fidelity Management & Research (Japan) Limited (investment adviser firms, 2018-2019); and Assistant Secretary of certain funds (2009-2018).
Timothy M. Cohen (1969)
Year of Election or Appointment: 2018
Vice President
Mr. Cohen also serves as Vice President of other funds. Mr. Cohen serves as Co-Head of Equity (2018-present), a Director of Fidelity Management & Research (Japan) Limited (investment adviser firm, 2016-present), and is an employee of Fidelity Investments. Previously, Mr. Cohen served as Executive Vice President of Fidelity SelectCo, LLC (2019), Head of Global Equity Research (2016-2018), Chief Investment Officer - Equity and a Director of Fidelity Management & Research (U.K.) Inc. (investment adviser firm, 2013-2015) and as a Director of Fidelity Management & Research (Hong Kong) Limited (investment adviser firm, 2017).
Jonathan Davis (1968)
Year of Election or Appointment: 2010
Assistant Treasurer
Mr. Davis also serves as an officer of other funds. Mr. Davis serves as Assistant Treasurer of FIMM, LLC (2021-present), FMR Capital, Inc. (2017-present), FD Funds GP LLC (2021-present), FD Funds Holding LLC (2021-present), and FD Funds Management LLC (2021-present); and is an employee of Fidelity Investments. Previously, Mr. Davis served as Vice President and Associate General Counsel of FMR LLC (diversified financial services company, 2003-2010).
Laura M. Del Prato (1964)
Year of Election or Appointment: 2018
Assistant Treasurer
Ms. Del Prato also serves as an officer of other funds. Ms. Del Prato serves as Assistant Treasurer of FIMM, LLC (2021-present) and is an employee of Fidelity Investments (2017-present). Previously, Ms. Del Prato served as President and Treasurer of The North Carolina Capital Management Trust: Cash Portfolio and Term Portfolio (2018-2020). Prior to joining Fidelity Investments, Ms. Del Prato served as a Managing Director and Treasurer of the JPMorgan Mutual Funds (2014-2017). Prior to JPMorgan, Ms. Del Prato served as a partner at Cohen Fund Audit Services (accounting firm, 2012-2013) and KPMG LLP (accounting firm, 2004-2012).
Colm A. Hogan (1973)
Year of Election or Appointment: 2020
Assistant Treasurer
Mr. Hogan also serves as an officer of other funds. Mr. Hogan serves as Assistant Treasurer of FIMM, LLC (2021-present) and FMR Capital, Inc. (2017-present) and is an employee of Fidelity Investments (2005-present). Previously, Mr. Hogan served as Deputy Treasurer of certain Fidelity ® funds (2016-2020) and Assistant Treasurer of certain Fidelity ® funds (2016-2018).
Pamela R. Holding (1964)
Year of Election or Appointment: 2018
Vice President
Ms. Holding also serves as Vice President of other funds. Ms. Holding serves as Co-Head of Equity (2018-present) and is an employee of Fidelity Investments (2013-present). Previously, Ms. Holding served as Executive Vice President of Fidelity SelectCo, LLC (2019) and as Chief Investment Officer of Fidelity Institutional Asset Management (2013-2018).
Cynthia Lo Bessette (1969)
Year of Election or Appointment: 2019
Secretary and Chief Legal Officer (CLO)
Ms. Lo Bessette also serves as an officer of other funds. Ms. Lo Bessette serves as CLO, Secretary, and Senior Vice President of Fidelity Management & Research Company LLC (investment adviser firm, 2019-present); CLO of Fidelity Management & Research (Hong Kong) Limited, FMR Investment Management (UK) Limited, and Fidelity Management & Research (Japan) Limited (investment adviser firms, 2019-present); Secretary of FD Funds GP LLC (2021-present), FD Funds Holding LLC (2021-present), FD Funds Management LLC (2021-present), and Fidelity Diversifying Solutions LLC (investment adviser firm, 2022-present); and Assistant Secretary of FIMM, LLC (2019-present). She is a Senior Vice President and Deputy General Counsel of FMR LLC (diversified financial services company, 2019-present), and is an employee of Fidelity Investments. Previously, Ms. Lo Bessette served as CLO, Secretary, and Senior Vice President of FMR Co., Inc. (investment adviser firm, 2019); Secretary of Fidelity SelectCo, LLC and Fidelity Investments Money Management, Inc. (investment adviser firms, 2019). Prior to joining Fidelity Investments, Ms. Lo Bessette was Executive Vice President, General Counsel (2016-2019) and Senior Vice President, Deputy General Counsel (2015-2016) of OppenheimerFunds (investment management company) and Deputy Chief Legal Officer (2013-2015) of Jennison Associates LLC (investment adviser firm).
Chris Maher (1972)
Year of Election or Appointment: 2020
Deputy Treasurer
Mr. Maher also serves as an officer of other funds. Mr. Maher serves as Assistant Treasurer of FIMM, LLC (2021-present) and FMR Capital, Inc. (2017-present), and is an employee of Fidelity Investments (2008-present). Previously, Mr. Maher served as Assistant Treasurer of certain funds (2013-2020); Vice President of Asset Management Compliance (2013), Vice President of the Program Management Group of FMR (investment adviser firm, 2010-2013), and Vice President of Valuation Oversight (2008-2010).
Jason P. Pogorelec (1975)
Year of Election or Appointment: 2020
Chief Compliance Officer
Mr. Pogorelec also serves as Chief Compliance Officer of other funds. Mr. Pogorelec is a senior Vice President of Asset Management Compliance for Fidelity Investments and is an employee of Fidelity Investments (2006-present). Previously, Mr. Pogorelec served as Vice President, Associate General Counsel for Fidelity Investments (2010-2020) and Assistant Secretary of certain Fidelity funds (2015-2020).
Brett Segaloff (1972)
Year of Election or Appointment: 2021
Anti-Money Laundering (AML) Officer
Mr. Segaloff also serves as an AML Officer of other funds and other related entities. He is Director, Anti-Money Laundering (2007-present) of FMR LLC (diversified financial services company) and is an employee of Fidelity Investments (1996-present).
Stacie M. Smith (1974)
Year of Election or Appointment: 2016
President and Treasurer
Ms. Smith also serves as an officer of other funds. Ms. Smith serves as Assistant Treasurer of FIMM, LLC (2021-present) and FMR Capital, Inc. (2017-present), is an employee of Fidelity Investments (2009-present), and has served in other fund officer roles. Prior to joining Fidelity Investments, Ms. Smith served as Senior Audit Manager of Ernst & Young LLP (accounting firm, 1996-2009). Previously, Ms. Smith served as Assistant Treasurer (2013-2019) and Deputy Treasurer (2013-2016) of certain Fidelity ® funds.
Jim Wegmann (1979)
Year of Election or Appointment: 2019
Assistant Treasurer
Mr. Wegmann also serves as an officer of other funds. Mr. Wegmann serves as Assistant Treasurer of FIMM, LLC (2021-present) and is an employee of Fidelity Investments (2011-present). Previously, Mr. Wegmann served as Assistant Treasurer of certain Fidelity ® funds (2019-2021).
As a shareholder, you incur two types of costs: (1) transaction costs, which may include sales charges (loads) on purchase payments or redemption proceeds, as applicable and (2) ongoing costs, which generally include management fees, distribution and/or service (12b-1) fees and other Fund expenses. This Example is intended to help you understand your ongoing costs (in dollars) of investing in a fund and to compare these costs with the ongoing costs of investing in other mutual funds.
| The Example is based on an investment of $1,000 invested at the beginning of the period and held for the entire period (May 1, 2022 to October 31, 2022). |
Actual Expenses
The first line of the accompanying table provides information about actual account values and actual expenses. You may use the information in this line, together with the amount you invested, to estimate the expenses that you paid over the period. Simply divide your account value by $1,000.00 (for example, an $8,600 account value divided by $1,000.00 = 8.6), then multiply the result by the number in the first line for a class/Fund under the heading entitled "Expenses Paid During Period" to estimate the expenses you paid on your account during this period. If any fund is a shareholder of any underlying mutual funds or exchange-traded funds (ETFs) (the Underlying Funds), such fund indirectly bears its proportional share of the expenses of the Underlying Funds in addition to the direct expenses incurred presented in the table. These fees and expenses are not included in the annualized expense ratio used to calculate the expense estimate in the table below.
Hypothetical Example for Comparison Purposes
The second line of the accompanying table provides information about hypothetical account values and hypothetical expenses based on the actual expense ratio and an assumed rate of return of 5% per year before expenses, which is not the actual return. The hypothetical account values and expenses may not be used to estimate the actual ending account balance or expenses you paid for the period. You may use this information to compare the ongoing costs of investing in the Fund and other funds. To do so, compare this 5% hypothetical example with the 5% hypothetical examples that appear in the shareholder reports of the other funds. If any fund is a shareholder of any Underlying Funds, such fund indirectly bears its proportional share of the expenses of the Underlying Funds in addition to the direct expenses as presented in the table. These fees and expenses are not included in the annualized expense ratio used to calculate the expense estimate in the table below.
Please note that the expenses shown in the table are meant to highlight your ongoing costs only and do not reflect any transaction costs. Therefore, the second line of the table is useful in comparing ongoing costs only, and will not help you determine the relative total costs of owning different funds. In addition, if these transactional costs were included, your costs would have been higher.
| | | | | Annualized Expense Ratio- A | | Beginning Account Value May 1, 2022 | | Ending Account Value October 31, 2022 | | Expenses Paid During Period- C May 1, 2022 to October 31, 2022 |
| Fidelity® Stock Selector Small Cap Fund | | | | | | | | | | |
| Class A | | | | 1.22% | | | | | | |
| Actual | | | | | | $ 1,000 | | $ 996.40 | | $ 6.14 |
Hypothetical- B | | | | | | $ 1,000 | | $ 1,019.06 | | $ 6.21 |
| Class M | | | | 1.50% | | | | | | |
| Actual | | | | | | $ 1,000 | | $ 994.70 | | $ 7.54 |
Hypothetical- B | | | | | | $ 1,000 | | $ 1,017.64 | | $ 7.63 |
| Class C | | | | 2.01% | | | | | | |
| Actual | | | | | | $ 1,000 | | $ 992.10 | | $ 10.09 |
Hypothetical- B | | | | | | $ 1,000 | | $ 1,015.07 | | $ 10.21 |
| Fidelity® Stock Selector Small Cap Fund | | | | .95% | | | | | | |
| Actual | | | | | | $ 1,000 | | $ 997.50 | | $ 4.78 |
Hypothetical- B | | | | | | $ 1,000 | | $ 1,020.42 | | $ 4.84 |
| Class I | | | | .95% | | | | | | |
| Actual | | | | | | $ 1,000 | | $ 997.60 | | $ 4.78 |
Hypothetical- B | | | | | | $ 1,000 | | $ 1,020.42 | | $ 4.84 |
| Class Z | | | | .82% | | | | | | |
| Actual | | | | | | $ 1,000 | | $ 998.30 | | $ 4.13 |
Hypothetical- B | | | | | | $ 1,000 | | $ 1,021.07 | | $ 4.18 |
| |
A Annualized expense ratio reflects expenses net of applicable fee waivers.
B 5% return per year before expenses
C Expenses are equal to the annualized expense ratio, multiplied by the average account value over the period, multiplied by 184/ 365 (to reflect the one-half year period). The fees and expenses of any Underlying Funds are not included in each annualized expense ratio.
The dividend and capital gains distributions for the fund(s) are available on Fidelity.com or Institutional.Fidelity.com.
The fund designates 99.96% of the short-term capital gain dividend distributed in December during the fiscal year as qualifying to be taxed as short-term capital gain dividends for nonresident alien shareholders.
Fidelity Stock Selector Small Cap Fund designates 33%; Class A designates 38%; Class M designates 44%; Class C designates 58%; Class I designates 33%; and Class Z designates 31% of the dividend distributed in December during the fiscal year as qualifying for the dividends-received deduction for corporate shareholders.
Fidelity Stock Selector Small Cap Fund designates 35%; Class A designates 40%; Class M designates 46%; Class C designates 61%; Class I designates 35%; and Class Z designates 33% of the dividend distributed in December during the fiscal year as amounts which may be taken into account as a dividend for purposes of the maximum rate under section 1(h)(11) of the Internal Revenue Code.
Fidelity Stock Selector Small Cap Fund designates 5%; Class A designates 5%; Class M designates 6%; Class C designates 8%; Class I designates 5%; and Class Z designates 4% of the dividend distributed in December during the fiscal year as a section 199A dividend.
The fund will notify shareholders in January 2023 of amounts for use in preparing 2022 income tax returns.
Fidelity Stock Selector Small Cap Fund
Each year, the Board of Trustees, including the Independent Trustees (together, the Board), votes on the renewal of the management contract with Fidelity Management & Research Company LLC (FMR) and the sub-advisory agreements (together, the Advisory Contracts) for the fund. FMR and the sub-advisers are referred to herein as the Investment Advisers. The Board, assisted by the advice of fund counsel and Independent Trustees' counsel, requests and considers a broad range of information relevant to the renewal of the Advisory Contracts throughout the year.
The Board meets regularly and, at each of its meetings, covers an extensive agenda of topics and materials and considers factors that are relevant to its annual consideration of the renewal of the fund's Advisory Contracts, including the services and support provided to the fund and its shareholders. The Board has established various standing committees (Committees), each composed of and chaired by Independent Trustees with varying backgrounds, to which the Board has assigned specific subject matter responsibilities in order to enhance effective decision-making by the Board. The Board, acting directly and through its Committees, requests and receives information concerning the annual consideration of the renewal of the fund's Advisory Contracts. The Board also meets as needed to review matters specifically related to the Board's annual consideration of the renewal of the Advisory Contracts. Members of the Board may also meet with trustees of other Fidelity funds through joint ad hoc committees to discuss certain matters relevant to all of the Fidelity funds.
At its May 2022 meeting, the Board unanimously determined to renew the fund's Advisory Contracts. In reaching its determination, the Board considered all factors it believed relevant, including (i) the nature, extent, and quality of the services provided to the fund and its shareholders (including the investment performance of the fund); (ii) the competitiveness relative to peer funds of the fund's management fee and total expense ratio of a representative class (retail class); (iii) the total costs of the services provided by and the profits realized by Fidelity from its relationships with the fund; and (iv) the extent to which, if any, economies of scale exist and are realized as the fund grows, and whether any economies of scale are appropriately shared with fund shareholders.
In considering whether to renew the Advisory Contracts for the fund, the Board reached a determination, with the assistance of fund counsel and Independent Trustees' counsel and through the exercise of its business judgment, that the renewal of the Advisory Contracts was in the best interests of the fund and its shareholders and that the compensation payable under the Advisory Contracts was fair and reasonable. The Board's decision to renew the Advisory Contracts was not based on any single factor, but rather was based on a comprehensive consideration of all the information provided to the Board at its meetings throughout the year. The Board, in reaching its determination to renew the Advisory Contracts, was aware that shareholders of the fund have a broad range of investment choices available to them, including a wide choice among funds offered by Fidelity's competitors, and that the fund's shareholders, who have the opportunity to review and weigh the disclosure provided by the fund in its prospectus and other public disclosures, have chosen to invest in this fund, which is part of the Fidelity family of funds.
Nature, Extent, and Quality of Services Provided . The Board considered Fidelity's staffing as it relates to the fund, including the backgrounds of investment personnel of Fidelity, and also considered the fund's investment objective, strategies, and related investment philosophy. The Independent Trustees also had discussions with senior management of Fidelity's investment operations and investment groups. The Board considered the structure of the investment personnel compensation program and whether this structure provides appropriate incentives to act in the best interests of the fund. Additionally, the Board considered the portfolio managers' investments, if any, in the funds that they manage. The Board also considered the steps Fidelity had taken to ensure the continued provision of high quality services to the Fidelity funds during the COVID-19 pandemic, including the expansion of staff in client facing positions to maintain service levels in periods of high volumes and volatility.
Resources Dedicated to Investment Management and Support Services . The Board and the Fund Oversight and Research Committees reviewed the general qualifications and capabilities of Fidelity's investment staff, including its size, education, experience, and resources, as well as Fidelity's approach to recruiting, training, managing, and compensating investment personnel. The Board noted the resources devoted to expansion of Fidelity's global investment organization, and that Fidelity's analysts have extensive resources, tools, and capabilities that allow them to conduct sophisticated quantitative and fundamental analysis, as well as credit analysis of issuers, counterparties, and guarantors. Further, the Board considered that Fidelity's investment professionals have sufficient access to global information and data so as to provide competitive investment results over time, and that those professionals also have access to sophisticated tools that permit them to assess portfolio construction and risk and performance attribution characteristics continuously, as well as to transmit new information and research conclusions rapidly around the world. Additionally, in its deliberations, the Board considered Fidelity's trading, risk management, compliance, and technology and operations capabilities and resources, which are integral parts of the investment management process.
Shareholder and Administrative Services . The Board considered (i) the nature, extent, quality, and cost of advisory, administrative, and shareholder services performed by the Investment Advisers and their affiliates under the Advisory Contracts and under separate agreements covering transfer agency, pricing and bookkeeping, and securities lending services for the fund; (ii) the nature and extent of the supervision of third party service providers, principally custodians, subcustodians, and pricing vendors; and (iii) the resources devoted to, and the record of compliance with, the fund's compliance policies and procedures. The Board also reviewed the allocation of fund brokerage, including allocations to brokers affiliated with the Investment Advisers, the use of brokerage commissions to pay fund expenses, and the use of "soft" commission dollars to pay for research services.
The Board noted that the growth of fund assets over time across the complex allows Fidelity to reinvest in the development of services designed to enhance the value and convenience of the Fidelity funds as investment vehicles. These services include 24-hour access to account information and market information over the Internet and through telephone representatives, investor education materials, and asset allocation tools. The Board also considered that it reviews customer service metrics such as telephone response times, continuity of services on the website and metrics addressing services at Fidelity Investor Centers.
Investment in a Large Fund Family . The Board considered the benefits to shareholders of investing in a Fidelity fund, including the benefits of investing in a fund that is part of a large family of funds offering a variety of investment disciplines and providing a large variety of mutual fund investor services. The Board noted that Fidelity had taken, or had made recommendations that resulted in the Fidelity funds taking, a number of actions over the previous year that benefited particular funds, including: (i) continuing to dedicate additional resources to Fidelity's investment research process, which includes meetings with management of issuers of securities in which the funds invest; (ii) continuing efforts to enhance Fidelity's global research capabilities; (iii) launching new funds and ETFs with innovative structures, strategies and pricing and making other enhancements to meet client needs; (iv) launching new share classes of existing funds; (v) eliminating purchase minimums and broadening eligibility requirements for certain funds and share classes; (vi) reducing management fees and total expenses for certain target date funds and classes and index funds; (vii) lowering expenses for certain existing funds and classes by implementing or lowering expense caps; (viii) rationalizing product lines and gaining increased efficiencies from fund mergers and liquidations; (ix) continuing to develop, acquire and implement systems and technology to improve services to the funds and shareholders, strengthen information security, and increase efficiency; and (x) continuing to implement enhancements to further strengthen Fidelity's product line to increase investors' probability of success in achieving their investment goals, including retirement income goals.
Investment Performance . The Board considered whether the fund has operated in accordance with its investment objective, as well as its record of compliance with its investment restrictions and its performance history. The Board noted that the fund had a portfolio manager change in October 2019, November 2019, December 2019, June 2020, September 2020 and November 2021. The Board will continue to monitor closely the fund's performance, taking into account the portfolio manager change.
The Board took into account discussions that occur at Board meetings throughout the year with representatives of the Investment Advisers about fund investment performance. In this regard the Board noted that as part of regularly scheduled fund reviews and other reports to the Board on fund performance, the Board considers annualized return information for the fund for different time periods, measured against an appropriate securities market index (benchmark index) and an appropriate peer group of funds with similar objectives (peer group). The Board also reviews and considers information about performance attribution. In its evaluation of fund investment performance, the Board gave particular attention to information indicating changes in performance of certain Fidelity funds for specific time periods and discussed with the Investment Advisers the reasons for any overperformance or underperformance.
In addition to reviewing absolute and relative fund performance, the Independent Trustees periodically consider the appropriateness of fund performance metrics in evaluating the results achieved. In general, the Independent Trustees believe that fund performance should be evaluated based on net performance (after fees and expenses) of the representative class, compared to appropriate benchmark indices, over appropriate time periods that may include full market cycles, and compared to peer groups, as applicable, over the same periods, taking into account relevant factors including the following: general market conditions; issuer-specific information; and fund cash flows and other factors.
The Independent Trustees recognize that shareholders evaluate performance on a net basis over their own holding periods, for which one-, three-, and five-year periods are often used as a proxy. For this reason, the performance information reviewed by the Board also included net cumulative total return information for the fund and an appropriate benchmark index and peer group for the most recent one-, three-, and five-year periods ended September 30, 2021, as shown below. Returns are shown compared to the 25th percentile (top of box, 75% beaten) and 75th percentile (bottom of box, 25% beaten) of the peer universe.
Fidelity Stock Selector Small Cap Fund
The Board also considered that the fund's management fee is subject to upward or downward adjustment depending upon whether, and to what extent, the fund's investment performance for the performance period (a rolling 36-month period) exceeds, or is exceeded by, a securities index, thus leading to a performance adjustment for the same period. The Board noted that the performance adjustment provides FMR with a strong economic incentive to seek to achieve superior long-term performance for the fund's shareholders and helps to more closely align the interests of FMR and the shareholders of the fund.
Based on its review, the Board concluded that the nature, extent, and quality of services provided to the fund under the Advisory Contracts should continue to benefit the shareholders of the fund.
Competitiveness of Management Fee and Total Expense Ratio . The Board considered the fund's management fee and total expense ratio compared to "mapped groups" of competitive funds and classes created for the purpose of facilitating the Trustees' competitive analysis of management fees and total expenses. Fidelity creates "mapped groups" by combining similar Lipper investment objective categories that have comparable investment mandates. Combining Lipper investment objective categories aids the Board's management fee and total expense ratio comparisons by broadening the competitive group used for comparison.
Management Fee . The Board considered two proprietary management fee comparisons for the 12-month periods ended September 30 (June 30 for periods ended 2019 and 2018 and December 31 for periods prior to 2018) shown in basis points (BP) in the chart below. The group of Lipper funds used by the Board for management fee comparisons is referred to below as the "Total Mapped Group." The Total Mapped Group comparison focuses on a fund's standing in terms of gross management fees before expense reimbursements or caps, and without giving effect to the fund's performance adjustment, relative to the total universe of funds with comparable investment mandates, regardless of whether their management fee structures also are comparable. Funds with comparable investment mandates offer exposure to similar types of securities. Funds with comparable management fee structures have similar management fee contractual arrangements (e.g., flat rate charged for advisory services, all-inclusive fee rate, etc.). "TMG %" represents the percentage of funds in the Total Mapped Group that had management fees that were lower than the fund's. For example, a hypothetical TMG % of 20% would mean that 80% of the funds in the Total Mapped Group had higher, and 20% had lower, management fees than the fund. The fund's actual TMG %s and the number of funds in the Total Mapped Group are in the chart below. The "Asset-Sized Peer Group" (ASPG) comparison focuses on a fund's standing relative to a subset of non-Fidelity funds within the Total Mapped Group that are similar in size and management fee structure without taking into account performance adjustments, if any. For example, if a fund is in the first quartile of the ASPG, the fund's management fee ranks in the least expensive or lowest 25% of funds in the ASPG. The ASPG represents at least 15% of the funds in the Total Mapped Group with comparable asset size and management fee structures, subject to a minimum of 50 funds (or all funds in the Total Mapped Group if fewer than 50). Additional information, such as the ASPG quartile in which the fund's management fee rate ranked and the impact of the fund's performance adjustment, is also included in the chart and was considered by the Board.
Fidelity Stock Selector Small Cap Fund
The Board noted that the fund's management fee rate ranked below the median of its Total Mapped Group and below the median of its ASPG for the 12-month period ended September 30, 2021. The Board also noted the effect of the fund's performance adjustment, if any, on the fund's management fee ranking.
The Board also considered that, for funds subject to the group fee, FMR agreed to voluntarily waive fees over a specified period of time in amounts designed to account for assets converted from certain funds to certain collective investment trusts.
Based on its review, the Board concluded that the fund's management fee is fair and reasonable in light of the services that the fund receives and the other factors considered.
Total Expense Ratio . In its review of the total expense ratio of the representative class (retail class), the Board considered the fund's management fee rate as well as other fund or class expenses, as applicable, such as transfer agent fees, pricing and bookkeeping fees, fund-paid 12b-1 fees, and custodial, legal, and audit fees. The Board noted the impact of the fund's performance adjustment. The Board also noted that Fidelity may agree to waive fees or reimburse expenses from time to time, and the extent to which, if any, it has done so for the fund. The fund's representative class is compared to those funds and classes in the Total Mapped Group (used by the Board for management fee comparisons) that have a similar sales load structure. The Board also considered a total expense ASPG comparison, which focuses on the total expenses of the representative class relative to a subset of non-Fidelity funds within the total expense similar sales load structure group. The total expense ASPG is limited to 15 larger and 15 smaller classes in fund average assets for a total of 30 classes, where possible. The total expense ASPG comparison excludes performance adjustments and fund-paid 12b-1 fees to eliminate variability in fee structures.
The Board noted that the total net expense ratio of the retail class ranked below the similar sales load structure group competitive median and below the ASPG competitive median for the 12-month period ended September 30, 2021.
Fees Charged to Other Fidelity Clients. The Board also considered Fidelity fee structures and other information with respect to clients of Fidelity, such as other funds advised or subadvised by Fidelity, pension plan clients, and other institutional clients with similar mandates. The Board noted that a joint ad hoc committee created by it and the boards of other Fidelity funds periodically reviews and compares Fidelity's institutional investment advisory business with its business of providing services to the Fidelity funds and also noted the most recent findings of the committee. The Board noted that the committee's review included a consideration of the differences in services provided, fees charged, and costs incurred, as well as competition in the markets serving the different categories of clients.
Based on its review of total expense ratios and fees charged to other Fidelity clients, the Board concluded that the total expense ratio of each class of the fund was reasonable in light of the services that the fund and its shareholders receive and the other factors considered.
Costs of the Services and Profitability . The Board considered the revenues earned and the expenses incurred by Fidelity in conducting the business of developing, marketing, distributing, managing, administering and servicing the fund and servicing the fund's shareholders. The Board also considered the level of Fidelity's profits in respect of all the Fidelity funds.
On an annual basis, Fidelity presents to the Board information about the profitability of its relationships with the fund. Fidelity calculates profitability information for each fund, as well as aggregate profitability information for groups of Fidelity funds and all Fidelity funds, using a series of detailed revenue and cost allocation methodologies which originate with the books and records of Fidelity on which Fidelity's audited financial statements are based. The Audit Committee of the Board reviews any significant changes from the prior year's methodologies and the full Board approves such changes.
A public accounting firm has been engaged annually by the Board as part of the Board's assessment of Fidelity's profitability analysis. The engagement includes the review and assessment of the methodologies used by Fidelity in determining the revenues and expenses attributable to Fidelity's mutual fund business, and completion of agreed-upon procedures in respect of the mathematical accuracy of certain fund profitability information and its conformity to established allocation methodologies. After considering the reports issued under the engagement and information provided by Fidelity, the Board concluded that while other allocation methods may also be reasonable, Fidelity's profitability methodologies are reasonable in all material respects.
The Board also reviewed Fidelity's non-fund businesses and potential indirect benefits such businesses may have received as a result of their association with Fidelity's mutual fund business (i.e., fall-out benefits) as well as cases where Fidelity's affiliates may benefit from the funds' business. The Board considered areas where potential indirect benefits to the Fidelity funds from their relationships with Fidelity may exist. The Board's consideration of these matters was informed by the findings of a joint ad hoc committee created by it and the boards of other Fidelity funds to evaluate potential fall-out benefits.
The Board considered the costs of the services provided by and the profits realized by Fidelity in connection with the operation of the fund and was satisfied that the profitability was not excessive.
Economies of Scale . The Board considered whether there have been economies of scale in respect of the management of the Fidelity funds, whether the Fidelity funds (including the fund) have appropriately benefited from any such economies of scale, and whether there is potential for realization of any further economies of scale. The Board considered the extent to which the fund will benefit from economies of scale as assets grow through increased services to the fund, through waivers or reimbursements, or through fee or expense ratio reductions. The Board also noted that a committee (the Economies of Scale Committee) created by it and the boards of other Fidelity funds periodically analyzes whether Fidelity attains economies of scale in respect of the management and servicing of the Fidelity funds, whether the Fidelity funds have appropriately benefited from such economies of scale, and whether there is potential for realization of any further economies of scale.
The Board recognized that the fund's management contract incorporates a "group fee" structure, which provides for lower group fee rates as total "group assets" increase, and for higher group fee rates as total "group assets" decrease ("group assets" as defined in the management contract). FMR calculates the group fee rates based on a tiered asset "breakpoint" schedule that varies based on asset class. The Board considered that the group fee is designed to deliver the benefits of economies of scale to fund shareholders when total Fidelity fund assets increase, even if assets of any particular fund are unchanged or have declined, because some portion of Fidelity's costs are attributable to services provided to all Fidelity funds, and all funds benefit if those costs can be allocated among more assets. The Board further considered that Fidelity agreed to impose a temporary fee waiver in the form of additional breakpoints to the current breakpoint schedule. The Board concluded that, given the group fee structure, fund shareholders will benefit from lower management fees as "group assets" increase at the fund complex level, regardless of whether Fidelity achieves any such economies of scale.
The Board concluded, taking into account the analysis of the Economies of Scale Committee, that economies of scale, if any, are being appropriately shared between fund shareholders and Fidelity.
Additional Information Requested by the Board . In order to develop fully the factual basis for consideration of the Fidelity funds' advisory contracts, the Board requested and received additional information on certain topics, including: (i) fund flow and performance trends, in particular the underperformance of certain funds and strategies, and Fidelity's long-term strategies for certain funds, including any consideration of fund liquidations or mergers; (ii) the operation of performance fees, competitor use of performance fees, and consideration of the expansion of performance fees to additional funds; (iii) Fidelity's pricing philosophy compared to competitors; (iv) fund profitability methodology and data; (v) evaluation of competitive fund data and peer group classifications and fee and expense comparisons; (vi) the management fee and expense structures for different funds and classes and information about the differences between various fee and expense structures; (vii) group fee breakpoints and related voluntary fee waivers; and (viii) information regarding other accounts managed by Fidelity and the funds' sub-advisory arrangements.
Based on its evaluation of all of the conclusions noted above, and after considering all factors it believed relevant, the Board concluded that the advisory fee arrangements are fair and reasonable and that the fund's Advisory Contracts should be renewed.
1.703160.125
SCS-ANN-1222
Fidelity® Capital Appreciation Fund
Annual Report
October 31, 2022
Contents
To view a fund's proxy voting guidelines and proxy voting record for the 12-month period ended June 30, visit http://www.fidelity.com/proxyvotingresults or visit the Securities and Exchange Commission's (SEC) web site at http://www.sec.gov.
You may also call 1-800-544-8544 if you're an individual investing directly with Fidelity, call 1-800-835-5092 if you're a plan sponsor or participant with Fidelity as your recordkeeper or call 1-877-208-0098 on institutional accounts or if you're an advisor or invest through one to request a free copy of the proxy voting guidelines.
Standard & Poor's, S&P and S&P 500 are registered service marks of The McGraw-Hill Companies, Inc. and have been licensed for use by Fidelity Distributors Corporation.
Other third-party marks appearing herein are the property of their respective owners.
All other marks appearing herein are registered or unregistered trademarks or service marks of FMR LLC or an affiliated company. © 2022 FMR LLC. All rights reserved.
This report and the financial statements contained herein are submitted for the general information of the shareholders of the Fund. This report is not authorized for distribution to prospective investors in the Fund unless preceded or accompanied by an effective prospectus.
A fund files its complete schedule of portfolio holdings with the SEC for the first and third quarters of each fiscal year on Form N-PORT. Forms N-PORT are available on the SEC's web site at http://www.sec.gov. A fund's Forms N-PORT may be reviewed and copied at the SEC's Public Reference Room in Washington, DC. Information regarding the operation of the SEC's Public Reference Room may be obtained by calling 1-800-SEC-0330.
For a complete list of a fund's portfolio holdings, view the most recent holdings listing, semiannual report, or annual report on Fidelity's web site at http://www.fidelity.com, http://www.institutional.fidelity.com, or http://www.401k.com, as applicable.
NOT FDIC INSURED •MAY LOSE VALUE •NO BANK GUARANTEE
Neither the Fund nor Fidelity Distributors Corporation is a bank.
Average annual total return reflects the change in the value of an investment, assuming reinvestment of distributions from dividend income and capital gains (the profits earned upon the sale of securities that have grown in value, if any) and assuming a constant rate of performance each year. The hypothetical investment and the average annual total returns do not reflect the deduction of taxes that a shareholder would pay on fund distributions or the redemption of fund shares. During periods of reimbursement by Fidelity, a fund's total return will be greater than it would be had the reimbursement not occurred. How a fund did yesterday is no guarantee of how it will do tomorrow.
| Average Annual Total Returns |
| | | | |
Periods ended October 31, 2022 | Past 1 year | Past 5 years | Past 10 years |
| Fidelity® Capital Appreciation Fund | -20.14% | 10.85% | 12.57% |
| Class K | -20.08% | 10.95% | 12.68% |
| $10,000 Over 10 Years |
| |
Let's say hypothetically that $10,000 was invested in Fidelity® Capital Appreciation Fund, a class of the fund, on October 31, 2012. The chart shows how the value of your investment would have changed, and also shows how the S&P 500® Index performed over the same period. |
|
|
Market Recap:
U.S. equities returned -14.61% for the 12 months ending October 31, 2022, according to the S&P 500 ® index, as a multitude of risk factors challenged the global economy and financial markets. Persistently high inflation prompted the Federal Reserve to aggressively tighten monetary policy, and market interest rates eclipsed their highest level in roughly a decade, stoking recession fears and sending stocks into bear market territory. In late 2021, the Fed shifted to a more "hawkish" (restrictive) policy stance and proceeded to hike its benchmark rate five times, by a total of 3%, between March and September - the fastest-ever pace of monetary tightening - while taking substantive steps to shrink its massive asset portfolio. Against this hostile backdrop for risk assets, the S&P 500 ® posted its worst year-to-date result (-23.87%) in 20 years through September, a seasonally weak month for stocks that stayed true to form, and then some, with volatility spiking due to growing certainty the Fed would persist in its effort to cool inflation, even at the expense of economic growth. Three of the index's worst monthly returns ever were recorded this period, with the S&P 500 shedding 8% to 9% in April, June and September. Gains of similar proportion were made in July and October, amid optimism on inflation and policy easing. For the full 12 months, the growth-oriented communication services (-41%) and consumer discretionary (-29%) sectors lagged most. In sharp contrast, energy (+65%) had a strong run, followed by consumer staples (+5%).
Comments from Co-Managers Asher Anolic and Jason Weiner:
For the fiscal year ending October 31, 2022, the fund's share classes returned roughly -20%, trailing the -14.61% result of the benchmark S&P 500 ® index. The largest detractor from performance versus the benchmark was security selection in information technology. An overweighting in the communication services sector, primarily within the media & entertainment industry, also hampered the fund's relative result, as did our stock picks in industrials. Not owning Exxon Mobil, a benchmark component that gained about 80%, was the largest individual relative detractor. Also hampering performance was our overweighting in Alphabet, which returned -36%. Alphabet was one of the fund's biggest holdings. Also holding back performance was our outsized stake in Microsoft, the fund's largest holding, which returned roughly -29%. The fund's foreign holdings detracted overall, in part due to a broadly strong U.S. dollar. In contrast, the top contributor to performance versus the benchmark was an overweighting in health care. Also aiding the fund's relative result was stock selection and an underweighting in consumer discretionary and stock picks and an overweighting in materials. The fund's biggest individual relative contributor was an overweighting in UnitedHealth Group, which gained 22% the past year, and was another of our biggest holdings. Also boosting value was our outsized stake in Vertex Pharmaceuticals, which gained approximately 68%. We increased our stake the past 12 months. Avoiding Tesla, a benchmark component that returned roughly -39%, also helped relative performance. Notable changes in positioning include a higher allocation to the financials and consumer discretionary sectors.
The views expressed above reflect those of the portfolio manager(s) only through the end of the period as stated on the cover of this report and do not necessarily represent the views of Fidelity or any other person in the Fidelity organization. Any such views are subject to change at any time based upon market or other conditions and Fidelity disclaims any responsibility to update such views. These views may not be relied on as investment advice and, because investment decisions for a Fidelity fund are based on numerous factors, may not be relied on as an indication of trading intent on behalf of any Fidelity fund.
Top Holdings (% of Fund's net assets) |
| |
| Microsoft Corp. | 8.1 | |
| UnitedHealth Group, Inc. | 5.1 | |
| Amazon.com, Inc. | 4.1 | |
| JPMorgan Chase & Co. | 2.6 | |
| Apple, Inc. | 2.6 | |
| Vertex Pharmaceuticals, Inc. | 2.4 | |
| Bank of America Corp. | 2.3 | |
| Alphabet, Inc. Class A | 2.2 | |
| TJX Companies, Inc. | 2.0 | |
| The Coca-Cola Co. | 1.8 | |
| | 33.2 | |
| |
| Market Sectors (% of Fund's net assets) |
| |
| Information Technology | 22.8 | |
| Health Care | 18.5 | |
| Financials | 12.5 | |
| Consumer Discretionary | 12.2 | |
| Communication Services | 10.4 | |
| Industrials | 9.7 | |
| Energy | 4.9 | |
| Consumer Staples | 4.7 | |
| Materials | 3.5 | |
| Utilities | 0.4 | |
| Real Estate | 0.1 | |
| |
Asset Allocation (% of Fund's net assets) |
|
Foreign investments - 8.3% |
|
Showing Percentage of Net Assets
| Common Stocks - 99.3% |
| | | Shares | Value ($) (000s) |
| COMMUNICATION SERVICES - 10.4% | | | |
| Entertainment - 3.3% | | | |
| Netflix, Inc. (a) | | 30,100 | 8,786 |
| Universal Music Group NV | | 4,453,321 | 87,443 |
| Warner Music Group Corp. Class A | | 2,753,200 | 71,638 |
| | | | 167,867 |
| Interactive Media & Services - 5.6% | | | |
| Alphabet, Inc.: | | | |
| Class A (a) | | 1,217,840 | 115,098 |
| Class C (a) | | 860,220 | 81,428 |
| Bumble, Inc. (a)(b) | | 529,600 | 13,452 |
| Eventbrite, Inc. (a) | | 363,300 | 2,387 |
| Meta Platforms, Inc. Class A (a) | | 796,902 | 74,239 |
| | | | 286,604 |
| Media - 1.5% | | | |
| Charter Communications, Inc. Class A (a) | | 137,800 | 50,658 |
| Innovid Corp. (a)(c) | | 337,444 | 1,262 |
| Liberty Media Corp. Liberty Formula One Group Series C (a) | | 461,481 | 26,641 |
| | | | 78,561 |
TOTAL COMMUNICATION SERVICES | | | 533,032 |
| CONSUMER DISCRETIONARY - 12.2% | | | |
| Hotels, Restaurants & Leisure - 1.8% | | | |
| Airbnb, Inc. Class A (a) | | 274,900 | 29,390 |
| Chipotle Mexican Grill, Inc. (a) | | 8,600 | 12,886 |
| Flutter Entertainment PLC (a) | | 220,800 | 29,322 |
| Wingstop, Inc. (b) | | 130,900 | 20,733 |
| | | | 92,331 |
| Internet & Direct Marketing Retail - 5.5% | | | |
| Amazon.com, Inc. (a) | | 2,052,460 | 210,254 |
| Uber Technologies, Inc. (a) | | 2,772,200 | 73,657 |
| | | | 283,911 |
| Multiline Retail - 0.3% | | | |
| Dollarama, Inc. | | 291,500 | 17,321 |
| Specialty Retail - 3.2% | | | |
| Five Below, Inc. (a) | | 231,900 | 33,939 |
| TJX Companies, Inc. | | 1,394,400 | 100,536 |
| Victoria's Secret & Co. (a) | | 724,900 | 27,256 |
| | | | 161,731 |
| Textiles, Apparel & Luxury Goods - 1.4% | | | |
| LVMH Moet Hennessy Louis Vuitton SE | | 52,104 | 32,877 |
| LVMH Moet Hennessy Louis Vuitton SE | | 23,738 | 15,584 |
| Samsonite International SA (a)(d) | | 11,419,200 | 24,556 |
| | | | 73,017 |
TOTAL CONSUMER DISCRETIONARY | | | 628,311 |
| CONSUMER STAPLES - 4.7% | | | |
| Beverages - 4.7% | | | |
| Boston Beer Co., Inc. Class A (a) | | 62,983 | 23,511 |
| Constellation Brands, Inc. Class A (sub. vtg.) | | 160,500 | 39,656 |
| Keurig Dr. Pepper, Inc. | | 827,100 | 32,125 |
| Monster Beverage Corp. (a) | | 562,238 | 52,693 |
| The Coca-Cola Co. | | 1,528,700 | 91,493 |
| | | | 239,478 |
| ENERGY - 4.9% | | | |
| Energy Equipment & Services - 1.3% | | | |
| Baker Hughes Co. Class A | | 1,600,500 | 44,270 |
| Cactus, Inc. | | 142,000 | 7,344 |
| Championx Corp. | | 298,700 | 8,549 |
| Helmerich & Payne, Inc. | | 143,500 | 7,105 |
| | | | 67,268 |
| Oil, Gas & Consumable Fuels - 3.6% | | | |
| Canadian Natural Resources Ltd. | | 790,300 | 47,371 |
| Cheniere Energy, Inc. | | 454,000 | 80,090 |
| Denbury, Inc. (a) | | 190,400 | 17,404 |
| New Fortress Energy, Inc. | | 333,700 | 18,377 |
| Range Resources Corp. | | 663,400 | 18,894 |
| | | | 182,136 |
TOTAL ENERGY | | | 249,404 |
| FINANCIALS - 12.5% | | | |
| Banks - 6.0% | | | |
| Bank of America Corp. | | 3,290,100 | 118,575 |
| JPMorgan Chase & Co. | | 1,067,500 | 134,377 |
| M&T Bank Corp. | | 277,526 | 46,727 |
| Signature Bank | | 53,300 | 8,450 |
| | | | 308,129 |
| Capital Markets - 2.5% | | | |
| CME Group, Inc. | | 420,138 | 72,810 |
| Morgan Stanley | | 659,700 | 54,208 |
| | | | 127,018 |
| Insurance - 3.9% | | | |
| American Financial Group, Inc. | | 256,900 | 37,279 |
| Arthur J. Gallagher & Co. | | 453,741 | 84,886 |
| BRP Group, Inc. (a) | | 438,000 | 12,417 |
| Marsh & McLennan Companies, Inc. | | 421,800 | 68,116 |
| | | | 202,698 |
| Thrifts & Mortgage Finance - 0.1% | | | |
| Rocket Companies, Inc. (b) | | 397,000 | 2,739 |
TOTAL FINANCIALS | | | 640,584 |
| HEALTH CARE - 18.5% | | | |
| Biotechnology - 6.1% | | | |
| 2seventy bio, Inc. (a) | | 34,200 | 543 |
| Adamas Pharmaceuticals, Inc.: | | | |
| rights (a)(e) | | 1,379,600 | 83 |
| rights (a)(e) | | 1,379,600 | 83 |
| Alnylam Pharmaceuticals, Inc. (a) | | 100,500 | 20,830 |
| Applied Therapeutics, Inc. (a) | | 92,111 | 71 |
| Arcellx, Inc. | | 25,600 | 601 |
| Beam Therapeutics, Inc. (a)(b) | | 61,100 | 2,692 |
| Cytokinetics, Inc. (a) | | 159,800 | 6,977 |
| EQRx, Inc. (a) | | 334,595 | 1,720 |
| Erasca, Inc. (a) | | 139,673 | 1,141 |
| Evelo Biosciences, Inc. (a) | | 379,400 | 774 |
| Galapagos NV sponsored ADR (a) | | 329,500 | 15,005 |
| Gamida Cell Ltd. (a) | | 1,811,763 | 3,243 |
| Gilead Sciences, Inc. | | 366,700 | 28,771 |
| Hookipa Pharma, Inc. (a) | | 916,200 | 1,182 |
| Prelude Therapeutics, Inc. (a) | | 24,000 | 161 |
| Regeneron Pharmaceuticals, Inc. (a) | | 87,022 | 65,158 |
| Seagen, Inc. (a) | | 232,800 | 29,603 |
| Seres Therapeutics, Inc. (a) | | 330,500 | 2,928 |
| Synlogic, Inc. (a) | | 951,200 | 797 |
| Vertex Pharmaceuticals, Inc. (a) | | 396,600 | 123,739 |
| Vor Biopharma, Inc. (a) | | 367,505 | 1,768 |
| XOMA Corp. (a)(b) | | 296,000 | 4,902 |
| | | | 312,772 |
| Health Care Equipment & Supplies - 0.9% | | | |
| Edwards Lifesciences Corp. (a) | | 405,500 | 29,370 |
| Insulet Corp. (a) | | 6,400 | 1,656 |
| Nevro Corp. (a) | | 53,907 | 2,067 |
| Penumbra, Inc. (a) | | 74,461 | 12,768 |
| | | | 45,861 |
| Health Care Providers & Services - 7.1% | | | |
| Guardant Health, Inc. (a) | | 354,788 | 17,562 |
| HealthEquity, Inc. (a) | | 879,200 | 68,498 |
| Option Care Health, Inc. (a) | | 583,100 | 17,645 |
| UnitedHealth Group, Inc. | | 469,092 | 260,416 |
| | | | 364,121 |
| Health Care Technology - 0.2% | | | |
| Certara, Inc. (a) | | 564,300 | 6,901 |
| Doximity, Inc. (a)(b) | | 98,200 | 2,599 |
| Simulations Plus, Inc. (b) | | 75,200 | 3,121 |
| | | | 12,621 |
| Life Sciences Tools & Services - 3.3% | | | |
| Bio-Techne Corp. | | 47,800 | 14,161 |
| Bruker Corp. | | 472,048 | 29,191 |
| Charles River Laboratories International, Inc. (a) | | 7,300 | 1,549 |
| Codexis, Inc. (a) | | 380,840 | 2,140 |
| Danaher Corp. | | 191,639 | 48,230 |
| Nanostring Technologies, Inc. (a) | | 39,503 | 413 |
| Thermo Fisher Scientific, Inc. | | 139,900 | 71,904 |
| | | | 167,588 |
| Pharmaceuticals - 0.9% | | | |
| Aclaris Therapeutics, Inc. (a) | | 218,000 | 3,403 |
| AstraZeneca PLC sponsored ADR | | 584,900 | 34,398 |
| Revance Therapeutics, Inc. (a) | | 371,300 | 8,284 |
| | | | 46,085 |
TOTAL HEALTH CARE | | | 949,048 |
| INDUSTRIALS - 9.7% | | | |
| Aerospace & Defense - 2.4% | | | |
| Axon Enterprise, Inc. (a) | | 57,400 | 8,348 |
| Northrop Grumman Corp. | | 131,700 | 72,305 |
| The Boeing Co. (a) | | 286,100 | 40,772 |
| | | | 121,425 |
| Electrical Equipment - 1.2% | | | |
| AMETEK, Inc. | | 126,300 | 16,376 |
| Bloom Energy Corp. Class A (a) | | 123,200 | 2,305 |
| Hubbell, Inc. Class B | | 53,200 | 12,634 |
| Rockwell Automation, Inc. | | 116,700 | 29,794 |
| | | | 61,109 |
| Machinery - 3.0% | | | |
| Chart Industries, Inc. (a)(b) | | 58,900 | 13,128 |
| Ingersoll Rand, Inc. | | 1,782,545 | 90,019 |
| Parker Hannifin Corp. | | 80,800 | 23,482 |
| Westinghouse Air Brake Tech Co. | | 321,600 | 29,999 |
| | | | 156,628 |
| Professional Services - 1.9% | | | |
| ASGN, Inc. (a) | | 125,500 | 10,640 |
| KBR, Inc. | | 1,589,200 | 79,094 |
| Kforce, Inc. | | 57,400 | 3,632 |
| Upwork, Inc. (a) | | 451,456 | 6,072 |
| | | | 99,438 |
| Road & Rail - 0.3% | | | |
| Old Dominion Freight Lines, Inc. | | 47,200 | 12,961 |
| Trading Companies & Distributors - 0.9% | | | |
| Ferguson PLC | | 441,800 | 48,183 |
TOTAL INDUSTRIALS | | | 499,744 |
| INFORMATION TECHNOLOGY - 22.7% | | | |
| Electronic Equipment & Components - 0.0% | | | |
| Mobileye Global, Inc. (a) | | 46,600 | 1,229 |
| IT Services - 2.1% | | | |
| Cloudflare, Inc. (a) | | 182,000 | 10,250 |
| MasterCard, Inc. Class A | | 229,100 | 75,186 |
| MongoDB, Inc. Class A (a) | | 89,319 | 16,348 |
| Snowflake, Inc. (a) | | 23,900 | 3,831 |
| | | | 105,615 |
| Semiconductors & Semiconductor Equipment - 3.8% | | | |
| Aixtron AG | | 594,500 | 14,623 |
| Allegro MicroSystems LLC (a) | | 180,400 | 4,584 |
| Analog Devices, Inc. | | 245,800 | 35,056 |
| ASML Holding NV | | 44,299 | 20,928 |
| Enphase Energy, Inc. (a) | | 148,995 | 45,741 |
| NVIDIA Corp. | | 137,436 | 18,550 |
| NXP Semiconductors NV | | 4,400 | 643 |
| Qualcomm, Inc. | | 249,947 | 29,409 |
| SiTime Corp. (a) | | 98,277 | 8,826 |
| Universal Display Corp. | | 189,428 | 18,037 |
| | | | 196,397 |
| Software - 14.2% | | | |
| Adobe, Inc. (a) | | 224,424 | 71,479 |
| Confluent, Inc. (a)(b) | | 296,600 | 7,973 |
| Epic Games, Inc. (a)(c)(e) | | 4,584 | 4,079 |
| HashiCorp, Inc. (b) | | 224,300 | 6,893 |
| Intuit, Inc. | | 105,500 | 45,101 |
| Manhattan Associates, Inc. (a) | | 181,448 | 22,077 |
| Microsoft Corp. | | 1,797,410 | 417,234 |
| Oracle Corp. | | 1,026,400 | 80,131 |
| Palo Alto Networks, Inc. (a) | | 206,700 | 35,468 |
| Synopsys, Inc. (a) | | 123,100 | 36,013 |
| Volue A/S (a) | | 1,407,500 | 3,655 |
| | | | 730,103 |
| Technology Hardware, Storage & Peripherals - 2.6% | | | |
| Apple, Inc. | | 863,308 | 132,380 |
TOTAL INFORMATION TECHNOLOGY | | | 1,165,724 |
| MATERIALS - 3.2% | | | |
| Chemicals - 2.8% | | | |
| Albemarle Corp. | | 158,800 | 44,443 |
| CF Industries Holdings, Inc. | | 348,900 | 37,074 |
| Sherwin-Williams Co. | | 272,835 | 61,396 |
| | | | 142,913 |
| Metals & Mining - 0.4% | | | |
| Lynas Rare Earths Ltd. (a) | | 2,375,566 | 12,658 |
| MP Materials Corp. (a)(b) | | 385,500 | 11,580 |
| | | | 24,238 |
TOTAL MATERIALS | | | 167,151 |
| REAL ESTATE - 0.1% | | | |
| Real Estate Management & Development - 0.1% | | | |
| Doma Holdings, Inc. (a)(c) | | 673,925 | 366 |
| WeWork, Inc. (a)(b) | | 2,795,500 | 7,184 |
| | | | 7,550 |
| UTILITIES - 0.4% | | | |
| Independent Power and Renewable Electricity Producers - 0.4% | | | |
| Brookfield Renewable Corp. (b) | | 551,700 | 17,119 |
| Brookfield Renewable Partners LP | | 114,500 | 3,341 |
| | | | 20,460 |
| TOTAL COMMON STOCKS (Cost $4,256,166) | | | 5,100,486 |
| | | | |
| Convertible Preferred Stocks - 0.4% |
| | | Shares | Value ($) (000s) |
| HEALTH CARE - 0.0% | | | |
| Biotechnology - 0.0% | | | |
| ElevateBio LLC Series C (a)(c)(e) | | 153,900 | 704 |
| INFORMATION TECHNOLOGY - 0.1% | | | |
| Software - 0.1% | | | |
| ASAPP, Inc. Series C (a)(c)(e) | | 513,013 | 1,888 |
| MATERIALS - 0.3% | | | |
| Metals & Mining - 0.3% | | | |
| Illuminated Holdings, Inc.: | | | |
| Series C2 (a)(c)(e) | | 110,923 | 5,207 |
| Series C3 (a)(c)(e) | | 138,654 | 6,508 |
| Series C4 (a)(c)(e) | | 37,518 | 1,761 |
| Series C5 (a)(c)(e) | | 75,216 | 3,531 |
| | | | 17,007 |
| TOTAL CONVERTIBLE PREFERRED STOCKS (Cost $15,563) | | | 19,599 |
| | | | |
| Money Market Funds - 2.7% |
| | | Shares | Value ($) (000s) |
| Fidelity Cash Central Fund 3.10% (f) | | 62,116,632 | 62,129 |
| Fidelity Securities Lending Cash Central Fund 3.10% (f)(g) | | 76,243,110 | 76,251 |
| TOTAL MONEY MARKET FUNDS (Cost $138,380) | | | 138,380 |
| | | | |
| TOTAL INVESTMENT IN SECURITIES - 102.4% (Cost $4,410,109) | 5,258,465 |
NET OTHER ASSETS (LIABILITIES) - (2.4)% | (123,133) |
| NET ASSETS - 100.0% | 5,135,332 |
| | |
Any values shown as $0 in the Schedule of Investments may reflect amounts less than $500.
Legend
| (b) | Security or a portion of the security is on loan at period end. |
| (c) | Restricted securities (including private placements) - Investment in securities not registered under the Securities Act of 1933 (excluding 144A issues). At the end of the period, the value of restricted securities (excluding 144A issues) amounted to $25,306,000 or 0.5% of net assets. |
| (d) | Security exempt from registration under Rule 144A of the Securities Act of 1933. These securities may be resold in transactions exempt from registration, normally to qualified institutional buyers. At the end of the period, the value of these securities amounted to $24,556,000 or 0.5% of net assets. |
| (f) | Affiliated fund that is generally available only to investment companies and other accounts managed by Fidelity Investments. The rate quoted is the annualized seven-day yield of the fund at period end. A complete unaudited listing of the fund's holdings as of its most recent quarter end is available upon request. In addition, each Fidelity Central Fund's financial statements, which are not covered by the Fund's Report of Independent Registered Public Accounting Firm, are available on the SEC's website or upon request. |
| (g) | Investment made with cash collateral received from securities on loan. |
| Additional information on each restricted holding is as follows: |
| Security | Acquisition Date | Acquisition Cost ($) (000s) |
| ASAPP, Inc. Series C | 4/30/21 | 3,384 |
| | | |
| Doma Holdings, Inc. | 3/02/21 | 6,739 |
| | | |
| ElevateBio LLC Series C | 3/09/21 | 646 |
| | | |
| Epic Games, Inc. | 3/29/21 | 4,057 |
| | | |
| Illuminated Holdings, Inc. Series C2 | 7/07/20 | 2,773 |
| | | |
| Illuminated Holdings, Inc. Series C3 | 7/07/20 | 4,160 |
| | | |
| Illuminated Holdings, Inc. Series C4 | 1/08/21 | 1,351 |
| | | |
| Illuminated Holdings, Inc. Series C5 | 6/16/21 | 3,249 |
| | | |
| Innovid Corp. | 6/24/21 | 3,374 |
| | | |
Affiliated Central Funds
Fiscal year to date information regarding the Fund's investments in Fidelity Central Funds, including the ownership percentage, is presented below.
| Affiliate (Amounts in thousands) | Value, beginning of period ($) | Purchases ($) | Sales Proceeds ($) | Dividend Income ($) | Realized Gain (loss) ($) | Change in Unrealized appreciation (depreciation) ($) | Value, end of period ($) | % ownership, end of period |
| Fidelity Cash Central Fund 3.10% | 150,736 | 1,211,695 | 1,300,302 | 208 | - | - | 62,129 | 0.1% |
| Fidelity Securities Lending Cash Central Fund 3.10% | 8,109 | 776,406 | 708,264 | 438 | - | - | 76,251 | 0.2% |
| Total | 158,845 | 1,988,101 | 2,008,566 | 646 | - | - | 138,380 | |
| | | | | | | | | |
Amounts in the income column in the above table include any capital gain distributions from underlying funds, which are presented in the corresponding line item in the Statement of Operations, if applicable.
Amount for Fidelity Securities Lending Cash Central Fund represents the income earned on investing cash collateral, less rebates paid to borrowers and any lending agent fees associated with the loan, plus any premium payments received for lending certain types of securities.
Investment Valuation
The following is a summary of the inputs used, as of October 31, 2022, involving the Fund's assets and liabilities carried at fair value. The inputs or methodology used for valuing securities may not be an indication of the risk associated with investing in those securities. For more information on valuation inputs, and their aggregation into the levels used below, please refer to the Investment Valuation section in the accompanying Notes to Financial Statements.
| Valuation Inputs at Reporting Date: |
Description (Amounts in thousands) | Total ($) | Level 1 ($) | Level 2 ($) | Level 3 ($) |
Investments in Securities: | | | | |
|
| Equities: | | | | |
Communication Services | 533,032 | 445,589 | 87,443 | - |
Consumer Discretionary | 628,311 | 595,434 | 32,877 | - |
Consumer Staples | 239,478 | 239,478 | - | - |
Energy | 249,404 | 249,404 | - | - |
Financials | 640,584 | 640,584 | - | - |
Health Care | 949,752 | 948,882 | - | 870 |
Industrials | 499,744 | 499,744 | - | - |
Information Technology | 1,167,612 | 1,161,645 | - | 5,967 |
Materials | 184,158 | 167,151 | - | 17,007 |
Real Estate | 7,550 | 7,550 | - | - |
Utilities | 20,460 | 20,460 | - | - |
|
| Money Market Funds | 138,380 | 138,380 | - | - |
| Total Investments in Securities: | 5,258,465 | 5,114,301 | 120,320 | 23,844 |
| Statement of Assets and Liabilities |
| Amounts in thousands (except per-share amounts) | | | | October 31, 2022 |
| | | | | |
| Assets | | | | |
| Investment in securities, at value (including securities loaned of $73,572) - See accompanying schedule: | | | | |
Unaffiliated issuers (cost $4,271,729) | | $5,120,085 | | |
Fidelity Central Funds (cost $138,380) | | 138,380 | | |
| | | | | |
| Total Investment in Securities (cost $4,410,109) | | | $ | 5,258,465 |
| Cash | | | | 750 |
| Receivable for investments sold | | | | 4,088 |
| Receivable for fund shares sold | | | | 1,299 |
| Dividends receivable | | | | 1,948 |
| Distributions receivable from Fidelity Central Funds | | | | 70 |
| Prepaid expenses | | | | 9 |
| Other receivables | | | | 27 |
Total assets | | | | 5,266,656 |
| Liabilities | | | | |
| Payable for investments purchased | | $49,442 | | |
| Payable for fund shares redeemed | | 2,158 | | |
| Accrued management fee | | 2,776 | | |
| Other affiliated payables | | 595 | | |
| Other payables and accrued expenses | | 91 | | |
| Collateral on securities loaned | | 76,262 | | |
| Total Liabilities | | | | 131,324 |
| Net Assets | | | $ | 5,135,332 |
| Net Assets consist of: | | | | |
| Paid in capital | | | $ | 3,867,142 |
| Total accumulated earnings (loss) | | | | 1,268,190 |
| Net Assets | | | $ | 5,135,332 |
| | | | | |
| Net Asset Value and Maximum Offering Price | | | | |
| Capital Appreciation : | | | | |
Net Asset Value , offering price and redemption price per share ($4,809,269 ÷ 138,570 shares) | | | $ | 34.71 |
| Class K : | | | | |
Net Asset Value , offering price and redemption price per share ($326,063 ÷ 9,357 shares) | | | $ | 34.85 |
| Statement of Operations |
| Amounts in thousands | | | | Year ended October 31, 2022 |
| Investment Income | | | | |
| Dividends | | | $ | 62,225 |
| Special dividends | | | | 23,086 |
| Income from Fidelity Central Funds (including $438 from security lending) | | | | 646 |
| Total Income | | | | 85,957 |
| Expenses | | | | |
| Management fee | | | | |
| Basic fee | $ | 31,907 | | |
| Performance adjustment | | 9,747 | | |
| Transfer agent fees | | 6,707 | | |
| Accounting fees | | 1,074 | | |
| Custodian fees and expenses | | 75 | | |
| Independent trustees' fees and expenses | | 21 | | |
| Registration fees | | 115 | | |
| Audit | | 59 | | |
| Legal | | 11 | | |
| Interest | | 54 | | |
| Miscellaneous | | 27 | | |
| Total expenses before reductions | | 49,797 | | |
| Expense reductions | | (199) | | |
| Total expenses after reductions | | | | 49,598 |
| Net Investment income (loss) | | | | 36,359 |
| Realized and Unrealized Gain (Loss) | | | | |
| Net realized gain (loss) on: | | | | |
| Investment Securities: | | | | |
| Unaffiliated issuers | | 471,928 | | |
| Foreign currency transactions | | 61 | | |
| Total net realized gain (loss) | | | | 471,989 |
| Change in net unrealized appreciation (depreciation) on: | | | | |
| Investment Securities: | | | | |
| Unaffiliated issuers | | (1,860,587) | | |
| Unfunded commitments | | 1,033 | | |
| Assets and liabilities in foreign currencies | | (18) | | |
| Total change in net unrealized appreciation (depreciation) | | | | (1,859,572) |
| Net gain (loss) | | | | (1,387,583) |
| Net increase (decrease) in net assets resulting from operations | | | $ | (1,351,224) |
| Statement of Changes in Net Assets |
| |
| Amount in thousands | | Year ended October 31, 2022 | | Year ended October 31, 2021 |
| Increase (Decrease) in Net Assets | | | | |
| Operations | | | | |
| Net investment income (loss) | $ | 36,359 | $ | (1,132) |
| Net realized gain (loss) | | 471,989 | | 1,062,802 |
| Change in net unrealized appreciation (depreciation) | | (1,859,572) | | 1,063,302 |
| Net increase (decrease) in net assets resulting from operations | | (1,351,224) | | 2,124,972 |
| Distributions to shareholders | | (1,022,382) | | (480,925) |
| Share transactions - net increase (decrease) | | 416,815 | | (75,008) |
| Total increase (decrease) in net assets | | (1,956,791) | | 1,569,039 |
| | | | | |
| Net Assets | | | | |
| Beginning of period | | 7,092,123 | | 5,523,084 |
| End of period | $ | 5,135,332 | $ | 7,092,123 |
| | | | | |
| | | | | |
Financial Highlights
| Fidelity® Capital Appreciation Fund |
| |
| Years ended October 31, | | 2022 | | 2021 | | 2020 | | 2019 | | 2018 |
Selected Per-Share Data | | | | | | | | | | |
| Net asset value, beginning of period | $ | 51.06 | $ | 39.58 | $ | 36.16 | $ | 36.33 | $ | 37.90 |
| Income from Investment Operations | | | | | | | | | | |
Net investment income (loss) A,B | | .23 C | | (.01) | | .04 | | .24 | | .29 |
| Net realized and unrealized gain (loss) | | (9.18) | | 14.99 | | 7.95 | | 3.53 | | 2.15 |
| Total from investment operations | | (8.95) | | 14.98 | | 7.99 | | 3.77 | | 2.44 |
| Distributions from net investment income | | (.17) | | (.01) | | (.24) | | (.27) | | (.34) |
| Distributions from net realized gain | | (7.23) | | (3.49) | | (4.34) | | (3.67) | | (3.67) |
| Total distributions | | (7.40) | | (3.50) | | (4.57) D | | (3.94) | | (4.01) |
| Net asset value, end of period | $ | 34.71 | $ | 51.06 | $ | 39.58 | $ | 36.16 | $ | 36.33 |
Total Return E | | (20.14)% | | 40.02% | | 24.73% | | 12.24% | | 6.93% |
Ratios to Average Net Assets B,F,G | | | | | | | | | | |
| Expenses before reductions | | .83% | | .84% | | .82% | | .62% | | .54% |
| Expenses net of fee waivers, if any | | .82% | | .84% | | .82% | | .62% | | .54% |
| Expenses net of all reductions | | .82% | | .84% | | .82% | | .61% | | .53% |
| Net investment income (loss) | | .59% C | | (.02)% | | .12% | | .69% | | .77% |
| Supplemental Data | | | | | | | | | | |
| Net assets, end of period (in millions) | $ | 4,809 | $ | 6,549 | $ | 5,023 | $ | 4,668 | $ | 4,792 |
Portfolio turnover rate H | | 69% | | 51% | | 61% I | | 122% | | 101% |
A Calculated based on average shares outstanding during the period.
B Net investment income (loss) is affected by the timing of the declaration of dividends by any underlying mutual funds or exchange-traded funds (ETFs). Net investment income (loss) of any mutual funds or ETFs is not included in the Fund's net investment income (loss) ratio.
C Net investment income per share reflects one or more large, non-recurring dividend(s) which amounted to $.15 per share. Excluding such non-recurring dividend(s), the ratio of net investment income (loss) to average net assets would have been .21%.
D Total distributions per share do not sum due to rounding.
E Total returns would have been lower if certain expenses had not been reduced during the applicable periods shown.
F Fees and expenses of any underlying mutual funds or exchange-traded funds (ETFs) are not included in the Fund's expense ratio. The Fund indirectly bears its proportionate share of these expenses. For additional expense information related to investments in Fidelity Central Funds, please refer to the "Investments in Fidelity Central Funds" note found in the Notes to Financial Statements section of the most recent Annual or Semi-Annual report.
G Expense ratios reflect operating expenses of the class. Expenses before reductions do not reflect amounts reimbursed, waived, or reduced through arrangements with the investment adviser, brokerage services, or other offset arrangements, if applicable, and do not represent the amount paid by the class during periods when reimbursements, waivers or reductions occur.
H Amount does not include the portfolio activity of any underlying mutual funds or exchange-traded funds (ETFs).
I Portfolio turnover rate excludes securities received or delivered in-kind.
| Fidelity® Capital Appreciation Fund Class K |
| |
| Years ended October 31, | | 2022 | | 2021 | | 2020 | | 2019 | | 2018 |
Selected Per-Share Data | | | | | | | | | | |
| Net asset value, beginning of period | $ | 51.24 | $ | 39.70 | $ | 36.25 | $ | 36.42 | $ | 37.99 |
| Income from Investment Operations | | | | | | | | | | |
Net investment income (loss) A,B | | .26 C | | .02 | | .07 | | .27 | | .33 |
| Net realized and unrealized gain (loss) | | (9.21) | | 15.04 | | 7.98 | | 3.54 | | 2.15 |
| Total from investment operations | | (8.95) | | 15.06 | | 8.05 | | 3.81 | | 2.48 |
| Distributions from net investment income | | (.21) | | (.03) | | (.26) | | (.31) | | (.37) |
| Distributions from net realized gain | | (7.23) | | (3.49) | | (4.34) | | (3.67) | | (3.67) |
| Total distributions | | (7.44) | | (3.52) | | (4.60) | | (3.98) | | (4.05) D |
| Net asset value, end of period | $ | 34.85 | $ | 51.24 | $ | 39.70 | $ | 36.25 | $ | 36.42 |
Total Return E | | (20.08)% | | 40.12% | | 24.85% | | 12.33% | | 7.03% |
Ratios to Average Net Assets B,F,G | | | | | | | | | | |
| Expenses before reductions | | .75% | | .76% | | .74% | | .52% | | .45% |
| Expenses net of fee waivers, if any | | .75% | | .76% | | .74% | | .52% | | .44% |
| Expenses net of all reductions | | .75% | | .76% | | .73% | | .52% | | .43% |
| Net investment income (loss) | | .67% C | | .05% | | .21% | | .79% | | .86% |
| Supplemental Data | | | | | | | | | | |
| Net assets, end of period (in millions) | $ | 326 | $ | 543 | $ | 500 | $ | 864 | $ | 1,702 |
Portfolio turnover rate H | | 69% | | 51% | | 61% I | | 122% | | 101% |
A Calculated based on average shares outstanding during the period.
B Net investment income (loss) is affected by the timing of the declaration of dividends by any underlying mutual funds or exchange-traded funds (ETFs). Net investment income (loss) of any mutual funds or ETFs is not included in the Fund's net investment income (loss) ratio.
C Net investment income per share reflects one or more large, non-recurring dividend(s) which amounted to $.15 per share. Excluding such non-recurring dividend(s), the ratio of net investment income (loss) to average net assets would have been .29%.
D Total distributions per share do not sum due to rounding.
E Total returns would have been lower if certain expenses had not been reduced during the applicable periods shown.
F Fees and expenses of any underlying mutual funds or exchange-traded funds (ETFs) are not included in the Fund's expense ratio. The Fund indirectly bears its proportionate share of these expenses. For additional expense information related to investments in Fidelity Central Funds, please refer to the "Investments in Fidelity Central Funds" note found in the Notes to Financial Statements section of the most recent Annual or Semi-Annual report.
G Expense ratios reflect operating expenses of the class. Expenses before reductions do not reflect amounts reimbursed, waived, or reduced through arrangements with the investment adviser, brokerage services, or other offset arrangements, if applicable, and do not represent the amount paid by the class during periods when reimbursements, waivers or reductions occur.
H Amount does not include the portfolio activity of any underlying mutual funds or exchange-traded funds (ETFs).
I Portfolio turnover rate excludes securities received or delivered in-kind.
For the period ended October 31, 2022
( Amounts in thousands except percentages)
1. Organization.
Fidelity Capital Appreciation Fund (the Fund) is a fund of Fidelity Capital Trust (the Trust) and is authorized to issue an unlimited number of shares. The Trust is registered under the Investment Company Act of 1940, as amended (the 1940 Act), as an open-end management investment company organized as a Massachusetts business trust. The Fund offers Capital Appreciation and Class K shares, each of which has equal rights as to assets and voting privileges. Each class has exclusive voting rights with respect to matters that affect that class.
2. Investments in Fidelity Central Funds.
Funds may invest in Fidelity Central Funds, which are open-end investment companies generally available only to other investment companies and accounts managed by the investment adviser and its affiliates. The Schedule of Investments lists any Fidelity Central Funds held as an investment as of period end, but does not include the underlying holdings of each Fidelity Central Fund. An investing fund indirectly bears its proportionate share of the expenses of the underlying Fidelity Central Funds.
Based on its investment objective, each Fidelity Central Fund may invest or participate in various investment vehicles or strategies that are similar to those of the investing fund. These strategies are consistent with the investment objectives of the investing fund and may involve certain economic risks which may cause a decline in value of each of the Fidelity Central Funds and thus a decline in the value of the investing fund.
| Fidelity Central Fund | Investment Manager | Investment Objective | Investment Practices | Expense Ratio A |
| Fidelity Money Market Central Funds | Fidelity Management & Research Company LLC (FMR) | Each fund seeks to obtain a high level of current income consistent with the preservation of capital and liquidity. | Short-term Investments | Less than .005% |
A Expenses expressed as a percentage of average net assets and are as of each underlying Central Fund's most recent annual or semi-annual shareholder report.
A complete unaudited list of holdings for each Fidelity Central Fund is available upon request or at the Securities and Exchange Commission website at www.sec.gov. In addition, the financial statements of the Fidelity Central Funds which contain the significant accounting policies (including investment valuation policies) of those funds, and are not covered by the Report of Independent Registered Public Accounting Firm, are available on the Securities and Exchange Commission website or upon request.
3. Significant Accounting Policies.
The Fund is an investment company and applies the accounting and reporting guidance of the Financial Accounting Standards Board (FASB) Accounting Standards Codification Topic 946 Financial Services - Investment Companies . The financial statements have been prepared in conformity with accounting principles generally accepted in the United States of America (GAAP), which require management to make certain estimates and assumptions at the date of the financial statements. Actual results could differ from those estimates. Subsequent events, if any, through the date that the financial statements were issued have been evaluated in the preparation of the financial statements. The Fund's Schedule of Investments lists any underlying mutual funds or exchange-traded funds (ETFs) but does not include the underlying holdings of these funds. The following summarizes the significant accounting policies of the Fund:
Investment Valuation. Investments are valued as of 4:00 p.m. Eastern time on the last calendar day of the period. The Board of Trustees (the Board) has designated the Fund's investment adviser as the valuation designee responsible for the fair valuation function and performing fair value determinations as needed. The investment adviser has established a Fair Value Committee (the Committee) to carry out the day-to-day fair valuation responsibilities and has adopted policies and procedures to govern the fair valuation process and the activities of the Committee. In accordance with these fair valuation policies and procedures, which have been approved by the Board, the Fund attempts to obtain prices from one or more third party pricing services or brokers to value its investments. When current market prices, quotations or currency exchange rates are not readily available or reliable, investments will be fair valued in good faith by the Committee, in accordance with the policies and procedures. Factors used in determining fair value vary by investment type and may include market or investment specific events, transaction data, estimated cash flows, and market observations of comparable investments. The frequency that the fair valuation procedures are used cannot be predicted and they may be utilized to a significant extent. The Committee manages the Fund's fair valuation practices and maintains the fair valuation policies and procedures. The Fund's investment adviser reports to the Board information regarding the fair valuation process and related material matters.
The Fund categorizes the inputs to valuation techniques used to value its investments into a disclosure hierarchy consisting of three levels as shown below:
Level 1 - unadjusted quoted prices in active markets for identical investments
Level 2 - other significant observable inputs (including quoted prices for similar investments, interest rates, prepayment speeds, etc.)
Level 3 - unobservable inputs (including the Fund's own assumptions based on the best information available)
Valuation techniques used to value the Fund's investments by major category are as follows:
Equity securities, including restricted securities, for which market quotations are readily available, are valued at the last reported sale price or official closing price as reported by a third party pricing service on the primary market or exchange on which they are traded and are categorized as Level 1 in the hierarchy. In the event there were no sales during the day or closing prices are not available, securities are valued at the last quoted bid price or may be valued using the last available price and are generally categorized as Level 2 in the hierarchy. For foreign equity securities, when market or security specific events arise, comparisons to the valuation of American Depositary Receipts (ADRs), futures contracts, Exchange-Traded Funds (ETFs) and certain indexes as well as quoted prices for similar securities may be used and would be categorized as Level 2 in the hierarchy. For equity securities, including restricted securities, where observable inputs are limited, assumptions about market activity and risk are used and these securities may be categorized as Level 3 in the hierarchy.
Investments in open-end mutual funds, including the Fidelity Central Funds, are valued at their closing net asset value (NAV) each business day and are categorized as Level 1 in the hierarchy.
Changes in valuation techniques may result in transfers in or out of an assigned level within the disclosure hierarchy. The aggregate value of investments by input level as of October 31, 2022 is included at the end of the Fund's Schedule of Investments.
Foreign Currency. Certain Funds may use foreign currency contracts to facilitate transactions in foreign-denominated securities. Gains and losses from these transactions may arise from changes in the value of the foreign currency or if the counterparties do not perform under the contracts' terms.
Foreign-denominated assets, including investment securities, and liabilities are translated into U.S. dollars at the exchange rates at period end. Purchases and sales of investment securities, income and dividends received, and expenses denominated in foreign currencies are translated into U.S. dollars at the exchange rate in effect on the transaction date.
The effects of exchange rate fluctuations on investments are included with the net realized and unrealized gain (loss) on investment securities. Other foreign currency transactions resulting in realized and unrealized gain (loss) are disclosed separately.
Investment Transactions and Income. For financial reporting purposes, the Fund's investment holdings and NAV include trades executed through the end of the last business day of the period. The NAV per share for processing shareholder transactions is calculated as of the close of business of the New York Stock Exchange (NYSE), normally 4:00 p.m. Eastern time and includes trades executed through the end of the prior business day. Gains and losses on securities sold are determined on the basis of identified cost and include proceeds received from litigation. Commissions paid to certain brokers with whom the investment adviser, or its affiliates, places trades on behalf of a fund include an amount in addition to trade execution, which may be rebated back to a fund. Any such rebates are included in net realized gain (loss) on investments in the Statement of Operations. Dividend income is recorded on the ex-dividend date, except for certain dividends from foreign securities where the ex-dividend date may have passed, which are recorded as soon as the Fund is informed of the ex-dividend date. Non-cash dividends included in dividend income, if any, are recorded at the fair market value of the securities received. Income and capital gain distributions from Fidelity Central Funds, if any, are recorded on the ex-dividend date. Certain distributions received by the Fund represent a return of capital or capital gain. The Fund determines the components of these distributions subsequent to the ex-dividend date, based upon receipt of tax filings or other correspondence relating to the underlying investment. These distributions are recorded as a reduction of cost of investments and/or as a realized gain. Large, non-recurring dividends recognized by the Fund are presented separately on the Statement of Operations as "Special Dividends" and the impact of these dividends is presented in the Financial Highlights. Investment income is recorded net of foreign taxes withheld where recovery of such taxes is uncertain. Funds may file withholding tax reclaims in certain jurisdictions to recover a portion of amounts previously withheld. Any withholding tax reclaims income is included in the Statement of Operations in dividends. Any receivables for withholding tax reclaims are included in the Statement of Assets and Liabilities in dividends receivable.
Class Allocations and Expenses. Investment income, realized and unrealized capital gains and losses, common expenses of a fund, and certain fund-level expense reductions, if any, are allocated daily on a pro-rata basis to each class based on the relative net assets of each class to the total net assets of a fund. Each class differs with respect to transfer agent and distribution and service plan fees incurred, as applicable. Certain expense reductions may also differ by class, if applicable. For the reporting period, the allocated portion of income and expenses to each class as a percent of its average net assets may vary due to the timing of recording these transactions in relation to fluctuating net assets of the classes. Expenses directly attributable to a fund are charged to that fund. Expenses attributable to more than one fund are allocated among the respective funds on the basis of relative net assets or other appropriate methods. Expenses included in the accompanying financial statements reflect the expenses of that fund and do not include any expenses associated with any underlying mutual funds or exchange-traded funds. Although not included in a fund's expenses, a fund indirectly bears its proportionate share of these expenses through the net asset value of each underlying mutual fund or exchange-traded fund. Expense estimates are accrued in the period to which they relate and adjustments are made when actual amounts are known.
Deferred Trustee Compensation. Under a Deferred Compensation Plan (the Plan) for certain Funds, certain independent Trustees have elected to defer receipt of a portion of their annual compensation. Deferred amounts are invested in affiliated mutual funds, are marked-to-market and remain in a fund until distributed in accordance with the Plan. The investment of deferred amounts and the offsetting payable to the Trustees presented below are included in the accompanying Statement of Assets and Liabilities in other receivables and other payables and accrued expenses, as applicable.
| Fidelity Capital Appreciation Fund | $26 |
Income Tax Information and Distributions to Shareholders. Each year, the Fund intends to qualify as a regulated investment company under Subchapter M of the Internal Revenue Code, including distributing substantially all of its taxable income and realized gains. As a result, no provision for U.S. Federal income taxes is required. As of October 31, 2022, the Fund did not have any unrecognized tax benefits in the financial statements; nor is the Fund aware of any tax positions for which it is reasonably possible that the total amounts of unrecognized tax benefits will significantly change in the next twelve months. The Fund files a U.S. federal tax return, in addition to state and local tax returns as required. The Fund's federal income tax returns are subject to examination by the Internal Revenue Service (IRS) for a period of three fiscal years after they are filed. State and local tax returns may be subject to examination for an additional fiscal year depending on the jurisdiction. Foreign taxes are provided for based on the Fund's understanding of the tax rules and rates that exist in the foreign markets in which it invests.
Distributions are declared and recorded on the ex-dividend date. Income and capital gain distributions are declared separately for each class. Income and capital gain distributions are determined in accordance with income tax regulations, which may differ from GAAP. In addition, the Fund claimed a portion of the payment made to redeeming shareholders as a distribution for income tax purposes.
Capital accounts within the financial statements are adjusted for permanent book-tax differences. These adjustments have no impact on net assets or the results of operations. Capital accounts are not adjusted for temporary book-tax differences which will reverse in a subsequent period.
Book-tax differences are primarily due to foreign currency transactions, partnerships and losses deferred due to wash sales.
As of period end, the cost and unrealized appreciation (depreciation) in securities, and derivatives if applicable, for federal income tax purposes were as follows:
| Gross unrealized appreciation | $1,278,123 |
| Gross unrealized depreciation | (437,665) |
| Net unrealized appreciation (depreciation) | $840,458 |
| Tax Cost | $4,418,007 |
The tax-based components of distributable earnings as of period end were as follows:
| Undistributed ordinary income | $13,743 |
| Undistributed long-term capital gain | $414,009 |
| Net unrealized appreciation (depreciation) on securities and other investments | $840,438 |
The tax character of distributions paid was as follows:
| | October 31, 2022 | October 31, 2021 |
| Ordinary Income | $198,377 | $6,834 |
| Long-term Capital Gains | 824,005 | 474,091 |
| Total | $1,022,382 | $480,925 |
Restricted Securities (including Private Placements). Funds may invest in securities that are subject to legal or contractual restrictions on resale. These securities generally may be resold in transactions exempt from registration or to the public if the securities are registered. Disposal of these securities may involve time-consuming negotiations and expense, and prompt sale at an acceptable price may be difficult. Information regarding restricted securities held at period end is included at the end of the Schedule of Investments, if applicable.
Special Purpose Acquisition Companies. Funds may invest in stock, warrants, and other securities of special purpose acquisition companies (SPACs) or similar special purpose entities. A SPAC is a publicly traded company that raises investment capital via an initial public offering (IPO) for the purpose of acquiring the equity securities of one or more existing companies via merger, business combination, acquisition or other similar transactions within a designated time frame.
Private Investment in Public Equity. Funds may acquire equity securities of an issuer through a private investment in a public equity (PIPE) transaction, including through commitments to purchase securities on a when-issued basis. A PIPE typically involves the purchase of securities directly from a publicly traded company in a private placement transaction. Securities purchased through PIPE transactions will be restricted from trading and considered illiquid until a resale registration statement for the shares is filed and declared effective.
At the current and/or prior period end, the Fund had commitments to purchase when-issued securities through PIPE transactions with SPACs. The commitments are contingent upon the SPACs acquiring the securities of target companies. Unrealized appreciation (depreciation) on any commitments outstanding at period end is separately presented in the Statements of Assets and Liabilities as Unrealized appreciation (depreciation) on unfunded commitments, and any change in unrealized appreciation (depreciation) on unfunded commitments during the period is separately presented in the Statement of Operations, as applicable.
4. Purchases and Sales of Investments.
Purchases and sales of securities, other than short-term securities and in-kind transactions, as applicable, are noted in the table below.
| | Purchases ($) | Sales ($) |
| Fidelity Capital Appreciation Fund | 4,210,775 | 4,589,957 |
5. Fees and Other Transactions with Affiliates.
Management Fee. Fidelity Management & Research Company LLC (the investment adviser) and its affiliates provide the Fund with investment management related services for which the Fund pays a monthly management fee. The management fee is the sum of an individual fund fee rate that is based on an annual rate of .30% of the Fund's average net assets and an annualized group fee rate that averaged .23% during the period. The group fee rate is based upon the monthly average net assets of a group of registered investment companies with which the investment adviser has management contracts. The group fee rate decreases as assets under management increase and increases as assets under management decrease. In addition, the management fee is subject to a performance adjustment (up to a maximum of +/- .20% of the Fund's average net assets over a 36 month performance period). The upward or downward adjustment to the management fee is based on the relative investment performance of Capital Appreciation as compared to its benchmark index, the S&P 500 Index, over the same 36 month performance period. For the reporting period, the total annual management fee rate, including the performance adjustment, was .69% of the Fund's average net assets. The performance adjustment included in the management fee rate may be higher or lower than the maximum performance adjustment rate due to the difference between the average net assets for the reporting and performance periods.
Transfer Agent Fees. Fidelity Investments Institutional Operations Company LLC (FIIOC), an affiliate of the investment adviser, is the transfer, dividend disbursing and shareholder servicing agent for each class of the Fund. FIIOC receives account fees and asset-based fees that vary according to the account size and type of account of the shareholders of Capital Appreciation, except for Class K. FIIOC receives an asset-based fee of Class K's average net assets. FIIOC pays for typesetting, printing and mailing of shareholder reports, except proxy statements.
For the period, transfer agent fees for each class were as follows:
| | Amount | % of Class-Level Average Net Assets |
| Capital Appreciation | $6,503 | .12 |
| Class K | 204 | .04 |
| | $6,707 | |
Accounting Fees. Fidelity Service Company, Inc. (FSC), an affiliate of the investment adviser, maintains the Fund's accounting records. The accounting fee is based on the level of average net assets for each month. For the period, the fees were equivalent to the following annual rates:
| | % of Average Net Assets |
| Fidelity Capital Appreciation Fund | .02 |
Brokerage Commissions. A portion of portfolio transactions were placed with brokerage firms which are affiliates of the investment adviser. Brokerage commissions are included in net realized gain (loss) and change in net unrealized appreciation (depreciation) in the Statement of Operations. The commissions paid to these affiliated firms were as follows:
| | Amount |
| Fidelity Capital Appreciation Fund | $65 |
Interfund Lending Program. Pursuant to an Exemptive Order issued by the Securities and Exchange Commission (the SEC), the Fund, along with other registered investment companies having management contracts with Fidelity Management & Research Company LLC (FMR), or other affiliated entities of FMR, may participate in an interfund lending program. This program provides an alternative credit facility allowing the Fund to borrow from, or lend money to, other participating affiliated funds. At period end, there were no interfund loans outstanding. Activity in this program during the period for which loans were outstanding was as follows:
| | Borrower or Lender | Average Loan Balance | Weighted Average Interest Rate | Interest Expense |
| Fidelity Capital Appreciation Fund | Borrower | $15,617 | 1.49% | $53 |
Interfund Trades. Funds may purchase from or sell securities to other Fidelity Funds under procedures adopted by the Board. The procedures have been designed to ensure these interfund trades are executed in accordance with Rule 17a-7 of the 1940 Act. Any interfund trades are included within the respective purchases and sales amounts shown in the Purchases and Sales of Investments note. Interfund trades during the period are noted in the table below.
| | Purchases ($) | Sales ($) | Realized Gain (Loss) ($) |
| Fidelity Capital Appreciation Fund | 151,438 | 260,627 | 14,416 |
Other. During the period, the investment adviser reimbursed the Fund for certain losses as follows:
| | Amount ($) |
| Fidelity Capital Appreciation Fund | 3 |
6. Committed Line of Credit.
Certain Funds participate with other funds managed by the investment adviser or an affiliate in a $4.25 billion credit facility (the "line of credit") to be utilized for temporary or emergency purposes to fund shareholder redemptions or for other short-term liquidity purposes. The participating funds have agreed to pay commitment fees on their pro-rata portion of the line of credit, which are reflected in Miscellaneous expenses on the Statement of Operations, and are listed below. During the period, there were no borrowings on this line of credit.
| | Amount |
| Fidelity Capital Appreciation Fund | $11 |
7. Security Lending.
Funds lend portfolio securities from time to time in order to earn additional income. Lending agents are used, including National Financial Services (NFS), an affiliate of the investment adviser. Pursuant to a securities lending agreement, NFS will receive a fee, which is capped at 9.9% of a fund's daily lending revenue, for its services as lending agent. A fund may lend securities to certain qualified borrowers, including NFS. On the settlement date of the loan, a fund receives collateral (in the form of U.S. Treasury obligations, letters of credit and/or cash) against the loaned securities and maintains collateral in an amount not less than 100% of the market value of the loaned securities during the period of the loan. The market value of the loaned securities is determined at the close of business of a fund and any additional required collateral is delivered to a fund on the next business day. A fund or borrower may terminate the loan at any time, and if the borrower defaults on its obligation to return the securities loaned because of insolvency or other reasons, a fund may apply collateral received from the borrower against the obligation. A fund may experience delays and costs in recovering the securities loaned. Any cash collateral received is invested in the Fidelity Securities Lending Cash Central Fund. Any loaned securities are identified as such in the Schedule of Investments, and the value of loaned securities and cash collateral at period end, as applicable, are presented in the Statement of Assets and Liabilities. Security lending income represents the income earned on investing cash collateral, less rebates paid to borrowers and any lending agent fees associated with the loan, plus any premium payments received for lending certain types of securities. Security lending income is presented in the Statement of Operations as a component of income from Fidelity Central Funds. Affiliated security lending activity, if any, was as follows:
| | Total Security Lending Fees Paid to NFS | Security Lending Income From Securities Loaned to NFS | Value of Securities Loaned to NFS at Period End |
| Fidelity Capital Appreciation Fund | $46 | $- A | $148 |
A Amount represents less than five hundred dollars.
Bank Borrowings.
The Fund is permitted to have bank borrowings for temporary or emergency purposes to fund shareholder redemptions or for other short-term liquidity requirements. The Fund has established borrowing arrangements with certain banks. The interest rate on the borrowings is the bank's base rate, as revised from time to time. Any open loans, including accrued interest, at period end are presented under the caption "Notes payable" in the Statement of Assets and Liabilities, if applicable. Activity in this program during the period for which loans were outstanding was as follows:
| | Average Loan Balance | Weighted Average Interest Rate | Interest Expense |
| Fidelity Capital Appreciation Fund | $11,581 | 1.33% | $- A |
A Amount represents less than five hundred dollars.
8. Expense Reductions.
During the period the investment adviser or an affiliate reimbursed and/or waived a portion of fund-level operating expenses in the amount of $199.
9. Distributions to Shareholders.
Distributions to shareholders of each class were as follows:
| | Year ended October 31, 2022 | Year ended October 31, 2021 |
| Fidelity Capital Appreciation Fund | | |
| Distributions to shareholders | | |
| Capital Appreciation | $943,863 | $440,699 |
| Class K | 78,519 | 40,226 |
Total | $1,022,382 | $480,925 |
10. Share Transactions.
Share transactions for each class were as follows and may contain in-kind transactions, automatic conversions between classes or exchanges between affiliated funds:
| | Shares | Shares | Dollars | Dollars |
| | Year ended October 31, 2022 | Year ended October 31, 2021 | Year ended October 31, 2022 | Year ended October 31, 2021 |
| Fidelity Capital Appreciation Fund | | | | |
| Capital Appreciation | | | | |
| Shares sold | 4,490 | 4,762 | $178,854 | $213,800 |
| Reinvestment of distributions | 21,042 | 10,190 | 890,712 | 417,572 |
| Shares redeemed | (15,220) | (13,606) | (597,446) | (616,358) |
| Net increase (decrease) | 10,312 | 1,346 | $472,120 | $15,014 |
| Class K | | | | |
| Shares sold | 9,368 | 2,161 | $337,499 | $97,913 |
| Reinvestment of distributions | 1,849 | 979 | 78,519 | 40,226 |
| Shares redeemed | (12,465) | (5,138) | (471,323) | (228,161) |
| Net increase (decrease) | (1,248) | (1,998) | $(55,305) | $(90,022) |
11. Other.
A fund's organizational documents provide former and current trustees and officers with a limited indemnification against liabilities arising in connection with the performance of their duties to the fund. In the normal course of business, a fund may also enter into contracts that provide general indemnifications. A fund's maximum exposure under these arrangements is unknown as this would be dependent on future claims that may be made against a fund. The risk of material loss from such claims is considered remote.
12. Risk and Uncertainties.
Many factors affect a fund's performance. Developments that disrupt global economies and financial markets, such as pandemics, epidemics, outbreaks of infectious diseases, war, terrorism, and environmental disasters, may significantly affect a fund's investment performance. The effects of these developments to a fund will be impacted by the types of securities in which a fund invests, the financial condition, industry, economic sector, and geographic location of an issuer, and a fund's level of investment in the securities of that issuer.
To the Board of Trustees of Fidelity Capital Trust and Shareholders of Fidelity Capital Appreciation Fund
Opinion on the Financial Statements
We have audited the accompanying statement of assets and liabilities, including the schedule of investments, of Fidelity Capital Appreciation Fund (one of the funds constituting Fidelity Capital Trust, referred to hereafter as the "Fund") as of October 31, 2022, the related statement of operations for the year ended October 31, 2022, the statement of changes in net assets for each of the two years in the period ended October 31, 2022, including the related notes, and the financial highlights for each of the five years in the period ended October 31, 2022 (collectively referred to as the "financial statements"). In our opinion, the financial statements present fairly, in all material respects, the financial position of the Fund as of October 31, 2022, the results of its operations for the year then ended, the changes in its net assets for each of the two years in the period ended October 31, 2022 and the financial highlights for each of the five years in the period ended October 31, 2022 in conformity with accounting principles generally accepted in the United States of America.
Basis for Opinion
These financial statements are the responsibility of the Fund's management. Our responsibility is to express an opinion on the Fund's financial statements based on our audits. We are a public accounting firm registered with the Public Company Accounting Oversight Board (United States) (PCAOB) and are required to be independent with respect to the Fund in accordance with the U.S. federal securities laws and the applicable rules and regulations of the Securities and Exchange Commission and the PCAOB.
We conducted our audits of these financial statements in accordance with the standards of the PCAOB. Those standards require that we plan and perform the audit to obtain reasonable assurance about whether the financial statements are free of material misstatement, whether due to error or fraud.
Our audits included performing procedures to assess the risks of material misstatement of the financial statements, whether due to error or fraud, and performing procedures that respond to those risks. Such procedures included examining, on a test basis, evidence regarding the amounts and disclosures in the financial statements. Our audits also included evaluating the accounting principles used and significant estimates made by management, as well as evaluating the overall presentation of the financial statements. Our procedures included confirmation of securities owned as of October 31, 2022 by correspondence with the custodian, issuers of privately offered securities and brokers; when replies were not received from brokers, we performed other auditing procedures. We believe that our audits provide a reasonable basis for our opinion.
/s/ PricewaterhouseCoopers LLP
Boston, Massachusetts
December 14, 2022
We have served as the auditor of one or more investment companies in the Fidelity group of funds since 1932.
The Trustees, Members of the Advisory Board (if any), and officers of the trust and fund, as applicable, are listed below. The Board of Trustees governs the fund and is responsible for protecting the interests of shareholders. The Trustees are experienced executives who meet periodically throughout the year to oversee the fund's activities, review contractual arrangements with companies that provide services to the fund, oversee management of the risks associated with such activities and contractual arrangements, and review the fund's performance. Each of the Trustees oversees 316 funds.
The Trustees hold office without limit in time except that (a) any Trustee may resign; (b) any Trustee may be removed by written instrument, signed by at least two-thirds of the number of Trustees prior to such removal; (c) any Trustee who requests to be retired or who has become incapacitated by illness or injury may be retired by written instrument signed by a majority of the other Trustees; and (d) any Trustee may be removed at any special meeting of shareholders by a two-thirds vote of the outstanding voting securities of the trust. Each Trustee who is not an interested person (as defined in the 1940 Act) of the trust and the fund is referred to herein as an Independent Trustee. Each Independent Trustee shall retire not later than the last day of the calendar year in which his or her 75th birthday occurs. The Independent Trustees may waive this mandatory retirement age policy with respect to individual Trustees. Officers and Advisory Board Members hold office without limit in time, except that any officer or Advisory Board Member may resign or may be removed by a vote of a majority of the Trustees at any regular meeting or any special meeting of the Trustees. Except as indicated, each individual has held the office shown or other offices in the same company for the past five years.
The fund's Statement of Additional Information (SAI) includes more information about the Trustees. To request a free copy, call Fidelity at 1-800-544-8544 if you're an individual investing directly with Fidelity, call 1-800-835-5092 if you're a plan sponsor or participant with Fidelity as your recordkeeper or call 1-877-208-0098 on institutional accounts or if you're an advisor or invest through one.
Experience, Skills, Attributes, and Qualifications of the Trustees. The Governance and Nominating Committee has adopted a statement of policy that describes the experience, qualifications, attributes, and skills that are necessary and desirable for potential Independent Trustee candidates (Statement of Policy). The Board believes that each Trustee satisfied at the time he or she was initially elected or appointed a Trustee, and continues to satisfy, the standards contemplated by the Statement of Policy. The Governance and Nominating Committee also engages professional search firms to help identify potential Independent Trustee candidates who have the experience, qualifications, attributes, and skills consistent with the Statement of Policy. From time to time, additional criteria based on the composition and skills of the current Independent Trustees, as well as experience or skills that may be appropriate in light of future changes to board composition, business conditions, and regulatory or other developments, have also been considered by the professional search firms and the Governance and Nominating Committee. In addition, the Board takes into account the Trustees' commitment and participation in Board and committee meetings, as well as their leadership of standing and ad hoc committees throughout their tenure.
In determining that a particular Trustee was and continues to be qualified to serve as a Trustee, the Board has considered a variety of criteria, none of which, in isolation, was controlling. The Board believes that, collectively, the Trustees have balanced and diverse experience, qualifications, attributes, and skills, which allow the Board to operate effectively in governing the fund and protecting the interests of shareholders. Information about the specific experience, skills, attributes, and qualifications of each Trustee, which in each case led to the Board's conclusion that the Trustee should serve (or continue to serve) as a trustee of the fund, is provided below.
Board Structure and Oversight Function. Robert A. Lawrence is an interested person and currently serves as Chair. The Trustees have determined that an interested Chair is appropriate and benefits shareholders because an interested Chair has a personal and professional stake in the quality and continuity of services provided to the fund. Independent Trustees exercise their informed business judgment to appoint an individual of their choosing to serve as Chair, regardless of whether the Trustee happens to be independent or a member of management. The Independent Trustees have determined that they can act independently and effectively without having an Independent Trustee serve as Chair and that a key structural component for assuring that they are in a position to do so is for the Independent Trustees to constitute a substantial majority for the Board. The Independent Trustees also regularly meet in executive session. David M. Thomas serves as Lead Independent Trustee and as such (i) acts as a liaison between the Independent Trustees and management with respect to matters important to the Independent Trustees and (ii) with management prepares agendas for Board meetings.
Fidelity ® funds are overseen by different Boards of Trustees. The fund's Board oversees Fidelity's high income and certain equity funds, and other Boards oversee Fidelity's investment-grade bond, money market, asset allocation, and other equity funds. The asset allocation funds may invest in Fidelity ® funds overseen by the fund's Board. The use of separate Boards, each with its own committee structure, allows the Trustees of each group of Fidelity ® funds to focus on the unique issues of the funds they oversee, including common research, investment, and operational issues. On occasion, the separate Boards establish joint committees to address issues of overlapping consequences for the Fidelity ® funds overseen by each Board.
The Trustees operate using a system of committees to facilitate the timely and efficient consideration of all matters of importance to the Trustees, the fund, and fund shareholders and to facilitate compliance with legal and regulatory requirements and oversight of the fund's activities and associated risks. The Board, acting through its committees, has charged FMR and its affiliates with (i) identifying events or circumstances the occurrence of which could have demonstrably adverse effects on the fund's business and/or reputation; (ii) implementing processes and controls to lessen the possibility that such events or circumstances occur or to mitigate the effects of such events or circumstances if they do occur; and (iii) creating and maintaining a system designed to evaluate continuously business and market conditions in order to facilitate the identification and implementation processes described in (i) and (ii) above. Because the day-to-day operations and activities of the fund are carried out by or through FMR, its affiliates, and other service providers, the fund's exposure to risks is mitigated but not eliminated by the processes overseen by the Trustees. While each of the Board's committees has responsibility for overseeing different aspects of the fund's activities, oversight is exercised primarily through the Operations, Audit, and Compliance Committees. Appropriate personnel, including but not limited to the fund's Chief Compliance Officer (CCO), FMR's internal auditor, the independent accountants, the fund's Treasurer and portfolio management personnel, make periodic reports to the Board's committees, as appropriate, including an annual review of Fidelity's risk management program for the Fidelity ® funds. The responsibilities of each standing committee, including their oversight responsibilities, are described further under "Standing Committees of the Trustees."
Interested Trustees*:
Correspondence intended for a Trustee who is an interested person may be sent to Fidelity Investments, 245 Summer Street, Boston, Massachusetts 02210.
Name, Year of Birth; Principal Occupations and Other Relevant Experience+
Bettina Doulton (1964)
Year of Election or Appointment: 2020
Trustee
Ms. Doulton also serves as Trustee of other Fidelity ® funds. Prior to her retirement, Ms. Doulton served in a variety of positions at Fidelity Investments, including as a managing director of research (2006-2007), portfolio manager to certain Fidelity ® funds (1993-2005), equity analyst and portfolio assistant (1990-1993), and research assistant (1987-1990). Ms. Doulton currently owns and operates Phi Builders + Architects and Cellardoor Winery. Previously, Ms. Doulton served as a member of the Board of Brown Capital Management, LLC (2014-2018).
Robert A. Lawrence (1952)
Year of Election or Appointment: 2020
Trustee
Chair of the Board of Trustees
Mr. Lawrence also serves as Trustee of other funds. Previously, Mr. Lawrence served as a Trustee and Member of the Advisory Board of certain funds. Prior to his retirement in 2008, Mr. Lawrence served as Vice President of certain Fidelity ® funds (2006-2008), Senior Vice President, Head of High Income Division of Fidelity Management & Research Company (investment adviser firm, 2006-2008), and President of Fidelity Strategic Investments (investment adviser firm, 2002-2005).
* Determined to be an "Interested Trustee" by virtue of, among other things, his or her affiliation with the trust or various entities under common control with FMR.
+ The information includes the Trustee's principal occupation during the last five years and other information relating to the experience, attributes, and skills relevant to the Trustee's qualifications to serve as a Trustee, which led to the conclusion that the Trustee should serve as a Trustee for the fund.
Independent Trustees:
Correspondence intended for an Independent Trustee may be sent to Fidelity Investments, P.O. Box 55235, Boston, Massachusetts 02205-5235.
Name, Year of Birth; Principal Occupations and Other Relevant Experience+
Thomas P. Bostick (1956)
Year of Election or Appointment: 2021
Trustee
Lieutenant General Bostick also serves as Trustee of other Fidelity ® funds. Prior to his retirement, General Bostick (United States Army, Retired) held a variety of positions within the U.S. Army, including Commanding General and Chief of Engineers, U.S. Army Corps of Engineers (2012-2016) and Deputy Chief of Staff and Director of Human Resources, U.S. Army (2009-2012). General Bostick currently serves as a member of the Board and Finance and Governance Committees of CSX Corporation (transportation, 2020-present) and a member of the Board and Corporate Governance and Nominating Committee of Perma-Fix Environmental Services, Inc. (nuclear waste management, 2020-present). General Bostick serves as Chief Executive Officer of Bostick Global Strategies, LLC (consulting, 2016-present) and as a member of the Board of HireVue, Inc. (video interview and assessment, 2020-present). Previously, General Bostick served as a Member of the Advisory Board of certain Fidelity® funds (2021), President, Intrexon Bioengineering (2018-2020) and Chief Operating Officer (2017-2020) and Senior Vice President of the Environment Sector (2016-2017) of Intrexon Corporation (biopharmaceutical company).
Dennis J. Dirks (1948)
Year of Election or Appointment: 2005
Trustee
Mr. Dirks also serves as Trustee of other Fidelity ® funds. Prior to his retirement in May 2003, Mr. Dirks served as Chief Operating Officer and as a member of the Board of The Depository Trust & Clearing Corporation (financial markets infrastructure), President, Chief Operating Officer and a member of the Board of The Depository Trust Company (DTC), President and a member of the Board of the National Securities Clearing Corporation (NSCC), Chief Executive Officer and a member of the Board of the Government Securities Clearing Corporation and Chief Executive Officer and a member of the Board of the Mortgage-Backed Securities Clearing Corporation. Mr. Dirks currently serves as a member of the Finance Committee (2016-present) and Board (2017-present) and is Treasurer (2018-present) of the Asolo Repertory Theatre.
Donald F. Donahue (1950)
Year of Election or Appointment: 2018
Trustee
Mr. Donahue also serves as Trustee of other Fidelity ® funds. Mr. Donahue serves as President and Chief Executive Officer of Miranda Partners, LLC (risk consulting for the financial services industry, 2012-present). Previously, Mr. Donahue served as Chief Executive Officer (2006-2012), Chief Operating Officer (2003-2006) and Managing Director, Customer Marketing and Development (1999-2003) of The Depository Trust & Clearing Corporation (financial markets infrastructure). Mr. Donahue currently serves as a member (2007-present) and Co-Chairman (2016-present) of the Board of United Way of New York and a member of the Board of The Leadership Academy (previously NYC Leadership Academy) (2012-present). Mr. Donahue previously served as a member of the Advisory Board of certain Fidelity® funds (2015-2018).
Vicki L. Fuller (1957)
Year of Election or Appointment: 2020
Trustee
Ms. Fuller also serves as Trustee of other Fidelity ® funds. Previously, Ms. Fuller served as a member of the Advisory Board of certain Fidelity ® funds (2018-2020), Chief Investment Officer of the New York State Common Retirement Fund (2012-2018) and held a variety of positions at AllianceBernstein L.P. (global asset management, 1985-2012), including Managing Director (2006-2012) and Senior Vice President and Senior Portfolio Manager (2001-2006). Ms. Fuller currently serves as a member of the Board, Audit Committee and Nominating and Governance Committee of two Blackstone business development companies (2020-present), as a member of the Board of Treliant, LLC (consulting, 2019-present), as a member of the Advisory Board of Ariel Alternatives, LLC (private equity, 2021-present) and as a member of the Board and Chair of the Audit Committee of Gusto, Inc. (software, 2021-present). In addition, Ms. Fuller currently serves as a member of the Board of Roosevelt University (2019-present) and as a member of the Executive Board of New York University's Stern School of Business. Ms. Fuller previously served as a member of the Board, Audit Committee and Nominating and Governance Committee of The Williams Companies, Inc. (natural gas infrastructure, 2018-2021).
Patricia L. Kampling (1959)
Year of Election or Appointment: 2020
Trustee
Ms. Kampling also serves as Trustee of other Fidelity ® funds. Prior to her retirement, Ms. Kampling served as Chairman of the Board and Chief Executive Officer (2012-2019), President and Chief Operating Officer (2011-2012) and Executive Vice President and Chief Financial Officer (2010-2011) of Alliant Energy Corporation. Ms. Kampling currently serves as a member of the Board, Finance Committee and Governance, Compensation and Nominating Committee of Xcel Energy Inc. (utilities company, 2020-present) and as a member of the Board, Audit, Finance and Risk Committee and Safety, Environmental, Technology and Operations Committee and Chair of the Executive Development and Compensation Committee of American Water Works Company, Inc. (utilities company, 2019-present). In addition, Ms. Kampling currently serves as a member of the Board of the Nature Conservancy, Wisconsin Chapter (2019-present). Previously, Ms. Kampling served as a Member of the Advisory Board of certain Fidelity® funds (2020), a member of the Board, Compensation Committee and Executive Committee and Chair of the Audit Committee of Briggs & Stratton Corporation (manufacturing, 2011-2021), a member of the Board of Interstate Power and Light Company (2012-2019) and Wisconsin Power and Light Company (2012-2019) (each a subsidiary of Alliant Energy Corporation) and as a member of the Board and Workforce Development Committee of the Business Roundtable (2018-2019).
Thomas A. Kennedy (1955)
Year of Election or Appointment: 2021
Trustee
Mr. Kennedy also serves as Trustee of other Fidelity ® funds. Previously, Mr. Kennedy served as a Member of the Advisory Board of certain Fidelity ® funds (2020) and held a variety of positions at Raytheon Company (aerospace and defense, 1983-2020), including Chairman and Chief Executive Officer (2014-2020) and Executive Vice President and Chief Operating Officer (2013-2014). Mr. Kennedy currently serves as Executive Chairman of the Board of Directors of Raytheon Technologies Corporation (aerospace and defense, 2020-present). He is also a member of the Rutgers School of Engineering Industry Advisory Board (2011-present) and a member of the UCLA Engineering Dean's Executive Board (2016-present).
Oscar Munoz (1959)
Year of Election or Appointment: 2021
Trustee
Mr. Munoz also serves as Trustee of other Fidelity ® funds. Prior to his retirement, Mr. Munoz served as Executive Chairman (2020-2021), Chief Executive Officer (2015-2020), President (2015-2016) and a member of the Board (2010-2021) of United Airlines Holdings, Inc. Mr. Munoz currently serves as a member of the Board of CBRE Group, Inc. (commercial real estate, 2020-present), a member of the Board of Univision Communications, Inc. (Hispanic media, 2020-present) and a member of the Advisory Board of Salesforce.com, Inc. (cloud-based software, 2020-present). Previously, Mr. Munoz served as a Member of the Advisory Board of certain Fidelity ® funds (2021).
Garnett A. Smith (1947)
Year of Election or Appointment: 2018
Trustee
Mr. Smith also serves as Trustee of other Fidelity ® funds. Prior to his retirement, Mr. Smith served as Chairman and Chief Executive Officer (1990-1997) and President (1986-1990) of Inbrand Corp. (manufacturer of personal absorbent products). Prior to his employment with Inbrand Corp., he was employed by a retail fabric chain and North Carolina National Bank (now Bank of America). Mr. Smith previously served as a member of the Advisory Board of certain Fidelity ® funds (2012-2013).
David M. Thomas (1949)
Year of Election or Appointment: 2008
Trustee
Lead Independent Trustee
Mr. Thomas also serves as Trustee of other Fidelity ® funds. Previously, Mr. Thomas served as Executive Chairman (2005-2006) and Chairman and Chief Executive Officer (2000-2005) of IMS Health, Inc. (pharmaceutical and healthcare information solutions). Mr. Thomas currently serves as a member of the Board of Fortune Brands Home and Security (home and security products, 2004-present) and as Director (2013-present) and Non-Executive Chairman of the Board (2022-present) of Interpublic Group of Companies, Inc. (marketing communication).
Susan Tomasky (1953)
Year of Election or Appointment: 2020
Trustee
Ms. Tomasky also serves as Trustee of other Fidelity ® funds. Prior to her retirement, Ms. Tomasky served in various executive officer positions at American Electric Power Company, Inc. (1998-2011), including most recently as President of AEP Transmission (2007-2011). Ms. Tomasky currently serves as a member of the Board and Sustainability Committee and as Chair of the Audit Committee of Marathon Petroleum Corporation (2018-present) and as a member of the Board, Executive Committee, Corporate Governance Committee and Organization and Compensation Committee and as Chair of the Audit Committee of Public Service Enterprise Group, Inc. (utilities company, 2012-present) and as a member of the Board of its subsidiary company, Public Service Electric and Gas Co. (2021-present). In addition, Ms. Tomasky currently serves as a member (2009-present) and President (2020-present) of the Board of the Royal Shakespeare Company - America (2009-present), as a member of the Board of the Columbus Association for the Performing Arts (2011-present) and as a member of the Board and Kenyon in the World Committee of Kenyon College (2016-present). Previously, Ms. Tomasky served as a Member of the Advisory Board of certain Fidelity ® funds (2020), as a member of the Board of the Columbus Regional Airport Authority (2007-2020), as a member of the Board (2011-2018) and Lead Independent Director (2015-2018) of Andeavor Corporation (previously Tesoro Corporation) (independent oil refiner and marketer) and as a member of the Board of Summit Midstream Partners LP (energy, 2012-2018).
Michael E. Wiley (1950)
Year of Election or Appointment: 2018
Trustee
Mr. Wiley also serves as Trustee of other Fidelity ® funds. Previously, Mr. Wiley served as a member of the Advisory Board of certain Fidelity ® funds (2018-2020), Chairman, President and CEO of Baker Hughes, Inc. (oilfield services, 2000-2004). Mr. Wiley also previously served as a member of the Board of Andeavor Corporation (independent oil refiner and marketer, 2005-2018), a member of the Board of Andeavor Logistics LP (natural resources logistics, 2015-2018) and a member of the Board of High Point Resources (exploration and production, 2005-2020).
+ The information includes the Trustee's principal occupation during the last five years and other information relating to the experience, attributes, and skills relevant to the Trustee's qualifications to serve as a Trustee, which led to the conclusion that the Trustee should serve as a Trustee for the fund.
Advisory Board Members and Officers:
Correspondence intended for a Member of the Advisory Board (if any) may be sent to Fidelity Investments, P.O. Box 55235, Boston, Massachusetts 02205-5235. Correspondence intended for an officer or Peter S. Lynch may be sent to Fidelity Investments, 245 Summer Street, Boston, Massachusetts 02210. Officers appear below in alphabetical order.
Name, Year of Birth; Principal Occupation
Peter S. Lynch (1944)
Year of Election or Appointment: 2003
Member of the Advisory Board
Mr. Lynch also serves as a Member of the Advisory Board of other Fidelity ® funds. Mr. Lynch is Vice Chairman and a Director of Fidelity Management & Research Company LLC (investment adviser firm). In addition, Mr. Lynch serves as a Trustee of Boston College and as the Chairman of the Inner-City Scholarship Fund. Previously, Mr. Lynch served as Vice Chairman and a Director of FMR Co., Inc. (investment adviser firm) and on the Special Olympics International Board of Directors (1997-2006).
Craig S. Brown (1977)
Year of Election or Appointment: 2022
Deputy Treasurer
Mr. Brown also serves as an officer of other funds. Mr. Brown serves as Assistant Treasurer of FIMM, LLC (2021-present) and is an employee of Fidelity Investments (2013-present). Previously, Mr. Brown served as Assistant Treasurer of certain Fidelity ® funds (2019-2022).
John J. Burke III (1964)
Year of Election or Appointment: 2018
Chief Financial Officer
Mr. Burke also serves as Chief Financial Officer of other funds. Mr. Burke serves as Head of Investment Operations for Fidelity Fund and Investment Operations (2018-present) and is an employee of Fidelity Investments (1998-present). Previously Mr. Burke served as head of Asset Management Investment Operations (2012-2018).
William C. Coffey (1969)
Year of Election or Appointment: 2019
Assistant Secretary
Mr. Coffey also serves as Assistant Secretary of other funds. He is Senior Vice President and Deputy General Counsel of FMR LLC (diversified financial services company, 2010-present), and is an employee of Fidelity Investments. Previously, Mr. Coffey served as Secretary and CLO of certain funds (2018-2019); CLO, Secretary, and Senior Vice President of Fidelity Management & Research Company and FMR Co., Inc. (investment adviser firms, 2018-2019); Secretary of Fidelity SelectCo, LLC and Fidelity Investments Money Management, Inc. (investment adviser firms, 2018-2019); CLO of Fidelity Management & Research (Hong Kong) Limited, FMR Investment Management (UK) Limited, and Fidelity Management & Research (Japan) Limited (investment adviser firms, 2018-2019); and Assistant Secretary of certain funds (2009-2018).
Timothy M. Cohen (1969)
Year of Election or Appointment: 2018
Vice President
Mr. Cohen also serves as Vice President of other funds. Mr. Cohen serves as Co-Head of Equity (2018-present), a Director of Fidelity Management & Research (Japan) Limited (investment adviser firm, 2016-present), and is an employee of Fidelity Investments. Previously, Mr. Cohen served as Executive Vice President of Fidelity SelectCo, LLC (2019), Head of Global Equity Research (2016-2018), Chief Investment Officer - Equity and a Director of Fidelity Management & Research (U.K.) Inc. (investment adviser firm, 2013-2015) and as a Director of Fidelity Management & Research (Hong Kong) Limited (investment adviser firm, 2017).
Jonathan Davis (1968)
Year of Election or Appointment: 2010
Assistant Treasurer
Mr. Davis also serves as an officer of other funds. Mr. Davis serves as Assistant Treasurer of FIMM, LLC (2021-present), FMR Capital, Inc. (2017-present), FD Funds GP LLC (2021-present), FD Funds Holding LLC (2021-present), and FD Funds Management LLC (2021-present); and is an employee of Fidelity Investments. Previously, Mr. Davis served as Vice President and Associate General Counsel of FMR LLC (diversified financial services company, 2003-2010).
Laura M. Del Prato (1964)
Year of Election or Appointment: 2018
Assistant Treasurer
Ms. Del Prato also serves as an officer of other funds. Ms. Del Prato serves as Assistant Treasurer of FIMM, LLC (2021-present) and is an employee of Fidelity Investments (2017-present). Previously, Ms. Del Prato served as President and Treasurer of The North Carolina Capital Management Trust: Cash Portfolio and Term Portfolio (2018-2020). Prior to joining Fidelity Investments, Ms. Del Prato served as a Managing Director and Treasurer of the JPMorgan Mutual Funds (2014-2017). Prior to JPMorgan, Ms. Del Prato served as a partner at Cohen Fund Audit Services (accounting firm, 2012-2013) and KPMG LLP (accounting firm, 2004-2012).
Colm A. Hogan (1973)
Year of Election or Appointment: 2020
Assistant Treasurer
Mr. Hogan also serves as an officer of other funds. Mr. Hogan serves as Assistant Treasurer of FIMM, LLC (2021-present) and FMR Capital, Inc. (2017-present) and is an employee of Fidelity Investments (2005-present). Previously, Mr. Hogan served as Deputy Treasurer of certain Fidelity ® funds (2016-2020) and Assistant Treasurer of certain Fidelity ® funds (2016-2018).
Pamela R. Holding (1964)
Year of Election or Appointment: 2018
Vice President
Ms. Holding also serves as Vice President of other funds. Ms. Holding serves as Co-Head of Equity (2018-present) and is an employee of Fidelity Investments (2013-present). Previously, Ms. Holding served as Executive Vice President of Fidelity SelectCo, LLC (2019) and as Chief Investment Officer of Fidelity Institutional Asset Management (2013-2018).
Cynthia Lo Bessette (1969)
Year of Election or Appointment: 2019
Secretary and Chief Legal Officer (CLO)
Ms. Lo Bessette also serves as an officer of other funds. Ms. Lo Bessette serves as CLO, Secretary, and Senior Vice President of Fidelity Management & Research Company LLC (investment adviser firm, 2019-present); CLO of Fidelity Management & Research (Hong Kong) Limited, FMR Investment Management (UK) Limited, and Fidelity Management & Research (Japan) Limited (investment adviser firms, 2019-present); Secretary of FD Funds GP LLC (2021-present), FD Funds Holding LLC (2021-present), FD Funds Management LLC (2021-present), and Fidelity Diversifying Solutions LLC (investment adviser firm, 2022-present); and Assistant Secretary of FIMM, LLC (2019-present). She is a Senior Vice President and Deputy General Counsel of FMR LLC (diversified financial services company, 2019-present), and is an employee of Fidelity Investments. Previously, Ms. Lo Bessette served as CLO, Secretary, and Senior Vice President of FMR Co., Inc. (investment adviser firm, 2019); Secretary of Fidelity SelectCo, LLC and Fidelity Investments Money Management, Inc. (investment adviser firms, 2019). Prior to joining Fidelity Investments, Ms. Lo Bessette was Executive Vice President, General Counsel (2016-2019) and Senior Vice President, Deputy General Counsel (2015-2016) of OppenheimerFunds (investment management company) and Deputy Chief Legal Officer (2013-2015) of Jennison Associates LLC (investment adviser firm).
Chris Maher (1972)
Year of Election or Appointment: 2020
Deputy Treasurer
Mr. Maher also serves as an officer of other funds. Mr. Maher serves as Assistant Treasurer of FIMM, LLC (2021-present) and FMR Capital, Inc. (2017-present), and is an employee of Fidelity Investments (2008-present). Previously, Mr. Maher served as Assistant Treasurer of certain funds (2013-2020); Vice President of Asset Management Compliance (2013), Vice President of the Program Management Group of FMR (investment adviser firm, 2010-2013), and Vice President of Valuation Oversight (2008-2010).
Jason P. Pogorelec (1975)
Year of Election or Appointment: 2020
Chief Compliance Officer
Mr. Pogorelec also serves as Chief Compliance Officer of other funds. Mr. Pogorelec is a senior Vice President of Asset Management Compliance for Fidelity Investments and is an employee of Fidelity Investments (2006-present). Previously, Mr. Pogorelec served as Vice President, Associate General Counsel for Fidelity Investments (2010-2020) and Assistant Secretary of certain Fidelity funds (2015-2020).
Brett Segaloff (1972)
Year of Election or Appointment: 2021
Anti-Money Laundering (AML) Officer
Mr. Segaloff also serves as an AML Officer of other funds and other related entities. He is Director, Anti-Money Laundering (2007-present) of FMR LLC (diversified financial services company) and is an employee of Fidelity Investments (1996-present).
Stacie M. Smith (1974)
Year of Election or Appointment: 2016
President and Treasurer
Ms. Smith also serves as an officer of other funds. Ms. Smith serves as Assistant Treasurer of FIMM, LLC (2021-present) and FMR Capital, Inc. (2017-present), is an employee of Fidelity Investments (2009-present), and has served in other fund officer roles. Prior to joining Fidelity Investments, Ms. Smith served as Senior Audit Manager of Ernst & Young LLP (accounting firm, 1996-2009). Previously, Ms. Smith served as Assistant Treasurer (2013-2019) and Deputy Treasurer (2013-2016) of certain Fidelity ® funds.
Jim Wegmann (1979)
Year of Election or Appointment: 2019
Assistant Treasurer
Mr. Wegmann also serves as an officer of other funds. Mr. Wegmann serves as Assistant Treasurer of FIMM, LLC (2021-present) and is an employee of Fidelity Investments (2011-present). Previously, Mr. Wegmann served as Assistant Treasurer of certain Fidelity ® funds (2019-2021).
As a shareholder, you incur two types of costs: (1) transaction costs, which may include sales charges (loads) on purchase payments or redemption proceeds, as applicable and (2) ongoing costs, which generally include management fees, distribution and/or service (12b-1) fees and other Fund expenses. This Example is intended to help you understand your ongoing costs (in dollars) of investing in a fund and to compare these costs with the ongoing costs of investing in other mutual funds.
| The Example is based on an investment of $1,000 invested at the beginning of the period and held for the entire period (May 1, 2022 to October 31, 2022). |
Actual Expenses
The first line of the accompanying table provides information about actual account values and actual expenses. You may use the information in this line, together with the amount you invested, to estimate the expenses that you paid over the period. Simply divide your account value by $1,000.00 (for example, an $8,600 account value divided by $1,000.00 = 8.6), then multiply the result by the number in the first line for a class/Fund under the heading entitled "Expenses Paid During Period" to estimate the expenses you paid on your account during this period. If any fund is a shareholder of any underlying mutual funds or exchange-traded funds (ETFs) (the Underlying Funds), such fund indirectly bears its proportional share of the expenses of the Underlying Funds in addition to the direct expenses incurred presented in the table. These fees and expenses are not included in the annualized expense ratio used to calculate the expense estimate in the table below.
Hypothetical Example for Comparison Purposes
The second line of the accompanying table provides information about hypothetical account values and hypothetical expenses based on the actual expense ratio and an assumed rate of return of 5% per year before expenses, which is not the actual return. The hypothetical account values and expenses may not be used to estimate the actual ending account balance or expenses you paid for the period. You may use this information to compare the ongoing costs of investing in the Fund and other funds. To do so, compare this 5% hypothetical example with the 5% hypothetical examples that appear in the shareholder reports of the other funds. If any fund is a shareholder of any Underlying Funds, such fund indirectly bears its proportional share of the expenses of the Underlying Funds in addition to the direct expenses as presented in the table. These fees and expenses are not included in the annualized expense ratio used to calculate the expense estimate in the table below.
Please note that the expenses shown in the table are meant to highlight your ongoing costs only and do not reflect any transaction costs. Therefore, the second line of the table is useful in comparing ongoing costs only, and will not help you determine the relative total costs of owning different funds. In addition, if these transactional costs were included, your costs would have been higher.
| | | | | Annualized Expense Ratio- A | | Beginning Account Value May 1, 2022 | | Ending Account Value October 31, 2022 | | Expenses Paid During Period- C May 1, 2022 to October 31, 2022 |
| Fidelity® Capital Appreciation Fund | | | | | | | | | | |
| Fidelity® Capital Appreciation Fund | | | | .82% | | | | | | |
| Actual | | | | | | $ 1,000 | | $ 925.60 | | $ 3.98 |
Hypothetical- B | | | | | | $ 1,000 | | $ 1,021.07 | | $ 4.18 |
| Class K | | | | .74% | | | | | | |
| Actual | | | | | | $ 1,000 | | $ 925.90 | | $ 3.59 |
Hypothetical- B | | | | | | $ 1,000 | | $ 1,021.48 | | $ 3.77 |
| |
A Annualized expense ratio reflects expenses net of applicable fee waivers.
B 5% return per year before expenses
C Expenses are equal to the annualized expense ratio, multiplied by the average account value over the period, multiplied by 184/ 365 (to reflect the one-half year period). The fees and expenses of any Underlying Funds are not included in each annualized expense ratio.
The dividend and capital gains distributions for the fund(s) are available on Fidelity.com or Institutional.Fidelity.com.
The fund hereby designates as a capital gain dividend with respect to the taxable year ended October 31, 2022, $478,422,045, or, if subsequently determined to be different, the net capital gain of such year.
The fund designates 99.97% of the short-term capital gain dividends distributed during the fiscal year as qualifying to be taxed as short-term capital gain dividends for nonresident alien shareholders.
Capital Appreciation and Class K designate 31% of the dividends distributed during the fiscal year as qualifying for the dividends-received deduction for corporate shareholders.
Capital Appreciation designates 35%, and Class K designates 34% of the dividends distributed during the fiscal year as amounts which may be taken into account as a dividend for purposes of the maximum rate under section 1(h)(11) of the Internal Revenue Code.
Capital Appreciation and Class K designate 1% of the dividends distributed during the fiscal year as a section 199A dividend.
The fund will notify shareholders in January 2023 of amounts for use in preparing 2022 income tax returns.
Fidelity Capital Appreciation Fund
Each year, the Board of Trustees, including the Independent Trustees (together, the Board), votes on the renewal of the management contract with Fidelity Management & Research Company LLC (FMR) and the sub-advisory agreements (together, the Advisory Contracts) for the fund. FMR and the sub-advisers are referred to herein as the Investment Advisers. The Board, assisted by the advice of fund counsel and Independent Trustees' counsel, requests and considers a broad range of information relevant to the renewal of the Advisory Contracts throughout the year.
The Board meets regularly and, at each of its meetings, covers an extensive agenda of topics and materials and considers factors that are relevant to its annual consideration of the renewal of the fund's Advisory Contracts, including the services and support provided to the fund and its shareholders. The Board has established various standing committees (Committees), each composed of and chaired by Independent Trustees with varying backgrounds, to which the Board has assigned specific subject matter responsibilities in order to enhance effective decision-making by the Board. The Board, acting directly and through its Committees, requests and receives information concerning the annual consideration of the renewal of the fund's Advisory Contracts. The Board also meets as needed to review matters specifically related to the Board's annual consideration of the renewal of the Advisory Contracts. Members of the Board may also meet with trustees of other Fidelity funds through joint ad hoc committees to discuss certain matters relevant to all of the Fidelity funds.
At its May 2022 meeting, the Board unanimously determined to renew the fund's Advisory Contracts. In reaching its determination, the Board considered all factors it believed relevant, including (i) the nature, extent, and quality of the services provided to the fund and its shareholders (including the investment performance of the fund); (ii) the competitiveness relative to peer funds of the fund's management fee and the total expense ratio of a representative class (retail class); (iii) the total costs of the services provided by and the profits realized by Fidelity from its relationships with the fund; and (iv) the extent to which, if any, economies of scale exist and are realized as the fund grows, and whether any economies of scale are appropriately shared with fund shareholders.
In considering whether to renew the Advisory Contracts for the fund, the Board reached a determination, with the assistance of fund counsel and Independent Trustees' counsel and through the exercise of its business judgment, that the renewal of the Advisory Contracts was in the best interests of the fund and its shareholders and that the compensation payable under the Advisory Contracts was fair and reasonable. The Board's decision to renew the Advisory Contracts was not based on any single factor, but rather was based on a comprehensive consideration of all the information provided to the Board at its meetings throughout the year. The Board, in reaching its determination to renew the Advisory Contracts, was aware that shareholders of the fund have a broad range of investment choices available to them, including a wide choice among funds offered by Fidelity's competitors, and that the fund's shareholders, who have the opportunity to review and weigh the disclosure provided by the fund in its prospectus and other public disclosures, have chosen to invest in this fund, which is part of the Fidelity family of funds.
Nature, Extent, and Quality of Services Provided . The Board considered Fidelity's staffing as it relates to the fund, including the backgrounds of investment personnel of Fidelity, and also considered the fund's investment objective, strategies, and related investment philosophy. The Independent Trustees also had discussions with senior management of Fidelity's investment operations and investment groups. The Board considered the structure of the investment personnel compensation program and whether this structure provides appropriate incentives to act in the best interests of the fund. Additionally, the Board considered the portfolio managers' investments, if any, in the funds that they manage. The Board also considered the steps Fidelity had taken to ensure the continued provision of high quality services to the Fidelity funds during the COVID-19 pandemic, including the expansion of staff in client facing positions to maintain service levels in periods of high volumes and volatility.
Resources Dedicated to Investment Management and Support Services . The Board and the Fund Oversight and Research Committees reviewed the general qualifications and capabilities of Fidelity's investment staff, including its size, education, experience, and resources, as well as Fidelity's approach to recruiting, training, managing, and compensating investment personnel. The Board noted the resources devoted to expansion of Fidelity's global investment organization, and that Fidelity's analysts have extensive resources, tools, and capabilities that allow them to conduct sophisticated quantitative and fundamental analysis, as well as credit analysis of issuers, counterparties, and guarantors. Further, the Board considered that Fidelity's investment professionals have sufficient access to global information and data so as to provide competitive investment results over time, and that those professionals also have access to sophisticated tools that permit them to assess portfolio construction and risk and performance attribution characteristics continuously, as well as to transmit new information and research conclusions rapidly around the world. Additionally, in its deliberations, the Board considered Fidelity's trading, risk management, compliance, and technology and operations capabilities and resources, which are integral parts of the investment management process.
Shareholder and Administrative Services . The Board considered (i) the nature, extent, quality, and cost of advisory, administrative, and shareholder services performed by the Investment Advisers and their affiliates under the Advisory Contracts and under separate agreements covering transfer agency, pricing and bookkeeping, and securities lending services for the fund; (ii) the nature and extent of the supervision of third party service providers, principally custodians, subcustodians, and pricing vendors; and (iii) the resources devoted to, and the record of compliance with, the fund's compliance policies and procedures. The Board also reviewed the allocation of fund brokerage, including allocations to brokers affiliated with the Investment Advisers, the use of brokerage commissions to pay fund expenses, and the use of "soft" commission dollars to pay for research services.
The Board noted that the growth of fund assets over time across the complex allows Fidelity to reinvest in the development of services designed to enhance the value and convenience of the Fidelity funds as investment vehicles. These services include 24-hour access to account information and market information over the Internet and through telephone representatives, investor education materials and asset allocation tools. The Board also considered that it reviews customer service metrics such as telephone response times, continuity of services on the website and metrics addressing services at Fidelity Investor Centers.
Investment in a Large Fund Family . The Board considered the benefits to shareholders of investing in a Fidelity fund, including the benefits of investing in a fund that is part of a large family of funds offering a variety of investment disciplines and providing a large variety of mutual fund investor services. The Board noted that Fidelity had taken, or had made recommendations that resulted in the Fidelity funds taking, a number of actions over the previous year that benefited particular funds, including: (i) continuing to dedicate additional resources to Fidelity's investment research process, which includes meetings with management of issuers of securities in which the funds invest; (ii) continuing efforts to enhance Fidelity's global research capabilities; (iii) launching new funds and ETFs with innovative structures, strategies and pricing and making other enhancements to meet client needs; (iv) launching new share classes of existing funds; (v) eliminating purchase minimums and broadening eligibility requirements for certain funds and share classes; (vi) reducing management fees and total expenses for certain target date funds and classes and index funds; (vii) lowering expenses for certain existing funds and classes by implementing or lowering expense caps; (viii) rationalizing product lines and gaining increased efficiencies from fund mergers and liquidations; (ix) continuing to develop, acquire and implement systems and technology to improve services to the funds and shareholders, strengthen information security, and increase efficiency; and (x) continuing to implement enhancements to further strengthen Fidelity's product line to increase investors' probability of success in achieving their investment goals, including retirement income goals.
Investment Performance . The Board considered whether the fund has operated in accordance with its investment objective, as well as its record of compliance with its investment restrictions and its performance history. The Board noted that the fund had a portfolio manager change in March 2019. The Board will continue to monitor closely the fund's performance, taking into account the portfolio manager change.
The Board took into account discussions that occur at Board meetings throughout the year with representatives of the Investment Advisers about fund investment performance. In this regard the Board noted that as part of regularly scheduled fund reviews and other reports to the Board on fund performance, the Board considers annualized return information for the fund for different time periods, measured against an appropriate securities market index (benchmark index) and an appropriate peer group of funds with similar objectives (peer group). The Board also reviews and considers information about performance attribution. In its evaluation of fund investment performance, the Board gave particular attention to information indicating changes in performance of certain Fidelity funds for specific time periods and discussed with the Investment Advisers the reasons for any overperformance or underperformance.
In addition to reviewing absolute and relative fund performance, the Independent Trustees periodically consider the appropriateness of fund performance metrics in evaluating the results achieved. In general, the Independent Trustees believe that fund performance should be evaluated based on net performance (after fees and expenses) of the representative class, compared to appropriate benchmark indices, over appropriate time periods that may include full market cycles, and compared to peer groups, as applicable, over the same periods, taking into account relevant factors including the following: general market conditions; issuer-specific information; and fund cash flows and other factors.
The Independent Trustees recognize that shareholders evaluate performance on a net basis over their own holding periods, for which one-, three-, and five-year periods are often used as a proxy. For this reason, the performance information reviewed by the Board also included net cumulative total return information for the fund and an appropriate benchmark index and peer group for the most recent one-, three-, and five-year periods ended September 30, 2021, as shown below. Returns are shown compared to the 25th percentile (top of box, 75% beaten) and 75th percentile (bottom of box, 25% beaten) of the peer universe.
Fidelity Capital Appreciation Fund
The Board also considered that the fund's management fee is subject to upward or downward adjustment depending upon whether, and to what extent, the fund's investment performance for the performance period (a rolling 36-month period) exceeds, or is exceeded by, a securities index, thus leading to a performance adjustment for the same period. The Board noted that the performance adjustment provides FMR with a strong economic incentive to seek to achieve superior long-term performance for the fund's shareholders and helps to more closely align the interests of FMR and the shareholders of the fund.
Based on its review, the Board concluded that the nature, extent, and quality of services provided to the fund under the Advisory Contracts should continue to benefit the shareholders of the fund.
Competitiveness of Management Fee and Total Expense Ratio . The Board considered the fund's management fee and total expense ratio compared to "mapped groups" of competitive funds and classes created for the purpose of facilitating the Trustees' competitive analysis of management fees and total expenses. Fidelity creates "mapped groups" by combining similar Lipper investment objective categories that have comparable investment mandates. Combining Lipper investment objective categories aids the Board's management fee and total expense ratio comparisons by broadening the competitive group used for comparison.
Management Fee . The Board considered two proprietary management fee comparisons for the 12-month periods ended September 30 (June 30 for periods ended 2019 and 2018 and December 31 for periods prior to 2018) shown in basis points (BP) in the chart below. The group of Lipper funds used by the Board for management fee comparisons is referred to below as the "Total Mapped Group." The Total Mapped Group comparison focuses on a fund's standing in terms of gross management fees before expense reimbursements or caps, and without giving effect to the fund's performance adjustment, relative to the total universe of funds with comparable investment mandates, regardless of whether their management fee structures also are comparable. Funds with comparable investment mandates offer exposure to similar types of securities. Funds with comparable management fee structures have similar management fee contractual arrangements (e.g., flat rate charged for advisory services, all-inclusive fee rate, etc.). "TMG %" represents the percentage of funds in the Total Mapped Group that had management fees that were lower than the fund's. For example, a hypothetical TMG % of 20% would mean that 80% of the funds in the Total Mapped Group had higher, and 20% had lower, management fees than the fund. The fund's actual TMG %s and the number of funds in the Total Mapped Group are in the chart below. The "Asset-Sized Peer Group" (ASPG) comparison focuses on a fund's standing relative to a subset of non-Fidelity funds within the Total Mapped Group that are similar in size and management fee structure without taking into account performance adjustments, if any. For example, if a fund is in the first quartile of the ASPG, the fund's management fee ranks in the least expensive or lowest 25% of funds in the ASPG. The ASPG represents at least 15% of the funds in the Total Mapped Group with comparable asset size and management fee structures, subject to a minimum of 50 funds (or all funds in the Total Mapped Group if fewer than 50). Additional information, such as the ASPG quartile in which the fund's management fee rate ranked and the impact of the fund's performance adjustment, is also included in the chart and was considered by the Board.
Fidelity Capital Appreciation Fund
The Board noted that the fund's management fee rate ranked below the median of its Total Mapped Group and below the median of its ASPG for the 12-month period ended September 30, 2021. The Board also noted the effect of the fund's performance adjustment, if any, on the fund's management fee ranking.
The Board also considered that, for funds subject to the group fee, FMR agreed to voluntarily waive fees over a specified period of time in amounts designed to account for assets converted from certain funds to certain collective investment trusts.
Based on its review, the Board concluded that the fund's management fee is fair and reasonable in light of the services that the fund receives and the other factors considered.
Total Expense Ratio . In its review of the total expense ratio of the representative class (retail class), the Board considered the fund's management fee rate as well as other fund or class expenses, as applicable, such as transfer agent fees, pricing and bookkeeping fees, and custodial, legal, and audit fees. The Board noted the impact of the fund's performance adjustment. The Board also noted that Fidelity may agree to waive fees or reimburse expenses from time to time, and the extent to which, if any, it has done so for the fund. The fund's representative class is compared to those funds and classes in the Total Mapped Group (used by the Board for management fee comparisons) that have a similar sales load structure. The Board also considered a total expense ASPG comparison for the representative class, which focuses on the total expenses of the representative class relative to a subset of non-Fidelity funds within the total expense similar sales load structure group. The total expense ASPG is limited to 15 larger and 15 smaller classes in fund average assets for a total of 30 classes, where possible. The total expense ASPG comparison excludes performance adjustments and fund-paid 12b-1 fees to eliminate variability in fee structures.
The Board noted that the total net expense ratio of the retail class ranked below the similar sales load structure group competitive median and below the ASPG competitive median for the 12-month period ended September 30, 2021.
Fees Charged to Other Fidelity Clients . The Board also considered Fidelity fee structures and other information with respect to clients of Fidelity, such as other funds advised or subadvised by Fidelity, pension plan clients, and other institutional clients with similar mandates. The Board noted that a joint ad hoc committee created by it and the boards of other Fidelity funds periodically reviews and compares Fidelity's institutional investment advisory business with its business of providing services to the Fidelity funds and also noted the most recent findings of the committee. The Board noted that the committee's review included a consideration of the differences in services provided, fees charged, and costs incurred, as well as competition in the markets serving the different categories of clients.
Based on its review of total expense ratios and fees charged to other Fidelity clients, the Board concluded that the total expense ratio of each class of the fund was reasonable in light of the services that the fund and its shareholders receive and the other factors considered.
Costs of the Services and Profitability . The Board considered the revenues earned and the expenses incurred by Fidelity in conducting the business of developing, marketing, distributing, managing, administering and servicing the fund and servicing the fund's shareholders. The Board also considered the level of Fidelity's profits in respect of all the Fidelity funds.
On an annual basis, Fidelity presents to the Board information about the profitability of its relationships with the fund. Fidelity calculates profitability information for each fund, as well as aggregate profitability information for groups of Fidelity funds and all Fidelity funds, using a series of detailed revenue and cost allocation methodologies which originate with the books and records of Fidelity on which Fidelity's audited financial statements are based. The Audit Committee of the Board reviews any significant changes from the prior year's methodologies and the full Board approves such changes.
A public accounting firm has been engaged annually by the Board as part of the Board's assessment of Fidelity's profitability analysis. The engagement includes the review and assessment of the methodologies used by Fidelity in determining the revenues and expenses attributable to Fidelity's mutual fund business, and completion of agreed-upon procedures in respect of the mathematical accuracy of certain fund profitability information and its conformity to established allocation methodologies. After considering the reports issued under the engagement and information provided by Fidelity, the Board concluded that while other allocation methods may also be reasonable, Fidelity's profitability methodologies are reasonable in all material respects.
The Board also reviewed Fidelity's non-fund businesses and potential indirect benefits such businesses may have received as a result of their association with Fidelity's mutual fund business (i.e., fall-out benefits) as well as cases where Fidelity's affiliates may benefit from the funds' business. The Board considered areas where potential indirect benefits to the Fidelity funds from their relationships with Fidelity may exist. The Board's consideration of these matters was informed by the findings of a joint ad hoc committee created by it and the boards of other Fidelity funds to evaluate potential fall-out benefits.
The Board considered the costs of the services provided by and the profits realized by Fidelity in connection with the operation of the fund and was satisfied that the profitability was not excessive.
Economies of Scale . The Board considered whether there have been economies of scale in respect of the management of the Fidelity funds, whether the Fidelity funds (including the fund) have appropriately benefited from any such economies of scale, and whether there is potential for realization of any further economies of scale. The Board considered the extent to which the fund will benefit from economies of scale as assets grow through increased services to the fund, through waivers or reimbursements, or through fee or expense ratio reductions. The Board also noted that a committee (the Economies of Scale Committee) created by it and the boards of other Fidelity funds periodically analyzes whether Fidelity attains economies of scale in respect of the management and servicing of the Fidelity funds, whether the Fidelity funds have appropriately benefited from such economies of scale, and whether there is potential for realization of any further economies of scale.
The Board recognized that the fund's management contract incorporates a "group fee" structure, which provides for lower group fee rates as total "group assets" increase, and for higher group fee rates as total "group assets" decrease ("group assets" as defined in the management contract). FMR calculates the group fee rates based on a tiered asset "breakpoint" schedule that varies based on asset class. The Board considered that the group fee is designed to deliver the benefits of economies of scale to fund shareholders when total Fidelity fund assets increase, even if assets of any particular fund are unchanged or have declined, because some portion of Fidelity's costs are attributable to services provided to all Fidelity funds, and all funds benefit if those costs can be allocated among more assets. The Board further considered that Fidelity agreed to impose a temporary fee waiver in the form of additional breakpoints to the current breakpoint schedule. The Board concluded that, given the group fee structure, fund shareholders will benefit from lower management fees as "group assets" increase at the fund complex level, regardless of whether Fidelity achieves any such economies of scale.
The Board concluded, taking into account the analysis of the Economies of Scale Committee, that economies of scale, if any, are being appropriately shared between fund shareholders and Fidelity.
Additional Information Requested by the Board . In order to develop fully the factual basis for consideration of the Fidelity funds' advisory contracts, the Board requested and received additional information on certain topics, including: (i) fund flow and performance trends, in particular the underperformance of certain funds and strategies, and Fidelity's long-term strategies for certain funds, including any consideration of fund liquidations or mergers; (ii) the operation of performance fees, competitor use of performance fees and consideration of the expansion of performance fees to additional funds; (iii) Fidelity's pricing philosophy compared to competitors; (iv) fund profitability methodology and data; (v) evaluation of competitive fund data and peer group classifications and fee and expense comparisons; (vi) the management fee and expense structures for different funds and classes and information about the differences between various fee and expense structures; (vii) group fee breakpoints and related voluntary fee waivers; and (viii) information regarding other accounts managed by Fidelity and the funds' sub-advisory arrangements.
Based on its evaluation of all of the conclusions noted above, and after considering all factors it believed relevant, the Board concluded that the advisory fee arrangements are fair and reasonable and that the fund's Advisory Contracts should be renewed.
1.538293.125
CAF-ANN-1222
Fidelity® Value Fund
Annual Report
October 31, 2022
Contents
To view a fund's proxy voting guidelines and proxy voting record for the 12-month period ended June 30, visit http://www.fidelity.com/proxyvotingresults or visit the Securities and Exchange Commission's (SEC) web site at http://www.sec.gov.
You may also call 1-800-544-8544 if you're an individual investing directly with Fidelity, call 1-800-835-5092 if you're a plan sponsor or participant with Fidelity as your recordkeeper or call 1-877-208-0098 on institutional accounts or if you're an advisor or invest through one to request a free copy of the proxy voting guidelines.
Standard & Poor's, S&P and S&P 500 are registered service marks of The McGraw-Hill Companies, Inc. and have been licensed for use by Fidelity Distributors Corporation.
Other third-party marks appearing herein are the property of their respective owners.
All other marks appearing herein are registered or unregistered trademarks or service marks of FMR LLC or an affiliated company. © 2022 FMR LLC. All rights reserved.
This report and the financial statements contained herein are submitted for the general information of the shareholders of the Fund. This report is not authorized for distribution to prospective investors in the Fund unless preceded or accompanied by an effective prospectus.
A fund files its complete schedule of portfolio holdings with the SEC for the first and third quarters of each fiscal year on Form N-PORT. Forms N-PORT are available on the SEC's web site at http://www.sec.gov. A fund's Forms N-PORT may be reviewed and copied at the SEC's Public Reference Room in Washington, DC. Information regarding the operation of the SEC's Public Reference Room may be obtained by calling 1-800-SEC-0330.
For a complete list of a fund's portfolio holdings, view the most recent holdings listing, semiannual report, or annual report on Fidelity's web site at http://www.fidelity.com, http://www.institutional.fidelity.com, or http://www.401k.com, as applicable.
NOT FDIC INSURED •MAY LOSE VALUE •NO BANK GUARANTEE
Neither the Fund nor Fidelity Distributors Corporation is a bank.
Average annual total return reflects the change in the value of an investment, assuming reinvestment of distributions from dividend income and capital gains (the profits earned upon the sale of securities that have grown in value, if any) and assuming a constant rate of performance each year. The hypothetical investment and the average annual total returns do not reflect the deduction of taxes that a shareholder would pay on fund distributions or the redemption of fund shares. During periods of reimbursement by Fidelity, a fund's total return will be greater than it would be had the reimbursement not occurred. How a fund did yesterday is no guarantee of how it will do tomorrow.
| Average Annual Total Returns |
| | | | |
Periods ended October 31, 2022 | Past 1 year | Past 5 years | Past 10 years |
| Fidelity® Value Fund | -6.80% | 8.66% | 11.30% |
| Class K | -6.63% | 8.77% | 11.42% |
| $10,000 Over 10 Years |
| |
Let's say hypothetically that $10,000 was invested in Fidelity® Value Fund, a class of the fund, on October 31, 2012. The chart shows how the value of your investment would have changed, and also shows how the Russell Midcap® Value Index performed over the same period. |
|
|
Market Recap:
U.S. equities returned -14.61% for the 12 months ending October 31, 2022, according to the S&P 500 ® index, as a multitude of risk factors challenged the global economy and financial markets. Persistently high inflation prompted the Federal Reserve to aggressively tighten monetary policy, and market interest rates eclipsed their highest level in roughly a decade, stoking recession fears and sending stocks into bear market territory. In late 2021, the Fed shifted to a more "hawkish" (restrictive) policy stance and proceeded to hike its benchmark rate five times, by a total of 3%, between March and September - the fastest-ever pace of monetary tightening - while taking substantive steps to shrink its massive asset portfolio. Against this hostile backdrop for risk assets, the S&P 500 ® posted its worst year-to-date result (-23.87%) in 20 years through September, a seasonally weak month for stocks that stayed true to form, and then some, with volatility spiking due to growing certainty the Fed would persist in its effort to cool inflation, even at the expense of economic growth. Three of the index's worst monthly returns ever were recorded this period, with the S&P 500 shedding 8% to 9% in April, June and September. Gains of similar proportion were made in July and October, amid optimism on inflation and policy easing. For the full 12 months, the growth-oriented communication services (-41%) and consumer discretionary (-29%) sectors lagged most. In sharp contrast, energy (+65%) had a strong run, followed by consumer staples (+5%).
Comments from Lead Manager Matthew Friedman:
For the fiscal year ending October 31, 2022, the fund's share classes returned about -7%, outperforming the -10.18% result of the benchmark Russell Midcap ® Value Index. Versus the benchmark, market selection was the primary contributor, led by a notable overweighting in the energy sector. Security selection in industrials and health care also helped. The biggest individual relative contributor was an overweight position in Antero Resources (+84%), the fund's largest holding. Also lifting performance was our outsized stake in Hess, which gained roughly 71%. Hess was also among our biggest holdings. The fund's non-benchmark stake in Cenovus Energy, another of our largest holdings, gained 69%. The fund's foreign holdings contributed overall, despite the headwind of broad U.S.-dollar strength. Conversely, the biggest detractor from performance versus the benchmark was our stock selection in materials. Stock picks and an overweighting in consumer discretionary, and stock selection in real estate, also hampered the fund's relative performance. Our biggest individual relative detractor was an out-of-benchmark position in Unisys (-67%). The fund's non-benchmark investment in Jeld-Wen Holding, a position not held at period end, returned about -62%. Another notable relative detractor was an overweighting in Caesars Entertainment (-60%). Notable changes in positioning include increased exposure to the energy sector and a lower allocation to industrials.
Note to shareholders: On July 27, 2022, Matt Friedman assumed portfolio management responsibilities for all of the fund's industrials assets, while removing John Mirshekari.
The views expressed above reflect those of the portfolio manager(s) only through the end of the period as stated on the cover of this report and do not necessarily represent the views of Fidelity or any other person in the Fidelity organization. Any such views are subject to change at any time based upon market or other conditions and Fidelity disclaims any responsibility to update such views. These views may not be relied on as investment advice and, because investment decisions for a Fidelity fund are based on numerous factors, may not be relied on as an indication of trading intent on behalf of any Fidelity fund.
Top Holdings (% of Fund's net assets) |
| |
| Antero Resources Corp. | 1.6 | |
| Hess Corp. | 1.5 | |
| Edison International | 1.3 | |
| PG&E Corp. | 1.2 | |
| The AES Corp. | 1.1 | |
| CubeSmart | 1.1 | |
| Denbury, Inc. | 1.0 | |
| The Travelers Companies, Inc. | 1.0 | |
| Entergy Corp. | 1.0 | |
| Cenovus Energy, Inc. (Canada) | 0.9 | |
| | 11.7 | |
| |
| Market Sectors (% of Fund's net assets) |
| |
| Consumer Discretionary | 15.4 | |
| Industrials | 15.0 | |
| Financials | 14.0 | |
| Energy | 13.6 | |
| Materials | 12.4 | |
| Health Care | 6.7 | |
| Utilities | 6.4 | |
| Real Estate | 5.4 | |
| Information Technology | 5.1 | |
| Communication Services | 2.8 | |
| Consumer Staples | 2.6 | |
| |
Asset Allocation (% of Fund's net assets) |
|
Foreign investments - 15.1% |
|
Geographic Diversification (% of Fund's net assets) |
|
* Includes Short-Term investments and Net Other Assets (Liabilities). Percentages are based on country or territory of incorporation and are adjusted for the effect of futures contracts, if applicable. |
| |
Showing Percentage of Net Assets
| Common Stocks - 99.4% |
| | | Shares | Value ($) (000s) |
| COMMUNICATION SERVICES - 2.8% | | | |
| Diversified Telecommunication Services - 0.4% | | | |
| Cellnex Telecom SA (a) | | 902,000 | 29,523 |
| Interactive Media & Services - 0.2% | | | |
| Ziff Davis, Inc. (b) | | 265,800 | 20,570 |
| Media - 2.2% | | | |
| DISH Network Corp. Class A (b) | | 727,068 | 10,841 |
| Interpublic Group of Companies, Inc. | | 1,366,500 | 40,708 |
| Liberty Broadband Corp. Class C (b) | | 362,100 | 30,572 |
| News Corp. Class A | | 1,104,300 | 18,630 |
| Nexstar Broadcasting Group, Inc. Class A | | 176,100 | 30,166 |
| Scholastic Corp. | | 749,500 | 28,586 |
| Thryv Holdings, Inc. (b) | | 1,345,400 | 27,527 |
| | | | 187,030 |
TOTAL COMMUNICATION SERVICES | | | 237,123 |
| CONSUMER DISCRETIONARY - 15.4% | | | |
| Auto Components - 1.3% | | | |
| Adient PLC (b) | | 1,471,700 | 51,480 |
| Autoliv, Inc. | | 555,400 | 44,626 |
| Cie Automotive SA | | 560,200 | 14,250 |
| | | | 110,356 |
| Automobiles - 0.7% | | | |
| Harley-Davidson, Inc. | | 1,259,400 | 54,154 |
| Diversified Consumer Services - 1.0% | | | |
| Adtalem Global Education, Inc. (b) | | 1,512,428 | 63,068 |
| Frontdoor, Inc. (b) | | 983,000 | 21,685 |
| | | | 84,753 |
| Hotels, Restaurants & Leisure - 2.8% | | | |
| ARAMARK Holdings Corp. | | 1,191,006 | 43,472 |
| Brinker International, Inc. (b) | | 447,557 | 14,944 |
| Caesars Entertainment, Inc. (b) | | 1,116,004 | 48,803 |
| Hilton Grand Vacations, Inc. (b) | | 593,000 | 23,269 |
| Hyatt Hotels Corp. Class A (b)(c) | | 310,346 | 29,238 |
| Light & Wonder, Inc. Class A (b) | | 546,342 | 30,672 |
| Red Rock Resorts, Inc. (c) | | 1,126,800 | 46,931 |
| | | | 237,329 |
| Household Durables - 1.3% | | | |
| KB Home | | 1,065,200 | 30,699 |
| Mohawk Industries, Inc. (b) | | 352,800 | 33,428 |
| Tempur Sealy International, Inc. | | 1,684,700 | 45,302 |
| | | | 109,429 |
| Internet & Direct Marketing Retail - 0.5% | | | |
| eBay, Inc. | | 1,044,664 | 41,619 |
| Leisure Products - 0.5% | | | |
| Mattel, Inc. (b) | | 2,375,892 | 45,047 |
| Multiline Retail - 2.1% | | | |
| Dollar Tree, Inc. (b) | | 371,000 | 58,804 |
| Franchise Group, Inc. | | 1,460,450 | 44,325 |
| Kohl's Corp. | | 1,598,400 | 47,872 |
| Nordstrom, Inc. (c) | | 1,310,108 | 26,648 |
| | | | 177,649 |
| Specialty Retail - 4.5% | | | |
| Academy Sports & Outdoors, Inc. | | 465,279 | 20,486 |
| American Eagle Outfitters, Inc. (c) | | 5,151,600 | 58,522 |
| Bath & Body Works, Inc. | | 1,306,400 | 43,608 |
| Camping World Holdings, Inc. (c) | | 1,191,200 | 33,151 |
| Lithia Motors, Inc. Class A (sub. vtg.) | | 158,700 | 31,446 |
| Rent-A-Center, Inc. | | 1,784,920 | 37,216 |
| Sally Beauty Holdings, Inc. (b) | | 2,386,646 | 30,334 |
| Signet Jewelers Ltd. (c) | | 593,777 | 38,738 |
| Victoria's Secret & Co. (b) | | 1,744,533 | 65,594 |
| Williams-Sonoma, Inc. (c) | | 106,800 | 13,225 |
| | | | 372,320 |
| Textiles, Apparel & Luxury Goods - 0.7% | | | |
| Capri Holdings Ltd. (b) | | 1,205,066 | 55,047 |
TOTAL CONSUMER DISCRETIONARY | | | 1,287,703 |
| CONSUMER STAPLES - 2.6% | | | |
| Beverages - 0.4% | | | |
| Primo Water Corp. | | 2,293,100 | 33,456 |
| Food & Staples Retailing - 0.8% | | | |
| U.S. Foods Holding Corp. (b) | | 2,216,800 | 65,972 |
| Food Products - 0.8% | | | |
| Darling Ingredients, Inc. (b) | | 823,894 | 64,659 |
| Household Products - 0.3% | | | |
| Energizer Holdings, Inc. | | 850,400 | 24,568 |
| Personal Products - 0.3% | | | |
| Herbalife Nutrition Ltd. (b) | | 1,108,100 | 23,558 |
TOTAL CONSUMER STAPLES | | | 212,213 |
| ENERGY - 13.6% | | | |
| Energy Equipment & Services - 2.8% | | | |
| Halliburton Co. | | 1,600,300 | 58,283 |
| Liberty Oilfield Services, Inc. Class A | | 2,115,133 | 35,767 |
| TechnipFMC PLC (b) | | 6,863,540 | 72,685 |
| Tenaris SA | | 3,166,800 | 49,564 |
| Valaris Ltd. (b) | | 266,900 | 17,864 |
| | | | 234,163 |
| Oil, Gas & Consumable Fuels - 10.8% | | | |
| Antero Resources Corp. (b) | | 3,688,300 | 135,213 |
| APA Corp. | | 282,000 | 12,820 |
| Canadian Natural Resources Ltd. | | 921,600 | 55,275 |
| Cenovus Energy, Inc. (Canada) | | 3,642,281 | 73,629 |
| Chesapeake Energy Corp. | | 187,200 | 19,145 |
| Denbury, Inc. (b) | | 891,927 | 81,531 |
| Devon Energy Corp. | | 310,901 | 24,048 |
| Diamondback Energy, Inc. | | 85,636 | 13,454 |
| Energy Transfer LP | | 3,722,397 | 47,535 |
| EQT Corp. | | 387,642 | 16,219 |
| Genesis Energy LP | | 3,782,595 | 43,462 |
| Hess Corp. | | 902,277 | 127,293 |
| HF Sinclair Corp. | | 962,700 | 58,888 |
| Imperial Oil Ltd. | | 855,400 | 46,533 |
| Kosmos Energy Ltd. (b) | | 6,520,128 | 42,316 |
| Targa Resources Corp. | | 508,380 | 34,758 |
| The Williams Companies, Inc. | | 301,333 | 9,863 |
| Tourmaline Oil Corp. | | 740,300 | 41,711 |
| Valero Energy Corp. | | 162,812 | 20,441 |
| | | | 904,134 |
TOTAL ENERGY | | | 1,138,297 |
| FINANCIALS - 14.0% | | | |
| Banks - 3.8% | | | |
| Bank of Kyoto Ltd. | | 363,800 | 13,114 |
| East West Bancorp, Inc. | | 909,666 | 65,105 |
| First Citizens Bancshares, Inc. | | 56,792 | 46,690 |
| First Citizens Bancshares, Inc. Class B | | 5,400 | 3,818 |
| M&T Bank Corp. | | 404,572 | 68,118 |
| PacWest Bancorp | | 1,165,140 | 28,965 |
| Signature Bank | | 419,400 | 66,487 |
| Wintrust Financial Corp. | | 254,600 | 23,836 |
| | | | 316,133 |
| Capital Markets - 2.4% | | | |
| Ameriprise Financial, Inc. | | 182,500 | 56,414 |
| Lazard Ltd. Class A | | 812,300 | 30,632 |
| LPL Financial | | 272,700 | 69,716 |
| Northern Trust Corp. | | 27,900 | 2,353 |
| Petershill Partners PLC (a) | | 7,977,800 | 18,133 |
| State Street Corp. | | 257,700 | 19,070 |
| | | | 196,318 |
| Consumer Finance - 1.3% | | | |
| OneMain Holdings, Inc. | | 1,262,780 | 48,693 |
| SLM Corp. | | 3,803,342 | 63,097 |
| | | | 111,790 |
| Diversified Financial Services - 1.5% | | | |
| Apollo Global Management, Inc. | | 1,213,502 | 67,179 |
| Corebridge Financial, Inc. | | 322,700 | 7,316 |
| ECN Capital Corp. | | 3,148,069 | 9,497 |
| Equitable Holdings, Inc. | | 1,338,757 | 40,993 |
| | | | 124,985 |
| Insurance - 3.6% | | | |
| AMBAC Financial Group, Inc. (b) | | 1,971,059 | 27,693 |
| American Financial Group, Inc. | | 273,400 | 39,673 |
| Arch Capital Group Ltd. (b) | | 747,151 | 42,961 |
| Assurant, Inc. | | 311,179 | 42,277 |
| First American Financial Corp. | | 438,800 | 22,116 |
| Reinsurance Group of America, Inc. | | 311,449 | 45,836 |
| The Travelers Companies, Inc. | | 441,400 | 81,421 |
| | | | 301,977 |
| Thrifts & Mortgage Finance - 1.4% | | | |
| Axos Financial, Inc. (b) | | 1,275,969 | 49,712 |
| Essent Group Ltd. | | 832,700 | 32,958 |
| Walker & Dunlop, Inc. | | 393,100 | 35,363 |
| | | | 118,033 |
TOTAL FINANCIALS | | | 1,169,236 |
| HEALTH CARE - 6.7% | | | |
| Biotechnology - 0.7% | | | |
| Biogen, Inc. (b) | | 35,899 | 10,175 |
| BioMarin Pharmaceutical, Inc. (b) | | 39,900 | 3,457 |
| Horizon Therapeutics PLC (b) | | 33,931 | 2,115 |
| Poseida Therapeutics, Inc. (b) | | 179,120 | 734 |
| United Therapeutics Corp. (b) | | 173,945 | 40,100 |
| | | | 56,581 |
| Health Care Equipment & Supplies - 0.5% | | | |
| Dentsply Sirona, Inc. | | 298,800 | 9,209 |
| STERIS PLC | | 45,893 | 7,920 |
| Teleflex, Inc. | | 34,620 | 7,428 |
| The Cooper Companies, Inc. | | 33,635 | 9,195 |
| Zimmer Biomet Holdings, Inc. | | 40,931 | 4,640 |
| | | | 38,392 |
| Health Care Providers & Services - 3.6% | | | |
| AdaptHealth Corp. (b)(d) | | 2,418,996 | 55,153 |
| agilon health, Inc. (b) | | 85,200 | 1,691 |
| AmerisourceBergen Corp. | | 79,732 | 12,535 |
| Centene Corp. (b) | | 612,700 | 52,159 |
| Cigna Corp. | | 190,349 | 61,494 |
| Laboratory Corp. of America Holdings | | 221,255 | 49,088 |
| Molina Healthcare, Inc. (b) | | 32,160 | 11,541 |
| Oak Street Health, Inc. (b) | | 116,600 | 2,359 |
| Owens & Minor, Inc. | | 460,836 | 7,834 |
| Quest Diagnostics, Inc. | | 27,800 | 3,993 |
| R1 Rcm, Inc. (b) | | 186,000 | 3,285 |
| Tenet Healthcare Corp. (b) | | 838,007 | 37,174 |
| | | | 298,306 |
| Health Care Technology - 0.0% | | | |
| Evolent Health, Inc. (b) | | 58,000 | 1,845 |
| Life Sciences Tools & Services - 0.9% | | | |
| Agilent Technologies, Inc. | | 61,827 | 8,554 |
| Avantor, Inc. (b) | | 148,320 | 2,992 |
| Bio-Rad Laboratories, Inc. Class A (b) | | 23,562 | 8,287 |
| Charles River Laboratories International, Inc. (b) | | 12,800 | 2,717 |
| IQVIA Holdings, Inc. (b) | | 27,084 | 5,679 |
| PerkinElmer, Inc. (c) | | 59,531 | 7,952 |
| Syneos Health, Inc. (b) | | 867,900 | 43,725 |
| | | | 79,906 |
| Pharmaceuticals - 1.0% | | | |
| Catalent, Inc. (b) | | 81,693 | 5,370 |
| Elanco Animal Health, Inc. (b) | | 906,000 | 11,950 |
| Jazz Pharmaceuticals PLC (b) | | 375,397 | 53,978 |
| Royalty Pharma PLC | | 269,787 | 11,417 |
| | | | 82,715 |
TOTAL HEALTH CARE | | | 557,745 |
| INDUSTRIALS - 15.0% | | | |
| Air Freight & Logistics - 0.6% | | | |
| Deutsche Post AG | | 129,100 | 4,564 |
| FedEx Corp. | | 282,600 | 45,295 |
| | | | 49,859 |
| Building Products - 0.9% | | | |
| Builders FirstSource, Inc. (b) | | 876,750 | 54,060 |
| UFP Industries, Inc. | | 244,800 | 17,437 |
| | | | 71,497 |
| Commercial Services & Supplies - 0.9% | | | |
| HNI Corp. (c) | | 737,824 | 21,390 |
| The Brink's Co. | | 886,900 | 52,886 |
| | | | 74,276 |
| Construction & Engineering - 3.0% | | | |
| API Group Corp. (b) | | 2,596,263 | 42,812 |
| Fluor Corp. (b) | | 2,140,400 | 64,769 |
| Granite Construction, Inc. | | 1,432,600 | 48,322 |
| MDU Resources Group, Inc. | | 1,410,800 | 40,180 |
| Willscot Mobile Mini Holdings (b) | | 1,301,600 | 55,357 |
| | | | 251,440 |
| Electrical Equipment - 1.9% | | | |
| Array Technologies, Inc. (b)(c) | | 2,501,000 | 45,268 |
| GrafTech International Ltd. | | 5,637,700 | 28,696 |
| Regal Rexnord Corp. | | 460,456 | 58,266 |
| Sensata Technologies, Inc. PLC | | 652,306 | 26,229 |
| | | | 158,459 |
| Machinery - 3.4% | | | |
| Allison Transmission Holdings, Inc. | | 1,154,129 | 48,762 |
| Crane Holdings Co. | | 507,400 | 50,913 |
| Flowserve Corp. | | 1,774,809 | 50,902 |
| Kennametal, Inc. | | 1,967,997 | 52,565 |
| Oshkosh Corp. | | 381,700 | 33,590 |
| Timken Co. | | 705,636 | 50,305 |
| | | | 287,037 |
| Professional Services - 0.6% | | | |
| Manpower, Inc. | | 657,000 | 51,469 |
| Road & Rail - 2.1% | | | |
| AMERCO | | 69,100 | 39,746 |
| FTAI Infrastructure LLC | | 1,204,031 | 3,311 |
| Ryder System, Inc. | | 559,370 | 45,035 |
| TFI International, Inc. (Canada) | | 369,300 | 33,616 |
| XPO Logistics, Inc. (b) | | 1,026,000 | 53,085 |
| | | | 174,793 |
| Trading Companies & Distributors - 1.6% | | | |
| Beacon Roofing Supply, Inc. (b) | | 944,800 | 53,239 |
| Custom Truck One Source, Inc. Class A (b) | | 3,803,100 | 26,355 |
| GMS, Inc. (b) | | 336,798 | 15,897 |
| Herc Holdings, Inc. | | 348,300 | 40,964 |
| | | | 136,455 |
TOTAL INDUSTRIALS | | | 1,255,285 |
| INFORMATION TECHNOLOGY - 5.1% | | | |
| Communications Equipment - 0.4% | | | |
| Lumentum Holdings, Inc. (b) | | 448,194 | 33,368 |
| Electronic Equipment & Components - 1.2% | | | |
| Flex Ltd. (b) | | 3,529,500 | 69,108 |
| Vontier Corp. | | 1,671,808 | 31,932 |
| | | | 101,040 |
| IT Services - 2.3% | | | |
| Concentrix Corp. | | 306,600 | 37,476 |
| Cyxtera Technologies, Inc. Class A (b) | | 2,970,392 | 7,188 |
| DXC Technology Co. (b) | | 640,400 | 18,412 |
| Fidelity National Information Services, Inc. | | 557,600 | 46,275 |
| SS&C Technologies Holdings, Inc. | | 955,100 | 49,111 |
| Unisys Corp. (b)(d) | | 3,400,472 | 28,904 |
| | | | 187,366 |
| Semiconductors & Semiconductor Equipment - 0.1% | | | |
| Micron Technology, Inc. | | 167,700 | 9,073 |
| Software - 1.1% | | | |
| NCR Corp. (b) | | 2,235,500 | 47,527 |
| NortonLifeLock, Inc. | | 2,028,200 | 45,695 |
| | | | 93,222 |
TOTAL INFORMATION TECHNOLOGY | | | 424,069 |
| MATERIALS - 12.4% | | | |
| Chemicals - 5.4% | | | |
| Axalta Coating Systems Ltd. (b)(c) | | 1,904,337 | 44,409 |
| Cabot Corp. | | 535,600 | 39,356 |
| Celanese Corp. Class A | | 493,911 | 47,475 |
| Corteva, Inc. | | 592,223 | 38,696 |
| Eastman Chemical Co. | | 522,900 | 40,164 |
| Huntsman Corp. | | 528,080 | 14,131 |
| Methanex Corp. (c) | | 1,429,200 | 49,865 |
| Olin Corp. | | 901,300 | 47,724 |
| The Chemours Co. LLC | | 1,401,345 | 40,121 |
| Trinseo PLC | | 374,726 | 7,052 |
| Tronox Holdings PLC | | 2,351,374 | 28,216 |
| Westlake Corp. (c) | | 570,700 | 55,158 |
| | | | 452,367 |
| Construction Materials - 1.4% | | | |
| Eagle Materials, Inc. | | 283,800 | 34,712 |
| GCC S.A.B. de CV | | 3,358,400 | 20,852 |
| Martin Marietta Materials, Inc. | | 69,749 | 23,434 |
| Summit Materials, Inc. (b) | | 1,508,484 | 39,749 |
| | | | 118,747 |
| Containers & Packaging - 1.5% | | | |
| Berry Global Group, Inc. (b) | | 1,003,167 | 47,470 |
| Crown Holdings, Inc. | | 531,600 | 36,462 |
| O-I Glass, Inc. (b) | | 2,602,884 | 42,453 |
| | | | 126,385 |
| Metals & Mining - 3.6% | | | |
| Alcoa Corp. | | 704,500 | 27,497 |
| ArcelorMittal SA Class A unit GDR | | 1,324,984 | 29,746 |
| Arconic Corp. (b) | | 2,699,824 | 56,048 |
| ATI, Inc. (b)(c) | | 1,045,800 | 31,123 |
| Carpenter Technology Corp. | | 602,200 | 22,522 |
| Constellium NV (b) | | 4,162,914 | 45,875 |
| First Quantum Minerals Ltd. | | 949,107 | 16,741 |
| Freeport-McMoRan, Inc. | | 1,209,600 | 38,332 |
| Steel Dynamics, Inc. | | 285,711 | 26,871 |
| | | | 294,755 |
| Paper & Forest Products - 0.5% | | | |
| Louisiana-Pacific Corp. | | 742,120 | 42,041 |
TOTAL MATERIALS | | | 1,034,295 |
| REAL ESTATE - 5.4% | | | |
| Equity Real Estate Investment Trusts (REITs) - 3.7% | | | |
| CubeSmart | | 2,133,637 | 89,335 |
| Equinix, Inc. | | 43,700 | 24,753 |
| Equity Lifestyle Properties, Inc. | | 486,022 | 31,086 |
| Lamar Advertising Co. Class A | | 135,500 | 12,497 |
| Outfront Media, Inc. | | 517,300 | 9,337 |
| Prologis (REIT), Inc. | | 547,902 | 60,680 |
| Ventas, Inc. | | 655,586 | 25,653 |
| Welltower Op | | 913,600 | 55,766 |
| | | | 309,107 |
| Real Estate Management & Development - 1.7% | | | |
| Anywhere Real Estate, Inc. (b) | | 3,739,895 | 27,787 |
| Cushman & Wakefield PLC (b) | | 4,076,666 | 47,085 |
| Jones Lang LaSalle, Inc. (b) | | 302,300 | 48,093 |
| WeWork, Inc. (b)(c) | | 6,491,247 | 16,683 |
| | | | 139,648 |
TOTAL REAL ESTATE | | | 448,755 |
| UTILITIES - 6.4% | | | |
| Electric Utilities - 4.3% | | | |
| Constellation Energy Corp. | | 685,469 | 64,804 |
| Edison International | | 1,859,784 | 111,661 |
| Entergy Corp. | | 750,300 | 80,387 |
| PG&E Corp. (b) | | 6,703,300 | 100,080 |
| | | | 356,932 |
| Independent Power and Renewable Electricity Producers - 1.5% | | | |
| The AES Corp. | | 3,595,700 | 94,064 |
| Vistra Corp. | | 1,554,500 | 35,707 |
| | | | 129,771 |
| Multi-Utilities - 0.6% | | | |
| Sempra Energy | | 332,300 | 50,157 |
TOTAL UTILITIES | | | 536,860 |
| TOTAL COMMON STOCKS (Cost $7,271,565) | | | 8,301,581 |
| | | | |
| U.S. Treasury Obligations - 0.1% |
| | | Principal Amount (e) (000s) | Value ($) (000s) |
U.S. Treasury Bills, yield at date of purchase 2.59% to 2.88% 11/17/22 to 12/1/22 (Cost $2,764) | | 2,770 | 2,763 |
| | | | |
| Money Market Funds - 2.5% |
| | | Shares | Value ($) (000s) |
| Fidelity Cash Central Fund 3.10% (f) | | 16,301,497 | 16,305 |
| Fidelity Securities Lending Cash Central Fund 3.10% (f)(g) | | 192,967,688 | 192,987 |
| TOTAL MONEY MARKET FUNDS (Cost $209,291) | | | 209,292 |
| | | | |
| TOTAL INVESTMENT IN SECURITIES - 102.0% (Cost $7,483,620) | 8,513,636 |
NET OTHER ASSETS (LIABILITIES) - (2.0)% | (164,386) |
| NET ASSETS - 100.0% | 8,349,250 |
| | |
Any values shown as $0 in the Schedule of Investments may reflect amounts less than $500.
Legend
| (a) | Security exempt from registration under Rule 144A of the Securities Act of 1933. These securities may be resold in transactions exempt from registration, normally to qualified institutional buyers. At the end of the period, the value of these securities amounted to $47,656,000 or 0.6% of net assets. |
| (c) | Security or a portion of the security is on loan at period end. |
| (e) | Amount is stated in United States dollars unless otherwise noted. |
| (f) | Affiliated fund that is generally available only to investment companies and other accounts managed by Fidelity Investments. The rate quoted is the annualized seven-day yield of the fund at period end. A complete unaudited listing of the fund's holdings as of its most recent quarter end is available upon request. In addition, each Fidelity Central Fund's financial statements, which are not covered by the Fund's Report of Independent Registered Public Accounting Firm, are available on the SEC's website or upon request. |
| (g) | Investment made with cash collateral received from securities on loan. |
Affiliated Central Funds
Fiscal year to date information regarding the Fund's investments in Fidelity Central Funds, including the ownership percentage, is presented below.
| Affiliate (Amounts in thousands) | Value, beginning of period ($) | Purchases ($) | Sales Proceeds ($) | Dividend Income ($) | Realized Gain (loss) ($) | Change in Unrealized appreciation (depreciation) ($) | Value, end of period ($) | % ownership, end of period |
| Fidelity Cash Central Fund 3.10% | 44,445 | 2,806,407 | 2,834,547 | 768 | - | - | 16,305 | 0.0% |
| Fidelity Securities Lending Cash Central Fund 3.10% | 192,078 | 1,571,899 | 1,570,990 | 1,887 | - | - | 192,987 | 0.5% |
| Total | 236,523 | 4,378,306 | 4,405,537 | 2,655 | - | - | 209,292 | |
| | | | | | | | | |
Amounts in the income column in the above table include any capital gain distributions from underlying funds, which are presented in the corresponding line item in the Statement of Operations, if applicable.
Amount for Fidelity Securities Lending Cash Central Fund represents the income earned on investing cash collateral, less rebates paid to borrowers and any lending agent fees associated with the loan, plus any premium payments received for lending certain types of securities.
Other Affiliated Issuers
An affiliated company is a company in which the Fund has ownership of at least 5% of the voting securities. Fiscal year to date transactions with companies which are or were affiliates are as follows:
| Affiliate (Amounts in thousands) | Value, beginning of period ($) | Purchases ($) | Sales Proceeds ($) | Dividend Income ($) | Realized Gain (loss) ($) | Change in Unrealized appreciation (depreciation) ($) | Value, end of period ($) |
| AdaptHealth Corp. | - | 72,900 | 35,192 | - | 785 | 16,660 | 55,153 |
| Unisys Corp. | 76,788 | 7,423 | - | - | - | (55,307) | 28,904 |
| Total | 76,788 | 80,323 | 35,192 | - | 785 | (38,647) | 84,057 |
Purchase and Sales proceeds in the table above include the value of securities received or delivered through in-kind transactions, if applicable.
Investment Valuation
The following is a summary of the inputs used, as of October 31, 2022, involving the Fund's assets and liabilities carried at fair value. The inputs or methodology used for valuing securities may not be an indication of the risk associated with investing in those securities. For more information on valuation inputs, and their aggregation into the levels used below, please refer to the Investment Valuation section in the accompanying Notes to Financial Statements.
| Valuation Inputs at Reporting Date: |
Description (Amounts in thousands) | Total ($) | Level 1 ($) | Level 2 ($) | Level 3 ($) |
Investments in Securities: | | | | |
|
| Equities: | | | | |
Communication Services | 237,123 | 207,600 | 29,523 | - |
Consumer Discretionary | 1,287,703 | 1,287,703 | - | - |
Consumer Staples | 212,213 | 212,213 | - | - |
Energy | 1,138,297 | 1,088,733 | 49,564 | - |
Financials | 1,169,236 | 1,169,236 | - | - |
Health Care | 557,745 | 557,745 | - | - |
Industrials | 1,255,285 | 1,250,721 | 4,564 | - |
Information Technology | 424,069 | 424,069 | - | - |
Materials | 1,034,295 | 1,034,295 | - | - |
Real Estate | 448,755 | 448,755 | - | - |
Utilities | 536,860 | 536,860 | - | - |
|
| U.S. Government and Government Agency Obligations | 2,763 | - | 2,763 | - |
|
| Money Market Funds | 209,292 | 209,292 | - | - |
| Total Investments in Securities: | 8,513,636 | 8,427,222 | 86,414 | - |
| Statement of Assets and Liabilities |
| Amounts in thousands (except per-share amounts) | | | | October 31, 2022 |
| | | | | |
| Assets | | | | |
| Investment in securities, at value (including securities loaned of $186,611) - See accompanying schedule: | | | | |
Unaffiliated issuers (cost $7,183,112) | | $8,220,287 | | |
Fidelity Central Funds (cost $209,291) | | 209,292 | | |
Other affiliated issuers (cost $91,217) | | 84,057 | | |
| | | | | |
| Total Investment in Securities (cost $7,483,620) | | | $ | 8,513,636 |
| Cash | | | | 898 |
| Foreign currency held at value (cost $2,826) | | | | 2,830 |
| Receivable for investments sold | | | | 59,253 |
| Receivable for fund shares sold | | | | 3,240 |
| Dividends receivable | | | | 3,898 |
| Distributions receivable from Fidelity Central Funds | | | | 281 |
| Prepaid expenses | | | | 13 |
| Other receivables | | | | 470 |
Total assets | | | | 8,584,519 |
| Liabilities | | | | |
| Payable for investments purchased | | $31,202 | | |
| Payable for fund shares redeemed | | 4,951 | | |
| Accrued management fee | | 4,777 | | |
| Payable for daily variation margin on futures contracts | | 19 | | |
| Other affiliated payables | | 903 | | |
| Other payables and accrued expenses | | 448 | | |
| Collateral on securities loaned | | 192,969 | | |
| Total Liabilities | | | | 235,269 |
| Net Assets | | | $ | 8,349,250 |
| Net Assets consist of: | | | | |
| Paid in capital | | | $ | 6,860,975 |
| Total accumulated earnings (loss) | | | | 1,488,275 |
| Net Assets | | | $ | 8,349,250 |
| | | | | |
| Net Asset Value and Maximum Offering Price | | | | |
| Value : | | | | |
Net Asset Value , offering price and redemption price per share ($7,189,566 ÷ 541,614 shares) | | | $ | 13.27 |
| Class K : | | | | |
Net Asset Value , offering price and redemption price per share ($1,159,684 ÷ 87,197 shares) | | | $ | 13.30 |
| Statement of Operations |
| Amounts in thousands | | | | Year ended October 31, 2022 |
| Investment Income | | | | |
| Dividends | | | $ | 180,541 |
| Interest | | | | 46 |
| Income from Fidelity Central Funds (including $1,887 from security lending) | | | | 2,655 |
| Total Income | | | | 183,242 |
| Expenses | | | | |
| Management fee | | | | |
| Basic fee | $ | 47,931 | | |
| Performance adjustment | | 14,713 | | |
| Transfer agent fees | | 10,452 | | |
| Accounting fees | | 1,199 | | |
| Custodian fees and expenses | | 69 | | |
| Independent trustees' fees and expenses | | 31 | | |
| Registration fees | | 172 | | |
| Audit | | 64 | | |
| Legal | | 16 | | |
| Interest | | 40 | | |
| Miscellaneous | | 40 | | |
| Total expenses before reductions | | 74,727 | | |
| Expense reductions | | (295) | | |
| Total expenses after reductions | | | | 74,432 |
| Net Investment income (loss) | | | | 108,810 |
| Realized and Unrealized Gain (Loss) | | | | |
| Net realized gain (loss) on: | | | | |
| Investment Securities: | | | | |
| Unaffiliated issuers | | 560,422 | | |
| Affiliated issuers | | 785 | | |
| Foreign currency transactions | | (80) | | |
| Futures contracts | | (21,896) | | |
| Total net realized gain (loss) | | | | 539,231 |
| Change in net unrealized appreciation (depreciation) on: | | | | |
| Investment Securities: | | | | |
| Unaffiliated issuers | | (1,264,121) | | |
| Affiliated issuers | | (38,647) | | |
| Assets and liabilities in foreign currencies | | (82) | | |
| Futures contracts | | (423) | | |
| Total change in net unrealized appreciation (depreciation) | | | | (1,303,273) |
| Net gain (loss) | | | | (764,042) |
| Net increase (decrease) in net assets resulting from operations | | | $ | (655,232) |
| Statement of Changes in Net Assets |
| |
| Amount in thousands | | Year ended October 31, 2022 | | Year ended October 31, 2021 |
| Increase (Decrease) in Net Assets | | | | |
| Operations | | | | |
| Net investment income (loss) | $ | 108,810 | $ | 68,102 |
| Net realized gain (loss) | | 539,231 | | 1,487,674 |
| Change in net unrealized appreciation (depreciation) | | (1,303,273) | | 1,892,801 |
| Net increase (decrease) in net assets resulting from operations | | (655,232) | | 3,448,577 |
| Distributions to shareholders | | (871,432) | | (64,718) |
| Share transactions - net increase (decrease) | | 346,721 | | 892,433 |
| Total increase (decrease) in net assets | | (1,179,943) | | 4,276,292 |
| | | | | |
| Net Assets | | | | |
| Beginning of period | | 9,529,193 | | 5,252,901 |
| End of period | $ | 8,349,250 | $ | 9,529,193 |
| | | | | |
| | | | | |
Financial Highlights
| Years ended October 31, | | 2022 | | 2021 | | 2020 | | 2019 | | 2018 A |
Selected Per-Share Data | | | | | | | | | | |
| Net asset value, beginning of period | $ | 15.72 | $ | 9.57 | $ | 10.59 | $ | 11.15 | $ | 12.19 |
| Income from Investment Operations | | | | | | | | | | |
Net investment income (loss) B,C | | .17 | | .12 | | .12 | | .14 | | .15 |
| Net realized and unrealized gain (loss) | | (1.18) | | 6.15 | | (.77) | | .71 | | (.62) |
| Total from investment operations | | (1.01) | | 6.27 | | (.65) | | .85 | | (.47) |
| Distributions from net investment income | | (.20) | | (.12) | | (.14) D | | (.12) | | (.17) |
| Distributions from net realized gain | | (1.24) | | - | | (.23) D | | (1.29) | | (.41) |
| Total distributions | | (1.44) | | (.12) | | (.37) | | (1.41) | | (.57) E |
| Net asset value, end of period | $ | 13.27 | $ | 15.72 | $ | 9.57 | $ | 10.59 | $ | 11.15 |
Total Return F | | (6.80)% | | 65.91% | | (6.52)% | | 9.31% | | (4.14)% |
Ratios to Average Net Assets B,G,H | | | | | | | | | | |
| Expenses before reductions | | .83% | | .79% | | .57% | | .58% | | .58% |
| Expenses net of fee waivers, if any | | .83% | | .79% | | .57% | | .58% | | .58% |
| Expenses net of all reductions | | .83% | | .79% | | .55% | | .58% | | .56% |
| Net investment income (loss) | | 1.18% | | .82% | | 1.30% | | 1.38% | | 1.25% |
| Supplemental Data | | | | | | | | | | |
| Net assets, end of period (in millions) | $ | 7,190 | $ | 8,361 | $ | 4,760 | $ | 6,112 | $ | 6,181 |
Portfolio turnover rate I | | 74% | | 77% | | 90% | | 75% | | 100% |
A Per share amounts have been adjusted to reflect the impact of the 10 for 1 share split that occurred on May 11, 2018.
B Net investment income (loss) is affected by the timing of the declaration of dividends by any underlying mutual funds or exchange-traded funds (ETFs). Net investment income (loss) of any mutual funds or ETFs is not included in the Fund's net investment income (loss) ratio.
C Calculated based on average shares outstanding during the period.
D The amount shown reflects reclassifications related to book to tax differences that were made in the year shown.
E Total distributions per share do not sum due to rounding.
F Total returns would have been lower if certain expenses had not been reduced during the applicable periods shown.
G Expense ratios reflect operating expenses of the class. Expenses before reductions do not reflect amounts reimbursed, waived, or reduced through arrangements with the investment adviser, brokerage services, or other offset arrangements, if applicable, and do not represent the amount paid by the class during periods when reimbursements, waivers or reductions occur.
H Fees and expenses of any underlying mutual funds or exchange-traded funds (ETFs) are not included in the Fund's expense ratio. The Fund indirectly bears its proportionate share of these expenses. For additional expense information related to investments in Fidelity Central Funds, please refer to the "Investments in Fidelity Central Funds" note found in the Notes to Financial Statements section of the most recent Annual or Semi-Annual report.
I Amount does not include the portfolio activity of any underlying mutual funds or exchange-traded funds (ETFs).
| Fidelity® Value Fund Class K |
| |
| Years ended October 31, | | 2022 | | 2021 | | 2020 | | 2019 | | 2018 A |
Selected Per-Share Data | | | | | | | | | | |
| Net asset value, beginning of period | $ | 15.74 | $ | 9.59 | $ | 10.60 | $ | 11.16 | $ | 12.21 |
| Income from Investment Operations | | | | | | | | | | |
Net investment income (loss) B,C | | .18 | | .13 | | .13 | | .15 | | .16 |
| Net realized and unrealized gain (loss) | | (1.17) | | 6.15 | | (.76) | | .72 | | (.62) |
| Total from investment operations | | (.99) | | 6.28 | | (.63) | | .87 | | (.46) |
| Distributions from net investment income | | (.21) | | (.13) | | (.15) D | | (.13) | | (.18) |
| Distributions from net realized gain | | (1.24) | | - | | (.23) D | | (1.29) | | (.41) |
| Total distributions | | (1.45) | | (.13) | | (.38) | | (1.43) E | | (.59) |
| Net asset value, end of period | $ | 13.30 | $ | 15.74 | $ | 9.59 | $ | 10.60 | $ | 11.16 |
Total Return F | | (6.63)% | | 65.90% | | (6.33)% | | 9.43% | | (4.11)% |
Ratios to Average Net Assets C,G,H | | | | | | | | | | |
| Expenses before reductions | | .75% | | .71% | | .47% | | .49% | | .48% |
| Expenses net of fee waivers, if any | | .74% | | .71% | | .47% | | .49% | | .48% |
| Expenses net of all reductions | | .74% | | .71% | | .45% | | .48% | | .46% |
| Net investment income (loss) | | 1.27% | | .91% | | 1.40% | | 1.48% | | 1.34% |
| Supplemental Data | | | | | | | | | | |
| Net assets, end of period (in millions) | $ | 1,160 | $ | 1,168 | $ | 493 | $ | 740 | $ | 844 |
Portfolio turnover rate I | | 74% | | 77% | | 90% | | 75% | | 100% |
A Per share amounts have been adjusted to reflect the impact of the 10 for 1 share split that occurred on May 11, 2018.
B Calculated based on average shares outstanding during the period.
C Net investment income (loss) is affected by the timing of the declaration of dividends by any underlying mutual funds or exchange-traded funds (ETFs). Net investment income (loss) of any mutual funds or ETFs is not included in the Fund's net investment income (loss) ratio.
D The amount shown reflects reclassifications related to book to tax differences that were made in the year shown.
E Total distributions per share do not sum due to rounding.
F Total returns would have been lower if certain expenses had not been reduced during the applicable periods shown.
G Fees and expenses of any underlying mutual funds or exchange-traded funds (ETFs) are not included in the Fund's expense ratio. The Fund indirectly bears its proportionate share of these expenses. For additional expense information related to investments in Fidelity Central Funds, please refer to the "Investments in Fidelity Central Funds" note found in the Notes to Financial Statements section of the most recent Annual or Semi-Annual report.
H Expense ratios reflect operating expenses of the class. Expenses before reductions do not reflect amounts reimbursed, waived, or reduced through arrangements with the investment adviser, brokerage services, or other offset arrangements, if applicable, and do not represent the amount paid by the class during periods when reimbursements, waivers or reductions occur.
I Amount does not include the portfolio activity of any underlying mutual funds or exchange-traded funds (ETFs).
For the period ended October 31, 2022
( Amounts in thousands except percentages)
1. Organization.
Fidelity Value Fund (the Fund) is a fund of Fidelity Capital Trust (the Trust) and is authorized to issue an unlimited number of shares. The Trust is registered under the Investment Company Act of 1940, as amended (the 1940 Act), as an open-end management investment company organized as a Massachusetts business trust. The Fund offers Value and Class K shares, each of which has equal rights as to assets and voting privileges. Each class has exclusive voting rights with respect to matters that affect that class.
2. Investments in Fidelity Central Funds.
Funds may invest in Fidelity Central Funds, which are open-end investment companies generally available only to other investment companies and accounts managed by the investment adviser and its affiliates. The Schedule of Investments lists any Fidelity Central Funds held as an investment as of period end, but does not include the underlying holdings of each Fidelity Central Fund. An investing fund indirectly bears its proportionate share of the expenses of the underlying Fidelity Central Funds.
Based on its investment objective, each Fidelity Central Fund may invest or participate in various investment vehicles or strategies that are similar to those of the investing fund. These strategies are consistent with the investment objectives of the investing fund and may involve certain economic risks which may cause a decline in value of each of the Fidelity Central Funds and thus a decline in the value of the investing fund.
| Fidelity Central Fund | Investment Manager | Investment Objective | Investment Practices | Expense Ratio A |
| Fidelity Money Market Central Funds | Fidelity Management & Research Company LLC (FMR) | Each fund seeks to obtain a high level of current income consistent with the preservation of capital and liquidity. | Short-term Investments | Less than .005% |
A Expenses expressed as a percentage of average net assets and are as of each underlying Central Fund's most recent annual or semi-annual shareholder report.
A complete unaudited list of holdings for each Fidelity Central Fund is available upon request or at the Securities and Exchange Commission website at www.sec.gov. In addition, the financial statements of the Fidelity Central Funds which contain the significant accounting policies (including investment valuation policies) of those funds, and are not covered by the Report of Independent Registered Public Accounting Firm, are available on the Securities and Exchange Commission website or upon request.
3. Significant Accounting Policies.
The Fund is an investment company and applies the accounting and reporting guidance of the Financial Accounting Standards Board (FASB) Accounting Standards Codification Topic 946 Financial Services - Investment Companies . The financial statements have been prepared in conformity with accounting principles generally accepted in the United States of America (GAAP), which require management to make certain estimates and assumptions at the date of the financial statements. Actual results could differ from those estimates. Subsequent events, if any, through the date that the financial statements were issued have been evaluated in the preparation of the financial statements. The Fund's Schedule of Investments lists any underlying mutual funds or exchange-traded funds (ETFs) but does not include the underlying holdings of these funds. The following summarizes the significant accounting policies of the Fund:
Investment Valuation. Investments are valued as of 4:00 p.m. Eastern time on the last calendar day of the period. The Board of Trustees (the Board) has designated the Fund's investment adviser as the valuation designee responsible for the fair valuation function and performing fair value determinations as needed. The investment adviser has established a Fair Value Committee (the Committee) to carry out the day-to-day fair valuation responsibilities and has adopted policies and procedures to govern the fair valuation process and the activities of the Committee. In accordance with these fair valuation policies and procedures, which have been approved by the Board, the Fund attempts to obtain prices from one or more third party pricing services or brokers to value its investments. When current market prices, quotations or currency exchange rates are not readily available or reliable, investments will be fair valued in good faith by the Committee, in accordance with the policies and procedures. Factors used in determining fair value vary by investment type and may include market or investment specific events, transaction data, estimated cash flows, and market observations of comparable investments. The frequency that the fair valuation procedures are used cannot be predicted and they may be utilized to a significant extent. The Committee manages the Fund's fair valuation practices and maintains the fair valuation policies and procedures. The Fund's investment adviser reports to the Board information regarding the fair valuation process and related material matters.
The Fund categorizes the inputs to valuation techniques used to value its investments into a disclosure hierarchy consisting of three levels as shown below:
Level 1 - unadjusted quoted prices in active markets for identical investments
Level 2 - other significant observable inputs (including quoted prices for similar investments, interest rates, prepayment speeds, etc.)
Level 3 - unobservable inputs (including the Fund's own assumptions based on the best information available)
Valuation techniques used to value the Fund's investments by major category are as follows:
Equity securities, including restricted securities, for which market quotations are readily available, are valued at the last reported sale price or official closing price as reported by a third party pricing service on the primary market or exchange on which they are traded and are categorized as Level 1 in the hierarchy. In the event there were no sales during the day or closing prices are not available, securities are valued at the last quoted bid price or may be valued using the last available price and are generally categorized as Level 2 in the hierarchy. For foreign equity securities, when market or security specific events arise, comparisons to the valuation of American Depositary Receipts (ADRs), futures contracts, ETFs and certain indexes as well as quoted prices for similar securities may be used and would be categorized as Level 2 in the hierarchy. For equity securities, including restricted securities, where observable inputs are limited, assumptions about market activity and risk are used and these securities may be categorized as Level 3 in the hierarchy.
Debt securities, including restricted securities, are valued based on evaluated prices received from third party pricing services or from brokers who make markets in such securities. U.S. government and government agency obligations are valued by pricing services who utilize matrix pricing which considers yield or price of bonds of comparable quality, coupon, maturity and type or by broker-supplied prices. When independent prices are unavailable or unreliable, debt securities may be valued utilizing pricing methodologies which consider similar factors that would be used by third party pricing services. Debt securities are generally categorized as Level 2 in the hierarchy but may be Level 3 depending on the circumstances.
Futures contracts are valued at the settlement price established each day by the board of trade or exchange on which they are traded and are categorized as Level 1 in the hierarchy. Investments in open-end mutual funds, including the Fidelity Central Funds, are valued at their closing net asset value (NAV) each business day and are categorized as Level 1 in the hierarchy.
Changes in valuation techniques may result in transfers in or out of an assigned level within the disclosure hierarchy. The aggregate value of investments by input level as of October 31, 2022 is included at the end of the Fund's Schedule of Investments.
Foreign Currency. Certain Funds may use foreign currency contracts to facilitate transactions in foreign-denominated securities. Gains and losses from these transactions may arise from changes in the value of the foreign currency or if the counterparties do not perform under the contracts' terms.
Foreign-denominated assets, including investment securities, and liabilities are translated into U.S. dollars at the exchange rates at period end. Purchases and sales of investment securities, income and dividends received, and expenses denominated in foreign currencies are translated into U.S. dollars at the exchange rate in effect on the transaction date.
The effects of exchange rate fluctuations on investments are included with the net realized and unrealized gain (loss) on investment securities. Other foreign currency transactions resulting in realized and unrealized gain (loss) are disclosed separately.
Investment Transactions and Income. For financial reporting purposes, the Fund's investment holdings and NAV include trades executed through the end of the last business day of the period. The NAV per share for processing shareholder transactions is calculated as of the close of business of the New York Stock Exchange (NYSE), normally 4:00 p.m. Eastern time and includes trades executed through the end of the prior business day. Gains and losses on securities sold are determined on the basis of identified cost and include proceeds received from litigation. Commissions paid to certain brokers with whom the investment adviser, or its affiliates, places trades on behalf of a fund include an amount in addition to trade execution, which may be rebated back to a fund. Any such rebates are included in net realized gain (loss) on investments in the Statement of Operations. Dividend income is recorded on the ex-dividend date, except for certain dividends from foreign securities where the ex-dividend date may have passed, which are recorded as soon as the Fund is informed of the ex-dividend date. Non-cash dividends included in dividend income, if any, are recorded at the fair market value of the securities received. Income and capital gain distributions from Fidelity Central Funds, if any, are recorded on the ex-dividend date. Certain distributions received by the Fund represent a return of capital or capital gain. The Fund determines the components of these distributions subsequent to the ex-dividend date, based upon receipt of tax filings or other correspondence relating to the underlying investment. These distributions are recorded as a reduction of cost of investments and/or as a realized gain. Interest income is accrued as earned and includes coupon interest and amortization of premium and accretion of discount on debt securities as applicable. Investment income is recorded net of foreign taxes withheld where recovery of such taxes is uncertain. Funds may file withholding tax reclaims in certain jurisdictions to recover a portion of amounts previously withheld. Any withholding tax reclaims income is included in the Statement of Operations in dividends. Any receivables for withholding tax reclaims are included in the Statement of Assets and Liabilities in dividends receivable.
Class Allocations and Expenses. Investment income, realized and unrealized capital gains and losses, common expenses of a fund, and certain fund-level expense reductions, if any, are allocated daily on a pro-rata basis to each class based on the relative net assets of each class to the total net assets of a fund. Each class differs with respect to transfer agent and distribution and service plan fees incurred, as applicable. Certain expense reductions may also differ by class, if applicable. For the reporting period, the allocated portion of income and expenses to each class as a percent of its average net assets may vary due to the timing of recording these transactions in relation to fluctuating net assets of the classes. Expenses directly attributable to a fund are charged to that fund. Expenses attributable to more than one fund are allocated among the respective funds on the basis of relative net assets or other appropriate methods. Expenses included in the accompanying financial statements reflect the expenses of that fund and do not include any expenses associated with any underlying mutual funds or exchange-traded funds. Although not included in a fund's expenses, a fund indirectly bears its proportionate share of these expenses through the net asset value of each underlying mutual fund or exchange-traded fund. Expense estimates are accrued in the period to which they relate and adjustments are made when actual amounts are known.
Deferred Trustee Compensation. Under a Deferred Compensation Plan (the Plan) for certain Funds, certain independent Trustees have elected to defer receipt of a portion of their annual compensation. Deferred amounts are invested in affiliated mutual funds, are marked-to-market and remain in a fund until distributed in accordance with the Plan. The investment of deferred amounts and the offsetting payable to the Trustees presented below are included in the accompanying Statement of Assets and Liabilities in other receivables and other payables and accrued expenses, as applicable.
Income Tax Information and Distributions to Shareholders. Each year, the Fund intends to qualify as a regulated investment company under Subchapter M of the Internal Revenue Code, including distributing substantially all of its taxable income and realized gains. As a result, no provision for U.S. Federal income taxes is required. As of October 31, 2022, the Fund did not have any unrecognized tax benefits in the financial statements; nor is the Fund aware of any tax positions for which it is reasonably possible that the total amounts of unrecognized tax benefits will significantly change in the next twelve months. The Fund files a U.S. federal tax return, in addition to state and local tax returns as required. The Fund's federal income tax returns are subject to examination by the Internal Revenue Service (IRS) for a period of three fiscal years after they are filed. State and local tax returns may be subject to examination for an additional fiscal year depending on the jurisdiction. Foreign taxes are provided for based on the Fund's understanding of the tax rules and rates that exist in the foreign markets in which it invests.
Distributions are declared and recorded on the ex-dividend date. Income and capital gain distributions are declared separately for each class. Income and capital gain distributions are determined in accordance with income tax regulations, which may differ from GAAP. In addition, the Fund claimed a portion of the payment made to redeeming shareholders as a distribution for income tax purposes.
Capital accounts within the financial statements are adjusted for permanent book-tax differences. These adjustments have no impact on net assets or the results of operations. Capital accounts are not adjusted for temporary book-tax differences which will reverse in a subsequent period.
Book-tax differences are primarily due to foreign currency transactions, passive foreign investment companies (PFIC), futures transactions, partnerships and losses deferred due to wash sales.
As of period end, the cost and unrealized appreciation (depreciation) in securities, and derivatives if applicable, for federal income tax purposes were as follows:
| Gross unrealized appreciation | $1,750,047 |
| Gross unrealized depreciation | (786,556) |
| Net unrealized appreciation (depreciation) | $ 963,491 |
| Tax Cost | $7,550,145 |
The tax-based components of distributable earnings as of period end were as follows:
| Undistributed ordinary income | $30,144 |
| Undistributed long-term capital gain | $494,720 |
| Net unrealized appreciation (depreciation) on securities and other investments | $963,412 |
The tax character of distributions paid was as follows:
| | October 31, 2022 | October 31, 2021 |
| Ordinary Income | $358,482 | $64,718 |
| Long-term Capital Gains | 512,950 | - |
| Total | $871,432 | $64,718 |
Restricted Securities (including Private Placements). Funds may invest in securities that are subject to legal or contractual restrictions on resale. These securities generally may be resold in transactions exempt from registration or to the public if the securities are registered. Disposal of these securities may involve time-consuming negotiations and expense, and prompt sale at an acceptable price may be difficult. Information regarding restricted securities held at period end is included at the end of the Schedule of Investments, if applicable.
4. Derivative Instruments.
Risk Exposures and the Use of Derivative Instruments. The Fund's investment objectives allow for various types of derivative instruments, including futures contracts. Derivatives are investments whose value is primarily derived from underlying assets, indices or reference rates and may be transacted on an exchange or over-the-counter (OTC). Derivatives may involve a future commitment to buy or sell a specified asset based on specified terms, to exchange future cash flows at periodic intervals based on a notional principal amount, or for one party to make one or more payments upon the occurrence of specified events in exchange for periodic payments from the other party.
Derivatives were used to increase returns and to manage exposure to certain risks as defined below. The success of any strategy involving derivatives depends on analysis of numerous economic factors, and if the strategies for investment do not work as intended, the objectives may not be achieved.
Derivatives were used to increase or decrease exposure to the following risk(s):
| | |
| Equity Risk | Equity risk relates to the fluctuations in the value of financial instruments as a result of changes in market prices (other than those arising from interest rate risk or foreign exchange risk), whether caused by factors specific to an individual investment, its issuer, or all factors affecting all instruments traded in a market or market segment. |
Funds are also exposed to additional risks from investing in derivatives, such as liquidity risk and counterparty credit risk. Liquidity risk is the risk that a fund will be unable to close out the derivative in the open market in a timely manner. Counterparty credit risk is the risk that the counterparty will not be able to fulfill its obligation to a fund. Counterparty credit risk related to exchange-traded contracts may be mitigated by the protection provided by the exchange on which they trade.
Investing in derivatives may involve greater risks than investing in the underlying assets directly and, to varying degrees, may involve risk of loss in excess of any initial investment and collateral received and amounts recognized in the Statement of Assets and Liabilities. In addition, there may be the risk that the change in value of the derivative contract does not correspond to the change in value of the underlying instrument.
Futures Contracts. A futures contract is an agreement between two parties to buy or sell a specified underlying instrument for a fixed price at a specified future date. Futures contracts were used to manage exposure to the stock market.
Upon entering into a futures contract, a fund is required to deposit either cash or securities (initial margin) with a clearing broker in an amount equal to a certain percentage of the face value of the contract. Futures contracts are marked-to-market daily and subsequent daily payments are made or received by a fund depending on the daily fluctuations in the value of the futures contracts and are recorded as unrealized appreciation or (depreciation). This receivable and/or payable, if any, is included in daily variation margin on futures contracts in the Statement of Assets and Liabilities. Realized gain or (loss) is recorded upon the expiration or closing of a futures contract. The net realized gain (loss) and change in net unrealized appreciation (depreciation) on futures contracts during the period is presented in the Statement of Operations.
Any open futures contracts at period end are presented in the Schedule of Investments under the caption "Futures Contracts". The notional amount at value reflects each contract's exposure to the underlying instrument or index at period end, and is representative of volume of activity during the period unless an average notional amount is presented. Any securities deposited to meet initial margin requirements are identified in the Schedule of Investments. Any cash deposited to meet initial margin requirements is presented as segregated cash with brokers for derivative instruments in the Statement of Assets and Liabilities.
5. Purchases and Sales of Investments.
Purchases and sales of securities, other than short-term securities, U.S. government securities and in-kind transactions, as applicable, are noted in the table below.
| | Purchases ($) | Sales ($) |
| Fidelity Value Fund | 6,628,180 | 7,019,386 |
6. Fees and Other Transactions with Affiliates.
Management Fee. Fidelity Management & Research Company LLC (the investment adviser) and its affiliates provide the Fund with investment management related services for which the Fund pays a monthly management fee. The management fee is the sum of an individual fund fee rate that is based on an annual rate of .30% of the Fund's average net assets and an annualized group fee rate that averaged .23% during the period. The group fee rate is based upon the monthly average net assets of a group of registered investment companies with which the investment adviser has management contracts. The group fee rate decreases as assets under management increase and increases as assets under management decrease. In addition, the management fee is subject to a performance adjustment (up to a maximum of +/- .20% of the Fund's average net assets over a 36 month performance period). The upward or downward adjustment to the management fee is based on the relative investment performance of Value as compared to its benchmark index, the Russell Midcap Value Index, over the same 36 month performance period. For the reporting period, the total annual management fee rate, including the performance adjustment, was .69% of the Fund's average net assets. The performance adjustment included in the management fee rate may be higher or lower than the maximum performance adjustment rate due to the difference between the average net assets for the reporting and performance periods.
Transfer Agent Fees. Fidelity Investments Institutional Operations Company LLC (FIIOC), an affiliate of the investment adviser, is the transfer, dividend disbursing and shareholder servicing agent for each class of the Fund. FIIOC receives account fees and asset-based fees that vary according to the account size and type of account of the shareholders of Value, except for Class K. FIIOC receives an asset-based fee of Class K's average net assets. FIIOC pays for typesetting, printing and mailing of shareholder reports, except proxy statements.
For the period, transfer agent fees for each class were as follows:
| | Amount | % of Class-Level Average Net Assets |
| Value | $9,959 | .13 |
| Class K | 493 | .04 |
| | $10,452 | |
Accounting Fees. Fidelity Service Company, Inc. (FSC), an affiliate of the investment adviser, maintains the Fund's accounting records. The accounting fee is based on the level of average net assets for each month. For the period, the fees were equivalent to the following annual rates:
| | % of Average Net Assets |
| Fidelity Value Fund | .01 |
Brokerage Commissions. A portion of portfolio transactions were placed with brokerage firms which are affiliates of the investment adviser. Brokerage commissions are included in net realized gain (loss) and change in net unrealized appreciation (depreciation) in the Statement of Operations. The commissions paid to these affiliated firms were as follows:
| | Amount |
| Fidelity Value Fund | $233 |
Interfund Lending Program. Pursuant to an Exemptive Order issued by the Securities and Exchange Commission (the SEC), the Fund, along with other registered investment companies having management contracts with Fidelity Management & Research Company LLC (FMR), or other affiliated entities of FMR, may participate in an interfund lending program. This program provides an alternative credit facility allowing the Fund to borrow from, or lend money to, other participating affiliated funds. At period end, there were no interfund loans outstanding. Activity in this program during the period for which loans were outstanding was as follows:
| | Borrower or Lender | Average Loan Balance | Weighted Average Interest Rate | Interest Expense |
| Fidelity Value Fund | Borrower | $28,618 | 1.75% | $38 |
Interfund Trades. Funds may purchase from or sell securities to other Fidelity Funds under procedures adopted by the Board. The procedures have been designed to ensure these interfund trades are executed in accordance with Rule 17a-7 of the 1940 Act. Any interfund trades are included within the respective purchases and sales amounts shown in the Purchases and Sales of Investments note. Interfund trades during the period are noted in the table below.
| | Purchases ($) | Sales ($) | Realized Gain (Loss) ($) |
| Fidelity Value Fund | 693,452 | 557,190 | 56,462 |
Other. During the period, the investment adviser reimbursed the Fund for certain losses as follows:
| | Amount ($) |
| Fidelity Value Fund | 59 |
7. Committed Line of Credit.
Certain Funds participate with other funds managed by the investment adviser or an affiliate in a $4.25 billion credit facility (the "line of credit") to be utilized for temporary or emergency purposes to fund shareholder redemptions or for other short-term liquidity purposes. The participating funds have agreed to pay commitment fees on their pro-rata portion of the line of credit, which are reflected in Miscellaneous expenses on the Statement of Operations, and are listed below. During the period, there were no borrowings on this line of credit.
| | Amount |
| Fidelity Value Fund | $16 |
8. Security Lending.
Funds lend portfolio securities from time to time in order to earn additional income. Lending agents are used, including National Financial Services (NFS), an affiliate of the investment adviser. Pursuant to a securities lending agreement, NFS will receive a fee, which is capped at 9.9% of a fund's daily lending revenue, for its services as lending agent. A fund may lend securities to certain qualified borrowers, including NFS. On the settlement date of the loan, a fund receives collateral (in the form of U.S. Treasury obligations, letters of credit and/or cash) against the loaned securities and maintains collateral in an amount not less than 100% of the market value of the loaned securities during the period of the loan. The market value of the loaned securities is determined at the close of business of a fund and any additional required collateral is delivered to a fund on the next business day. A fund or borrower may terminate the loan at any time, and if the borrower defaults on its obligation to return the securities loaned because of insolvency or other reasons, a fund may apply collateral received from the borrower against the obligation. A fund may experience delays and costs in recovering the securities loaned. Any cash collateral received is invested in the Fidelity Securities Lending Cash Central Fund. Any loaned securities are identified as such in the Schedule of Investments, and the value of loaned securities and cash collateral at period end, as applicable, are presented in the Statement of Assets and Liabilities. Security lending income represents the income earned on investing cash collateral, less rebates paid to borrowers and any lending agent fees associated with the loan, plus any premium payments received for lending certain types of securities. Security lending income is presented in the Statement of Operations as a component of income from Fidelity Central Funds. Affiliated security lending activity, if any, was as follows:
| | Total Security Lending Fees Paid to NFS | Security Lending Income From Securities Loaned to NFS | Value of Securities Loaned to NFS at Period End |
| Fidelity Value Fund | $197 | $10 | $- |
9. Bank Borrowings.
The Fund is permitted to have bank borrowings for temporary or emergency purposes to fund shareholder redemptions or for other short-term liquidity requirements. The Fund has established borrowing arrangements with certain banks. The interest rate on the borrowings is the bank's base rate, as revised from time to time. Any open loans, including accrued interest, at period end are presented under the caption "Notes payable" in the Statement of Assets and Liabilities, if applicable. Activity in this program during the period for which loans were outstanding was as follows:
| | Average Loan Balance | Weighted Average Interest Rate | Interest Expense |
| Fidelity Value Fund | $25,296 | 2.83% | $2 |
10. Expense Reductions.
During the period the investment adviser or an affiliate reimbursed and/or waived a portion of fund-level operating expenses in the amount of $295.
11. Distributions to Shareholders.
Distributions to shareholders of each class were as follows:
| | Year ended October 31, 2022 | Year ended October 31, 2021 |
| Fidelity Value Fund | | |
| Distributions to shareholders | | |
| Value | $764,386 | $58,303 |
| Class K | 107,046 | 6,415 |
Total | $871,432 | $64,718 |
12. Share Transactions.
Share transactions for each class were as follows and may contain in-kind transactions, automatic conversions between classes or exchanges between affiliated funds:
| | Shares | Shares | Dollars | Dollars |
| | Year ended October 31, 2022 | Year ended October 31, 2021 | Year ended October 31, 2022 | Year ended October 31, 2021 |
| Fidelity Value Fund | | | | |
| Value | | | | |
| Shares sold | 66,565 | 108,639 | $955,112 | $1,570,378 |
| Reinvestment of distributions | 50,898 | 4,594 | 704,841 | 54,026 |
| Shares redeemed | (107,837) | (78,502) | (1,496,833) | (1,105,911) |
| Net increase (decrease) | 9,626 | 34,731 | $163,120 | $518,493 |
| Class K | | | | |
| Shares sold | 27,089 | 45,765 | $383,456 | $690,373 |
| Reinvestment of distributions | 7,724 | 545 | 107,046 | 6,415 |
| Shares redeemed | (21,814) | (23,501) | (306,902) | (322,848) |
| Net increase (decrease) | 12,999 | 22,809 | $183,600 | $373,940 |
13. Other.
A fund's organizational documents provide former and current trustees and officers with a limited indemnification against liabilities arising in connection with the performance of their duties to the fund. In the normal course of business, a fund may also enter into contracts that provide general indemnifications. A fund's maximum exposure under these arrangements is unknown as this would be dependent on future claims that may be made against a fund. The risk of material loss from such claims is considered remote.
14. Risk and Uncertainties.
Many factors affect a fund's performance. Developments that disrupt global economies and financial markets, such as pandemics, epidemics, outbreaks of infectious diseases, war, terrorism, and environmental disasters, may significantly affect a fund's investment performance. The effects of these developments to a fund will be impacted by the types of securities in which a fund invests, the financial condition, industry, economic sector, and geographic location of an issuer, and a fund's level of investment in the securities of that issuer.
To the Board of Trustees of Fidelity Capital Trust and Shareholders of Fidelity Value Fund
Opinion on the Financial Statements
We have audited the accompanying statement of assets and liabilities, including the schedule of investments, of Fidelity Value Fund (one of the funds constituting Fidelity Capital Trust, referred to hereafter as the "Fund") as of October 31, 2022, the related statement of operations for the year ended October 31, 2022, the statement of changes in net assets for each of the two years in the period ended October 31, 2022, including the related notes, and the financial highlights for each of the five years in the period ended October 31, 2022 (collectively referred to as the "financial statements"). In our opinion, the financial statements present fairly, in all material respects, the financial position of the Fund as of October 31, 2022, the results of its operations for the year then ended, the changes in its net assets for each of the two years in the period ended October 31, 2022 and the financial highlights for each of the five years in the period ended October 31, 2022 in conformity with accounting principles generally accepted in the United States of America.
Basis for Opinion
These financial statements are the responsibility of the Fund's management. Our responsibility is to express an opinion on the Fund's financial statements based on our audits. We are a public accounting firm registered with the Public Company Accounting Oversight Board (United States) (PCAOB) and are required to be independent with respect to the Fund in accordance with the U.S. federal securities laws and the applicable rules and regulations of the Securities and Exchange Commission and the PCAOB.
We conducted our audits of these financial statements in accordance with the standards of the PCAOB. Those standards require that we plan and perform the audit to obtain reasonable assurance about whether the financial statements are free of material misstatement, whether due to error or fraud.
Our audits included performing procedures to assess the risks of material misstatement of the financial statements, whether due to error or fraud, and performing procedures that respond to those risks. Such procedures included examining, on a test basis, evidence regarding the amounts and disclosures in the financial statements. Our audits also included evaluating the accounting principles used and significant estimates made by management, as well as evaluating the overall presentation of the financial statements. Our procedures included confirmation of securities owned as of October 31, 2022 by correspondence with the custodian and brokers; when replies were not received from brokers, we performed other auditing procedures. We believe that our audits provide a reasonable basis for our opinion.
/s/ PricewaterhouseCoopers LLP
Boston, Massachusetts
December 14, 2022
We have served as the auditor of one or more investment companies in the Fidelity group of funds since 1932.
The Trustees, Members of the Advisory Board (if any), and officers of the trust and fund, as applicable, are listed below. The Board of Trustees governs the fund and is responsible for protecting the interests of shareholders. The Trustees are experienced executives who meet periodically throughout the year to oversee the fund's activities, review contractual arrangements with companies that provide services to the fund, oversee management of the risks associated with such activities and contractual arrangements, and review the fund's performance. Each of the Trustees oversees 316 funds.
The Trustees hold office without limit in time except that (a) any Trustee may resign; (b) any Trustee may be removed by written instrument, signed by at least two-thirds of the number of Trustees prior to such removal; (c) any Trustee who requests to be retired or who has become incapacitated by illness or injury may be retired by written instrument signed by a majority of the other Trustees; and (d) any Trustee may be removed at any special meeting of shareholders by a two-thirds vote of the outstanding voting securities of the trust. Each Trustee who is not an interested person (as defined in the 1940 Act) of the trust and the fund is referred to herein as an Independent Trustee. Each Independent Trustee shall retire not later than the last day of the calendar year in which his or her 75th birthday occurs. The Independent Trustees may waive this mandatory retirement age policy with respect to individual Trustees. Officers and Advisory Board Members hold office without limit in time, except that any officer or Advisory Board Member may resign or may be removed by a vote of a majority of the Trustees at any regular meeting or any special meeting of the Trustees. Except as indicated, each individual has held the office shown or other offices in the same company for the past five years.
The fund's Statement of Additional Information (SAI) includes more information about the Trustees. To request a free copy, call Fidelity at 1-800-544-8544 if you're an individual investing directly with Fidelity, call 1-800-835-5092 if you're a plan sponsor or participant with Fidelity as your recordkeeper or call 1-877-208-0098 on institutional accounts or if you're an advisor or invest through one.
Experience, Skills, Attributes, and Qualifications of the Trustees. The Governance and Nominating Committee has adopted a statement of policy that describes the experience, qualifications, attributes, and skills that are necessary and desirable for potential Independent Trustee candidates (Statement of Policy). The Board believes that each Trustee satisfied at the time he or she was initially elected or appointed a Trustee, and continues to satisfy, the standards contemplated by the Statement of Policy. The Governance and Nominating Committee also engages professional search firms to help identify potential Independent Trustee candidates who have the experience, qualifications, attributes, and skills consistent with the Statement of Policy. From time to time, additional criteria based on the composition and skills of the current Independent Trustees, as well as experience or skills that may be appropriate in light of future changes to board composition, business conditions, and regulatory or other developments, have also been considered by the professional search firms and the Governance and Nominating Committee. In addition, the Board takes into account the Trustees' commitment and participation in Board and committee meetings, as well as their leadership of standing and ad hoc committees throughout their tenure.
In determining that a particular Trustee was and continues to be qualified to serve as a Trustee, the Board has considered a variety of criteria, none of which, in isolation, was controlling. The Board believes that, collectively, the Trustees have balanced and diverse experience, qualifications, attributes, and skills, which allow the Board to operate effectively in governing the fund and protecting the interests of shareholders. Information about the specific experience, skills, attributes, and qualifications of each Trustee, which in each case led to the Board's conclusion that the Trustee should serve (or continue to serve) as a trustee of the fund, is provided below.
Board Structure and Oversight Function. Robert A. Lawrence is an interested person and currently serves as Chair. The Trustees have determined that an interested Chair is appropriate and benefits shareholders because an interested Chair has a personal and professional stake in the quality and continuity of services provided to the fund. Independent Trustees exercise their informed business judgment to appoint an individual of their choosing to serve as Chair, regardless of whether the Trustee happens to be independent or a member of management. The Independent Trustees have determined that they can act independently and effectively without having an Independent Trustee serve as Chair and that a key structural component for assuring that they are in a position to do so is for the Independent Trustees to constitute a substantial majority for the Board. The Independent Trustees also regularly meet in executive session. David M. Thomas serves as Lead Independent Trustee and as such (i) acts as a liaison between the Independent Trustees and management with respect to matters important to the Independent Trustees and (ii) with management prepares agendas for Board meetings.
Fidelity ® funds are overseen by different Boards of Trustees. The fund's Board oversees Fidelity's high income and certain equity funds, and other Boards oversee Fidelity's investment-grade bond, money market, asset allocation, and other equity funds. The asset allocation funds may invest in Fidelity ® funds overseen by the fund's Board. The use of separate Boards, each with its own committee structure, allows the Trustees of each group of Fidelity ® funds to focus on the unique issues of the funds they oversee, including common research, investment, and operational issues. On occasion, the separate Boards establish joint committees to address issues of overlapping consequences for the Fidelity ® funds overseen by each Board.
The Trustees operate using a system of committees to facilitate the timely and efficient consideration of all matters of importance to the Trustees, the fund, and fund shareholders and to facilitate compliance with legal and regulatory requirements and oversight of the fund's activities and associated risks. The Board, acting through its committees, has charged FMR and its affiliates with (i) identifying events or circumstances the occurrence of which could have demonstrably adverse effects on the fund's business and/or reputation; (ii) implementing processes and controls to lessen the possibility that such events or circumstances occur or to mitigate the effects of such events or circumstances if they do occur; and (iii) creating and maintaining a system designed to evaluate continuously business and market conditions in order to facilitate the identification and implementation processes described in (i) and (ii) above. Because the day-to-day operations and activities of the fund are carried out by or through FMR, its affiliates, and other service providers, the fund's exposure to risks is mitigated but not eliminated by the processes overseen by the Trustees. While each of the Board's committees has responsibility for overseeing different aspects of the fund's activities, oversight is exercised primarily through the Operations, Audit, and Compliance Committees. Appropriate personnel, including but not limited to the fund's Chief Compliance Officer (CCO), FMR's internal auditor, the independent accountants, the fund's Treasurer and portfolio management personnel, make periodic reports to the Board's committees, as appropriate, including an annual review of Fidelity's risk management program for the Fidelity ® funds. The responsibilities of each standing committee, including their oversight responsibilities, are described further under "Standing Committees of the Trustees."
Interested Trustees*:
Correspondence intended for a Trustee who is an interested person may be sent to Fidelity Investments, 245 Summer Street, Boston, Massachusetts 02210.
Name, Year of Birth; Principal Occupations and Other Relevant Experience+
Bettina Doulton (1964)
Year of Election or Appointment: 2020
Trustee
Ms. Doulton also serves as Trustee of other Fidelity ® funds. Prior to her retirement, Ms. Doulton served in a variety of positions at Fidelity Investments, including as a managing director of research (2006-2007), portfolio manager to certain Fidelity ® funds (1993-2005), equity analyst and portfolio assistant (1990-1993), and research assistant (1987-1990). Ms. Doulton currently owns and operates Phi Builders + Architects and Cellardoor Winery. Previously, Ms. Doulton served as a member of the Board of Brown Capital Management, LLC (2014-2018).
Robert A. Lawrence (1952)
Year of Election or Appointment: 2020
Trustee
Chair of the Board of Trustees
Mr. Lawrence also serves as Trustee of other funds. Previously, Mr. Lawrence served as a Trustee and Member of the Advisory Board of certain funds. Prior to his retirement in 2008, Mr. Lawrence served as Vice President of certain Fidelity ® funds (2006-2008), Senior Vice President, Head of High Income Division of Fidelity Management & Research Company (investment adviser firm, 2006-2008), and President of Fidelity Strategic Investments (investment adviser firm, 2002-2005).
* Determined to be an "Interested Trustee" by virtue of, among other things, his or her affiliation with the trust or various entities under common control with FMR.
+ The information includes the Trustee's principal occupation during the last five years and other information relating to the experience, attributes, and skills relevant to the Trustee's qualifications to serve as a Trustee, which led to the conclusion that the Trustee should serve as a Trustee for the fund.
Independent Trustees:
Correspondence intended for an Independent Trustee may be sent to Fidelity Investments, P.O. Box 55235, Boston, Massachusetts 02205-5235.
Name, Year of Birth; Principal Occupations and Other Relevant Experience+
Thomas P. Bostick (1956)
Year of Election or Appointment: 2021
Trustee
Lieutenant General Bostick also serves as Trustee of other Fidelity ® funds. Prior to his retirement, General Bostick (United States Army, Retired) held a variety of positions within the U.S. Army, including Commanding General and Chief of Engineers, U.S. Army Corps of Engineers (2012-2016) and Deputy Chief of Staff and Director of Human Resources, U.S. Army (2009-2012). General Bostick currently serves as a member of the Board and Finance and Governance Committees of CSX Corporation (transportation, 2020-present) and a member of the Board and Corporate Governance and Nominating Committee of Perma-Fix Environmental Services, Inc. (nuclear waste management, 2020-present). General Bostick serves as Chief Executive Officer of Bostick Global Strategies, LLC (consulting, 2016-present) and as a member of the Board of HireVue, Inc. (video interview and assessment, 2020-present). Previously, General Bostick served as a Member of the Advisory Board of certain Fidelity® funds (2021), President, Intrexon Bioengineering (2018-2020) and Chief Operating Officer (2017-2020) and Senior Vice President of the Environment Sector (2016-2017) of Intrexon Corporation (biopharmaceutical company).
Dennis J. Dirks (1948)
Year of Election or Appointment: 2005
Trustee
Mr. Dirks also serves as Trustee of other Fidelity ® funds. Prior to his retirement in May 2003, Mr. Dirks served as Chief Operating Officer and as a member of the Board of The Depository Trust & Clearing Corporation (financial markets infrastructure), President, Chief Operating Officer and a member of the Board of The Depository Trust Company (DTC), President and a member of the Board of the National Securities Clearing Corporation (NSCC), Chief Executive Officer and a member of the Board of the Government Securities Clearing Corporation and Chief Executive Officer and a member of the Board of the Mortgage-Backed Securities Clearing Corporation. Mr. Dirks currently serves as a member of the Finance Committee (2016-present) and Board (2017-present) and is Treasurer (2018-present) of the Asolo Repertory Theatre.
Donald F. Donahue (1950)
Year of Election or Appointment: 2018
Trustee
Mr. Donahue also serves as Trustee of other Fidelity ® funds. Mr. Donahue serves as President and Chief Executive Officer of Miranda Partners, LLC (risk consulting for the financial services industry, 2012-present). Previously, Mr. Donahue served as Chief Executive Officer (2006-2012), Chief Operating Officer (2003-2006) and Managing Director, Customer Marketing and Development (1999-2003) of The Depository Trust & Clearing Corporation (financial markets infrastructure). Mr. Donahue currently serves as a member (2007-present) and Co-Chairman (2016-present) of the Board of United Way of New York and a member of the Board of The Leadership Academy (previously NYC Leadership Academy) (2012-present). Mr. Donahue previously served as a member of the Advisory Board of certain Fidelity® funds (2015-2018).
Vicki L. Fuller (1957)
Year of Election or Appointment: 2020
Trustee
Ms. Fuller also serves as Trustee of other Fidelity ® funds. Previously, Ms. Fuller served as a member of the Advisory Board of certain Fidelity ® funds (2018-2020), Chief Investment Officer of the New York State Common Retirement Fund (2012-2018) and held a variety of positions at AllianceBernstein L.P. (global asset management, 1985-2012), including Managing Director (2006-2012) and Senior Vice President and Senior Portfolio Manager (2001-2006). Ms. Fuller currently serves as a member of the Board, Audit Committee and Nominating and Governance Committee of two Blackstone business development companies (2020-present), as a member of the Board of Treliant, LLC (consulting, 2019-present), as a member of the Advisory Board of Ariel Alternatives, LLC (private equity, 2021-present) and as a member of the Board and Chair of the Audit Committee of Gusto, Inc. (software, 2021-present). In addition, Ms. Fuller currently serves as a member of the Board of Roosevelt University (2019-present) and as a member of the Executive Board of New York University's Stern School of Business. Ms. Fuller previously served as a member of the Board, Audit Committee and Nominating and Governance Committee of The Williams Companies, Inc. (natural gas infrastructure, 2018-2021).
Patricia L. Kampling (1959)
Year of Election or Appointment: 2020
Trustee
Ms. Kampling also serves as Trustee of other Fidelity ® funds. Prior to her retirement, Ms. Kampling served as Chairman of the Board and Chief Executive Officer (2012-2019), President and Chief Operating Officer (2011-2012) and Executive Vice President and Chief Financial Officer (2010-2011) of Alliant Energy Corporation. Ms. Kampling currently serves as a member of the Board, Finance Committee and Governance, Compensation and Nominating Committee of Xcel Energy Inc. (utilities company, 2020-present) and as a member of the Board, Audit, Finance and Risk Committee and Safety, Environmental, Technology and Operations Committee and Chair of the Executive Development and Compensation Committee of American Water Works Company, Inc. (utilities company, 2019-present). In addition, Ms. Kampling currently serves as a member of the Board of the Nature Conservancy, Wisconsin Chapter (2019-present). Previously, Ms. Kampling served as a Member of the Advisory Board of certain Fidelity® funds (2020), a member of the Board, Compensation Committee and Executive Committee and Chair of the Audit Committee of Briggs & Stratton Corporation (manufacturing, 2011-2021), a member of the Board of Interstate Power and Light Company (2012-2019) and Wisconsin Power and Light Company (2012-2019) (each a subsidiary of Alliant Energy Corporation) and as a member of the Board and Workforce Development Committee of the Business Roundtable (2018-2019).
Thomas A. Kennedy (1955)
Year of Election or Appointment: 2021
Trustee
Mr. Kennedy also serves as Trustee of other Fidelity ® funds. Previously, Mr. Kennedy served as a Member of the Advisory Board of certain Fidelity ® funds (2020) and held a variety of positions at Raytheon Company (aerospace and defense, 1983-2020), including Chairman and Chief Executive Officer (2014-2020) and Executive Vice President and Chief Operating Officer (2013-2014). Mr. Kennedy currently serves as Executive Chairman of the Board of Directors of Raytheon Technologies Corporation (aerospace and defense, 2020-present). He is also a member of the Rutgers School of Engineering Industry Advisory Board (2011-present) and a member of the UCLA Engineering Dean's Executive Board (2016-present).
Oscar Munoz (1959)
Year of Election or Appointment: 2021
Trustee
Mr. Munoz also serves as Trustee of other Fidelity ® funds. Prior to his retirement, Mr. Munoz served as Executive Chairman (2020-2021), Chief Executive Officer (2015-2020), President (2015-2016) and a member of the Board (2010-2021) of United Airlines Holdings, Inc. Mr. Munoz currently serves as a member of the Board of CBRE Group, Inc. (commercial real estate, 2020-present), a member of the Board of Univision Communications, Inc. (Hispanic media, 2020-present) and a member of the Advisory Board of Salesforce.com, Inc. (cloud-based software, 2020-present). Previously, Mr. Munoz served as a Member of the Advisory Board of certain Fidelity ® funds (2021).
Garnett A. Smith (1947)
Year of Election or Appointment: 2018
Trustee
Mr. Smith also serves as Trustee of other Fidelity ® funds. Prior to his retirement, Mr. Smith served as Chairman and Chief Executive Officer (1990-1997) and President (1986-1990) of Inbrand Corp. (manufacturer of personal absorbent products). Prior to his employment with Inbrand Corp., he was employed by a retail fabric chain and North Carolina National Bank (now Bank of America). Mr. Smith previously served as a member of the Advisory Board of certain Fidelity ® funds (2012-2013).
David M. Thomas (1949)
Year of Election or Appointment: 2008
Trustee
Lead Independent Trustee
Mr. Thomas also serves as Trustee of other Fidelity ® funds. Previously, Mr. Thomas served as Executive Chairman (2005-2006) and Chairman and Chief Executive Officer (2000-2005) of IMS Health, Inc. (pharmaceutical and healthcare information solutions). Mr. Thomas currently serves as a member of the Board of Fortune Brands Home and Security (home and security products, 2004-present) and as Director (2013-present) and Non-Executive Chairman of the Board (2022-present) of Interpublic Group of Companies, Inc. (marketing communication).
Susan Tomasky (1953)
Year of Election or Appointment: 2020
Trustee
Ms. Tomasky also serves as Trustee of other Fidelity ® funds. Prior to her retirement, Ms. Tomasky served in various executive officer positions at American Electric Power Company, Inc. (1998-2011), including most recently as President of AEP Transmission (2007-2011). Ms. Tomasky currently serves as a member of the Board and Sustainability Committee and as Chair of the Audit Committee of Marathon Petroleum Corporation (2018-present) and as a member of the Board, Executive Committee, Corporate Governance Committee and Organization and Compensation Committee and as Chair of the Audit Committee of Public Service Enterprise Group, Inc. (utilities company, 2012-present) and as a member of the Board of its subsidiary company, Public Service Electric and Gas Co. (2021-present). In addition, Ms. Tomasky currently serves as a member (2009-present) and President (2020-present) of the Board of the Royal Shakespeare Company - America (2009-present), as a member of the Board of the Columbus Association for the Performing Arts (2011-present) and as a member of the Board and Kenyon in the World Committee of Kenyon College (2016-present). Previously, Ms. Tomasky served as a Member of the Advisory Board of certain Fidelity ® funds (2020), as a member of the Board of the Columbus Regional Airport Authority (2007-2020), as a member of the Board (2011-2018) and Lead Independent Director (2015-2018) of Andeavor Corporation (previously Tesoro Corporation) (independent oil refiner and marketer) and as a member of the Board of Summit Midstream Partners LP (energy, 2012-2018).
Michael E. Wiley (1950)
Year of Election or Appointment: 2018
Trustee
Mr. Wiley also serves as Trustee of other Fidelity ® funds. Previously, Mr. Wiley served as a member of the Advisory Board of certain Fidelity ® funds (2018-2020), Chairman, President and CEO of Baker Hughes, Inc. (oilfield services, 2000-2004). Mr. Wiley also previously served as a member of the Board of Andeavor Corporation (independent oil refiner and marketer, 2005-2018), a member of the Board of Andeavor Logistics LP (natural resources logistics, 2015-2018) and a member of the Board of High Point Resources (exploration and production, 2005-2020).
+ The information includes the Trustee's principal occupation during the last five years and other information relating to the experience, attributes, and skills relevant to the Trustee's qualifications to serve as a Trustee, which led to the conclusion that the Trustee should serve as a Trustee for the fund.
Advisory Board Members and Officers:
Correspondence intended for a Member of the Advisory Board (if any) may be sent to Fidelity Investments, P.O. Box 55235, Boston, Massachusetts 02205-5235. Correspondence intended for an officer or Peter S. Lynch may be sent to Fidelity Investments, 245 Summer Street, Boston, Massachusetts 02210. Officers appear below in alphabetical order.
Name, Year of Birth; Principal Occupation
Peter S. Lynch (1944)
Year of Election or Appointment: 2003
Member of the Advisory Board
Mr. Lynch also serves as a Member of the Advisory Board of other Fidelity ® funds. Mr. Lynch is Vice Chairman and a Director of Fidelity Management & Research Company LLC (investment adviser firm). In addition, Mr. Lynch serves as a Trustee of Boston College and as the Chairman of the Inner-City Scholarship Fund. Previously, Mr. Lynch served as Vice Chairman and a Director of FMR Co., Inc. (investment adviser firm) and on the Special Olympics International Board of Directors (1997-2006).
Craig S. Brown (1977)
Year of Election or Appointment: 2022
Deputy Treasurer
Mr. Brown also serves as an officer of other funds. Mr. Brown serves as Assistant Treasurer of FIMM, LLC (2021-present) and is an employee of Fidelity Investments (2013-present). Previously, Mr. Brown served as Assistant Treasurer of certain Fidelity ® funds (2019-2022).
John J. Burke III (1964)
Year of Election or Appointment: 2018
Chief Financial Officer
Mr. Burke also serves as Chief Financial Officer of other funds. Mr. Burke serves as Head of Investment Operations for Fidelity Fund and Investment Operations (2018-present) and is an employee of Fidelity Investments (1998-present). Previously Mr. Burke served as head of Asset Management Investment Operations (2012-2018).
William C. Coffey (1969)
Year of Election or Appointment: 2019
Assistant Secretary
Mr. Coffey also serves as Assistant Secretary of other funds. He is Senior Vice President and Deputy General Counsel of FMR LLC (diversified financial services company, 2010-present), and is an employee of Fidelity Investments. Previously, Mr. Coffey served as Secretary and CLO of certain funds (2018-2019); CLO, Secretary, and Senior Vice President of Fidelity Management & Research Company and FMR Co., Inc. (investment adviser firms, 2018-2019); Secretary of Fidelity SelectCo, LLC and Fidelity Investments Money Management, Inc. (investment adviser firms, 2018-2019); CLO of Fidelity Management & Research (Hong Kong) Limited, FMR Investment Management (UK) Limited, and Fidelity Management & Research (Japan) Limited (investment adviser firms, 2018-2019); and Assistant Secretary of certain funds (2009-2018).
Timothy M. Cohen (1969)
Year of Election or Appointment: 2018
Vice President
Mr. Cohen also serves as Vice President of other funds. Mr. Cohen serves as Co-Head of Equity (2018-present), a Director of Fidelity Management & Research (Japan) Limited (investment adviser firm, 2016-present), and is an employee of Fidelity Investments. Previously, Mr. Cohen served as Executive Vice President of Fidelity SelectCo, LLC (2019), Head of Global Equity Research (2016-2018), Chief Investment Officer - Equity and a Director of Fidelity Management & Research (U.K.) Inc. (investment adviser firm, 2013-2015) and as a Director of Fidelity Management & Research (Hong Kong) Limited (investment adviser firm, 2017).
Jonathan Davis (1968)
Year of Election or Appointment: 2010
Assistant Treasurer
Mr. Davis also serves as an officer of other funds. Mr. Davis serves as Assistant Treasurer of FIMM, LLC (2021-present), FMR Capital, Inc. (2017-present), FD Funds GP LLC (2021-present), FD Funds Holding LLC (2021-present), and FD Funds Management LLC (2021-present); and is an employee of Fidelity Investments. Previously, Mr. Davis served as Vice President and Associate General Counsel of FMR LLC (diversified financial services company, 2003-2010).
Laura M. Del Prato (1964)
Year of Election or Appointment: 2018
Assistant Treasurer
Ms. Del Prato also serves as an officer of other funds. Ms. Del Prato serves as Assistant Treasurer of FIMM, LLC (2021-present) and is an employee of Fidelity Investments (2017-present). Previously, Ms. Del Prato served as President and Treasurer of The North Carolina Capital Management Trust: Cash Portfolio and Term Portfolio (2018-2020). Prior to joining Fidelity Investments, Ms. Del Prato served as a Managing Director and Treasurer of the JPMorgan Mutual Funds (2014-2017). Prior to JPMorgan, Ms. Del Prato served as a partner at Cohen Fund Audit Services (accounting firm, 2012-2013) and KPMG LLP (accounting firm, 2004-2012).
Colm A. Hogan (1973)
Year of Election or Appointment: 2020
Assistant Treasurer
Mr. Hogan also serves as an officer of other funds. Mr. Hogan serves as Assistant Treasurer of FIMM, LLC (2021-present) and FMR Capital, Inc. (2017-present) and is an employee of Fidelity Investments (2005-present). Previously, Mr. Hogan served as Deputy Treasurer of certain Fidelity ® funds (2016-2020) and Assistant Treasurer of certain Fidelity ® funds (2016-2018).
Pamela R. Holding (1964)
Year of Election or Appointment: 2018
Vice President
Ms. Holding also serves as Vice President of other funds. Ms. Holding serves as Co-Head of Equity (2018-present) and is an employee of Fidelity Investments (2013-present). Previously, Ms. Holding served as Executive Vice President of Fidelity SelectCo, LLC (2019) and as Chief Investment Officer of Fidelity Institutional Asset Management (2013-2018).
Cynthia Lo Bessette (1969)
Year of Election or Appointment: 2019
Secretary and Chief Legal Officer (CLO)
Ms. Lo Bessette also serves as an officer of other funds. Ms. Lo Bessette serves as CLO, Secretary, and Senior Vice President of Fidelity Management & Research Company LLC (investment adviser firm, 2019-present); CLO of Fidelity Management & Research (Hong Kong) Limited, FMR Investment Management (UK) Limited, and Fidelity Management & Research (Japan) Limited (investment adviser firms, 2019-present); Secretary of FD Funds GP LLC (2021-present), FD Funds Holding LLC (2021-present), FD Funds Management LLC (2021-present), and Fidelity Diversifying Solutions LLC (investment adviser firm, 2022-present); and Assistant Secretary of FIMM, LLC (2019-present). She is a Senior Vice President and Deputy General Counsel of FMR LLC (diversified financial services company, 2019-present), and is an employee of Fidelity Investments. Previously, Ms. Lo Bessette served as CLO, Secretary, and Senior Vice President of FMR Co., Inc. (investment adviser firm, 2019); Secretary of Fidelity SelectCo, LLC and Fidelity Investments Money Management, Inc. (investment adviser firms, 2019). Prior to joining Fidelity Investments, Ms. Lo Bessette was Executive Vice President, General Counsel (2016-2019) and Senior Vice President, Deputy General Counsel (2015-2016) of OppenheimerFunds (investment management company) and Deputy Chief Legal Officer (2013-2015) of Jennison Associates LLC (investment adviser firm).
Chris Maher (1972)
Year of Election or Appointment: 2020
Deputy Treasurer
Mr. Maher also serves as an officer of other funds. Mr. Maher serves as Assistant Treasurer of FIMM, LLC (2021-present) and FMR Capital, Inc. (2017-present), and is an employee of Fidelity Investments (2008-present). Previously, Mr. Maher served as Assistant Treasurer of certain funds (2013-2020); Vice President of Asset Management Compliance (2013), Vice President of the Program Management Group of FMR (investment adviser firm, 2010-2013), and Vice President of Valuation Oversight (2008-2010).
Jason P. Pogorelec (1975)
Year of Election or Appointment: 2020
Chief Compliance Officer
Mr. Pogorelec also serves as Chief Compliance Officer of other funds. Mr. Pogorelec is a senior Vice President of Asset Management Compliance for Fidelity Investments and is an employee of Fidelity Investments (2006-present). Previously, Mr. Pogorelec served as Vice President, Associate General Counsel for Fidelity Investments (2010-2020) and Assistant Secretary of certain Fidelity funds (2015-2020).
Brett Segaloff (1972)
Year of Election or Appointment: 2021
Anti-Money Laundering (AML) Officer
Mr. Segaloff also serves as an AML Officer of other funds and other related entities. He is Director, Anti-Money Laundering (2007-present) of FMR LLC (diversified financial services company) and is an employee of Fidelity Investments (1996-present).
Stacie M. Smith (1974)
Year of Election or Appointment: 2016
President and Treasurer
Ms. Smith also serves as an officer of other funds. Ms. Smith serves as Assistant Treasurer of FIMM, LLC (2021-present) and FMR Capital, Inc. (2017-present), is an employee of Fidelity Investments (2009-present), and has served in other fund officer roles. Prior to joining Fidelity Investments, Ms. Smith served as Senior Audit Manager of Ernst & Young LLP (accounting firm, 1996-2009). Previously, Ms. Smith served as Assistant Treasurer (2013-2019) and Deputy Treasurer (2013-2016) of certain Fidelity ® funds.
Jim Wegmann (1979)
Year of Election or Appointment: 2019
Assistant Treasurer
Mr. Wegmann also serves as an officer of other funds. Mr. Wegmann serves as Assistant Treasurer of FIMM, LLC (2021-present) and is an employee of Fidelity Investments (2011-present). Previously, Mr. Wegmann served as Assistant Treasurer of certain Fidelity ® funds (2019-2021).
As a shareholder, you incur two types of costs: (1) transaction costs, which may include sales charges (loads) on purchase payments or redemption proceeds, as applicable and (2) ongoing costs, which generally include management fees, distribution and/or service (12b-1) fees and other Fund expenses. This Example is intended to help you understand your ongoing costs (in dollars) of investing in a fund and to compare these costs with the ongoing costs of investing in other mutual funds.
| The Example is based on an investment of $1,000 invested at the beginning of the period and held for the entire period (May 1, 2022 to October 31, 2022). |
Actual Expenses
The first line of the accompanying table provides information about actual account values and actual expenses. You may use the information in this line, together with the amount you invested, to estimate the expenses that you paid over the period. Simply divide your account value by $1,000.00 (for example, an $8,600 account value divided by $1,000.00 = 8.6), then multiply the result by the number in the first line for a class/Fund under the heading entitled "Expenses Paid During Period" to estimate the expenses you paid on your account during this period. If any fund is a shareholder of any underlying mutual funds or exchange-traded funds (ETFs) (the Underlying Funds), such fund indirectly bears its proportional share of the expenses of the Underlying Funds in addition to the direct expenses incurred presented in the table. These fees and expenses are not included in the annualized expense ratio used to calculate the expense estimate in the table below.
Hypothetical Example for Comparison Purposes
The second line of the accompanying table provides information about hypothetical account values and hypothetical expenses based on the actual expense ratio and an assumed rate of return of 5% per year before expenses, which is not the actual return. The hypothetical account values and expenses may not be used to estimate the actual ending account balance or expenses you paid for the period. You may use this information to compare the ongoing costs of investing in the Fund and other funds. To do so, compare this 5% hypothetical example with the 5% hypothetical examples that appear in the shareholder reports of the other funds. If any fund is a shareholder of any Underlying Funds, such fund indirectly bears its proportional share of the expenses of the Underlying Funds in addition to the direct expenses as presented in the table. These fees and expenses are not included in the annualized expense ratio used to calculate the expense estimate in the table below.
Please note that the expenses shown in the table are meant to highlight your ongoing costs only and do not reflect any transaction costs. Therefore, the second line of the table is useful in comparing ongoing costs only, and will not help you determine the relative total costs of owning different funds. In addition, if these transactional costs were included, your costs would have been higher.
| | | | | Annualized Expense Ratio- A | | Beginning Account Value May 1, 2022 | | Ending Account Value October 31, 2022 | | Expenses Paid During Period- C May 1, 2022 to October 31, 2022 |
| Fidelity® Value Fund | | | | | | | | | | |
| Fidelity® Value Fund | | | | .85% | | | | | | |
| Actual | | | | | | $ 1,000 | | $ 954.70 | | $ 4.19 |
Hypothetical- B | | | | | | $ 1,000 | | $ 1,020.92 | | $ 4.33 |
| Class K | | | | .76% | | | | | | |
| Actual | | | | | | $ 1,000 | | $ 955.50 | | $ 3.75 |
Hypothetical- B | | | | | | $ 1,000 | | $ 1,021.37 | | $ 3.87 |
| |
A Annualized expense ratio reflects expenses net of applicable fee waivers.
B 5% return per year before expenses
C Expenses are equal to the annualized expense ratio, multiplied by the average account value over the period, multiplied by 184/ 365 (to reflect the one-half year period). The fees and expenses of any Underlying Funds are not included in each annualized expense ratio.
The dividend and capital gains distributions for the fund(s) are available on Fidelity.com or Institutional.Fidelity.com.
The fund hereby designates as a capital gain dividend with respect to the taxable year ended October 31, 2022, $568,349,043, or, if subsequently determined to be different, the net capital gain of such year.
The fund designates 99.91% of the short-term capital gain dividends distributed during the fiscal year as qualifying to be taxed as short-term capital gain dividends for nonresident alien shareholders.
The fund designates 32% and 75%, Class K designates 31% and 75% of the dividends distributed during the fiscal year as qualifying for the dividends-received deduction for corporate shareholders.
The fund designates 36% and 80%, Class K designates 36% and 80% of the dividends distributed during the fiscal year as amounts which may be taken into account as a dividend for purposes of the maximum rate under section 1(h)(11) of the Internal Revenue Code.
The fund designates 3% and 5%, Class K designates 3% and 5% of the dividends distributed during the fiscal year as a section 199A dividend.
The fund will notify shareholders in January 2023 of amounts for use in preparing 2022 income tax returns.
Fidelity Value Fund
Each year, the Board of Trustees, including the Independent Trustees (together, the Board), votes on the renewal of the management contract with Fidelity Management & Research Company LLC (FMR) and the sub-advisory agreements (together, the Advisory Contracts) for the fund. FMR and the sub-advisers are referred to herein as the Investment Advisers. The Board, assisted by the advice of fund counsel and Independent Trustees' counsel, requests and considers a broad range of information relevant to the renewal of the Advisory Contracts throughout the year.
The Board meets regularly and, at each of its meetings, covers an extensive agenda of topics and materials and considers factors that are relevant to its annual consideration of the renewal of the fund's Advisory Contracts, including the services and support provided to the fund and its shareholders. The Board has established various standing committees (Committees), each composed of and chaired by Independent Trustees with varying backgrounds, to which the Board has assigned specific subject matter responsibilities in order to enhance effective decision-making by the Board. The Board, acting directly and through its Committees, requests and receives information concerning the annual consideration of the renewal of the fund's Advisory Contracts. The Board also meets as needed to review matters specifically related to the Board's annual consideration of the renewal of the Advisory Contracts. Members of the Board may also meet with trustees of other Fidelity funds through joint ad hoc committees to discuss certain matters relevant to all of the Fidelity funds.
At its May 2022 meeting, the Board unanimously determined to renew the fund's Advisory Contracts. In reaching its determination, the Board considered all factors it believed relevant, including (i) the nature, extent, and quality of the services provided to the fund and its shareholders (including the investment performance of the fund); (ii) the competitiveness relative to peer funds of the fund's management fee and total expense ratio of a representative class (retail class); (iii) the total costs of the services provided by and the profits realized by Fidelity from its relationships with the fund; and (iv) the extent to which, if any, economies of scale exist and are realized as the fund grows, and whether any economies of scale are appropriately shared with fund shareholders.
In considering whether to renew the Advisory Contracts for the fund, the Board reached a determination, with the assistance of fund counsel and Independent Trustees' counsel and through the exercise of its business judgment, that the renewal of the Advisory Contracts was in the best interests of the fund and its shareholders and that the compensation payable under the Advisory Contracts was fair and reasonable. The Board's decision to renew the Advisory Contracts was not based on any single factor, but rather was based on a comprehensive consideration of all the information provided to the Board at its meetings throughout the year. The Board, in reaching its determination to renew the Advisory Contracts, was aware that shareholders of the fund have a broad range of investment choices available to them, including a wide choice among funds offered by Fidelity's competitors, and that the fund's shareholders, who have the opportunity to review and weigh the disclosure provided by the fund in its prospectus and other public disclosures, have chosen to invest in this fund, which is part of the Fidelity family of funds.
Nature, Extent, and Quality of Services Provided . The Board considered Fidelity's staffing as it relates to the fund, including the backgrounds of investment personnel of Fidelity, and also considered the fund's investment objective, strategies, and related investment philosophy. The Independent Trustees also had discussions with senior management of Fidelity's investment operations and investment groups. The Board considered the structure of the investment personnel compensation program and whether this structure provides appropriate incentives to act in the best interests of the fund. Additionally, the Board considered the portfolio managers' investments, if any, in the funds that they manage. The Board also considered the steps Fidelity had taken to ensure the continued provision of high quality services to the Fidelity funds during the COVID-19 pandemic, including the expansion of staff in client facing positions to maintain service levels in periods of high volumes and volatility.
Resources Dedicated to Investment Management and Support Services . The Board and the Fund Oversight and Research Committees reviewed the general qualifications and capabilities of Fidelity's investment staff, including its size, education, experience, and resources, as well as Fidelity's approach to recruiting, training, managing, and compensating investment personnel. The Board noted the resources devoted to expansion of Fidelity's global investment organization, and that Fidelity's analysts have extensive resources, tools, and capabilities that allow them to conduct sophisticated quantitative and fundamental analysis, as well as credit analysis of issuers, counterparties, and guarantors. Further, the Board considered that Fidelity's investment professionals have sufficient access to global information and data so as to provide competitive investment results over time, and that those professionals also have access to sophisticated tools that permit them to assess portfolio construction and risk and performance attribution characteristics continuously, as well as to transmit new information and research conclusions rapidly around the world. Additionally, in its deliberations, the Board considered Fidelity's trading, risk management, compliance, and technology and operations capabilities and resources, which are integral parts of the investment management process.
Shareholder and Administrative Services . The Board considered (i) the nature, extent, quality, and cost of advisory, administrative, and shareholder services performed by the Investment Advisers and their affiliates under the Advisory Contracts and under separate agreements covering transfer agency, pricing and bookkeeping, and securities lending services for the fund; (ii) the nature and extent of the supervision of third party service providers, principally custodians, subcustodians, and pricing vendors; and (iii) the resources devoted to, and the record of compliance with, the fund's compliance policies and procedures. The Board also reviewed the allocation of fund brokerage, including allocations to brokers affiliated with the Investment Advisers, the use of brokerage commissions to pay fund expenses, and the use of "soft" commission dollars to pay for research services.
The Board noted that the growth of fund assets over time across the complex allows Fidelity to reinvest in the development of services designed to enhance the value and convenience of the Fidelity funds as investment vehicles. These services include 24-hour access to account information and market information over the Internet and through telephone representatives, investor education materials, and asset allocation tools. The Board also considered that it reviews customer service metrics such as telephone response times, continuity of services on the website and metrics addressing services at Fidelity Investor Centers.
Investment in a Large Fund Family . The Board considered the benefits to shareholders of investing in a Fidelity fund, including the benefits of investing in a fund that is part of a large family of funds offering a variety of investment disciplines and providing a large variety of mutual fund investor services. The Board noted that Fidelity had taken, or had made recommendations that resulted in the Fidelity funds taking, a number of actions over the previous year that benefited particular funds, including: (i) continuing to dedicate additional resources to Fidelity's investment research process, which includes meetings with management of issuers of securities in which the funds invest; (ii) continuing efforts to enhance Fidelity's global research capabilities; (iii) launching new funds and ETFs with innovative structures, strategies and pricing and making other enhancements to meet client needs; (iv) launching new share classes of existing funds; (v) eliminating purchase minimums and broadening eligibility requirements for certain funds and share classes; (vi) reducing management fees and total expenses for certain target date funds and classes and index funds; (vii) lowering expenses for certain existing funds and classes by implementing or lowering expense caps; (viii) rationalizing product lines and gaining increased efficiencies from fund mergers and liquidations; (ix) continuing to develop, acquire and implement systems and technology to improve services to the funds and shareholders, strengthen information security, and increase efficiency; and (x) continuing to implement enhancements to further strengthen Fidelity's product line to increase investors' probability of success in achieving their investment goals, including retirement income goals.
Investment Performance . The Board considered whether the fund has operated in accordance with its investment objective, as well as its record of compliance with its investment restrictions and its performance history.
The Board took into account discussions that occur at Board meetings throughout the year with representatives of the Investment Advisers about fund investment performance. In this regard the Board noted that as part of regularly scheduled fund reviews and other reports to the Board on fund performance, the Board considers annualized return information for the fund for different time periods, measured against an appropriate securities market index (benchmark index) and an appropriate peer group of funds with similar objectives (peer group). The Board also reviews and considers information about performance attribution. In its evaluation of fund investment performance, the Board gave particular attention to information indicating changes in performance of certain Fidelity funds for specific time periods and discussed with the Investment Advisers the reasons for any overperformance or underperformance.
In addition to reviewing absolute and relative fund performance, the Independent Trustees periodically consider the appropriateness of fund performance metrics in evaluating the results achieved. In general, the Independent Trustees believe that fund performance should be evaluated based on net performance (after fees and expenses) of the representative class, compared to appropriate benchmark indices, over appropriate time periods that may include full market cycles, and compared to peer groups, as applicable, over the same periods, taking into account relevant factors including the following: general market conditions; issuer-specific information; and fund cash flows and other factors.
The Independent Trustees recognize that shareholders evaluate performance on a net basis over their own holding periods, for which one-, three-, and five-year periods are often used as a proxy. For this reason, the performance information reviewed by the Board also included net cumulative total return information for the fund and an appropriate benchmark index and peer group for the most recent one-, three-, and five-year periods ended September 30, 2021, as shown below. Returns are shown compared to the 25th percentile (top of box, 75% beaten) and 75th percentile (bottom of box, 25% beaten) of the peer universe.
Fidelity Value Fund
The Board also considered that the fund's management fee is subject to upward or downward adjustment depending upon whether, and to what extent, the fund's investment performance for the performance period (a rolling 36-month period) exceeds, or is exceeded by, a securities index, thus leading to a performance adjustment for the same period. The Board noted that the performance adjustment provides FMR with a strong economic incentive to seek to achieve superior long-term performance for the fund's shareholders and helps to more closely align the interests of FMR and the shareholders of the fund.
Based on its review, the Board concluded that the nature, extent, and quality of services provided to the fund under the Advisory Contracts should continue to benefit the shareholders of the fund.
Competitiveness of Management Fee and Total Expense Ratio . The Board considered the fund's management fee and total expense ratio compared to "mapped groups" of competitive funds and classes created for the purpose of facilitating the Trustees' competitive analysis of management fees and total expenses. Fidelity creates "mapped groups" by combining similar Lipper investment objective categories that have comparable investment mandates. Combining Lipper investment objective categories aids the Board's management fee and total expense ratio comparisons by broadening the competitive group used for comparison.
Management Fee . The Board considered two proprietary management fee comparisons for the 12-month periods ended September 30 (June 30 for periods ended 2019 and 2018 and December 31 for periods prior to 2018) shown in basis points (BP) in the chart below. The group of Lipper funds used by the Board for management fee comparisons is referred to below as the "Total Mapped Group." The Total Mapped Group comparison focuses on a fund's standing in terms of gross management fees before expense reimbursements or caps, and without giving effect to the fund's performance adjustment, relative to the total universe of funds with comparable investment mandates, regardless of whether their management fee structures also are comparable. Funds with comparable investment mandates offer exposure to similar types of securities. Funds with comparable management fee structures have similar management fee contractual arrangements (e.g., flat rate charged for advisory services, all-inclusive fee rate, etc.). "TMG %" represents the percentage of funds in the Total Mapped Group that had management fees that were lower than the fund's. For example, a hypothetical TMG % of 20% would mean that 80% of the funds in the Total Mapped Group had higher, and 20% had lower, management fees than the fund. The fund's actual TMG %s and the number of funds in the Total Mapped Group are in the chart below. The "Asset-Sized Peer Group" (ASPG) comparison focuses on a fund's standing relative to a subset of non-Fidelity funds within the Total Mapped Group that are similar in size and management fee structure without taking into account performance adjustments, if any. For example, if a fund is in the first quartile of the ASPG, the fund's management fee ranks in the least expensive or lowest 25% of funds in the ASPG. The ASPG represents at least 15% of the funds in the Total Mapped Group with comparable asset size and management fee structures, subject to a minimum of 50 funds (or all funds in the Total Mapped Group if fewer than 50). Additional information, such as the ASPG quartile in which the fund's management fee rate ranked and the impact of the fund's performance adjustment, is also included in the chart and was considered by the Board.
Fidelity Value Fund
The Board noted that the fund's management fee rate ranked below the median of its Total Mapped Group and below the median of its ASPG for the 12-month period ended September 30, 2021. The Board also noted the effect of the fund's performance adjustment, if any, on the fund's management fee ranking.
The Board also considered that, for funds subject to the group fee, FMR agreed to voluntarily waive fees over a specified period of time in amounts designed to account for assets converted from certain funds to certain collective investment trusts.
Based on its review, the Board concluded that the fund's management fee is fair and reasonable in light of the services that the fund receives and the other factors considered.
Total Expense Ratio . In its review of the total expense ratio of the representative class (retail class), the Board considered the fund's management fee rate as well as other fund or class expenses, as applicable, such as transfer agent fees, pricing and bookkeeping fees, and custodial, legal, and audit fees. The Board noted the impact of the fund's performance adjustment. The Board also noted that Fidelity may agree to waive fees or reimburse expenses from time to time, and the extent to which, if any, it has done so for the fund. The fund's representative class is compared to those funds and classes in the Total Mapped Group (used by the Board for management fee comparisons) that have a similar sales load structure. The Board also considered a total expense ASPG comparison for the representative class, which focuses on the total expenses of the representative class relative to a subset of non-Fidelity funds within the total expense similar sales load structure group. The total expense ASPG is limited to 15 larger and 15 smaller classes in fund average assets for a total of 30 classes, where possible. The total expense ASPG comparison excludes performance adjustments and fund-paid 12b-1 fees to eliminate variability in fee structures.
The Board noted that the total net expense ratio of the retail class ranked below the similar sales load structure group median and below the ASPG competitive median for the 12-month period ended September 30, 2021.
Fees Charged to Other Fidelity Clients . The Board also considered Fidelity fee structures and other information with respect to clients of Fidelity, such as other funds advised or subadvised by Fidelity, pension plan clients, and other institutional clients with similar mandates. The Board noted that a joint ad hoc committee created by it and the boards of other Fidelity funds periodically reviews and compares Fidelity's institutional investment advisory business with its business of providing services to the Fidelity funds and also noted the most recent findings of the committee. The Board noted that the committee's review included a consideration of the differences in services provided, fees charged, and costs incurred, as well as competition in the markets serving the different categories of clients.
Based on its review of total expense ratios and fees charged to other Fidelity clients, the Board concluded that the total expense ratio of each class of the fund was reasonable in light of the services that the fund and its shareholders receive and the other factors considered.
Costs of the Services and Profitability. The Board considered the revenues earned and the expenses incurred by Fidelity in conducting the business of developing, marketing, distributing, managing, administering and servicing the fund and servicing the fund's shareholders. The Board also considered the level of Fidelity's profits in respect of all the Fidelity funds.
On an annual basis, Fidelity presents to the Board information about the profitability of its relationships with the fund. Fidelity calculates profitability information for each fund, as well as aggregate profitability information for groups of Fidelity funds and all Fidelity funds, using a series of detailed revenue and cost allocation methodologies which originate with the books and records of Fidelity on which Fidelity's audited financial statements are based. The Audit Committee of the Board reviews any significant changes from the prior year's methodologies and the full Board approves such changes.
A public accounting firm has been engaged annually by the Board as part of the Board's assessment of Fidelity's profitability analysis. The engagement includes the review and assessment of the methodologies used by Fidelity in determining the revenues and expenses attributable to Fidelity's mutual fund business, and completion of agreed-upon procedures in respect of the mathematical accuracy of certain fund profitability information and its conformity to established allocation methodologies. After considering the reports issued under the engagement and information provided by Fidelity, the Board concluded that while other allocation methods may also be reasonable, Fidelity's profitability methodologies are reasonable in all material respects.
The Board also reviewed Fidelity's non-fund businesses and potential indirect benefits such businesses may have received as a result of their association with Fidelity's mutual fund business (i.e., fall-out benefits) as well as cases where Fidelity's affiliates may benefit from the funds' business. The Board considered areas where potential indirect benefits to the Fidelity funds from their relationships with Fidelity may exist. The Board's consideration of these matters was informed by the findings of a joint ad hoc committee created by it and the boards of other Fidelity funds to evaluate potential fall-out benefits.
The Board considered the costs of the services provided by and the profits realized by Fidelity in connection with the operation of the fund and was satisfied that the profitability was not excessive.
Economies of Scale . The Board considered whether there have been economies of scale in respect of the management of the Fidelity funds, whether the Fidelity funds (including the fund) have appropriately benefited from any such economies of scale, and whether there is potential for realization of any further economies of scale. The Board considered the extent to which the fund will benefit from economies of scale as assets grow through increased services to the fund, through waivers or reimbursements, or through fee or expense ratio reductions. The Board also noted that a committee (the Economies of Scale Committee) created by it and the boards of other Fidelity funds periodically analyzes whether Fidelity attains economies of scale in respect of the management and servicing of the Fidelity funds, whether the Fidelity funds have appropriately benefited from such economies of scale, and whether there is potential for realization of any further economies of scale.
The Board recognized that the fund's management contract incorporates a "group fee" structure, which provides for lower group fee rates as total "group assets" increase, and for higher group fee rates as total "group assets" decrease ("group assets" as defined in the management contract). FMR calculates the group fee rates based on a tiered asset "breakpoint" schedule that varies based on asset class. The Board considered that the group fee is designed to deliver the benefits of economies of scale to fund shareholders when total Fidelity fund assets increase, even if assets of any particular fund are unchanged or have declined, because some portion of Fidelity's costs are attributable to services provided to all Fidelity funds, and all funds benefit if those costs can be allocated among more assets. The Board further considered that Fidelity agreed to impose a temporary fee waiver in the form of additional breakpoints to the current breakpoint schedule. The Board concluded that, given the group fee structure, fund shareholders will benefit from lower management fees as "group assets" increase at the fund complex level, regardless of whether Fidelity achieves any such economies of scale.
The Board concluded, taking into account the analysis of the Economies of Scale Committee, that economies of scale, if any, are being appropriately shared between fund shareholders and Fidelity.
Additional Information Requested by the Board . In order to develop fully the factual basis for consideration of the Fidelity funds' advisory contracts, the Board requested and received additional information on certain topics, including: (i) fund flow and performance trends, in particular the underperformance of certain funds and strategies, and Fidelity's long-term strategies for certain funds, including any consideration of fund liquidations or mergers; (ii) the operation of performance fees, competitor use of performance fees, and consideration of the expansion of performance fees to additional funds; (iii) Fidelity's pricing philosophy compared to competitors; (iv) fund profitability methodology and data; (v) evaluation of competitive fund data and peer group classifications and fee and expense comparisons; (vi) the management fee and expense structures for different funds and classes and information about the differences between various fee and expense structures; (vii) group fee breakpoints and related voluntary fee waivers; and (viii) information regarding other accounts managed by Fidelity and the funds' sub-advisory arrangements.
Based on its evaluation of all of the conclusions noted above, and after considering all factors it believed relevant, the Board concluded that the advisory fee arrangements are fair and reasonable and that the fund's Advisory Contracts should be renewed.
1.538531.125
VAL-ANN-1222
Fidelity® Focused Stock Fund
Annual Report
October 31, 2022
Contents
To view a fund's proxy voting guidelines and proxy voting record for the 12-month period ended June 30, visit http://www.fidelity.com/proxyvotingresults or visit the Securities and Exchange Commission's (SEC) web site at http://www.sec.gov.
You may also call 1-800-544-8544 to request a free copy of the proxy voting guidelines.
Standard & Poor's, S&P and S&P 500 are registered service marks of The McGraw-Hill Companies, Inc. and have been licensed for use by Fidelity Distributors Corporation.
Other third-party marks appearing herein are the property of their respective owners.
All other marks appearing herein are registered or unregistered trademarks or service marks of FMR LLC or an affiliated company. © 2022 FMR LLC. All rights reserved.
This report and the financial statements contained herein are submitted for the general information of the shareholders of the Fund. This report is not authorized for distribution to prospective investors in the Fund unless preceded or accompanied by an effective prospectus.
A fund files its complete schedule of portfolio holdings with the SEC for the first and third quarters of each fiscal year on Form N-PORT. Forms N-PORT are available on the SEC's web site at http://www.sec.gov. A fund's Forms N-PORT may be reviewed and copied at the SEC's Public Reference Room in Washington, DC. Information regarding the operation of the SEC's Public Reference Room may be obtained by calling 1-800-SEC-0330.
For a complete list of a fund's portfolio holdings, view the most recent holdings listing, semiannual report, or annual report on Fidelity's web site at http://www.fidelity.com, http://www.institutional.fidelity.com, or http://www.401k.com, as applicable.
NOT FDIC INSURED •MAY LOSE VALUE •NO BANK GUARANTEE
Neither the Fund nor Fidelity Distributors Corporation is a bank.
Average annual total return reflects the change in the value of an investment, assuming reinvestment of distributions from dividend income and capital gains (the profits earned upon the sale of securities that have grown in value, if any) and assuming a constant rate of performance each year. The hypothetical investment and the average annual total returns do not reflect the deduction of taxes that a shareholder would pay on fund distributions or the redemption of fund shares. During periods of reimbursement by Fidelity, a fund's total return will be greater than it would be had the reimbursement not occurred. How a fund did yesterday is no guarantee of how it will do tomorrow.
| Average Annual Total Returns |
| | | | |
Periods ended October 31, 2022 | Past 1 year | Past 5 years | Past 10 years |
| Fidelity® Focused Stock Fund | -24.13% | 12.51% | 13.56% |
| $10,000 Over 10 Years |
| |
Let's say hypothetically that $10,000 was invested in Fidelity® Focused Stock Fund on October 31, 2012. The chart shows how the value of your investment would have changed, and also shows how the S&P 500® Index performed over the same period. |
|
|
Market Recap:
U.S. equities returned -14.61% for the 12 months ending October 31, 2022, according to the S&P 500 ® index, as a multitude of risk factors challenged the global economy and financial markets. Persistently high inflation prompted the Federal Reserve to aggressively tighten monetary policy, and market interest rates eclipsed their highest level in roughly a decade, stoking recession fears and sending stocks into bear market territory. In late 2021, the Fed shifted to a more "hawkish" (restrictive) policy stance and proceeded to hike its benchmark rate five times, by a total of 3%, between March and September - the fastest-ever pace of monetary tightening - while taking substantive steps to shrink its massive asset portfolio. Against this hostile backdrop for risk assets, the S&P 500 ® posted its worst year-to-date result (-23.87%) in 20 years through September, a seasonally weak month for stocks that stayed true to form, and then some, with volatility spiking due to growing certainty the Fed would persist in its effort to cool inflation, even at the expense of economic growth. Three of the index's worst monthly returns ever were recorded this period, with the S&P 500 shedding 8% to 9% in April, June and September. Gains of similar proportion were made in July and October, amid optimism on inflation and policy easing. For the full 12 months, the growth-oriented communication services (-41%) and consumer discretionary (-29%) sectors lagged most. In sharp contrast, energy (+65%) had a strong run, followed by consumer staples (+5%).
Comments from Portfolio Manager Stephen DuFour:
For the fiscal year ending October 31, 2022, the fund returned -24.13%, trailing the -14.61% result of the benchmark S&P 500 ® index. Versus the benchmark, the combined result of stock selection and an overweighting in the information technology sector, primarily within the software & services industry, was the largest relative detractor. Weak picks in the financials sector, especially within the diversified financials industry, also hurt. Stock selection in communication services further hindered our result. The fund's biggest individual relative detractor was an overweighting in Adobe, which returned -46% the past 12 months. We decreased our stake in this company during the period. Also holding back performance was our outsized stake in S&P Global, one of the fund's largest holdings, which returned about -32%. Our overweighting in Caesars Entertainment, which returned approximately -30%, also detracted. Caesars Entertainment was not held at period end. Conversely, the largest contributors to performance versus the benchmark were strong stock picks in the utilities and health care sectors. An overweighting in energy also helped. The biggest individual relative contributor was our outsized position in Constellation Energy (+108%), which was an investment we established the past year. Also adding value was an overweight stake in UnitedHealth Group, which gained about 16%. This was a position we established the past 12 months. An overweighting in Eli Lilly (+45%), one of our biggest holdings, was another notable contributor. Changes in positioning include significantly increased exposure to the health care sector and lower allocations to communication services and information technology.
The views expressed above reflect those of the portfolio manager(s) only through the end of the period as stated on the cover of this report and do not necessarily represent the views of Fidelity or any other person in the Fidelity organization. Any such views are subject to change at any time based upon market or other conditions and Fidelity disclaims any responsibility to update such views. These views may not be relied on as investment advice and, because investment decisions for a Fidelity fund are based on numerous factors, may not be relied on as an indication of trading intent on behalf of any Fidelity fund.
Top Holdings (% of Fund's net assets) |
| |
| UnitedHealth Group, Inc. | 7.8 | |
| Microsoft Corp. | 6.1 | |
| Apple, Inc. | 5.7 | |
| Alphabet, Inc. Class A | 5.2 | |
| Constellation Energy Corp. | 4.6 | |
| Eli Lilly & Co. | 4.3 | |
| Amazon.com, Inc. | 4.2 | |
| The Travelers Companies, Inc. | 3.8 | |
| Estee Lauder Companies, Inc. Class A | 3.6 | |
| Northrop Grumman Corp. | 3.4 | |
| | 48.7 | |
| |
| Market Sectors (% of Fund's net assets) |
| |
| Information Technology | 25.2 | |
| Health Care | 23.5 | |
| Financials | 13.8 | |
| Consumer Discretionary | 12.4 | |
| Industrials | 7.2 | |
| Communication Services | 5.2 | |
| Utilities | 4.6 | |
| Consumer Staples | 3.6 | |
| Energy | 3.4 | |
| |
Asset Allocation (% of Fund's net assets) |
|
Foreign investments - 3.7% |
|
Showing Percentage of Net Assets
| Common Stocks - 98.9% |
| | | Shares | Value ($) |
| COMMUNICATION SERVICES - 5.2% | | | |
| Interactive Media & Services - 5.2% | | | |
| Alphabet, Inc. Class A (a) | | 1,412,000 | 133,448,120 |
| CONSUMER DISCRETIONARY - 12.4% | | | |
| Automobiles - 2.5% | | | |
| Tesla, Inc. (a) | | 278,000 | 63,256,120 |
| Internet & Direct Marketing Retail - 4.2% | | | |
| Amazon.com, Inc. (a) | | 1,049,000 | 107,459,560 |
| Specialty Retail - 2.4% | | | |
| TJX Companies, Inc. | | 873,000 | 62,943,300 |
| Textiles, Apparel & Luxury Goods - 3.3% | | | |
| Deckers Outdoor Corp. (a) | | 65,827 | 23,034,842 |
| lululemon athletica, Inc. (a) | | 50,000 | 16,452,000 |
| LVMH Moet Hennessy Louis Vuitton SE | | 71,741 | 45,268,205 |
| | | | 84,755,047 |
TOTAL CONSUMER DISCRETIONARY | | | 318,414,027 |
| CONSUMER STAPLES - 3.6% | | | |
| Personal Products - 3.6% | | | |
| Estee Lauder Companies, Inc. Class A | | 465,000 | 93,227,850 |
| ENERGY - 3.4% | | | |
| Oil, Gas & Consumable Fuels - 3.4% | | | |
| PrairieSky Royalty Ltd. (b) | | 2,705,000 | 42,014,020 |
| Range Resources Corp. | | 1,601,000 | 45,596,480 |
| | | | 87,610,500 |
| FINANCIALS - 13.8% | | | |
| Banks - 3.2% | | | |
| JPMorgan Chase & Co. | | 656,000 | 82,577,280 |
| Capital Markets - 6.5% | | | |
| Moody's Corp. | | 38,810 | 10,279,605 |
| MSCI, Inc. | | 171,000 | 80,175,060 |
| S&P Global, Inc. | | 239,294 | 76,873,198 |
| | | | 167,327,863 |
| Insurance - 4.1% | | | |
| Chubb Ltd. | | 36,029 | 7,742,272 |
| The Travelers Companies, Inc. | | 525,100 | 96,859,946 |
| | | | 104,602,218 |
TOTAL FINANCIALS | | | 354,507,361 |
| HEALTH CARE - 23.5% | | | |
| Biotechnology - 3.1% | | | |
| Regeneron Pharmaceuticals, Inc. (a) | | 35,408 | 26,511,740 |
| Vertex Pharmaceuticals, Inc. (a) | | 168,000 | 52,416,000 |
| | | | 78,927,740 |
| Health Care Providers & Services - 9.9% | | | |
| Humana, Inc. | | 99,000 | 55,249,920 |
| UnitedHealth Group, Inc. | | 362,000 | 200,964,298 |
| | | | 256,214,218 |
| Life Sciences Tools & Services - 3.3% | | | |
| Danaher Corp. | | 165,000 | 41,525,550 |
| Thermo Fisher Scientific, Inc. | | 83,000 | 42,659,510 |
| | | | 84,185,060 |
| Pharmaceuticals - 7.2% | | | |
| Eli Lilly & Co. | | 310,000 | 112,247,900 |
| Royalty Pharma PLC | | 1,754,000 | 74,229,280 |
| | | | 186,477,180 |
TOTAL HEALTH CARE | | | 605,804,198 |
| INDUSTRIALS - 7.2% | | | |
| Aerospace & Defense - 3.4% | | | |
| Northrop Grumman Corp. | | 161,000 | 88,390,610 |
| Machinery - 1.8% | | | |
| Cummins, Inc. | | 188,127 | 45,998,933 |
| Road & Rail - 2.0% | | | |
| Union Pacific Corp. | | 259,000 | 51,059,260 |
TOTAL INDUSTRIALS | | | 185,448,803 |
| INFORMATION TECHNOLOGY - 25.2% | | | |
| IT Services - 6.7% | | | |
| Fiserv, Inc. (a) | | 526,971 | 54,141,001 |
| MasterCard, Inc. Class A | | 166,000 | 54,477,880 |
| Visa, Inc. Class A | | 303,000 | 62,769,480 |
| | | | 171,388,361 |
| Semiconductors & Semiconductor Equipment - 3.8% | | | |
| Marvell Technology, Inc. | | 328,320 | 13,027,738 |
| NVIDIA Corp. | | 629,000 | 84,896,130 |
| | | | 97,923,868 |
| Software - 9.0% | | | |
| Adobe, Inc. (a) | | 60,000 | 19,110,000 |
| Intuit, Inc. | | 106,000 | 45,315,000 |
| Microsoft Corp. | | 682,000 | 158,312,660 |
| Oracle Corp. | | 133,000 | 10,383,310 |
| | | | 233,120,970 |
| Technology Hardware, Storage & Peripherals - 5.7% | | | |
| Apple, Inc. | | 962,000 | 147,513,080 |
TOTAL INFORMATION TECHNOLOGY | | | 649,946,279 |
| UTILITIES - 4.6% | | | |
| Electric Utilities - 4.6% | | | |
| Constellation Energy Corp. | | 1,253,000 | 118,458,620 |
| TOTAL COMMON STOCKS (Cost $2,140,406,887) | | | 2,546,865,758 |
| | | | |
| Money Market Funds - 0.4% |
| | | Shares | Value ($) |
| Fidelity Cash Central Fund 3.10% (c) | | 6,944,698 | 6,946,087 |
| Fidelity Securities Lending Cash Central Fund 3.10% (c)(d) | | 2,265,724 | 2,265,950 |
| TOTAL MONEY MARKET FUNDS (Cost $9,212,037) | | | 9,212,037 |
| | | | |
| TOTAL INVESTMENT IN SECURITIES - 99.3% (Cost $2,149,618,924) | 2,556,077,795 |
NET OTHER ASSETS (LIABILITIES) - 0.7% | 17,914,737 |
| NET ASSETS - 100.0% | 2,573,992,532 |
| | |
Legend
| (b) | Security or a portion of the security is on loan at period end. |
| (c) | Affiliated fund that is generally available only to investment companies and other accounts managed by Fidelity Investments. The rate quoted is the annualized seven-day yield of the fund at period end. A complete unaudited listing of the fund's holdings as of its most recent quarter end is available upon request. In addition, each Fidelity Central Fund's financial statements, which are not covered by the Fund's Report of Independent Registered Public Accounting Firm, are available on the SEC's website or upon request. |
| (d) | Investment made with cash collateral received from securities on loan. |
Affiliated Central Funds
Fiscal year to date information regarding the Fund's investments in Fidelity Central Funds, including the ownership percentage, is presented below.
| Affiliate | Value, beginning of period ($) | Purchases ($) | Sales Proceeds ($) | Dividend Income ($) | Realized Gain (loss) ($) | Change in Unrealized appreciation (depreciation) ($) | Value, end of period ($) | % ownership, end of period |
| Fidelity Cash Central Fund 3.10% | 6,535,025 | 1,596,319,261 | 1,595,908,199 | 437,355 | - | - | 6,946,087 | 0.0% |
| Fidelity Securities Lending Cash Central Fund 3.10% | 44,138,069 | 662,782,964 | 704,655,083 | 273,134 | - | - | 2,265,950 | 0.0% |
| Total | 50,673,094 | 2,259,102,225 | 2,300,563,282 | 710,489 | - | - | 9,212,037 | |
| | | | | | | | | |
Amounts in the income column in the above table include any capital gain distributions from underlying funds, which are presented in the corresponding line item in the Statement of Operations, if applicable.
Amount for Fidelity Securities Lending Cash Central Fund represents the income earned on investing cash collateral, less rebates paid to borrowers and any lending agent fees associated with the loan, plus any premium payments received for lending certain types of securities.
Investment Valuation
The following is a summary of the inputs used, as of October 31, 2022, involving the Fund's assets and liabilities carried at fair value. The inputs or methodology used for valuing securities may not be an indication of the risk associated with investing in those securities. For more information on valuation inputs, and their aggregation into the levels used below, please refer to the Investment Valuation section in the accompanying Notes to Financial Statements.
| Valuation Inputs at Reporting Date: |
| Description | Total ($) | Level 1 ($) | Level 2 ($) | Level 3 ($) |
Investments in Securities: | | | | |
|
| Equities: | | | | |
Communication Services | 133,448,120 | 133,448,120 | - | - |
Consumer Discretionary | 318,414,027 | 273,145,822 | 45,268,205 | - |
Consumer Staples | 93,227,850 | 93,227,850 | - | - |
Energy | 87,610,500 | 87,610,500 | - | - |
Financials | 354,507,361 | 354,507,361 | - | - |
Health Care | 605,804,198 | 605,804,198 | - | - |
Industrials | 185,448,803 | 185,448,803 | - | - |
Information Technology | 649,946,279 | 649,946,279 | - | - |
Utilities | 118,458,620 | 118,458,620 | - | - |
|
| Money Market Funds | 9,212,037 | 9,212,037 | - | - |
| Total Investments in Securities: | 2,556,077,795 | 2,510,809,590 | 45,268,205 | - |
| Statement of Assets and Liabilities |
| | | | October 31, 2022 |
| | | | | |
| Assets | | | | |
| Investment in securities, at value (including securities loaned of $2,127,774) - See accompanying schedule: | | | | |
Unaffiliated issuers (cost $2,140,406,887) | | $2,546,865,758 | | |
Fidelity Central Funds (cost $9,212,037) | | 9,212,037 | | |
| | | | | |
| Total Investment in Securities (cost $2,149,618,924) | | | $ | 2,556,077,795 |
| Cash | | | | 32,152 |
| Foreign currency held at value (cost $2,047) | | | | 2,007 |
| Receivable for investments sold | | | | 64,128,961 |
| Receivable for fund shares sold | | | | 201,277 |
| Dividends receivable | | | | 203,038 |
| Distributions receivable from Fidelity Central Funds | | | | 103,824 |
| Prepaid expenses | | | | 4,417 |
| Other receivables | | | | 1,531 |
Total assets | | | | 2,620,755,002 |
| Liabilities | | | | |
| Payable for investments purchased | | $41,676,039 | | |
| Payable for fund shares redeemed | | 1,124,055 | | |
| Accrued management fee | | 1,276,806 | | |
| Other affiliated payables | | 379,712 | | |
| Other payables and accrued expenses | | 42,652 | | |
| Collateral on securities loaned | | 2,263,206 | | |
| Total Liabilities | | | | 46,762,470 |
| Net Assets | | | $ | 2,573,992,532 |
| Net Assets consist of: | | | | |
| Paid in capital | | | $ | 2,003,323,760 |
| Total accumulated earnings (loss) | | | | 570,668,772 |
| Net Assets | | | $ | 2,573,992,532 |
Net Asset Value , offering price and redemption price per share ($2,573,992,532 ÷ 98,879,772 shares) | | | $ | 26.03 |
| | | | | |
| Statement of Operations |
| | | | Year ended October 31, 2022 |
| Investment Income | | | | |
| Dividends | | | $ | 30,570,122 |
| Interest | | | | 498 |
| Income from Fidelity Central Funds (including $273,134 from security lending) | | | | 710,489 |
| Total Income | | | | 31,281,109 |
| Expenses | | | | |
| Management fee | | | | |
| Basic fee | $ | 17,047,526 | | |
| Performance adjustment | | 3,188,846 | | |
| Transfer agent fees | | 4,502,002 | | |
| Accounting fees | | 887,148 | | |
| Custodian fees and expenses | | 56,565 | | |
| Independent trustees' fees and expenses | | 11,333 | | |
| Registration fees | | 70,713 | | |
| Audit | | 39,575 | | |
| Legal | | 9,137 | | |
| Miscellaneous | | 14,872 | | |
| Total expenses before reductions | | 25,827,717 | | |
| Expense reductions | | (106,736) | | |
| Total expenses after reductions | | | | 25,720,981 |
| Net Investment income (loss) | | | | 5,560,128 |
| Realized and Unrealized Gain (Loss) | | | | |
| Net realized gain (loss) on: | | | | |
| Investment Securities: | | | | |
| Unaffiliated issuers | | 232,159,784 | | |
| Foreign currency transactions | | 21,018 | | |
| Total net realized gain (loss) | | | | 232,180,802 |
| Change in net unrealized appreciation (depreciation) on: | | | | |
| Investment Securities: | | | | |
| Unaffiliated issuers | | (1,170,313,998) | | |
| Assets and liabilities in foreign currencies | | (36,016) | | |
| Total change in net unrealized appreciation (depreciation) | | | | (1,170,350,014) |
| Net gain (loss) | | | | (938,169,212) |
| Net increase (decrease) in net assets resulting from operations | | | $ | (932,609,084) |
| Statement of Changes in Net Assets |
| |
| | Year ended October 31, 2022 | | Year ended October 31, 2021 |
| Increase (Decrease) in Net Assets | | | | |
| Operations | | | | |
| Net investment income (loss) | $ | 5,560,128 | $ | (10,310,440) |
| Net realized gain (loss) | | 232,180,802 | | 539,785,834 |
| Change in net unrealized appreciation (depreciation) | | (1,170,350,014) | | 737,238,783 |
| Net increase (decrease) in net assets resulting from operations | | (932,609,084) | | 1,266,714,177 |
| Distributions to shareholders | | (473,470,909) | | (368,627,790) |
| Share transactions | | | | |
| Proceeds from sales of shares | | 318,891,655 | | 371,384,461 |
| Reinvestment of distributions | | 444,595,520 | | 349,597,290 |
| Cost of shares redeemed | | (736,064,445) | | (856,975,720) |
Net increase (decrease) in net assets resulting from share transactions | | 27,422,730 | | (135,993,969) |
| Total increase (decrease) in net assets | | (1,378,657,263) | | 762,092,418 |
| | | | | |
| Net Assets | | | | |
| Beginning of period | | 3,952,649,795 | | 3,190,557,377 |
| End of period | $ | 2,573,992,532 | $ | 3,952,649,795 |
| | | | | |
| Other Information | | | | |
| Shares | | | | |
| Sold | | 10,448,913 | | 11,211,690 |
| Issued in reinvestment of distributions | | 13,184,921 | | 11,477,259 |
| Redeemed | | (25,861,227) | | (26,001,483) |
| Net increase (decrease) | | (2,227,393) | | (3,312,534) |
| | | | | |
Financial Highlights
| Fidelity® Focused Stock Fund |
| |
| Years ended October 31, | | 2022 | | 2021 | | 2020 | | 2019 | | 2018 |
Selected Per-Share Data | | | | | | | | | | |
| Net asset value, beginning of period | $ | 39.09 | $ | 30.56 | $ | 25.42 | $ | 25.23 | $ | 23.48 |
| Income from Investment Operations | | | | | | | | | | |
Net investment income (loss) A,B | | .05 | | (.10) | | .01 | | .03 | | .02 |
| Net realized and unrealized gain (loss) | | (8.41) | | 12.18 | | 6.45 | | 3.23 | | 3.17 |
| Total from investment operations | | (8.36) | | 12.08 | | 6.46 | | 3.26 | | 3.19 |
| Distributions from net investment income | | - | | (.01) | | (.02) | | (.03) | | (.09) C |
| Distributions from net realized gain | | (4.70) | | (3.54) | | (1.30) | | (3.04) | | (1.35) C |
| Total distributions | | (4.70) | | (3.55) | | (1.32) | | (3.07) | | (1.44) |
| Net asset value, end of period | $ | 26.03 | $ | 39.09 | $ | 30.56 | $ | 25.42 | $ | 25.23 |
Total Return D | | (24.13)% | | 42.82% | | 26.56% | | 15.05% | | 14.30% |
Ratios to Average Net Assets B,E,F | | | | | | | | | | |
| Expenses before reductions | | .80% | | .86% | | .88% | | .89% | | .82% |
| Expenses net of fee waivers, if any | | .79% | | .86% | | .88% | | .89% | | .82% |
| Expenses net of all reductions | | .79% | | .86% | | .87% | | .89% | | .81% |
| Net investment income (loss) | | .17% | | (.29)% | | .05% | | .12% | | .07% |
| Supplemental Data | | | | | | | | | | |
| Net assets, end of period (000 omitted) | $ | 2,573,993 | $ | 3,952,650 | $ | 3,190,557 | $ | 2,953,108 | $ | 2,262,100 |
Portfolio turnover rate G | | 142% | | 107% | | 140% | | 152% | | 138% |
A Calculated based on average shares outstanding during the period.
B Net investment income (loss) is affected by the timing of the declaration of dividends by any underlying mutual funds or exchange-traded funds (ETFs). Net investment income (loss) of any mutual funds or ETFs is not included in the Fund's net investment income (loss) ratio.
C The amount shown reflects reclassifications related to book to tax differences that were made in the year shown.
D Total returns would have been lower if certain expenses had not been reduced during the applicable periods shown.
E Fees and expenses of any underlying mutual funds or exchange-traded funds (ETFs) are not included in the Fund's expense ratio. The Fund indirectly bears its proportionate share of these expenses. For additional expense information related to investments in Fidelity Central Funds, please refer to the "Investments in Fidelity Central Funds" note found in the Notes to Financial Statements section of the most recent Annual or Semi-Annual report.
F Expense ratios reflect operating expenses of the class. Expenses before reductions do not reflect amounts reimbursed, waived, or reduced through arrangements with the investment adviser, brokerage services, or other offset arrangements, if applicable, and do not represent the amount paid by the class during periods when reimbursements, waivers or reductions occur.
G Amount does not include the portfolio activity of any underlying mutual funds or exchange-traded funds (ETFs).
For the period ended October 31, 2022
1. Organization.
Fidelity Focused Stock Fund (the Fund) is a fund of Fidelity Capital Trust (the Trust) and is authorized to issue an unlimited number of shares. Share transactions on the Statement of Changes in Net Assets may contain exchanges between affiliated funds. The Trust is registered under the Investment Company Act of 1940, as amended (the 1940 Act), as an open-end management investment company organized as a Massachusetts business trust.
2. Investments in Fidelity Central Funds.
Funds may invest in Fidelity Central Funds, which are open-end investment companies generally available only to other investment companies and accounts managed by the investment adviser and its affiliates. The Schedule of Investments lists any Fidelity Central Funds held as an investment as of period end, but does not include the underlying holdings of each Fidelity Central Fund. An investing fund indirectly bears its proportionate share of the expenses of the underlying Fidelity Central Funds.
Based on its investment objective, each Fidelity Central Fund may invest or participate in various investment vehicles or strategies that are similar to those of the investing fund. These strategies are consistent with the investment objectives of the investing fund and may involve certain economic risks which may cause a decline in value of each of the Fidelity Central Funds and thus a decline in the value of the investing fund.
| Fidelity Central Fund | Investment Manager | Investment Objective | Investment Practices | Expense Ratio A |
| Fidelity Money Market Central Funds | Fidelity Management & Research Company LLC (FMR) | Each fund seeks to obtain a high level of current income consistent with the preservation of capital and liquidity. | Short-term Investments | Less than .005% |
A Expenses expressed as a percentage of average net assets and are as of each underlying Central Fund's most recent annual or semi-annual shareholder report.
A complete unaudited list of holdings for each Fidelity Central Fund is available upon request or at the Securities and Exchange Commission website at www.sec.gov. In addition, the financial statements of the Fidelity Central Funds which contain the significant accounting policies (including investment valuation policies) of those funds, and are not covered by the Report of Independent Registered Public Accounting Firm, are available on the Securities and Exchange Commission website or upon request.
3. Significant Accounting Policies.
The Fund is an investment company and applies the accounting and reporting guidance of the Financial Accounting Standards Board (FASB) Accounting Standards Codification Topic 946 Financial Services - Investment Companies . The financial statements have been prepared in conformity with accounting principles generally accepted in the United States of America (GAAP), which require management to make certain estimates and assumptions at the date of the financial statements. Actual results could differ from those estimates. Subsequent events, if any, through the date that the financial statements were issued have been evaluated in the preparation of the financial statements. The Fund's Schedule of Investments lists any underlying mutual funds or exchange-traded funds (ETFs) but does not include the underlying holdings of these funds. The following summarizes the significant accounting policies of the Fund:
Investment Valuation. Investments are valued as of 4:00 p.m. Eastern time on the last calendar day of the period. The Board of Trustees (the Board) has designated the Fund's investment adviser as the valuation designee responsible for the fair valuation function and performing fair value determinations as needed. The investment adviser has established a Fair Value Committee (the Committee) to carry out the day-to-day fair valuation responsibilities and has adopted policies and procedures to govern the fair valuation process and the activities of the Committee. In accordance with these fair valuation policies and procedures, which have been approved by the Board, the Fund attempts to obtain prices from one or more third party pricing services or brokers to value its investments. When current market prices, quotations or currency exchange rates are not readily available or reliable, investments will be fair valued in good faith by the Committee, in accordance with the policies and procedures. Factors used in determining fair value vary by investment type and may include market or investment specific events, transaction data, estimated cash flows, and market observations of comparable investments. The frequency that the fair valuation procedures are used cannot be predicted and they may be utilized to a significant extent. The Committee manages the Fund's fair valuation practices and maintains the fair valuation policies and procedures. The Fund's investment adviser reports to the Board information regarding the fair valuation process and related material matters.
The Fund categorizes the inputs to valuation techniques used to value its investments into a disclosure hierarchy consisting of three levels as shown below:
Level 1 - unadjusted quoted prices in active markets for identical investments
Level 2 - other significant observable inputs (including quoted prices for similar investments, interest rates, prepayment speeds, etc.)
Level 3 - unobservable inputs (including the Fund's own assumptions based on the best information available)
Valuation techniques used to value the Fund's investments by major category are as follows:
Equity securities, including restricted securities, for which market quotations are readily available, are valued at the last reported sale price or official closing price as reported by a third party pricing service on the primary market or exchange on which they are traded and are categorized as Level 1 in the hierarchy. In the event there were no sales during the day or closing prices are not available, securities are valued at the last quoted bid price or may be valued using the last available price and are generally categorized as Level 2 in the hierarchy. For foreign equity securities, when market or security specific events arise, comparisons to the valuation of American Depositary Receipts (ADRs), futures contracts, ETFs and certain indexes as well as quoted prices for similar securities may be used and would be categorized as Level 2 in the hierarchy. For equity securities, including restricted securities, where observable inputs are limited, assumptions about market activity and risk are used and these securities may be categorized as Level 3 in the hierarchy.
Investments in open-end mutual funds, including the Fidelity Central Funds, are valued at their closing net asset value (NAV) each business day and are categorized as Level 1 in the hierarchy.
Changes in valuation techniques may result in transfers in or out of an assigned level within the disclosure hierarchy. The aggregate value of investments by input level as of October 31, 2022 is included at the end of the Fund's Schedule of Investments.
Foreign Currency. Certain Funds may use foreign currency contracts to facilitate transactions in foreign-denominated securities. Gains and losses from these transactions may arise from changes in the value of the foreign currency or if the counterparties do not perform under the contracts' terms.
Foreign-denominated assets, including investment securities, and liabilities are translated into U.S. dollars at the exchange rates at period end. Purchases and sales of investment securities, income and dividends received, and expenses denominated in foreign currencies are translated into U.S. dollars at the exchange rate in effect on the transaction date.
The effects of exchange rate fluctuations on investments are included with the net realized and unrealized gain (loss) on investment securities. Other foreign currency transactions resulting in realized and unrealized gain (loss) are disclosed separately.
Investment Transactions and Income. For financial reporting purposes, the Fund's investment holdings and NAV include trades executed through the end of the last business day of the period. The NAV per share for processing shareholder transactions is calculated as of the close of business of the New York Stock Exchange (NYSE), normally 4:00 p.m. Eastern time and includes trades executed through the end of the prior business day. Gains and losses on securities sold are determined on the basis of identified cost and include proceeds received from litigation. Commissions paid to certain brokers with whom the investment adviser, or its affiliates, places trades on behalf of a fund include an amount in addition to trade execution, which may be rebated back to a fund. Any such rebates are included in net realized gain (loss) on investments in the Statement of Operations. Dividend income is recorded on the ex-dividend date, except for certain dividends from foreign securities where the ex-dividend date may have passed, which are recorded as soon as the Fund is informed of the ex-dividend date. Non-cash dividends included in dividend income, if any, are recorded at the fair market value of the securities received. Income and capital gain distributions from Fidelity Central Funds, if any, are recorded on the ex-dividend date. Certain distributions received by the Fund represent a return of capital or capital gain. The Fund determines the components of these distributions subsequent to the ex-dividend date, based upon receipt of tax filings or other correspondence relating to the underlying investment. These distributions are recorded as a reduction of cost of investments and/or as a realized gain. Interest income is accrued as earned and includes coupon interest and amortization of premium and accretion of discount on debt securities as applicable. Investment income is recorded net of foreign taxes withheld where recovery of such taxes is uncertain. Funds may file withholding tax reclaims in certain jurisdictions to recover a portion of amounts previously withheld. Any withholding tax reclaims income is included in the Statement of Operations in dividends. Any receivables for withholding tax reclaims are included in the Statement of Assets and Liabilities in dividends receivable.
Expenses. Expenses directly attributable to a fund are charged to that fund. Expenses attributable to more than one fund are allocated among the respective funds on the basis of relative net assets or other appropriate methods. Expenses included in the accompanying financial statements reflect the expenses of that fund and do not include any expenses associated with any underlying mutual funds or exchange-traded funds. Although not included in a fund's expenses, a fund indirectly bears its proportionate share of these expenses through the net asset value of each underlying mutual fund or exchange-traded fund. Expense estimates are accrued in the period to which they relate and adjustments are made when actual amounts are known.
Income Tax Information and Distributions to Shareholders. Each year, the Fund intends to qualify as a regulated investment company under Subchapter M of the Internal Revenue Code, including distributing substantially all of its taxable income and realized gains. As a result, no provision for U.S. Federal income taxes is required. As of October 31, 2022, the Fund did not have any unrecognized tax benefits in the financial statements; nor is the Fund aware of any tax positions for which it is reasonably possible that the total amounts of unrecognized tax benefits will significantly change in the next twelve months. The Fund files a U.S. federal tax return, in addition to state and local tax returns as required. The Fund's federal income tax returns are subject to examination by the Internal Revenue Service (IRS) for a period of three fiscal years after they are filed. State and local tax returns may be subject to examination for an additional fiscal year depending on the jurisdiction. Foreign taxes are provided for based on the Fund's understanding of the tax rules and rates that exist in the foreign markets in which it invests.
Distributions are declared and recorded on the ex-dividend date. Income and capital gain distributions are determined in accordance with income tax regulations, which may differ from GAAP. In addition, the Fund claimed a portion of the payment made to redeeming shareholders as a distribution for income tax purposes.
Capital accounts within the financial statements are adjusted for permanent book-tax differences. These adjustments have no impact on net assets or the results of operations. Capital accounts are not adjusted for temporary book-tax differences which will reverse in a subsequent period.
Book-tax differences are primarily due to foreign currency transactions, passive foreign investment companies (PFIC) and losses deferred due to wash sales.
As of period end, the cost and unrealized appreciation (depreciation) in securities, and derivatives if applicable, for federal income tax purposes were as follows:
| Gross unrealized appreciation | $509,782,075 |
| Gross unrealized depreciation | (119,134,801) |
| Net unrealized appreciation (depreciation) | $390,647,274 |
| Tax Cost | $2,165,430,521 |
The tax-based components of distributable earnings as of period end were as follows:
| Undistributed ordinary income | $16,083,380 |
| Undistributed long-term capital gain | $163,970,933 |
| Net unrealized appreciation (depreciation) on securities and other investments | $390,614,456 |
The tax character of distributions paid was as follows:
| | October 31, 2022 | October 31, 2021 |
| Ordinary Income | $112,899,173 | $623,037 |
| Long-term Capital Gains | 360,571,736 | 368,004,753 |
| Total | $473,470,909 | $368,627,790 |
4. Purchases and Sales of Investments.
Purchases and sales of securities, other than short-term securities and in-kind transactions, as applicable, are noted in the table below.
| | Purchases ($) | Sales ($) |
| Fidelity Focused Stock Fund | 4,543,825,031 | 5,000,564,123 |
5. Fees and Other Transactions with Affiliates.
Management Fee. Fidelity Management & Research Company LLC (the investment adviser) and its affiliates provide the Fund with investment management related services for which the Fund pays a monthly management fee. The management fee is the sum of an individual fund fee rate that is based on an annual rate of .30% of the Fund's average net assets and an annualized group fee rate that averaged .23% during the period. The group fee rate is based upon the monthly average net assets of a group of registered investment companies with which the investment adviser has management contracts. The group fee rate decreases as assets under management increase and increases as assets under management decrease. In addition, the management fee is subject to a performance adjustment (up to a maximum of +/- .20% of the Fund's average net assets over a 36 month performance period). The upward or downward adjustment to the management fee is based on the Fund's relative investment performance as compared to its benchmark index, the S&P 500 Index, over the same 36 month performance period. For the reporting period, the total annual management fee rate, including the performance adjustment, was .62% of the Fund's average net assets. The performance adjustment included in the management fee rate may be higher or lower than the maximum performance adjustment rate due to the difference between the average net assets for the reporting and performance periods.
Transfer Agent Fees. Fidelity Investments Institutional Operations Company LLC (FIIOC), an affiliate of the investment adviser, is the Fund's transfer, dividend disbursing and shareholder servicing agent. FIIOC receives account fees and asset-based fees that vary according to account size and type of account. FIIOC pays for typesetting, printing and mailing of shareholder reports, except proxy statements. For the period, the transfer agent fees were equivalent to an annual rate of .14% of average net assets.
Accounting Fees. Fidelity Service Company, Inc. (FSC), an affiliate of the investment adviser, maintains the Fund's accounting records. The accounting fee is based on the level of average net assets for each month. For the period, the fees were equivalent to the following annual rates:
| | % of Average Net Assets |
| Fidelity Focused Stock Fund | .03 |
Brokerage Commissions. A portion of portfolio transactions were placed with brokerage firms which are affiliates of the investment adviser. Brokerage commissions are included in net realized gain (loss) and change in net unrealized appreciation (depreciation) in the Statement of Operations. The commissions paid to these affiliated firms were as follows:
| | Amount |
| Fidelity Focused Stock Fund | $50,233 |
Interfund Trades. Funds may purchase from or sell securities to other Fidelity Funds under procedures adopted by the Board. The procedures have been designed to ensure these interfund trades are executed in accordance with Rule 17a-7 of the 1940 Act. Any interfund trades are included within the respective purchases and sales amounts shown in the Purchases and Sales of Investments note. Interfund trades during the period are noted in the table below.
| | Purchases ($) | Sales ($) | Realized Gain (Loss) ($) |
| Fidelity Focused Stock Fund | 368,326,002 | 499,907,470 | 65,398,880 |
Other. During the period, the investment adviser reimbursed the Fund for certain losses as follows:
| | Amount ($) |
| Fidelity Focused Stock Fund | 74,946 |
6. Committed Line of Credit.
Certain Funds participate with other funds managed by the investment adviser or an affiliate in a $4.25 billion credit facility (the "line of credit") to be utilized for temporary or emergency purposes to fund shareholder redemptions or for other short-term liquidity purposes. The participating funds have agreed to pay commitment fees on their pro-rata portion of the line of credit, which are reflected in Miscellaneous expenses on the Statement of Operations, and are listed below. During the period, there were no borrowings on this line of credit.
| | Amount |
| Fidelity Focused Stock Fund | $5,726 |
7. Security Lending.
Funds lend portfolio securities from time to time in order to earn additional income. Lending agents are used, including National Financial Services (NFS), an affiliate of the investment adviser. Pursuant to a securities lending agreement, NFS will receive a fee, which is capped at 9.9% of a fund's daily lending revenue, for its services as lending agent. A fund may lend securities to certain qualified borrowers, including NFS. On the settlement date of the loan, a fund receives collateral (in the form of U.S. Treasury obligations, letters of credit and/or cash) against the loaned securities and maintains collateral in an amount not less than 100% of the market value of the loaned securities during the period of the loan. The market value of the loaned securities is determined at the close of business of a fund and any additional required collateral is delivered to a fund on the next business day. A fund or borrower may terminate the loan at any time, and if the borrower defaults on its obligation to return the securities loaned because of insolvency or other reasons, a fund may apply collateral received from the borrower against the obligation. A fund may experience delays and costs in recovering the securities loaned. Any cash collateral received is invested in the Fidelity Securities Lending Cash Central Fund. Any loaned securities are identified as such in the Schedule of Investments, and the value of loaned securities and cash collateral at period end, as applicable, are presented in the Statement of Assets and Liabilities. Security lending income represents the income earned on investing cash collateral, less rebates paid to borrowers and any lending agent fees associated with the loan, plus any premium payments received for lending certain types of securities. Security lending income is presented in the Statement of Operations as a component of income from Fidelity Central Funds. Affiliated security lending activity, if any, was as follows:
| | Total Security Lending Fees Paid to NFS | Security Lending Income From Securities Loaned to NFS | Value of Securities Loaned to NFS at Period End |
| Fidelity Focused Stock Fund | $29,624 | $- | $- |
8. Expense Reductions.
Through arrangements with the Fund's custodian, credits realized as a result of certain uninvested cash balances were used to reduce the Fund's expenses by $52.
In addition, during the period the investment adviser or an affiliate reimbursed and/or waived a portion of operating expenses in the amount of $106,684.
9. Other.
A fund's organizational documents provide former and current trustees and officers with a limited indemnification against liabilities arising in connection with the performance of their duties to the fund. In the normal course of business, a fund may also enter into contracts that provide general indemnifications. A fund's maximum exposure under these arrangements is unknown as this would be dependent on future claims that may be made against a fund. The risk of material loss from such claims is considered remote.
10. Risk and Uncertainties.
Many factors affect a fund's performance. Developments that disrupt global economies and financial markets, such as pandemics, epidemics, outbreaks of infectious diseases, war, terrorism, and environmental disasters, may significantly affect a fund's investment performance. The effects of these developments to a fund will be impacted by the types of securities in which a fund invests, the financial condition, industry, economic sector, and geographic location of an issuer, and a fund's level of investment in the securities of that issuer.
To the Board of Trustees of Fidelity Capital Trust and Shareholders of Fidelity Focused Stock Fund
Opinion on the Financial Statements
We have audited the accompanying statement of assets and liabilities, including the schedule of investments, of Fidelity Focused Stock Fund (one of the funds constituting Fidelity Capital Trust, referred to hereafter as the "Fund") as of October 31, 2022, the related statement of operations for the year ended October 31, 2022, the statement of changes in net assets for each of the two years in the period ended October 31, 2022, including the related notes, and the financial highlights for each of the five years in the period ended October 31, 2022 (collectively referred to as the "financial statements"). In our opinion, the financial statements present fairly, in all material respects, the financial position of the Fund as of October 31, 2022, the results of its operations for the year then ended, the changes in its net assets for each of the two years in the period ended October 31, 2022 and the financial highlights for each of the five years in the period ended October 31, 2022 in conformity with accounting principles generally accepted in the United States of America.
Basis for Opinion
These financial statements are the responsibility of the Fund's management. Our responsibility is to express an opinion on the Fund's financial statements based on our audits. We are a public accounting firm registered with the Public Company Accounting Oversight Board (United States) (PCAOB) and are required to be independent with respect to the Fund in accordance with the U.S. federal securities laws and the applicable rules and regulations of the Securities and Exchange Commission and the PCAOB.
We conducted our audits of these financial statements in accordance with the standards of the PCAOB. Those standards require that we plan and perform the audit to obtain reasonable assurance about whether the financial statements are free of material misstatement, whether due to error or fraud.
Our audits included performing procedures to assess the risks of material misstatement of the financial statements, whether due to error or fraud, and performing procedures that respond to those risks. Such procedures included examining, on a test basis, evidence regarding the amounts and disclosures in the financial statements. Our audits also included evaluating the accounting principles used and significant estimates made by management, as well as evaluating the overall presentation of the financial statements. Our procedures included confirmation of securities owned as of October 31, 2022 by correspondence with the custodian and brokers; when replies were not received from brokers, we performed other auditing procedures. We believe that our audits provide a reasonable basis for our opinion.
/s/ PricewaterhouseCoopers LLP
Boston, Massachusetts
December 14, 2022
We have served as the auditor of one or more investment companies in the Fidelity group of funds since 1932.
The Trustees, Members of the Advisory Board (if any), and officers of the trust and fund, as applicable, are listed below. The Board of Trustees governs the fund and is responsible for protecting the interests of shareholders. The Trustees are experienced executives who meet periodically throughout the year to oversee the fund's activities, review contractual arrangements with companies that provide services to the fund, oversee management of the risks associated with such activities and contractual arrangements, and review the fund's performance. Each of the Trustees oversees 316 funds.
The Trustees hold office without limit in time except that (a) any Trustee may resign; (b) any Trustee may be removed by written instrument, signed by at least two-thirds of the number of Trustees prior to such removal; (c) any Trustee who requests to be retired or who has become incapacitated by illness or injury may be retired by written instrument signed by a majority of the other Trustees; and (d) any Trustee may be removed at any special meeting of shareholders by a two-thirds vote of the outstanding voting securities of the trust. Each Trustee who is not an interested person (as defined in the 1940 Act) of the trust and the fund is referred to herein as an Independent Trustee. Each Independent Trustee shall retire not later than the last day of the calendar year in which his or her 75th birthday occurs. The Independent Trustees may waive this mandatory retirement age policy with respect to individual Trustees. Officers and Advisory Board Members hold office without limit in time, except that any officer or Advisory Board Member may resign or may be removed by a vote of a majority of the Trustees at any regular meeting or any special meeting of the Trustees. Except as indicated, each individual has held the office shown or other offices in the same company for the past five years.
The fund's Statement of Additional Information (SAI) includes more information about the Trustees. To request a free copy, call Fidelity at 1-800-544-8544.
Experience, Skills, Attributes, and Qualifications of the Trustees. The Governance and Nominating Committee has adopted a statement of policy that describes the experience, qualifications, attributes, and skills that are necessary and desirable for potential Independent Trustee candidates (Statement of Policy). The Board believes that each Trustee satisfied at the time he or she was initially elected or appointed a Trustee, and continues to satisfy, the standards contemplated by the Statement of Policy. The Governance and Nominating Committee also engages professional search firms to help identify potential Independent Trustee candidates who have the experience, qualifications, attributes, and skills consistent with the Statement of Policy. From time to time, additional criteria based on the composition and skills of the current Independent Trustees, as well as experience or skills that may be appropriate in light of future changes to board composition, business conditions, and regulatory or other developments, have also been considered by the professional search firms and the Governance and Nominating Committee. In addition, the Board takes into account the Trustees' commitment and participation in Board and committee meetings, as well as their leadership of standing and ad hoc committees throughout their tenure.
In determining that a particular Trustee was and continues to be qualified to serve as a Trustee, the Board has considered a variety of criteria, none of which, in isolation, was controlling. The Board believes that, collectively, the Trustees have balanced and diverse experience, qualifications, attributes, and skills, which allow the Board to operate effectively in governing the fund and protecting the interests of shareholders. Information about the specific experience, skills, attributes, and qualifications of each Trustee, which in each case led to the Board's conclusion that the Trustee should serve (or continue to serve) as a trustee of the fund, is provided below.
Board Structure and Oversight Function. Robert A. Lawrence is an interested person and currently serves as Chair. The Trustees have determined that an interested Chair is appropriate and benefits shareholders because an interested Chair has a personal and professional stake in the quality and continuity of services provided to the fund. Independent Trustees exercise their informed business judgment to appoint an individual of their choosing to serve as Chair, regardless of whether the Trustee happens to be independent or a member of management. The Independent Trustees have determined that they can act independently and effectively without having an Independent Trustee serve as Chair and that a key structural component for assuring that they are in a position to do so is for the Independent Trustees to constitute a substantial majority for the Board. The Independent Trustees also regularly meet in executive session. David M. Thomas serves as Lead Independent Trustee and as such (i) acts as a liaison between the Independent Trustees and management with respect to matters important to the Independent Trustees and (ii) with management prepares agendas for Board meetings.
Fidelity ® funds are overseen by different Boards of Trustees. The fund's Board oversees Fidelity's high income and certain equity funds, and other Boards oversee Fidelity's investment-grade bond, money market, asset allocation, and other equity funds. The asset allocation funds may invest in Fidelity ® funds overseen by the fund's Board. The use of separate Boards, each with its own committee structure, allows the Trustees of each group of Fidelity ® funds to focus on the unique issues of the funds they oversee, including common research, investment, and operational issues. On occasion, the separate Boards establish joint committees to address issues of overlapping consequences for the Fidelity ® funds overseen by each Board.
The Trustees operate using a system of committees to facilitate the timely and efficient consideration of all matters of importance to the Trustees, the fund, and fund shareholders and to facilitate compliance with legal and regulatory requirements and oversight of the fund's activities and associated risks. The Board, acting through its committees, has charged FMR and its affiliates with (i) identifying events or circumstances the occurrence of which could have demonstrably adverse effects on the fund's business and/or reputation; (ii) implementing processes and controls to lessen the possibility that such events or circumstances occur or to mitigate the effects of such events or circumstances if they do occur; and (iii) creating and maintaining a system designed to evaluate continuously business and market conditions in order to facilitate the identification and implementation processes described in (i) and (ii) above. Because the day-to-day operations and activities of the fund are carried out by or through FMR, its affiliates, and other service providers, the fund's exposure to risks is mitigated but not eliminated by the processes overseen by the Trustees. While each of the Board's committees has responsibility for overseeing different aspects of the fund's activities, oversight is exercised primarily through the Operations, Audit, and Compliance Committees. Appropriate personnel, including but not limited to the fund's Chief Compliance Officer (CCO), FMR's internal auditor, the independent accountants, the fund's Treasurer and portfolio management personnel, make periodic reports to the Board's committees, as appropriate, including an annual review of Fidelity's risk management program for the Fidelity ® funds. The responsibilities of each standing committee, including their oversight responsibilities, are described further under "Standing Committees of the Trustees."
Interested Trustees*:
Correspondence intended for a Trustee who is an interested person may be sent to Fidelity Investments, 245 Summer Street, Boston, Massachusetts 02210.
Name, Year of Birth; Principal Occupations and Other Relevant Experience+
Bettina Doulton (1964)
Year of Election or Appointment: 2020
Trustee
Ms. Doulton also serves as Trustee of other Fidelity ® funds. Prior to her retirement, Ms. Doulton served in a variety of positions at Fidelity Investments, including as a managing director of research (2006-2007), portfolio manager to certain Fidelity ® funds (1993-2005), equity analyst and portfolio assistant (1990-1993), and research assistant (1987-1990). Ms. Doulton currently owns and operates Phi Builders + Architects and Cellardoor Winery. Previously, Ms. Doulton served as a member of the Board of Brown Capital Management, LLC (2014-2018).
Robert A. Lawrence (1952)
Year of Election or Appointment: 2020
Trustee
Chair of the Board of Trustees
Mr. Lawrence also serves as Trustee of other funds. Previously, Mr. Lawrence served as a Trustee and Member of the Advisory Board of certain funds. Prior to his retirement in 2008, Mr. Lawrence served as Vice President of certain Fidelity ® funds (2006-2008), Senior Vice President, Head of High Income Division of Fidelity Management & Research Company (investment adviser firm, 2006-2008), and President of Fidelity Strategic Investments (investment adviser firm, 2002-2005).
* Determined to be an "Interested Trustee" by virtue of, among other things, his or her affiliation with the trust or various entities under common control with FMR.
+ The information includes the Trustee's principal occupation during the last five years and other information relating to the experience, attributes, and skills relevant to the Trustee's qualifications to serve as a Trustee, which led to the conclusion that the Trustee should serve as a Trustee for the fund.
Independent Trustees:
Correspondence intended for an Independent Trustee may be sent to Fidelity Investments, P.O. Box 55235, Boston, Massachusetts 02205-5235.
Name, Year of Birth; Principal Occupations and Other Relevant Experience+
Thomas P. Bostick (1956)
Year of Election or Appointment: 2021
Trustee
Lieutenant General Bostick also serves as Trustee of other Fidelity ® funds. Prior to his retirement, General Bostick (United States Army, Retired) held a variety of positions within the U.S. Army, including Commanding General and Chief of Engineers, U.S. Army Corps of Engineers (2012-2016) and Deputy Chief of Staff and Director of Human Resources, U.S. Army (2009-2012). General Bostick currently serves as a member of the Board and Finance and Governance Committees of CSX Corporation (transportation, 2020-present) and a member of the Board and Corporate Governance and Nominating Committee of Perma-Fix Environmental Services, Inc. (nuclear waste management, 2020-present). General Bostick serves as Chief Executive Officer of Bostick Global Strategies, LLC (consulting, 2016-present) and as a member of the Board of HireVue, Inc. (video interview and assessment, 2020-present). Previously, General Bostick served as a Member of the Advisory Board of certain Fidelity® funds (2021), President, Intrexon Bioengineering (2018-2020) and Chief Operating Officer (2017-2020) and Senior Vice President of the Environment Sector (2016-2017) of Intrexon Corporation (biopharmaceutical company).
Dennis J. Dirks (1948)
Year of Election or Appointment: 2005
Trustee
Mr. Dirks also serves as Trustee of other Fidelity ® funds. Prior to his retirement in May 2003, Mr. Dirks served as Chief Operating Officer and as a member of the Board of The Depository Trust & Clearing Corporation (financial markets infrastructure), President, Chief Operating Officer and a member of the Board of The Depository Trust Company (DTC), President and a member of the Board of the National Securities Clearing Corporation (NSCC), Chief Executive Officer and a member of the Board of the Government Securities Clearing Corporation and Chief Executive Officer and a member of the Board of the Mortgage-Backed Securities Clearing Corporation. Mr. Dirks currently serves as a member of the Finance Committee (2016-present) and Board (2017-present) and is Treasurer (2018-present) of the Asolo Repertory Theatre.
Donald F. Donahue (1950)
Year of Election or Appointment: 2018
Trustee
Mr. Donahue also serves as Trustee of other Fidelity ® funds. Mr. Donahue serves as President and Chief Executive Officer of Miranda Partners, LLC (risk consulting for the financial services industry, 2012-present). Previously, Mr. Donahue served as Chief Executive Officer (2006-2012), Chief Operating Officer (2003-2006) and Managing Director, Customer Marketing and Development (1999-2003) of The Depository Trust & Clearing Corporation (financial markets infrastructure). Mr. Donahue currently serves as a member (2007-present) and Co-Chairman (2016-present) of the Board of United Way of New York and a member of the Board of The Leadership Academy (previously NYC Leadership Academy) (2012-present). Mr. Donahue previously served as a member of the Advisory Board of certain Fidelity® funds (2015-2018).
Vicki L. Fuller (1957)
Year of Election or Appointment: 2020
Trustee
Ms. Fuller also serves as Trustee of other Fidelity ® funds. Previously, Ms. Fuller served as a member of the Advisory Board of certain Fidelity ® funds (2018-2020), Chief Investment Officer of the New York State Common Retirement Fund (2012-2018) and held a variety of positions at AllianceBernstein L.P. (global asset management, 1985-2012), including Managing Director (2006-2012) and Senior Vice President and Senior Portfolio Manager (2001-2006). Ms. Fuller currently serves as a member of the Board, Audit Committee and Nominating and Governance Committee of two Blackstone business development companies (2020-present), as a member of the Board of Treliant, LLC (consulting, 2019-present), as a member of the Advisory Board of Ariel Alternatives, LLC (private equity, 2021-present) and as a member of the Board and Chair of the Audit Committee of Gusto, Inc. (software, 2021-present). In addition, Ms. Fuller currently serves as a member of the Board of Roosevelt University (2019-present) and as a member of the Executive Board of New York University's Stern School of Business. Ms. Fuller previously served as a member of the Board, Audit Committee and Nominating and Governance Committee of The Williams Companies, Inc. (natural gas infrastructure, 2018-2021).
Patricia L. Kampling (1959)
Year of Election or Appointment: 2020
Trustee
Ms. Kampling also serves as Trustee of other Fidelity ® funds. Prior to her retirement, Ms. Kampling served as Chairman of the Board and Chief Executive Officer (2012-2019), President and Chief Operating Officer (2011-2012) and Executive Vice President and Chief Financial Officer (2010-2011) of Alliant Energy Corporation. Ms. Kampling currently serves as a member of the Board, Finance Committee and Governance, Compensation and Nominating Committee of Xcel Energy Inc. (utilities company, 2020-present) and as a member of the Board, Audit, Finance and Risk Committee and Safety, Environmental, Technology and Operations Committee and Chair of the Executive Development and Compensation Committee of American Water Works Company, Inc. (utilities company, 2019-present). In addition, Ms. Kampling currently serves as a member of the Board of the Nature Conservancy, Wisconsin Chapter (2019-present). Previously, Ms. Kampling served as a Member of the Advisory Board of certain Fidelity® funds (2020), a member of the Board, Compensation Committee and Executive Committee and Chair of the Audit Committee of Briggs & Stratton Corporation (manufacturing, 2011-2021), a member of the Board of Interstate Power and Light Company (2012-2019) and Wisconsin Power and Light Company (2012-2019) (each a subsidiary of Alliant Energy Corporation) and as a member of the Board and Workforce Development Committee of the Business Roundtable (2018-2019).
Thomas A. Kennedy (1955)
Year of Election or Appointment: 2021
Trustee
Mr. Kennedy also serves as Trustee of other Fidelity ® funds. Previously, Mr. Kennedy served as a Member of the Advisory Board of certain Fidelity ® funds (2020) and held a variety of positions at Raytheon Company (aerospace and defense, 1983-2020), including Chairman and Chief Executive Officer (2014-2020) and Executive Vice President and Chief Operating Officer (2013-2014). Mr. Kennedy currently serves as Executive Chairman of the Board of Directors of Raytheon Technologies Corporation (aerospace and defense, 2020-present). He is also a member of the Rutgers School of Engineering Industry Advisory Board (2011-present) and a member of the UCLA Engineering Dean's Executive Board (2016-present).
Oscar Munoz (1959)
Year of Election or Appointment: 2021
Trustee
Mr. Munoz also serves as Trustee of other Fidelity ® funds. Prior to his retirement, Mr. Munoz served as Executive Chairman (2020-2021), Chief Executive Officer (2015-2020), President (2015-2016) and a member of the Board (2010-2021) of United Airlines Holdings, Inc. Mr. Munoz currently serves as a member of the Board of CBRE Group, Inc. (commercial real estate, 2020-present), a member of the Board of Univision Communications, Inc. (Hispanic media, 2020-present) and a member of the Advisory Board of Salesforce.com, Inc. (cloud-based software, 2020-present). Previously, Mr. Munoz served as a Member of the Advisory Board of certain Fidelity ® funds (2021).
Garnett A. Smith (1947)
Year of Election or Appointment: 2018
Trustee
Mr. Smith also serves as Trustee of other Fidelity ® funds. Prior to his retirement, Mr. Smith served as Chairman and Chief Executive Officer (1990-1997) and President (1986-1990) of Inbrand Corp. (manufacturer of personal absorbent products). Prior to his employment with Inbrand Corp., he was employed by a retail fabric chain and North Carolina National Bank (now Bank of America). Mr. Smith previously served as a member of the Advisory Board of certain Fidelity ® funds (2012-2013).
David M. Thomas (1949)
Year of Election or Appointment: 2008
Trustee
Lead Independent Trustee
Mr. Thomas also serves as Trustee of other Fidelity ® funds. Previously, Mr. Thomas served as Executive Chairman (2005-2006) and Chairman and Chief Executive Officer (2000-2005) of IMS Health, Inc. (pharmaceutical and healthcare information solutions). Mr. Thomas currently serves as a member of the Board of Fortune Brands Home and Security (home and security products, 2004-present) and as Director (2013-present) and Non-Executive Chairman of the Board (2022-present) of Interpublic Group of Companies, Inc. (marketing communication).
Susan Tomasky (1953)
Year of Election or Appointment: 2020
Trustee
Ms. Tomasky also serves as Trustee of other Fidelity ® funds. Prior to her retirement, Ms. Tomasky served in various executive officer positions at American Electric Power Company, Inc. (1998-2011), including most recently as President of AEP Transmission (2007-2011). Ms. Tomasky currently serves as a member of the Board and Sustainability Committee and as Chair of the Audit Committee of Marathon Petroleum Corporation (2018-present) and as a member of the Board, Executive Committee, Corporate Governance Committee and Organization and Compensation Committee and as Chair of the Audit Committee of Public Service Enterprise Group, Inc. (utilities company, 2012-present) and as a member of the Board of its subsidiary company, Public Service Electric and Gas Co. (2021-present). In addition, Ms. Tomasky currently serves as a member (2009-present) and President (2020-present) of the Board of the Royal Shakespeare Company - America (2009-present), as a member of the Board of the Columbus Association for the Performing Arts (2011-present) and as a member of the Board and Kenyon in the World Committee of Kenyon College (2016-present). Previously, Ms. Tomasky served as a Member of the Advisory Board of certain Fidelity ® funds (2020), as a member of the Board of the Columbus Regional Airport Authority (2007-2020), as a member of the Board (2011-2018) and Lead Independent Director (2015-2018) of Andeavor Corporation (previously Tesoro Corporation) (independent oil refiner and marketer) and as a member of the Board of Summit Midstream Partners LP (energy, 2012-2018).
Michael E. Wiley (1950)
Year of Election or Appointment: 2018
Trustee
Mr. Wiley also serves as Trustee of other Fidelity ® funds. Previously, Mr. Wiley served as a member of the Advisory Board of certain Fidelity ® funds (2018-2020), Chairman, President and CEO of Baker Hughes, Inc. (oilfield services, 2000-2004). Mr. Wiley also previously served as a member of the Board of Andeavor Corporation (independent oil refiner and marketer, 2005-2018), a member of the Board of Andeavor Logistics LP (natural resources logistics, 2015-2018) and a member of the Board of High Point Resources (exploration and production, 2005-2020).
+ The information includes the Trustee's principal occupation during the last five years and other information relating to the experience, attributes, and skills relevant to the Trustee's qualifications to serve as a Trustee, which led to the conclusion that the Trustee should serve as a Trustee for the fund.
Advisory Board Members and Officers:
Correspondence intended for a Member of the Advisory Board (if any) may be sent to Fidelity Investments, P.O. Box 55235, Boston, Massachusetts 02205-5235. Correspondence intended for an officer or Peter S. Lynch may be sent to Fidelity Investments, 245 Summer Street, Boston, Massachusetts 02210. Officers appear below in alphabetical order.
Name, Year of Birth; Principal Occupation
Peter S. Lynch (1944)
Year of Election or Appointment: 2003
Member of the Advisory Board
Mr. Lynch also serves as a Member of the Advisory Board of other Fidelity ® funds. Mr. Lynch is Vice Chairman and a Director of Fidelity Management & Research Company LLC (investment adviser firm). In addition, Mr. Lynch serves as a Trustee of Boston College and as the Chairman of the Inner-City Scholarship Fund. Previously, Mr. Lynch served as Vice Chairman and a Director of FMR Co., Inc. (investment adviser firm) and on the Special Olympics International Board of Directors (1997-2006).
Craig S. Brown (1977)
Year of Election or Appointment: 2022
Deputy Treasurer
Mr. Brown also serves as an officer of other funds. Mr. Brown serves as Assistant Treasurer of FIMM, LLC (2021-present) and is an employee of Fidelity Investments (2013-present). Previously, Mr. Brown served as Assistant Treasurer of certain Fidelity ® funds (2019-2022).
John J. Burke III (1964)
Year of Election or Appointment: 2018
Chief Financial Officer
Mr. Burke also serves as Chief Financial Officer of other funds. Mr. Burke serves as Head of Investment Operations for Fidelity Fund and Investment Operations (2018-present) and is an employee of Fidelity Investments (1998-present). Previously Mr. Burke served as head of Asset Management Investment Operations (2012-2018).
William C. Coffey (1969)
Year of Election or Appointment: 2019
Assistant Secretary
Mr. Coffey also serves as Assistant Secretary of other funds. He is Senior Vice President and Deputy General Counsel of FMR LLC (diversified financial services company, 2010-present), and is an employee of Fidelity Investments. Previously, Mr. Coffey served as Secretary and CLO of certain funds (2018-2019); CLO, Secretary, and Senior Vice President of Fidelity Management & Research Company and FMR Co., Inc. (investment adviser firms, 2018-2019); Secretary of Fidelity SelectCo, LLC and Fidelity Investments Money Management, Inc. (investment adviser firms, 2018-2019); CLO of Fidelity Management & Research (Hong Kong) Limited, FMR Investment Management (UK) Limited, and Fidelity Management & Research (Japan) Limited (investment adviser firms, 2018-2019); and Assistant Secretary of certain funds (2009-2018).
Timothy M. Cohen (1969)
Year of Election or Appointment: 2018
Vice President
Mr. Cohen also serves as Vice President of other funds. Mr. Cohen serves as Co-Head of Equity (2018-present), a Director of Fidelity Management & Research (Japan) Limited (investment adviser firm, 2016-present), and is an employee of Fidelity Investments. Previously, Mr. Cohen served as Executive Vice President of Fidelity SelectCo, LLC (2019), Head of Global Equity Research (2016-2018), Chief Investment Officer - Equity and a Director of Fidelity Management & Research (U.K.) Inc. (investment adviser firm, 2013-2015) and as a Director of Fidelity Management & Research (Hong Kong) Limited (investment adviser firm, 2017).
Jonathan Davis (1968)
Year of Election or Appointment: 2010
Assistant Treasurer
Mr. Davis also serves as an officer of other funds. Mr. Davis serves as Assistant Treasurer of FIMM, LLC (2021-present), FMR Capital, Inc. (2017-present), FD Funds GP LLC (2021-present), FD Funds Holding LLC (2021-present), and FD Funds Management LLC (2021-present); and is an employee of Fidelity Investments. Previously, Mr. Davis served as Vice President and Associate General Counsel of FMR LLC (diversified financial services company, 2003-2010).
Laura M. Del Prato (1964)
Year of Election or Appointment: 2018
Assistant Treasurer
Ms. Del Prato also serves as an officer of other funds. Ms. Del Prato serves as Assistant Treasurer of FIMM, LLC (2021-present) and is an employee of Fidelity Investments (2017-present). Previously, Ms. Del Prato served as President and Treasurer of The North Carolina Capital Management Trust: Cash Portfolio and Term Portfolio (2018-2020). Prior to joining Fidelity Investments, Ms. Del Prato served as a Managing Director and Treasurer of the JPMorgan Mutual Funds (2014-2017). Prior to JPMorgan, Ms. Del Prato served as a partner at Cohen Fund Audit Services (accounting firm, 2012-2013) and KPMG LLP (accounting firm, 2004-2012).
Colm A. Hogan (1973)
Year of Election or Appointment: 2020
Assistant Treasurer
Mr. Hogan also serves as an officer of other funds. Mr. Hogan serves as Assistant Treasurer of FIMM, LLC (2021-present) and FMR Capital, Inc. (2017-present) and is an employee of Fidelity Investments (2005-present). Previously, Mr. Hogan served as Deputy Treasurer of certain Fidelity ® funds (2016-2020) and Assistant Treasurer of certain Fidelity ® funds (2016-2018).
Pamela R. Holding (1964)
Year of Election or Appointment: 2018
Vice President
Ms. Holding also serves as Vice President of other funds. Ms. Holding serves as Co-Head of Equity (2018-present) and is an employee of Fidelity Investments (2013-present). Previously, Ms. Holding served as Executive Vice President of Fidelity SelectCo, LLC (2019) and as Chief Investment Officer of Fidelity Institutional Asset Management (2013-2018).
Cynthia Lo Bessette (1969)
Year of Election or Appointment: 2019
Secretary and Chief Legal Officer (CLO)
Ms. Lo Bessette also serves as an officer of other funds. Ms. Lo Bessette serves as CLO, Secretary, and Senior Vice President of Fidelity Management & Research Company LLC (investment adviser firm, 2019-present); CLO of Fidelity Management & Research (Hong Kong) Limited, FMR Investment Management (UK) Limited, and Fidelity Management & Research (Japan) Limited (investment adviser firms, 2019-present); Secretary of FD Funds GP LLC (2021-present), FD Funds Holding LLC (2021-present), FD Funds Management LLC (2021-present), and Fidelity Diversifying Solutions LLC (investment adviser firm, 2022-present); and Assistant Secretary of FIMM, LLC (2019-present). She is a Senior Vice President and Deputy General Counsel of FMR LLC (diversified financial services company, 2019-present), and is an employee of Fidelity Investments. Previously, Ms. Lo Bessette served as CLO, Secretary, and Senior Vice President of FMR Co., Inc. (investment adviser firm, 2019); Secretary of Fidelity SelectCo, LLC and Fidelity Investments Money Management, Inc. (investment adviser firms, 2019). Prior to joining Fidelity Investments, Ms. Lo Bessette was Executive Vice President, General Counsel (2016-2019) and Senior Vice President, Deputy General Counsel (2015-2016) of OppenheimerFunds (investment management company) and Deputy Chief Legal Officer (2013-2015) of Jennison Associates LLC (investment adviser firm).
Chris Maher (1972)
Year of Election or Appointment: 2020
Deputy Treasurer
Mr. Maher also serves as an officer of other funds. Mr. Maher serves as Assistant Treasurer of FIMM, LLC (2021-present) and FMR Capital, Inc. (2017-present), and is an employee of Fidelity Investments (2008-present). Previously, Mr. Maher served as Assistant Treasurer of certain funds (2013-2020); Vice President of Asset Management Compliance (2013), Vice President of the Program Management Group of FMR (investment adviser firm, 2010-2013), and Vice President of Valuation Oversight (2008-2010).
Jason P. Pogorelec (1975)
Year of Election or Appointment: 2020
Chief Compliance Officer
Mr. Pogorelec also serves as Chief Compliance Officer of other funds. Mr. Pogorelec is a senior Vice President of Asset Management Compliance for Fidelity Investments and is an employee of Fidelity Investments (2006-present). Previously, Mr. Pogorelec served as Vice President, Associate General Counsel for Fidelity Investments (2010-2020) and Assistant Secretary of certain Fidelity funds (2015-2020).
Brett Segaloff (1972)
Year of Election or Appointment: 2021
Anti-Money Laundering (AML) Officer
Mr. Segaloff also serves as an AML Officer of other funds and other related entities. He is Director, Anti-Money Laundering (2007-present) of FMR LLC (diversified financial services company) and is an employee of Fidelity Investments (1996-present).
Stacie M. Smith (1974)
Year of Election or Appointment: 2016
President and Treasurer
Ms. Smith also serves as an officer of other funds. Ms. Smith serves as Assistant Treasurer of FIMM, LLC (2021-present) and FMR Capital, Inc. (2017-present), is an employee of Fidelity Investments (2009-present), and has served in other fund officer roles. Prior to joining Fidelity Investments, Ms. Smith served as Senior Audit Manager of Ernst & Young LLP (accounting firm, 1996-2009). Previously, Ms. Smith served as Assistant Treasurer (2013-2019) and Deputy Treasurer (2013-2016) of certain Fidelity ® funds.
Jim Wegmann (1979)
Year of Election or Appointment: 2019
Assistant Treasurer
Mr. Wegmann also serves as an officer of other funds. Mr. Wegmann serves as Assistant Treasurer of FIMM, LLC (2021-present) and is an employee of Fidelity Investments (2011-present). Previously, Mr. Wegmann served as Assistant Treasurer of certain Fidelity ® funds (2019-2021).
As a shareholder, you incur two types of costs: (1) transaction costs, which may include sales charges (loads) on purchase payments or redemption proceeds, as applicable and (2) ongoing costs, which generally include management fees, distribution and/or service (12b-1) fees and other Fund expenses. This Example is intended to help you understand your ongoing costs (in dollars) of investing in a fund and to compare these costs with the ongoing costs of investing in other mutual funds.
| The Example is based on an investment of $1,000 invested at the beginning of the period and held for the entire period (May 1, 2022 to October 31, 2022). |
Actual Expenses
The first line of the accompanying table provides information about actual account values and actual expenses. You may use the information in this line, together with the amount you invested, to estimate the expenses that you paid over the period. Simply divide your account value by $1,000.00 (for example, an $8,600 account value divided by $1,000.00 = 8.6), then multiply the result by the number in the first line for a class/Fund under the heading entitled "Expenses Paid During Period" to estimate the expenses you paid on your account during this period. If any fund is a shareholder of any underlying mutual funds or exchange-traded funds (ETFs) (the Underlying Funds), such fund indirectly bears its proportional share of the expenses of the Underlying Funds in addition to the direct expenses incurred presented in the table. These fees and expenses are not included in the annualized expense ratio used to calculate the expense estimate in the table below.
Hypothetical Example for Comparison Purposes
The second line of the accompanying table provides information about hypothetical account values and hypothetical expenses based on the actual expense ratio and an assumed rate of return of 5% per year before expenses, which is not the actual return. The hypothetical account values and expenses may not be used to estimate the actual ending account balance or expenses you paid for the period. You may use this information to compare the ongoing costs of investing in the Fund and other funds. To do so, compare this 5% hypothetical example with the 5% hypothetical examples that appear in the shareholder reports of the other funds. If any fund is a shareholder of any Underlying Funds, such fund indirectly bears its proportional share of the expenses of the Underlying Funds in addition to the direct expenses as presented in the table. These fees and expenses are not included in the annualized expense ratio used to calculate the expense estimate in the table below.
Please note that the expenses shown in the table are meant to highlight your ongoing costs only and do not reflect any transaction costs. Therefore, the second line of the table is useful in comparing ongoing costs only, and will not help you determine the relative total costs of owning different funds. In addition, if these transactional costs were included, your costs would have been higher.
| | | | | Annualized Expense Ratio- A | | Beginning Account Value May 1, 2022 | | Ending Account Value October 31, 2022 | | Expenses Paid During Period- C May 1, 2022 to October 31, 2022 |
| | | | | | | | | | |
| Fidelity® Focused Stock Fund | | | | .75% | | | | | | |
| Actual | | | | | | $ 1,000 | | $ 913.00 | | $ 3.62 |
Hypothetical- B | | | | | | $ 1,000 | | $ 1,021.42 | | $ 3.82 |
| |
A Annualized expense ratio reflects expenses net of applicable fee waivers.
B 5% return per year before expenses
C Expenses are equal to the annualized expense ratio, multiplied by the average account value over the period, multiplied by 184/ 365 (to reflect the one-half year period). The fees and expenses of any Underlying Funds are not included in each annualized expense ratio.
The dividend and capital gains distributions for the fund(s) are available on Fidelity.com or Institutional.Fidelity.com .
The fund hereby designates as a capital gain dividend with respect to the taxable year ended October 31, 2021, $360,521,804, or, if subsequently determined to be different, the net capital gain of such year.
The fund hereby designates as a capital gain dividend with respect to the taxable year ended October 31, 2022, $235,204,272, or, if subsequently determined to be different, the net capital gain of such year.
The fund designates 100% of the short-term capital gain dividend distributed during the fiscal year as qualifying to be taxed as short-term capital gain dividends for nonresident alien shareholders.
The fund designates 16% of the dividend distributed during the fiscal year as qualifying for the dividends-received deduction for corporate shareholders.
The fund designates 17% of the dividend distributed during the fiscal year as amounts which may be taken into account as a dividend for the purposes of the maximum rate under section 1(h)(11) of the Internal Revenue Code.
The fund designates 1% of the dividend distributed during the fiscal year as a section 199A dividend.
The fund will notify shareholders in January 2023 of amounts for use in preparing 2022 income tax returns.
Fidelity Focused Stock Fund
Each year, the Board of Trustees, including the Independent Trustees (together, the Board), votes on the renewal of the management contract with Fidelity Management & Research Company LLC (FMR) and the sub-advisory agreements (together, the Advisory Contracts) for the fund. FMR and the sub-advisers are referred to herein as the Investment Advisers. The Board, assisted by the advice of fund counsel and Independent Trustees' counsel, requests and considers a broad range of information relevant to the renewal of the Advisory Contracts throughout the year.
The Board meets regularly and, at each of its meetings, covers an extensive agenda of topics and materials and considers factors that are relevant to its annual consideration of the renewal of the fund's Advisory Contracts, including the services and support provided to the fund and its shareholders. The Board has established various standing committees (Committees), each composed of and chaired by Independent Trustees with varying backgrounds, to which the Board has assigned specific subject matter responsibilities in order to enhance effective decision-making by the Board. The Board, acting directly and through its Committees, requests and receives information concerning the annual consideration of the renewal of the fund's Advisory Contracts. The Board also meets as needed to review matters specifically related to the Board's annual consideration of the renewal of the Advisory Contracts. Members of the Board may also meet with trustees of other Fidelity funds through joint ad hoc committees to discuss certain matters relevant to all of the Fidelity funds.
At its May 2022 meeting, the Board unanimously determined to renew the fund's Advisory Contracts. In reaching its determination, the Board considered all factors it believed relevant, including (i) the nature, extent, and quality of the services provided to the fund and its shareholders (including the investment performance of the fund); (ii) the competitiveness relative to peer funds of the fund's management fee and total expense ratio; (iii) the total costs of the services provided by and the profits realized by Fidelity from its relationships with the fund; and (iv) the extent to which, if any, economies of scale exist and are realized as the fund grows, and whether any economies of scale are appropriately shared with fund shareholders.
In considering whether to renew the Advisory Contracts for the fund, the Board reached a determination, with the assistance of fund counsel and Independent Trustees' counsel and through the exercise of its business judgment, that the renewal of the Advisory Contracts was in the best interests of the fund and its shareholders and that the compensation payable under the Advisory Contracts was fair and reasonable. The Board's decision to renew the Advisory Contracts was not based on any single factor, but rather was based on a comprehensive consideration of all the information provided to the Board at its meetings throughout the year. The Board, in reaching its determination to renew the Advisory Contracts, was aware that shareholders of the fund have a broad range of investment choices available to them, including a wide choice among funds offered by Fidelity's competitors, and that the fund's shareholders, who have the opportunity to review and weigh the disclosure provided by the fund in its prospectus and other public disclosures, have chosen to invest in this fund, which is part of the Fidelity family of funds.
Nature, Extent, and Quality of Services Provided . The Board considered Fidelity's staffing as it relates to the fund, including the backgrounds of investment personnel of Fidelity, and also considered the fund's investment objective, strategies, and related investment philosophy. The Independent Trustees also had discussions with senior management of Fidelity's investment operations and investment groups. The Board considered the structure of the investment personnel compensation program and whether this structure provides appropriate incentives to act in the best interests of the fund. Additionally, the Board considered the portfolio managers' investments, if any, in the funds that they manage. The Board also considered the steps Fidelity had taken to ensure the continued provision of high quality services to the Fidelity funds during the COVID-19 pandemic, including the expansion of staff in client facing positions to maintain service levels in periods of high volumes and volatility.
Resources Dedicated to Investment Management and Support Services . The Board and the Fund Oversight and Research Committees reviewed the general qualifications and capabilities of Fidelity's investment staff, including its size, education, experience, and resources, as well as Fidelity's approach to recruiting, training, managing, and compensating investment personnel. The Board noted the resources devoted to expansion of Fidelity's global investment organization, and that Fidelity's analysts have extensive resources, tools, and capabilities that allow them to conduct sophisticated quantitative and fundamental analysis, as well as credit analysis of issuers, counterparties, and guarantors. Further, the Board considered that Fidelity's investment professionals have sufficient access to global information and data so as to provide competitive investment results over time, and that those professionals also have access to sophisticated tools that permit them to assess portfolio construction and risk and performance attribution characteristics continuously, as well as to transmit new information and research conclusions rapidly around the world. Additionally, in its deliberations, the Board considered Fidelity's trading, risk management, compliance, and technology and operations capabilities and resources, which are integral parts of the investment management process.
Shareholder and Administrative Services . The Board considered (i) the nature, extent, quality, and cost of advisory, administrative, and shareholder services performed by the Investment Advisers and their affiliates under the Advisory Contracts and under separate agreements covering transfer agency, pricing and bookkeeping, and securities lending services for the fund; (ii) the nature and extent of the supervision of third party service providers, principally custodians, subcustodians, and pricing vendors; and (iii) the resources devoted to, and the record of compliance with, the fund's compliance policies and procedures. The Board also reviewed the allocation of fund brokerage, including allocations to brokers affiliated with the Investment Advisers, the use of brokerage commissions to pay fund expenses, and the use of "soft" commission dollars to pay for research services.
The Board noted that the growth of fund assets over time across the complex allows Fidelity to reinvest in the development of services designed to enhance the value and convenience of the Fidelity funds as investment vehicles. These services include 24-hour access to account information and market information over the Internet and through telephone representatives, investor education materials, and asset allocation tools. The Board also considered that it reviews customer service metrics such as telephone response times, continuity of services on the website and metrics addressing services at Fidelity Investor Centers.
Investment in a Large Fund Family . The Board considered the benefits to shareholders of investing in a Fidelity fund, including the benefits of investing in a fund that is part of a large family of funds offering a variety of investment disciplines and providing a large variety of mutual fund investor services. The Board noted that Fidelity had taken, or had made recommendations that resulted in the Fidelity funds taking, a number of actions over the previous year that benefited particular funds, including: (i) continuing to dedicate additional resources to Fidelity's investment research process, which includes meetings with management of issuers of securities in which the funds invest; (ii) continuing efforts to enhance Fidelity's global research capabilities; (iii) launching new funds and ETFs with innovative structures, strategies and pricing and making other enhancements to meet client needs; (iv) launching new share classes of existing funds; (v) eliminating purchase minimums and broadening eligibility requirements for certain funds and share classes; (vi) reducing management fees and total expenses for certain target date funds and classes and index funds; (vii) lowering expenses for certain existing funds and classes by implementing or lowering expense caps; (viii) rationalizing product lines and gaining increased efficiencies from fund mergers and liquidations; (ix) continuing to develop, acquire and implement systems and technology to improve services to the funds and shareholders, strengthen information security, and increase efficiency; and (x) continuing to implement enhancements to further strengthen Fidelity's product line to increase investors' probability of success in achieving their investment goals, including retirement income goals.
Investment Performance . The Board considered whether the fund has operated in accordance with its investment objective, as well as its record of compliance with its investment restrictions and its performance history.
The Board took into account discussions that occur at Board meetings throughout the year with representatives of the Investment Advisers about fund investment performance. In this regard the Board noted that as part of regularly scheduled fund reviews and other reports to the Board on fund performance, the Board considers annualized return information for the fund for different time periods, measured against an appropriate securities market index (benchmark index) and an appropriate peer group of funds with similar objectives (peer group). The Board also reviews and considers information about performance attribution. In its evaluation of fund investment performance, the Board gave particular attention to information indicating changes in performance of certain Fidelity funds for specific time periods and discussed with the Investment Advisers the reasons for any overperformance or underperformance.
In addition to reviewing absolute and relative fund performance, the Independent Trustees periodically consider the appropriateness of fund performance metrics in evaluating the results achieved. In general, the Independent Trustees believe that fund performance should be evaluated based on net performance (after fees and expenses) of the fund compared to appropriate benchmark indices, over appropriate time periods that may include full market cycles, and compared to peer groups, as applicable, over the same periods, taking into account relevant factors including the following: general market conditions; issuer-specific information; and fund cash flows and other factors.
The Independent Trustees recognize that shareholders evaluate performance on a net basis over their own holding periods, for which one-, three-, and five-year periods are often used as a proxy. For this reason, the performance information reviewed by the Board also included net cumulative total return information for the fund and an appropriate benchmark index and peer group for the most recent one-, three-, and five-year periods ended September 30, 2021, as shown below. Returns are shown compared to the 25th percentile (top of box, 75% beaten) and 75th percentile (bottom of box, 25% beaten) of the peer universe.
Fidelity Focused Stock Fund
The Board also considered that the fund's management fee is subject to upward or downward adjustment depending upon whether, and to what extent, the fund's investment performance for the performance period (a rolling 36-month period) exceeds, or is exceeded by, a securities index, thus leading to a performance adjustment for the same period. The Board noted that the performance adjustment provides FMR with a strong economic incentive to seek to achieve superior long-term performance for the fund's shareholders and helps to more closely align the interests of FMR and the shareholders of the fund
Based on its review, the Board concluded that the nature, extent, and quality of services provided to the fund under the Advisory Contracts should continue to benefit the shareholders of the fund.
Competitiveness of Management Fee and Total Expense Ratio. The Board considered the fund's management fee and total expense ratio compared to "mapped groups" of competitive funds and classes created for the purpose of facilitating the Trustees' competitive analysis of management fees and total expenses. Fidelity creates "mapped groups" by combining similar Lipper investment objective categories that have comparable investment mandates. Combining Lipper investment objective categories aids the Board's management fee and total expense ratio comparisons by broadening the competitive group used for comparison.
Management Fee . The Board considered two proprietary management fee comparisons for the 12-month periods ended September 30 (June 30 for periods ended 2019 and 2018 and December 31 for periods prior to 2018) shown in basis points (BP) in the chart below. The group of Lipper funds used by the Board for management fee comparisons is referred to below as the "Total Mapped Group." The Total Mapped Group comparison focuses on a fund's standing in terms of gross management fees before expense reimbursements or caps, and without giving effect to the fund's performance adjustment, relative to the total universe of funds with comparable investment mandates, regardless of whether their management fee structures also are comparable. Funds with comparable investment mandates offer exposure to similar types of securities. Funds with comparable management fee structures have similar management fee contractual arrangements (e.g., flat rate charged for advisory services, all-inclusive fee rate, etc.). "TMG %" represents the percentage of funds in the Total Mapped Group that had management fees that were lower than the fund's. For example, a hypothetical TMG % of 20% would mean that 80% of the funds in the Total Mapped Group had higher, and 20% had lower, management fees than the fund. The fund's actual TMG %s and the number of funds in the Total Mapped Group are in the chart below. The "Asset-Sized Peer Group" (ASPG) comparison focuses on a fund's standing relative to a subset of non-Fidelity funds within the Total Mapped Group that are similar in size and management fee structure without taking into account performance adjustments, if any. For example, if a fund is in the first quartile of the ASPG, the fund's management fee ranks in the least expensive or lowest 25% of funds in the ASPG. The ASPG represents at least 15% of the funds in the Total Mapped Group with comparable asset size and management fee structures, subject to a minimum of 50 funds (or all funds in the Total Mapped Group if fewer than 50). Additional information, such as the ASPG quartile in which the fund's management fee rate ranked and the impact of the fund's performance adjustment, is also included in the chart and was considered by the Board.
Fidelity Focused Stock Fund
The Board noted that the fund's management fee rate ranked below the median of its Total Mapped Group and below the median of its ASPG for the 12-month period ended September 30, 2021. The Board also noted the effect of the fund's performance adjustment, if any, on the fund's management fee ranking.
The Board also considered that, for funds subject to the group fee, FMR agreed to voluntarily waive fees over a specified period of time in amounts designed to account for assets converted from certain funds to certain collective investment trusts.
Based on its review, the Board concluded that the fund's management fee is fair and reasonable in light of the services that the fund receives and the other factors considered.
Total Expense Ratio . In its review of the fund's total expense ratio, the Board considered the fund's management fee rate as well as other fund expenses, such as transfer agent fees, pricing and bookkeeping fees, and custodial, legal, and audit fees. The Board noted the impact of the fund's performance adjustment. The Board also noted that Fidelity may agree to waive fees or reimburse expenses from time to time, and the extent to which, if any, it has done so for the fund. The fund is compared to those funds and classes in the Total Mapped Group (used by the Board for management fee comparisons) that have a similar sales load structure. The Board also considered a total expense ASPG comparison for the fund, which focuses on the total expenses of the fund relative to a subset of non-Fidelity funds within the total expense similar sales load structure group. The total expense ASPG is limited to 15 larger and 15 smaller classes in fund average assets for a total of 30 classes, where possible. The total expense ASPG comparison excludes performance adjustments and fund-paid 12b-1 fees to eliminate variability in fee structures.
The Board noted that the fund's total net expense ratio ranked below the similar sales load structure group competitive median and below the ASPG competitive median for the 12-month period ended September 30, 2021.
Fees Charged to Other Fidelity Clients. The Board also considered Fidelity fee structures and other information with respect to clients of Fidelity, such as other funds advised or subadvised by Fidelity, pension plan clients, and other institutional clients with similar mandates. The Board noted that a joint ad hoc committee created by it and the boards of other Fidelity funds periodically reviews and compares Fidelity's institutional investment advisory business with its business of providing services to the Fidelity funds and also noted the most recent findings of the committee. The Board noted that the committee's review included a consideration of the differences in services provided, fees charged, and costs incurred, as well as competition in the markets serving the different categories of clients.
Based on its review of total expense ratios and fees charged to other Fidelity clients, the Board concluded that the fund's total expense ratio was reasonable in light of the services that the fund and its shareholders receive and the other factors considered.
Costs of the Services and Profitability . The Board considered the revenues earned and the expenses incurred by Fidelity in conducting the business of developing, marketing, distributing, managing, administering and servicing the fund and servicing the fund's shareholders. The Board also considered the level of Fidelity's profits in respect of all the Fidelity funds.
On an annual basis, Fidelity presents to the Board information about the profitability of its relationships with the fund. Fidelity calculates profitability information for each fund, as well as aggregate profitability information for groups of Fidelity funds and all Fidelity funds, using a series of detailed revenue and cost allocation methodologies which originate with the books and records of Fidelity on which Fidelity's audited financial statements are based. The Audit Committee of the Board reviews any significant changes from the prior year's methodologies and the full Board approves such changes.
A public accounting firm has been engaged annually by the Board as part of the Board's assessment of Fidelity's profitability analysis. The engagement includes the review and assessment of the methodologies used by Fidelity in determining the revenues and expenses attributable to Fidelity's mutual fund business, and completion of agreed-upon procedures in respect of the mathematical accuracy of certain fund profitability information and its conformity to established allocation methodologies. After considering the reports issued under the engagement and information provided by Fidelity, the Board concluded that while other allocation methods may also be reasonable, Fidelity's profitability methodologies are reasonable in all material respects.
The Board also reviewed Fidelity's non-fund businesses and potential indirect benefits such businesses may have received as a result of their association with Fidelity's mutual fund business (i.e., fall-out benefits) as well as cases where Fidelity's affiliates may benefit from the funds' business. The Board considered areas where potential indirect benefits to the Fidelity funds from their relationships with Fidelity may exist. The Board's consideration of these matters was informed by the findings of a joint ad hoc committee created by it and the boards of other Fidelity funds to evaluate potential fall-out benefits.
The Board considered the costs of the services provided by and the profits realized by Fidelity in connection with the operation of the fund and was satisfied that the profitability was not excessive.
Economies of Scale . The Board considered whether there have been economies of scale in respect of the management of the Fidelity funds, whether the Fidelity funds (including the fund) have appropriately benefited from any such economies of scale, and whether there is potential for realization of any further economies of scale. The Board considered the extent to which the fund will benefit from economies of scale as assets grow through increased services to the fund, through waivers or reimbursements, or through fee or expense ratio reductions. The Board also noted that a committee (the Economies of Scale Committee) created by it and the boards of other Fidelity funds periodically analyzes whether Fidelity attains economies of scale in respect of the management and servicing of the Fidelity funds, whether the Fidelity funds have appropriately benefited from such economies of scale, and whether there is potential for realization of any further economies of scale.
The Board recognized that the fund's management contract incorporates a "group fee" structure, which provides for lower group fee rates as total "group assets" increase, and for higher group fee rates as total "group assets" decrease ("group assets" as defined in the management contract). FMR calculates the group fee rates based on a tiered asset "breakpoint" schedule that varies based on asset class. The Board considered that the group fee is designed to deliver the benefits of economies of scale to fund shareholders when total Fidelity fund assets increase, even if assets of any particular fund are unchanged or have declined, because some portion of Fidelity's costs are attributable to services provided to all Fidelity funds, and all funds benefit if those costs can be allocated among more assets. The Board further considered that Fidelity agreed to impose a temporary fee waiver in the form of additional breakpoints to the current breakpoint schedule. The Board concluded that, given the group fee structure, fund shareholders will benefit from lower management fees as "group assets" increase at the fund complex level, regardless of whether Fidelity achieves any such economies of scale.
The Board concluded, taking into account the analysis of the Economies of Scale Committee, that economies of scale, if any, are being appropriately shared between fund shareholders and Fidelity.
Additional Information Requested by the Board . In order to develop fully the factual basis for consideration of the Fidelity funds' advisory contracts, the Board requested and received additional information on certain topics, including: (i) fund flow and performance trends, in particular the underperformance of certain funds and strategies, and Fidelity's long-term strategies for certain funds, including any consideration of fund liquidations or mergers; (ii) the operation of performance fees, competitor use of performance fees, and consideration of the expansion of performance fees to additional funds; (iii) Fidelity's pricing philosophy compared to competitors; (iv) fund profitability methodology and data; (v) evaluation of competitive fund data and peer group classifications and fee and expense comparisons; (vi) the management fee and expense structures for different funds and classes and information about the differences between various fee and expense structures; (vii) group fee breakpoints and related voluntary fee waivers; and (viii) information regarding other accounts managed by Fidelity and the funds' sub-advisory arrangements.
Based on its evaluation of all of the conclusions noted above, and after considering all factors it believed relevant, the Board concluded that the advisory fee arrangements are fair and reasonable and that the fund's Advisory Contracts should be renewed.
1.538682.125
TQG-ANN-1222
Fidelity® Disciplined Equity Fund
Annual Report
October 31, 2022
Contents
To view a fund's proxy voting guidelines and proxy voting record for the 12-month period ended June 30, visit http://www.fidelity.com/proxyvotingresults or visit the Securities and Exchange Commission's (SEC) web site at http://www.sec.gov.
You may also call 1-800-544-8544 if you're an individual investing directly with Fidelity, call 1-800-835-5092 if you're a plan sponsor or participant with Fidelity as your recordkeeper or call 1-877-208-0098 on institutional accounts or if you're an advisor or invest through one to request a free copy of the proxy voting guidelines.
Standard & Poor's, S&P and S&P 500 are registered service marks of The McGraw-Hill Companies, Inc. and have been licensed for use by Fidelity Distributors Corporation.
Other third-party marks appearing herein are the property of their respective owners.
All other marks appearing herein are registered or unregistered trademarks or service marks of FMR LLC or an affiliated company. © 2022 FMR LLC. All rights reserved.
This report and the financial statements contained herein are submitted for the general information of the shareholders of the Fund. This report is not authorized for distribution to prospective investors in the Fund unless preceded or accompanied by an effective prospectus.
A fund files its complete schedule of portfolio holdings with the SEC for the first and third quarters of each fiscal year on Form N-PORT. Forms N-PORT are available on the SEC's web site at http://www.sec.gov. A fund's Forms N-PORT may be reviewed and copied at the SEC's Public Reference Room in Washington, DC. Information regarding the operation of the SEC's Public Reference Room may be obtained by calling 1-800-SEC-0330.
For a complete list of a fund's portfolio holdings, view the most recent holdings listing, semiannual report, or annual report on Fidelity's web site at http://www.fidelity.com, http://www.institutional.fidelity.com, or http://www.401k.com, as applicable.
NOT FDIC INSURED •MAY LOSE VALUE •NO BANK GUARANTEE
Neither the Fund nor Fidelity Distributors Corporation is a bank.
Average annual total return reflects the change in the value of an investment, assuming reinvestment of distributions from dividend income and capital gains (the profits earned upon the sale of securities that have grown in value, if any) and assuming a constant rate of performance each year. The hypothetical investment and the average annual total returns do not reflect the deduction of taxes that a shareholder would pay on fund distributions or the redemption of fund shares. During periods of reimbursement by Fidelity, a fund's total return will be greater than it would be had the reimbursement not occurred. How a fund did yesterday is no guarantee of how it will do tomorrow.
| Average Annual Total Returns |
| | | | |
Periods ended October 31, 2022 | Past 1 year | Past 5 years | Past 10 years |
| Fidelity® Disciplined Equity Fund | -25.71% | 8.28% | 11.22% |
| Class K | -25.65% | 8.38% | 11.33% |
| $10,000 Over 10 Years |
| |
Let's say hypothetically that $10,000 was invested in Fidelity® Disciplined Equity Fund, a class of the fund, on October 31, 2012. The chart shows how the value of your investment would have changed, and also shows how the S&P 500® Index performed over the same period. |
|
|
Market Recap:
U.S. equities returned -14.61% for the 12 months ending October 31, 2022, according to the S&P 500® index, as a multitude of risk factors challenged the global economy and financial markets. Persistently high inflation prompted the Federal Reserve to aggressively tighten monetary policy, and market interest rates eclipsed their highest level in roughly a decade, stoking recession fears and sending stocks into bear market territory. In late 2021, the Fed shifted to a more "hawkish" (restrictive) policy stance and proceeded to hike its benchmark rate five times, by a total of 3%, between March and September - the fastest-ever pace of monetary tightening - while taking substantive steps to shrink its massive asset portfolio. Against this hostile backdrop for risk assets, the S&P 500® posted its worst year-to-date result (-23.87%) in 20 years through September, a seasonally weak month for stocks that stayed true to form, and then some, with volatility spiking due to growing certainty the Fed would persist in its effort to cool inflation, even at the expense of economic growth. Three of the index's worst monthly returns ever were recorded this period, with the S&P 500® shedding 8% to 9% in April, June and September. Gains of similar proportion were made in July and October, amid optimism on inflation and policy easing. For the full 12 months, the growth-oriented communication services (-41%) and consumer discretionary (-29%) sectors lagged most. In sharp contrast, energy (+65%) had a strong run, followed by consumer staples (+5%).
Comments from Portfolio Manager Kwasi Dadzie-Yeboah:
For the fiscal year ending October 31, 2022, the fund's share classes returned roughly -26%, considerably trailing the -14.61% result of the benchmark S&P 500® index. Versus the benchmark, security selection was the primary detractor this period, especially within the health care sector where picks among pharmaceuticals, biotechnology & life sciences stocks were a notable headwind. Subpar investment choices in information technology and communication services also hurt. Not owning Exxon Mobil, a benchmark component that gained about 80%, was the biggest individual relative detractor. Also pressuring performance was an outsized stake in Generac Holdings, which returned roughly -76%, although we decreased our position the past 12 months. Avoiding Chevron, a benchmark component that gained approximately 64%, also hindered the portfolio's relative return. In contrast, the largest contributor to performance versus the benchmark was an underweighting in communication services. Security selection in energy added value as well. The portfolio's largest individual relative contributor was an overweighting in Devon Energy, which gained 107% the past year. Also bolstering performance was an underweighting in Tesla - a position we established the past 12 months - which returned roughly -11%. Further bolstering performance was an outsized stake in UnitedHealth Group (+22%), which was one of our largest holdings on October 31. Notable changes in positioning include a lower allocation to the communication services and consumer discretionary sectors.
The views expressed above reflect those of the portfolio manager(s) only through the end of the period as stated on the cover of this report and do not necessarily represent the views of Fidelity or any other person in the Fidelity organization. Any such views are subject to change at any time based upon market or other conditions and Fidelity disclaims any responsibility to update such views. These views may not be relied on as investment advice and, because investment decisions for a Fidelity fund are based on numerous factors, may not be relied on as an indication of trading intent on behalf of any Fidelity fund.
Top Holdings (% of Fund's net assets) |
| |
| Microsoft Corp. | 7.3 | |
| Apple, Inc. | 6.9 | |
| UnitedHealth Group, Inc. | 3.5 | |
| Amazon.com, Inc. | 3.4 | |
| Visa, Inc. Class A | 2.5 | |
| Alphabet, Inc. Class A | 2.2 | |
| MasterCard, Inc. Class A | 2.1 | |
| Danaher Corp. | 1.9 | |
| Alphabet, Inc. Class C | 1.6 | |
| JPMorgan Chase & Co. | 1.5 | |
| | 32.9 | |
| |
| Market Sectors (% of Fund's net assets) |
| |
| Information Technology | 36.5 | |
| Health Care | 15.0 | |
| Consumer Discretionary | 9.8 | |
| Industrials | 8.3 | |
| Financials | 7.1 | |
| Energy | 6.9 | |
| Communication Services | 5.6 | |
| Consumer Staples | 5.0 | |
| Materials | 1.6 | |
| Real Estate | 1.4 | |
| Utilities | 0.8 | |
| |
Asset Allocation (% of Fund's net assets) |
|
Foreign investments - 2% |
|
Showing Percentage of Net Assets
| Common Stocks - 98.0% |
| | | Shares | Value ($) (000s) |
| COMMUNICATION SERVICES - 5.6% | | | |
| Entertainment - 1.3% | | | |
| Live Nation Entertainment, Inc. (a) | | 33,800 | 2,691 |
| Netflix, Inc. (a) | | 55,334 | 16,151 |
| | | | 18,842 |
| Interactive Media & Services - 4.3% | | | |
| Alphabet, Inc.: | | | |
| Class A (a) | | 346,100 | 32,710 |
| Class C (a) | | 258,600 | 24,479 |
| Meta Platforms, Inc. Class A (a) | | 75,877 | 7,069 |
| | | | 64,258 |
TOTAL COMMUNICATION SERVICES | | | 83,100 |
| CONSUMER DISCRETIONARY - 9.8% | | | |
| Automobiles - 0.5% | | | |
| Tesla, Inc. (a) | | 29,000 | 6,599 |
| Distributors - 0.2% | | | |
| Pool Corp. | | 9,200 | 2,799 |
| Hotels, Restaurants & Leisure - 1.6% | | | |
| Domino's Pizza, Inc. | | 18,700 | 6,213 |
| Hilton Worldwide Holdings, Inc. | | 59,866 | 8,097 |
| Marriott International, Inc. Class A | | 61,800 | 9,895 |
| | | | 24,205 |
| Household Durables - 0.3% | | | |
| NVR, Inc. (a) | | 1,055 | 4,471 |
| Internet & Direct Marketing Retail - 3.4% | | | |
| Amazon.com, Inc. (a) | | 489,760 | 50,171 |
| Multiline Retail - 0.7% | | | |
| Dollar General Corp. | | 40,800 | 10,406 |
| Specialty Retail - 2.1% | | | |
| Floor & Decor Holdings, Inc. Class A (a) | | 11,352 | 833 |
| Ross Stores, Inc. | | 31,800 | 3,043 |
| The Home Depot, Inc. | | 62,444 | 18,492 |
| TJX Companies, Inc. | | 125,300 | 9,034 |
| | | | 31,402 |
| Textiles, Apparel & Luxury Goods - 1.0% | | | |
| lululemon athletica, Inc. (a) | | 13,900 | 4,574 |
| NIKE, Inc. Class B | | 106,510 | 9,871 |
| | | | 14,445 |
TOTAL CONSUMER DISCRETIONARY | | | 144,498 |
| CONSUMER STAPLES - 5.0% | | | |
| Beverages - 2.2% | | | |
| Constellation Brands, Inc. Class A (sub. vtg.) | | 17,600 | 4,349 |
| Monster Beverage Corp. (a) | | 105,600 | 9,897 |
| The Coca-Cola Co. | | 295,000 | 17,656 |
| | | | 31,902 |
| Food & Staples Retailing - 1.5% | | | |
| Costco Wholesale Corp. | | 43,515 | 21,823 |
| Food Products - 0.7% | | | |
| Lamb Weston Holdings, Inc. | | 57,000 | 4,915 |
| Mondelez International, Inc. | | 79,100 | 4,863 |
| | | | 9,778 |
| Personal Products - 0.6% | | | |
| Estee Lauder Companies, Inc. Class A | | 47,919 | 9,607 |
TOTAL CONSUMER STAPLES | | | 73,110 |
| ENERGY - 6.9% | | | |
| Oil, Gas & Consumable Fuels - 6.9% | | | |
| ConocoPhillips Co. | | 130,500 | 16,455 |
| Continental Resources, Inc. | | 67,500 | 4,993 |
| Coterra Energy, Inc. | | 89,700 | 2,792 |
| Devon Energy Corp. | | 234,396 | 18,131 |
| EOG Resources, Inc. | | 110,667 | 15,108 |
| EQT Corp. | | 98,500 | 4,121 |
| Hess Corp. | | 83,800 | 11,823 |
| Occidental Petroleum Corp. | | 136,400 | 9,903 |
| Pioneer Natural Resources Co. | | 36,500 | 9,359 |
| Valero Energy Corp. | | 73,900 | 9,278 |
| | | | 101,963 |
| FINANCIALS - 7.1% | | | |
| Banks - 3.4% | | | |
| Bank of America Corp. | | 489,283 | 17,634 |
| Comerica, Inc. | | 63,400 | 4,470 |
| Cullen/Frost Bankers, Inc. | | 35,600 | 5,520 |
| JPMorgan Chase & Co. | | 183,314 | 23,076 |
| | | | 50,700 |
| Capital Markets - 2.5% | | | |
| Moody's Corp. | | 40,439 | 10,711 |
| MSCI, Inc. | | 34,344 | 16,103 |
| S&P Global, Inc. | | 29,558 | 9,496 |
| | | | 36,310 |
| Insurance - 1.2% | | | |
| American Financial Group, Inc. | | 9,300 | 1,350 |
| Arthur J. Gallagher & Co. | | 56,800 | 10,626 |
| The Travelers Companies, Inc. | | 31,100 | 5,737 |
| | | | 17,713 |
TOTAL FINANCIALS | | | 104,723 |
| HEALTH CARE - 15.0% | | | |
| Biotechnology - 0.4% | | | |
| Horizon Therapeutics PLC (a) | | 22,284 | 1,389 |
| Neurocrine Biosciences, Inc. (a) | | 12,500 | 1,439 |
| Vertex Pharmaceuticals, Inc. (a) | | 9,600 | 2,995 |
| | | | 5,823 |
| Health Care Equipment & Supplies - 2.6% | | | |
| Boston Scientific Corp. (a) | | 168,429 | 7,261 |
| DexCom, Inc. (a) | | 38,700 | 4,674 |
| IDEXX Laboratories, Inc. (a) | | 9,093 | 3,271 |
| Intuitive Surgical, Inc. (a) | | 27,814 | 6,855 |
| Masimo Corp. (a) | | 21,384 | 2,814 |
| ResMed, Inc. | | 34,620 | 7,744 |
| Stryker Corp. | | 26,335 | 6,037 |
| | | | 38,656 |
| Health Care Providers & Services - 5.6% | | | |
| Cigna Corp. | | 33,400 | 10,790 |
| Elevance Health, Inc. | | 27,300 | 14,927 |
| Guardant Health, Inc. (a) | | 29,400 | 1,455 |
| HCA Holdings, Inc. | | 20,500 | 4,458 |
| UnitedHealth Group, Inc. | | 92,075 | 51,115 |
| | | | 82,745 |
| Health Care Technology - 0.1% | | | |
| Veeva Systems, Inc. Class A (a) | | 9,185 | 1,543 |
| Life Sciences Tools & Services - 4.6% | | | |
| Agilent Technologies, Inc. | | 34,900 | 4,828 |
| Avantor, Inc. (a) | | 72,073 | 1,454 |
| Bio-Rad Laboratories, Inc. Class A (a) | | 4,854 | 1,707 |
| Danaher Corp. | | 111,545 | 28,073 |
| Maravai LifeSciences Holdings, Inc. (a) | | 55,200 | 916 |
| Mettler-Toledo International, Inc. (a) | | 4,764 | 6,026 |
| Thermo Fisher Scientific, Inc. | | 38,900 | 19,993 |
| West Pharmaceutical Services, Inc. | | 21,236 | 4,886 |
| | | | 67,883 |
| Pharmaceuticals - 1.7% | | | |
| Eli Lilly & Co. | | 25,700 | 9,306 |
| Zoetis, Inc. Class A | | 104,544 | 15,763 |
| | | | 25,069 |
TOTAL HEALTH CARE | | | 221,719 |
| INDUSTRIALS - 8.3% | | | |
| Aerospace & Defense - 2.6% | | | |
| HEICO Corp. Class A | | 81,847 | 10,419 |
| L3Harris Technologies, Inc. | | 28,100 | 6,926 |
| Lockheed Martin Corp. | | 22,137 | 10,774 |
| Northrop Grumman Corp. | | 17,000 | 9,333 |
| | | | 37,452 |
| Commercial Services & Supplies - 1.5% | | | |
| Cintas Corp. | | 28,263 | 12,084 |
| Copart, Inc. (a) | | 80,288 | 9,235 |
| | | | 21,319 |
| Electrical Equipment - 0.7% | | | |
| AMETEK, Inc. | | 75,838 | 9,833 |
| Generac Holdings, Inc. (a) | | 8,806 | 1,021 |
| | | | 10,854 |
| Machinery - 1.8% | | | |
| Fortive Corp. | | 92,300 | 5,898 |
| IDEX Corp. | | 39,300 | 8,737 |
| ITT, Inc. | | 73,839 | 5,641 |
| Snap-On, Inc. | | 30,200 | 6,706 |
| | | | 26,982 |
| Professional Services - 0.5% | | | |
| CoStar Group, Inc. (a) | | 93,500 | 7,734 |
| Road & Rail - 1.2% | | | |
| Norfolk Southern Corp. | | 41,703 | 9,511 |
| Old Dominion Freight Lines, Inc. | | 29,950 | 8,224 |
| | | | 17,735 |
TOTAL INDUSTRIALS | | | 122,076 |
| INFORMATION TECHNOLOGY - 36.5% | | | |
| Electronic Equipment & Components - 2.4% | | | |
| Amphenol Corp. Class A | | 142,940 | 10,839 |
| CDW Corp. | | 33,873 | 5,854 |
| Keysight Technologies, Inc. (a) | | 51,102 | 8,899 |
| Teledyne Technologies, Inc. (a) | | 19,897 | 7,919 |
| Zebra Technologies Corp. Class A (a) | | 4,941 | 1,399 |
| | | | 34,910 |
| IT Services - 7.5% | | | |
| Accenture PLC Class A | | 78,708 | 22,345 |
| EPAM Systems, Inc. (a) | | 26,000 | 9,100 |
| Global Payments, Inc. | | 38,872 | 4,442 |
| MasterCard, Inc. Class A | | 92,811 | 30,459 |
| Okta, Inc. (a) | | 5,100 | 286 |
| PayPal Holdings, Inc. (a) | | 89,300 | 7,464 |
| Visa, Inc. Class A | | 175,034 | 36,260 |
| | | | 110,356 |
| Semiconductors & Semiconductor Equipment - 3.1% | | | |
| Lam Research Corp. | | 25,767 | 10,430 |
| Monolithic Power Systems, Inc. | | 9,500 | 3,225 |
| NVIDIA Corp. | | 160,598 | 21,676 |
| NXP Semiconductors NV | | 39,000 | 5,697 |
| onsemi (a) | | 74,600 | 4,583 |
| | | | 45,611 |
| Software - 16.6% | | | |
| Adobe, Inc. (a) | | 61,459 | 19,575 |
| ANSYS, Inc. (a) | | 51,700 | 11,434 |
| Atlassian Corp. PLC (a) | | 4,041 | 819 |
| Autodesk, Inc. (a) | | 40,500 | 8,679 |
| Bill.Com Holdings, Inc. (a) | | 2,200 | 293 |
| Cadence Design Systems, Inc. (a) | | 85,647 | 12,966 |
| Ceridian HCM Holding, Inc. (a) | | 12,100 | 801 |
| Datadog, Inc. Class A (a) | | 3,500 | 282 |
| Dynatrace, Inc. (a) | | 138,903 | 4,895 |
| Elastic NV (a) | | 4,400 | 281 |
| Fortinet, Inc. (a) | | 193,760 | 11,075 |
| HubSpot, Inc. (a) | | 4,962 | 1,472 |
| Intuit, Inc. | | 51,126 | 21,856 |
| Microsoft Corp. | | 466,738 | 108,340 |
| New Relic, Inc. (a) | | 4,800 | 284 |
| Paycom Software, Inc. (a) | | 23,396 | 8,095 |
| Roper Technologies, Inc. | | 17,275 | 7,161 |
| Salesforce.com, Inc. (a) | | 59,194 | 9,624 |
| ServiceNow, Inc. (a) | | 20,052 | 8,437 |
| Splunk, Inc. (a) | | 3,600 | 299 |
| Synopsys, Inc. (a) | | 27,100 | 7,928 |
| Zendesk, Inc. (a) | | 3,800 | 291 |
| | | | 244,887 |
| Technology Hardware, Storage & Peripherals - 6.9% | | | |
| Apple, Inc. | | 664,807 | 101,942 |
TOTAL INFORMATION TECHNOLOGY | | | 537,706 |
| MATERIALS - 1.6% | | | |
| Chemicals - 1.4% | | | |
| CF Industries Holdings, Inc. | | 90,100 | 9,574 |
| Sherwin-Williams Co. | | 39,383 | 8,862 |
| Westlake Corp. | | 22,800 | 2,204 |
| | | | 20,640 |
| Metals & Mining - 0.2% | | | |
| Freeport-McMoRan, Inc. | | 112,700 | 3,571 |
TOTAL MATERIALS | | | 24,211 |
| REAL ESTATE - 1.4% | | | |
| Equity Real Estate Investment Trusts (REITs) - 1.4% | | | |
| American Tower Corp. | | 70,700 | 14,648 |
| SBA Communications Corp. Class A | | 24,300 | 6,559 |
| | | | 21,207 |
| UTILITIES - 0.8% | | | |
| Electric Utilities - 0.8% | | | |
| NextEra Energy, Inc. | | 158,400 | 12,276 |
| TOTAL COMMON STOCKS (Cost $936,423) | | | 1,446,589 |
| | | | |
| Money Market Funds - 1.2% |
| | | Shares | Value ($) (000s) |
Fidelity Cash Central Fund 3.10% (b) (Cost $17,319) | | 17,315,333 | 17,319 |
| | | | |
| TOTAL INVESTMENT IN SECURITIES - 99.2% (Cost $953,742) | 1,463,908 |
NET OTHER ASSETS (LIABILITIES) - 0.8% | 11,095 |
| NET ASSETS - 100.0% | 1,475,003 |
| | |
Any values shown as $0 in the Schedule of Investments may reflect amounts less than $500.
Legend
| (b) | Affiliated fund that is generally available only to investment companies and other accounts managed by Fidelity Investments. The rate quoted is the annualized seven-day yield of the fund at period end. A complete unaudited listing of the fund's holdings as of its most recent quarter end is available upon request. In addition, each Fidelity Central Fund's financial statements, which are not covered by the Fund's Report of Independent Registered Public Accounting Firm, are available on the SEC's website or upon request. |
Affiliated Central Funds
Fiscal year to date information regarding the Fund's investments in Fidelity Central Funds, including the ownership percentage, is presented below.
| Affiliate (Amounts in thousands) | Value, beginning of period ($) | Purchases ($) | Sales Proceeds ($) | Dividend Income ($) | Realized Gain (loss) ($) | Change in Unrealized appreciation (depreciation) ($) | Value, end of period ($) | % ownership, end of period |
| Fidelity Cash Central Fund 3.10% | 872 | 339,337 | 322,890 | 259 | - | - | 17,319 | 0.0% |
| Fidelity Securities Lending Cash Central Fund 3.10% | 1,673 | 113,763 | 115,436 | 3 | - | - | - | 0.0% |
| Total | 2,545 | 453,100 | 438,326 | 262 | - | - | 17,319 | |
| | | | | | | | | |
Amounts in the income column in the above table include any capital gain distributions from underlying funds, which are presented in the corresponding line item in the Statement of Operations, if applicable.
Amount for Fidelity Securities Lending Cash Central Fund represents the income earned on investing cash collateral, less rebates paid to borrowers and any lending agent fees associated with the loan, plus any premium payments received for lending certain types of securities.
Investment Valuation
The following is a summary of the inputs used, as of October 31, 2022, involving the Fund's assets and liabilities carried at fair value. The inputs or methodology used for valuing securities may not be an indication of the risk associated with investing in those securities. For more information on valuation inputs, and their aggregation into the levels used below, please refer to the Investment Valuation section in the accompanying Notes to Financial Statements.
| Valuation Inputs at Reporting Date: |
Description (Amounts in thousands) | Total ($) | Level 1 ($) | Level 2 ($) | Level 3 ($) |
Investments in Securities: | | | | |
|
| Equities: | | | | |
Communication Services | 83,100 | 83,100 | - | - |
Consumer Discretionary | 144,498 | 144,498 | - | - |
Consumer Staples | 73,110 | 73,110 | - | - |
Energy | 101,963 | 101,963 | - | - |
Financials | 104,723 | 104,723 | - | - |
Health Care | 221,719 | 221,719 | - | - |
Industrials | 122,076 | 122,076 | - | - |
Information Technology | 537,706 | 537,706 | - | - |
Materials | 24,211 | 24,211 | - | - |
Real Estate | 21,207 | 21,207 | - | - |
Utilities | 12,276 | 12,276 | - | - |
|
| Money Market Funds | 17,319 | 17,319 | - | - |
| Total Investments in Securities: | 1,463,908 | 1,463,908 | - | - |
| Statement of Assets and Liabilities |
| Amounts in thousands (except per-share amounts) | | | | October 31, 2022 |
| | | | | |
| Assets | | | | |
| Investment in securities, at value - See accompanying schedule: | | | | |
Unaffiliated issuers (cost $936,423) | | $1,446,589 | | |
Fidelity Central Funds (cost $17,319) | | 17,319 | | |
| | | | | |
| Total Investment in Securities (cost $953,742) | | | $ | 1,463,908 |
| Receivable for investments sold | | | | 15,604 |
| Receivable for fund shares sold | | | | 134 |
| Dividends receivable | | | | 228 |
| Distributions receivable from Fidelity Central Funds | | | | 113 |
| Prepaid expenses | | | | 2 |
Total assets | | | | 1,479,989 |
| Liabilities | | | | |
| Payable for investments purchased | | $3,746 | | |
| Payable for fund shares redeemed | | 478 | | |
| Accrued management fee | | 516 | | |
| Other affiliated payables | | 195 | | |
| Other payables and accrued expenses | | 51 | | |
| Total Liabilities | | | | 4,986 |
| Net Assets | | | $ | 1,475,003 |
| Net Assets consist of: | | | | |
| Paid in capital | | | $ | 933,064 |
| Total accumulated earnings (loss) | | | | 541,939 |
| Net Assets | | | $ | 1,475,003 |
| | | | | |
| Net Asset Value and Maximum Offering Price | | | | |
| Disciplined Equity : | | | | |
Net Asset Value , offering price and redemption price per share ($1,422,066 ÷ 29,807 shares) | | | $ | 47.71 |
| Class K : | | | | |
Net Asset Value , offering price and redemption price per share ($52,937 ÷ 1,109 shares) (a) | | | $ | 47.72 |
(a)Corresponding Net Asset Value does not calculate due to rounding of fractional net assets and/or shares |
| Statement of Operations |
| Amounts in thousands | | | | Year ended October 31, 2022 |
| Investment Income | | | | |
| Dividends | | | $ | 15,847 |
| Income from Fidelity Central Funds (including $3 from security lending) | | | | 262 |
| Total Income | | | | 16,109 |
| Expenses | | | | |
| Management fee | | | | |
| Basic fee | $ | 9,359 | | |
| Performance adjustment | | 353 | | |
| Transfer agent fees | | 2,154 | | |
| Accounting fees | | 524 | | |
| Custodian fees and expenses | | 24 | | |
| Independent trustees' fees and expenses | | 6 | | |
| Registration fees | | 48 | | |
| Audit | | 52 | | |
| Legal | | 6 | | |
| Miscellaneous | | 9 | | |
| Total expenses before reductions | | 12,535 | | |
| Expense reductions | | (59) | | |
| Total expenses after reductions | | | | 12,476 |
| Net Investment income (loss) | | | | 3,633 |
| Realized and Unrealized Gain (Loss) | | | | |
| Net realized gain (loss) on: | | | | |
| Investment Securities: | | | | |
| Unaffiliated issuers | | 34,685 | | |
| Total net realized gain (loss) | | | | 34,685 |
| Change in net unrealized appreciation (depreciation) on investment securities | | | | (583,180) |
| Net gain (loss) | | | | (548,495) |
| Net increase (decrease) in net assets resulting from operations | | | $ | (544,862) |
| Statement of Changes in Net Assets |
| |
| Amount in thousands | | Year ended October 31, 2022 | | Year ended October 31, 2021 |
| Increase (Decrease) in Net Assets | | | | |
| Operations | | | | |
| Net investment income (loss) | $ | 3,633 | $ | (1,823) |
| Net realized gain (loss) | | 34,685 | | 68,874 |
| Change in net unrealized appreciation (depreciation) | | (583,180) | | 615,412 |
| Net increase (decrease) in net assets resulting from operations | | (544,862) | | 682,463 |
| Distributions to shareholders | | (31,288) | | (438) |
| Share transactions - net increase (decrease) | | (152,553) | | (42,002) |
| Total increase (decrease) in net assets | | (728,703) | | 640,023 |
| | | | | |
| Net Assets | | | | |
| Beginning of period | | 2,203,706 | | 1,563,683 |
| End of period | $ | 1,475,003 | $ | 2,203,706 |
| | | | | |
| | | | | |
Financial Highlights
| Fidelity® Disciplined Equity Fund |
| |
| Years ended October 31, | | 2022 | | 2021 | | 2020 | | 2019 | | 2018 |
Selected Per-Share Data | | | | | | | | | | |
| Net asset value, beginning of period | $ | 65.18 | $ | 45.48 | $ | 37.51 | $ | 38.32 | $ | 38.96 |
| Income from Investment Operations | | | | | | | | | | |
Net investment income (loss) A,B | | .11 | | (.06) | | .03 | | .32 | | .52 |
| Net realized and unrealized gain (loss) | | (16.65) | | 19.77 | | 8.16 | | 3.53 | | .41 |
| Total from investment operations | | (16.54) | | 19.71 | | 8.19 | | 3.85 | | .93 |
| Distributions from net investment income | | - | | (.01) | | (.22) | | (.53) | | (.45) |
| Distributions from net realized gain | | (.93) | | - | | - | | (4.13) | | (1.12) |
| Total distributions | | (.93) | | (.01) | | (.22) | | (4.66) | | (1.57) |
| Net asset value, end of period | $ | 47.71 | $ | 65.18 | $ | 45.48 | $ | 37.51 | $ | 38.32 |
Total Return C | | (25.71)% | | 43.35% | | 21.92% | | 12.01% | | 2.37% |
Ratios to Average Net Assets B,D,E | | | | | | | | | | |
| Expenses before reductions | | .71% | | .79% | | .71% | | .51% | | .53% |
| Expenses net of fee waivers, if any | | .70% | | .78% | | .71% | | .51% | | .53% |
| Expenses net of all reductions | | .70% | | .78% | | .71% | | .51% | | .53% |
| Net investment income (loss) | | .20% | | (.10)% | | .07% | | .90% | | 1.32% |
| Supplemental Data | | | | | | | | | | |
| Net assets, end of period (in millions) | $ | 1,422 | $ | 2,091 | $ | 1,469 | $ | 1,190 | $ | 1,182 |
Portfolio turnover rate F | | 28% | | 19% | | 35% | | 108% | | 181% |
A Calculated based on average shares outstanding during the period.
B Net investment income (loss) is affected by the timing of the declaration of dividends by any underlying mutual funds or exchange-traded funds (ETFs). Net investment income (loss) of any mutual funds or ETFs is not included in the Fund's net investment income (loss) ratio.
C Total returns would have been lower if certain expenses had not been reduced during the applicable periods shown.
D Fees and expenses of any underlying mutual funds or exchange-traded funds (ETFs) are not included in the Fund's expense ratio. The Fund indirectly bears its proportionate share of these expenses. For additional expense information related to investments in Fidelity Central Funds, please refer to the "Investments in Fidelity Central Funds" note found in the Notes to Financial Statements section of the most recent Annual or Semi-Annual report.
E Expense ratios reflect operating expenses of the class. Expenses before reductions do not reflect amounts reimbursed, waived, or reduced through arrangements with the investment adviser, brokerage services, or other offset arrangements, if applicable, and do not represent the amount paid by the class during periods when reimbursements, waivers or reductions occur.
F Amount does not include the portfolio activity of any underlying mutual funds or exchange-traded funds (ETFs).
| Fidelity® Disciplined Equity Fund Class K |
| |
| Years ended October 31, | | 2022 | | 2021 | | 2020 | | 2019 | | 2018 |
Selected Per-Share Data | | | | | | | | | | |
| Net asset value, beginning of period | $ | 65.14 | $ | 45.42 | $ | 37.47 | $ | 38.29 | $ | 38.93 |
| Income from Investment Operations | | | | | | | | | | |
Net investment income (loss) A,B | | .16 | | (.01) | | .06 | | .35 | | .56 |
| Net realized and unrealized gain (loss) | | (16.65) | | 19.75 | | 8.14 | | 3.53 | | .41 |
| Total from investment operations | | (16.49) | | 19.74 | | 8.20 | | 3.88 | | .97 |
| Distributions from net investment income | | - | | (.02) | | (.25) | | (.57) | | (.49) |
| Distributions from net realized gain | | (.93) | | - | | - | | (4.13) | | (1.12) |
| Total distributions | | (.93) | | (.02) | | (.25) | | (4.70) | | (1.61) |
| Net asset value, end of period | $ | 47.72 | $ | 65.14 | $ | 45.42 | $ | 37.47 | $ | 38.29 |
Total Return C | | (25.65)% | | 43.47% | | 21.99% | | 12.12% | | 2.48% |
Ratios to Average Net Assets B,D,E | | | | | | | | | | |
| Expenses before reductions | | .62% | | .70% | | .62% | | .42% | | .43% |
| Expenses net of fee waivers, if any | | .62% | | .70% | | .62% | | .42% | | .43% |
| Expenses net of all reductions | | .62% | | .70% | | .62% | | .42% | | .43% |
| Net investment income (loss) | | .28% | | (.01)% | | .16% | | .99% | | 1.41% |
| Supplemental Data | | | | | | | | | | |
| Net assets, end of period (in millions) | $ | 53 | $ | 113 | $ | 95 | $ | 91 | $ | 99 |
Portfolio turnover rate F | | 28% | | 19% | | 35% | | 108% | | 181% |
A Calculated based on average shares outstanding during the period.
B Net investment income (loss) is affected by the timing of the declaration of dividends by any underlying mutual funds or exchange-traded funds (ETFs). Net investment income (loss) of any mutual funds or ETFs is not included in the Fund's net investment income (loss) ratio.
C Total returns would have been lower if certain expenses had not been reduced during the applicable periods shown.
D Fees and expenses of any underlying mutual funds or exchange-traded funds (ETFs) are not included in the Fund's expense ratio. The Fund indirectly bears its proportionate share of these expenses. For additional expense information related to investments in Fidelity Central Funds, please refer to the "Investments in Fidelity Central Funds" note found in the Notes to Financial Statements section of the most recent Annual or Semi-Annual report.
E Expense ratios reflect operating expenses of the class. Expenses before reductions do not reflect amounts reimbursed, waived, or reduced through arrangements with the investment adviser, brokerage services, or other offset arrangements, if applicable, and do not represent the amount paid by the class during periods when reimbursements, waivers or reductions occur.
F Amount does not include the portfolio activity of any underlying mutual funds or exchange-traded funds (ETFs).
For the period ended October 31, 2022
( Amounts in thousands except percentages)
1. Organization.
Fidelity Disciplined Equity Fund (the Fund) is a fund of Fidelity Capital Trust (the Trust) and is authorized to issue an unlimited number of shares. The Trust is registered under the Investment Company Act of 1940, as amended (the 1940 Act), as an open-end management investment company organized as a Massachusetts business trust. The Fund offers Disciplined Equity and Class K shares, each of which has equal rights as to assets and voting privileges. Each class has exclusive voting rights with respect to matters that affect that class.
2. Investments in Fidelity Central Funds.
Funds may invest in Fidelity Central Funds, which are open-end investment companies generally available only to other investment companies and accounts managed by the investment adviser and its affiliates. The Schedule of Investments lists any Fidelity Central Funds held as an investment as of period end, but does not include the underlying holdings of each Fidelity Central Fund. An investing fund indirectly bears its proportionate share of the expenses of the underlying Fidelity Central Funds.
Based on its investment objective, each Fidelity Central Fund may invest or participate in various investment vehicles or strategies that are similar to those of the investing fund. These strategies are consistent with the investment objectives of the investing fund and may involve certain economic risks which may cause a decline in value of each of the Fidelity Central Funds and thus a decline in the value of the investing fund.
| Fidelity Central Fund | Investment Manager | Investment Objective | Investment Practices | Expense Ratio A |
| Fidelity Money Market Central Funds | Fidelity Management & Research Company LLC (FMR) | Each fund seeks to obtain a high level of current income consistent with the preservation of capital and liquidity. | Short-term Investments | Less than .005% |
A Expenses expressed as a percentage of average net assets and are as of each underlying Central Fund's most recent annual or semi-annual shareholder report.
A complete unaudited list of holdings for each Fidelity Central Fund is available upon request or at the Securities and Exchange Commission website at www.sec.gov. In addition, the financial statements of the Fidelity Central Funds which contain the significant accounting policies (including investment valuation policies) of those funds, and are not covered by the Report of Independent Registered Public Accounting Firm, are available on the Securities and Exchange Commission website or upon request.
3. Significant Accounting Policies.
The Fund is an investment company and applies the accounting and reporting guidance of the Financial Accounting Standards Board (FASB) Accounting Standards Codification Topic 946 Financial Services - Investment Companies . The financial statements have been prepared in conformity with accounting principles generally accepted in the United States of America (GAAP), which require management to make certain estimates and assumptions at the date of the financial statements. Actual results could differ from those estimates. Subsequent events, if any, through the date that the financial statements were issued have been evaluated in the preparation of the financial statements. The Fund's Schedule of Investments lists any underlying mutual funds or exchange-traded funds (ETFs) but does not include the underlying holdings of these funds. The following summarizes the significant accounting policies of the Fund:
Investment Valuation. Investments are valued as of 4:00 p.m. Eastern time on the last calendar day of the period. The Board of Trustees (the Board) has designated the Fund's investment adviser as the valuation designee responsible for the fair valuation function and performing fair value determinations as needed. The investment adviser has established a Fair Value Committee (the Committee) to carry out the day-to-day fair valuation responsibilities and has adopted policies and procedures to govern the fair valuation process and the activities of the Committee. In accordance with these fair valuation policies and procedures, which have been approved by the Board, the Fund attempts to obtain prices from one or more third party pricing services or brokers to value its investments. When current market prices, quotations or currency exchange rates are not readily available or reliable, investments will be fair valued in good faith by the Committee, in accordance with the policies and procedures. Factors used in determining fair value vary by investment type and may include market or investment specific events, transaction data, estimated cash flows, and market observations of comparable investments. The frequency that the fair valuation procedures are used cannot be predicted and they may be utilized to a significant extent. The Committee manages the Fund's fair valuation practices and maintains the fair valuation policies and procedures. The Fund's investment adviser reports to the Board information regarding the fair valuation process and related material matters.
The Fund categorizes the inputs to valuation techniques used to value its investments into a disclosure hierarchy consisting of three levels as shown below:
Level 1 - unadjusted quoted prices in active markets for identical investments
Level 2 - other significant observable inputs (including quoted prices for similar investments, interest rates, prepayment speeds, etc.)
Level 3 - unobservable inputs (including the Fund's own assumptions based on the best information available)
Valuation techniques used to value the Fund's investments by major category are as follows:
Equity securities, including restricted securities, for which market quotations are readily available, are valued at the last reported sale price or official closing price as reported by a third party pricing service on the primary market or exchange on which they are traded and are categorized as Level 1 in the hierarchy. In the event there were no sales during the day or closing prices are not available, securities are valued at the last quoted bid price or may be valued using the last available price and are generally categorized as Level 2 in the hierarchy. For foreign equity securities, when market or security specific events arise, comparisons to the valuation of American Depositary Receipts (ADRs), futures contracts, ETFs and certain indexes as well as quoted prices for similar securities may be used and would be categorized as Level 2 in the hierarchy. For equity securities, including restricted securities, where observable inputs are limited, assumptions about market activity and risk are used and these securities may be categorized as Level 3 in the hierarchy.
Investments in open-end mutual funds, including the Fidelity Central Funds, are valued at their closing net asset value (NAV) each business day and are categorized as Level 1 in the hierarchy.
Changes in valuation techniques may result in transfers in or out of an assigned level within the disclosure hierarchy. The aggregate value of investments by input level as of October 31, 2022 is included at the end of the Fund's Schedule of Investments.
Investment Transactions and Income. For financial reporting purposes, the Fund's investment holdings and NAV include trades executed through the end of the last business day of the period. The NAV per share for processing shareholder transactions is calculated as of the close of business of the New York Stock Exchange (NYSE), normally 4:00 p.m. Eastern time and includes trades executed through the end of the prior business day. Gains and losses on securities sold are determined on the basis of identified cost and include proceeds received from litigation. Commissions paid to certain brokers with whom the investment adviser, or its affiliates, places trades on behalf of a fund include an amount in addition to trade execution, which may be rebated back to a fund. Any such rebates are included in net realized gain (loss) on investments in the Statement of Operations. Dividend income is recorded on the ex-dividend date, except for certain dividends from foreign securities where the ex-dividend date may have passed, which are recorded as soon as the Fund is informed of the ex-dividend date. Non-cash dividends included in dividend income, if any, are recorded at the fair market value of the securities received. Income and capital gain distributions from Fidelity Central Funds, if any, are recorded on the ex-dividend date. Certain distributions received by the Fund represent a return of capital or capital gain. The Fund determines the components of these distributions subsequent to the ex-dividend date, based upon receipt of tax filings or other correspondence relating to the underlying investment. These distributions are recorded as a reduction of cost of investments and/or as a realized gain.
Class Allocations and Expenses. Investment income, realized and unrealized capital gains and losses, common expenses of a fund, and certain fund-level expense reductions, if any, are allocated daily on a pro-rata basis to each class based on the relative net assets of each class to the total net assets of a fund. Each class differs with respect to transfer agent and distribution and service plan fees incurred, as applicable. Certain expense reductions may also differ by class, if applicable. For the reporting period, the allocated portion of income and expenses to each class as a percent of its average net assets may vary due to the timing of recording these transactions in relation to fluctuating net assets of the classes. Expenses directly attributable to a fund are charged to that fund. Expenses attributable to more than one fund are allocated among the respective funds on the basis of relative net assets or other appropriate methods. Expenses included in the accompanying financial statements reflect the expenses of that fund and do not include any expenses associated with any underlying mutual funds or exchange-traded funds. Although not included in a fund's expenses, a fund indirectly bears its proportionate share of these expenses through the net asset value of each underlying mutual fund or exchange-traded fund. Expense estimates are accrued in the period to which they relate and adjustments are made when actual amounts are known.
Income Tax Information and Distributions to Shareholders. Each year, the Fund intends to qualify as a regulated investment company under Subchapter M of the Internal Revenue Code, including distributing substantially all of its taxable income and realized gains. As a result, no provision for U.S. Federal income taxes is required. As of October 31, 2022, the Fund did not have any unrecognized tax benefits in the financial statements; nor is the Fund aware of any tax positions for which it is reasonably possible that the total amounts of unrecognized tax benefits will significantly change in the next twelve months. The Fund files a U.S. federal tax return, in addition to state and local tax returns as required. The Fund's federal income tax returns are subject to examination by the Internal Revenue Service (IRS) for a period of three fiscal years after they are filed. State and local tax returns may be subject to examination for an additional fiscal year depending on the jurisdiction.
Distributions are declared and recorded on the ex-dividend date. Income and capital gain distributions are declared separately for each class. Income and capital gain distributions are determined in accordance with income tax regulations, which may differ from GAAP. In addition, the Fund claimed a portion of the payment made to redeeming shareholders as a distribution for income tax purposes.
Capital accounts within the financial statements are adjusted for permanent book-tax differences. These adjustments have no impact on net assets or the results of operations. Capital accounts are not adjusted for temporary book-tax differences which will reverse in a subsequent period.
Book-tax differences are primarily due to losses deferred due to wash sales and excise tax regulations.
As of period end, the cost and unrealized appreciation (depreciation) in securities, and derivatives if applicable, for federal income tax purposes were as follows:
| Gross unrealized appreciation | $532,551 |
| Gross unrealized depreciation | (28,575) |
| Net unrealized appreciation (depreciation) | $503,976 |
| Tax Cost | $959,932 |
The tax-based components of distributable earnings as of period end were as follows:
| Undistributed ordinary income | $1,250 |
| Undistributed long-term capital gain | $36,712 |
| Net unrealized appreciation (depreciation) on securities and other investments | $503,976 |
The tax character of distributions paid was as follows:
| | October 31, 2022 | October 31, 2021 |
| Ordinary Income | $- | $438 |
| Long-term Capital Gains | 31,288 | - |
| Total | $31,288 | $438 |
4. Purchases and Sales of Investments.
Purchases and sales of securities, other than short-term securities and in-kind transactions, as applicable, are noted in the table below.
| | Purchases ($) | Sales ($) |
| Fidelity Disciplined Equity Fund | 505,235 | 700,274 |
5. Fees and Other Transactions with Affiliates.
Management Fee. Fidelity Management & Research Company LLC (the investment adviser) and its affiliates provide the Fund with investment management related services for which the Fund pays a monthly management fee. The management fee is the sum of an individual fund fee rate that is based on an annual rate of .30% of the Fund's average net assets and an annualized group fee rate that averaged .23% during the period. The group fee rate is based upon the monthly average net assets of a group of registered investment companies with which the investment adviser has management contracts. The group fee rate decreases as assets under management increase and increases as assets under management decrease. In addition, the management fee is subject to a performance adjustment (up to a maximum of +/- .20% of the Fund's average net assets over a 36 month performance period). The upward or downward adjustment to the management fee is based on the relative investment performance of Disciplined Equity as compared to its benchmark index, the S&P 500 Index, over the same 36 month performance period. For the reporting period, the total annual management fee rate, including the performance adjustment, was .55% of the Fund's average net assets. The performance adjustment included in the management fee rate may be higher or lower than the maximum performance adjustment rate due to the difference between the average net assets for the reporting and performance periods.
Transfer Agent Fees. Fidelity Investments Institutional Operations Company LLC (FIIOC), an affiliate of the investment adviser, is the transfer, dividend disbursing and shareholder servicing agent for each class of the Fund. FIIOC receives account fees and asset-based fees that vary according to the account size and type of account of the shareholders of the respective classes of the Fund, except for Class K. FIIOC receives an asset-based fee of Class K's average net assets. FIIOC pays for typesetting, printing and mailing of shareholder reports, except proxy statements.
For the period, transfer agent fees for each class were as follows:
| | Amount | % of Class-Level Average Net Assets |
| Disciplined Equity | $2,121 | .12 |
| Class K | 33 | .04 |
| | $2,154 | |
Accounting Fees. Fidelity Service Company, Inc. (FSC), an affiliate of the investment adviser, maintains the Fund's accounting records. The accounting fee is based on the level of average net assets for each month. For the period, the fees were equivalent to the following annual rates:
| | % of Average Net Assets |
| Fidelity Disciplined Equity Fund | .03 |
Brokerage Commissions. A portion of portfolio transactions were placed with brokerage firms which are affiliates of the investment adviser. Brokerage commissions are included in net realized gain (loss) and change in net unrealized appreciation (depreciation) in the Statement of Operations. The commissions paid to these affiliated firms were as follows:
| | Amount |
| Fidelity Disciplined Equity Fund | $10 |
Interfund Trades. Funds may purchase from or sell securities to other Fidelity Funds under procedures adopted by the Board. The procedures have been designed to ensure these interfund trades are executed in accordance with Rule 17a-7 of the 1940 Act. Any interfund trades are included within the respective purchases and sales amounts shown in the Purchases and Sales of Investments note. Interfund trades during the period are noted in the table below.
| | Purchases ($) | Sales ($) | Realized Gain (Loss) ($) |
| Fidelity Disciplined Equity Fund | 41,853 | 43,114 | 206 |
6. Committed Line of Credit.
Certain Funds participate with other funds managed by the investment adviser or an affiliate in a $4.25 billion credit facility (the "line of credit") to be utilized for temporary or emergency purposes to fund shareholder redemptions or for other short-term liquidity purposes. The participating funds have agreed to pay commitment fees on their pro-rata portion of the line of credit, which are reflected in Miscellaneous expenses on the Statement of Operations, and are listed below. During the period, there were no borrowings on this line of credit.
| | Amount |
| Fidelity Disciplined Equity Fund | $3 |
7. Security Lending.
Funds lend portfolio securities from time to time in order to earn additional income. Lending agents are used, including National Financial Services (NFS), an affiliate of the investment adviser. Pursuant to a securities lending agreement, NFS will receive a fee, which is capped at 9.9% of a fund's daily lending revenue, for its services as lending agent. A fund may lend securities to certain qualified borrowers, including NFS. On the settlement date of the loan, a fund receives collateral (in the form of U.S. Treasury obligations, letters of credit and/or cash) against the loaned securities and maintains collateral in an amount not less than 100% of the market value of the loaned securities during the period of the loan. The market value of the loaned securities is determined at the close of business of a fund and any additional required collateral is delivered to a fund on the next business day. A fund or borrower may terminate the loan at any time, and if the borrower defaults on its obligation to return the securities loaned because of insolvency or other reasons, a fund may apply collateral received from the borrower against the obligation. A fund may experience delays and costs in recovering the securities loaned. Any cash collateral received is invested in the Fidelity Securities Lending Cash Central Fund. Any loaned securities are identified as such in the Schedule of Investments, and the value of loaned securities and cash collateral at period end, as applicable, are presented in the Statement of Assets and Liabilities. Security lending income represents the income earned on investing cash collateral, less rebates paid to borrowers and any lending agent fees associated with the loan, plus any premium payments received for lending certain types of securities. Security lending income is presented in the Statement of Operations as a component of income from Fidelity Central Funds. Affiliated security lending activity, if any, was as follows:
| | Total Security Lending Fees Paid to NFS | Security Lending Income From Securities Loaned to NFS | Value of Securities Loaned to NFS at Period End |
| Fidelity Disciplined Equity Fund | $- A | $- | $- |
A In the amount of less than five hundred dollars.
8. Expense Reductions.
During the period the investment adviser or an affiliate reimbursed and/or waived a portion of fund-level operating expenses in the amount of $59.
9. Distributions to Shareholders.
Distributions to shareholders of each class were as follows:
| | Year ended October 31, 2022 | Year ended October 31, 2021 |
| Fidelity Disciplined Equity Fund | | |
| Distributions to shareholders | | |
| Disciplined Equity | $29,805 | $396 |
| Class K | 1,483 | 42 |
Total | $31,288 | $438 |
10. Share Transactions.
Share transactions for each class were as follows and may contain in-kind transactions, automatic conversions between classes or exchanges between affiliated funds:
| | Shares | Shares | Dollars | Dollars |
| | Year ended October 31, 2022 | Year ended October 31, 2021 | Year ended October 31, 2022 | Year ended October 31, 2021 |
| Fidelity Disciplined Equity Fund | | | | |
| Disciplined Equity | | | | |
| Shares sold | 884 | 4,022 | $49,965 | $213,553 |
| Reinvestment of distributions | 441 | 7 | 27,553 | 367 |
| Shares redeemed | (3,600) | (4,245) | (197,919) | (236,063) |
| Net increase (decrease) | (2,275) | (216) | $(120,401) | $(22,143) |
| Class K | | | | |
| Shares sold | 125 | 171 | $7,128 | $9,204 |
| Reinvestment of distributions | 24 | 1 | 1,483 | 42 |
| Shares redeemed | (768) | (533) | (40,763) | (29,105) |
| Net increase (decrease) | (619) | (361) | $(32,152) | $(19,859) |
11. Other.
A fund's organizational documents provide former and current trustees and officers with a limited indemnification against liabilities arising in connection with the performance of their duties to the fund. In the normal course of business, a fund may also enter into contracts that provide general indemnifications. A fund's maximum exposure under these arrangements is unknown as this would be dependent on future claims that may be made against a fund. The risk of material loss from such claims is considered remote.
12. Risk and Uncertainties.
Many factors affect a fund's performance. Developments that disrupt global economies and financial markets, such as pandemics, epidemics, outbreaks of infectious diseases, war, terrorism, and environmental disasters, may significantly affect a fund's investment performance. The effects of these developments to a fund will be impacted by the types of securities in which a fund invests, the financial condition, industry, economic sector, and geographic location of an issuer, and a fund's level of investment in the securities of that issuer.
To the Board of Trustees of Fidelity Capital Trust and Shareholders of Fidelity Disciplined Equity Fund
Opinion on the Financial Statements
We have audited the accompanying statement of assets and liabilities, including the schedule of investments, of Fidelity Disciplined Equity Fund (one of the funds constituting Fidelity Capital Trust, referred to hereafter as the "Fund") as of October 31, 2022, the related statement of operations for the year ended October 31, 2022, the statement of changes in net assets for each of the two years in the period ended October 31, 2022, including the related notes, and the financial highlights for each of the five years in the period ended October 31, 2022 (collectively referred to as the "financial statements"). In our opinion, the financial statements present fairly, in all material respects, the financial position of the Fund as of October 31, 2022, the results of its operations for the year then ended, the changes in its net assets for each of the two years in the period ended October 31, 2022 and the financial highlights for each of the five years in the period ended October 31, 2022 in conformity with accounting principles generally accepted in the United States of America.
Basis for Opinion
These financial statements are the responsibility of the Fund's management. Our responsibility is to express an opinion on the Fund's financial statements based on our audits. We are a public accounting firm registered with the Public Company Accounting Oversight Board (United States) (PCAOB) and are required to be independent with respect to the Fund in accordance with the U.S. federal securities laws and the applicable rules and regulations of the Securities and Exchange Commission and the PCAOB.
We conducted our audits of these financial statements in accordance with the standards of the PCAOB. Those standards require that we plan and perform the audit to obtain reasonable assurance about whether the financial statements are free of material misstatement, whether due to error or fraud.
Our audits included performing procedures to assess the risks of material misstatement of the financial statements, whether due to error or fraud, and performing procedures that respond to those risks. Such procedures included examining, on a test basis, evidence regarding the amounts and disclosures in the financial statements. Our audits also included evaluating the accounting principles used and significant estimates made by management, as well as evaluating the overall presentation of the financial statements. Our procedures included confirmation of securities owned as of October 31, 2022 by correspondence with the custodian and brokers; when replies were not received from brokers, we performed other auditing procedures. We believe that our audits provide a reasonable basis for our opinion.
/s/ PricewaterhouseCoopers LLP
Boston, Massachusetts
December 14, 2022
We have served as the auditor of one or more investment companies in the Fidelity group of funds since 1932.
The Trustees, Members of the Advisory Board (if any), and officers of the trust and fund, as applicable, are listed below. The Board of Trustees governs the fund and is responsible for protecting the interests of shareholders. The Trustees are experienced executives who meet periodically throughout the year to oversee the fund's activities, review contractual arrangements with companies that provide services to the fund, oversee management of the risks associated with such activities and contractual arrangements, and review the fund's performance. Each of the Trustees oversees 316 funds.
The Trustees hold office without limit in time except that (a) any Trustee may resign; (b) any Trustee may be removed by written instrument, signed by at least two-thirds of the number of Trustees prior to such removal; (c) any Trustee who requests to be retired or who has become incapacitated by illness or injury may be retired by written instrument signed by a majority of the other Trustees; and (d) any Trustee may be removed at any special meeting of shareholders by a two-thirds vote of the outstanding voting securities of the trust. Each Trustee who is not an interested person (as defined in the 1940 Act) of the trust and the fund is referred to herein as an Independent Trustee. Each Independent Trustee shall retire not later than the last day of the calendar year in which his or her 75th birthday occurs. The Independent Trustees may waive this mandatory retirement age policy with respect to individual Trustees. Officers and Advisory Board Members hold office without limit in time, except that any officer or Advisory Board Member may resign or may be removed by a vote of a majority of the Trustees at any regular meeting or any special meeting of the Trustees. Except as indicated, each individual has held the office shown or other offices in the same company for the past five years.
The fund's Statement of Additional Information (SAI) includes more information about the Trustees. To request a free copy, call Fidelity at 1-800-544-8544 if you're an individual investing directly with Fidelity, call 1-800-835-5092 if you're a plan sponsor or participant with Fidelity as your recordkeeper or call 1-877-208-0098 on institutional accounts or if you're an advisor or invest through one.
Experience, Skills, Attributes, and Qualifications of the Trustees. The Governance and Nominating Committee has adopted a statement of policy that describes the experience, qualifications, attributes, and skills that are necessary and desirable for potential Independent Trustee candidates (Statement of Policy). The Board believes that each Trustee satisfied at the time he or she was initially elected or appointed a Trustee, and continues to satisfy, the standards contemplated by the Statement of Policy. The Governance and Nominating Committee also engages professional search firms to help identify potential Independent Trustee candidates who have the experience, qualifications, attributes, and skills consistent with the Statement of Policy. From time to time, additional criteria based on the composition and skills of the current Independent Trustees, as well as experience or skills that may be appropriate in light of future changes to board composition, business conditions, and regulatory or other developments, have also been considered by the professional search firms and the Governance and Nominating Committee. In addition, the Board takes into account the Trustees' commitment and participation in Board and committee meetings, as well as their leadership of standing and ad hoc committees throughout their tenure.
In determining that a particular Trustee was and continues to be qualified to serve as a Trustee, the Board has considered a variety of criteria, none of which, in isolation, was controlling. The Board believes that, collectively, the Trustees have balanced and diverse experience, qualifications, attributes, and skills, which allow the Board to operate effectively in governing the fund and protecting the interests of shareholders. Information about the specific experience, skills, attributes, and qualifications of each Trustee, which in each case led to the Board's conclusion that the Trustee should serve (or continue to serve) as a trustee of the fund, is provided below.
Board Structure and Oversight Function. Robert A. Lawrence is an interested person and currently serves as Chair. The Trustees have determined that an interested Chair is appropriate and benefits shareholders because an interested Chair has a personal and professional stake in the quality and continuity of services provided to the fund. Independent Trustees exercise their informed business judgment to appoint an individual of their choosing to serve as Chair, regardless of whether the Trustee happens to be independent or a member of management. The Independent Trustees have determined that they can act independently and effectively without having an Independent Trustee serve as Chair and that a key structural component for assuring that they are in a position to do so is for the Independent Trustees to constitute a substantial majority for the Board. The Independent Trustees also regularly meet in executive session. David M. Thomas serves as Lead Independent Trustee and as such (i) acts as a liaison between the Independent Trustees and management with respect to matters important to the Independent Trustees and (ii) with management prepares agendas for Board meetings.
Fidelity ® funds are overseen by different Boards of Trustees. The fund's Board oversees Fidelity's high income and certain equity funds, and other Boards oversee Fidelity's investment-grade bond, money market, asset allocation, and other equity funds. The asset allocation funds may invest in Fidelity ® funds overseen by the fund's Board. The use of separate Boards, each with its own committee structure, allows the Trustees of each group of Fidelity ® funds to focus on the unique issues of the funds they oversee, including common research, investment, and operational issues. On occasion, the separate Boards establish joint committees to address issues of overlapping consequences for the Fidelity ® funds overseen by each Board.
The Trustees operate using a system of committees to facilitate the timely and efficient consideration of all matters of importance to the Trustees, the fund, and fund shareholders and to facilitate compliance with legal and regulatory requirements and oversight of the fund's activities and associated risks. The Board, acting through its committees, has charged FMR and its affiliates with (i) identifying events or circumstances the occurrence of which could have demonstrably adverse effects on the fund's business and/or reputation; (ii) implementing processes and controls to lessen the possibility that such events or circumstances occur or to mitigate the effects of such events or circumstances if they do occur; and (iii) creating and maintaining a system designed to evaluate continuously business and market conditions in order to facilitate the identification and implementation processes described in (i) and (ii) above. Because the day-to-day operations and activities of the fund are carried out by or through FMR, its affiliates, and other service providers, the fund's exposure to risks is mitigated but not eliminated by the processes overseen by the Trustees. While each of the Board's committees has responsibility for overseeing different aspects of the fund's activities, oversight is exercised primarily through the Operations, Audit, and Compliance Committees. Appropriate personnel, including but not limited to the fund's Chief Compliance Officer (CCO), FMR's internal auditor, the independent accountants, the fund's Treasurer and portfolio management personnel, make periodic reports to the Board's committees, as appropriate, including an annual review of Fidelity's risk management program for the Fidelity ® funds. The responsibilities of each standing committee, including their oversight responsibilities, are described further under "Standing Committees of the Trustees."
Interested Trustees*:
Correspondence intended for a Trustee who is an interested person may be sent to Fidelity Investments, 245 Summer Street, Boston, Massachusetts 02210.
Name, Year of Birth; Principal Occupations and Other Relevant Experience+
Bettina Doulton (1964)
Year of Election or Appointment: 2020
Trustee
Ms. Doulton also serves as Trustee of other Fidelity ® funds. Prior to her retirement, Ms. Doulton served in a variety of positions at Fidelity Investments, including as a managing director of research (2006-2007), portfolio manager to certain Fidelity ® funds (1993-2005), equity analyst and portfolio assistant (1990-1993), and research assistant (1987-1990). Ms. Doulton currently owns and operates Phi Builders + Architects and Cellardoor Winery. Previously, Ms. Doulton served as a member of the Board of Brown Capital Management, LLC (2014-2018).
Robert A. Lawrence (1952)
Year of Election or Appointment: 2020
Trustee
Chair of the Board of Trustees
Mr. Lawrence also serves as Trustee of other funds. Previously, Mr. Lawrence served as a Trustee and Member of the Advisory Board of certain funds. Prior to his retirement in 2008, Mr. Lawrence served as Vice President of certain Fidelity ® funds (2006-2008), Senior Vice President, Head of High Income Division of Fidelity Management & Research Company (investment adviser firm, 2006-2008), and President of Fidelity Strategic Investments (investment adviser firm, 2002-2005).
* Determined to be an "Interested Trustee" by virtue of, among other things, his or her affiliation with the trust or various entities under common control with FMR.
+ The information includes the Trustee's principal occupation during the last five years and other information relating to the experience, attributes, and skills relevant to the Trustee's qualifications to serve as a Trustee, which led to the conclusion that the Trustee should serve as a Trustee for the fund.
Independent Trustees:
Correspondence intended for an Independent Trustee may be sent to Fidelity Investments, P.O. Box 55235, Boston, Massachusetts 02205-5235.
Name, Year of Birth; Principal Occupations and Other Relevant Experience+
Thomas P. Bostick (1956)
Year of Election or Appointment: 2021
Trustee
Lieutenant General Bostick also serves as Trustee of other Fidelity ® funds. Prior to his retirement, General Bostick (United States Army, Retired) held a variety of positions within the U.S. Army, including Commanding General and Chief of Engineers, U.S. Army Corps of Engineers (2012-2016) and Deputy Chief of Staff and Director of Human Resources, U.S. Army (2009-2012). General Bostick currently serves as a member of the Board and Finance and Governance Committees of CSX Corporation (transportation, 2020-present) and a member of the Board and Corporate Governance and Nominating Committee of Perma-Fix Environmental Services, Inc. (nuclear waste management, 2020-present). General Bostick serves as Chief Executive Officer of Bostick Global Strategies, LLC (consulting, 2016-present) and as a member of the Board of HireVue, Inc. (video interview and assessment, 2020-present). Previously, General Bostick served as a Member of the Advisory Board of certain Fidelity® funds (2021), President, Intrexon Bioengineering (2018-2020) and Chief Operating Officer (2017-2020) and Senior Vice President of the Environment Sector (2016-2017) of Intrexon Corporation (biopharmaceutical company).
Dennis J. Dirks (1948)
Year of Election or Appointment: 2005
Trustee
Mr. Dirks also serves as Trustee of other Fidelity ® funds. Prior to his retirement in May 2003, Mr. Dirks served as Chief Operating Officer and as a member of the Board of The Depository Trust & Clearing Corporation (financial markets infrastructure), President, Chief Operating Officer and a member of the Board of The Depository Trust Company (DTC), President and a member of the Board of the National Securities Clearing Corporation (NSCC), Chief Executive Officer and a member of the Board of the Government Securities Clearing Corporation and Chief Executive Officer and a member of the Board of the Mortgage-Backed Securities Clearing Corporation. Mr. Dirks currently serves as a member of the Finance Committee (2016-present) and Board (2017-present) and is Treasurer (2018-present) of the Asolo Repertory Theatre.
Donald F. Donahue (1950)
Year of Election or Appointment: 2018
Trustee
Mr. Donahue also serves as Trustee of other Fidelity ® funds. Mr. Donahue serves as President and Chief Executive Officer of Miranda Partners, LLC (risk consulting for the financial services industry, 2012-present). Previously, Mr. Donahue served as Chief Executive Officer (2006-2012), Chief Operating Officer (2003-2006) and Managing Director, Customer Marketing and Development (1999-2003) of The Depository Trust & Clearing Corporation (financial markets infrastructure). Mr. Donahue currently serves as a member (2007-present) and Co-Chairman (2016-present) of the Board of United Way of New York and a member of the Board of The Leadership Academy (previously NYC Leadership Academy) (2012-present). Mr. Donahue previously served as a member of the Advisory Board of certain Fidelity® funds (2015-2018).
Vicki L. Fuller (1957)
Year of Election or Appointment: 2020
Trustee
Ms. Fuller also serves as Trustee of other Fidelity ® funds. Previously, Ms. Fuller served as a member of the Advisory Board of certain Fidelity ® funds (2018-2020), Chief Investment Officer of the New York State Common Retirement Fund (2012-2018) and held a variety of positions at AllianceBernstein L.P. (global asset management, 1985-2012), including Managing Director (2006-2012) and Senior Vice President and Senior Portfolio Manager (2001-2006). Ms. Fuller currently serves as a member of the Board, Audit Committee and Nominating and Governance Committee of two Blackstone business development companies (2020-present), as a member of the Board of Treliant, LLC (consulting, 2019-present), as a member of the Advisory Board of Ariel Alternatives, LLC (private equity, 2021-present) and as a member of the Board and Chair of the Audit Committee of Gusto, Inc. (software, 2021-present). In addition, Ms. Fuller currently serves as a member of the Board of Roosevelt University (2019-present) and as a member of the Executive Board of New York University's Stern School of Business. Ms. Fuller previously served as a member of the Board, Audit Committee and Nominating and Governance Committee of The Williams Companies, Inc. (natural gas infrastructure, 2018-2021).
Patricia L. Kampling (1959)
Year of Election or Appointment: 2020
Trustee
Ms. Kampling also serves as Trustee of other Fidelity ® funds. Prior to her retirement, Ms. Kampling served as Chairman of the Board and Chief Executive Officer (2012-2019), President and Chief Operating Officer (2011-2012) and Executive Vice President and Chief Financial Officer (2010-2011) of Alliant Energy Corporation. Ms. Kampling currently serves as a member of the Board, Finance Committee and Governance, Compensation and Nominating Committee of Xcel Energy Inc. (utilities company, 2020-present) and as a member of the Board, Audit, Finance and Risk Committee and Safety, Environmental, Technology and Operations Committee and Chair of the Executive Development and Compensation Committee of American Water Works Company, Inc. (utilities company, 2019-present). In addition, Ms. Kampling currently serves as a member of the Board of the Nature Conservancy, Wisconsin Chapter (2019-present). Previously, Ms. Kampling served as a Member of the Advisory Board of certain Fidelity® funds (2020), a member of the Board, Compensation Committee and Executive Committee and Chair of the Audit Committee of Briggs & Stratton Corporation (manufacturing, 2011-2021), a member of the Board of Interstate Power and Light Company (2012-2019) and Wisconsin Power and Light Company (2012-2019) (each a subsidiary of Alliant Energy Corporation) and as a member of the Board and Workforce Development Committee of the Business Roundtable (2018-2019).
Thomas A. Kennedy (1955)
Year of Election or Appointment: 2021
Trustee
Mr. Kennedy also serves as Trustee of other Fidelity ® funds. Previously, Mr. Kennedy served as a Member of the Advisory Board of certain Fidelity ® funds (2020) and held a variety of positions at Raytheon Company (aerospace and defense, 1983-2020), including Chairman and Chief Executive Officer (2014-2020) and Executive Vice President and Chief Operating Officer (2013-2014). Mr. Kennedy currently serves as Executive Chairman of the Board of Directors of Raytheon Technologies Corporation (aerospace and defense, 2020-present). He is also a member of the Rutgers School of Engineering Industry Advisory Board (2011-present) and a member of the UCLA Engineering Dean's Executive Board (2016-present).
Oscar Munoz (1959)
Year of Election or Appointment: 2021
Trustee
Mr. Munoz also serves as Trustee of other Fidelity ® funds. Prior to his retirement, Mr. Munoz served as Executive Chairman (2020-2021), Chief Executive Officer (2015-2020), President (2015-2016) and a member of the Board (2010-2021) of United Airlines Holdings, Inc. Mr. Munoz currently serves as a member of the Board of CBRE Group, Inc. (commercial real estate, 2020-present), a member of the Board of Univision Communications, Inc. (Hispanic media, 2020-present) and a member of the Advisory Board of Salesforce.com, Inc. (cloud-based software, 2020-present). Previously, Mr. Munoz served as a Member of the Advisory Board of certain Fidelity ® funds (2021).
Garnett A. Smith (1947)
Year of Election or Appointment: 2018
Trustee
Mr. Smith also serves as Trustee of other Fidelity ® funds. Prior to his retirement, Mr. Smith served as Chairman and Chief Executive Officer (1990-1997) and President (1986-1990) of Inbrand Corp. (manufacturer of personal absorbent products). Prior to his employment with Inbrand Corp., he was employed by a retail fabric chain and North Carolina National Bank (now Bank of America). Mr. Smith previously served as a member of the Advisory Board of certain Fidelity ® funds (2012-2013).
David M. Thomas (1949)
Year of Election or Appointment: 2008
Trustee
Lead Independent Trustee
Mr. Thomas also serves as Trustee of other Fidelity ® funds. Previously, Mr. Thomas served as Executive Chairman (2005-2006) and Chairman and Chief Executive Officer (2000-2005) of IMS Health, Inc. (pharmaceutical and healthcare information solutions). Mr. Thomas currently serves as a member of the Board of Fortune Brands Home and Security (home and security products, 2004-present) and as Director (2013-present) and Non-Executive Chairman of the Board (2022-present) of Interpublic Group of Companies, Inc. (marketing communication).
Susan Tomasky (1953)
Year of Election or Appointment: 2020
Trustee
Ms. Tomasky also serves as Trustee of other Fidelity ® funds. Prior to her retirement, Ms. Tomasky served in various executive officer positions at American Electric Power Company, Inc. (1998-2011), including most recently as President of AEP Transmission (2007-2011). Ms. Tomasky currently serves as a member of the Board and Sustainability Committee and as Chair of the Audit Committee of Marathon Petroleum Corporation (2018-present) and as a member of the Board, Executive Committee, Corporate Governance Committee and Organization and Compensation Committee and as Chair of the Audit Committee of Public Service Enterprise Group, Inc. (utilities company, 2012-present) and as a member of the Board of its subsidiary company, Public Service Electric and Gas Co. (2021-present). In addition, Ms. Tomasky currently serves as a member (2009-present) and President (2020-present) of the Board of the Royal Shakespeare Company - America (2009-present), as a member of the Board of the Columbus Association for the Performing Arts (2011-present) and as a member of the Board and Kenyon in the World Committee of Kenyon College (2016-present). Previously, Ms. Tomasky served as a Member of the Advisory Board of certain Fidelity ® funds (2020), as a member of the Board of the Columbus Regional Airport Authority (2007-2020), as a member of the Board (2011-2018) and Lead Independent Director (2015-2018) of Andeavor Corporation (previously Tesoro Corporation) (independent oil refiner and marketer) and as a member of the Board of Summit Midstream Partners LP (energy, 2012-2018).
Michael E. Wiley (1950)
Year of Election or Appointment: 2018
Trustee
Mr. Wiley also serves as Trustee of other Fidelity ® funds. Previously, Mr. Wiley served as a member of the Advisory Board of certain Fidelity ® funds (2018-2020), Chairman, President and CEO of Baker Hughes, Inc. (oilfield services, 2000-2004). Mr. Wiley also previously served as a member of the Board of Andeavor Corporation (independent oil refiner and marketer, 2005-2018), a member of the Board of Andeavor Logistics LP (natural resources logistics, 2015-2018) and a member of the Board of High Point Resources (exploration and production, 2005-2020).
+ The information includes the Trustee's principal occupation during the last five years and other information relating to the experience, attributes, and skills relevant to the Trustee's qualifications to serve as a Trustee, which led to the conclusion that the Trustee should serve as a Trustee for the fund.
Advisory Board Members and Officers:
Correspondence intended for a Member of the Advisory Board (if any) may be sent to Fidelity Investments, P.O. Box 55235, Boston, Massachusetts 02205-5235. Correspondence intended for an officer or Peter S. Lynch may be sent to Fidelity Investments, 245 Summer Street, Boston, Massachusetts 02210. Officers appear below in alphabetical order.
Name, Year of Birth; Principal Occupation
Peter S. Lynch (1944)
Year of Election or Appointment: 2003
Member of the Advisory Board
Mr. Lynch also serves as a Member of the Advisory Board of other Fidelity ® funds. Mr. Lynch is Vice Chairman and a Director of Fidelity Management & Research Company LLC (investment adviser firm). In addition, Mr. Lynch serves as a Trustee of Boston College and as the Chairman of the Inner-City Scholarship Fund. Previously, Mr. Lynch served as Vice Chairman and a Director of FMR Co., Inc. (investment adviser firm) and on the Special Olympics International Board of Directors (1997-2006).
Craig S. Brown (1977)
Year of Election or Appointment: 2022
Deputy Treasurer
Mr. Brown also serves as an officer of other funds. Mr. Brown serves as Assistant Treasurer of FIMM, LLC (2021-present) and is an employee of Fidelity Investments (2013-present). Previously, Mr. Brown served as Assistant Treasurer of certain Fidelity ® funds (2019-2022).
John J. Burke III (1964)
Year of Election or Appointment: 2018
Chief Financial Officer
Mr. Burke also serves as Chief Financial Officer of other funds. Mr. Burke serves as Head of Investment Operations for Fidelity Fund and Investment Operations (2018-present) and is an employee of Fidelity Investments (1998-present). Previously Mr. Burke served as head of Asset Management Investment Operations (2012-2018).
William C. Coffey (1969)
Year of Election or Appointment: 2019
Assistant Secretary
Mr. Coffey also serves as Assistant Secretary of other funds. He is Senior Vice President and Deputy General Counsel of FMR LLC (diversified financial services company, 2010-present), and is an employee of Fidelity Investments. Previously, Mr. Coffey served as Secretary and CLO of certain funds (2018-2019); CLO, Secretary, and Senior Vice President of Fidelity Management & Research Company and FMR Co., Inc. (investment adviser firms, 2018-2019); Secretary of Fidelity SelectCo, LLC and Fidelity Investments Money Management, Inc. (investment adviser firms, 2018-2019); CLO of Fidelity Management & Research (Hong Kong) Limited, FMR Investment Management (UK) Limited, and Fidelity Management & Research (Japan) Limited (investment adviser firms, 2018-2019); and Assistant Secretary of certain funds (2009-2018).
Timothy M. Cohen (1969)
Year of Election or Appointment: 2018
Vice President
Mr. Cohen also serves as Vice President of other funds. Mr. Cohen serves as Co-Head of Equity (2018-present), a Director of Fidelity Management & Research (Japan) Limited (investment adviser firm, 2016-present), and is an employee of Fidelity Investments. Previously, Mr. Cohen served as Executive Vice President of Fidelity SelectCo, LLC (2019), Head of Global Equity Research (2016-2018), Chief Investment Officer - Equity and a Director of Fidelity Management & Research (U.K.) Inc. (investment adviser firm, 2013-2015) and as a Director of Fidelity Management & Research (Hong Kong) Limited (investment adviser firm, 2017).
Jonathan Davis (1968)
Year of Election or Appointment: 2010
Assistant Treasurer
Mr. Davis also serves as an officer of other funds. Mr. Davis serves as Assistant Treasurer of FIMM, LLC (2021-present), FMR Capital, Inc. (2017-present), FD Funds GP LLC (2021-present), FD Funds Holding LLC (2021-present), and FD Funds Management LLC (2021-present); and is an employee of Fidelity Investments. Previously, Mr. Davis served as Vice President and Associate General Counsel of FMR LLC (diversified financial services company, 2003-2010).
Laura M. Del Prato (1964)
Year of Election or Appointment: 2018
Assistant Treasurer
Ms. Del Prato also serves as an officer of other funds. Ms. Del Prato serves as Assistant Treasurer of FIMM, LLC (2021-present) and is an employee of Fidelity Investments (2017-present). Previously, Ms. Del Prato served as President and Treasurer of The North Carolina Capital Management Trust: Cash Portfolio and Term Portfolio (2018-2020). Prior to joining Fidelity Investments, Ms. Del Prato served as a Managing Director and Treasurer of the JPMorgan Mutual Funds (2014-2017). Prior to JPMorgan, Ms. Del Prato served as a partner at Cohen Fund Audit Services (accounting firm, 2012-2013) and KPMG LLP (accounting firm, 2004-2012).
Colm A. Hogan (1973)
Year of Election or Appointment: 2020
Assistant Treasurer
Mr. Hogan also serves as an officer of other funds. Mr. Hogan serves as Assistant Treasurer of FIMM, LLC (2021-present) and FMR Capital, Inc. (2017-present) and is an employee of Fidelity Investments (2005-present). Previously, Mr. Hogan served as Deputy Treasurer of certain Fidelity ® funds (2016-2020) and Assistant Treasurer of certain Fidelity ® funds (2016-2018).
Pamela R. Holding (1964)
Year of Election or Appointment: 2018
Vice President
Ms. Holding also serves as Vice President of other funds. Ms. Holding serves as Co-Head of Equity (2018-present) and is an employee of Fidelity Investments (2013-present). Previously, Ms. Holding served as Executive Vice President of Fidelity SelectCo, LLC (2019) and as Chief Investment Officer of Fidelity Institutional Asset Management (2013-2018).
Cynthia Lo Bessette (1969)
Year of Election or Appointment: 2019
Secretary and Chief Legal Officer (CLO)
Ms. Lo Bessette also serves as an officer of other funds. Ms. Lo Bessette serves as CLO, Secretary, and Senior Vice President of Fidelity Management & Research Company LLC (investment adviser firm, 2019-present); CLO of Fidelity Management & Research (Hong Kong) Limited, FMR Investment Management (UK) Limited, and Fidelity Management & Research (Japan) Limited (investment adviser firms, 2019-present); Secretary of FD Funds GP LLC (2021-present), FD Funds Holding LLC (2021-present), FD Funds Management LLC (2021-present), and Fidelity Diversifying Solutions LLC (investment adviser firm, 2022-present); and Assistant Secretary of FIMM, LLC (2019-present). She is a Senior Vice President and Deputy General Counsel of FMR LLC (diversified financial services company, 2019-present), and is an employee of Fidelity Investments. Previously, Ms. Lo Bessette served as CLO, Secretary, and Senior Vice President of FMR Co., Inc. (investment adviser firm, 2019); Secretary of Fidelity SelectCo, LLC and Fidelity Investments Money Management, Inc. (investment adviser firms, 2019). Prior to joining Fidelity Investments, Ms. Lo Bessette was Executive Vice President, General Counsel (2016-2019) and Senior Vice President, Deputy General Counsel (2015-2016) of OppenheimerFunds (investment management company) and Deputy Chief Legal Officer (2013-2015) of Jennison Associates LLC (investment adviser firm).
Chris Maher (1972)
Year of Election or Appointment: 2020
Deputy Treasurer
Mr. Maher also serves as an officer of other funds. Mr. Maher serves as Assistant Treasurer of FIMM, LLC (2021-present) and FMR Capital, Inc. (2017-present), and is an employee of Fidelity Investments (2008-present). Previously, Mr. Maher served as Assistant Treasurer of certain funds (2013-2020); Vice President of Asset Management Compliance (2013), Vice President of the Program Management Group of FMR (investment adviser firm, 2010-2013), and Vice President of Valuation Oversight (2008-2010).
Jason P. Pogorelec (1975)
Year of Election or Appointment: 2020
Chief Compliance Officer
Mr. Pogorelec also serves as Chief Compliance Officer of other funds. Mr. Pogorelec is a senior Vice President of Asset Management Compliance for Fidelity Investments and is an employee of Fidelity Investments (2006-present). Previously, Mr. Pogorelec served as Vice President, Associate General Counsel for Fidelity Investments (2010-2020) and Assistant Secretary of certain Fidelity funds (2015-2020).
Brett Segaloff (1972)
Year of Election or Appointment: 2021
Anti-Money Laundering (AML) Officer
Mr. Segaloff also serves as an AML Officer of other funds and other related entities. He is Director, Anti-Money Laundering (2007-present) of FMR LLC (diversified financial services company) and is an employee of Fidelity Investments (1996-present).
Stacie M. Smith (1974)
Year of Election or Appointment: 2016
President and Treasurer
Ms. Smith also serves as an officer of other funds. Ms. Smith serves as Assistant Treasurer of FIMM, LLC (2021-present) and FMR Capital, Inc. (2017-present), is an employee of Fidelity Investments (2009-present), and has served in other fund officer roles. Prior to joining Fidelity Investments, Ms. Smith served as Senior Audit Manager of Ernst & Young LLP (accounting firm, 1996-2009). Previously, Ms. Smith served as Assistant Treasurer (2013-2019) and Deputy Treasurer (2013-2016) of certain Fidelity ® funds.
Jim Wegmann (1979)
Year of Election or Appointment: 2019
Assistant Treasurer
Mr. Wegmann also serves as an officer of other funds. Mr. Wegmann serves as Assistant Treasurer of FIMM, LLC (2021-present) and is an employee of Fidelity Investments (2011-present). Previously, Mr. Wegmann served as Assistant Treasurer of certain Fidelity ® funds (2019-2021).
As a shareholder, you incur two types of costs: (1) transaction costs, which may include sales charges (loads) on purchase payments or redemption proceeds, as applicable and (2) ongoing costs, which generally include management fees, distribution and/or service (12b-1) fees and other Fund expenses. This Example is intended to help you understand your ongoing costs (in dollars) of investing in a fund and to compare these costs with the ongoing costs of investing in other mutual funds.
| The Example is based on an investment of $1,000 invested at the beginning of the period and held for the entire period (May 1, 2022 to October 31, 2022). |
Actual Expenses
The first line of the accompanying table provides information about actual account values and actual expenses. You may use the information in this line, together with the amount you invested, to estimate the expenses that you paid over the period. Simply divide your account value by $1,000.00 (for example, an $8,600 account value divided by $1,000.00 = 8.6), then multiply the result by the number in the first line for a class/Fund under the heading entitled "Expenses Paid During Period" to estimate the expenses you paid on your account during this period. If any fund is a shareholder of any underlying mutual funds or exchange-traded funds (ETFs) (the Underlying Funds), such fund indirectly bears its proportional share of the expenses of the Underlying Funds in addition to the direct expenses incurred presented in the table. These fees and expenses are not included in the annualized expense ratio used to calculate the expense estimate in the table below.
Hypothetical Example for Comparison Purposes
The second line of the accompanying table provides information about hypothetical account values and hypothetical expenses based on the actual expense ratio and an assumed rate of return of 5% per year before expenses, which is not the actual return. The hypothetical account values and expenses may not be used to estimate the actual ending account balance or expenses you paid for the period. You may use this information to compare the ongoing costs of investing in the Fund and other funds. To do so, compare this 5% hypothetical example with the 5% hypothetical examples that appear in the shareholder reports of the other funds. If any fund is a shareholder of any Underlying Funds, such fund indirectly bears its proportional share of the expenses of the Underlying Funds in addition to the direct expenses as presented in the table. These fees and expenses are not included in the annualized expense ratio used to calculate the expense estimate in the table below.
Please note that the expenses shown in the table are meant to highlight your ongoing costs only and do not reflect any transaction costs. Therefore, the second line of the table is useful in comparing ongoing costs only, and will not help you determine the relative total costs of owning different funds. In addition, if these transactional costs were included, your costs would have been higher.
| | | | | Annualized Expense Ratio- A | | Beginning Account Value May 1, 2022 | | Ending Account Value October 31, 2022 | | Expenses Paid During Period- C May 1, 2022 to October 31, 2022 |
| Fidelity® Disciplined Equity Fund | | | | | | | | | | |
| Fidelity® Disciplined Equity Fund | | | | .62% | | | | | | |
| Actual | | | | | | $ 1,000 | | $ 921.60 | | $ 3.00 |
Hypothetical- B | | | | | | $ 1,000 | | $ 1,022.08 | | $ 3.16 |
| Class K | | | | .52% | | | | | | |
| Actual | | | | | | $ 1,000 | | $ 921.90 | | $ 2.52 |
Hypothetical- B | | | | | | $ 1,000 | | $ 1,022.58 | | $ 2.65 |
| |
A Annualized expense ratio reflects expenses net of applicable fee waivers.
B 5% return per year before expenses
C Expenses are equal to the annualized expense ratio, multiplied by the average account value over the period, multiplied by 184/ 365 (to reflect the one-half year period). The fees and expenses of any Underlying Funds are not included in each annualized expense ratio.
The dividend and capital gains distributions for the fund(s) are available on Fidelity.com or Institutional.Fidelity.com.
The fund hereby designates as a capital gain dividend with respect to the taxable year ended October 31, 2022, $40,143,812, or, if subsequently determined to be different, the net capital gain of such year.
The fund will notify shareholders in January 2023 of amounts for use in preparing 2022 income tax returns.
Fidelity Disciplined Equity Fund
Each year, the Board of Trustees, including the Independent Trustees (together, the Board), votes on the renewal of the management contract with Fidelity Management & Research Company LLC (FMR) and the sub-advisory agreements (together, the Advisory Contracts) for the fund. FMR and the sub-advisers are referred to herein as the Investment Advisers. The Board, assisted by the advice of fund counsel and Independent Trustees' counsel, requests and considers a broad range of information relevant to the renewal of the Advisory Contracts throughout the year.
The Board meets regularly and, at each of its meetings, covers an extensive agenda of topics and materials and considers factors that are relevant to its annual consideration of the renewal of the fund's Advisory Contracts, including the services and support provided to the fund and its shareholders. The Board has established various standing committees (Committees), each composed of and chaired by Independent Trustees with varying backgrounds, to which the Board has assigned specific subject matter responsibilities in order to enhance effective decision-making by the Board. The Board, acting directly and through its Committees, requests and receives information concerning the annual consideration of the renewal of the fund's Advisory Contracts. The Board also meets as needed to review matters specifically related to the Board's annual consideration of the renewal of the Advisory Contracts. Members of the Board may also meet with trustees of other Fidelity funds through joint ad hoc committees to discuss certain matters relevant to all of the Fidelity funds.
At its May 2022 meeting, the Board unanimously determined to renew the fund's Advisory Contracts. In reaching its determination, the Board considered all factors it believed relevant, including (i) the nature, extent, and quality of the services provided to the fund and its shareholders (including the investment performance of the fund); (ii) the competitiveness relative to peer funds of the fund's management fee and the total expense ratio of a representative class (retail class); (iii) the total costs of the services provided by and the profits realized by Fidelity from its relationships with the fund; and (iv) the extent to which, if any, economies of scale exist and are realized as the fund grows, and whether any economies of scale are appropriately shared with fund shareholders.
In considering whether to renew the Advisory Contracts for the fund, the Board reached a determination, with the assistance of fund counsel and Independent Trustees' counsel and through the exercise of its business judgment, that the renewal of the Advisory Contracts was in the best interests of the fund and its shareholders and that the compensation payable under the Advisory Contracts was fair and reasonable. The Board's decision to renew the Advisory Contracts was not based on any single factor, but rather was based on a comprehensive consideration of all the information provided to the Board at its meetings throughout the year. The Board, in reaching its determination to renew the Advisory Contracts, was aware that shareholders of the fund have a broad range of investment choices available to them, including a wide choice among funds offered by Fidelity's competitors, and that the fund's shareholders, who have the opportunity to review and weigh the disclosure provided by the fund in its prospectus and other public disclosures, have chosen to invest in this fund, which is part of the Fidelity family of funds.
Nature, Extent, and Quality of Services Provided . The Board considered Fidelity's staffing as it relates to the fund, including the backgrounds of investment personnel of Fidelity, and also considered the fund's investment objective, strategies, and related investment philosophy. The Independent Trustees also had discussions with senior management of Fidelity's investment operations and investment groups. The Board considered the structure of the investment personnel compensation program and whether this structure provides appropriate incentives to act in the best interests of the fund. Additionally, the Board considered the portfolio managers' investments, if any, in the funds that they manage. The Board also considered the steps Fidelity had taken to ensure the continued provision of high quality services to the Fidelity funds during the COVID-19 pandemic, including the expansion of staff in client facing positions to maintain service levels in periods of high volumes and volatility.
Resources Dedicated to Investment Management and Support Services . The Board and the Fund Oversight and Research Committees reviewed the general qualifications and capabilities of Fidelity's investment staff, including its size, education, experience, and resources, as well as Fidelity's approach to recruiting, training, managing, and compensating investment personnel. The Board noted the resources devoted to expansion of Fidelity's global investment organization, and that Fidelity's analysts have extensive resources, tools, and capabilities that allow them to conduct sophisticated quantitative and fundamental analysis, as well as credit analysis of issuers, counterparties, and guarantors. Further, the Board considered that Fidelity's investment professionals have sufficient access to global information and data so as to provide competitive investment results over time, and that those professionals also have access to sophisticated tools that permit them to assess portfolio construction and risk and performance attribution characteristics continuously, as well as to transmit new information and research conclusions rapidly around the world. Additionally, in its deliberations, the Board considered Fidelity's trading, risk management, compliance, and technology and operations capabilities and resources, which are integral parts of the investment management process.
Shareholder and Administrative Services . The Board considered (i) the nature, extent, quality, and cost of advisory, administrative, and shareholder services performed by the Investment Advisers and their affiliates under the Advisory Contracts and under separate agreements covering transfer agency, pricing and bookkeeping, and securities lending services for the fund; (ii) the nature and extent of the supervision of third party service providers, principally custodians, subcustodians, and pricing vendors; and (iii) the resources devoted to, and the record of compliance with, the fund's compliance policies and procedures. The Board also reviewed the allocation of fund brokerage, including allocations to brokers affiliated with the Investment Advisers, the use of brokerage commissions to pay fund expenses, and the use of "soft" commission dollars to pay for research services.
The Board noted that the growth of fund assets over time across the complex allows Fidelity to reinvest in the development of services designed to enhance the value and convenience of the Fidelity funds as investment vehicles. These services include 24-hour access to account information and market information over the Internet and through telephone representatives, investor education materials, and asset allocation tools. The Board also considered that it reviews customer service metrics such as telephone response times, continuity of services on the website and metrics addressing services at Fidelity Investor Centers.
Investment in a Large Fund Family . The Board considered the benefits to shareholders of investing in a Fidelity fund, including the benefits of investing in a fund that is part of a large family of funds offering a variety of investment disciplines and providing a large variety of mutual fund investor services. The Board noted that Fidelity had taken, or had made recommendations that resulted in the Fidelity funds taking, a number of actions over the previous year that benefited particular funds, including: (i) continuing to dedicate additional resources to Fidelity's investment research process, which includes meetings with management of issuers of securities in which the funds invest; (ii) continuing efforts to enhance Fidelity's global research capabilities; (iii) launching new funds and ETFs with innovative structures, strategies and pricing and making other enhancements to meet client needs; (iv) launching new share classes of existing funds; (v) eliminating purchase minimums and broadening eligibility requirements for certain funds and share classes; (vi) reducing management fees and total expenses for certain target date funds and classes and index funds; (vii) lowering expenses for certain existing funds and classes by implementing or lowering expense caps; (viii) rationalizing product lines and gaining increased efficiencies from fund mergers and liquidations; (ix) continuing to develop, acquire and implement systems and technology to improve services to the funds and shareholders, strengthen information security, and increase efficiency; and (x) continuing to implement enhancements to further strengthen Fidelity's product line to increase investors' probability of success in achieving their investment goals, including retirement income goals.
Investment Performance . The Board considered whether the fund has operated in accordance with its investment objective, as well as its record of compliance with its investment restrictions and its performance history. The Board noted that the fund had portfolio manager changes in February 2019 and October 2019. The Board will continue to monitor closely the fund's performance, taking into account the portfolio manager changes.
The Board took into account discussions that occur at Board meetings throughout the year with representatives of the Investment Advisers about fund investment performance. In this regard the Board noted that as part of regularly scheduled fund reviews and other reports to the Board on fund performance, the Board considers annualized return information for the fund for different time periods, measured against an appropriate securities market index (benchmark index) and an appropriate peer group of funds with similar objectives (peer group). The Board also reviews and considers information about performance attribution. In its evaluation of fund investment performance, the Board gave particular attention to information indicating changes in performance of certain Fidelity funds for specific time periods and discussed with the Investment Advisers the reasons for any overperformance or underperformance.
In addition to reviewing absolute and relative fund performance, the Independent Trustees periodically consider the appropriateness of fund performance metrics in evaluating the results achieved. In general, the Independent Trustees believe that fund performance should be evaluated based on net performance (after fees and expenses) of the representative class, compared to appropriate benchmark indices, over appropriate time periods that may include full market cycles, and compared to peer groups, as applicable, over the same periods, taking into account relevant factors including the following: general market conditions; issuer-specific information; and fund cash flows and other factors.
The Independent Trustees recognize that shareholders evaluate performance on a net basis over their own holding periods, for which one-, three-, and five-year periods are often used as a proxy. For this reason, the performance information reviewed by the Board also included net cumulative total return information for the fund and an appropriate benchmark index and peer group for the most recent one-, three-, and five-year periods ended September 30, 2021, as shown below. Returns are shown compared to the 25th percentile (top of box, 75% beaten) and 75th percentile (bottom of box, 25% beaten) of the peer universe.
Fidelity Disciplined Equity Fund
The Board also considered that the fund's management fee is subject to upward or downward adjustment depending upon whether, and to what extent, the fund's investment performance for the performance period (a rolling 36-month period) exceeds, or is exceeded by, a securities index, thus leading to a performance adjustment for the same period. The Board noted that the performance adjustment provides FMR with a strong economic incentive to seek to achieve superior long-term performance for the fund's shareholders and helps to more closely align the interests of FMR and the shareholders of the fund.
Based on its review, the Board concluded that the nature, extent, and quality of services provided to the fund under the Advisory Contracts should continue to benefit the shareholders of the fund.
Competitiveness of Management Fee and Total Expense Ratio . The Board considered the fund's management fee and total expense ratio compared to "mapped groups" of competitive funds and classes created for the purpose of facilitating the Trustees' competitive analysis of management fees and total expenses. Fidelity creates "mapped groups" by combining similar Lipper investment objective categories that have comparable investment mandates. Combining Lipper investment objective categories aids the Board's management fee and total expense ratio comparisons by broadening the competitive group used for comparison.
Management Fee . The Board considered two proprietary management fee comparisons for the 12-month periods ended September 30 (June 30 for periods ended 2019 and 2018 and December 31 for periods prior to 2018) shown in basis points (BP) in the chart below. The group of Lipper funds used by the Board for management fee comparisons is referred to below as the "Total Mapped Group." The Total Mapped Group comparison focuses on a fund's standing in terms of gross management fees before expense reimbursements or caps, and without giving effect to the fund's performance adjustment, relative to the total universe of funds with comparable investment mandates, regardless of whether their management fee structures also are comparable. Funds with comparable investment mandates offer exposure to similar types of securities. Funds with comparable management fee structures have similar management fee contractual arrangements (e.g., flat rate charged for advisory services, all-inclusive fee rate, etc.). "TMG %" represents the percentage of funds in the Total Mapped Group that had management fees that were lower than the fund's. For example, a hypothetical TMG % of 20% would mean that 80% of the funds in the Total Mapped Group had higher, and 20% had lower, management fees than the fund. The fund's actual TMG %s and the number of funds in the Total Mapped Group are in the chart below. The "Asset-Sized Peer Group" (ASPG) comparison focuses on a fund's standing relative to a subset of non-Fidelity funds within the Total Mapped Group that are similar in size and management fee structure without taking into account performance adjustments, if any. For example, if a fund is in the first quartile of the ASPG, the fund's management fee ranks in the least expensive or lowest 25% of funds in the ASPG. The ASPG represents at least 15% of the funds in the Total Mapped Group with comparable asset size and management fee structures, subject to a minimum of 50 funds (or all funds in the Total Mapped Group if fewer than 50). Additional information, such as the ASPG quartile in which the fund's management fee rate ranked and the impact of the fund's performance adjustment, is also included in the chart and was considered by the Board.
Fidelity Disciplined Equity Fund
The Board noted that the fund's management fee rate ranked below the median of its Total Mapped Group and below the median of its ASPG for the 12-month period ended September 30, 2021. The Board also noted the effect of the fund's performance adjustment, if any, on the fund's management fee ranking.
The Board also considered that, for funds subject to the group fee, FMR agreed to voluntarily waive fees over a specified period of time in amounts designed to account for assets converted from certain funds to certain collective investment trusts.
Based on its review, the Board concluded that the fund's management fee is fair and reasonable in light of the services that the fund receives and the other factors considered.
Total Expense Ratio . In its review of the total expense ratio of the representative class (retail class), the Board considered the fund's management fee rate as well as other fund or class expenses, as applicable, such as transfer agent fees, pricing and bookkeeping fees, and custodial, legal, and audit fees. The Board noted the impact of the fund's performance adjustment. The Board also noted that Fidelity may agree to waive fees or reimburse expenses from time to time, and the extent to which, if any, it has done so for the fund. The fund's representative class is compared to those funds and classes in the Total Mapped Group (used by the Board for management fee comparisons) that have a similar sales load structure. The Board also considered a total expense ASPG comparison for the representative class, which focuses on the total expenses of the representative class relative to a subset of non-Fidelity funds within the total expense similar sales load structure group. The total expense ASPG is limited to 15 larger and 15 smaller classes in fund average assets for a total of 30 classes, where possible. The total expense ASPG comparison excludes performance adjustments and fund-paid 12b-1 fees to eliminate variability in fee structures.
The Board noted that the total net expense ratio of the retail class ranked below the similar sales load structure group competitive median and below the ASPG competitive median for the 12-month period ended September 30, 2021.
Fees Charged to Other Fidelity Clients . The Board also considered Fidelity fee structures and other information with respect to clients of Fidelity, such as other funds advised or subadvised by Fidelity, pension plan clients, and other institutional clients with similar mandates. The Board noted that a joint ad hoc committee created by it and the boards of other Fidelity funds periodically reviews and compares Fidelity's institutional investment advisory business with its business of providing services to the Fidelity funds and also noted the most recent findings of the committee. The Board noted that the committee's review included a consideration of the differences in services provided, fees charged, and costs incurred, as well as competition in the markets serving the different categories of clients.
Based on its review of total expense ratios and fees charged to other Fidelity clients, the Board concluded that the total expense ratio of each class of the fund was reasonable in light of the services that the fund and its shareholders receive and the other factors considered.
Costs of the Services and Profitability . The Board considered the revenues earned and the expenses incurred by Fidelity in conducting the business of developing, marketing, distributing, managing, administering and servicing the fund and servicing the fund's shareholders. The Board also considered the level of Fidelity's profits in respect of all the Fidelity funds.
On an annual basis, Fidelity presents to the Board information about the profitability of its relationships with the fund. Fidelity calculates profitability information for each fund, as well as aggregate profitability information for groups of Fidelity funds and all Fidelity funds, using a series of detailed revenue and cost allocation methodologies which originate with the books and records of Fidelity on which Fidelity's audited financial statements are based. The Audit Committee of the Board reviews any significant changes from the prior year's methodologies and the full Board approves such changes.
A public accounting firm has been engaged annually by the Board as part of the Board's assessment of Fidelity's profitability analysis. The engagement includes the review and assessment of the methodologies used by Fidelity in determining the revenues and expenses attributable to Fidelity's mutual fund business, and completion of agreed-upon procedures in respect of the mathematical accuracy of certain fund profitability information and its conformity to established allocation methodologies. After considering the reports issued under the engagement and information provided by Fidelity, the Board concluded that while other allocation methods may also be reasonable, Fidelity's profitability methodologies are reasonable in all material respects.
The Board also reviewed Fidelity's non-fund businesses and potential indirect benefits such businesses may have received as a result of their association with Fidelity's mutual fund business (i.e., fall-out benefits) as well as cases where Fidelity's affiliates may benefit from the funds' business. The Board considered areas where potential indirect benefits to the Fidelity funds from their relationships with Fidelity may exist. The Board's consideration of these matters was informed by the findings of a joint ad hoc committee created by it and the boards of other Fidelity funds to evaluate potential fall-out benefits.
The Board considered the costs of the services provided by and the profits realized by Fidelity in connection with the operation of the fund and was satisfied that the profitability was not excessive.
Economies of Scale . The Board considered whether there have been economies of scale in respect of the management of the Fidelity funds, whether the Fidelity funds (including the fund) have appropriately benefited from any such economies of scale, and whether there is potential for realization of any further economies of scale. The Board considered the extent to which the fund will benefit from economies of scale as assets grow through increased services to the fund, through waivers or reimbursements, or through fee or expense ratio reductions. The Board also noted that a committee (the Economies of Scale Committee) created by it and the boards of other Fidelity funds periodically analyzes whether Fidelity attains economies of scale in respect of the management and servicing of the Fidelity funds, whether the Fidelity funds have appropriately benefited from such economies of scale, and whether there is potential for realization of any further economies of scale.
The Board recognized that the fund's management contract incorporates a "group fee" structure, which provides for lower group fee rates as total "group assets" increase, and for higher group fee rates as total "group assets" decrease ("group assets" as defined in the management contract). FMR calculates the group fee rates based on a tiered asset "breakpoint" schedule that varies based on asset class. The Board considered that the group fee is designed to deliver the benefits of economies of scale to fund shareholders when total Fidelity fund assets increase, even if assets of any particular fund are unchanged or have declined, because some portion of Fidelity's costs are attributable to services provided to all Fidelity funds, and all funds benefit if those costs can be allocated among more assets. The Board further considered that Fidelity agreed to impose a temporary fee waiver in the form of additional breakpoints to the current breakpoint schedule. The Board concluded that, given the group fee structure, fund shareholders will benefit from lower management fees as "group assets" increase at the fund complex level, regardless of whether Fidelity achieves any such economies of scale.
The Board concluded, taking into account the analysis of the Economies of Scale Committee, that economies of scale, if any, are being appropriately shared between fund shareholders and Fidelity.
Additional Information Requested by the Board . In order to develop fully the factual basis for consideration of the Fidelity funds' advisory contracts, the Board requested and received additional information on certain topics, including: (i) fund flow and performance trends, in particular the underperformance of certain funds and strategies, and Fidelity's long-term strategies for certain funds, including any consideration of fund liquidations or mergers; (ii) the operation of performance fees, competitor use of performance fees, and consideration of the expansion of performance fees to additional funds; (iii) Fidelity's pricing philosophy compared to competitors; (iv) fund profitability methodology and data; (v) evaluation of competitive fund data and peer group classifications and fee and expense comparisons; (vi) the management fee and expense structures for different funds and classes and information about the differences between various fee and expense structures; (vii) group fee breakpoints and related voluntary fee waivers; and (viii) information regarding other accounts managed by Fidelity and the funds' sub-advisory arrangements.
Based on its evaluation of all of the conclusions noted above, and after considering all factors it believed relevant, the Board concluded that the advisory fee arrangements are fair and reasonable and that the fund's Advisory Contracts should be renewed.
1.538372.125
FDE-ANN-1222
Item 2.
Code of Ethics
As of the end of the period, October 31, 2022, Fidelity Capital Trust (the trust) has adopted a code of ethics, as defined in Item 2 of Form N-CSR, that applies to its President and Treasurer and its Chief Financial Officer. A copy of the code of ethics is filed as an exhibit to this Form N-CSR.
Item 3.
Audit Committee Financial Expert
The Board of Trustees of the trust has determined that Donald F. Donahue is an audit committee financial expert, as defined in Item 3 of Form N-CSR. Mr. Donahue is independent for purposes of Item 3 of Form N-CSR.
Item 4.
Principal Accountant Fees and Services
Fees and Services
The following table presents fees billed by Deloitte & Touche LLP, the member firms of Deloitte Touche Tohmatsu, and their respective affiliates (collectively, “Deloitte Entities ”) in each of the last two fiscal years for services rendered to Fidelity Stock Selector Small Cap Fund (the “Fund(s) ”):
Services Billed by Deloitte Entities
October 31, 2022 Fees A
| | | | |
| Audit Fees | Audit-Related Fees | Tax Fees | All Other Fees |
Fidelity Stock Selector Small Cap Fund | $44,100 | $- | $6,900 | $1,000 |
| | | | |
| Audit Fees | Audit-Related Fees | Tax Fees | All Other Fees |
Fidelity Stock Selector Small Cap Fund | $42,200 | $- | $7,200 | $1,000 |
A Amounts may reflect rounding.
The following table presents fees billed by PricewaterhouseCoopers LLP ( “PwC ”) in each of the last two fiscal years for services rendered to Fidelity Capital Appreciation Fund, Fidelity Disciplined Equity Fund, Fidelity Focused Stock Fund and Fidelity Value Fund (the “Fund(s) ”):
Services Billed by PwC
October 31, 2022 Fees A
| | | | |
| Audit Fees | Audit-Related Fees | Tax Fees | All Other Fees |
Fidelity Capital Appreciation Fund | $45,100 | $4,000 | $8,800 | $1,400 |
Fidelity Disciplined Equity Fund | $42,700 | $3,800 | $7,800 | $1,300 |
Fidelity Focused Stock Fund | $28,000 | $2,700 | $8,600 | $900 |
Fidelity Value Fund | $49,900 | $4,700 | $14,400 | $1,600 |
| | | | |
| Audit Fees | Audit-Related Fees | Tax Fees | All Other Fees |
Fidelity Capital Appreciation Fund | $46,300 | $4,200 | $10,900 | $1,400 |
Fidelity Disciplined Equity Fund | $41,500 | $4,000 | $7,600 | $1,400 |
Fidelity Focused Stock Fund | $27,200 | $2,800 | $8,400 | $1,000 |
Fidelity Value Fund | $48,500 | $5,000 | $14,000 | $1,700 |
A Amounts may reflect rounding.
The following table(s) present(s) fees billed by Deloitte Entities and PwC that were required to be approved by the Audit Committee for services that relate directly to the operations and financial reporting of the Fund(s) and that are rendered on behalf of Fidelity Management & Research Company LLC ("FMR") and entities controlling, controlled by, or under common control with FMR (not including any sub-adviser whose role is primarily portfolio management and is subcontracted with or overseen by another investment adviser) that provide ongoing services to the Fund(s) ( “Fund Service Providers ”):
Services Billed by Deloitte Entities
| | |
| October 31, 2022 A | October 31, 2021 A |
Audit-Related Fees | $- | $- |
Tax Fees | $- | $- |
All Other Fees | $- | $- |
A Amounts may reflect rounding.
Services Billed by PwC
| | |
| October 31, 2022 A | October 31, 2021 A |
Audit-Related Fees | $7,914,600 | $8,830,600 |
Tax Fees | $1,000 | $354,200 |
All Other Fees | $- | $- |
A Amounts may reflect rounding.
“Audit-Related Fees ” represent fees billed for assurance and related services that are reasonably related to the performance of the fund audit or the review of the fund's financial statements and that are not reported under Audit Fees.
“Tax Fees ” represent fees billed for tax compliance, tax advice or tax planning that relate directly to the operations and financial reporting of the fund.
“All Other Fees ” represent fees billed for services provided to the fund or Fund Service Provider, a significant portion of which are assurance related, that relate directly to the operations and financial reporting of the fund, excluding those services that are reported under Audit Fees, Audit-Related Fees or Tax Fees.
Assurance services must be performed by an independent public accountant.
* * *
The aggregate non-audit fees billed by Deloitte Entities and PwC for services rendered to the Fund(s), FMR (not including any sub-adviser whose role is primarily portfolio management and is subcontracted with or overseen by another investment adviser), and any Fund Service Provider for each of the last two fiscal years of the Fund(s) are as follows:
| | |
Billed By | October 31, 2022 A | October 31, 2021 A |
Deloitte Entities | $473,000 | $537,900 |
PwC | $12,943,000 | $14,549,900 |
A Amounts may reflect rounding.
The trust's Audit Committee has considered non-audit services that were not pre-approved that were provided by Deloitte Entities and PwC to Fund Service Providers to be compatible with maintaining the independence of Deloitte Entities and PwC in its(their) audit of the Fund(s), taking into account representations from Deloitte Entities and PwC, in accordance with Public Company Accounting Oversight Board rules, regarding its independence from the Fund(s) and its(their) related entities and FMR ’s review of the appropriateness and permissibility under applicable law of such non-audit services prior to their provision to the Fund(s) Service Providers.
Audit Committee Pre-Approval Policies and Procedures
The trust ’s Audit Committee must pre-approve all audit and non-audit services provided by a fund ’s independent registered public accounting firm relating to the operations or financial reporting of the fund. Prior to the commencement of any audit or non-audit services to a fund, the Audit Committee reviews the services to determine whether they are appropriate and permissible under applicable law.
The Audit Committee has adopted policies and procedures to, among other purposes, provide a framework for the Committee ’s consideration of non-audit services by the audit firms that audit the Fidelity funds. The policies and procedures require that any non-audit service provided by a fund audit firm to a Fidelity fund and any non-audit service provided by a fund auditor to a Fund Service Provider that relates directly to the operations and financial reporting of a Fidelity fund ( “Covered Service ”) are subject to approval by the Audit Committee before such service is provided.
All Covered Services must be approved in advance of provision of the service either: (i) by formal resolution of the Audit Committee, or (ii) by oral or written approval of the service by the Chair of the Audit Committee (or if the Chair is unavailable, such other member of the Audit Committee as may be designated by the Chair to act in the Chair ’s absence). The approval contemplated by (ii) above is permitted where the Treasurer determines that action on such an engagement is necessary before the next meeting of the Audit Committee.
Non-audit services provided by a fund audit firm to a Fund Service Provider that do not relate directly to the operations and financial reporting of a Fidelity fund are reported to the Audit Committee periodically.
Non-Audit Services Approved Pursuant to Rule 2-01(c)(7)(i)(C) and (ii) of Regulation S-X ( “De Minimis Exception ”)
There were no non-audit services approved or required to be approved by the Audit Committee pursuant to the De Minimis Exception during the Fund ’s(s ’) last two fiscal years relating to services provided to (i) the Fund(s) or (ii) any Fund Service Provider that relate directly to the operations and financial reporting of the Fund(s).
Item 5.
Audit Committee of Listed Registrants
Not applicable.
Item 6.
Investments
(a)
Not applicable.
(b)
Not applicable.
Item 7.
Disclosure of Proxy Voting Policies and Procedures for Closed-End Management Investment Companies
Not applicable.
Item 8.
Portfolio Managers of Closed-End Management Investment Companies
Not applicable.
Item 9.
Purchase of Equity Securities by Closed-End Management Investment Company and Affiliated Purchasers
Not applicable.
Item 10.
Submission of Matters to a Vote of Security Holders
There were no material changes to the procedures by which shareholders may recommend nominees to the trust ’s Board of Trustees.
Item 11.
Controls and Procedures
(a)(i) The President and Treasurer and the Chief Financial Officer have concluded that the trust ’s disclosure controls and procedures (as defined in Rule 30a-3(c) under the Investment Company Act) provide reasonable assurances that material information relating to the trust is made known to them by the appropriate persons, based on their evaluation of these controls and procedures as of a date within 90 days of the filing date of this report.
(a)(ii) There was no change in the trust ’s internal control over financial reporting (as defined in Rule 30a-3(d) under the Investment Company Act) that occurred during the period covered by this report that has materially affected, or is reasonably likely to materially affect, the trust ’s internal control over financial reporting.
Item 12.
Disclosure of Securities Lending Activities for Closed-End Management
Investment Companies
Not applicable.
Item 13.
Exhibits
SIGNATURES
Pursuant to the requirements of the Securities Exchange Act of 1934 and the Investment Company Act of 1940, the registrant has duly caused this report to be signed on its behalf by the undersigned, thereunto duly authorized.
Fidelity Capital Trust
| |
By: | /s/Stacie M. Smith |
| Stacie M. Smith |
| President and Treasurer |
|
|
Date: | December 21, 2022 |
Pursuant to the requirements of the Securities Exchange Act of 1934 and the Investment Company Act of 1940, this report has been signed below by the following persons on behalf of the registrant and in the capacities and on the dates indicated.
| |
By: | /s/Stacie M. Smith |
| Stacie M. Smith |
| President and Treasurer |
|
|
Date: | December 21, 2022 |
| |
By: | /s/John J. Burke III |
| John J. Burke III |
| Chief Financial Officer |
|
|
Date: | December 21, 2022 |