UNITED STATES
SECURITIES AND EXCHANGE COMMISSION
Washington, D.C. 20549
FORM N-CSR
CERTIFIED SHAREHOLDER REPORT OF REGISTERED
MANAGEMENT INVESTMENT COMPANIES
Investment Company Act file number 811-02841
Fidelity Capital Trust
(Exact name of registrant as specified in charter)
245 Summer St., Boston, MA 02210
(Address of principal executive offices) (Zip code)
Margaret Carey, Secretary
245 Summer St.
Boston, Massachusetts 02210
(Name and address of agent for service)
Registrant's telephone number, including area code:
617-563-7000
| |
Date of fiscal year end: | October 31 |
|
|
Date of reporting period: | April 30, 2024 |
Item 1.
Reports to Stockholders
Fidelity® Value Fund
Semi-Annual Report
April 30, 2024
Contents
To view a fund's proxy voting guidelines and proxy voting record for the 12-month period ended June 30, visit http://www.fidelity.com/proxyvotingresults or visit the Securities and Exchange Commission's (SEC) web site at http://www.sec.gov.
You may also call 1-800-544-8544 if you're an individual investing directly with Fidelity, call 1-800-835-5092 if you're a plan sponsor or participant with Fidelity as your recordkeeper or call 1-877-208-0098 on institutional accounts or if you're an advisor or invest through one to request a free copy of the proxy voting guidelines.
Standard & Poor's, S&P and S&P 500 are registered service marks of The McGraw-Hill Companies, Inc. and have been licensed for use by Fidelity Distributors Corporation.
Other third-party marks appearing herein are the property of their respective owners.
All other marks appearing herein are registered or unregistered trademarks or service marks of FMR LLC or an affiliated company. © 2024 FMR LLC. All rights reserved.
This report and the financial statements contained herein are submitted for the general information of the shareholders of the Fund. This report is not authorized for distribution to prospective investors in the Fund unless preceded or accompanied by an effective prospectus.
A fund files its complete schedule of portfolio holdings with the SEC for the first and third quarters of each fiscal year on Form N-PORT. Forms N-PORT are available on the SEC's web site at http://www.sec.gov. A fund's Forms N-PORT may be reviewed and copied at the SEC's Public Reference Room in Washington, DC. Information regarding the operation of the SEC's Public Reference Room may be obtained by calling 1-800-SEC-0330.
For a complete list of a fund's portfolio holdings, view the most recent holdings listing, semiannual report, or annual report on Fidelity's web site at http://www.fidelity.com, http://www.institutional.fidelity.com, or http://www.401k.com, as applicable.
NOT FDIC INSURED •MAY LOSE VALUE •NO BANK GUARANTEE
Neither the Fund nor Fidelity Distributors Corporation is a bank.
Top Holdings (% of Fund's net assets) |
| |
| Constellation Energy Corp. | 1.6 | |
| Antero Resources Corp. | 1.1 | |
| PG&E Corp. | 1.0 | |
| Global Payments, Inc. | 1.0 | |
| The AES Corp. | 0.9 | |
| WestRock Co. | 0.9 | |
| Expro Group Holdings NV | 0.9 | |
| Cenovus Energy, Inc. (Canada) | 0.9 | |
| Flex Ltd. | 0.8 | |
| Apollo Global Management, Inc. | 0.8 | |
| | 9.9 | |
| |
| Market Sectors (% of Fund's net assets) |
| |
| Financials | 18.6 | |
| Industrials | 18.5 | |
| Consumer Discretionary | 11.8 | |
| Materials | 11.0 | |
| Energy | 10.4 | |
| Utilities | 8.4 | |
| Health Care | 6.3 | |
| Real Estate | 4.6 | |
| Consumer Staples | 3.2 | |
| Communication Services | 3.1 | |
| Information Technology | 2.9 | |
| |
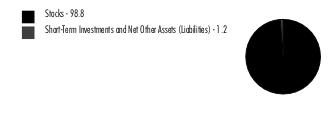
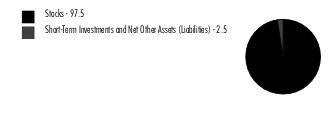
Asset Allocation (% of Fund's net assets) |
|
Futures - 0.9% |
|
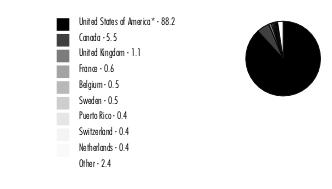
Geographic Diversification (% of Fund's net assets) |
|
* Includes Short-Term investments and Net Other Assets (Liabilities). Percentages are adjusted for the effect of derivatives, if applicable. |
| |
Showing Percentage of Net Assets
| Common Stocks - 98.8% |
| | | Shares | Value ($) (000s) |
| COMMUNICATION SERVICES - 3.1% | | | |
| Diversified Telecommunication Services - 0.3% | | | |
| Cellnex Telecom SA (a) | | 836,400 | 27,647 |
| Entertainment - 0.2% | | | |
| Ubisoft Entertainment SA (b) | | 804,600 | 19,037 |
| Interactive Media & Services - 0.4% | | | |
| Zoominfo Technologies, Inc. (b) | | 2,437,400 | 38,657 |
| Media - 2.2% | | | |
| Grupo Televisa SA de CV (CPO) sponsored ADR (c) | | 10,854,671 | 31,696 |
| Interpublic Group of Companies, Inc. | | 1,859,900 | 56,615 |
| Nexstar Media Group, Inc. Class A | | 237,200 | 37,966 |
| Thryv Holdings, Inc. (b) | | 1,572,263 | 36,178 |
| WPP PLC | | 3,634,600 | 36,430 |
| | | | 198,885 |
TOTAL COMMUNICATION SERVICES | | | 284,226 |
| CONSUMER DISCRETIONARY - 11.8% | | | |
| Automobile Components - 1.2% | | | |
| Aptiv PLC (b) | | 893,900 | 63,467 |
| Autoliv, Inc. | | 372,600 | 44,634 |
| Cie Automotive SA | | 66,805 | 1,775 |
| | | | 109,876 |
| Automobiles - 0.6% | | | |
| Harley-Davidson, Inc. | | 1,589,400 | 54,659 |
| Broadline Retail - 0.4% | | | |
| Kohl's Corp. (c) | | 1,349,900 | 32,317 |
| Distributors - 0.3% | | | |
| LKQ Corp. | | 621,900 | 26,823 |
| Diversified Consumer Services - 0.2% | | | |
| H&R Block, Inc. | | 472,822 | 22,331 |
| Hotels, Restaurants & Leisure - 1.5% | | | |
| Brinker International, Inc. (b) | | 916,657 | 49,133 |
| Everi Holdings, Inc. (b) | | 1,943,400 | 15,878 |
| Hilton Grand Vacations, Inc. (b) | | 851,200 | 35,444 |
| Marriott Vacations Worldwide Corp. | | 249,100 | 23,941 |
| Red Rock Resorts, Inc. | | 240,893 | 12,796 |
| | | | 137,192 |
| Household Durables - 1.3% | | | |
| Mohawk Industries, Inc. (b) | | 333,800 | 38,494 |
| Newell Brands, Inc. (c) | | 3,306,900 | 26,257 |
| Tempur Sealy International, Inc. | | 1,020,300 | 51,076 |
| | | | 115,827 |
| Leisure Products - 1.3% | | | |
| BRP, Inc. | | 692,000 | 46,557 |
| Brunswick Corp. | | 365,900 | 29,506 |
| Topgolf Callaway Brands Corp. (b) | | 2,809,700 | 45,011 |
| | | | 121,074 |
| Specialty Retail - 2.9% | | | |
| Academy Sports & Outdoors, Inc. | | 457,679 | 26,683 |
| Camping World Holdings, Inc. (c) | | 1,577,400 | 31,974 |
| Gap, Inc. | | 375,200 | 7,699 |
| Lithia Motors, Inc. Class A (sub. vtg.) (c) | | 207,800 | 52,860 |
| Sally Beauty Holdings, Inc. (b) | | 2,393,290 | 25,967 |
| Signet Jewelers Ltd. (c) | | 499,677 | 48,983 |
| Upbound Group, Inc. | | 1,533,274 | 47,547 |
| Victoria's Secret & Co. (b) | | 1,598,733 | 28,170 |
| | | | 269,883 |
| Textiles, Apparel & Luxury Goods - 2.1% | | | |
| Dr. Martens Ltd. (c) | | 14,428,400 | 13,702 |
| Gildan Activewear, Inc. | | 1,383,200 | 47,947 |
| PVH Corp. | | 492,000 | 53,530 |
| Samsonite International SA (a) | | 13,397,400 | 47,101 |
| Tapestry, Inc. | | 688,700 | 27,493 |
| | | | 189,773 |
TOTAL CONSUMER DISCRETIONARY | | | 1,079,755 |
| CONSUMER STAPLES - 3.2% | | | |
| Beverages - 0.3% | | | |
| Keurig Dr. Pepper, Inc. | | 812,200 | 27,371 |
| Consumer Staples Distribution & Retail - 0.6% | | | |
| U.S. Foods Holding Corp. (b) | | 1,038,100 | 52,165 |
| Food Products - 1.6% | | | |
| Archer Daniels Midland Co. | | 637,800 | 37,413 |
| Bunge Global SA | | 545,200 | 55,480 |
| Darling Ingredients, Inc. (b) | | 1,144,294 | 48,484 |
| Lamb Weston Holdings, Inc. | | 31,100 | 2,592 |
| | | | 143,969 |
| Personal Care Products - 0.4% | | | |
| Kenvue, Inc. | | 2,078,900 | 39,125 |
| Tobacco - 0.3% | | | |
| Philip Morris International, Inc. | | 328,300 | 31,169 |
TOTAL CONSUMER STAPLES | | | 293,799 |
| ENERGY - 10.4% | | | |
| Energy Equipment & Services - 3.8% | | | |
| Baker Hughes Co. Class A | | 1,705,800 | 55,643 |
| Expro Group Holdings NV (b) | | 4,206,000 | 78,905 |
| John Wood Group PLC (b) | | 2,440,021 | 4,525 |
| Liberty Oilfield Services, Inc. Class A | | 673,485 | 14,817 |
| Secure Energy Services, Inc. | | 3,208,100 | 27,172 |
| Tenaris SA | | 1,738,600 | 29,084 |
| Tidewater, Inc. (b) | | 505,900 | 46,467 |
| Valaris Ltd. (b) | | 813,500 | 52,926 |
| Vallourec SA (b) | | 2,309,700 | 40,092 |
| | | | 349,631 |
| Oil, Gas & Consumable Fuels - 6.6% | | | |
| Antero Resources Corp. (b) | | 2,866,100 | 97,476 |
| Canadian Natural Resources Ltd. | | 605,500 | 45,884 |
| Cenovus Energy, Inc. (Canada) | | 3,819,581 | 78,464 |
| Delek U.S. Holdings, Inc. (c) | | 974,400 | 26,630 |
| Diamondback Energy, Inc. | | 143,631 | 28,889 |
| Energy Transfer LP | | 2,351,097 | 36,983 |
| Imperial Oil Ltd. | | 699,900 | 48,121 |
| Imperial Oil Ltd. (U.S.) (c) | | 130,200 | 8,977 |
| Kosmos Energy Ltd. (b) | | 4,059,158 | 23,015 |
| MEG Energy Corp. (b) | | 762,100 | 17,333 |
| Phillips 66 Co. | | 423,900 | 60,707 |
| Range Resources Corp. | | 494,700 | 17,765 |
| Targa Resources Corp. | | 580,780 | 66,244 |
| Tourmaline Oil Corp. | | 892,600 | 43,623 |
| | | | 600,111 |
TOTAL ENERGY | | | 949,742 |
| FINANCIALS - 18.6% | | | |
| Banks - 3.5% | | | |
| Axos Financial, Inc. (b) | | 396,869 | 20,086 |
| Barclays PLC | | 4,118,700 | 10,384 |
| East West Bancorp, Inc. | | 634,566 | 47,269 |
| First Citizens Bancshares, Inc. | | 35,792 | 60,373 |
| First Citizens Bancshares, Inc. Class B | | 6,100 | 9,242 |
| KeyCorp | | 3,452,000 | 50,019 |
| M&T Bank Corp. | | 70,800 | 10,223 |
| Popular, Inc. | | 468,800 | 39,843 |
| U.S. Bancorp | | 1,175,600 | 47,765 |
| Webster Financial Corp. | | 713,800 | 31,286 |
| | | | 326,490 |
| Capital Markets - 3.5% | | | |
| Ameriprise Financial, Inc. | | 109,500 | 45,091 |
| BGC Group, Inc. Class A | | 5,558,930 | 43,526 |
| Carlyle Group LP | | 1,094,800 | 49,047 |
| LPL Financial | | 190,700 | 51,323 |
| Onex Corp. (sub. vtg.) | | 264,200 | 18,744 |
| Petershill Partners PLC (a) | | 8,282,600 | 21,579 |
| Raymond James Financial, Inc. | | 408,700 | 49,861 |
| UBS Group AG | | 1,508,810 | 39,836 |
| | | | 319,007 |
| Consumer Finance - 2.3% | | | |
| Ally Financial, Inc. | | 1,290,000 | 49,472 |
| Navient Corp. | | 1,394,200 | 20,941 |
| OneMain Holdings, Inc. | | 1,031,380 | 53,745 |
| PROG Holdings, Inc. | | 1,190,482 | 39,572 |
| SLM Corp. | | 2,236,679 | 47,395 |
| | | | 211,125 |
| Financial Services - 4.4% | | | |
| Apollo Global Management, Inc. | | 714,502 | 77,438 |
| Corebridge Financial, Inc. (c) | | 1,349,700 | 35,848 |
| ECN Capital Corp. | | 8,921,393 | 11,406 |
| Essent Group Ltd. | | 941,800 | 49,887 |
| Global Payments, Inc. | | 737,200 | 90,506 |
| NCR Atleos Corp. | | 2,204,150 | 43,929 |
| Voya Financial, Inc. | | 653,100 | 44,515 |
| WEX, Inc. (b) | | 227,700 | 48,104 |
| | | | 401,633 |
| Insurance - 4.9% | | | |
| AMBAC Financial Group, Inc. (b) | | 1,921,502 | 27,766 |
| American Financial Group, Inc. | | 467,500 | 59,723 |
| Assurant, Inc. | | 216,179 | 37,702 |
| First American Financial Corp. | | 787,300 | 42,176 |
| Globe Life, Inc. | | 424,824 | 32,359 |
| Hartford Financial Services Group, Inc. | | 651,000 | 63,075 |
| Primerica, Inc. | | 111,523 | 23,627 |
| Prudential PLC | | 1,918,500 | 16,686 |
| Reinsurance Group of America, Inc. | | 288,649 | 53,974 |
| Stewart Information Services Corp. | | 329,908 | 20,458 |
| The Travelers Companies, Inc. | | 254,400 | 53,974 |
| Unum Group | | 314,300 | 15,935 |
| | | | 447,455 |
TOTAL FINANCIALS | | | 1,705,710 |
| HEALTH CARE - 6.3% | | | |
| Biotechnology - 0.5% | | | |
| Alnylam Pharmaceuticals, Inc. (b) | | 11,400 | 1,641 |
| Biogen, Inc. (b) | | 50,965 | 10,948 |
| BioMarin Pharmaceutical, Inc. (b) | | 47,465 | 3,833 |
| Exact Sciences Corp. (b) | | 52,898 | 3,139 |
| Galapagos NV (b) | | 711,900 | 20,136 |
| United Therapeutics Corp. (b) | | 13,677 | 3,205 |
| | | | 42,902 |
| Health Care Equipment & Supplies - 0.8% | | | |
| Baxter International, Inc. | | 491,198 | 19,830 |
| Dentsply Sirona, Inc. | | 73,803 | 2,215 |
| Globus Medical, Inc. (b)(c) | | 34,800 | 1,733 |
| Hologic, Inc. (b) | | 98,232 | 7,443 |
| QuidelOrtho Corp. (b) | | 486,000 | 19,707 |
| STERIS PLC | | 26,775 | 5,477 |
| Teleflex, Inc. | | 15,110 | 3,154 |
| The Cooper Companies, Inc. | | 97,040 | 8,642 |
| Zimmer Biomet Holdings, Inc. | | 74,113 | 8,914 |
| | | | 77,115 |
| Health Care Providers & Services - 3.1% | | | |
| Acadia Healthcare Co., Inc. (b) | | 65,554 | 4,847 |
| AdaptHealth Corp. (b) | | 2,722,896 | 26,821 |
| BrightSpring Health Services, Inc. | | 1,748,400 | 18,690 |
| Cencora, Inc. | | 53,041 | 12,679 |
| Centene Corp. (b) | | 691,400 | 50,514 |
| Chemed Corp. | | 6,600 | 3,749 |
| Cigna Group | | 144,949 | 51,753 |
| CVS Health Corp. | | 610,500 | 41,337 |
| Encompass Health Corp. | | 57,752 | 4,815 |
| Henry Schein, Inc. (b) | | 47,342 | 3,280 |
| Humana, Inc. | | 92,700 | 28,004 |
| Molina Healthcare, Inc. (b) | | 26,468 | 9,055 |
| PACS Group, Inc. | | 815,400 | 20,361 |
| Quest Diagnostics, Inc. | | 71,414 | 9,868 |
| R1 RCM, Inc. (b) | | 46,200 | 568 |
| Tenet Healthcare Corp. (b) | | 31,100 | 3,492 |
| | | | 289,833 |
| Health Care Technology - 0.0% | | | |
| Doximity, Inc. (b) | | 19,700 | 479 |
| Life Sciences Tools & Services - 0.8% | | | |
| Agilent Technologies, Inc. | | 55,311 | 7,580 |
| Avantor, Inc. (b) | | 216,000 | 5,234 |
| Bio-Rad Laboratories, Inc. Class A (b) | | 10,906 | 2,942 |
| Charles River Laboratories International, Inc. (b) | | 27,726 | 6,349 |
| Fortrea Holdings, Inc. | | 822,500 | 30,095 |
| ICON PLC (b) | | 37,503 | 11,171 |
| Illumina, Inc. (b) | | 28,510 | 3,508 |
| Revvity, Inc. | | 19,700 | 2,019 |
| West Pharmaceutical Services, Inc. | | 4,700 | 1,680 |
| | | | 70,578 |
| Pharmaceuticals - 1.1% | | | |
| Bausch Health Cos., Inc. (United States) (b)(c) | | 76,800 | 673 |
| Catalent, Inc. (b) | | 44,176 | 2,467 |
| Elanco Animal Health, Inc. (b) | | 152,600 | 2,008 |
| Jazz Pharmaceuticals PLC (b) | | 276,867 | 30,663 |
| Organon & Co. | | 51,300 | 955 |
| Perrigo Co. PLC | | 60,100 | 1,963 |
| Royalty Pharma PLC | | 281,124 | 7,787 |
| Teva Pharmaceutical Industries Ltd. sponsored ADR (b) | | 2,500,600 | 35,133 |
| Viatris, Inc. | | 1,746,200 | 20,204 |
| | | | 101,853 |
TOTAL HEALTH CARE | | | 582,760 |
| INDUSTRIALS - 18.5% | | | |
| Air Freight & Logistics - 0.6% | | | |
| DHL Group | | 272,500 | 11,410 |
| FedEx Corp. | | 179,700 | 47,042 |
| | | | 58,452 |
| Building Products - 2.4% | | | |
| AZZ, Inc. | | 383,600 | 27,477 |
| Builders FirstSource, Inc. (b) | | 272,350 | 49,791 |
| Johnson Controls International PLC | | 785,700 | 51,125 |
| Tecnoglass, Inc. (c) | | 893,400 | 49,628 |
| UFP Industries, Inc. | | 338,400 | 38,138 |
| | | | 216,159 |
| Commercial Services & Supplies - 2.0% | | | |
| Driven Brands Holdings, Inc. (b) | | 2,532,600 | 36,292 |
| HNI Corp. | | 394,261 | 16,539 |
| The Brink's Co. | | 567,800 | 49,660 |
| The GEO Group, Inc. (b)(c) | | 1,960,958 | 29,140 |
| Vestis Corp. | | 2,729,137 | 50,271 |
| | | | 181,902 |
| Construction & Engineering - 1.6% | | | |
| Fluor Corp. (b) | | 1,027,000 | 41,419 |
| Granite Construction, Inc. | | 277,800 | 15,418 |
| MDU Resources Group, Inc. | | 1,922,400 | 47,483 |
| Willscot Mobile Mini Holdings (b) | | 1,216,400 | 44,958 |
| | | | 149,278 |
| Electrical Equipment - 1.4% | | | |
| Acuity Brands, Inc. | | 170,200 | 42,261 |
| GrafTech International Ltd. | | 4,838,609 | 8,322 |
| Regal Rexnord Corp. | | 339,156 | 54,730 |
| Siemens Energy AG (b) | | 935,800 | 19,275 |
| | | | 124,588 |
| Ground Transportation - 2.3% | | | |
| ArcBest Corp. | | 297,700 | 33,018 |
| Ryder System, Inc. | | 367,870 | 44,825 |
| TFI International, Inc. (Canada) | | 274,600 | 35,761 |
| U-Haul Holding Co. (non-vtg.) | | 757,625 | 46,458 |
| XPO, Inc. (b) | | 434,400 | 46,681 |
| | | | 206,743 |
| Machinery - 4.2% | | | |
| Allison Transmission Holdings, Inc. | | 706,429 | 51,958 |
| Atmus Filtration Technologies, Inc. | | 1,500,700 | 45,456 |
| Barnes Group, Inc. | | 1,215,600 | 42,206 |
| Chart Industries, Inc. (b)(c) | | 272,500 | 39,256 |
| CNH Industrial NV | | 3,236,400 | 36,895 |
| Gates Industrial Corp. PLC (b) | | 2,665,200 | 46,961 |
| Oshkosh Corp. | | 346,500 | 38,902 |
| Terex Corp. | | 489,600 | 27,442 |
| Timken Co. | | 676,996 | 60,402 |
| | | | 389,478 |
| Professional Services - 1.9% | | | |
| Clarivate PLC (b)(c) | | 4,777,773 | 32,298 |
| Concentrix Corp. | | 652,000 | 35,645 |
| First Advantage Corp. (c) | | 1,414,700 | 23,060 |
| Genpact Ltd. | | 698,700 | 21,478 |
| ManpowerGroup, Inc. | | 435,692 | 32,873 |
| WNS Holdings Ltd. | | 774,996 | 32,480 |
| | | | 177,834 |
| Trading Companies & Distributors - 2.1% | | | |
| Beacon Roofing Supply, Inc. (b) | | 255,600 | 25,184 |
| GMS, Inc. (b) | | 470,600 | 43,540 |
| Herc Holdings, Inc. | | 334,700 | 47,872 |
| Rush Enterprises, Inc. Class A | | 225,620 | 9,909 |
| WESCO International, Inc. | | 419,000 | 64,002 |
| | | | 190,507 |
TOTAL INDUSTRIALS | | | 1,694,941 |
| INFORMATION TECHNOLOGY - 2.9% | | | |
| Communications Equipment - 0.8% | | | |
| Ciena Corp. (b) | | 612,000 | 28,293 |
| Lumentum Holdings, Inc. (b) | | 1,070,694 | 46,854 |
| | | | 75,147 |
| Electronic Equipment, Instruments & Components - 0.8% | | | |
| Flex Ltd. (b) | | 2,717,311 | 77,851 |
| IT Services - 0.3% | | | |
| GoDaddy, Inc. (b) | | 202,700 | 24,806 |
| Semiconductors & Semiconductor Equipment - 0.6% | | | |
| First Solar, Inc. (b) | | 201,900 | 35,595 |
| ON Semiconductor Corp. (b) | | 244,600 | 17,161 |
| | | | 52,756 |
| Software - 0.4% | | | |
| NCR Voyix Corp. (b) | | 3,249,207 | 39,803 |
TOTAL INFORMATION TECHNOLOGY | | | 270,363 |
| MATERIALS - 11.0% | | | |
| Chemicals - 5.0% | | | |
| Axalta Coating Systems Ltd. (b) | | 885,737 | 27,848 |
| Cabot Corp. | | 443,100 | 40,424 |
| Celanese Corp. Class A | | 147,288 | 22,625 |
| Corteva, Inc. | | 763,312 | 41,318 |
| Methanex Corp. | | 1,030,419 | 49,367 |
| OCI NV | | 1,440,500 | 38,894 |
| Olin Corp. | | 890,400 | 46,550 |
| Syensqo SA | | 332,400 | 30,930 |
| The Chemours Co. LLC | | 2,334,645 | 62,452 |
| Tronox Holdings PLC | | 1,825,055 | 31,008 |
| Westlake Corp. | | 485,449 | 71,536 |
| | | | 462,952 |
| Construction Materials - 1.1% | | | |
| Eagle Materials, Inc. | | 139,900 | 35,074 |
| GCC S.A.B. de CV | | 2,994,900 | 34,088 |
| Martin Marietta Materials, Inc. | | 48,868 | 28,689 |
| | | | 97,851 |
| Containers & Packaging - 1.8% | | | |
| Berry Global Group, Inc. | | 249,000 | 14,103 |
| Graphic Packaging Holding Co. | | 1,431,300 | 36,999 |
| International Paper Co. | | 337,900 | 11,806 |
| O-I Glass, Inc. (b) | | 1,753,084 | 26,226 |
| WestRock Co. | | 1,688,800 | 80,995 |
| | | | 170,129 |
| Metals & Mining - 2.0% | | | |
| ATI, Inc. (b) | | 602,600 | 35,975 |
| Compass Minerals International, Inc. (c) | | 1,035,400 | 12,891 |
| Constellium NV (b) | | 3,774,614 | 74,322 |
| First Quantum Minerals Ltd. | | 1,286,563 | 16,336 |
| Perseus Mining Ltd. (Australia) | | 1,719,345 | 2,515 |
| Radius Recycling, Inc. Class A | | 685,000 | 11,933 |
| Steel Dynamics, Inc. | | 198,811 | 25,869 |
| | | | 179,841 |
| Paper & Forest Products - 1.1% | | | |
| Interfor Corp. (b)(d) | | 3,277,326 | 41,590 |
| Louisiana-Pacific Corp. | | 755,097 | 55,266 |
| | | | 96,856 |
TOTAL MATERIALS | | | 1,007,629 |
| REAL ESTATE - 4.6% | | | |
| Equity Real Estate Investment Trusts (REITs) - 4.0% | | | |
| Camden Property Trust (SBI) | | 515,800 | 51,415 |
| Extra Space Storage, Inc. | | 283,600 | 38,082 |
| Lamar Advertising Co. Class A | | 261,900 | 30,341 |
| Outfront Media, Inc. | | 2,924,137 | 46,377 |
| Prologis, Inc. | | 420,602 | 42,922 |
| Sun Communities, Inc. | | 196,100 | 21,830 |
| Ventas, Inc. | | 1,559,000 | 69,033 |
| Welltower, Inc. | | 710,800 | 67,725 |
| | | | 367,725 |
| Real Estate Management & Development - 0.6% | | | |
| Compass, Inc. (b) | | 11,235,676 | 35,392 |
| Newmark Group, Inc. | | 1,792,700 | 17,156 |
| | | | 52,548 |
TOTAL REAL ESTATE | | | 420,273 |
| UTILITIES - 8.4% | | | |
| Electric Utilities - 5.4% | | | |
| Constellation Energy Corp. | | 775,169 | 144,125 |
| Edison International | | 881,384 | 62,631 |
| Entergy Corp. | | 439,200 | 46,849 |
| FirstEnergy Corp. | | 1,741,000 | 66,750 |
| NextEra Energy, Inc. | | 635,300 | 42,546 |
| NRG Energy, Inc. | | 209,400 | 15,217 |
| PG&E Corp. | | 5,576,200 | 95,409 |
| SSE PLC | | 1,044,800 | 21,718 |
| | | | 495,245 |
| Gas Utilities - 0.8% | | | |
| Southwest Gas Holdings, Inc. | | 432,100 | 32,243 |
| UGI Corp. | | 1,617,100 | 41,333 |
| | | | 73,576 |
| Independent Power and Renewable Electricity Producers - 1.4% | | | |
| The AES Corp. | | 4,723,300 | 84,547 |
| Vistra Corp. | | 575,500 | 43,646 |
| | | | 128,193 |
| Multi-Utilities - 0.8% | | | |
| Algonquin Power & Utilities Corp. | | 5,219,600 | 31,887 |
| Sempra | | 639,800 | 45,829 |
| | | | 77,716 |
TOTAL UTILITIES | | | 774,730 |
| TOTAL COMMON STOCKS (Cost $7,182,200) | | | 9,063,928 |
| | | | |
| U.S. Treasury Obligations - 0.1% |
| | | Principal Amount (e) (000s) | Value ($) (000s) |
U.S. Treasury Bills, yield at date of purchase 5.29% to 5.29% 5/16/24 to 5/30/24 (Cost $4,803) | | 4,820 | 4,803 |
| | | | |
| Money Market Funds - 1.9% |
| | | Shares | Value ($) (000s) |
| Fidelity Cash Central Fund 5.39% (f) | | 977 | 1 |
| Fidelity Securities Lending Cash Central Fund 5.39% (f)(g) | | 176,882,852 | 176,901 |
| TOTAL MONEY MARKET FUNDS (Cost $176,902) | | | 176,902 |
| | | | |
| TOTAL INVESTMENT IN SECURITIES - 100.8% (Cost $7,363,905) | 9,245,633 |
NET OTHER ASSETS (LIABILITIES) - (0.8)% | (75,877) |
| NET ASSETS - 100.0% | 9,169,756 |
| | |
| Futures Contracts |
| | Number of contracts | Expiration Date | Notional Amount ($) (000s) | Value ($) (000s) | Unrealized Appreciation/ (Depreciation) ($) (000s) |
| Purchased | | | | | |
| | | | | | |
| Equity Index Contracts | | | | | |
| CME E-mini S&P MidCap 400 Index Contracts (United States) | 296 | Jun 2024 | 85,165 | (747) | (747) |
| | | | | | |
| The notional amount of futures purchased as a percentage of Net Assets is 0.9% |
Any values shown as $0 in the Schedule of Investments may reflect amounts less than $500.
Legend
| (a) | Security exempt from registration under Rule 144A of the Securities Act of 1933. These securities may be resold in transactions exempt from registration, normally to qualified institutional buyers. At the end of the period, the value of these securities amounted to $96,327,000 or 1.1% of net assets. |
| (c) | Security or a portion of the security is on loan at period end. |
| (e) | Amount is stated in United States dollars unless otherwise noted. |
| (f) | Affiliated fund that is generally available only to investment companies and other accounts managed by Fidelity Investments. The rate quoted is the annualized seven-day yield of the fund at period end. A complete unaudited listing of the fund's holdings as of its most recent quarter end is available upon request. In addition, each Fidelity Central Fund's financial statements are available on the SEC's website or upon request. |
| (g) | Investment made with cash collateral received from securities on loan. |
Affiliated Central Funds
Fiscal year to date information regarding the Fund's investments in Fidelity Central Funds, including the ownership percentage, is presented below.
| Affiliate (Amounts in thousands) | Value, beginning of period ($) | Purchases ($) | Sales Proceeds ($) | Dividend Income ($) | Realized Gain (loss) ($) | Change in Unrealized appreciation (depreciation) ($) | Value, end of period ($) | % ownership, end of period |
| Fidelity Cash Central Fund 5.39% | 32,997 | 2,188,587 | 2,221,584 | 2,317 | 1 | - | 1 | 0.0% |
| Fidelity Securities Lending Cash Central Fund 5.39% | 174,301 | 894,447 | 891,847 | 2,041 | - | - | 176,901 | 0.6% |
| Total | 207,298 | 3,083,034 | 3,113,431 | 4,358 | 1 | - | 176,902 | |
| | | | | | | | | |
Amounts in the dividend income column in the above table include any capital gain distributions from underlying funds, which are presented in the corresponding line item in the Statement of Operations, if applicable.
Amounts in the dividend income column for Fidelity Securities Lending Cash Central Fund represents the income earned on investing cash collateral, less rebates paid to borrowers and any lending agent fees associated with the loan, plus any premium payments received for lending certain types of securities.
Amounts included in the purchases and sales proceeds columns may include in-kind transactions, if applicable.
Other Affiliated Issuers
An affiliated company is a company in which the Fund has ownership of at least 5% of the voting securities. Fiscal year to date transactions with companies which are or were affiliates are presented in the table below. Certain corporate actions, such as mergers, are excluded from the amounts in this table if applicable. A dash in the Value end of period ($) column means either the issuer is no longer held at period end, or the issuer is held at period end but is no longer an affiliate.
| Affiliate (Amounts in thousands) | Value, beginning of period ($) | Purchases ($) | Sales Proceeds ($) | Dividend Income ($) | Realized Gain (loss) ($) | Change in Unrealized appreciation (depreciation) ($) | Value, end of period ($) |
| Interfor Corp. | 15,768 | 35,424 | 5,564 | - | (274) | (3,764) | 41,590 |
| Total | 15,768 | 35,424 | 5,564 | - | (274) | (3,764) | 41,590 |
Amounts included in the purchases and sales proceeds columns may include in-kind transactions, if applicable.
Investment Valuation
The following is a summary of the inputs used, as of April 30, 2024, involving the Fund's assets and liabilities carried at fair value. The inputs or methodology used for valuing securities may not be an indication of the risk associated with investing in those securities. For more information on valuation inputs, and their aggregation into the levels used below, please refer to the Investment Valuation section in the accompanying Notes to Financial Statements.
| Valuation Inputs at Reporting Date: |
Description (Amounts in thousands) | Total ($) | Level 1 ($) | Level 2 ($) | Level 3 ($) |
Investments in Securities: | | | | |
|
| Equities: | | | | |
Communication Services | 284,226 | 220,149 | 64,077 | - |
Consumer Discretionary | 1,079,755 | 1,032,654 | 47,101 | - |
Consumer Staples | 293,799 | 293,799 | - | - |
Energy | 949,742 | 949,742 | - | - |
Financials | 1,705,710 | 1,678,640 | 27,070 | - |
Health Care | 582,760 | 562,624 | 20,136 | - |
Industrials | 1,694,941 | 1,683,531 | 11,410 | - |
Information Technology | 270,363 | 270,363 | - | - |
Materials | 1,007,629 | 1,005,114 | 2,515 | - |
Real Estate | 420,273 | 420,273 | - | - |
Utilities | 774,730 | 753,012 | 21,718 | - |
|
| U.S. Government and Government Agency Obligations | 4,803 | - | 4,803 | - |
|
| Money Market Funds | 176,902 | 176,902 | - | - |
| Total Investments in Securities: | 9,245,633 | 9,046,803 | 198,830 | - |
Derivative Instruments: Liabilities | | | | |
Futures Contracts | (747) | (747) | - | - |
| Total Liabilities | (747) | (747) | - | - |
| Total Derivative Instruments: | (747) | (747) | - | - |
Value of Derivative Instruments
The following table is a summary of the Fund's value of derivative instruments by primary risk exposure as of April 30, 2024. For additional information on derivative instruments, please refer to the Derivative Instruments section in the accompanying Notes to Financial Statements.
Primary Risk Exposure / Derivative Type | Value |
| (Amounts in thousands) | Asset ($) | Liability ($) |
| Equity Risk | | |
Futures Contracts (a) | 0 | (747) |
| Total Equity Risk | 0 | (747) |
| Total Value of Derivatives | 0 | (747) |
(a)Reflects gross cumulative appreciation (depreciation) on futures contracts as presented in the Schedule of Investments. In the Statement of Assets and Liabilities, the period end daily variation margin is included in receivable or payable for daily variation margin on futures contracts, and the net cumulative appreciation (depreciation) is included in Total accumulated earnings (loss).
| Statement of Assets and Liabilities |
| Amounts in thousands (except per-share amounts) | | | | April 30, 2024 (Unaudited) |
| | | | | |
| Assets | | | | |
| Investment in securities, at value (including securities loaned of $167,428) - See accompanying schedule: | | | | |
Unaffiliated issuers (cost $7,138,011) | $ | 9,027,141 | | |
Fidelity Central Funds (cost $176,902) | | 176,902 | | |
Other affiliated issuers (cost $48,992) | | 41,590 | | |
| | | | | |
| | | | | |
| Total Investment in Securities (cost $7,363,905) | | | $ | 9,245,633 |
| Cash | | | | 333 |
| Foreign currency held at value (cost $693) | | | | 689 |
| Receivable for investments sold | | | | 186,929 |
| Receivable for fund shares sold | | | | 1,476 |
| Dividends receivable | | | | 9,423 |
| Distributions receivable from Fidelity Central Funds | | | | 165 |
| Prepaid expenses | | | | 3 |
| Other receivables | | | | 433 |
Total assets | | | | 9,445,084 |
| Liabilities | | | | |
| Payable for investments purchased | $ | 80,057 | | |
| Payable for fund shares redeemed | | 3,003 | | |
| Accrued management fee | | 6,288 | | |
| Notes payable to affiliates | | 7,684 | | |
| Payable for daily variation margin on futures contracts | | 747 | | |
| Other payables and accrued expenses | | 667 | | |
| Collateral on securities loaned | | 176,882 | | |
| Total liabilities | | | | 275,328 |
| Net Assets | | | $ | 9,169,756 |
| Net Assets consist of: | | | | |
| Paid in capital | | | $ | 6,753,732 |
| Total accumulated earnings (loss) | | | | 2,416,024 |
| Net Assets | | | $ | 9,169,756 |
| | | | | |
| Net Asset Value and Maximum Offering Price | | | | |
| Value : | | | | |
Net Asset Value, offering price and redemption price per share ($7,981,130 ÷ 538,465 shares) | | | $ | 14.82 |
| Class K : | | | | |
Net Asset Value, offering price and redemption price per share ($1,188,626 ÷ 80,121 shares) | | | $ | 14.84 |
| Statement of Operations |
| Amounts in thousands | | | | Six months ended April 30, 2024 (Unaudited) |
| Investment Income | | | | |
| Dividends | | | $ | 80,501 |
| Interest | | | | 376 |
| Income from Fidelity Central Funds (including $2,041 from security lending) | | | | 4,358 |
| Total income | | | | 85,235 |
| Expenses | | | | |
| Management fee | | | | |
| Basic fee | $ | 24,606 | | |
| Performance adjustment | | 8,628 | | |
| Transfer agent fees | | 3,316 | | |
| Accounting fees | | 386 | | |
| Custodian fees and expenses | | 49 | | |
| Independent trustees' fees and expenses | | 21 | | |
| Registration fees | | 123 | | |
| Audit | | 33 | | |
| Legal | | 12 | | |
| Interest | | 6 | | |
| Miscellaneous | | 16 | | |
| Total expenses before reductions | | 37,196 | | |
| Expense reductions | | (395) | | |
| Total expenses after reductions | | | | 36,801 |
| Net Investment income (loss) | | | | 48,434 |
| Realized and Unrealized Gain (Loss) | | | | |
| Net realized gain (loss) on: | | | | |
| Investment Securities: | | | | |
| Unaffiliated issuers | | 538,816 | | |
| Fidelity Central Funds | | 1 | | |
| Other affiliated issuers | | (274) | | |
| Foreign currency transactions | | 68 | | |
| Futures contracts | | 21,006 | | |
| Total net realized gain (loss) | | | | 559,617 |
| Change in net unrealized appreciation (depreciation) on: | | | | |
| Investment Securities: | | | | |
| Unaffiliated issuers | | 1,114,448 | | |
| Affiliated issuers | | (3,764) | | |
| Assets and liabilities in foreign currencies | | 4 | | |
| Futures contracts | | (747) | | |
| Total change in net unrealized appreciation (depreciation) | | | | 1,109,941 |
| Net gain (loss) | | | | 1,669,558 |
| Net increase (decrease) in net assets resulting from operations | | | $ | 1,717,992 |
| Statement of Changes in Net Assets |
| |
| Amount in thousands | | Six months ended April 30, 2024 (Unaudited) | | Year ended October 31, 2023 |
| Increase (Decrease) in Net Assets | | | | |
| Operations | | | | |
| Net investment income (loss) | $ | 48,434 | $ | 80,170 |
| Net realized gain (loss) | | 559,617 | | 269,308 |
| Change in net unrealized appreciation (depreciation) | | 1,109,941 | | (258,943) |
| Net increase (decrease) in net assets resulting from operations | | 1,717,992 | | 90,535 |
| Distributions to shareholders | | (317,212) | | (550,862) |
| | | | | |
| Share transactions - net increase (decrease) | | 600,330 | | (720,277) |
| Total increase (decrease) in net assets | | 2,001,110 | | (1,180,604) |
| | | | | |
| Net Assets | | | | |
| Beginning of period | | 7,168,646 | | 8,349,250 |
| End of period | $ | 9,169,756 | $ | 7,168,646 |
| | | | | |
| | | | | |
Financial Highlights
| | Six months ended (Unaudited) April 30, 2024 | | Years ended October 31, 2023 | | 2022 | | 2021 | | 2020 | | 2019 |
Selected Per-Share Data | | | | | | | | | | | | |
| Net asset value, beginning of period | $ | 12.52 | $ | 13.27 | $ | 15.72 | $ | 9.57 | $ | 10.59 | $ | 11.15 |
| Income from Investment Operations | | | | | | | | | | | | |
Net investment income (loss) A,B | | .08 | | .13 | | .17 | | .12 | | .12 | | .14 |
| Net realized and unrealized gain (loss) | | 2.75 | | - C | | (1.18) | | 6.15 | | (.77) | | .71 |
| Total from investment operations | | 2.83 | | .13 | | (1.01) | | 6.27 | | (.65) | | .85 |
| Distributions from net investment income | | (.15) | | (.09) | | (.20) | | (.12) | | (.14) D | | (.12) |
| Distributions from net realized gain | | (.38) | | (.80) | | (1.24) | | - | | (.23) D | | (1.29) |
| Total distributions | | (.53) | | (.88) E | | (1.44) | | (.12) | | (.37) | | (1.41) |
| Net asset value, end of period | $ | 14.82 | $ | 12.52 | $ | 13.27 | $ | 15.72 | $ | 9.57 | $ | 10.59 |
Total Return F,G | | | | .97% | | (6.80)% | | 65.91% | | (6.52)% | | 9.31% |
Ratios to Average Net Assets A,H,I | | | | | | | | | | | | |
| Expenses before reductions | | .85% J | | .87% | | .83% | | .79% | | .57% | | .58% |
| Expenses net of fee waivers, if any | | | | .87% | | .83% | | .79% | | .57% | | .58% |
| Expenses net of all reductions | | .84% J | | .87% | | .83% | | .79% | | .55% | | .58% |
| Net investment income (loss) | | 1.08% J | | .99% | | 1.18% | | .82% | | 1.30% | | 1.38% |
| Supplemental Data | | | | | | | | | | | | |
| Net assets, end of period (in millions) | $ | 7,981 | $ | 6,539 | $ | 7,190 | $ | 8,361 | $ | 4,760 | $ | 6,112 |
Portfolio turnover rate K | | | | 69% | | 74% | | 77% | | 90% | | 75% |
ANet investment income (loss) is affected by the timing of the declaration of dividends by any underlying mutual funds or exchange-traded funds (ETFs). Net investment income (loss) of any mutual funds or ETFs is not included in the Fund's net investment income (loss) ratio.
BCalculated based on average shares outstanding during the period.
CAmount represents less than $.005 per share.
DThe amount shown reflects reclassifications related to book to tax differences that were made in the year shown.
ETotal distributions per share do not sum due to rounding.
FTotal returns for periods of less than one year are not annualized.
GTotal returns would have been lower if certain expenses had not been reduced during the applicable periods shown.
HFees and expenses of any underlying mutual funds or exchange-traded funds (ETFs) are not included in the Fund's expense ratio. The Fund indirectly bears its proportionate share of these expenses. For additional expense information related to investments in Fidelity Central Funds, please refer to the "Investments in Fidelity Central Funds" note found in the Notes to Financial Statements section of the most recent Annual or Semi-Annual report.
IExpense ratios reflect operating expenses of the class. Expenses before reductions do not reflect amounts reimbursed, waived, or reduced through arrangements with the investment adviser, brokerage services, or other offset arrangements, if applicable, and do not represent the amount paid by the class during periods when reimbursements, waivers or reductions occur.
JAnnualized.
KAmount does not include the portfolio activity of any underlying mutual funds or exchange-traded funds (ETFs).
Fidelity® Value Fund Class K |
| |
| | Six months ended (Unaudited) April 30, 2024 | | Years ended October 31, 2023 | | 2022 | | 2021 | | 2020 | | 2019 |
Selected Per-Share Data | | | | | | | | | | | | |
| Net asset value, beginning of period | $ | 12.54 | $ | 13.30 | $ | 15.74 | $ | 9.59 | $ | 10.60 | $ | 11.16 |
| Income from Investment Operations | | | | | | | | | | | | |
Net investment income (loss) A,B | | .08 | | .14 | | .18 | | .13 | | .13 | | .15 |
| Net realized and unrealized gain (loss) | | 2.77 | | - C | | (1.17) | | 6.15 | | (.76) | | .72 |
| Total from investment operations | | 2.85 | | .14 | | (.99) | | 6.28 | | (.63) | | .87 |
| Distributions from net investment income | | (.16) | | (.10) | | (.21) | | (.13) | | (.15) D | | (.13) |
| Distributions from net realized gain | | (.38) | | (.80) | | (1.24) | | - | | (.23) D | | (1.29) |
| Total distributions | | (.55) E | | (.90) | | (1.45) | | (.13) | | (.38) | | (1.43) E |
| Net asset value, end of period | $ | 14.84 | $ | 12.54 | $ | 13.30 | $ | 15.74 | $ | 9.59 | $ | 10.60 |
Total Return F,G | | | | .99% | | (6.63)% | | 65.90% | | (6.33)% | | 9.43% |
Ratios to Average Net Assets B,H,I | | | | | | | | | | | | |
| Expenses before reductions | | .77% J | | .79% | | .75% | | .71% | | .47% | | .49% |
| Expenses net of fee waivers, if any | | | | .78% | | .74% | | .71% | | .47% | | .49% |
| Expenses net of all reductions | | .76% J | | .78% | | .74% | | .71% | | .45% | | .48% |
| Net investment income (loss) | | 1.16% J | | 1.07% | | 1.27% | | .91% | | 1.40% | | 1.48% |
| Supplemental Data | | | | | | | | | | | | |
| Net assets, end of period (in millions) | $ | 1,189 | $ | 630 | $ | 1,160 | $ | 1,168 | $ | 493 | $ | 740 |
Portfolio turnover rate K | | | | 69% | | 74% | | 77% | | 90% | | 75% |
ACalculated based on average shares outstanding during the period.
BNet investment income (loss) is affected by the timing of the declaration of dividends by any underlying mutual funds or exchange-traded funds (ETFs). Net investment income (loss) of any mutual funds or ETFs is not included in the Fund's net investment income (loss) ratio.
CAmount represents less than $.005 per share.
DThe amount shown reflects reclassifications related to book to tax differences that were made in the year shown.
ETotal distributions per share do not sum due to rounding.
FTotal returns for periods of less than one year are not annualized.
GTotal returns would have been lower if certain expenses had not been reduced during the applicable periods shown.
HFees and expenses of any underlying mutual funds or exchange-traded funds (ETFs) are not included in the Fund's expense ratio. The Fund indirectly bears its proportionate share of these expenses. For additional expense information related to investments in Fidelity Central Funds, please refer to the "Investments in Fidelity Central Funds" note found in the Notes to Financial Statements section of the most recent Annual or Semi-Annual report.
IExpense ratios reflect operating expenses of the class. Expenses before reductions do not reflect amounts reimbursed, waived, or reduced through arrangements with the investment adviser, brokerage services, or other offset arrangements, if applicable, and do not represent the amount paid by the class during periods when reimbursements, waivers or reductions occur.
JAnnualized.
KAmount does not include the portfolio activity of any underlying mutual funds or exchange-traded funds (ETFs).
For the period ended April 30, 2024
(Amounts in thousands except percentages)
1. Organization.
Fidelity Value Fund (the Fund) is a fund of Fidelity Capital Trust (the Trust) and is authorized to issue an unlimited number of shares. The Trust is registered under the Investment Company Act of 1940, as amended (the 1940 Act), as an open-end management investment company organized as a Massachusetts business trust. The Fund offers Value and Class K shares, each of which has equal rights as to assets and voting privileges. Each class has exclusive voting rights with respect to matters that affect that class.
2. Investments in Fidelity Central Funds.
Funds may invest in Fidelity Central Funds, which are open-end investment companies generally available only to other investment companies and accounts managed by the investment adviser and its affiliates. The Schedule of Investments lists any Fidelity Central Funds held as an investment as of period end, but does not include the underlying holdings of each Fidelity Central Fund. An investing fund indirectly bears its proportionate share of the expenses of the underlying Fidelity Central Funds.
Based on its investment objective, each Fidelity Central Fund may invest or participate in various investment vehicles or strategies that are similar to those of the investing fund. These strategies are consistent with the investment objectives of the investing fund and may involve certain economic risks which may cause a decline in value of each of the Fidelity Central Funds and thus a decline in the value of the investing fund.
| Fidelity Central Fund | Investment Manager | Investment Objective | Investment Practices | Expense RatioA |
| Fidelity Money Market Central Funds | Fidelity Management & Research Company LLC (FMR) | Each fund seeks to obtain a high level of current income consistent with the preservation of capital and liquidity. | Short-term Investments | Less than .005% |
A Expenses expressed as a percentage of average net assets and are as of each underlying Central Fund's most recent annual or semi-annual shareholder report.
A complete unaudited list of holdings for each Fidelity Central Fund is available upon request or at the Securities and Exchange Commission website at www.sec.gov. In addition, the financial statements of the Fidelity Central Funds which contain the significant accounting policies (including investment valuation policies) of those funds, and are not covered by the Report of Independent Registered Public Accounting Firm, are available on the Securities and Exchange Commission website or upon request.
3. Significant Accounting Policies.
The Fund is an investment company and applies the accounting and reporting guidance of the Financial Accounting Standards Board (FASB) Accounting Standards Codification Topic 946 Financial Services - Investment Companies. The financial statements have been prepared in conformity with accounting principles generally accepted in the United States of America (GAAP), which require management to make certain estimates and assumptions at the date of the financial statements. Actual results could differ from those estimates. Subsequent events, if any, through the date that the financial statements were issued have been evaluated in the preparation of the financial statements. The Fund's Schedule of Investments lists any underlying mutual funds or exchange-traded funds (ETFs) but does not include the underlying holdings of these funds. The following summarizes the significant accounting policies of the Fund:
Investment Valuation. Investments are valued as of 4:00 p.m. Eastern time on the last calendar day of the period. The Board of Trustees (the Board) has designated the Fund's investment adviser as the valuation designee responsible for the fair valuation function and performing fair value determinations as needed. The investment adviser has established a Fair Value Committee (the Committee) to carry out the day-to-day fair valuation responsibilities and has adopted policies and procedures to govern the fair valuation process and the activities of the Committee. In accordance with these fair valuation policies and procedures, which have been approved by the Board, the Fund attempts to obtain prices from one or more third party pricing services or brokers to value its investments. When current market prices, quotations or currency exchange rates are not readily available or reliable, investments will be fair valued in good faith by the Committee, in accordance with the policies and procedures. Factors used in determining fair value vary by investment type and may include market or investment specific events, transaction data, estimated cash flows, and market observations of comparable investments. The frequency that the fair valuation procedures are used cannot be predicted and they may be utilized to a significant extent. The Committee manages the Fund's fair valuation practices and maintains the fair valuation policies and procedures. The Fund's investment adviser reports to the Board information regarding the fair valuation process and related material matters.
The Fund categorizes the inputs to valuation techniques used to value its investments into a disclosure hierarchy consisting of three levels as shown below:
Level 1 - unadjusted quoted prices in active markets for identical investments
Level 2 - other significant observable inputs (including quoted prices for similar investments, interest rates, prepayment speeds, etc.)
Level 3 - unobservable inputs (including the Fund's own assumptions based on the best information available)
Valuation techniques used to value the Fund's investments by major category are as follows:
Equity securities, including restricted securities, for which market quotations are readily available, are valued at the last reported sale price or official closing price as reported by a third party pricing service on the primary market or exchange on which they are traded and are categorized as Level 1 in the hierarchy. In the event there were no sales during the day or closing prices are not available, securities are valued at the last quoted bid price or may be valued using the last available price and are generally categorized as Level 2 in the hierarchy. For foreign equity securities, when market or security specific events arise, comparisons to the valuation of American Depositary Receipts (ADRs), futures contracts, Exchange-Traded Funds (ETFs) and certain indexes as well as quoted prices for similar securities may be used and would be categorized as Level 2 in the hierarchy. For equity securities, including restricted securities, where observable inputs are limited, assumptions about market activity and risk are used and these securities may be categorized as Level 3 in the hierarchy.
Debt securities, including restricted securities, are valued based on evaluated prices received from third party pricing services or from brokers who make markets in such securities. U.S. government and government agency obligations are valued by pricing services who utilize matrix pricing which considers yield or price of bonds of comparable quality, coupon, maturity and type or by broker-supplied prices. When independent prices are unavailable or unreliable, debt securities may be valued utilizing pricing methodologies which consider similar factors that would be used by third party pricing services. Debt securities are generally categorized as Level 2 in the hierarchy but may be Level 3 depending on the circumstances.
Futures contracts are valued at the settlement price or official closing price established each day by the board of trade or exchange on which they are traded and are categorized as Level 1 in the hierarchy. Investments in open-end mutual funds, including the Fidelity Central Funds, are valued at their closing net asset value (NAV) each business day and are categorized as Level 1 in the hierarchy.
Changes in valuation techniques may result in transfers in or out of an assigned level within the disclosure hierarchy. The aggregate value of investments by input level as of April 30, 2024 is included at the end of the Fund's Schedule of Investments.
Foreign Currency. Certain Funds may use foreign currency contracts to facilitate transactions in foreign-denominated securities. Gains and losses from these transactions may arise from changes in the value of the foreign currency or if the counterparties do not perform under the contracts' terms.
Foreign-denominated assets, including investment securities, and liabilities are translated into U.S. dollars at the exchange rates at period end. Purchases and sales of investment securities, income and dividends received, and expenses denominated in foreign currencies are translated into U.S. dollars at the exchange rate in effect on the transaction date.
The effects of exchange rate fluctuations on investments are included with the net realized and unrealized gain (loss) on investment securities. Other foreign currency transactions resulting in realized and unrealized gain (loss) are disclosed separately.
Investment Transactions and Income. For financial reporting purposes, the Fund's investment holdings and NAV include trades executed through the end of the last business day of the period. The NAV per share for processing shareholder transactions is calculated as of the close of business of the New York Stock Exchange (NYSE), normally 4:00 p.m. Eastern time and includes trades executed through the end of the prior business day. Gains and losses on securities sold are determined on the basis of identified cost and include proceeds received from litigation. Commissions paid to certain brokers with whom the investment adviser, or its affiliates, places trades on behalf of a fund include an amount in addition to trade execution, which may be rebated back to a fund. Any such rebates are included in net realized gain (loss) on investments in the Statement of Operations. Dividend income is recorded on the ex-dividend date, except for certain dividends from foreign securities where the ex-dividend date may have passed, which are recorded as soon as the Fund is informed of the ex-dividend date. Non-cash dividends included in dividend income, if any, are recorded at the fair market value of the securities received. Income and capital gain distributions from Fidelity Central Funds, if any, are recorded on the ex-dividend date. Certain distributions received by the Fund represent a return of capital or capital gain. The Fund determines the components of these distributions subsequent to the ex-dividend date, based upon receipt of tax filings or other correspondence relating to the underlying investment. These distributions are recorded as a reduction of cost of investments and/or as a realized gain. Interest income is accrued as earned and includes coupon interest and amortization of premium and accretion of discount on debt securities as applicable. Investment income is recorded net of foreign taxes withheld where recovery of such taxes is uncertain. Funds may file withholding tax reclaims in certain jurisdictions to recover a portion of amounts previously withheld. Any withholding tax reclaims income is included in the Statement of Operations in dividends. Any receivables for withholding tax reclaims are included in the Statement of Assets and Liabilities in dividends receivable.
Class Allocations and Expenses. Investment income, realized and unrealized capital gains and losses, common expenses of a fund, and certain fund-level expense reductions, if any, are allocated daily on a pro-rata basis to each class based on the relative net assets of each class to the total net assets of a fund. Each class differs with respect to transfer agent and distribution and service plan fees incurred, as applicable. Certain expense reductions may also differ by class, if applicable. For the reporting period, the allocated portion of income and expenses to each class as a percent of its average net assets may vary due to the timing of recording these transactions in relation to fluctuating net assets of the classes. Expenses directly attributable to a fund are charged to that fund. Expenses attributable to more than one fund are allocated among the respective funds on the basis of relative net assets or other appropriate methods. Expenses included in the accompanying financial statements reflect the expenses of that fund and do not include any expenses associated with any underlying mutual funds or exchange-traded funds (ETFs). Although not included in a fund's expenses, a fund indirectly bears its proportionate share of these expenses through the net asset value of each underlying mutual fund or exchange-traded fund (ETF). Expense estimates are accrued in the period to which they relate and adjustments are made when actual amounts are known.
Deferred Trustee Compensation. Under a Deferred Compensation Plan (the Plan) for certain Funds, certain independent Trustees have elected to defer receipt of a portion of their annual compensation. Deferred amounts are invested in affiliated mutual funds, are marked-to-market and remain in a fund until distributed in accordance with the Plan. The investment of deferred amounts and the offsetting payable to the Trustees presented below are included in the accompanying Statement of Assets and Liabilities in other receivables and other payables and accrued expenses, as applicable.
Income Tax Information and Distributions to Shareholders. Each year, the Fund intends to qualify as a regulated investment company under Subchapter M of the Internal Revenue Code, including distributing substantially all of its taxable income and realized gains. As a result, no provision for U.S. Federal income taxes is required. The Fund files a U.S. federal tax return, in addition to state and local tax returns as required. The Fund's federal income tax returns are subject to examination by the Internal Revenue Service (IRS) for a period of three fiscal years after they are filed. State and local tax returns may be subject to examination for an additional fiscal year depending on the jurisdiction. Foreign taxes are provided for based on the Fund's understanding of the tax rules and rates that exist in the foreign markets in which it invests.
Distributions are declared and recorded on the ex-dividend date. Income and capital gain distributions are declared separately for each class. Income and capital gain distributions are determined in accordance with income tax regulations, which may differ from GAAP.
Capital accounts within the financial statements are adjusted for permanent book-tax differences. These adjustments have no impact on net assets or the results of operations. Capital accounts are not adjusted for temporary book-tax differences which will reverse in a subsequent period.
Book-tax differences are primarily due to foreign currency transactions, passive foreign investment companies (PFIC), future transactions, partnerships and losses deferred due to wash sales.
As of period end, the cost and unrealized appreciation (depreciation) in securities, and derivatives if applicable, for federal income tax purposes were as follows:
| Gross unrealized appreciation | $2,223,747 |
| Gross unrealized depreciation | (382,064) |
| Net unrealized appreciation (depreciation) | $1,841,683 |
| Tax cost | $7,403,950 |
Restricted Securities (including Private Placements). Funds may invest in securities that are subject to legal or contractual restrictions on resale. These securities generally may be resold in transactions exempt from registration or to the public if the securities are registered. Disposal of these securities may involve time-consuming negotiations and expense, and prompt sale at an acceptable price may be difficult. Information regarding restricted securities held at period end is included at the end of the Schedule of Investments, if applicable.
4. Derivative Instruments.
Risk Exposures and the Use of Derivative Instruments. The Fund's investment objectives allow for various types of derivative instruments, including futures contracts. Derivatives are investments whose value is primarily derived from underlying assets, indices or reference rates and may be transacted on an exchange or over-the-counter (OTC). Derivatives may involve a future commitment to buy or sell a specified asset based on specified terms, to exchange future cash flows at periodic intervals based on a notional principal amount, or for one party to make one or more payments upon the occurrence of specified events in exchange for periodic payments from the other party.
Derivatives were used to increase returns and to manage exposure to certain risks as defined below. The success of any strategy involving derivatives depends on analysis of numerous economic factors, and if the strategies for investment do not work as intended, the objectives may not be achieved.
Derivatives were used to increase or decrease exposure to the following risk(s):
| | |
| Equity Risk | Equity risk relates to the fluctuations in the value of financial instruments as a result of changes in market prices (other than those arising from interest rate risk or foreign exchange risk), whether caused by factors specific to an individual investment, its issuer, or all factors affecting all instruments traded in a market or market segment. |
Funds are also exposed to additional risks from investing in derivatives, such as liquidity risk and counterparty credit risk. Liquidity risk is the risk that a fund will be unable to close out the derivative in the open market in a timely manner. Counterparty credit risk is the risk that the counterparty will not be able to fulfill its obligation to a fund. Counterparty credit risk related to exchange-traded contracts may be mitigated by the protection provided by the exchange on which they trade.
Investing in derivatives may involve greater risks than investing in the underlying assets directly and, to varying degrees, may involve risk of loss in excess of any initial investment and collateral received and amounts recognized in the Statement of Assets and Liabilities. In addition, there may be the risk that the change in value of the derivative contract does not correspond to the change in value of the underlying instrument.
Futures Contracts. A futures contract is an agreement between two parties to buy or sell a specified underlying instrument for a fixed price at a specified future date. Futures contracts were used to manage exposure to the stock market.
Upon entering into a futures contract, a fund is required to deposit either cash or securities (initial margin) with a clearing broker in an amount equal to a certain percentage of the face value of the contract. Futures contracts are marked-to-market daily and subsequent daily payments are made or received by a fund depending on the daily fluctuations in the value of the futures contracts and are recorded as unrealized appreciation or (depreciation). This receivable and/or payable, if any, is included in daily variation margin on futures contracts in the Statement of Assets and Liabilities. Realized gain or (loss) is recorded upon the expiration or closing of a futures contract. The net realized gain (loss) and change in net unrealized appreciation (depreciation) on futures contracts during the period is presented in the Statement of Operations.
Any open futures contracts at period end are presented in the Schedule of Investments under the caption "Futures Contracts". The notional amount at value reflects each contract's exposure to the underlying instrument or index at period end, and is representative of volume of activity during the period unless an average notional amount is presented. Any securities deposited to meet initial margin requirements are identified in the Schedule of Investments. Any cash deposited to meet initial margin requirements is presented as segregated cash with brokers for derivative instruments in the Statement of Assets and Liabilities.
5. Purchases and Sales of Investments.
Purchases and sales of securities, other than short-term securities, U.S. government securities and in-kind transactions, as applicable, are noted in the table below.
| | Purchases ($) | Sales ($) |
| Fidelity Value Fund | 3,754,990 | 3,479,301 |
6. Fees and Other Transactions with Affiliates.
Management Fee. Fidelity Management & Research Company LLC (the investment adviser) and its affiliates provide the Fund with investment management related services for which the Fund pays a monthly management fee.
Effective March 1, 2024, the Fund's management contract was amended to incorporate administrative services previously covered under separate services agreements (Transfer Agent and Accounting agreements). The amended contract incorporates a basic fee rate that may vary by class (subject to a performance adjustment). The investment adviser or an affiliate pays certain expenses of managing and operating the Fund out of each class's management fee. Each class of the Fund pays a management fee to the investment adviser. The management fee is calculated and paid to the investment adviser every month. The management fee is determined by calculating a basic fee and then applying a performance adjustment. When determining a class's basic fee, a mandate rate is calculated based on the monthly average net assets of a group of funds advised by FMR within a designated asset class. A discount rate is subtracted from the mandate rate once the Fund's monthly average net assets reach a certain level. The mandate rate and discount rate may vary by class. The annual basic fee rate for a class of shares of the Fund is the lesser of (1) the class's mandate rate reduced by the class's discount rate (if applicable) or (2) the amount set forth in the following table.
| | Maximum Management Fee Rate % |
| Value | .63 |
| Class K | .55 |
One-twelfth of the basic fee rate for a class is applied to the average net assets of the class for the month, giving a dollar amount which is the basic fee for the class for that month. A different management fee rate may be applicable to each class of the Fund. The difference between classes is the result of separate arrangements for class-level services and/or waivers of certain expenses. It is not the result of any difference in advisory or custodial fees or other expenses related to the management of the Fund's assets, which do not vary by class. For the portion of the reporting period on or after March 1, 2024, the total annualized management fee rates were as follows:
| | Total Management Fee Rate % |
| Value | .63 |
| Class K | .55 |
Prior to March 1, 2024, the management fee was the sum of an individual fund fee rate that was based on an annual rate of .30% of the Fund's average net assets and an annualized group fee rate that averaged .22% during the period. The group fee rate was based upon the monthly average net assets of a group of registered investment companies with which the investment adviser has management contracts. The group fee rate decreased as assets under management increased and increased as assets under management decreased. For the portion of the reporting period prior to March 1, 2024, the total annualized management fee rate was .52%.
The performance adjustment rate is calculated monthly by comparing over the performance period the Fund's performance to that of the performance adjustment index listed below.
| | Performance Adjustment Index |
| Fidelity Value Fund | Russell Midcap Value Index |
For the purposes of calculating the performance adjustment for the Fund, the Fund's investment performance is based on the performance of Value. To the extent that other classes of the Fund have higher expenses, this could result in those classes bearing a larger positive performance adjustment and smaller negative performance adjustment than would be the case if each class's own performance were considered. The performance period is the most recent 36 month period. The maximum annualized performance adjustment rate is ±.20% of the Fund's average net assets over the performance period. The performance adjustment rate is divided by twelve and multiplied by the Fund's average net assets over the performance period, and the resulting dollar amount is proportionately added to or subtracted from a class's basic fee. For the entire reporting period, the total annualized performance adjustment was .19%.
Effective March 1, 2024, the Fund's sub-advisory agreements with FMR Investment Management (UK) Limited, Fidelity Management & Research (Hong Kong) Limited, and Fidelity Management & Research (Japan) Limited were amended to provide that the investment adviser pays each sub-adviser monthly fees equal to 110% of the sub-adviser's costs for providing sub-advisory services.
Transfer Agent Fees. Fidelity Investments Institutional Operations Company LLC (FIIOC), an affiliate of the investment adviser, is the transfer, dividend disbursing and shareholder servicing agent for each class of the Fund. Effective March 1, 2024, the Fund's management contract was amended to incorporate transfer agent services and associated fees previously covered under a separate services agreement. FIIOC pays for typesetting, printing and mailing of shareholder reports, except proxy statements.
During November 2023, the Board approved a change in the transfer agent fees effective December 1, 2023 to a fixed annual rate of class-level average net assets as follows:
| | % of Class-Level Average Net Assets |
| Value | .1269 |
Prior to December 1, 2023, FIIOC received account fees and asset-based fees that varied according to the account size and type of account of the shareholders of Value, except for Class K. FIIOC received an asset-based fee of Class K's average net assets. For the portion of the reporting period prior to March 1, 2024, the fees were equivalent to the following annualized rates:
| | Amount ($) | % of Class-Level Average Net AssetsA |
| Value | 3,167 | .13 |
| Class K | 149 | .04 |
| | 3,316 | |
A Annualized
Accounting Fees. Fidelity Service Company, Inc. (FSC), an affiliate of the investment adviser, maintains the Fund's accounting records. Effective March 1, 2024, the Fund's management contract was amended to incorporate accounting services and associated fees previously covered under a separate services agreement.
During November 2023, the Board approved a change in the accounting fees effective December 1, 2023 to a fixed annual rate of average net assets as follows:
| | % of Average Net Assets |
| Fidelity Value Fund | .0134 |
Prior to December 1, 2023, the accounting fee was based on the level of average net assets for each month. For the portion of the reporting period prior to March 1, 2024, the fees were equivalent to the following annualized rates:
| | % of Average Net Assets |
| Fidelity Value Fund | .01 |
Brokerage Commissions. A portion of portfolio transactions were placed with brokerage firms which are affiliates of the investment adviser. Brokerage commissions are included in net realized gain (loss) and change in net unrealized appreciation (depreciation) in the Statement of Operations. The commissions paid to these affiliated firms were as follows:
| | Amount ($) |
| Fidelity Value Fund | 108 |
Interfund Lending Program. Pursuant to an Exemptive Order issued by the Securities and Exchange Commission (the SEC), the Fund, along with other registered investment companies having management contracts with Fidelity Management & Research Company LLC (FMR), or other affiliated entities of FMR, may participate in an interfund lending program. This program provides an alternative credit facility allowing the Fund to borrow from, or lend money to, other participating affiliated funds. At period end, there were no interfund loans outstanding. Any open loans, including accrued interest, at period end are presented as Notes payable to affiliates in the Statement of Assets and Liabilities. Activity in this program during the period for which loans were outstanding was as follows:
| | Borrower or Lender | Average Loan Balance ($) | Weighted Average Interest Rate | Interest Expense ($) |
| Fidelity Value Fund | Borrower | 9,064 | 5.57% | 6 |
Interfund Trades. Funds may purchase from or sell securities to other Fidelity Funds under procedures adopted by the Board. The procedures have been designed to ensure these interfund trades are executed in accordance with Rule 17a-7 of the 1940 Act. Any interfund trades are included within the respective purchases and sales amounts shown in the Purchases and Sales of Investments note. Interfund trades during the period are noted in the table below.
| | Purchases ($) | Sales ($) | Realized Gain (Loss)($) |
| Fidelity Value Fund | 151,825 | 299,435 | 46,227 |
7. Committed Line of Credit.
Certain Funds participate with other funds managed by the investment adviser or an affiliate in a $4.25 billion credit facility (the "line of credit") to be utilized for temporary or emergency purposes to fund shareholder redemptions or for other short-term liquidity purposes. The participating funds have agreed to pay commitment fees on their pro-rata portion of the line of credit, which are reflected in Miscellaneous expenses on the Statement of Operations, and are listed below. During the period, there were no borrowings on this line of credit.
| | Amount ($) |
| Fidelity Value Fund | 8 |
8. Security Lending.
Funds lend portfolio securities from time to time in order to earn additional income. Lending agents are used, including National Financial Services (NFS), an affiliate of the investment adviser. Pursuant to a securities lending agreement, NFS will receive a fee, which is capped at 9.9% of a fund's daily lending revenue, for its services as lending agent. A fund may lend securities to certain qualified borrowers, including NFS. On the settlement date of the loan, a fund receives collateral (in the form of U.S. Treasury obligations, letters of credit and/or cash) against the loaned securities and maintains collateral in an amount not less than 100% of the market value of the loaned securities during the period of the loan. The market value of the loaned securities is determined at the close of business of a fund and any additional required collateral is delivered to a fund on the next business day. A fund or borrower may terminate the loan at any time, and if the borrower defaults on its obligation to return the securities loaned because of insolvency or other reasons, a fund may apply collateral received from the borrower against the obligation. A fund may experience delays and costs in recovering the securities loaned. Any cash collateral received is invested in the Fidelity Securities Lending Cash Central Fund. Any loaned securities are identified as such in the Schedule of Investments, and the value of loaned securities and cash collateral at period end, as applicable, are presented in the Statement of Assets and Liabilities. Security lending income represents the income earned on investing cash collateral, less rebates paid to borrowers and any lending agent fees associated with the loan, plus any premium payments received for lending certain types of securities. Security lending income is presented in the Statement of Operations as a component of income from Fidelity Central Funds. Affiliated security lending activity, if any, was as follows:
| | Total Security Lending Fees Paid to NFS ($) | Security Lending Income From Securities Loaned to NFS ($) | Value of Securities Loaned to NFS at Period End ($) |
| Fidelity Value Fund | 217 | -A | - |
A In the amount of less than five hundred dollars.
9. Expense Reductions.
During the period the investment adviser or an affiliate reimbursed and/or waived a portion of fund-level operating expenses in the amount of $395.
10. Distributions to Shareholders.
Distributions to shareholders of each class were as follows:
| | Six months ended April 30, 2024 | Year ended October 31, 2023 |
| Fidelity Value Fund | | |
| Distributions to shareholders | | |
| Value | $275,443 | $473,295 |
| Class K | 41,769 | 77,567 |
Total | $317,212 | $550,862 |
11. Share Transactions.
Share transactions for each class were as follows and may contain in-kind transactions, automatic conversions between classes or exchanges between affiliated funds:
| | Shares | Shares | Dollars | Dollars |
| | Six months ended April 30, 2024 | Year ended October 31, 2023 | Six months ended April 30, 2024 | Year ended October 31, 2023 |
| Fidelity Value Fund | | | | |
| Value | | | | |
| Shares sold | 34,803 | 25,663 | $493,834 | $340,386 |
| Reinvestment of distributions | 18,648 | 34,449 | 250,634 | 434,054 |
| Shares redeemed | (37,422) | (79,290) | (533,543) | (1,032,323) |
| Net increase (decrease) | 16,029 | (19,178) | $210,925 | $(257,883) |
| Class K | | | | |
| Shares sold | 34,657 | 11,753 | $460,535 | $155,225 |
| Reinvestment of distributions | 3,103 | 6,151 | 41,769 | 77,567 |
| Shares redeemed | (7,842) | (54,898) | (112,899) | (695,186) |
| Net increase (decrease) | 29,918 | (36,994) | $389,405 | $(462,394) |
12. Other.
A fund's organizational documents provide former and current trustees and officers with a limited indemnification against liabilities arising in connection with the performance of their duties to the fund. In the normal course of business, a fund may also enter into contracts that provide general indemnifications. A fund's maximum exposure under these arrangements is unknown as this would be dependent on future claims that may be made against a fund. The risk of material loss from such claims is considered remote.
13. Risk and Uncertainties.
Many factors affect a fund's performance. Developments that disrupt global economies and financial markets, such as pandemics, epidemics, outbreaks of infectious diseases, war, terrorism, and environmental disasters, may significantly affect a fund's investment performance. The effects of these developments to a fund will be impacted by the types of securities in which a fund invests, the financial condition, industry, economic sector, and geographic location of an issuer, and a fund's level of investment in the securities of that issuer. Significant concentrations in security types, issuers, industries, sectors, and geographic locations may magnify the factors that affect a fund's performance.
As a shareholder, you incur two types of costs: (1) transaction costs, which may include sales charges (loads) on purchase payments or redemption proceeds, as applicable and (2) ongoing costs, which generally include management fees, distribution and/or service (12b-1) fees and other Fund expenses. This Example is intended to help you understand your ongoing costs (in dollars) of investing in a fund and to compare these costs with the ongoing costs of investing in other mutual funds.
| The Example is based on an investment of $1,000 invested at the beginning of the period and held for the entire period (November 1, 2023 to April 30, 2024). |
Actual Expenses
The first line of the accompanying table provides information about actual account values and actual expenses. You may use the information in this line, together with the amount you invested, to estimate the expenses that you paid over the period. Simply divide your account value by $1,000.00 (for example, an $8,600 account value divided by $1,000.00 = 8.6), then multiply the result by the number in the first line for a class/Fund under the heading entitled "Expenses Paid During Period" to estimate the expenses you paid on your account during this period. If any fund is a shareholder of any underlying mutual funds or exchange-traded funds (ETFs) (the Underlying Funds), such fund indirectly bears its proportional share of the expenses of the Underlying Funds in addition to the direct expenses incurred presented in the table. These fees and expenses are not included in the annualized expense ratio used to calculate the expense estimate in the table below.
Hypothetical Example for Comparison Purposes
The second line of the accompanying table provides information about hypothetical account values and hypothetical expenses based on the actual expense ratio and an assumed rate of return of 5% per year before expenses, which is not the actual return. The hypothetical account values and expenses may not be used to estimate the actual ending account balance or expenses you paid for the period. You may use this information to compare the ongoing costs of investing in the Fund and other funds. To do so, compare this 5% hypothetical example with the 5% hypothetical examples that appear in the shareholder reports of the other funds. If any fund is a shareholder of any Underlying Funds, such fund indirectly bears its proportional share of the expenses of the Underlying Funds in addition to the direct expenses as presented in the table. These fees and expenses are not included in the annualized expense ratio used to calculate the expense estimate in the table below.
Please note that the expenses shown in the table are meant to highlight your ongoing costs only and do not reflect any transaction costs. Therefore, the second line of the table is useful in comparing ongoing costs only, and will not help you determine the relative total costs of owning different funds. In addition, if these transactional costs were included, your costs would have been higher.
| | | | | Annualized Expense Ratio- A | | Beginning Account Value November 1, 2023 | | Ending Account Value April 30, 2024 | | Expenses Paid During Period- C November 1, 2023 to April 30, 2024 |
| Fidelity® Value Fund | | | | | | | | | | |
| Fidelity® Value Fund | | | | .84% | | | | | | |
| Actual | | | | | | $ 1,000 | | $ 1,230.60 | | $ 4.66 |
Hypothetical-B | | | | | | $ 1,000 | | $ 1,020.69 | | $ 4.22 |
| Class K | | | | .76% | | | | | | |
| Actual | | | | | | $ 1,000 | | $ 1,231.40 | | $ 4.22 |
Hypothetical-B | | | | | | $ 1,000 | | $ 1,021.08 | | $ 3.82 |
| |
A Annualized expense ratio reflects expenses net of applicable fee waivers.
B 5% return per year before expenses
C Expenses are equal to the annualized expense ratio, multiplied by the average account value over the period, multiplied by 182/ 366 (to reflect the one-half year period). The fees and expenses of any Underlying Funds are not included in each annualized expense ratio.
Board Approval of Investment Advisory Contracts
Fidelity Value Fund
At its January 2024 meeting, the Board of Trustees, including the Independent Trustees (together, the Board), approved an amended and restated management contract with Fidelity Management & Research Company LLC (FMR) (the Management Contract), and amended and restated sub-advisory agreements (the Sub-Advisory Contracts, and together with the Management Contract, the Advisory Contracts) for the fund, including the fund's sub-advisory agreements with FMR Investment Management (UK) Limited (FMR UK), Fidelity Management & Research (Hong Kong) Limited (FMR H.K.), and Fidelity Management & Research (Japan) Limited (FMR Japan). The Advisory Contracts will be effective March 1, 2024. The Board will consider the annual renewal of the fund's Advisory Contracts in May 2024, following its review of additional materials provided by FMR.
Management Contract. The Board approved the Management Contract, which implements a new fee structure combining the management fee, transfer agent fee (TA Fee), and pricing and bookkeeping fee (P&B Fee) of the fund and each class into a single class-level fee based on tiered schedules and subject to a maximum class-level rate (the Unified Fee). In exchange for the Unified Fee, the fund will receive investment advisory, management, administrative, transfer agent, pricing and bookkeeping services under a single agreement - the Management Contract.
In its consideration of the Management Contract over several meetings, the Board received, reviewed and discussed a comprehensive set of analyses regarding the Unified Fee including (i) the legal framework, (ii) design goals for the Unified Fee, (iii) calculation methodology for the Unified Fee and illustrative examples, (iv) annual and cumulative projected impacts under various scenarios, both in the aggregate and at the fund/class level, (v) explanations of schedules, rate levers and maximum rates and (vi) shareholder benefits and projected savings.
The Board considered that the maximum Unified Fee for each class of the fund would be no higher than the sum of (i) the lowest contractual management fee rate under the fund's existing management contract, which is the individual fund fee rate, if any, plus the lowest contractual marginal group fee rate and (ii) the TA and P&B Fee rates, which are fixed fee rates since December 1, 2023 (together, the Unified Fee Cap). The Board noted that Fidelity has represented that, as a result of this Unified Fee Cap, the Unified Fee would be no greater than the fee rates previously authorized to be charged to the fund for the same services. The Board noted that certain expenses such as performance adjustments, third-party expenses, and certain other miscellaneous expenses would be outside the scope of the Unified Fee and the calculation of such fees would not change as a result of the Unified Fee. The Board considered that, under the Management Contract, a different management fee rate will be applicable to each class of the fund. The Board noted that Fidelity has represented that the difference in expenses between classes is based on differences in class-specific expenses and not due to any difference in advisory or third-party custodial fees or other expenses related to the management of the fund's assets.
The Board considered Fidelity's representations that implementation of the Unified Fee, which includes the Unified Fee Cap, would cause all funds subject to the Unified Fee, including the fund, to experience an immediate reduction on contractual fee rates for services provided under the current management contracts. The Board considered that some funds would not experience lower net total fees as a result of existing fee caps. The Board further considered that, in addition to the contractual fee savings, the Unified Fee offers funds and their shareholders greater protection from future rate increases for services previously offered under separate agreements that are now covered by the Management Contract because such rate increases would require shareholder approval.
Sub-Advisory Contracts. In connection with the Unified Fee changes, the Board considered the Sub-Advisory Contracts, which simplified the calculation of the fees paid by FMR to the sub-advisers under the agreements. The Board noted that the agreements with FMR UK, FMR H.K., and FMR Japan were amended to provide that FMR will compensate each sub-adviser at a fee rate equal to 110% of the sub-adviser's costs incurred in providing services under the agreement. The Board considered that, under the Sub-Advisory Contracts, FMR, and not the fund, will continue to pay the sub-advisory fees to each applicable sub-adviser.
The Board further considered that the approval of the fund's Advisory Contracts will not result in any changes in the investment process or strategies employed in the management of the fund's assets or the day-to-day management of the fund or the persons primarily responsible for such management. Further, the Board considered that the Management Contract would not change the obligations and services of FMR and its affiliates on behalf of the fund, and, in particular, there would be no change in the nature and level of advisory, management, administration, transfer agent, and pricing and bookkeeping services provided to the fund by FMR, its affiliates, and each applicable sub-adviser.
In connection with its consideration of future renewals of the fund's Advisory Contracts, the Board will consider: (i) the nature, extent and quality of services provided to the funds, including shareholder and administrative services and investment performance; (ii) the competitiveness of the management fee and total expenses for the fund; (iii) the costs of the services and profitability, including the revenues earned and the expenses incurred in conducting the business of developing, marketing, distributing, managing, administering, and servicing the fund and its shareholders, to the extent applicable; and (iv) whether there have been economies of scale in respect of the Fidelity funds, whether the Fidelity funds (including the fund) have appropriately benefited from any such economies of scale, and whether there is the potential for realization of any further economies.
Based on its evaluation of all of the conclusions and representations noted above, and after considering all factors it believed relevant, the Board concluded that the fund's management fee structure is fair and reasonable, and that the fund's Advisory Contracts should be approved.
The Securities and Exchange Commission adopted Rule 22e-4 under the Investment Company Act of 1940 (the Liquidity Rule) to promote effective liquidity risk management throughout the open-end investment company industry, thereby reducing the risk that funds will be unable to meet their redemption obligations and mitigating dilution of the interests of fund shareholders.
The Fund has adopted and implemented a liquidity risk management program (the Program) reasonably designed to assess and manage the Fund's liquidity risk and to comply with the requirements of the Liquidity Rule. The Fund's Board of Trustees (the Board) has designated the Fund's investment adviser as administrator of the Program. The Fidelity advisers have established a Liquidity Risk Management Committee (the LRM Committee) to manage the Program for each of the Fidelity Funds. The LRM Committee monitors the adequacy and effectiveness of implementation of the Program and on a periodic basis assesses each Fund's liquidity risk based on a variety of factors including (1) the Fund's investment strategy, (2) portfolio liquidity and cash flow projections during normal and reasonably foreseeable stressed conditions, (3) shareholder redemptions, (4) borrowings and other funding sources and (5) certain factors specific to ETFs including the effect of the Fund's prices and spreads, market participants, and basket compositions on the overall liquidity of the Fund's portfolio, as applicable.
In accordance with the Program, each of the Fund's portfolio investments is classified into one of four defined liquidity categories based on a determination of a reasonable expectation for how long it would take to convert the investment to cash (or sell or dispose of the investment) without significantly changing its market value.
- Highly liquid investments - cash or convertible to cash within three business days or less
- Moderately liquid investments - convertible to cash in three to seven calendar days
- Less liquid investments - can be sold or disposed of, but not settled, within seven calendar days
- Illiquid investments - cannot be sold or disposed of within seven calendar days
Liquidity classification determinations take into account a variety of factors including various market, trading and investment-specific considerations, as well as market depth, and generally utilize analysis from a third-party liquidity metrics service.
The Liquidity Rule places a 15% limit on a fund's illiquid investments and requires funds that do not primarily hold assets that are highly liquid investments to determine and maintain a minimum percentage of the fund's net assets to be invested in highly liquid investments (highly liquid investment minimum or HLIM). The Program includes provisions reasonably designed to comply with the 15% limit on illiquid investments and for determining, periodically reviewing and complying with the HLIM requirement as applicable.
At a recent meeting of the Fund's Board of Trustees, the LRM Committee provided a written report to the Board pertaining to the operation, adequacy, and effectiveness of the Program for the period December 1, 2022 through November 30, 2023. The report concluded that the Program is operating effectively and is reasonably designed to assess and manage the Fund's liquidity risk.
1.703562.126
VAL-SANN-0624
Fidelity® Disciplined Equity Fund
Semi-Annual Report
April 30, 2024
Contents
To view a fund's proxy voting guidelines and proxy voting record for the 12-month period ended June 30, visit http://www.fidelity.com/proxyvotingresults or visit the Securities and Exchange Commission's (SEC) web site at http://www.sec.gov.
You may also call 1-800-544-8544 if you're an individual investing directly with Fidelity, call 1-800-835-5092 if you're a plan sponsor or participant with Fidelity as your recordkeeper or call 1-877-208-0098 on institutional accounts or if you're an advisor or invest through one to request a free copy of the proxy voting guidelines.
Standard & Poor's, S&P and S&P 500 are registered service marks of The McGraw-Hill Companies, Inc. and have been licensed for use by Fidelity Distributors Corporation.
Other third-party marks appearing herein are the property of their respective owners.
All other marks appearing herein are registered or unregistered trademarks or service marks of FMR LLC or an affiliated company. © 2024 FMR LLC. All rights reserved.
This report and the financial statements contained herein are submitted for the general information of the shareholders of the Fund. This report is not authorized for distribution to prospective investors in the Fund unless preceded or accompanied by an effective prospectus.
A fund files its complete schedule of portfolio holdings with the SEC for the first and third quarters of each fiscal year on Form N-PORT. Forms N-PORT are available on the SEC's web site at http://www.sec.gov. A fund's Forms N-PORT may be reviewed and copied at the SEC's Public Reference Room in Washington, DC. Information regarding the operation of the SEC's Public Reference Room may be obtained by calling 1-800-SEC-0330.
For a complete list of a fund's portfolio holdings, view the most recent holdings listing, semiannual report, or annual report on Fidelity's web site at http://www.fidelity.com, http://www.institutional.fidelity.com, or http://www.401k.com, as applicable.
NOT FDIC INSURED •MAY LOSE VALUE •NO BANK GUARANTEE
Neither the Fund nor Fidelity Distributors Corporation is a bank.
Top Holdings (% of Fund's net assets) |
| |
| Microsoft Corp. | 8.7 | |
| NVIDIA Corp. | 6.7 | |
| Amazon.com, Inc. | 4.8 | |
| Apple, Inc. | 3.9 | |
| Meta Platforms, Inc. Class A | 3.6 | |
| Alphabet, Inc. Class A | 3.1 | |
| Eli Lilly & Co. | 2.9 | |
| Alphabet, Inc. Class C | 2.7 | |
| JPMorgan Chase & Co. | 2.2 | |
| UnitedHealth Group, Inc. | 2.0 | |
| | 40.6 | |
| |
| Market Sectors (% of Fund's net assets) |
| |
| Information Technology | 33.8 | |
| Health Care | 12.9 | |
| Industrials | 12.7 | |
| Financials | 11.1 | |
| Communication Services | 10.6 | |
| Consumer Discretionary | 9.6 | |
| Consumer Staples | 2.9 | |
| Materials | 2.3 | |
| Energy | 2.2 | |
| Real Estate | 0.2 | |
| Utilities | 0.2 | |
| |
Asset Allocation (% of Fund's net assets) |
|
|
Showing Percentage of Net Assets
| Common Stocks - 98.5% |
| | | Shares | Value ($) (000s) |
| COMMUNICATION SERVICES - 10.6% | | | |
| Entertainment - 1.2% | | | |
| Netflix, Inc. (a) | | 42,034 | 23,146 |
| Interactive Media & Services - 9.4% | | | |
| Alphabet, Inc.: | | | |
| Class A | | 356,000 | 57,950 |
| Class C | | 312,400 | 51,434 |
| Meta Platforms, Inc. Class A | | 157,477 | 67,742 |
| | | | 177,126 |
TOTAL COMMUNICATION SERVICES | | | 200,272 |
| CONSUMER DISCRETIONARY - 9.6% | | | |
| Broadline Retail - 4.8% | | | |
| Amazon.com, Inc. (a) | | 520,260 | 91,046 |
| Distributors - 0.0% | | | |
| Pool Corp. | | 3,200 | 1,160 |
| Hotels, Restaurants & Leisure - 2.8% | | | |
| Airbnb, Inc. Class A (a) | | 69,700 | 11,052 |
| Booking Holdings, Inc. | | 2,100 | 7,249 |
| Chipotle Mexican Grill, Inc. (a) | | 600 | 1,896 |
| Domino's Pizza, Inc. | | 10,000 | 5,293 |
| Doordash, Inc. (a) | | 41,000 | 5,300 |
| Hilton Worldwide Holdings, Inc. | | 50,066 | 9,877 |
| Marriott International, Inc. Class A | | 53,500 | 12,633 |
| | | | 53,300 |
| Household Durables - 1.0% | | | |
| NVR, Inc. (a) | | 1,655 | 12,311 |
| TopBuild Corp. (a) | | 14,700 | 5,949 |
| | | | 18,260 |
| Specialty Retail - 0.6% | | | |
| Dick's Sporting Goods, Inc. | | 22,600 | 4,541 |
| TJX Companies, Inc. | | 66,700 | 6,276 |
| | | | 10,817 |
| Textiles, Apparel & Luxury Goods - 0.4% | | | |
| lululemon athletica, Inc. (a) | | 16,900 | 6,094 |
| NIKE, Inc. Class B | | 9,810 | 905 |
| | | | 6,999 |
TOTAL CONSUMER DISCRETIONARY | | | 181,582 |
| CONSUMER STAPLES - 2.9% | | | |
| Beverages - 1.2% | | | |
| Monster Beverage Corp. (a) | | 162,000 | 8,659 |
| The Coca-Cola Co. | | 239,200 | 14,775 |
| | | | 23,434 |
| Consumer Staples Distribution & Retail - 1.6% | | | |
| Costco Wholesale Corp. | | 41,315 | 29,867 |
| Food Products - 0.1% | | | |
| Lamb Weston Holdings, Inc. | | 19,200 | 1,600 |
| Personal Care Products - 0.0% | | | |
| Estee Lauder Companies, Inc. Class A | | 5,119 | 751 |
TOTAL CONSUMER STAPLES | | | 55,652 |
| ENERGY - 2.2% | | | |
| Oil, Gas & Consumable Fuels - 2.2% | | | |
| ConocoPhillips Co. | | 68,200 | 8,567 |
| Devon Energy Corp. | | 118,900 | 6,085 |
| EOG Resources, Inc. | | 68,567 | 9,060 |
| Exxon Mobil Corp. | | 36,600 | 4,329 |
| Occidental Petroleum Corp. | | 61,500 | 4,068 |
| Ovintiv, Inc. | | 60,700 | 3,115 |
| Valero Energy Corp. | | 35,700 | 5,707 |
| | | | 40,931 |
| FINANCIALS - 11.1% | | | |
| Banks - 3.9% | | | |
| Bank of America Corp. | | 673,683 | 24,933 |
| JPMorgan Chase & Co. | | 212,814 | 40,805 |
| KeyCorp | | 570,900 | 8,272 |
| | | | 74,010 |
| Capital Markets - 2.7% | | | |
| Coinbase Global, Inc. (a) | | 22,500 | 4,588 |
| KKR & Co. LP | | 78,600 | 7,315 |
| LPL Financial | | 21,500 | 5,786 |
| Moody's Corp. | | 34,439 | 12,754 |
| MSCI, Inc. | | 17,944 | 8,358 |
| S&P Global, Inc. | | 27,458 | 11,418 |
| | | | 50,219 |
| Financial Services - 3.5% | | | |
| MasterCard, Inc. Class A | | 67,811 | 30,596 |
| Visa, Inc. Class A | | 133,134 | 35,761 |
| | | | 66,357 |
| Insurance - 1.0% | | | |
| Arthur J. Gallagher & Co. | | 41,900 | 9,834 |
| The Travelers Companies, Inc. | | 40,700 | 8,635 |
| | | | 18,469 |
TOTAL FINANCIALS | | | 209,055 |
| HEALTH CARE - 12.9% | | | |
| Biotechnology - 0.9% | | | |
| Repligen Corp. (a) | | 22,200 | 3,645 |
| Vertex Pharmaceuticals, Inc. (a) | | 35,600 | 13,984 |
| | | | 17,629 |
| Health Care Equipment & Supplies - 3.3% | | | |
| Boston Scientific Corp. (a) | | 266,029 | 19,120 |
| DexCom, Inc. (a) | | 63,400 | 8,077 |
| IDEXX Laboratories, Inc. (a) | | 11,493 | 5,663 |
| Inspire Medical Systems, Inc. (a) | | 16,300 | 3,939 |
| Intuitive Surgical, Inc. (a) | | 24,314 | 9,011 |
| Penumbra, Inc. (a) | | 10,700 | 2,102 |
| Stryker Corp. | | 37,000 | 12,451 |
| TransMedics Group, Inc. (a) | | 11,625 | 1,094 |
| | | | 61,457 |
| Health Care Providers & Services - 2.7% | | | |
| Cigna Group | | 16,000 | 5,713 |
| Elevance Health, Inc. | | 14,300 | 7,559 |
| UnitedHealth Group, Inc. | | 78,975 | 38,200 |
| | | | 51,472 |
| Life Sciences Tools & Services - 2.6% | | | |
| Danaher Corp. | | 97,645 | 24,081 |
| Mettler-Toledo International, Inc. (a) | | 5,664 | 6,965 |
| Thermo Fisher Scientific, Inc. | | 29,300 | 16,663 |
| West Pharmaceutical Services, Inc. | | 5,836 | 2,086 |
| | | | 49,795 |
| Pharmaceuticals - 3.4% | | | |
| Eli Lilly & Co. | | 70,100 | 54,755 |
| Zoetis, Inc. Class A | | 57,144 | 9,100 |
| | | | 63,855 |
TOTAL HEALTH CARE | | | 244,208 |
| INDUSTRIALS - 12.7% | | | |
| Aerospace & Defense - 3.2% | | | |
| General Electric Co. | | 180,500 | 29,209 |
| HEICO Corp. Class A | | 77,047 | 12,778 |
| The Boeing Co. (a) | | 14,100 | 2,367 |
| TransDigm Group, Inc. | | 12,500 | 15,600 |
| | | | 59,954 |
| Building Products - 0.2% | | | |
| The AZEK Co., Inc. (a) | | 100,700 | 4,596 |
| Commercial Services & Supplies - 1.2% | | | |
| Cintas Corp. | | 16,563 | 10,904 |
| Copart, Inc. | | 225,552 | 12,250 |
| | | | 23,154 |
| Construction & Engineering - 1.0% | | | |
| Comfort Systems U.S.A., Inc. | | 24,700 | 7,642 |
| EMCOR Group, Inc. | | 33,400 | 11,929 |
| | | | 19,571 |
| Electrical Equipment - 3.2% | | | |
| AMETEK, Inc. | | 67,438 | 11,779 |
| Eaton Corp. PLC | | 97,100 | 30,903 |
| Vertiv Holdings Co. | | 180,900 | 16,824 |
| | | | 59,506 |
| Ground Transportation - 0.8% | | | |
| Old Dominion Freight Lines, Inc. | | 27,500 | 4,997 |
| Uber Technologies, Inc. (a) | | 165,500 | 10,968 |
| | | | 15,965 |
| Machinery - 3.1% | | | |
| Fortive Corp. | | 66,700 | 5,021 |
| ITT, Inc. | | 48,939 | 6,330 |
| Parker Hannifin Corp. | | 44,100 | 24,031 |
| Pentair PLC | | 31,400 | 2,483 |
| Snap-On, Inc. | | 26,400 | 7,074 |
| Westinghouse Air Brake Tech Co. | | 78,900 | 12,709 |
| | | | 57,648 |
TOTAL INDUSTRIALS | | | 240,394 |
| INFORMATION TECHNOLOGY - 33.8% | | | |
| Electronic Equipment, Instruments & Components - 1.5% | | | |
| Amphenol Corp. Class A | | 154,740 | 18,688 |
| CDW Corp. | | 36,773 | 8,894 |
| | | | 27,582 |
| IT Services - 0.4% | | | |
| Accenture PLC Class A | | 21,908 | 6,592 |
| Twilio, Inc. Class A (a) | | 12,900 | 772 |
| | | | 7,364 |
| Semiconductors & Semiconductor Equipment - 11.5% | | | |
| Advanced Micro Devices, Inc. (a) | | 108,700 | 17,216 |
| Broadcom, Inc. | | 5,400 | 7,021 |
| Entegris, Inc. | | 14,100 | 1,874 |
| KLA Corp. | | 11,600 | 7,996 |
| Lam Research Corp. | | 18,567 | 16,607 |
| Lattice Semiconductor Corp. (a) | | 79,700 | 5,467 |
| Micron Technology, Inc. | | 139,100 | 15,713 |
| Monolithic Power Systems, Inc. | | 15,600 | 10,442 |
| NVIDIA Corp. | | 146,698 | 126,750 |
| NXP Semiconductors NV | | 14,800 | 3,792 |
| ON Semiconductor Corp. (a) | | 61,300 | 4,301 |
| | | | 217,179 |
| Software - 16.5% | | | |
| Adobe, Inc. (a) | | 38,959 | 18,031 |
| ANSYS, Inc. (a) | | 21,600 | 7,017 |
| Cadence Design Systems, Inc. (a) | | 66,947 | 18,453 |
| Crowdstrike Holdings, Inc. (a) | | 6,900 | 2,019 |
| Dynatrace, Inc. (a) | | 118,103 | 5,351 |
| Fortinet, Inc. (a) | | 194,060 | 12,261 |
| Guidewire Software, Inc. (a)(b) | | 7,200 | 795 |
| HubSpot, Inc. (a) | | 12,362 | 7,477 |
| Intuit, Inc. | | 32,126 | 20,099 |
| Microsoft Corp. | | 424,638 | 165,324 |
| Palo Alto Networks, Inc. (a) | | 32,700 | 9,512 |
| Salesforce, Inc. | | 89,294 | 24,015 |
| ServiceNow, Inc. (a) | | 13,652 | 9,465 |
| Synopsys, Inc. (a) | | 21,900 | 11,620 |
| | | | 311,439 |
| Technology Hardware, Storage & Peripherals - 3.9% | | | |
| Apple, Inc. | | 435,907 | 74,248 |
TOTAL INFORMATION TECHNOLOGY | | | 637,812 |
| MATERIALS - 2.3% | | | |
| Chemicals - 1.0% | | | |
| CF Industries Holdings, Inc. | | 82,100 | 6,483 |
| Corteva, Inc. | | 34,300 | 1,857 |
| Sherwin-Williams Co. | | 35,583 | 10,661 |
| | | | 19,001 |
| Construction Materials - 1.3% | | | |
| Martin Marietta Materials, Inc. | | 21,500 | 12,622 |
| Vulcan Materials Co. | | 44,100 | 11,361 |
| | | | 23,983 |
TOTAL MATERIALS | | | 42,984 |
| REAL ESTATE - 0.2% | | | |
| Equity Real Estate Investment Trusts (REITs) - 0.2% | | | |
| American Tower Corp. | | 26,000 | 4,461 |
| UTILITIES - 0.2% | | | |
| Independent Power and Renewable Electricity Producers - 0.2% | | | |
| Vistra Corp. | | 49,400 | 3,746 |
| TOTAL COMMON STOCKS (Cost $907,288) | | | 1,861,097 |
| | | | |
| Money Market Funds - 0.7% |
| | | Shares | Value ($) (000s) |
| Fidelity Cash Central Fund 5.39% (c) | | 12,154,946 | 12,157 |
| Fidelity Securities Lending Cash Central Fund 5.39% (c)(d) | | 818,193 | 818 |
| TOTAL MONEY MARKET FUNDS (Cost $12,975) | | | 12,975 |
| | | | |
| TOTAL INVESTMENT IN SECURITIES - 99.2% (Cost $920,263) | 1,874,072 |
NET OTHER ASSETS (LIABILITIES) - 0.8% | 14,951 |
| NET ASSETS - 100.0% | 1,889,023 |
| | |
Any values shown as $0 in the Schedule of Investments may reflect amounts less than $500.
Legend
| (b) | Security or a portion of the security is on loan at period end. |
| (c) | Affiliated fund that is generally available only to investment companies and other accounts managed by Fidelity Investments. The rate quoted is the annualized seven-day yield of the fund at period end. A complete unaudited listing of the fund's holdings as of its most recent quarter end is available upon request. In addition, each Fidelity Central Fund's financial statements are available on the SEC's website or upon request. |
| (d) | Investment made with cash collateral received from securities on loan. |
Affiliated Central Funds
Fiscal year to date information regarding the Fund's investments in Fidelity Central Funds, including the ownership percentage, is presented below.
| Affiliate (Amounts in thousands) | Value, beginning of period ($) | Purchases ($) | Sales Proceeds ($) | Dividend Income ($) | Realized Gain (loss) ($) | Change in Unrealized appreciation (depreciation) ($) | Value, end of period ($) | % ownership, end of period |
| Fidelity Cash Central Fund 5.39% | 7,011 | 107,271 | 102,125 | 184 | - | - | 12,157 | 0.0% |
| Fidelity Securities Lending Cash Central Fund 5.39% | - | 12,345 | 11,527 | - | - | - | 818 | 0.0% |
| Total | 7,011 | 119,616 | 113,652 | 184 | - | - | 12,975 | |
| | | | | | | | | |
Amounts in the dividend income column in the above table include any capital gain distributions from underlying funds, which are presented in the corresponding line item in the Statement of Operations, if applicable.
Amounts in the dividend income column for Fidelity Securities Lending Cash Central Fund represents the income earned on investing cash collateral, less rebates paid to borrowers and any lending agent fees associated with the loan, plus any premium payments received for lending certain types of securities.
Amounts included in the purchases and sales proceeds columns may include in-kind transactions, if applicable.
Investment Valuation
The following is a summary of the inputs used, as of April 30, 2024, involving the Fund's assets and liabilities carried at fair value. The inputs or methodology used for valuing securities may not be an indication of the risk associated with investing in those securities. For more information on valuation inputs, and their aggregation into the levels used below, please refer to the Investment Valuation section in the accompanying Notes to Financial Statements.
| Valuation Inputs at Reporting Date: |
Description (Amounts in thousands) | Total ($) | Level 1 ($) | Level 2 ($) | Level 3 ($) |
Investments in Securities: | | | | |
|
| Equities: | | | | |
Communication Services | 200,272 | 200,272 | - | - |
Consumer Discretionary | 181,582 | 181,582 | - | - |
Consumer Staples | 55,652 | 55,652 | - | - |
Energy | 40,931 | 40,931 | - | - |
Financials | 209,055 | 209,055 | - | - |
Health Care | 244,208 | 244,208 | - | - |
Industrials | 240,394 | 240,394 | - | - |
Information Technology | 637,812 | 637,812 | - | - |
Materials | 42,984 | 42,984 | - | - |
Real Estate | 4,461 | 4,461 | - | - |
Utilities | 3,746 | 3,746 | - | - |
|
| Money Market Funds | 12,975 | 12,975 | - | - |
| Total Investments in Securities: | 1,874,072 | 1,874,072 | - | - |
| Statement of Assets and Liabilities |
| Amounts in thousands (except per-share amounts) | | | | April 30, 2024 (Unaudited) |
| | | | | |
| Assets | | | | |
| Investment in securities, at value (including securities loaned of $784) - See accompanying schedule: | | | | |
Unaffiliated issuers (cost $907,288) | $ | 1,861,097 | | |
Fidelity Central Funds (cost $12,975) | | 12,975 | | |
| | | | | |
| | | | | |
| Total Investment in Securities (cost $920,263) | | | $ | 1,874,072 |
| Receivable for investments sold | | | | 19,924 |
| Receivable for fund shares sold | | | | 161 |
| Dividends receivable | | | | 164 |
| Distributions receivable from Fidelity Central Funds | | | | 28 |
| Prepaid expenses | | | | 1 |
Total assets | | | | 1,894,350 |
| Liabilities | | | | |
| Payable for investments purchased | $ | 3,252 | | |
| Payable for fund shares redeemed | | 317 | | |
| Accrued management fee | | 904 | | |
| Other payables and accrued expenses | | 36 | | |
| Collateral on securities loaned | | 818 | | |
| Total liabilities | | | | 5,327 |
| Net Assets | | | $ | 1,889,023 |
| Net Assets consist of: | | | | |
| Paid in capital | | | $ | 869,686 |
| Total accumulated earnings (loss) | | | | 1,019,337 |
| Net Assets | | | $ | 1,889,023 |
| | | | | |
| Net Asset Value and Maximum Offering Price | | | | |
| Disciplined Equity : | | | | |
Net Asset Value, offering price and redemption price per share ($1,828,358 ÷ 28,715 shares) | | | $ | 63.67 |
| Class K : | | | | |
Net Asset Value, offering price and redemption price per share ($60,665 ÷ 953 shares)(a) | | | $ | 63.65 |
(a)Corresponding Net Asset Value does not calculate due to rounding of fractional net assets and/or shares. |
| Statement of Operations |
| Amounts in thousands | | | | Six months ended April 30, 2024 (Unaudited) |
| Investment Income | | | | |
| Dividends | | | $ | 7,405 |
| Income from Fidelity Central Funds | | | | 184 |
| Total income | | | | 7,589 |
| Expenses | | | | |
| Management fee | | | | |
| Basic fee | $ | 5,166 | | |
| Performance adjustment | | (1,142) | | |
| Transfer agent fees | | 717 | | |
| Accounting fees | | 161 | | |
| Custodian fees and expenses | | 12 | | |
| Independent trustees' fees and expenses | | 4 | | |
| Registration fees | | 29 | | |
| Audit | | 27 | | |
| Legal | | 6 | | |
| Interest | | 3 | | |
| Miscellaneous | | 6 | | |
| Total expenses before reductions | | 4,989 | | |
| Expense reductions | | (81) | | |
| Total expenses after reductions | | | | 4,908 |
| Net Investment income (loss) | | | | 2,681 |
| Realized and Unrealized Gain (Loss) | | | | |
| Net realized gain (loss) on: | | | | |
| Investment Securities: | | | | |
| Unaffiliated issuers | | 69,579 | | |
| Total net realized gain (loss) | | | | 69,579 |
| Change in net unrealized appreciation (depreciation) on investment securities | | | | 321,388 |
| Net gain (loss) | | | | 390,967 |
| Net increase (decrease) in net assets resulting from operations | | | $ | 393,648 |
| Statement of Changes in Net Assets |
| |
| Amount in thousands | | Six months ended April 30, 2024 (Unaudited) | | Year ended October 31, 2023 |
| Increase (Decrease) in Net Assets | | | | |
| Operations | | | | |
| Net investment income (loss) | $ | 2,681 | $ | 6,784 |
| Net realized gain (loss) | | 69,579 | | 76,312 |
| Change in net unrealized appreciation (depreciation) | | 321,388 | | 122,255 |
| Net increase (decrease) in net assets resulting from operations | | 393,648 | | 205,351 |
| Distributions to shareholders | | (77,529) | | (40,439) |
| | | | | |
| Share transactions - net increase (decrease) | | 20,140 | | (87,151) |
| Total increase (decrease) in net assets | | 336,259 | | 77,761 |
| | | | | |
| Net Assets | | | | |
| Beginning of period | | 1,552,764 | | 1,475,003 |
| End of period | $ | 1,889,023 | $ | 1,552,764 |
| | | | | |
| | | | | |
Financial Highlights
Fidelity® Disciplined Equity Fund |
| |
| | Six months ended (Unaudited) April 30, 2024 | | Years ended October 31, 2023 | | 2022 | | 2021 | | 2020 | | 2019 |
Selected Per-Share Data | | | | | | | | | | | | |
| Net asset value, beginning of period | $ | 53.10 | $ | 47.71 | $ | 65.18 | $ | 45.48 | $ | 37.51 | $ | 38.32 |
| Income from Investment Operations | | | | | | | | | | | | |
Net investment income (loss) A,B | | .09 | | .22 | | .11 | | (.06) | | .03 | | .32 |
| Net realized and unrealized gain (loss) | | 13.14 | | 6.49 | | (16.65) | | 19.77 | | 8.16 | | 3.53 |
| Total from investment operations | | 13.23 | | 6.71 | | (16.54) | | 19.71 | | 8.19 | | 3.85 |
| Distributions from net investment income | | (.22) | | (.12) | | - | | (.01) | | (.22) | | (.53) |
| Distributions from net realized gain | | (2.45) | | (1.20) | | (.93) | | - | | - | | (4.13) |
| Total distributions | | (2.66) C | | (1.32) | | (.93) | | (.01) | | (.22) | | (4.66) |
| Net asset value, end of period | $ | 63.67 | $ | 53.10 | $ | 47.71 | $ | 65.18 | $ | 45.48 | $ | 37.51 |
Total Return D,E | | | | 14.44% | | (25.71)% | | 43.35% | | 21.92% | | 12.01% |
Ratios to Average Net Assets B,F,G | | | | | | | | | | | | |
| Expenses before reductions | | .55% H | | .49% | | .71% | | .79% | | .71% | | .51% |
| Expenses net of fee waivers, if any | | | | .48% | | .70% | | .78% | | .71% | | .51% |
| Expenses net of all reductions | | .54% H | | .48% | | .70% | | .78% | | .71% | | .51% |
| Net investment income (loss) | | .29% H | | .44% | | .20% | | (.10)% | | .07% | | .90% |
| Supplemental Data | | | | | | | | | | | | |
| Net assets, end of period (in millions) | $ | 1,828 | $ | 1,504 | $ | 1,422 | $ | 2,091 | $ | 1,469 | $ | 1,190 |
Portfolio turnover rate I | | | | 36% | | 28% | | 19% | | 35% | | 108% |
ACalculated based on average shares outstanding during the period.
BNet investment income (loss) is affected by the timing of the declaration of dividends by any underlying mutual funds or exchange-traded funds (ETFs). Net investment income (loss) of any mutual funds or ETFs is not included in the Fund's net investment income (loss) ratio.
CTotal distributions per share do not sum due to rounding.
DTotal returns for periods of less than one year are not annualized.
ETotal returns would have been lower if certain expenses had not been reduced during the applicable periods shown.
FFees and expenses of any underlying mutual funds or exchange-traded funds (ETFs) are not included in the Fund's expense ratio. The Fund indirectly bears its proportionate share of these expenses. For additional expense information related to investments in Fidelity Central Funds, please refer to the "Investments in Fidelity Central Funds" note found in the Notes to Financial Statements section of the most recent Annual or Semi-Annual report.
GExpense ratios reflect operating expenses of the class. Expenses before reductions do not reflect amounts reimbursed, waived, or reduced through arrangements with the investment adviser, brokerage services, or other offset arrangements, if applicable, and do not represent the amount paid by the class during periods when reimbursements, waivers or reductions occur.
HAnnualized.
IAmount does not include the portfolio activity of any underlying mutual funds or exchange-traded funds (ETFs).
Fidelity® Disciplined Equity Fund Class K |
| |
| | Six months ended (Unaudited) April 30, 2024 | | Years ended October 31, 2023 | | 2022 | | 2021 | | 2020 | | 2019 |
Selected Per-Share Data | | | | | | | | | | | | |
| Net asset value, beginning of period | $ | 53.11 | $ | 47.72 | $ | 65.14 | $ | 45.42 | $ | 37.47 | $ | 38.29 |
| Income from Investment Operations | | | | | | | | | | | | |
Net investment income (loss) A,B | | .12 | | .27 | | .16 | | (.01) | | .06 | | .35 |
| Net realized and unrealized gain (loss) | | 13.13 | | 6.49 | | (16.65) | | 19.75 | | 8.14 | | 3.53 |
| Total from investment operations | | 13.25 | | 6.76 | | (16.49) | | 19.74 | | 8.20 | | 3.88 |
| Distributions from net investment income | | (.26) | | (.17) | | - | | (.02) | | (.25) | | (.57) |
| Distributions from net realized gain | | (2.45) | | (1.20) | | (.93) | | - | | - | | (4.13) |
| Total distributions | | (2.71) | | (1.37) | | (.93) | | (.02) | | (.25) | | (4.70) |
| Net asset value, end of period | $ | 63.65 | $ | 53.11 | $ | 47.72 | $ | 65.14 | $ | 45.42 | $ | 37.47 |
Total Return C,D | | | | 14.55% | | (25.65)% | | 43.47% | | 21.99% | | 12.12% |
Ratios to Average Net Assets B,E,F | | | | | | | | | | | | |
| Expenses before reductions | | .46% G | | .40% | | .62% | | .70% | | .62% | | .42% |
| Expenses net of fee waivers, if any | | | | .39% | | .62% | | .70% | | .62% | | .42% |
| Expenses net of all reductions | | .45% G | | .39% | | .62% | | .70% | | .62% | | .42% |
| Net investment income (loss) | | .38% G | | .52% | | .28% | | (.01)% | | .16% | | .99% |
| Supplemental Data | | | | | | | | | | | | |
| Net assets, end of period (in millions) | $ | 61 | $ | 49 | $ | 53 | $ | 113 | $ | 95 | $ | 91 |
Portfolio turnover rate H | | | | 36% | | 28% | | 19% | | 35% | | 108% |
ACalculated based on average shares outstanding during the period.
BNet investment income (loss) is affected by the timing of the declaration of dividends by any underlying mutual funds or exchange-traded funds (ETFs). Net investment income (loss) of any mutual funds or ETFs is not included in the Fund's net investment income (loss) ratio.
CTotal returns for periods of less than one year are not annualized.
DTotal returns would have been lower if certain expenses had not been reduced during the applicable periods shown.
EFees and expenses of any underlying mutual funds or exchange-traded funds (ETFs) are not included in the Fund's expense ratio. The Fund indirectly bears its proportionate share of these expenses. For additional expense information related to investments in Fidelity Central Funds, please refer to the "Investments in Fidelity Central Funds" note found in the Notes to Financial Statements section of the most recent Annual or Semi-Annual report.
FExpense ratios reflect operating expenses of the class. Expenses before reductions do not reflect amounts reimbursed, waived, or reduced through arrangements with the investment adviser, brokerage services, or other offset arrangements, if applicable, and do not represent the amount paid by the class during periods when reimbursements, waivers or reductions occur.
GAnnualized.
HAmount does not include the portfolio activity of any underlying mutual funds or exchange-traded funds (ETFs).
For the period ended April 30, 2024
(Amounts in thousands except percentages)
1. Organization.
Fidelity Disciplined Equity Fund (the Fund) is a fund of Fidelity Capital Trust (the Trust) and is authorized to issue an unlimited number of shares. The Trust is registered under the Investment Company Act of 1940, as amended (the 1940 Act), as an open-end management investment company organized as a Massachusetts business trust. The Fund offers Disciplined Equity and Class K shares, each of which has equal rights as to assets and voting privileges.
2. Investments in Fidelity Central Funds.
Funds may invest in Fidelity Central Funds, which are open-end investment companies generally available only to other investment companies and accounts managed by the investment adviser and its affiliates. The Schedule of Investments lists any Fidelity Central Funds held as an investment as of period end, but does not include the underlying holdings of each Fidelity Central Fund. An investing fund indirectly bears its proportionate share of the expenses of the underlying Fidelity Central Funds.
Based on its investment objective, each Fidelity Central Fund may invest or participate in various investment vehicles or strategies that are similar to those of the investing fund. These strategies are consistent with the investment objectives of the investing fund and may involve certain economic risks which may cause a decline in value of each of the Fidelity Central Funds and thus a decline in the value of the investing fund.
| Fidelity Central Fund | Investment Manager | Investment Objective | Investment Practices | Expense RatioA |
| Fidelity Money Market Central Funds | Fidelity Management & Research Company LLC (FMR) | Each fund seeks to obtain a high level of current income consistent with the preservation of capital and liquidity. | Short-term Investments | Less than .005% |
A Expenses expressed as a percentage of average net assets and are as of each underlying Central Fund's most recent annual or semi-annual shareholder report.
A complete unaudited list of holdings for each Fidelity Central Fund is available upon request or at the Securities and Exchange Commission website at www.sec.gov. In addition, the financial statements of the Fidelity Central Funds which contain the significant accounting policies (including investment valuation policies) of those funds, and are not covered by the Report of Independent Registered Public Accounting Firm, are available on the Securities and Exchange Commission website or upon request.
3. Significant Accounting Policies.
The Fund is an investment company and applies the accounting and reporting guidance of the Financial Accounting Standards Board (FASB) Accounting Standards Codification Topic 946 Financial Services - Investment Companies. The financial statements have been prepared in conformity with accounting principles generally accepted in the United States of America (GAAP), which require management to make certain estimates and assumptions at the date of the financial statements. Actual results could differ from those estimates. Subsequent events, if any, through the date that the financial statements were issued have been evaluated in the preparation of the financial statements. The Fund's Schedule of Investments lists any underlying mutual funds or exchange-traded funds (ETFs) but does not include the underlying holdings of these funds. The following summarizes the significant accounting policies of the Fund:
Investment Valuation. Investments are valued as of 4:00 p.m. Eastern time on the last calendar day of the period. The Board of Trustees (the Board) has designated the Fund's investment adviser as the valuation designee responsible for the fair valuation function and performing fair value determinations as needed. The investment adviser has established a Fair Value Committee (the Committee) to carry out the day-to-day fair valuation responsibilities and has adopted policies and procedures to govern the fair valuation process and the activities of the Committee. In accordance with these fair valuation policies and procedures, which have been approved by the Board, the Fund attempts to obtain prices from one or more third party pricing services or brokers to value its investments. When current market prices, quotations or currency exchange rates are not readily available or reliable, investments will be fair valued in good faith by the Committee, in accordance with the policies and procedures. Factors used in determining fair value vary by investment type and may include market or investment specific events, transaction data, estimated cash flows, and market observations of comparable investments. The frequency that the fair valuation procedures are used cannot be predicted and they may be utilized to a significant extent. The Committee manages the Fund's fair valuation practices and maintains the fair valuation policies and procedures. The Fund's investment adviser reports to the Board information regarding the fair valuation process and related material matters.
The Fund categorizes the inputs to valuation techniques used to value its investments into a disclosure hierarchy consisting of three levels as shown below:
Level 1 - unadjusted quoted prices in active markets for identical investments
Level 2 - other significant observable inputs (including quoted prices for similar investments, interest rates, prepayment speeds, etc.)
Level 3 - unobservable inputs (including the Fund's own assumptions based on the best information available)
Valuation techniques used to value the Fund's investments by major category are as follows:
Equity securities, including restricted securities, for which market quotations are readily available, are valued at the last reported sale price or official closing price as reported by a third party pricing service on the primary market or exchange on which they are traded and are categorized as Level 1 in the hierarchy. In the event there were no sales during the day or closing prices are not available, securities are valued at the last quoted bid price or may be valued using the last available price and are generally categorized as Level 2 in the hierarchy. For foreign equity securities, when market or security specific events arise, comparisons to the valuation of American Depositary Receipts (ADRs), futures contracts, Exchange-Traded Funds (ETFs) and certain indexes as well as quoted prices for similar securities may be used and would be categorized as Level 2 in the hierarchy. For equity securities, including restricted securities, where observable inputs are limited, assumptions about market activity and risk are used and these securities may be categorized as Level 3 in the hierarchy.
Investments in open-end mutual funds, including the Fidelity Central Funds, are valued at their closing net asset value (NAV) each business day and are categorized as Level 1 in the hierarchy.
Changes in valuation techniques may result in transfers in or out of an assigned level within the disclosure hierarchy. The aggregate value of investments by input level as of April 30, 2024 is included at the end of the Fund's Schedule of Investments.
Investment Transactions and Income. For financial reporting purposes, the Fund's investment holdings and NAV include trades executed through the end of the last business day of the period. The NAV per share for processing shareholder transactions is calculated as of the close of business of the New York Stock Exchange (NYSE), normally 4:00 p.m. Eastern time and includes trades executed through the end of the prior business day. Gains and losses on securities sold are determined on the basis of identified cost and include proceeds received from litigation. Commissions paid to certain brokers with whom the investment adviser, or its affiliates, places trades on behalf of a fund include an amount in addition to trade execution, which may be rebated back to a fund. Any such rebates are included in net realized gain (loss) on investments in the Statement of Operations. Dividend income is recorded on the ex-dividend date, except for certain dividends from foreign securities where the ex-dividend date may have passed, which are recorded as soon as the Fund is informed of the ex-dividend date. Non-cash dividends included in dividend income, if any, are recorded at the fair market value of the securities received. Income and capital gain distributions from Fidelity Central Funds, if any, are recorded on the ex-dividend date.
Class Allocations and Expenses. Investment income, realized and unrealized capital gains and losses, common expenses of a fund, and certain fund-level expense reductions, if any, are allocated daily on a pro-rata basis to each class based on the relative net assets of each class to the total net assets of a fund. Each class differs with respect to transfer agent and distribution and service plan fees incurred, as applicable. Certain expense reductions may also differ by class, if applicable. For the reporting period, the allocated portion of income and expenses to each class as a percent of its average net assets may vary due to the timing of recording these transactions in relation to fluctuating net assets of the classes. Expenses directly attributable to a fund are charged to that fund. Expenses attributable to more than one fund are allocated among the respective funds on the basis of relative net assets or other appropriate methods. Expenses included in the accompanying financial statements reflect the expenses of that fund and do not include any expenses associated with any underlying mutual funds or exchange-traded funds (ETFs). Although not included in a fund's expenses, a fund indirectly bears its proportionate share of these expenses through the net asset value of each underlying mutual fund or exchange-traded fund (ETF). Expense estimates are accrued in the period to which they relate and adjustments are made when actual amounts are known.
Income Tax Information and Distributions to Shareholders. Each year, the Fund intends to qualify as a regulated investment company under Subchapter M of the Internal Revenue Code, including distributing substantially all of its taxable income and realized gains. As a result, no provision for U.S. Federal income taxes is required. The Fund files a U.S. federal tax return, in addition to state and local tax returns as required. The Fund's federal income tax returns are subject to examination by the Internal Revenue Service (IRS) for a period of three fiscal years after they are filed. State and local tax returns may be subject to examination for an additional fiscal year depending on the jurisdiction.
Distributions are declared and recorded on the ex-dividend date. Income and capital gain distributions are declared separately for each class. Income and capital gain distributions are determined in accordance with income tax regulations, which may differ from GAAP.
Capital accounts within the financial statements are adjusted for permanent book-tax differences. These adjustments have no impact on net assets or the results of operations. Capital accounts are not adjusted for temporary book-tax differences which will reverse in a subsequent period.
Book-tax differences are primarily due to losses deferred due to wash sales.
As of period end, the cost and unrealized appreciation (depreciation) in securities, and derivatives if applicable, for federal income tax purposes were as follows:
| Gross unrealized appreciation | $962,160 |
| Gross unrealized depreciation | (12,206) |
| Net unrealized appreciation (depreciation) | $949,954 |
| Tax cost | $924,118 |
4. Purchases and Sales of Investments.
Purchases and sales of securities, other than short-term securities and in-kind transactions, as applicable, are noted in the table below.
| | Purchases ($) | Sales ($) |
| Fidelity Disciplined Equity Fund | 275,682 | 342,292 |
5. Fees and Other Transactions with Affiliates.
Management Fee. Fidelity Management & Research Company LLC (the investment adviser) and its affiliates provide the Fund with investment management related services for which the Fund pays a monthly management fee.
Effective March 1, 2024, the Fund's management contract was amended to incorporate administrative services previously covered under separate services agreements (Transfer Agent and Accounting agreements). The amended contract incorporates a basic fee rate that may vary by class (subject to a performance adjustment). The investment adviser or an affiliate pays certain expenses of managing and operating the Fund out of each class's management fee. Each class of the Fund pays a management fee to the investment adviser. The management fee is calculated and paid to the investment adviser every month. The management fee is determined by calculating a basic fee and then applying a performance adjustment. When determining a class's basic fee, a mandate rate is calculated based on the monthly average net assets of a group of funds advised by FMR within a designated asset class. A discount rate is subtracted from the mandate rate once the Fund's monthly average net assets reach a certain level. The mandate rate and discount rate may vary by class. The annual basic fee rate for a class of shares of the Fund is the lesser of (1) the class's mandate rate reduced by the class's discount rate (if applicable) or (2) the amount set forth in the following table.
| | Maximum Management Fee Rate % |
| Disciplined Equity | 0.65% |
| Class K | 0.56% |
One-twelfth of the basic fee rate for a class is applied to the average net assets of the class for the month, giving a dollar amount which is the basic fee for the class for that month. A different management fee rate may be applicable to each class of the Fund. The difference between classes is the result of separate arrangements for class-level services and/or waivers of certain expenses. It is not the result of any difference in advisory or custodial fees or other expenses related to the management of the Fund's assets, which do not vary by class. For the portion of the reporting period on or after March 1, 2024, the total annualized management fee rates were as follows:
| | Total Management Fee Rate % |
| Disciplined Equity | .65 |
| Class K | .56 |
Prior to March 1, 2024, the management fee was the sum of an individual fund fee rate that was based on an annual rate of .30% of the Fund's average net assets and an annualized group fee rate that averaged .22% during the period. The group fee rate was based upon the monthly average net assets of a group of registered investment companies with which the investment adviser has management contracts. The group fee rate decreased as assets under management increased and increased as assets under management decreased. For the portion of the reporting period prior to March 1, 2024, the total annualized management fee rate was .52%.
The performance adjustment rate is calculated monthly by comparing over the performance period the Fund's performance to that of the performance adjustment index listed below.
| | Performance Adjustment Index |
| Fidelity Disciplined Equity Fund | S&P 500 Index |
For the purposes of calculating the performance adjustment for the Fund, the Fund's investment performance is based on the performance of Disciplined Equity. To the extent that other classes of the Fund have higher expenses, this could result in those classes bearing a larger positive performance adjustment and smaller negative performance adjustment than would be the case if each class's own performance were considered. The performance period is the most recent 36 month period. The maximum annualized performance adjustment rate is ± .20% of the Fund's average net assets over the performance period. The performance adjustment rate is divided by twelve and multiplied by the Fund's average net assets over the performance period, and the resulting dollar amount is proportionately added to or subtracted from a class's basic fee. For the entire reporting period, the total annualized performance adjustment was (.13)%.
Effective March 1, 2024, the Fund's sub-advisory agreements with FMR Investment Management (UK) Limited, Fidelity Management & Research (Hong Kong) Limited, and Fidelity Management & Research (Japan) Limited were amended to provide that the investment adviser pays each sub-adviser monthly fees equal to 110% of the sub-adviser's costs for providing sub-advisory services.
Transfer Agent Fees. Fidelity Investments Institutional Operations Company LLC (FIIOC), an affiliate of the investment adviser, is the transfer, dividend disbursing and shareholder servicing agent for each class of the Fund. Effective March 1, 2024, the Fund's management contract was amended to incorporate transfer agent services and associated fees previously covered under a separate services agreement. FIIOC pays for typesetting, printing and mailing of shareholder reports, except proxy statements.
During November 2023, the Board approved a change in the transfer agent fees effective December 1, 2023 to a fixed annual rate of class-level average net assets as follows:
| | % of Class-Level Average Net Assets |
| Disciplined Equity | .1251 |
Prior to December 1, 2023, FIIOC received account fees and asset-based fees that varied according to the account size and type of account of the shareholders of the respective classes of the Fund, except for Class K. FIIOC received an asset-based fee of Class K's average net assets. For the portion of the reporting period prior to March 1, 2024, the fees were equivalent to the following annualized rates:
| | Amount ($) | % of Class-Level Average Net AssetsA |
| Disciplined Equity | 709 | .12 |
| Class K | 8 | .04 |
| | 717 | |
A Annualized
Accounting Fees. Fidelity Service Company, Inc. (FSC), an affiliate of the investment adviser, maintains the Fund's accounting records. Effective March 1, 2024, the Fund's management contract was amended to incorporate accounting services and associated fees previously covered under a separate services agreement.
During November 2023, the Board approved a change in the accounting fees effective December 1, 2023 to a fixed annual rate of average net assets as follows:
| | % of Average Net Assets |
| Fidelity Disciplined Equity Fund | .0274 |
Prior to December 1, 2023, the accounting fee was based on the level of average net assets for each month. For the portion of the reporting period prior to March 1, 2024, the fees were equivalent to the following annualized rates:
| | % of Average Net Assets |
| Fidelity Disciplined Equity Fund | .03 |
Brokerage Commissions. A portion of portfolio transactions were placed with brokerage firms which are affiliates of the investment adviser. Brokerage commissions are included in net realized gain (loss) and change in net unrealized appreciation (depreciation) in the Statement of Operations. The commissions paid to these affiliated firms were as follows:
| | Amount ($) |
| Fidelity Disciplined Equity Fund | 3 |
Interfund Lending Program. Pursuant to an Exemptive Order issued by the Securities and Exchange Commission (the SEC), the Fund, along with other registered investment companies having management contracts with Fidelity Management & Research Company LLC (FMR), or other affiliated entities of FMR, may participate in an interfund lending program. This program provides an alternative credit facility allowing the Fund to borrow from, or lend money to, other participating affiliated funds. At period end, there were no interfund loans outstanding. Activity in this program during the period for which loans were outstanding was as follows:
| | Borrower or Lender | Average Loan Balance ($) | Weighted Average Interest Rate | Interest Expense ($) |
| Fidelity Disciplined Equity Fund | Borrower | 5,705 | 5.57% | 3 |
Interfund Trades. Funds may purchase from or sell securities to other Fidelity Funds under procedures adopted by the Board. The procedures have been designed to ensure these interfund trades are executed in accordance with Rule 17a-7 of the 1940 Act. Any interfund trades are included within the respective purchases and sales amounts shown in the Purchases and Sales of Investments note. Interfund trades during the period are noted in the table below.
| | Purchases ($) | Sales ($) | Realized Gain (Loss)($) |
| Fidelity Disciplined Equity Fund | 14,191 | 23,233 | 4,672 |
6. Committed Line of Credit.
Certain Funds participate with other funds managed by the investment adviser or an affiliate in a $4.25 billion credit facility (the "line of credit") to be utilized for temporary or emergency purposes to fund shareholder redemptions or for other short-term liquidity purposes. The participating funds have agreed to pay commitment fees on their pro-rata portion of the line of credit, which are reflected in Miscellaneous expenses on the Statement of Operations, and are listed below. During the period, there were no borrowings on this line of credit.
| | Amount ($) |
| Fidelity Disciplined Equity Fund | 2 |
7. Security Lending.
Funds lend portfolio securities from time to time in order to earn additional income. Lending agents are used, including National Financial Services (NFS), an affiliate of the investment adviser. Pursuant to a securities lending agreement, NFS will receive a fee, which is capped at 9.9% of a fund's daily lending revenue, for its services as lending agent. A fund may lend securities to certain qualified borrowers, including NFS. On the settlement date of the loan, a fund receives collateral (in the form of U.S. Treasury obligations, letters of credit and/or cash) against the loaned securities and maintains collateral in an amount not less than 100% of the market value of the loaned securities during the period of the loan. The market value of the loaned securities is determined at the close of business of a fund and any additional required collateral is delivered to a fund on the next business day. A fund or borrower may terminate the loan at any time, and if the borrower defaults on its obligation to return the securities loaned because of insolvency or other reasons, a fund may apply collateral received from the borrower against the obligation. A fund may experience delays and costs in recovering the securities loaned. Any cash collateral received is invested in the Fidelity Securities Lending Cash Central Fund. Any loaned securities are identified as such in the Schedule of Investments, and the value of loaned securities and cash collateral at period end, as applicable, are presented in the Statement of Assets and Liabilities. Security lending income represents the income earned on investing cash collateral, less rebates paid to borrowers and any lending agent fees associated with the loan, plus any premium payments received for lending certain types of securities. Security lending income is presented in the Statement of Operations as a component of income from Fidelity Central Funds. Affiliated security lending activity, if any, was as follows:
| | Total Security Lending Fees Paid to NFS ($) | Security Lending Income From Securities Loaned to NFS ($) | Value of Securities Loaned to NFS at Period End ($) |
| Fidelity Disciplined Equity Fund | -A | - | - |
A Amount represents less than five hundred dollars
8. Expense Reductions.
During the period the investment adviser or an affiliate reimbursed and/or waived a portion of fund-level operating expenses in the amount of $81.
9. Distributions to Shareholders.
Distributions to shareholders of each class were as follows:
| | Six months ended April 30, 2024 | Year ended October 31, 2023 |
| Fidelity Disciplined Equity Fund | | |
| Distributions to shareholders | | |
| Disciplined Equity | $75,009 | $39,004 |
| Class K | 2,520 | 1,435 |
Total | $77,529 | $40,439 |
10. Share Transactions.
Share transactions for each class were as follows and may contain in-kind transactions, automatic conversions between classes or exchanges between affiliated funds:
| | Shares | Shares | Dollars | Dollars |
| | Six months ended April 30, 2024 | Year ended October 31, 2023 | Six months ended April 30, 2024 | Year ended October 31, 2023 |
| Fidelity Disciplined Equity Fund | | | | |
| Disciplined Equity | | | | |
| Shares sold | 606 | 567 | $37,015 | $29,350 |
| Reinvestment of distributions | 1,208 | 760 | 68,008 | 35,580 |
| Shares redeemed | (1,415) | (2,818) | (86,224) | (142,970) |
| Net increase (decrease) | 399 | (1,491) | $18,799 | $(78,040) |
| Class K | | | | |
| Shares sold | 37 | 48 | $2,323 | $2,440 |
| Reinvestment of distributions | 45 | 31 | 2,520 | 1,435 |
| Shares redeemed | (57) | (260) | (3,502) | (12,986) |
| Net increase (decrease) | 25 | (181) | $1,341 | $(9,111) |
11. Other.
A fund's organizational documents provide former and current trustees and officers with a limited indemnification against liabilities arising in connection with the performance of their duties to the fund. In the normal course of business, a fund may also enter into contracts that provide general indemnifications. A fund's maximum exposure under these arrangements is unknown as this would be dependent on future claims that may be made against a fund. The risk of material loss from such claims is considered remote.
12. Risk and Uncertainties.
Many factors affect a fund's performance. Developments that disrupt global economies and financial markets, such as pandemics, epidemics, outbreaks of infectious diseases, war, terrorism, and environmental disasters, may significantly affect a fund's investment performance. The effects of these developments to a fund will be impacted by the types of securities in which a fund invests, the financial condition, industry, economic sector, and geographic location of an issuer, and a fund's level of investment in the securities of that issuer. Significant concentrations in security types, issuers, industries, sectors, and geographic locations may magnify the factors that affect a fund's performance.
As a shareholder, you incur two types of costs: (1) transaction costs, which may include sales charges (loads) on purchase payments or redemption proceeds, as applicable and (2) ongoing costs, which generally include management fees, distribution and/or service (12b-1) fees and other Fund expenses. This Example is intended to help you understand your ongoing costs (in dollars) of investing in a fund and to compare these costs with the ongoing costs of investing in other mutual funds.
| The Example is based on an investment of $1,000 invested at the beginning of the period and held for the entire period (November 1, 2023 to April 30, 2024). |
Actual Expenses
The first line of the accompanying table provides information about actual account values and actual expenses. You may use the information in this line, together with the amount you invested, to estimate the expenses that you paid over the period. Simply divide your account value by $1,000.00 (for example, an $8,600 account value divided by $1,000.00 = 8.6), then multiply the result by the number in the first line for a class/Fund under the heading entitled "Expenses Paid During Period" to estimate the expenses you paid on your account during this period. If any fund is a shareholder of any underlying mutual funds or exchange-traded funds (ETFs) (the Underlying Funds), such fund indirectly bears its proportional share of the expenses of the Underlying Funds in addition to the direct expenses incurred presented in the table. These fees and expenses are not included in the annualized expense ratio used to calculate the expense estimate in the table below.
Hypothetical Example for Comparison Purposes
The second line of the accompanying table provides information about hypothetical account values and hypothetical expenses based on the actual expense ratio and an assumed rate of return of 5% per year before expenses, which is not the actual return. The hypothetical account values and expenses may not be used to estimate the actual ending account balance or expenses you paid for the period. You may use this information to compare the ongoing costs of investing in the Fund and other funds. To do so, compare this 5% hypothetical example with the 5% hypothetical examples that appear in the shareholder reports of the other funds. If any fund is a shareholder of any Underlying Funds, such fund indirectly bears its proportional share of the expenses of the Underlying Funds in addition to the direct expenses as presented in the table. These fees and expenses are not included in the annualized expense ratio used to calculate the expense estimate in the table below.
Please note that the expenses shown in the table are meant to highlight your ongoing costs only and do not reflect any transaction costs. Therefore, the second line of the table is useful in comparing ongoing costs only, and will not help you determine the relative total costs of owning different funds. In addition, if these transactional costs were included, your costs would have been higher.
| | | | | Annualized Expense Ratio- A | | Beginning Account Value November 1, 2023 | | Ending Account Value April 30, 2024 | | Expenses Paid During Period- C November 1, 2023 to April 30, 2024 |
| Fidelity® Disciplined Equity Fund | | | | | | | | | | |
| Fidelity® Disciplined Equity Fund | | | | .54% | | | | | | |
| Actual | | | | | | $ 1,000 | | $ 1,255.80 | | $ 3.03 |
Hypothetical-B | | | | | | $ 1,000 | | $ 1,022.18 | | $ 2.72 |
| Class K | | | | .45% | | | | | | |
| Actual | | | | | | $ 1,000 | | $ 1,256.20 | | $ 2.52 |
Hypothetical-B | | | | | | $ 1,000 | | $ 1,022.63 | | $ 2.26 |
| |
A Annualized expense ratio reflects expenses net of applicable fee waivers.
B 5% return per year before expenses
C Expenses are equal to the annualized expense ratio, multiplied by the average account value over the period, multiplied by 182/ 366 (to reflect the one-half year period). The fees and expenses of any Underlying Funds are not included in each annualized expense ratio.
Board Approval of Investment Advisory Contracts
Fidelity Disciplined Equity Fund
At its January 2024 meeting, the Board of Trustees, including the Independent Trustees (together, the Board), approved an amended and restated management contract with Fidelity Management & Research Company LLC (FMR) (the Management Contract), and amended and restated sub-advisory agreements (the Sub-Advisory Contracts, and together with the Management Contract, the Advisory Contracts) for the fund, including the fund's sub-advisory agreements with FMR Investment Management (UK) Limited (FMR UK), Fidelity Management & Research (Hong Kong) Limited (FMR H.K.), and Fidelity Management & Research (Japan) Limited (FMR Japan). The Advisory Contracts will be effective March 1, 2024. The Board will consider the annual renewal of the fund's Advisory Contracts in May 2024, following its review of additional materials provided by FMR.
Management Contract. The Board approved the Management Contract, which implements a new fee structure combining the management fee, transfer agent fee (TA Fee), and pricing and bookkeeping fee (P&B Fee) of the fund and each class into a single class-level fee based on tiered schedules and subject to a maximum class-level rate (the Unified Fee). In exchange for the Unified Fee, the fund will receive investment advisory, management, administrative, transfer agent, pricing and bookkeeping services under a single agreement - the Management Contract.
In its consideration of the Management Contract over several meetings, the Board received, reviewed and discussed a comprehensive set of analyses regarding the Unified Fee including (i) the legal framework, (ii) design goals for the Unified Fee, (iii) calculation methodology for the Unified Fee and illustrative examples, (iv) annual and cumulative projected impacts under various scenarios, both in the aggregate and at the fund/class level, (v) explanations of schedules, rate levers and maximum rates and (vi) shareholder benefits and projected savings.
The Board considered that the maximum Unified Fee for each class of the fund would be no higher than the sum of (i) the lowest contractual management fee rate under the fund's existing management contract, which is the individual fund fee rate, if any, plus the lowest contractual marginal group fee rate and (ii) the TA and P&B Fee rates, which are fixed fee rates since December 1, 2023 (together, the Unified Fee Cap). The Board noted that Fidelity has represented that, as a result of this Unified Fee Cap, the Unified Fee would be no greater than the fee rates previously authorized to be charged to the fund for the same services. The Board noted that certain expenses such as performance adjustments, third-party expenses, and certain other miscellaneous expenses would be outside the scope of the Unified Fee and the calculation of such fees would not change as a result of the Unified Fee. The Board considered that, under the Management Contract, a different management fee rate will be applicable to each class of the fund. The Board noted that Fidelity has represented that the difference in expenses between classes is based on differences in class-specific expenses and not due to any difference in advisory or third-party custodial fees or other expenses related to the management of the fund's assets.
The Board considered Fidelity's representations that implementation of the Unified Fee, which includes the Unified Fee Cap, would cause all funds subject to the Unified Fee, including the fund, to experience an immediate reduction on contractual fee rates for services provided under the current management contracts. The Board considered that some funds would not experience lower net total fees as a result of existing fee caps. The Board further considered that, in addition to the contractual fee savings, the Unified Fee offers funds and their shareholders greater protection from future rate increases for services previously offered under separate agreements that are now covered by the Management Contract because such rate increases would require shareholder approval.
Sub-Advisory Contracts. In connection with the Unified Fee changes, the Board considered the Sub-Advisory Contracts, which simplified the calculation of the fees paid by FMR to the sub-advisers under the agreements. The Board noted that the agreements with FMR UK, FMR H.K., and FMR Japan were amended to provide that FMR will compensate each sub-adviser at a fee rate equal to 110% of the sub-adviser's costs incurred in providing services under the agreement. The Board considered that, under the Sub-Advisory Contracts, FMR, and not the fund, will continue to pay the sub-advisory fees to each applicable sub-adviser.
The Board further considered that the approval of the fund's Advisory Contracts will not result in any changes in the investment process or strategies employed in the management of the fund's assets or the day-to-day management of the fund or the persons primarily responsible for such management. Further, the Board considered that the Management Contract would not change the obligations and services of FMR and its affiliates on behalf of the fund, and, in particular, there would be no change in the nature and level of advisory, management, administration, transfer agent, and pricing and bookkeeping services provided to the fund by FMR, its affiliates, and each applicable sub-adviser.
In connection with its consideration of future renewals of the fund's Advisory Contracts, the Board will consider: (i) the nature, extent and quality of services provided to the funds, including shareholder and administrative services and investment performance; (ii) the competitiveness of the management fee and total expenses for the fund; (iii) the costs of the services and profitability, including the revenues earned and the expenses incurred in conducting the business of developing, marketing, distributing, managing, administering, and servicing the fund and its shareholders, to the extent applicable; and (iv) whether there have been economies of scale in respect of the Fidelity funds, whether the Fidelity funds (including the fund) have appropriately benefited from any such economies of scale, and whether there is the potential for realization of any further economies.
Based on its evaluation of all of the conclusions and representations noted above, and after considering all factors it believed relevant, the Board concluded that the fund's management fee structure is fair and reasonable, and that the fund's Advisory Contracts should be approved.
The Securities and Exchange Commission adopted Rule 22e-4 under the Investment Company Act of 1940 (the Liquidity Rule) to promote effective liquidity risk management throughout the open-end investment company industry, thereby reducing the risk that funds will be unable to meet their redemption obligations and mitigating dilution of the interests of fund shareholders.
The Fund has adopted and implemented a liquidity risk management program (the Program) reasonably designed to assess and manage the Fund's liquidity risk and to comply with the requirements of the Liquidity Rule. The Fund's Board of Trustees (the Board) has designated the Fund's investment adviser as administrator of the Program. The Fidelity advisers have established a Liquidity Risk Management Committee (the LRM Committee) to manage the Program for each of the Fidelity Funds. The LRM Committee monitors the adequacy and effectiveness of implementation of the Program and on a periodic basis assesses each Fund's liquidity risk based on a variety of factors including (1) the Fund's investment strategy, (2) portfolio liquidity and cash flow projections during normal and reasonably foreseeable stressed conditions, (3) shareholder redemptions, (4) borrowings and other funding sources and (5) certain factors specific to ETFs including the effect of the Fund's prices and spreads, market participants, and basket compositions on the overall liquidity of the Fund's portfolio, as applicable.
In accordance with the Program, each of the Fund's portfolio investments is classified into one of four defined liquidity categories based on a determination of a reasonable expectation for how long it would take to convert the investment to cash (or sell or dispose of the investment) without significantly changing its market value.
- Highly liquid investments - cash or convertible to cash within three business days or less
- Moderately liquid investments - convertible to cash in three to seven calendar days
- Less liquid investments - can be sold or disposed of, but not settled, within seven calendar days
- Illiquid investments - cannot be sold or disposed of within seven calendar days
Liquidity classification determinations take into account a variety of factors including various market, trading and investment-specific considerations, as well as market depth, and generally utilize analysis from a third-party liquidity metrics service.
The Liquidity Rule places a 15% limit on a fund's illiquid investments and requires funds that do not primarily hold assets that are highly liquid investments to determine and maintain a minimum percentage of the fund's net assets to be invested in highly liquid investments (highly liquid investment minimum or HLIM). The Program includes provisions reasonably designed to comply with the 15% limit on illiquid investments and for determining, periodically reviewing and complying with the HLIM requirement as applicable.
At a recent meeting of the Fund's Board of Trustees, the LRM Committee provided a written report to the Board pertaining to the operation, adequacy, and effectiveness of the Program for the period December 1, 2022 through November 30, 2023. The report concluded that the Program is operating effectively and is reasonably designed to assess and manage the Fund's liquidity risk.
1.703636.126
FDE-SANN-0624
Fidelity® Stock Selector Small Cap Fund
Semi-Annual Report
April 30, 2024
Includes Fidelity and Fidelity Advisor share classes
Contents
To view a fund's proxy voting guidelines and proxy voting record for the 12-month period ended June 30, visit http://www.fidelity.com/proxyvotingresults or visit the Securities and Exchange Commission's (SEC) web site at http://www.sec.gov.
You may also call 1-800-544-8544 if you're an individual investing directly with Fidelity, call 1-800-835-5092 if you're a plan sponsor or participant with Fidelity as your recordkeeper or call 1-877-208-0098 on institutional accounts or if you're an advisor or invest through one to request a free copy of the proxy voting guidelines.
Standard & Poor's, S&P and S&P 500 are registered service marks of The McGraw-Hill Companies, Inc. and have been licensed for use by Fidelity Distributors Corporation.
Other third-party marks appearing herein are the property of their respective owners.
All other marks appearing herein are registered or unregistered trademarks or service marks of FMR LLC or an affiliated company. © 2024 FMR LLC. All rights reserved.
This report and the financial statements contained herein are submitted for the general information of the shareholders of the Fund. This report is not authorized for distribution to prospective investors in the Fund unless preceded or accompanied by an effective prospectus.
A fund files its complete schedule of portfolio holdings with the SEC for the first and third quarters of each fiscal year on Form N-PORT. Forms N-PORT are available on the SEC's web site at http://www.sec.gov. A fund's Forms N-PORT may be reviewed and copied at the SEC's Public Reference Room in Washington, DC. Information regarding the operation of the SEC's Public Reference Room may be obtained by calling 1-800-SEC-0330.
For a complete list of a fund's portfolio holdings, view the most recent holdings listing, semiannual report, or annual report on Fidelity's web site at http://www.fidelity.com, http://www.institutional.fidelity.com, or http://www.401k.com, as applicable.
NOT FDIC INSURED ��MAY LOSE VALUE •NO BANK GUARANTEE
Neither the Fund nor Fidelity Distributors Corporation is a bank.
Top Holdings (% of Fund's net assets) |
| |
| IES Holdings, Inc. | 1.4 | |
| Fabrinet | 1.3 | |
| Academy Sports & Outdoors, Inc. | 1.3 | |
| Liberty Oilfield Services, Inc. Class A | 1.3 | |
| Insight Enterprises, Inc. | 1.3 | |
| Commercial Metals Co. | 1.2 | |
| SPX Technologies, Inc. | 1.2 | |
| Northern Oil & Gas, Inc. | 1.1 | |
| Synovus Financial Corp. | 1.1 | |
| Eagle Materials, Inc. | 1.1 | |
| | 12.3 | |
| |
| Market Sectors (% of Fund's net assets) |
| |
| Industrials | 20.8 | |
| Health Care | 14.6 | |
| Financials | 14.3 | |
| Information Technology | 13.2 | |
| Consumer Discretionary | 12.0 | |
| Energy | 6.9 | |
| Materials | 5.8 | |
| Real Estate | 3.5 | |
| Consumer Staples | 3.2 | |
| Utilities | 2.0 | |
| Communication Services | 1.2 | |
| |
Asset Allocation (% of Fund's net assets) |
|
Futures - 0.5% |
|
Showing Percentage of Net Assets
| Common Stocks - 97.5% |
| | | Shares | Value ($) (000s) |
| COMMUNICATION SERVICES - 1.2% | | | |
| Diversified Telecommunication Services - 0.2% | | | |
| Cogent Communications Group, Inc. (a) | | 88,000 | 5,648 |
| Entertainment - 0.3% | | | |
| Vivid Seats, Inc. Class A (a)(b) | | 1,672,067 | 8,795 |
| Interactive Media & Services - 0.2% | | | |
| Ziff Davis, Inc. (b) | | 121,300 | 6,078 |
| Media - 0.4% | | | |
| TechTarget, Inc. (b) | | 254,398 | 6,996 |
| Thryv Holdings, Inc. (b) | | 281,200 | 6,470 |
| | | | 13,466 |
| Wireless Telecommunication Services - 0.1% | | | |
| Gogo, Inc. (b) | | 286,900 | 2,599 |
TOTAL COMMUNICATION SERVICES | | | 36,586 |
| CONSUMER DISCRETIONARY - 12.0% | | | |
| Automobile Components - 1.1% | | | |
| Adient PLC (b) | | 177,100 | 5,290 |
| LCI Industries (a) | | 137,600 | 14,308 |
| Patrick Industries, Inc. | | 124,100 | 12,967 |
| | | | 32,565 |
| Broadline Retail - 0.3% | | | |
| Macy's, Inc. | | 388,400 | 7,158 |
| Savers Value Village, Inc. (a) | | 236,000 | 3,899 |
| | | | 11,057 |
| Diversified Consumer Services - 0.6% | | | |
| Laureate Education, Inc. Class A | | 1,203,749 | 17,454 |
| Hotels, Restaurants & Leisure - 0.8% | | | |
| Bloomin' Brands, Inc. (a) | | 308,099 | 7,946 |
| Brinker International, Inc. (b) | | 150,100 | 8,045 |
| Hilton Grand Vacations, Inc. (b) | | 238,000 | 9,910 |
| | | | 25,901 |
| Household Durables - 2.9% | | | |
| Green Brick Partners, Inc. (b) | | 532,906 | 28,846 |
| Lovesac (b) | | 137,466 | 3,049 |
| SharkNinja, Inc. | | 480,100 | 30,861 |
| Skyline Champion Corp. (b) | | 346,300 | 25,969 |
| | | | 88,725 |
| Leisure Products - 1.1% | | | |
| Acushnet Holdings Corp. (a) | | 153,800 | 9,379 |
| BRP, Inc. | | 178,200 | 11,989 |
| Clarus Corp. (a) | | 991,761 | 6,278 |
| Games Workshop Group PLC | | 48,155 | 5,963 |
| | | | 33,609 |
| Specialty Retail - 3.8% | | | |
| Academy Sports & Outdoors, Inc. | | 682,900 | 39,813 |
| Advance Auto Parts, Inc. | | 140,500 | 10,254 |
| Boot Barn Holdings, Inc. (a)(b) | | 121,400 | 12,925 |
| Dick's Sporting Goods, Inc. | | 67,000 | 13,463 |
| Murphy U.S.A., Inc. | | 78,350 | 32,423 |
| Upbound Group, Inc. | | 200,500 | 6,218 |
| | | | 115,096 |
| Textiles, Apparel & Luxury Goods - 1.4% | | | |
| Crocs, Inc. (b) | | 119,100 | 14,812 |
| Deckers Outdoor Corp. (b) | | 9,200 | 7,530 |
| Kontoor Brands, Inc. (a) | | 308,500 | 19,146 |
| | | | 41,488 |
TOTAL CONSUMER DISCRETIONARY | | | 365,895 |
| CONSUMER STAPLES - 3.2% | | | |
| Beverages - 0.6% | | | |
| Primo Water Corp. | | 496,700 | 9,373 |
| The Vita Coco Co., Inc. (b) | | 323,487 | 7,841 |
| | | | 17,214 |
| Consumer Staples Distribution & Retail - 1.2% | | | |
| BJ's Wholesale Club Holdings, Inc. (b) | | 181,000 | 13,517 |
| Performance Food Group Co. (b) | | 163,000 | 11,064 |
| Sprouts Farmers Market LLC (b) | | 197,000 | 13,008 |
| | | | 37,589 |
| Food Products - 1.0% | | | |
| Nomad Foods Ltd. | | 1,014,577 | 18,323 |
| The Simply Good Foods Co. (b) | | 332,400 | 12,116 |
| | | | 30,439 |
| Personal Care Products - 0.4% | | | |
| BellRing Brands, Inc. (b) | | 200,000 | 11,034 |
TOTAL CONSUMER STAPLES | | | 96,276 |
| ENERGY - 6.9% | | | |
| Energy Equipment & Services - 4.6% | | | |
| Cactus, Inc. | | 646,518 | 32,093 |
| Championx Corp. | | 904,413 | 30,361 |
| Liberty Oilfield Services, Inc. Class A | | 1,757,578 | 38,667 |
| TechnipFMC PLC | | 814,200 | 20,860 |
| Valaris Ltd. (b) | | 273,100 | 17,768 |
| | | | 139,749 |
| Oil, Gas & Consumable Fuels - 2.3% | | | |
| Antero Resources Corp. (b) | | 755,288 | 25,687 |
| Chord Energy Corp. | | 63,500 | 11,238 |
| Northern Oil & Gas, Inc. (a) | | 816,122 | 33,290 |
| | | | 70,215 |
TOTAL ENERGY | | | 209,964 |
| FINANCIALS - 14.3% | | | |
| Banks - 6.6% | | | |
| ConnectOne Bancorp, Inc. | | 249,824 | 4,474 |
| East West Bancorp, Inc. | | 165,800 | 12,350 |
| First Bancorp, Puerto Rico (a) | | 1,686,700 | 29,096 |
| First Interstate Bancsystem, Inc. | | 421,300 | 11,249 |
| Glacier Bancorp, Inc. (a) | | 240,500 | 8,701 |
| Independent Bank Group, Inc. | | 291,600 | 10,859 |
| Metropolitan Bank Holding Corp. (b) | | 121,234 | 4,813 |
| Pathward Financial, Inc. | | 286,500 | 14,431 |
| Pinnacle Financial Partners, Inc. | | 187,000 | 14,343 |
| Synovus Financial Corp. | | 925,300 | 33,116 |
| Trico Bancshares | | 394,917 | 13,731 |
| United Community Bank, Inc. | | 745,700 | 18,814 |
| Webster Financial Corp. | | 213,764 | 9,369 |
| Western Alliance Bancorp. | | 278,900 | 15,850 |
| | | | 201,196 |
| Capital Markets - 2.9% | | | |
| Houlihan Lokey | | 234,382 | 29,881 |
| Lazard, Inc. Class A | | 493,477 | 18,999 |
| Stifel Financial Corp. | | 165,900 | 13,259 |
| TMX Group Ltd. | | 1,000,000 | 26,477 |
| | | | 88,616 |
| Consumer Finance - 1.1% | | | |
| FirstCash Holdings, Inc. | | 172,100 | 19,444 |
| SLM Corp. | | 658,400 | 13,951 |
| | | | 33,395 |
| Financial Services - 1.3% | | | |
| Essent Group Ltd. | | 526,500 | 27,889 |
| Walker & Dunlop, Inc. (a) | | 105,800 | 9,694 |
| | | | 37,583 |
| Insurance - 2.4% | | | |
| Assurant, Inc. | | 42,900 | 7,482 |
| First American Financial Corp. | | 192,400 | 10,307 |
| Genworth Financial, Inc. Class A (b) | | 1,907,400 | 11,311 |
| Primerica, Inc. | | 118,400 | 25,084 |
| Selective Insurance Group, Inc. | | 145,770 | 14,818 |
| Stewart Information Services Corp. | | 66,100 | 4,099 |
| | | | 73,101 |
TOTAL FINANCIALS | | | 433,891 |
| HEALTH CARE - 14.6% | | | |
| Biotechnology - 8.3% | | | |
| Allogene Therapeutics, Inc. (b) | | 763,744 | 2,108 |
| ALX Oncology Holdings, Inc. (b) | | 486,600 | 8,282 |
| Arcellx, Inc. (b) | | 163,100 | 8,158 |
| Argenx SE ADR (b) | | 26,131 | 9,812 |
| Arrowhead Pharmaceuticals, Inc. (b) | | 276,400 | 6,252 |
| Ascendis Pharma A/S sponsored ADR (b) | | 32,406 | 4,486 |
| Astria Therapeutics, Inc. (b) | | 484,711 | 4,450 |
| Astria Therapeutics, Inc. warrants (b) | | 95,634 | 441 |
| Autolus Therapeutics PLC ADR (b) | | 802,879 | 2,955 |
| Blueprint Medicines Corp. (b) | | 114,000 | 10,413 |
| Boundless Bio, Inc. | | 15,000 | 149 |
| Boundless Bio, Inc. (f) | | 114,326 | 1,132 |
| Cargo Therapeutics, Inc. | | 226,163 | 4,320 |
| Celldex Therapeutics, Inc. (b) | | 316,100 | 11,828 |
| Cogent Biosciences, Inc. (b) | | 838,290 | 5,449 |
| Crinetics Pharmaceuticals, Inc. (b) | | 228,300 | 10,004 |
| Cytokinetics, Inc. (b) | | 275,455 | 16,891 |
| Dianthus Therapeutics, Inc. (a)(b) | | 334,418 | 7,140 |
| Insmed, Inc. (b) | | 415,500 | 10,271 |
| Keros Therapeutics, Inc. (b) | | 204,000 | 11,504 |
| Kymera Therapeutics, Inc. (b) | | 100,207 | 3,369 |
| Madrigal Pharmaceuticals, Inc. (a)(b) | | 44,000 | 8,977 |
| Moonlake Immunotherapeutics (b) | | 116,300 | 4,758 |
| Morphic Holding, Inc. (b) | | 145,838 | 3,977 |
| Nuvalent, Inc. Class A (b) | | 96,619 | 6,655 |
| Revolution Medicines, Inc. (b) | | 86,500 | 3,225 |
| Shattuck Labs, Inc. (b) | | 300,994 | 3,154 |
| Spyre Therapeutics, Inc. (b) | | 143,704 | 4,747 |
| Tango Therapeutics, Inc. (b) | | 147,424 | 1,135 |
| Tango Therapeutics, Inc. (c) | | 387,835 | 2,986 |
| Tyra Biosciences, Inc. (a)(b) | | 316,770 | 5,417 |
| Tyra Biosciences, Inc. (c) | | 95,707 | 1,637 |
| Vaxcyte, Inc. (b) | | 233,471 | 14,137 |
| Vericel Corp. (b) | | 298,587 | 13,696 |
| Viking Therapeutics, Inc. (b) | | 221,600 | 17,635 |
| Viridian Therapeutics, Inc. (b) | | 467,527 | 6,199 |
| Xenon Pharmaceuticals, Inc. (b) | | 226,771 | 9,218 |
| Zentalis Pharmaceuticals, Inc. (a)(b) | | 456,405 | 5,048 |
| | | | 252,015 |
| Health Care Equipment & Supplies - 2.6% | | | |
| Dentsply Sirona, Inc. | | 195,000 | 5,852 |
| Glaukos Corp. (b) | | 152,900 | 14,678 |
| Inspire Medical Systems, Inc. (b) | | 41,100 | 9,932 |
| Integer Holdings Corp. (b) | | 170,700 | 19,055 |
| Masimo Corp. (b) | | 49,100 | 6,600 |
| Penumbra, Inc. (b) | | 15,700 | 3,085 |
| TransMedics Group, Inc. (b) | | 208,507 | 19,627 |
| | | | 78,829 |
| Health Care Providers & Services - 2.0% | | | |
| Acadia Healthcare Co., Inc. (b) | | 97,251 | 7,191 |
| agilon health, Inc. (b) | | 489,901 | 2,694 |
| Encompass Health Corp. | | 114,200 | 9,522 |
| Privia Health Group, Inc. (b) | | 429,203 | 7,897 |
| Progyny, Inc. (b) | | 268,300 | 8,602 |
| Surgery Partners, Inc. (b) | | 428,254 | 10,685 |
| Tenet Healthcare Corp. (b) | | 133,760 | 15,020 |
| | | | 61,611 |
| Life Sciences Tools & Services - 0.1% | | | |
| 10X Genomics, Inc. (b) | | 133,900 | 3,921 |
| Pharmaceuticals - 1.6% | | | |
| Axsome Therapeutics, Inc. (a)(b) | | 86,052 | 6,347 |
| Edgewise Therapeutics, Inc. (b) | | 337,645 | 6,057 |
| Enliven Therapeutics, Inc. (a)(b) | | 425,008 | 7,391 |
| Enliven Therapeutics, Inc. (c) | | 120,720 | 2,099 |
| Intra-Cellular Therapies, Inc. (b) | | 134,200 | 9,637 |
| Longboard Pharmaceuticals, Inc. (b) | | 303,400 | 6,462 |
| Prestige Brands Holdings, Inc. (b) | | 150,600 | 10,807 |
| | | | 48,800 |
TOTAL HEALTH CARE | | | 445,176 |
| INDUSTRIALS - 20.8% | | | |
| Building Products - 1.4% | | | |
| AAON, Inc. | | 124,100 | 11,677 |
| Simpson Manufacturing Co. Ltd. | | 180,710 | 31,424 |
| | | | 43,101 |
| Commercial Services & Supplies - 0.6% | | | |
| The Brink's Co. | | 126,400 | 11,055 |
| Vestis Corp. | | 475,400 | 8,757 |
| | | | 19,812 |
| Construction & Engineering - 5.7% | | | |
| Comfort Systems U.S.A., Inc. | | 90,776 | 28,087 |
| Construction Partners, Inc. Class A (b) | | 288,000 | 14,872 |
| Dycom Industries, Inc. (b) | | 95,500 | 13,372 |
| EMCOR Group, Inc. | | 84,840 | 30,302 |
| Granite Construction, Inc. (a) | | 328,700 | 18,243 |
| IES Holdings, Inc. (b) | | 323,115 | 43,662 |
| MDU Resources Group, Inc. | | 469,500 | 11,597 |
| Sterling Construction Co., Inc. (b) | | 125,300 | 12,730 |
| | | | 172,865 |
| Electrical Equipment - 2.1% | | | |
| Array Technologies, Inc. (b) | | 557,900 | 6,884 |
| Atkore, Inc. | | 175,170 | 30,707 |
| Nextracker, Inc. Class A (b) | | 254,000 | 10,869 |
| Thermon Group Holdings, Inc. (b) | | 499,955 | 15,964 |
| | | | 64,424 |
| Ground Transportation - 0.6% | | | |
| ArcBest Corp. | | 164,279 | 18,220 |
| Machinery - 4.9% | | | |
| Astec Industries, Inc. | | 318,164 | 13,299 |
| Atmus Filtration Technologies, Inc. | | 298,300 | 9,036 |
| Federal Signal Corp. | | 374,400 | 30,439 |
| Kadant, Inc. | | 47,000 | 12,868 |
| SPX Technologies, Inc. (b) | | 306,000 | 37,274 |
| Terex Corp. | | 579,230 | 32,466 |
| Timken Co. | | 147,000 | 13,115 |
| | | | 148,497 |
| Professional Services - 2.2% | | | |
| ASGN, Inc. (b) | | 131,100 | 12,645 |
| CACI International, Inc. Class A (b) | | 21,800 | 8,769 |
| CRA International, Inc. | | 82,600 | 11,984 |
| ExlService Holdings, Inc. (b) | | 427,360 | 12,393 |
| First Advantage Corp. (a) | | 317,611 | 5,177 |
| KBR, Inc. | | 165,900 | 10,774 |
| WNS Holdings Ltd. | | 152,650 | 6,398 |
| | | | 68,140 |
| Trading Companies & Distributors - 3.3% | | | |
| Applied Industrial Technologies, Inc. | | 70,800 | 12,974 |
| Beacon Roofing Supply, Inc. (b) | | 151,200 | 14,898 |
| FTAI Aviation Ltd. | | 235,000 | 16,499 |
| GMS, Inc. (b) | | 297,500 | 27,525 |
| Rush Enterprises, Inc. Class A | | 629,332 | 27,640 |
| | | | 99,536 |
TOTAL INDUSTRIALS | | | 634,595 |
| INFORMATION TECHNOLOGY - 13.2% | | | |
| Communications Equipment - 0.3% | | | |
| Ciena Corp. (b) | | 192,300 | 8,890 |
| Electronic Equipment, Instruments & Components - 5.0% | | | |
| Advanced Energy Industries, Inc. | | 315,600 | 30,247 |
| Fabrinet (b) | | 232,240 | 40,194 |
| Insight Enterprises, Inc. (b) | | 210,485 | 38,428 |
| Napco Security Technologies, Inc. | | 146,100 | 5,946 |
| Sanmina Corp. (b) | | 218,200 | 13,238 |
| TD SYNNEX Corp. | | 195,300 | 23,014 |
| | | | 151,067 |
| IT Services - 0.7% | | | |
| Endava PLC ADR (b) | | 169,000 | 4,901 |
| Perficient, Inc. (b) | | 143,000 | 6,758 |
| Wix.com Ltd. (b) | | 86,100 | 10,235 |
| | | | 21,894 |
| Semiconductors & Semiconductor Equipment - 3.0% | | | |
| Allegro MicroSystems LLC (b) | | 360,500 | 10,703 |
| Diodes, Inc. (b) | | 293,711 | 21,444 |
| MACOM Technology Solutions Holdings, Inc. (b) | | 282,800 | 28,831 |
| Nova Ltd. (b) | | 54,800 | 9,311 |
| Onto Innovation, Inc. (b) | | 105,450 | 19,560 |
| | | | 89,849 |
| Software - 4.2% | | | |
| Five9, Inc. (b) | | 182,800 | 10,524 |
| Intapp, Inc. (b) | | 273,548 | 8,458 |
| Lumine Group, Inc. (b) | | 326,300 | 8,938 |
| Manhattan Associates, Inc. (b) | | 35,800 | 7,377 |
| Progress Software Corp. | | 186,900 | 9,311 |
| PROS Holdings, Inc. (a)(b) | | 510,900 | 16,732 |
| Rapid7, Inc. (b) | | 96,100 | 4,305 |
| SPS Commerce, Inc. (b) | | 154,700 | 26,898 |
| Tenable Holdings, Inc. (b) | | 604,900 | 27,202 |
| Vertex, Inc. Class A (b) | | 309,336 | 9,011 |
| | | | 128,756 |
TOTAL INFORMATION TECHNOLOGY | | | 400,456 |
| MATERIALS - 5.8% | | | |
| Chemicals - 1.1% | | | |
| Element Solutions, Inc. | | 795,300 | 18,395 |
| The Chemours Co. LLC | | 240,900 | 6,444 |
| Tronox Holdings PLC | | 521,800 | 8,865 |
| | | | 33,704 |
| Construction Materials - 1.1% | | | |
| Eagle Materials, Inc. | | 129,600 | 32,492 |
| Containers & Packaging - 0.3% | | | |
| O-I Glass, Inc. (b) | | 643,300 | 9,624 |
| Metals & Mining - 2.7% | | | |
| Commercial Metals Co. | | 700,500 | 37,645 |
| Constellium NV (b) | | 1,296,700 | 25,532 |
| Lundin Mining Corp. | | 1,526,200 | 17,428 |
| | | | 80,605 |
| Paper & Forest Products - 0.6% | | | |
| Louisiana-Pacific Corp. | | 148,200 | 10,847 |
| Sylvamo Corp. | | 136,100 | 8,506 |
| | | | 19,353 |
TOTAL MATERIALS | | | 175,778 |
| REAL ESTATE - 3.5% | | | |
| Equity Real Estate Investment Trusts (REITs) - 2.3% | | | |
| Elme Communities (SBI) | | 441,000 | 6,686 |
| Essential Properties Realty Trust, Inc. | | 1,011,300 | 26,638 |
| Lamar Advertising Co. Class A | | 130,500 | 15,118 |
| Terreno Realty Corp. | | 409,410 | 22,251 |
| | | | 70,693 |
| Real Estate Management & Development - 1.2% | | | |
| Colliers International Group, Inc. | | 157,600 | 16,412 |
| Jones Lang LaSalle, Inc. (b) | | 79,900 | 14,438 |
| Marcus & Millichap, Inc. | | 192,238 | 6,088 |
| | | | 36,938 |
TOTAL REAL ESTATE | | | 107,631 |
| UTILITIES - 2.0% | | | |
| Gas Utilities - 2.0% | | | |
| Brookfield Infrastructure Corp. A Shares | | 1,054,500 | 32,131 |
| Southwest Gas Holdings, Inc. | | 369,036 | 27,537 |
| | | | 59,668 |
| TOTAL COMMON STOCKS (Cost $2,305,575) | | | 2,965,916 |
| | | | |
| Money Market Funds - 7.0% |
| | | Shares | Value ($) (000s) |
| Fidelity Cash Central Fund 5.39% (d) | | 107,600,832 | 107,622 |
| Fidelity Securities Lending Cash Central Fund 5.39% (d)(e) | | 106,908,397 | 106,919 |
| TOTAL MONEY MARKET FUNDS (Cost $214,541) | | | 214,541 |
| | | | |
| TOTAL INVESTMENT IN SECURITIES - 104.5% (Cost $2,520,116) | 3,180,457 |
NET OTHER ASSETS (LIABILITIES) - (4.5)% | (137,447) |
| NET ASSETS - 100.0% | 3,043,010 |
| | |
| Futures Contracts |
| | Number of contracts | Expiration Date | Notional Amount ($) (000s) | Value ($) (000s) | Unrealized Appreciation/ (Depreciation) ($) (000s) |
| Purchased | | | | | |
| | | | | | |
| Equity Index Contracts | | | | | |
| CME E-mini Russell 2000 Index Contracts (United States) | 168 | Jun 2024 | 16,679 | (44) | (44) |
| | | | | | |
| The notional amount of futures purchased as a percentage of Net Assets is 0.5% |
Any values shown as $0 in the Schedule of Investments may reflect amounts less than $500.
Legend
| (a) | Security or a portion of the security is on loan at period end. |
| (c) | Restricted securities (including private placements) - Investment in securities not registered under the Securities Act of 1933 (excluding 144A issues). At the end of the period, the value of restricted securities (excluding 144A issues) amounted to $6,722,000 or 0.2% of net assets. |
| (d) | Affiliated fund that is generally available only to investment companies and other accounts managed by Fidelity Investments. The rate quoted is the annualized seven-day yield of the fund at period end. A complete unaudited listing of the fund's holdings as of its most recent quarter end is available upon request. In addition, each Fidelity Central Fund's financial statements are available on the SEC's website or upon request. |
| (e) | Investment made with cash collateral received from securities on loan. |
| (f) | Equity security is subject to lock-up or market standoff agreement. Fair value is based on the unadjusted market price of the equivalent equity security. As of period end, the total fair value of unadjusted equity securities subject to contractual sale restrictions is $1,132 and all restrictions are set to expire on or before September 30, 2024. Under normal market conditions, there are no circumstances that could cause the restrictions to lapse. |
| Additional information on each restricted holding is as follows: |
| Security | Acquisition Date | Acquisition Cost ($) (000s) |
| Enliven Therapeutics, Inc. | 3/19/24 | 1,690 |
| | | |
| Tango Therapeutics, Inc. | 8/09/23 | 1,997 |
| | | |
| Tyra Biosciences, Inc. | 2/02/24 | 1,245 |
| | | |
Affiliated Central Funds
Fiscal year to date information regarding the Fund's investments in Fidelity Central Funds, including the ownership percentage, is presented below.
| Affiliate (Amounts in thousands) | Value, beginning of period ($) | Purchases ($) | Sales Proceeds ($) | Dividend Income ($) | Realized Gain (loss) ($) | Change in Unrealized appreciation (depreciation) ($) | Value, end of period ($) | % ownership, end of period |
| Fidelity Cash Central Fund 5.39% | 47,828 | 775,063 | 715,269 | 1,821 | 1 | (1) | 107,622 | 0.2% |
| Fidelity Securities Lending Cash Central Fund 5.39% | 73,108 | 512,801 | 478,990 | 202 | - | - | 106,919 | 0.4% |
| Total | 120,936 | 1,287,864 | 1,194,259 | 2,023 | 1 | (1) | 214,541 | |
| | | | | | | | | |
Amounts in the dividend income column in the above table include any capital gain distributions from underlying funds, which are presented in the corresponding line item in the Statement of Operations, if applicable.
Amounts in the dividend income column for Fidelity Securities Lending Cash Central Fund represents the income earned on investing cash collateral, less rebates paid to borrowers and any lending agent fees associated with the loan, plus any premium payments received for lending certain types of securities.
Amounts included in the purchases and sales proceeds columns may include in-kind transactions, if applicable.
Investment Valuation
The following is a summary of the inputs used, as of April 30, 2024, involving the Fund's assets and liabilities carried at fair value. The inputs or methodology used for valuing securities may not be an indication of the risk associated with investing in those securities. For more information on valuation inputs, and their aggregation into the levels used below, please refer to the Investment Valuation section in the accompanying Notes to Financial Statements.
| Valuation Inputs at Reporting Date: |
Description (Amounts in thousands) | Total ($) | Level 1 ($) | Level 2 ($) | Level 3 ($) |
Investments in Securities: | | | | |
|
| Equities: | | | | |
Communication Services | 36,586 | 36,586 | - | - |
Consumer Discretionary | 365,895 | 365,895 | - | - |
Consumer Staples | 96,276 | 96,276 | - | - |
Energy | 209,964 | 209,964 | - | - |
Financials | 433,891 | 433,891 | - | - |
Health Care | 445,176 | 444,735 | 441 | - |
Industrials | 634,595 | 634,595 | - | - |
Information Technology | 400,456 | 400,456 | - | - |
Materials | 175,778 | 175,778 | - | - |
Real Estate | 107,631 | 107,631 | - | - |
Utilities | 59,668 | 59,668 | - | - |
|
| Money Market Funds | 214,541 | 214,541 | - | - |
| Total Investments in Securities: | 3,180,457 | 3,180,016 | 441 | - |
Derivative Instruments: Liabilities | | | | |
Futures Contracts | (44) | (44) | - | - |
| Total Liabilities | (44) | (44) | - | - |
| Total Derivative Instruments: | (44) | (44) | - | - |
Value of Derivative Instruments
The following table is a summary of the Fund's value of derivative instruments by primary risk exposure as of April 30, 2024. For additional information on derivative instruments, please refer to the Derivative Instruments section in the accompanying Notes to Financial Statements.
Primary Risk Exposure / Derivative Type | Value |
| (Amounts in thousands) | Asset ($) | Liability ($) |
| Equity Risk | | |
Futures Contracts (a) | 0 | (44) |
| Total Equity Risk | 0 | (44) |
| Total Value of Derivatives | 0 | (44) |
(a)Reflects gross cumulative appreciation (depreciation) on futures contracts as presented in the Schedule of Investments. In the Statement of Assets and Liabilities, the period end daily variation margin is included in receivable or payable for daily variation margin on futures contracts, and the net cumulative appreciation (depreciation) is included in Total accumulated earnings (loss).
| Statement of Assets and Liabilities |
| Amounts in thousands (except per-share amounts) | | | | April 30, 2024 (Unaudited) |
| | | | | |
| Assets | | | | |
| Investment in securities, at value (including securities loaned of $100,921) - See accompanying schedule: | | | | |
Unaffiliated issuers (cost $2,305,575) | $ | 2,965,916 | | |
Fidelity Central Funds (cost $214,541) | | 214,541 | | |
| | | | | |
| | | | | |
| Total Investment in Securities (cost $2,520,116) | | | $ | 3,180,457 |
| Segregated cash with brokers for derivative instruments | | | | 1,593 |
| Cash | | | | 243 |
| Receivable for investments sold | | | | 1,325 |
| Receivable for fund shares sold | | | | 5,775 |
| Dividends receivable | | | | 83 |
| Distributions receivable from Fidelity Central Funds | | | | 476 |
| Prepaid expenses | | | | 1 |
Total assets | | | | 3,189,953 |
| Liabilities | | | | |
| Payable for investments purchased | $ | 35,402 | | |
| Payable for fund shares redeemed | | 1,926 | | |
| Accrued management fee | | 2,179 | | |
| Distribution and service plan fees payable | | 69 | | |
| Payable for daily variation margin on futures contracts | | 403 | | |
| Other payables and accrued expenses | | 50 | | |
| Collateral on securities loaned | | 106,914 | | |
| Total liabilities | | | | 146,943 |
| Net Assets | | | $ | 3,043,010 |
| Net Assets consist of: | | | | |
| Paid in capital | | | $ | 2,330,933 |
| Total accumulated earnings (loss) | | | | 712,077 |
| Net Assets | | | $ | 3,043,010 |
| | | | | |
| Net Asset Value and Maximum Offering Price | | | | |
| Class A : | | | | |
Net Asset Value and redemption price per share ($217,072 ÷ 6,538 shares)(a) | | | $ | 33.20 |
| Maximum offering price per share (100/94.25 of $33.20) | | | $ | 35.23 |
| Class M : | | | | |
Net Asset Value and redemption price per share ($19,206 ÷ 608 shares)(a)(b) | | | $ | 31.61 |
| Maximum offering price per share (100/96.50 of $31.61) | | | $ | 32.76 |
| Class C : | | | | |
Net Asset Value and offering price per share ($26,618 ÷ 932 shares)(a) | | | $ | 28.56 |
| Stock Selector Small Cap : | | | | |
Net Asset Value, offering price and redemption price per share ($1,666,136 ÷ 48,399 shares) | | | $ | 34.43 |
| Class I : | | | | |
Net Asset Value, offering price and redemption price per share ($750,723 ÷ 21,670 shares) | | | $ | 34.64 |
| Class Z : | | | | |
Net Asset Value, offering price and redemption price per share ($363,255 ÷ 10,500 shares) | | | $ | 34.60 |
(a)Redemption price per share is equal to net asset value less any applicable contingent deferred sales charge. |
(b)Corresponding Net Asset Value does not calculate due to rounding of fractional net assets and/or shares. |
| Statement of Operations |
| Amounts in thousands | | | | Six months ended April 30, 2024 (Unaudited) |
| Investment Income | | | | |
| Dividends | | | $ | 14,307 |
| Interest | | | | 4 |
| Income from Fidelity Central Funds (including $202 from security lending) | | | | 2,023 |
| Total income | | | | 16,334 |
| Expenses | | | | |
| Management fee | | | | |
| Basic fee | $ | 8,452 | | |
| Performance adjustment | | 2,158 | | |
| Transfer agent fees | | 1,337 | | |
| Distribution and service plan fees | | 344 | | |
| Accounting fees | | 225 | | |
| Custodian fees and expenses | | 19 | | |
| Independent trustees' fees and expenses | | 6 | | |
| Registration fees | | 154 | | |
| Audit | | 28 | | |
| Legal | | 2 | | |
| Miscellaneous | | 6 | | |
| Total expenses before reductions | | 12,731 | | |
| Expense reductions | | (121) | | |
| Total expenses after reductions | | | | 12,610 |
| Net Investment income (loss) | | | | 3,724 |
| Realized and Unrealized Gain (Loss) | | | | |
| Net realized gain (loss) on: | | | | |
| Investment Securities: | | | | |
| Unaffiliated issuers | | 85,138 | | |
| Fidelity Central Funds | | 1 | | |
| Foreign currency transactions | | 5 | | |
| Futures contracts | | 2,245 | | |
| Total net realized gain (loss) | | | | 87,389 |
| Change in net unrealized appreciation (depreciation) on: | | | | |
| Investment Securities: | | | | |
| Unaffiliated issuers | | 440,016 | | |
| Fidelity Central Funds | | (1) | | |
| Assets and liabilities in foreign currencies | | (2) | | |
| Futures contracts | | 715 | | |
| Total change in net unrealized appreciation (depreciation) | | | | 440,728 |
| Net gain (loss) | | | | 528,117 |
| Net increase (decrease) in net assets resulting from operations | | | $ | 531,841 |
| Statement of Changes in Net Assets |
| |
| Amount in thousands | | Six months ended April 30, 2024 (Unaudited) | | Year ended October 31, 2023 |
| Increase (Decrease) in Net Assets | | | | |
| Operations | | | | |
| Net investment income (loss) | $ | 3,724 | $ | 4,665 |
| Net realized gain (loss) | | 87,389 | | (11,882) |
| Change in net unrealized appreciation (depreciation) | | 440,728 | | (63,743) |
| Net increase (decrease) in net assets resulting from operations | | 531,841 | | (70,960) |
| Distributions to shareholders | | (6,123) | | (2,386) |
| | | | | |
| Share transactions - net increase (decrease) | | 310,739 | | 289,717 |
| Total increase (decrease) in net assets | | 836,457 | | 216,371 |
| | | | | |
| Net Assets | | | | |
| Beginning of period | | 2,206,553 | | 1,990,182 |
| End of period | $ | 3,043,010 | $ | 2,206,553 |
| | | | | |
| | | | | |
Financial Highlights
Fidelity Advisor® Stock Selector Small Cap Fund Class A |
| |
| | Six months ended (Unaudited) April 30, 2024 | | Years ended October 31, 2023 | | 2022 | | 2021 | | 2020 | | 2019 |
Selected Per-Share Data | | | | | | | | | | | | |
| Net asset value, beginning of period | $ | 26.73 | $ | 27.51 | $ | 36.93 | $ | 24.09 | $ | 23.82 | $ | 25.94 |
| Income from Investment Operations | | | | | | | | | | | | |
Net investment income (loss) A,B | | - C | | (.01) | | (.03) D | | (.15) | | (.07) | | .01 |
| Net realized and unrealized gain (loss) | | 6.48 | | (.75) | | (5.76) | | 13.42 | | .83 | | 2.30 |
| Total from investment operations | | 6.48 | | (.76) | | (5.79) | | 13.27 | | .76 | | 2.31 |
| Distributions from net investment income | | (.01) | | (.02) | | - | | - | | (.02) E | | (.01) |
| Distributions from net realized gain | | - | | - | | (3.63) | | (.43) | | (.47) E | | (4.42) |
| Total distributions | | (.01) | | (.02) | | (3.63) | | (.43) | | (.49) | | (4.43) |
| Net asset value, end of period | $ | 33.20 | $ | 26.73 | $ | 27.51 | $ | 36.93 | $ | 24.09 | $ | 23.82 |
Total Return F,G,H | | | | (2.75)% | | (16.94)% | | 55.62% | | 3.15% | | 11.55% |
Ratios to Average Net Assets B,I,J | | | | | | | | | | | | |
| Expenses before reductions | | 1.22% K | | 1.23% | | 1.21% | | 1.19% | | 1.32% | | 1.04% |
| Expenses net of fee waivers, if any | | | | 1.23% | | 1.21% | | 1.19% | | 1.32% | | 1.04% |
| Expenses net of all reductions | | 1.21% K | | 1.23% | | 1.21% | | 1.19% | | 1.31% | | 1.04% |
| Net investment income (loss) | | .01% K | | (.05)% | | (.10)% D | | (.45)% | | (.29)% | | .06% |
| Supplemental Data | | | | | | | | | | | | |
| Net assets, end of period (in millions) | $ | 217 | $ | 109 | $ | 99 | $ | 108 | $ | 52 | $ | 37 |
Portfolio turnover rate L | | | | 38% | | 38% | | 59% | | 70% | | 56% M |
ACalculated based on average shares outstanding during the period.
BNet investment income (loss) is affected by the timing of the declaration of dividends by any underlying mutual funds or exchange-traded funds (ETFs). Net investment income (loss) of any mutual funds or ETFs is not included in the Fund's net investment income (loss) ratio.
CAmount represents less than $.005 per share.
DNet investment income per share reflects one or more large, non-recurring dividend(s) which amounted to $.06 per share. Excluding such non-recurring dividend(s), the ratio of net investment income (loss) to average net assets would have been (.29)%.
EThe amount shown reflects reclassifications related to book to tax differences that were made in the year shown.
FTotal returns for periods of less than one year are not annualized.
GTotal returns would have been lower if certain expenses had not been reduced during the applicable periods shown.
HTotal returns do not include the effect of the sales charges.
IFees and expenses of any underlying mutual funds or exchange-traded funds (ETFs) are not included in the Fund's expense ratio. The Fund indirectly bears its proportionate share of these expenses. For additional expense information related to investments in Fidelity Central Funds, please refer to the "Investments in Fidelity Central Funds" note found in the Notes to Financial Statements section of the most recent Annual or Semi-Annual report.
JExpense ratios reflect operating expenses of the class. Expenses before reductions do not reflect amounts reimbursed, waived, or reduced through arrangements with the investment adviser, brokerage services, or other offset arrangements, if applicable, and do not represent the amount paid by the class during periods when reimbursements, waivers or reductions occur.
KAnnualized.
LAmount does not include the portfolio activity of any underlying mutual funds or exchange-traded funds (ETFs).
MPortfolio turnover rate excludes securities received or delivered in-kind.
Fidelity Advisor® Stock Selector Small Cap Fund Class M |
| |
| | Six months ended (Unaudited) April 30, 2024 | | Years ended October 31, 2023 | | 2022 | | 2021 | | 2020 | | 2019 |
Selected Per-Share Data | | | | | | | | | | | | |
| Net asset value, beginning of period | $ | 25.48 | $ | 26.28 | $ | 35.46 | $ | 23.20 | $ | 23.00 | $ | 25.21 |
| Income from Investment Operations | | | | | | | | | | | | |
Net investment income (loss) A,B | | (.04) | | (.09) | | (.10) C | | (.23) | | (.13) | | (.05) |
| Net realized and unrealized gain (loss) | | 6.17 | | (.70) | | (5.53) | | 12.92 | | .80 | | 2.21 |
| Total from investment operations | | 6.13 | | (.79) | | (5.63) | | 12.69 | | .67 | | 2.16 |
| Distributions from net investment income | | - | | (.01) | | - | | - | | - | | - |
| Distributions from net realized gain | | - | | - | | (3.55) | | (.43) | | (.46) D | | (4.37) |
| Total distributions | | - | | (.01) | | (3.55) | | (.43) | | (.46) | | (4.37) |
| Net asset value, end of period | $ | 31.61 | $ | 25.48 | $ | 26.28 | $ | 35.46 | $ | 23.20 | $ | 23.00 |
Total Return E,F,G | | | | (3.01)% | | (17.19)% | | 55.24% | | 2.83% | | 11.20% |
Ratios to Average Net Assets B,H,I | | | | | | | | | | | | |
| Expenses before reductions | | 1.46% J | | 1.51% | | 1.48% | | 1.46% | | 1.61% | | 1.35% |
| Expenses net of fee waivers, if any | | | | 1.51% | | 1.48% | | 1.45% | | 1.60% | | 1.35% |
| Expenses net of all reductions | | 1.46% J | | 1.50% | | 1.48% | | 1.45% | | 1.60% | | 1.35% |
| Net investment income (loss) | | (.24)% J | | (.33)% | | (.37)% C | | (.71)% | | (.58)% | | (.24)% |
| Supplemental Data | | | | | | | | | | | | |
| Net assets, end of period (in millions) | $ | 19 | $ | 14 | $ | 14 | $ | 17 | $ | 8 | $ | 7 |
Portfolio turnover rate K | | | | 38% | | 38% | | 59% | | 70% | | 56% L |
ACalculated based on average shares outstanding during the period.
BNet investment income (loss) is affected by the timing of the declaration of dividends by any underlying mutual funds or exchange-traded funds (ETFs). Net investment income (loss) of any mutual funds or ETFs is not included in the Fund's net investment income (loss) ratio.
CNet investment income per share reflects one or more large, non-recurring dividend(s) which amounted to $.05 per share. Excluding such non-recurring dividend(s), the ratio of net investment income (loss) to average net assets would have been (.56)%.
DThe amount shown reflects reclassifications related to book to tax differences that were made in the year shown. Amount has been revised from previously reported amount of $.47 per share.
ETotal returns for periods of less than one year are not annualized.
FTotal returns would have been lower if certain expenses had not been reduced during the applicable periods shown.
GTotal returns do not include the effect of the sales charges.
HFees and expenses of any underlying mutual funds or exchange-traded funds (ETFs) are not included in the Fund's expense ratio. The Fund indirectly bears its proportionate share of these expenses. For additional expense information related to investments in Fidelity Central Funds, please refer to the "Investments in Fidelity Central Funds" note found in the Notes to Financial Statements section of the most recent Annual or Semi-Annual report.
IExpense ratios reflect operating expenses of the class. Expenses before reductions do not reflect amounts reimbursed, waived, or reduced through arrangements with the investment adviser, brokerage services, or other offset arrangements, if applicable, and do not represent the amount paid by the class during periods when reimbursements, waivers or reductions occur.
JAnnualized.
KAmount does not include the portfolio activity of any underlying mutual funds or exchange-traded funds (ETFs).
LPortfolio turnover rate excludes securities received or delivered in-kind.
Fidelity Advisor® Stock Selector Small Cap Fund Class C |
| |
| | Six months ended (Unaudited) April 30, 2024 | | Years ended October 31, 2023 | | 2022 | | 2021 | | 2020 | | 2019 |
Selected Per-Share Data | | | | | | | | | | | | |
| Net asset value, beginning of period | $ | 23.07 | $ | 23.91 | $ | 32.61 | $ | 21.48 | $ | 21.43 | $ | 23.79 |
| Income from Investment Operations | | | | | | | | | | | | |
Net investment income (loss) A,B | | (.10) | | (.20) | | (.23) C | | (.36) | | (.23) | | (.16) |
| Net realized and unrealized gain (loss) | | 5.59 | | (.64) | | (5.05) | | 11.92 | | .75 | | 2.06 |
| Total from investment operations | | 5.49 | | (.84) | | (5.28) | | 11.56 | | .52 | | 1.90 |
| Distributions from net realized gain | | - | | - | | (3.42) | | (.43) | | (.46) D | | (4.26) |
| Total distributions | | - | | - | | (3.42) | | (.43) | | (.46) | | (4.26) |
| Net asset value, end of period | $ | 28.56 | $ | 23.07 | $ | 23.91 | $ | 32.61 | $ | 21.48 | $ | 21.43 |
Total Return E,F,G | | | | (3.51)% | | (17.61)% | | 54.40% | | 2.33% | | 10.64% |
Ratios to Average Net Assets B,H,I | | | | | | | | | | | | |
| Expenses before reductions | | 1.97% J | | 2.01% | | 2.00% | | 1.98% | | 2.13% | | 1.86% |
| Expenses net of fee waivers, if any | | | | 2.00% | | 1.99% | | 1.97% | | 2.13% | | 1.86% |
| Expenses net of all reductions | | 1.96% J | | 2.00% | | 1.99% | | 1.97% | | 2.12% | | 1.86% |
| Net investment income (loss) | | (.75)% J | | (.83)% | | (.88)% C | | (1.23)% | | (1.10)% | | (.76)% |
| Supplemental Data | | | | | | | | | | | | |
| Net assets, end of period (in millions) | $ | 27 | $ | 18 | $ | 16 | $ | 19 | $ | 8 | $ | 8 |
Portfolio turnover rate K | | | | 38% | | 38% | | 59% | | 70% | | 56% L |
ACalculated based on average shares outstanding during the period.
BNet investment income (loss) is affected by the timing of the declaration of dividends by any underlying mutual funds or exchange-traded funds (ETFs). Net investment income (loss) of any mutual funds or ETFs is not included in the Fund's net investment income (loss) ratio.
CNet investment income per share reflects one or more large, non-recurring dividend(s) which amounted to $.05 per share. Excluding such non-recurring dividend(s), the ratio of net investment income (loss) to average net assets would have been (1.08)%.
DThe amount shown reflects reclassifications related to book to tax differences that were made in the year shown. Amount has been revised from previously reported amount of $.47 per share.
ETotal returns for periods of less than one year are not annualized.
FTotal returns would have been lower if certain expenses had not been reduced during the applicable periods shown.
GTotal returns do not include the effect of the contingent deferred sales charge.
HFees and expenses of any underlying mutual funds or exchange-traded funds (ETFs) are not included in the Fund's expense ratio. The Fund indirectly bears its proportionate share of these expenses. For additional expense information related to investments in Fidelity Central Funds, please refer to the "Investments in Fidelity Central Funds" note found in the Notes to Financial Statements section of the most recent Annual or Semi-Annual report.
IExpense ratios reflect operating expenses of the class. Expenses before reductions do not reflect amounts reimbursed, waived, or reduced through arrangements with the investment adviser, brokerage services, or other offset arrangements, if applicable, and do not represent the amount paid by the class during periods when reimbursements, waivers or reductions occur.
JAnnualized.
KAmount does not include the portfolio activity of any underlying mutual funds or exchange-traded funds (ETFs).
LPortfolio turnover rate excludes securities received or delivered in-kind.
Fidelity® Stock Selector Small Cap Fund |
| |
| | Six months ended (Unaudited) April 30, 2024 | | Years ended October 31, 2023 | | 2022 | | 2021 | | 2020 | | 2019 |
Selected Per-Share Data | | | | | | | | | | | | |
| Net asset value, beginning of period | $ | 27.74 | $ | 28.48 | $ | 38.11 | $ | 24.77 | $ | 24.47 | $ | 26.50 |
| Income from Investment Operations | | | | | | | | | | | | |
Net investment income (loss) A,B | | .05 | | .07 | | .06 C | | (.05) | | - D | | .08 |
| Net realized and unrealized gain (loss) | | 6.72 | | (.77) | | (5.96) | | 13.82 | | .84 | | 2.36 |
| Total from investment operations | | 6.77 | | (.70) | | (5.90) | | 13.77 | | .84 | | 2.44 |
| Distributions from net investment income | | (.08) | | (.04) | | (.06) | | - | | (.07) E | | (.06) |
| Distributions from net realized gain | | - | | - | | (3.67) | | (.43) | | (.47) E | | (4.42) |
| Total distributions | | (.08) | | (.04) | | (3.73) | | (.43) | | (.54) | | (4.47) F |
| Net asset value, end of period | $ | 34.43 | $ | 27.74 | $ | 28.48 | $ | 38.11 | $ | 24.77 | $ | 24.47 |
Total Return G,H | | | | (2.48)% | | (16.73)% | | 56.11% | | 3.42% | | 11.90% |
Ratios to Average Net Assets A,I,J | | | | | | | | | | | | |
| Expenses before reductions | | .92% K | | .96% | | .93% | | .90% | | 1.02% | | .75% |
| Expenses net of fee waivers, if any | | | | .95% | | .93% | | .90% | | 1.02% | | .75% |
| Expenses net of all reductions | | .91% K | | .95% | | .93% | | .90% | | 1.01% | | .75% |
| Net investment income (loss) | | .30% K | | .23% | | .18% C | | (.16)% | | -% L | | .36% |
| Supplemental Data | | | | | | | | | | | | |
| Net assets, end of period (in millions) | $ | 1,666 | $ | 1,283 | $ | 1,340 | $ | 1,654 | $ | 960 | $ | 938 |
Portfolio turnover rate M | | | | 38% | | 38% | | 59% | | 70% | | 56% N |
ANet investment income (loss) is affected by the timing of the declaration of dividends by any underlying mutual funds or exchange-traded funds (ETFs). Net investment income (loss) of any mutual funds or ETFs is not included in the Fund's net investment income (loss) ratio.
BCalculated based on average shares outstanding during the period.
CNet investment income per share reflects one or more large, non-recurring dividend(s) which amounted to $.06 per share. Excluding such non-recurring dividend(s), the ratio of net investment income (loss) to average net assets would have been (.01)%.
DAmount represents less than $.005 per share.
EThe amount shown reflects reclassifications related to book to tax differences that were made in the year shown.
FTotal distributions per share do not sum due to rounding.
GTotal returns for periods of less than one year are not annualized.
HTotal returns would have been lower if certain expenses had not been reduced during the applicable periods shown.
IFees and expenses of any underlying mutual funds or exchange-traded funds (ETFs) are not included in the Fund's expense ratio. The Fund indirectly bears its proportionate share of these expenses. For additional expense information related to investments in Fidelity Central Funds, please refer to the "Investments in Fidelity Central Funds" note found in the Notes to Financial Statements section of the most recent Annual or Semi-Annual report.
JExpense ratios reflect operating expenses of the class. Expenses before reductions do not reflect amounts reimbursed, waived, or reduced through arrangements with the investment adviser, brokerage services, or other offset arrangements, if applicable, and do not represent the amount paid by the class during periods when reimbursements, waivers or reductions occur.
KAnnualized.
LAmount represents less than .005%.
MAmount does not include the portfolio activity of any underlying mutual funds or exchange-traded funds (ETFs).
NPortfolio turnover rate excludes securities received or delivered in-kind.
Fidelity Advisor® Stock Selector Small Cap Fund Class I |
| |
| | Six months ended (Unaudited) April 30, 2024 | | Years ended October 31, 2023 | | 2022 | | 2021 | | 2020 | | 2019 |
Selected Per-Share Data | | | | | | | | | | | | |
| Net asset value, beginning of period | $ | 27.92 | $ | 28.67 | $ | 38.34 | $ | 24.93 | $ | 24.54 | $ | 26.57 |
| Income from Investment Operations | | | | | | | | | | | | |
Net investment income (loss) A,B | | .04 | | .06 | | .05 C | | (.06) | | - D | | .08 |
| Net realized and unrealized gain (loss) | | 6.76 | | (.78) | | (5.99) | | 13.90 | | .86 | | 2.37 |
| Total from investment operations | | 6.80 | | (.72) | | (5.94) | | 13.84 | | .86 | | 2.45 |
| Distributions from net investment income | | (.08) | | (.03) | | (.06) | | - | | - D,E | | (.06) |
| Distributions from net realized gain | | - | | - | | (3.67) | | (.43) | | (.47) E | | (4.42) |
| Total distributions | | (.08) | | (.03) | | (3.73) | | (.43) | | (.47) | | (4.48) |
| Net asset value, end of period | $ | 34.64 | $ | 27.92 | $ | 28.67 | $ | 38.34 | $ | 24.93 | $ | 24.54 |
Total Return F,G | | | | (2.50)% | | (16.72)% | | 56.03% | | 3.49% | | 11.87% |
Ratios to Average Net Assets B,H,I | | | | | | | | | | | | |
| Expenses before reductions | | .95% J | | .98% | | .94% | | .92% | | 1.01% | | .76% |
| Expenses net of fee waivers, if any | | | | .97% | | .94% | | .91% | | 1.00% | | .76% |
| Expenses net of all reductions | | .95% J | | .97% | | .94% | | .91% | | 1.00% | | .75% |
| Net investment income (loss) | | .27% J | | .21% | | .17% C | | (.17)% | | .02% | | .35% |
| Supplemental Data | | | | | | | | | | | | |
| Net assets, end of period (in millions) | $ | 751 | $ | 471 | $ | 296 | $ | 308 | $ | 79 | $ | 9 |
Portfolio turnover rate K | | | | 38% | | 38% | | 59% | | 70% | | 56% L |
ACalculated based on average shares outstanding during the period.
BNet investment income (loss) is affected by the timing of the declaration of dividends by any underlying mutual funds or exchange-traded funds (ETFs). Net investment income (loss) of any mutual funds or ETFs is not included in the Fund's net investment income (loss) ratio.
CNet investment income per share reflects one or more large, non-recurring dividend(s) which amounted to $.06 per share. Excluding such non-recurring dividend(s), the ratio of net investment income (loss) to average net assets would have been (.02)%.
DAmount represents less than $.005 per share.
EThe amount shown reflects reclassifications related to book to tax differences that were made in the year shown.
FTotal returns for periods of less than one year are not annualized.
GTotal returns would have been lower if certain expenses had not been reduced during the applicable periods shown.
HFees and expenses of any underlying mutual funds or exchange-traded funds (ETFs) are not included in the Fund's expense ratio. The Fund indirectly bears its proportionate share of these expenses. For additional expense information related to investments in Fidelity Central Funds, please refer to the "Investments in Fidelity Central Funds" note found in the Notes to Financial Statements section of the most recent Annual or Semi-Annual report.
IExpense ratios reflect operating expenses of the class. Expenses before reductions do not reflect amounts reimbursed, waived, or reduced through arrangements with the investment adviser, brokerage services, or other offset arrangements, if applicable, and do not represent the amount paid by the class during periods when reimbursements, waivers or reductions occur.
JAnnualized.
KAmount does not include the portfolio activity of any underlying mutual funds or exchange-traded funds (ETFs).
LPortfolio turnover rate excludes securities received or delivered in-kind.
Fidelity Advisor® Stock Selector Small Cap Fund Class Z |
| |
| | Six months ended (Unaudited) April 30, 2024 | | Years ended October 31, 2023 | | 2022 | | 2021 | | 2020 | | 2019 |
Selected Per-Share Data | | | | | | | | | | | | |
| Net asset value, beginning of period | $ | 27.90 | $ | 28.61 | $ | 38.27 | $ | 24.85 | $ | 24.55 | $ | 26.59 |
| Income from Investment Operations | | | | | | | | | | | | |
Net investment income (loss) A,B | | .07 | | .11 | | .09 C | | (.02) | | .03 | | .12 |
| Net realized and unrealized gain (loss) | | 6.75 | | (.78) | | (5.98) | | 13.87 | | .86 | | 2.36 |
| Total from investment operations | | 6.82 | | (.67) | | (5.89) | | 13.85 | | .89 | | 2.48 |
| Distributions from net investment income | | (.12) | | (.04) | | (.11) | | - | | (.12) D | | (.10) |
| Distributions from net realized gain | | - | | - | | (3.67) | | (.43) | | (.47) D | | (4.42) |
| Total distributions | | (.12) | | (.04) | | (3.77) E | | (.43) | | (.59) | | (4.52) |
| Net asset value, end of period | $ | 34.60 | $ | 27.90 | $ | 28.61 | $ | 38.27 | $ | 24.85 | $ | 24.55 |
Total Return F,G | | | | (2.34)% | | (16.62)% | | 56.26% | | 3.58% | | 12.05% |
Ratios to Average Net Assets B,H,I | | | | | | | | | | | | |
| Expenses before reductions | | .80% J | | .83% | | .81% | | .79% | | .89% | | .61% |
| Expenses net of fee waivers, if any | | | | .82% | | .81% | | .79% | | .88% | | .61% |
| Expenses net of all reductions | | .79% J | | .82% | | .81% | | .79% | | .88% | | .61% |
| Net investment income (loss) | | .42% J | | .35% | | .30% C | | (.04)% | | .14% | | .49% |
| Supplemental Data | | | | | | | | | | | | |
| Net assets, end of period (in millions) | $ | 363 | $ | 310 | $ | 225 | $ | 167 | $ | 53 | $ | 30 |
Portfolio turnover rate K | | | | 38% | | 38% | | 59% | | 70% | | 56% L |
ACalculated based on average shares outstanding during the period.
BNet investment income (loss) is affected by the timing of the declaration of dividends by any underlying mutual funds or exchange-traded funds (ETFs). Net investment income (loss) of any mutual funds or ETFs is not included in the Fund's net investment income (loss) ratio.
CNet investment income per share reflects one or more large, non-recurring dividend(s) which amounted to $.06 per share. Excluding such non-recurring dividend(s), the ratio of net investment income (loss) to average net assets would have been .11%.
DThe amount shown reflects reclassifications related to book to tax differences that were made in the year shown.
ETotal distributions per share do not sum due to rounding.
FTotal returns for periods of less than one year are not annualized.
GTotal returns would have been lower if certain expenses had not been reduced during the applicable periods shown.
HFees and expenses of any underlying mutual funds or exchange-traded funds (ETFs) are not included in the Fund's expense ratio. The Fund indirectly bears its proportionate share of these expenses. For additional expense information related to investments in Fidelity Central Funds, please refer to the "Investments in Fidelity Central Funds" note found in the Notes to Financial Statements section of the most recent Annual or Semi-Annual report.
IExpense ratios reflect operating expenses of the class. Expenses before reductions do not reflect amounts reimbursed, waived, or reduced through arrangements with the investment adviser, brokerage services, or other offset arrangements, if applicable, and do not represent the amount paid by the class during periods when reimbursements, waivers or reductions occur.
JAnnualized.
KAmount does not include the portfolio activity of any underlying mutual funds or exchange-traded funds (ETFs).
LPortfolio turnover rate excludes securities received or delivered in-kind.
For the period ended April 30, 2024
(Amounts in thousands except percentages)
1. Organization.
Fidelity Stock Selector Small Cap Fund (the Fund) is a fund of Fidelity Capital Trust (the Trust) and is authorized to issue an unlimited number of shares. The Trust is registered under the Investment Company Act of 1940, as amended (the 1940 Act), as an open-end management investment company organized as a Massachusetts business trust. The Fund offers Class A, Class M, Class C, Stock Selector Small Cap, Class I and Class Z shares, each of which has equal rights as to assets and voting privileges. Class A, Class M, Class C, Class I and Class Z are Fidelity Advisor classes. Each class has exclusive voting rights with respect to matters that affect that class. Class C shares will automatically convert to Class A shares after a holding period of eight years from the initial date of purchase, with certain exceptions.
2. Investments in Fidelity Central Funds.
Funds may invest in Fidelity Central Funds, which are open-end investment companies generally available only to other investment companies and accounts managed by the investment adviser and its affiliates. The Schedule of Investments lists any Fidelity Central Funds held as an investment as of period end, but does not include the underlying holdings of each Fidelity Central Fund. An investing fund indirectly bears its proportionate share of the expenses of the underlying Fidelity Central Funds.
Based on its investment objective, each Fidelity Central Fund may invest or participate in various investment vehicles or strategies that are similar to those of the investing fund. These strategies are consistent with the investment objectives of the investing fund and may involve certain economic risks which may cause a decline in value of each of the Fidelity Central Funds and thus a decline in the value of the investing fund.
| Fidelity Central Fund | Investment Manager | Investment Objective | Investment Practices | Expense RatioA |
| Fidelity Money Market Central Funds | Fidelity Management & Research Company LLC (FMR) | Each fund seeks to obtain a high level of current income consistent with the preservation of capital and liquidity. | Short-term Investments | Less than .005% |
A Expenses expressed as a percentage of average net assets and are as of each underlying Central Fund's most recent annual or semi-annual shareholder report.
A complete unaudited list of holdings for each Fidelity Central Fund is available upon request or at the Securities and Exchange Commission website at www.sec.gov. In addition, the financial statements of the Fidelity Central Funds which contain the significant accounting policies (including investment valuation policies) of those funds, and are not covered by the Report of Independent Registered Public Accounting Firm, are available on the Securities and Exchange Commission website or upon request.
3. Significant Accounting Policies.
The Fund is an investment company and applies the accounting and reporting guidance of the Financial Accounting Standards Board (FASB) Accounting Standards Codification Topic 946 Financial Services - Investment Companies. The financial statements have been prepared in conformity with accounting principles generally accepted in the United States of America (GAAP), which require management to make certain estimates and assumptions at the date of the financial statements. Actual results could differ from those estimates. Subsequent events, if any, through the date that the financial statements were issued have been evaluated in the preparation of the financial statements. The Fund's Schedule of Investments lists any underlying mutual funds or exchange-traded funds (ETFs) but does not include the underlying holdings of these funds. The following summarizes the significant accounting policies of the Fund:
Investment Valuation. Investments are valued as of 4:00 p.m. Eastern time on the last calendar day of the period. The Board of Trustees (the Board) has designated the Fund's investment adviser as the valuation designee responsible for the fair valuation function and performing fair value determinations as needed. The investment adviser has established a Fair Value Committee (the Committee) to carry out the day-to-day fair valuation responsibilities and has adopted policies and procedures to govern the fair valuation process and the activities of the Committee. In accordance with these fair valuation policies and procedures, which have been approved by the Board, the Fund attempts to obtain prices from one or more third party pricing services or brokers to value its investments. When current market prices, quotations or currency exchange rates are not readily available or reliable, investments will be fair valued in good faith by the Committee, in accordance with the policies and procedures. Factors used in determining fair value vary by investment type and may include market or investment specific events, transaction data, estimated cash flows, and market observations of comparable investments. The frequency that the fair valuation procedures are used cannot be predicted and they may be utilized to a significant extent. The Committee manages the Fund's fair valuation practices and maintains the fair valuation policies and procedures. The Fund's investment adviser reports to the Board information regarding the fair valuation process and related material matters.
The Fund categorizes the inputs to valuation techniques used to value its investments into a disclosure hierarchy consisting of three levels as shown below:
Level 1 - unadjusted quoted prices in active markets for identical investments
Level 2 - other significant observable inputs (including quoted prices for similar investments, interest rates, prepayment speeds, etc.)
Level 3 - unobservable inputs (including the Fund's own assumptions based on the best information available)
Valuation techniques used to value the Fund's investments by major category are as follows:
Equity securities, including restricted securities, for which market quotations are readily available, are valued at the last reported sale price or official closing price as reported by a third party pricing service on the primary market or exchange on which they are traded and are categorized as Level 1 in the hierarchy. In the event there were no sales during the day or closing prices are not available, securities are valued at the last quoted bid price or may be valued using the last available price and are generally categorized as Level 2 in the hierarchy. For foreign equity securities, when market or security specific events arise, comparisons to the valuation of American Depositary Receipts (ADRs), futures contracts, Exchange-Traded Funds (ETFs) and certain indexes as well as quoted prices for similar securities may be used and would be categorized as Level 2 in the hierarchy. For equity securities, including restricted securities, where observable inputs are limited, assumptions about market activity and risk are used and these securities may be categorized as Level 3 in the hierarchy.
Futures contracts are valued at the settlement price established each day by the board of trade or exchange on which they are traded and are categorized as Level 1 in the hierarchy. Investments in open-end mutual funds, including the Fidelity Central Funds, are valued at their closing net asset value (NAV) each business day and are categorized as Level 1 in the hierarchy.
Changes in valuation techniques may result in transfers in or out of an assigned level within the disclosure hierarchy. The aggregate value of investments by input level as of April 30, 2024 is included at the end of the Fund's Schedule of Investments.
Foreign Currency. Certain Funds may use foreign currency contracts to facilitate transactions in foreign-denominated securities. Gains and losses from these transactions may arise from changes in the value of the foreign currency or if the counterparties do not perform under the contracts' terms.
Foreign-denominated assets, including investment securities, and liabilities are translated into U.S. dollars at the exchange rates at period end. Purchases and sales of investment securities, income and dividends received, and expenses denominated in foreign currencies are translated into U.S. dollars at the exchange rate in effect on the transaction date.
The effects of exchange rate fluctuations on investments are included with the net realized and unrealized gain (loss) on investment securities. Other foreign currency transactions resulting in realized and unrealized gain (loss) are disclosed separately.
Investment Transactions and Income. For financial reporting purposes, the Fund's investment holdings and NAV include trades executed through the end of the last business day of the period. The NAV per share for processing shareholder transactions is calculated as of the close of business of the New York Stock Exchange (NYSE), normally 4:00 p.m. Eastern time and includes trades executed through the end of the prior business day. Gains and losses on securities sold are determined on the basis of identified cost and include proceeds received from litigation. Commissions paid to certain brokers with whom the investment adviser, or its affiliates, places trades on behalf of a fund include an amount in addition to trade execution, which may be rebated back to a fund. Any such rebates are included in net realized gain (loss) on investments in the Statement of Operations. Dividend income is recorded on the ex-dividend date, except for certain dividends from foreign securities where the ex-dividend date may have passed, which are recorded as soon as the Fund is informed of the ex-dividend date. Non-cash dividends included in dividend income, if any, are recorded at the fair market value of the securities received. Income and capital gain distributions from Fidelity Central Funds, if any, are recorded on the ex-dividend date. Certain distributions received by the Fund represent a return of capital or capital gain. The Fund determines the components of these distributions subsequent to the ex-dividend date, based upon receipt of tax filings or other correspondence relating to the underlying investment. These distributions are recorded as a reduction of cost of investments and/or as a realized gain. Interest income is accrued as earned and includes coupon interest and amortization of premium and accretion of discount on debt securities as applicable. Investment income is recorded net of foreign taxes withheld where recovery of such taxes is uncertain.
Class Allocations and Expenses. Investment income, realized and unrealized capital gains and losses, common expenses of a fund, and certain fund-level expense reductions, if any, are allocated daily on a pro-rata basis to each class based on the relative net assets of each class to the total net assets of a fund. Each class differs with respect to transfer agent and distribution and service plan fees incurred, as applicable. Certain expense reductions may also differ by class, if applicable. For the reporting period, the allocated portion of income and expenses to each class as a percent of its average net assets may vary due to the timing of recording these transactions in relation to fluctuating net assets of the classes. Expenses directly attributable to a fund are charged to that fund. Expenses attributable to more than one fund are allocated among the respective funds on the basis of relative net assets or other appropriate methods. Expenses included in the accompanying financial statements reflect the expenses of that fund and do not include any expenses associated with any underlying mutual funds or exchange-traded funds (ETFs). Although not included in a fund's expenses, a fund indirectly bears its proportionate share of these expenses through the net asset value of each underlying mutual fund or exchange-traded fund (ETF). Expense estimates are accrued in the period to which they relate and adjustments are made when actual amounts are known.
Income Tax Information and Distributions to Shareholders. Each year, the Fund intends to qualify as a regulated investment company under Subchapter M of the Internal Revenue Code, including distributing substantially all of its taxable income and realized gains. As a result, no provision for U.S. Federal income taxes is required. The Fund files a U.S. federal tax return, in addition to state and local tax returns as required. The Fund's federal income tax returns are subject to examination by the Internal Revenue Service (IRS) for a period of three fiscal years after they are filed. State and local tax returns may be subject to examination for an additional fiscal year depending on the jurisdiction. Foreign taxes are provided for based on the Fund's understanding of the tax rules and rates that exist in the foreign markets in which it invests.
Distributions are declared and recorded on the ex-dividend date. Income and capital gain distributions are declared separately for each class. Income and capital gain distributions are determined in accordance with income tax regulations, which may differ from GAAP.
Capital accounts within the financial statements are adjusted for permanent book-tax differences. These adjustments have no impact on net assets or the results of operations. Capital accounts are not adjusted for temporary book-tax differences which will reverse in a subsequent period.
Book-tax differences are primarily due to futures contracts, foreign currency transactions, passive foreign investment companies (PFIC), partnerships, capital loss carryforwards and losses deferred due to wash sales and excise tax regulations.
As of period end, the cost and unrealized appreciation (depreciation) in securities, and derivatives if applicable, for federal income tax purposes were as follows:
| Gross unrealized appreciation | $825,818 |
| Gross unrealized depreciation | (171,569) |
| Net unrealized appreciation (depreciation) | $654,249 |
| Tax cost | $2,526,164 |
Capital loss carryforwards are only available to offset future capital gains of the Fund to the extent provided by regulations and may be limited. The capital loss carryforward information presented below, including any applicable limitation, is estimated as of prior fiscal period end and is subject to adjustment.
Restricted Securities (including Private Placements). Funds may invest in securities that are subject to legal or contractual restrictions on resale. These securities generally may be resold in transactions exempt from registration or to the public if the securities are registered. Disposal of these securities may involve time-consuming negotiations and expense, and prompt sale at an acceptable price may be difficult. Information regarding restricted securities held at period end is included at the end of the Schedule of Investments, if applicable.
4. Derivative Instruments.
Risk Exposures and the Use of Derivative Instruments. The Fund's investment objectives allow for various types of derivative instruments, including futures contracts. Derivatives are investments whose value is primarily derived from underlying assets, indices or reference rates and may be transacted on an exchange or over-the-counter (OTC). Derivatives may involve a future commitment to buy or sell a specified asset based on specified terms, to exchange future cash flows at periodic intervals based on a notional principal amount, or for one party to make one or more payments upon the occurrence of specified events in exchange for periodic payments from the other party.
Derivatives were used to increase returns and to manage exposure to certain risks as defined below. The success of any strategy involving derivatives depends on analysis of numerous economic factors, and if the strategies for investment do not work as intended, the objectives may not be achieved.
Derivatives were used to increase or decrease exposure to the following risk(s):
| | |
| Equity Risk | Equity risk relates to the fluctuations in the value of financial instruments as a result of changes in market prices (other than those arising from interest rate risk or foreign exchange risk), whether caused by factors specific to an individual investment, its issuer, or all factors affecting all instruments traded in a market or market segment. |
Funds are also exposed to additional risks from investing in derivatives, such as liquidity risk and counterparty credit risk. Liquidity risk is the risk that a fund will be unable to close out the derivative in the open market in a timely manner. Counterparty credit risk is the risk that the counterparty will not be able to fulfill its obligation to a fund. Counterparty credit risk related to exchange-traded contracts may be mitigated by the protection provided by the exchange on which they trade.
Investing in derivatives may involve greater risks than investing in the underlying assets directly and, to varying degrees, may involve risk of loss in excess of any initial investment and collateral received and amounts recognized in the Statement of Assets and Liabilities. In addition, there may be the risk that the change in value of the derivative contract does not correspond to the change in value of the underlying instrument.
Futures Contracts. A futures contract is an agreement between two parties to buy or sell a specified underlying instrument for a fixed price at a specified future date. Futures contracts were used to manage exposure to the stock market.
Upon entering into a futures contract, a fund is required to deposit either cash or securities (initial margin) with a clearing broker in an amount equal to a certain percentage of the face value of the contract. Futures contracts are marked-to-market daily and subsequent daily payments are made or received by a fund depending on the daily fluctuations in the value of the futures contracts and are recorded as unrealized appreciation or (depreciation). This receivable and/or payable, if any, is included in daily variation margin on futures contracts in the Statement of Assets and Liabilities. Realized gain or (loss) is recorded upon the expiration or closing of a futures contract. The net realized gain (loss) and change in net unrealized appreciation (depreciation) on futures contracts during the period is presented in the Statement of Operations.
Any open futures contracts at period end are presented in the Schedule of Investments under the caption "Futures Contracts". The notional amount at value reflects each contract's exposure to the underlying instrument or index at period end, and is representative of volume of activity during the period unless an average notional amount is presented. Any securities deposited to meet initial margin requirements are identified in the Schedule of Investments. Any cash deposited to meet initial margin requirements is presented as segregated cash with brokers for derivative instruments in the Statement of Assets and Liabilities.
5. Purchases and Sales of Investments.
Purchases and sales of securities, other than short-term securities and in-kind transactions, as applicable, are noted in the table below.
| | Purchases ($) | Sales ($) |
| Fidelity Stock Selector Small Cap Fund | 805,406 | 514,458 |
6. Fees and Other Transactions with Affiliates.
Management Fee. Fidelity Management & Research Company LLC (the investment adviser) and its affiliates provide the Fund with investment management related services for which the Fund pays a monthly management fee.
Effective March 1, 2024, the Fund's management contract was amended to incorporate administrative services previously covered under separate services agreements (Transfer Agent and Accounting agreements). The amended contract incorporates a basic fee rate that may vary by class (subject to a performance adjustment). The investment adviser or an affiliate pays certain expenses of managing and operating the Fund out of each class's management fee. Each class of the Fund pays a management fee to the investment adviser. The management fee is calculated and paid to the investment adviser every month. The management fee is determined by calculating a basic fee and then applying a performance adjustment. When determining a class's basic fee, a mandate rate is calculated based on the monthly average net assets of a group of funds advised by FMR within a designated asset class. A discount rate is subtracted from the mandate rate once the Fund's monthly average net assets reach a certain level. The mandate rate and discount rate may vary by class. The annual basic fee rate for a class of shares of the Fund is the lesser of (1) the class's mandate rate reduced by the class's discount rate (if applicable) or (2) the amount set forth in the following table.
| | Maximum Management Fee Rate % |
| Class A | .76 |
| Class M | .77 |
| Class C | .77 |
| Stock Selector Small Cap | .73 |
| Class I | .75 |
| Class Z | .61 |
One-twelfth of the basic fee rate for a class is applied to the average net assets of the class for the month, giving a dollar amount which is the basic fee for the class for that month. A different management fee rate may be applicable to each class of the Fund. The difference between classes is the result of separate arrangements for class-level services and/or waivers of certain expenses. It is not the result of any difference in advisory or custodial fees or other expenses related to the management of the Fund's assets, which do not vary by class. For the portion of the reporting period on or after March 1, 2024, the total annualized management fee rates were as follows:
| | Total Management Fee Rate % |
| Class A | .75 |
| Class M | .77 |
| Class C | .77 |
| Stock Selector Small Cap | .73 |
| Class I | .75 |
| Class Z | .61 |
Prior to March 1, 2024, the management fee was the sum of an individual fund fee rate that was based on an annual rate of .35% of the Fund's average net assets and an annualized group fee rate that averaged .22% during the period. The group fee rate was based upon the monthly average net assets of a group of registered investment companies with which the investment adviser has management contracts. The group fee rate decreased as assets under management increased and increased as assets under management decreased. For the portion of the reporting period prior to March 1, 2024, the total annualized management fee rate was .57%.
The performance adjustment rate is calculated monthly by comparing over the performance period the Fund's performance to that of the performance adjustment index listed below.
| | Performance Adjustment Index |
| Fidelity Stock Selector Small Cap Fund | Russell 2000 Index |
For the purposes of calculating the performance adjustment for the Fund, the Fund's investment performance is based on the performance of Stock Selector Small Cap. To the extent that other classes of the Fund have higher expenses, this could result in those classes bearing a larger positive performance adjustment and smaller negative performance adjustment than would be the case if each class's own performance were considered. The performance period is the most recent 36 month period. The maximum annualized performance adjustment rate is ± .20% of the Fund's average net assets over the performance period. The performance adjustment rate is divided by twelve and multiplied by the Fund's average net assets over the performance period, and the resulting dollar amount is proportionately added to or subtracted from a class's basic fee. For the entire reporting period, the total annualized performance adjustment was .16%.
Effective March 1, 2024, the Fund's sub-advisory agreements with FMR Investment Management (UK) Limited, Fidelity Management & Research (Hong Kong) Limited, and Fidelity Management & Research (Japan) Limited were amended to provide that the investment adviser pays each sub-adviser monthly fees equal to 110% of the sub-adviser's costs for providing sub-advisory services.
Distribution and Service Plan Fees. In accordance with Rule 12b-1 of the 1940 Act, the Fund has adopted separate Distribution and Service Plans for each class of shares. Certain classes pay Fidelity Distributors Company LLC (FDC), an affiliate of the investment adviser, separate Distribution and Service Fees, each of which is based on an annual percentage of each class' average net assets. In addition, FDC may pay financial intermediaries for selling shares of the Fund and providing shareholder support services. For the period, the Distribution and Service Fee rates, total fees and amounts retained by FDC were as follows:
| | Distribution Fee | Service Fee | Total Fees ($) | Retained by FDC ($) |
| Class A | - % | .25% | 180 | 10 |
| Class M | .25% | .25% | 45 | - A |
| Class C | .75% | .25% | 119 | 35 |
| | | | 344 | 45 |
A Amount represents less than five hundred dollars.
Sales Load. FDC may receive a front-end sales charge of up to 5.75% for selling Class A shares and 3.50% for selling Class M shares, some of which is paid to financial intermediaries for selling shares of the Fund. Depending on the holding period, FDC may receive contingent deferred sales charges levied on Class A, Class M and Class C redemptions. The deferred sales charges are 1.00% for Class C shares, 1.00% for certain purchases of Class A shares and .25% for certain purchases of Class M shares.
For the period, sales charge amounts retained by FDC were as follows:
| | Retained by FDC ($) |
| Class A | 61 |
| Class M | 3 |
Class CA | - B |
| | 64 |
A When Class C shares are initially sold, FDC pays commissions from its own resources to financial intermediaries through which the sales are made.
B Amount represents less than five hundred dollars.
Transfer Agent Fees. Fidelity Investments Institutional Operations Company LLC (FIIOC), an affiliate of the investment adviser, is the transfer, dividend disbursing and shareholder servicing agent for each class of the Fund. Effective March 1, 2024, the Fund's management contract was amended to incorporate transfer agent services and associated fees previously covered under a separate services agreement. FIIOC pays for typesetting, printing and mailing of shareholder reports, except proxy statements.
During November 2023, the Board approved a change in the transfer agent fees effective December 1, 2023 to a fixed annual rate of class-level average net assets as follows:
| | % of Class-Level Average Net Assets |
| Class A | .1897 |
| Class M | .2000 |
| Class C | .2000 |
| Stock Selector Small Cap | .1658 |
| Class I | .1859 |
Prior to December 1, 2023, FIIOC received account fees and asset-based fees that varied according to the account size and type of account of the shareholders of the respective classes of the Fund, except for Class Z. FIIOC received an asset-based fee of Class Z's average net assets. For the portion of the reporting period prior to March 1, 2024, the fees were equivalent to the following annualized rates:
| | Amount ($) | % of Class-Level Average Net Assets |
| Class A | 84 | .19 |
| Class M | 12 | .21 |
| Class C | 15 | .20 |
| Stock Selector Small Cap | 820 | .17 |
| Class I | 362 | .18 |
| Class Z | 44 | .04 |
| | 1,337 | |
Accounting Fees. Fidelity Service Company, Inc. (FSC), an affiliate of the investment adviser, maintains the Fund's accounting records. Effective March 1, 2024, the Fund's management contract was amended to incorporate accounting services and associated fees previously covered under a separate services agreement.
During November 2023, the Board approved a change in the accounting fees effective December 1, 2023 to a fixed annual rate of average net assets as follows:
| | % of Average Net Assets |
| Fidelity Stock Selector Small Cap Fund | .0263 |
Prior to December 1, 2023, the accounting fee was based on the level of average net assets for each month. For the portion of the reporting period prior to March 1, 2024, the fees were equivalent to the following annualized rates:
| | % of Average Net Assets |
| Fidelity Stock Selector Small Cap Fund | .03 |
Brokerage Commissions. A portion of portfolio transactions were placed with brokerage firms which are affiliates of the investment adviser. Brokerage commissions are included in net realized gain (loss) and change in net unrealized appreciation (depreciation) in the Statement of Operations. The commissions paid to these affiliated firms were as follows:
| | Amount ($) |
| Fidelity Stock Selector Small Cap Fund | 16 |
Interfund Trades. Funds may purchase from or sell securities to other Fidelity Funds under procedures adopted by the Board. The procedures have been designed to ensure these interfund trades are executed in accordance with Rule 17a-7 of the 1940 Act. Any interfund trades are included within the respective purchases and sales amounts shown in the Purchases and Sales of Investments note. Interfund trades during the period are noted in the table below.
| | Purchases ($) | Sales ($) | Realized Gain (Loss)($) |
| Fidelity Stock Selector Small Cap Fund | 47,349 | 39,936 | 9,022 |
7. Committed Line of Credit.
Certain Funds participate with other funds managed by the investment adviser or an affiliate in a $4.25 billion credit facility (the "line of credit") to be utilized for temporary or emergency purposes to fund shareholder redemptions or for other short-term liquidity purposes. The participating funds have agreed to pay commitment fees on their pro-rata portion of the line of credit, which are reflected in Miscellaneous expenses on the Statement of Operations, and are listed below. During the period, there were no borrowings on this line of credit.
| | Amount ($) |
| Fidelity Stock Selector Small Cap Fund | 2 |
8. Security Lending.
Funds lend portfolio securities from time to time in order to earn additional income. Lending agents are used, including National Financial Services (NFS), an affiliate of the investment adviser. Pursuant to a securities lending agreement, NFS will receive a fee, which is capped at 9.9% of a fund's daily lending revenue, for its services as lending agent. A fund may lend securities to certain qualified borrowers, including NFS. On the settlement date of the loan, a fund receives collateral (in the form of U.S. Treasury obligations, letters of credit and/or cash) against the loaned securities and maintains collateral in an amount not less than 100% of the market value of the loaned securities during the period of the loan. The market value of the loaned securities is determined at the close of business of a fund and any additional required collateral is delivered to a fund on the next business day. A fund or borrower may terminate the loan at any time, and if the borrower defaults on its obligation to return the securities loaned because of insolvency or other reasons, a fund may apply collateral received from the borrower against the obligation. A fund may experience delays and costs in recovering the securities loaned. Any cash collateral received is invested in the Fidelity Securities Lending Cash Central Fund. Any loaned securities are identified as such in the Schedule of Investments, and the value of loaned securities and cash collateral at period end, as applicable, are presented in the Statement of Assets and Liabilities. Security lending income represents the income earned on investing cash collateral, less rebates paid to borrowers and any lending agent fees associated with the loan, plus any premium payments received for lending certain types of securities. Security lending income is presented in the Statement of Operations as a component of income from Fidelity Central Funds. Affiliated security lending activity, if any, was as follows:
| | Total Security Lending Fees Paid to NFS ($) | Security Lending Income From Securities Loaned to NFS ($) | Value of Securities Loaned to NFS at Period End ($) |
| Fidelity Stock Selector Small Cap Fund | 21 | - A | - |
A Amount represents less than five hundred dollars.
9. Expense Reductions.
Through arrangements with the Fund's custodian, credits realized as a result of certain uninvested cash balances were used to reduce the Fund's expenses. During the period, custodian credits reduced the Fund's expenses by $2.
In addition, during the period the investment adviser or an affiliate reimbursed and/or waived a portion of fund-level operating expenses in the amount of $119.
10. Distributions to Shareholders.
Distributions to shareholders of each class were as follows:
| | Six months ended April 30, 2024 | Year ended October 31, 2023 |
| Fidelity Stock Selector Small Cap Fund | | |
| Distributions to shareholders | | |
| Class A | $33 | $84 |
| Class M | - | 5 |
| Stock Selector Small Cap | 3,539 | 1,630 |
| Class I | 1,415 | 342 |
| Class Z | 1,136 | 325 |
Total | $6,123 | $2,386 |
11. Share Transactions.
Share transactions for each class were as follows and may contain in-kind transactions, automatic conversions between classes or exchanges between affiliated funds:
| | Shares | Shares | Dollars | Dollars |
| | Six months ended April 30, 2024 | Year ended October 31, 2023 | Six months ended April 30, 2024 | Year ended October 31, 2023 |
| Fidelity Stock Selector Small Cap Fund | | | | |
| Class A | | | | |
| Shares sold | 2,796 | 1,193 | $92,639 | $34,158 |
| Reinvestment of distributions | 1 | 3 | 33 | 84 |
| Shares redeemed | (351) | (700) | (11,176) | (19,837) |
| Net increase (decrease) | 2,446 | 496 | $81,496 | $14,405 |
| Class M | | | | |
| Shares sold | 79 | 110 | $2,385 | $3,004 |
| Reinvestment of distributions | - | - | - | 5 |
| Shares redeemed | (39) | (83) | (1,187) | (2,280) |
| Net increase (decrease) | 40 | 27 | $1,198 | $729 |
| Class C | | | | |
| Shares sold | 211 | 299 | $5,871 | $7,405 |
| Shares redeemed | (77) | (156) | (2,111) | (3,844) |
| Net increase (decrease) | 134 | 143 | $3,760 | $3,561 |
| Stock Selector Small Cap | | | | |
| Shares sold | 6,627 | 7,397 | $223,285 | $219,149 |
| Reinvestment of distributions | 106 | 54 | 3,279 | 1,526 |
| Shares redeemed | (4,599) | (8,227) | (151,409) | (242,949) |
| Net increase (decrease) | 2,134 | (776) | $75,155 | $(22,274) |
| Class I | | | | |
| Shares sold | 9,334 | 14,720 | $310,484 | $443,431 |
| Reinvestment of distributions | 45 | 12 | 1,390 | 336 |
| Shares redeemed | (4,579) | (8,200) | (150,917) | (245,687) |
| Net increase (decrease) | 4,800 | 6,532 | $160,957 | $198,080 |
| Class Z | | | | |
| Shares sold | 3,583 | 6,735 | $120,019 | $199,337 |
| Reinvestment of distributions | 33 | 11 | 1,029 | 302 |
| Shares redeemed | (4,217) | (3,524) | (132,875) | (104,423) |
| Net increase (decrease) | (601) | 3,222 | $(11,827) | $95,216 |
12. Other.
A fund's organizational documents provide former and current trustees and officers with a limited indemnification against liabilities arising in connection with the performance of their duties to the fund. In the normal course of business, a fund may also enter into contracts that provide general indemnifications. A fund's maximum exposure under these arrangements is unknown as this would be dependent on future claims that may be made against a fund. The risk of material loss from such claims is considered remote.
13. Risk and Uncertainties.
Many factors affect a fund's performance. Developments that disrupt global economies and financial markets, such as pandemics, epidemics, outbreaks of infectious diseases, war, terrorism, and environmental disasters, may significantly affect a fund's investment performance. The effects of these developments to a fund will be impacted by the types of securities in which a fund invests, the financial condition, industry, economic sector, and geographic location of an issuer, and a fund's level of investment in the securities of that issuer. Significant concentrations in security types, issuers, industries, sectors, and geographic locations may magnify the factors that affect a fund's performance.
As a shareholder, you incur two types of costs: (1) transaction costs, which may include sales charges (loads) on purchase payments or redemption proceeds, as applicable and (2) ongoing costs, which generally include management fees, distribution and/or service (12b-1) fees and other Fund expenses. This Example is intended to help you understand your ongoing costs (in dollars) of investing in a fund and to compare these costs with the ongoing costs of investing in other mutual funds.
| The Example is based on an investment of $1,000 invested at the beginning of the period and held for the entire period (November 1, 2023 to April 30, 2024). |
Actual Expenses
The first line of the accompanying table provides information about actual account values and actual expenses. You may use the information in this line, together with the amount you invested, to estimate the expenses that you paid over the period. Simply divide your account value by $1,000.00 (for example, an $8,600 account value divided by $1,000.00 = 8.6), then multiply the result by the number in the first line for a class/Fund under the heading entitled "Expenses Paid During Period" to estimate the expenses you paid on your account during this period. If any fund is a shareholder of any underlying mutual funds or exchange-traded funds (ETFs) (the Underlying Funds), such fund indirectly bears its proportional share of the expenses of the Underlying Funds in addition to the direct expenses incurred presented in the table. These fees and expenses are not included in the annualized expense ratio used to calculate the expense estimate in the table below.
Hypothetical Example for Comparison Purposes
The second line of the accompanying table provides information about hypothetical account values and hypothetical expenses based on the actual expense ratio and an assumed rate of return of 5% per year before expenses, which is not the actual return. The hypothetical account values and expenses may not be used to estimate the actual ending account balance or expenses you paid for the period. You may use this information to compare the ongoing costs of investing in the Fund and other funds. To do so, compare this 5% hypothetical example with the 5% hypothetical examples that appear in the shareholder reports of the other funds. If any fund is a shareholder of any Underlying Funds, such fund indirectly bears its proportional share of the expenses of the Underlying Funds in addition to the direct expenses as presented in the table. These fees and expenses are not included in the annualized expense ratio used to calculate the expense estimate in the table below.
Please note that the expenses shown in the table are meant to highlight your ongoing costs only and do not reflect any transaction costs. Therefore, the second line of the table is useful in comparing ongoing costs only, and will not help you determine the relative total costs of owning different funds. In addition, if these transactional costs were included, your costs would have been higher.
| | | | | Annualized Expense Ratio- A | | Beginning Account Value November 1, 2023 | | Ending Account Value April 30, 2024 | | Expenses Paid During Period- C November 1, 2023 to April 30, 2024 |
| Fidelity® Stock Selector Small Cap Fund | | | | | | | | | | |
| Class A | | | | 1.21% | | | | | | |
| Actual | | | | | | $ 1,000 | | $ 1,242.40 | | $ 6.75 |
Hypothetical-B | | | | | | $ 1,000 | | $ 1,018.85 | | $ 6.07 |
| Class M | | | | 1.46% | | | | | | |
| Actual | | | | | | $ 1,000 | | $ 1,240.60 | | $ 8.13 |
Hypothetical-B | | | | | | $ 1,000 | | $ 1,017.60 | | $ 7.32 |
| Class C | | | | 1.96% | | | | | | |
| Actual | | | | | | $ 1,000 | | $ 1,238.00 | | $ 10.91 |
Hypothetical-B | | | | | | $ 1,000 | | $ 1,015.12 | | $ 9.82 |
| Fidelity® Stock Selector Small Cap Fund | | | | .91% | | | | | | |
| Actual | | | | | | $ 1,000 | | $ 1,244.30 | | $ 5.08 |
Hypothetical-B | | | | | | $ 1,000 | | $ 1,020.34 | | $ 4.57 |
| Class I | | | | .95% | | | | | | |
| Actual | | | | | | $ 1,000 | | $ 1,243.90 | | $ 5.30 |
Hypothetical-B | | | | | | $ 1,000 | | $ 1,020.14 | | $ 4.77 |
| Class Z | | | | .79% | | | | | | |
| Actual | | | | | | $ 1,000 | | $ 1,244.80 | | $ 4.41 |
Hypothetical-B | | | | | | $ 1,000 | | $ 1,020.93 | | $ 3.97 |
| |
A Annualized expense ratio reflects expenses net of applicable fee waivers.
B 5% return per year before expenses
C Expenses are equal to the annualized expense ratio, multiplied by the average account value over the period, multiplied by 182/ 366 (to reflect the one-half year period). The fees and expenses of any Underlying Funds are not included in each annualized expense ratio.
Board Approval of Investment Advisory Contracts
Fidelity Stock Selector Small Cap Fund
At its January 2024 meeting, the Board of Trustees, including the Independent Trustees (together, the Board), approved an amended and restated management contract with Fidelity Management & Research Company LLC (FMR) (the Management Contract), and amended and restated sub-advisory agreements (the Sub-Advisory Contracts, and together with the Management Contract, the Advisory Contracts) for the fund, including the fund's sub-advisory agreements with FMR Investment Management (UK) Limited (FMR UK), Fidelity Management & Research (Hong Kong) Limited (FMR H.K.), and Fidelity Management & Research (Japan) Limited (FMR Japan). The Advisory Contracts will be effective March 1, 2024. The Board will consider the annual renewal of the fund's Advisory Contracts in May 2024, following its review of additional materials provided by FMR.
Management Contract. The Board approved the Management Contract, which implements a new fee structure combining the management fee, transfer agent fee (TA Fee), and pricing and bookkeeping fee (P&B Fee) of the fund and each class into a single class-level fee based on tiered schedules and subject to a maximum class-level rate (the Unified Fee). In exchange for the Unified Fee, the fund will receive investment advisory, management, administrative, transfer agent, pricing and bookkeeping services under a single agreement - the Management Contract.
In its consideration of the Management Contract over several meetings, the Board received, reviewed and discussed a comprehensive set of analyses regarding the Unified Fee including (i) the legal framework, (ii) design goals for the Unified Fee, (iii) calculation methodology for the Unified Fee and illustrative examples, (iv) annual and cumulative projected impacts under various scenarios, both in the aggregate and at the fund/class level, (v) explanations of schedules, rate levers and maximum rates and (vi) shareholder benefits and projected savings.
The Board considered that the maximum Unified Fee for each class of the fund would be no higher than the sum of (i) the lowest contractual management fee rate under the fund's existing management contract, which is the individual fund fee rate, if any, plus the lowest contractual marginal group fee rate and (ii) the TA and P&B Fee rates, which are fixed fee rates since December 1, 2023 (together, the Unified Fee Cap). The Board noted that Fidelity has represented that, as a result of this Unified Fee Cap, the Unified Fee would be no greater than the fee rates previously authorized to be charged to the fund for the same services. The Board noted that certain expenses such as performance adjustments, third-party expenses, Rule 12b-1 fees, and certain other miscellaneous expenses would be outside the scope of the Unified Fee and the calculation of such fees would not change as a result of the Unified Fee. The Board considered that, under the Management Contract, a different management fee rate will be applicable to each class of the fund. The Board noted that Fidelity has represented that the difference in expenses between classes is based on differences in class-specific expenses and not due to any difference in advisory or third-party custodial fees or other expenses related to the management of the fund's assets.
The Board considered Fidelity's representations that implementation of the Unified Fee, which includes the Unified Fee Cap, would cause all funds subject to the Unified Fee, including the fund, to experience an immediate reduction on contractual fee rates for services provided under the current management contracts. The Board considered that some funds would not experience lower net total fees as a result of existing fee caps. The Board further considered that, in addition to the contractual fee savings, the Unified Fee offers funds and their shareholders greater protection from future rate increases for services previously offered under separate agreements that are now covered by the Management Contract because such rate increases would require shareholder approval.
Sub-Advisory Contracts. In connection with the Unified Fee changes, the Board considered the Sub-Advisory Contracts, which simplified the calculation of the fees paid by FMR to the sub-advisers under the agreements. The Board noted that the agreements with FMR UK, FMR H.K., and FMR Japan were amended to provide that FMR will compensate each sub-adviser at a fee rate equal to 110% of the sub-adviser's costs incurred in providing services under the agreement. The Board considered that, under the Sub-Advisory Contracts, FMR, and not the fund, will continue to pay the sub-advisory fees to each applicable sub-adviser.
The Board further considered that the approval of the fund's Advisory Contracts will not result in any changes in the investment process or strategies employed in the management of the fund's assets or the day-to-day management of the fund or the persons primarily responsible for such management. Further, the Board considered that the Management Contract would not change the obligations and services of FMR and its affiliates on behalf of the fund, and, in particular, there would be no change in the nature and level of advisory, management, administration, transfer agent, and pricing and bookkeeping services provided to the fund by FMR, its affiliates, and each applicable sub-adviser.
In connection with its consideration of future renewals of the fund's Advisory Contracts, the Board will consider: (i) the nature, extent and quality of services provided to the funds, including shareholder and administrative services and investment performance; (ii) the competitiveness of the management fee and total expenses for the fund; (iii) the costs of the services and profitability, including the revenues earned and the expenses incurred in conducting the business of developing, marketing, distributing, managing, administering, and servicing the fund and its shareholders, to the extent applicable; and (iv) whether there have been economies of scale in respect of the Fidelity funds, whether the Fidelity funds (including the fund) have appropriately benefited from any such economies of scale, and whether there is the potential for realization of any further economies.
Based on its evaluation of all of the conclusions and representations noted above, and after considering all factors it believed relevant, the Board concluded that the fund's management fee structure is fair and reasonable, and that the fund's Advisory Contracts should be approved.
The Securities and Exchange Commission adopted Rule 22e-4 under the Investment Company Act of 1940 (the Liquidity Rule) to promote effective liquidity risk management throughout the open-end investment company industry, thereby reducing the risk that funds will be unable to meet their redemption obligations and mitigating dilution of the interests of fund shareholders.
The Fund has adopted and implemented a liquidity risk management program (the Program) reasonably designed to assess and manage the Fund's liquidity risk and to comply with the requirements of the Liquidity Rule. The Fund's Board of Trustees (the Board) has designated the Fund's investment adviser as administrator of the Program. The Fidelity advisers have established a Liquidity Risk Management Committee (the LRM Committee) to manage the Program for each of the Fidelity Funds. The LRM Committee monitors the adequacy and effectiveness of implementation of the Program and on a periodic basis assesses each Fund's liquidity risk based on a variety of factors including (1) the Fund's investment strategy, (2) portfolio liquidity and cash flow projections during normal and reasonably foreseeable stressed conditions, (3) shareholder redemptions, (4) borrowings and other funding sources and (5) certain factors specific to ETFs including the effect of the Fund's prices and spreads, market participants, and basket compositions on the overall liquidity of the Fund's portfolio, as applicable.
In accordance with the Program, each of the Fund's portfolio investments is classified into one of four defined liquidity categories based on a determination of a reasonable expectation for how long it would take to convert the investment to cash (or sell or dispose of the investment) without significantly changing its market value.
- Highly liquid investments - cash or convertible to cash within three business days or less
- Moderately liquid investments - convertible to cash in three to seven calendar days
- Less liquid investments - can be sold or disposed of, but not settled, within seven calendar days
- Illiquid investments - cannot be sold or disposed of within seven calendar days
Liquidity classification determinations take into account a variety of factors including various market, trading and investment-specific considerations, as well as market depth, and generally utilize analysis from a third-party liquidity metrics service.
The Liquidity Rule places a 15% limit on a fund's illiquid investments and requires funds that do not primarily hold assets that are highly liquid investments to determine and maintain a minimum percentage of the fund's net assets to be invested in highly liquid investments (highly liquid investment minimum or HLIM). The Program includes provisions reasonably designed to comply with the 15% limit on illiquid investments and for determining, periodically reviewing and complying with the HLIM requirement as applicable.
At a recent meeting of the Fund's Board of Trustees, the LRM Committee provided a written report to the Board pertaining to the operation, adequacy, and effectiveness of the Program for the period December 1, 2022 through November 30, 2023. The report concluded that the Program is operating effectively and is reasonably designed to assess and manage the Fund's liquidity risk.
1.538515.126
SCS-SANN-0624
Fidelity® Capital Appreciation Fund
Semi-Annual Report
April 30, 2024
Contents
To view a fund's proxy voting guidelines and proxy voting record for the 12-month period ended June 30, visit http://www.fidelity.com/proxyvotingresults or visit the Securities and Exchange Commission's (SEC) web site at http://www.sec.gov.
You may also call 1-800-544-8544 if you're an individual investing directly with Fidelity, call 1-800-835-5092 if you're a plan sponsor or participant with Fidelity as your recordkeeper or call 1-877-208-0098 on institutional accounts or if you're an advisor or invest through one to request a free copy of the proxy voting guidelines.
Standard & Poor's, S&P and S&P 500 are registered service marks of The McGraw-Hill Companies, Inc. and have been licensed for use by Fidelity Distributors Corporation.
Other third-party marks appearing herein are the property of their respective owners.
All other marks appearing herein are registered or unregistered trademarks or service marks of FMR LLC or an affiliated company. © 2024 FMR LLC. All rights reserved.
This report and the financial statements contained herein are submitted for the general information of the shareholders of the Fund. This report is not authorized for distribution to prospective investors in the Fund unless preceded or accompanied by an effective prospectus.
A fund files its complete schedule of portfolio holdings with the SEC for the first and third quarters of each fiscal year on Form N-PORT. Forms N-PORT are available on the SEC's web site at http://www.sec.gov. A fund's Forms N-PORT may be reviewed and copied at the SEC's Public Reference Room in Washington, DC. Information regarding the operation of the SEC's Public Reference Room may be obtained by calling 1-800-SEC-0330.
For a complete list of a fund's portfolio holdings, view the most recent holdings listing, semiannual report, or annual report on Fidelity's web site at http://www.fidelity.com, http://www.institutional.fidelity.com, or http://www.401k.com, as applicable.
NOT FDIC INSURED •MAY LOSE VALUE •NO BANK GUARANTEE
Neither the Fund nor Fidelity Distributors Corporation is a bank.
Top Holdings (% of Fund's net assets) |
| |
| Microsoft Corp. | 9.6 | |
| NVIDIA Corp. | 6.0 | |
| Amazon.com, Inc. | 3.7 | |
| Uber Technologies, Inc. | 3.0 | |
| Boston Scientific Corp. | 3.0 | |
| MasterCard, Inc. Class A | 2.6 | |
| Ingersoll Rand, Inc. | 2.1 | |
| Apple, Inc. | 1.9 | |
| Alphabet, Inc. Class A | 1.9 | |
| Alphabet, Inc. Class C | 1.8 | |
| | 35.6 | |
| |
| Market Sectors (% of Fund's net assets) |
| |
| Information Technology | 30.3 | |
| Industrials | 16.4 | |
| Health Care | 15.3 | |
| Financials | 11.4 | |
| Consumer Discretionary | 10.8 | |
| Communication Services | 9.4 | |
| Energy | 3.7 | |
| Consumer Staples | 1.5 | |
| Materials | 1.4 | |
| |
Asset Allocation (% of Fund's net assets) |
|
Short-Term Investments and Net Other Assets (Liabilities) - (0.2)% |
|
Geographic Diversification (% of Fund's net assets) |
|
* Includes Short-Term investments and Net Other Assets (Liabilities). Percentages are adjusted for the effect of derivatives, if applicable. |
| |
Showing Percentage of Net Assets
| Common Stocks - 99.9% |
| | | Shares | Value ($) (000s) |
| COMMUNICATION SERVICES - 9.4% | | | |
| Entertainment - 4.6% | | | |
| Live Nation Entertainment, Inc. (a) | | 270,700 | 24,068 |
| Netflix, Inc. (a) | | 199,500 | 109,853 |
| Universal Music Group NV | | 3,487,251 | 103,088 |
| Warner Music Group Corp. Class A | | 1,692,600 | 55,856 |
| | | | 292,865 |
| Interactive Media & Services - 4.8% | | | |
| Alphabet, Inc.: | | | |
| Class A | | 737,340 | 120,024 |
| Class C | | 674,820 | 111,102 |
| Epic Games, Inc. (a)(b)(c) | | 4,584 | 2,750 |
| Meta Platforms, Inc. Class A | | 160,700 | 69,128 |
| | | | 303,004 |
TOTAL COMMUNICATION SERVICES | | | 595,869 |
| CONSUMER DISCRETIONARY - 10.8% | | | |
| Automobiles - 0.3% | | | |
| BYD Co. Ltd. (H Shares) | | 762,000 | 20,888 |
| Broadline Retail - 5.4% | | | |
| Amazon.com, Inc. (a) | | 1,348,960 | 236,068 |
| Dollarama, Inc. | | 291,500 | 24,317 |
| MercadoLibre, Inc. (a) | | 37,300 | 54,410 |
| PDD Holdings, Inc. ADR (a) | | 122,600 | 15,347 |
| Savers Value Village, Inc. (d) | | 495,100 | 8,179 |
| | | | 338,321 |
| Diversified Consumer Services - 0.3% | | | |
| Service Corp. International | | 240,600 | 17,253 |
| Hotels, Restaurants & Leisure - 2.5% | | | |
| Airbnb, Inc. Class A (a) | | 472,700 | 74,956 |
| Domino's Pizza, Inc. | | 75,200 | 39,801 |
| Flutter Entertainment PLC (a) | | 160,400 | 29,914 |
| Kura Sushi U.S.A., Inc. Class A (a)(d) | | 96,500 | 10,623 |
| | | | 155,294 |
| Household Durables - 0.0% | | | |
| TopBuild Corp. (a) | | 8,400 | 3,399 |
| Specialty Retail - 1.2% | | | |
| TJX Companies, Inc. | | 789,800 | 74,312 |
| Textiles, Apparel & Luxury Goods - 1.1% | | | |
| LVMH Moet Hennessy Louis Vuitton SE | | 23,738 | 19,608 |
| LVMH Moet Hennessy Louis Vuitton SE | | 40,704 | 33,436 |
| Samsonite International SA (e) | | 5,644,800 | 19,845 |
| | | | 72,889 |
TOTAL CONSUMER DISCRETIONARY | | | 682,356 |
| CONSUMER STAPLES - 1.5% | | | |
| Beverages - 0.8% | | | |
| Monster Beverage Corp. (a) | | 962,876 | 51,466 |
| Personal Care Products - 0.7% | | | |
| Kenvue, Inc. | | 2,078,300 | 39,114 |
| Puig Group SL Class B | | 118,900 | 3,109 |
| | | | 42,223 |
TOTAL CONSUMER STAPLES | | | 93,689 |
| ENERGY - 3.7% | | | |
| Energy Equipment & Services - 0.6% | | | |
| Schlumberger Ltd. | | 739,100 | 35,092 |
| Oil, Gas & Consumable Fuels - 3.1% | | | |
| Antero Resources Corp. (a) | | 586,900 | 19,960 |
| Canadian Natural Resources Ltd. | | 1,099,900 | 83,394 |
| Cheniere Energy, Inc. | | 342,800 | 54,101 |
| Marathon Petroleum Corp. | | 55,600 | 10,104 |
| Range Resources Corp. | | 795,200 | 28,556 |
| | | | 196,115 |
TOTAL ENERGY | | | 231,207 |
| FINANCIALS - 11.4% | | | |
| Banks - 0.6% | | | |
| JPMorgan Chase & Co. | | 199,200 | 38,195 |
| Capital Markets - 2.0% | | | |
| Ares Management Corp. | | 104,100 | 13,855 |
| LPL Financial | | 25,500 | 6,863 |
| Moody's Corp. | | 129,400 | 47,921 |
| Morgan Stanley | | 628,500 | 57,093 |
| MSCI, Inc. | | 6,100 | 2,841 |
| | | | 128,573 |
| Consumer Finance - 0.7% | | | |
| Capital One Financial Corp. | | 309,800 | 44,435 |
| Financial Services - 5.9% | | | |
| Apollo Global Management, Inc. | | 59,800 | 6,481 |
| Corebridge Financial, Inc. (d) | | 703,400 | 18,682 |
| Fiserv, Inc. (a) | | 315,600 | 48,183 |
| Global Payments, Inc. | | 323,100 | 39,667 |
| MasterCard, Inc. Class A | | 364,500 | 164,462 |
| Rocket Companies, Inc. (a)(d) | | 1,244,600 | 15,284 |
| Visa, Inc. Class A | | 284,700 | 76,473 |
| | | | 369,232 |
| Insurance - 2.2% | | | |
| Arthur J. Gallagher & Co. | | 275,441 | 64,643 |
| Marsh & McLennan Companies, Inc. | | 267,300 | 53,308 |
| The Baldwin Insurance Group, Inc. (a) | | 698,800 | 18,616 |
| | | | 136,567 |
TOTAL FINANCIALS | | | 717,002 |
| HEALTH CARE - 15.3% | | | |
| Biotechnology - 4.8% | | | |
| AbbVie, Inc. | | 624,100 | 101,504 |
| Adamas Pharmaceuticals, Inc.: | | | |
| rights (a)(c) | | 1,379,600 | 304 |
| rights (a)(c) | | 1,379,600 | 97 |
| Alnylam Pharmaceuticals, Inc. (a) | | 197,100 | 28,373 |
| Arcellx, Inc. (a) | | 63,800 | 3,191 |
| Arrowhead Pharmaceuticals, Inc. (a) | | 163,811 | 3,705 |
| Beam Therapeutics, Inc. (a) | | 82,900 | 1,759 |
| Blueprint Medicines Corp. (a) | | 31,800 | 2,905 |
| Cytokinetics, Inc. (a) | | 117,300 | 7,193 |
| Exact Sciences Corp. (a) | | 493,500 | 29,289 |
| Galapagos NV sponsored ADR (a)(d) | | 354,700 | 10,091 |
| Gamida Cell Ltd. (a)(d) | | 2,169,053 | 35 |
| Gamida Cell Ltd. warrants 4/21/28 (a) | | 317,400 | 0 |
| Hookipa Pharma, Inc. (a) | | 916,200 | 813 |
| Immunocore Holdings PLC ADR (a) | | 158,900 | 9,388 |
| Insmed, Inc. (a) | | 352,300 | 8,709 |
| Krystal Biotech, Inc. (a) | | 19,100 | 2,925 |
| Legend Biotech Corp. ADR (a) | | 157,900 | 6,907 |
| Regeneron Pharmaceuticals, Inc. (a) | | 59,522 | 53,014 |
| Repligen Corp. (a) | | 127,400 | 20,919 |
| Sarepta Therapeutics, Inc. (a) | | 42,900 | 5,434 |
| Seres Therapeutics, Inc. (a) | | 330,500 | 327 |
| Synlogic, Inc. (a) | | 61,286 | 112 |
| Vor Biopharma, Inc. (a) | | 610,405 | 1,050 |
| XOMA Corp. (a)(d) | | 296,000 | 7,501 |
| | | | 305,545 |
| Health Care Equipment & Supplies - 4.9% | | | |
| Align Technology, Inc. (a) | | 84,700 | 23,918 |
| Baxter International, Inc. | | 859,500 | 34,698 |
| Boston Scientific Corp. (a) | | 2,592,600 | 186,330 |
| Hologic, Inc. (a) | | 163,700 | 12,404 |
| Inspire Medical Systems, Inc. (a) | | 50,200 | 12,131 |
| Lantheus Holdings, Inc. (a) | | 40,200 | 2,675 |
| Masimo Corp. (a) | | 184,170 | 24,754 |
| Penumbra, Inc. (a) | | 74,461 | 14,629 |
| | | | 311,539 |
| Health Care Providers & Services - 1.0% | | | |
| HealthEquity, Inc. (a) | | 756,100 | 59,664 |
| Health Care Technology - 0.1% | | | |
| Evolent Health, Inc. Class A (a) | | 252,894 | 7,015 |
| Life Sciences Tools & Services - 3.8% | | | |
| Agilent Technologies, Inc. | | 130,500 | 17,884 |
| Bio-Techne Corp. | | 217,800 | 13,767 |
| Bruker Corp. | | 441,248 | 34,422 |
| Chemometec A/S | | 87,800 | 3,756 |
| Codexis, Inc. (a) | | 970,508 | 2,824 |
| Danaher Corp. | | 239,139 | 58,976 |
| Sartorius Stedim Biotech | | 87,376 | 18,929 |
| Thermo Fisher Scientific, Inc. | | 155,500 | 88,436 |
| | | | 238,994 |
| Pharmaceuticals - 0.7% | | | |
| Aclaris Therapeutics, Inc. (a) | | 218,000 | 264 |
| Chugai Pharmaceutical Co. Ltd. | | 303,100 | 9,640 |
| Teva Pharmaceutical Industries Ltd. sponsored ADR (a) | | 2,446,100 | 34,368 |
| | | | 44,272 |
TOTAL HEALTH CARE | | | 967,029 |
| INDUSTRIALS - 16.4% | | | |
| Aerospace & Defense - 1.5% | | | |
| General Electric Co. | | 591,900 | 95,781 |
| Loar Holdings, Inc. (d) | | 6,400 | 335 |
| | | | 96,116 |
| Commercial Services & Supplies - 0.7% | | | |
| Montrose Environmental Group, Inc. (a) | | 55,700 | 2,418 |
| Republic Services, Inc. | | 210,600 | 40,372 |
| | | | 42,790 |
| Electrical Equipment - 1.8% | | | |
| Eaton Corp. PLC | | 224,800 | 71,545 |
| GE Vernova LLC | | 183,525 | 28,210 |
| HD Hyundai Electric Co. Ltd. | | 75,510 | 13,284 |
| | | | 113,039 |
| Ground Transportation - 3.0% | | | |
| Uber Technologies, Inc. (a) | | 2,922,900 | 193,701 |
| Machinery - 4.0% | | | |
| Chart Industries, Inc. (a) | | 50,100 | 7,217 |
| Energy Recovery, Inc. (a) | | 240,200 | 3,579 |
| Ingersoll Rand, Inc. | | 1,382,545 | 129,019 |
| Parker Hannifin Corp. | | 106,200 | 57,869 |
| Westinghouse Air Brake Tech Co. | | 330,400 | 53,221 |
| | | | 250,905 |
| Passenger Airlines - 0.6% | | | |
| Ryanair Holdings PLC sponsored ADR | | 273,600 | 37,264 |
| Professional Services - 3.7% | | | |
| Equifax, Inc. | | 356,500 | 78,498 |
| KBR, Inc. | | 1,347,000 | 87,474 |
| RELX PLC sponsored ADR (d) | | 650,700 | 26,802 |
| TransUnion | | 339,700 | 24,798 |
| UL Solutions, Inc. Class A | | 442,600 | 15,535 |
| | | | 233,107 |
| Trading Companies & Distributors - 1.1% | | | |
| Ferguson PLC | | 326,600 | 69,214 |
TOTAL INDUSTRIALS | | | 1,036,136 |
| INFORMATION TECHNOLOGY - 30.1% | | | |
| Electronic Equipment, Instruments & Components - 1.4% | | | |
| Flex Ltd. (a) | | 1,785,597 | 51,157 |
| Jabil, Inc. | | 331,100 | 38,858 |
| | | | 90,015 |
| IT Services - 1.2% | | | |
| Gartner, Inc. (a) | | 64,700 | 26,695 |
| MongoDB, Inc. Class A (a) | | 139,219 | 50,840 |
| | | | 77,535 |
| Semiconductors & Semiconductor Equipment - 13.1% | | | |
| Allegro MicroSystems LLC (a) | | 823,657 | 24,454 |
| Analog Devices, Inc. | | 197,000 | 39,520 |
| ASML Holding NV (depository receipt) | | 87,999 | 76,776 |
| Astera Labs, Inc. | | 12,000 | 1,017 |
| BE Semiconductor Industries NV | | 353,500 | 47,346 |
| Marvell Technology, Inc. | | 246,000 | 16,214 |
| Micron Technology, Inc. | | 609,500 | 68,849 |
| NVIDIA Corp. | | 437,936 | 378,385 |
| NXP Semiconductors NV | | 195,600 | 50,111 |
| SiTime Corp. (a) | | 219,500 | 19,562 |
| Taiwan Semiconductor Manufacturing Co. Ltd. sponsored ADR | | 509,200 | 69,934 |
| Universal Display Corp. | | 200,528 | 31,679 |
| | | | 823,847 |
| Software - 12.5% | | | |
| ASAPP, Inc. warrants 8/28/28 (a)(b)(c) | | 1,620,156 | 3,289 |
| Autodesk, Inc. (a) | | 30,100 | 6,407 |
| DocuSign, Inc. (a) | | 333,300 | 18,865 |
| HubSpot, Inc. (a) | | 52,300 | 31,635 |
| Intuit, Inc. | | 77,100 | 48,235 |
| Manhattan Associates, Inc. (a) | | 169,548 | 34,937 |
| Microsoft Corp. | | 1,559,410 | 607,123 |
| NICE Ltd. sponsored ADR (a) | | 147,500 | 32,968 |
| Volue A/S (a) | | 1,407,500 | 3,643 |
| | | | 787,102 |
| Technology Hardware, Storage & Peripherals - 1.9% | | | |
| Apple, Inc. | | 706,408 | 120,322 |
TOTAL INFORMATION TECHNOLOGY | | | 1,898,821 |
| MATERIALS - 1.3% | | | |
| Chemicals - 1.2% | | | |
| Aspen Aerogels, Inc. (a) | | 519,300 | 8,132 |
| Linde PLC | | 114,700 | 50,578 |
| Sherwin-Williams Co. | | 53,900 | 16,149 |
| | | | 74,859 |
| Construction Materials - 0.1% | | | |
| Eagle Materials, Inc. | | 29,400 | 7,371 |
TOTAL MATERIALS | | | 82,230 |
| TOTAL COMMON STOCKS (Cost $4,135,419) | | | 6,304,339 |
| | | | |
| Convertible Preferred Stocks - 0.3% |
| | | Shares | Value ($) (000s) |
| CONSUMER DISCRETIONARY - 0.0% | | | |
| Textiles, Apparel & Luxury Goods - 0.0% | | | |
| Canva, Inc.: | | | |
| Series A (b)(c) | | 677 | 722 |
| Series A2 (b)(c) | | 123 | 131 |
| | | | 853 |
| FINANCIALS - 0.0% | | | |
| Financial Services - 0.0% | | | |
| Akeana Series C (b)(c) | | 41,000 | 520 |
| HEALTH CARE - 0.0% | | | |
| Biotechnology - 0.0% | | | |
| ElevateBio LLC Series C (a)(b)(c) | | 153,900 | 500 |
| INFORMATION TECHNOLOGY - 0.2% | | | |
| Software - 0.2% | | | |
| ASAPP, Inc.: | | | |
| Series C (a)(b)(c) | | 513,013 | 1,329 |
| Series D (b)(c) | | 2,823,822 | 7,031 |
| | | | 8,360 |
| MATERIALS - 0.1% | | | |
| Metals & Mining - 0.1% | | | |
| Illuminated Holdings, Inc.: | | | |
| Series C2 (a)(b)(c) | | 110,923 | 1,892 |
| Series C3 (a)(b)(c) | | 138,654 | 2,365 |
| Series C4 (a)(b)(c) | | 37,518 | 640 |
| Series C5 (a)(b)(c) | | 75,216 | 1,283 |
| | | | 6,180 |
| TOTAL CONVERTIBLE PREFERRED STOCKS (Cost $27,843) | | | 16,413 |
| | | | |
| Convertible Bonds - 0.0% |
| | | Principal Amount (f) (000s) | Value ($) (000s) |
| MATERIALS - 0.0% | | | |
| Metals & Mining - 0.0% | | | |
Illuminated Holdings, Inc. 0% (b)(c)(g) (Cost $1,334) | | 1,334 | 1,385 |
| | | | |
| Preferred Securities - 0.0% |
| | | Principal Amount (f) (000s) | Value ($) (000s) |
| MATERIALS - 0.0% | | | |
| Metals & Mining - 0.0% | | | |
Illuminated Holdings, Inc. 0% (b)(c)(g) (Cost $1,724) | | 1,724 | 1,787 |
| | | | |
| Money Market Funds - 1.0% |
| | | Shares | Value ($) (000s) |
| Fidelity Cash Central Fund 5.39% (h) | | 7,462,486 | 7,464 |
| Fidelity Securities Lending Cash Central Fund 5.39% (h)(i) | | 51,132,794 | 51,138 |
| TOTAL MONEY MARKET FUNDS (Cost $58,602) | | | 58,602 |
| | | | |
| TOTAL INVESTMENT IN SECURITIES - 101.2% (Cost $4,224,922) | 6,382,526 |
NET OTHER ASSETS (LIABILITIES) - (1.2)% | (73,488) |
| NET ASSETS - 100.0% | 6,309,038 |
| | |
Any values shown as $0 in the Schedule of Investments may reflect amounts less than $500.
Legend
| (b) | Restricted securities (including private placements) - Investment in securities not registered under the Securities Act of 1933 (excluding 144A issues). At the end of the period, the value of restricted securities (excluding 144A issues) amounted to $25,624,000 or 0.4% of net assets. |
| (d) | Security or a portion of the security is on loan at period end. |
| (e) | Security exempt from registration under Rule 144A of the Securities Act of 1933. These securities may be resold in transactions exempt from registration, normally to qualified institutional buyers. At the end of the period, the value of these securities amounted to $19,845,000 or 0.3% of net assets. |
| (f) | Amount is stated in United States dollars unless otherwise noted. |
| (g) | Security is perpetual in nature with no stated maturity date. |
| (h) | Affiliated fund that is generally available only to investment companies and other accounts managed by Fidelity Investments. The rate quoted is the annualized seven-day yield of the fund at period end. A complete unaudited listing of the fund's holdings as of its most recent quarter end is available upon request. In addition, each Fidelity Central Fund's financial statements are available on the SEC's website or upon request. |
| (i) | Investment made with cash collateral received from securities on loan. |
| Additional information on each restricted holding is as follows: |
| Security | Acquisition Date | Acquisition Cost ($) (000s) |
| Akeana Series C | 1/23/24 | 523 |
| | | |
| ASAPP, Inc. warrants 8/28/28 | 8/29/23 | 0 |
| | | |
| ASAPP, Inc. Series C | 4/30/21 | 3,384 |
| | | |
| ASAPP, Inc. Series D | 8/29/23 | 10,904 |
| | | |
| Canva, Inc. Series A | 9/22/23 | 722 |
| | | |
| Canva, Inc. Series A2 | 9/22/23 | 131 |
| | | |
| ElevateBio LLC Series C | 3/09/21 | 646 |
| | | |
| Epic Games, Inc. | 3/29/21 | 4,057 |
| | | |
| Illuminated Holdings, Inc. Series C2 | 7/07/20 | 2,773 |
| | | |
| Illuminated Holdings, Inc. Series C3 | 7/07/20 | 4,160 |
| | | |
| Illuminated Holdings, Inc. Series C4 | 1/08/21 | 1,351 |
| | | |
| Illuminated Holdings, Inc. Series C5 | 6/16/21 | 3,249 |
| | | |
| Illuminated Holdings, Inc. 0% | 6/14/23 | 1,334 |
| | | |
| Illuminated Holdings, Inc. 0% | 9/27/23 | 1,724 |
| | | |
Affiliated Central Funds
Fiscal year to date information regarding the Fund's investments in Fidelity Central Funds, including the ownership percentage, is presented below.
| Affiliate (Amounts in thousands) | Value, beginning of period ($) | Purchases ($) | Sales Proceeds ($) | Dividend Income ($) | Realized Gain (loss) ($) | Change in Unrealized appreciation (depreciation) ($) | Value, end of period ($) | % ownership, end of period |
| Fidelity Cash Central Fund 5.39% | 6,669 | 388,460 | 387,665 | 622 | - | - | 7,464 | 0.0% |
| Fidelity Securities Lending Cash Central Fund 5.39% | 56,263 | 227,705 | 232,830 | 104 | - | - | 51,138 | 0.2% |
| Total | 62,932 | 616,165 | 620,495 | 726 | - | - | 58,602 | |
| | | | | | | | | |
Amounts in the dividend income column in the above table include any capital gain distributions from underlying funds, which are presented in the corresponding line item in the Statement of Operations, if applicable.
Amounts in the dividend income column for Fidelity Securities Lending Cash Central Fund represents the income earned on investing cash collateral, less rebates paid to borrowers and any lending agent fees associated with the loan, plus any premium payments received for lending certain types of securities.
Amounts included in the purchases and sales proceeds columns may include in-kind transactions, if applicable.
Investment Valuation
The following is a summary of the inputs used, as of April 30, 2024, involving the Fund's assets and liabilities carried at fair value. The inputs or methodology used for valuing securities may not be an indication of the risk associated with investing in those securities. For more information on valuation inputs, and their aggregation into the levels used below, please refer to the Investment Valuation section in the accompanying Notes to Financial Statements.
| Valuation Inputs at Reporting Date: |
Description (Amounts in thousands) | Total ($) | Level 1 ($) | Level 2 ($) | Level 3 ($) |
Investments in Securities: | | | | |
|
| Equities: | | | | |
Communication Services | 595,869 | 593,119 | - | 2,750 |
Consumer Discretionary | 683,209 | 608,187 | 74,169 | 853 |
Consumer Staples | 93,689 | 90,580 | 3,109 | - |
Energy | 231,207 | 231,207 | - | - |
Financials | 717,522 | 717,002 | - | 520 |
Health Care | 967,529 | 956,988 | 9,640 | 901 |
Industrials | 1,036,136 | 1,022,852 | 13,284 | - |
Information Technology | 1,907,181 | 1,895,532 | - | 11,649 |
Materials | 88,410 | 82,230 | - | 6,180 |
|
| Corporate Bonds | 1,385 | - | - | 1,385 |
|
| Preferred Securities | 1,787 | - | - | 1,787 |
|
| Money Market Funds | 58,602 | 58,602 | - | - |
| Total Investments in Securities: | 6,382,526 | 6,256,299 | 100,202 | 26,025 |
| Statement of Assets and Liabilities |
| Amounts in thousands (except per-share amounts) | | | | April 30, 2024 (Unaudited) |
| | | | | |
| Assets | | | | |
| Investment in securities, at value (including securities loaned of $48,904) - See accompanying schedule: | | | | |
Unaffiliated issuers (cost $4,166,320) | $ | 6,323,924 | | |
Fidelity Central Funds (cost $58,602) | | 58,602 | | |
| | | | | |
| | | | | |
| Total Investment in Securities (cost $4,224,922) | | | $ | 6,382,526 |
| Receivable for investments sold | | | | 3,138 |
| Receivable for fund shares sold | | | | 826 |
| Dividends receivable | | | | 3,625 |
| Distributions receivable from Fidelity Central Funds | | | | 103 |
| Prepaid expenses | | | | 2 |
| Other receivables | | | | 27 |
Total assets | | | | 6,390,247 |
| Liabilities | | | | |
| Payable for investments purchased | $ | 23,889 | | |
| Payable for fund shares redeemed | | 2,848 | | |
| Accrued management fee | | 3,222 | | |
| Other payables and accrued expenses | | 101 | | |
| Collateral on securities loaned | | 51,149 | | |
| Total liabilities | | | | 81,209 |
| Net Assets | | | $ | 6,309,038 |
| Net Assets consist of: | | | | |
| Paid in capital | | | $ | 3,762,689 |
| Total accumulated earnings (loss) | | | | 2,546,349 |
| Net Assets | | | $ | 6,309,038 |
| | | | | |
| Net Asset Value and Maximum Offering Price | | | | |
| Capital Appreciation : | | | | |
Net Asset Value, offering price and redemption price per share ($6,031,812 ÷ 139,546 shares) | | | $ | 43.22 |
| Class K : | | | | |
Net Asset Value, offering price and redemption price per share ($277,226 ÷ 6,387 shares)(a) | | | $ | 43.41 |
(a)Corresponding Net Asset Value does not calculate due to rounding of fractional net assets and/or shares. |
| Statement of Operations |
| Amounts in thousands | | | | Six months ended April 30, 2024 (Unaudited) |
| Investment Income | | | | |
| Dividends | | | $ | 24,743 |
| Income from Fidelity Central Funds (including $104 from security lending) | | | | 726 |
| Total income | | | | 25,469 |
| Expenses | | | | |
| Management fee | | | | |
| Basic fee | $ | 17,078 | | |
| Performance adjustment | | (2,977) | | |
| Transfer agent fees | | 2,251 | | |
| Accounting fees | | 342 | | |
| Custodian fees and expenses | | 40 | | |
| Independent trustees' fees and expenses | | 15 | | |
| Registration fees | | 39 | | |
| Audit | | 29 | | |
| Legal | | 9 | | |
| Interest | | 76 | | |
| Miscellaneous | | 10 | | |
| Total expenses before reductions | | 16,912 | | |
| Expense reductions | | (269) | | |
| Total expenses after reductions | | | | 16,643 |
| Net Investment income (loss) | | | | 8,826 |
| Realized and Unrealized Gain (Loss) | | | | |
| Net realized gain (loss) on: | | | | |
| Investment Securities: | | | | |
| Unaffiliated issuers | | 386,963 | | |
| Foreign currency transactions | | 33 | | |
| Total net realized gain (loss) | | | | 386,996 |
| Change in net unrealized appreciation (depreciation) on: | | | | |
| Investment Securities: | | | | |
| Unaffiliated issuers | | 963,640 | | |
| Assets and liabilities in foreign currencies | | (7) | | |
| Total change in net unrealized appreciation (depreciation) | | | | 963,633 |
| Net gain (loss) | | | | 1,350,629 |
| Net increase (decrease) in net assets resulting from operations | | | $ | 1,359,455 |
| Statement of Changes in Net Assets |
| |
| Amount in thousands | | Six months ended April 30, 2024 (Unaudited) | | Year ended October 31, 2023 |
| Increase (Decrease) in Net Assets | | | | |
| Operations | | | | |
| Net investment income (loss) | $ | 8,826 | $ | 20,926 |
| Net realized gain (loss) | | 386,996 | | 188,716 |
| Change in net unrealized appreciation (depreciation) | | 963,633 | | 345,619 |
| Net increase (decrease) in net assets resulting from operations | | 1,359,455 | | 555,261 |
| Distributions to shareholders | | (191,673) | | (434,233) |
| | | | | |
| Share transactions - net increase (decrease) | | (15,881) | | (99,223) |
| Total increase (decrease) in net assets | | 1,151,901 | | 21,805 |
| | | | | |
| Net Assets | | | | |
| Beginning of period | | 5,157,137 | | 5,135,332 |
| End of period | $ | 6,309,038 | $ | 5,157,137 |
| | | | | |
| | | | | |
Financial Highlights
Fidelity® Capital Appreciation Fund |
| |
| | Six months ended (Unaudited) April 30, 2024 | | Years ended October 31, 2023 | | 2022 | | 2021 | | 2020 | | 2019 |
Selected Per-Share Data | | | | | | | | | | | | |
| Net asset value, beginning of period | $ | 35.32 | $ | 34.71 | $ | 51.06 | $ | 39.58 | $ | 36.16 | $ | 36.33 |
| Income from Investment Operations | | | | | | | | | | | | |
Net investment income (loss) A,B | | .06 | | .14 | | .23 C | | (.01) | | .04 | | .24 |
| Net realized and unrealized gain (loss) | | 9.16 | | 3.44 | | (9.18) | | 14.99 | | 7.95 | | 3.53 |
| Total from investment operations | | 9.22 | | 3.58 | | (8.95) | | 14.98 | | 7.99 | | 3.77 |
| Distributions from net investment income | | (.15) | | (.14) | | (.17) | | (.01) | | (.24) | | (.27) |
| Distributions from net realized gain | | (1.18) | | (2.84) | | (7.23) | | (3.49) | | (4.34) | | (3.67) |
| Total distributions | | (1.32) D | | (2.97) D | | (7.40) | | (3.50) | | (4.57) D | | (3.94) |
| Net asset value, end of period | $ | 43.22 | $ | 35.32 | $ | 34.71 | $ | 51.06 | $ | 39.58 | $ | 36.16 |
Total Return E,F | | | | 11.03% | | (20.14)% | | 40.02% | | 24.73% | | 12.24% |
Ratios to Average Net Assets B,G,H | | | | | | | | | | | | |
| Expenses before reductions | | .56% I | | .65% | | .83% | | .84% | | .82% | | .62% |
| Expenses net of fee waivers, if any | | | | .64% | | .82% | | .84% | | .82% | | .62% |
| Expenses net of all reductions | | .55% I | | .64% | | .82% | | .84% | | .82% | | .61% |
| Net investment income (loss) | | .29% I | | .39% | | .59% C | | (.02)% | | .12% | | .69% |
| Supplemental Data | | | | | | | | | | | | |
| Net assets, end of period (in millions) | $ | 6,032 | $ | 4,921 | $ | 4,809 | $ | 6,549 | $ | 5,023 | $ | 4,668 |
Portfolio turnover rate J | | | | 49% | | 69% | | 51% | | 61% K | | 122% |
ACalculated based on average shares outstanding during the period.
BNet investment income (loss) is affected by the timing of the declaration of dividends by any underlying mutual funds or exchange-traded funds (ETFs). Net investment income (loss) of any mutual funds or ETFs is not included in the Fund's net investment income (loss) ratio.
CNet investment income per share reflects one or more large, non-recurring dividend(s) which amounted to $.15 per share. Excluding such non-recurring dividend(s), the ratio of net investment income (loss) to average net assets would have been .21%.
DTotal distributions per share do not sum due to rounding.
ETotal returns for periods of less than one year are not annualized.
FTotal returns would have been lower if certain expenses had not been reduced during the applicable periods shown.
GFees and expenses of any underlying mutual funds or exchange-traded funds (ETFs) are not included in the Fund's expense ratio. The Fund indirectly bears its proportionate share of these expenses. For additional expense information related to investments in Fidelity Central Funds, please refer to the "Investments in Fidelity Central Funds" note found in the Notes to Financial Statements section of the most recent Annual or Semi-Annual report.
HExpense ratios reflect operating expenses of the class. Expenses before reductions do not reflect amounts reimbursed, waived, or reduced through arrangements with the investment adviser, brokerage services, or other offset arrangements, if applicable, and do not represent the amount paid by the class during periods when reimbursements, waivers or reductions occur.
IAnnualized.
JAmount does not include the portfolio activity of any underlying mutual funds or exchange-traded funds (ETFs).
KPortfolio turnover rate excludes securities received or delivered in-kind.
Fidelity® Capital Appreciation Fund Class K |
| |
| | Six months ended (Unaudited) April 30, 2024 | | Years ended October 31, 2023 | | 2022 | | 2021 | | 2020 | | 2019 |
Selected Per-Share Data | | | | | | | | | | | | |
| Net asset value, beginning of period | $ | 35.48 | $ | 34.85 | $ | 51.24 | $ | 39.70 | $ | 36.25 | $ | 36.42 |
| Income from Investment Operations | | | | | | | | | | | | |
Net investment income (loss) A,B | | .08 | | .16 | | .26 C | | .02 | | .07 | | .27 |
| Net realized and unrealized gain (loss) | | 9.20 | | 3.47 | | (9.21) | | 15.04 | | 7.98 | | 3.54 |
| Total from investment operations | | 9.28 | | 3.63 | | (8.95) | | 15.06 | | 8.05 | | 3.81 |
| Distributions from net investment income | | (.17) | | (.16) | | (.21) | | (.03) | | (.26) | | (.31) |
| Distributions from net realized gain | | (1.18) | | (2.84) | | (7.23) | | (3.49) | | (4.34) | | (3.67) |
| Total distributions | | (1.35) | | (3.00) | | (7.44) | | (3.52) | | (4.60) | | (3.98) |
| Net asset value, end of period | $ | 43.41 | $ | 35.48 | $ | 34.85 | $ | 51.24 | $ | 39.70 | $ | 36.25 |
Total Return D,E | | | | 11.13% | | (20.08)% | | 40.12% | | 24.85% | | 12.33% |
Ratios to Average Net Assets B,F,G | | | | | | | | | | | | |
| Expenses before reductions | | .48% H | | .57% | | .75% | | .76% | | .74% | | .52% |
| Expenses net of fee waivers, if any | | | | .56% | | .75% | | .76% | | .74% | | .52% |
| Expenses net of all reductions | | .47% H | | .56% | | .75% | | .76% | | .73% | | .52% |
| Net investment income (loss) | | .36% H | | .47% | | .67% C | | .05% | | .21% | | .79% |
| Supplemental Data | | | | | | | | | | | | |
| Net assets, end of period (in millions) | $ | 277 | $ | 237 | $ | 326 | $ | 543 | $ | 500 | $ | 864 |
Portfolio turnover rate I | | | | 49% | | 69% | | 51% | | 61% J | | 122% |
ACalculated based on average shares outstanding during the period.
BNet investment income (loss) is affected by the timing of the declaration of dividends by any underlying mutual funds or exchange-traded funds (ETFs). Net investment income (loss) of any mutual funds or ETFs is not included in the Fund's net investment income (loss) ratio.
CNet investment income per share reflects one or more large, non-recurring dividend(s) which amounted to $.15 per share. Excluding such non-recurring dividend(s), the ratio of net investment income (loss) to average net assets would have been .29%.
DTotal returns for periods of less than one year are not annualized.
ETotal returns would have been lower if certain expenses had not been reduced during the applicable periods shown.
FFees and expenses of any underlying mutual funds or exchange-traded funds (ETFs) are not included in the Fund's expense ratio. The Fund indirectly bears its proportionate share of these expenses. For additional expense information related to investments in Fidelity Central Funds, please refer to the "Investments in Fidelity Central Funds" note found in the Notes to Financial Statements section of the most recent Annual or Semi-Annual report.
GExpense ratios reflect operating expenses of the class. Expenses before reductions do not reflect amounts reimbursed, waived, or reduced through arrangements with the investment adviser, brokerage services, or other offset arrangements, if applicable, and do not represent the amount paid by the class during periods when reimbursements, waivers or reductions occur.
HAnnualized.
IAmount does not include the portfolio activity of any underlying mutual funds or exchange-traded funds (ETFs).
JPortfolio turnover rate excludes securities received or delivered in-kind.
For the period ended April 30, 2024
(Amounts in thousands except percentages)
1. Organization.
Fidelity Capital Appreciation Fund (the Fund) is a fund of Fidelity Capital Trust (the Trust) and is authorized to issue an unlimited number of shares. The Trust is registered under the Investment Company Act of 1940, as amended (the 1940 Act), as an open-end management investment company organized as a Massachusetts business trust. The Fund offers Capital Appreciation and Class K shares, each of which has equal rights as to assets and voting privileges.
2. Investments in Fidelity Central Funds.
Funds may invest in Fidelity Central Funds, which are open-end investment companies generally available only to other investment companies and accounts managed by the investment adviser and its affiliates. The Schedule of Investments lists any Fidelity Central Funds held as an investment as of period end, but does not include the underlying holdings of each Fidelity Central Fund. An investing fund indirectly bears its proportionate share of the expenses of the underlying Fidelity Central Funds.
Based on its investment objective, each Fidelity Central Fund may invest or participate in various investment vehicles or strategies that are similar to those of the investing fund. These strategies are consistent with the investment objectives of the investing fund and may involve certain economic risks which may cause a decline in value of each of the Fidelity Central Funds and thus a decline in the value of the investing fund.
| Fidelity Central Fund | Investment Manager | Investment Objective | Investment Practices | Expense RatioA |
| Fidelity Money Market Central Funds | Fidelity Management & Research Company LLC (FMR) | Each fund seeks to obtain a high level of current income consistent with the preservation of capital and liquidity. | Short-term Investments | Less than .005% |
A Expenses expressed as a percentage of average net assets and are as of each underlying Central Fund's most recent annual or semi-annual shareholder report.
A complete unaudited list of holdings for each Fidelity Central Fund is available upon request or at the Securities and Exchange Commission website at www.sec.gov. In addition, the financial statements of the Fidelity Central Funds which contain the significant accounting policies (including investment valuation policies) of those funds, and are not covered by the Report of Independent Registered Public Accounting Firm, are available on the Securities and Exchange Commission website or upon request.
3. Significant Accounting Policies.
The Fund is an investment company and applies the accounting and reporting guidance of the Financial Accounting Standards Board (FASB) Accounting Standards Codification Topic 946 Financial Services - Investment Companies. The financial statements have been prepared in conformity with accounting principles generally accepted in the United States of America (GAAP), which require management to make certain estimates and assumptions at the date of the financial statements. Actual results could differ from those estimates. Subsequent events, if any, through the date that the financial statements were issued have been evaluated in the preparation of the financial statements. The Fund's Schedule of Investments lists any underlying mutual funds or ETFs but does not include the underlying holdings of these funds. The following summarizes the significant accounting policies of the Fund:
Investment Valuation. Investments are valued as of 4:00 p.m. Eastern time on the last calendar day of the period. The Board of Trustees (the Board) has designated the Fund's investment adviser as the valuation designee responsible for the fair valuation function and performing fair value determinations as needed. The investment adviser has established a Fair Value Committee (the Committee) to carry out the day-to-day fair valuation responsibilities and has adopted policies and procedures to govern the fair valuation process and the activities of the Committee. In accordance with these fair valuation policies and procedures, which have been approved by the Board, the Fund attempts to obtain prices from one or more third party pricing services or brokers to value its investments. When current market prices, quotations or currency exchange rates are not readily available or reliable, investments will be fair valued in good faith by the Committee, in accordance with the policies and procedures. Factors used in determining fair value vary by investment type and may include market or investment specific events, transaction data, estimated cash flows, and market observations of comparable investments. The frequency that the fair valuation procedures are used cannot be predicted and they may be utilized to a significant extent. The Committee manages the Fund's fair valuation practices and maintains the fair valuation policies and procedures. The Fund's investment adviser reports to the Board information regarding the fair valuation process and related material matters.
The Fund categorizes the inputs to valuation techniques used to value its investments into a disclosure hierarchy consisting of three levels as shown below:
Level 1 - unadjusted quoted prices in active markets for identical investments
Level 2 - other significant observable inputs (including quoted prices for similar investments, interest rates, prepayment speeds, etc.)
Level 3 - unobservable inputs (including the Fund's own assumptions based on the best information available)
Valuation techniques used to value the Fund's investments by major category are as follows:
Equity securities, including restricted securities, for which market quotations are readily available, are valued at the last reported sale price or official closing price as reported by a third party pricing service on the primary market or exchange on which they are traded and are categorized as Level 1 in the hierarchy. In the event there were no sales during the day or closing prices are not available, securities are valued at the last quoted bid price or may be valued using the last available price and are generally categorized as Level 2 in the hierarchy. For foreign equity securities, when market or security specific events arise, comparisons to the valuation of American Depositary Receipts (ADRs), futures contracts, ETFs and certain indexes as well as quoted prices for similar securities may be used and would be categorized as Level 2 in the hierarchy. For equity securities, including restricted securities, where observable inputs are limited, assumptions about market activity and risk are used and these securities may be categorized as Level 3 in the hierarchy.
Investments in open-end mutual funds, including the Fidelity Central Funds, are valued at their closing net asset value (NAV) each business day and are categorized as Level 1 in the hierarchy.
Changes in valuation techniques may result in transfers in or out of an assigned level within the disclosure hierarchy. The aggregate value of investments by input level as of April 30, 2024 is included at the end of the Fund's Schedule of Investments.
Foreign Currency. Certain Funds may use foreign currency contracts to facilitate transactions in foreign-denominated securities. Gains and losses from these transactions may arise from changes in the value of the foreign currency or if the counterparties do not perform under the contracts' terms.
Foreign-denominated assets, including investment securities, and liabilities are translated into U.S. dollars at the exchange rates at period end. Purchases and sales of investment securities, income and dividends received, and expenses denominated in foreign currencies are translated into U.S. dollars at the exchange rate in effect on the transaction date.
The effects of exchange rate fluctuations on investments are included with the net realized and unrealized gain (loss) on investment securities. Other foreign currency transactions resulting in realized and unrealized gain (loss) are disclosed separately.
Investment Transactions and Income. For financial reporting purposes, the Fund's investment holdings and NAV include trades executed through the end of the last business day of the period. The NAV per share for processing shareholder transactions is calculated as of the close of business of the New York Stock Exchange (NYSE), normally 4:00 p.m. Eastern time and includes trades executed through the end of the prior business day. Gains and losses on securities sold are determined on the basis of identified cost and include proceeds received from litigation. Commissions paid to certain brokers with whom the investment adviser, or its affiliates, places trades on behalf of a fund include an amount in addition to trade execution, which may be rebated back to a fund. Any such rebates are included in net realized gain (loss) on investments in the Statement of Operations. Dividend income is recorded on the ex-dividend date, except for certain dividends from foreign securities where the ex-dividend date may have passed, which are recorded as soon as the Fund is informed of the ex-dividend date. Non-cash dividends included in dividend income, if any, are recorded at the fair market value of the securities received. Income and capital gain distributions from Fidelity Central Funds, if any, are recorded on the ex-dividend date. Certain distributions received by the Fund represent a return of capital or capital gain. The Fund determines the components of these distributions subsequent to the ex-dividend date, based upon receipt of tax filings or other correspondence relating to the underlying investment. These distributions are recorded as a reduction of cost of investments and/or as a realized gain. Investment income is recorded net of foreign taxes withheld where recovery of such taxes is uncertain. Funds may file withholding tax reclaims in certain jurisdictions to recover a portion of amounts previously withheld. Any withholding tax reclaims income is included in the Statement of Operations in dividends. Any receivables for withholding tax reclaims are included in the Statement of Assets and Liabilities in dividends receivable.
Class Allocations and Expenses. Investment income, realized and unrealized capital gains and losses, common expenses of a fund, and certain fund-level expense reductions, if any, are allocated daily on a pro-rata basis to each class based on the relative net assets of each class to the total net assets of a fund. Each class differs with respect to transfer agent and distribution and service plan fees incurred, as applicable. Certain expense reductions may also differ by class, if applicable. For the reporting period, the allocated portion of income and expenses to each class as a percent of its average net assets may vary due to the timing of recording these transactions in relation to fluctuating net assets of the classes. Expenses directly attributable to a fund are charged to that fund. Expenses attributable to more than one fund are allocated among the respective funds on the basis of relative net assets or other appropriate methods. Expenses included in the accompanying financial statements reflect the expenses of that fund and do not include any expenses associated with any underlying mutual funds or exchange-traded funds (ETFs). Although not included in a fund's expenses, a fund indirectly bears its proportionate share of these expenses through the net asset value of each underlying mutual fund or exchange-traded fund (ETF). Expense estimates are accrued in the period to which they relate and adjustments are made when actual amounts are known.
Deferred Trustee Compensation. Under a Deferred Compensation Plan (the Plan) for certain Funds, certain independent Trustees have elected to defer receipt of a portion of their annual compensation. Deferred amounts are invested in affiliated mutual funds, are marked-to-market and remain in a fund until distributed in accordance with the Plan. The investment of deferred amounts and the offsetting payable to the Trustees presented below are included in the accompanying Statement of Assets and Liabilities in other receivables and other payables and accrued expenses, as applicable.
| Fidelity Capital Appreciation Fund | $27 |
Income Tax Information and Distributions to Shareholders. Each year, the Fund intends to qualify as a regulated investment company under Subchapter M of the Internal Revenue Code, including distributing substantially all of its taxable income and realized gains. As a result, no provision for U.S. Federal income taxes is required. The Fund files a U.S. federal tax return, in addition to state and local tax returns as required. The Fund's federal income tax returns are subject to examination by the Internal Revenue Service (IRS) for a period of three fiscal years after they are filed. State and local tax returns may be subject to examination for an additional fiscal year depending on the jurisdiction. Foreign taxes are provided for based on the Fund's understanding of the tax rules and rates that exist in the foreign markets in which it invests.
Distributions are declared and recorded on the ex-dividend date. Income and capital gain distributions are declared separately for each class. Income and capital gain distributions are determined in accordance with income tax regulations, which may differ from GAAP.
Capital accounts within the financial statements are adjusted for permanent book-tax differences. These adjustments have no impact on net assets or the results of operations. Capital accounts are not adjusted for temporary book-tax differences which will reverse in a subsequent period.
Book-tax differences are primarily due to foreign currency transactions, contingent interest, partnerships and losses deferred due to wash sales.
As of period end, the cost and unrealized appreciation (depreciation) in securities, and derivatives if applicable, for federal income tax purposes were as follows:
| Gross unrealized appreciation | $2,302,813 |
| Gross unrealized depreciation | (145,650) |
| Net unrealized appreciation (depreciation) | $2,157,163 |
| Tax cost | $4,225,363 |
Restricted Securities (including Private Placements). Funds may invest in securities that are subject to legal or contractual restrictions on resale. These securities generally may be resold in transactions exempt from registration or to the public if the securities are registered. Disposal of these securities may involve time-consuming negotiations and expense, and prompt sale at an acceptable price may be difficult. Information regarding restricted securities held at period end is included at the end of the Schedule of Investments, if applicable.
4. Purchases and Sales of Investments.
Purchases and sales of securities, other than short-term securities and in-kind transactions, as applicable, are noted in the table below.
| | Purchases ($) | Sales ($) |
| Fidelity Capital Appreciation Fund | 1,181,571 | 1,365,212 |
5. Fees and Other Transactions with Affiliates.
Management Fee. Fidelity Management & Research Company LLC (the investment adviser) and its affiliates provide the Fund with investment management related services for which the Fund pays a monthly management fee.
Effective March 1, 2024, the Fund's management contract was amended to incorporate administrative services previously covered under separate services agreements (Transfer Agent and Accounting agreements). The amended contract incorporates a basic fee rate that may vary by class (subject to a performance adjustment). The investment adviser or an affiliate pays certain expenses of managing and operating the Fund out of each class's management fee. Each class of the Fund pays a management fee to the investment adviser. The management fee is calculated and paid to the investment adviser every month. The management fee is determined by calculating a basic fee and then applying a performance adjustment. When determining a class's basic fee, a mandate rate is calculated based on the monthly average net assets of a group of funds advised by FMR within a designated asset class. A discount rate is subtracted from the mandate rate once the Fund's monthly average net assets reach a certain level. The mandate rate and discount rate may vary by class. The annual basic fee rate for a class of shares of the Fund is the lesser of (1) the class's mandate rate reduced by the class's discount rate (if applicable) or (2) the amount set forth in the following table.
| | Maximum Management Fee Rate % |
| Capital Appreciation | .63 |
| Class K | .55 |
One-twelfth of the basic fee rate for a class is applied to the average net assets of the class for the month, giving a dollar amount which is the basic fee for the class for that month. A different management fee rate may be applicable to each class of the Fund. The difference between classes is the result of separate arrangements for class-level services and/or waivers of certain expenses. It is not the result of any difference in advisory or custodial fees or other expenses related to the management of the Fund's assets, which do not vary by class. For the portion of the reporting period on or after March 1, 2024, the total annualized management fee rates were as follows:
| | Total Management Fee Rate % |
| Capital Appreciation | .63 |
| Class K | .55 |
Prior to March 1, 2024, the management fee was the sum of an individual fund fee rate that was based on an annual rate of .30% of the Fund's average net assets and an annualized group fee rate that averaged .22% during the period. The group fee rate was based upon the monthly average net assets of a group of registered investment companies with which the investment adviser has management contracts. The group fee rate decreased as assets under management increased and increased as assets under management decreased. For the portion of the reporting period prior to March 1, 2024, the total annualized management fee rate was .52%.
The performance adjustment rate is calculated monthly by comparing over the performance period the Fund's performance to that of the performance adjustment index listed below.
| | Performance Adjustment Index |
| Fidelity Capital Appreciation Fund | S&P 500 Index |
For the purposes of calculating the performance adjustment for the Fund, the Fund's investment performance is based on the performance of Capital Appreciation. To the extent that other classes of the Fund have higher expenses, this could result in those classes bearing a larger positive performance adjustment and smaller negative performance adjustment than would be the case if each class's own performance were considered. The performance period is the most recent 36 month period. The maximum annualized performance adjustment rate is ±.20% of the Fund's average net assets over the performance period. The performance adjustment rate is divided by twelve and multiplied by the Fund's average net assets over the performance period, and the resulting dollar amount is proportionately added to or subtracted from a class's basic fee. For the entire reporting period, the total annualized performance adjustment was (.10) %.
Effective March 1, 2024, the Fund's sub-advisory agreements with FMR Investment Management (UK) Limited, Fidelity Management & Research (Hong Kong) Limited, and Fidelity Management & Research (Japan) Limited were amended to provide that the investment adviser pays each sub-adviser monthly fees equal to 110% of the sub-adviser's costs for providing sub-advisory services.
Transfer Agent Fees. Fidelity Investments Institutional Operations Company LLC (FIIOC), an affiliate of the investment adviser, is the transfer, dividend disbursing and shareholder servicing agent for each class of the Fund. Effective March 1, 2024, the Fund's management contract was amended to incorporate transfer agent services and associated fees previously covered under a separate services agreement. FIIOC pays for typesetting, printing and mailing of shareholder reports, except proxy statements.
During November 2023, the Board approved a change in the transfer agent fees effective December 1, 2023 to a fixed annual rate of class-level average net assets as follows:
| | % of Class-Level Average Net Assets |
| Capital Appreciation | .1186 |
Prior to December 1, 2023, FIIOC received account fees and asset-based fees that varied according to the account size and type of account of the shareholders of the respective classes of the Fund, except for Class K. FIIOC received an asset-based fee of Class K's average net assets. For the portion of the reporting period prior to March 1, 2024, the fees were equivalent to the following annualized rates:
| | Amount ($) | % of Class-Level Average Net AssetsA |
| Capital Appreciation | 2,213 | .12 |
| Class K | 38 | .04 |
| | 2,251 | |
A Annualized
Accounting Fees. Fidelity Service Company, Inc. (FSC), an affiliate of the investment adviser, maintains the Fund's accounting records. Effective March 1, 2024, the Fund's management contract was amended to incorporate accounting services and associated fees previously covered under a separate services agreement.
During November 2023, the Board approved a change in the accounting fees effective December 1, 2023 to a fixed annual rate of average net assets as follows:
| | % of Average Net Assets |
| Fidelity Capital Appreciation Fund | .0173 |
Prior to December 1, 2023, the accounting fee was based on the level of average net assets for each month. For the portion of the reporting period prior to March 1, 2024, the fees were equivalent to the following annualized rates:
| | % of Average Net Assets |
| Fidelity Capital Appreciation Fund | .02 |
Brokerage Commissions. A portion of portfolio transactions were placed with brokerage firms which are affiliates of the investment adviser. Brokerage commissions are included in net realized gain (loss) and change in net unrealized appreciation (depreciation) in the Statement of Operations. The commissions paid to these affiliated firms were as follows:
| | Amount ($) |
| Fidelity Capital Appreciation Fund | 11 |
Interfund Lending Program. Pursuant to an Exemptive Order issued by the Securities and Exchange Commission (the SEC), the Fund, along with other registered investment companies having management contracts with Fidelity Management & Research Company LLC (FMR), or other affiliated entities of FMR, may participate in an interfund lending program. This program provides an alternative credit facility allowing the Fund to borrow from, or lend money to, other participating affiliated funds. At period end, there were no interfund loans outstanding. Activity in this program during the period for which loans were outstanding was as follows:
| | Borrower or Lender | Average Loan Balance ($) | Weighted Average Interest Rate | Interest Expense ($) |
| Fidelity Capital Appreciation Fund | Borrower | 8,952 | 5.57% | 76 |
Interfund Trades. Funds may purchase from or sell securities to other Fidelity Funds under procedures adopted by the Board. The procedures have been designed to ensure these interfund trades are executed in accordance with Rule 17a-7 of the 1940 Act. Any interfund trades are included within the respective purchases and sales amounts shown in the Purchases and Sales of Investments note. Interfund trades during the period are noted in the table below.
| | Purchases ($) | Sales ($) | Realized Gain (Loss)($) |
| Fidelity Capital Appreciation Fund | 51,931 | 58,105 | 12,612 |
6. Committed Line of Credit.
Certain Funds participate with other funds managed by the investment adviser or an affiliate in a $4.25 billion credit facility (the "line of credit") to be utilized for temporary or emergency purposes to fund shareholder redemptions or for other short-term liquidity purposes. The participating funds have agreed to pay commitment fees on their pro-rata portion of the line of credit, which are reflected in Miscellaneous expenses on the Statement of Operations, and are listed below. During the period, there were no borrowings on this line of credit.
| | Amount ($) |
| Fidelity Capital Appreciation Fund | 5 |
7. Security Lending.
Funds lend portfolio securities from time to time in order to earn additional income. Lending agents are used, including National Financial Services (NFS), an affiliate of the investment adviser. Pursuant to a securities lending agreement, NFS will receive a fee, which is capped at 9.9% of a fund's daily lending revenue, for its services as lending agent. A fund may lend securities to certain qualified borrowers, including NFS. On the settlement date of the loan, a fund receives collateral (in the form of U.S. Treasury obligations, letters of credit and/or cash) against the loaned securities and maintains collateral in an amount not less than 100% of the market value of the loaned securities during the period of the loan. The market value of the loaned securities is determined at the close of business of a fund and any additional required collateral is delivered to a fund on the next business day. A fund or borrower may terminate the loan at any time, and if the borrower defaults on its obligation to return the securities loaned because of insolvency or other reasons, a fund may apply collateral received from the borrower against the obligation. A fund may experience delays and costs in recovering the securities loaned. Any cash collateral received is invested in the Fidelity Securities Lending Cash Central Fund. Any loaned securities are identified as such in the Schedule of Investments, and the value of loaned securities and cash collateral at period end, as applicable, are presented in the Statement of Assets and Liabilities. Security lending income represents the income earned on investing cash collateral, less rebates paid to borrowers and any lending agent fees associated with the loan, plus any premium payments received for lending certain types of securities. Security lending income is presented in the Statement of Operations as a component of income from Fidelity Central Funds. Affiliated security lending activity, if any, was as follows:
| | Total Security Lending Fees Paid to NFS ($) | Security Lending Income From Securities Loaned to NFS ($) | Value of Securities Loaned to NFS at Period End ($) |
| Fidelity Capital Appreciation Fund | 11 | 3 | - |
8. Expense Reductions.
During the period the investment adviser or an affiliate reimbursed and/or waived a portion of fund-level operating expenses in the amount of $269.
10. Distributions to Shareholders.
Distributions to shareholders of each class were as follows:
| | Six months ended April 30, 2024 | Year ended October 31, 2023 |
| Fidelity Capital Appreciation Fund | | |
| Distributions to shareholders | | |
| Capital Appreciation | $182,758 | $406,264 |
| Class K | 8,915 | 27,969 |
Total | $191,673 | $434,233 |
11. Share Transactions.
Share transactions for each class were as follows and may contain in-kind transactions, automatic conversions between classes or exchanges between affiliated funds:
| | Shares | Shares | Dollars | Dollars |
| | Six months ended April 30, 2024 | Year ended October 31, 2023 | Six months ended April 30, 2024 | Year ended October 31, 2023 |
| Fidelity Capital Appreciation Fund | | | | |
| Capital Appreciation | | | | |
| Shares sold | 3,129 | 4,890 | $131,125 | $170,292 |
| Reinvestment of distributions | 4,518 | 11,738 | 171,761 | 382,791 |
| Shares redeemed | (7,410) | (15,889) | (306,130) | (556,464) |
| Net increase (decrease) | 237 | 739 | $(3,244) | $(3,381) |
| Class K | | | | |
| Shares sold | 505 | 895 | $21,266 | $31,370 |
| Reinvestment of distributions | 234 | 855 | 8,915 | 27,969 |
| Shares redeemed | (1,021) | (4,438) | (42,818) | (155,181) |
| Net increase (decrease) | (282) | (2,688) | $(12,637) | $(95,842) |
12. Other.
A fund's organizational documents provide former and current trustees and officers with a limited indemnification against liabilities arising in connection with the performance of their duties to the fund. In the normal course of business, a fund may also enter into contracts that provide general indemnifications. A fund's maximum exposure under these arrangements is unknown as this would be dependent on future claims that may be made against a fund. The risk of material loss from such claims is considered remote.
13. Risk and Uncertainties.
Many factors affect a fund's performance. Developments that disrupt global economies and financial markets, such as pandemics, epidemics, outbreaks of infectious diseases, war, terrorism, and environmental disasters, may significantly affect a fund's investment performance. The effects of these developments to a fund will be impacted by the types of securities in which a fund invests, the financial condition, industry, economic sector, and geographic location of an issuer, and a fund's level of investment in the securities of that issuer. Significant concentrations in security types, issuers, industries, sectors, and geographic locations may magnify the factors that affect a fund's performance.
As a shareholder, you incur two types of costs: (1) transaction costs, which may include sales charges (loads) on purchase payments or redemption proceeds, as applicable and (2) ongoing costs, which generally include management fees, distribution and/or service (12b-1) fees and other Fund expenses. This Example is intended to help you understand your ongoing costs (in dollars) of investing in a fund and to compare these costs with the ongoing costs of investing in other mutual funds.
| The Example is based on an investment of $1,000 invested at the beginning of the period and held for the entire period (November 1, 2023 to April 30, 2024). |
Actual Expenses
The first line of the accompanying table provides information about actual account values and actual expenses. You may use the information in this line, together with the amount you invested, to estimate the expenses that you paid over the period. Simply divide your account value by $1,000.00 (for example, an $8,600 account value divided by $1,000.00 = 8.6), then multiply the result by the number in the first line for a class/Fund under the heading entitled "Expenses Paid During Period" to estimate the expenses you paid on your account during this period. If any fund is a shareholder of any underlying mutual funds or exchange-traded funds (ETFs) (the Underlying Funds), such fund indirectly bears its proportional share of the expenses of the Underlying Funds in addition to the direct expenses incurred presented in the table. These fees and expenses are not included in the annualized expense ratio used to calculate the expense estimate in the table below.
Hypothetical Example for Comparison Purposes
The second line of the accompanying table provides information about hypothetical account values and hypothetical expenses based on the actual expense ratio and an assumed rate of return of 5% per year before expenses, which is not the actual return. The hypothetical account values and expenses may not be used to estimate the actual ending account balance or expenses you paid for the period. You may use this information to compare the ongoing costs of investing in the Fund and other funds. To do so, compare this 5% hypothetical example with the 5% hypothetical examples that appear in the shareholder reports of the other funds. If any fund is a shareholder of any Underlying Funds, such fund indirectly bears its proportional share of the expenses of the Underlying Funds in addition to the direct expenses as presented in the table. These fees and expenses are not included in the annualized expense ratio used to calculate the expense estimate in the table below.
Please note that the expenses shown in the table are meant to highlight your ongoing costs only and do not reflect any transaction costs. Therefore, the second line of the table is useful in comparing ongoing costs only, and will not help you determine the relative total costs of owning different funds. In addition, if these transactional costs were included, your costs would have been higher.
| | | | | Annualized Expense Ratio- A | | Beginning Account Value November 1, 2023 | | Ending Account Value April 30, 2024 | | Expenses Paid During Period- C November 1, 2023 to April 30, 2024 |
| Fidelity® Capital Appreciation Fund | | | | | | | | | | |
| Fidelity® Capital Appreciation Fund | | | | .55% | | | | | | |
| Actual | | | | | | $ 1,000 | | $ 1,266.20 | | $ 3.10 |
Hypothetical-B | | | | | | $ 1,000 | | $ 1,022.13 | | $ 2.77 |
| Class K | | | | .47% | | | | | | |
| Actual | | | | | | $ 1,000 | | $ 1,266.80 | | $ 2.65 |
Hypothetical-B | | | | | | $ 1,000 | | $ 1,022.53 | | $ 2.36 |
| |
A Annualized expense ratio reflects expenses net of applicable fee waivers.
B 5% return per year before expenses
C Expenses are equal to the annualized expense ratio, multiplied by the average account value over the period, multiplied by 182/ 366 (to reflect the one-half year period). The fees and expenses of any Underlying Funds are not included in each annualized expense ratio.
Board Approval of Investment Advisory Contracts
Fidelity Capital Appreciation Fund
At its January 2024 meeting, the Board of Trustees, including the Independent Trustees (together, the Board), approved an amended and restated management contract with Fidelity Management & Research Company LLC (FMR) (the Management Contract), and amended and restated sub-advisory agreements (the Sub-Advisory Contracts, and together with the Management Contract, the Advisory Contracts) for the fund, including the fund's sub-advisory agreements with FMR Investment Management (UK) Limited (FMR UK), Fidelity Management & Research (Hong Kong) Limited (FMR H.K.), and Fidelity Management & Research (Japan) Limited (FMR Japan). The Advisory Contracts will be effective March 1, 2024. The Board will consider the annual renewal of the fund's Advisory Contracts in May 2024, following its review of additional materials provided by FMR.
Management Contract. The Board approved the Management Contract, which implements a new fee structure combining the management fee, transfer agent fee (TA Fee), and pricing and bookkeeping fee (P&B Fee) of the fund and each class into a single class-level fee based on tiered schedules and subject to a maximum class-level rate (the Unified Fee). In exchange for the Unified Fee, the fund will receive investment advisory, management, administrative, transfer agent, pricing and bookkeeping services under a single agreement - the Management Contract.
In its consideration of the Management Contract over several meetings, the Board received, reviewed and discussed a comprehensive set of analyses regarding the Unified Fee including (i) the legal framework, (ii) design goals for the Unified Fee, (iii) calculation methodology for the Unified Fee and illustrative examples, (iv) annual and cumulative projected impacts under various scenarios, both in the aggregate and at the fund/class level, (v) explanations of schedules, rate levers and maximum rates and (vi) shareholder benefits and projected savings.
The Board considered that the maximum Unified Fee for each class of the fund would be no higher than the sum of (i) the lowest contractual management fee rate under the fund's existing management contract, which is the individual fund fee rate, if any, plus the lowest contractual marginal group fee rate and (ii) the TA and P&B Fee rates, which are fixed fee rates since December 1, 2023 (together, the Unified Fee Cap). The Board noted that Fidelity has represented that, as a result of this Unified Fee Cap, the Unified Fee would be no greater than the fee rates previously authorized to be charged to the fund for the same services. The Board noted that certain expenses such as performance adjustments, third-party expenses, and certain other miscellaneous expenses would be outside the scope of the Unified Fee and the calculation of such fees would not change as a result of the Unified Fee. The Board considered that, under the Management Contract, a different management fee rate will be applicable to each class of the fund. The Board noted that Fidelity has represented that the difference in expenses between classes is based on differences in class-specific expenses and not due to any difference in advisory or third-party custodial fees or other expenses related to the management of the fund's assets.
The Board considered Fidelity's representations that implementation of the Unified Fee, which includes the Unified Fee Cap, would cause all funds subject to the Unified Fee, including the fund, to experience an immediate reduction on contractual fee rates for services provided under the current management contracts. The Board considered that some funds would not experience lower net total fees as a result of existing fee caps. The Board further considered that, in addition to the contractual fee savings, the Unified Fee offers funds and their shareholders greater protection from future rate increases for services previously offered under separate agreements that are now covered by the Management Contract because such rate increases would require shareholder approval.
Sub-Advisory Contracts. In connection with the Unified Fee changes, the Board considered the Sub-Advisory Contracts, which simplified the calculation of the fees paid by FMR to the sub-advisers under the agreements. The Board noted that the agreements with FMR UK, FMR H.K., and FMR Japan were amended to provide that FMR will compensate each sub-adviser at a fee rate equal to 110% of the sub-adviser's costs incurred in providing services under the agreement. The Board considered that, under the Sub-Advisory Contracts, FMR, and not the fund, will continue to pay the sub-advisory fees to each applicable sub-adviser.
The Board further considered that the approval of the fund's Advisory Contracts will not result in any changes in the investment process or strategies employed in the management of the fund's assets or the day-to-day management of the fund or the persons primarily responsible for such management. Further, the Board considered that the Management Contract would not change the obligations and services of FMR and its affiliates on behalf of the fund, and, in particular, there would be no change in the nature and level of advisory, management, administration, transfer agent, and pricing and bookkeeping services provided to the fund by FMR, its affiliates, and each applicable sub-adviser.
In connection with its consideration of future renewals of the fund's Advisory Contracts, the Board will consider: (i) the nature, extent and quality of services provided to the funds, including shareholder and administrative services and investment performance; (ii) the competitiveness of the management fee and total expenses for the fund; (iii) the costs of the services and profitability, including the revenues earned and the expenses incurred in conducting the business of developing, marketing, distributing, managing, administering, and servicing the fund and its shareholders, to the extent applicable; and (iv) whether there have been economies of scale in respect of the Fidelity funds, whether the Fidelity funds (including the fund) have appropriately benefited from any such economies of scale, and whether there is the potential for realization of any further economies.
Based on its evaluation of all of the conclusions and representations noted above, and after considering all factors it believed relevant, the Board concluded that the fund's management fee structure is fair and reasonable, and that the fund's Advisory Contracts should be approved.
The Securities and Exchange Commission adopted Rule 22e-4 under the Investment Company Act of 1940 (the Liquidity Rule) to promote effective liquidity risk management throughout the open-end investment company industry, thereby reducing the risk that funds will be unable to meet their redemption obligations and mitigating dilution of the interests of fund shareholders.
The Fund has adopted and implemented a liquidity risk management program (the Program) reasonably designed to assess and manage the Fund's liquidity risk and to comply with the requirements of the Liquidity Rule. The Fund's Board of Trustees (the Board) has designated the Fund's investment adviser as administrator of the Program. The Fidelity advisers have established a Liquidity Risk Management Committee (the LRM Committee) to manage the Program for each of the Fidelity Funds. The LRM Committee monitors the adequacy and effectiveness of implementation of the Program and on a periodic basis assesses each Fund's liquidity risk based on a variety of factors including (1) the Fund's investment strategy, (2) portfolio liquidity and cash flow projections during normal and reasonably foreseeable stressed conditions, (3) shareholder redemptions, (4) borrowings and other funding sources and (5) certain factors specific to ETFs including the effect of the Fund's prices and spreads, market participants, and basket compositions on the overall liquidity of the Fund's portfolio, as applicable.
In accordance with the Program, each of the Fund's portfolio investments is classified into one of four defined liquidity categories based on a determination of a reasonable expectation for how long it would take to convert the investment to cash (or sell or dispose of the investment) without significantly changing its market value.
- Highly liquid investments - cash or convertible to cash within three business days or less
- Moderately liquid investments - convertible to cash in three to seven calendar days
- Less liquid investments - can be sold or disposed of, but not settled, within seven calendar days
- Illiquid investments - cannot be sold or disposed of within seven calendar days
Liquidity classification determinations take into account a variety of factors including various market, trading and investment-specific considerations, as well as market depth, and generally utilize analysis from a third-party liquidity metrics service.
The Liquidity Rule places a 15% limit on a fund's illiquid investments and requires funds that do not primarily hold assets that are highly liquid investments to determine and maintain a minimum percentage of the fund's net assets to be invested in highly liquid investments (highly liquid investment minimum or HLIM). The Program includes provisions reasonably designed to comply with the 15% limit on illiquid investments and for determining, periodically reviewing and complying with the HLIM requirement as applicable.
At a recent meeting of the Fund's Board of Trustees, the LRM Committee provided a written report to the Board pertaining to the operation, adequacy, and effectiveness of the Program for the period December 1, 2022 through November 30, 2023. The report concluded that the Program is operating effectively and is reasonably designed to assess and manage the Fund's liquidity risk.
1.703454.126
CAF-SANN-0624
Fidelity® Focused Stock Fund
Semi-Annual Report
April 30, 2024
Contents
To view a fund's proxy voting guidelines and proxy voting record for the 12-month period ended June 30, visit http://www.fidelity.com/proxyvotingresults or visit the Securities and Exchange Commission's (SEC) web site at http://www.sec.gov.
You may also call 1-800-544-8544 to request a free copy of the proxy voting guidelines.
Standard & Poor's, S&P and S&P 500 are registered service marks of The McGraw-Hill Companies, Inc. and have been licensed for use by Fidelity Distributors Corporation.
Other third-party marks appearing herein are the property of their respective owners.
All other marks appearing herein are registered or unregistered trademarks or service marks of FMR LLC or an affiliated company. © 2024 FMR LLC. All rights reserved.
This report and the financial statements contained herein are submitted for the general information of the shareholders of the Fund. This report is not authorized for distribution to prospective investors in the Fund unless preceded or accompanied by an effective prospectus.
A fund files its complete schedule of portfolio holdings with the SEC for the first and third quarters of each fiscal year on Form N-PORT. Forms N-PORT are available on the SEC's web site at http://www.sec.gov. A fund's Forms N-PORT may be reviewed and copied at the SEC's Public Reference Room in Washington, DC. Information regarding the operation of the SEC's Public Reference Room may be obtained by calling 1-800-SEC-0330.
For a complete list of a fund's portfolio holdings, view the most recent holdings listing, semiannual report, or annual report on Fidelity's web site at http://www.fidelity.com, http://www.institutional.fidelity.com, or http://www.401k.com, as applicable.
NOT FDIC INSURED •MAY LOSE VALUE •NO BANK GUARANTEE
Neither the Fund nor Fidelity Distributors Corporation is a bank.
Top Holdings (% of Fund's net assets) |
| |
| NVIDIA Corp. | 9.2 | |
| Microsoft Corp. | 7.3 | |
| Meta Platforms, Inc. Class A | 6.3 | |
| Eaton Corp. PLC | 5.7 | |
| Amazon.com, Inc. | 5.4 | |
| Eli Lilly & Co. | 5.2 | |
| Fiserv, Inc. | 5.0 | |
| Alphabet, Inc. Class A | 4.1 | |
| Vertiv Holdings Co. | 3.8 | |
| Broadcom, Inc. | 3.5 | |
| | 55.5 | |
| |
| Market Sectors (% of Fund's net assets) |
| |
| Information Technology | 26.9 | |
| Industrials | 20.6 | |
| Communication Services | 10.9 | |
| Health Care | 10.7 | |
| Consumer Discretionary | 10.6 | |
| Financials | 9.5 | |
| Energy | 4.9 | |
| Utilities | 3.4 | |
| Consumer Staples | 0.4 | |
| |
Asset Allocation (% of Fund's net assets) |
|
|
Showing Percentage of Net Assets
| Common Stocks - 97.9% |
| | | Shares | Value ($) |
| COMMUNICATION SERVICES - 10.9% | | | |
| Entertainment - 0.5% | | | |
| The Walt Disney Co. | | 167,000 | 18,553,700 |
| Interactive Media & Services - 10.4% | | | |
| Alphabet, Inc. Class A | | 891,000 | 145,036,980 |
| Meta Platforms, Inc. Class A | | 516,000 | 221,967,720 |
| | | | 367,004,700 |
TOTAL COMMUNICATION SERVICES | | | 385,558,400 |
| CONSUMER DISCRETIONARY - 10.6% | | | |
| Automobile Components - 3.4% | | | |
| Modine Manufacturing Co. (a) | | 1,280,000 | 118,566,400 |
| Broadline Retail - 5.4% | | | |
| Amazon.com, Inc. (a) | | 1,088,000 | 190,400,000 |
| Textiles, Apparel & Luxury Goods - 1.8% | | | |
| Deckers Outdoor Corp. (a) | | 78,327 | 64,108,300 |
TOTAL CONSUMER DISCRETIONARY | | | 373,074,700 |
| CONSUMER STAPLES - 0.4% | | | |
| Consumer Staples Distribution & Retail - 0.4% | | | |
| Costco Wholesale Corp. | | 18,000 | 13,012,200 |
| Personal Care Products - 0.0% | | | |
| Puig Group SL Class B | | 50,000 | 1,307,320 |
TOTAL CONSUMER STAPLES | | | 14,319,520 |
| ENERGY - 4.9% | | | |
| Oil, Gas & Consumable Fuels - 4.9% | | | |
| Antero Resources Corp. (a) | | 2,305,000 | 78,393,050 |
| PrairieSky Royalty Ltd. (b) | | 4,200,000 | 80,024,698 |
| Range Resources Corp. | | 450,000 | 16,159,500 |
| | | | 174,577,248 |
| FINANCIALS - 9.5% | | | |
| Banks - 2.0% | | | |
| KeyCorp | | 4,910,000 | 71,145,900 |
| Capital Markets - 1.9% | | | |
| Coinbase Global, Inc. (a) | | 160,000 | 32,628,800 |
| S&P Global, Inc. | | 85,294 | 35,467,804 |
| | | | 68,096,604 |
| Financial Services - 5.6% | | | |
| Block, Inc. Class A (a) | | 284,000 | 20,732,000 |
| Fiserv, Inc. (a) | | 1,146,971 | 175,108,063 |
| | | | 195,840,063 |
TOTAL FINANCIALS | | | 335,082,567 |
| HEALTH CARE - 10.7% | | | |
| Biotechnology - 1.1% | | | |
| Regeneron Pharmaceuticals, Inc. (a) | | 45,000 | 40,079,700 |
| Health Care Equipment & Supplies - 1.7% | | | |
| Boston Scientific Corp. (a) | | 825,000 | 59,292,750 |
| Pharmaceuticals - 7.9% | | | |
| Eli Lilly & Co. | | 234,000 | 182,777,400 |
| Merck & Co., Inc. | | 203,000 | 26,231,660 |
| Novo Nordisk A/S Series B sponsored ADR | | 555,000 | 71,212,050 |
| | | | 280,221,110 |
TOTAL HEALTH CARE | | | 379,593,560 |
| INDUSTRIALS - 20.6% | | | |
| Construction & Engineering - 0.0% | | | |
| Centuri Holdings, Inc. | | 17,800 | 440,550 |
| Electrical Equipment - 9.5% | | | |
| Eaton Corp. PLC | | 629,000 | 200,185,540 |
| Vertiv Holdings Co. | | 1,443,000 | 134,199,000 |
| | | | 334,384,540 |
| Ground Transportation - 2.4% | | | |
| CSX Corp. | | 1,992,000 | 66,174,240 |
| Uber Technologies, Inc. (a) | | 255,000 | 16,898,850 |
| | | | 83,073,090 |
| Machinery - 4.4% | | | |
| Ingersoll Rand, Inc. | | 424,000 | 39,567,680 |
| Parker Hannifin Corp. | | 211,000 | 114,976,010 |
| | | | 154,543,690 |
| Professional Services - 1.8% | | | |
| KBR, Inc. | | 1,004,800 | 65,251,712 |
| Trading Companies & Distributors - 2.5% | | | |
| United Rentals, Inc. | | 133,000 | 88,842,670 |
TOTAL INDUSTRIALS | | | 726,536,252 |
| INFORMATION TECHNOLOGY - 26.9% | | | |
| Electronic Equipment, Instruments & Components - 1.0% | | | |
| Jabil, Inc. | | 308,954 | 36,258,841 |
| Semiconductors & Semiconductor Equipment - 16.5% | | | |
| Astera Labs, Inc. | | 318,300 | 26,979,108 |
| Broadcom, Inc. | | 94,000 | 122,225,380 |
| Micron Technology, Inc. | | 945,000 | 106,747,200 |
| NVIDIA Corp. | | 377,000 | 325,735,539 |
| | | | 581,687,227 |
| Software - 7.3% | | | |
| Microsoft Corp. | | 663,000 | 258,125,790 |
| Technology Hardware, Storage & Peripherals - 2.1% | | | |
| Apple, Inc. | | 98,000 | 16,692,340 |
| Western Digital Corp. (a) | | 790,000 | 55,955,700 |
| | | | 72,648,040 |
TOTAL INFORMATION TECHNOLOGY | | | 948,719,898 |
| UTILITIES - 3.4% | | | |
| Electric Utilities - 3.4% | | | |
| Constellation Energy Corp. | | 654,000 | 121,604,760 |
| TOTAL COMMON STOCKS (Cost $2,046,374,062) | | | 3,459,066,905 |
| | | | |
| Money Market Funds - 0.9% |
| | | Shares | Value ($) |
| Fidelity Cash Central Fund 5.39% (c) | | 29,543,538 | 29,549,447 |
| Fidelity Securities Lending Cash Central Fund 5.39% (c)(d) | | 242,120 | 242,144 |
| TOTAL MONEY MARKET FUNDS (Cost $29,791,591) | | | 29,791,591 |
| | | | |
| TOTAL INVESTMENT IN SECURITIES - 98.8% (Cost $2,076,165,653) | 3,488,858,496 |
NET OTHER ASSETS (LIABILITIES) - 1.2% | 43,810,394 |
| NET ASSETS - 100.0% | 3,532,668,890 |
| | |
Legend
| (b) | Security or a portion of the security is on loan at period end. |
| (c) | Affiliated fund that is generally available only to investment companies and other accounts managed by Fidelity Investments. The rate quoted is the annualized seven-day yield of the fund at period end. A complete unaudited listing of the fund's holdings as of its most recent quarter end is available upon request. In addition, each Fidelity Central Fund's financial statements are available on the SEC's website or upon request. |
| (d) | Investment made with cash collateral received from securities on loan. |
Affiliated Central Funds
Fiscal year to date information regarding the Fund's investments in Fidelity Central Funds, including the ownership percentage, is presented below.
| Affiliate | Value, beginning of period ($) | Purchases ($) | Sales Proceeds ($) | Dividend Income ($) | Realized Gain (loss) ($) | Change in Unrealized appreciation (depreciation) ($) | Value, end of period ($) | % ownership, end of period |
| Fidelity Cash Central Fund 5.39% | 8,986,187 | 295,200,719 | 274,637,144 | 405,324 | (315) | - | 29,549,447 | 0.1% |
| Fidelity Securities Lending Cash Central Fund 5.39% | 4,045,434 | 29,361,798 | 33,165,088 | 6,965 | - | - | 242,144 | 0.0% |
| Total | 13,031,621 | 324,562,517 | 307,802,232 | 412,289 | (315) | - | 29,791,591 | |
| | | | | | | | | |
Amounts in the dividend income column in the above table include any capital gain distributions from underlying funds, which are presented in the corresponding line item in the Statement of Operations, if applicable.
Amounts in the dividend income column for Fidelity Securities Lending Cash Central Fund represents the income earned on investing cash collateral, less rebates paid to borrowers and any lending agent fees associated with the loan, plus any premium payments received for lending certain types of securities.
Amounts included in the purchases and sales proceeds columns may include in-kind transactions, if applicable.
Investment Valuation
The following is a summary of the inputs used, as of April 30, 2024, involving the Fund's assets and liabilities carried at fair value. The inputs or methodology used for valuing securities may not be an indication of the risk associated with investing in those securities. For more information on valuation inputs, and their aggregation into the levels used below, please refer to the Investment Valuation section in the accompanying Notes to Financial Statements.
| Valuation Inputs at Reporting Date: |
| Description | Total ($) | Level 1 ($) | Level 2 ($) | Level 3 ($) |
Investments in Securities: | | | | |
|
| Equities: | | | | |
Communication Services | 385,558,400 | 385,558,400 | - | - |
Consumer Discretionary | 373,074,700 | 373,074,700 | - | - |
Consumer Staples | 14,319,520 | 13,012,200 | 1,307,320 | - |
Energy | 174,577,248 | 174,577,248 | - | - |
Financials | 335,082,567 | 335,082,567 | - | - |
Health Care | 379,593,560 | 379,593,560 | - | - |
Industrials | 726,536,252 | 726,536,252 | - | - |
Information Technology | 948,719,898 | 948,719,898 | - | - |
Utilities | 121,604,760 | 121,604,760 | - | - |
|
| Money Market Funds | 29,791,591 | 29,791,591 | - | - |
| Total Investments in Securities: | 3,488,858,496 | 3,487,551,176 | 1,307,320 | - |
| Statement of Assets and Liabilities |
| | | | April 30, 2024 (Unaudited) |
| | | | | |
| Assets | | | | |
| Investment in securities, at value (including securities loaned of $217,653) - See accompanying schedule: | | | | |
Unaffiliated issuers (cost $2,046,374,062) | $ | 3,459,066,905 | | |
Fidelity Central Funds (cost $29,791,591) | | 29,791,591 | | |
| | | | | |
| | | | | |
| Total Investment in Securities (cost $2,076,165,653) | | | $ | 3,488,858,496 |
| Foreign currency held at value (cost $136) | | | | 136 |
| Receivable for investments sold | | | | 47,798,209 |
| Receivable for fund shares sold | | | | 8,355,093 |
| Dividends receivable | | | | 259,409 |
| Distributions receivable from Fidelity Central Funds | | | | 112,613 |
| Prepaid expenses | | | | 943 |
| Other receivables | | | | 1,518 |
Total assets | | | | 3,545,386,417 |
| Liabilities | | | | |
| Payable for investments purchased | $ | 9,438,078 | | |
| Payable for fund shares redeemed | | 833,044 | | |
| Accrued management fee | | 2,172,852 | | |
| Other payables and accrued expenses | | 34,153 | | |
| Collateral on securities loaned | | 239,400 | | |
| Total liabilities | | | | 12,717,527 |
| Net Assets | | | $ | 3,532,668,890 |
| Net Assets consist of: | | | | |
| Paid in capital | | | $ | 2,016,349,017 |
| Total accumulated earnings (loss) | | | | 1,516,319,873 |
| Net Assets | | | $ | 3,532,668,890 |
Net Asset Value, offering price and redemption price per share ($3,532,668,890 ÷ 98,426,947 shares) | | | $ | 35.89 |
| Statement of Operations |
| | | | Six months ended April 30, 2024 (Unaudited) |
| Investment Income | | | | |
| Dividends | | | $ | 10,887,284 |
| Income from Fidelity Central Funds (including $6,965 from security lending) | | | | 412,289 |
| Total income | | | | 11,299,573 |
| Expenses | | | | |
| Management fee | | | | |
| Basic fee | $ | 8,831,998 | | |
| Performance adjustment | | (867,510) | | |
| Transfer agent fees | | 1,316,018 | | |
| Accounting fees | | 254,207 | | |
| Custodian fees and expenses | | 22,022 | | |
| Independent trustees' fees and expenses | | 7,413 | | |
| Registration fees | | 31,153 | | |
| Audit | | 21,084 | | |
| Legal | | 7,072 | | |
| Miscellaneous | | 5,615 | | |
| Total expenses before reductions | | 9,629,072 | | |
| Expense reductions | | (134,208) | | |
| Total expenses after reductions | | | | 9,494,864 |
| Net Investment income (loss) | | | | 1,804,709 |
| Realized and Unrealized Gain (Loss) | | | | |
| Net realized gain (loss) on: | | | | |
| Investment Securities: | | | | |
| Unaffiliated issuers | | 153,223,782 | | |
| Fidelity Central Funds | | (315) | | |
| Foreign currency transactions | | (15,468) | | |
| Total net realized gain (loss) | | | | 153,207,999 |
| Change in net unrealized appreciation (depreciation) on: | | | | |
| Investment Securities: | | | | |
| Unaffiliated issuers | | 706,055,155 | | |
| Assets and liabilities in foreign currencies | | 866 | | |
| Total change in net unrealized appreciation (depreciation) | | | | 706,056,021 |
| Net gain (loss) | | | | 859,264,020 |
| Net increase (decrease) in net assets resulting from operations | | | $ | 861,068,729 |
| Statement of Changes in Net Assets |
| |
| | Six months ended April 30, 2024 (Unaudited) | | Year ended October 31, 2023 |
| Increase (Decrease) in Net Assets | | | | |
| Operations | | | | |
| Net investment income (loss) | $ | 1,804,709 | $ | 12,751,632 |
| Net realized gain (loss) | | 153,207,999 | | (26,495,259) |
| Change in net unrealized appreciation (depreciation) | | 706,056,021 | | 300,205,324 |
| Net increase (decrease) in net assets resulting from operations | | 861,068,729 | | 286,461,697 |
| Distributions to shareholders | | (17,621,906) | | (183,691,014) |
| | | | | |
| Share transactions | | | | |
| Proceeds from sales of shares | | 301,724,108 | | 120,824,499 |
| Reinvestment of distributions | | 16,334,638 | | 170,864,087 |
| Cost of shares redeemed | | (222,277,393) | | (375,011,087) |
| | | | | |
Net increase (decrease) in net assets resulting from share transactions | | 95,781,353 | | (83,322,501) |
| Total increase (decrease) in net assets | | 939,228,176 | | 19,448,182 |
| | | | | |
| Net Assets | | | | |
| Beginning of period | | 2,593,440,714 | | 2,573,992,532 |
| End of period | $ | 3,532,668,890 | $ | 2,593,440,714 |
| | | | | |
| Other Information | | | | |
| Shares | | | | |
| Sold | | 8,539,080 | | 4,640,288 |
| Issued in reinvestment of distributions | | 552,963 | | 7,072,189 |
| Redeemed | | (6,850,047) | | (14,407,298) |
| Net increase (decrease) | | 2,241,996 | | (2,694,821) |
| | | | | |
Financial Highlights
Fidelity® Focused Stock Fund |
| |
| | Six months ended (Unaudited) April 30, 2024 | | Years ended October 31, 2023 | | 2022 | | 2021 | | 2020 | | 2019 |
Selected Per-Share Data | | | | | | | | | | | | |
| Net asset value, beginning of period | $ | 26.96 | $ | 26.03 | $ | 39.09 | $ | 30.56 | $ | 25.42 | $ | 25.23 |
| Income from Investment Operations | | | | | | | | | | | | |
Net investment income (loss) A,B | | .02 | | .13 | | .05 | | (.10) | | .01 | | .03 |
| Net realized and unrealized gain (loss) | | 9.10 | | 2.68 | | (8.41) | | 12.18 | | 6.45 | | 3.23 |
| Total from investment operations | | 9.12 | | 2.81 | | (8.36) | | 12.08 | | 6.46 | | 3.26 |
| Distributions from net investment income | | (.19) | | (.20) | | - | | (.01) | | (.02) | | (.03) |
| Distributions from net realized gain | | - | | (1.68) | | (4.70) | | (3.54) | | (1.30) | | (3.04) |
| Total distributions | | (.19) | | (1.88) | | (4.70) | | (3.55) | | (1.32) | | (3.07) |
| Net asset value, end of period | $ | 35.89 | $ | 26.96 | $ | 26.03 | $ | 39.09 | $ | 30.56 | $ | 25.42 |
Total Return C,D | | | | 11.64% | | (24.13)% | | 42.82% | | 26.56% | | 15.05% |
Ratios to Average Net Assets B,E,F | | | | | | | | | | | | |
| Expenses before reductions | | .62% G | | .51% | | .80% | | .86% | | .88% | | .89% |
| Expenses net of fee waivers, if any | | | | .51% | | .79% | | .86% | | .88% | | .89% |
| Expenses net of all reductions | | .61% G | | .51% | | .79% | | .86% | | .87% | | .89% |
| Net investment income (loss) | | .12% G | | .48% | | .17% | | (.29)% | | .05% | | .12% |
| Supplemental Data | | | | | | | | | | | | |
| Net assets, end of period (000 omitted) | $ | 3,532,669 | $ | 2,593,441 | $ | 2,573,993 | $ | 3,952,650 | $ | 3,190,557 | $ | 2,953,108 |
Portfolio turnover rate H | | | | 130% | | 142% | | 107% | | 140% | | 152% |
ACalculated based on average shares outstanding during the period.
BNet investment income (loss) is affected by the timing of the declaration of dividends by any underlying mutual funds or exchange-traded funds (ETFs). Net investment income (loss) of any mutual funds or ETFs is not included in the Fund's net investment income (loss) ratio.
CTotal returns for periods of less than one year are not annualized.
DTotal returns would have been lower if certain expenses had not been reduced during the applicable periods shown.
EFees and expenses of any underlying mutual funds or exchange-traded funds (ETFs) are not included in the Fund's expense ratio. The Fund indirectly bears its proportionate share of these expenses. For additional expense information related to investments in Fidelity Central Funds, please refer to the "Investments in Fidelity Central Funds" note found in the Notes to Financial Statements section of the most recent Annual or Semi-Annual report.
FExpense ratios reflect operating expenses of the class. Expenses before reductions do not reflect amounts reimbursed, waived, or reduced through arrangements with the investment adviser, brokerage services, or other offset arrangements, if applicable, and do not represent the amount paid by the class during periods when reimbursements, waivers or reductions occur.
GAnnualized.
HAmount does not include the portfolio activity of any underlying mutual funds or exchange-traded funds (ETFs).
For the period ended April 30, 2024
1. Organization.
Fidelity Focused Stock Fund (the Fund) is a fund of Fidelity Capital Trust (the Trust) and is authorized to issue an unlimited number of shares. Share transactions on the Statement of Changes in Net Assets may contain exchanges between affiliated funds. The Trust is registered under the Investment Company Act of 1940, as amended (the 1940 Act), as an open-end management investment company organized as a Massachusetts business trust.
2. Investments in Fidelity Central Funds.
Funds may invest in Fidelity Central Funds, which are open-end investment companies generally available only to other investment companies and accounts managed by the investment adviser and its affiliates. The Schedule of Investments lists any Fidelity Central Funds held as an investment as of period end, but does not include the underlying holdings of each Fidelity Central Fund. An investing fund indirectly bears its proportionate share of the expenses of the underlying Fidelity Central Funds.
Based on its investment objective, each Fidelity Central Fund may invest or participate in various investment vehicles or strategies that are similar to those of the investing fund. These strategies are consistent with the investment objectives of the investing fund and may involve certain economic risks which may cause a decline in value of each of the Fidelity Central Funds and thus a decline in the value of the investing fund.
| Fidelity Central Fund | Investment Manager | Investment Objective | Investment Practices | Expense RatioA |
| Fidelity Money Market Central Funds | Fidelity Management & Research Company LLC (FMR) | Each fund seeks to obtain a high level of current income consistent with the preservation of capital and liquidity. | Short-term Investments | Less than .005% |
A Expenses expressed as a percentage of average net assets and are as of each underlying Central Fund's most recent annual or semi-annual shareholder report.
A complete unaudited list of holdings for each Fidelity Central Fund is available upon request or at the Securities and Exchange Commission website at www.sec.gov. In addition, the financial statements of the Fidelity Central Funds which contain the significant accounting policies (including investment valuation policies) of those funds, and are not covered by the Report of Independent Registered Public Accounting Firm, are available on the Securities and Exchange Commission website or upon request.
3. Significant Accounting Policies.
The Fund is an investment company and applies the accounting and reporting guidance of the Financial Accounting Standards Board (FASB) Accounting Standards Codification Topic 946 Financial Services - Investment Companies. The financial statements have been prepared in conformity with accounting principles generally accepted in the United States of America (GAAP), which require management to make certain estimates and assumptions at the date of the financial statements. Actual results could differ from those estimates. Subsequent events, if any, through the date that the financial statements were issued have been evaluated in the preparation of the financial statements. The Fund's Schedule of Investments lists any underlying mutual funds or exchange-traded funds (ETFs) but does not include the underlying holdings of these funds. The following summarizes the significant accounting policies of the Fund:
Investment Valuation. Investments are valued as of 4:00 p.m. Eastern time on the last calendar day of the period. The Board of Trustees (the Board) has designated the Fund's investment adviser as the valuation designee responsible for the fair valuation function and performing fair value determinations as needed. The investment adviser has established a Fair Value Committee (the Committee) to carry out the day-to-day fair valuation responsibilities and has adopted policies and procedures to govern the fair valuation process and the activities of the Committee. In accordance with these fair valuation policies and procedures, which have been approved by the Board, the Fund attempts to obtain prices from one or more third party pricing services or brokers to value its investments. When current market prices, quotations or currency exchange rates are not readily available or reliable, investments will be fair valued in good faith by the Committee, in accordance with the policies and procedures. Factors used in determining fair value vary by investment type and may include market or investment specific events, transaction data, estimated cash flows, and market observations of comparable investments. The frequency that the fair valuation procedures are used cannot be predicted and they may be utilized to a significant extent. The Committee manages the Fund's fair valuation practices and maintains the fair valuation policies and procedures. The Fund's investment adviser reports to the Board information regarding the fair valuation process and related material matters.
The Fund categorizes the inputs to valuation techniques used to value its investments into a disclosure hierarchy consisting of three levels as shown below:
Level 1 - unadjusted quoted prices in active markets for identical investments
Level 2 - other significant observable inputs (including quoted prices for similar investments, interest rates, prepayment speeds, etc.)
Level 3 - unobservable inputs (including the Fund's own assumptions based on the best information available)
Valuation techniques used to value the Fund's investments by major category are as follows:
Equity securities, including restricted securities, for which market quotations are readily available, are valued at the last reported sale price or official closing price as reported by a third party pricing service on the primary market or exchange on which they are traded and are categorized as Level 1 in the hierarchy. In the event there were no sales during the day or closing prices are not available, securities are valued at the last quoted bid price or may be valued using the last available price and are generally categorized as Level 2 in the hierarchy. For foreign equity securities, when market or security specific events arise, comparisons to the valuation of American Depositary Receipts (ADRs), futures contracts, Exchange-Traded Funds (ETFs) and certain indexes as well as quoted prices for similar securities may be used and would be categorized as Level 2 in the hierarchy. For equity securities, including restricted securities, where observable inputs are limited, assumptions about market activity and risk are used and these securities may be categorized as Level 3 in the hierarchy.
Investments in open-end mutual funds, including the Fidelity Central Funds, are valued at their closing net asset value (NAV) each business day and are categorized as Level 1 in the hierarchy.
Changes in valuation techniques may result in transfers in or out of an assigned level within the disclosure hierarchy. The aggregate value of investments by input level as of April 30, 2024 is included at the end of the Fund's Schedule of Investments.
Foreign Currency. Certain Funds may use foreign currency contracts to facilitate transactions in foreign-denominated securities. Gains and losses from these transactions may arise from changes in the value of the foreign currency or if the counterparties do not perform under the contracts' terms.
Foreign-denominated assets, including investment securities, and liabilities are translated into U.S. dollars at the exchange rates at period end. Purchases and sales of investment securities, income and dividends received, and expenses denominated in foreign currencies are translated into U.S. dollars at the exchange rate in effect on the transaction date.
The effects of exchange rate fluctuations on investments are included with the net realized and unrealized gain (loss) on investment securities. Other foreign currency transactions resulting in realized and unrealized gain (loss) are disclosed separately.
Investment Transactions and Income. For financial reporting purposes, the Fund's investment holdings and NAV include trades executed through the end of the last business day of the period. The NAV per share for processing shareholder transactions is calculated as of the close of business of the New York Stock Exchange (NYSE), normally 4:00 p.m. Eastern time and includes trades executed through the end of the prior business day. Gains and losses on securities sold are determined on the basis of identified cost and include proceeds received from litigation. Commissions paid to certain brokers with whom the investment adviser, or its affiliates, places trades on behalf of a fund include an amount in addition to trade execution, which may be rebated back to a fund. Any such rebates are included in net realized gain (loss) on investments in the Statement of Operations. Dividend income is recorded on the ex-dividend date, except for certain dividends from foreign securities where the ex-dividend date may have passed, which are recorded as soon as the Fund is informed of the ex-dividend date. Non-cash dividends included in dividend income, if any, are recorded at the fair market value of the securities received. Income and capital gain distributions from Fidelity Central Funds, if any, are recorded on the ex-dividend date. Certain distributions received by the Fund represent a return of capital or capital gain. The Fund determines the components of these distributions subsequent to the ex-dividend date, based upon receipt of tax filings or other correspondence relating to the underlying investment. These distributions are recorded as a reduction of cost of investments and/or as a realized gain. Investment income is recorded net of foreign taxes withheld where recovery of such taxes is uncertain. Funds may file withholding tax reclaims in certain jurisdictions to recover a portion of amounts previously withheld. Any withholding tax reclaims income is included in the Statement of Operations in dividends. Any receivables for withholding tax reclaims are included in the Statement of Assets and Liabilities in dividends receivable.
Expenses. Expenses directly attributable to a fund are charged to that fund. Expenses attributable to more than one fund are allocated among the respective funds on the basis of relative net assets or other appropriate methods. Expenses included in the accompanying financial statements reflect the expenses of that fund and do not include any expenses associated with any underlying mutual funds or exchange-traded funds. Although not included in a fund's expenses, a fund indirectly bears its proportionate share of these expenses through the net asset value of each underlying mutual fund or exchange-traded fund. Expense estimates are accrued in the period to which they relate and adjustments are made when actual amounts are known.
Income Tax Information and Distributions to Shareholders. Each year, the Fund intends to qualify as a regulated investment company under Subchapter M of the Internal Revenue Code, including distributing substantially all of its taxable income and realized gains. As a result, no provision for U.S. Federal income taxes is required. The Fund files a U.S. federal tax return, in addition to state and local tax returns as required. The Fund's federal income tax returns are subject to examination by the Internal Revenue Service (IRS) for a period of three fiscal years after they are filed. State and local tax returns may be subject to examination for an additional fiscal year depending on the jurisdiction. Foreign taxes are provided for based on the Fund's understanding of the tax rules and rates that exist in the foreign markets in which it invests.
Distributions are declared and recorded on the ex-dividend date. Income and capital gain distributions are determined in accordance with income tax regulations, which may differ from GAAP.
Capital accounts within the financial statements are adjusted for permanent book-tax differences. These adjustments have no impact on net assets or the results of operations. Capital accounts are not adjusted for temporary book-tax differences which will reverse in a subsequent period.
Book-tax differences are primarily due to foreign currency transactions, passive foreign investment companies (PFIC), capital loss carryforwards and losses deferred due to wash sales.
As of period end, the cost and unrealized appreciation (depreciation) in securities, and derivatives if applicable, for federal income tax purposes were as follows:
| Gross unrealized appreciation | $1,420,247,111 |
| Gross unrealized depreciation | (23,646,601) |
| Net unrealized appreciation (depreciation) | $1,396,600,510 |
| Tax cost | $2,092,257,986 |
Capital loss carryforwards are only available to offset future capital gains of the Fund to the extent provided by regulations and may be limited. The capital loss carryforward information presented below, including any applicable limitation, is estimated as of prior fiscal period end and is subject to adjustment.
Short-term | $(31,042,303) |
| Total capital loss carryforward | $(31,042,303) |
4. Purchases and Sales of Investments.
Purchases and sales of securities, other than short-term securities and in-kind transactions, as applicable, are noted in the table below.
| | Purchases ($) | Sales ($) |
| Fidelity Focused Stock Fund | 1,522,287,406 | 1,488,822,527 |
5. Fees and Other Transactions with Affiliates.
Management Fee. Fidelity Management & Research Company LLC (the investment adviser) and its affiliates provide the Fund with investment management related services for which the Fund pays a monthly management fee.
Effective March 1, 2024, the Fund's management contract was amended to incorporate administrative services previously covered under separate services agreements (Transfer Agent and Accounting agreements). Any reference to "class" in this note shall mean "the Fund" as the Fund currently offers only one class of shares. The amended contract incorporates a basic fee rate that may vary by class (subject to a performance adjustment). The investment adviser or an affiliate pays certain expenses of managing and operating the Fund out of each class's management fee. Each class of the Fund pays a management fee to the investment adviser. The management fee is calculated and paid to the investment adviser every month. The management fee is determined by calculating a basic fee and then applying a performance adjustment. When determining a class's basic fee, a mandate rate is calculated based on the monthly average net assets of a group of funds advised by FMR within a designated asset class. A discount rate is subtracted from the mandate rate once the Fund's monthly average net assets reach a certain level. The mandate rate and discount rate may vary by class. The annual basic fee rate for a class of shares of the Fund is the lesser of (1) the class's mandate rate reduced by the class's discount rate (if applicable) or (2) the amount set forth in the following table.
| | Maximum Management Fee Rate % |
| Fidelity Focused Stock Fund | .65 |
One-twelfth of the basic fee rate for a class is applied to the average net assets of the class for the month, giving a dollar amount which is the basic fee for the class for that month. A different management fee rate may be applicable to each class of the Fund. The difference between classes is the result of separate arrangements for class-level services and/or waivers of certain expenses. It is not the result of any difference in advisory or custodial fees or other expenses related to the management of the Fund's assets, which do not vary by class. For the portion of the reporting period on or after March 1, 2024, the total annualized management fee rates were as follows:
| | Total Management Fee Rate % |
| Fidelity Focused Stock Fund | .64 |
Prior to March 1, 2024, the management fee was the sum of an individual fund fee rate that was based on an annual rate of .30% of the Fund's average net assets and an annualized group fee rate that averaged .22% during the period. The group fee rate was based upon the monthly average net assets of a group of registered investment companies with which the investment adviser has management contracts. The group fee rate decreased as assets under management increased and increased as assets under management decreased. For the portion of the reporting period prior to March 1, 2024, the total annualized management fee rate was .52%.
The performance adjustment rate is calculated monthly by comparing over the performance period the Fund's performance to that of the performance adjustment index listed below.
| | Performance Adjustment Index |
| Fidelity Focused Stock Fund | S&P 500 Index |
For the purposes of calculating the performance adjustment for the Fund, the Fund's investment performance is based on the performance of the Fund. To the extent that other classes of the Fund have higher expenses, this could result in those classes bearing a larger positive performance adjustment and smaller negative performance adjustment than would be the case if each class's own performance were considered. The performance period is the most recent 36 month period. The maximum annualized performance adjustment rate is ±.20% of the Fund's average net assets over the performance period. The performance adjustment rate is divided by twelve and multiplied by the Fund's average net assets over the performance period, and the resulting dollar amount is proportionately added to or subtracted from a class's basic fee. For the entire reporting period, the total annualized performance adjustment was (.06) %.
Effective March 1, 2024, the Fund's sub-advisory agreements with FMR Investment Management (UK) Limited, Fidelity Management & Research (Hong Kong) Limited, and Fidelity Management & Research (Japan) Limited were amended to provide that the investment adviser pays each sub-adviser monthly fees equal to 110% of the sub-adviser's costs for providing sub-advisory services.
Transfer Agent Fees. Fidelity Investments Institutional Operations Company LLC (FIIOC), an affiliate of the investment adviser, is the Fund's transfer, dividend disbursing and shareholder servicing agent. Effective March 1, 2024, each Fund's management contract was amended to incorporate transfer agent services and associated fees previously covered under a separate services agreement. FIIOC pays for typesetting, printing and mailing of shareholder reports, except proxy statements.
During November 2023, the Board approved a change in the transfer agent fees effective December 1, 2023 to a fixed annual rate of average net assets of 0.1351%.
Prior to December 1, 2023, FIIOC received account fees and asset-based fees that varied according to account size and type of account.
For the portion of the reporting period prior to March 1, 2024, the fees were equivalent to the annualized rate of .13% of average net assets.
Accounting Fees. Fidelity Service Company, Inc. (FSC), an affiliate of the investment adviser, maintains the Fund's accounting records. Effective March 1, 2024, the Fund's management contract was amended to incorporate accounting services and associated fees previously covered under a separate services agreement.
During November 2023, the Board approved a change in the accounting fees effective December 1, 2023 to a fixed annual rate of average net assets as follows:
| | % of Average Net Assets |
| Fidelity Focused Stock Fund | 0.0259 |
Prior to December 1, 2023, the accounting fee was based on the level of average net assets for each month. For the portion of the reporting period prior to March 1, 2024, the fees were equivalent to the following annualized rates:
| | % of Average Net Assets |
| Fidelity Focused Stock Fund | .03 |
Brokerage Commissions. A portion of portfolio transactions were placed with brokerage firms which are affiliates of the investment adviser. Brokerage commissions are included in net realized gain (loss) and change in net unrealized appreciation (depreciation) in the Statement of Operations. The commissions paid to these affiliated firms were as follows:
| | Amount ($) |
| Fidelity Focused Stock Fund | 21,297 |
Interfund Trades. Funds may purchase from or sell securities to other Fidelity Funds under procedures adopted by the Board. The procedures have been designed to ensure these interfund trades are executed in accordance with Rule 17a-7 of the 1940 Act. Any interfund trades are included within the respective purchases and sales amounts shown in the Purchases and Sales of Investments note. Interfund trades during the period are noted in the table below.
| | Purchases ($) | Sales ($) | Realized Gain (Loss)($) |
| Fidelity Focused Stock Fund | 92,972,537 | 122,132,365 | 9,734,604 |
6. Committed Line of Credit.
Certain Funds participate with other funds managed by the investment adviser or an affiliate in a $4.25 billion credit facility (the "line of credit") to be utilized for temporary or emergency purposes to fund shareholder redemptions or for other short-term liquidity purposes. The participating funds have agreed to pay commitment fees on their pro-rata portion of the line of credit, which are reflected in Miscellaneous expenses on the Statement of Operations, and are listed below. During the period, there were no borrowings on this line of credit.
| | Amount ($) |
| Fidelity Focused Stock Fund | 2,782 |
7. Security Lending.
Funds lend portfolio securities from time to time in order to earn additional income. Lending agents are used, including National Financial Services (NFS), an affiliate of the investment adviser. Pursuant to a securities lending agreement, NFS will receive a fee, which is capped at 9.9% of a fund's daily lending revenue, for its services as lending agent. A fund may lend securities to certain qualified borrowers, including NFS. On the settlement date of the loan, a fund receives collateral (in the form of U.S. Treasury obligations, letters of credit and/or cash) against the loaned securities and maintains collateral in an amount not less than 100% of the market value of the loaned securities during the period of the loan. The market value of the loaned securities is determined at the close of business of a fund and any additional required collateral is delivered to a fund on the next business day. A fund or borrower may terminate the loan at any time, and if the borrower defaults on its obligation to return the securities loaned because of insolvency or other reasons, a fund may apply collateral received from the borrower against the obligation. A fund may experience delays and costs in recovering the securities loaned. Any cash collateral received is invested in the Fidelity Securities Lending Cash Central Fund. Any loaned securities are identified as such in the Schedule of Investments, and the value of loaned securities and cash collateral at period end, as applicable, are presented in the Statement of Assets and Liabilities. Security lending income represents the income earned on investing cash collateral, less rebates paid to borrowers and any lending agent fees associated with the loan, plus any premium payments received for lending certain types of securities. Security lending income is presented in the Statement of Operations as a component of income from Fidelity Central Funds. Affiliated security lending activity, if any, was as follows:
| | Total Security Lending Fees Paid to NFS ($) | Security Lending Income From Securities Loaned to NFS ($) | Value of Securities Loaned to NFS at Period End ($) |
| Fidelity Focused Stock Fund | 750 | - | - |
8. Expense Reductions.
During the period the investment adviser or an affiliate reimbursed and/or waived a portion of operating expenses in the amount of $134,208.
9. Other.
A fund's organizational documents provide former and current trustees and officers with a limited indemnification against liabilities arising in connection with the performance of their duties to the fund. In the normal course of business, a fund may also enter into contracts that provide general indemnifications. A fund's maximum exposure under these arrangements is unknown as this would be dependent on future claims that may be made against a fund. The risk of material loss from such claims is considered remote.
10. Risk and Uncertainties.
Many factors affect a fund's performance. Developments that disrupt global economies and financial markets, such as pandemics, epidemics, outbreaks of infectious diseases, war, terrorism, and environmental disasters, may significantly affect a fund's investment performance. The effects of these developments to a fund will be impacted by the types of securities in which a fund invests, the financial condition, industry, economic sector, and geographic location of an issuer, and a fund's level of investment in the securities of that issuer. Significant concentrations in security types, issuers, industries, sectors, and geographic locations may magnify the factors that affect a fund's performance.
As a shareholder, you incur two types of costs: (1) transaction costs, which may include sales charges (loads) on purchase payments or redemption proceeds, as applicable and (2) ongoing costs, which generally include management fees, distribution and/or service (12b-1) fees and other Fund expenses. This Example is intended to help you understand your ongoing costs (in dollars) of investing in a fund and to compare these costs with the ongoing costs of investing in other mutual funds.
| The Example is based on an investment of $1,000 invested at the beginning of the period and held for the entire period (November 1, 2023 to April 30, 2024). |
Actual Expenses
The first line of the accompanying table provides information about actual account values and actual expenses. You may use the information in this line, together with the amount you invested, to estimate the expenses that you paid over the period. Simply divide your account value by $1,000.00 (for example, an $8,600 account value divided by $1,000.00 = 8.6), then multiply the result by the number in the first line for a class/Fund under the heading entitled "Expenses Paid During Period" to estimate the expenses you paid on your account during this period. If any fund is a shareholder of any underlying mutual funds or exchange-traded funds (ETFs) (the Underlying Funds), such fund indirectly bears its proportional share of the expenses of the Underlying Funds in addition to the direct expenses incurred presented in the table. These fees and expenses are not included in the annualized expense ratio used to calculate the expense estimate in the table below.
Hypothetical Example for Comparison Purposes
The second line of the accompanying table provides information about hypothetical account values and hypothetical expenses based on the actual expense ratio and an assumed rate of return of 5% per year before expenses, which is not the actual return. The hypothetical account values and expenses may not be used to estimate the actual ending account balance or expenses you paid for the period. You may use this information to compare the ongoing costs of investing in the Fund and other funds. To do so, compare this 5% hypothetical example with the 5% hypothetical examples that appear in the shareholder reports of the other funds. If any fund is a shareholder of any Underlying Funds, such fund indirectly bears its proportional share of the expenses of the Underlying Funds in addition to the direct expenses as presented in the table. These fees and expenses are not included in the annualized expense ratio used to calculate the expense estimate in the table below.
Please note that the expenses shown in the table are meant to highlight your ongoing costs only and do not reflect any transaction costs. Therefore, the second line of the table is useful in comparing ongoing costs only, and will not help you determine the relative total costs of owning different funds. In addition, if these transactional costs were included, your costs would have been higher.
| | | | | Annualized Expense Ratio- A | | Beginning Account Value November 1, 2023 | | Ending Account Value April 30, 2024 | | Expenses Paid During Period- C November 1, 2023 to April 30, 2024 |
| | | | | | | | | | |
| Fidelity® Focused Stock Fund | | | | .61% | | | | | | |
| Actual | | | | | | $ 1,000 | | $ 1,339.60 | | $ 3.55 |
Hypothetical-B | | | | | | $ 1,000 | | $ 1,021.83 | | $ 3.07 |
| |
A Annualized expense ratio reflects expenses net of applicable fee waivers.
B 5% return per year before expenses
C Expenses are equal to the annualized expense ratio, multiplied by the average account value over the period, multiplied by 182/ 366 (to reflect the one-half year period). The fees and expenses of any Underlying Funds are not included in each annualized expense ratio.
Board Approval of Investment Advisory Contracts
Fidelity Focused Stock Fund
At its January 2024 meeting, the Board of Trustees, including the Independent Trustees (together, the Board), approved an amended and restated management contract with Fidelity Management & Research Company LLC (FMR) (the Management Contract), and amended and restated sub-advisory agreements (the Sub-Advisory Contracts, and together with the Management Contract, the Advisory Contracts) for the fund, including the fund's sub-advisory agreements with FMR Investment Management (UK) Limited (FMR UK), Fidelity Management & Research (Hong Kong) Limited (FMR H.K.), and Fidelity Management & Research (Japan) Limited (FMR Japan). The Advisory Contracts will be effective March 1, 2024. The Board will consider the annual renewal of the fund's Advisory Contracts in May 2024, following its review of additional materials provided by FMR.
Management Contract. The Board approved the Management Contract, which implements a new fee structure combining the management fee, transfer agent fee (TA Fee), and pricing and bookkeeping fee (P&B Fee) of the fund into a single fee based on tiered schedules and subject to a maximum rate (the Unified Fee). In exchange for the Unified Fee, the fund will receive investment advisory, management, administrative, transfer agent, pricing and bookkeeping services under a single agreement - the Management Contract.
In its consideration of the Management Contract over several meetings, the Board received, reviewed and discussed a comprehensive set of analyses regarding the Unified Fee including (i) the legal framework, (ii) design goals for the Unified Fee, (iii) calculation methodology for the Unified Fee and illustrative examples, (iv) annual and cumulative projected impacts under various scenarios, both in the aggregate and at the fund/class level, (v) explanations of schedules, rate levers and maximum rates and (vi) shareholder benefits and projected savings.
The Board considered that the maximum Unified Fee for the fund would be no higher than the sum of (i) the lowest contractual management fee rate under the fund's existing management contract, which is the individual fund fee rate, if any, plus the lowest contractual marginal group fee rate and (ii) the TA and P&B Fee rates, which are fixed fee rates since December 1, 2023 (together, the Unified Fee Cap). The Board noted that Fidelity has represented that, as a result of this Unified Fee Cap, the Unified Fee would be no greater than the fee rates previously authorized to be charged to the fund for the same services. The Board noted that certain expenses such as performance adjustments, third-party expenses, and certain other miscellaneous expenses would be outside the scope of the Unified Fee and the calculation of such fees would not change as a result of the Unified Fee.
The Board considered Fidelity's representations that implementation of the Unified Fee, which includes the Unified Fee Cap, would cause all funds subject to the Unified Fee, including the fund, to experience an immediate reduction on contractual fee rates for services provided under the current management contracts. The Board considered that some funds would not experience lower net total fees as a result of existing fee caps. The Board further considered that, in addition to the contractual fee savings, the Unified Fee offers funds and their shareholders greater protection from future rate increases for services previously offered under separate agreements that are now covered by the Management Contract because such rate increases would require shareholder approval.
Sub-Advisory Contracts. In connection with the Unified Fee changes, the Board considered the Sub-Advisory Contracts, which simplified the calculation of the fees paid by FMR to the sub-advisers under the agreements. The Board noted that the agreements with FMR UK, FMR H.K., and FMR Japan were amended to provide that FMR will compensate each sub-adviser at a fee rate equal to 110% of the sub-adviser's costs incurred in providing services under the agreement. The Board considered that, under the Sub-Advisory Contracts, FMR, and not the fund, will continue to pay the sub-advisory fees to each applicable sub-adviser.
The Board further considered that the approval of the fund's Advisory Contracts will not result in any changes in the investment process or strategies employed in the management of the fund's assets or the day-to-day management of the fund or the persons primarily responsible for such management. Further, the Board considered that the Management Contract would not change the obligations and services of FMR and its affiliates on behalf of the fund, and, in particular, there would be no change in the nature and level of advisory, management, administration, transfer agent, and pricing and bookkeeping services provided to the fund by FMR, its affiliates, and each applicable sub-adviser.
In connection with its consideration of future renewals of the fund's Advisory Contracts, the Board will consider: (i) the nature, extent and quality of services provided to the funds, including shareholder and administrative services and investment performance; (ii) the competitiveness of the management fee and total expenses for the fund; (iii) the costs of the services and profitability, including the revenues earned and the expenses incurred in conducting the business of developing, marketing, distributing, managing, administering, and servicing the fund and its shareholders, to the extent applicable; and (iv) whether there have been economies of scale in respect of the Fidelity funds, whether the Fidelity funds (including the fund) have appropriately benefited from any such economies of scale, and whether there is the potential for realization of any further economies.
Based on its evaluation of all of the conclusions and representations noted above, and after considering all factors it believed relevant, the Board concluded that the fund's management fee structure is fair and reasonable, and that the fund's Advisory Contracts should be approved.
The Securities and Exchange Commission adopted Rule 22e-4 under the Investment Company Act of 1940 (the Liquidity Rule) to promote effective liquidity risk management throughout the open-end investment company industry, thereby reducing the risk that funds will be unable to meet their redemption obligations and mitigating dilution of the interests of fund shareholders.
The Fund has adopted and implemented a liquidity risk management program (the Program) reasonably designed to assess and manage the Fund's liquidity risk and to comply with the requirements of the Liquidity Rule. The Fund's Board of Trustees (the Board) has designated the Fund's investment adviser as administrator of the Program. The Fidelity advisers have established a Liquidity Risk Management Committee (the LRM Committee) to manage the Program for each of the Fidelity Funds. The LRM Committee monitors the adequacy and effectiveness of implementation of the Program and on a periodic basis assesses each Fund's liquidity risk based on a variety of factors including (1) the Fund's investment strategy, (2) portfolio liquidity and cash flow projections during normal and reasonably foreseeable stressed conditions, (3) shareholder redemptions, (4) borrowings and other funding sources and (5) certain factors specific to ETFs including the effect of the Fund's prices and spreads, market participants, and basket compositions on the overall liquidity of the Fund's portfolio, as applicable.
In accordance with the Program, each of the Fund's portfolio investments is classified into one of four defined liquidity categories based on a determination of a reasonable expectation for how long it would take to convert the investment to cash (or sell or dispose of the investment) without significantly changing its market value.
- Highly liquid investments - cash or convertible to cash within three business days or less
- Moderately liquid investments - convertible to cash in three to seven calendar days
- Less liquid investments - can be sold or disposed of, but not settled, within seven calendar days
- Illiquid investments - cannot be sold or disposed of within seven calendar days
Liquidity classification determinations take into account a variety of factors including various market, trading and investment-specific considerations, as well as market depth, and generally utilize analysis from a third-party liquidity metrics service.
The Liquidity Rule places a 15% limit on a fund's illiquid investments and requires funds that do not primarily hold assets that are highly liquid investments to determine and maintain a minimum percentage of the fund's net assets to be invested in highly liquid investments (highly liquid investment minimum or HLIM). The Program includes provisions reasonably designed to comply with the 15% limit on illiquid investments and for determining, periodically reviewing and complying with the HLIM requirement as applicable.
At a recent meeting of the Fund's Board of Trustees, the LRM Committee provided a written report to the Board pertaining to the operation, adequacy, and effectiveness of the Program for the period December 1, 2022 through November 30, 2023. The report concluded that the Program is operating effectively and is reasonably designed to assess and manage the Fund's liquidity risk.
1.703563.126
TQG-SANN-0624
Item 2.
Code of Ethics
Not applicable.
Item 3.
Audit Committee Financial Expert
Not applicable.
Item 4.
Principal Accountant Fees and Services
Not applicable.
Item 5.
Audit Committee of Listed Registrants
Not applicable.
Item 6.
Investments
(a)
Not applicable.
(b)
Not applicable
Item 7.
Disclosure of Proxy Voting Policies and Procedures for Closed-End Management Investment Companies
Not applicable.
Item 8.
Portfolio Managers of Closed-End Management Investment Companies
Not applicable.
Item 9.
Purchase of Equity Securities by Closed-End Management Investment Company and Affiliated Purchasers
Not applicable.
Item 10.
Submission of Matters to a Vote of Security Holders
There were no material changes to the procedures by which shareholders may recommend nominees to the Fidelity Capital Trust’s Board of Trustees.
Item 11.
Controls and Procedures
(a)(i) The President and Treasurer and the Chief Financial Officer have concluded that the Fidelity Capital Trust’s (the “Trust”) disclosure controls and procedures (as defined in Rule 30a-3(c) under the Investment Company Act) provide reasonable assurances that
material information relating to the Trust is made known to them by the appropriate persons, based on their evaluation of these controls and procedures as of a date within 90 days of the filing date of this report.
(a)(ii) There was no change in the Trust’s internal control over financial reporting (as defined in Rule 30a-3(d) under the Investment Company Act) that occurred during the period covered by this report that has materially affected, or is reasonably likely to materially affect, the Trust’s internal control over financial reporting.
Item 12.
Disclosure of Securities Lending Activities for Closed-End Management
Investment Companies
Not applicable.
Item 18.
Recovery of Erroneously Awarded Compensation
(a)
Not applicable.
(b)
Not applicable.
Item 19.
Exhibits
SIGNATURES
Pursuant to the requirements of the Securities Exchange Act of 1934 and the Investment Company Act of 1940, the registrant has duly caused this report to be signed on its behalf by the undersigned, thereunto duly authorized.
Fidelity Capital Trust
| |
By: | /s/Stacie M. Smith |
| Stacie M. Smith |
| President and Treasurer (Principal Executive Officer) |
|
|
Date: | June 21, 2024 |
Pursuant to the requirements of the Securities Exchange Act of 1934 and the Investment Company Act of 1940, this report has been signed below by the following persons on behalf of the registrant and in the capacities and on the dates indicated.
| |
By: | /s/Stacie M. Smith |
| Stacie M. Smith |
| President and Treasurer (Principal Executive Officer) |
|
|
Date: | June 21, 2024 |
| |
By: | /s/John J. Burke III |
| John J. Burke III |
| Chief Financial Officer (Principal Financial Officer) |
|
|
Date: | June 21, 2024 |