UNITED STATES
SECURITIES AND EXCHANGE COMMISSION
Washington, D.C. 20549
FORM N-CSR
CERTIFIED SHAREHOLDER REPORT OF REGISTERED
MANAGEMENT INVESTMENT COMPANIES
Investment Company Act file number 811-2841
Fidelity Capital Trust
(Exact name of registrant as specified in charter)
82 Devonshire St., Boston, Massachusetts 02109
(Address of principal executive offices) (Zip code)
Scott C. Goebel, Secretary
82 Devonshire St.
Boston, Massachusetts 02109
(Name and address of agent for service)
Registrant's telephone number, including area code: 617-563-7000
Date of fiscal year end: | October 31 |
| |
Date of reporting period: | October 31, 2010 |
Item 1. Reports to Stockholders
Fidelity®
Capital Appreciation
Fund
Annual Report
October 31, 2010
(2_fidelity_logos) (Registered_Trademark)
Contents
Chairman's Message | <Click Here> | The Chairman's message to shareholders. |
Performance | <Click Here> | How the fund has done over time. |
Management's Discussion of Fund Performance | <Click Here> | The Portfolio Manager's review of fundperformance and strategy. |
Shareholder Expense Example | <Click Here> | An example of shareholder expenses. |
Investment Changes | <Click Here> | A summary of major shifts in the fund's investments over the past six months. |
Investments | <Click Here> | A complete list of the fund's investments with their market values. |
Financial Statements | <Click Here> | Statements of assets and liabilities, operations, and changes in net assets,
as well as financial highlights. |
Notes | <Click Here> | Notes to the financial statements. |
Report of Independent Registered Public Accounting Firm | <Click Here> | |
Trustees and Officers | <Click Here> | |
Distributions | <Click Here> | |
Board Approval of Investment Advisory Contracts and Management Fees | <Click Here> | |
To view a fund's proxy voting guidelines and proxy voting record for the 12-month period ended June 30, visit http://www.fidelity.com/proxyvotingresults or visit the Securities and Exchange Commission's (SEC) web site at http://www.sec.gov. You may also call 1-800-544-8544 to request a free copy of the proxy voting guidelines.
Standard & Poor's, S&P and S&P 500 are registered service marks of The McGraw-Hill Companies, Inc. and have been licensed for use by Fidelity Distributors Corporation.
Other third party marks appearing herein are the property of their respective owners.
All other marks appearing herein are registered or unregistered trademarks or service marks of FMR LLC or an affiliated company.
Annual Report
This report and the financial statements contained herein are submitted for the general information of the shareholders of the fund. This report is not authorized for distribution to prospective investors in the fund unless preceded or accompanied by an effective prospectus.
A fund files its complete schedule of portfolio holdings with the SEC for the first and third quarters of each fiscal year on Form N-Q. Forms N-Q are available on the SEC's web site at http://www.sec.gov. A fund's Forms N-Q may be reviewed and copied at the SEC's Public Reference Room in Washington, DC. Information regarding the operation of the SEC's Public Reference Room may be obtained by calling 1-800-SEC-0330. For a complete list of a fund's portfolio holdings, view the most recent holdings listing, semiannual report, or annual report on Fidelity's web site at http://www.fidelity.com or http://www.advisor.fidelity.com, as applicable.
NOT FDIC INSURED • MAY LOSE VALUE • NO BANK GUARANTEE
Neither the fund nor Fidelity Distributors Corporation is a bank.
Annual Report
(photo_of_Edward_C_Johnson_3d)
Dear Shareholder:
Equities have staged a rally in the second half of 2010, shaking off concerns about the European debt crisis and the possibility of a double-dip recession in the U.S. Although the short-term surge pushed major equity indexes back into positive territory for the year, several questions remain about the longer-term outlook, including lackluster economic growth and persistently high unemployment. Financial markets are always unpredictable, of course, but there also are several time-tested investment principles that can help put the odds in your favor.
One of the basic tenets is to invest for the long term. Over time, riding out the markets' inevitable ups and downs has proven much more effective than selling into panic or chasing the hottest trend. Even missing only a few of the markets' best days can significantly diminish investor returns. Patience also affords the benefits of compounding - of earning interest on additional income or reinvested dividends and capital gains. There can be tax advantages and cost benefits to consider as well. While staying the course doesn't eliminate risk, it can considerably lessen the effect of short-term declines.
You can further manage your investing risk through diversification. And today, more than ever, geographic diversification should be taken into account. Studies indicate that asset allocation is the single most important determinant of a portfolio's long-term success. The right mix of stocks, bonds and cash - aligned to your particular risk tolerance and investment objective - is very important. Age-appropriate rebalancing is also an essential aspect of asset allocation. For younger investors, an emphasis on equities - which historically have been the best-performing asset class over time - is encouraged. As investors near their specific goal, such as retirement or sending a child to college, consideration may be given to replacing volatile assets (e.g. common stocks) with more-stable fixed investments (bonds or savings plans).
A third principle - investing regularly - can help lower the average cost of your purchases. Investing a certain amount of money each month or quarter helps ensure you won't pay for all your shares at market highs. This strategy - known as dollar cost averaging - also reduces "emotion" from investing, helping shareholders avoid selling weak performers just prior to an upswing, or chasing a hot performer just before a correction.
We invite you to contact us via the Internet, through our Investor Centers or by phone. It is our privilege to provide you the information you need to make the investments that are right for you.
Sincerely,
(The chairman's signature appears here.)
Edward C. Johnson 3d
Annual Report
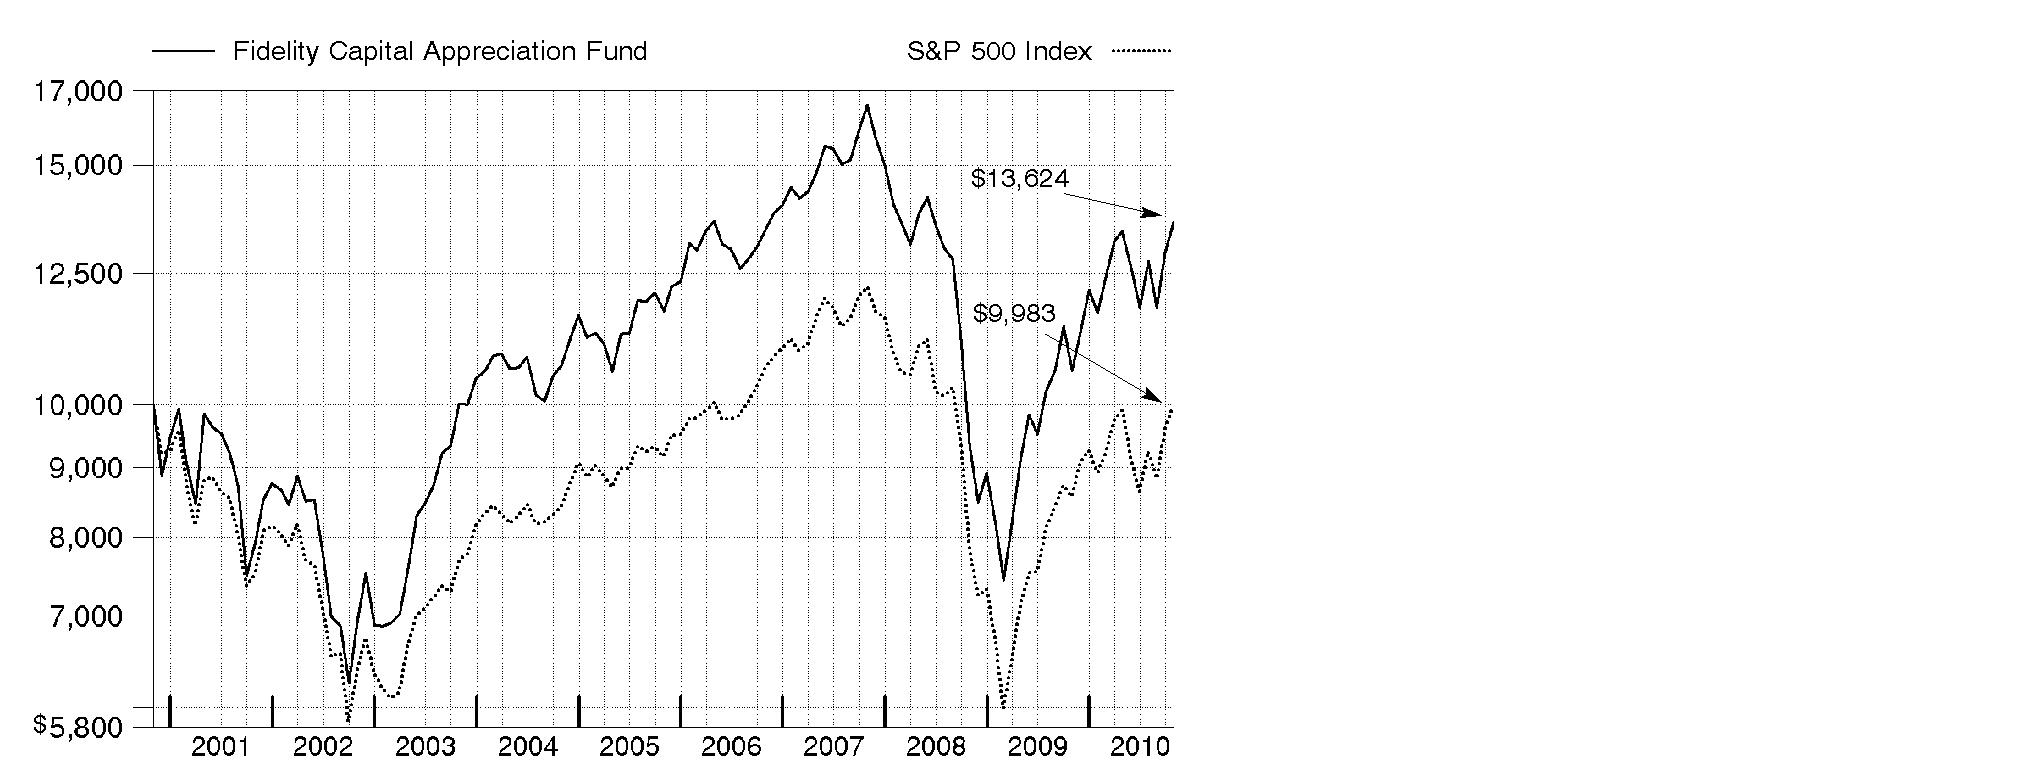
Average annual total return reflects the change in the value of an investment, assuming reinvestment of the class' distributions from dividend income and capital gains (the profits earned upon the sale of securities that have grown in value, if any) and assuming a constant rate of performance each year. The $10,000 table and the fund's returns do not reflect the deduction of taxes that a shareholder would pay on fund distributions or the redemption of fund shares. During periods of reimbursement by Fidelity, a fund's total return will be greater than it would be had the reimbursement not occurred. How a fund did yesterday is no guarantee of how it will do tomorrow.
Average Annual Total Returns
Periods ended October 31, 2010 | Past 1
year | Past 5
years | Past 10
years |
Fidelity® Capital Appreciation Fund | 28.57% | 3.05% | 3.14% |
$10,000 Over 10 Years
Let's say hypothetically that $10,000 was invested in Fidelity Capital Appreciation Fund, a class of the fund, on October 31, 2000. The chart shows how the value of your investment would have changed, and also shows how the S&P 500® Index performed over the same period.
Annual Report
Market Recap: Amid bouts of volatility, major U.S. stock market indexes recorded double-digit gains for the year ending October 31, 2010, lifted by economic optimism, encouraging earnings reports and a wave of corporate mergers. Aside from a January dip, stocks trended upward for the first half of the period amid indications the Great Recession was over. However, in April, lingering high unemployment and heightened concern over European debt sent equities falling. Markets regrouped in July, but fell again in August on mixed economic data. The final two months of the period brought renewed optimism, with the large-cap S&P 500® Index posting its best September/October performance since 1998. For the full 12 months, the S&P 500® rose 16.52%, while the blue-chip-laden Dow Jones Industrial AverageSM added 17.62% and the technology-heavy Nasdaq Composite® Index rose 23.72%. Among market segments, all 10 sectors in the S&P 500 posted gains, with more than half outperforming the broad-market index. Stocks of mid- and small-sized companies surged, with the Russell Midcap® Index adding 27.71% and Russell 2000® Index climbing 26.58%. Looking abroad, debt problems in several European countries cooled gains in developed markets, and yet the MSCI® EAFE® (Europe, Australasia, Far East) Index still rose 8.49%.
Comments from Fergus Shiel, Portfolio Manager of Fidelity® Capital Appreciation Fund: During the year, the fund's Retail Class shares returned 28.57%, handily beating the S&P 500. Versus the index, superior security selection and a large overweighting in the transportation industry helped performance the most, followed by an overweighting and solid picks in media, and security selection in financials. A bias toward mid- and small-caps also was beneficial. Individual contributors included Continental Airlines; UAL, parent company of United Airlines; Delta Air Lines; and US Airways Group. Continental and UAL merged during the period to form United Continental Holdings, the fund's largest holding at period end. Other contributors included U.K.-based cable television provider Virgin Media and a large underweighting in energy giant Exxon Mobil, which I sold. Conversely, weak security selection and an underweighting in information technology hurt, as did an overweighting in banks and stock picking in retailing. For-profit educator ITT Educational Services was the fund's largest individual detractor. Performance also was hampered by personal computer/consumer electronics maker Apple - mainly due to untimely ownership - drilling rig owner/operator Pride International, network equipment maker Cisco Systems and Bank of Ireland. All of the holdings I mentioned, except for Exxon Mobil, Apple and Cisco Systems, were out of index. Pride International and Bank of Ireland were sold from the fund.
The views expressed above reflect those of the portfolio manager(s) only through the end of the period as stated on the cover of this report and do not necessarily represent the views of Fidelity or any other person in the Fidelity organization. Any such views are subject to change at any time based upon market or other conditions and Fidelity disclaims any responsibility to update such views. These views may not be relied on as investment advice and, because investment decisions for a Fidelity fund are based on numerous factors, may not be relied on as an indication of trading intent on behalf of any Fidelity fund.
Annual Report
Shareholder Expense Example
As a shareholder of the Fund, you incur two types of costs: (1) transaction costs, and (2) ongoing costs, including management fees and other Fund expenses. This Example is intended to help you understand your ongoing costs (in dollars) of investing in the Fund and to compare these costs with the ongoing costs of investing in other mutual funds.
The Example is based on an investment of $1,000 invested at the beginning of the period and held for the entire period (May 1, 2010 to October 31, 2010).
Actual Expenses
The first line of the accompanying table for each class of the Fund provides information about actual account values and actual expenses. You may use the information in this line, together with the amount you invested, to estimate the expenses that you paid over the period. Simply divide your account value by $1,000.00 (for example, an $8,600 account value divided by $1,000.00 = 8.6), then multiply the result by the number in the first line for a class of the Fund under the heading entitled "Expenses Paid During Period" to estimate the expenses you paid on your account during this period. A small balance maintenance fee of $12.00 that is charged once a year may apply for certain accounts with a value of less than $2,000. This fee is not included in the table below. If it was, the estimate of expenses you paid during the period would be higher, and your ending account value lower, by this amount. In addition, the Fund, as a shareholder in the underlying Fidelity Central Funds, will indirectly bear its pro-rata share of the fees and expenses incurred by the underlying Fidelity Central Funds. These fees and expenses are not included in the Fund's annualized expense ratio used to calculate the expense estimate in the table below.
Hypothetical Example for Comparison Purposes
The second line of the accompanying table for each class of the Fund provides information about hypothetical account values and hypothetical expenses based on a Class' actual expense ratio and an assumed rate of return of 5% per year before expenses, which is not the Class' actual return. The hypothetical account values and expenses may not be used to estimate the actual ending account balance or expenses you paid for the period. You may use this information to compare the ongoing costs of investing in the Fund and other funds. To do so, compare this 5% hypothetical example with the 5% hypothetical examples that appear in the shareholder reports of the other funds. A small balance maintenance fee of $12.00 that is charged once a year may apply for certain accounts with a value of less than $2,000. This fee is not included in the table below. If it was, the estimate of expenses you paid during the period would be higher, and your ending account value lower, by this amount. In addition, the Fund, as a shareholder in the underlying Fidelity Central Funds, will indirectly bear its pro-rata share of the fees and expenses incurred by the underlying Fidelity Central Funds. These fees and expenses are not included in the Fund's annualized expense ratio used to calculate the expense estimate in the table below.
Please note that the expenses shown in the table are meant to highlight your ongoing costs only and do not reflect any transaction costs. Therefore, the second line of the table is useful in comparing ongoing costs only, and will not help you determine the relative total costs of owning different funds.
Annual Report
| Annualized
Expense Ratio | Beginning
Account Value
May 1, 2010 | Ending
Account Value
October 31, 2010 | Expenses Paid
During Period*
May 1, 2010 to
October 31, 2010 |
Capital Appreciation | .88% | | | |
Actual | | $ 1,000.00 | $ 1,016.50 | $ 4.47 |
HypotheticalA | | $ 1,000.00 | $ 1,020.77 | $ 4.48 |
Class K | .71% | | | |
Actual | | $ 1,000.00 | $ 1,017.70 | $ 3.61 |
HypotheticalA | | $ 1,000.00 | $ 1,021.63 | $ 3.62 |
A 5% return per year before expenses
* Expenses are equal to each Class' annualized expense ratio, multiplied by the average account value over the period, multiplied by 184/365 (to reflect the one-half year period).
Annual Report
Investment Changes (Unaudited)
Top Ten Stocks as of October 31, 2010 |
| % of fund's
net assets | % of fund's net assets
6 months ago |
United Continental Holdings, Inc. | 8.1 | 0.0 |
Apple, Inc. | 4.0 | 0.9 |
Virgin Media, Inc. | 3.9 | 1.4 |
Sprint Nextel Corp. | 3.5 | 2.1 |
Delta Air Lines, Inc. | 3.1 | 3.9 |
The Walt Disney Co. | 2.8 | 3.7 |
US Airways Group, Inc. | 2.2 | 1.0 |
Union Pacific Corp. | 2.1 | 0.0 |
Juniper Networks, Inc. | 2.0 | 0.7 |
Cisco Systems, Inc. | 1.8 | 3.8 |
| 33.5 | |
Top Five Market Sectors as of October 31, 2010 |
| % of fund's
net assets | % of fund's net assets
6 months ago |
Consumer Discretionary | 27.6 | 17.1 |
Industrials | 26.1 | 18.6 |
Information Technology | 11.4 | 12.3 |
Financials | 7.9 | 16.2 |
Energy | 6.8 | 9.3 |
Asset Allocation (% of fund's net assets) |
As of October 31, 2010 * | As of April 30, 2010 ** |
 | Stocks 96.1% | | | Stocks 91.6% | |
 | Short-Term
Investments and
Net Other Assets 3.9% | | | Short-Term
Investments and
Net Other Assets 8.4% | |
* Foreign investments | 7.5% | | ** Foreign investments | 8.9% | |

Annual Report
Investments October 31, 2010
Showing Percentage of Net Assets
Common Stocks - 96.1% |
| Shares | | Value (000s) |
CONSUMER DISCRETIONARY - 27.6% |
Diversified Consumer Services - 1.5% |
ITT Educational Services, Inc. (a)(d) | 932,006 | | $ 60,142 |
Strayer Education, Inc. (d) | 146,121 | | 20,432 |
| | 80,574 |
Hotels, Restaurants & Leisure - 5.4% |
Accor SA | 643,336 | | 26,376 |
Marriott International, Inc. Class A | 904,404 | | 33,508 |
McDonald's Corp. | 1,088,682 | | 84,667 |
MGM Mirage, Inc. (a)(d) | 1,484,500 | | 16,226 |
Paddy Power PLC (Ireland) | 1,188,758 | | 47,969 |
Starwood Hotels & Resorts Worldwide, Inc. | 1,486,120 | | 80,459 |
| | 289,205 |
Internet & Catalog Retail - 1.1% |
Amazon.com, Inc. (a) | 287,061 | | 47,405 |
Blue Nile, Inc. (a) | 285,000 | | 12,141 |
| | 59,546 |
Media - 10.9% |
CBS Corp. Class B | 2,573,281 | | 43,566 |
Interpublic Group of Companies, Inc. (a) | 6,621,473 | | 68,532 |
Kabel Deutschland Holding AG | 1,115,800 | | 50,234 |
The Walt Disney Co. | 4,125,262 | | 148,963 |
Valassis Communications, Inc. (a) | 1,895,434 | | 62,549 |
Virgin Media, Inc. (d) | 8,355,135 | | 212,471 |
| | 586,315 |
Multiline Retail - 0.3% |
Retail Ventures, Inc. (a) | 1,035,657 | | 14,075 |
Specialty Retail - 5.5% |
Bed Bath & Beyond, Inc. (a) | 1,336,069 | | 58,653 |
Chico's FAS, Inc. | 5,047,714 | | 49,064 |
DSW, Inc. Class A (a)(d) | 662,321 | | 22,035 |
J. Crew Group, Inc. (a)(d) | 841,400 | | 26,916 |
Staples, Inc. | 2,276,346 | | 46,597 |
Tiffany & Co., Inc. | 395,905 | | 20,983 |
TJX Companies, Inc. | 1,583,486 | | 72,666 |
| | 296,914 |
Textiles, Apparel & Luxury Goods - 2.9% |
Coach, Inc. | 940,164 | | 47,008 |
NIKE, Inc. Class B | 197,940 | | 16,120 |
Phillips-Van Heusen Corp. | 859,100 | | 52,697 |
Common Stocks - continued |
| Shares | | Value (000s) |
CONSUMER DISCRETIONARY - continued |
Textiles, Apparel & Luxury Goods - continued |
Polo Ralph Lauren Corp. Class A | 247,500 | | $ 23,978 |
VF Corp. | 227,330 | | 18,923 |
| | 158,726 |
TOTAL CONSUMER DISCRETIONARY | | 1,485,355 |
CONSUMER STAPLES - 4.5% |
Beverages - 2.8% |
Anheuser-Busch InBev SA NV | 593,922 | | 37,217 |
Grupo Modelo SAB de CV Series C | 3,100,300 | | 17,361 |
The Coca-Cola Co. | 1,583,546 | | 97,103 |
| | 151,681 |
Food Products - 0.5% |
Kraft Foods, Inc. Class A | 791,841 | | 25,553 |
Tobacco - 1.2% |
Reynolds American, Inc. | 996,640 | | 64,682 |
TOTAL CONSUMER STAPLES | | 241,916 |
ENERGY - 6.8% |
Energy Equipment & Services - 0.4% |
National Oilwell Varco, Inc. | 395,923 | | 21,285 |
Oil, Gas & Consumable Fuels - 6.4% |
Alpha Natural Resources, Inc. (a) | 791,800 | | 35,766 |
Chevron Corp. | 1,039,184 | | 85,847 |
Massey Energy Co. | 643,340 | | 27,065 |
Occidental Petroleum Corp. | 1,020,708 | | 80,258 |
Patriot Coal Corp. (a)(d) | 1,187,700 | | 16,022 |
Peabody Energy Corp. | 395,800 | | 20,938 |
Royal Dutch Shell PLC Class A sponsored ADR | 1,237,141 | | 80,328 |
| | 346,224 |
TOTAL ENERGY | | 367,509 |
FINANCIALS - 7.9% |
Capital Markets - 1.3% |
Franklin Resources, Inc. | 198,035 | | 22,715 |
Janus Capital Group, Inc. | 1,977,543 | | 20,883 |
Lazard Ltd. Class A | 679,700 | | 25,081 |
| | 68,679 |
Common Stocks - continued |
| Shares | | Value (000s) |
FINANCIALS - continued |
Commercial Banks - 3.8% |
Comerica, Inc. | 1,375,188 | | $ 49,204 |
PNC Financial Services Group, Inc. | 1,285,702 | | 69,299 |
Regions Financial Corp. | 3,661,900 | | 23,070 |
SunTrust Banks, Inc. | 1,336,138 | | 33,430 |
SVB Financial Group (a) | 640,394 | | 27,755 |
| | 202,758 |
Diversified Financial Services - 1.5% |
CME Group, Inc. | 218,333 | | 63,240 |
Moody's Corp. | 593,805 | | 16,068 |
| | 79,308 |
Real Estate Management & Development - 1.3% |
CB Richard Ellis Group, Inc. Class A (a) | 3,982,147 | | 73,072 |
TOTAL FINANCIALS | | 423,817 |
HEALTH CARE - 2.6% |
Biotechnology - 1.3% |
Biogen Idec, Inc. (a) | 1,076,960 | | 67,536 |
Health Care Equipment & Supplies - 1.1% |
Edwards Lifesciences Corp. (a) | 712,600 | | 45,542 |
Symmetry Medical, Inc. (a) | 399,897 | | 3,539 |
Wright Medical Group, Inc. (a) | 891,987 | | 11,899 |
| | 60,980 |
Health Care Technology - 0.2% |
Transcend Services, Inc. (a)(e) | 625,383 | | 10,894 |
TOTAL HEALTH CARE | | 139,410 |
INDUSTRIALS - 26.1% |
Aerospace & Defense - 0.4% |
GeoEye, Inc. (a) | 526,888 | | 23,325 |
Air Freight & Logistics - 0.2% |
Air Transport Services Group, Inc. (a) | 1,976,893 | | 13,285 |
Airlines - 13.4% |
Delta Air Lines, Inc. (a) | 12,106,033 | | 168,153 |
United Continental Holdings, Inc. (a)(d) | 15,071,989 | | 437,693 |
US Airways Group, Inc. (a)(d)(e) | 9,983,845 | | 117,710 |
| | 723,556 |
Common Stocks - continued |
| Shares | | Value (000s) |
INDUSTRIALS - continued |
Commercial Services & Supplies - 1.2% |
Pitney Bowes, Inc. | 2,845,282 | | $ 62,425 |
Construction & Engineering - 0.5% |
Fluor Corp. | 544,323 | | 26,231 |
Electrical Equipment - 0.5% |
Emerson Electric Co. | 494,863 | | 27,168 |
Industrial Conglomerates - 0.7% |
Textron, Inc. | 1,710,667 | | 35,616 |
Machinery - 6.1% |
Bucyrus International, Inc. Class A | 742,245 | | 50,591 |
Caterpillar, Inc. | 494,888 | | 38,898 |
Cummins, Inc. | 791,801 | | 69,758 |
Deere & Co. | 692,820 | | 53,209 |
Joy Global, Inc. | 494,900 | | 35,113 |
Trinity Industries, Inc. | 834,449 | | 18,967 |
Vallourec SA | 211,593 | | 21,955 |
WABCO Holdings, Inc. (a) | 858,319 | | 39,843 |
| | 328,334 |
Road & Rail - 3.1% |
Norfolk Southern Corp. | 890,794 | | 54,775 |
Union Pacific Corp. | 1,286,630 | | 112,812 |
| | 167,587 |
TOTAL INDUSTRIALS | | 1,407,527 |
INFORMATION TECHNOLOGY - 11.4% |
Communications Equipment - 3.8% |
Cisco Systems, Inc. (a) | 4,275,013 | | 97,599 |
Juniper Networks, Inc. (a) | 3,265,938 | | 105,784 |
| | 203,383 |
Computers & Peripherals - 4.0% |
Apple, Inc. (a) | 712,568 | | 214,390 |
Internet Software & Services - 1.6% |
Equinix, Inc. (a) | 296,900 | | 25,011 |
Google, Inc. Class A (a) | 99,000 | | 60,686 |
| | 85,697 |
IT Services - 0.7% |
Paychex, Inc. | 1,385,530 | | 38,379 |
Semiconductors & Semiconductor Equipment - 0.8% |
Altera Corp. | 1,435,060 | | 44,788 |
Common Stocks - continued |
| Shares | | Value (000s) |
INFORMATION TECHNOLOGY - continued |
Software - 0.5% |
Citrix Systems, Inc. (a) | 395,902 | | $ 25,365 |
TOTAL INFORMATION TECHNOLOGY | | 612,002 |
MATERIALS - 2.5% |
Metals & Mining - 2.5% |
Alcoa, Inc. | 1,632,959 | | 21,441 |
Newmont Mining Corp. | 346,470 | | 21,090 |
Nucor Corp. | 494,900 | | 18,915 |
Steel Dynamics, Inc. | 1,484,600 | | 21,556 |
United States Steel Corp. (d) | 1,187,693 | | 50,821 |
| | 133,823 |
TELECOMMUNICATION SERVICES - 6.7% |
Diversified Telecommunication Services - 0.4% |
Iliad Group SA | 191,005 | | 21,501 |
Wireless Telecommunication Services - 6.3% |
American Tower Corp. Class A (a) | 791,722 | | 40,861 |
Clearwire Corp. Class A (a)(d) | 4,783,479 | | 33,915 |
SOFTBANK CORP. | 692,800 | | 22,249 |
Sprint Nextel Corp. (a) | 46,397,699 | | 191,159 |
Vodafone Group PLC sponsored ADR | 1,979,292 | | 54,450 |
| | 342,634 |
TOTAL TELECOMMUNICATION SERVICES | | 364,135 |
TOTAL COMMON STOCKS (Cost $4,728,892) | 5,175,494 |
Money Market Funds - 8.5% |
| Shares | | Value (000s) |
Fidelity Cash Central Fund, 0.23% (b) | 136,327,358 | | $ 136,327 |
Fidelity Securities Lending Cash Central Fund, 0.24% (b)(c) | 319,496,836 | | 319,497 |
TOTAL MONEY MARKET FUNDS (Cost $455,824) | 455,824 |
TOTAL INVESTMENT PORTFOLIO - 104.6% (Cost $5,184,716) | | 5,631,318 |
NET OTHER ASSETS (LIABILITIES) - (4.6)% | | (248,244) |
NET ASSETS - 100% | $ 5,383,074 |
Legend |
(a) Non-income producing |
(b) Affiliated fund that is available only to investment companies and other accounts managed by Fidelity Investments. The rate quoted is the annualized seven-day yield of the fund at period end. A complete unaudited listing of the fund's holdings as of its most recent quarter end is available upon request. In addition, each Fidelity Central Fund's financial statements, which are not covered by the Fund's report of Independent Registered Public Accounting Firm, are available on the SEC's website or upon request. |
(c) Investment made with cash collateral received from securities on loan. |
(d) Security or a portion of the security is on loan at period end. |
(e) Affiliated company |
Affiliated Central Funds |
Information regarding fiscal year to date income earned by the Fund from investments in Fidelity Central Funds is as follows: |
Fund | Income earned
(Amounts in thousands) |
Fidelity Cash Central Fund | $ 1,053 |
Fidelity Securities Lending Cash Central Fund | 1,276 |
Total | $ 2,329 |
Other Affiliated Issuers |
An affiliated company is a company in which the Fund has ownership of at least 5% of the voting securities. Fiscal year to date transactions with companies which are or were affiliates are as follows: |
Affiliate
(Amounts in thousands) | Value,
beginning of
period | Purchases | Sales
Proceeds | Dividend
Income | Value,
end of
period |
AMR Corp. | $ 106,576 | $ 6,566 | $ 143,714 | $ - | $ - |
Cbeyond, Inc. | 25,670 | - | 24,980 | - | - |
Continental Airlines, Inc. Class B | 105,889 | 35,858 | 23,236 | - | - |
James River Coal Co. | 34,883 | - | 34,548 | - | - |
Transcend Services, Inc. | - | 9,787 | - | - | 10,894 |
US Airways Group, Inc. | 23,575 | 22,909 | 2,688 | - | 117,710 |
Total | $ 296,593 | $ 75,120 | $ 229,166 | $ - | $ 128,604 |
Other Information |
The following is a summary of the inputs used, as of October 31, 2010, involving the Fund's assets and liabilities carried at fair value. The inputs or methodology used for valuing securities may not be an indication of the risk associated with investing in those securities. For more information on valuation inputs, and their aggregation into the levels used in the table below, please refer to the Security Valuation section in the accompanying Notes to Financial Statements. |
Valuation Inputs at Reporting Date: |
Description
(Amounts in thousands) | Total | Level 1 | Level 2 | Level 3 |
Investments in Securities: | | | | |
Equities: | | | | |
Consumer Discretionary | $ 1,485,355 | $ 1,485,355 | $ - | $ - |
Consumer Staples | 241,916 | 241,916 | - | - |
Energy | 367,509 | 367,509 | - | - |
Financials | 423,817 | 423,817 | - | - |
Health Care | 139,410 | 139,410 | - | - |
Industrials | 1,407,527 | 1,407,527 | - | - |
Information Technology | 612,002 | 612,002 | - | - |
Materials | 133,823 | 133,823 | - | - |
Telecommunication Services | 364,135 | 341,886 | 22,249 | - |
Money Market Funds | 455,824 | 455,824 | - | - |
Total Investments in Securities: | $ 5,631,318 | $ 5,609,069 | $ 22,249 | $ - |
Income Tax Information |
At October 31, 2010, the Fund had a capital loss carryforward of approximately $642,471,000 all of which will expire on October 31, 2016. Capital loss carryforwards are only available to offset future capital gains of the Fund to the extent provided by regulations and may be limited. |
See accompanying notes which are an integral part of the financial statements.
Annual Report
Statement of Assets and Liabilities
Amounts in thousands (except per-share amounts) | October 31, 2010 |
| | |
Assets | | |
Investment in securities, at value (including securities loaned of $315,935) - See accompanying schedule: Unaffiliated issuers (cost $4,548,236) | $ 5,046,890 | |
Fidelity Central Funds (cost $455,824) | 455,824 | |
Other affiliated issuers (cost $180,656) | 128,604 | |
Total Investments (cost $5,184,716) | | $ 5,631,318 |
Receivable for investments sold | | 149,061 |
Receivable for fund shares sold | | 4,359 |
Dividends receivable | | 1,071 |
Distributions receivable from Fidelity Central Funds | | 219 |
Other receivables | | 349 |
Total assets | | 5,786,377 |
| | |
Liabilities | | |
Payable for investments purchased | $ 75,660 | |
Payable for fund shares redeemed | 4,505 | |
Accrued management fee | 2,496 | |
Other affiliated payables | 974 | |
Other payables and accrued expenses | 171 | |
Collateral on securities loaned, at value | 319,497 | |
Total liabilities | | 403,303 |
| | |
Net Assets | | $ 5,383,074 |
Net Assets consist of: | | |
Paid in capital | | $ 5,593,078 |
Distributions in excess of net investment income | | (93) |
Accumulated undistributed net realized gain (loss) on investments and foreign currency transactions | | (656,498) |
Net unrealized appreciation (depreciation) on investments and assets and liabilities in foreign currencies | | 446,587 |
Net Assets | | $ 5,383,074 |
See accompanying notes which are an integral part of the financial statements.
Annual Report
Statement of Assets and Liabilities - continued
Amounts in thousands (except per-share amounts) | October 31, 2010 |
| | |
Capital Appreciation:
Net Asset Value, offering price and redemption price per share ($4,671,565 ÷ 194,442 shares) | | $ 24.03 |
| | |
Class K:
Net Asset Value, offering price and redemption price per share ($711,509 ÷ 29,540 shares) | | $ 24.09 |
See accompanying notes which are an integral part of the financial statements.
Annual Report
Financial Statements - continued
Statement of Operations
Amounts in thousands | Year ended October 31, 2010 |
| | |
Investment Income | | |
Dividends | | $ 51,959 |
Interest | | 1 |
Income from Fidelity Central Funds | | 2,329 |
Total income | | 54,289 |
| | |
Expenses | | |
Management fee
Basic fee | $ 29,605 | |
Performance adjustment | 3,175 | |
Transfer agent fees | 11,352 | |
Accounting and security lending fees | 1,193 | |
Custodian fees and expenses | 144 | |
Independent trustees' compensation | 31 | |
Registration fees | 86 | |
Audit | 66 | |
Legal | 28 | |
Miscellaneous | 72 | |
Total expenses before reductions | 45,752 | |
Expense reductions | (1,042) | 44,710 |
Net investment income (loss) | | 9,579 |
Realized and Unrealized Gain (Loss) Net realized gain (loss) on: | | |
Investment securities: | | |
Unaffiliated issuers | 290,585 | |
Other affiliated issuers | (245,010) | |
Foreign currency transactions | (843) | |
Capital gain distribution from Fidelity Central Funds | 11 | |
Total net realized gain (loss) | | 44,743 |
Change in net unrealized appreciation (depreciation) on: Investment securities | 1,258,916 | |
Assets and liabilities in foreign currencies | (33) | |
Total change in net unrealized appreciation (depreciation) | | 1,258,883 |
Net gain (loss) | | 1,303,626 |
Net increase (decrease) in net assets resulting from operations | | $ 1,313,205 |
See accompanying notes which are an integral part of the financial statements.
Annual Report
Statement of Changes in Net Assets
Amounts in thousands | Year ended
October 31,
2010 | Year ended
October 31,
2009 |
Increase (Decrease) in Net Assets | | |
Operations | | |
Net investment income (loss) | $ 9,579 | $ 12,057 |
Net realized gain (loss) | 44,743 | 183,369 |
Change in net unrealized appreciation (depreciation) | 1,258,883 | 368,356 |
Net increase (decrease) in net assets resulting
from operations | 1,313,205 | 563,782 |
Distributions to shareholders from net investment income | (5,772) | (53,246) |
Share transactions - net increase (decrease) | (834,386) | (487,277) |
Total increase (decrease) in net assets | 473,047 | 23,259 |
| | |
Net Assets | | |
Beginning of period | 4,910,027 | 4,886,768 |
End of period (including distributions in excess of net investment income of $93 and distributions in excess of net investment income of $90, respectively) | $ 5,383,074 | $ 4,910,027 |
See accompanying notes which are an integral part of the financial statements.
Annual Report
Financial Highlights - Capital Appreciation
Years ended October 31, | 2010 | 2009 | 2008 | 2007 | 2006 |
Selected Per-Share Data | | | | |
Net asset value, beginning of period | $ 18.71 | $ 16.68 | $ 32.13 | $ 27.41 | $ 26.22 |
Income from Investment Operations | | | | | |
Net investment income (loss) B | .04 | .04 | .16 | .11 | .10 |
Net realized and unrealized gain (loss) | 5.30 | 2.17 | (13.27) | 6.06 | 3.55 |
Total from investment operations | 5.34 | 2.21 | (13.11) | 6.17 | 3.65 |
Distributions from net investment income | (.02) | (.18) | (.12) | (.11) | - |
Distributions from net realized gain | - | - | (2.22) | (1.34) | (2.46) |
Total distributions | (.02) | (.18) | (2.34) | (1.45) | (2.46) |
Net asset value, end of period | $ 24.03 | $ 18.71 | $ 16.68 | $ 32.13 | $ 27.41 |
Total Return A | 28.57% | 13.54% | (43.80)% | 23.51% | 14.70% |
Ratios to Average Net Assets C, E | | | | |
Expenses before reductions | .88% | .79% | .82% | .83% | .91% |
Expenses net of fee waivers, if any | .88% | .79% | .82% | .83% | .91% |
Expenses net of all reductions | .86% | .78% | .82% | .82% | .87% |
Net investment income (loss) | .16% | .25% | .67% | .36% | .36% |
Supplemental Data | | | | |
Net assets, end of period (in millions) | $ 4,672 | $ 4,627 | $ 4,794 | $ 10,139 | $ 8,353 |
Portfolio turnover rate D | 186% | 243% | 157% | 135% | 198% |
A Total returns would have been lower had certain expenses not been reduced during the periods shown.
B Calculated based on average shares outstanding during the period.
C Fees and expenses of the underlying Fidelity Central Funds are not included in the Fund's expense ratio. The Fund indirectly bears its proportionate share of the expenses of any underlying Fidelity Central Funds.
D Amount does not include the portfolio activity of any underlying Fidelity Central Funds.
E Expense ratios reflect operating expenses of the class. Expenses before reductions do not reflect amounts reimbursed by the investment adviser or reductions from brokerage service arrangements or reductions from other expense offset arrangements and do not represent the amount paid by the class during periods when reimbursements or reductions occur. Expenses net of fee waivers reflect expenses after reimbursement by the investment adviser but prior to reductions from brokerage service arrangements or other expense offset arrangements. Expenses net of all reductions represent the net expenses paid by the class.
See accompanying notes which are an integral part of the financial statements.
Annual Report
Financial Highlights - Class K
Years ended October 31, | 2010 | 2009 | 2008 G |
Selected Per-Share Data | | |
Net asset value, beginning of period | $ 18.73 | $ 16.69 | $ 25.11 |
Income from Investment Operations | | | |
Net investment income (loss) D | .08 | .08 | .03 |
Net realized and unrealized gain (loss) | 5.31 | 2.18 | (8.45) |
Total from investment operations | 5.39 | 2.26 | (8.42) |
Distributions from net investment income | (.03) | (.22) | - |
Net asset value, end of period | $ 24.09 | $ 18.73 | $ 16.69 |
Total Return B, C | 28.80% | 13.85% | (33.53)% |
Ratios to Average Net Assets E, H | | |
Expenses before reductions | .70% | .55% | .66% A |
Expenses net of fee waivers, if any | .70% | .55% | .66% A |
Expenses net of all reductions | .68% | .54% | .65% A |
Net investment income (loss) | .34% | .49% | .41% A |
Supplemental Data | | |
Net assets, end of period (in millions) | $ 712 | $ 283 | $ 93 |
Portfolio turnover rate F | 186% | 243% | 157% |
A Annualized
B Total returns for periods of less than one year are not annualized.
C Total returns would have been lower had certain expenses not been reduced during the periods shown.
D Calculated based on average shares outstanding during the period.
E Fees and expenses of the underlying Fidelity Central Funds are not included in the Fund's expense ratio. The Fund indirectly bears its proportionate share of the expenses of any underlying Fidelity Central Funds.
F Amount does not include the portfolio activity of any underlying Fidelity Central Funds.
G For the period May 9, 2008 (commencement of sale of shares) to October 31, 2008.
H Expense ratios reflect operating expenses of the class. Expenses before reductions do not reflect amounts reimbursed by the investment adviser or reductions from brokerage service arrangements or reductions from other expense offset arrangements and do not represent the amount paid by the class during periods when reimbursements or reductions occur. Expense ratios before reductions for start-up periods may not be representative of longer-term operating periods. Expenses net of fee waivers reflect expenses after reimbursement by the investment adviser but prior to reductions from brokerage service arrangements or other expense offset arrangements. Expenses net of all reductions represent the net expenses paid by the class.
See accompanying notes which are an integral part of the financial statements.
Annual Report
Notes to Financial Statements
For the period ended October 31, 2010
(Amounts in thousands except ratios)
1. Organization.
Fidelity Capital Appreciation Fund (the Fund) is a fund of Fidelity Capital Trust (the Trust) and is authorized to issue an unlimited number of shares. The trust is registered under the Investment Company Act of 1940, as amended (the 1940 Act), as an open-end management investment company organized as a Massachusetts business trust. The Fund offers Capital Appreciation and Class K shares, each of which has equal rights as to assets and voting privileges. Each class has exclusive voting rights with respect to matters that affect that class. Investment income, realized and unrealized capital gains and losses, the common expenses of the Fund, and certain fund-level expense reductions, if any, are allocated on a pro-rata basis to each class based on the relative net assets of each class to the total net assets of the Fund. Each class differs with respect to transfer agent fees incurred. Certain expense reductions also differ by class.
2. Investments in Fidelity Central Funds.
The Fund may invest in Fidelity Central Funds, which are open-end investment companies available only to other investment companies and accounts managed by Fidelity Management & Research Company (FMR) and its affiliates. The Fund's Schedule of Investments lists each of the Fidelity Central Funds held as of period end, if any, as an investment of the Fund, but does not include the underlying holdings of each Fidelity Central Fund. As an Investing Fund, the Fund indirectly bears its proportionate share of the expenses of the underlying Fidelity Central Funds.
The Money Market Central Funds seek preservation of capital and current income and are managed by Fidelity Investments Money Management, Inc. (FIMM), an affiliate of FMR.
A complete unaudited list of holdings for each Fidelity Central Fund is available upon request or at the Securities and Exchange Commission (the SEC) web site at www.sec.gov. In addition, the financial statements of the Fidelity Central Funds, which are not covered by the Fund's Report of Independent Registered Public Accounting Firm, are available on the SEC web site or upon request.
3. Significant Accounting Policies.
The financial statements have been prepared in conformity with accounting principles generally accepted in the United States of America (GAAP), which require management to make certain estimates and assumptions at the date of the financial statements. Actual results could differ from those estimates. The following summarizes the significant accounting policies of the Fund:
Security Valuation. Investments are valued as of 4:00 p.m. Eastern time on the last calendar day of the period. The Fund uses independent pricing services approved by the
Annual Report
Notes to Financial Statements - continued
(Amounts in thousands except ratios)
3. Significant Accounting Policies - continued
Security Valuation - continued
Board of Trustees to value its investments. When current market prices or quotations are not readily available or reliable, valuations may be determined in good faith in accordance with procedures adopted by the Board of Trustees. Factors used in determining value may include market or security specific events. The frequency with which these procedures are used cannot be predicted and they may be utilized to a significant extent. The value used for net asset value (NAV) calculation under these procedures may differ from published prices for the same securities.
The Fund categorizes the inputs to valuation techniques used to value its investments into a disclosure hierarchy consisting of three levels as shown below.
Level 1 - quoted prices in active markets for identical investments
Level 2 - other significant observable inputs (including quoted prices for similar investments, interest rates, prepayment speeds, etc.)
Level 3 - unobservable inputs (including the fund's own assumptions based on the best information available)
Changes in valuation techniques may result in transfers in or out of an assigned level within the disclosure hierarchy. The aggregate value of investments by input level, as of October 31, 2010, is included at the end of the Fund's Schedule of Investments. Valuation techniques used to value the Fund's investments by major category are as follows.
Equity securities, including restricted securities, for which market quotations are readily available, are valued at the last reported sale price or official closing price as reported by an independent pricing service on the primary market or exchange on which they are traded and are categorized as Level 1 in the hierarchy. In the event there were no sales during the day or closing prices are not available, securities are valued at the last quoted bid price or may be valued using the last available price and are generally categorized as Level 2 in the hierarchy. For foreign equity securities, when significant market or security specific events arise, comparisons to the valuation of American Depositary Receipts (ADRs), futures contracts, Exchange-traded funds (ETFs) and certain indexes as well as quoted prices for similar securities are used and are categorized as Level 2 in the hierarchy in these circumstances. Utilizing these techniques may result in transfers between Level 1 and Level 2. For restricted equity securities and private placements where observable inputs are limited, assumptions about market activity and risk are used and are categorized as Level 3 in the hierarchy.
Investments in open-end mutual funds, including the Fidelity Central Funds, are valued at their closing net asset value each business day and are categorized as Level 1 in the hierarchy. Short-term securities with remaining maturities of sixty days or less for which
Annual Report
3. Significant Accounting Policies - continued
Security Valuation - continued
quotations are not readily available are valued at amortized cost, which approximates fair value and are categorized as Level 2 in the hierarchy.
Foreign Currency. The Fund uses foreign currency contracts to facilitate transactions in foreign-denominated securities. Gains and losses from these transactions may arise from changes in the value of the foreign currency or if the counterparties do not perform under the contracts' terms.
Foreign-denominated assets, including investment securities, and liabilities are translated into U.S. dollars at the exchange rate at period end. Purchases and sales of investment securities, income and dividends received and expenses denominated in foreign currencies are translated into U.S. dollars at the exchange rate in effect on the transaction date.
The effects of exchange rate fluctuations on investments are included with the net realized and unrealized gain (loss) on investment securities. Other foreign currency transactions resulting in realized and unrealized gain (loss) are disclosed separately.
Investment Transactions and Income. For financial reporting purposes, the Fund's investment holdings and NAV include trades executed through the end of the last business day of the period. The NAV per share for processing shareholder transactions is calculated as of the close of business of the New York Stock Exchange (NYSE), normally 4:00 p.m. Eastern time and includes trades executed through the end of the prior business day. Gains and losses on securities sold are determined on the basis of identified cost and may include proceeds received from litigation. Dividend income is recorded on the ex-dividend date, except for certain dividends from foreign securities where the ex-dividend date may have passed, which are recorded as soon as the Fund is informed of the ex-dividend date. Non-cash dividends included in dividend income, if any, are recorded at the fair market value of the securities received. Distributions received on securities that represent a return of capital or capital gain are recorded as a reduction of cost of investments and/or as a realized gain. The Fund estimates the components of distributions received that may be considered return of capital distributions or capital gain distributions. As a result of a change in the estimate of the return of capital component of dividend income realized in the year ended October 31, 2009, dividend income has been increased $7,146, with a corresponding decrease to net unrealized appreciation (depreciation). The change in estimate has no impact on total net assets or total return of the Fund. Interest income and distributions from the Fidelity Central Funds are accrued as earned. Interest income includes coupon interest and amortization of premium and accretion of discount on debt securities. Investment income is recorded net of foreign taxes withheld where recovery of such taxes is uncertain.
Annual Report
Notes to Financial Statements - continued
(Amounts in thousands except ratios)
3. Significant Accounting Policies - continued
Expenses. Most expenses of the Trust can be directly attributed to a fund. Expenses which cannot be directly attributed are apportioned amongst each fund in the Trust. Expense estimates are accrued in the period to which they relate and adjustments are made when actual amounts are known.
Deferred Trustee Compensation. Under a Deferred Compensation Plan (the Plan), independent Trustees may elect to defer receipt of a portion of their annual compensation. Deferred amounts are invested in a cross-section of Fidelity funds, are marked-to-market and remain in the Fund until distributed in accordance with the Plan. The investment of deferred amounts and the offsetting payable to the Trustees are included in the accompanying Statement of Assets and Liabilities.
Income Tax Information and Distributions to Shareholders. Each year the Fund intends to qualify as a regulated investment company, including distributing substantially all of its taxable income and realized gains under Subchapter M of the Internal Revenue Code and filing its U.S. federal tax return. As a result, no provision for income taxes is required. As of October 31, 2010, the Fund did not have any unrecognized tax benefits in the accompanying financial statements. A fund's federal tax return is subject to examination by the Internal Revenue Service (IRS) for a period of three years. Foreign taxes are provided for based on the Fund's understanding of the tax rules and rates that exist in the foreign markets in which it invests.
Distributions are declared and recorded on the ex-dividend date. Income dividends and capital gain distributions are declared separately for each class. Income and capital gain distributions are determined in accordance with income tax regulations, which may differ from GAAP.
Capital accounts within the financial statements are adjusted for permanent book-tax differences. These adjustments have no impact on net assets or the results of operations. Temporary book-tax differences will reverse in a subsequent period.
Book-tax differences are primarily due to the short-term gain distributions from the Fidelity Central Funds, foreign currency transactions, deferred trustees compensation, capital loss carryforwards and losses deferred due to wash sales.
The federal tax cost of investment securities and unrealized appreciation (depreciation) as of period end were as follows:
Gross unrealized appreciation | $ 741,080 |
Gross unrealized depreciation | (308,505) |
Net unrealized appreciation (depreciation) | $ 432,575 |
| |
Tax Cost | $ 5,198,743 |
Annual Report
3. Significant Accounting Policies - continued
Income Tax Information and Distributions to Shareholders - continued
The tax-based components of distributable earnings as of period end were as follows:
Capital loss carryforward | $ (642,471) |
Net unrealized appreciation (depreciation) | $ 432,560 |
The tax character of distributions paid was as follows:
| October 31, 2010 | October 31, 2009 |
Ordinary Income | $ 5,772 | $ 53,246 |
4. Purchases and Sales of Investments.
Purchases and sales of securities, other than short-term securities, aggregated $8,845,563 and $9,503,135, respectively.
5. Fees and Other Transactions with Affiliates.
Management Fee. FMR and its affiliates provide the Fund with investment management related services for which the Fund pays a monthly management fee. The management fee is the sum of an individual fund fee rate that is based on an annual rate of .30% of the Fund's average net assets and a group fee rate that averaged .26% during the period. The group fee rate is based upon the average net assets of all the mutual funds advised by FMR. The group fee rate decreases as assets under management increase and increases as assets under management decrease. In addition, the management fee is subject to a performance adjustment (up to a maximum of ± .20% of the Fund's average net assets over a 36 month performance period). The upward or downward adjustment to the management fee is based on the relative investment performance of the retail class of the Fund, Capital Appreciation as compared to an appropriate benchmark index. For the period, the total annual management fee rate, including the performance adjustment, was .62% of the Fund's average net assets.
Transfer Agent Fees. Fidelity Investments Institutional Operations Company, Inc. (FIIOC), an affiliate of FMR, is the transfer, dividend disbursing and shareholder servicing agent for each class of the Fund. FIIOC receives account fees and asset-based fees that vary according to the account size and type of account of the shareholders of Capital Appreciation. FIIOC receives an asset-based fee of Class K's average net assets. FIIOC
Annual Report
Notes to Financial Statements - continued
(Amounts in thousands except ratios)
5. Fees and Other Transactions with Affiliates - continued
Transfer Agent Fees - continued
pays for typesetting, printing and mailing of shareholder reports, except proxy statements. For the period, transfer agent fees for each class were as follows:
| Amount | % of
Average
Net Assets |
Capital Appreciation | $ 11,046 | .23 |
Class K | 306 | .05 |
| $ 11,352 | |
Accounting and Security Lending Fees. Fidelity Service Company, Inc. (FSC), an affiliate of FMR, maintains the Fund's accounting records. The accounting fee is based on the level of average net assets for the month. Under a separate contract, FSC administers the security lending program. The security lending fee is based on the number and duration of lending transactions.
Brokerage Commissions. The Fund placed a portion of its portfolio transactions with brokerage firms which are affiliates of the investment adviser. The commissions paid to these affiliated firms were $351 for the period.
6. Committed Line of Credit.
The Fund participates with other funds managed by FMR or an affiliate in a $3.75 billion credit facility (the "line of credit") to be utilized for temporary or emergency purposes to fund shareholder redemptions or for other short-term liquidity purposes. The Fund has agreed to pay commitment fees on its pro-rata portion of the line of credit, which amounted to $21 and is reflected in Miscellaneous expenses on the Statement of Operations. During the period, there were no borrowings on this line of credit.
7. Security Lending.
The Fund lends portfolio securities through a lending agent from time to time in order to earn additional income. The lending agent may loan securities to certain qualified borrowers, including Fidelity Capital Markets (FCM), a broker-dealer affiliated with the Fund. On the settlement date of the loan, the Fund receives collateral (in the form of U.S. Treasury obligations, letters of credit and/or cash) against the loaned securities and maintains collateral in an amount not less than 100% of the market value of the loaned securities during the period of the loan. The market value of the loaned securities is determined at the close of business of the Fund and any additional required collateral is delivered to the Fund on the next business day. If the borrower defaults on its obligation to return the securities loaned because of insolvency or other reasons, a fund could
Annual Report
7. Security Lending - continued
experience delays and costs in recovering the securities loaned or in gaining access to the collateral. Any cash collateral received is invested in the Fidelity Securities Lending Cash Central Fund. The value of loaned securities and cash collateral at period end are disclosed on the Fund's Statement of Assets and Liabilities. The value of securities loaned to FCM at period end was $420. Security lending income represents the income earned on investing cash collateral, less rebates paid to borrowers and lending agent fees associated with the loan, plus any premium payments received for lending certain types of securities. Security lending income is presented in the Statement of Operations as a component of income from Fidelity Central Funds. Total security lending income during the period amounted to $1,276, including $5 from securities loaned to FCM.
8. Expense Reductions.
Many of the brokers with whom FMR places trades on behalf of the Fund provided services to the Fund in addition to trade execution. These services included payments of certain expenses on behalf of the Fund totaling $1,042 for the period.
9. Distributions to Shareholders.
Distributions to shareholders of each class were as follows:
Years ended October 31, | 2010 | 2009 |
From net investment income | | |
Capital Appreciation | $ 5,336 | $ 51,796 |
Class K | 436 | 1,450 |
Total | $ 5,772 | $ 53,246 |
10. Share Transactions.
Transactions for each class of shares were as follows:
| Shares | Dollars |
Years ended October 31, | 2010 | 2009A | 2010 | 2009A |
Capital Appreciation | | | | |
Shares sold | 24,608 | 32,746 | $ 544,840 | $ 532,909 |
Conversion to Class K | - | (9,081) | - | (137,950) |
Reinvestment of distributions | 250 | 3,319 | 5,154 | 49,955 |
Shares redeemed | (77,678) | (67,177) | (1,707,314) | (1,079,034) |
Net increase (decrease) | (52,820) | (40,193) | $ (1,157,320) | $ (634,120) |
Annual Report
Notes to Financial Statements - continued
(Amounts in thousands except ratios)
10. Share Transactions - continued
| Shares | Dollars |
Years ended October 31, | 2010 | 2009A | 2010 | 2009A |
Class K | | | | |
Shares sold | 22,592 | 3,750 | $ 500,526 | $ 63,798 |
Conversion from Capital Appreciation | - | 9,086 | - | 137,950 |
Reinvestment of distributions | 21 | 96 | 436 | 1,450 |
Shares redeemed | (8,191) | (3,358) | (178,028) | (56,355) |
Net increase (decrease) | 14,422 | 9,574 | $ 322,934 | $ 146,843 |
A Conversion transactions for Class K and Capital Appreciation are presented for the period November 1, 2008, through August 31, 2009.
11. Other.
The Fund's organizational documents provide former and current trustees and officers with a limited indemnification against liabilities arising in connection with the performance of their duties to the Fund. In the normal course of business, the Fund may also enter into contracts that provide general indemnifications. The Fund's maximum exposure under these arrangements is unknown as this would be dependent on future claims that may be made against the Fund. The risk of material loss from such claims is considered remote.
Annual Report
To the Trustees of Fidelity Capital Trust and the Shareholders of Fidelity Capital Appreciation Fund:
In our opinion, the accompanying statement of assets and liabilities, including the schedule of investments, and the related statements of operations and of changes in net assets and the financial highlights present fairly, in all material respects, the financial position of Fidelity Capital Appreciation Fund (a fund of Fidelity Capital Trust) at October 31, 2010, the results of its operations for the year then ended, the changes in its net assets for each of the two years in the period then ended and the financial highlights for each of the periods indicated, in conformity with accounting principles generally accepted in the United States of America. These financial statements and financial highlights (hereafter referred to as "financial statements") are the responsibility of the Fidelity Capital Appreciation Fund's management. Our responsibility is to express an opinion on these financial statements based on our audits. We conducted our audits of these financial statements in accordance with the standards of the Public Company Accounting Oversight Board (United States). Those standards require that we plan and perform the audit to obtain reasonable assurance about whether the financial statements are free of material misstatement. An audit includes examining, on a test basis, evidence supporting the amounts and disclosures in the financial statements, assessing the accounting principles used and significant estimates made by management, and evaluating the overall financial statement presentation. We believe that our audits, which included confirmation of securities at October 31, 2010 by correspondence with the custodian and brokers, provide a reasonable basis for our opinion.
/s/ PricewaterhouseCoopers LLP
PricewaterhouseCoopers LLP
Boston, Massachusetts
December 10, 2010
Annual Report
The Trustees, Member of the Advisory Board, and executive officers of the trust and fund, as applicable, are listed below. The Board of Trustees governs the fund and is responsible for protecting the interests of shareholders. The Trustees are experienced executives who meet periodically throughout the year to oversee the fund's activities, review contractual arrangements with companies that provide services to the fund, oversee management of the risks associated with such activities and contractual arrangements, and review the fund's performance. Except for James C. Curvey, each of the Trustees oversees 221 funds advised by FMR or an affiliate. Mr. Curvey oversees 410 funds advised by FMR or an affiliate.
The Trustees hold office without limit in time except that (a) any Trustee may resign; (b) any Trustee may be removed by written instrument, signed by at least two-thirds of the number of Trustees prior to such removal; (c) any Trustee who requests to be retired or who has become incapacitated by illness or injury may be retired by written instrument signed by a majority of the other Trustees; and (d) any Trustee may be removed at any special meeting of shareholders by a two-thirds vote of the outstanding voting securities of the trust. Each Trustee who is not an interested person (as defined in the 1940 Act) (Independent Trustee), shall retire not later than the last day of the calendar year in which his or her 72nd birthday occurs. The Independent Trustees may waive this mandatory retirement age policy with respect to individual Trustees. The executive officers and Advisory Board Member hold office without limit in time, except that any officer and Advisory Board Member may resign or may be removed by a vote of a majority of the Trustees at any regular meeting or any special meeting of the Trustees. Except as indicated, each individual has held the office shown or other offices in the same company for the past five years.
Experience, Skills, Attributes, and Qualifications of the Fund's Trustees. The Governance and Nominating Committee has adopted a statement of policy that describes the experience, qualifications, attributes, and skills that are necessary and desirable for potential Independent Trustee candidates (Statement of Policy). The Board believes that each Trustee satisfied at the time he or she was initially elected or appointed a Trustee, and continues to satisfy, the standards contemplated by the Statement of Policy. The Governance and Nominating Committee also engages professional search firms to help identify potential Independent Trustee candidates who have the experience, qualifications, attributes, and skills consistent with the Statement of Policy. From time to time, additional criteria based on the composition and skills of the current Independent Trustees, as well as experience or skills that may be appropriate in light of future changes to board composition, business conditions, and regulatory or other developments, have also been considered by the professional search firms and the Governance and Nominating Committee. In addition, the Board takes into account the Trustees' commitment and participation in Board and committee meetings, as well as their leadership of standing and ad hoc committees throughout their tenure.
In determining that a particular Trustee was and continues to be qualified to serve as a Trustee, the Board has considered a variety of criteria, none of which, in isolation, was controlling. The Board believes that, collectively, the Trustees have balanced and diverse experience, qualifications, attributes, and skills, which allow the Board to operate effectively in governing the fund and protecting the interests of shareholders. Information about the specific experience, skills, attributes, and qualifications of each Trustee, which in each case led to the Board's conclusion that the Trustee should serve (or continue to serve) as a trustee of the fund, is provided below.
Annual Report
Trustees and Officers - continued
Board Structure and Oversight Function. Edward C. Johnson 3d is an interested person (as defined in the 1940 Act) and currently serves as Chairman. The Trustees have determined that an interested Chairman is appropriate and benefits shareholders because an interested Chairman has a personal and professional stake in the quality and continuity of services provided to the fund. Independent Trustees exercise their informed business judgment to appoint an individual of their choosing to serve as Chairman, regardless of whether the Trustee happens to be independent or a member of management. The Independent Trustees have determined that they can act independently and effectively without having an Independent Trustee serve as Chairman and that a key structural component for assuring that they are in a position to do so is for the Independent Trustees to constitute a substantial majority for the Board. The Independent Trustees also regularly meet in executive session. Ned C. Lautenbach serves as Chairman of the Independent Trustees and as such (i) acts as a liaison between the Independent Trustees and management with respect to matters important to the Independent Trustees and (ii) with management prepares agendas for Board meetings.
Fidelity funds are overseen by different Boards of Trustees. The fund's Board oversees Fidelity's equity and high income funds and another Board oversees Fidelity's investment-grade bond, money market, and asset allocation funds. The asset allocation funds may invest in Fidelity funds overseen by the fund's Board. The use of separate Boards, each with its own committee structure, allows the Trustees of each group of Fidelity funds to focus on the unique issues of the funds they oversee, including common research, investment, and operational issues. On occasion, the separate Boards establish joint committees to address issues of overlapping consequences for the Fidelity funds overseen by each Board.
The Trustees operate using a system of committees to facilitate the timely and efficient consideration of all matters of importance to the Trustees, the fund, and fund shareholders and to facilitate compliance with legal and regulatory requirements and oversight of the fund's activities and associated risks. The Board, acting through its committees, has charged FMR and its affiliates with (i) identifying events or circumstances the occurrence of which could have demonstrably adverse effects on the fund's business and/or reputation; (ii) implementing processes and controls to lessen the possibility that such events or circumstances occur or to mitigate the effects of such events or circumstances if they do occur; and (iii) creating and maintaining a system designed to evaluate continuously business and market conditions in order to facilitate the identification and implementation processes described in (i) and (ii) above. Because the day-to-day operations and activities of the fund are carried out by or through FMR, its affiliates and other service providers, the fund's exposure to risks is mitigated but not eliminated by the processes overseen by the Trustees. While each of the Board's committees has responsibility for overseeing different aspects of the fund's activities, oversight is exercised primarily through the Operations, Audit, and Compliance Committees. Appropriate personnel, including but not limited to the fund's Chief Compliance Officer (CCO), FMR's internal auditor, the independent accountants, the fund's Treasurer and portfolio management personnel, make periodic reports to the Board's committees, as appropriate. The responsibilities of each committee, including their oversight responsibilities, are described further under "Standing Committees of the Fund's Trustees."
Annual Report
The fund's Statement of Additional Information (SAI) includes more information about the Trustees. To request a free copy, call Fidelity at 1-800-544-8544.
Interested Trustees*:
Correspondence intended for each Trustee who is an interested person may be sent to Fidelity Investments, 82 Devonshire Street, Boston, Massachusetts 02109.
Name, Age; Principal Occupations and Other Relevant Experience+ |
Edward C. Johnson 3d (80) |
| Year of Election or Appointment: 1978 Mr. Johnson is Trustee and Chairman of the Board of Trustees of certain Trusts. Mr. Johnson serves as Chief Executive Officer, Chairman, and a Director of FMR LLC; Chairman and a Director of FMR; Chairman and a Director of Fidelity Research & Analysis Company (FRAC); Chairman and a Director of Fidelity Investments Money Management, Inc.; and Chairman and a Director of FMR Co., Inc. In addition, Mr. Johnson serves as Chairman and Director of FIL Limited. Previously, Mr. Johnson served as President of FMR LLC (2006-2007). |
James C. Curvey (75) |
| Year of Election or Appointment: 2007 Mr. Curvey also serves as Trustee (2007-present) of other investment companies advised by FMR. Mr. Curvey is a Director of Fidelity Investments Money Management, Inc. (2009-present), Director of Fidelity Research & Analysis Co. (2009-present) and Director of FMR and FMR Co., Inc. (2007-present). Mr. Curvey is also Vice Chairman (2007-present) and Director of FMR LLC. In addition, Mr. Curvey serves as an Overseer for the Boston Symphony Orchestra and a member of the Trustees of Villanova University. Previously, Mr. Curvey was the Vice Chairman (2006-2007) and Director (2000-2007) of FMR Corp. |
* Trustees have been determined to be "Interested Trustees" by virtue of, among other things, their affiliation with the trust or various entities under common control with FMR.
Annual Report
Trustees and Officers - continued
+ The information above includes each Trustee's principal occupation during the last five years and other information relating to the experience, attributes, and skills relevant to each Trustee's qualifications to serve as a Trustee, which led to the conclusion that each Trustee should serve as a Trustee for the fund.
Independent Trustees:
Correspondence intended for each Independent Trustee (that is, the Trustees other than the Interested Trustees) may be sent to Fidelity Investments, P.O. Box 55235, Boston, Massachusetts 02205-5235.
Name, Age; Principal Occupations and Other Relevant Experience+ |
Dennis J. Dirks (62) |
| Year of Election or Appointment: 2005 Prior to his retirement in May 2003, Mr. Dirks was Chief Operating Officer and a member of the Board of The Depository Trust & Clearing Corporation (DTCC). He also served as President, Chief Operating Officer, and Board member of The Depository Trust Company (DTC) and President and Board member of the National Securities Clearing Corporation (NSCC). In addition, Mr. Dirks served as Chief Executive Officer and Board member of the Government Securities Clearing Corporation, Chief Executive Officer and Board member of the Mortgage-Backed Securities Clearing Corporation, as a Trustee and a member of the Finance Committee of Manhattan College (2005-2008), and as a Trustee and a member of the Finance Committee of AHRC of Nassau County (2006-2008). Mr. Dirks is a member of the Independent Directors Council (IDC) Governing Council (2010-Present) and Board of Directors for The Brookville Center for Children's Services, Inc. (2009-present). |
Alan J. Lacy (57) |
| Year of Election or Appointment: 2008 Mr. Lacy serves as Senior Adviser (2007-present) of Oak Hill Capital Partners, L.P. (private equity). Mr. Lacy also served as Chief Executive Officer (2000-2005) and Vice Chairman (2005-2006) of Sears Holdings Corporation and Sears, Roebuck and Co. (retail). In addition, Mr. Lacy serves as a member of the Board of Directors of The Western Union Company (global money transfer, 2006-present) and Bristol-Myers Squibb Company (global pharmaceuticals, 2007-present). Mr. Lacy is Chairman (2008-present) and a member (2006-present) of the Board of Trustees of The National Parks Conservation Association. |
Ned C. Lautenbach (66) |
| Year of Election or Appointment: 2000 Mr. Lautenbach is Chairman of the Independent Trustees of the Equity and High Income Funds (2006-present). Mr. Lautenbach currently serves as the Lead Director of the Eaton Corporation Board of Directors (diversified industrial, 1997-present). Mr. Lautenbach is also a member of the Board of Directors of the Philharmonic Center for the Arts in Naples, Florida (1999-present); a member of the Board of Trustees of Fairfield University (2005-present); and a member of the Council on Foreign Relations (1994-present). Previously, Mr. Lautenbach was a Partner/Advisory Partner at Clayton, Dubilier & Rice, Inc. (private equity investment, 1998-2010), as well as a Director of Sony Corporation (2006-2007). |
Joseph Mauriello (66) |
| Year of Election or Appointment: 2008 Prior to his retirement in January 2006, Mr. Mauriello served in numerous senior management positions including Deputy Chairman and Chief Operating Officer (2004-2005), and Vice Chairman of Financial Services (2002-2004) of KPMG LLP US (professional services, 1965-2005). Mr. Mauriello currently serves as a member of the Board of Directors of XL Group plc. (global insurance and re-insurance, 2006-present) and of Arcadia Resources Inc. (health care services and products, 2007-present). Previously, Mr. Mauriello served as a Director of the Hamilton Funds of the Bank of New York (2006-2007). |
Cornelia M. Small (66) |
| Year of Election or Appointment: 2005 Ms. Small is a member of the Board of Directors of the Teagle Foundation (2009-present). Ms. Small is also a member of the Investment Committee, and Chair (2008-present) and a member of the Board of Trustees of Smith College. In addition, Ms. Small serves on the Investment Committee of the Berkshire Taconic Community Foundation (2008-present). Previously, Ms. Small served as Chairperson of the Investment Committee (2002-2008) of Smith College. In addition, Ms. Small served as Chief Investment Officer, Director of Global Equity Investments, and a member of the Board of Directors of Scudder, Stevens & Clark and Scudder Kemper Investments. |
William S. Stavropoulos (71) |
| Year of Election or Appointment: 2002 Mr. Stavropoulos is Vice Chairman of the Independent Trustees of the Equity and High Income Funds (2006-present). Mr. Stavropoulos serves as President and Founder of the Michigan Baseball Foundation, the Great Lakes Loons (2007-present). Mr. Stavropoulos is Chairman Emeritus of the Board of Directors of The Dow Chemical Company, where he previously served in numerous senior management positions, including President, CEO (1995-2000; 2002-2004), Chairman of the Executive Committee (2000-2006), and as a member of the Board of Directors (1990-2006). Currently, Mr. Stavropoulos is Chairman of Univar (global distributor of commodity and specialty chemicals, 2010-present), a Director of Teradata Corporation (data warehousing and technology solutions, 2008-present), Chemical Financial Corporation, Maersk Inc. (industrial conglomerate), Tyco International, Inc. (multinational manufacturing and services, 2007-present), and a member of the Advisory Board for Metalmark Capital (private equity investment, 2005-
present). Mr. Stavropoulos is a special advisor to Clayton, Dubilier & Rice, Inc. (private equity investment). In addition, Mr. Stavropoulos is a member of the University of Notre Dame Advisory Council for the College of Science. |
David M. Thomas (61) |
| Year of Election or Appointment: 2008 Previously, Mr. Thomas served as Executive Chairman (2005-2006) and Chairman and Chief Executive Officer (2000-2005) of IMS Health, Inc. (pharmaceutical and healthcare information solutions). In addition, Mr. Thomas serves as a member of the Board of Directors of Fortune Brands, Inc. (consumer products), and Interpublic Group of Companies, Inc. (marketing communication, 2004-present). |
Michael E. Wiley (60) |
| Year of Election or Appointment: 2008 Mr. Wiley also serves as a Director of Asia Pacific Exploration Consolidated (international oil and gas exploration and production, 2008-present). Mr. Wiley serves as a Director of Tesoro Corporation (independent oil refiner and marketer, 2005-present), and a Director of Bill Barrett Corporation (exploration and production, 2005-present). In addition, Mr. Wiley also serves as a Director of Post Oak Bank (privately-held bank, 2004-present). Previously, Mr. Wiley served as a member of the Board of Trustees of the University of Tulsa (2000-2006; 2007-2010), as a Senior Energy Advisor of Katzenbach Partners, LLC (consulting, 2006-2007), as an Advisory Director of Riverstone Holdings (private investment), Chairman, President, and CEO of Baker Hughes, Inc. (oilfield services, 2000-2004), and as Director of Spinnaker Exploration Company (exploration and production, 2001-2005). |
Annual Report
+ The information above includes each Trustee's principal occupation during the last five years and other information relating to the experience, attributes, and skills relevant to each Trustee's qualifications to serve as a Trustee, which led to the conclusion that each Trustee should serve as a Trustee for the fund.
Advisory Board Member and Executive Officers:
Correspondence intended for each executive officer and Peter S. Lynch may be sent to Fidelity Investments, 82 Devonshire Street, Boston, Massachusetts 02109.
Name, Age; Principal Occupation |
Peter S. Lynch (66) |
| Year of Election or Appointment: 2003 Member of the Advisory Board of Fidelity's Equity and High Income Funds. Mr. Lynch is Vice Chairman and a Director of FMR and FMR Co., Inc. In addition, Mr. Lynch serves as a Trustee of Boston College and as the Chairman of the Inner-City Scholarship Fund. Previously, Mr. Lynch served on the Special Olympics International Board of Directors (1997-2006). |
Kenneth B. Robins (41) |
| Year of Election or Appointment: 2008 President and Treasurer of Fidelity's Equity and High Income Funds. Mr. Robins also serves as President and Treasurer (2010-present) and Assistant Treasurer (2009-present) of other Fidelity funds and is an employee of Fidelity Investments (2004-present). Previously, Mr. Robins served as Deputy Treasurer of the Fidelity funds (2005-2008) and Treasurer and Chief Financial Officer of The North Carolina Capital Management Trust: Cash and Term Portfolios (2006-2008). |
Bruce T. Herring (45) |
| Year of Election or Appointment: 2006 Vice President of certain Equity Funds. Mr. Herring also serves as Chief Investment Officer and Director of Fidelity Management & Research (U.K.) Inc. (2010-present) and Group Chief Investments Officer of FMR. Previously, Mr. Herring served as Vice President (2005-2006) and Senior Vice President (2006-2007) of Fidelity Management & Research Company, Vice President of FMR Co., Inc. (2001-2007) and as a portfolio manager for Fidelity U.S. Equity Funds. |
Brian B. Hogan (46) |
| Year of Election or Appointment: 2009 Vice President of certain Equity Funds and Vice President of Sector Funds. Mr. Hogan also serves as President of FMR's Equity Division (2009-present). Previously, Mr. Hogan served as Senior Vice President, Equity Research of FMR (2006-2009) and as a portfolio manager. |
Scott C. Goebel (42) |
| Year of Election or Appointment: 2008 Secretary and Chief Legal Officer (CLO) of the Fidelity funds. Mr. Goebel also serves as Secretary and CLO of The North Carolina Capital Management Trust: Cash and Term Portfolio (2008-present); General Counsel, Secretary, and Senior Vice President of FMR (2008-present) and FMR Co., Inc. (2008-present); Deputy General Counsel of FMR LLC; Chief Legal Officer of Fidelity Management & Research (Hong Kong) Limited (2008-present) and Assistant Secretary of Fidelity Management & Research (Japan) Inc. (2008-present), Fidelity Investments Money Management, Inc. (2008-present), Fidelity Management & Research (U.K.) Inc. (2008-present), and Fidelity Research and Analysis Company (2008-present). Previously, Mr. Goebel served as Assistant Secretary of the Funds (2007-2008) and as Vice President and Secretary of Fidelity Distributors Corporation (FDC) (2005-2007). |
William C. Coffey (41) |
| Year of Election or Appointment: 2009 Assistant Secretary of Fidelity's Equity and High Income Funds. Mr. Coffey also serves as Senior Vice President and Deputy General Counsel of FMR LLC (2010-present), and is an employee of Fidelity Investments. Previously, Mr. Coffey served as Vice President and Associate General Counsel of FMR LLC (2005-2009). |
Holly C. Laurent (56) |
| Year of Election or Appointment: 2008 Anti-Money Laundering (AML) Officer of the Fidelity funds. Ms. Laurent also serves as AML Officer of The North Carolina Capital Management Trust: Cash and Term Portfolio (2008-present) and is an employee of Fidelity Investments. Previously, Ms. Laurent was Senior Vice President and Head of Legal for Fidelity Business Services India Pvt. Ltd. (2006-2008), and Senior Vice President, Deputy General Counsel and Group Head for FMR LLC (2005-2006). |
Christine Reynolds (52) |
| Year of Election or Appointment: 2008 Chief Financial Officer of the Fidelity funds. Ms. Reynolds became President of Fidelity Pricing and Cash Management Services (FPCMS) in August 2008. Ms. Reynolds served as Chief Operating Officer of FPCMS (2007-2008). Previously, Ms. Reynolds served as President, Treasurer, and Anti-Money Laundering officer of the Fidelity funds (2004-2007). |
Kenneth A. Rathgeber (63) |
| Year of Election or Appointment: 2004 Chief Compliance Officer of Fidelity's Equity and High Income Funds. Mr. Rathgeber is Chief Compliance Officer of Fidelity Management & Research (Hong Kong) Limited (2008-present), Fidelity Management & Research (Japan) Inc. (2008-present), FMR (2005-present), FMR Co., Inc. (2005-present), Fidelity Management & Research (U.K.) Inc. (2005-present), Fidelity Research & Analysis Company (2005-present), Fidelity Investments Money Management, Inc. (2005-present), Pyramis Global Advisors, LLC (2005-present), and Strategic Advisers, Inc. (2005-present). |
Jeffrey S. Christian (49) |
| Year of Election or Appointment: 2009 Deputy Treasurer of the Fidelity funds. Mr. Christian is an employee of Fidelity Investments. Previously, Mr. Christian served as Chief Financial Officer (2008-2009) of certain Fidelity funds and Senior Vice President of Fidelity Pricing and Cash Management Services (FPCMS) (2004-2009). |
Bryan A. Mehrmann (49) |
| Year of Election or Appointment: 2005 Deputy Treasurer of the Fidelity funds. Mr. Mehrmann is an employee of Fidelity Investments. |
Adrien E. Deberghes (43) |
| Year of Election or Appointment: 2008 Deputy Treasurer of Fidelity's Equity and High Income Funds. Mr. Deberghes also serves as Assistant Treasurer of other Fidelity funds (2010-present) and is an employee of Fidelity Investments (2008-present). Previously, Mr. Deberghes served as Senior Vice President of Mutual Fund Administration at State Street Corporation (2007-2008), Senior Director of Mutual Fund Administration at Investors Bank & Trust (2005-2007), and Director of Finance for Dunkin' Brands (2000-2005). |
Stephanie J. Dorsey (41) |
| Year of Election or Appointment: 2010 Assistant Treasurer of Fidelity's Equity and High Income Funds. Ms. Dorsey also serves as Deputy Treasurer of other Fidelity funds (2008-present) and is an employee of Fidelity Investments (2008-present). Previously, Ms. Dorsey served as Treasurer (2004-2008) of the JPMorgan Mutual Funds and Vice President (2004-2008) of JPMorgan Chase Bank. |
John R. Hebble (52) |
| Year of Election or Appointment: 2009 Assistant Treasurer of Fidelity's Equity and High Income Funds. Mr. Hebble also serves as Treasurer and Chief Financial Officer of The North Carolina Capital Management Trust: Cash and Term Portfolio (2008-present), President and Treasurer of other Fidelity funds (2008-present) and is an employee of Fidelity Investments. |
Gary W. Ryan (52) |
| Year of Election or Appointment: 2005 Assistant Treasurer of the Fidelity funds. Mr. Ryan is an employee of Fidelity Investments. Previously, Mr. Ryan served as Vice President of Fund Reporting in Fidelity Pricing and Cash Management Services (FPCMS) (1999-2005). |
Jonathan Davis (42) |
| Year of Election or Appointment: 2010 Assistant Treasurer of the Fidelity funds. Mr. Davis is an employee of Fidelity Investments. Previously, Mr. Davis served as Vice President and Associate General Counsel of FMR LLC (2003-2010). |
Annual Report
Capital Appreciation Fund designates 100% of the dividends distributed during the fiscal year as qualifying for the dividends-received deduction for corporate shareholders.
Capital Appreciation Fund designates 100% of the dividends distributed during the fiscal year as amounts which may be taken into account as a dividend for the purposes of the maximum rate under section 1(h)(11) of the Internal Revenue Code.
The fund will notify shareholders in January 2011 of amounts for use in preparing 2010 income tax returns.
Annual Report
Board Approval of Investment Advisory Contracts and Management Fees
Fidelity Capital Appreciation Fund
Each year, the Board of Trustees, including the Independent Trustees (together, the Board), votes on the renewal of the management contract and sub-advisory agreements (together, the Advisory Contracts) for the fund. The Board, assisted by the advice of fund counsel and Independent Trustees' counsel, requests and considers a broad range of information relevant to the renewal of the Advisory Contracts throughout the year.
The Board meets regularly and considers at each of its meetings factors that are relevant to its annual consideration of the renewal of the fund's Advisory Contracts, including the services and support provided to the fund and its shareholders. The Board has established various standing committees, each composed of Independent Trustees with varying backgrounds, to which the Board has assigned specific subject matter responsibilities in order to enhance effective decision-making by the Board. The Board, acting directly and through its Committees, requests and receives information concerning the annual consideration of the renewal of the fund's Advisory Contracts. The Board also meets as needed to consider matters specifically related to the Board's annual consideration of the renewal of Advisory Contracts. Members of the Board may also meet with trustees of other Fidelity funds through ad hoc joint committees to discuss certain matters relevant to the Fidelity funds.
At its July 2010 meeting, the Board of Trustees, including the Independent Trustees, unanimously determined to renew the fund's Advisory Contracts. In reaching its determination, the Board considered all factors it believed relevant, including (i) the nature, extent, and quality of the services to be provided to the fund and its shareholders (including the investment performance of the fund); (ii) the competitiveness of the fund's management fee and total expenses; (iii) the total costs of the services to be provided by and the profits to be realized by Fidelity from its relationship with the fund; (iv) the extent to which economies of scale would be realized as the fund grows; and (v) whether fee levels reflect these economies of scale, if any, for the benefit of fund shareholders.
In considering whether to renew the Advisory Contracts for the fund, the Board reached a determination, with the assistance of fund counsel and Independent Trustees' counsel and through the exercise of its business judgment, that the renewal of the Advisory Contracts is in the best interests of fund shareholders and that the compensation to be received by Fidelity under the management contract is fair and reasonable. The Board's decision to renew the Advisory Contracts was not based on any single factor noted above, but rather was based on a comprehensive consideration of all the information provided to the Board at its meetings throughout the year. The Board, in reaching its determination to renew the Advisory Contracts, is aware that shareholders in the fund have a broad range of investment choices available to them, including a wide choice among mutual funds offered by Fidelity's competitors, and that the fund's shareholders, with the opportunity to review and weigh the disclosure provided by the fund in its prospectus and other public disclosures, have chosen to invest in this fund, managed by Fidelity.
Annual Report
Nature, Extent, and Quality of Services Provided. The Board considered the staffing within the investment adviser, FMR, and the sub-advisers (together, the Investment Advisers), including the backgrounds of the fund's investment personnel and the fund's investment objective and discipline. The Independent Trustees also had discussions with senior management of Fidelity's investment operations and investment groups. The Board considered the structure of the portfolio manager compensation program and whether this structure provides appropriate incentives to act in the best interest of the fund.
Resources Dedicated to Investment Management and Support Services. The Board and the equity research subcommittee of the Board's Fund Oversight Committee reviewed the size, education, and experience of the Investment Advisers' investment staff, their use of technology, and the Investment Advisers' approach to recruiting, training, and retaining portfolio managers and other research, advisory, and management personnel. The Board noted that Fidelity's analysts have access to a variety of technological tools and market and securities data that enable them to perform both fundamental and quantitative analysis and to specialize in various disciplines. The Board considered Fidelity's extensive global research capabilities that enable the Investment Advisers to aggregate data from various sources in an effort to produce positive investment results. The Board also considered that Fidelity's portfolio managers and analysts have access to daily portfolio attribution that allows for monitoring of a fund's portfolio, as well as an electronic communication system that provides immediate real-time access to research concerning issuers and credit enhancers. The Board noted FMR's continued focus on strengthening the organization and discipline of equity portfolio management and research.
Shareholder and Administrative Services. The Board considered (i) the nature, extent, quality, and cost of advisory, administrative, and shareholder services performed by the Investment Advisers and their affiliates under the Advisory Contracts and under separate agreements covering transfer agency, pricing and bookkeeping, and securities lending services for the fund; (ii) the nature and extent of the investment adviser's supervision of third party service providers, principally custodians and subcustodians; and (iii) the resources devoted to, and the record of compliance with, the fund's compliance policies and procedures. The Board also reviewed the allocation of fund brokerage, including allocations to brokers affiliated with the Investment Advisers, the use of brokerage commissions to pay fund expenses, and the use of "soft" commission dollars to pay for research services.
The Board noted that the growth of fund assets over time across the complex allows Fidelity to reinvest in the development of services designed to enhance the value or convenience of the Fidelity funds as investment vehicles. These services include 24-hour access to account information and market information through phone representatives and over the Internet, and investor education materials and asset allocation tools.
Annual Report
Board Approval of Investment Advisory Contracts and
Management Fees - continued
Investment in a Large Fund Family. The Board considered the benefits to shareholders of investing in a Fidelity fund, including the benefits of investing in a fund that is part of a large family of funds offering a variety of investment disciplines and providing a large variety of mutual fund investor services. The Board noted that Fidelity had taken, or had made recommendations that resulted in the Fidelity funds taking, a number of actions over the previous year that benefited particular funds, including (i) dedicating additional resources to investment research and restructuring and broadening the focus of the investment research teams; (ii) bolstering the senior management team that oversees asset management; (iii) launching Class F of certain funds as a lower-fee class available to Freedom K and Freedom Index Funds; (iv) lowering the initial investment minimums and ongoing balance requirements for Real Estate High Income Fund; (v) eliminating subsequent purchase minimums for all funds and adding a waiver of the investment minimum requirement for new accounts opened with the proceeds of a systematic withdrawal plan; (vi) eliminating the withdrawal minimum and maximum limits for systematic withdrawals from Advisor funds; (vii) expanding sales load waivers on Class A shares for Destiny Planholders and expanding Institutional Class eligibility for Class O Destiny Planholders; and (viii) changing certain Class A and Class T sales charge structures to further align them with industry practices.
Investment Performance. The Board considered whether the fund has operated in accordance with its investment objective, as well as its record of compliance with its investment restrictions. It also reviewed the fund's absolute investment performance for each class, as well as the fund's relative investment performance for each class measured over multiple periods against (i) a broad-based securities market index, and (ii) a custom peer group of mutual funds deemed appropriate by Fidelity and reviewed by the Board. The following charts considered by the Board show, over the one-, three-, and five-year periods ended December 31, 2009, as available, the cumulative total returns of Class K and the retail class of the fund, the cumulative total returns of a broad-based securities market index ("benchmark"), and a range of cumulative total returns of a custom peer group of mutual funds defined by FMR based on categories assigned by Morningstar, Inc. The box within each chart shows the 25th percentile return (bottom of box) and the 75th percentile return (top of box) of the peer group. Returns shown above the box are in the first quartile and returns shown below the box are in the fourth quartile. The percentage beaten numbers noted below each chart correspond to the percentile box and represent the percentage of funds in the peer group whose performance was equal to or lower than that of the class indicated. The fund's custom peer group, defined by FMR, is a peer group that FMR believes provides a more meaningful performance comparison than the peer group assigned by Morningstar, Inc., which assigns mutual funds to categories based on their investment styles as measured by their underlying portfolio holdings.
Annual Report
Fidelity Capital Appreciation Fund
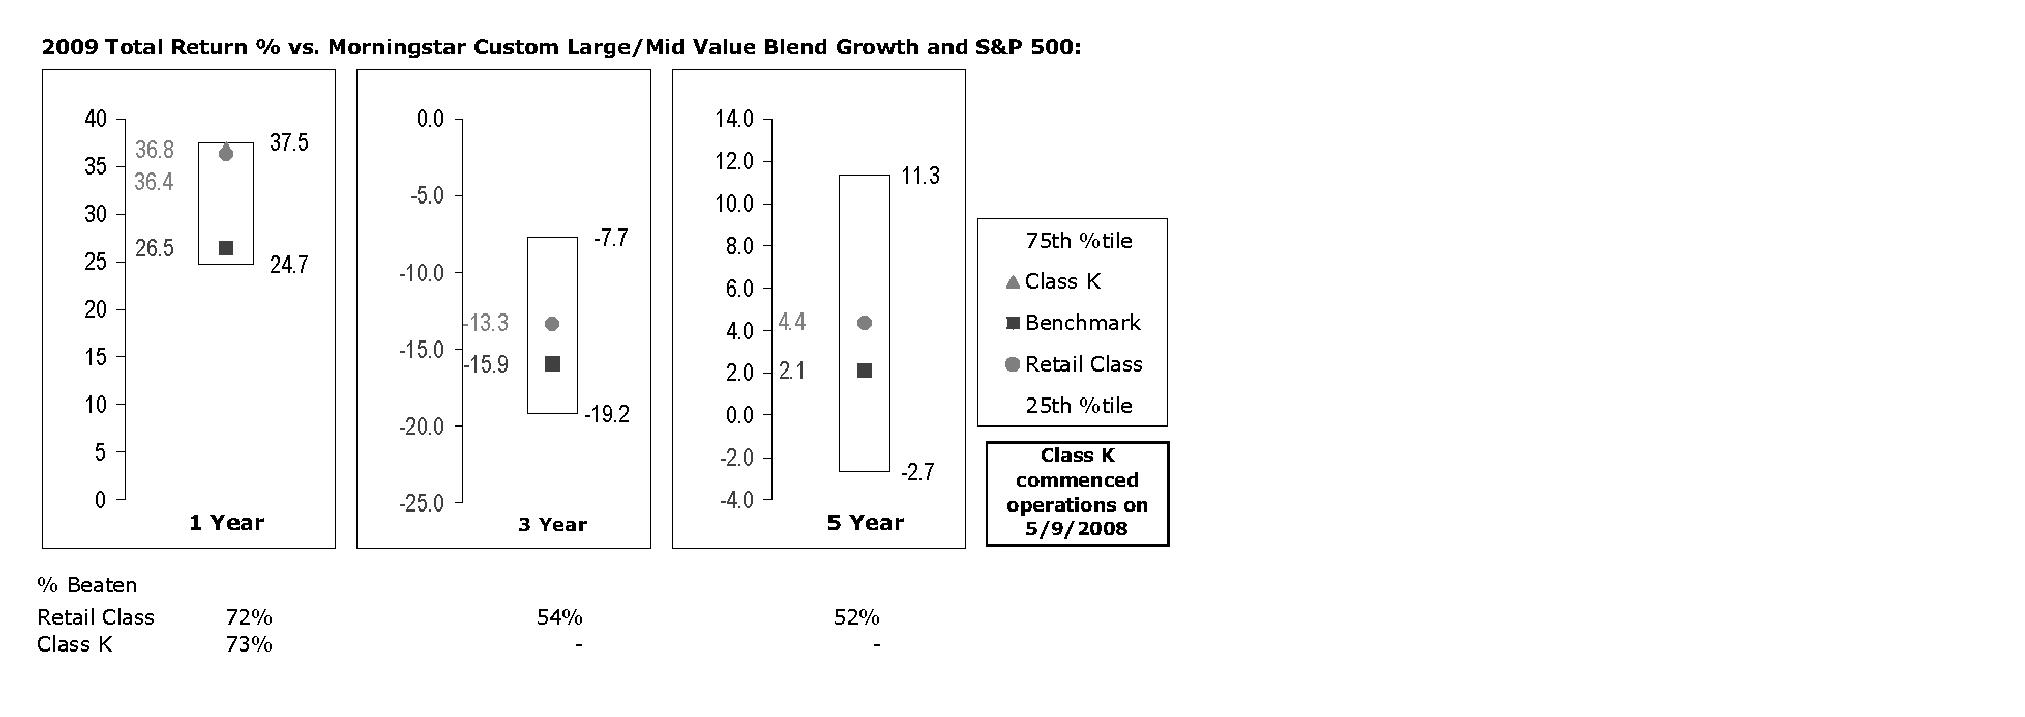
The Board reviewed the fund's relative investment performance against its peer group and noted that the performance of the retail class of the fund (the class with the longer performance record) was in the second quartile for all the periods shown. The Board also noted that the investment performance of the retail class of the fund compared favorably to its benchmark for all the periods shown. The Board considered that the variations in performance between the fund's classes reflect the variations in class expenses, which result in lower performance for the higher expense class. The Board also reviewed the fund's performance since inception as well as performance in the current year.
The Board also considered that the fund's management fee is subject to upward or downward adjustment depending upon whether, and to what extent, the fund's investment performance for the performance period exceeds, or is exceeded by, the record (over the same period) of a Board-approved performance adjustment index. The Board realizes that the performance adjustment provides FMR with a strong economic incentive to seek to achieve superior performance for the fund's shareholders and helps to more closely align the interests of FMR and the fund's shareholders.
Based on its review, and giving particular weight to the nature and quality of the resources dedicated by the Investment Advisers to maintain and improve relative performance and factoring in the unprecedented market events in recent years, the Board concluded that the nature, extent, and quality of investment management and support services and of shareholder and administrative services provided to the fund will benefit the fund's shareholders, particularly in light of the Board's view that the fund's shareholders benefit from investing in a fund that is part of a large family of funds offering a variety of investment disciplines and services.
Annual Report
Board Approval of Investment Advisory Contracts and
Management Fees - continued
Competitiveness of Management Fee and Total Fund Expenses. The Board considered the fund's management fee and total expenses compared to "mapped groups" of competitive funds and classes. Fidelity creates "mapped groups" by combining similar Lipper investment objective categories that have comparable management fee characteristics. Combining Lipper investment objective categories aids the Board's management fee and total expense comparisons by broadening the competitive group used for comparison and by reducing the number of universes to which various Fidelity funds are compared.
Management Fee. The Board considered two proprietary management fee comparisons for the 12-month periods shown in the chart below. The group of Lipper funds used by the Board for management fee comparisons is referred to below as the "Total Mapped Group." The Total Mapped Group comparison focuses on a fund's standing relative to the total universe of comparable funds available to investors, in terms of gross management fees before expense reimbursements or caps, and without giving effect to the fund's performance adjustment. "TMG %" represents the percentage of funds in the Total Mapped Group that had management fees that were lower than the fund's. For example, a TMG % of 10% means that 90% of the funds in the Total Mapped Group had higher management fees than the fund. The "Asset-Size Peer Group" (ASPG) comparison focuses on a fund's standing relative to non-Fidelity funds similar in size to the fund within the Total Mapped Group. The ASPG represents at least 15% of the funds in the Total Mapped Group with comparable asset size and management fee characteristics, subject to a minimum of 50 funds (or all funds in the Total Mapped Group if fewer than 50). Additional information, such as the ASPG quartile in which the fund's management fee ranked and the impact of the fund's performance adjustment, is also included in the chart and considered by the Board.
Annual Report
Fidelity Capital Appreciation Fund
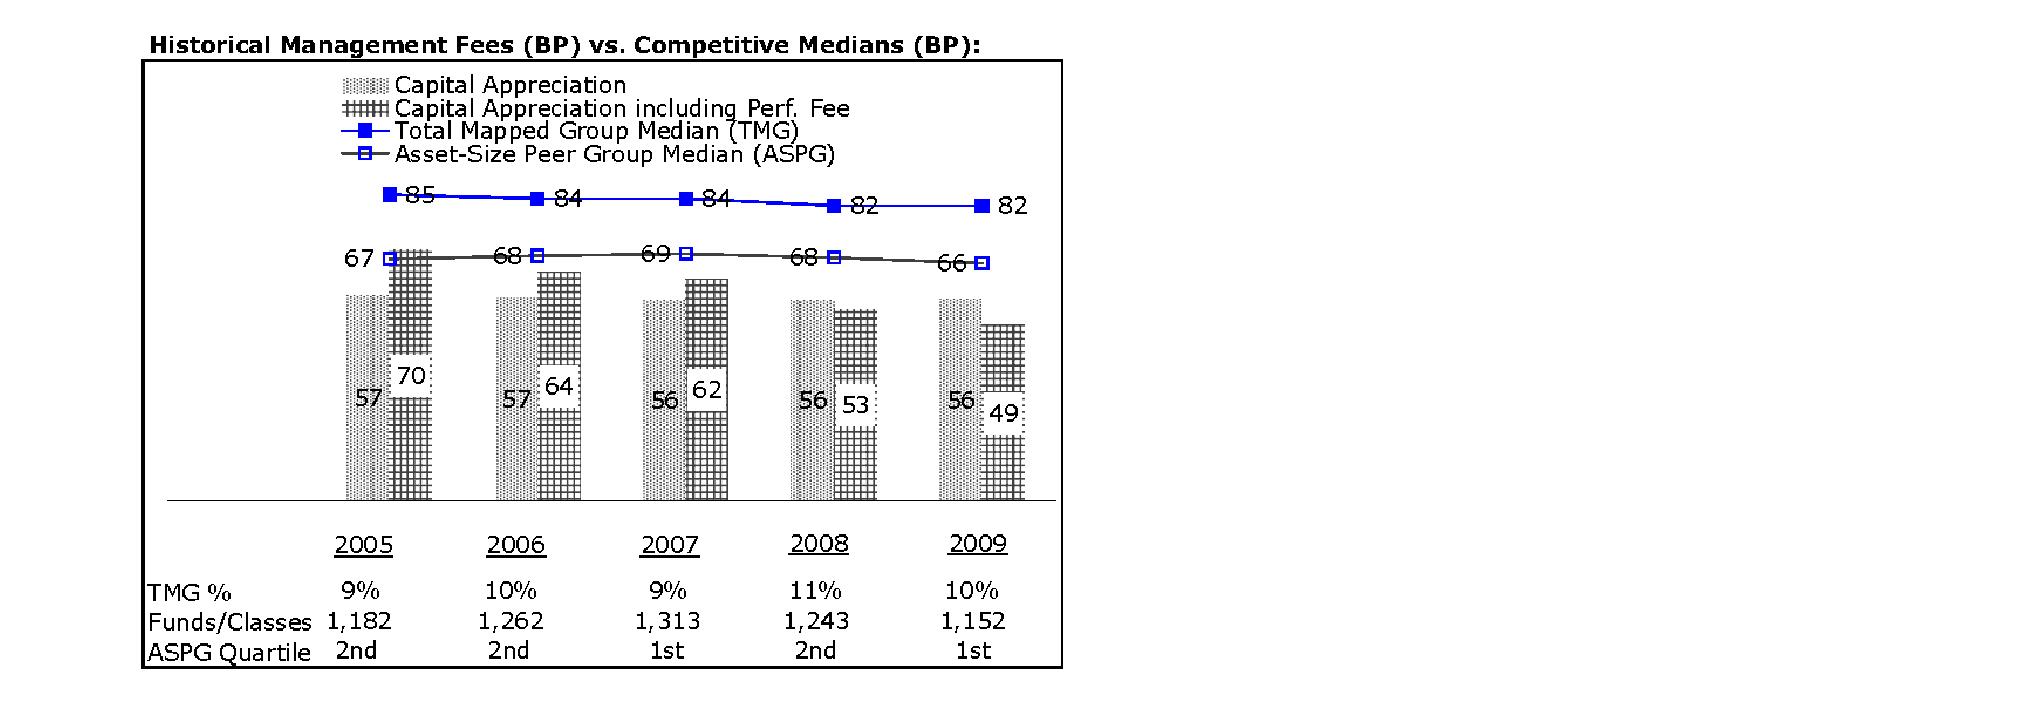
The Board noted that the fund's management fee ranked below the median of its Total Mapped Group and below the median of its ASPG for 2009. The Board also noted the effect of the fund's negative performance adjustment on the fund's management fee ranking. The Board noted that the performance adjustment for each year represents calculations for performance periods that differ from the periods shown in the performance charts above.
Based on its review, the Board concluded that the fund's management fee is fair and reasonable in light of the services that the fund receives and the other factors considered.
Total Expenses. In its review of each class's total expenses, the Board considered the fund's management fee as well as other fund or class expenses, as applicable, such as transfer agent fees, pricing and bookkeeping fees, and custodial, legal, and audit fees. The Board also noted the effects of any waivers and reimbursements on fees and expenses, as well as the impact of the fund's performance adjustment. As part of its review, the Board also considered current and historical total expenses of each class of the fund compared to competitive fund median expenses. Each class of the fund is compared to those funds and classes in the Total Mapped Group (used by the Board for management fee comparisons) that have a similar sales load structure.
The Board noted that the total expenses of each class ranked below its competitive median for 2009.
Annual Report
Board Approval of Investment Advisory Contracts and
Management Fees - continued
Fees Charged to Other Fidelity Clients. The Board also considered Fidelity fee structures and other information with respect to clients of FMR and its affiliates, such as other mutual funds advised or subadvised by FMR or its affiliates, pension plan clients, and other institutional clients. In March 2010, the Board created an ad hoc joint committee with the board of other Fidelity funds (the Committee) to review and compare Fidelity's institutional investment advisory business with its business of providing services to the Fidelity funds, including the differences in services provided, fees charged, and costs incurred, as well as competition in their respective marketplaces.
Based on its review of total expenses and fees charged to other Fidelity clients, the Board concluded that the total expenses of each class of the fund were reasonable in light of the services that the fund and its shareholders receive and the other factors considered, including the findings of the Committee.
Costs of the Services and Profitability. The Board considered the revenues earned and the expenses incurred by Fidelity in conducting the business of developing, marketing, distributing, managing, administering and servicing the fund and its shareholders. The Board also considered the level of Fidelity's profits in respect of all the Fidelity funds.
On an annual basis, FMR presents to the Board Fidelity's profitability for the fund. Fidelity calculates the profitability for each fund, as well as aggregate profitability for groups of Fidelity funds and all Fidelity funds, using a series of detailed revenue and cost allocation methodologies which originate with the audited books and records of Fidelity. The Audit Committee of the Board reviews any significant changes from the prior year's methodologies.
PricewaterhouseCoopers LLP (PwC), independent registered public accounting firm and auditor to Fidelity and certain Fidelity funds, has been engaged annually by the Board as part of the Board's assessment of Fidelity's profitability analysis. PwC's engagement includes the review and assessment of Fidelity's methodologies used in determining the revenues and expenses attributable to Fidelity's mutual fund business, and completion of agreed-upon procedures surrounding the mathematical accuracy of fund profitability and its conformity to allocation methodologies. After considering PwC's reports issued under the engagement and information provided by Fidelity, the Board believes that while other allocation methods may also be reasonable, Fidelity's profitability methodologies are reasonable in all material respects.
The Board has also reviewed Fidelity's non-fund businesses and fall-out benefits related to the mutual fund business as well as cases where Fidelity's affiliates may benefit from or be related to the fund's business.
Annual Report
The Board considered the costs of the services provided by and the profits realized by Fidelity in connection with the operation of the fund and were satisfied that the profitability was not excessive in the circumstances.
Economies of Scale. The Board considered whether there have been economies of scale in respect of the management of the Fidelity funds, whether the Fidelity funds (including the fund) have appropriately benefited from any such economies of scale, and whether there is potential for realization of any further economies of scale. The Board considered the extent to which the fund will benefit from economies of scale through increased services to the fund, through waivers or reimbursements, or through fee or expense reductions.
In February 2009, the Board and the board of other Fidelity funds created an ad hoc committee (the Economies of Scale Committee) to analyze whether FMR attains economies of scale in respect of the management and servicing of the Fidelity funds, whether the Fidelity funds have appropriately benefited from such economies of scale, and whether there is potential for realization of any further economies of scale.
The Board recognized that the fund's management contract incorporates a "group fee" structure, which provides for lower group fee rates as total fund assets under FMR's management increase, and for higher group fee rates as total fund assets under FMR's management decrease. FMR calculates the group fee rates based on a tiered asset "breakpoint" schedule that varies based on asset class. The Board considered that the group fee is designed to deliver the benefits of economies of scale to fund shareholders when total Fidelity fund assets increase, even if assets of any particular fund are unchanged or have declined, because some portion of Fidelity's costs are attributable to services provided to all Fidelity funds, and all funds benefit if those costs can be allocated among more assets. The Board concluded that, given the group fee structure, fund shareholders will benefit from lower management fees as assets under FMR's management increase at the fund complex level, regardless of whether Fidelity achieves any such economies of scale.
The Board concluded, considering the findings of the Economies of Scale Committee, that any potential economies of scale are being appropriately shared between fund shareholders and Fidelity.
Additional Information Requested by the Board. In order to develop fully the factual basis for consideration of the Fidelity funds' Advisory Contracts, the Board requested and received additional information on certain topics, including (i) fund performance trends, actions to be taken by FMR to improve certain funds' overall performance, and Fidelity's long-term strategies for certain funds; (ii) portfolio manager changes that have occurred during the past year and length of portfolio manager tenure for different categories of funds over time; (iii) Fidelity's compensation structure for portfolio managers, research analysts, and other key personnel, the rationale for the compensation structure, and how the compensation structure provides appropriate performance incentives; (iv) the amount of the investment that each portfolio manager has made in the Fidelity fund(s) that he or she manages; (v) management and other fees paid by FMR to affiliated sub-advisers on behalf of the Fidelity funds; (vi) Fidelity's fee structures and rationale for recommending different fees among different categories of funds; (vii) Fidelity's rationale for recommending which funds should have a performance adjustment component as part of their management fees; (viii) the rationale for any differences between fund fee structures and fee structures in place for other Fidelity clients; and (ix) explanations regarding the relative total expenses borne by certain funds and classes, total expense competitive trends, and actions that might be taken by FMR to reduce total expenses for certain funds and classes.
Annual Report
Board Approval of Investment Advisory Contracts and
Management Fees - continued
Based on its evaluation of all of the conclusions noted above, and after considering all factors it believed relevant, the Board ultimately concluded that the advisory fee structures are fair and reasonable, and that the fund's Advisory Contracts should be renewed.
Annual Report
Managing Your Investments
Fidelity offers several ways to conveniently manage your personal investments via your telephone or PC. You can access your account information, conduct trades and research your investments 24 hours a day.
By Phone
Fidelity Automated Service Telephone provides a single toll-free number to access account balances, positions, quotes and trading. It's easy to navigate the service, and on your first call, the system will help you create a personal identification number (PIN) for security.
(phone_graphic)
Fidelity Automated
Service Telephone (FAST®)
1-800-544-5555
Press
 For mutual fund and brokerage trading.
 For quotes.*
 For account balances and holdings.
 To review orders and mutual
fund activity.
 To change your PIN.

 To speak to a Fidelity representative.
By PC
Fidelity's web site on the Internet provides a wide range of information, including daily financial news, fund performance, interactive planning tools and news about Fidelity products and services.
(computer_graphic)
Fidelity's Web Site
www.fidelity.com
* When you call the quotes line, please remember that a fund's yield and return will vary and, except for money market funds, share price will also vary. This means that you may have a gain or loss when you sell your shares. There is no assurance that money market funds will be able to maintain a stable $1 share price; an investment in a money market fund is not insured or guaranteed by the U.S. government. Total returns are historical and include changes in share price, reinvestment of dividends and capital gains, and the effects of any sales charges.
Annual Report
To Visit Fidelity
For directions and hours,
please call 1-800-544-9797.
Arizona
7001 West Ray Road
Chandler, AZ
15445 N. Scottsdale Road
Scottsdale, AZ
17550 North 75th Avenue
Glendale, AZ
5330 E. Broadway Blvd
Tucson, AZ
California
815 East Birch Street
Brea, CA
1411 Chapin Avenue
Burlingame, CA
851 East Hamilton Avenue
Campbell, CA
601 Larkspur Landing Circle
Larkspur, CA
2000 Avenue of the Stars
Los Angeles, CA
27101 Puerta Real
Mission Viejo, CA
73575 El Paseo
Palm Desert, CA
251 University Avenue
Palo Alto, CA
123 South Lake Avenue
Pasadena, CA
16656 Bernardo Ctr. Drive
Rancho Bernardo, CA
1220 Roseville Parkway
Roseville, CA
1740 Arden Way
Sacramento, CA
7676 Hazard Center Drive
San Diego, CA
11943 El Camino Real
San Diego, CA
8 Montgomery Street
San Francisco, CA
3793 State Street
Santa Barbara, CA
1200 Wilshire Boulevard
Santa Monica, CA
398 West El Camino Real
Sunnyvale, CA
111 South Westlake Blvd
Thousand Oaks, CA
21701 Hawthorne Boulevard
Torrance, CA
2001 North Main Street
Walnut Creek, CA
6326 Canoga Avenue
Woodland Hills, CA
2211 Michelson Drive
Irvine, CA
Colorado
281 East Flatiron Circle
Broomfield, CO
1625 Broadway
Denver, CO
9185 Westview Road
Lone Tree, CO
Connecticut
48 West Putnam Avenue
Greenwich, CT
265 Church Street
New Haven, CT
300 Atlantic Street
Stamford, CT
29 South Main Street
West Hartford, CT
1261 Post Road
Fairfield, CT
Delaware
400 Delaware Avenue
Wilmington, DE
Florida
175 East Altamonte Drive
Altamonte Springs, FL
1400 Glades Road
Boca Raton, FL
121 Alhambra Plaza
Coral Gables, FL
2948 N. Federal Highway
Ft. Lauderdale, FL
4671 Town Center Parkway
Jacksonville, FL
8880 Tamiami Trail, North
Naples, FL
230 Royal Palm Way
Palm Beach, FL
3501 PGA Boulevard
Palm Beach Gardens, FL
3550 Tamiami Trail, South
Sarasota, FL
1502 N. Westshore Blvd.
Tampa, FL
2465 State Road 7
Wellington, FL
Georgia
3242 Peachtree Road
Atlanta, GA
1000 Abernathy Road
Atlanta, GA
Illinois
One North LaSalle Street
Chicago, IL
401 North Michigan Avenue
Chicago, IL
One Skokie Valley Road
Highland Park, IL
1415 West 22nd Street
Oak Brook, IL
15105 S LaGrange Road
Orland Park, IL
1572 East Golf Road
Schaumburg, IL
1823 Freedom Drive
Naperville, IL
Indiana
8480 Keystone Crossing
Indianapolis, IN
Kansas
5400 College Boulevard
Overland Park, KS
Maine
Three Canal Plaza
Portland, ME
Maryland
7315 Wisconsin Avenue
Bethesda, MD
610 York Road
Towson, MD
Massachusetts
801 Boylston Street
Boston, MA
155 Congress Street
Boston, MA
300 Granite Street
Braintree, MA
44 Mall Road
Burlington, MA
238 Main Street
Cambridge, MA
200 Endicott Street
Danvers, MA
Fidelity Brokerage Services, Inc., 100 Summer St., Boston, MA 02110 Member NYSE/SIPC
Annual Report
405 Cochituate Road
Framingham, MA
551 Boston Turnpike
Shrewsbury, MA
Michigan
500 E. Eisenhower Pkwy.
Ann Arbor, MI
280 N. Old Woodward Ave.
Birmingham, MI
30200 Northwestern Hwy.
Farmington Hills, MI
43420 Grand River Avenue
Novi, MI
3480 28th Street
Grand Rapids, MI
2425 S. Linden Road STE E
Flint, MI
Minnesota
7740 France Avenue South
Edina, MN
8342 3rd Street North
Oakdale, MN
Missouri
1524 South Lindbergh Blvd.
St. Louis, MO
Nevada
2225 Village Walk Drive
Henderson, NV
New Jersey
501 Route 73 South
Marlton, NJ
150 Essex Street
Millburn, NJ
35 Morris Street
Morristown, NJ
396 Route 17, North
Paramus, NJ
3518 Route 1 North
Princeton, NJ
530 Broad Street
Shrewsbury, NJ
New Mexico
2261 Q Street NE
Albuquerque,��NM
New York
1130 Franklin Avenue
Garden City, NY
37 West Jericho Turnpike
Huntington Station, NY
1271 Avenue of the Americas
New York, NY
980 Madison Avenue
New York, NY
61 Broadway
New York, NY
350 Park Avenue
New York, NY
200 Fifth Avenue
New York, NY
733 Third Avenue
New York, NY
2070 Broadway
New York, NY
1075 Northern Blvd.
Roslyn, NY
799 Central Park Avenue
Scarsdale, NY
3349 Monroe Avenue
Rochester, NY
North Carolina
4611 Sharon Road
Charlotte, NC
7011 Fayetteville Road
Durham, NC
Ohio
3805 Edwards Road
Cincinnati, OH
1324 Polaris Parkway
Columbus, OH
1800 Crocker Road
Westlake, OH
28699 Chagrin Boulevard
Woodmere Village, OH
Oregon
7493 SW Bridgeport Road
Tigard, OR
Pennsylvania
600 West DeKalb Pike
King of Prussia, PA
1735 Market Street
Philadelphia, PA
12001 Perry Highway
Wexford, PA
Rhode Island
10 Memorial Boulevard
Providence, RI
Tennessee
3018 Peoples Street
Johnson City, TN
7628 West Farmington Blvd.
Germantown, TN
2035 Mallory Lane
Franklin, TN
Texas
10000 Research Boulevard
Austin, TX
4001 Northwest Parkway
Dallas, TX
12532 Memorial Drive
Houston, TX
2701 Drexel Drive
Houston, TX
6560 Fannin Street
Houston, TX
1701 Lake Robbins Drive
The Woodlands, TX
6500 N. MacArthur Blvd.
Irving, TX
6005 West Park Boulevard
Plano, TX
1576 East Southlake Blvd.
Southlake, TX
15600 Southwest Freeway
Sugar Land, TX
139 N. Loop 1604 East
San Antonio, TX
Utah
279 West South Temple
Salt Lake City, UT
Virginia
1861 International Drive
McLean, VA
11957 Democracy Drive
Reston, VA
Washington
10500 NE 8th Street
Bellevue, WA
1518 6th Avenue
Seattle, WA
304 Strander Blvd
Tukwila, WA
Washington, DC
1900 K Street, N.W.
Washington, DC
Wisconsin
16020 West Bluemound Road
Brookfield, WI
Annual Report
Investment Adviser
Fidelity Management & Research Company
Boston, MA
Investment Sub-Advisers
FMR Co., Inc.
Fidelity Management & Research
(U.K.) Inc.
Fidelity Research & Analysis Company
Fidelity Management & Research
(Hong Kong) Limited
Fidelity Management & Research
(Japan) Inc.
General Distributor
Fidelity Distributors Corporation
Boston, MA
Transfer and Service Agents
Fidelity Investments Institutional
Operations Company, Inc.
Boston, MA
Fidelity Service Company, Inc.
Boston, MA
Custodian
Citibank, N.A.
New York, NY
The Fidelity Telephone Connection
Mutual Fund 24-Hour Service
Exchanges/Redemptions
and Account Assistance 1-800-544-6666
Product Information 1-800-544-6666
Retirement Accounts 1-800-544-4774
(8 a.m. - 9 p.m.)
TDD Service 1-800-544-0118
for the deaf and hearing impaired
(9 a.m. - 9 p.m. Eastern time)
Fidelity Automated Service
Telephone (FAST®) 1-800-544-5555
Automated line for quickest service
CAF-UANN-1210
1.784775.107

Fidelity®
Capital Appreciation
Fund -
Class K
Annual Report
October 31, 2010
(2_fidelity_logos) (Registered_Trademark)
Contents
Chairman's Message | <Click Here> | The Chairman's message to shareholders. |
Performance | <Click Here> | How the fund has done over time. |
Management's Discussion of Fund Performance | <Click Here> | The Portfolio Manager's review of fundperformance and strategy. |
Shareholder Expense Example | <Click Here> | An example of shareholder expenses. |
Investment Changes | <Click Here> | A summary of major shifts in the fund's investments over the past six months. |
Investments | <Click Here> | A complete list of the fund's investments with their market values. |
Financial Statements | <Click Here> | Statements of assets and liabilities, operations, and changes in net assets,
as well as financial highlights. |
Notes | <Click Here> | Notes to the financial statements. |
Report of Independent Registered Public Accounting Firm | <Click Here> | |
Trustees and Officers | <Click Here> | |
Distributions | <Click Here> | |
Board Approval of Investment Advisory Contracts and Management Fees | <Click Here> | |
To view a fund's proxy voting guidelines and proxy voting record for the 12-month period ended June 30, visit http://www.fidelity.com/proxyvotingresults or visit the Securities and Exchange Commission's (SEC) web site at http://www.sec.gov. You may also call 1-800-544-8544 to request a free copy of the proxy voting guidelines.
Standard & Poor's, S&P and S&P 500 are registered service marks of The McGraw-Hill Companies, Inc. and have been licensed for use by Fidelity Distributors Corporation.
Other third party marks appearing herein are the property of their respective owners.
All other marks appearing herein are registered or unregistered trademarks or service marks of FMR LLC or an affiliated company.
Annual Report
This report and the financial statements contained herein are submitted for the general information of the shareholders of the fund. This report is not authorized for distribution to prospective investors in the fund unless preceded or accompanied by an effective prospectus.
A fund files its complete schedule of portfolio holdings with the SEC for the first and third quarters of each fiscal year on Form N-Q. Forms N-Q are available on the SEC's web site at http://www.sec.gov. A fund's Forms N-Q may be reviewed and copied at the SEC's Public Reference Room in Washington, DC. Information regarding the operation of the SEC's Public Reference Room may be obtained by calling 1-800-SEC-0330. For a complete list of a fund's portfolio holdings, view the most recent holdings listing, semiannual report, or annual report on Fidelity's web site at http://www.fidelity.com or http://www.advisor.fidelity.com, as applicable.
NOT FDIC INSURED • MAY LOSE VALUE • NO BANK GUARANTEE
Neither the fund nor Fidelity Distributors Corporation is a bank.
Annual Report
(photo_of_Edward_C_Johnson_3d)
Dear Shareholder:
Equities have staged a rally in the second half of 2010, shaking off concerns about the European debt crisis and the possibility of a double-dip recession in the U.S. Although the short-term surge pushed major equity indexes back into positive territory for the year, several questions remain about the longer-term outlook, including lackluster economic growth and persistently high unemployment. Financial markets are always unpredictable, of course, but there also are several time-tested investment principles that can help put the odds in your favor.
One of the basic tenets is to invest for the long term. Over time, riding out the markets' inevitable ups and downs has proven much more effective than selling into panic or chasing the hottest trend. Even missing only a few of the markets' best days can significantly diminish investor returns. Patience also affords the benefits of compounding - of earning interest on additional income or reinvested dividends and capital gains. There can be tax advantages and cost benefits to consider as well. While staying the course doesn't eliminate risk, it can considerably lessen the effect of short-term declines.
You can further manage your investing risk through diversification. And today, more than ever, geographic diversification should be taken into account. Studies indicate that asset allocation is the single most important determinant of a portfolio's long-term success. The right mix of stocks, bonds and cash - aligned to your particular risk tolerance and investment objective - is very important. Age-appropriate rebalancing is also an essential aspect of asset allocation. For younger investors, an emphasis on equities - which historically have been the best-performing asset class over time - is encouraged. As investors near their specific goal, such as retirement or sending a child to college, consideration may be given to replacing volatile assets (e.g. common stocks) with more-stable fixed investments (bonds or savings plans).
A third principle - investing regularly - can help lower the average cost of your purchases. Investing a certain amount of money each month or quarter helps ensure you won't pay for all your shares at market highs. This strategy - known as dollar cost averaging - also reduces "emotion" from investing, helping shareholders avoid selling weak performers just prior to an upswing, or chasing a hot performer just before a correction.
We invite you to contact us via the Internet, through our Investor Centers or by phone. It is our privilege to provide you the information you need to make the investments that are right for you.
Sincerely,
(The chairman's signature appears here.)
Edward C. Johnson 3d
Annual Report
Average annual total return reflects the change in the value of an investment, assuming reinvestment of the class' distributions from dividend income and capital gains (the profits earned upon the sale of securities that have grown in value, if any) and assuming a constant rate of performance each year. The $10,000 table and the fund's returns do not reflect the deduction of taxes that a shareholder would pay on fund distributions or the redemption of fund shares. During periods of reimbursement by Fidelity, a fund's total return will be greater than it would be had the reimbursement not occurred. How a fund did yesterday is no guarantee of how it will do tomorrow.
Average Annual Total Returns
Periods ended October 31, 2010 | Past 1
year | Past 5
years | Past 10
years |
Class KA | 28.80% | 3.16% | 3.19% |
A The initial offering of Class K shares took place on May 9, 2008. Returns prior to May 9, 2008 are those of Fidelity® Capital Appreciation Fund, the original class of the fund.
$10,000 Over 10 Years
Let's say hypothetically that $10,000 was invested in Fidelity® Capital Appreciation Fund - Class K on October 31, 2000. The chart shows how the value of your investment would have changed, and also shows how the S&P 500® Index performed over the same period. The initial offering of Class K took place on May 9, 2008. See above for additional information regarding the performance of Class K.
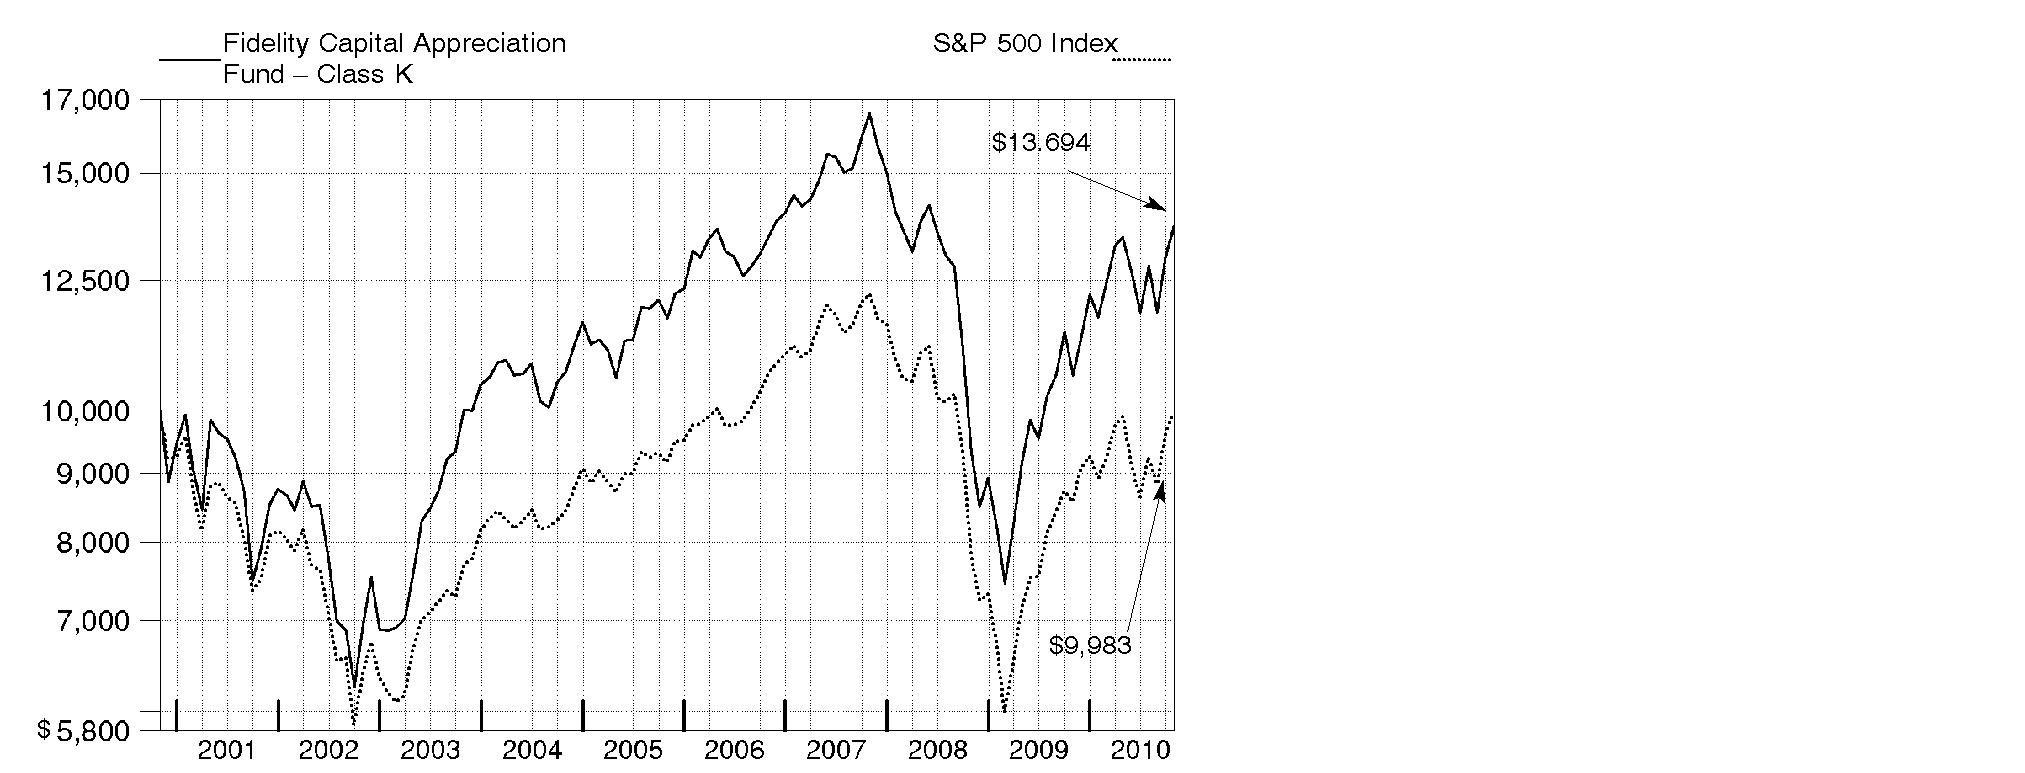
Annual Report
Market Recap: Amid bouts of volatility, major U.S. stock market indexes recorded double-digit gains for the year ending October 31, 2010, lifted by economic optimism, encouraging earnings reports and a wave of corporate mergers. Aside from a January dip, stocks trended upward for the first half of the period amid indications the Great Recession was over. However, in April, lingering high unemployment and heightened concern over European debt sent equities falling. Markets regrouped in July, but fell again in August on mixed economic data. The final two months of the period brought renewed optimism, with the large-cap S&P 500® Index posting its best September/October performance since 1998. For the full 12 months, the S&P 500® rose 16.52%, while the blue-chip-laden Dow Jones Industrial AverageSM added 17.62% and the technology-heavy Nasdaq Composite® Index rose 23.72%. Among market segments, all 10 sectors in the S&P 500 posted gains, with more than half outperforming the broad-market index. Stocks of mid- and small-sized companies surged, with the Russell Midcap® Index adding 27.71% and Russell 2000® Index climbing 26.58%. Looking abroad, debt problems in several European countries cooled gains in developed markets, and yet the MSCI® EAFE® (Europe, Australasia, Far East) Index still rose 8.49%.
Comments from Fergus Shiel, Portfolio Manager of Fidelity® Capital Appreciation Fund: During the year, the fund's Class K shares returned 28.80%, handily beating the S&P 500. Versus the index, superior security selection and a large overweighting in the transportation industry helped performance the most, followed by an overweighting and solid picks in media, and security selection in financials. A bias toward mid- and small-caps also was beneficial. Individual contributors included Continental Airlines; UAL, parent company of United Airlines; Delta Air Lines; and US Airways Group. Continental and UAL merged during the period to form United Continental Holdings, the fund's largest holding at period end. Other contributors included U.K.-based cable television provider Virgin Media and a large underweighting in energy giant Exxon Mobil, which I sold. Conversely, weak security selection and an underweighting in information technology hurt, as did an overweighting in banks and stock picking in retailing. For-profit educator ITT Educational Services was the fund's largest individual detractor. Performance also was hampered by personal computer/consumer electronics maker Apple - mainly due to untimely ownership - drilling rig owner/operator Pride International, network equipment maker Cisco Systems and Bank of Ireland. All of the holdings I mentioned, except for Exxon Mobil, Apple and Cisco Systems, were out of index. Pride International and Bank of Ireland were sold from the fund.
The views expressed above reflect those of the portfolio manager(s) only through the end of the period as stated on the cover of this report and do not necessarily represent the views of Fidelity or any other person in the Fidelity organization. Any such views are subject to change at any time based upon market or other conditions and Fidelity disclaims any responsibility to update such views. These views may not be relied on as investment advice and, because investment decisions for a Fidelity fund are based on numerous factors, may not be relied on as an indication of trading intent on behalf of any Fidelity fund.
Annual Report
Shareholder Expense Example
As a shareholder of the Fund, you incur two types of costs: (1) transaction costs, and (2) ongoing costs, including management fees and other Fund expenses. This Example is intended to help you understand your ongoing costs (in dollars) of investing in the Fund and to compare these costs with the ongoing costs of investing in other mutual funds.
The Example is based on an investment of $1,000 invested at the beginning of the period and held for the entire period (May 1, 2010 to October 31, 2010).
Actual Expenses
The first line of the accompanying table for each class of the Fund provides information about actual account values and actual expenses. You may use the information in this line, together with the amount you invested, to estimate the expenses that you paid over the period. Simply divide your account value by $1,000.00 (for example, an $8,600 account value divided by $1,000.00 = 8.6), then multiply the result by the number in the first line for a class of the Fund under the heading entitled "Expenses Paid During Period" to estimate the expenses you paid on your account during this period. A small balance maintenance fee of $12.00 that is charged once a year may apply for certain accounts with a value of less than $2,000. This fee is not included in the table below. If it was, the estimate of expenses you paid during the period would be higher, and your ending account value lower, by this amount. In addition, the Fund, as a shareholder in the underlying Fidelity Central Funds, will indirectly bear its pro-rata share of the fees and expenses incurred by the underlying Fidelity Central Funds. These fees and expenses are not included in the Fund's annualized expense ratio used to calculate the expense estimate in the table below.
Hypothetical Example for Comparison Purposes
The second line of the accompanying table for each class of the Fund provides information about hypothetical account values and hypothetical expenses based on a Class' actual expense ratio and an assumed rate of return of 5% per year before expenses, which is not the Class' actual return. The hypothetical account values and expenses may not be used to estimate the actual ending account balance or expenses you paid for the period. You may use this information to compare the ongoing costs of investing in the Fund and other funds. To do so, compare this 5% hypothetical example with the 5% hypothetical examples that appear in the shareholder reports of the other funds. A small balance maintenance fee of $12.00 that is charged once a year may apply for certain accounts with a value of less than $2,000. This fee is not included in the table below. If it was, the estimate of expenses you paid during the period would be higher, and your ending account value lower, by this amount. In addition, the Fund, as a shareholder in the underlying Fidelity Central Funds, will indirectly bear its pro-rata share of the fees and expenses incurred by the underlying Fidelity Central Funds. These fees and expenses are not included in the Fund's annualized expense ratio used to calculate the expense estimate in the table below.
Please note that the expenses shown in the table are meant to highlight your ongoing costs only and do not reflect any transaction costs. Therefore, the second line of the table is useful in comparing ongoing costs only, and will not help you determine the relative total costs of owning different funds.
Annual Report
| Annualized
Expense Ratio | Beginning
Account Value
May 1, 2010 | Ending
Account Value
October 31, 2010 | Expenses Paid
During Period*
May 1, 2010 to
October 31, 2010 |
Capital Appreciation | .88% | | | |
Actual | | $ 1,000.00 | $ 1,016.50 | $ 4.47 |
HypotheticalA | | $ 1,000.00 | $ 1,020.77 | $ 4.48 |
Class K | .71% | | | |
Actual | | $ 1,000.00 | $ 1,017.70 | $ 3.61 |
HypotheticalA | | $ 1,000.00 | $ 1,021.63 | $ 3.62 |
A 5% return per year before expenses
* Expenses are equal to each Class' annualized expense ratio, multiplied by the average account value over the period, multiplied by 184/365 (to reflect the one-half year period).
Annual Report
Investment Changes (Unaudited)
Top Ten Stocks as of October 31, 2010 |
| % of fund's
net assets | % of fund's net assets
6 months ago |
United Continental Holdings, Inc. | 8.1 | 0.0 |
Apple, Inc. | 4.0 | 0.9 |
Virgin Media, Inc. | 3.9 | 1.4 |
Sprint Nextel Corp. | 3.5 | 2.1 |
Delta Air Lines, Inc. | 3.1 | 3.9 |
The Walt Disney Co. | 2.8 | 3.7 |
US Airways Group, Inc. | 2.2 | 1.0 |
Union Pacific Corp. | 2.1 | 0.0 |
Juniper Networks, Inc. | 2.0 | 0.7 |
Cisco Systems, Inc. | 1.8 | 3.8 |
| 33.5 | |
Top Five Market Sectors as of October 31, 2010 |
| % of fund's
net assets | % of fund's net assets
6 months ago |
Consumer Discretionary | 27.6 | 17.1 |
Industrials | 26.1 | 18.6 |
Information Technology | 11.4 | 12.3 |
Financials | 7.9 | 16.2 |
Energy | 6.8 | 9.3 |
Asset Allocation (% of fund's net assets) |
As of October 31, 2010 * | As of April 30, 2010 ** |
| Stocks 96.1% | | | Stocks 91.6% | |
| Short-Term
Investments and
Net Other Assets 3.9% | | | Short-Term
Investments and
Net Other Assets 8.4% | |
* Foreign investments | 7.5% | | ** Foreign investments | 8.9% | |

Annual Report
Investments October 31, 2010
Showing Percentage of Net Assets
Common Stocks - 96.1% |
| Shares | | Value (000s) |
CONSUMER DISCRETIONARY - 27.6% |
Diversified Consumer Services - 1.5% |
ITT Educational Services, Inc. (a)(d) | 932,006 | | $ 60,142 |
Strayer Education, Inc. (d) | 146,121 | | 20,432 |
| | 80,574 |
Hotels, Restaurants & Leisure - 5.4% |
Accor SA | 643,336 | | 26,376 |
Marriott International, Inc. Class A | 904,404 | | 33,508 |
McDonald's Corp. | 1,088,682 | | 84,667 |
MGM Mirage, Inc. (a)(d) | 1,484,500 | | 16,226 |
Paddy Power PLC (Ireland) | 1,188,758 | | 47,969 |
Starwood Hotels & Resorts Worldwide, Inc. | 1,486,120 | | 80,459 |
| | 289,205 |
Internet & Catalog Retail - 1.1% |
Amazon.com, Inc. (a) | 287,061 | | 47,405 |
Blue Nile, Inc. (a) | 285,000 | | 12,141 |
| | 59,546 |
Media - 10.9% |
CBS Corp. Class B | 2,573,281 | | 43,566 |
Interpublic Group of Companies, Inc. (a) | 6,621,473 | | 68,532 |
Kabel Deutschland Holding AG | 1,115,800 | | 50,234 |
The Walt Disney Co. | 4,125,262 | | 148,963 |
Valassis Communications, Inc. (a) | 1,895,434 | | 62,549 |
Virgin Media, Inc. (d) | 8,355,135 | | 212,471 |
| | 586,315 |
Multiline Retail - 0.3% |
Retail Ventures, Inc. (a) | 1,035,657 | | 14,075 |
Specialty Retail - 5.5% |
Bed Bath & Beyond, Inc. (a) | 1,336,069 | | 58,653 |
Chico's FAS, Inc. | 5,047,714 | | 49,064 |
DSW, Inc. Class A (a)(d) | 662,321 | | 22,035 |
J. Crew Group, Inc. (a)(d) | 841,400 | | 26,916 |
Staples, Inc. | 2,276,346 | | 46,597 |
Tiffany & Co., Inc. | 395,905 | | 20,983 |
TJX Companies, Inc. | 1,583,486 | | 72,666 |
| | 296,914 |
Textiles, Apparel & Luxury Goods - 2.9% |
Coach, Inc. | 940,164 | | 47,008 |
NIKE, Inc. Class B | 197,940 | | 16,120 |
Phillips-Van Heusen Corp. | 859,100 | | 52,697 |
Common Stocks - continued |
| Shares | | Value (000s) |
CONSUMER DISCRETIONARY - continued |
Textiles, Apparel & Luxury Goods - continued |
Polo Ralph Lauren Corp. Class A | 247,500 | | $ 23,978 |
VF Corp. | 227,330 | | 18,923 |
| | 158,726 |
TOTAL CONSUMER DISCRETIONARY | | 1,485,355 |
CONSUMER STAPLES - 4.5% |
Beverages - 2.8% |
Anheuser-Busch InBev SA NV | 593,922 | | 37,217 |
Grupo Modelo SAB de CV Series C | 3,100,300 | | 17,361 |
The Coca-Cola Co. | 1,583,546 | | 97,103 |
| | 151,681 |
Food Products - 0.5% |
Kraft Foods, Inc. Class A | 791,841 | | 25,553 |
Tobacco - 1.2% |
Reynolds American, Inc. | 996,640 | | 64,682 |
TOTAL CONSUMER STAPLES | | 241,916 |
ENERGY - 6.8% |
Energy Equipment & Services - 0.4% |
National Oilwell Varco, Inc. | 395,923 | | 21,285 |
Oil, Gas & Consumable Fuels - 6.4% |
Alpha Natural Resources, Inc. (a) | 791,800 | | 35,766 |
Chevron Corp. | 1,039,184 | | 85,847 |
Massey Energy Co. | 643,340 | | 27,065 |
Occidental Petroleum Corp. | 1,020,708 | | 80,258 |
Patriot Coal Corp. (a)(d) | 1,187,700 | | 16,022 |
Peabody Energy Corp. | 395,800 | | 20,938 |
Royal Dutch Shell PLC Class A sponsored ADR | 1,237,141 | | 80,328 |
| | 346,224 |
TOTAL ENERGY | | 367,509 |
FINANCIALS - 7.9% |
Capital Markets - 1.3% |
Franklin Resources, Inc. | 198,035 | | 22,715 |
Janus Capital Group, Inc. | 1,977,543 | | 20,883 |
Lazard Ltd. Class A | 679,700 | | 25,081 |
| | 68,679 |
Common Stocks - continued |
| Shares | | Value (000s) |
FINANCIALS - continued |
Commercial Banks - 3.8% |
Comerica, Inc. | 1,375,188 | | $ 49,204 |
PNC Financial Services Group, Inc. | 1,285,702 | | 69,299 |
Regions Financial Corp. | 3,661,900 | | 23,070 |
SunTrust Banks, Inc. | 1,336,138 | | 33,430 |
SVB Financial Group (a) | 640,394 | | 27,755 |
| | 202,758 |
Diversified Financial Services - 1.5% |
CME Group, Inc. | 218,333 | | 63,240 |
Moody's Corp. | 593,805 | | 16,068 |
| | 79,308 |
Real Estate Management & Development - 1.3% |
CB Richard Ellis Group, Inc. Class A (a) | 3,982,147 | | 73,072 |
TOTAL FINANCIALS | | 423,817 |
HEALTH CARE - 2.6% |
Biotechnology - 1.3% |
Biogen Idec, Inc. (a) | 1,076,960 | | 67,536 |
Health Care Equipment & Supplies - 1.1% |
Edwards Lifesciences Corp. (a) | 712,600 | | 45,542 |
Symmetry Medical, Inc. (a) | 399,897 | | 3,539 |
Wright Medical Group, Inc. (a) | 891,987 | | 11,899 |
| | 60,980 |
Health Care Technology - 0.2% |
Transcend Services, Inc. (a)(e) | 625,383 | | 10,894 |
TOTAL HEALTH CARE | | 139,410 |
INDUSTRIALS - 26.1% |
Aerospace & Defense - 0.4% |
GeoEye, Inc. (a) | 526,888 | | 23,325 |
Air Freight & Logistics - 0.2% |
Air Transport Services Group, Inc. (a) | 1,976,893 | | 13,285 |
Airlines - 13.4% |
Delta Air Lines, Inc. (a) | 12,106,033 | | 168,153 |
United Continental Holdings, Inc. (a)(d) | 15,071,989 | | 437,693 |
US Airways Group, Inc. (a)(d)(e) | 9,983,845 | | 117,710 |
| | 723,556 |
Common Stocks - continued |
| Shares | | Value (000s) |
INDUSTRIALS - continued |
Commercial Services & Supplies - 1.2% |
Pitney Bowes, Inc. | 2,845,282 | | $ 62,425 |
Construction & Engineering - 0.5% |
Fluor Corp. | 544,323 | | 26,231 |
Electrical Equipment - 0.5% |
Emerson Electric Co. | 494,863 | | 27,168 |
Industrial Conglomerates - 0.7% |
Textron, Inc. | 1,710,667 | | 35,616 |
Machinery - 6.1% |
Bucyrus International, Inc. Class A | 742,245 | | 50,591 |
Caterpillar, Inc. | 494,888 | | 38,898 |
Cummins, Inc. | 791,801 | | 69,758 |
Deere & Co. | 692,820 | | 53,209 |
Joy Global, Inc. | 494,900 | | 35,113 |
Trinity Industries, Inc. | 834,449 | | 18,967 |
Vallourec SA | 211,593 | | 21,955 |
WABCO Holdings, Inc. (a) | 858,319 | | 39,843 |
| | 328,334 |
Road & Rail - 3.1% |
Norfolk Southern Corp. | 890,794 | | 54,775 |
Union Pacific Corp. | 1,286,630 | | 112,812 |
| | 167,587 |
TOTAL INDUSTRIALS | | 1,407,527 |
INFORMATION TECHNOLOGY - 11.4% |
Communications Equipment - 3.8% |
Cisco Systems, Inc. (a) | 4,275,013 | | 97,599 |
Juniper Networks, Inc. (a) | 3,265,938 | | 105,784 |
| | 203,383 |
Computers & Peripherals - 4.0% |
Apple, Inc. (a) | 712,568 | | 214,390 |
Internet Software & Services - 1.6% |
Equinix, Inc. (a) | 296,900 | | 25,011 |
Google, Inc. Class A (a) | 99,000 | | 60,686 |
| | 85,697 |
IT Services - 0.7% |
Paychex, Inc. | 1,385,530 | | 38,379 |
Semiconductors & Semiconductor Equipment - 0.8% |
Altera Corp. | 1,435,060 | | 44,788 |
Common Stocks - continued |
| Shares | | Value (000s) |
INFORMATION TECHNOLOGY - continued |
Software - 0.5% |
Citrix Systems, Inc. (a) | 395,902 | | $ 25,365 |
TOTAL INFORMATION TECHNOLOGY | | 612,002 |
MATERIALS - 2.5% |
Metals & Mining - 2.5% |
Alcoa, Inc. | 1,632,959 | | 21,441 |
Newmont Mining Corp. | 346,470 | | 21,090 |
Nucor Corp. | 494,900 | | 18,915 |
Steel Dynamics, Inc. | 1,484,600 | | 21,556 |
United States Steel Corp. (d) | 1,187,693 | | 50,821 |
| | 133,823 |
TELECOMMUNICATION SERVICES - 6.7% |
Diversified Telecommunication Services - 0.4% |
Iliad Group SA | 191,005 | | 21,501 |
Wireless Telecommunication Services - 6.3% |
American Tower Corp. Class A (a) | 791,722 | | 40,861 |
Clearwire Corp. Class A (a)(d) | 4,783,479 | | 33,915 |
SOFTBANK CORP. | 692,800 | | 22,249 |
Sprint Nextel Corp. (a) | 46,397,699 | | 191,159 |
Vodafone Group PLC sponsored ADR | 1,979,292 | | 54,450 |
| | 342,634 |
TOTAL TELECOMMUNICATION SERVICES | | 364,135 |
TOTAL COMMON STOCKS (Cost $4,728,892) | 5,175,494 |
Money Market Funds - 8.5% |
| Shares | | Value (000s) |
Fidelity Cash Central Fund, 0.23% (b) | 136,327,358 | | $ 136,327 |
Fidelity Securities Lending Cash Central Fund, 0.24% (b)(c) | 319,496,836 | | 319,497 |
TOTAL MONEY MARKET FUNDS (Cost $455,824) | 455,824 |
TOTAL INVESTMENT PORTFOLIO - 104.6% (Cost $5,184,716) | | 5,631,318 |
NET OTHER ASSETS (LIABILITIES) - (4.6)% | | (248,244) |
NET ASSETS - 100% | $ 5,383,074 |
Legend |
(a) Non-income producing |
(b) Affiliated fund that is available only to investment companies and other accounts managed by Fidelity Investments. The rate quoted is the annualized seven-day yield of the fund at period end. A complete unaudited listing of the fund's holdings as of its most recent quarter end is available upon request. In addition, each Fidelity Central Fund's financial statements, which are not covered by the Fund's report of Independent Registered Public Accounting Firm, are available on the SEC's website or upon request. |
(c) Investment made with cash collateral received from securities on loan. |
(d) Security or a portion of the security is on loan at period end. |
(e) Affiliated company |
Affiliated Central Funds |
Information regarding fiscal year to date income earned by the Fund from investments in Fidelity Central Funds is as follows: |
Fund | Income earned
(Amounts in thousands) |
Fidelity Cash Central Fund | $ 1,053 |
Fidelity Securities Lending Cash Central Fund | 1,276 |
Total | $ 2,329 |
Other Affiliated Issuers |
An affiliated company is a company in which the Fund has ownership of at least 5% of the voting securities. Fiscal year to date transactions with companies which are or were affiliates are as follows: |
Affiliate
(Amounts in thousands) | Value,
beginning of
period | Purchases | Sales
Proceeds | Dividend
Income | Value,
end of
period |
AMR Corp. | $ 106,576 | $ 6,566 | $ 143,714 | $ - | $ - |
Cbeyond, Inc. | 25,670 | - | 24,980 | - | - |
Continental Airlines, Inc. Class B | 105,889 | 35,858 | 23,236 | - | - |
James River Coal Co. | 34,883 | - | 34,548 | - | - |
Transcend Services, Inc. | - | 9,787 | - | - | 10,894 |
US Airways Group, Inc. | 23,575 | 22,909 | 2,688 | - | 117,710 |
Total | $ 296,593 | $ 75,120 | $ 229,166 | $ - | $ 128,604 |
Other Information |
The following is a summary of the inputs used, as of October 31, 2010, involving the Fund's assets and liabilities carried at fair value. The inputs or methodology used for valuing securities may not be an indication of the risk associated with investing in those securities. For more information on valuation inputs, and their aggregation into the levels used in the table below, please refer to the Security Valuation section in the accompanying Notes to Financial Statements. |
Valuation Inputs at Reporting Date: |
Description
(Amounts in thousands) | Total | Level 1 | Level 2 | Level 3 |
Investments in Securities: | | | | |
Equities: | | | | |
Consumer Discretionary | $ 1,485,355 | $ 1,485,355 | $ - | $ - |
Consumer Staples | 241,916 | 241,916 | - | - |
Energy | 367,509 | 367,509 | - | - |
Financials | 423,817 | 423,817 | - | - |
Health Care | 139,410 | 139,410 | - | - |
Industrials | 1,407,527 | 1,407,527 | - | - |
Information Technology | 612,002 | 612,002 | - | - |
Materials | 133,823 | 133,823 | - | - |
Telecommunication Services | 364,135 | 341,886 | 22,249 | - |
Money Market Funds | 455,824 | 455,824 | - | - |
Total Investments in Securities: | $ 5,631,318 | $ 5,609,069 | $ 22,249 | $ - |
Income Tax Information |
At October 31, 2010, the Fund had a capital loss carryforward of approximately $642,471,000 all of which will expire on October 31, 2016. Capital loss carryforwards are only available to offset future capital gains of the Fund to the extent provided by regulations and may be limited. |
See accompanying notes which are an integral part of the financial statements.
Annual Report
Statement of Assets and Liabilities
Amounts in thousands (except per-share amounts) | October 31, 2010 |
| | |
Assets | | |
Investment in securities, at value (including securities loaned of $315,935) - See accompanying schedule: Unaffiliated issuers (cost $4,548,236) | $ 5,046,890 | |
Fidelity Central Funds (cost $455,824) | 455,824 | |
Other affiliated issuers (cost $180,656) | 128,604 | |
Total Investments (cost $5,184,716) | | $ 5,631,318 |
Receivable for investments sold | | 149,061 |
Receivable for fund shares sold | | 4,359 |
Dividends receivable | | 1,071 |
Distributions receivable from Fidelity Central Funds | | 219 |
Other receivables | | 349 |
Total assets | | 5,786,377 |
| | |
Liabilities | | |
Payable for investments purchased | $ 75,660 | |
Payable for fund shares redeemed | 4,505 | |
Accrued management fee | 2,496 | |
Other affiliated payables | 974 | |
Other payables and accrued expenses | 171 | |
Collateral on securities loaned, at value | 319,497 | |
Total liabilities | | 403,303 |
| | |
Net Assets | | $ 5,383,074 |
Net Assets consist of: | | |
Paid in capital | | $ 5,593,078 |
Distributions in excess of net investment income | | (93) |
Accumulated undistributed net realized gain (loss) on investments and foreign currency transactions | | (656,498) |
Net unrealized appreciation (depreciation) on investments and assets and liabilities in foreign currencies | | 446,587 |
Net Assets | | $ 5,383,074 |
See accompanying notes which are an integral part of the financial statements.
Annual Report
Statement of Assets and Liabilities - continued
Amounts in thousands (except per-share amounts) | October 31, 2010 |
| | |
Capital Appreciation:
Net Asset Value, offering price and redemption price per share ($4,671,565 ÷ 194,442 shares) | | $ 24.03 |
| | |
Class K:
Net Asset Value, offering price and redemption price per share ($711,509 ÷ 29,540 shares) | | $ 24.09 |
See accompanying notes which are an integral part of the financial statements.
Annual Report
Financial Statements - continued
Statement of Operations
Amounts in thousands | Year ended October 31, 2010 |
| | |
Investment Income | | |
Dividends | | $ 51,959 |
Interest | | 1 |
Income from Fidelity Central Funds | | 2,329 |
Total income | | 54,289 |
| | |
Expenses | | |
Management fee
Basic fee | $ 29,605 | |
Performance adjustment | 3,175 | |
Transfer agent fees | 11,352 | |
Accounting and security lending fees | 1,193 | |
Custodian fees and expenses | 144 | |
Independent trustees' compensation | 31 | |
Registration fees | 86 | |
Audit | 66 | |
Legal | 28 | |
Miscellaneous | 72 | |
Total expenses before reductions | 45,752 | |
Expense reductions | (1,042) | 44,710 |
Net investment income (loss) | | 9,579 |
Realized and Unrealized Gain (Loss) Net realized gain (loss) on: | | |
Investment securities: | | |
Unaffiliated issuers | 290,585 | |
Other affiliated issuers | (245,010) | |
Foreign currency transactions | (843) | |
Capital gain distribution from Fidelity Central Funds | 11 | |
Total net realized gain (loss) | | 44,743 |
Change in net unrealized appreciation (depreciation) on: Investment securities | 1,258,916 | |
Assets and liabilities in foreign currencies | (33) | |
Total change in net unrealized appreciation (depreciation) | | 1,258,883 |
Net gain (loss) | | 1,303,626 |
Net increase (decrease) in net assets resulting from operations | | $ 1,313,205 |
See accompanying notes which are an integral part of the financial statements.
Annual Report
Statement of Changes in Net Assets
Amounts in thousands | Year ended
October 31,
2010 | Year ended
October 31,
2009 |
Increase (Decrease) in Net Assets | | |
Operations | | |
Net investment income (loss) | $ 9,579 | $ 12,057 |
Net realized gain (loss) | 44,743 | 183,369 |
Change in net unrealized appreciation (depreciation) | 1,258,883 | 368,356 |
Net increase (decrease) in net assets resulting
from operations | 1,313,205 | 563,782 |
Distributions to shareholders from net investment income | (5,772) | (53,246) |
Share transactions - net increase (decrease) | (834,386) | (487,277) |
Total increase (decrease) in net assets | 473,047 | 23,259 |
| | |
Net Assets | | |
Beginning of period | 4,910,027 | 4,886,768 |
End of period (including distributions in excess of net investment income of $93 and distributions in excess of net investment income of $90, respectively) | $ 5,383,074 | $ 4,910,027 |
See accompanying notes which are an integral part of the financial statements.
Annual Report
Financial Highlights - Capital Appreciation
Years ended October 31, | 2010 | 2009 | 2008 | 2007 | 2006 |
Selected Per-Share Data | | | | |
Net asset value, beginning of period | $ 18.71 | $ 16.68 | $ 32.13 | $ 27.41 | $ 26.22 |
Income from Investment Operations | | | | | |
Net investment income (loss) B | .04 | .04 | .16 | .11 | .10 |
Net realized and unrealized gain (loss) | 5.30 | 2.17 | (13.27) | 6.06 | 3.55 |
Total from investment operations | 5.34 | 2.21 | (13.11) | 6.17 | 3.65 |
Distributions from net investment income | (.02) | (.18) | (.12) | (.11) | - |
Distributions from net realized gain | - | - | (2.22) | (1.34) | (2.46) |
Total distributions | (.02) | (.18) | (2.34) | (1.45) | (2.46) |
Net asset value, end of period | $ 24.03 | $ 18.71 | $ 16.68 | $ 32.13 | $ 27.41 |
Total Return A | 28.57% | 13.54% | (43.80)% | 23.51% | 14.70% |
Ratios to Average Net Assets C, E | | | | |
Expenses before reductions | .88% | .79% | .82% | .83% | .91% |
Expenses net of fee waivers, if any | .88% | .79% | .82% | .83% | .91% |
Expenses net of all reductions | .86% | .78% | .82% | .82% | .87% |
Net investment income (loss) | .16% | .25% | .67% | .36% | .36% |
Supplemental Data | | | | |
Net assets, end of period (in millions) | $ 4,672 | $ 4,627 | $ 4,794 | $ 10,139 | $ 8,353 |
Portfolio turnover rate D | 186% | 243% | 157% | 135% | 198% |
A Total returns would have been lower had certain expenses not been reduced during the periods shown.
B Calculated based on average shares outstanding during the period.
C Fees and expenses of the underlying Fidelity Central Funds are not included in the Fund's expense ratio. The Fund indirectly bears its proportionate share of the expenses of any underlying Fidelity Central Funds.
D Amount does not include the portfolio activity of any underlying Fidelity Central Funds.
E Expense ratios reflect operating expenses of the class. Expenses before reductions do not reflect amounts reimbursed by the investment adviser or reductions from brokerage service arrangements or reductions from other expense offset arrangements and do not represent the amount paid by the class during periods when reimbursements or reductions occur. Expenses net of fee waivers reflect expenses after reimbursement by the investment adviser but prior to reductions from brokerage service arrangements or other expense offset arrangements. Expenses net of all reductions represent the net expenses paid by the class.
See accompanying notes which are an integral part of the financial statements.
Annual Report
Financial Highlights - Class K
Years ended October 31, | 2010 | 2009 | 2008 G |
Selected Per-Share Data | | |
Net asset value, beginning of period | $ 18.73 | $ 16.69 | $ 25.11 |
Income from Investment Operations | | | |
Net investment income (loss) D | .08 | .08 | .03 |
Net realized and unrealized gain (loss) | 5.31 | 2.18 | (8.45) |
Total from investment operations | 5.39 | 2.26 | (8.42) |
Distributions from net investment income | (.03) | (.22) | - |
Net asset value, end of period | $ 24.09 | $ 18.73 | $ 16.69 |
Total Return B, C | 28.80% | 13.85% | (33.53)% |
Ratios to Average Net Assets E, H | | |
Expenses before reductions | .70% | .55% | .66% A |
Expenses net of fee waivers, if any | .70% | .55% | .66% A |
Expenses net of all reductions | .68% | .54% | .65% A |
Net investment income (loss) | .34% | .49% | .41% A |
Supplemental Data | | |
Net assets, end of period (in millions) | $ 712 | $ 283 | $ 93 |
Portfolio turnover rate F | 186% | 243% | 157% |
A Annualized
B Total returns for periods of less than one year are not annualized.
C Total returns would have been lower had certain expenses not been reduced during the periods shown.
D Calculated based on average shares outstanding during the period.
E Fees and expenses of the underlying Fidelity Central Funds are not included in the Fund's expense ratio. The Fund indirectly bears its proportionate share of the expenses of any underlying Fidelity Central Funds.
F Amount does not include the portfolio activity of any underlying Fidelity Central Funds.
G For the period May 9, 2008 (commencement of sale of shares) to October 31, 2008.
H Expense ratios reflect operating expenses of the class. Expenses before reductions do not reflect amounts reimbursed by the investment adviser or reductions from brokerage service arrangements or reductions from other expense offset arrangements and do not represent the amount paid by the class during periods when reimbursements or reductions occur. Expense ratios before reductions for start-up periods may not be representative of longer-term operating periods. Expenses net of fee waivers reflect expenses after reimbursement by the investment adviser but prior to reductions from brokerage service arrangements or other expense offset arrangements. Expenses net of all reductions represent the net expenses paid by the class.
See accompanying notes which are an integral part of the financial statements.
Annual Report
Notes to Financial Statements
For the period ended October 31, 2010
(Amounts in thousands except ratios)
1. Organization.
Fidelity Capital Appreciation Fund (the Fund) is a fund of Fidelity Capital Trust (the Trust) and is authorized to issue an unlimited number of shares. The trust is registered under the Investment Company Act of 1940, as amended (the 1940 Act), as an open-end management investment company organized as a Massachusetts business trust. The Fund offers Capital Appreciation and Class K shares, each of which has equal rights as to assets and voting privileges. Each class has exclusive voting rights with respect to matters that affect that class. Investment income, realized and unrealized capital gains and losses, the common expenses of the Fund, and certain fund-level expense reductions, if any, are allocated on a pro-rata basis to each class based on the relative net assets of each class to the total net assets of the Fund. Each class differs with respect to transfer agent fees incurred. Certain expense reductions also differ by class.
2. Investments in Fidelity Central Funds.
The Fund may invest in Fidelity Central Funds, which are open-end investment companies available only to other investment companies and accounts managed by Fidelity Management & Research Company (FMR) and its affiliates. The Fund's Schedule of Investments lists each of the Fidelity Central Funds held as of period end, if any, as an investment of the Fund, but does not include the underlying holdings of each Fidelity Central Fund. As an Investing Fund, the Fund indirectly bears its proportionate share of the expenses of the underlying Fidelity Central Funds.
The Money Market Central Funds seek preservation of capital and current income and are managed by Fidelity Investments Money Management, Inc. (FIMM), an affiliate of FMR.
A complete unaudited list of holdings for each Fidelity Central Fund is available upon request or at the Securities and Exchange Commission (the SEC) web site at www.sec.gov. In addition, the financial statements of the Fidelity Central Funds, which are not covered by the Fund's Report of Independent Registered Public Accounting Firm, are available on the SEC web site or upon request.
3. Significant Accounting Policies.
The financial statements have been prepared in conformity with accounting principles generally accepted in the United States of America (GAAP), which require management to make certain estimates and assumptions at the date of the financial statements. Actual results could differ from those estimates. The following summarizes the significant accounting policies of the Fund:
Security Valuation. Investments are valued as of 4:00 p.m. Eastern time on the last calendar day of the period. The Fund uses independent pricing services approved by the
Annual Report
Notes to Financial Statements - continued
(Amounts in thousands except ratios)
3. Significant Accounting Policies - continued
Security Valuation - continued
Board of Trustees to value its investments. When current market prices or quotations are not readily available or reliable, valuations may be determined in good faith in accordance with procedures adopted by the Board of Trustees. Factors used in determining value may include market or security specific events. The frequency with which these procedures are used cannot be predicted and they may be utilized to a significant extent. The value used for net asset value (NAV) calculation under these procedures may differ from published prices for the same securities.
The Fund categorizes the inputs to valuation techniques used to value its investments into a disclosure hierarchy consisting of three levels as shown below.
Level 1 - quoted prices in active markets for identical investments
Level 2 - other significant observable inputs (including quoted prices for similar investments, interest rates, prepayment speeds, etc.)
Level 3 - unobservable inputs (including the fund's own assumptions based on the best information available)
Changes in valuation techniques may result in transfers in or out of an assigned level within the disclosure hierarchy. The aggregate value of investments by input level, as of October 31, 2010, is included at the end of the Fund's Schedule of Investments. Valuation techniques used to value the Fund's investments by major category are as follows.
Equity securities, including restricted securities, for which market quotations are readily available, are valued at the last reported sale price or official closing price as reported by an independent pricing service on the primary market or exchange on which they are traded and are categorized as Level 1 in the hierarchy. In the event there were no sales during the day or closing prices are not available, securities are valued at the last quoted bid price or may be valued using the last available price and are generally categorized as Level 2 in the hierarchy. For foreign equity securities, when significant market or security specific events arise, comparisons to the valuation of American Depositary Receipts (ADRs), futures contracts, Exchange-traded funds (ETFs) and certain indexes as well as quoted prices for similar securities are used and are categorized as Level 2 in the hierarchy in these circumstances. Utilizing these techniques may result in transfers between Level 1 and Level 2. For restricted equity securities and private placements where observable inputs are limited, assumptions about market activity and risk are used and are categorized as Level 3 in the hierarchy.
Investments in open-end mutual funds, including the Fidelity Central Funds, are valued at their closing net asset value each business day and are categorized as Level 1 in the hierarchy. Short-term securities with remaining maturities of sixty days or less for which
Annual Report
3. Significant Accounting Policies - continued
Security Valuation - continued
quotations are not readily available are valued at amortized cost, which approximates fair value and are categorized as Level 2 in the hierarchy.
Foreign Currency. The Fund uses foreign currency contracts to facilitate transactions in foreign-denominated securities. Gains and losses from these transactions may arise from changes in the value of the foreign currency or if the counterparties do not perform under the contracts' terms.
Foreign-denominated assets, including investment securities, and liabilities are translated into U.S. dollars at the exchange rate at period end. Purchases and sales of investment securities, income and dividends received and expenses denominated in foreign currencies are translated into U.S. dollars at the exchange rate in effect on the transaction date.
The effects of exchange rate fluctuations on investments are included with the net realized and unrealized gain (loss) on investment securities. Other foreign currency transactions resulting in realized and unrealized gain (loss) are disclosed separately.
Investment Transactions and Income. For financial reporting purposes, the Fund's investment holdings and NAV include trades executed through the end of the last business day of the period. The NAV per share for processing shareholder transactions is calculated as of the close of business of the New York Stock Exchange (NYSE), normally 4:00 p.m. Eastern time and includes trades executed through the end of the prior business day. Gains and losses on securities sold are determined on the basis of identified cost and may include proceeds received from litigation. Dividend income is recorded on the ex-dividend date, except for certain dividends from foreign securities where the ex-dividend date may have passed, which are recorded as soon as the Fund is informed of the ex-dividend date. Non-cash dividends included in dividend income, if any, are recorded at the fair market value of the securities received. Distributions received on securities that represent a return of capital or capital gain are recorded as a reduction of cost of investments and/or as a realized gain. The Fund estimates the components of distributions received that may be considered return of capital distributions or capital gain distributions. As a result of a change in the estimate of the return of capital component of dividend income realized in the year ended October 31, 2009, dividend income has been increased $7,146, with a corresponding decrease to net unrealized appreciation (depreciation). The change in estimate has no impact on total net assets or total return of the Fund. Interest income and distributions from the Fidelity Central Funds are accrued as earned. Interest income includes coupon interest and amortization of premium and accretion of discount on debt securities. Investment income is recorded net of foreign taxes withheld where recovery of such taxes is uncertain.
Annual Report
Notes to Financial Statements - continued
(Amounts in thousands except ratios)
3. Significant Accounting Policies - continued
Expenses. Most expenses of the Trust can be directly attributed to a fund. Expenses which cannot be directly attributed are apportioned amongst each fund in the Trust. Expense estimates are accrued in the period to which they relate and adjustments are made when actual amounts are known.
Deferred Trustee Compensation. Under a Deferred Compensation Plan (the Plan), independent Trustees may elect to defer receipt of a portion of their annual compensation. Deferred amounts are invested in a cross-section of Fidelity funds, are marked-to-market and remain in the Fund until distributed in accordance with the Plan. The investment of deferred amounts and the offsetting payable to the Trustees are included in the accompanying Statement of Assets and Liabilities.
Income Tax Information and Distributions to Shareholders. Each year the Fund intends to qualify as a regulated investment company, including distributing substantially all of its taxable income and realized gains under Subchapter M of the Internal Revenue Code and filing its U.S. federal tax return. As a result, no provision for income taxes is required. As of October 31, 2010, the Fund did not have any unrecognized tax benefits in the accompanying financial statements. A fund's federal tax return is subject to examination by the Internal Revenue Service (IRS) for a period of three years. Foreign taxes are provided for based on the Fund's understanding of the tax rules and rates that exist in the foreign markets in which it invests.
Distributions are declared and recorded on the ex-dividend date. Income dividends and capital gain distributions are declared separately for each class. Income and capital gain distributions are determined in accordance with income tax regulations, which may differ from GAAP.
Capital accounts within the financial statements are adjusted for permanent book-tax differences. These adjustments have no impact on net assets or the results of operations. Temporary book-tax differences will reverse in a subsequent period.
Book-tax differences are primarily due to the short-term gain distributions from the Fidelity Central Funds, foreign currency transactions, deferred trustees compensation, capital loss carryforwards and losses deferred due to wash sales.
The federal tax cost of investment securities and unrealized appreciation (depreciation) as of period end were as follows:
Gross unrealized appreciation | $ 741,080 |
Gross unrealized depreciation | (308,505) |
Net unrealized appreciation (depreciation) | $ 432,575 |
| |
Tax Cost | $ 5,198,743 |
Annual Report
3. Significant Accounting Policies - continued
Income Tax Information and Distributions to Shareholders - continued
The tax-based components of distributable earnings as of period end were as follows:
Capital loss carryforward | $ (642,471) |
Net unrealized appreciation (depreciation) | $ 432,560 |
The tax character of distributions paid was as follows:
| October 31, 2010 | October 31, 2009 |
Ordinary Income | $ 5,772 | $ 53,246 |
4. Purchases and Sales of Investments.
Purchases and sales of securities, other than short-term securities, aggregated $8,845,563 and $9,503,135, respectively.
5. Fees and Other Transactions with Affiliates.
Management Fee. FMR and its affiliates provide the Fund with investment management related services for which the Fund pays a monthly management fee. The management fee is the sum of an individual fund fee rate that is based on an annual rate of .30% of the Fund's average net assets and a group fee rate that averaged .26% during the period. The group fee rate is based upon the average net assets of all the mutual funds advised by FMR. The group fee rate decreases as assets under management increase and increases as assets under management decrease. In addition, the management fee is subject to a performance adjustment (up to a maximum of ± .20% of the Fund's average net assets over a 36 month performance period). The upward or downward adjustment to the management fee is based on the relative investment performance of the retail class of the Fund, Capital Appreciation as compared to an appropriate benchmark index. For the period, the total annual management fee rate, including the performance adjustment, was .62% of the Fund's average net assets.
Transfer Agent Fees. Fidelity Investments Institutional Operations Company, Inc. (FIIOC), an affiliate of FMR, is the transfer, dividend disbursing and shareholder servicing agent for each class of the Fund. FIIOC receives account fees and asset-based fees that vary according to the account size and type of account of the shareholders of Capital Appreciation. FIIOC receives an asset-based fee of Class K's average net assets. FIIOC
Annual Report
Notes to Financial Statements - continued
(Amounts in thousands except ratios)
5. Fees and Other Transactions with Affiliates - continued
Transfer Agent Fees - continued
pays for typesetting, printing and mailing of shareholder reports, except proxy statements. For the period, transfer agent fees for each class were as follows:
| Amount | % of
Average
Net Assets |
Capital Appreciation | $ 11,046 | .23 |
Class K | 306 | .05 |
| $ 11,352 | |
Accounting and Security Lending Fees. Fidelity Service Company, Inc. (FSC), an affiliate of FMR, maintains the Fund's accounting records. The accounting fee is based on the level of average net assets for the month. Under a separate contract, FSC administers the security lending program. The security lending fee is based on the number and duration of lending transactions.
Brokerage Commissions. The Fund placed a portion of its portfolio transactions with brokerage firms which are affiliates of the investment adviser. The commissions paid to these affiliated firms were $351 for the period.
6. Committed Line of Credit.
The Fund participates with other funds managed by FMR or an affiliate in a $3.75 billion credit facility (the "line of credit") to be utilized for temporary or emergency purposes to fund shareholder redemptions or for other short-term liquidity purposes. The Fund has agreed to pay commitment fees on its pro-rata portion of the line of credit, which amounted to $21 and is reflected in Miscellaneous expenses on the Statement of Operations. During the period, there were no borrowings on this line of credit.
7. Security Lending.
The Fund lends portfolio securities through a lending agent from time to time in order to earn additional income. The lending agent may loan securities to certain qualified borrowers, including Fidelity Capital Markets (FCM), a broker-dealer affiliated with the Fund. On the settlement date of the loan, the Fund receives collateral (in the form of U.S. Treasury obligations, letters of credit and/or cash) against the loaned securities and maintains collateral in an amount not less than 100% of the market value of the loaned securities during the period of the loan. The market value of the loaned securities is determined at the close of business of the Fund and any additional required collateral is delivered to the Fund on the next business day. If the borrower defaults on its obligation to return the securities loaned because of insolvency or other reasons, a fund could
Annual Report
7. Security Lending - continued
experience delays and costs in recovering the securities loaned or in gaining access to the collateral. Any cash collateral received is invested in the Fidelity Securities Lending Cash Central Fund. The value of loaned securities and cash collateral at period end are disclosed on the Fund's Statement of Assets and Liabilities. The value of securities loaned to FCM at period end was $420. Security lending income represents the income earned on investing cash collateral, less rebates paid to borrowers and lending agent fees associated with the loan, plus any premium payments received for lending certain types of securities. Security lending income is presented in the Statement of Operations as a component of income from Fidelity Central Funds. Total security lending income during the period amounted to $1,276, including $5 from securities loaned to FCM.
8. Expense Reductions.
Many of the brokers with whom FMR places trades on behalf of the Fund provided services to the Fund in addition to trade execution. These services included payments of certain expenses on behalf of the Fund totaling $1,042 for the period.
9. Distributions to Shareholders.
Distributions to shareholders of each class were as follows:
Years ended October 31, | 2010 | 2009 |
From net investment income | | |
Capital Appreciation | $ 5,336 | $ 51,796 |
Class K | 436 | 1,450 |
Total | $ 5,772 | $ 53,246 |
10. Share Transactions.
Transactions for each class of shares were as follows:
| Shares | Dollars |
Years ended October 31, | 2010 | 2009A | 2010 | 2009A |
Capital Appreciation | | | | |
Shares sold | 24,608 | 32,746 | $ 544,840 | $ 532,909 |
Conversion to Class K | - | (9,081) | - | (137,950) |
Reinvestment of distributions | 250 | 3,319 | 5,154 | 49,955 |
Shares redeemed | (77,678) | (67,177) | (1,707,314) | (1,079,034) |
Net increase (decrease) | (52,820) | (40,193) | $ (1,157,320) | $ (634,120) |
Annual Report
Notes to Financial Statements - continued
(Amounts in thousands except ratios)
10. Share Transactions - continued
| Shares | Dollars |
Years ended October 31, | 2010 | 2009A | 2010 | 2009A |
Class K | | | | |
Shares sold | 22,592 | 3,750 | $ 500,526 | $ 63,798 |
Conversion from Capital Appreciation | - | 9,086 | - | 137,950 |
Reinvestment of distributions | 21 | 96 | 436 | 1,450 |
Shares redeemed | (8,191) | (3,358) | (178,028) | (56,355) |
Net increase (decrease) | 14,422 | 9,574 | $ 322,934 | $ 146,843 |
A Conversion transactions for Class K and Capital Appreciation are presented for the period November 1, 2008, through August 31, 2009.
11. Other.
The Fund's organizational documents provide former and current trustees and officers with a limited indemnification against liabilities arising in connection with the performance of their duties to the Fund. In the normal course of business, the Fund may also enter into contracts that provide general indemnifications. The Fund's maximum exposure under these arrangements is unknown as this would be dependent on future claims that may be made against the Fund. The risk of material loss from such claims is considered remote.
Annual Report
To the Trustees of Fidelity Capital Trust and the Shareholders of Fidelity Capital Appreciation Fund:
In our opinion, the accompanying statement of assets and liabilities, including the schedule of investments, and the related statements of operations and of changes in net assets and the financial highlights present fairly, in all material respects, the financial position of Fidelity Capital Appreciation Fund (a fund of Fidelity Capital Trust) at October 31, 2010, the results of its operations for the year then ended, the changes in its net assets for each of the two years in the period then ended and the financial highlights for each of the periods indicated, in conformity with accounting principles generally accepted in the United States of America. These financial statements and financial highlights (hereafter referred to as "financial statements") are the responsibility of the Fidelity Capital Appreciation Fund's management. Our responsibility is to express an opinion on these financial statements based on our audits. We conducted our audits of these financial statements in accordance with the standards of the Public Company Accounting Oversight Board (United States). Those standards require that we plan and perform the audit to obtain reasonable assurance about whether the financial statements are free of material misstatement. An audit includes examining, on a test basis, evidence supporting the amounts and disclosures in the financial statements, assessing the accounting principles used and significant estimates made by management, and evaluating the overall financial statement presentation. We believe that our audits, which included confirmation of securities at October 31, 2010 by correspondence with the custodian and brokers, provide a reasonable basis for our opinion.
/s/ PricewaterhouseCoopers LLP
PricewaterhouseCoopers LLP
Boston, Massachusetts
December 10, 2010
Annual Report
The Trustees, Member of the Advisory Board, and executive officers of the trust and fund, as applicable, are listed below. The Board of Trustees governs the fund and is responsible for protecting the interests of shareholders. The Trustees are experienced executives who meet periodically throughout the year to oversee the fund's activities, review contractual arrangements with companies that provide services to the fund, oversee management of the risks associated with such activities and contractual arrangements, and review the fund's performance. Except for James C. Curvey, each of the Trustees oversees 221 funds advised by FMR or an affiliate. Mr. Curvey oversees 410 funds advised by FMR or an affiliate.
The Trustees hold office without limit in time except that (a) any Trustee may resign; (b) any Trustee may be removed by written instrument, signed by at least two-thirds of the number of Trustees prior to such removal; (c) any Trustee who requests to be retired or who has become incapacitated by illness or injury may be retired by written instrument signed by a majority of the other Trustees; and (d) any Trustee may be removed at any special meeting of shareholders by a two-thirds vote of the outstanding voting securities of the trust. Each Trustee who is not an interested person (as defined in the 1940 Act) (Independent Trustee), shall retire not later than the last day of the calendar year in which his or her 72nd birthday occurs. The Independent Trustees may waive this mandatory retirement age policy with respect to individual Trustees. The executive officers and Advisory Board Member hold office without limit in time, except that any officer and Advisory Board Member may resign or may be removed by a vote of a majority of the Trustees at any regular meeting or any special meeting of the Trustees. Except as indicated, each individual has held the office shown or other offices in the same company for the past five years.
Experience, Skills, Attributes, and Qualifications of the Fund's Trustees. The Governance and Nominating Committee has adopted a statement of policy that describes the experience, qualifications, attributes, and skills that are necessary and desirable for potential Independent Trustee candidates (Statement of Policy). The Board believes that each Trustee satisfied at the time he or she was initially elected or appointed a Trustee, and continues to satisfy, the standards contemplated by the Statement of Policy. The Governance and Nominating Committee also engages professional search firms to help identify potential Independent Trustee candidates who have the experience, qualifications, attributes, and skills consistent with the Statement of Policy. From time to time, additional criteria based on the composition and skills of the current Independent Trustees, as well as experience or skills that may be appropriate in light of future changes to board composition, business conditions, and regulatory or other developments, have also been considered by the professional search firms and the Governance and Nominating Committee. In addition, the Board takes into account the Trustees' commitment and participation in Board and committee meetings, as well as their leadership of standing and ad hoc committees throughout their tenure.
In determining that a particular Trustee was and continues to be qualified to serve as a Trustee, the Board has considered a variety of criteria, none of which, in isolation, was controlling. The Board believes that, collectively, the Trustees have balanced and diverse experience, qualifications, attributes, and skills, which allow the Board to operate effectively in governing the fund and protecting the interests of shareholders. Information about the specific experience, skills, attributes, and qualifications of each Trustee, which in each case led to the Board's conclusion that the Trustee should serve (or continue to serve) as a trustee of the fund, is provided below.
Annual Report
Trustees and Officers - continued
Board Structure and Oversight Function. Edward C. Johnson 3d is an interested person (as defined in the 1940 Act) and currently serves as Chairman. The Trustees have determined that an interested Chairman is appropriate and benefits shareholders because an interested Chairman has a personal and professional stake in the quality and continuity of services provided to the fund. Independent Trustees exercise their informed business judgment to appoint an individual of their choosing to serve as Chairman, regardless of whether the Trustee happens to be independent or a member of management. The Independent Trustees have determined that they can act independently and effectively without having an Independent Trustee serve as Chairman and that a key structural component for assuring that they are in a position to do so is for the Independent Trustees to constitute a substantial majority for the Board. The Independent Trustees also regularly meet in executive session. Ned C. Lautenbach serves as Chairman of the Independent Trustees and as such (i) acts as a liaison between the Independent Trustees and management with respect to matters important to the Independent Trustees and (ii) with management prepares agendas for Board meetings.
Fidelity funds are overseen by different Boards of Trustees. The fund's Board oversees Fidelity's equity and high income funds and another Board oversees Fidelity's investment-grade bond, money market, and asset allocation funds. The asset allocation funds may invest in Fidelity funds overseen by the fund's Board. The use of separate Boards, each with its own committee structure, allows the Trustees of each group of Fidelity funds to focus on the unique issues of the funds they oversee, including common research, investment, and operational issues. On occasion, the separate Boards establish joint committees to address issues of overlapping consequences for the Fidelity funds overseen by each Board.
The Trustees operate using a system of committees to facilitate the timely and efficient consideration of all matters of importance to the Trustees, the fund, and fund shareholders and to facilitate compliance with legal and regulatory requirements and oversight of the fund's activities and associated risks. The Board, acting through its committees, has charged FMR and its affiliates with (i) identifying events or circumstances the occurrence of which could have demonstrably adverse effects on the fund's business and/or reputation; (ii) implementing processes and controls to lessen the possibility that such events or circumstances occur or to mitigate the effects of such events or circumstances if they do occur; and (iii) creating and maintaining a system designed to evaluate continuously business and market conditions in order to facilitate the identification and implementation processes described in (i) and (ii) above. Because the day-to-day operations and activities of the fund are carried out by or through FMR, its affiliates and other service providers, the fund's exposure to risks is mitigated but not eliminated by the processes overseen by the Trustees. While each of the Board's committees has responsibility for overseeing different aspects of the fund's activities, oversight is exercised primarily through the Operations, Audit, and Compliance Committees. Appropriate personnel, including but not limited to the fund's Chief Compliance Officer (CCO), FMR's internal auditor, the independent accountants, the fund's Treasurer and portfolio management personnel, make periodic reports to the Board's committees, as appropriate. The responsibilities of each committee, including their oversight responsibilities, are described further under "Standing Committees of the Fund's Trustees."
Annual Report
The fund's Statement of Additional Information (SAI) includes more information about the Trustees. To request a free copy, call Fidelity at 1-800-835-5092.
Interested Trustees*:
Correspondence intended for each Trustee who is an interested person may be sent to Fidelity Investments, 82 Devonshire Street, Boston, Massachusetts 02109.
Name, Age; Principal Occupations and Other Relevant Experience+ |
Edward C. Johnson 3d (80) |
| Year of Election or Appointment: 1978 Mr. Johnson is Trustee and Chairman of the Board of Trustees of certain Trusts. Mr. Johnson serves as Chief Executive Officer, Chairman, and a Director of FMR LLC; Chairman and a Director of FMR; Chairman and a Director of Fidelity Research & Analysis Company (FRAC); Chairman and a Director of Fidelity Investments Money Management, Inc.; and Chairman and a Director of FMR Co., Inc. In addition, Mr. Johnson serves as Chairman and Director of FIL Limited. Previously, Mr. Johnson served as President of FMR LLC (2006-2007). |
James C. Curvey (75) |
| Year of Election or Appointment: 2007 Mr. Curvey also serves as Trustee (2007-present) of other investment companies advised by FMR. Mr. Curvey is a Director of Fidelity Investments Money Management, Inc. (2009-present), Director of Fidelity Research & Analysis Co. (2009-present) and Director of FMR and FMR Co., Inc. (2007-present). Mr. Curvey is also Vice Chairman (2007-present) and Director of FMR LLC. In addition, Mr. Curvey serves as an Overseer for the Boston Symphony Orchestra and a member of the Trustees of Villanova University. Previously, Mr. Curvey was the Vice Chairman (2006-2007) and Director (2000-2007) of FMR Corp. |
* Trustees have been determined to be "Interested Trustees" by virtue of, among other things, their affiliation with the trust or various entities under common control with FMR.
Annual Report
Trustees and Officers - continued
+ The information above includes each Trustee's principal occupation during the last five years and other information relating to the experience, attributes, and skills relevant to each Trustee's qualifications to serve as a Trustee, which led to the conclusion that each Trustee should serve as a Trustee for the fund.
Independent Trustees:
Correspondence intended for each Independent Trustee (that is, the Trustees other than the Interested Trustees) may be sent to Fidelity Investments, P.O. Box 55235, Boston, Massachusetts 02205-5235.
Name, Age; Principal Occupations and Other Relevant Experience+ |
Dennis J. Dirks (62) |
| Year of Election or Appointment: 2005 Prior to his retirement in May 2003, Mr. Dirks was Chief Operating Officer and a member of the Board of The Depository Trust & Clearing Corporation (DTCC). He also served as President, Chief Operating Officer, and Board member of The Depository Trust Company (DTC) and President and Board member of the National Securities Clearing Corporation (NSCC). In addition, Mr. Dirks served as Chief Executive Officer and Board member of the Government Securities Clearing Corporation, Chief Executive Officer and Board member of the Mortgage-Backed Securities Clearing Corporation, as a Trustee and a member of the Finance Committee of Manhattan College (2005-2008), and as a Trustee and a member of the Finance Committee of AHRC of Nassau County (2006-2008). Mr. Dirks is a member of the Independent Directors Council (IDC) Governing Council (2010-Present) and Board of Directors for The Brookville Center for Children's Services, Inc. (2009-present). |
Alan J. Lacy (57) |
| Year of Election or Appointment: 2008 Mr. Lacy serves as Senior Adviser (2007-present) of Oak Hill Capital Partners, L.P. (private equity). Mr. Lacy also served as Chief Executive Officer (2000-2005) and Vice Chairman (2005-2006) of Sears Holdings Corporation and Sears, Roebuck and Co. (retail). In addition, Mr. Lacy serves as a member of the Board of Directors of The Western Union Company (global money transfer, 2006-present) and Bristol-Myers Squibb Company (global pharmaceuticals, 2007-present). Mr. Lacy is Chairman (2008-present) and a member (2006-present) of the Board of Trustees of The National Parks Conservation Association. |
Ned C. Lautenbach (66) |
| Year of Election or Appointment: 2000 Mr. Lautenbach is Chairman of the Independent Trustees of the Equity and High Income Funds (2006-present). Mr. Lautenbach currently serves as the Lead Director of the Eaton Corporation Board of Directors (diversified industrial, 1997-present). Mr. Lautenbach is also a member of the Board of Directors of the Philharmonic Center for the Arts in Naples, Florida (1999-present); a member of the Board of Trustees of Fairfield University (2005-present); and a member of the Council on Foreign Relations (1994-present). Previously, Mr. Lautenbach was a Partner/Advisory Partner at Clayton, Dubilier & Rice, Inc. (private equity investment, 1998-2010), as well as a Director of Sony Corporation (2006-2007). |
Joseph Mauriello (66) |
| Year of Election or Appointment: 2008 Prior to his retirement in January 2006, Mr. Mauriello served in numerous senior management positions including Deputy Chairman and Chief Operating Officer (2004-2005), and Vice Chairman of Financial Services (2002-2004) of KPMG LLP US (professional services, 1965-2005). Mr. Mauriello currently serves as a member of the Board of Directors of XL Group plc. (global insurance and re-insurance, 2006-present) and of Arcadia Resources Inc. (health care services and products, 2007-present). Previously, Mr. Mauriello served as a Director of the Hamilton Funds of the Bank of New York (2006-2007). |
Cornelia M. Small (66) |
| Year of Election or Appointment: 2005 Ms. Small is a member of the Board of Directors of the Teagle Foundation (2009-present). Ms. Small is also a member of the Investment Committee, and Chair (2008-present) and a member of the Board of Trustees of Smith College. In addition, Ms. Small serves on the Investment Committee of the Berkshire Taconic Community Foundation (2008-present). Previously, Ms. Small served as Chairperson of the Investment Committee (2002-2008) of Smith College. In addition, Ms. Small served as Chief Investment Officer, Director of Global Equity Investments, and a member of the Board of Directors of Scudder, Stevens & Clark and Scudder Kemper Investments. |
William S. Stavropoulos (71) |
| Year of Election or Appointment: 2002 Mr. Stavropoulos is Vice Chairman of the Independent Trustees of the Equity and High Income Funds (2006-present). Mr. Stavropoulos serves as President and Founder of the Michigan Baseball Foundation, the Great Lakes Loons (2007-present). Mr. Stavropoulos is Chairman Emeritus of the Board of Directors of The Dow Chemical Company, where he previously served in numerous senior management positions, including President, CEO (1995-2000; 2002-2004), Chairman of the Executive Committee (2000-2006), and as a member of the Board of Directors (1990-2006). Currently, Mr. Stavropoulos is Chairman of Univar (global distributor of commodity and specialty chemicals, 2010-present), a Director of Teradata Corporation (data warehousing and technology solutions, 2008-present), Chemical Financial Corporation, Maersk Inc. (industrial conglomerate), Tyco International, Inc. (multinational manufacturing and services, 2007-present), and a member of the Advisory Board for Metalmark Capital (private equity investment, 2005-
present). Mr. Stavropoulos is a special advisor to Clayton, Dubilier & Rice, Inc. (private equity investment). In addition, Mr. Stavropoulos is a member of the University of Notre Dame Advisory Council for the College of Science. |
David M. Thomas (61) |
| Year of Election or Appointment: 2008 Previously, Mr. Thomas served as Executive Chairman (2005-2006) and Chairman and Chief Executive Officer (2000-2005) of IMS Health, Inc. (pharmaceutical and healthcare information solutions). In addition, Mr. Thomas serves as a member of the Board of Directors of Fortune Brands, Inc. (consumer products), and Interpublic Group of Companies, Inc. (marketing communication, 2004-present). |
Michael E. Wiley (60) |
| Year of Election or Appointment: 2008 Mr. Wiley also serves as a Director of Asia Pacific Exploration Consolidated (international oil and gas exploration and production, 2008-present). Mr. Wiley serves as a Director of Tesoro Corporation (independent oil refiner and marketer, 2005-present), and a Director of Bill Barrett Corporation (exploration and production, 2005-present). In addition, Mr. Wiley also serves as a Director of Post Oak Bank (privately-held bank, 2004-present). Previously, Mr. Wiley served as a member of the Board of Trustees of the University of Tulsa (2000-2006; 2007-2010), as a Senior Energy Advisor of Katzenbach Partners, LLC (consulting, 2006-2007), as an Advisory Director of Riverstone Holdings (private investment), Chairman, President, and CEO of Baker Hughes, Inc. (oilfield services, 2000-2004), and as Director of Spinnaker Exploration Company (exploration and production, 2001-2005). |
Annual Report
+ The information above includes each Trustee's principal occupation during the last five years and other information relating to the experience, attributes, and skills relevant to each Trustee's qualifications to serve as a Trustee, which led to the conclusion that each Trustee should serve as a Trustee for the fund.
Advisory Board Member and Executive Officers:
Correspondence intended for each executive officer and Peter S. Lynch may be sent to Fidelity Investments, 82 Devonshire Street, Boston, Massachusetts 02109.
Name, Age; Principal Occupation |
Peter S. Lynch (66) |
| Year of Election or Appointment: 2003 Member of the Advisory Board of Fidelity's Equity and High Income Funds. Mr. Lynch is Vice Chairman and a Director of FMR and FMR Co., Inc. In addition, Mr. Lynch serves as a Trustee of Boston College and as the Chairman of the Inner-City Scholarship Fund. Previously, Mr. Lynch served on the Special Olympics International Board of Directors (1997-2006). |
Kenneth B. Robins (41) |
| Year of Election or Appointment: 2008 President and Treasurer of Fidelity's Equity and High Income Funds. Mr. Robins also serves as President and Treasurer (2010-present) and Assistant Treasurer (2009-present) of other Fidelity funds and is an employee of Fidelity Investments (2004-present). Previously, Mr. Robins served as Deputy Treasurer of the Fidelity funds (2005-2008) and Treasurer and Chief Financial Officer of The North Carolina Capital Management Trust: Cash and Term Portfolios (2006-2008). |
Bruce T. Herring (45) |
| Year of Election or Appointment: 2006 Vice President of certain Equity Funds. Mr. Herring also serves as Chief Investment Officer and Director of Fidelity Management & Research (U.K.) Inc. (2010-present) and Group Chief Investments Officer of FMR. Previously, Mr. Herring served as Vice President (2005-2006) and Senior Vice President (2006-2007) of Fidelity Management & Research Company, Vice President of FMR Co., Inc. (2001-2007) and as a portfolio manager for Fidelity U.S. Equity Funds. |
Brian B. Hogan (46) |
| Year of Election or Appointment: 2009 Vice President of certain Equity Funds and Vice President of Sector Funds. Mr. Hogan also serves as President of FMR's Equity Division (2009-present). Previously, Mr. Hogan served as Senior Vice President, Equity Research of FMR (2006-2009) and as a portfolio manager. |
Scott C. Goebel (42) |
| Year of Election or Appointment: 2008 Secretary and Chief Legal Officer (CLO) of the Fidelity funds. Mr. Goebel also serves as Secretary and CLO of The North Carolina Capital Management Trust: Cash and Term Portfolio (2008-present); General Counsel, Secretary, and Senior Vice President of FMR (2008-present) and FMR Co., Inc. (2008-present); Deputy General Counsel of FMR LLC; Chief Legal Officer of Fidelity Management & Research (Hong Kong) Limited (2008-present) and Assistant Secretary of Fidelity Management & Research (Japan) Inc. (2008-present), Fidelity Investments Money Management, Inc. (2008-present), Fidelity Management & Research (U.K.) Inc. (2008-present), and Fidelity Research and Analysis Company (2008-present). Previously, Mr. Goebel served as Assistant Secretary of the Funds (2007-2008) and as Vice President and Secretary of Fidelity Distributors Corporation (FDC) (2005-2007). |
William C. Coffey (41) |
| Year of Election or Appointment: 2009 Assistant Secretary of Fidelity's Equity and High Income Funds. Mr. Coffey also serves as Senior Vice President and Deputy General Counsel of FMR LLC (2010-present), and is an employee of Fidelity Investments. Previously, Mr. Coffey served as Vice President and Associate General Counsel of FMR LLC (2005-2009). |
Holly C. Laurent (56) |
| Year of Election or Appointment: 2008 Anti-Money Laundering (AML) Officer of the Fidelity funds. Ms. Laurent also serves as AML Officer of The North Carolina Capital Management Trust: Cash and Term Portfolio (2008-present) and is an employee of Fidelity Investments. Previously, Ms. Laurent was Senior Vice President and Head of Legal for Fidelity Business Services India Pvt. Ltd. (2006-2008), and Senior Vice President, Deputy General Counsel and Group Head for FMR LLC (2005-2006). |
Christine Reynolds (52) |
| Year of Election or Appointment: 2008 Chief Financial Officer of the Fidelity funds. Ms. Reynolds became President of Fidelity Pricing and Cash Management Services (FPCMS) in August 2008. Ms. Reynolds served as Chief Operating Officer of FPCMS (2007-2008). Previously, Ms. Reynolds served as President, Treasurer, and Anti-Money Laundering officer of the Fidelity funds (2004-2007). |
Kenneth A. Rathgeber (63) |
| Year of Election or Appointment: 2004 Chief Compliance Officer of Fidelity's Equity and High Income Funds. Mr. Rathgeber is Chief Compliance Officer of Fidelity Management & Research (Hong Kong) Limited (2008-present), Fidelity Management & Research (Japan) Inc. (2008-present), FMR (2005-present), FMR Co., Inc. (2005-present), Fidelity Management & Research (U.K.) Inc. (2005-present), Fidelity Research & Analysis Company (2005-present), Fidelity Investments Money Management, Inc. (2005-present), Pyramis Global Advisors, LLC (2005-present), and Strategic Advisers, Inc. (2005-present). |
Jeffrey S. Christian (49) |
| Year of Election or Appointment: 2009 Deputy Treasurer of the Fidelity funds. Mr. Christian is an employee of Fidelity Investments. Previously, Mr. Christian served as Chief Financial Officer (2008-2009) of certain Fidelity funds and Senior Vice President of Fidelity Pricing and Cash Management Services (FPCMS) (2004-2009). |
Bryan A. Mehrmann (49) |
| Year of Election or Appointment: 2005 Deputy Treasurer of the Fidelity funds. Mr. Mehrmann is an employee of Fidelity Investments. |
Adrien E. Deberghes (43) |
| Year of Election or Appointment: 2008 Deputy Treasurer of Fidelity's Equity and High Income Funds. Mr. Deberghes also serves as Assistant Treasurer of other Fidelity funds (2010-present) and is an employee of Fidelity Investments (2008-present). Previously, Mr. Deberghes served as Senior Vice President of Mutual Fund Administration at State Street Corporation (2007-2008), Senior Director of Mutual Fund Administration at Investors Bank & Trust (2005-2007), and Director of Finance for Dunkin' Brands (2000-2005). |
Stephanie J. Dorsey (41) |
| Year of Election or Appointment: 2010 Assistant Treasurer of Fidelity's Equity and High Income Funds. Ms. Dorsey also serves as Deputy Treasurer of other Fidelity funds (2008-present) and is an employee of Fidelity Investments (2008-present). Previously, Ms. Dorsey served as Treasurer (2004-2008) of the JPMorgan Mutual Funds and Vice President (2004-2008) of JPMorgan Chase Bank. |
John R. Hebble (52) |
| Year of Election or Appointment: 2009 Assistant Treasurer of Fidelity's Equity and High Income Funds. Mr. Hebble also serves as Treasurer and Chief Financial Officer of The North Carolina Capital Management Trust: Cash and Term Portfolio (2008-present), President and Treasurer of other Fidelity funds (2008-present) and is an employee of Fidelity Investments. |
Gary W. Ryan (52) |
| Year of Election or Appointment: 2005 Assistant Treasurer of the Fidelity funds. Mr. Ryan is an employee of Fidelity Investments. Previously, Mr. Ryan served as Vice President of Fund Reporting in Fidelity Pricing and Cash Management Services (FPCMS) (1999-2005). |
Jonathan Davis (42) |
| Year of Election or Appointment: 2010 Assistant Treasurer of the Fidelity funds. Mr. Davis is an employee of Fidelity Investments. Previously, Mr. Davis served as Vice President and Associate General Counsel of FMR LLC (2003-2010). |
Annual Report
Class K designates 100% of the dividends distributed during the fiscal year as qualifying for the dividends-received deduction for corporate shareholders.
Class K designates 100% of the dividends distributed during the fiscal year as amounts which may be taken into account as a dividend for the purposes of the maximum rate under section 1(h)(11) of the Internal Revenue Code.
The fund will notify shareholders in January 2011 of amounts for use in preparing 2010 income tax returns.
Annual Report
Board Approval of Investment Advisory Contracts and Management Fees
Fidelity Capital Appreciation Fund
Each year, the Board of Trustees, including the Independent Trustees (together, the Board), votes on the renewal of the management contract and sub-advisory agreements (together, the Advisory Contracts) for the fund. The Board, assisted by the advice of fund counsel and Independent Trustees' counsel, requests and considers a broad range of information relevant to the renewal of the Advisory Contracts throughout the year.
The Board meets regularly and considers at each of its meetings factors that are relevant to its annual consideration of the renewal of the fund's Advisory Contracts, including the services and support provided to the fund and its shareholders. The Board has established various standing committees, each composed of Independent Trustees with varying backgrounds, to which the Board has assigned specific subject matter responsibilities in order to enhance effective decision-making by the Board. The Board, acting directly and through its Committees, requests and receives information concerning the annual consideration of the renewal of the fund's Advisory Contracts. The Board also meets as needed to consider matters specifically related to the Board's annual consideration of the renewal of Advisory Contracts. Members of the Board may also meet with trustees of other Fidelity funds through ad hoc joint committees to discuss certain matters relevant to the Fidelity funds.
At its July 2010 meeting, the Board of Trustees, including the Independent Trustees, unanimously determined to renew the fund's Advisory Contracts. In reaching its determination, the Board considered all factors it believed relevant, including (i) the nature, extent, and quality of the services to be provided to the fund and its shareholders (including the investment performance of the fund); (ii) the competitiveness of the fund's management fee and total expenses; (iii) the total costs of the services to be provided by and the profits to be realized by Fidelity from its relationship with the fund; (iv) the extent to which economies of scale would be realized as the fund grows; and (v) whether fee levels reflect these economies of scale, if any, for the benefit of fund shareholders.
In considering whether to renew the Advisory Contracts for the fund, the Board reached a determination, with the assistance of fund counsel and Independent Trustees' counsel and through the exercise of its business judgment, that the renewal of the Advisory Contracts is in the best interests of fund shareholders and that the compensation to be received by Fidelity under the management contract is fair and reasonable. The Board's decision to renew the Advisory Contracts was not based on any single factor noted above, but rather was based on a comprehensive consideration of all the information provided to the Board at its meetings throughout the year. The Board, in reaching its determination to renew the Advisory Contracts, is aware that shareholders in the fund have a broad range of investment choices available to them, including a wide choice among mutual funds offered by Fidelity's competitors, and that the fund's shareholders, with the opportunity to review and weigh the disclosure provided by the fund in its prospectus and other public disclosures, have chosen to invest in this fund, managed by Fidelity.
Annual Report
Nature, Extent, and Quality of Services Provided. The Board considered the staffing within the investment adviser, FMR, and the sub-advisers (together, the Investment Advisers), including the backgrounds of the fund's investment personnel and the fund's investment objective and discipline. The Independent Trustees also had discussions with senior management of Fidelity's investment operations and investment groups. The Board considered the structure of the portfolio manager compensation program and whether this structure provides appropriate incentives to act in the best interest of the fund.
Resources Dedicated to Investment Management and Support Services. The Board and the equity research subcommittee of the Board's Fund Oversight Committee reviewed the size, education, and experience of the Investment Advisers' investment staff, their use of technology, and the Investment Advisers' approach to recruiting, training, and retaining portfolio managers and other research, advisory, and management personnel. The Board noted that Fidelity's analysts have access to a variety of technological tools and market and securities data that enable them to perform both fundamental and quantitative analysis and to specialize in various disciplines. The Board considered Fidelity's extensive global research capabilities that enable the Investment Advisers to aggregate data from various sources in an effort to produce positive investment results. The Board also considered that Fidelity's portfolio managers and analysts have access to daily portfolio attribution that allows for monitoring of a fund's portfolio, as well as an electronic communication system that provides immediate real-time access to research concerning issuers and credit enhancers. The Board noted FMR's continued focus on strengthening the organization and discipline of equity portfolio management and research.
Shareholder and Administrative Services. The Board considered (i) the nature, extent, quality, and cost of advisory, administrative, and shareholder services performed by the Investment Advisers and their affiliates under the Advisory Contracts and under separate agreements covering transfer agency, pricing and bookkeeping, and securities lending services for the fund; (ii) the nature and extent of the investment adviser's supervision of third party service providers, principally custodians and subcustodians; and (iii) the resources devoted to, and the record of compliance with, the fund's compliance policies and procedures. The Board also reviewed the allocation of fund brokerage, including allocations to brokers affiliated with the Investment Advisers, the use of brokerage commissions to pay fund expenses, and the use of "soft" commission dollars to pay for research services.
The Board noted that the growth of fund assets over time across the complex allows Fidelity to reinvest in the development of services designed to enhance the value or convenience of the Fidelity funds as investment vehicles. These services include 24-hour access to account information and market information through phone representatives and over the Internet, and investor education materials and asset allocation tools.
Annual Report
Board Approval of Investment Advisory Contracts and
Management Fees - continued
Investment in a Large Fund Family. The Board considered the benefits to shareholders of investing in a Fidelity fund, including the benefits of investing in a fund that is part of a large family of funds offering a variety of investment disciplines and providing a large variety of mutual fund investor services. The Board noted that Fidelity had taken, or had made recommendations that resulted in the Fidelity funds taking, a number of actions over the previous year that benefited particular funds, including (i) dedicating additional resources to investment research and restructuring and broadening the focus of the investment research teams; (ii) bolstering the senior management team that oversees asset management; (iii) launching Class F of certain funds as a lower-fee class available to Freedom K and Freedom Index Funds; (iv) lowering the initial investment minimums and ongoing balance requirements for Real Estate High Income Fund; (v) eliminating subsequent purchase minimums for all funds and adding a waiver of the investment minimum requirement for new accounts opened with the proceeds of a systematic withdrawal plan; (vi) eliminating the withdrawal minimum and maximum limits for systematic withdrawals from Advisor funds; (vii) expanding sales load waivers on Class A shares for Destiny Planholders and expanding Institutional Class eligibility for Class O Destiny Planholders; and (viii) changing certain Class A and Class T sales charge structures to further align them with industry practices.
Investment Performance. The Board considered whether the fund has operated in accordance with its investment objective, as well as its record of compliance with its investment restrictions. It also reviewed the fund's absolute investment performance for each class, as well as the fund's relative investment performance for each class measured over multiple periods against (i) a broad-based securities market index, and (ii) a custom peer group of mutual funds deemed appropriate by Fidelity and reviewed by the Board. The following charts considered by the Board show, over the one-, three-, and five-year periods ended December 31, 2009, as available, the cumulative total returns of Class K and the retail class of the fund, the cumulative total returns of a broad-based securities market index ("benchmark"), and a range of cumulative total returns of a custom peer group of mutual funds defined by FMR based on categories assigned by Morningstar, Inc. The box within each chart shows the 25th percentile return (bottom of box) and the 75th percentile return (top of box) of the peer group. Returns shown above the box are in the first quartile and returns shown below the box are in the fourth quartile. The percentage beaten numbers noted below each chart correspond to the percentile box and represent the percentage of funds in the peer group whose performance was equal to or lower than that of the class indicated. The fund's custom peer group, defined by FMR, is a peer group that FMR believes provides a more meaningful performance comparison than the peer group assigned by Morningstar, Inc., which assigns mutual funds to categories based on their investment styles as measured by their underlying portfolio holdings.
Annual Report
Fidelity Capital Appreciation Fund
The Board reviewed the fund's relative investment performance against its peer group and noted that the performance of the retail class of the fund (the class with the longer performance record) was in the second quartile for all the periods shown. The Board also noted that the investment performance of the retail class of the fund compared favorably to its benchmark for all the periods shown. The Board considered that the variations in performance between the fund's classes reflect the variations in class expenses, which result in lower performance for the higher expense class. The Board also reviewed the fund's performance since inception as well as performance in the current year.
The Board also considered that the fund's management fee is subject to upward or downward adjustment depending upon whether, and to what extent, the fund's investment performance for the performance period exceeds, or is exceeded by, the record (over the same period) of a Board-approved performance adjustment index. The Board realizes that the performance adjustment provides FMR with a strong economic incentive to seek to achieve superior performance for the fund's shareholders and helps to more closely align the interests of FMR and the fund's shareholders.
Based on its review, and giving particular weight to the nature and quality of the resources dedicated by the Investment Advisers to maintain and improve relative performance and factoring in the unprecedented market events in recent years, the Board concluded that the nature, extent, and quality of investment management and support services and of shareholder and administrative services provided to the fund will benefit the fund's shareholders, particularly in light of the Board's view that the fund's shareholders benefit from investing in a fund that is part of a large family of funds offering a variety of investment disciplines and services.
Annual Report
Board Approval of Investment Advisory Contracts and
Management Fees - continued
Competitiveness of Management Fee and Total Fund Expenses. The Board considered the fund's management fee and total expenses compared to "mapped groups" of competitive funds and classes. Fidelity creates "mapped groups" by combining similar Lipper investment objective categories that have comparable management fee characteristics. Combining Lipper investment objective categories aids the Board's management fee and total expense comparisons by broadening the competitive group used for comparison and by reducing the number of universes to which various Fidelity funds are compared.
Management Fee. The Board considered two proprietary management fee comparisons for the 12-month periods shown in the chart below. The group of Lipper funds used by the Board for management fee comparisons is referred to below as the "Total Mapped Group." The Total Mapped Group comparison focuses on a fund's standing relative to the total universe of comparable funds available to investors, in terms of gross management fees before expense reimbursements or caps, and without giving effect to the fund's performance adjustment. "TMG %" represents the percentage of funds in the Total Mapped Group that had management fees that were lower than the fund's. For example, a TMG % of 10% means that 90% of the funds in the Total Mapped Group had higher management fees than the fund. The "Asset-Size Peer Group" (ASPG) comparison focuses on a fund's standing relative to non-Fidelity funds similar in size to the fund within the Total Mapped Group. The ASPG represents at least 15% of the funds in the Total Mapped Group with comparable asset size and management fee characteristics, subject to a minimum of 50 funds (or all funds in the Total Mapped Group if fewer than 50). Additional information, such as the ASPG quartile in which the fund's management fee ranked and the impact of the fund's performance adjustment, is also included in the chart and considered by the Board.
Annual Report
Fidelity Capital Appreciation Fund
The Board noted that the fund's management fee ranked below the median of its Total Mapped Group and below the median of its ASPG for 2009. The Board also noted the effect of the fund's negative performance adjustment on the fund's management fee ranking. The Board noted that the performance adjustment for each year represents calculations for performance periods that differ from the periods shown in the performance charts above.
Based on its review, the Board concluded that the fund's management fee is fair and reasonable in light of the services that the fund receives and the other factors considered.
Total Expenses. In its review of each class's total expenses, the Board considered the fund's management fee as well as other fund or class expenses, as applicable, such as transfer agent fees, pricing and bookkeeping fees, and custodial, legal, and audit fees. The Board also noted the effects of any waivers and reimbursements on fees and expenses, as well as the impact of the fund's performance adjustment. As part of its review, the Board also considered current and historical total expenses of each class of the fund compared to competitive fund median expenses. Each class of the fund is compared to those funds and classes in the Total Mapped Group (used by the Board for management fee comparisons) that have a similar sales load structure.
The Board noted that the total expenses of each class ranked below its competitive median for 2009.
Annual Report
Board Approval of Investment Advisory Contracts and
Management Fees - continued
Fees Charged to Other Fidelity Clients. The Board also considered Fidelity fee structures and other information with respect to clients of FMR and its affiliates, such as other mutual funds advised or subadvised by FMR or its affiliates, pension plan clients, and other institutional clients. In March 2010, the Board created an ad hoc joint committee with the board of other Fidelity funds (the Committee) to review and compare Fidelity's institutional investment advisory business with its business of providing services to the Fidelity funds, including the differences in services provided, fees charged, and costs incurred, as well as competition in their respective marketplaces.
Based on its review of total expenses and fees charged to other Fidelity clients, the Board concluded that the total expenses of each class of the fund were reasonable in light of the services that the fund and its shareholders receive and the other factors considered, including the findings of the Committee.
Costs of the Services and Profitability. The Board considered the revenues earned and the expenses incurred by Fidelity in conducting the business of developing, marketing, distributing, managing, administering and servicing the fund and its shareholders. The Board also considered the level of Fidelity's profits in respect of all the Fidelity funds.
On an annual basis, FMR presents to the Board Fidelity's profitability for the fund. Fidelity calculates the profitability for each fund, as well as aggregate profitability for groups of Fidelity funds and all Fidelity funds, using a series of detailed revenue and cost allocation methodologies which originate with the audited books and records of Fidelity. The Audit Committee of the Board reviews any significant changes from the prior year's methodologies.
PricewaterhouseCoopers LLP (PwC), independent registered public accounting firm and auditor to Fidelity and certain Fidelity funds, has been engaged annually by the Board as part of the Board's assessment of Fidelity's profitability analysis. PwC's engagement includes the review and assessment of Fidelity's methodologies used in determining the revenues and expenses attributable to Fidelity's mutual fund business, and completion of agreed-upon procedures surrounding the mathematical accuracy of fund profitability and its conformity to allocation methodologies. After considering PwC's reports issued under the engagement and information provided by Fidelity, the Board believes that while other allocation methods may also be reasonable, Fidelity's profitability methodologies are reasonable in all material respects.
The Board has also reviewed Fidelity's non-fund businesses and fall-out benefits related to the mutual fund business as well as cases where Fidelity's affiliates may benefit from or be related to the fund's business.
Annual Report
The Board considered the costs of the services provided by and the profits realized by Fidelity in connection with the operation of the fund and were satisfied that the profitability was not excessive in the circumstances.
Economies of Scale. The Board considered whether there have been economies of scale in respect of the management of the Fidelity funds, whether the Fidelity funds (including the fund) have appropriately benefited from any such economies of scale, and whether there is potential for realization of any further economies of scale. The Board considered the extent to which the fund will benefit from economies of scale through increased services to the fund, through waivers or reimbursements, or through fee or expense reductions.
In February 2009, the Board and the board of other Fidelity funds created an ad hoc committee (the Economies of Scale Committee) to analyze whether FMR attains economies of scale in respect of the management and servicing of the Fidelity funds, whether the Fidelity funds have appropriately benefited from such economies of scale, and whether there is potential for realization of any further economies of scale.
The Board recognized that the fund's management contract incorporates a "group fee" structure, which provides for lower group fee rates as total fund assets under FMR's management increase, and for higher group fee rates as total fund assets under FMR's management decrease. FMR calculates the group fee rates based on a tiered asset "breakpoint" schedule that varies based on asset class. The Board considered that the group fee is designed to deliver the benefits of economies of scale to fund shareholders when total Fidelity fund assets increase, even if assets of any particular fund are unchanged or have declined, because some portion of Fidelity's costs are attributable to services provided to all Fidelity funds, and all funds benefit if those costs can be allocated among more assets. The Board concluded that, given the group fee structure, fund shareholders will benefit from lower management fees as assets under FMR's management increase at the fund complex level, regardless of whether Fidelity achieves any such economies of scale.
The Board concluded, considering the findings of the Economies of Scale Committee, that any potential economies of scale are being appropriately shared between fund shareholders and Fidelity.
Additional Information Requested by the Board. In order to develop fully the factual basis for consideration of the Fidelity funds' Advisory Contracts, the Board requested and received additional information on certain topics, including (i) fund performance trends, actions to be taken by FMR to improve certain funds' overall performance, and Fidelity's long-term strategies for certain funds; (ii) portfolio manager changes that have occurred during the past year and length of portfolio manager tenure for different categories of funds over time; (iii) Fidelity's compensation structure for portfolio managers, research analysts, and other key personnel, the rationale for the compensation structure, and how the compensation structure provides appropriate performance incentives; (iv) the amount of the investment that each portfolio manager has made in the Fidelity fund(s) that he or she manages; (v) management and other fees paid by FMR to affiliated sub-advisers on behalf of the Fidelity funds; (vi) Fidelity's fee structures and rationale for recommending different fees among different categories of funds; (vii) Fidelity's rationale for recommending which funds should have a performance adjustment component as part of their management fees; (viii) the rationale for any differences between fund fee structures and fee structures in place for other Fidelity clients; and (ix) explanations regarding the relative total expenses borne by certain funds and classes, total expense competitive trends, and actions that might be taken by FMR to reduce total expenses for certain funds and classes.
Annual Report
Board Approval of Investment Advisory Contracts and
Management Fees - continued
Based on its evaluation of all of the conclusions noted above, and after considering all factors it believed relevant, the Board ultimately concluded that the advisory fee structures are fair and reasonable, and that the fund's Advisory Contracts should be renewed.
Annual Report
Managing Your Investments
Fidelity offers several ways to conveniently manage your workplace benefits (including your workplace savings plan, investments, and additional services) via your telephone or PC. You can access your plan and account information and research your investments 24 hours a day.
By Phone
Fidelity provides a single toll-free number to access plan information, account balances, positions, and quotes*. It's easy to navigate the service, and on your first call, the system will help you create a personal identification number (PIN) for security.
(phone_graphic)
Fidelity Workplace
Investing
1-800-835-5092
By PC
Fidelity's web site on the Internet provides a wide range of information, including plan information, daily financial news, fund performance, interactive planning tools, and news about Fidelity products and services.
(computer_graphic)
Fidelity's Web Site
www.401k.com
* When you call the quotes line, please remember that a fund's yield and return will vary and, except for money market funds, share price will also vary. This means that you may have a gain or loss when you sell your shares. There is no assurance that money market funds will be able to maintain a stable $1 share price; an investment in a money market fund is not insured or guaranteed by the U.S. government. Total returns are historical and include changes in share price, reinvestment of dividends and capital gains, and the effects of any sales charges.
Annual Report
To Write Fidelity
We'll give your correspondence immediate attention and send you written confirmation upon completion of your request.
(letter_graphic)
For Non-Retirement
Accounts
Buying shares
Fidelity Investments
P.O. Box 770001
Cincinnati, OH 45277-0003
Overnight Express
Fidelity Investments
Attn: Distribution Services
100 Crosby Parkway - KC1H
Covington, KY 41015
Selling shares
Fidelity Investments
P.O. Box 770001
Cincinnati, OH 45277-0035
Overnight Express
Fidelity Investments
Attn: Distribution Services
100 Crosby Parkway - KC1H
Covington, KY 41015
General Correspondence
Fidelity Investments
P.O. Box 500
Merrimack, NH 03054-0500
(letter_graphic)
For Retirement
Accounts
Buying shares
Fidelity Investments
P.O. Box 770001
Cincinnati, OH 45277-0003
Selling shares
Fidelity Investments
P.O. Box 770001
Cincinnati, OH 45277-0035
Overnight Express
Fidelity Investments
Attn: Distribution Services
100 Crosby Parkway - KC1H
Covington, KY 41015
General Correspondence
Fidelity Investments
P.O. Box 500
Merrimack, NH 03054-0500
Annual Report
Investment Adviser
Fidelity Management & Research Company
Boston, MA
Investment Sub-Advisers
FMR Co., Inc.
Fidelity Management & Research
(U.K.) Inc.
Fidelity Research & Analysis Company
Fidelity Management & Research
(Hong Kong) Limited
Fidelity Management & Research
(Japan) Inc.
General Distributor
Fidelity Distributors Corporation
Boston, MA
Transfer and Service Agents
Fidelity Investments Institutional
Operations Company, Inc.
Boston, MA
Fidelity Service Company, Inc.
Boston, MA
Custodian
Citibank, N.A.
New York, NY
The Fidelity Telephone Connection
Mutual Fund 24-Hour Service
Exchanges/Redemptions
and Account Assistance 1-800-544-6666
Product Information 1-800-544-6666
Retirement Accounts 1-800-544-4774
(8 a.m. - 9 p.m.)
TDD Service 1-800-544-0118
for the deaf and hearing impaired
(9 a.m. - 9 p.m. Eastern time)
Fidelity Automated Service
Telephone (FAST®) 1-800-544-5555
Automated line for quickest service
CAF-K-UANN-1210
1.863089.102
Fidelity®
Disciplined Equity
Fund
Annual Report
October 31, 2010
(2_fidelity_logos) (Registered_Trademark)
Contents
Chairman's Message | <Click Here> | The Chairman's message to shareholders. |
Performance | <Click Here> | How the fund has done over time. |
Management's Discussion of Fund Performance | <Click Here> | The Portfolio Manager's review of fund performance and strategy. |
Shareholder Expense Example | <Click Here> | An example of shareholder expenses. |
Investment Changes | <Click Here> | A summary of major shifts in the fund's investments over the past six months. |
Investments | <Click Here> | A complete list of the fund's investments with their market values. |
Financial Statements | <Click Here> | Statements of assets and liabilities, operations, and changes in net assets, as well as financial highlights. |
Notes | <Click Here> | Notes to the financial statements. |
Report of Independent Registered Public Accounting Firm | <Click Here> | |
Trustees and Officers | <Click Here> | |
Distributions | <Click Here> | |
Board Approval of Investment Advisory Contracts and Management Fees | <Click Here> | |
To view a fund's proxy voting guidelines and proxy voting record for the 12-month period ended June 30, visit http://www.fidelity.com/proxyvotingresults or visit the Securities and Exchange Commission's (SEC) web site at http://www.sec.gov. You may also call 1-800-544-8544 to request a free copy of the proxy voting guidelines.
Standard & Poor's, S&P and S&P 500 are registered service marks of The McGraw-Hill Companies, Inc. and have been licensed for use by Fidelity Distributors Corporation.
Other third party marks appearing herein are the property of their respective owners.
All other marks appearing herein are registered or unregistered trademarks or service marks of FMR LLC or an affiliated company.
Annual Report
This report and the financial statements contained herein are submitted for the general information of the shareholders of the fund. This report is not authorized for distribution to prospective investors in the fund unless preceded or accompanied by an effective prospectus.
A fund files its complete schedule of portfolio holdings with the SEC for the first and third quarters of each fiscal year on Form N-Q. Forms N-Q are available on the SEC's web site at http://www.sec.gov. A fund's Forms N-Q may be reviewed and copied at the SEC's Public Reference Room in Washington, DC. Information regarding the operation of the SEC's Public Reference Room may be obtained by calling 1-800-SEC-0330. For a complete list of a fund's portfolio holdings, view the most recent holdings listing, semiannual report, or annual report on Fidelity's web site at http://www.fidelity.com or http://www.advisor.fidelity.com, as applicable.
NOT FDIC INSURED • MAY LOSE VALUE • NO BANK GUARANTEE
Neither the fund nor Fidelity Distributors Corporation is a bank.
Annual Report
(photo_of_Edward_C_Johnson_3d)
Dear Shareholder:
Equities have staged a rally in the second half of 2010, shaking off concerns about the European debt crisis and the possibility of a double-dip recession in the U.S. Although the short-term surge pushed major equity indexes back into positive territory for the year, several questions remain about the longer-term outlook, including lackluster economic growth and persistently high unemployment. Financial markets are always unpredictable, of course, but there also are several time-tested investment principles that can help put the odds in your favor.
One of the basic tenets is to invest for the long term. Over time, riding out the markets' inevitable ups and downs has proven much more effective than selling into panic or chasing the hottest trend. Even missing only a few of the markets' best days can significantly diminish investor returns. Patience also affords the benefits of compounding - of earning interest on additional income or reinvested dividends and capital gains. There can be tax advantages and cost benefits to consider as well. While staying the course doesn't eliminate risk, it can considerably lessen the effect of short-term declines.
You can further manage your investing risk through diversification. And today, more than ever, geographic diversification should be taken into account. Studies indicate that asset allocation is the single most important determinant of a portfolio's long-term success. The right mix of stocks, bonds and cash - aligned to your particular risk tolerance and investment objective - is very important. Age-appropriate rebalancing is also an essential aspect of asset allocation. For younger investors, an emphasis on equities - which historically have been the best-performing asset class over time - is encouraged. As investors near their specific goal, such as retirement or sending a child to college, consideration may be given to replacing volatile assets (e.g. common stocks) with more-stable fixed investments (bonds or savings plans).
A third principle - investing regularly - can help lower the average cost of your purchases. Investing a certain amount of money each month or quarter helps ensure you won't pay for all your shares at market highs. This strategy - known as dollar cost averaging - also reduces "emotion" from investing, helping shareholders avoid selling weak performers just prior to an upswing, or chasing a hot performer just before a correction.
We invite you to contact us via the Internet, through our Investor Centers or by phone. It is our privilege to provide you the information you need to make the investments that are right for you.
Sincerely,
(The chairman's signature appears here.)
Edward C. Johnson 3d
Annual Report
Average annual total return reflects the change in the value of an investment, assuming reinvestment of the class' distributions from dividend income and capital gains (the profits earned upon the sale of securities that have grown in value, if any) and assuming a constant rate of performance each year. The $10,000 table and the fund's returns do not reflect the deduction of taxes that a shareholder would pay on fund distributions or the redemption of fund shares. During periods of reimbursement by Fidelity, a fund's total return will be greater than it would be had the reimbursement not occurred. How a fund did yesterday is no guarantee of how it will do tomorrow.
Average Annual Total Returns
Periods ended October 31, 2010 | Past 1
year | Past 5
years | Past 10
years |
Fidelity® Disciplined Equity Fund | 11.05% | -0.02% | -0.07% |
$10,000 Over 10 Years
Let's say hypothetically that $10,000 was invested in Fidelity® Disciplined Equity Fund, a class of the fund, on October 31, 2000. The chart shows how the value of your investment would have changed, and also shows how the S&P 500® Index performed over the same period.
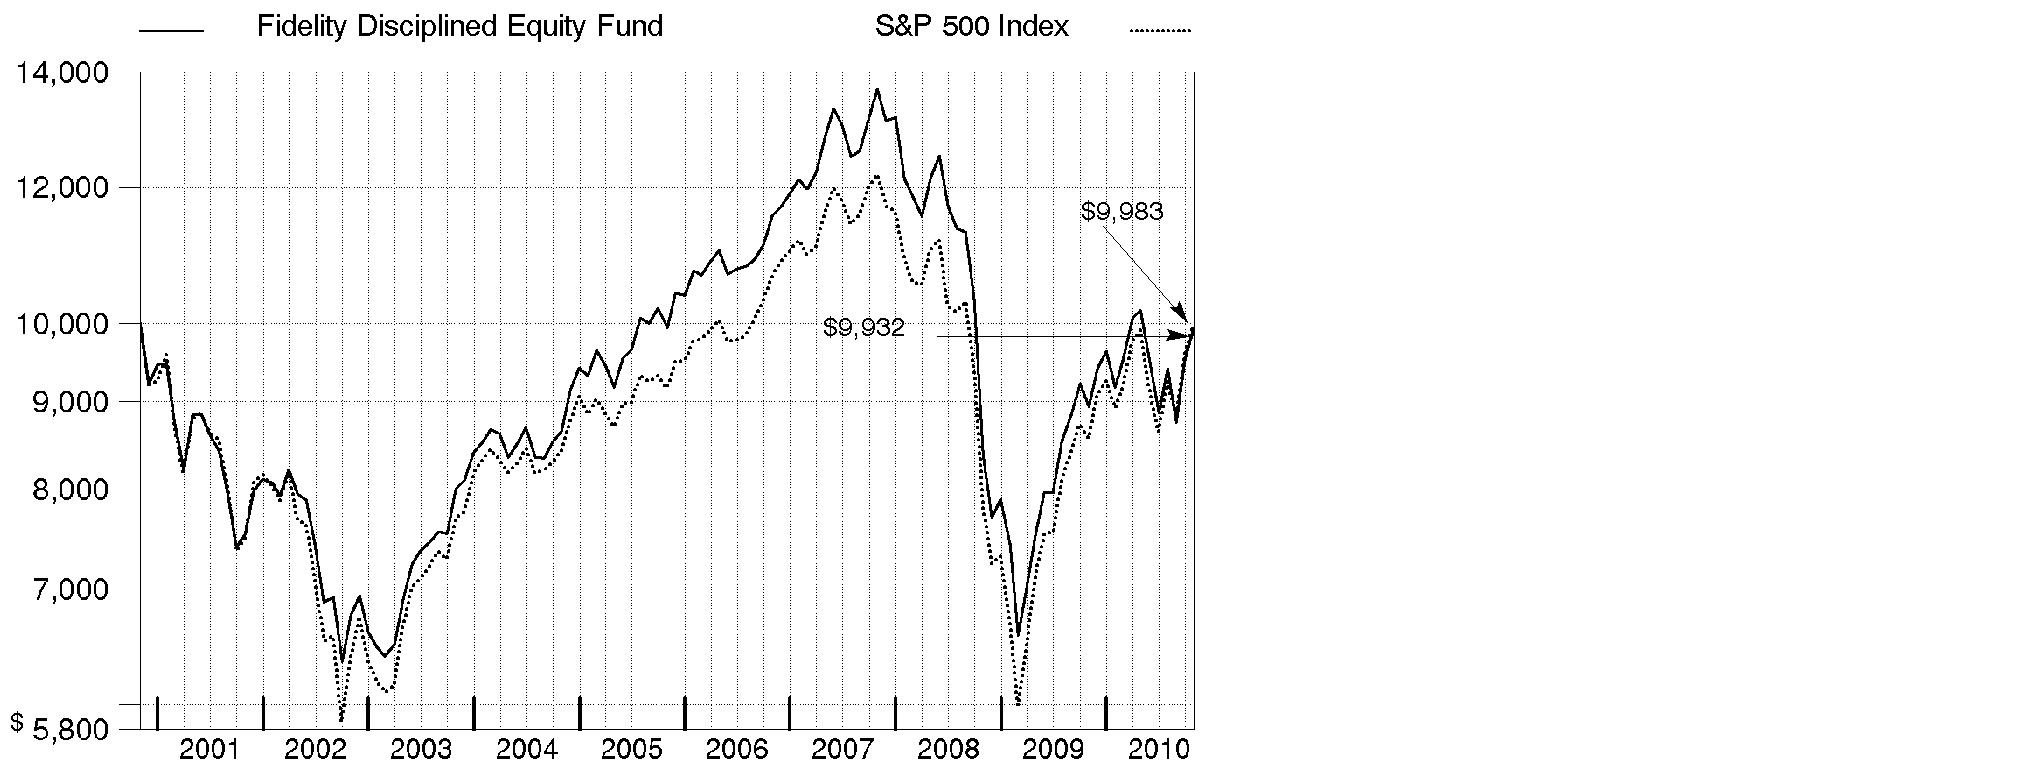
Annual Report
Market Recap: Amid bouts of volatility, major U.S. stock market indexes recorded double-digit gains for the year ending October 31, 2010, lifted by economic optimism, encouraging earnings reports and a wave of corporate mergers. Aside from a January dip, stocks trended upward for the first half of the period amid indications the Great Recession was over. However, in April, lingering high unemployment and heightened concern over European debt sent equities falling. Markets regrouped in July, but fell again in August on mixed economic data. The final two months of the period brought renewed optimism, with the large-cap S&P 500® Index posting its best September/October performance since 1998. For the full 12 months, the S&P 500® rose 16.52%, while the blue-chip-laden Dow Jones Industrial AverageSM added 17.62% and the technology-heavy Nasdaq Composite® Index rose 23.72%. Among market segments, all 10 sectors in the S&P 500 posted gains, with more than half outperforming the broad-market index. Stocks of mid- and small-sized companies surged, with the Russell Midcap® Index adding 27.71% and Russell 2000® Index climbing 26.58%. Looking abroad, debt problems in several European countries cooled gains in developed markets, and yet the MSCI® EAFE® (Europe, Australasia, Far East) Index still rose 8.49%.
Comments from Keith Quinton, Portfolio Manager of Fidelity® Disciplined Equity Fund: The fund's Retail Class shares rose 11.05% for the year, trailing the S&P 500. The fund was hurt by our quantitative stock picking models, which do not factor in sudden changes in market tempo. Positioning in the weak-performing financials sector notably detracted, as did security selection in technology, health care and utilities. The biggest individual disappointment was an out-of-index investment in asset manager BlackRock, a stock the fund no longer owned at period end. After acquiring Barclays Global Investors, BlackRock saw asset outflows, shrinking business and weak earnings, and its stock fell about 20% for the period. The fund also was hurt by overweighting technology giant Hewlett-Packard, whose stock dropped after its CEO was forced to resign in August amid a scandal. Not owning enough of mobile device leader Apple hurt relative results, as did holdings in JPMorgan Chase and Microsoft. Performance was helped by positioning in consumer staples, including stakes in Coca-Cola Enterprises and Anheuser-Busch InBev. Security selection in consumer discretionary contributed, including TRW Automotive Holdings, whose stock nearly tripled after it cut debt and grew profits. The fund's top individual contributor was database software supplier Sybase, acquired by SAP at a premium. Underweighting benchmark goliath and underperformer Exxon Mobil also contributed. Some of the stocks I've mentioned were not in the benchmark.
The views expressed above reflect those of the portfolio manager(s) only through the end of the period as stated on the cover of this report and do not necessarily represent the views of Fidelity or any other person in the Fidelity organization. Any such views are subject to change at any time based upon market or other conditions and Fidelity disclaims any responsibility to update such views. These views may not be relied on as investment advice and, because investment decisions for a Fidelity fund are based on numerous factors, may not be relied on as an indication of trading intent on behalf of any Fidelity fund.
Annual Report
Shareholder Expense Example
As a shareholder of the Fund, you incur two types of costs: (1) transaction costs, and (2) ongoing costs, including management fees and other Fund expenses. This Example is intended to help you understand your ongoing costs (in dollars) of investing in the Fund and to compare these costs with the ongoing costs of investing in other mutual funds.
The Example is based on an investment of $1,000 invested at the beginning of the period and held for the entire period (May 1, 2010 to October 31, 2010).
Actual Expenses
The first line of the accompanying table for each class of the Fund provides information about actual account values and actual expenses. You may use the information in this line, together with the amount you invested, to estimate the expenses that you paid over the period. Simply divide your account value by $1,000.00 (for example, an $8,600 account value divided by $1,000.00 = 8.6), then multiply the result by the number in the first line for a class of the Fund under the heading entitled "Expenses Paid During Period" to estimate the expenses you paid on your account during this period. A small balance maintenance fee of $12.00 that is charged once a year may apply for certain accounts with a value of less than $2,000. This fee is not included in the table below. If it was, the estimate of expenses you paid during the period would be higher, and your ending account value lower, by this amount. In addition, the Fund, as a shareholder in the underlying Fidelity Central Funds, will indirectly bear its pro-rata share of the fees and expenses incurred by the underlying Fidelity Central Funds. These fees and expenses are not included in the Fund's annualized expense ratio used to calculate the expense estimate in the table below.
Hypothetical Example for Comparison Purposes
The second line of the accompanying table for each class of the Fund provides information about hypothetical account values and hypothetical expenses based on a Class' actual expense ratio and an assumed rate of return of 5% per year before expenses, which is not the Class' actual return. The hypothetical account values and expenses may not be used to estimate the actual ending account balance or expenses you paid for the period. You may use this information to compare the ongoing costs of investing in the Fund and other funds. To do so, compare this 5% hypothetical example with the 5% hypothetical examples that appear in the shareholder reports of the other funds. A small balance maintenance fee of $12.00 that is charged once a year may apply for certain accounts with a value of less than $2,000. This fee is not included in the table below. If it was, the estimate of expenses you paid during the period would be higher, and your ending account value lower, by this amount. In addition, the Fund, as a shareholder in the underlying Fidelity Central Funds, will indirectly bear its pro-rata share of the fees and expenses incurred by the underlying Fidelity Central Funds. These fees and expenses are not included in the Fund's annualized expense ratio used to calculate the expense estimate in the table below.
Please note that the expenses shown in the table are meant to highlight your ongoing costs only and do not reflect any transaction costs. Therefore, the second line of the table is useful in comparing ongoing costs only, and will not help you determine the relative total costs of owning different funds.
Annual Report
| Annualized
Expense Ratio | Beginning
Account Value
May 1, 2010 | Ending
Account Value
October 31, 2010 | Expenses Paid
During Period*
May 1, 2010
to October 31, 2010 |
Disciplined Equity | .67% | | | |
Actual | | $ 1,000.00 | $ 976.60 | $ 3.34 |
HypotheticalA | | $ 1,000.00 | $ 1,021.83 | $ 3.41 |
Class K | .49% | | | |
Actual | | $ 1,000.00 | $ 977.50 | $ 2.44 |
HypotheticalA | | $ 1,000.00 | $ 1,022.74 | $ 2.50 |
Class F | .46% | | | |
Actual | | $ 1,000.00 | $ 977.90 | $ 2.29 |
HypotheticalA | | $ 1,000.00 | $ 1,022.89 | $ 2.35 |
A 5% return per year before expenses
* Expenses are equal to each Class' annualized expense ratio, multiplied by the average account value over the period, multiplied by 184/365 (to reflect the one-half year period).
Annual Report
Investment Changes (Unaudited)
Top Ten Stocks as of October 31, 2010 |
| % of fund's
net assets | % of fund's net assets
6 months ago |
Microsoft Corp. | 4.9 | 4.4 |
Chevron Corp. | 4.4 | 4.6 |
Hewlett-Packard Co. | 4.1 | 4.1 |
JPMorgan Chase & Co. | 3.4 | 2.9 |
Goldman Sachs Group, Inc. | 3.0 | 1.9 |
Marathon Oil Corp. | 3.0 | 2.6 |
Anheuser-Busch InBev SA NV | 3.0 | 2.4 |
Exxon Mobil Corp. | 2.6 | 0.0 |
Vodafone Group PLC sponsored ADR | 2.4 | 1.9 |
General Electric Co. | 2.3 | 2.5 |
| 33.1 | |
Top Five Market Sectors as of October 31, 2010 |
| % of fund's
net assets | % of fund's net assets
6 months ago |
Information Technology | 19.7 | 18.9 |
Financials | 14.4 | 16.4 |
Health Care | 11.5 | 11.7 |
Energy | 11.1 | 11.2 |
Industrials | 10.8 | 10.8 |
Asset Allocation (% of fund's net assets) |
As of October 31, 2010* | As of April 30, 2010** |
| Stocks 98.6% | | | Stocks and
Equity Futures 99.9% | |
| Short-Term
Investments and
Net Other Assets 1.4% | | | Short-Term
Investments and
Net Other Assets 0.1% | |
* Foreign investments | 13.6% | | ** Foreign investments | 11.6% | |

Annual Report
Investments October 31, 2010
Showing Percentage of Net Assets
Common Stocks - 98.6% |
| Shares | | Value (000s) |
CONSUMER DISCRETIONARY - 10.6% |
Auto Components - 2.3% |
TRW Automotive Holdings Corp. (a) | 5,273,000 | | $ 240,923 |
Automobiles - 1.7% |
Ford Motor Co. (a) | 13,100,000 | | 185,103 |
Media - 0.4% |
Comcast Corp. Class A (special) (non-vtg.) | 1,500,000 | | 28,995 |
Interpublic Group of Companies, Inc. (a) | 1,000,000 | | 10,350 |
| | 39,345 |
Multiline Retail - 2.1% |
Macy's, Inc. | 9,200,000 | | 217,488 |
Specialty Retail - 2.6% |
Best Buy Co., Inc. | 5,400,000 | | 232,092 |
TJX Companies, Inc. | 900,000 | | 41,301 |
| | 273,393 |
Textiles, Apparel & Luxury Goods - 1.5% |
Phillips-Van Heusen Corp. | 1,720,000 | | 105,505 |
VF Corp. | 600,000 | | 49,944 |
| | 155,449 |
TOTAL CONSUMER DISCRETIONARY | | 1,111,701 |
CONSUMER STAPLES - 9.9% |
Beverages - 5.1% |
Anheuser-Busch InBev SA NV | 4,938,240 | | 309,450 |
Coca-Cola Enterprises, Inc. | 1,751,800 | | 42,061 |
Constellation Brands, Inc. Class A (sub. vtg.) (a) | 5,315,577 | | 104,876 |
Dr Pepper Snapple Group, Inc. | 2,000,000 | | 73,100 |
| | 529,487 |
Food & Staples Retailing - 0.9% |
Wal-Mart Stores, Inc. | 1,800,000 | | 97,506 |
Household Products - 2.7% |
Kimberly-Clark Corp. | 1,500,000 | | 95,010 |
Procter & Gamble Co. | 2,900,000 | | 184,353 |
| | 279,363 |
Common Stocks - continued |
| Shares | | Value (000s) |
CONSUMER STAPLES - continued |
Tobacco - 1.2% |
British American Tobacco PLC sponsored ADR | 200,000 | | $ 15,246 |
Philip Morris International, Inc. | 2,000,000 | | 117,000 |
| | 132,246 |
TOTAL CONSUMER STAPLES | | 1,038,602 |
ENERGY - 11.1% |
Energy Equipment & Services - 0.6% |
Complete Production Services, Inc. (a) | 900,000 | | 21,087 |
Oil States International, Inc. (a) | 549,342 | | 28,082 |
Rowan Companies, Inc. (a) | 300,000 | | 9,870 |
| | 59,039 |
Oil, Gas & Consumable Fuels - 10.5% |
Chevron Corp. | 5,567,400 | | 459,923 |
Exxon Mobil Corp. | 4,129,780 | | 274,506 |
Holly Corp. | 300,000 | | 9,819 |
Marathon Oil Corp. | 8,800,000 | | 313,016 |
Sunoco, Inc. | 1,000,000 | | 37,470 |
| | 1,094,734 |
TOTAL ENERGY | | 1,153,773 |
FINANCIALS - 14.4% |
Capital Markets - 3.0% |
Goldman Sachs Group, Inc. | 1,950,000 | | 313,853 |
Commercial Banks - 1.2% |
Barclays PLC | 10,000,000 | | 43,939 |
Barclays PLC Sponsored ADR | 1,300,000 | | 22,945 |
HSBC Holdings PLC sponsored ADR | 200,000 | | 10,422 |
M&T Bank Corp. (d) | 700,000 | | 52,325 |
| | 129,631 |
Consumer Finance - 1.1% |
Capital One Financial Corp. | 3,100,000 | | 115,537 |
Diversified Financial Services - 4.9% |
Citigroup, Inc. (a) | 37,500,000 | | 156,375 |
JPMorgan Chase & Co. | 9,500,000 | | 357,485 |
| | 513,860 |
Insurance - 3.8% |
ACE Ltd. | 1,000,000 | | 59,420 |
Common Stocks - continued |
| Shares | | Value (000s) |
FINANCIALS - continued |
Insurance - continued |
AFLAC, Inc. | 1,000,000 | | $ 55,890 |
Allstate Corp. | 800,000 | | 24,392 |
Axis Capital Holdings Ltd. | 1,500,000 | | 51,015 |
MetLife, Inc. | 2,511,500 | | 101,289 |
Unum Group | 1,100,000 | | 24,662 |
XL Capital Ltd. Class A | 3,600,000 | | 76,140 |
| | 392,808 |
Real Estate Investment Trusts - 0.3% |
AvalonBay Communities, Inc. | 300,000 | | 31,893 |
Real Estate Management & Development - 0.1% |
CB Richard Ellis Group, Inc. Class A (a) | 500,000 | | 9,175 |
TOTAL FINANCIALS | | 1,506,757 |
HEALTH CARE - 11.5% |
Biotechnology - 3.4% |
Amgen, Inc. (a) | 2,274,000 | | 130,050 |
Biogen Idec, Inc. (a) | 1,000,000 | | 62,710 |
Cephalon, Inc. (a) | 2,298,000 | | 152,679 |
Gilead Sciences, Inc. (a) | 300,000 | | 11,901 |
| | 357,340 |
Health Care Equipment & Supplies - 0.2% |
Cooper Companies, Inc. | 500,000 | | 24,670 |
Health Care Providers & Services - 1.3% |
CIGNA Corp. | 579,200 | | 20,382 |
Humana, Inc. (a) | 1,870,000 | | 109,002 |
| | 129,384 |
Pharmaceuticals - 6.6% |
Impax Laboratories, Inc. (a) | 2,800,000 | | 52,752 |
Johnson & Johnson | 3,600,000 | | 229,212 |
Merck & Co., Inc. | 3,000,000 | | 108,840 |
Perrigo Co. | 940,100 | | 61,934 |
Pfizer, Inc. | 1,500,000 | | 26,100 |
Sanofi-Aventis | 2,000,000 | | 140,088 |
Teva Pharmaceutical Industries Ltd. sponsored ADR | 500,000 | | 25,950 |
Common Stocks - continued |
| Shares | | Value (000s) |
HEALTH CARE - continued |
Pharmaceuticals - continued |
Valeant Pharmaceuticals International, Inc. | 400,000 | | $ 11,068 |
Watson Pharmaceuticals, Inc. (a) | 600,000 | | 27,990 |
| | 683,934 |
TOTAL HEALTH CARE | | 1,195,328 |
INDUSTRIALS - 10.8% |
Aerospace & Defense - 1.0% |
United Technologies Corp. | 1,400,000 | | 104,678 |
Airlines - 0.8% |
Delta Air Lines, Inc. (a) | 2,000,000 | | 27,780 |
United Continental Holdings, Inc. (a) | 1,900,000 | | 55,176 |
| | 82,956 |
Building Products - 0.7% |
Owens Corning (a) | 2,594,667 | | 70,160 |
Commercial Services & Supplies - 0.1% |
Schawk, Inc. Class A | 700,000 | | 13,594 |
Construction & Engineering - 0.7% |
EMCOR Group, Inc. (a) | 400,000 | | 10,340 |
KBR, Inc. | 1,856,063 | | 47,144 |
URS Corp. (a) | 300,000 | | 11,679 |
| | 69,163 |
Electrical Equipment - 0.2% |
Regal-Beloit Corp. | 209,646 | | 12,099 |
Thomas & Betts Corp. (a) | 200,000 | | 8,710 |
| | 20,809 |
Industrial Conglomerates - 4.0% |
General Electric Co. | 15,200,000 | | 243,504 |
Siemens AG sponsored ADR (d) | 1,541,700 | | 176,232 |
| | 419,736 |
Machinery - 3.3% |
ArvinMeritor, Inc. (a) | 2,556,903 | | 42,393 |
Cummins, Inc. | 2,500,000 | | 220,250 |
Parker Hannifin Corp. | 200,000 | | 15,310 |
Timken Co. | 1,700,000 | | 70,414 |
| | 348,367 |
TOTAL INDUSTRIALS | | 1,129,463 |
Common Stocks - continued |
| Shares | | Value (000s) |
INFORMATION TECHNOLOGY - 19.7% |
Communications Equipment - 1.2% |
Cisco Systems, Inc. (a) | 4,200,000 | | $ 95,886 |
HTC Corp. | 1,478,000 | | 33,370 |
| | 129,256 |
Computers & Peripherals - 5.7% |
Apple, Inc. (a) | 200,000 | | 60,174 |
Hewlett-Packard Co. | 10,200,000 | | 429,012 |
SanDisk Corp. (a) | 2,794,861 | | 105,031 |
| | 594,217 |
Electronic Equipment & Components - 0.4% |
Jabil Circuit, Inc. | 2,100,000 | | 32,214 |
Vishay Intertechnology, Inc. (a) | 1,000,000 | | 11,300 |
| | 43,514 |
Internet Software & Services - 0.2% |
Baidu.com, Inc. sponsored ADR (a) | 100,000 | | 11,001 |
Digital River, Inc. (a) | 300,000 | | 11,178 |
| | 22,179 |
IT Services - 2.4% |
International Business Machines Corp. | 1,500,000 | | 215,400 |
VeriFone Holdings, Inc. (a) | 900,000 | | 30,447 |
| | 245,847 |
Office Electronics - 0.5% |
Xerox Corp. | 4,600,000 | | 53,820 |
Semiconductors & Semiconductor Equipment - 3.6% |
Intel Corp. | 5,300,000 | | 106,371 |
Micron Technology, Inc. (a) | 17,305,400 | | 143,116 |
Samsung Electronics Co. Ltd. | 182,977 | | 121,225 |
| | 370,712 |
Software - 5.7% |
Intuit, Inc. (a) | 1,100,000 | | 52,800 |
Microsoft Corp. | 19,200,000 | | 511,487 |
Red Hat, Inc. (a) | 700,000 | | 29,582 |
| | 593,869 |
TOTAL INFORMATION TECHNOLOGY | | 2,053,414 |
Common Stocks - continued |
| Shares | | Value (000s) |
MATERIALS - 3.8% |
Chemicals - 1.6% |
Ashland, Inc. | 2,846,495 | | $ 146,965 |
Kraton Performance Polymers, Inc. | 800,000 | | 25,968 |
| | 172,933 |
Metals & Mining - 2.2% |
Newmont Mining Corp. | 2,700,000 | | 164,349 |
Vale SA sponsored ADR | 1,900,000 | | 61,066 |
| | 225,415 |
TOTAL MATERIALS | | 398,348 |
TELECOMMUNICATION SERVICES - 3.3% |
Wireless Telecommunication Services - 3.3% |
MetroPCS Communications, Inc. (a) | 3,928,600 | | 40,897 |
Sprint Nextel Corp. (a) | 11,000,000 | | 45,320 |
Vodafone Group PLC sponsored ADR | 9,200,000 | | 253,092 |
| | 339,309 |
UTILITIES - 3.5% |
Independent Power Producers & Energy Traders - 2.4% |
AES Corp. (a) | 9,500,000 | | 113,430 |
NRG Energy, Inc. (a) | 6,780,000 | | 134,990 |
| | 248,420 |
Multi-Utilities - 1.1% |
Alliant Energy Corp. | 1,400,000 | | 51,142 |
CMS Energy Corp. | 3,700,000 | | 68,006 |
| | 119,148 |
TOTAL UTILITIES | | 367,568 |
TOTAL COMMON STOCKS (Cost $9,695,600) | 10,294,263 |
Money Market Funds - 2.3% |
| Shares | | Value (000s) |
Fidelity Cash Central Fund, 0.23% (b) | 188,062,876 | | $ 188,063 |
Fidelity Securities Lending Cash Central Fund, 0.24% (b)(c) | 54,588,088 | | 54,588 |
TOTAL MONEY MARKET FUNDS (Cost $242,651) | 242,651 |
TOTAL INVESTMENT PORTFOLIO - 100.9% (Cost $9,938,251) | | 10,536,914 |
NET OTHER ASSETS (LIABILITIES) - (0.9)% | | (94,471) |
NET ASSETS - 100% | $ 10,442,443 |
Legend |
(a) Non-income producing |
(b) Affiliated fund that is available only to investment companies and other accounts managed by Fidelity Investments. The rate quoted is the annualized seven-day yield of the fund at period end. A complete unaudited listing of the fund's holdings as of its most recent quarter end is available upon request. In addition, each Fidelity Central Fund's financial statements, which are not covered by the Fund's report of Independent Registered Public Accounting Firm, are available on the SEC's website or upon request. |
(c) Investment made with cash collateral received from securities on loan. |
(d) Security or a portion of the security is on loan at period end. |
Affiliated Central Funds |
Information regarding fiscal year to date income earned by the Fund from investments in Fidelity Central Funds is as follows: |
Fund | Income earned
(Amounts in
thousands) |
Fidelity Cash Central Fund | $ 240 |
Fidelity Securities Lending Cash Central Fund | 828 |
Total | $ 1,068 |
Other Affiliated Issuers |
An affiliated company is a company in which the Fund has ownership of at least 5% of the voting securities. Fiscal year to date transactions with companies which are or were affiliates are as follows: |
Affiliate
(Amounts in thousands) | Value, beginning of period | Purchases | Sales Proceeds | Dividend Income | Value,
end of
period |
Sybase, Inc. | $ 206,108 | $ 13,774 | $ 343,777 | $ - | $ - |
Total | $ 206,108 | $ 13,774 | $ 343,777 | $ - | $ - |
Other Information |
The following is a summary of the inputs used, as of October 31, 2010, involving the Fund's assets and liabilities carried at fair value. The inputs or methodology used for valuing securities may not be an indication of the risk associated with investing in those securities. For more information on valuation inputs, and their aggregation into the levels used in the table below, please refer to the Security Valuation section in the accompanying Notes to Financial Statements. |
Valuation Inputs at Reporting Date: |
Description
(Amounts in thousands) | Total | Level 1 | Level 2 | Level 3 |
Investments in Securities: | | | | |
Equities: | | | | |
Consumer Discretionary | $ 1,111,701 | $ 1,111,701 | $ - | $ - |
Consumer Staples | 1,038,602 | 1,038,602 | - | - |
Energy | 1,153,773 | 1,153,773 | - | - |
Financials | 1,506,757 | 1,462,818 | 43,939 | - |
Health Care | 1,195,328 | 1,055,240 | 140,088 | - |
Industrials | 1,129,463 | 1,129,463 | - | - |
Information Technology | 2,053,414 | 2,053,414 | - | - |
Materials | 398,348 | 398,348 | - | - |
Telecommunication Services | 339,309 | 339,309 | - | - |
Utilities | 367,568 | 367,568 | - | - |
Money Market Funds | 242,651 | 242,651 | - | - |
Total Investments in Securities: | $ 10,536,914 | $ 10,352,887 | $ 184,027 | $ - |
Distribution of investments by country of issue, as a percentage of total net assets, is as follows: (Unaudited) |
United States of America | 86.4% |
United Kingdom | 3.2% |
Belgium | 3.0% |
Germany | 1.7% |
France | 1.3% |
Korea (South) | 1.2% |
Others (Individually Less Than 1%) | 3.2% |
| 100.0% |
Income Tax Information |
At October 31, 2010, the Fund had a capital loss carryforward of approximately $2,872,513,000 of which $874,329,000 and $1,998,184,000 will expire on October 31, 2016 and 2017, respectively. Capital loss carryforwards are only available to offset future capital gains of the Fund to the extent provided by regulations and may be limited. |
See accompanying notes which are an integral part of the financial statements.
Annual Report
Statement of Assets and Liabilities
Amounts in thousands (except per-share amounts) | October 31, 2010 |
| | |
Assets | | |
Investment in securities, at value (including securities loaned of $53,509) - See accompanying schedule: Unaffiliated issuers (cost $9,695,600) | $ 10,294,263 | |
Fidelity Central Funds (cost $242,651) | 242,651 | |
Total Investments (cost $9,938,251) | | $ 10,536,914 |
Receivable for investments sold | | 330,086 |
Receivable for fund shares sold | | 10,249 |
Dividends receivable | | 3,052 |
Distributions receivable from Fidelity Central Funds | | 48 |
Other receivables | | 605 |
Total assets | | 10,880,954 |
| | |
Liabilities | | |
Payable for investments purchased | $ 353,087 | |
Payable for fund shares redeemed | 25,544 | |
Accrued management fee | 3,188 | |
Other affiliated payables | 1,780 | |
Other payables and accrued expenses | 324 | |
Collateral on securities loaned, at value | 54,588 | |
Total liabilities | | 438,511 |
| | |
Net Assets | | $ 10,442,443 |
Net Assets consist of: | | |
Paid in capital | | $ 12,699,786 |
Undistributed net investment income | | 76,361 |
Accumulated undistributed net realized gain (loss) on investments and foreign currency transactions | | (2,932,367) |
Net unrealized appreciation (depreciation) on investments | | 598,663 |
Net Assets | | $ 10,442,443 |
See accompanying notes which are an integral part of the financial statements.
Annual Report
Financial Statements - continued
Statement of Assets and Liabilities - continued
Amounts in thousands (except per-share amounts) | October 31, 2010 |
| | |
Disciplined Equity:
Net Asset Value, offering price and redemption price
per share ($8,942,518 ÷ 412,743 shares) | | $ 21.67 |
| | |
Class K:
Net Asset Value, offering price and redemption price per share ($141,005 ÷ 6,502 shares) | | $ 21.69 |
| | |
Class F:
Net Asset Value, offering price and redemption price per share ($1,358,920 ÷ 62,664 shares) | | $ 21.69 |
See accompanying notes which are an integral part of the financial statements.
Annual Report
Statement of Operations
Amounts in thousands | Year ended October 31, 2010 |
| | |
Investment Income | | |
Dividends | | $ 164,701 |
Interest | | 10 |
Income from Fidelity Central Funds | | 1,068 |
Total income | | 165,779 |
| | |
Expenses | | |
Management fee
Basic fee | $ 60,321 | |
Performance adjustment | (11,856) | |
Transfer agent fees | 22,921 | |
Accounting and security lending fees | 1,382 | |
Custodian fees and expenses | 320 | |
Independent trustees' compensation | 62 | |
Registration fees | 53 | |
Audit | 83 | |
Legal | 58 | |
Interest | 5 | |
Miscellaneous | 153 | |
Total expenses before reductions | 73,502 | |
Expense reductions | (1,693) | 71,809 |
Net investment income (loss) | | 93,970 |
Realized and Unrealized Gain (Loss) Net realized gain (loss) on: | | |
Investment securities: | | |
Unaffiliated issuers | 867,392 | |
Other affiliated issuers | 176,333 | |
Foreign currency transactions | 142 | |
Futures contracts | 5,363 | |
Capital gains distributions from Fidelity Central Funds | 6 | |
Total net realized gain (loss) | | 1,049,236 |
Change in net unrealized appreciation (depreciation) on: Investment securities | 493 | |
Futures contracts | 552 | |
Total change in net unrealized appreciation (depreciation) | | 1,045 |
Net gain (loss) | | 1,050,281 |
Net increase (decrease) in net assets resulting from operations | | $ 1,144,251 |
See accompanying notes which are an integral part of the financial statements.
Annual Report
Financial Statements - continued
Statement of Changes in Net Assets
Amounts in thousands | Year ended
October 31,
2010 | Year ended
October 31,
2009 |
Increase (Decrease) in Net Assets | | |
Operations | | |
Net investment income (loss) | $ 93,970 | $ 129,999 |
Net realized gain (loss) | 1,049,236 | (1,958,006) |
Change in net unrealized appreciation (depreciation) | 1,045 | 2,561,703 |
Net increase (decrease) in net assets resulting
from operations | 1,144,251 | 733,696 |
Distributions to shareholders from net investment income | (121,330) | (134,965) |
Share transactions - net increase (decrease) | (1,369,605) | 337,423 |
Total increase (decrease) in net assets | (346,684) | 936,154 |
| | |
Net Assets | | |
Beginning of period | 10,789,127 | 9,852,973 |
End of period (including undistributed net investment income of $76,361 and undistributed net investment income of $98,538, respectively) | $ 10,442,443 | $ 10,789,127 |
See accompanying notes which are an integral part of the financial statements.
Annual Report
Financial Highlights - Disciplined Equity
Years ended October 31, | 2010 | 2009 | 2008 | 2007 | 2006 |
Selected Per-Share Data | | | | | |
Net asset value, beginning of period | $ 19.72 | $ 18.78 | $ 33.37 | $ 30.83 | $ 26.71 |
Income from Investment Operations | | | | | |
Net investment income (loss) B | .18 | .24 | .29 | .27 | .22 |
Net realized and unrealized gain (loss) | 1.99 | .96 | (12.19) | 4.95 | 4.08 |
Total from investment operations | 2.17 | 1.20 | (11.90) | 5.22 | 4.30 |
Distributions from net investment income | (.22) | (.26) | (.26) | (.19) | (.18) |
Distributions from net realized gain | - | - | (2.43) | (2.49) | - |
Total distributions | (.22) | (.26) | (2.69) | (2.68) | (.18) |
Net asset value, end of period | $ 21.67 | $ 19.72 | $ 18.78 | $ 33.37 | $ 30.83 |
Total Return A | 11.05% | 6.64% | (38.68)% | 18.42% | 16.16% |
Ratios to Average Net Assets C, E | | | | | |
Expenses before reductions | .70% | .84% | .87% | .91% | .92% |
Expenses net of fee waivers,
if any | .70% | .84% | .87% | .91% | .92% |
Expenses net of all reductions | .68% | .83% | .87% | .90% | .91% |
Net investment income (loss) | .85% | 1.37% | 1.10% | .88% | .76% |
Supplemental Data | | | | | |
Net assets, end of period
(in millions) | $ 8,943 | $ 10,530 | $ 9,804 | $ 11,482 | $ 7,694 |
Portfolio turnover rate D | 146% | 200% | 186% | 152% | 98% |
A Total returns would have been lower had certain expenses not been reduced during the periods shown.
B Calculated based on average shares outstanding during the period.
C Fees and expenses of the underlying Fidelity Central Funds are not included in the Fund's expense ratio. The Fund indirectly bears its proportionate share of the expenses of any underlying Fidelity Central Funds.
D Amount does not include the portfolio activity of any underlying Fidelity Central Funds.
E Expense ratios reflect operating expenses of the class. Expenses before reductions do not reflect amounts reimbursed by the investment adviser or reductions from brokerage service arrangements or reductions from other expense offset arrangements and do not represent the amount paid by the class during periods when reimbursements or reductions occur. Expenses net of fee waivers reflect expenses after reimbursement by the investment adviser but prior to reductions from brokerage service arrangements or other expense offset arrangements. Expenses net of all reductions represent the net expenses paid by the class.
See accompanying notes which are an integral part of the financial statements.
Annual Report
Financial Highlights - Class K
Years ended October 31, | 2010 | 2009 | 2008 G |
Selected Per-Share Data | | | |
Net asset value, beginning of period | $ 19.74 | $ 18.79 | $ 27.38 |
Income from Investment Operations | | | |
Net investment income (loss) D | .22 | .28 | .12 |
Net realized and unrealized gain (loss) | 1.99 | .96 | (8.71) |
Total from investment operations | 2.21 | 1.24 | (8.59) |
Distributions from net investment income | (.26) | (.29) | - |
Net asset value, end of period | $ 21.69 | $ 19.74 | $ 18.79 |
Total Return B, C | 11.25% | 6.92% | (31.37)% |
Ratios to Average Net Assets E, H | | | |
Expenses before reductions | .52% | .61% | .71% A |
Expenses net of fee waivers, if any | .52% | .61% | .71% A |
Expenses net of all reductions | .51% | .60% | .71% A |
Net investment income (loss) | 1.03% | 1.59% | 1.30% A |
Supplemental Data | | | |
Net assets, end of period (in millions) | $ 141 | $ 184 | $ 49 |
Portfolio turnover rate F | 146% | 200% | 186% |
A Annualized
B Total returns for periods of less than one year are not annualized.
C Total returns would have been lower had certain expenses not been reduced during the periods shown.
D Calculated based on average shares outstanding during the period.
E Fees and expenses of the underlying Fidelity Central Funds are not included in the Fund's expense ratio. The Fund indirectly bears its proportionate share of the expenses of any underlying Fidelity Central Funds.
F Amount does not include the portfolio activity of any underlying Fidelity Central Funds.
G For the period May 9, 2008 (commencement of sale of shares) to October 31, 2008.
H Expense ratios reflect operating expenses of the class. Expenses before reductions do not reflect amounts reimbursed by the investment adviser or reductions from brokerage service arrangements or reductions from other expense offset arrangements and do not represent the amount paid by the class during periods when reimbursements or reductions occur. Expense ratios before reductions for start-up periods may not be representative of longer-term operating periods. Expenses net of fee waivers reflect expenses after reimbursement by the investment adviser but prior to reductions from brokerage service arrangements or other expense offset arrangements. Expenses net of all reductions represent the net expenses paid by the class.
See accompanying notes which are an integral part of the financial statements.
Annual Report
Financial Highlights - Class F
Years ended October 31, | 2010 | 2009 G |
Selected Per-Share Data | | |
Net asset value, beginning of period | $ 19.74 | $ 17.52 |
Income from Investment Operations | | |
Net investment income (loss) D | .22 | .02 |
Net realized and unrealized gain (loss) | 2.00 | 2.20 |
Total from investment operations | 2.22 | 2.22 |
Distributions from net investment income | (.27) | - |
Net asset value, end of period | $ 21.69 | $ 19.74 |
Total Return B, C | 11.31% | 12.67% |
Ratios to Average Net Assets E, H | | |
Expenses before reductions | .47% | .50% A |
Expenses net of fee waivers, if any | .47% | .50% A |
Expenses net of all reductions | .45% | .49% A |
Net investment income (loss) | 1.08% | .25% A |
Supplemental Data | | |
Net assets, end of period (in millions) | $ 1,359 | $ 75 |
Portfolio turnover rate F | 146% | 200% |
A Annualized
B Total returns for periods of less than one year are not annualized.
C Total returns would have been lower had certain expenses not been reduced during the periods shown.
D Calculated based on average shares outstanding during the period.
E Fees and expenses of the underlying Fidelity Central Funds are not included in the Fund's expense ratio. The Fund indirectly bears its proportionate share of the expenses of any underlying Fidelity Central Funds.
F Amount does not include the portfolio activity of any underlying Fidelity Central Funds.
G For the period June 26, 2009 (commencement of sale of shares) to October 31, 2009.
H Expense ratios reflect operating expenses of the class. Expenses before reductions do not reflect amounts reimbursed by the investment adviser or reductions from brokerage service arrangements or reductions from other expense offset arrangements and do not represent the amount paid by the class during periods when reimbursements or reductions occur. Expense ratios before reductions for start-up periods may not be representative of longer-term operating periods. Expenses net of fee waivers reflect expenses after reimbursement by the investment adviser but prior to reductions from brokerage service arrangements or other expense offset arrangements. Expenses net of all reductions represent the net expenses paid by the class.
See accompanying notes which are an integral part of the financial statements.
Annual Report
Notes to Financial Statements
For the period ended October 31, 2010
(Amounts in thousands except ratios)
1. Organization.
Fidelity Disciplined Equity Fund (the Fund) is a fund of Fidelity Capital Trust (the Trust) and is authorized to issue an unlimited number of shares. The Trust is registered under the Investment Company Act of 1940, as amended (the 1940 Act), as an open-end management investment company organized as a Massachusetts business trust. The Fund offers Disciplined Equity, Class K and Class F shares, each of which has equal rights as to assets and voting privileges. Each class has exclusive voting rights with respect to matters that affect that class. Class F shares of the Fund are only available for purchase by mutual funds for which Fidelity Management & Research Company (FMR) or an affiliate serves as investment manager. Investment income, realized and unrealized capital gains and losses, the common expenses of the Fund, and certain fund-level expense reductions, if any, are allocated on a pro-rata basis to each class based on the relative net assets of each class to the total net assets of the Fund. Each class differs with respect to transfer agent and distribution and service plan fees incurred. Certain expense reductions also differ by class.
2. Investments in Fidelity Central Funds.
The Fund may invest in Fidelity Central Funds, which are open-end investment companies available only to other investment companies and accounts managed by FMR and its affiliates. The Fund's Schedule of Investments lists each of the Fidelity Central Funds held as of period end, if any, as an investment of the Fund, but does not include the underlying holdings of each Fidelity Central Fund. As an Investing Fund, the Fund indirectly bears its proportionate share of the expenses of the underlying Fidelity Central Funds.
The Money Market Central Funds seek preservation of capital and current income and are managed by Fidelity Investments Money Management, Inc. (FIMM), an affiliate of FMR.
A complete unaudited list of holdings for each Fidelity Central Fund is available upon request or at the Securities and Exchange Commission (the SEC) web site at www.sec.gov. In addition, the financial statements of the Fidelity Central Funds, which are not covered by the Fund's Report of Independent Registered Public Accounting Firm, are available on the SEC web site or upon request.
3. Significant Accounting Policies.
The financial statements have been prepared in conformity with accounting principles generally accepted in the United States of America (GAAP), which require management to make certain estimates and assumptions at the date of the financial statements. Actual results could differ from those estimates. The following summarizes the significant accounting policies of the Fund:
Annual Report
Notes to Financial Statements - continued
(Amounts in thousands except ratios)
3. Significant Accounting Policies - continued
Security Valuation. Investments are valued as of 4:00 p.m. Eastern time on the last calendar day of the period. The Fund uses independent pricing services approved by the Board of Trustees to value its investments. When current market prices or quotations are not readily available or reliable, valuations may be determined in good faith in accordance with procedures adopted by the Board of Trustees. Factors used in determining value may include market or security specific events. The frequency with which these procedures are used cannot be predicted and they may be utilized to a significant extent. The value used for net asset value (NAV) calculation under these procedures may differ from published prices for the same securities.
The Fund categorizes the inputs to valuation techniques used to value its investments into a disclosure hierarchy consisting of three levels as shown below.
Level 1 - quoted prices in active markets for identical investments
Level 2 - other significant observable inputs (including quoted prices for similar investments, interest rates, prepayment speeds, etc.)
Level 3 - unobservable inputs (including the fund's own assumptions based on the best information available)
Changes in valuation techniques may result in transfers in or out of an assigned level within the disclosure hierarchy. The aggregate value of investments by input level, as of October 31, 2010, is included at the end of the Fund's Schedule of Investments. Valuation techniques used to value the Fund's investments by major category are as follows.
Equity securities, including restricted securities, for which market quotations are readily available, are valued at the last reported sale price or official closing price as reported by an independent pricing service on the primary market or exchange on which they are traded and are categorized as Level 1 in the hierarchy. In the event there were no sales during the day or closing prices are not available, securities are valued at the last quoted bid price or may be valued using the last available price and are generally categorized as Level 2 in the hierarchy. For foreign equity securities, when significant market or security specific events arise, comparisons to the valuation of American Depositary Receipts (ADRs), futures contracts, Exchange-traded funds (ETFs) and certain indexes as well as quoted prices for similar securities are used and are categorized as Level 2 in the hierarchy in these circumstances. Utilizing these techniques may result in transfers between Level 1 and Level 2. For restricted equity securities and private placements where observable inputs are limited, assumptions about market activity and risk are used and are categorized as Level 3 in the hierarchy.
Annual Report
3. Significant Accounting Policies - continued
Security Valuation - continued
Investments in open-end mutual funds, including the Fidelity Central Funds, are valued at their closing net asset value each business day and are categorized as Level 1 in the hierarchy. Short-term securities with remaining maturities of sixty days or less for which quotations are not readily available are valued at amortized cost, which approximates fair value and are categorized as Level 2 in the hierarchy.
Foreign Currency. The Fund uses foreign currency contracts to facilitate transactions in foreign-denominated securities. Gains and losses from these transactions may arise from changes in the value of the foreign currency or if the counterparties do not perform under the contracts' terms.
Foreign-denominated assets, including investment securities, and liabilities are translated into U.S. dollars at the exchange rate at period end. Purchases and sales of investment securities, income and dividends received and expenses denominated in foreign currencies are translated into U.S. dollars at the exchange rate in effect on the transaction date.
The effects of exchange rate fluctuations on investments are included with the net realized and unrealized gain (loss) on investment securities. Other foreign currency transactions resulting in realized and unrealized gain (loss) are disclosed separately.
Investment Transactions and Income. For financial reporting purposes, the Fund's investment holdings and NAV include trades executed through the end of the last business day of the period. The NAV per share for processing shareholder transactions is calculated as of the close of business of the New York Stock Exchange (NYSE), normally 4:00 p.m. Eastern time and includes trades executed through the end of the prior business day. Gains and losses on securities sold are determined on the basis of identified cost and may include proceeds received from litigation. Dividend income is recorded on the ex-dividend date, except for certain dividends from foreign securities where the ex-dividend date may have passed, which are recorded as soon as the Fund is informed of the ex-dividend date. Non-cash dividends included in dividend income, if any, are recorded at the fair market value of the securities received. Distributions received on securities that represent a return of capital or capital gain are recorded as a reduction of cost of investments and/or as a realized gain. The Fund estimates the components of distributions received that may be considered return of capital distributions or capital gain distributions. Interest income and distributions from the Fidelity Central Funds are accrued as earned. Interest income includes coupon interest and amortization of premium and accretion of discount on debt securities. Investment income is recorded net of foreign taxes withheld where recovery of such taxes is uncertain.
Annual Report
Notes to Financial Statements - continued
(Amounts in thousands except ratios)
3. Significant Accounting Policies - continued
Expenses. Most expenses of the Trust can be directly attributed to a fund. Expenses which cannot be directly attributed are apportioned amongst each fund in the Trust. Expense estimates are accrued in the period to which they relate and adjustments are made when actual amounts are known.
Deferred Trustee Compensation. Under a Deferred Compensation Plan (the Plan), independent Trustees may elect to defer receipt of a portion of their annual compensation. Deferred amounts are invested in a cross-section of Fidelity funds, are marked-to-market and remain in the Fund until distributed in accordance with the Plan. The investment of deferred amounts and the offsetting payable to the Trustees are included in the accompanying Statement of Assets and Liabilities.
Income Tax Information and Distributions to Shareholders. Each year the Fund intends to qualify as a regulated investment company, including distributing substantially all of its taxable income and realized gains under Subchapter M of the Internal Revenue Code and filing its U.S. federal tax return. As a result, no provision for income taxes is required. As of October 31, 2010, the Fund did not have any unrecognized tax benefits in the accompanying financial statements. A fund's federal tax return is subject to examination by the Internal Revenue Service (IRS) for a period of three years. Foreign taxes are provided for based on the Fund's understanding of the tax rules and rates that exist in the foreign markets in which it invests.
Distributions are declared and recorded on the ex-dividend date. Income dividends and capital gain distributions are declared separately for each class. Income and capital gain distributions are determined in accordance with income tax regulations, which may differ from GAAP.
Capital accounts within the financial statements are adjusted for permanent book-tax differences. These adjustments have no impact on net assets or the results of operations. Temporary book-tax differences will reverse in a subsequent period.
Book-tax differences are primarily due to the short-term gain distributions from the Fidelity Central Funds, futures transactions, foreign currency transactions, market discount, partnerships, deferred trustees compensation, capital loss carryforwards and losses deferred due to wash sales.
The federal tax cost of investment securities and unrealized appreciation (depreciation) as of period end were as follows:
Gross unrealized appreciation | $ 880,838 |
Gross unrealized depreciation | (342,029) |
Net unrealized appreciation (depreciation) | $ 538,809 |
| |
Tax Cost | $ 9,998,105 |
Annual Report
3. Significant Accounting Policies - continued
Income Tax Information and Distributions to Shareholders - continued
The tax-based components of distributable earnings as of period end were as follows:
Undistributed ordinary income | $ 76,550 |
Capital loss carryforward | $ (2,872,513) |
Net unrealized appreciation (depreciation) | $ 538,809 |
The tax character of distributions paid was as follows:
| October 31, 2010 | October 31, 2009 |
Ordinary Income | $ 121,330 | $ 134,965 |
4. Derivative Instruments.
Risk Exposures and the Use of Derivative Instruments. The Fund uses derivative instruments (derivatives), including futures contracts, in order to meet its investment objectives. The strategy is to use derivatives to increase returns and to manage exposure to certain risks as defined below. The success of any strategy involving derivatives depends on analysis of numerous economic factors, and if the strategies for investment do not work as intended, the Fund may not achieve its objectives.
The Fund's use of derivatives may increase or decrease its exposure to the following risk:
Equity Risk | Equity risk relates to the fluctuations in the value of financial instruments as a result of changes in market prices (other than those arising from interest rate risk or foreign exchange risk), whether caused by factors specific to an individual investment, its issuer, or all factors affecting all instruments traded in a market or market segment. |
The Fund is also exposed to additional risks from investing in derivatives, such as liquidity risk and counterparty credit risk. Liquidity risk is the risk that the Fund will be unable to sell the derivative in the open market in a timely manner. Counterparty credit risk is the risk that the counterparty will not be able to fulfill its obligation to the Fund. The Fund's maximum risk of loss from counterparty credit risk is generally the aggregate unrealized appreciation and unpaid counterparty fees in excess of any collateral pledged by the counterparty to the Fund. Counterparty risk related to exchange-traded futures contracts is minimal because of the protection provided by the exchange on which they trade. Risk of loss may exceed the amounts recognized in the Statement of Assets and Liabilities.
Annual Report
Notes to Financial Statements - continued
(Amounts in thousands except ratios)
4. Derivative Instruments - continued
Futures Contracts. A futures contract is an agreement between two parties to buy or sell a specified underlying instrument for a fixed price at a specified future date. The Fund uses futures contracts to manage its exposure to the stock market.
Upon entering into a futures contract, a fund is required to deposit either cash or securities (initial margin) with a clearing broker in an amount equal to a certain percentage of the face value of the contract. Futures contracts are marked-to-market daily and subsequent payments (variation margin) are made or received by a fund depending on the daily fluctuations in the value of the futures contracts and are recorded as unrealized appreciation or (depreciation). Realized gain or (loss) is recorded upon the expiration or closing of a futures contract.
The underlying face amount at value of open futures contracts at period end, if any, is shown in the Schedule of Investments under the caption "Futures Contracts." This amount reflects each contract's exposure to the underlying instrument at period end. Securities deposited to meet initial margin requirements are identified in the Schedule of Investments. The receivable and/or payable for the variation margin are reflected in the Statement of Assets and Liabilities.
Certain risks may arise upon entering into futures contracts, including the risk that an illiquid market may limit the ability to close out a futures contract prior to settlement date.
During the period the Fund recognized net realized gain (loss) of $5,363 and a change in net unrealized appreciation (depreciation) of $552 related to its investment in futures contracts. These amounts are included in the Statement of Operations.
5. Purchases and Sales of Investments.
Purchases and sales of securities, other than short-term securities, aggregated $15,327,643 and $16,802,758, respectively.
6. Fees and Other Transactions with Affiliates.
Management Fee. FMR and its affiliates provide the Fund with investment management related services for which the Fund pays a monthly management fee. The management fee is the sum of an individual fund fee rate that is based on an annual rate of .30% of the Fund's average net assets and a group fee rate that averaged .26% during the period. The group fee rate is based upon the average net assets of all the mutual funds advised by FMR. The group fee rate decreases as assets under management increase and increases as assets under management decrease. In addition, the management fee is subject to a performance adjustment (up to a maximum of ± .20% of the Fund's average net assets over a 36 month performance period). The upward or downward adjustment to
Annual Report
6. Fees and Other Transactions with Affiliates - continued
Management Fee - continued
the management fee is based on the relative investment performance of Disciplined Equity as compared to an appropriate benchmark index. For the period, the total annual management fee rate, including the performance adjustment, was .45% of the Fund's average net assets.
Transfer Agent Fees. Fidelity Investments Institutional Operations Company, Inc. (FIIOC), an affiliate of FMR, is the transfer, dividend disbursing and shareholder servicing agent for each class of the Fund. FIIOC receives account fees and asset-based fees that vary according to the account size and type of account of the shareholders of Disciplined Equity. FIIOC receives an asset-based fee of Class K's average net assets. FIIOC receives no fees for providing transfer agency services to Class F. FIIOC pays for typesetting, printing and mailing of shareholder reports, except proxy statements. For the period, transfer agent fees for each class were as follows:
| Amount | % of
Average
Net Assets |
Disciplined Equity | $ 22,818 | .23 |
Class K | 103 | .05 |
| $ 22,921 | |
Accounting and Security Lending Fees. Fidelity Service Company, Inc. (FSC), an affiliate of FMR, maintains the Fund's accounting records. The accounting fee is based on the level of average net assets for the month. Under a separate contract, FSC administers the security lending program. The security lending fee is based on the number and duration of lending transactions.
Brokerage Commissions. The Fund placed a portion of its portfolio transactions with brokerage firms which are affiliates of the investment adviser. The commissions paid to these affiliated firms were $244 for the period.
Interfund Lending Program. Pursuant to an Exemptive Order issued by the SEC, the Fund, along with other registered investment companies having management contracts with FMR, may participate in an interfund lending program. This program provides an alternative credit facility allowing the funds to borrow from, or lend money to, other participating affiliated funds. At period end, there were no interfund loans outstanding. The Fund's activity in this program during the period for which loans were outstanding was as follows:
Borrower or Lender | Average Daily Loan Balance | Weighted Average Interest Rate | Interest Expense |
Borrower | $ 23,957 | .43% | $ 5 |
Annual Report
Notes to Financial Statements - continued
(Amounts in thousands except ratios)
7. Committed Line of Credit.
The Fund participates with other funds managed by FMR or an affiliate in a $3.75 billion credit facility (the "line of credit") to be utilized for temporary or emergency purposes to fund shareholder redemptions or for other short-term liquidity purposes. The Fund has agreed to pay commitment fees on its pro-rata portion of the line of credit, which amounted to $43 and is reflected in Miscellaneous expenses on the Statement of Operations. During the period, there were no borrowings on this line of credit.
8. Security Lending.
The Fund lends portfolio securities through a lending agent from time to time in order to earn additional income. The lending agent may loan securities to certain qualified borrowers, including Fidelity Capital Markets (FCM), a broker-dealer affiliated with the Fund. On the settlement date of the loan, the Fund receives collateral (in the form of U.S. Treasury obligations, letters of credit and/or cash) against the loaned securities and maintains collateral in an amount not less than 100% of the market value of the loaned securities during the period of the loan. The market value of the loaned securities is determined at the close of business of the Fund and any additional required collateral is delivered to the Fund on the next business day. If the borrower defaults on its obligation to return the securities loaned because of insolvency or other reasons, a fund could experience delays and costs in recovering the securities loaned or in gaining access to the collateral. Any cash collateral received is invested in the Fidelity Securities Lending Cash Central Fund. The value of loaned securities and cash collateral at period end are disclosed on the Fund's Statement of Assets and Liabilities. Security lending income represents the income earned on investing cash collateral, less rebates paid to borrowers and lending agent fees associated with the loan, plus any premium payments received for lending certain types of securities. Security lending income is presented in the Statement of Operations as a component of income from Fidelity Central Funds. Total security lending income during the period amounted to $828. During the period, there were no securities loaned to FCM.
9. Expense Reductions.
Many of the brokers with whom FMR places trades on behalf of the Fund provided services to the Fund in addition to trade execution. These services included payments of certain expenses on behalf of the Fund totaling $1,693 for the period.
Annual Report
10. Distributions to Shareholders.
Distributions to shareholders of each class were as follows:
Years ended October 31, | 2010 | 2009A |
From net investment income | | |
Disciplined Equity | $ 116,715 | $ 132,354 |
Class K | 2,464 | 2,611 |
Class F | 2,151 | - |
Total | $ 121,330 | $ 134,965 |
A Distributions for Class F are for the period June 26, 2009 (commencement of sale of shares) to October 31, 2009.
11. Share Transactions.
Transactions for each class of shares were as follows:
| Shares | Dollars |
Years ended October 31, | 2010 | 2009 A, B | 2010 | 2009 A, B |
Disciplined Equity | | | | |
Shares sold | 48,761 | 80,765 | $ 1,024,807 | $ 1,370,832 |
Conversion to Class K | - | (7,396) | - | (131,798) |
Reinvestment of distributions | 5,559 | 7,952 | 115,802 | 131,216 |
Shares redeemed | (175,504) | (69,527) | (3,680,202) | (1,229,222) |
Net increase (decrease) | (121,184) | 11,794 | $ (2,539,593) | $ 141,028 |
Class K | | | | |
Shares sold | 5,579 | 2,494 | $ 117,922 | $ 42,351 |
Conversion from Disciplined Equity | - | 7,392 | - | 131,798 |
Reinvestment of distributions | 118 | 158 | 2,464 | 2,611 |
Shares redeemed | (8,493) | (3,351) | (175,735) | (59,298) |
Net increase (decrease) | (2,796) | 6,693 | $ (55,349) | $ 117,462 |
Class F | | | | |
Shares sold | 65,890 | 3,867 | $ 1,373,135 | $ 79,938 |
Reinvestment of distributions | 103 | - | 2,151 | - |
Shares redeemed | (7,147) | (49) | (149,949) | (1,005) |
Net increase (decrease) | 58,846 | 3,818 | $ 1,225,337 | $ 78,933 |
A Share transactions for Class F are for the period June 26, 2009 (commencement of sale of shares) to October 31, 2009.
B Conversion transactions for Class K and Disciplined Equity are presented for the period November 1, 2008 through August 31, 2009.
Annual Report
Notes to Financial Statements - continued
(Amounts in thousands except ratios)
12. Other.
The Fund's organizational documents provide former and current trustees and officers with a limited indemnification against liabilities arising in connection with the performance of their duties to the Fund. In the normal course of business, the Fund may also enter into contracts that provide general indemnifications. The Fund's maximum exposure under these arrangements is unknown as this would be dependent on future claims that may be made against the Fund. The risk of material loss from such claims is considered remote.
At the end of the period, Fidelity Freedom 2020 and Fidelity Freedom 2030 were the owners of record of approximately 13% and 12%, respectively, of the total outstanding shares of the Fund. The Fidelity Freedom and Freedom K Funds were the owners of record, in the aggregate, of approximately 74% of the total outstanding shares of the Fund.
Annual Report
To the Trustees of Fidelity Capital Trust and the Shareholders of Fidelity Disciplined Equity Fund:
In our opinion, the accompanying statement of assets and liabilities, including the schedule of investments, and the related statements of operations and of changes in net assets and the financial highlights present fairly, in all material respects, the financial position of Fidelity Disciplined Equity Fund (a fund of Fidelity Capital Trust) at October 31, 2010, the results of its operations for the year then ended, the changes in its net assets for each of the two years in the period then ended and the financial highlights for each of the periods indicated, in conformity with accounting principles generally accepted in the United States of America. These financial statements and financial highlights (hereafter referred to as "financial statements") are the responsibility of the Fidelity Disciplined Equity Fund's management. Our responsibility is to express an opinion on these financial statements based on our audits. We conducted our audits of these financial statements in accordance with the standards of the Public Company Accounting Oversight Board (United States). Those standards require that we plan and perform the audit to obtain reasonable assurance about whether the financial statements are free of material misstatement. An audit includes examining, on a test basis, evidence supporting the amounts and disclosures in the financial statements, assessing the accounting principles used and significant estimates made by management, and evaluating the overall financial statement presentation. We believe that our audits, which included confirmation of securities at October 31, 2010 by correspondence with the custodian and brokers, provide a reasonable basis for our opinion.
/s/ PricewaterhouseCoopers LLP
PricewaterhouseCoopers LLP
Boston, Massachusetts
December 14, 2010
Annual Report
The Trustees, Member of the Advisory Board, and executive officers of the trust and fund, as applicable, are listed below. The Board of Trustees governs the fund and is responsible for protecting the interests of shareholders. The Trustees are experienced executives who meet periodically throughout the year to oversee the fund's activities, review contractual arrangements with companies that provide services to the fund, oversee management of the risks associated with such activities and contractual arrangements, and review the fund's performance. Except for James C. Curvey, each of the Trustees oversees 221 funds advised by FMR or an affiliate. Mr. Curvey oversees 410 funds advised by FMR or an affiliate.
The Trustees hold office without limit in time except that (a) any Trustee may resign; (b) any Trustee may be removed by written instrument, signed by at least two-thirds of the number of Trustees prior to such removal; (c) any Trustee who requests to be retired or who has become incapacitated by illness or injury may be retired by written instrument signed by a majority of the other Trustees; and (d) any Trustee may be removed at any special meeting of shareholders by a two-thirds vote of the outstanding voting securities of the trust. Each Trustee who is not an interested person (as defined in the 1940 Act) (Independent Trustee), shall retire not later than the last day of the calendar year in which his or her 72nd birthday occurs. The Independent Trustees may waive this mandatory retirement age policy with respect to individual Trustees. The executive officers and Advisory Board Member hold office without limit in time, except that any officer and Advisory Board Member may resign or may be removed by a vote of a majority of the Trustees at any regular meeting or any special meeting of the Trustees. Except as indicated, each individual has held the office shown or other offices in the same company for the past five years.
Experience, Skills, Attributes, and Qualifications of the Fund's Trustees. The Governance and Nominating Committee has adopted a statement of policy that describes the experience, qualifications, attributes, and skills that are necessary and desirable for potential Independent Trustee candidates (Statement of Policy). The Board believes that each Trustee satisfied at the time he or she was initially elected or appointed a Trustee, and continues to satisfy, the standards contemplated by the Statement of Policy. The Governance and Nominating Committee also engages professional search firms to help identify potential Independent Trustee candidates who have the experience, qualifications, attributes, and skills consistent with the Statement of Policy. From time to time, additional criteria based on the composition and skills of the current Independent Trustees, as well as experience or skills that may be appropriate in light of future changes to board composition, business conditions, and regulatory or other developments, have also been considered by the professional search firms and the Governance and Nominating Committee. In addition, the Board takes into account the Trustees' commitment and participation in Board and committee meetings, as well as their leadership of standing and ad hoc committees throughout their tenure.
In determining that a particular Trustee was and continues to be qualified to serve as a Trustee, the Board has considered a variety of criteria, none of which, in isolation, was controlling. The Board believes that, collectively, the Trustees have balanced and diverse experience, qualifications, attributes, and skills, which allow the Board to operate effectively in governing the fund and protecting the interests of shareholders. Information about the specific experience, skills, attributes, and qualifications of each Trustee, which in each case led to the Board's conclusion that the Trustee should serve (or continue to serve) as a trustee of the fund, is provided below.
Annual Report
Board Structure and Oversight Function. Edward C. Johnson 3d is an interested person (as defined in the 1940 Act) and currently serves as Chairman. The Trustees have determined that an interested Chairman is appropriate and benefits shareholders because an interested Chairman has a personal and professional stake in the quality and continuity of services provided to the fund. Independent Trustees exercise their informed business judgment to appoint an individual of their choosing to serve as Chairman, regardless of whether the Trustee happens to be independent or a member of management. The Independent Trustees have determined that they can act independently and effectively without having an Independent Trustee serve as Chairman and that a key structural component for assuring that they are in a position to do so is for the Independent Trustees to constitute a substantial majority for the Board. The Independent Trustees also regularly meet in executive session. Ned C. Lautenbach serves as Chairman of the Independent Trustees and as such (i) acts as a liaison between the Independent Trustees and management with respect to matters important to the Independent Trustees and (ii) with management prepares agendas for Board meetings.
Fidelity funds are overseen by different Boards of Trustees. The fund's Board oversees Fidelity's equity and high income funds and another Board oversees Fidelity's investment-grade bond, money market, and asset allocation funds. The asset allocation funds may invest in Fidelity funds overseen by the fund's Board. The use of separate Boards, each with its own committee structure, allows the Trustees of each group of Fidelity funds to focus on the unique issues of the funds they oversee, including common research, investment, and operational issues. On occasion, the separate Boards establish joint committees to address issues of overlapping consequences for the Fidelity funds overseen by each Board.
The Trustees operate using a system of committees to facilitate the timely and efficient consideration of all matters of importance to the Trustees, the fund, and fund shareholders and to facilitate compliance with legal and regulatory requirements and oversight of the fund's activities and associated risks. The Board, acting through its committees, has charged FMR and its affiliates with (i) identifying events or circumstances the occurrence of which could have demonstrably adverse effects on the fund's business and/or reputation; (ii) implementing processes and controls to lessen the possibility that such events or circumstances occur or to mitigate the effects of such events or circumstances if they do occur; and (iii) creating and maintaining a system designed to evaluate continuously business and market conditions in order to facilitate the identification and implementation processes described in (i) and (ii) above. Because the day-to-day operations and activities of the fund are carried out by or through FMR, its affiliates and other service providers, the fund's exposure to risks is mitigated but not eliminated by the processes overseen by the Trustees. While each of the Board's committees has responsibility for overseeing different aspects of the fund's activities, oversight is exercised primarily through the Operations, Audit, and Compliance Committees. Appropriate personnel, including but not limited to the fund's Chief Compliance Officer (CCO), FMR's internal auditor, the independent accountants, the fund's Treasurer and portfolio management personnel, make periodic reports to the Board's committees, as appropriate. The responsibilities of each committee, including their oversight responsibilities, are described further under "Standing Committees of the Fund's Trustees."
Annual Report
Trustees and Officers - continued
The fund's Statement of Additional Information (SAI) includes more information about the Trustees. To request a free copy, call Fidelity at 1-800-544-8544.
Interested Trustees*:
Correspondence intended for each Trustee who is an interested person may be sent to Fidelity Investments, 82 Devonshire Street, Boston, Massachusetts 02109.
Name, Age; Principal Occupations and Other Relevant Experience+ |
Edward C. Johnson 3d (80) |
| Year of Election or Appointment: 1978 Mr. Johnson is Trustee and Chairman of the Board of Trustees of certain Trusts. Mr. Johnson serves as Chief Executive Officer, Chairman, and a Director of FMR LLC; Chairman and a Director of FMR; Chairman and a Director of Fidelity Research & Analysis Company (FRAC); Chairman and a Director of Fidelity Investments Money Management, Inc.; and Chairman and a Director of FMR Co., Inc. In addition, Mr. Johnson serves as Chairman and Director of FIL Limited. Previously, Mr. Johnson served as President of FMR LLC (2006-2007). |
James C. Curvey (75) |
| Year of Election or Appointment: 2007 Mr. Curvey also serves as Trustee (2007-present) of other investment companies advised by FMR. Mr. Curvey is a Director of Fidelity Investments Money Management, Inc. (2009-present), Director of Fidelity Research & Analysis Co. (2009-present) and Director of FMR and FMR Co., Inc. (2007-present). Mr. Curvey is also Vice Chairman (2007-present) and Director of FMR LLC. In addition, Mr. Curvey serves as an Overseer for the Boston Symphony Orchestra and a member of the Trustees of Villanova University. Previously, Mr. Curvey was the Vice Chairman (2006-2007) and Director (2000-2007) of FMR Corp. |
Annual Report
* Trustees have been determined to be "Interested Trustees" by virtue of, among other things, their affiliation with the trust or various entities under common control with FMR.
+ The information above includes each Trustee's principal occupation during the last five years and other information relating to the experience, attributes, and skills relevant to each Trustee's qualifications to serve as a Trustee, which led to the conclusion that each Trustee should serve as a Trustee for the fund.
Independent Trustees:
Correspondence intended for each Independent Trustee (that is, the Trustees other than the Interested Trustees) may be sent to Fidelity Investments, P.O. Box 55235, Boston, Massachusetts 02205-5235.
Name, Age; Principal Occupations and Other Relevant Experience+ |
Dennis J. Dirks (62) |
| Year of Election or Appointment: 2005 Prior to his retirement in May 2003, Mr. Dirks was Chief Operating Officer and a member of the Board of The Depository Trust & Clearing Corporation (DTCC). He also served as President, Chief Operating Officer, and Board member of The Depository Trust Company (DTC) and President and Board member of the National Securities Clearing Corporation (NSCC). In addition, Mr. Dirks served as Chief Executive Officer and Board member of the Government Securities Clearing Corporation, Chief Executive Officer and Board member of the Mortgage-Backed Securities Clearing Corporation, as a Trustee and a member of the Finance Committee of Manhattan College (2005-2008), and as a Trustee and a member of the Finance Committee of AHRC of Nassau County (2006-2008). Mr. Dirks is a member of the Independent Directors Council (IDC) Governing Council (2010-present) and Board of Directors for The Brookville Center for Children's Services, Inc. (2009-present). |
Alan J. Lacy (57) |
| Year of Election or Appointment: 2008 Mr. Lacy serves as Senior Adviser (2007-present) of Oak Hill Capital Partners, L.P. (private equity). Mr. Lacy also served as Chief Executive Officer (2000-2005) and Vice Chairman (2005-2006) of Sears Holdings Corporation and Sears, Roebuck and Co. (retail). In addition, Mr. Lacy serves as a member of the Board of Directors of The Western Union Company (global money transfer, 2006-present) and Bristol-Myers Squibb Company (global pharmaceuticals, 2007-present). Mr. Lacy is Chairman (2008-present) and a member (2006-present) of the Board of Trustees of The National Parks Conservation Association. |
Ned C. Lautenbach (66) |
| Year of Election or Appointment: 2000 Mr. Lautenbach is Chairman of the Independent Trustees of the Equity and High Income Funds (2006-present). Mr. Lautenbach currently serves as the Lead Director of the Eaton Corporation Board of Directors (diversified industrial, 1997-present). Mr. Lautenbach is also a member of the Board of Directors of the Philharmonic Center for the Arts in Naples, Florida (1999-present); a member of the Board of Trustees of Fairfield University (2005-present); and a member of the Council on Foreign Relations (1994-present). Previously, Mr. Lautenbach was a Partner/Advisory Partner at Clayton, Dubilier & Rice, Inc. (private equity investment, 1998-2010), as well as a Director of Sony Corporation (2006-2007). |
Joseph Mauriello (66) |
| Year of Election or Appointment: 2008 Prior to his retirement in January 2006, Mr. Mauriello served in numerous senior management positions including Deputy Chairman and Chief Operating Officer (2004-2005), and Vice Chairman of Financial Services (2002-2004) of KPMG LLP US (professional services, 1965-2005).
Mr. Mauriello currently serves as a member of the Board of Directors of XL Group plc. (global insurance and re-insurance, 2006-present) and of Arcadia Resources Inc. (health care services and products, 2007-present). Previously, Mr. Mauriello served as a Director of the Hamilton Funds of the Bank of New York (2006-2007). |
Cornelia M. Small (66) |
| Year of Election or Appointment: 2005 Ms. Small is a member of the Board of Directors of the Teagle Foundation (2009-present). Ms. Small is also a member of the Investment Committee, and Chair (2008-present) and a member of the Board of Trustees of Smith College. In addition, Ms. Small serves on the Investment Committee of the Berkshire Taconic Community Foundation (2008-present). Previously, Ms. Small served as Chairperson of the Investment Committee (2002-2008) of Smith College. In addition, Ms. Small served as Chief Investment Officer, Director of Global Equity Investments, and a member of the Board of Directors of Scudder, Stevens & Clark and Scudder Kemper Investments. |
William S. Stavropoulos (71) |
| Year of Election or Appointment: 2002 Mr. Stavropoulos is Vice Chairman of the Independent Trustees of the Equity and High Income Funds (2006-present). Mr. Stavropoulos serves as President and Founder of the Michigan Baseball Foundation, the Great Lakes Loons (2007-present). Mr. Stavropoulos is Chairman Emeritus of the Board of Directors of The Dow Chemical Company, where he previously served in numerous senior management positions, including President, CEO (1995-2000; 2002-2004), Chairman of the Executive Committee (2000-2006), and as a member of the Board of Directors (1990-2006). Currently, Mr. Stavropoulos is Chairman of Univar (global distributor of commodity and specialty chemicals, 2010-present), a Director of Teradata Corporation (data warehousing and technology solutions, 2008-present), Chemical Financial Corporation, Maersk Inc. (industrial conglomerate), Tyco International, Inc. (multinational manufacturing and services, 2007-present), and a member of the Advisory Board for Metalmark Capital (private equity investment, 2005-present). Mr. Stavropoulos is a special advisor to Clayton, Dubilier & Rice, Inc. (private equity investment). In addition, Mr. Stavropoulos is a member of the University of Notre Dame Advisory Council for the College of Science. |
David M. Thomas (61) |
| Year of Election or Appointment: 2008 Previously, Mr. Thomas served as Executive Chairman (2005-2006) and Chairman and Chief Executive Officer (2000-2005) of IMS Health, Inc. (pharmaceutical and healthcare information solutions). In addition,
Mr. Thomas serves as a member of the Board of Directors of Fortune Brands, Inc. (consumer products), and Interpublic Group of Companies, Inc. (marketing communication, 2004-present). |
Michael E. Wiley (60) |
| Year of Election or Appointment: 2008 Mr. Wiley also serves as a Director of Asia Pacific Exploration Consolidated (international oil and gas exploration and production, 2008-present). Mr. Wiley serves as a Director of Tesoro Corporation (independent oil refiner and marketer, 2005-present), and a Director of Bill Barrett Corporation (exploration and production, 2005-present). In addition, Mr. Wiley also serves as a Director of Post Oak Bank (privately-held bank, 2004-present). Previously, Mr. Wiley served as a member of the Board of Trustees of the University of Tulsa (2000-2006; 2007-2010), as a Senior Energy Advisor of Katzenbach Partners, LLC (consulting, 2006-2007), as an Advisory Director of Riverstone Holdings (private investment), Chairman, President, and CEO of Baker Hughes, Inc. (oilfield services, 2000-2004), and as Director of Spinnaker Exploration Company (exploration and production, 2001-2005). |
Annual Report
Trustees and Officers - continued
+ The information above includes each Trustee's principal occupation during the last five years and other information relating to the experience, attributes, and skills relevant to each Trustee's qualifications to serve as a Trustee, which led to the conclusion that each Trustee should serve as a Trustee for the fund.
Advisory Board Member and Executive Officers:
Correspondence intended for each executive officer and Peter S. Lynch may be sent to Fidelity Investments, 82 Devonshire Street, Boston, Massachusetts 02109.
Name, Age; Principal Occupation |
Peter S. Lynch (66) |
| Year of Election or Appointment: 2003 Member of the Advisory Board of Fidelity's Equity and High Income Funds. Mr. Lynch is Vice Chairman and a Director of FMR and FMR Co., Inc. In addition, Mr. Lynch serves as a Trustee of Boston College and as the Chairman of the Inner-City Scholarship Fund. Previously, Mr. Lynch served on the Special Olympics International Board of Directors (1997-2006). |
Kenneth B. Robins (41) |
| Year of Election or Appointment: 2008 President and Treasurer of Fidelity's Equity and High Income Funds.
Mr. Robins also serves as President and Treasurer (2010-present) and Assistant Treasurer (2009-present) of other Fidelity funds and is an employee of Fidelity Investments (2004-present). Previously, Mr. Robins served as Deputy Treasurer of the Fidelity funds (2005-2008) and Treasurer and Chief Financial Officer of The North Carolina Capital Management Trust: Cash and Term Portfolios (2006-2008). |
Bruce T. Herring (45) |
| Year of Election or Appointment: 2006 Vice President of certain Equity Funds. Mr. Herring also serves as Chief Investment Officer and Director of Fidelity Management & Research (U.K.) Inc. (2010-present) and Group Chief Investments Officer of FMR. Previously, Mr. Herring served as Vice President (2005-2006) and Senior Vice President (2006-2007) of Fidelity Management & Research Company, Vice President of FMR Co., Inc. (2001-2007) and as a portfolio manager for Fidelity U.S. Equity Funds. |
Brian B. Hogan (46) |
| Year of Election or Appointment: 2009 Vice President of certain Equity Funds and Vice President of Sector Funds. Mr. Hogan also serves as President of FMR's Equity Division (2009-present). Previously, Mr. Hogan served as Senior Vice President, Equity Research of FMR (2006-2009) and as a portfolio manager. |
Scott C. Goebel (42) |
| Year of Election or Appointment: 2008 Secretary and Chief Legal Officer (CLO) of the Fidelity funds. Mr. Goebel also serves as Secretary and CLO of The North Carolina Capital Management Trust: Cash and Term Portfolio (2008-present); General Counsel, Secretary, and Senior Vice President of FMR (2008-present) and FMR Co., Inc. (2008-present); Deputy General Counsel of FMR LLC; Chief Legal Officer of Fidelity Management & Research (Hong Kong) Limited (2008-present) and Assistant Secretary of Fidelity Management & Research (Japan) Inc. (2008-present), Fidelity Investments Money Management, Inc. (2008-present), Fidelity Management & Research (U.K.) Inc. (2008-present), and Fidelity Research and Analysis Company (2008-present). Previously, Mr. Goebel served as Assistant Secretary of the Funds (2007-2008) and as Vice President and Secretary of Fidelity Distributors Corporation (FDC) (2005-2007). |
William C. Coffey (41) |
| Year of Election or Appointment: 2009 Assistant Secretary of Fidelity's Equity and High Income Funds. Mr. Coffey also serves as Senior Vice President and Deputy General Counsel of FMR LLC (2010-present), and is an employee of Fidelity Investments. Previously, Mr. Coffey served as Vice President and Associate General Counsel of FMR LLC (2005-2009). |
Holly C. Laurent (56) |
| Year of Election or Appointment: 2008 Anti-Money Laundering (AML) Officer of the Fidelity funds. Ms. Laurent also serves as AML Officer of The North Carolina Capital Management Trust: Cash and Term Portfolio (2008-present) and is an employee of Fidelity Investments. Previously, Ms. Laurent was Senior Vice President and Head of Legal for Fidelity Business Services India Pvt. Ltd. (2006-2008), and Senior Vice President, Deputy General Counsel and Group Head for FMR LLC (2005-2006). |
Christine Reynolds (52) |
| Year of Election or Appointment: 2008 Chief Financial Officer of the Fidelity funds. Ms. Reynolds became President of Fidelity Pricing and Cash Management Services (FPCMS) in August 2008. Ms. Reynolds served as Chief Operating Officer of FPCMS (2007-2008). Previously, Ms. Reynolds served as President, Treasurer, and Anti-Money Laundering officer of the Fidelity funds (2004-2007). |
Kenneth A. Rathgeber (63) |
| Year of Election or Appointment: 2004 Chief Compliance Officer of Fidelity's Equity and High Income Funds. Mr. Rathgeber is Chief Compliance Officer of Fidelity Management & Research (Hong Kong) Limited (2008-present), Fidelity Management & Research (Japan) Inc. (2008-present), FMR (2005-present), FMR Co., Inc. (2005-present), Fidelity Management & Research (U.K.) Inc. (2005-present), Fidelity Research & Analysis Company (2005-present), Fidelity Investments Money Management, Inc. (2005-present), Pyramis Global Advisors, LLC (2005-present), and Strategic Advisers, Inc. (2005-present). |
Jeffrey S. Christian (49) |
| Year of Election or Appointment: 2009 Deputy Treasurer of the Fidelity funds. Mr. Christian is an employee of Fidelity Investments. Previously, Mr. Christian served as Chief Financial Officer (2008-2009) of certain Fidelity funds and Senior Vice President of Fidelity Pricing and Cash Management Services (FPCMS) (2004-2009). |
Bryan A. Mehrmann (49) |
| Year of Election or Appointment: 2005 Deputy Treasurer of the Fidelity funds. Mr. Mehrmann is an employee of Fidelity Investments. |
Adrien E. Deberghes (43) |
| Year of Election or Appointment: 2008 Deputy Treasurer of Fidelity's Equity and High Income Funds.
Mr. Deberghes also serves as Assistant Treasurer of other Fidelity funds (2010-present) and is an employee of Fidelity Investments (2008-present). Previously, Mr. Deberghes served as Senior Vice President of Mutual Fund Administration at State Street Corporation (2007-2008), Senior Director of Mutual Fund Administration at Investors Bank & Trust (2005-2007), and Director of Finance for Dunkin' Brands (2000-2005). |
Stephanie J. Dorsey (41) |
| Year of Election or Appointment: 2010 Assistant Treasurer of Fidelity's Equity and High Income Funds. Ms. Dorsey also serves as Deputy Treasurer of other Fidelity funds (2008-present) and is an employee of Fidelity Investments (2008-present). Previously,
Ms. Dorsey served as Treasurer (2004-2008) of the JPMorgan Mutual Funds and Vice President (2004-2008) of JPMorgan Chase Bank. |
John R. Hebble (52) |
| Year of Election or Appointment: 2009 Assistant Treasurer of Fidelity's Equity and High Income Funds. Mr. Hebble also serves as Treasurer and Chief Financial Officer of The North Carolina Capital Management Trust: Cash and Term Portfolio (2008-present), President and Treasurer of other Fidelity funds (2008-present) and is an employee of Fidelity Investments. |
Gary W. Ryan (52) |
| Year of Election or Appointment: 2005 Assistant Treasurer of the Fidelity funds. Mr. Ryan is an employee of Fidelity Investments. Previously, Mr. Ryan served as Vice President of Fund Reporting in Fidelity Pricing and Cash Management Services (FPCMS) (1999-2005). |
Jonathan Davis (42) |
| Year of Election or Appointment: 2010 Assistant Treasurer of the Fidelity funds. Mr. Davis is an employee of Fidelity Investments. Previously, Mr. Davis served as Vice President and Associate General Counsel of FMR LLC (2003-2010). |
Annual Report
Disciplined Equity designates 100% of the dividends distributed during the fiscal year as qualifying for the dividends-received deduction for corporate shareholders.
Disciplined Equity designates 100% of the dividends distributed in December during the fiscal year as amounts which may be taken into account as a dividend for the purposes of the maximum rate under section 1(h)(11) of the Internal Revenue Code.
The fund will notify shareholders in January 2011 of amounts for use in preparing 2010 income tax returns.
Annual Report
Board Approval of Investment Advisory Contracts and Management Fees
Fidelity Disciplined Equity Fund
Each year, the Board of Trustees, including the Independent Trustees (together, the Board), votes on the renewal of the management contract and sub-advisory agreements (together, the Advisory Contracts) for the fund. The Board, assisted by the advice of fund counsel and Independent Trustees' counsel, requests and considers a broad range of information relevant to the renewal of the Advisory Contracts throughout the year.
The Board meets regularly and considers at each of its meetings factors that are relevant to its annual consideration of the renewal of the fund's Advisory Contracts, including the services and support provided to the fund and its shareholders. The Board has established various standing committees, each composed of Independent Trustees with varying backgrounds, to which the Board has assigned specific subject matter responsibilities in order to enhance effective decision-making by the Board. The Board, acting directly and through its Committees, requests and receives information concerning the annual consideration of the renewal of the fund's Advisory Contracts. The Board also meets as needed to consider matters specifically related to the Board's annual consideration of the renewal of Advisory Contracts. Members of the Board may also meet with trustees of other Fidelity funds through ad hoc joint committees to discuss certain matters relevant to the Fidelity funds.
At its July 2010 meeting, the Board of Trustees, including the Independent Trustees, unanimously determined to renew the fund's Advisory Contracts. In reaching its determination, the Board considered all factors it believed relevant, including (i) the nature, extent, and quality of the services to be provided to the fund and its shareholders (including the investment performance of the fund); (ii) the competitiveness of the fund's management fee and total expenses; (iii) the total costs of the services to be provided by and the profits to be realized by Fidelity from its relationship with the fund; (iv) the extent to which economies of scale would be realized as the fund grows; and (v) whether fee levels reflect these economies of scale, if any, for the benefit of fund shareholders.
In considering whether to renew the Advisory Contracts for the fund, the Board reached a determination, with the assistance of fund counsel and Independent Trustees' counsel and through the exercise of its business judgment, that the renewal of the Advisory Contracts is in the best interests of fund shareholders and that the compensation to be received by Fidelity under the management contract is fair and reasonable. The Board's decision to renew the Advisory Contracts was not based on any single factor noted above, but rather was based on a comprehensive consideration of all the information provided to the Board at its meetings throughout the year. The Board, in reaching its determination to renew the Advisory Contracts, is aware that shareholders in the fund have a broad range of investment choices available to them, including a wide choice among mutual funds offered by Fidelity's competitors, and that the fund's shareholders, with the opportunity to review and weigh the disclosure provided by the fund in its prospectus and other public disclosures, have chosen to invest in this fund, managed by Fidelity.
Annual Report
Nature, Extent, and Quality of Services Provided. The Board considered the staffing within the investment adviser, FMR, and the sub-advisers (together, the Investment Advisers), including the backgrounds of the fund's investment personnel and the fund's investment objective and discipline. The Independent Trustees also had discussions with senior management of Fidelity's investment operations and investment groups. The Board considered the structure of the portfolio manager compensation program and whether this structure provides appropriate incentives to act in the best interest of the fund.
Resources Dedicated to Investment Management and Support Services. The Board and the equity research subcommittee of the Board's Fund Oversight Committee reviewed the size, education, and experience of the Investment Advisers' investment staff, their use of technology, and the Investment Advisers' approach to recruiting, training, and retaining portfolio managers and other research, advisory, and management personnel. The Board noted that Fidelity's analysts have access to a variety of technological tools and market and securities data that enable them to perform both fundamental and quantitative analysis and to specialize in various disciplines. The Board considered Fidelity's extensive global research capabilities that enable the Investment Advisers to aggregate data from various sources in an effort to produce positive investment results. The Board also considered that Fidelity's portfolio managers and analysts have access to daily portfolio attribution that allows for monitoring of a fund's portfolio, as well as an electronic communication system that provides immediate real-time access to research concerning issuers and credit enhancers. The Board noted FMR's continued focus on strengthening the organization and discipline of equity portfolio management and research.
Shareholder and Administrative Services. The Board considered (i) the nature, extent, quality, and cost of advisory, administrative, and shareholder services performed by the Investment Advisers and their affiliates under the Advisory Contracts and under separate agreements covering transfer agency, pricing and bookkeeping, and securities lending services for the fund; (ii) the nature and extent of the investment adviser's supervision of third party service providers, principally custodians and subcustodians; and (iii) the resources devoted to, and the record of compliance with, the fund's compliance policies and procedures. The Board also reviewed the allocation of fund brokerage, including allocations to brokers affiliated with the Investment Advisers, the use of brokerage commissions to pay fund expenses, and the use of "soft" commission dollars to pay for research services.
The Board noted that the growth of fund assets over time across the complex allows Fidelity to reinvest in the development of services designed to enhance the value or convenience of the Fidelity funds as investment vehicles. These services include 24-hour access to account information and market information through phone representatives and over the Internet, and investor education materials and asset allocation tools.
Annual Report
Board Approval of Investment Advisory Contracts and
Management Fees - continued
Investment in a Large Fund Family. The Board considered the benefits to shareholders of investing in a Fidelity fund, including the benefits of investing in a fund that is part of a large family of funds offering a variety of investment disciplines and providing a large variety of mutual fund investor services. The Board noted that Fidelity had taken, or had made recommendations that resulted in the Fidelity funds taking, a number of actions over the previous year that benefited particular funds, including (i) dedicating additional resources to investment research and restructuring and broadening the focus of the investment research teams; (ii) bolstering the senior management team that oversees asset management; (iii) launching Class F of certain funds as a lower-fee class available to Freedom K and Freedom Index Funds; (iv) lowering the initial investment minimums and ongoing balance requirements for Real Estate High Income Fund; (v) eliminating subsequent purchase minimums for all funds and adding a waiver of the investment minimum requirement for new accounts opened with the proceeds of a systematic withdrawal plan; (vi) eliminating the withdrawal minimum and maximum limits for systematic withdrawals from Advisor funds; (vii) expanding sales load waivers on Class A shares for Destiny Planholders and expanding Institutional Class eligibility for Class O Destiny Planholders; and (viii) changing certain Class A and Class T sales charge structures to further align them with industry practices.
Investment Performance. The Board considered whether the fund has operated in accordance with its investment objective, as well as its record of compliance with its investment restrictions. It also reviewed the fund's absolute investment performance for each class (except Class F), as well as the fund's relative investment performance for each class (except Class F) measured over multiple periods against (i) a broad-based securities market index, and (ii) a peer group of mutual funds deemed appropriate by Fidelity and reviewed by the Board. The following charts considered by the Board show, over the one-, three-, and five-year periods ended December 31, 2009, as available, the cumulative total returns of Class K and the retail class of the fund, the cumulative total returns of a broad-based securities market index ("benchmark"), and a range of cumulative total returns of a peer group of mutual funds identified by Morningstar, Inc. as having an investment style similar to that of the fund based on underlying portfolio holdings. (Class F of the fund had less than one year of performance as of December 31, 2009.) The box within each chart shows the 25th percentile return (bottom of box) and the 75th percentile return (top of box) of the peer group. Returns shown above the box are in the first quartile and returns shown below the box are in the fourth quartile. The percentage beaten numbers noted below each chart correspond to the percentile box and represent the percentage of funds in the peer group whose performance was equal to or lower than that of the class indicated.
Annual Report
Fidelity Disciplined Equity Fund
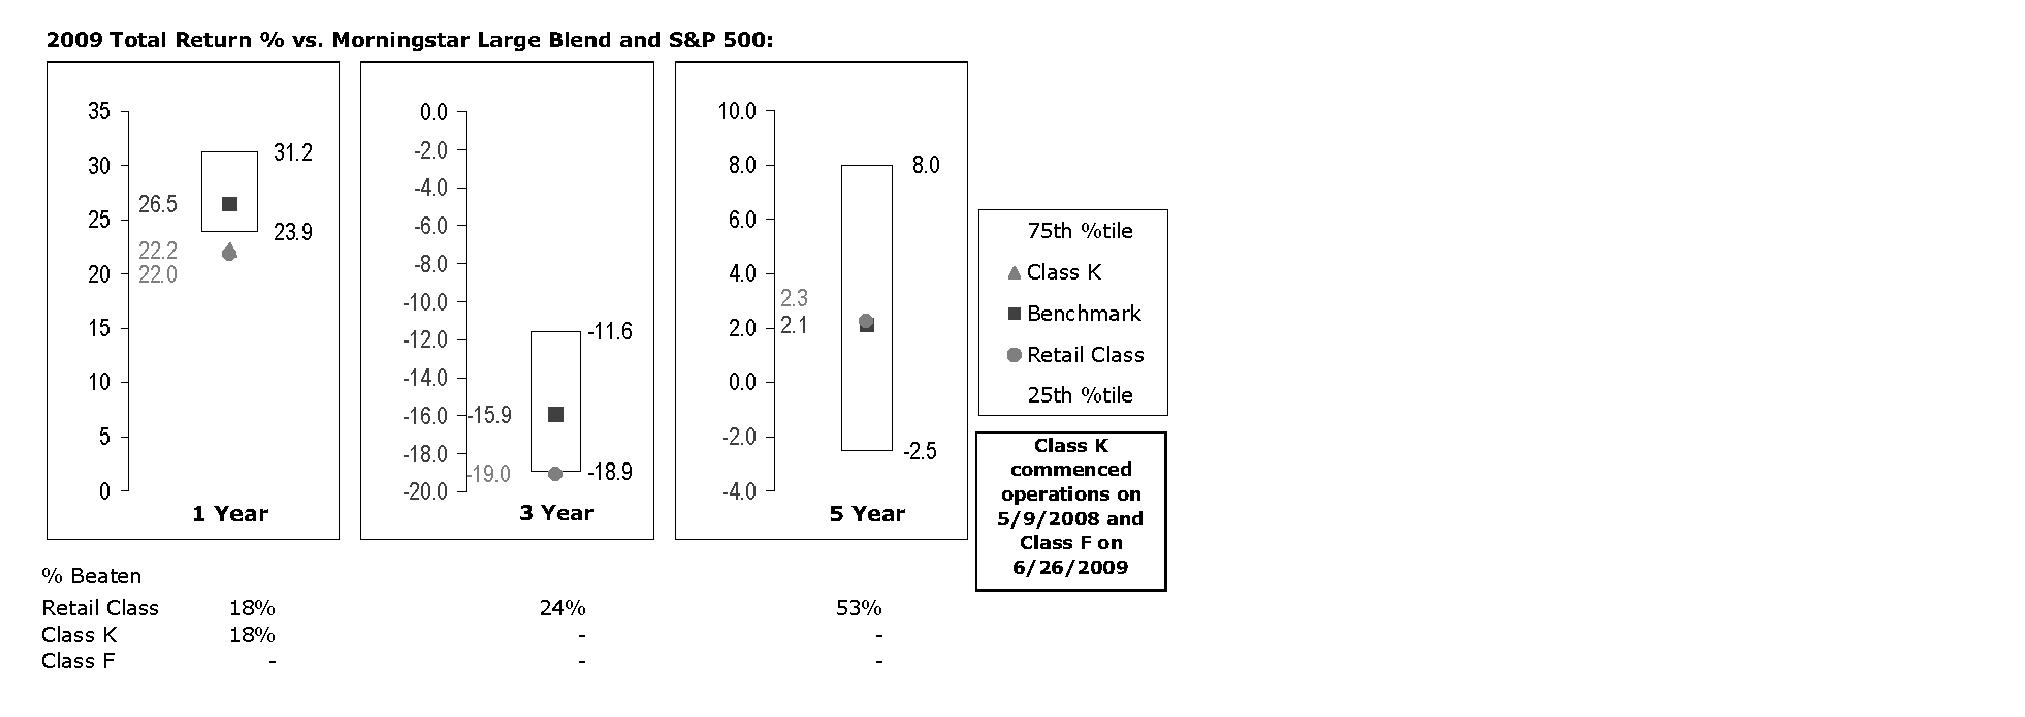
The Board reviewed the fund's relative investment performance against its peer group and noted that the performance of the retail class of the fund (the class with the longer performance record) was in the fourth quartile for the one- and three-year periods and the second quartile for the five-year period. The Board also noted that the investment performance of the fund was lower than its benchmark for the one- and three-year periods, although the five-year cumulative total return of the retail class compared favorably to its benchmark. The Board considered that the variations in performance between the fund's classes reflect the variations in class expenses, which result in lower performance for the higher expense class. The Board discussed with FMR actions that have been taken by FMR to improve the fund's more recent disappointing performance relative to its peer group and benchmark. The Board also reviewed the fund's performance since inception as well as performance in the current year. The Board will continue to closely monitor the performance of the fund in the coming year and discuss with FMR other appropriate actions to address the performance of the fund.
The Board also considered that the fund's management fee is subject to upward or downward adjustment depending upon whether, and to what extent, the fund's investment performance for the performance period exceeds, or is exceeded by, the record (over the same period) of a Board-approved performance adjustment index. The Board realizes that the performance adjustment provides FMR with a strong economic incentive to seek to achieve superior performance for the fund's shareholders and helps to more closely align the interests of FMR and the fund's shareholders.
Annual Report
Board Approval of Investment Advisory Contracts and
Management Fees - continued
Based on its review, and giving particular weight to the nature and quality of the resources dedicated by the Investment Advisers to maintain and improve relative performance and factoring in the unprecedented market events in recent years, the Board concluded that the nature, extent, and quality of investment management and support services and of shareholder and administrative services provided to the fund will benefit the fund's shareholders, particularly in light of the Board's view that the fund's shareholders benefit from investing in a fund that is part of a large family of funds offering a variety of investment disciplines and services.
Competitiveness of Management Fee and Total Fund Expenses. The Board considered the fund's management fee and total expenses compared to "mapped groups" of competitive funds and classes. Fidelity creates "mapped groups" by combining similar Lipper investment objective categories that have comparable management fee characteristics. Combining Lipper investment objective categories aids the Board's management fee and total expense comparisons by broadening the competitive group used for comparison and by reducing the number of universes to which various Fidelity funds are compared.
Management Fee. The Board considered two proprietary management fee comparisons for the 12-month periods shown in the chart below. The group of Lipper funds used by the Board for management fee comparisons is referred to below as the "Total Mapped Group." The Total Mapped Group comparison focuses on a fund's standing relative to the total universe of comparable funds available to investors, in terms of gross management fees before expense reimbursements or caps, and without giving effect to the fund's performance adjustment. "TMG %" represents the percentage of funds in the Total Mapped Group that had management fees that were lower than the fund's. For example, a TMG % of 10% means that 90% of the funds in the Total Mapped Group had higher management fees than the fund. The "Asset-Size Peer Group" (ASPG) comparison focuses on a fund's standing relative to non-Fidelity funds similar in size to the fund within the Total Mapped Group. The ASPG represents at least 15% of the funds in the Total Mapped Group with comparable asset size and management fee characteristics, subject to a minimum of 50 funds (or all funds in the Total Mapped Group if fewer than 50). Additional information, such as the ASPG quartile in which the fund's management fee ranked and the impact of the fund's performance adjustment, is also included in the chart and considered by the Board.
Annual Report
Fidelity Disciplined Equity Fund
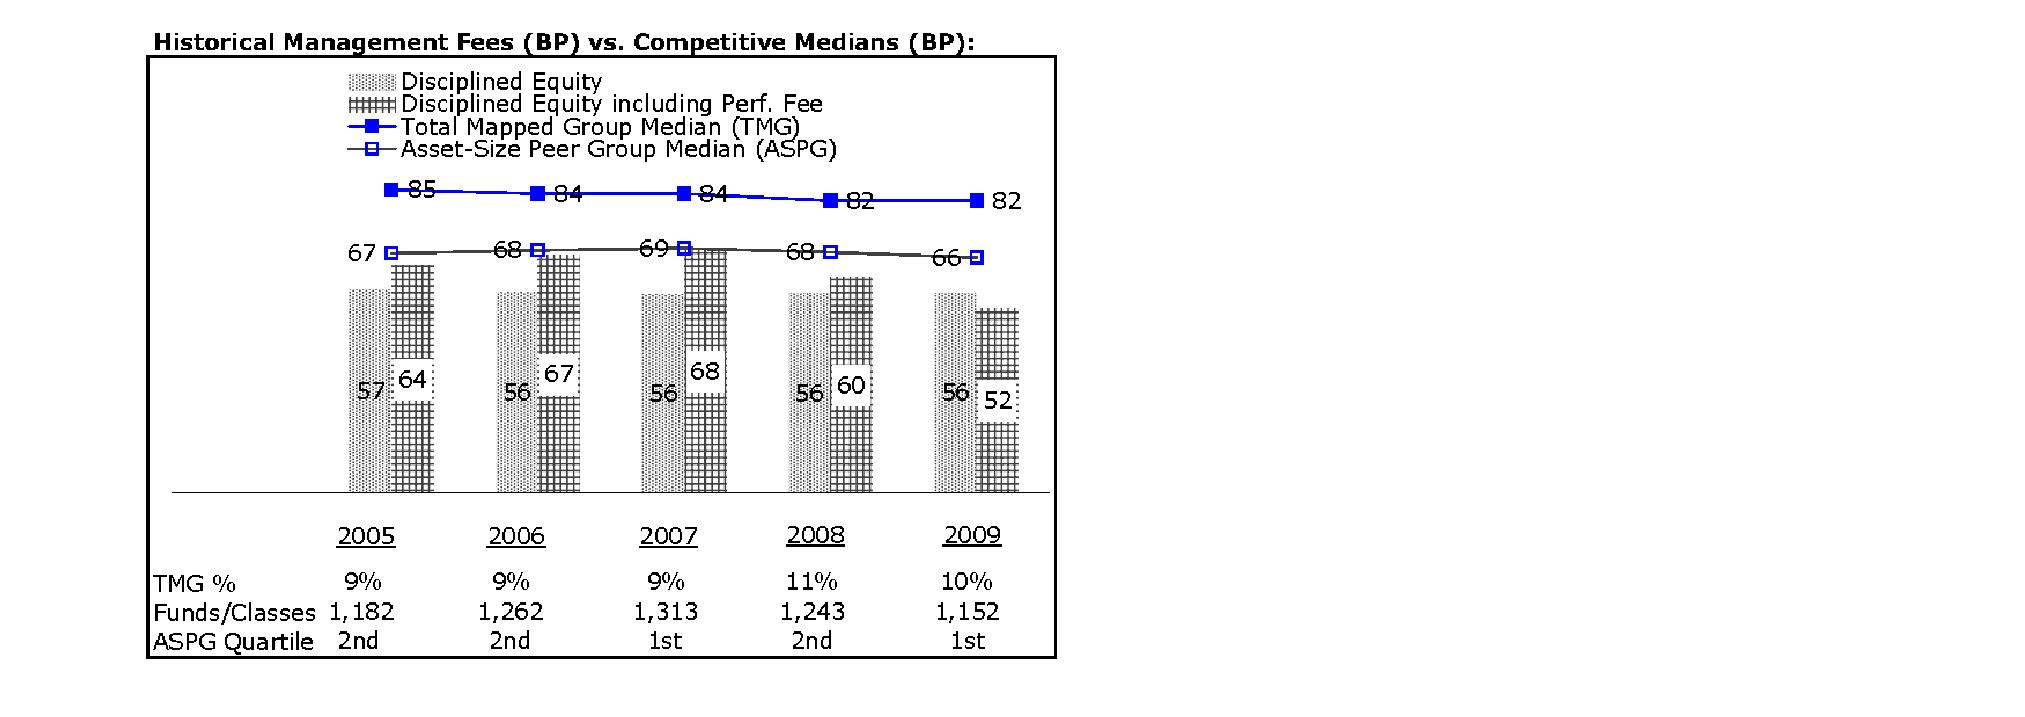
The Board noted that the fund's management fee ranked below the median of its Total Mapped Group and below the median of its ASPG for 2009. The Board also noted the effect of the fund's negative performance adjustment on the fund's management fee ranking. The Board noted that the performance adjustment for each year represents calculations for performance periods that differ from the periods shown in the performance charts above.
Based on its review, the Board concluded that the fund's management fee is fair and reasonable in light of the services that the fund receives and the other factors considered.
Total Expenses. In its review of each class's total expenses, the Board considered the fund's management fee as well as other fund or class expenses, as applicable, such as transfer agent fees, pricing and bookkeeping fees, and custodial, legal, and audit fees. The Board also noted the effects of any waivers and reimbursements on fees and expenses, as well as the impact of the fund's performance adjustment. As part of its review, the Board also considered current and historical total expenses of each class of the fund compared to competitive fund median expenses. Each class of the fund is compared to those funds and classes in the Total Mapped Group (used by the Board for management fee comparisons) that have a similar sales load structure.
The Board noted that the total expenses of each class ranked below its competitive median for the period.
Annual Report
Board Approval of Investment Advisory Contracts and
Management Fees - continued
Fees Charged to Other Fidelity Clients. The Board also considered Fidelity fee structures and other information with respect to clients of FMR and its affiliates, such as other mutual funds advised or subadvised by FMR or its affiliates, pension plan clients, and other institutional clients. In March 2010, the Board created an ad hoc joint committee with the board of other Fidelity funds (the Committee) to review and compare Fidelity's institutional investment advisory business with its business of providing services to the Fidelity funds, including the differences in services provided, fees charged, and costs incurred, as well as competition in their respective marketplaces.
Based on its review of total expenses and fees charged to other Fidelity clients, the Board concluded that the total expenses of each class of the fund were reasonable in light of the services that the fund and its shareholders receive and the other factors considered, including the findings of the Committee.
Costs of the Services and Profitability. The Board considered the revenues earned and the expenses incurred by Fidelity in conducting the business of developing, marketing, distributing, managing, administering and servicing the fund and its shareholders. The Board also considered the level of Fidelity's profits in respect of all the Fidelity funds.
On an annual basis, FMR presents to the Board Fidelity's profitability for the fund. Fidelity calculates the profitability for each fund, as well as aggregate profitability for groups of Fidelity funds and all Fidelity funds, using a series of detailed revenue and cost allocation methodologies which originate with the audited books and records of Fidelity. The Audit Committee of the Board reviews any significant changes from the prior year's methodologies.
PricewaterhouseCoopers LLP (PwC), independent registered public accounting firm and auditor to Fidelity and certain Fidelity funds, has been engaged annually by the Board as part of the Board's assessment of Fidelity's profitability analysis. PwC's engagement includes the review and assessment of Fidelity's methodologies used in determining the revenues and expenses attributable to Fidelity's mutual fund business, and completion of agreed-upon procedures surrounding the mathematical accuracy of fund profitability and its conformity to allocation methodologies. After considering PwC's reports issued under the engagement and information provided by Fidelity, the Board believes that while other allocation methods may also be reasonable, Fidelity's profitability methodologies are reasonable in all material respects.
The Board has also reviewed Fidelity's non-fund businesses and fall-out benefits related to the mutual fund business as well as cases where Fidelity's affiliates may benefit from or be related to the fund's business.
Annual Report
The Board considered the costs of the services provided by and the profits realized by Fidelity in connection with the operation of the fund and were satisfied that the profitability was not excessive in the circumstances.
Economies of Scale. The Board considered whether there have been economies of scale in respect of the management of the Fidelity funds, whether the Fidelity funds (including the fund) have appropriately benefited from any such economies of scale, and whether there is potential for realization of any further economies of scale. The Board considered the extent to which the fund will benefit from economies of scale through increased services to the fund, through waivers or reimbursements, or through fee or expense reductions.
In February 2009, the Board and the board of other Fidelity funds created an ad hoc committee (the Economies of Scale Committee) to analyze whether FMR attains economies of scale in respect of the management and servicing of the Fidelity funds, whether the Fidelity funds have appropriately benefited from such economies of scale, and whether there is potential for realization of any further economies of scale.
The Board recognized that the fund's management contract incorporates a "group fee" structure, which provides for lower group fee rates as total fund assets under FMR's management increase, and for higher group fee rates as total fund assets under FMR's management decrease. FMR calculates the group fee rates based on a tiered asset "breakpoint" schedule that varies based on asset class. The Board considered that the group fee is designed to deliver the benefits of economies of scale to fund shareholders when total Fidelity fund assets increase, even if assets of any particular fund are unchanged or have declined, because some portion of Fidelity's costs are attributable to services provided to all Fidelity funds, and all funds benefit if those costs can be allocated among more assets. The Board concluded that, given the group fee structure, fund shareholders will benefit from lower management fees as assets under FMR's management increase at the fund complex level, regardless of whether Fidelity achieves any such economies of scale.
The Board concluded, considering the findings of the Economies of Scale Committee, that any potential economies of scale are being appropriately shared between fund shareholders and Fidelity.
Additional Information Requested by the Board. In order to develop fully the factual basis for consideration of the Fidelity funds' Advisory Contracts, the Board requested and received additional information on certain topics, including (i) fund performance trends, actions to be taken by FMR to improve certain funds' overall performance, and Fidelity's long-term strategies for certain funds; (ii) portfolio manager changes that have occurred during the past year and length of portfolio manager tenure for different categories of funds over time; (iii) Fidelity's compensation structure for portfolio managers, research analysts, and other key personnel, the rationale for the compensation structure, and how the compensation structure provides appropriate performance incentives; (iv) the amount of the investment that each portfolio manager has made in the Fidelity fund(s) that he or she manages; (v) management and other fees paid by FMR to affiliated sub-advisers on behalf of the Fidelity funds; (vi) Fidelity's fee structures and rationale for recommending different fees among different categories of funds; (vii) Fidelity's rationale for recommending which funds should have a performance adjustment component as part of their management fees; (viii) the rationale for any differences between fund fee structures and fee structures in place for other Fidelity clients; and (ix) explanations regarding the relative total expenses borne by certain funds and classes, total expense competitive trends, and actions that might be taken by FMR to reduce total expenses for certain funds and classes.
Annual Report
Board Approval of Investment Advisory Contracts and
Management Fees - continued
Based on its evaluation of all of the conclusions noted above, and after considering all factors it believed relevant, the Board ultimately concluded that the advisory fee structures are fair and reasonable, and that the fund's Advisory Contracts should be renewed.
Annual Report
Managing Your Investments
Fidelity offers several ways to conveniently manage your personal investments via your telephone or PC. You can access your account information, conduct trades and research your investments 24 hours a day.
By Phone
Fidelity Automated Service Telephone provides a single toll-free number to access account balances, positions, quotes and trading. It's easy to navigate the service, and on your first call, the system will help you create a personal identification number (PIN) for security.
(phone_graphic)
Fidelity Automated
Service Telephone (FAST®)
1-800-544-5555
Press
For mutual fund and brokerage trading.
For quotes.*
For account balances and holdings.
To review orders and mutual
fund activity.
To change your PIN.
To speak to a Fidelity representative.
By PC
Fidelity's web site on the Internet provides a wide range of information, including daily financial news, fund performance, interactive planning tools and news about Fidelity products and services.
(computer_graphic)
Fidelity's Web Site
www.fidelity.com
* When you call the quotes line, please remember that a fund's yield and return will vary and, except for money market funds, share price will also vary. This means that you may have a gain or loss when you sell your shares. There is no assurance that money market funds will be able to maintain a stable $1 share price; an investment in a money market fund is not insured or guaranteed by the U.S. government. Total returns are historical and include changes in share price, reinvestment of dividends and capital gains, and the effects of any sales charges.
Annual Report
To Visit Fidelity
For directions and hours,
please call 1-800-544-9797.
Arizona
7001 West Ray Road
Chandler, AZ
15445 N. Scottsdale Road
Scottsdale, AZ
17550 North 75th Avenue
Glendale, AZ
5330 E. Broadway Blvd
Tucson, AZ
California
815 East Birch Street
Brea, CA
1411 Chapin Avenue
Burlingame, CA
851 East Hamilton Avenue
Campbell, CA
601 Larkspur Landing Circle
Larkspur, CA
2000 Avenue of the Stars
Los Angeles, CA
27101 Puerta Real
Mission Viejo, CA
73575 El Paseo
Palm Desert, CA
251 University Avenue
Palo Alto, CA
123 South Lake Avenue
Pasadena, CA
16656 Bernardo Ctr. Drive
Rancho Bernardo, CA
1220 Roseville Parkway
Roseville, CA
1740 Arden Way
Sacramento, CA
7676 Hazard Center Drive
San Diego, CA
11943 El Camino Real
San Diego, CA
8 Montgomery Street
San Francisco, CA
3793 State Street
Santa Barbara, CA
1200 Wilshire Boulevard
Santa Monica, CA
398 West El Camino Real
Sunnyvale, CA
111 South Westlake Blvd
Thousand Oaks, CA
21701 Hawthorne Boulevard
Torrance, CA
2001 North Main Street
Walnut Creek, CA
6326 Canoga Avenue
Woodland Hills, CA
2211 Michelson Drive
Irvine, CA
Colorado
281 East Flatiron Circle
Broomfield, CO
1625 Broadway
Denver, CO
9185 Westview Road
Lone Tree, CO
Connecticut
48 West Putnam Avenue
Greenwich, CT
265 Church Street
New Haven, CT
300 Atlantic Street
Stamford, CT
29 South Main Street
West Hartford, CT
1261 Post Road
Fairfield, CT
Delaware
400 Delaware Avenue
Wilmington, DE
Florida
175 East Altamonte Drive
Altamonte Springs, FL
1400 Glades Road
Boca Raton, FL
121 Alhambra Plaza
Coral Gables, FL
2948 N. Federal Highway
Ft. Lauderdale, FL
4671 Town Center Parkway
Jacksonville, FL
8880 Tamiami Trail, North
Naples, FL
230 Royal Palm Way
Palm Beach, FL
3501 PGA Boulevard
Palm Beach Gardens, FL
3550 Tamiami Trail, South
Sarasota, FL
1502 N. Westshore Blvd.
Tampa, FL
2465 State Road 7
Wellington, FL
Georgia
3242 Peachtree Road
Atlanta, GA
1000 Abernathy Road
Atlanta, GA
Illinois
One North LaSalle Street
Chicago, IL
401 North Michigan Avenue
Chicago, IL
One Skokie Valley Road
Highland Park, IL
1415 West 22nd Street
Oak Brook, IL
15105 S LaGrange Road
Orland Park, IL
1572 East Golf Road
Schaumburg, IL
1823 Freedom Drive
Naperville, IL
Indiana
8480 Keystone Crossing
Indianapolis, IN
Kansas
5400 College Boulevard
Overland Park, KS
Maine
Three Canal Plaza
Portland, ME
Maryland
7315 Wisconsin Avenue
Bethesda, MD
610 York Road
Towson, MD
Massachusetts
801 Boylston Street
Boston, MA
155 Congress Street
Boston, MA
300 Granite Street
Braintree, MA
44 Mall Road
Burlington, MA
238 Main Street
Cambridge, MA
200 Endicott Street
Danvers, MA
Fidelity Brokerage Services, Inc., 100 Summer St., Boston, MA 02110 Member NYSE/SIPC
Annual Report
405 Cochituate Road
Framingham, MA
551 Boston Turnpike
Shrewsbury, MA
Michigan
500 E. Eisenhower Pkwy.
Ann Arbor, MI
280 N. Old Woodward Ave.
Birmingham, MI
30200 Northwestern Hwy.
Farmington Hills, MI
43420 Grand River Avenue
Novi, MI
3480 28th Street
Grand Rapids, MI
2425 S. Linden Road STE E
Flint, MI
Minnesota
7740 France Avenue South
Edina, MN
8342 3rd Street North
Oakdale, MN
Missouri
1524 South Lindbergh Blvd.
St. Louis, MO
Nevada
2225 Village Walk Drive
Henderson, NV
New Jersey
501 Route 73 South
Marlton, NJ
150 Essex Street
Millburn, NJ
35 Morris Street
Morristown, NJ
396 Route 17, North
Paramus, NJ
3518 Route 1 North
Princeton, NJ
530 Broad Street
Shrewsbury, NJ
New Mexico
2261 Q Street NE
Albuquerque, NM
New York
1130 Franklin Avenue
Garden City, NY
37 West Jericho Turnpike
Huntington Station, NY
1271 Avenue of the Americas
New York, NY
980 Madison Avenue
New York, NY
61 Broadway
New York, NY
350 Park Avenue
New York, NY
200 Fifth Avenue
New York, NY
733 Third Avenue
New York, NY
2070 Broadway
New York, NY
1075 Northern Blvd.
Roslyn, NY
799 Central Park Avenue
Scarsdale, NY
3349 Monroe Avenue
Rochester, NY
North Carolina
4611 Sharon Road
Charlotte, NC
7011 Fayetteville Road
Durham, NC
Ohio
3805 Edwards Road
Cincinnati, OH
1324 Polaris Parkway
Columbus, OH
1800 Crocker Road
Westlake, OH
28699 Chagrin Boulevard
Woodmere Village, OH
Oregon
7493 SW Bridgeport Road
Tigard, OR
Pennsylvania
600 West DeKalb Pike
King of Prussia, PA
1735 Market Street
Philadelphia, PA
12001 Perry Highway
Wexford, PA
Rhode Island
10 Memorial Boulevard
Providence, RI
Tennessee
3018 Peoples Street
Johnson City, TN
7628 West Farmington Blvd.
Germantown, TN
2035 Mallory Lane
Franklin, TN
Texas
10000 Research Boulevard
Austin, TX
4001 Northwest Parkway
Dallas, TX
12532 Memorial Drive
Houston, TX
2701 Drexel Drive
Houston, TX
6560 Fannin Street
Houston, TX
1701 Lake Robbins Drive
The Woodlands, TX
6500 N. MacArthur Blvd.
Irving, TX
6005 West Park Boulevard
Plano, TX
1576 East Southlake Blvd.
Southlake, TX
15600 Southwest Freeway
Sugar Land, TX
139 N. Loop 1604 East
San Antonio, TX
Utah
279 West South Temple
Salt Lake City, UT
Virginia
1861 International Drive
McLean, VA
11957 Democracy Drive
Reston, VA
Washington
10500 NE 8th Street
Bellevue, WA
1518 6th Avenue
Seattle, WA
304 Strander Blvd
Tukwila, WA
Washington, DC
1900 K Street, N.W.
Washington, DC
Wisconsin
16020 West Bluemound Road
Brookfield, WI
Annual Report
To Write Fidelity
We'll give your correspondence immediate attention and send you written confirmation upon completion of your request.
(letter_graphic)
Making Changes
To Your Account
(such as changing name, address, bank, etc.)
Fidelity Investments
P.O. Box 770001
Cincinnati, OH 45277-0002
(letter_graphic)
For Non-Retirement
Accounts
Buying shares
Fidelity Investments
P.O. Box 770001
Cincinnati, OH 45277-0003
Overnight Express
Fidelity Investments
Attn: Distribution Services
100 Crosby Parkway - KC1H
Covington, KY 41015
Selling shares
Fidelity Investments
P.O. Box 770001
Cincinnati, OH 45277-0035
Overnight Express
Fidelity Investments
Attn: Distribution Services
100 Crosby Parkway - KC1H
Covington, KY 41015
General Correspondence
Fidelity Investments
P.O. Box 500
Merrimack, NH 03054-0500
(letter_graphic)
For Retirement
Accounts
Buying shares
Fidelity Investments
P.O. Box 770001
Cincinnati, OH 45277-0003
Selling shares
Fidelity Investments
P.O. Box 770001
Cincinnati, OH 45277-0035
Overnight Express
Fidelity Investments
Attn: Distribution Services
100 Crosby Parkway - KC1H
Covington, KY 41015
General Correspondence
Fidelity Investments
P.O. Box 500
Merrimack, NH 03054-0500
Annual Report
Investment Adviser
Fidelity Management & Research Company
Boston, MA
Investment Sub-Advisers
FMR Co., Inc.
Fidelity Management & Research
(U.K.) Inc.
Fidelity Research & Analysis Company
Fidelity Management & Research
(Japan) Inc.
Fidelity Management & Research
(Hong Kong) Limited
General Distributor
Fidelity Distributors Corporation
Boston, MA
Transfer and Service Agents
Fidelity Investments Institutional
Operations Company, Inc. (FIIOC)
Boston, MA
Fidelity Service Company, Inc.
Boston, MA
Custodian
State Street Bank and Trust Company
Quincy, MA
The Fidelity Telephone Connection
Mutual Fund 24-Hour Service
Exchanges/Redemptions
and Account Assistance 1-800-544-6666
Product Information 1-800-544-6666
Retirement Accounts 1-800-544-4774
(8 a.m. - 9 p.m.)
TDD Service 1-800-544-0118
for the deaf and hearing impaired
(9 a.m. - 9 p.m. Eastern time)
Fidelity Automated Service
Telephone (FAST®) 1-800-544-5555
Automated line for quickest service
FDE-UANN-1210
1.784777.107
Fidelity®
Disciplined Equity
Fund -
Class F
Annual Report
October 31, 2010
(2_fidelity_logos) (Registered_Trademark)
Contents
Performance | <Click Here> | How the fund has done over time. |
Management's Discussion of Fund Performance | <Click Here> | The Portfolio Manager's review of fundperformance and strategy. |
Shareholder Expense Example | <Click Here> | An example of shareholder expenses. |
Investment Changes | <Click Here> | A summary of major shifts in the fund's investments over the past six months. |
Investments | <Click Here> | A complete list of the fund's investments with their market values. |
Financial Statements | <Click Here> | Statements of assets and liabilities, operations, and changes in net assets, as well as financial highlights. |
Notes | <Click Here> | Notes to the financial statements. |
Report of Independent Registered Public Accounting Firm | <Click Here> | |
Trustees and Officers | <Click Here> | |
Distributions | <Click Here> | |
Board Approval of Investment Advisory Contracts and Management Fees | <Click Here> | |
To view a fund's proxy voting guidelines and proxy voting record for the 12-month period ended June 30, visit http://www.fidelity.com/proxyvotingresults or visit the Securities and Exchange Commission's (SEC) web site at http://www.sec.gov. You may also call 1-800-835-5092 to request a free copy of the proxy voting guidelines.
Standard & Poor's, S&P and S&P 500 are registered service marks of The McGraw-Hill Companies, Inc. and have been licensed for use by Fidelity Distributors Corporation.
Other third party marks appearing herein are the property of their respective owners.
All other marks appearing herein are registered or unregistered trademarks or service marks of FMR LLC or an affiliated company.
Annual Report
This report and the financial statements contained herein are submitted for the general information of the shareholders of the fund. This report is not authorized for distribution to prospective investors in the fund unless preceded or accompanied by an effective prospectus.
A fund files its complete schedule of portfolio holdings with the SEC for the first and third quarters of each fiscal year on Form N-Q. Forms N-Q are available on the SEC's web site at http://www.sec.gov. A fund's Forms N-Q may be reviewed and copied at the SEC's Public Reference Room in Washington, DC. Information regarding the operation of the SEC's Public Reference Room may be obtained by calling 1-800-SEC-0330. For a complete list of a fund's portfolio holdings, view the most recent holdings listing, semiannual report, or annual report on Fidelity's web site at http://www.fidelity.com or http://www.advisor.fidelity.com, as applicable.
NOT FDIC INSURED • MAY LOSE VALUE • NO BANK GUARANTEE
Neither the fund nor Fidelity Distributors Corporation is a bank.
Annual Report
Average annual total return reflects the change in the value of an investment, assuming reinvestment of the class' distributions from dividend income and capital gains (the profits earned upon the sale of securities that have grown in value, if any) and assuming a constant rate of performance each year. The $10,000 table and the fund's returns do not reflect the deduction of taxes that a shareholder would pay on fund distributions or the redemption of fund shares. During periods of reimbursement by Fidelity, a fund's total return will be greater than it would be had the reimbursement not occurred. How a fund did yesterday is no guarantee of how it will do tomorrow.
Average Annual Total Returns
Periods ended October 31, 2010 | Past 1
year | Past 5
years | Past 10
years |
Class F A | 11.31% | 0.05% | -0.03% |
A The initial offering of Class F shares took place on June 26, 2009. Returns prior to June 26, 2009 are those of Fidelity® Disciplined Equity Fund, the original class of the fund.
$10,000 Over 10 Years
Let's say hypothetically that $10,000 was invested in Fidelity® Disciplined Equity Fund - Class F on October 31, 2000. The chart shows how the value of your investment would have changed, and also shows how the Standard & Poor's 500SM (S&P 500®) Index performed over the same period. The initial offering of Class F took place on June 26, 2009. See above for additional information regarding the performance of Class F.

Annual Report
Market Recap: Amid bouts of volatility, major U.S. stock market indexes recorded double-digit gains for the year ending October 31, 2010, lifted by economic optimism, encouraging earnings reports and a wave of corporate mergers. Aside from a January dip, stocks trended upward for the first half of the period amid indications the Great Recession was over. However, in April, lingering high unemployment and heightened concern over European debt sent equities falling. Markets regrouped in July, but fell again in August on mixed economic data. The final two months of the period brought renewed optimism, with the large-cap S&P 500® Index posting its best September/October performance since 1998. For the full 12 months, the S&P 500® rose 16.52%, while the blue-chip-laden Dow Jones Industrial AverageSM added 17.62% and the technology-heavy Nasdaq Composite® Index rose 23.72%. Among market segments, all 10 sectors in the S&P 500 posted gains, with more than half outperforming the broad-market index. Stocks of mid- and small-sized companies surged, with the Russell Midcap® Index adding 27.71% and Russell 2000® Index climbing 26.58%. Looking abroad, debt problems in several European countries cooled gains in developed markets, and yet the MSCI® EAFE® (Europe, Australasia, Far East) Index still rose 8.49%.
Comments from Keith Quinton, Portfolio Manager of Fidelity® Disciplined Equity Fund: The fund's Class F shares rose 11.31% for the year, trailing the S&P 500. The fund was hurt by our quantitative stock picking models, which do not factor in sudden changes in market tempo. Positioning in the weak-performing financials sector notably detracted, as did security selection in technology, health care and utilities. The biggest individual disappointment was an out-of-index investment in asset manager BlackRock, a stock the fund no longer owned at period end. After acquiring Barclays Global Investors, BlackRock saw asset outflows, shrinking business and weak earnings, and its stock fell about 20% for the period. The fund also was hurt by overweighting technology giant Hewlett-Packard, whose stock dropped after its CEO was forced to resign in August amid a scandal. Not owning enough of mobile device leader Apple hurt relative results, as did holdings in JPMorgan Chase and Microsoft. Performance was helped by positioning in consumer staples, including stakes in Coca-Cola Enterprises and Anheuser-Busch InBev. Security selection in consumer discretionary contributed, including TRW Automotive Holdings, whose stock nearly tripled after it cut debt and grew profits. The fund's top individual contributor was database software supplier Sybase, acquired by SAP at a premium. Underweighting benchmark goliath and underperformer Exxon Mobil also contributed. Some of the stocks I've mentioned were not in the benchmark.
The views expressed above reflect those of the portfolio manager(s) only through the end of the period as stated on the cover of this report and do not necessarily represent the views of Fidelity or any other person in the Fidelity organization. Any such views are subject to change at any time based upon market or other conditions and Fidelity disclaims any responsibility to update such views. These views may not be relied on as investment advice and, because investment decisions for a Fidelity fund are based on numerous factors, may not be relied on as an indication of trading intent on behalf of any Fidelity fund.
Annual Report
Shareholder Expense Example
As a shareholder of the Fund, you incur two types of costs: (1) transaction costs, and (2) ongoing costs, including management fees and other Fund expenses. This Example is intended to help you understand your ongoing costs (in dollars) of investing in the Fund and to compare these costs with the ongoing costs of investing in other mutual funds.
The Example is based on an investment of $1,000 invested at the beginning of the period and held for the entire period (May 1, 2010 to October 31, 2010).
Actual Expenses
The first line of the accompanying table for each class of the Fund provides information about actual account values and actual expenses. You may use the information in this line, together with the amount you invested, to estimate the expenses that you paid over the period. Simply divide your account value by $1,000.00 (for example, an $8,600 account value divided by $1,000.00 = 8.6), then multiply the result by the number in the first line for a class of the Fund under the heading entitled "Expenses Paid During Period" to estimate the expenses you paid on your account during this period. A small balance maintenance fee of $12.00 that is charged once a year may apply for certain accounts with a value of less than $2,000. This fee is not included in the table below. If it was, the estimate of expenses you paid during the period would be higher, and your ending account value lower, by this amount. In addition, the Fund, as a shareholder in the underlying Fidelity Central Funds, will indirectly bear its pro-rata share of the fees and expenses incurred by the underlying Fidelity Central Funds. These fees and expenses are not included in the Fund's annualized expense ratio used to calculate the expense estimate in the table below.
Hypothetical Example for Comparison Purposes
The second line of the accompanying table for each class of the Fund provides information about hypothetical account values and hypothetical expenses based on a Class' actual expense ratio and an assumed rate of return of 5% per year before expenses, which is not the Class' actual return. The hypothetical account values and expenses may not be used to estimate the actual ending account balance or expenses you paid for the period. You may use this information to compare the ongoing costs of investing in the Fund and other funds. To do so, compare this 5% hypothetical example with the 5% hypothetical examples that appear in the shareholder reports of the other funds. A small balance maintenance fee of $12.00 that is charged once a year may apply for certain accounts with a value of less than $2,000. This fee is not included in the table below. If it was, the estimate of expenses you paid during the period would be higher, and your ending account value lower, by this amount. In addition, the Fund, as a shareholder in the underlying Fidelity Central Funds, will indirectly bear its pro-rata share of the fees and expenses incurred by the underlying Fidelity Central Funds. These fees and expenses are not included in the Fund's annualized expense ratio used to calculate the expense estimate in the table below.
Please note that the expenses shown in the table are meant to highlight your ongoing costs only and do not reflect any transaction costs. Therefore, the second line of the table is useful in comparing ongoing costs only, and will not help you determine the relative total costs of owning different funds.
Annual Report
| Annualized
Expense Ratio | Beginning
Account Value
May 1, 2010 | Ending
Account Value
October 31, 2010 | Expenses Paid
During Period*
May 1, 2010
to October 31, 2010 |
Disciplined Equity | .67% | | | |
Actual | | $ 1,000.00 | $ 976.60 | $ 3.34 |
HypotheticalA | | $ 1,000.00 | $ 1,021.83 | $ 3.41 |
Class K | .49% | | | |
Actual | | $ 1,000.00 | $ 977.50 | $ 2.44 |
HypotheticalA | | $ 1,000.00 | $ 1,022.74 | $ 2.50 |
Class F | .46% | | | |
Actual | | $ 1,000.00 | $ 977.90 | $ 2.29 |
HypotheticalA | | $ 1,000.00 | $ 1,022.89 | $ 2.35 |
A 5% return per year before expenses
* Expenses are equal to each Class' annualized expense ratio, multiplied by the average account value over the period, multiplied by 184/365 (to reflect the one-half year period).
Annual Report
Investment Changes (Unaudited)
Top Ten Stocks as of October 31, 2010 |
| % of fund's
net assets | % of fund's net assets
6 months ago |
Microsoft Corp. | 4.9 | 4.4 |
Chevron Corp. | 4.4 | 4.6 |
Hewlett-Packard Co. | 4.1 | 4.1 |
JPMorgan Chase & Co. | 3.4 | 2.9 |
Goldman Sachs Group, Inc. | 3.0 | 1.9 |
Marathon Oil Corp. | 3.0 | 2.6 |
Anheuser-Busch InBev SA NV | 3.0 | 2.4 |
Exxon Mobil Corp. | 2.6 | 0.0 |
Vodafone Group PLC sponsored ADR | 2.4 | 1.9 |
General Electric Co. | 2.3 | 2.5 |
| 33.1 | |
Top Five Market Sectors as of October 31, 2010 |
| % of fund's
net assets | % of fund's net assets
6 months ago |
Information Technology | 19.7 | 18.9 |
Financials | 14.4 | 16.4 |
Health Care | 11.5 | 11.7 |
Energy | 11.1 | 11.2 |
Industrials | 10.8 | 10.8 |
Asset Allocation (% of fund's net assets) |
As of October 31, 2010* | As of April 30, 2010** |
| Stocks 98.6% | | | Stocks and
Equity Futures 99.9% | |
| Short-Term
Investments and
Net Other Assets 1.4% | | | Short-Term
Investments and
Net Other Assets 0.1% | |
* Foreign investments | 13.6% | | ** Foreign investments | 11.6% | |

Annual Report
Investments October 31, 2010
Showing Percentage of Net Assets
Common Stocks - 98.6% |
| Shares | | Value (000s) |
CONSUMER DISCRETIONARY - 10.6% |
Auto Components - 2.3% |
TRW Automotive Holdings Corp. (a) | 5,273,000 | | $ 240,923 |
Automobiles - 1.7% |
Ford Motor Co. (a) | 13,100,000 | | 185,103 |
Media - 0.4% |
Comcast Corp. Class A (special) (non-vtg.) | 1,500,000 | | 28,995 |
Interpublic Group of Companies, Inc. (a) | 1,000,000 | | 10,350 |
| | 39,345 |
Multiline Retail - 2.1% |
Macy's, Inc. | 9,200,000 | | 217,488 |
Specialty Retail - 2.6% |
Best Buy Co., Inc. | 5,400,000 | | 232,092 |
TJX Companies, Inc. | 900,000 | | 41,301 |
| | 273,393 |
Textiles, Apparel & Luxury Goods - 1.5% |
Phillips-Van Heusen Corp. | 1,720,000 | | 105,505 |
VF Corp. | 600,000 | | 49,944 |
| | 155,449 |
TOTAL CONSUMER DISCRETIONARY | | 1,111,701 |
CONSUMER STAPLES - 9.9% |
Beverages - 5.1% |
Anheuser-Busch InBev SA NV | 4,938,240 | | 309,450 |
Coca-Cola Enterprises, Inc. | 1,751,800 | | 42,061 |
Constellation Brands, Inc. Class A (sub. vtg.) (a) | 5,315,577 | | 104,876 |
Dr Pepper Snapple Group, Inc. | 2,000,000 | | 73,100 |
| | 529,487 |
Food & Staples Retailing - 0.9% |
Wal-Mart Stores, Inc. | 1,800,000 | | 97,506 |
Household Products - 2.7% |
Kimberly-Clark Corp. | 1,500,000 | | 95,010 |
Procter & Gamble Co. | 2,900,000 | | 184,353 |
| | 279,363 |
Common Stocks - continued |
| Shares | | Value (000s) |
CONSUMER STAPLES - continued |
Tobacco - 1.2% |
British American Tobacco PLC sponsored ADR | 200,000 | | $ 15,246 |
Philip Morris International, Inc. | 2,000,000 | | 117,000 |
| | 132,246 |
TOTAL CONSUMER STAPLES | | 1,038,602 |
ENERGY - 11.1% |
Energy Equipment & Services - 0.6% |
Complete Production Services, Inc. (a) | 900,000 | | 21,087 |
Oil States International, Inc. (a) | 549,342 | | 28,082 |
Rowan Companies, Inc. (a) | 300,000 | | 9,870 |
| | 59,039 |
Oil, Gas & Consumable Fuels - 10.5% |
Chevron Corp. | 5,567,400 | | 459,923 |
Exxon Mobil Corp. | 4,129,780 | | 274,506 |
Holly Corp. | 300,000 | | 9,819 |
Marathon Oil Corp. | 8,800,000 | | 313,016 |
Sunoco, Inc. | 1,000,000 | | 37,470 |
| | 1,094,734 |
TOTAL ENERGY | | 1,153,773 |
FINANCIALS - 14.4% |
Capital Markets - 3.0% |
Goldman Sachs Group, Inc. | 1,950,000 | | 313,853 |
Commercial Banks - 1.2% |
Barclays PLC | 10,000,000 | | 43,939 |
Barclays PLC Sponsored ADR | 1,300,000 | | 22,945 |
HSBC Holdings PLC sponsored ADR | 200,000 | | 10,422 |
M&T Bank Corp. (d) | 700,000 | | 52,325 |
| | 129,631 |
Consumer Finance - 1.1% |
Capital One Financial Corp. | 3,100,000 | | 115,537 |
Diversified Financial Services - 4.9% |
Citigroup, Inc. (a) | 37,500,000 | | 156,375 |
JPMorgan Chase & Co. | 9,500,000 | | 357,485 |
| | 513,860 |
Insurance - 3.8% |
ACE Ltd. | 1,000,000 | | 59,420 |
Common Stocks - continued |
| Shares | | Value (000s) |
FINANCIALS - continued |
Insurance - continued |
AFLAC, Inc. | 1,000,000 | | $ 55,890 |
Allstate Corp. | 800,000 | | 24,392 |
Axis Capital Holdings Ltd. | 1,500,000 | | 51,015 |
MetLife, Inc. | 2,511,500 | | 101,289 |
Unum Group | 1,100,000 | | 24,662 |
XL Capital Ltd. Class A | 3,600,000 | | 76,140 |
| | 392,808 |
Real Estate Investment Trusts - 0.3% |
AvalonBay Communities, Inc. | 300,000 | | 31,893 |
Real Estate Management & Development - 0.1% |
CB Richard Ellis Group, Inc. Class A (a) | 500,000 | | 9,175 |
TOTAL FINANCIALS | | 1,506,757 |
HEALTH CARE - 11.5% |
Biotechnology - 3.4% |
Amgen, Inc. (a) | 2,274,000 | | 130,050 |
Biogen Idec, Inc. (a) | 1,000,000 | | 62,710 |
Cephalon, Inc. (a) | 2,298,000 | | 152,679 |
Gilead Sciences, Inc. (a) | 300,000 | | 11,901 |
| | 357,340 |
Health Care Equipment & Supplies - 0.2% |
Cooper Companies, Inc. | 500,000 | | 24,670 |
Health Care Providers & Services - 1.3% |
CIGNA Corp. | 579,200 | | 20,382 |
Humana, Inc. (a) | 1,870,000 | | 109,002 |
| | 129,384 |
Pharmaceuticals - 6.6% |
Impax Laboratories, Inc. (a) | 2,800,000 | | 52,752 |
Johnson & Johnson | 3,600,000 | | 229,212 |
Merck & Co., Inc. | 3,000,000 | | 108,840 |
Perrigo Co. | 940,100 | | 61,934 |
Pfizer, Inc. | 1,500,000 | | 26,100 |
Sanofi-Aventis | 2,000,000 | | 140,088 |
Teva Pharmaceutical Industries Ltd. sponsored ADR | 500,000 | | 25,950 |
Common Stocks - continued |
| Shares | | Value (000s) |
HEALTH CARE - continued |
Pharmaceuticals - continued |
Valeant Pharmaceuticals International, Inc. | 400,000 | | $ 11,068 |
Watson Pharmaceuticals, Inc. (a) | 600,000 | | 27,990 |
| | 683,934 |
TOTAL HEALTH CARE | | 1,195,328 |
INDUSTRIALS - 10.8% |
Aerospace & Defense - 1.0% |
United Technologies Corp. | 1,400,000 | | 104,678 |
Airlines - 0.8% |
Delta Air Lines, Inc. (a) | 2,000,000 | | 27,780 |
United Continental Holdings, Inc. (a) | 1,900,000 | | 55,176 |
| | 82,956 |
Building Products - 0.7% |
Owens Corning (a) | 2,594,667 | | 70,160 |
Commercial Services & Supplies - 0.1% |
Schawk, Inc. Class A | 700,000 | | 13,594 |
Construction & Engineering - 0.7% |
EMCOR Group, Inc. (a) | 400,000 | | 10,340 |
KBR, Inc. | 1,856,063 | | 47,144 |
URS Corp. (a) | 300,000 | | 11,679 |
| | 69,163 |
Electrical Equipment - 0.2% |
Regal-Beloit Corp. | 209,646 | | 12,099 |
Thomas & Betts Corp. (a) | 200,000 | | 8,710 |
| | 20,809 |
Industrial Conglomerates - 4.0% |
General Electric Co. | 15,200,000 | | 243,504 |
Siemens AG sponsored ADR (d) | 1,541,700 | | 176,232 |
| | 419,736 |
Machinery - 3.3% |
ArvinMeritor, Inc. (a) | 2,556,903 | | 42,393 |
Cummins, Inc. | 2,500,000 | | 220,250 |
Parker Hannifin Corp. | 200,000 | | 15,310 |
Timken Co. | 1,700,000 | | 70,414 |
| | 348,367 |
TOTAL INDUSTRIALS | | 1,129,463 |
Common Stocks - continued |
| Shares | | Value (000s) |
INFORMATION TECHNOLOGY - 19.7% |
Communications Equipment - 1.2% |
Cisco Systems, Inc. (a) | 4,200,000 | | $ 95,886 |
HTC Corp. | 1,478,000 | | 33,370 |
| | 129,256 |
Computers & Peripherals - 5.7% |
Apple, Inc. (a) | 200,000 | | 60,174 |
Hewlett-Packard Co. | 10,200,000 | | 429,012 |
SanDisk Corp. (a) | 2,794,861 | | 105,031 |
| | 594,217 |
Electronic Equipment & Components - 0.4% |
Jabil Circuit, Inc. | 2,100,000 | | 32,214 |
Vishay Intertechnology, Inc. (a) | 1,000,000 | | 11,300 |
| | 43,514 |
Internet Software & Services - 0.2% |
Baidu.com, Inc. sponsored ADR (a) | 100,000 | | 11,001 |
Digital River, Inc. (a) | 300,000 | | 11,178 |
| | 22,179 |
IT Services - 2.4% |
International Business Machines Corp. | 1,500,000 | | 215,400 |
VeriFone Holdings, Inc. (a) | 900,000 | | 30,447 |
| | 245,847 |
Office Electronics - 0.5% |
Xerox Corp. | 4,600,000 | | 53,820 |
Semiconductors & Semiconductor Equipment - 3.6% |
Intel Corp. | 5,300,000 | | 106,371 |
Micron Technology, Inc. (a) | 17,305,400 | | 143,116 |
Samsung Electronics Co. Ltd. | 182,977 | | 121,225 |
| | 370,712 |
Software - 5.7% |
Intuit, Inc. (a) | 1,100,000 | | 52,800 |
Microsoft Corp. | 19,200,000 | | 511,487 |
Red Hat, Inc. (a) | 700,000 | | 29,582 |
| | 593,869 |
TOTAL INFORMATION TECHNOLOGY | | 2,053,414 |
Common Stocks - continued |
| Shares | | Value (000s) |
MATERIALS - 3.8% |
Chemicals - 1.6% |
Ashland, Inc. | 2,846,495 | | $ 146,965 |
Kraton Performance Polymers, Inc. | 800,000 | | 25,968 |
| | 172,933 |
Metals & Mining - 2.2% |
Newmont Mining Corp. | 2,700,000 | | 164,349 |
Vale SA sponsored ADR | 1,900,000 | | 61,066 |
| | 225,415 |
TOTAL MATERIALS | | 398,348 |
TELECOMMUNICATION SERVICES - 3.3% |
Wireless Telecommunication Services - 3.3% |
MetroPCS Communications, Inc. (a) | 3,928,600 | | 40,897 |
Sprint Nextel Corp. (a) | 11,000,000 | | 45,320 |
Vodafone Group PLC sponsored ADR | 9,200,000 | | 253,092 |
| | 339,309 |
UTILITIES - 3.5% |
Independent Power Producers & Energy Traders - 2.4% |
AES Corp. (a) | 9,500,000 | | 113,430 |
NRG Energy, Inc. (a) | 6,780,000 | | 134,990 |
| | 248,420 |
Multi-Utilities - 1.1% |
Alliant Energy Corp. | 1,400,000 | | 51,142 |
CMS Energy Corp. | 3,700,000 | | 68,006 |
| | 119,148 |
TOTAL UTILITIES | | 367,568 |
TOTAL COMMON STOCKS (Cost $9,695,600) | 10,294,263 |
Money Market Funds - 2.3% |
| Shares | | Value (000s) |
Fidelity Cash Central Fund, 0.23% (b) | 188,062,876 | | $ 188,063 |
Fidelity Securities Lending Cash Central Fund, 0.24% (b)(c) | 54,588,088 | | 54,588 |
TOTAL MONEY MARKET FUNDS (Cost $242,651) | 242,651 |
TOTAL INVESTMENT PORTFOLIO - 100.9% (Cost $9,938,251) | | 10,536,914 |
NET OTHER ASSETS (LIABILITIES) - (0.9)% | | (94,471) |
NET ASSETS - 100% | $ 10,442,443 |
Legend |
(a) Non-income producing |
(b) Affiliated fund that is available only to investment companies and other accounts managed by Fidelity Investments. The rate quoted is the annualized seven-day yield of the fund at period end. A complete unaudited listing of the fund's holdings as of its most recent quarter end is available upon request. In addition, each Fidelity Central Fund's financial statements, which are not covered by the Fund's report of Independent Registered Public Accounting Firm, are available on the SEC's website or upon request. |
(c) Investment made with cash collateral received from securities on loan. |
(d) Security or a portion of the security is on loan at period end. |
Affiliated Central Funds |
Information regarding fiscal year to date income earned by the Fund from investments in Fidelity Central Funds is as follows: |
Fund | Income earned
(Amounts in
thousands) |
Fidelity Cash Central Fund | $ 240 |
Fidelity Securities Lending Cash Central Fund | 828 |
Total | $ 1,068 |
Other Affiliated Issuers |
An affiliated company is a company in which the Fund has ownership of at least 5% of the voting securities. Fiscal year to date transactions with companies which are or were affiliates are as follows: |
Affiliate
(Amounts in thousands) | Value, beginning of period | Purchases | Sales Proceeds | Dividend Income | Value,
end of
period |
Sybase, Inc. | $ 206,108 | $ 13,774 | $ 343,777 | $ - | $ - |
Total | $ 206,108 | $ 13,774 | $ 343,777 | $ - | $ - |
Other Information |
The following is a summary of the inputs used, as of October 31, 2010, involving the Fund's assets and liabilities carried at fair value. The inputs or methodology used for valuing securities may not be an indication of the risk associated with investing in those securities. For more information on valuation inputs, and their aggregation into the levels used in the table below, please refer to the Security Valuation section in the accompanying Notes to Financial Statements. |
Valuation Inputs at Reporting Date: |
Description
(Amounts in thousands) | Total | Level 1 | Level 2 | Level 3 |
Investments in Securities: | | | | |
Equities: | | | | |
Consumer Discretionary | $ 1,111,701 | $ 1,111,701 | $ - | $ - |
Consumer Staples | 1,038,602 | 1,038,602 | - | - |
Energy | 1,153,773 | 1,153,773 | - | - |
Financials | 1,506,757 | 1,462,818 | 43,939 | - |
Health Care | 1,195,328 | 1,055,240 | 140,088 | - |
Industrials | 1,129,463 | 1,129,463 | - | - |
Information Technology | 2,053,414 | 2,053,414 | - | - |
Materials | 398,348 | 398,348 | - | - |
Telecommunication Services | 339,309 | 339,309 | - | - |
Utilities | 367,568 | 367,568 | - | - |
Money Market Funds | 242,651 | 242,651 | - | - |
Total Investments in Securities: | $ 10,536,914 | $ 10,352,887 | $ 184,027 | $ - |
Distribution of investments by country of issue, as a percentage of total net assets, is as follows: (Unaudited) |
United States of America | 86.4% |
United Kingdom | 3.2% |
Belgium | 3.0% |
Germany | 1.7% |
France | 1.3% |
Korea (South) | 1.2% |
Others (Individually Less Than 1%) | 3.2% |
| 100.0% |
Income Tax Information |
At October 31, 2010, the Fund had a capital loss carryforward of approximately $2,872,513,000 of which $874,329,000 and $1,998,184,000 will expire on October 31, 2016 and 2017, respectively. Capital loss carryforwards are only available to offset future capital gains of the Fund to the extent provided by regulations and may be limited. |
See accompanying notes which are an integral part of the financial statements.
Annual Report
Statement of Assets and Liabilities
Amounts in thousands (except per-share amounts) | October 31, 2010 |
| | |
Assets | | |
Investment in securities, at value (including securities loaned of $53,509) - See accompanying schedule: Unaffiliated issuers (cost $9,695,600) | $ 10,294,263 | |
Fidelity Central Funds (cost $242,651) | 242,651 | |
Total Investments (cost $9,938,251) | | $ 10,536,914 |
Receivable for investments sold | | 330,086 |
Receivable for fund shares sold | | 10,249 |
Dividends receivable | | 3,052 |
Distributions receivable from Fidelity Central Funds | | 48 |
Other receivables | | 605 |
Total assets | | 10,880,954 |
| | |
Liabilities | | |
Payable for investments purchased | $ 353,087 | |
Payable for fund shares redeemed | 25,544 | |
Accrued management fee | 3,188 | |
Other affiliated payables | 1,780 | |
Other payables and accrued expenses | 324 | |
Collateral on securities loaned, at value | 54,588 | |
Total liabilities | | 438,511 |
| | |
Net Assets | | $ 10,442,443 |
Net Assets consist of: | | |
Paid in capital | | $ 12,699,786 |
Undistributed net investment income | | 76,361 |
Accumulated undistributed net realized gain (loss) on investments and foreign currency transactions | | (2,932,367) |
Net unrealized appreciation (depreciation) on investments | | 598,663 |
Net Assets | | $ 10,442,443 |
See accompanying notes which are an integral part of the financial statements.
Annual Report
Financial Statements - continued
Statement of Assets and Liabilities - continued
Amounts in thousands (except per-share amounts) | October 31, 2010 |
| | |
Disciplined Equity:
Net Asset Value, offering price and redemption price
per share ($8,942,518 ÷ 412,743 shares) | | $ 21.67 |
| | |
Class K:
Net Asset Value, offering price and redemption price per share ($141,005 ÷ 6,502 shares) | | $ 21.69 |
| | |
Class F:
Net Asset Value, offering price and redemption price per share ($1,358,920 ÷ 62,664 shares) | | $ 21.69 |
See accompanying notes which are an integral part of the financial statements.
Annual Report
Statement of Operations
Amounts in thousands | Year ended October 31, 2010 |
| | |
Investment Income | | |
Dividends | | $ 164,701 |
Interest | | 10 |
Income from Fidelity Central Funds | | 1,068 |
Total income | | 165,779 |
| | |
Expenses | | |
Management fee
Basic fee | $ 60,321 | |
Performance adjustment | (11,856) | |
Transfer agent fees | 22,921 | |
Accounting and security lending fees | 1,382 | |
Custodian fees and expenses | 320 | |
Independent trustees' compensation | 62 | |
Registration fees | 53 | |
Audit | 83 | |
Legal | 58 | |
Interest | 5 | |
Miscellaneous | 153 | |
Total expenses before reductions | 73,502 | |
Expense reductions | (1,693) | 71,809 |
Net investment income (loss) | | 93,970 |
Realized and Unrealized Gain (Loss) Net realized gain (loss) on: | | |
Investment securities: | | |
Unaffiliated issuers | 867,392 | |
Other affiliated issuers | 176,333 | |
Foreign currency transactions | 142 | |
Futures contracts | 5,363 | |
Capital gains distributions from Fidelity Central Funds | 6 | |
Total net realized gain (loss) | | 1,049,236 |
Change in net unrealized appreciation (depreciation) on: Investment securities | 493 | |
Futures contracts | 552 | |
Total change in net unrealized appreciation (depreciation) | | 1,045 |
Net gain (loss) | | 1,050,281 |
Net increase (decrease) in net assets resulting from operations | | $ 1,144,251 |
See accompanying notes which are an integral part of the financial statements.
Annual Report
Financial Statements - continued
Statement of Changes in Net Assets
Amounts in thousands | Year ended
October 31,
2010 | Year ended
October 31,
2009 |
Increase (Decrease) in Net Assets | | |
Operations | | |
Net investment income (loss) | $ 93,970 | $ 129,999 |
Net realized gain (loss) | 1,049,236 | (1,958,006) |
Change in net unrealized appreciation (depreciation) | 1,045 | 2,561,703 |
Net increase (decrease) in net assets resulting
from operations | 1,144,251 | 733,696 |
Distributions to shareholders from net investment income | (121,330) | (134,965) |
Share transactions - net increase (decrease) | (1,369,605) | 337,423 |
Total increase (decrease) in net assets | (346,684) | 936,154 |
| | |
Net Assets | | |
Beginning of period | 10,789,127 | 9,852,973 |
End of period (including undistributed net investment income of $76,361 and undistributed net investment income of $98,538, respectively) | $ 10,442,443 | $ 10,789,127 |
See accompanying notes which are an integral part of the financial statements.
Annual Report
Financial Highlights - Disciplined Equity
Years ended October 31, | 2010 | 2009 | 2008 | 2007 | 2006 |
Selected Per-Share Data | | | | | |
Net asset value, beginning of period | $ 19.72 | $ 18.78 | $ 33.37 | $ 30.83 | $ 26.71 |
Income from Investment Operations | | | | | |
Net investment income (loss) B | .18 | .24 | .29 | .27 | .22 |
Net realized and unrealized gain (loss) | 1.99 | .96 | (12.19) | 4.95 | 4.08 |
Total from investment operations | 2.17 | 1.20 | (11.90) | 5.22 | 4.30 |
Distributions from net investment income | (.22) | (.26) | (.26) | (.19) | (.18) |
Distributions from net realized gain | - | - | (2.43) | (2.49) | - |
Total distributions | (.22) | (.26) | (2.69) | (2.68) | (.18) |
Net asset value, end of period | $ 21.67 | $ 19.72 | $ 18.78 | $ 33.37 | $ 30.83 |
Total Return A | 11.05% | 6.64% | (38.68)% | 18.42% | 16.16% |
Ratios to Average Net Assets C, E | | | | | |
Expenses before reductions | .70% | .84% | .87% | .91% | .92% |
Expenses net of fee waivers,
if any | .70% | .84% | .87% | .91% | .92% |
Expenses net of all reductions | .68% | .83% | .87% | .90% | .91% |
Net investment income (loss) | .85% | 1.37% | 1.10% | .88% | .76% |
Supplemental Data | | | | | |
Net assets, end of period
(in millions) | $ 8,943 | $ 10,530 | $ 9,804 | $ 11,482 | $ 7,694 |
Portfolio turnover rate D | 146% | 200% | 186% | 152% | 98% |
A Total returns would have been lower had certain expenses not been reduced during the periods shown.
B Calculated based on average shares outstanding during the period.
C Fees and expenses of the underlying Fidelity Central Funds are not included in the Fund's expense ratio. The Fund indirectly bears its proportionate share of the expenses of any underlying Fidelity Central Funds.
D Amount does not include the portfolio activity of any underlying Fidelity Central Funds.
E Expense ratios reflect operating expenses of the class. Expenses before reductions do not reflect amounts reimbursed by the investment adviser or reductions from brokerage service arrangements or reductions from other expense offset arrangements and do not represent the amount paid by the class during periods when reimbursements or reductions occur. Expenses net of fee waivers reflect expenses after reimbursement by the investment adviser but prior to reductions from brokerage service arrangements or other expense offset arrangements. Expenses net of all reductions represent the net expenses paid by the class.
See accompanying notes which are an integral part of the financial statements.
Annual Report
Financial Highlights - Class K
Years ended October 31, | 2010 | 2009 | 2008 G |
Selected Per-Share Data | | | |
Net asset value, beginning of period | $ 19.74 | $ 18.79 | $ 27.38 |
Income from Investment Operations | | | |
Net investment income (loss) D | .22 | .28 | .12 |
Net realized and unrealized gain (loss) | 1.99 | .96 | (8.71) |
Total from investment operations | 2.21 | 1.24 | (8.59) |
Distributions from net investment income | (.26) | (.29) | - |
Net asset value, end of period | $ 21.69 | $ 19.74 | $ 18.79 |
Total Return B, C | 11.25% | 6.92% | (31.37)% |
Ratios to Average Net Assets E, H | | | |
Expenses before reductions | .52% | .61% | .71% A |
Expenses net of fee waivers, if any | .52% | .61% | .71% A |
Expenses net of all reductions | .51% | .60% | .71% A |
Net investment income (loss) | 1.03% | 1.59% | 1.30% A |
Supplemental Data | | | |
Net assets, end of period (in millions) | $ 141 | $ 184 | $ 49 |
Portfolio turnover rate F | 146% | 200% | 186% |
A Annualized
B Total returns for periods of less than one year are not annualized.
C Total returns would have been lower had certain expenses not been reduced during the periods shown.
D Calculated based on average shares outstanding during the period.
E Fees and expenses of the underlying Fidelity Central Funds are not included in the Fund's expense ratio. The Fund indirectly bears its proportionate share of the expenses of any underlying Fidelity Central Funds.
F Amount does not include the portfolio activity of any underlying Fidelity Central Funds.
G For the period May 9, 2008 (commencement of sale of shares) to October 31, 2008.
H Expense ratios reflect operating expenses of the class. Expenses before reductions do not reflect amounts reimbursed by the investment adviser or reductions from brokerage service arrangements or reductions from other expense offset arrangements and do not represent the amount paid by the class during periods when reimbursements or reductions occur. Expense ratios before reductions for start-up periods may not be representative of longer-term operating periods. Expenses net of fee waivers reflect expenses after reimbursement by the investment adviser but prior to reductions from brokerage service arrangements or other expense offset arrangements. Expenses net of all reductions represent the net expenses paid by the class.
See accompanying notes which are an integral part of the financial statements.
Annual Report
Financial Highlights - Class F
Years ended October 31, | 2010 | 2009 G |
Selected Per-Share Data | | |
Net asset value, beginning of period | $ 19.74 | $ 17.52 |
Income from Investment Operations | | |
Net investment income (loss) D | .22 | .02 |
Net realized and unrealized gain (loss) | 2.00 | 2.20 |
Total from investment operations | 2.22 | 2.22 |
Distributions from net investment income | (.27) | - |
Net asset value, end of period | $ 21.69 | $ 19.74 |
Total Return B, C | 11.31% | 12.67% |
Ratios to Average Net Assets E, H | | |
Expenses before reductions | .47% | .50% A |
Expenses net of fee waivers, if any | .47% | .50% A |
Expenses net of all reductions | .45% | .49% A |
Net investment income (loss) | 1.08% | .25% A |
Supplemental Data | | |
Net assets, end of period (in millions) | $ 1,359 | $ 75 |
Portfolio turnover rate F | 146% | 200% |
A Annualized
B Total returns for periods of less than one year are not annualized.
C Total returns would have been lower had certain expenses not been reduced during the periods shown.
D Calculated based on average shares outstanding during the period.
E Fees and expenses of the underlying Fidelity Central Funds are not included in the Fund's expense ratio. The Fund indirectly bears its proportionate share of the expenses of any underlying Fidelity Central Funds.
F Amount does not include the portfolio activity of any underlying Fidelity Central Funds.
G For the period June 26, 2009 (commencement of sale of shares) to October 31, 2009.
H Expense ratios reflect operating expenses of the class. Expenses before reductions do not reflect amounts reimbursed by the investment adviser or reductions from brokerage service arrangements or reductions from other expense offset arrangements and do not represent the amount paid by the class during periods when reimbursements or reductions occur. Expense ratios before reductions for start-up periods may not be representative of longer-term operating periods. Expenses net of fee waivers reflect expenses after reimbursement by the investment adviser but prior to reductions from brokerage service arrangements or other expense offset arrangements. Expenses net of all reductions represent the net expenses paid by the class.
See accompanying notes which are an integral part of the financial statements.
Annual Report
Notes to Financial Statements
For the period ended October 31, 2010
(Amounts in thousands except ratios)
1. Organization.
Fidelity Disciplined Equity Fund (the Fund) is a fund of Fidelity Capital Trust (the Trust) and is authorized to issue an unlimited number of shares. The Trust is registered under the Investment Company Act of 1940, as amended (the 1940 Act), as an open-end management investment company organized as a Massachusetts business trust. The Fund offers Disciplined Equity, Class K and Class F shares, each of which has equal rights as to assets and voting privileges. Each class has exclusive voting rights with respect to matters that affect that class. Class F shares of the Fund are only available for purchase by mutual funds for which Fidelity Management & Research Company (FMR) or an affiliate serves as investment manager. Investment income, realized and unrealized capital gains and losses, the common expenses of the Fund, and certain fund-level expense reductions, if any, are allocated on a pro-rata basis to each class based on the relative net assets of each class to the total net assets of the Fund. Each class differs with respect to transfer agent and distribution and service plan fees incurred. Certain expense reductions also differ by class.
2. Investments in Fidelity Central Funds.
The Fund may invest in Fidelity Central Funds, which are open-end investment companies available only to other investment companies and accounts managed by FMR and its affiliates. The Fund's Schedule of Investments lists each of the Fidelity Central Funds held as of period end, if any, as an investment of the Fund, but does not include the underlying holdings of each Fidelity Central Fund. As an Investing Fund, the Fund indirectly bears its proportionate share of the expenses of the underlying Fidelity Central Funds.
The Money Market Central Funds seek preservation of capital and current income and are managed by Fidelity Investments Money Management, Inc. (FIMM), an affiliate of FMR.
A complete unaudited list of holdings for each Fidelity Central Fund is available upon request or at the Securities and Exchange Commission (the SEC) web site at www.sec.gov. In addition, the financial statements of the Fidelity Central Funds, which are not covered by the Fund's Report of Independent Registered Public Accounting Firm, are available on the SEC web site or upon request.
3. Significant Accounting Policies.
The financial statements have been prepared in conformity with accounting principles generally accepted in the United States of America (GAAP), which require management to make certain estimates and assumptions at the date of the financial statements. Actual results could differ from those estimates. The following summarizes the significant accounting policies of the Fund:
Annual Report
Notes to Financial Statements - continued
(Amounts in thousands except ratios)
3. Significant Accounting Policies - continued
Security Valuation. Investments are valued as of 4:00 p.m. Eastern time on the last calendar day of the period. The Fund uses independent pricing services approved by the Board of Trustees to value its investments. When current market prices or quotations are not readily available or reliable, valuations may be determined in good faith in accordance with procedures adopted by the Board of Trustees. Factors used in determining value may include market or security specific events. The frequency with which these procedures are used cannot be predicted and they may be utilized to a significant extent. The value used for net asset value (NAV) calculation under these procedures may differ from published prices for the same securities.
The Fund categorizes the inputs to valuation techniques used to value its investments into a disclosure hierarchy consisting of three levels as shown below.
Level 1 - quoted prices in active markets for identical investments
Level 2 - other significant observable inputs (including quoted prices for similar investments, interest rates, prepayment speeds, etc.)
Level 3 - unobservable inputs (including the fund's own assumptions based on the best information available)
Changes in valuation techniques may result in transfers in or out of an assigned level within the disclosure hierarchy. The aggregate value of investments by input level, as of October 31, 2010, is included at the end of the Fund's Schedule of Investments. Valuation techniques used to value the Fund's investments by major category are as follows.
Equity securities, including restricted securities, for which market quotations are readily available, are valued at the last reported sale price or official closing price as reported by an independent pricing service on the primary market or exchange on which they are traded and are categorized as Level 1 in the hierarchy. In the event there were no sales during the day or closing prices are not available, securities are valued at the last quoted bid price or may be valued using the last available price and are generally categorized as Level 2 in the hierarchy. For foreign equity securities, when significant market or security specific events arise, comparisons to the valuation of American Depositary Receipts (ADRs), futures contracts, Exchange-traded funds (ETFs) and certain indexes as well as quoted prices for similar securities are used and are categorized as Level 2 in the hierarchy in these circumstances. Utilizing these techniques may result in transfers between Level 1 and Level 2. For restricted equity securities and private placements where observable inputs are limited, assumptions about market activity and risk are used and are categorized as Level 3 in the hierarchy.
Annual Report
3. Significant Accounting Policies - continued
Security Valuation - continued
Investments in open-end mutual funds, including the Fidelity Central Funds, are valued at their closing net asset value each business day and are categorized as Level 1 in the hierarchy. Short-term securities with remaining maturities of sixty days or less for which quotations are not readily available are valued at amortized cost, which approximates fair value and are categorized as Level 2 in the hierarchy.
Foreign Currency. The Fund uses foreign currency contracts to facilitate transactions in foreign-denominated securities. Gains and losses from these transactions may arise from changes in the value of the foreign currency or if the counterparties do not perform under the contracts' terms.
Foreign-denominated assets, including investment securities, and liabilities are translated into U.S. dollars at the exchange rate at period end. Purchases and sales of investment securities, income and dividends received and expenses denominated in foreign currencies are translated into U.S. dollars at the exchange rate in effect on the transaction date.
The effects of exchange rate fluctuations on investments are included with the net realized and unrealized gain (loss) on investment securities. Other foreign currency transactions resulting in realized and unrealized gain (loss) are disclosed separately.
Investment Transactions and Income. For financial reporting purposes, the Fund's investment holdings and NAV include trades executed through the end of the last business day of the period. The NAV per share for processing shareholder transactions is calculated as of the close of business of the New York Stock Exchange (NYSE), normally 4:00 p.m. Eastern time and includes trades executed through the end of the prior business day. Gains and losses on securities sold are determined on the basis of identified cost and may include proceeds received from litigation. Dividend income is recorded on the ex-dividend date, except for certain dividends from foreign securities where the ex-dividend date may have passed, which are recorded as soon as the Fund is informed of the ex-dividend date. Non-cash dividends included in dividend income, if any, are recorded at the fair market value of the securities received. Distributions received on securities that represent a return of capital or capital gain are recorded as a reduction of cost of investments and/or as a realized gain. The Fund estimates the components of distributions received that may be considered return of capital distributions or capital gain distributions. Interest income and distributions from the Fidelity Central Funds are accrued as earned. Interest income includes coupon interest and amortization of premium and accretion of discount on debt securities. Investment income is recorded net of foreign taxes withheld where recovery of such taxes is uncertain.
Annual Report
Notes to Financial Statements - continued
(Amounts in thousands except ratios)
3. Significant Accounting Policies - continued
Expenses. Most expenses of the Trust can be directly attributed to a fund. Expenses which cannot be directly attributed are apportioned amongst each fund in the Trust. Expense estimates are accrued in the period to which they relate and adjustments are made when actual amounts are known.
Deferred Trustee Compensation. Under a Deferred Compensation Plan (the Plan), independent Trustees may elect to defer receipt of a portion of their annual compensation. Deferred amounts are invested in a cross-section of Fidelity funds, are marked-to-market and remain in the Fund until distributed in accordance with the Plan. The investment of deferred amounts and the offsetting payable to the Trustees are included in the accompanying Statement of Assets and Liabilities.
Income Tax Information and Distributions to Shareholders. Each year the Fund intends to qualify as a regulated investment company, including distributing substantially all of its taxable income and realized gains under Subchapter M of the Internal Revenue Code and filing its U.S. federal tax return. As a result, no provision for income taxes is required. As of October 31, 2010, the Fund did not have any unrecognized tax benefits in the accompanying financial statements. A fund's federal tax return is subject to examination by the Internal Revenue Service (IRS) for a period of three years. Foreign taxes are provided for based on the Fund's understanding of the tax rules and rates that exist in the foreign markets in which it invests.
Distributions are declared and recorded on the ex-dividend date. Income dividends and capital gain distributions are declared separately for each class. Income and capital gain distributions are determined in accordance with income tax regulations, which may differ from GAAP.
Capital accounts within the financial statements are adjusted for permanent book-tax differences. These adjustments have no impact on net assets or the results of operations. Temporary book-tax differences will reverse in a subsequent period.
Book-tax differences are primarily due to the short-term gain distributions from the Fidelity Central Funds, futures transactions, foreign currency transactions, market discount, partnerships, deferred trustees compensation, capital loss carryforwards and losses deferred due to wash sales.
The federal tax cost of investment securities and unrealized appreciation (depreciation) as of period end were as follows:
Gross unrealized appreciation | $ 880,838 |
Gross unrealized depreciation | (342,029) |
Net unrealized appreciation (depreciation) | $ 538,809 |
| |
Tax Cost | $ 9,998,105 |
Annual Report
3. Significant Accounting Policies - continued
Income Tax Information and Distributions to Shareholders - continued
The tax-based components of distributable earnings as of period end were as follows:
Undistributed ordinary income | $ 76,550 |
Capital loss carryforward | $ (2,872,513) |
Net unrealized appreciation (depreciation) | $ 538,809 |
The tax character of distributions paid was as follows:
| October 31, 2010 | October 31, 2009 |
Ordinary Income | $ 121,330 | $ 134,965 |
4. Derivative Instruments.
Risk Exposures and the Use of Derivative Instruments. The Fund uses derivative instruments (derivatives), including futures contracts, in order to meet its investment objectives. The strategy is to use derivatives to increase returns and to manage exposure to certain risks as defined below. The success of any strategy involving derivatives depends on analysis of numerous economic factors, and if the strategies for investment do not work as intended, the Fund may not achieve its objectives.
The Fund's use of derivatives may increase or decrease its exposure to the following risk:
Equity Risk | Equity risk relates to the fluctuations in the value of financial instruments as a result of changes in market prices (other than those arising from interest rate risk or foreign exchange risk), whether caused by factors specific to an individual investment, its issuer, or all factors affecting all instruments traded in a market or market segment. |
The Fund is also exposed to additional risks from investing in derivatives, such as liquidity risk and counterparty credit risk. Liquidity risk is the risk that the Fund will be unable to sell the derivative in the open market in a timely manner. Counterparty credit risk is the risk that the counterparty will not be able to fulfill its obligation to the Fund. The Fund's maximum risk of loss from counterparty credit risk is generally the aggregate unrealized appreciation and unpaid counterparty fees in excess of any collateral pledged by the counterparty to the Fund. Counterparty risk related to exchange-traded futures contracts is minimal because of the protection provided by the exchange on which they trade. Risk of loss may exceed the amounts recognized in the Statement of Assets and Liabilities.
Annual Report
Notes to Financial Statements - continued
(Amounts in thousands except ratios)
4. Derivative Instruments - continued
Futures Contracts. A futures contract is an agreement between two parties to buy or sell a specified underlying instrument for a fixed price at a specified future date. The Fund uses futures contracts to manage its exposure to the stock market.
Upon entering into a futures contract, a fund is required to deposit either cash or securities (initial margin) with a clearing broker in an amount equal to a certain percentage of the face value of the contract. Futures contracts are marked-to-market daily and subsequent payments (variation margin) are made or received by a fund depending on the daily fluctuations in the value of the futures contracts and are recorded as unrealized appreciation or (depreciation). Realized gain or (loss) is recorded upon the expiration or closing of a futures contract.
The underlying face amount at value of open futures contracts at period end, if any, is shown in the Schedule of Investments under the caption "Futures Contracts." This amount reflects each contract's exposure to the underlying instrument at period end. Securities deposited to meet initial margin requirements are identified in the Schedule of Investments. The receivable and/or payable for the variation margin are reflected in the Statement of Assets and Liabilities.
Certain risks may arise upon entering into futures contracts, including the risk that an illiquid market may limit the ability to close out a futures contract prior to settlement date.
During the period the Fund recognized net realized gain (loss) of $5,363 and a change in net unrealized appreciation (depreciation) of $552 related to its investment in futures contracts. These amounts are included in the Statement of Operations.
5. Purchases and Sales of Investments.
Purchases and sales of securities, other than short-term securities, aggregated $15,327,643 and $16,802,758, respectively.
6. Fees and Other Transactions with Affiliates.
Management Fee. FMR and its affiliates provide the Fund with investment management related services for which the Fund pays a monthly management fee. The management fee is the sum of an individual fund fee rate that is based on an annual rate of .30% of the Fund's average net assets and a group fee rate that averaged .26% during the period. The group fee rate is based upon the average net assets of all the mutual funds advised by FMR. The group fee rate decreases as assets under management increase and increases as assets under management decrease. In addition, the management fee is subject to a performance adjustment (up to a maximum of ± .20% of the Fund's average net assets over a 36 month performance period). The upward or downward adjustment to
Annual Report
6. Fees and Other Transactions with Affiliates - continued
Management Fee - continued
the management fee is based on the relative investment performance of Disciplined Equity as compared to an appropriate benchmark index. For the period, the total annual management fee rate, including the performance adjustment, was .45% of the Fund's average net assets.
Transfer Agent Fees. Fidelity Investments Institutional Operations Company, Inc. (FIIOC), an affiliate of FMR, is the transfer, dividend disbursing and shareholder servicing agent for each class of the Fund. FIIOC receives account fees and asset-based fees that vary according to the account size and type of account of the shareholders of Disciplined Equity. FIIOC receives an asset-based fee of Class K's average net assets. FIIOC receives no fees for providing transfer agency services to Class F. FIIOC pays for typesetting, printing and mailing of shareholder reports, except proxy statements. For the period, transfer agent fees for each class were as follows:
| Amount | % of
Average
Net Assets |
Disciplined Equity | $ 22,818 | .23 |
Class K | 103 | .05 |
| $ 22,921 | |
Accounting and Security Lending Fees. Fidelity Service Company, Inc. (FSC), an affiliate of FMR, maintains the Fund's accounting records. The accounting fee is based on the level of average net assets for the month. Under a separate contract, FSC administers the security lending program. The security lending fee is based on the number and duration of lending transactions.
Brokerage Commissions. The Fund placed a portion of its portfolio transactions with brokerage firms which are affiliates of the investment adviser. The commissions paid to these affiliated firms were $244 for the period.
Interfund Lending Program. Pursuant to an Exemptive Order issued by the SEC, the Fund, along with other registered investment companies having management contracts with FMR, may participate in an interfund lending program. This program provides an alternative credit facility allowing the funds to borrow from, or lend money to, other participating affiliated funds. At period end, there were no interfund loans outstanding. The Fund's activity in this program during the period for which loans were outstanding was as follows:
Borrower or Lender | Average Daily Loan Balance | Weighted Average Interest Rate | Interest Expense |
Borrower | $ 23,957 | .43% | $ 5 |
Annual Report
Notes to Financial Statements - continued
(Amounts in thousands except ratios)
7. Committed Line of Credit.
The Fund participates with other funds managed by FMR or an affiliate in a $3.75 billion credit facility (the "line of credit") to be utilized for temporary or emergency purposes to fund shareholder redemptions or for other short-term liquidity purposes. The Fund has agreed to pay commitment fees on its pro-rata portion of the line of credit, which amounted to $43 and is reflected in Miscellaneous expenses on the Statement of Operations. During the period, there were no borrowings on this line of credit.
8. Security Lending.
The Fund lends portfolio securities through a lending agent from time to time in order to earn additional income. The lending agent may loan securities to certain qualified borrowers, including Fidelity Capital Markets (FCM), a broker-dealer affiliated with the Fund. On the settlement date of the loan, the Fund receives collateral (in the form of U.S. Treasury obligations, letters of credit and/or cash) against the loaned securities and maintains collateral in an amount not less than 100% of the market value of the loaned securities during the period of the loan. The market value of the loaned securities is determined at the close of business of the Fund and any additional required collateral is delivered to the Fund on the next business day. If the borrower defaults on its obligation to return the securities loaned because of insolvency or other reasons, a fund could experience delays and costs in recovering the securities loaned or in gaining access to the collateral. Any cash collateral received is invested in the Fidelity Securities Lending Cash Central Fund. The value of loaned securities and cash collateral at period end are disclosed on the Fund's Statement of Assets and Liabilities. Security lending income represents the income earned on investing cash collateral, less rebates paid to borrowers and lending agent fees associated with the loan, plus any premium payments received for lending certain types of securities. Security lending income is presented in the Statement of Operations as a component of income from Fidelity Central Funds. Total security lending income during the period amounted to $828. During the period, there were no securities loaned to FCM.
9. Expense Reductions.
Many of the brokers with whom FMR places trades on behalf of the Fund provided services to the Fund in addition to trade execution. These services included payments of certain expenses on behalf of the Fund totaling $1,693 for the period.
Annual Report
10. Distributions to Shareholders.
Distributions to shareholders of each class were as follows:
Years ended October 31, | 2010 | 2009A |
From net investment income | | |
Disciplined Equity | $ 116,715 | $ 132,354 |
Class K | 2,464 | 2,611 |
Class F | 2,151 | - |
Total | $ 121,330 | $ 134,965 |
A Distributions for Class F are for the period June 26, 2009 (commencement of sale of shares) to October 31, 2009.
11. Share Transactions.
Transactions for each class of shares were as follows:
| Shares | Dollars |
Years ended October 31, | 2010 | 2009 A, B | 2010 | 2009 A, B |
Disciplined Equity | | | | |
Shares sold | 48,761 | 80,765 | $ 1,024,807 | $ 1,370,832 |
Conversion to Class K | - | (7,396) | - | (131,798) |
Reinvestment of distributions | 5,559 | 7,952 | 115,802 | 131,216 |
Shares redeemed | (175,504) | (69,527) | (3,680,202) | (1,229,222) |
Net increase (decrease) | (121,184) | 11,794 | $ (2,539,593) | $ 141,028 |
Class K | | | | |
Shares sold | 5,579 | 2,494 | $ 117,922 | $ 42,351 |
Conversion from Disciplined Equity | - | 7,392 | - | 131,798 |
Reinvestment of distributions | 118 | 158 | 2,464 | 2,611 |
Shares redeemed | (8,493) | (3,351) | (175,735) | (59,298) |
Net increase (decrease) | (2,796) | 6,693 | $ (55,349) | $ 117,462 |
Class F | | | | |
Shares sold | 65,890 | 3,867 | $ 1,373,135 | $ 79,938 |
Reinvestment of distributions | 103 | - | 2,151 | - |
Shares redeemed | (7,147) | (49) | (149,949) | (1,005) |
Net increase (decrease) | 58,846 | 3,818 | $ 1,225,337 | $ 78,933 |
A Share transactions for Class F are for the period June 26, 2009 (commencement of sale of shares) to October 31, 2009.
B Conversion transactions for Class K and Disciplined Equity are presented for the period November 1, 2008 through August 31, 2009.
Annual Report
Notes to Financial Statements - continued
(Amounts in thousands except ratios)
12. Other.
The Fund's organizational documents provide former and current trustees and officers with a limited indemnification against liabilities arising in connection with the performance of their duties to the Fund. In the normal course of business, the Fund may also enter into contracts that provide general indemnifications. The Fund's maximum exposure under these arrangements is unknown as this would be dependent on future claims that may be made against the Fund. The risk of material loss from such claims is considered remote.
At the end of the period, Fidelity Freedom 2020 and Fidelity Freedom 2030 were the owners of record of approximately 13% and 12%, respectively, of the total outstanding shares of the Fund. The Fidelity Freedom and Freedom K Funds were the owners of record, in the aggregate, of approximately 74% of the total outstanding shares of the Fund.
Annual Report
To the Trustees of Fidelity Capital Trust and the Shareholders of Fidelity Disciplined Equity Fund:
In our opinion, the accompanying statement of assets and liabilities, including the schedule of investments, and the related statements of operations and of changes in net assets and the financial highlights present fairly, in all material respects, the financial position of Fidelity Disciplined Equity Fund (a fund of Fidelity Capital Trust) at October 31, 2010, the results of its operations for the year then ended, the changes in its net assets for each of the two years in the period then ended and the financial highlights for each of the periods indicated, in conformity with accounting principles generally accepted in the United States of America. These financial statements and financial highlights (hereafter referred to as "financial statements") are the responsibility of the Fidelity Disciplined Equity Fund's management. Our responsibility is to express an opinion on these financial statements based on our audits. We conducted our audits of these financial statements in accordance with the standards of the Public Company Accounting Oversight Board (United States). Those standards require that we plan and perform the audit to obtain reasonable assurance about whether the financial statements are free of material misstatement. An audit includes examining, on a test basis, evidence supporting the amounts and disclosures in the financial statements, assessing the accounting principles used and significant estimates made by management, and evaluating the overall financial statement presentation. We believe that our audits, which included confirmation of securities at October 31, 2010 by correspondence with the custodian and brokers, provide a reasonable basis for our opinion.
/s/ PricewaterhouseCoopers LLP
PricewaterhouseCoopers LLP
Boston, Massachusetts
December 14, 2010
Annual Report
The Trustees Member of the Advisory Board, and executive officers of the trust and fund, as applicable, are listed below. The Board of Trustees governs the fund and is responsible for protecting the interests of shareholders. The Trustees are experienced executives who meet periodically throughout the year to oversee the fund's activities, review contractual arrangements with companies that provide services to the fund, oversee management of the risks associated with such activities and contractual arrangements, and review the fund's performance. Except for James C. Curvey, each of the Trustees oversees 221 funds advised by FMR or an affiliate. Mr. Curvey oversees 410 funds advised by FMR or an affiliate.
The Trustees hold office without limit in time except that (a) any Trustee may resign; (b) any Trustee may be removed by written instrument, signed by at least two-thirds of the number of Trustees prior to such removal; (c) any Trustee who requests to be retired or who has become incapacitated by illness or injury may be retired by written instrument signed by a majority of the other Trustees; and (d) any Trustee may be removed at any special meeting of shareholders by a two-thirds vote of the outstanding voting securities of the trust. Each Trustee who is not an interested person (as defined in the 1940 Act) (Independent Trustee), shall retire not later than the last day of the calendar year in which his or her 72nd birthday occurs. The Independent Trustees may waive this mandatory retirement age policy with respect to individual Trustees. The executive officers and Advisory Board Member hold office without limit in time, except that any officer and Advisory Board Member may resign or may be removed by a vote of a majority of the Trustees at any regular meeting or any special meeting of the Trustees. Except as indicated, each individual has held the office shown or other offices in the same company for the past five years.
Experience, Skills, Attributes, and Qualifications of the Fund's Trustees. The Governance and Nominating Committee has adopted a statement of policy that describes the experience, qualifications, attributes, and skills that are necessary and desirable for potential Independent Trustee candidates (Statement of Policy). The Board believes that each Trustee satisfied at the time he or she was initially elected or appointed a Trustee, and continues to satisfy, the standards contemplated by the Statement of Policy. The Governance and Nominating Committee also engages professional search firms to help identify potential Independent Trustee candidates who have the experience, qualifications, attributes, and skills consistent with the Statement of Policy. From time to time, additional criteria based on the composition and skills of the current Independent Trustees, as well as experience or skills that may be appropriate in light of future changes to board composition, business conditions, and regulatory or other developments, have also been considered by the professional search firms and the Governance and Nominating Committee. In addition, the Board takes into account the Trustees' commitment and participation in Board and committee meetings, as well as their leadership of standing and ad hoc committees throughout their tenure.
In determining that a particular Trustee was and continues to be qualified to serve as a Trustee, the Board has considered a variety of criteria, none of which, in isolation, was controlling. The Board believes that, collectively, the Trustees have balanced and diverse experience, qualifications, attributes, and skills, which allow the Board to operate effectively in governing the fund and protecting the interests of shareholders. Information about the specific experience, skills, attributes, and qualifications of each Trustee, which in each case led to the Board's conclusion that the Trustee should serve (or continue to serve) as a trustee of the fund, is provided below.
Annual Report
Board Structure and Oversight Function. Edward C. Johnson 3d is an interested person (as defined in the 1940 Act) and currently serves as Chairman. The Trustees have determined that an interested Chairman is appropriate and benefits shareholders because an interested Chairman has a personal and professional stake in the quality and continuity of services provided to the fund. Independent Trustees exercise their informed business judgment to appoint an individual of their choosing to serve as Chairman, regardless of whether the Trustee happens to be independent or a member of management. The Independent Trustees have determined that they can act independently and effectively without having an Independent Trustee serve as Chairman and that a key structural component for assuring that they are in a position to do so is for the Independent Trustees to constitute a substantial majority for the Board. The Independent Trustees also regularly meet in executive session. Ned C. Lautenbach serves as Chairman of the Independent Trustees and as such (i) acts as a liaison between the Independent Trustees and management with respect to matters important to the Independent Trustees and (ii) with management prepares agendas for Board meetings.
Fidelity funds are overseen by different Boards of Trustees. The fund's Board oversees Fidelity's equity and high income funds and another Board oversees Fidelity's investment-grade bond, money market, and asset allocation funds. The asset allocation funds may invest in Fidelity funds overseen by the fund's Board. The use of separate Boards, each with its own committee structure, allows the Trustees of each group of Fidelity funds to focus on the unique issues of the funds they oversee, including common research, investment, and operational issues. On occasion, the separate Boards establish joint committees to address issues of overlapping consequences for the Fidelity funds overseen by each Board.
The Trustees operate using a system of committees to facilitate the timely and efficient consideration of all matters of importance to the Trustees, the fund, and fund shareholders and to facilitate compliance with legal and regulatory requirements and oversight of the fund's activities and associated risks. The Board, acting through its committees, has charged FMR and its affiliates with (i) identifying events or circumstances the occurrence of which could have demonstrably adverse effects on the fund's business and/or reputation; (ii) implementing processes and controls to lessen the possibility that such events or circumstances occur or to mitigate the effects of such events or circumstances if they do occur; and (iii) creating and maintaining a system designed to evaluate continuously business and market conditions in order to facilitate the identification and implementation processes described in (i) and (ii) above. Because the day-to-day operations and activities of the fund are carried out by or through FMR, its affiliates and other service providers, the fund's exposure to risks is mitigated but not eliminated by the processes overseen by the Trustees. While each of the Board's committees has responsibility for overseeing different aspects of the fund's activities, oversight is exercised primarily through the Operations, Audit, and Compliance Committees. Appropriate personnel, including but not limited to the fund's Chief Compliance Officer (CCO), FMR's internal auditor, the independent accountants, the fund's Treasurer and portfolio management personnel, make periodic reports to the Board's committees, as appropriate. The responsibilities of each committee, including their oversight responsibilities, are described further under "Standing Committees of the Fund's Trustees."
Annual Report
Trustees and Officers - continued
The fund's Statement of Additional Information (SAI) includes more information about the Trustees. To request a free copy, call Fidelity at 1-800-835-5092.
Interested Trustees*:
Correspondence intended for each Trustee who is an interested person may be sent to Fidelity Investments, 82 Devonshire Street, Boston, Massachusetts 02109.
Name, Age; Principal Occupations and Other Relevant Experience+ |
Edward C. Johnson 3d (80) |
| Year of Election or Appointment: 1978 Mr. Johnson is Trustee and Chairman of the Board of Trustees of certain Trusts. Mr. Johnson serves as Chief Executive Officer, Chairman, and a Director of FMR LLC; Chairman and a Director of FMR; Chairman and a Director of Fidelity Research & Analysis Company (FRAC); Chairman and a Director of Fidelity Investments Money Management, Inc.; and Chairman and a Director of FMR Co., Inc. In addition, Mr. Johnson serves as Chairman and Director of FIL Limited. Previously, Mr. Johnson served as President of FMR LLC (2006-2007). |
James C. Curvey (75) |
| Year of Election or Appointment: 2007 Mr. Curvey also serves as Trustee (2007-present) of other investment companies advised by FMR. Mr. Curvey is a Director of Fidelity Investments Money Management, Inc. (2009-present), Director of Fidelity Research & Analysis Co. (2009-present) and Director of FMR and FMR Co., Inc. (2007-present). Mr. Curvey is also Vice Chairman (2007-present) and Director of FMR LLC. In addition, Mr. Curvey serves as an Overseer for the Boston Symphony Orchestra and a member of the Trustees of Villanova University. Previously, Mr. Curvey was the Vice Chairman (2006-2007) and Director (2000-2007) of FMR Corp. |
* Trustees have been determined to be "Interested Trustees" by virtue of, among other things, their affiliation with the trust or various entities under common control with FMR.
Annual Report
+ The information above includes each Trustee's principal occupation during the last five years and other information relating to the experience, attributes, and skills relevant to each Trustee's qualifications to serve as a Trustee, which led to the conclusion that each Trustee should serve as a Trustee for the fund.
Independent Trustees:
Correspondence intended for each Independent Trustee (that is, the Trustees other than the Interested Trustees) may be sent to Fidelity Investments, P.O. Box 55235, Boston, Massachusetts 02205-5235.
Name, Age; Principal Occupations and Other Relevant Experience+ |
Dennis J. Dirks (62) |
| Year of Election or Appointment: 2005 Prior to his retirement in May 2003, Mr. Dirks was Chief Operating Officer and a member of the Board of The Depository Trust & Clearing Corporation (DTCC). He also served as President, Chief Operating Officer, and Board member of The Depository Trust Company (DTC) and President and Board member of the National Securities Clearing Corporation (NSCC). In addition, Mr. Dirks served as Chief Executive Officer and Board member of the Government Securities Clearing Corporation, Chief Executive Officer and Board member of the Mortgage-Backed Securities Clearing Corporation, as a Trustee and a member of the Finance Committee of Manhattan College (2005-2008), and as a Trustee and a member of the Finance Committee of AHRC of Nassau County (2006-2008). Mr. Dirks is a member of the Independent Directors Council (IDC) Governing Council (2010-Present) and Board of Directors for The Brookville Center for Children's Services, Inc. (2009-present). |
Alan J. Lacy (57) |
| Year of Election or Appointment: 2008 Mr. Lacy serves as Senior Adviser (2007-present) of Oak Hill Capital Partners, L.P. (private equity). Mr. Lacy also served as Chief Executive Officer (2000-2005) and Vice Chairman (2005-2006) of Sears Holdings Corporation and Sears, Roebuck and Co. (retail). In addition, Mr. Lacy serves as a member of the Board of Directors of The Western Union Company (global money transfer, 2006-present) and Bristol-
Myers Squibb Company (global pharmaceuticals, 2007-present). Mr. Lacy is Chairman (2008-present) and a member (2006-present) of the Board of Trustees of The National Parks Conservation Association. |
Ned C. Lautenbach (66) |
| Year of Election or Appointment: 2000 Mr. Lautenbach is Chairman of the Independent Trustees of the Equity and High Income Funds (2006-present). Mr. Lautenbach currently serves as the Lead Director of the Eaton Corporation Board of Directors (diversified industrial, 1997-present). Mr. Lautenbach is also a member of the Board of Directors of the Philharmonic Center for the Arts in Naples, Florida (1999-present); a member of the Board of Trustees of Fairfield University (2005-present); and a member of the Council on Foreign Relations (1994-present). Previously, Mr. Lautenbach was a Partner/Advisory Partner at Clayton, Dubilier & Rice, Inc. (private equity investment, 1998-2010), as well as a Director of Sony Corporation (2006-2007). |
Joseph Mauriello (66) |
| Year of Election or Appointment: 2008 Prior to his retirement in January 2006, Mr. Mauriello served in numerous senior management positions including Deputy Chairman and Chief Operating Officer (2004-2005), and Vice Chairman of Financial Services (2002-2004) of KPMG LLP US (professional services, 1965-2005). Mr. Mauriello currently serves as a member of the Board of Directors of XL Group plc. (global insurance and re-insurance, 2006-present) and of Arcadia Resources Inc. (health care services and products, 2007-present). Previously, Mr. Mauriello served as a Director of the Hamilton Funds of the Bank of New York (2006-2007). |
Cornelia M. Small (66) |
| Year of Election or Appointment: 2005 Ms. Small is a member of the Board of Directors of the Teagle Foundation (2009-present). Ms. Small is also a member of the Investment Committee, and Chair (2008-present) and a member of the Board of Trustees of Smith College. In addition, Ms. Small serves on the Investment Committee of the Berkshire Taconic Community Foundation (2008-present). Previously, Ms. Small served as Chairperson of the Investment Committee (2002-2008) of Smith College. In addition, Ms. Small served as Chief Investment Officer, Director of Global Equity Investments, and a member of the Board of Directors of Scudder, Stevens & Clark and Scudder Kemper Investments. |
William S. Stavropoulos (71) |
| Year of Election or Appointment: 2002 Mr. Stavropoulos is Vice Chairman of the Independent Trustees of the Equity and High Income Funds (2006-present). Mr. Stavropoulos serves as President and Founder of the Michigan Baseball Foundation, the Great Lakes Loons (2007-present). Mr. Stavropoulos is Chairman Emeritus of the Board of Directors of The Dow Chemical Company, where he previously served in numerous senior management positions, including President, CEO (1995-2000; 2002-2004), Chairman of the Executive Committee (2000-2006), and as a member of the Board of Directors (1990-2006). Currently, Mr. Stavropoulos is Chairman of Univar (global distributor of commodity and specialty chemicals, 2010-present), a Director of Teradata Corporation (data warehousing and technology solutions, 2008-present), Chemical Financial Corporation, Maersk Inc. (industrial conglomerate), Tyco International, Inc. (multinational manufacturing and services, 2007-present), and a member of the Advisory Board for Metalmark Capital (private equity investment, 2005-present). Mr. Stavropoulos is a special advisor to Clayton, Dubilier & Rice, Inc. (private equity investment). In addition, Mr. Stavropoulos is a member of the University of Notre Dame Advisory Council for the College of Science. |
David M. Thomas (61) |
| Year of Election or Appointment: 2008 Previously, Mr. Thomas served as Executive Chairman (2005-2006) and Chairman and Chief Executive Officer (2000-2005) of IMS Health, Inc. (pharmaceutical and healthcare information solutions). In addition, Mr. Thomas serves as a member of the Board of Directors of Fortune Brands, Inc. (consumer products), and Interpublic Group of Companies, Inc. (marketing communication, 2004-present). |
Michael E. Wiley (60) |
| Year of Election or Appointment: 2008 Mr. Wiley also serves as a Director of Asia Pacific Exploration Consolidated (international oil and gas exploration and production, 2008-
present). Mr. Wiley serves as a Director of Tesoro Corporation (independent oil refiner and marketer, 2005-present), and a Director of Bill Barrett Corporation (exploration and production, 2005-present). In addition, Mr. Wiley also serves as a Director of Post Oak Bank (privately-held bank, 2004-present). Previously, Mr. Wiley served as a member of the Board of Trustees of the University of Tulsa (2000-2006; 2007-2010), as a Senior Energy Advisor of Katzenbach Partners, LLC (consulting, 2006-2007), as an Advisory Director of Riverstone Holdings (private investment), Chairman, President, and CEO of Baker Hughes, Inc. (oilfield services, 2000-2004), and as Director of Spinnaker Exploration Company (exploration and production, 2001-2005). |
Annual Report
Trustees and Officers - continued
+ The information above includes each Trustee's principal occupation during the last five years and other information relating to the experience, attributes, and skills relevant to each Trustee's qualifications to serve as a Trustee, which led to the conclusion that each Trustee should serve as a Trustee for the fund.
Advisory Board Member and Executive Officers:
Correspondence intended for each executive officer and Peter S. Lynch may be sent to Fidelity Investments, 82 Devonshire Street, Boston, Massachusetts 02109.
Name, Age; Principal Occupation |
Peter S. Lynch (66) |
| Year of Election or Appointment: 2003 Member of the Advisory Board of Fidelity's Equity and High Income Funds. Mr. Lynch is Vice Chairman and a Director of FMR and FMR Co., Inc. In addition, Mr. Lynch serves as a Trustee of Boston College and as the Chairman of the Inner-City Scholarship Fund. Previously, Mr. Lynch served on the Special Olympics International Board of Directors (1997-2006). |
Kenneth B. Robins (41) |
| Year of Election or Appointment: 2008 President and Treasurer of Fidelity's Equity and High Income Funds. Mr. Robins also serves as President and Treasurer (2010-present) and Assistant Treasurer (2009-present) of other Fidelity funds and is an employee of Fidelity Investments (2004-present). Previously, Mr. Robins served as Deputy Treasurer of the Fidelity funds (2005-2008) and Treasurer and Chief Financial Officer of The North Carolina Capital Management Trust: Cash and Term Portfolios (2006-2008). |
Bruce T. Herring (45) |
| Year of Election or Appointment: 2006 Vice President of certain Equity Funds. Mr. Herring also serves as Chief Investment Officer and Director of Fidelity Management & Research (U.K.) Inc. (2010-present) and Group Chief Investments Officer of FMR. Previously, Mr. Herring served as Vice President (2005-2006) and Senior Vice President (2006-2007) of Fidelity Management & Research Company, Vice President of FMR Co., Inc. (2001-2007) and as a portfolio manager for Fidelity U.S. Equity Funds. |
Brian B. Hogan (46) |
| Year of Election or Appointment: 2009 Vice President of certain Equity Funds and Vice President of Sector Funds. Mr. Hogan also serves as President of FMR's Equity Division (2009-present). Previously, Mr. Hogan served as Senior Vice President, Equity Research of FMR (2006-2009) and as a portfolio manager. |
Scott C. Goebel (42) |
| Year of Election or Appointment: 2008 Secretary and Chief Legal Officer (CLO) of the Fidelity funds. Mr. Goebel also serves as Secretary and CLO of The North Carolina Capital Management Trust: Cash and Term Portfolio (2008-present); General Counsel, Secretary, and Senior Vice President of FMR (2008-present) and FMR Co., Inc. (2008-present); Deputy General Counsel of FMR LLC; Chief Legal Officer of Fidelity Management & Research (Hong Kong) Limited (2008-present) and Assistant Secretary of Fidelity Management & Research (Japan) Inc. (2008-present), Fidelity Investments Money Management, Inc. (2008-present), Fidelity Management & Research (U.K.) Inc. (2008-present), and Fidelity Research and Analysis Company (2008-present). Previously, Mr. Goebel served as Assistant Secretary of the Funds (2007-2008) and as Vice President and Secretary of Fidelity Distributors Corporation (FDC) (2005-2007). |
William C. Coffey (41) |
| Year of Election or Appointment: 2009 Assistant Secretary of Fidelity's Equity and High Income Funds. Mr. Coffey also serves as Senior Vice President and Deputy General Counsel of FMR LLC (2010-present), and is an employee of Fidelity Investments. Previously, Mr. Coffey served as Vice President and Associate General Counsel of FMR LLC (2005-2009). |
Holly C. Laurent (56) |
| Year of Election or Appointment: 2008 Anti-Money Laundering (AML) Officer of the Fidelity funds. Ms. Laurent also serves as AML Officer of The North Carolina Capital Management Trust: Cash and Term Portfolio (2008-present) and is an employee of Fidelity Investments. Previously, Ms. Laurent was Senior Vice President and Head of Legal for Fidelity Business Services India Pvt. Ltd. (2006-2008), and Senior Vice President, Deputy General Counsel and Group Head for FMR LLC (2005-2006). |
Christine Reynolds (52) |
| Year of Election or Appointment: 2008 Chief Financial Officer of the Fidelity funds. Ms. Reynolds became President of Fidelity Pricing and Cash Management Services (FPCMS) in August 2008. Ms. Reynolds served as Chief Operating Officer of FPCMS (2007-2008). Previously, Ms. Reynolds served as President, Treasurer, and Anti-Money Laundering officer of the Fidelity funds (2004-2007). |
Kenneth A. Rathgeber (63) |
| Year of Election or Appointment: 2004 Chief Compliance Officer of Fidelity's Equity and High Income Funds. Mr. Rathgeber is Chief Compliance Officer of Fidelity Management & Research (Hong Kong) Limited (2008-present), Fidelity Management & Research (Japan) Inc. (2008-present), FMR (2005-present), FMR Co., Inc. (2005-present), Fidelity Management & Research (U.K.) Inc. (2005-present), Fidelity Research & Analysis Company (2005-present), Fidelity Investments Money Management, Inc. (2005-present), Pyramis Global Advisors, LLC (2005-present), and Strategic Advisers, Inc. (2005-present). |
Jeffrey S. Christian (49) |
| Year of Election or Appointment: 2009 Deputy Treasurer of the Fidelity funds. Mr. Christian is an employee of Fidelity Investments. Previously, Mr. Christian served as Chief Financial Officer (2008-2009) of certain Fidelity funds and Senior Vice President of Fidelity Pricing and Cash Management Services (FPCMS) (2004-2009). |
Bryan A. Mehrmann (49) |
| Year of Election or Appointment: 2005 Deputy Treasurer of the Fidelity funds. Mr. Mehrmann is an employee of Fidelity Investments. |
Adrien E. Deberghes (43) |
| Year of Election or Appointment: 2008 Deputy Treasurer of Fidelity's Equity and High Income Funds. Mr. Deberghes also serves as Assistant Treasurer of other Fidelity funds (2010-present) and is an employee of Fidelity Investments (2008-present). Previously, Mr. Deberghes served as Senior Vice President of Mutual Fund Administration at State Street Corporation (2007-2008), Senior Director of Mutual Fund Administration at Investors Bank & Trust (2005-2007), and Director of Finance for Dunkin' Brands (2000-2005). |
Stephanie J. Dorsey (41) |
| Year of Election or Appointment: 2010 Assistant Treasurer of Fidelity's Equity and High Income Funds. Ms. Dorsey also serves as Deputy Treasurer of other Fidelity funds (2008-present) and is an employee of Fidelity Investments (2008-present). Previously, Ms. Dorsey served as Treasurer (2004-2008) of the JPMorgan Mutual Funds and Vice President (2004-2008) of JPMorgan Chase Bank. |
Name, Age; Principal Occupation |
John R. Hebble (52) |
| Year of Election or Appointment: 2009 Assistant Treasurer of Fidelity's Equity and High Income Funds. Mr. Hebble also serves as Treasurer and Chief Financial Officer of The North Carolina Capital Management Trust: Cash and Term Portfolio (2008-present), President and Treasurer of other Fidelity funds (2008-present) and is an employee of Fidelity Investments. |
Gary W. Ryan (52) |
| Year of Election or Appointment: 2005 Assistant Treasurer of the Fidelity funds. Mr. Ryan is an employee of Fidelity Investments. Previously, Mr. Ryan served as Vice President of Fund Reporting in Fidelity Pricing and Cash Management Services (FPCMS) (1999-2005). |
Jonathan Davis (42) |
| Year of Election or Appointment: 2010 Assistant Treasurer of the Fidelity funds. Mr. Davis is an employee of Fidelity Investments. Previously, Mr. Davis served as Vice President and Associate General Counsel of FMR LLC (2003-2010). |
Annual Report
Class F designates 100% of the dividends distributed during the fiscal year as qualifying for the dividends-received deduction for corporate shareholders.
Class F designates 100% of the dividend distributed in December during the fiscal year as amounts which may be taken into account as a dividend for the purposes of the maximum rate under section 1(h)(11) of the Internal Revenue Code.
The fund will notify shareholders in January 2011 of amounts for use in preparing 2010 income tax returns.
Annual Report
Board Approval of Investment Advisory Contracts and Management Fees
Fidelity Disciplined Equity Fund
Each year, the Board of Trustees, including the Independent Trustees (together, the Board), votes on the renewal of the management contract and sub-advisory agreements (together, the Advisory Contracts) for the fund. The Board, assisted by the advice of fund counsel and Independent Trustees' counsel, requests and considers a broad range of information relevant to the renewal of the Advisory Contracts throughout the year.
The Board meets regularly and considers at each of its meetings factors that are relevant to its annual consideration of the renewal of the fund's Advisory Contracts, including the services and support provided to the fund and its shareholders. The Board has established various standing committees, each composed of Independent Trustees with varying backgrounds, to which the Board has assigned specific subject matter responsibilities in order to enhance effective decision-making by the Board. The Board, acting directly and through its Committees, requests and receives information concerning the annual consideration of the renewal of the fund's Advisory Contracts. The Board also meets as needed to consider matters specifically related to the Board's annual consideration of the renewal of Advisory Contracts. Members of the Board may also meet with trustees of other Fidelity funds through ad hoc joint committees to discuss certain matters relevant to the Fidelity funds.
At its July 2010 meeting, the Board of Trustees, including the Independent Trustees, unanimously determined to renew the fund's Advisory Contracts. In reaching its determination, the Board considered all factors it believed relevant, including (i) the nature, extent, and quality of the services to be provided to the fund and its shareholders (including the investment performance of the fund); (ii) the competitiveness of the fund's management fee and total expenses; (iii) the total costs of the services to be provided by and the profits to be realized by Fidelity from its relationship with the fund; (iv) the extent to which economies of scale would be realized as the fund grows; and (v) whether fee levels reflect these economies of scale, if any, for the benefit of fund shareholders.
In considering whether to renew the Advisory Contracts for the fund, the Board reached a determination, with the assistance of fund counsel and Independent Trustees' counsel and through the exercise of its business judgment, that the renewal of the Advisory Contracts is in the best interests of fund shareholders and that the compensation to be received by Fidelity under the management contract is fair and reasonable. The Board's decision to renew the Advisory Contracts was not based on any single factor noted above, but rather was based on a comprehensive consideration of all the information provided to the Board at its meetings throughout the year. The Board, in reaching its determination to renew the Advisory Contracts, is aware that shareholders in the fund have a broad range of investment choices available to them, including a wide choice among mutual funds offered by Fidelity's competitors, and that the fund's shareholders, with the opportunity to review and weigh the disclosure provided by the fund in its prospectus and other public disclosures, have chosen to invest in this fund, managed by Fidelity.
Annual Report
Board Approval of Investment Advisory Contracts and
Management Fees - continued
Nature, Extent, and Quality of Services Provided. The Board considered the staffing within the investment adviser, FMR, and the sub-advisers (together, the Investment Advisers), including the backgrounds of the fund's investment personnel and the fund's investment objective and discipline. The Independent Trustees also had discussions with senior management of Fidelity's investment operations and investment groups. The Board considered the structure of the portfolio manager compensation program and whether this structure provides appropriate incentives to act in the best interest of the fund.
Resources Dedicated to Investment Management and Support Services. The Board and the equity research subcommittee of the Board's Fund Oversight Committee reviewed the size, education, and experience of the Investment Advisers' investment staff, their use of technology, and the Investment Advisers' approach to recruiting, training, and retaining portfolio managers and other research, advisory, and management personnel. The Board noted that Fidelity's analysts have access to a variety of technological tools and market and securities data that enable them to perform both fundamental and quantitative analysis and to specialize in various disciplines. The Board considered Fidelity's extensive global research capabilities that enable the Investment Advisers to aggregate data from various sources in an effort to produce positive investment results. The Board also considered that Fidelity's portfolio managers and analysts have access to daily portfolio attribution that allows for monitoring of a fund's portfolio, as well as an electronic communication system that provides immediate real-time access to research concerning issuers and credit enhancers. The Board noted FMR's continued focus on strengthening the organization and discipline of equity portfolio management and research.
Shareholder and Administrative Services. The Board considered (i) the nature, extent, quality, and cost of advisory, administrative, and shareholder services performed by the Investment Advisers and their affiliates under the Advisory Contracts and under separate agreements covering transfer agency, pricing and bookkeeping, and securities lending services for the fund; (ii) the nature and extent of the investment adviser's supervision of third party service providers, principally custodians and subcustodians; and (iii) the resources devoted to, and the record of compliance with, the fund's compliance policies and procedures. The Board also reviewed the allocation of fund brokerage, including allocations to brokers affiliated with the Investment Advisers, the use of brokerage commissions to pay fund expenses, and the use of "soft" commission dollars to pay for research services.
The Board noted that the growth of fund assets over time across the complex allows Fidelity to reinvest in the development of services designed to enhance the value or convenience of the Fidelity funds as investment vehicles. These services include 24-hour access to account information and market information through phone representatives and over the Internet, and investor education materials and asset allocation tools.
Annual Report
Investment in a Large Fund Family. The Board considered the benefits to shareholders of investing in a Fidelity fund, including the benefits of investing in a fund that is part of a large family of funds offering a variety of investment disciplines and providing a large variety of mutual fund investor services. The Board noted that Fidelity had taken, or had made recommendations that resulted in the Fidelity funds taking, a number of actions over the previous year that benefited particular funds, including (i) dedicating additional resources to investment research and restructuring and broadening the focus of the investment research teams; (ii) bolstering the senior management team that oversees asset management; (iii) launching Class F of certain funds as a lower-fee class available to Freedom K and Freedom Index Funds; (iv) lowering the initial investment minimums and ongoing balance requirements for Real Estate High Income Fund; (v) eliminating subsequent purchase minimums for all funds and adding a waiver of the investment minimum requirement for new accounts opened with the proceeds of a systematic withdrawal plan; (vi) eliminating the withdrawal minimum and maximum limits for systematic withdrawals from Advisor funds; (vii) expanding sales load waivers on Class A shares for Destiny Planholders and expanding Institutional Class eligibility for Class O Destiny Planholders; and (viii) changing certain Class A and Class T sales charge structures to further align them with industry practices.
Investment Performance. The Board considered whether the fund has operated in accordance with its investment objective, as well as its record of compliance with its investment restrictions. It also reviewed the fund's absolute investment performance for each class (except Class F), as well as the fund's relative investment performance for each class (except Class F) measured over multiple periods against (i) a broad-based securities market index, and (ii) a peer group of mutual funds deemed appropriate by Fidelity and reviewed by the Board. The following charts considered by the Board show, over the one-, three-, and five-year periods ended December 31, 2009, as available, the cumulative total returns of Class K and the retail class of the fund, the cumulative total returns of a broad-based securities market index ("benchmark"), and a range of cumulative total returns of a peer group of mutual funds identified by Morningstar, Inc. as having an investment style similar to that of the fund based on underlying portfolio holdings. (Class F of the fund had less than one year of performance as of December 31, 2009.) The box within each chart shows the 25th percentile return (bottom of box) and the 75th percentile return (top of box) of the peer group. Returns shown above the box are in the first quartile and returns shown below the box are in the fourth quartile. The percentage beaten numbers noted below each chart correspond to the percentile box and represent the percentage of funds in the peer group whose performance was equal to or lower than that of the class indicated.
Annual Report
Board Approval of Investment Advisory Contracts and
Management Fees - continued
Fidelity Disciplined Equity Fund
The Board reviewed the fund's relative investment performance against its peer group and noted that the performance of the retail class of the fund (the class with the longer performance record) was in the fourth quartile for the one- and three-year periods and the second quartile for the five-year period. The Board also noted that the investment performance of the fund was lower than its benchmark for the one- and three-year periods, although the five-year cumulative total return of the retail class compared favorably to its benchmark. The Board considered that the variations in performance between the fund's classes reflect the variations in class expenses, which result in lower performance for the higher expense class. The Board discussed with FMR actions that have been taken by FMR to improve the fund's more recent disappointing performance relative to its peer group and benchmark. The Board also reviewed the fund's performance since inception as well as performance in the current year. The Board will continue to closely monitor the performance of the fund in the coming year and discuss with FMR other appropriate actions to address the performance of the fund.
The Board also considered that the fund's management fee is subject to upward or downward adjustment depending upon whether, and to what extent, the fund's investment performance for the performance period exceeds, or is exceeded by, the record (over the same period) of a Board-approved performance adjustment index. The Board realizes that the performance adjustment provides FMR with a strong economic incentive to seek to achieve superior performance for the fund's shareholders and helps to more closely align the interests of FMR and the fund's shareholders.
Annual Report
Based on its review, and giving particular weight to the nature and quality of the resources dedicated by the Investment Advisers to maintain and improve relative performance and factoring in the unprecedented market events in recent years, the Board concluded that the nature, extent, and quality of investment management and support services and of shareholder and administrative services provided to the fund will benefit the fund's shareholders, particularly in light of the Board's view that the fund's shareholders benefit from investing in a fund that is part of a large family of funds offering a variety of investment disciplines and services.
Competitiveness of Management Fee and Total Fund Expenses. The Board considered the fund's management fee and total expenses compared to "mapped groups" of competitive funds and classes. Fidelity creates "mapped groups" by combining similar Lipper investment objective categories that have comparable management fee characteristics. Combining Lipper investment objective categories aids the Board's management fee and total expense comparisons by broadening the competitive group used for comparison and by reducing the number of universes to which various Fidelity funds are compared.
Management Fee. The Board considered two proprietary management fee comparisons for the 12-month periods shown in the chart below. The group of Lipper funds used by the Board for management fee comparisons is referred to below as the "Total Mapped Group." The Total Mapped Group comparison focuses on a fund's standing relative to the total universe of comparable funds available to investors, in terms of gross management fees before expense reimbursements or caps, and without giving effect to the fund's performance adjustment. "TMG %" represents the percentage of funds in the Total Mapped Group that had management fees that were lower than the fund's. For example, a TMG % of 10% means that 90% of the funds in the Total Mapped Group had higher management fees than the fund. The "Asset-Size Peer Group" (ASPG) comparison focuses on a fund's standing relative to non-Fidelity funds similar in size to the fund within the Total Mapped Group. The ASPG represents at least 15% of the funds in the Total Mapped Group with comparable asset size and management fee characteristics, subject to a minimum of 50 funds (or all funds in the Total Mapped Group if fewer than 50). Additional information, such as the ASPG quartile in which the fund's management fee ranked and the impact of the fund's performance adjustment, is also included in the chart and considered by the Board.
Annual Report
Board Approval of Investment Advisory Contracts and
Management Fees - continued
Fidelity Disciplined Equity Fund
The Board noted that the fund's management fee ranked below the median of its Total Mapped Group and below the median of its ASPG for 2009. The Board also noted the effect of the fund's negative performance adjustment on the fund's management fee ranking. The Board noted that the performance adjustment for each year represents calculations for performance periods that differ from the periods shown in the performance charts above.
Based on its review, the Board concluded that the fund's management fee is fair and reasonable in light of the services that the fund receives and the other factors considered.
Total Expenses. In its review of each class's total expenses, the Board considered the fund's management fee as well as other fund or class expenses, as applicable, such as transfer agent fees, pricing and bookkeeping fees, and custodial, legal, and audit fees. The Board also noted the effects of any waivers and reimbursements on fees and expenses, as well as the impact of the fund's performance adjustment. As part of its review, the Board also considered current and historical total expenses of each class of the fund compared to competitive fund median expenses. Each class of the fund is compared to those funds and classes in the Total Mapped Group (used by the Board for management fee comparisons) that have a similar sales load structure.
The Board noted that the total expenses of each class ranked below its competitive median for the period.
Annual Report
Fees Charged to Other Fidelity Clients. The Board also considered Fidelity fee structures and other information with respect to clients of FMR and its affiliates, such as other mutual funds advised or subadvised by FMR or its affiliates, pension plan clients, and other institutional clients. In March 2010, the Board created an ad hoc joint committee with the board of other Fidelity funds (the Committee) to review and compare Fidelity's institutional investment advisory business with its business of providing services to the Fidelity funds, including the differences in services provided, fees charged, and costs incurred, as well as competition in their respective marketplaces.
Based on its review of total expenses and fees charged to other Fidelity clients, the Board concluded that the total expenses of each class of the fund were reasonable in light of the services that the fund and its shareholders receive and the other factors considered, including the findings of the Committee.
Costs of the Services and Profitability. The Board considered the revenues earned and the expenses incurred by Fidelity in conducting the business of developing, marketing, distributing, managing, administering and servicing the fund and its shareholders. The Board also considered the level of Fidelity's profits in respect of all the Fidelity funds.
On an annual basis, FMR presents to the Board Fidelity's profitability for the fund. Fidelity calculates the profitability for each fund, as well as aggregate profitability for groups of Fidelity funds and all Fidelity funds, using a series of detailed revenue and cost allocation methodologies which originate with the audited books and records of Fidelity. The Audit Committee of the Board reviews any significant changes from the prior year's methodologies.
PricewaterhouseCoopers LLP (PwC), independent registered public accounting firm and auditor to Fidelity and certain Fidelity funds, has been engaged annually by the Board as part of the Board's assessment of Fidelity's profitability analysis. PwC's engagement includes the review and assessment of Fidelity's methodologies used in determining the revenues and expenses attributable to Fidelity's mutual fund business, and completion of agreed-upon procedures surrounding the mathematical accuracy of fund profitability and its conformity to allocation methodologies. After considering PwC's reports issued under the engagement and information provided by Fidelity, the Board believes that while other allocation methods may also be reasonable, Fidelity's profitability methodologies are reasonable in all material respects.
The Board has also reviewed Fidelity's non-fund businesses and fall-out benefits related to the mutual fund business as well as cases where Fidelity's affiliates may benefit from or be related to the fund's business.
Annual Report
Board Approval of Investment Advisory Contracts and
Management Fees - continued
The Board considered the costs of the services provided by and the profits realized by Fidelity in connection with the operation of the fund and were satisfied that the profitability was not excessive in the circumstances.
Economies of Scale. The Board considered whether there have been economies of scale in respect of the management of the Fidelity funds, whether the Fidelity funds (including the fund) have appropriately benefited from any such economies of scale, and whether there is potential for realization of any further economies of scale. The Board considered the extent to which the fund will benefit from economies of scale through increased services to the fund, through waivers or reimbursements, or through fee or expense reductions.
In February 2009, the Board and the board of other Fidelity funds created an ad hoc committee (the Economies of Scale Committee) to analyze whether FMR attains economies of scale in respect of the management and servicing of the Fidelity funds, whether the Fidelity funds have appropriately benefited from such economies of scale, and whether there is potential for realization of any further economies of scale.
The Board recognized that the fund's management contract incorporates a "group fee" structure, which provides for lower group fee rates as total fund assets under FMR's management increase, and for higher group fee rates as total fund assets under FMR's management decrease. FMR calculates the group fee rates based on a tiered asset "breakpoint" schedule that varies based on asset class. The Board considered that the group fee is designed to deliver the benefits of economies of scale to fund shareholders when total Fidelity fund assets increase, even if assets of any particular fund are unchanged or have declined, because some portion of Fidelity's costs are attributable to services provided to all Fidelity funds, and all funds benefit if those costs can be allocated among more assets. The Board concluded that, given the group fee structure, fund shareholders will benefit from lower management fees as assets under FMR's management increase at the fund complex level, regardless of whether Fidelity achieves any such economies of scale.
The Board concluded, considering the findings of the Economies of Scale Committee, that any potential economies of scale are being appropriately shared between fund shareholders and Fidelity.
Additional Information Requested by the Board. In order to develop fully the factual basis for consideration of the Fidelity funds' Advisory Contracts, the Board requested and received additional information on certain topics, including (i) fund performance trends, actions to be taken by FMR to improve certain funds' overall performance, and Fidelity's long-term strategies for certain funds; (ii) portfolio manager changes that have occurred during the past year and length of portfolio manager tenure for different categories of funds over time; (iii) Fidelity's compensation structure for portfolio managers, research analysts, and other key personnel, the rationale for the compensation structure, and how the compensation structure provides appropriate performance incentives; (iv) the amount of the investment that each portfolio manager has made in the Fidelity fund(s) that he or she manages; (v) management and other fees paid by FMR to affiliated sub-advisers on behalf of the Fidelity funds; (vi) Fidelity's fee structures and rationale for recommending different fees among different categories of funds; (vii) Fidelity's rationale for recommending which funds should have a performance adjustment component as part of their management fees; (viii) the rationale for any differences between fund fee structures and fee structures in place for other Fidelity clients; and (ix) explanations regarding the relative total expenses borne by certain funds and classes, total expense competitive trends, and actions that might be taken by FMR to reduce total expenses for certain funds and classes.
Annual Report
Based on its evaluation of all of the conclusions noted above, and after considering all factors it believed relevant, the Board ultimately concluded that the advisory fee structures are fair and reasonable, and that the fund's Advisory Contracts should be renewed.
Annual Report
Investment Adviser
Fidelity Management & Research Company
Boston, MA
Investment Sub-Advisers
FMR Co., Inc.
Fidelity Management & Research
(U.K.) Inc.
Fidelity Research & Analysis Company
Fidelity Management & Research
(Hong Kong) Limited
Fidelity Management & Research
(Japan) Inc.
General Distributor
Fidelity Distributors Corporation
Boston, MA
Transfer and Service Agents
Fidelity Investments Institutional
Operations Company, Inc. (FIIOC)
Boston, MA
Fidelity Service Company, Inc.
Boston, MA
Custodian
State Street Bank and Trust Company
Quincy, MA
FDE-F-ANN-1210
1.891696.101
Fidelity®
Disciplined Equity
Fund -
Class K
Annual Report
October 31, 2010
(2_fidelity_logos) (Registered_Trademark)
Contents
Chairman's Message | <Click Here> | The Chairman's message to shareholders. |
Performance | <Click Here> | How the fund has done over time. |
Management's Discussion of Fund Performance | <Click Here> | The Portfolio Manager's review of fundperformance and strategy. |
Shareholder Expense Example | <Click Here> | An example of shareholder expenses. |
Investment Changes | <Click Here> | A summary of major shifts in the fund's investments over the past six months. |
Investments | <Click Here> | A complete list of the fund's investments with their market values. |
Financial Statements | <Click Here> | Statements of assets and liabilities, operations, and changes in net assets, as well as financial highlights. |
Notes | <Click Here> | Notes to the financial statements. |
Report of Independent Registered Public Accounting Firm | <Click Here> | |
Trustees and Officers | <Click Here> | |
Distributions | <Click Here> | |
Board Approval of Investment Advisory Contracts and Management Fees | <Click Here> | |
To view a fund's proxy voting guidelines and proxy voting record for the 12-month period ended June 30, visit http://www.fidelity.com/proxyvotingresults or visit the Securities and Exchange Commission's (SEC) web site at http://www.sec.gov. You may also call 1-800-835-5092 to request a free copy of the proxy voting guidelines.
Standard & Poor's, S&P and S&P 500 are registered service marks of The McGraw-Hill Companies, Inc. and have been licensed for use by Fidelity Distributors Corporation.
Other third party marks appearing herein are the property of their respective owners.
All other marks appearing herein are registered or unregistered trademarks or service marks of FMR LLC or an affiliated company.
Annual Report
This report and the financial statements contained herein are submitted for the general information of the shareholders of the fund. This report is not authorized for distribution to prospective investors in the fund unless preceded or accompanied by an effective prospectus.
A fund files its complete schedule of portfolio holdings with the SEC for the first and third quarters of each fiscal year on Form N-Q. Forms N-Q are available on the SEC's web site at http://www.sec.gov. A fund's Forms N-Q may be reviewed and copied at the SEC's Public Reference Room in Washington, DC. Information regarding the operation of the SEC's Public Reference Room may be obtained by calling 1-800-SEC-0330. For a complete list of a fund's portfolio holdings, view the most recent holdings listing, semiannual report, or annual report on Fidelity's web site at http://www.fidelity.com or http://www.advisor.fidelity.com, as applicable.
NOT FDIC INSURED • MAY LOSE VALUE • NO BANK GUARANTEE
Neither the fund nor Fidelity Distributors Corporation is a bank.
Annual Report
(photo_of_Edward_C_Johnson_3d)
Dear Shareholder:
Equities have staged a rally in the second half of 2010, shaking off concerns about the European debt crisis and the possibility of a double-dip recession in the U.S. Although the short-term surge pushed major equity indexes back into positive territory for the year, several questions remain about the longer-term outlook, including lackluster economic growth and persistently high unemployment. Financial markets are always unpredictable, of course, but there also are several time-tested investment principles that can help put the odds in your favor.
One of the basic tenets is to invest for the long term. Over time, riding out the markets' inevitable ups and downs has proven much more effective than selling into panic or chasing the hottest trend. Even missing only a few of the markets' best days can significantly diminish investor returns. Patience also affords the benefits of compounding - of earning interest on additional income or reinvested dividends and capital gains. There can be tax advantages and cost benefits to consider as well. While staying the course doesn't eliminate risk, it can considerably lessen the effect of short-term declines.
You can further manage your investing risk through diversification. And today, more than ever, geographic diversification should be taken into account. Studies indicate that asset allocation is the single most important determinant of a portfolio's long-term success. The right mix of stocks, bonds and cash - aligned to your particular risk tolerance and investment objective - is very important. Age-appropriate rebalancing is also an essential aspect of asset allocation. For younger investors, an emphasis on equities - which historically have been the best-performing asset class over time - is encouraged. As investors near their specific goal, such as retirement or sending a child to college, consideration may be given to replacing volatile assets (e.g. common stocks) with more-stable fixed investments (bonds or savings plans).
A third principle - investing regularly - can help lower the average cost of your purchases. Investing a certain amount of money each month or quarter helps ensure you won't pay for all your shares at market highs. This strategy - known as dollar cost averaging - also reduces "emotion" from investing, helping shareholders avoid selling weak performers just prior to an upswing, or chasing a hot performer just before a correction.
We invite you to contact us via the Internet, through our Investor Centers or by phone. It is our privilege to provide you the information you need to make the investments that are right for you.
Sincerely,
(The chairman's signature appears here.)
Edward C. Johnson 3d
Annual Report
Average annual total return reflects the change in the value of an investment, assuming reinvestment of the class' distributions from dividend income and capital gains (the profits earned upon the sale of securities that have grown in value, if any) and assuming a constant rate of performance each year. The $10,000 table and the fund's returns do not reflect the deduction of taxes that a shareholder would pay on fund distributions or the redemption of fund shares. During periods of reimbursement by Fidelity, a fund's total return will be greater than it would be had the reimbursement not occurred. How a fund did yesterday is no guarantee of how it will do tomorrow.
Average Annual Total Returns
Periods ended October 31, 2010 | Past 1
year | Past 5
years | Past 10
years |
Class KA | 11.25% | 0.08% | -0.02% |
A The initial offering of Class K shares took place on May 9, 2008. Returns prior to May 9, 2008 are those of Fidelity® Disciplined Equity Fund, the original class of the fund.
$10,000 Over 10 Years
Let's say hypothetically that $10,000 was invested in Fidelity® Disciplined Equity Fund - Class K on October 31, 2000. The chart shows how the value of your investment would have changed, and also shows how the Standard & Poor's 500SM (S&P 500®) Index performed over the same period. The initial offering of Class K took place on May 9, 2008. See above for additional information regarding the performance of Class K.
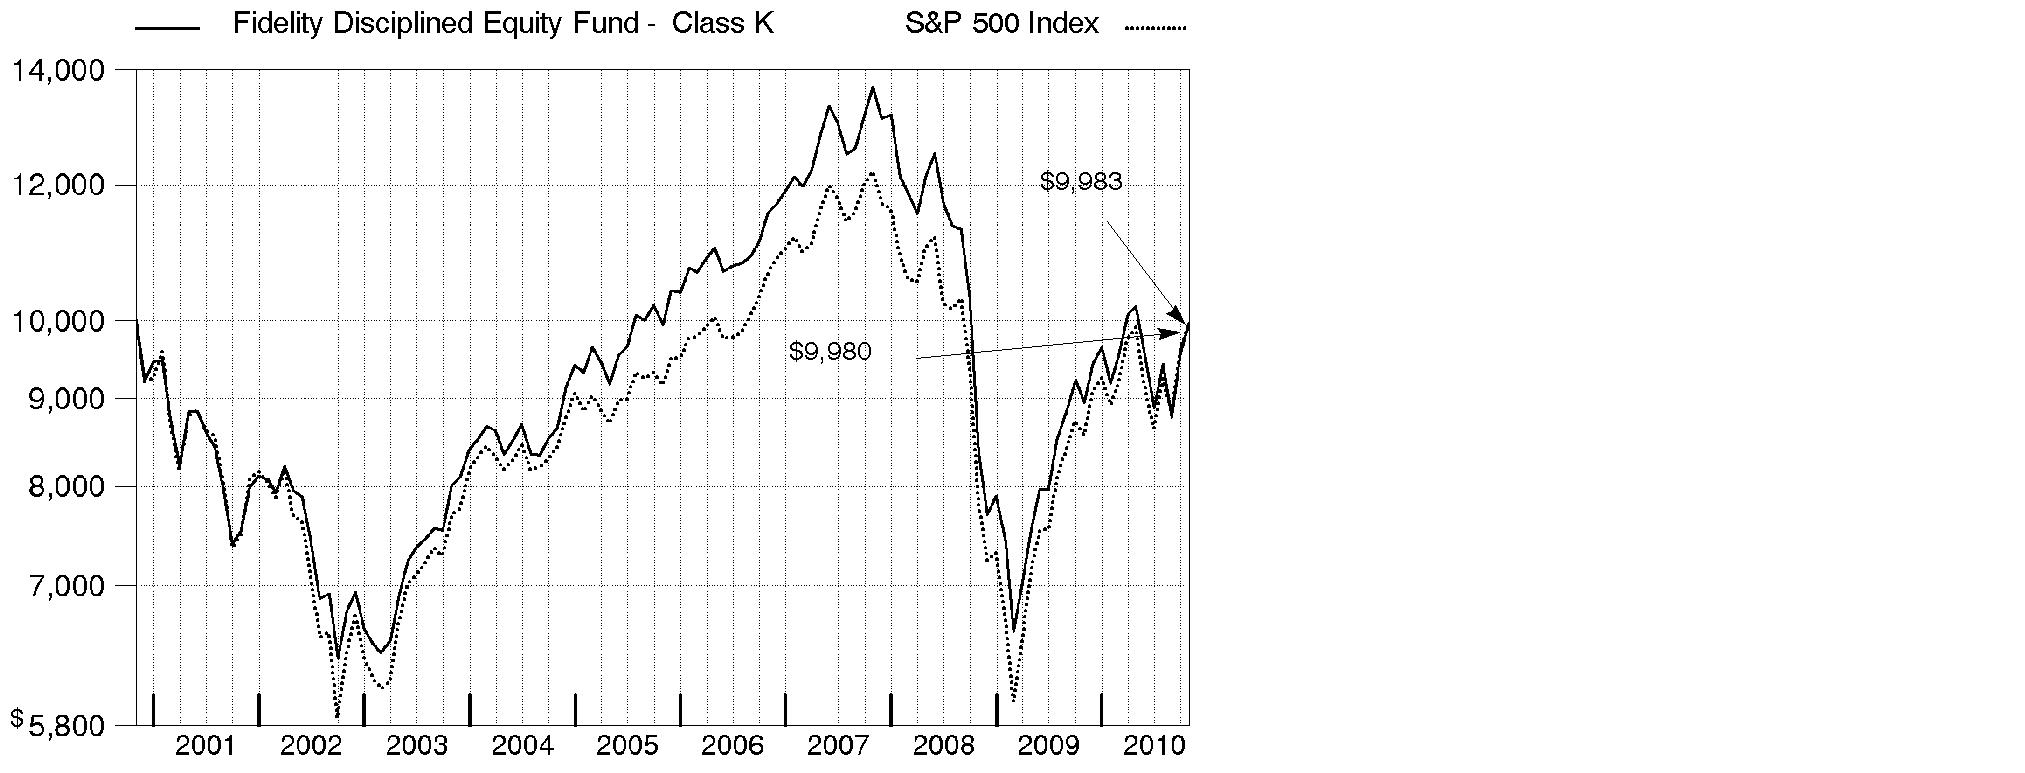
Annual Report
Market Recap: Amid bouts of volatility, major U.S. stock market indexes recorded double-digit gains for the year ending October 31, 2010, lifted by economic optimism, encouraging earnings reports and a wave of corporate mergers. Aside from a January dip, stocks trended upward for the first half of the period amid indications the Great Recession was over. However, in April, lingering high unemployment and heightened concern over European debt sent equities falling. Markets regrouped in July, but fell again in August on mixed economic data. The final two months of the period brought renewed optimism, with the large-cap S&P 500® Index posting its best September/October performance since 1998. For the full 12 months, the S&P 500® rose 16.52%, while the blue-chip-laden Dow Jones Industrial AverageSM added 17.62% and the technology-heavy Nasdaq Composite® Index rose 23.72%. Among market segments, all 10 sectors in the S&P 500 posted gains, with more than half outperforming the broad-market index. Stocks of mid- and small-sized companies surged, with the Russell Midcap® Index adding 27.71% and Russell 2000® Index climbing 26.58%. Looking abroad, debt problems in several European countries cooled gains in developed markets, and yet the MSCI® EAFE® (Europe, Australasia, Far East) Index still rose 8.49%.
Comments from Keith Quinton, Portfolio Manager of Fidelity® Disciplined Equity Fund: The fund's Class K shares rose 11.25% for the year, trailing the S&P 500. The fund was hurt by our quantitative stock picking models, which do not factor in sudden changes in market tempo. Positioning in the weak-performing financials sector, notably detracted, as did security selection in technology, health care and utilities. The biggest individual disappointment was an out-of-index investment in asset manager BlackRock, a stock the fund no longer owned at period end. After acquiring Barclays Global Investors, BlackRock saw asset outflows, shrinking business and weak earnings, and its stock fell about 20% for the period. The fund also was hurt by overweighting technology giant Hewlett-Packard, whose stock dropped after its CEO was forced to resign in August amid a scandal. Not owning enough of mobile device leader Apple hurt relative results, as did holdings in JPMorgan Chase and Microsoft. Performance was helped by positioning in consumer staples, including stakes in Coca-Cola Enterprises and Anheuser-Busch InBev. Security selection in consumer discretionary contributed, including TRW Automotive Holdings, whose stock nearly tripled after it cut debt and grew profits. The fund's top individual contributor was database software supplier Sybase, acquired by SAP at a premium. Underweighting benchmark goliath and underperformer Exxon Mobil also contributed. Some of the stocks I've mentioned were not in the benchmark.
The views expressed above reflect those of the portfolio manager(s) only through the end of the period as stated on the cover of this report and do not necessarily represent the views of Fidelity or any other person in the Fidelity organization. Any such views are subject to change at any time based upon market or other conditions and Fidelity disclaims any responsibility to update such views. These views may not be relied on as investment advice and, because investment decisions for a Fidelity fund are based on numerous factors, may not be relied on as an indication of trading intent on behalf of any Fidelity fund.
Annual Report
Shareholder Expense Example
As a shareholder of the Fund, you incur two types of costs: (1) transaction costs, and (2) ongoing costs, including management fees and other Fund expenses. This Example is intended to help you understand your ongoing costs (in dollars) of investing in the Fund and to compare these costs with the ongoing costs of investing in other mutual funds.
The Example is based on an investment of $1,000 invested at the beginning of the period and held for the entire period (May 1, 2010 to October 31, 2010).
Actual Expenses
The first line of the accompanying table for each class of the Fund provides information about actual account values and actual expenses. You may use the information in this line, together with the amount you invested, to estimate the expenses that you paid over the period. Simply divide your account value by $1,000.00 (for example, an $8,600 account value divided by $1,000.00 = 8.6), then multiply the result by the number in the first line for a class of the Fund under the heading entitled "Expenses Paid During Period" to estimate the expenses you paid on your account during this period. A small balance maintenance fee of $12.00 that is charged once a year may apply for certain accounts with a value of less than $2,000. This fee is not included in the table below. If it was, the estimate of expenses you paid during the period would be higher, and your ending account value lower, by this amount. In addition, the Fund, as a shareholder in the underlying Fidelity Central Funds, will indirectly bear its pro-rata share of the fees and expenses incurred by the underlying Fidelity Central Funds. These fees and expenses are not included in the Fund's annualized expense ratio used to calculate the expense estimate in the table below.
Hypothetical Example for Comparison Purposes
The second line of the accompanying table for each class of the Fund provides information about hypothetical account values and hypothetical expenses based on a Class' actual expense ratio and an assumed rate of return of 5% per year before expenses, which is not the Class' actual return. The hypothetical account values and expenses may not be used to estimate the actual ending account balance or expenses you paid for the period. You may use this information to compare the ongoing costs of investing in the Fund and other funds. To do so, compare this 5% hypothetical example with the 5% hypothetical examples that appear in the shareholder reports of the other funds. A small balance maintenance fee of $12.00 that is charged once a year may apply for certain accounts with a value of less than $2,000. This fee is not included in the table below. If it was, the estimate of expenses you paid during the period would be higher, and your ending account value lower, by this amount. In addition, the Fund, as a shareholder in the underlying Fidelity Central Funds, will indirectly bear its pro-rata share of the fees and expenses incurred by the underlying Fidelity Central Funds. These fees and expenses are not included in the Fund's annualized expense ratio used to calculate the expense estimate in the table below.
Please note that the expenses shown in the table are meant to highlight your ongoing costs only and do not reflect any transaction costs. Therefore, the second line of the table is useful in comparing ongoing costs only, and will not help you determine the relative total costs of owning different funds.
Annual Report
| Annualized
Expense Ratio | Beginning
Account Value
May 1, 2010 | Ending
Account Value
October 31, 2010 | Expenses Paid
During Period*
May 1, 2010
to October 31, 2010 |
Disciplined Equity | .67% | | | |
Actual | | $ 1,000.00 | $ 976.60 | $ 3.34 |
HypotheticalA | | $ 1,000.00 | $ 1,021.83 | $ 3.41 |
Class K | .49% | | | |
Actual | | $ 1,000.00 | $ 977.50 | $ 2.44 |
HypotheticalA | | $ 1,000.00 | $ 1,022.74 | $ 2.50 |
Class F | .46% | | | |
Actual | | $ 1,000.00 | $ 977.90 | $ 2.29 |
HypotheticalA | | $ 1,000.00 | $ 1,022.89 | $ 2.35 |
A 5% return per year before expenses
* Expenses are equal to each Class' annualized expense ratio, multiplied by the average account value over the period, multiplied by 184/365 (to reflect the one-half year period).
Annual Report
Investment Changes (Unaudited)
Top Ten Stocks as of October 31, 2010 |
| % of fund's
net assets | % of fund's net assets
6 months ago |
Microsoft Corp. | 4.9 | 4.4 |
Chevron Corp. | 4.4 | 4.6 |
Hewlett-Packard Co. | 4.1 | 4.1 |
JPMorgan Chase & Co. | 3.4 | 2.9 |
Goldman Sachs Group, Inc. | 3.0 | 1.9 |
Marathon Oil Corp. | 3.0 | 2.6 |
Anheuser-Busch InBev SA NV | 3.0 | 2.4 |
Exxon Mobil Corp. | 2.6 | 0.0 |
Vodafone Group PLC sponsored ADR | 2.4 | 1.9 |
General Electric Co. | 2.3 | 2.5 |
| 33.1 | |
Top Five Market Sectors as of October 31, 2010 |
| % of fund's
net assets | % of fund's net assets
6 months ago |
Information Technology | 19.7 | 18.9 |
Financials | 14.4 | 16.4 |
Health Care | 11.5 | 11.7 |
Energy | 11.1 | 11.2 |
Industrials | 10.8 | 10.8 |
Asset Allocation (% of fund's net assets) |
As of October 31, 2010* | As of April 30, 2010** |
| Stocks 98.6% | | | Stocks and
Equity Futures 99.9% | |
| Short-Term
Investments and
Net Other Assets 1.4% | | | Short-Term
Investments and
Net Other Assets 0.1% | |
* Foreign investments | 13.6% | | ** Foreign investments | 11.6% | |

Annual Report
Investments October 31, 2010
Showing Percentage of Net Assets
Common Stocks - 98.6% |
| Shares | | Value (000s) |
CONSUMER DISCRETIONARY - 10.6% |
Auto Components - 2.3% |
TRW Automotive Holdings Corp. (a) | 5,273,000 | | $ 240,923 |
Automobiles - 1.7% |
Ford Motor Co. (a) | 13,100,000 | | 185,103 |
Media - 0.4% |
Comcast Corp. Class A (special) (non-vtg.) | 1,500,000 | | 28,995 |
Interpublic Group of Companies, Inc. (a) | 1,000,000 | | 10,350 |
| | 39,345 |
Multiline Retail - 2.1% |
Macy's, Inc. | 9,200,000 | | 217,488 |
Specialty Retail - 2.6% |
Best Buy Co., Inc. | 5,400,000 | | 232,092 |
TJX Companies, Inc. | 900,000 | | 41,301 |
| | 273,393 |
Textiles, Apparel & Luxury Goods - 1.5% |
Phillips-Van Heusen Corp. | 1,720,000 | | 105,505 |
VF Corp. | 600,000 | | 49,944 |
| | 155,449 |
TOTAL CONSUMER DISCRETIONARY | | 1,111,701 |
CONSUMER STAPLES - 9.9% |
Beverages - 5.1% |
Anheuser-Busch InBev SA NV | 4,938,240 | | 309,450 |
Coca-Cola Enterprises, Inc. | 1,751,800 | | 42,061 |
Constellation Brands, Inc. Class A (sub. vtg.) (a) | 5,315,577 | | 104,876 |
Dr Pepper Snapple Group, Inc. | 2,000,000 | | 73,100 |
| | 529,487 |
Food & Staples Retailing - 0.9% |
Wal-Mart Stores, Inc. | 1,800,000 | | 97,506 |
Household Products - 2.7% |
Kimberly-Clark Corp. | 1,500,000 | | 95,010 |
Procter & Gamble Co. | 2,900,000 | | 184,353 |
| | 279,363 |
Common Stocks - continued |
| Shares | | Value (000s) |
CONSUMER STAPLES - continued |
Tobacco - 1.2% |
British American Tobacco PLC sponsored ADR | 200,000 | | $ 15,246 |
Philip Morris International, Inc. | 2,000,000 | | 117,000 |
| | 132,246 |
TOTAL CONSUMER STAPLES | | 1,038,602 |
ENERGY - 11.1% |
Energy Equipment & Services - 0.6% |
Complete Production Services, Inc. (a) | 900,000 | | 21,087 |
Oil States International, Inc. (a) | 549,342 | | 28,082 |
Rowan Companies, Inc. (a) | 300,000 | | 9,870 |
| | 59,039 |
Oil, Gas & Consumable Fuels - 10.5% |
Chevron Corp. | 5,567,400 | | 459,923 |
Exxon Mobil Corp. | 4,129,780 | | 274,506 |
Holly Corp. | 300,000 | | 9,819 |
Marathon Oil Corp. | 8,800,000 | | 313,016 |
Sunoco, Inc. | 1,000,000 | | 37,470 |
| | 1,094,734 |
TOTAL ENERGY | | 1,153,773 |
FINANCIALS - 14.4% |
Capital Markets - 3.0% |
Goldman Sachs Group, Inc. | 1,950,000 | | 313,853 |
Commercial Banks - 1.2% |
Barclays PLC | 10,000,000 | | 43,939 |
Barclays PLC Sponsored ADR | 1,300,000 | | 22,945 |
HSBC Holdings PLC sponsored ADR | 200,000 | | 10,422 |
M&T Bank Corp. (d) | 700,000 | | 52,325 |
| | 129,631 |
Consumer Finance - 1.1% |
Capital One Financial Corp. | 3,100,000 | | 115,537 |
Diversified Financial Services - 4.9% |
Citigroup, Inc. (a) | 37,500,000 | | 156,375 |
JPMorgan Chase & Co. | 9,500,000 | | 357,485 |
�� | | 513,860 |
Insurance - 3.8% |
ACE Ltd. | 1,000,000 | | 59,420 |
Common Stocks - continued |
| Shares | | Value (000s) |
FINANCIALS - continued |
Insurance - continued |
AFLAC, Inc. | 1,000,000 | | $ 55,890 |
Allstate Corp. | 800,000 | | 24,392 |
Axis Capital Holdings Ltd. | 1,500,000 | | 51,015 |
MetLife, Inc. | 2,511,500 | | 101,289 |
Unum Group | 1,100,000 | | 24,662 |
XL Capital Ltd. Class A | 3,600,000 | | 76,140 |
| | 392,808 |
Real Estate Investment Trusts - 0.3% |
AvalonBay Communities, Inc. | 300,000 | | 31,893 |
Real Estate Management & Development - 0.1% |
CB Richard Ellis Group, Inc. Class A (a) | 500,000 | | 9,175 |
TOTAL FINANCIALS | | 1,506,757 |
HEALTH CARE - 11.5% |
Biotechnology - 3.4% |
Amgen, Inc. (a) | 2,274,000 | | 130,050 |
Biogen Idec, Inc. (a) | 1,000,000 | | 62,710 |
Cephalon, Inc. (a) | 2,298,000 | | 152,679 |
Gilead Sciences, Inc. (a) | 300,000 | | 11,901 |
| | 357,340 |
Health Care Equipment & Supplies - 0.2% |
Cooper Companies, Inc. | 500,000 | | 24,670 |
Health Care Providers & Services - 1.3% |
CIGNA Corp. | 579,200 | | 20,382 |
Humana, Inc. (a) | 1,870,000 | | 109,002 |
| | 129,384 |
Pharmaceuticals - 6.6% |
Impax Laboratories, Inc. (a) | 2,800,000 | | 52,752 |
Johnson & Johnson | 3,600,000 | | 229,212 |
Merck & Co., Inc. | 3,000,000 | | 108,840 |
Perrigo Co. | 940,100 | | 61,934 |
Pfizer, Inc. | 1,500,000 | | 26,100 |
Sanofi-Aventis | 2,000,000 | | 140,088 |
Teva Pharmaceutical Industries Ltd. sponsored ADR | 500,000 | | 25,950 |
Common Stocks - continued |
| Shares | | Value (000s) |
HEALTH CARE - continued |
Pharmaceuticals - continued |
Valeant Pharmaceuticals International, Inc. | 400,000 | | $ 11,068 |
Watson Pharmaceuticals, Inc. (a) | 600,000 | | 27,990 |
| | 683,934 |
TOTAL HEALTH CARE | | 1,195,328 |
INDUSTRIALS - 10.8% |
Aerospace & Defense - 1.0% |
United Technologies Corp. | 1,400,000 | | 104,678 |
Airlines - 0.8% |
Delta Air Lines, Inc. (a) | 2,000,000 | | 27,780 |
United Continental Holdings, Inc. (a) | 1,900,000 | | 55,176 |
| | 82,956 |
Building Products - 0.7% |
Owens Corning (a) | 2,594,667 | | 70,160 |
Commercial Services & Supplies - 0.1% |
Schawk, Inc. Class A | 700,000 | | 13,594 |
Construction & Engineering - 0.7% |
EMCOR Group, Inc. (a) | 400,000 | | 10,340 |
KBR, Inc. | 1,856,063 | | 47,144 |
URS Corp. (a) | 300,000 | | 11,679 |
| | 69,163 |
Electrical Equipment - 0.2% |
Regal-Beloit Corp. | 209,646 | | 12,099 |
Thomas & Betts Corp. (a) | 200,000 | | 8,710 |
| | 20,809 |
Industrial Conglomerates - 4.0% |
General Electric Co. | 15,200,000 | | 243,504 |
Siemens AG sponsored ADR (d) | 1,541,700 | | 176,232 |
| | 419,736 |
Machinery - 3.3% |
ArvinMeritor, Inc. (a) | 2,556,903 | | 42,393 |
Cummins, Inc. | 2,500,000 | | 220,250 |
Parker Hannifin Corp. | 200,000 | | 15,310 |
Timken Co. | 1,700,000 | | 70,414 |
| | 348,367 |
TOTAL INDUSTRIALS | | 1,129,463 |
Common Stocks - continued |
| Shares | | Value (000s) |
INFORMATION TECHNOLOGY - 19.7% |
Communications Equipment - 1.2% |
Cisco Systems, Inc. (a) | 4,200,000 | | $ 95,886 |
HTC Corp. | 1,478,000 | | 33,370 |
| | 129,256 |
Computers & Peripherals - 5.7% |
Apple, Inc. (a) | 200,000 | | 60,174 |
Hewlett-Packard Co. | 10,200,000 | | 429,012 |
SanDisk Corp. (a) | 2,794,861 | | 105,031 |
| | 594,217 |
Electronic Equipment & Components - 0.4% |
Jabil Circuit, Inc. | 2,100,000 | | 32,214 |
Vishay Intertechnology, Inc. (a) | 1,000,000 | | 11,300 |
| | 43,514 |
Internet Software & Services - 0.2% |
Baidu.com, Inc. sponsored ADR (a) | 100,000 | | 11,001 |
Digital River, Inc. (a) | 300,000 | | 11,178 |
| | 22,179 |
IT Services - 2.4% |
International Business Machines Corp. | 1,500,000 | | 215,400 |
VeriFone Holdings, Inc. (a) | 900,000 | | 30,447 |
| | 245,847 |
Office Electronics - 0.5% |
Xerox Corp. | 4,600,000 | | 53,820 |
Semiconductors & Semiconductor Equipment - 3.6% |
Intel Corp. | 5,300,000 | | 106,371 |
Micron Technology, Inc. (a) | 17,305,400 | | 143,116 |
Samsung Electronics Co. Ltd. | 182,977 | | 121,225 |
| | 370,712 |
Software - 5.7% |
Intuit, Inc. (a) | 1,100,000 | | 52,800 |
Microsoft Corp. | 19,200,000 | | 511,487 |
Red Hat, Inc. (a) | 700,000 | | 29,582 |
| | 593,869 |
TOTAL INFORMATION TECHNOLOGY | | 2,053,414 |
Common Stocks - continued |
| Shares | | Value (000s) |
MATERIALS - 3.8% |
Chemicals - 1.6% |
Ashland, Inc. | 2,846,495 | | $ 146,965 |
Kraton Performance Polymers, Inc. | 800,000 | | 25,968 |
| | 172,933 |
Metals & Mining - 2.2% |
Newmont Mining Corp. | 2,700,000 | | 164,349 |
Vale SA sponsored ADR | 1,900,000 | | 61,066 |
| | 225,415 |
TOTAL MATERIALS | | 398,348 |
TELECOMMUNICATION SERVICES - 3.3% |
Wireless Telecommunication Services - 3.3% |
MetroPCS Communications, Inc. (a) | 3,928,600 | | 40,897 |
Sprint Nextel Corp. (a) | 11,000,000 | | 45,320 |
Vodafone Group PLC sponsored ADR | 9,200,000 | | 253,092 |
| | 339,309 |
UTILITIES - 3.5% |
Independent Power Producers & Energy Traders - 2.4% |
AES Corp. (a) | 9,500,000 | | 113,430 |
NRG Energy, Inc. (a) | 6,780,000 | | 134,990 |
| | 248,420 |
Multi-Utilities - 1.1% |
Alliant Energy Corp. | 1,400,000 | | 51,142 |
CMS Energy Corp. | 3,700,000 | | 68,006 |
| | 119,148 |
TOTAL UTILITIES | | 367,568 |
TOTAL COMMON STOCKS (Cost $9,695,600) | 10,294,263 |
Money Market Funds - 2.3% |
| Shares | | Value (000s) |
Fidelity Cash Central Fund, 0.23% (b) | 188,062,876 | | $ 188,063 |
Fidelity Securities Lending Cash Central Fund, 0.24% (b)(c) | 54,588,088 | | 54,588 |
TOTAL MONEY MARKET FUNDS (Cost $242,651) | 242,651 |
TOTAL INVESTMENT PORTFOLIO - 100.9% (Cost $9,938,251) | | 10,536,914 |
NET OTHER ASSETS (LIABILITIES) - (0.9)% | | (94,471) |
NET ASSETS - 100% | $ 10,442,443 |
Legend |
(a) Non-income producing |
(b) Affiliated fund that is available only to investment companies and other accounts managed by Fidelity Investments. The rate quoted is the annualized seven-day yield of the fund at period end. A complete unaudited listing of the fund's holdings as of its most recent quarter end is available upon request. In addition, each Fidelity Central Fund's financial statements, which are not covered by the Fund's report of Independent Registered Public Accounting Firm, are available on the SEC's website or upon request. |
(c) Investment made with cash collateral received from securities on loan. |
(d) Security or a portion of the security is on loan at period end. |
Affiliated Central Funds |
Information regarding fiscal year to date income earned by the Fund from investments in Fidelity Central Funds is as follows: |
Fund | Income earned
(Amounts in
thousands) |
Fidelity Cash Central Fund | $ 240 |
Fidelity Securities Lending Cash Central Fund | 828 |
Total | $ 1,068 |
Other Affiliated Issuers |
An affiliated company is a company in which the Fund has ownership of at least 5% of the voting securities. Fiscal year to date transactions with companies which are or were affiliates are as follows: |
Affiliate
(Amounts in thousands) | Value, beginning of period | Purchases | Sales Proceeds | Dividend Income | Value,
end of
period |
Sybase, Inc. | $ 206,108 | $ 13,774 | $ 343,777 | $ - | $ - |
Total | $ 206,108 | $ 13,774 | $ 343,777 | $ - | $ - |
Other Information |
The following is a summary of the inputs used, as of October 31, 2010, involving the Fund's assets and liabilities carried at fair value. The inputs or methodology used for valuing securities may not be an indication of the risk associated with investing in those securities. For more information on valuation inputs, and their aggregation into the levels used in the table below, please refer to the Security Valuation section in the accompanying Notes to Financial Statements. |
Valuation Inputs at Reporting Date: |
Description
(Amounts in thousands) | Total | Level 1 | Level 2 | Level 3 |
Investments in Securities: | | | | |
Equities: | | | | |
Consumer Discretionary | $ 1,111,701 | $ 1,111,701 | $ - | $ - |
Consumer Staples | 1,038,602 | 1,038,602 | - | - |
Energy | 1,153,773 | 1,153,773 | - | - |
Financials | 1,506,757 | 1,462,818 | 43,939 | - |
Health Care | 1,195,328 | 1,055,240 | 140,088 | - |
Industrials | 1,129,463 | 1,129,463 | - | - |
Information Technology | 2,053,414 | 2,053,414 | - | - |
Materials | 398,348 | 398,348 | - | - |
Telecommunication Services | 339,309 | 339,309 | - | - |
Utilities | 367,568 | 367,568 | - | - |
Money Market Funds | 242,651 | 242,651 | - | - |
Total Investments in Securities: | $ 10,536,914 | $ 10,352,887 | $ 184,027 | $ - |
Distribution of investments by country of issue, as a percentage of total net assets, is as follows: (Unaudited) |
United States of America | 86.4% |
United Kingdom | 3.2% |
Belgium | 3.0% |
Germany | 1.7% |
France | 1.3% |
Korea (South) | 1.2% |
Others (Individually Less Than 1%) | 3.2% |
| 100.0% |
Income Tax Information |
At October 31, 2010, the Fund had a capital loss carryforward of approximately $2,872,513,000 of which $874,329,000 and $1,998,184,000 will expire on October 31, 2016 and 2017, respectively. Capital loss carryforwards are only available to offset future capital gains of the Fund to the extent provided by regulations and may be limited. |
See accompanying notes which are an integral part of the financial statements.
Annual Report
Statement of Assets and Liabilities
Amounts in thousands (except per-share amounts) | October 31, 2010 |
| | |
Assets | | |
Investment in securities, at value (including securities loaned of $53,509) - See accompanying schedule: Unaffiliated issuers (cost $9,695,600) | $ 10,294,263 | |
Fidelity Central Funds (cost $242,651) | 242,651 | |
Total Investments (cost $9,938,251) | | $ 10,536,914 |
Receivable for investments sold | | 330,086 |
Receivable for fund shares sold | | 10,249 |
Dividends receivable | | 3,052 |
Distributions receivable from Fidelity Central Funds | | 48 |
Other receivables | | 605 |
Total assets | | 10,880,954 |
| | |
Liabilities | | |
Payable for investments purchased | $ 353,087 | |
Payable for fund shares redeemed | 25,544 | |
Accrued management fee | 3,188 | |
Other affiliated payables | 1,780 | |
Other payables and accrued expenses | 324 | |
Collateral on securities loaned, at value | 54,588 | |
Total liabilities | | 438,511 |
| | |
Net Assets | | $ 10,442,443 |
Net Assets consist of: | | |
Paid in capital | | $ 12,699,786 |
Undistributed net investment income | | 76,361 |
Accumulated undistributed net realized gain (loss) on investments and foreign currency transactions | | (2,932,367) |
Net unrealized appreciation (depreciation) on investments | | 598,663 |
Net Assets | | $ 10,442,443 |
See accompanying notes which are an integral part of the financial statements.
Annual Report
Financial Statements - continued
Statement of Assets and Liabilities - continued
Amounts in thousands (except per-share amounts) | October 31, 2010 |
| | |
Disciplined Equity:
Net Asset Value, offering price and redemption price
per share ($8,942,518 ÷ 412,743 shares) | | $ 21.67 |
| | |
Class K:
Net Asset Value, offering price and redemption price per share ($141,005 ÷ 6,502 shares) | | $ 21.69 |
| | |
Class F:
Net Asset Value, offering price and redemption price per share ($1,358,920 ÷ 62,664 shares) | | $ 21.69 |
See accompanying notes which are an integral part of the financial statements.
Annual Report
Statement of Operations
Amounts in thousands | Year ended October 31, 2010 |
| | |
Investment Income | | |
Dividends | | $ 164,701 |
Interest | | 10 |
Income from Fidelity Central Funds | | 1,068 |
Total income | | 165,779 |
| | |
Expenses | | |
Management fee
Basic fee | $ 60,321 | |
Performance adjustment | (11,856) | |
Transfer agent fees | 22,921 | |
Accounting and security lending fees | 1,382 | |
Custodian fees and expenses | 320 | |
Independent trustees' compensation | 62 | |
Registration fees | 53 | |
Audit | 83 | |
Legal | 58 | |
Interest | 5 | |
Miscellaneous | 153 | |
Total expenses before reductions | 73,502 | |
Expense reductions | (1,693) | 71,809 |
Net investment income (loss) | | 93,970 |
Realized and Unrealized Gain (Loss) Net realized gain (loss) on: | | |
Investment securities: | | |
Unaffiliated issuers | 867,392 | |
Other affiliated issuers | 176,333 | |
Foreign currency transactions | 142 | |
Futures contracts | 5,363 | |
Capital gains distributions from Fidelity Central Funds | 6 | |
Total net realized gain (loss) | | 1,049,236 |
Change in net unrealized appreciation (depreciation) on: Investment securities | 493 | |
Futures contracts | 552 | |
Total change in net unrealized appreciation (depreciation) | | 1,045 |
Net gain (loss) | | 1,050,281 |
Net increase (decrease) in net assets resulting from operations | | $ 1,144,251 |
See accompanying notes which are an integral part of the financial statements.
Annual Report
Financial Statements - continued
Statement of Changes in Net Assets
Amounts in thousands | Year ended
October 31,
2010 | Year ended
October 31,
2009 |
Increase (Decrease) in Net Assets | | |
Operations | | |
Net investment income (loss) | $ 93,970 | $ 129,999 |
Net realized gain (loss) | 1,049,236 | (1,958,006) |
Change in net unrealized appreciation (depreciation) | 1,045 | 2,561,703 |
Net increase (decrease) in net assets resulting
from operations | 1,144,251 | 733,696 |
Distributions to shareholders from net investment income | (121,330) | (134,965) |
Share transactions - net increase (decrease) | (1,369,605) | 337,423 |
Total increase (decrease) in net assets | (346,684) | 936,154 |
| | |
Net Assets | | |
Beginning of period | 10,789,127 | 9,852,973 |
End of period (including undistributed net investment income of $76,361 and undistributed net investment income of $98,538, respectively) | $ 10,442,443 | $ 10,789,127 |
See accompanying notes which are an integral part of the financial statements.
Annual Report
Financial Highlights - Disciplined Equity
Years ended October 31, | 2010 | 2009 | 2008 | 2007 | 2006 |
Selected Per-Share Data | | | | | |
Net asset value, beginning of period | $ 19.72 | $ 18.78 | $ 33.37 | $ 30.83 | $ 26.71 |
Income from Investment Operations | | | | | |
Net investment income (loss) B | .18 | .24 | .29 | .27 | .22 |
Net realized and unrealized gain (loss) | 1.99 | .96 | (12.19) | 4.95 | 4.08 |
Total from investment operations | 2.17 | 1.20 | (11.90) | 5.22 | 4.30 |
Distributions from net investment income | (.22) | (.26) | (.26) | (.19) | (.18) |
Distributions from net realized gain | - | - | (2.43) | (2.49) | - |
Total distributions | (.22) | (.26) | (2.69) | (2.68) | (.18) |
Net asset value, end of period | $ 21.67 | $ 19.72 | $ 18.78 | $ 33.37 | $ 30.83 |
Total Return A | 11.05% | 6.64% | (38.68)% | 18.42% | 16.16% |
Ratios to Average Net Assets C, E | | | | | |
Expenses before reductions | .70% | .84% | .87% | .91% | .92% |
Expenses net of fee waivers,
if any | .70% | .84% | .87% | .91% | .92% |
Expenses net of all reductions | .68% | .83% | .87% | .90% | .91% |
Net investment income (loss) | .85% | 1.37% | 1.10% | .88% | .76% |
Supplemental Data | | | | | |
Net assets, end of period
(in millions) | $ 8,943 | $ 10,530 | $ 9,804 | $ 11,482 | $ 7,694 |
Portfolio turnover rate D | 146% | 200% | 186% | 152% | 98% |
A Total returns would have been lower had certain expenses not been reduced during the periods shown.
B Calculated based on average shares outstanding during the period.
C Fees and expenses of the underlying Fidelity Central Funds are not included in the Fund's expense ratio. The Fund indirectly bears its proportionate share of the expenses of any underlying Fidelity Central Funds.
D Amount does not include the portfolio activity of any underlying Fidelity Central Funds.
E Expense ratios reflect operating expenses of the class. Expenses before reductions do not reflect amounts reimbursed by the investment adviser or reductions from brokerage service arrangements or reductions from other expense offset arrangements and do not represent the amount paid by the class during periods when reimbursements or reductions occur. Expenses net of fee waivers reflect expenses after reimbursement by the investment adviser but prior to reductions from brokerage service arrangements or other expense offset arrangements. Expenses net of all reductions represent the net expenses paid by the class.
See accompanying notes which are an integral part of the financial statements.
Annual Report
Financial Highlights - Class K
Years ended October 31, | 2010 | 2009 | 2008 G |
Selected Per-Share Data | | | |
Net asset value, beginning of period | $ 19.74 | $ 18.79 | $ 27.38 |
Income from Investment Operations | | | |
Net investment income (loss) D | .22 | .28 | .12 |
Net realized and unrealized gain (loss) | 1.99 | .96 | (8.71) |
Total from investment operations | 2.21 | 1.24 | (8.59) |
Distributions from net investment income | (.26) | (.29) | - |
Net asset value, end of period | $ 21.69 | $ 19.74 | $ 18.79 |
Total Return B, C | 11.25% | 6.92% | (31.37)% |
Ratios to Average Net Assets E, H | | | |
Expenses before reductions | .52% | .61% | .71% A |
Expenses net of fee waivers, if any | .52% | .61% | .71% A |
Expenses net of all reductions | .51% | .60% | .71% A |
Net investment income (loss) | 1.03% | 1.59% | 1.30% A |
Supplemental Data | | | |
Net assets, end of period (in millions) | $ 141 | $ 184 | $ 49 |
Portfolio turnover rate F | 146% | 200% | 186% |
A Annualized
B Total returns for periods of less than one year are not annualized.
C Total returns would have been lower had certain expenses not been reduced during the periods shown.
D Calculated based on average shares outstanding during the period.
E Fees and expenses of the underlying Fidelity Central Funds are not included in the Fund's expense ratio. The Fund indirectly bears its proportionate share of the expenses of any underlying Fidelity Central Funds.
F Amount does not include the portfolio activity of any underlying Fidelity Central Funds.
G For the period May 9, 2008 (commencement of sale of shares) to October 31, 2008.
H Expense ratios reflect operating expenses of the class. Expenses before reductions do not reflect amounts reimbursed by the investment adviser or reductions from brokerage service arrangements or reductions from other expense offset arrangements and do not represent the amount paid by the class during periods when reimbursements or reductions occur. Expense ratios before reductions for start-up periods may not be representative of longer-term operating periods. Expenses net of fee waivers reflect expenses after reimbursement by the investment adviser but prior to reductions from brokerage service arrangements or other expense offset arrangements. Expenses net of all reductions represent the net expenses paid by the class.
See accompanying notes which are an integral part of the financial statements.
Annual Report
Financial Highlights - Class F
Years ended October 31, | 2010 | 2009 G |
Selected Per-Share Data | | |
Net asset value, beginning of period | $ 19.74 | $ 17.52 |
Income from Investment Operations | | |
Net investment income (loss) D | .22 | .02 |
Net realized and unrealized gain (loss) | 2.00 | 2.20 |
Total from investment operations | 2.22 | 2.22 |
Distributions from net investment income | (.27) | - |
Net asset value, end of period | $ 21.69 | $ 19.74 |
Total Return B, C | 11.31% | 12.67% |
Ratios to Average Net Assets E, H | | |
Expenses before reductions | .47% | .50% A |
Expenses net of fee waivers, if any | .47% | .50% A |
Expenses net of all reductions | .45% | .49% A |
Net investment income (loss) | 1.08% | .25% A |
Supplemental Data | | |
Net assets, end of period (in millions) | $ 1,359 | $ 75 |
Portfolio turnover rate F | 146% | 200% |
A Annualized
B Total returns for periods of less than one year are not annualized.
C Total returns would have been lower had certain expenses not been reduced during the periods shown.
D Calculated based on average shares outstanding during the period.
E Fees and expenses of the underlying Fidelity Central Funds are not included in the Fund's expense ratio. The Fund indirectly bears its proportionate share of the expenses of any underlying Fidelity Central Funds.
F Amount does not include the portfolio activity of any underlying Fidelity Central Funds.
G For the period June 26, 2009 (commencement of sale of shares) to October 31, 2009.
H Expense ratios reflect operating expenses of the class. Expenses before reductions do not reflect amounts reimbursed by the investment adviser or reductions from brokerage service arrangements or reductions from other expense offset arrangements and do not represent the amount paid by the class during periods when reimbursements or reductions occur. Expense ratios before reductions for start-up periods may not be representative of longer-term operating periods. Expenses net of fee waivers reflect expenses after reimbursement by the investment adviser but prior to reductions from brokerage service arrangements or other expense offset arrangements. Expenses net of all reductions represent the net expenses paid by the class.
See accompanying notes which are an integral part of the financial statements.
Annual Report
Notes to Financial Statements
For the period ended October 31, 2010
(Amounts in thousands except ratios)
1. Organization.
Fidelity Disciplined Equity Fund (the Fund) is a fund of Fidelity Capital Trust (the Trust) and is authorized to issue an unlimited number of shares. The Trust is registered under the Investment Company Act of 1940, as amended (the 1940 Act), as an open-end management investment company organized as a Massachusetts business trust. The Fund offers Disciplined Equity, Class K and Class F shares, each of which has equal rights as to assets and voting privileges. Each class has exclusive voting rights with respect to matters that affect that class. Class F shares of the Fund are only available for purchase by mutual funds for which Fidelity Management & Research Company (FMR) or an affiliate serves as investment manager. Investment income, realized and unrealized capital gains and losses, the common expenses of the Fund, and certain fund-level expense reductions, if any, are allocated on a pro-rata basis to each class based on the relative net assets of each class to the total net assets of the Fund. Each class differs with respect to transfer agent and distribution and service plan fees incurred. Certain expense reductions also differ by class.
2. Investments in Fidelity Central Funds.
The Fund may invest in Fidelity Central Funds, which are open-end investment companies available only to other investment companies and accounts managed by FMR and its affiliates. The Fund's Schedule of Investments lists each of the Fidelity Central Funds held as of period end, if any, as an investment of the Fund, but does not include the underlying holdings of each Fidelity Central Fund. As an Investing Fund, the Fund indirectly bears its proportionate share of the expenses of the underlying Fidelity Central Funds.
The Money Market Central Funds seek preservation of capital and current income and are managed by Fidelity Investments Money Management, Inc. (FIMM), an affiliate of FMR.
A complete unaudited list of holdings for each Fidelity Central Fund is available upon request or at the Securities and Exchange Commission (the SEC) web site at www.sec.gov. In addition, the financial statements of the Fidelity Central Funds, which are not covered by the Fund's Report of Independent Registered Public Accounting Firm, are available on the SEC web site or upon request.
3. Significant Accounting Policies.
The financial statements have been prepared in conformity with accounting principles generally accepted in the United States of America (GAAP), which require management to make certain estimates and assumptions at the date of the financial statements. Actual results could differ from those estimates. The following summarizes the significant accounting policies of the Fund:
Annual Report
Notes to Financial Statements - continued
(Amounts in thousands except ratios)
3. Significant Accounting Policies - continued
Security Valuation. Investments are valued as of 4:00 p.m. Eastern time on the last calendar day of the period. The Fund uses independent pricing services approved by the Board of Trustees to value its investments. When current market prices or quotations are not readily available or reliable, valuations may be determined in good faith in accordance with procedures adopted by the Board of Trustees. Factors used in determining value may include market or security specific events. The frequency with which these procedures are used cannot be predicted and they may be utilized to a significant extent. The value used for net asset value (NAV) calculation under these procedures may differ from published prices for the same securities.
The Fund categorizes the inputs to valuation techniques used to value its investments into a disclosure hierarchy consisting of three levels as shown below.
Level 1 - quoted prices in active markets for identical investments
Level 2 - other significant observable inputs (including quoted prices for similar investments, interest rates, prepayment speeds, etc.)
Level 3 - unobservable inputs (including the fund's own assumptions based on the best information available)
Changes in valuation techniques may result in transfers in or out of an assigned level within the disclosure hierarchy. The aggregate value of investments by input level, as of October 31, 2010, is included at the end of the Fund's Schedule of Investments. Valuation techniques used to value the Fund's investments by major category are as follows.
Equity securities, including restricted securities, for which market quotations are readily available, are valued at the last reported sale price or official closing price as reported by an independent pricing service on the primary market or exchange on which they are traded and are categorized as Level 1 in the hierarchy. In the event there were no sales during the day or closing prices are not available, securities are valued at the last quoted bid price or may be valued using the last available price and are generally categorized as Level 2 in the hierarchy. For foreign equity securities, when significant market or security specific events arise, comparisons to the valuation of American Depositary Receipts (ADRs), futures contracts, Exchange-traded funds (ETFs) and certain indexes as well as quoted prices for similar securities are used and are categorized as Level 2 in the hierarchy in these circumstances. Utilizing these techniques may result in transfers between Level 1 and Level 2. For restricted equity securities and private placements where observable inputs are limited, assumptions about market activity and risk are used and are categorized as Level 3 in the hierarchy.
Annual Report
3. Significant Accounting Policies - continued
Security Valuation - continued
Investments in open-end mutual funds, including the Fidelity Central Funds, are valued at their closing net asset value each business day and are categorized as Level 1 in the hierarchy. Short-term securities with remaining maturities of sixty days or less for which quotations are not readily available are valued at amortized cost, which approximates fair value and are categorized as Level 2 in the hierarchy.
Foreign Currency. The Fund uses foreign currency contracts to facilitate transactions in foreign-denominated securities. Gains and losses from these transactions may arise from changes in the value of the foreign currency or if the counterparties do not perform under the contracts' terms.
Foreign-denominated assets, including investment securities, and liabilities are translated into U.S. dollars at the exchange rate at period end. Purchases and sales of investment securities, income and dividends received and expenses denominated in foreign currencies are translated into U.S. dollars at the exchange rate in effect on the transaction date.
The effects of exchange rate fluctuations on investments are included with the net realized and unrealized gain (loss) on investment securities. Other foreign currency transactions resulting in realized and unrealized gain (loss) are disclosed separately.
Investment Transactions and Income. For financial reporting purposes, the Fund's investment holdings and NAV include trades executed through the end of the last business day of the period. The NAV per share for processing shareholder transactions is calculated as of the close of business of the New York Stock Exchange (NYSE), normally 4:00 p.m. Eastern time and includes trades executed through the end of the prior business day. Gains and losses on securities sold are determined on the basis of identified cost and may include proceeds received from litigation. Dividend income is recorded on the ex-dividend date, except for certain dividends from foreign securities where the ex-dividend date may have passed, which are recorded as soon as the Fund is informed of the ex-dividend date. Non-cash dividends included in dividend income, if any, are recorded at the fair market value of the securities received. Distributions received on securities that represent a return of capital or capital gain are recorded as a reduction of cost of investments and/or as a realized gain. The Fund estimates the components of distributions received that may be considered return of capital distributions or capital gain distributions. Interest income and distributions from the Fidelity Central Funds are accrued as earned. Interest income includes coupon interest and amortization of premium and accretion of discount on debt securities. Investment income is recorded net of foreign taxes withheld where recovery of such taxes is uncertain.
Annual Report
Notes to Financial Statements - continued
(Amounts in thousands except ratios)
3. Significant Accounting Policies - continued
Expenses. Most expenses of the Trust can be directly attributed to a fund. Expenses which cannot be directly attributed are apportioned amongst each fund in the Trust. Expense estimates are accrued in the period to which they relate and adjustments are made when actual amounts are known.
Deferred Trustee Compensation. Under a Deferred Compensation Plan (the Plan), independent Trustees may elect to defer receipt of a portion of their annual compensation. Deferred amounts are invested in a cross-section of Fidelity funds, are marked-to-market and remain in the Fund until distributed in accordance with the Plan. The investment of deferred amounts and the offsetting payable to the Trustees are included in the accompanying Statement of Assets and Liabilities.
Income Tax Information and Distributions to Shareholders. Each year the Fund intends to qualify as a regulated investment company, including distributing substantially all of its taxable income and realized gains under Subchapter M of the Internal Revenue Code and filing its U.S. federal tax return. As a result, no provision for income taxes is required. As of October 31, 2010, the Fund did not have any unrecognized tax benefits in the accompanying financial statements. A fund's federal tax return is subject to examination by the Internal Revenue Service (IRS) for a period of three years. Foreign taxes are provided for based on the Fund's understanding of the tax rules and rates that exist in the foreign markets in which it invests.
Distributions are declared and recorded on the ex-dividend date. Income dividends and capital gain distributions are declared separately for each class. Income and capital gain distributions are determined in accordance with income tax regulations, which may differ from GAAP.
Capital accounts within the financial statements are adjusted for permanent book-tax differences. These adjustments have no impact on net assets or the results of operations. Temporary book-tax differences will reverse in a subsequent period.
Book-tax differences are primarily due to the short-term gain distributions from the Fidelity Central Funds, futures transactions, foreign currency transactions, market discount, partnerships, deferred trustees compensation, capital loss carryforwards and losses deferred due to wash sales.
The federal tax cost of investment securities and unrealized appreciation (depreciation) as of period end were as follows:
Gross unrealized appreciation | $ 880,838 |
Gross unrealized depreciation | (342,029) |
Net unrealized appreciation (depreciation) | $ 538,809 |
| |
Tax Cost | $ 9,998,105 |
Annual Report
3. Significant Accounting Policies - continued
Income Tax Information and Distributions to Shareholders - continued
The tax-based components of distributable earnings as of period end were as follows:
Undistributed ordinary income | $ 76,550 |
Capital loss carryforward | $ (2,872,513) |
Net unrealized appreciation (depreciation) | $ 538,809 |
The tax character of distributions paid was as follows:
| October 31, 2010 | October 31, 2009 |
Ordinary Income | $ 121,330 | $ 134,965 |
4. Derivative Instruments.
Risk Exposures and the Use of Derivative Instruments. The Fund uses derivative instruments (derivatives), including futures contracts, in order to meet its investment objectives. The strategy is to use derivatives to increase returns and to manage exposure to certain risks as defined below. The success of any strategy involving derivatives depends on analysis of numerous economic factors, and if the strategies for investment do not work as intended, the Fund may not achieve its objectives.
The Fund's use of derivatives may increase or decrease its exposure to the following risk:
Equity Risk | Equity risk relates to the fluctuations in the value of financial instruments as a result of changes in market prices (other than those arising from interest rate risk or foreign exchange risk), whether caused by factors specific to an individual investment, its issuer, or all factors affecting all instruments traded in a market or market segment. |
The Fund is also exposed to additional risks from investing in derivatives, such as liquidity risk and counterparty credit risk. Liquidity risk is the risk that the Fund will be unable to sell the derivative in the open market in a timely manner. Counterparty credit risk is the risk that the counterparty will not be able to fulfill its obligation to the Fund. The Fund's maximum risk of loss from counterparty credit risk is generally the aggregate unrealized appreciation and unpaid counterparty fees in excess of any collateral pledged by the counterparty to the Fund. Counterparty risk related to exchange-traded futures contracts is minimal because of the protection provided by the exchange on which they trade. Risk of loss may exceed the amounts recognized in the Statement of Assets and Liabilities.
Annual Report
Notes to Financial Statements - continued
(Amounts in thousands except ratios)
4. Derivative Instruments - continued
Futures Contracts. A futures contract is an agreement between two parties to buy or sell a specified underlying instrument for a fixed price at a specified future date. The Fund uses futures contracts to manage its exposure to the stock market.
Upon entering into a futures contract, a fund is required to deposit either cash or securities (initial margin) with a clearing broker in an amount equal to a certain percentage of the face value of the contract. Futures contracts are marked-to-market daily and subsequent payments (variation margin) are made or received by a fund depending on the daily fluctuations in the value of the futures contracts and are recorded as unrealized appreciation or (depreciation). Realized gain or (loss) is recorded upon the expiration or closing of a futures contract.
The underlying face amount at value of open futures contracts at period end, if any, is shown in the Schedule of Investments under the caption "Futures Contracts." This amount reflects each contract's exposure to the underlying instrument at period end. Securities deposited to meet initial margin requirements are identified in the Schedule of Investments. The receivable and/or payable for the variation margin are reflected in the Statement of Assets and Liabilities.
Certain risks may arise upon entering into futures contracts, including the risk that an illiquid market may limit the ability to close out a futures contract prior to settlement date.
During the period the Fund recognized net realized gain (loss) of $5,363 and a change in net unrealized appreciation (depreciation) of $552 related to its investment in futures contracts. These amounts are included in the Statement of Operations.
5. Purchases and Sales of Investments.
Purchases and sales of securities, other than short-term securities, aggregated $15,327,643 and $16,802,758, respectively.
6. Fees and Other Transactions with Affiliates.
Management Fee. FMR and its affiliates provide the Fund with investment management related services for which the Fund pays a monthly management fee. The management fee is the sum of an individual fund fee rate that is based on an annual rate of .30% of the Fund's average net assets and a group fee rate that averaged .26% during the period. The group fee rate is based upon the average net assets of all the mutual funds advised by FMR. The group fee rate decreases as assets under management increase and increases as assets under management decrease. In addition, the management fee is subject to a performance adjustment (up to a maximum of ± .20% of the Fund's average net assets over a 36 month performance period). The upward or downward adjustment to
Annual Report
6. Fees and Other Transactions with Affiliates - continued
Management Fee - continued
the management fee is based on the relative investment performance of Disciplined Equity as compared to an appropriate benchmark index. For the period, the total annual management fee rate, including the performance adjustment, was .45% of the Fund's average net assets.
Transfer Agent Fees. Fidelity Investments Institutional Operations Company, Inc. (FIIOC), an affiliate of FMR, is the transfer, dividend disbursing and shareholder servicing agent for each class of the Fund. FIIOC receives account fees and asset-based fees that vary according to the account size and type of account of the shareholders of Disciplined Equity. FIIOC receives an asset-based fee of Class K's average net assets. FIIOC receives no fees for providing transfer agency services to Class F. FIIOC pays for typesetting, printing and mailing of shareholder reports, except proxy statements. For the period, transfer agent fees for each class were as follows:
| Amount | % of
Average
Net Assets |
Disciplined Equity | $ 22,818 | .23 |
Class K | 103 | .05 |
| $ 22,921 | |
Accounting and Security Lending Fees. Fidelity Service Company, Inc. (FSC), an affiliate of FMR, maintains the Fund's accounting records. The accounting fee is based on the level of average net assets for the month. Under a separate contract, FSC administers the security lending program. The security lending fee is based on the number and duration of lending transactions.
Brokerage Commissions. The Fund placed a portion of its portfolio transactions with brokerage firms which are affiliates of the investment adviser. The commissions paid to these affiliated firms were $244 for the period.
Interfund Lending Program. Pursuant to an Exemptive Order issued by the SEC, the Fund, along with other registered investment companies having management contracts with FMR, may participate in an interfund lending program. This program provides an alternative credit facility allowing the funds to borrow from, or lend money to, other participating affiliated funds. At period end, there were no interfund loans outstanding. The Fund's activity in this program during the period for which loans were outstanding was as follows:
Borrower or Lender | Average Daily Loan Balance | Weighted Average Interest Rate | Interest Expense |
Borrower | $ 23,957 | .43% | $ 5 |
Annual Report
Notes to Financial Statements - continued
(Amounts in thousands except ratios)
7. Committed Line of Credit.
The Fund participates with other funds managed by FMR or an affiliate in a $3.75 billion credit facility (the "line of credit") to be utilized for temporary or emergency purposes to fund shareholder redemptions or for other short-term liquidity purposes. The Fund has agreed to pay commitment fees on its pro-rata portion of the line of credit, which amounted to $43 and is reflected in Miscellaneous expenses on the Statement of Operations. During the period, there were no borrowings on this line of credit.
8. Security Lending.
The Fund lends portfolio securities through a lending agent from time to time in order to earn additional income. The lending agent may loan securities to certain qualified borrowers, including Fidelity Capital Markets (FCM), a broker-dealer affiliated with the Fund. On the settlement date of the loan, the Fund receives collateral (in the form of U.S. Treasury obligations, letters of credit and/or cash) against the loaned securities and maintains collateral in an amount not less than 100% of the market value of the loaned securities during the period of the loan. The market value of the loaned securities is determined at the close of business of the Fund and any additional required collateral is delivered to the Fund on the next business day. If the borrower defaults on its obligation to return the securities loaned because of insolvency or other reasons, a fund could experience delays and costs in recovering the securities loaned or in gaining access to the collateral. Any cash collateral received is invested in the Fidelity Securities Lending Cash Central Fund. The value of loaned securities and cash collateral at period end are disclosed on the Fund's Statement of Assets and Liabilities. Security lending income represents the income earned on investing cash collateral, less rebates paid to borrowers and lending agent fees associated with the loan, plus any premium payments received for lending certain types of securities. Security lending income is presented in the Statement of Operations as a component of income from Fidelity Central Funds. Total security lending income during the period amounted to $828. During the period, there were no securities loaned to FCM.
9. Expense Reductions.
Many of the brokers with whom FMR places trades on behalf of the Fund provided services to the Fund in addition to trade execution. These services included payments of certain expenses on behalf of the Fund totaling $1,693 for the period.
Annual Report
10. Distributions to Shareholders.
Distributions to shareholders of each class were as follows:
Years ended October 31, | 2010 | 2009A |
From net investment income | | |
Disciplined Equity | $ 116,715 | $ 132,354 |
Class K | 2,464 | 2,611 |
Class F | 2,151 | - |
Total | $ 121,330 | $ 134,965 |
A Distributions for Class F are for the period June 26, 2009 (commencement of sale of shares) to October 31, 2009.
11. Share Transactions.
Transactions for each class of shares were as follows:
| Shares | Dollars |
Years ended October 31, | 2010 | 2009 A, B | 2010 | 2009 A, B |
Disciplined Equity | | | | |
Shares sold | 48,761 | 80,765 | $ 1,024,807 | $ 1,370,832 |
Conversion to Class K | - | (7,396) | - | (131,798) |
Reinvestment of distributions | 5,559 | 7,952 | 115,802 | 131,216 |
Shares redeemed | (175,504) | (69,527) | (3,680,202) | (1,229,222) |
Net increase (decrease) | (121,184) | 11,794 | $ (2,539,593) | $ 141,028 |
Class K | | | | |
Shares sold | 5,579 | 2,494 | $ 117,922 | $ 42,351 |
Conversion from Disciplined Equity | - | 7,392 | - | 131,798 |
Reinvestment of distributions | 118 | 158 | 2,464 | 2,611 |
Shares redeemed | (8,493) | (3,351) | (175,735) | (59,298) |
Net increase (decrease) | (2,796) | 6,693 | $ (55,349) | $ 117,462 |
Class F | | | | |
Shares sold | 65,890 | 3,867 | $ 1,373,135 | $ 79,938 |
Reinvestment of distributions | 103 | - | 2,151 | - |
Shares redeemed | (7,147) | (49) | (149,949) | (1,005) |
Net increase (decrease) | 58,846 | 3,818 | $ 1,225,337 | $ 78,933 |
A Share transactions for Class F are for the period June 26, 2009 (commencement of sale of shares) to October 31, 2009.
B Conversion transactions for Class K and Disciplined Equity are presented for the period November 1, 2008 through August 31, 2009.
Annual Report
Notes to Financial Statements - continued
(Amounts in thousands except ratios)
12. Other.
The Fund's organizational documents provide former and current trustees and officers with a limited indemnification against liabilities arising in connection with the performance of their duties to the Fund. In the normal course of business, the Fund may also enter into contracts that provide general indemnifications. The Fund's maximum exposure under these arrangements is unknown as this would be dependent on future claims that may be made against the Fund. The risk of material loss from such claims is considered remote.
At the end of the period, Fidelity Freedom 2020 and Fidelity Freedom 2030 were the owners of record of approximately 13% and 12%, respectively, of the total outstanding shares of the Fund. The Fidelity Freedom and Freedom K Funds were the owners of record, in the aggregate, of approximately 74% of the total outstanding shares of the Fund.
Annual Report
To the Trustees of Fidelity Capital Trust and the Shareholders of Fidelity Disciplined Equity Fund:
In our opinion, the accompanying statement of assets and liabilities, including the schedule of investments, and the related statements of operations and of changes in net assets and the financial highlights present fairly, in all material respects, the financial position of Fidelity Disciplined Equity Fund (a fund of Fidelity Capital Trust) at October 31, 2010, the results of its operations for the year then ended, the changes in its net assets for each of the two years in the period then ended and the financial highlights for each of the periods indicated, in conformity with accounting principles generally accepted in the United States of America. These financial statements and financial highlights (hereafter referred to as "financial statements") are the responsibility of the Fidelity Disciplined Equity Fund's management. Our responsibility is to express an opinion on these financial statements based on our audits. We conducted our audits of these financial statements in accordance with the standards of the Public Company Accounting Oversight Board (United States). Those standards require that we plan and perform the audit to obtain reasonable assurance about whether the financial statements are free of material misstatement. An audit includes examining, on a test basis, evidence supporting the amounts and disclosures in the financial statements, assessing the accounting principles used and significant estimates made by management, and evaluating the overall financial statement presentation. We believe that our audits, which included confirmation of securities at October 31, 2010 by correspondence with the custodian and brokers, provide a reasonable basis for our opinion.
/s/ PricewaterhouseCoopers LLP
PricewaterhouseCoopers LLP
Boston, Massachusetts
December 14, 2010
Annual Report
The Trustees Member of the Advisory Board, and executive officers of the trust and fund, as applicable, are listed below. The Board of Trustees governs the fund and is responsible for protecting the interests of shareholders. The Trustees are experienced executives who meet periodically throughout the year to oversee the fund's activities, review contractual arrangements with companies that provide services to the fund, oversee management of the risks associated with such activities and contractual arrangements, and review the fund's performance. Except for James C. Curvey, each of the Trustees oversees 221 funds advised by FMR or an affiliate. Mr. Curvey oversees 410 funds advised by FMR or an affiliate.
The Trustees hold office without limit in time except that (a) any Trustee may resign; (b) any Trustee may be removed by written instrument, signed by at least two-thirds of the number of Trustees prior to such removal; (c) any Trustee who requests to be retired or who has become incapacitated by illness or injury may be retired by written instrument signed by a majority of the other Trustees; and (d) any Trustee may be removed at any special meeting of shareholders by a two-thirds vote of the outstanding voting securities of the trust. Each Trustee who is not an interested person (as defined in the 1940 Act) (Independent Trustee), shall retire not later than the last day of the calendar year in which his or her 72nd birthday occurs. The Independent Trustees may waive this mandatory retirement age policy with respect to individual Trustees. The executive officers and Advisory Board Member hold office without limit in time, except that any officer and Advisory Board Member may resign or may be removed by a vote of a majority of the Trustees at any regular meeting or any special meeting of the Trustees. Except as indicated, each individual has held the office shown or other offices in the same company for the past five years.
Experience, Skills, Attributes, and Qualifications of the Fund's Trustees. The Governance and Nominating Committee has adopted a statement of policy that describes the experience, qualifications, attributes, and skills that are necessary and desirable for potential Independent Trustee candidates (Statement of Policy). The Board believes that each Trustee satisfied at the time he or she was initially elected or appointed a Trustee, and continues to satisfy, the standards contemplated by the Statement of Policy. The Governance and Nominating Committee also engages professional search firms to help identify potential Independent Trustee candidates who have the experience, qualifications, attributes, and skills consistent with the Statement of Policy. From time to time, additional criteria based on the composition and skills of the current Independent Trustees, as well as experience or skills that may be appropriate in light of future changes to board composition, business conditions, and regulatory or other developments, have also been considered by the professional search firms and the Governance and Nominating Committee. In addition, the Board takes into account the Trustees' commitment and participation in Board and committee meetings, as well as their leadership of standing and ad hoc committees throughout their tenure.
In determining that a particular Trustee was and continues to be qualified to serve as a Trustee, the Board has considered a variety of criteria, none of which, in isolation, was controlling. The Board believes that, collectively, the Trustees have balanced and diverse experience, qualifications, attributes, and skills, which allow the Board to operate effectively in governing the fund and protecting the interests of shareholders. Information about the specific experience, skills, attributes, and qualifications of each Trustee, which in each case led to the Board's conclusion that the Trustee should serve (or continue to serve) as a trustee of the fund, is provided below.
Annual Report
Board Structure and Oversight Function. Edward C. Johnson 3d is an interested person (as defined in the 1940 Act) and currently serves as Chairman. The Trustees have determined that an interested Chairman is appropriate and benefits shareholders because an interested Chairman has a personal and professional stake in the quality and continuity of services provided to the fund. Independent Trustees exercise their informed business judgment to appoint an individual of their choosing to serve as Chairman, regardless of whether the Trustee happens to be independent or a member of management. The Independent Trustees have determined that they can act independently and effectively without having an Independent Trustee serve as Chairman and that a key structural component for assuring that they are in a position to do so is for the Independent Trustees to constitute a substantial majority for the Board. The Independent Trustees also regularly meet in executive session. Ned C. Lautenbach serves as Chairman of the Independent Trustees and as such (i) acts as a liaison between the Independent Trustees and management with respect to matters important to the Independent Trustees and (ii) with management prepares agendas for Board meetings.
Fidelity funds are overseen by different Boards of Trustees. The fund's Board oversees Fidelity's equity and high income funds and another Board oversees Fidelity's investment-grade bond, money market, and asset allocation funds. The asset allocation funds may invest in Fidelity funds overseen by the fund's Board. The use of separate Boards, each with its own committee structure, allows the Trustees of each group of Fidelity funds to focus on the unique issues of the funds they oversee, including common research, investment, and operational issues. On occasion, the separate Boards establish joint committees to address issues of overlapping consequences for the Fidelity funds overseen by each Board.
The Trustees operate using a system of committees to facilitate the timely and efficient consideration of all matters of importance to the Trustees, the fund, and fund shareholders and to facilitate compliance with legal and regulatory requirements and oversight of the fund's activities and associated risks. The Board, acting through its committees, has charged FMR and its affiliates with (i) identifying events or circumstances the occurrence of which could have demonstrably adverse effects on the fund's business and/or reputation; (ii) implementing processes and controls to lessen the possibility that such events or circumstances occur or to mitigate the effects of such events or circumstances if they do occur; and (iii) creating and maintaining a system designed to evaluate continuously business and market conditions in order to facilitate the identification and implementation processes described in (i) and (ii) above. Because the day-to-day operations and activities of the fund are carried out by or through FMR, its affiliates and other service providers, the fund's exposure to risks is mitigated but not eliminated by the processes overseen by the Trustees. While each of the Board's committees has responsibility for overseeing different aspects of the fund's activities, oversight is exercised primarily through the Operations, Audit, and Compliance Committees. Appropriate personnel, including but not limited to the fund's Chief Compliance Officer (CCO), FMR's internal auditor, the independent accountants, the fund's Treasurer and portfolio management personnel, make periodic reports to the Board's committees, as appropriate. The responsibilities of each committee, including their oversight responsibilities, are described further under "Standing Committees of the Fund's Trustees."
Annual Report
Trustees and Officers - continued
The fund's Statement of Additional Information (SAI) includes more information about the Trustees. To request a free copy, call Fidelity at 1-800-835-5092.
Interested Trustees*:
Correspondence intended for each Trustee who is an interested person may be sent to Fidelity Investments, 82 Devonshire Street, Boston, Massachusetts 02109.
Name, Age; Principal Occupations and Other Relevant Experience+ |
Edward C. Johnson 3d (80) |
| Year of Election or Appointment: 1978 Mr. Johnson is Trustee and Chairman of the Board of Trustees of certain Trusts. Mr. Johnson serves as Chief Executive Officer, Chairman, and a Director of FMR LLC; Chairman and a Director of FMR; Chairman and a Director of Fidelity Research & Analysis Company (FRAC); Chairman and a Director of Fidelity Investments Money Management, Inc.; and Chairman and a Director of FMR Co., Inc. In addition, Mr. Johnson serves as Chairman and Director of FIL Limited. Previously, Mr. Johnson served as President of FMR LLC (2006-2007). |
James C. Curvey (75) |
| Year of Election or Appointment: 2007 Mr. Curvey also serves as Trustee (2007-present) of other investment companies advised by FMR. Mr. Curvey is a Director of Fidelity Investments Money Management, Inc. (2009-present), Director of Fidelity Research & Analysis Co. (2009-present) and Director of FMR and FMR Co., Inc. (2007-present). Mr. Curvey is also Vice Chairman (2007-present) and Director of FMR LLC. In addition, Mr. Curvey serves as an Overseer for the Boston Symphony Orchestra and a member of the Trustees of Villanova University. Previously, Mr. Curvey was the Vice Chairman (2006-2007) and Director (2000-2007) of FMR Corp. |
* Trustees have been determined to be "Interested Trustees" by virtue of, among other things, their affiliation with the trust or various entities under common control with FMR.
Annual Report
+ The information above includes each Trustee's principal occupation during the last five years and other information relating to the experience, attributes, and skills relevant to each Trustee's qualifications to serve as a Trustee, which led to the conclusion that each Trustee should serve as a Trustee for the fund.
Independent Trustees:
Correspondence intended for each Independent Trustee (that is, the Trustees other than the Interested Trustees) may be sent to Fidelity Investments, P.O. Box 55235, Boston, Massachusetts 02205-5235.
Name, Age; Principal Occupations and Other Relevant Experience+ |
Dennis J. Dirks (62) |
| Year of Election or Appointment: 2005 Prior to his retirement in May 2003, Mr. Dirks was Chief Operating Officer and a member of the Board of The Depository Trust & Clearing Corporation (DTCC). He also served as President, Chief Operating Officer, and Board member of The Depository Trust Company (DTC) and President and Board member of the National Securities Clearing Corporation (NSCC). In addition, Mr. Dirks served as Chief Executive Officer and Board member of the Government Securities Clearing Corporation, Chief Executive Officer and Board member of the Mortgage-Backed Securities Clearing Corporation, as a Trustee and a member of the Finance Committee of Manhattan College (2005-2008), and as a Trustee and a member of the Finance Committee of AHRC of Nassau County (2006-2008). Mr. Dirks is a member of the Independent Directors Council (IDC) Governing Council (2010-Present) and Board of Directors for The Brookville Center for Children's Services, Inc. (2009-present). |
Alan J. Lacy (57) |
| Year of Election or Appointment: 2008 Mr. Lacy serves as Senior Adviser (2007-present) of Oak Hill Capital Partners, L.P. (private equity). Mr. Lacy also served as Chief Executive Officer (2000-2005) and Vice Chairman (2005-2006) of Sears Holdings Corporation and Sears, Roebuck and Co. (retail). In addition, Mr. Lacy serves as a member of the Board of Directors of The Western Union Company (global money transfer, 2006-present) and Bristol-
Myers Squibb Company (global pharmaceuticals, 2007-present). Mr. Lacy is Chairman (2008-present) and a member (2006-present) of the Board of Trustees of The National Parks Conservation Association. |
Ned C. Lautenbach (66) |
| Year of Election or Appointment: 2000 Mr. Lautenbach is Chairman of the Independent Trustees of the Equity and High Income Funds (2006-present). Mr. Lautenbach currently serves as the Lead Director of the Eaton Corporation Board of Directors (diversified industrial, 1997-present). Mr. Lautenbach is also a member of the Board of Directors of the Philharmonic Center for the Arts in Naples, Florida (1999-present); a member of the Board of Trustees of Fairfield University (2005-present); and a member of the Council on Foreign Relations (1994-present). Previously, Mr. Lautenbach was a Partner/Advisory Partner at Clayton, Dubilier & Rice, Inc. (private equity investment, 1998-2010), as well as a Director of Sony Corporation (2006-2007). |
Joseph Mauriello (66) |
| Year of Election or Appointment: 2008 Prior to his retirement in January 2006, Mr. Mauriello served in numerous senior management positions including Deputy Chairman and Chief Operating Officer (2004-2005), and Vice Chairman of Financial Services (2002-2004) of KPMG LLP US (professional services, 1965-2005). Mr. Mauriello currently serves as a member of the Board of Directors of XL Group plc. (global insurance and re-insurance, 2006-present) and of Arcadia Resources Inc. (health care services and products, 2007-present). Previously, Mr. Mauriello served as a Director of the Hamilton Funds of the Bank of New York (2006-2007). |
Cornelia M. Small (66) |
| Year of Election or Appointment: 2005 Ms. Small is a member of the Board of Directors of the Teagle Foundation (2009-present). Ms. Small is also a member of the Investment Committee, and Chair (2008-present) and a member of the Board of Trustees of Smith College. In addition, Ms. Small serves on the Investment Committee of the Berkshire Taconic Community Foundation (2008-present). Previously, Ms. Small served as Chairperson of the Investment Committee (2002-2008) of Smith College. In addition, Ms. Small served as Chief Investment Officer, Director of Global Equity Investments, and a member of the Board of Directors of Scudder, Stevens & Clark and Scudder Kemper Investments. |
William S. Stavropoulos (71) |
| Year of Election or Appointment: 2002 Mr. Stavropoulos is Vice Chairman of the Independent Trustees of the Equity and High Income Funds (2006-present). Mr. Stavropoulos serves as President and Founder of the Michigan Baseball Foundation, the Great Lakes Loons (2007-present). Mr. Stavropoulos is Chairman Emeritus of the Board of Directors of The Dow Chemical Company, where he previously served in numerous senior management positions, including President, CEO (1995-2000; 2002-2004), Chairman of the Executive Committee (2000-2006), and as a member of the Board of Directors (1990-2006). Currently, Mr. Stavropoulos is Chairman of Univar (global distributor of commodity and specialty chemicals, 2010-present), a Director of Teradata Corporation (data warehousing and technology solutions, 2008-present), Chemical Financial Corporation, Maersk Inc. (industrial conglomerate), Tyco International, Inc. (multinational manufacturing and services, 2007-present), and a member of the Advisory Board for Metalmark Capital (private equity investment, 2005-present). Mr. Stavropoulos is a special advisor to Clayton, Dubilier & Rice, Inc. (private equity investment). In addition, Mr. Stavropoulos is a member of the University of Notre Dame Advisory Council for the College of Science. |
David M. Thomas (61) |
| Year of Election or Appointment: 2008 Previously, Mr. Thomas served as Executive Chairman (2005-2006) and Chairman and Chief Executive Officer (2000-2005) of IMS Health, Inc. (pharmaceutical and healthcare information solutions). In addition, Mr. Thomas serves as a member of the Board of Directors of Fortune Brands, Inc. (consumer products), and Interpublic Group of Companies, Inc. (marketing communication, 2004-present). |
Michael E. Wiley (60) |
| Year of Election or Appointment: 2008 Mr. Wiley also serves as a Director of Asia Pacific Exploration Consolidated (international oil and gas exploration and production, 2008-
present). Mr. Wiley serves as a Director of Tesoro Corporation (independent oil refiner and marketer, 2005-present), and a Director of Bill Barrett Corporation (exploration and production, 2005-present). In addition, Mr. Wiley also serves as a Director of Post Oak Bank (privately-held bank, 2004-present). Previously, Mr. Wiley served as a member of the Board of Trustees of the University of Tulsa (2000-2006; 2007-2010), as a Senior Energy Advisor of Katzenbach Partners, LLC (consulting, 2006-2007), as an Advisory Director of Riverstone Holdings (private investment), Chairman, President, and CEO of Baker Hughes, Inc. (oilfield services, 2000-2004), and as Director of Spinnaker Exploration Company (exploration and production, 2001-2005). |
Annual Report
Trustees and Officers - continued
+ The information above includes each Trustee's principal occupation during the last five years and other information relating to the experience, attributes, and skills relevant to each Trustee's qualifications to serve as a Trustee, which led to the conclusion that each Trustee should serve as a Trustee for the fund.
Advisory Board Member and Executive Officers:
Correspondence intended for each executive officer and Peter S. Lynch may be sent to Fidelity Investments, 82 Devonshire Street, Boston, Massachusetts 02109.
Name, Age; Principal Occupation |
Peter S. Lynch (66) |
| Year of Election or Appointment: 2003 Member of the Advisory Board of Fidelity's Equity and High Income Funds. Mr. Lynch is Vice Chairman and a Director of FMR and FMR Co., Inc. In addition, Mr. Lynch serves as a Trustee of Boston College and as the Chairman of the Inner-City Scholarship Fund. Previously, Mr. Lynch served on the Special Olympics International Board of Directors (1997-2006). |
Kenneth B. Robins (41) |
| Year of Election or Appointment: 2008 President and Treasurer of Fidelity's Equity and High Income Funds. Mr. Robins also serves as President and Treasurer (2010-present) and Assistant Treasurer (2009-present) of other Fidelity funds and is an employee of Fidelity Investments (2004-present). Previously, Mr. Robins served as Deputy Treasurer of the Fidelity funds (2005-2008) and Treasurer and Chief Financial Officer of The North Carolina Capital Management Trust: Cash and Term Portfolios (2006-2008). |
Bruce T. Herring (45) |
| Year of Election or Appointment: 2006 Vice President of certain Equity Funds. Mr. Herring also serves as Chief Investment Officer and Director of Fidelity Management & Research (U.K.) Inc. (2010-present) and Group Chief Investments Officer of FMR. Previously, Mr. Herring served as Vice President (2005-2006) and Senior Vice President (2006-2007) of Fidelity Management & Research Company, Vice President of FMR Co., Inc. (2001-2007) and as a portfolio manager for Fidelity U.S. Equity Funds. |
Brian B. Hogan (46) |
| Year of Election or Appointment: 2009 Vice President of certain Equity Funds and Vice President of Sector Funds. Mr. Hogan also serves as President of FMR's Equity Division (2009-present). Previously, Mr. Hogan served as Senior Vice President, Equity Research of FMR (2006-2009) and as a portfolio manager. |
Scott C. Goebel (42) |
| Year of Election or Appointment: 2008 Secretary and Chief Legal Officer (CLO) of the Fidelity funds. Mr. Goebel also serves as Secretary and CLO of The North Carolina Capital Management Trust: Cash and Term Portfolio (2008-present); General Counsel, Secretary, and Senior Vice President of FMR (2008-present) and FMR Co., Inc. (2008-present); Deputy General Counsel of FMR LLC; Chief Legal Officer of Fidelity Management & Research (Hong Kong) Limited (2008-present) and Assistant Secretary of Fidelity Management & Research (Japan) Inc. (2008-present), Fidelity Investments Money Management, Inc. (2008-present), Fidelity Management & Research (U.K.) Inc. (2008-present), and Fidelity Research and Analysis Company (2008-present). Previously, Mr. Goebel served as Assistant Secretary of the Funds (2007-2008) and as Vice President and Secretary of Fidelity Distributors Corporation (FDC) (2005-2007). |
William C. Coffey (41) |
| Year of Election or Appointment: 2009 Assistant Secretary of Fidelity's Equity and High Income Funds. Mr. Coffey also serves as Senior Vice President and Deputy General Counsel of FMR LLC (2010-present), and is an employee of Fidelity Investments. Previously, Mr. Coffey served as Vice President and Associate General Counsel of FMR LLC (2005-2009). |
Holly C. Laurent (56) |
| Year of Election or Appointment: 2008 Anti-Money Laundering (AML) Officer of the Fidelity funds. Ms. Laurent also serves as AML Officer of The North Carolina Capital Management Trust: Cash and Term Portfolio (2008-present) and is an employee of Fidelity Investments. Previously, Ms. Laurent was Senior Vice President and Head of Legal for Fidelity Business Services India Pvt. Ltd. (2006-2008), and Senior Vice President, Deputy General Counsel and Group Head for FMR LLC (2005-2006). |
Christine Reynolds (52) |
| Year of Election or Appointment: 2008 Chief Financial Officer of the Fidelity funds. Ms. Reynolds became President of Fidelity Pricing and Cash Management Services (FPCMS) in August 2008. Ms. Reynolds served as Chief Operating Officer of FPCMS (2007-2008). Previously, Ms. Reynolds served as President, Treasurer, and Anti-Money Laundering officer of the Fidelity funds (2004-2007). |
Kenneth A. Rathgeber (63) |
| Year of Election or Appointment: 2004 Chief Compliance Officer of Fidelity's Equity and High Income Funds. Mr. Rathgeber is Chief Compliance Officer of Fidelity Management & Research (Hong Kong) Limited (2008-present), Fidelity Management & Research (Japan) Inc. (2008-present), FMR (2005-present), FMR Co., Inc. (2005-present), Fidelity Management & Research (U.K.) Inc. (2005-present), Fidelity Research & Analysis Company (2005-present), Fidelity Investments Money Management, Inc. (2005-present), Pyramis Global Advisors, LLC (2005-present), and Strategic Advisers, Inc. (2005-present). |
Jeffrey S. Christian (49) |
| Year of Election or Appointment: 2009 Deputy Treasurer of the Fidelity funds. Mr. Christian is an employee of Fidelity Investments. Previously, Mr. Christian served as Chief Financial Officer (2008-2009) of certain Fidelity funds and Senior Vice President of Fidelity Pricing and Cash Management Services (FPCMS) (2004-2009). |
Bryan A. Mehrmann (49) |
| Year of Election or Appointment: 2005 Deputy Treasurer of the Fidelity funds. Mr. Mehrmann is an employee of Fidelity Investments. |
Adrien E. Deberghes (43) |
| Year of Election or Appointment: 2008 Deputy Treasurer of Fidelity's Equity and High Income Funds. Mr. Deberghes also serves as Assistant Treasurer of other Fidelity funds (2010-present) and is an employee of Fidelity Investments (2008-present). Previously, Mr. Deberghes served as Senior Vice President of Mutual Fund Administration at State Street Corporation (2007-2008), Senior Director of Mutual Fund Administration at Investors Bank & Trust (2005-2007), and Director of Finance for Dunkin' Brands (2000-2005). |
Stephanie J. Dorsey (41) |
| Year of Election or Appointment: 2010 Assistant Treasurer of Fidelity's Equity and High Income Funds. Ms. Dorsey also serves as Deputy Treasurer of other Fidelity funds (2008-present) and is an employee of Fidelity Investments (2008-present). Previously, Ms. Dorsey served as Treasurer (2004-2008) of the JPMorgan Mutual Funds and Vice President (2004-2008) of JPMorgan Chase Bank. |
Name, Age; Principal Occupation |
John R. Hebble (52) |
| Year of Election or Appointment: 2009 Assistant Treasurer of Fidelity's Equity and High Income Funds. Mr. Hebble also serves as Treasurer and Chief Financial Officer of The North Carolina Capital Management Trust: Cash and Term Portfolio (2008-present), President and Treasurer of other Fidelity funds (2008-present) and is an employee of Fidelity Investments. |
Gary W. Ryan (52) |
| Year of Election or Appointment: 2005 Assistant Treasurer of the Fidelity funds. Mr. Ryan is an employee of Fidelity Investments. Previously, Mr. Ryan served as Vice President of Fund Reporting in Fidelity Pricing and Cash Management Services (FPCMS) (1999-2005). |
Jonathan Davis (42) |
| Year of Election or Appointment: 2010 Assistant Treasurer of the Fidelity funds. Mr. Davis is an employee of Fidelity Investments. Previously, Mr. Davis served as Vice President and Associate General Counsel of FMR LLC (2003-2010). |
Annual Report
Class K designates 100% of the dividends distributed during the fiscal year as qualifying for the dividends-received deduction for corporate shareholders.
Class K designates 100% of the dividend distributed in December during the fiscal year as amounts which may be taken into account as a dividend for the purposes of the maximum rate under section 1(h)(11) of the Internal Revenue Code.
The fund will notify shareholders in January 2011 of amounts for use in preparing 2010 income tax returns.
Annual Report
Board Approval of Investment Advisory Contracts and Management Fees
Fidelity Disciplined Equity Fund
Each year, the Board of Trustees, including the Independent Trustees (together, the Board), votes on the renewal of the management contract and sub-advisory agreements (together, the Advisory Contracts) for the fund. The Board, assisted by the advice of fund counsel and Independent Trustees' counsel, requests and considers a broad range of information relevant to the renewal of the Advisory Contracts throughout the year.
The Board meets regularly and considers at each of its meetings factors that are relevant to its annual consideration of the renewal of the fund's Advisory Contracts, including the services and support provided to the fund and its shareholders. The Board has established various standing committees, each composed of Independent Trustees with varying backgrounds, to which the Board has assigned specific subject matter responsibilities in order to enhance effective decision-making by the Board. The Board, acting directly and through its Committees, requests and receives information concerning the annual consideration of the renewal of the fund's Advisory Contracts. The Board also meets as needed to consider matters specifically related to the Board's annual consideration of the renewal of Advisory Contracts. Members of the Board may also meet with trustees of other Fidelity funds through ad hoc joint committees to discuss certain matters relevant to the Fidelity funds.
At its July 2010 meeting, the Board of Trustees, including the Independent Trustees, unanimously determined to renew the fund's Advisory Contracts. In reaching its determination, the Board considered all factors it believed relevant, including (i) the nature, extent, and quality of the services to be provided to the fund and its shareholders (including the investment performance of the fund); (ii) the competitiveness of the fund's management fee and total expenses; (iii) the total costs of the services to be provided by and the profits to be realized by Fidelity from its relationship with the fund; (iv) the extent to which economies of scale would be realized as the fund grows; and (v) whether fee levels reflect these economies of scale, if any, for the benefit of fund shareholders.
In considering whether to renew the Advisory Contracts for the fund, the Board reached a determination, with the assistance of fund counsel and Independent Trustees' counsel and through the exercise of its business judgment, that the renewal of the Advisory Contracts is in the best interests of fund shareholders and that the compensation to be received by Fidelity under the management contract is fair and reasonable. The Board's decision to renew the Advisory Contracts was not based on any single factor noted above, but rather was based on a comprehensive consideration of all the information provided to the Board at its meetings throughout the year. The Board, in reaching its determination to renew the Advisory Contracts, is aware that shareholders in the fund have a broad range of investment choices available to them, including a wide choice among mutual funds offered by Fidelity's competitors, and that the fund's shareholders, with the opportunity to review and weigh the disclosure provided by the fund in its prospectus and other public disclosures, have chosen to invest in this fund, managed by Fidelity.
Annual Report
Board Approval of Investment Advisory Contracts and
Management Fees - continued
Nature, Extent, and Quality of Services Provided. The Board considered the staffing within the investment adviser, FMR, and the sub-advisers (together, the Investment Advisers), including the backgrounds of the fund's investment personnel and the fund's investment objective and discipline. The Independent Trustees also had discussions with senior management of Fidelity's investment operations and investment groups. The Board considered the structure of the portfolio manager compensation program and whether this structure provides appropriate incentives to act in the best interest of the fund.
Resources Dedicated to Investment Management and Support Services. The Board and the equity research subcommittee of the Board's Fund Oversight Committee reviewed the size, education, and experience of the Investment Advisers' investment staff, their use of technology, and the Investment Advisers' approach to recruiting, training, and retaining portfolio managers and other research, advisory, and management personnel. The Board noted that Fidelity's analysts have access to a variety of technological tools and market and securities data that enable them to perform both fundamental and quantitative analysis and to specialize in various disciplines. The Board considered Fidelity's extensive global research capabilities that enable the Investment Advisers to aggregate data from various sources in an effort to produce positive investment results. The Board also considered that Fidelity's portfolio managers and analysts have access to daily portfolio attribution that allows for monitoring of a fund's portfolio, as well as an electronic communication system that provides immediate real-time access to research concerning issuers and credit enhancers. The Board noted FMR's continued focus on strengthening the organization and discipline of equity portfolio management and research.
Shareholder and Administrative Services. The Board considered (i) the nature, extent, quality, and cost of advisory, administrative, and shareholder services performed by the Investment Advisers and their affiliates under the Advisory Contracts and under separate agreements covering transfer agency, pricing and bookkeeping, and securities lending services for the fund; (ii) the nature and extent of the investment adviser's supervision of third party service providers, principally custodians and subcustodians; and (iii) the resources devoted to, and the record of compliance with, the fund's compliance policies and procedures. The Board also reviewed the allocation of fund brokerage, including allocations to brokers affiliated with the Investment Advisers, the use of brokerage commissions to pay fund expenses, and the use of "soft" commission dollars to pay for research services.
The Board noted that the growth of fund assets over time across the complex allows Fidelity to reinvest in the development of services designed to enhance the value or convenience of the Fidelity funds as investment vehicles. These services include 24-hour access to account information and market information through phone representatives and over the Internet, and investor education materials and asset allocation tools.
Annual Report
Investment in a Large Fund Family. The Board considered the benefits to shareholders of investing in a Fidelity fund, including the benefits of investing in a fund that is part of a large family of funds offering a variety of investment disciplines and providing a large variety of mutual fund investor services. The Board noted that Fidelity had taken, or had made recommendations that resulted in the Fidelity funds taking, a number of actions over the previous year that benefited particular funds, including (i) dedicating additional resources to investment research and restructuring and broadening the focus of the investment research teams; (ii) bolstering the senior management team that oversees asset management; (iii) launching Class F of certain funds as a lower-fee class available to Freedom K and Freedom Index Funds; (iv) lowering the initial investment minimums and ongoing balance requirements for Real Estate High Income Fund; (v) eliminating subsequent purchase minimums for all funds and adding a waiver of the investment minimum requirement for new accounts opened with the proceeds of a systematic withdrawal plan; (vi) eliminating the withdrawal minimum and maximum limits for systematic withdrawals from Advisor funds; (vii) expanding sales load waivers on Class A shares for Destiny Planholders and expanding Institutional Class eligibility for Class O Destiny Planholders; and (viii) changing certain Class A and Class T sales charge structures to further align them with industry practices.
Investment Performance. The Board considered whether the fund has operated in accordance with its investment objective, as well as its record of compliance with its investment restrictions. It also reviewed the fund's absolute investment performance for each class (except Class F), as well as the fund's relative investment performance for each class (except Class F) measured over multiple periods against (i) a broad-based securities market index, and (ii) a peer group of mutual funds deemed appropriate by Fidelity and reviewed by the Board. The following charts considered by the Board show, over the one-, three-, and five-year periods ended December 31, 2009, as available, the cumulative total returns of Class K and the retail class of the fund, the cumulative total returns of a broad-based securities market index ("benchmark"), and a range of cumulative total returns of a peer group of mutual funds identified by Morningstar, Inc. as having an investment style similar to that of the fund based on underlying portfolio holdings. (Class F of the fund had less than one year of performance as of December 31, 2009.) The box within each chart shows the 25th percentile return (bottom of box) and the 75th percentile return (top of box) of the peer group. Returns shown above the box are in the first quartile and returns shown below the box are in the fourth quartile. The percentage beaten numbers noted below each chart correspond to the percentile box and represent the percentage of funds in the peer group whose performance was equal to or lower than that of the class indicated.
Annual Report
Board Approval of Investment Advisory Contracts and
Management Fees - continued
Fidelity Disciplined Equity Fund
The Board reviewed the fund's relative investment performance against its peer group and noted that the performance of the retail class of the fund (the class with the longer performance record) was in the fourth quartile for the one- and three-year periods and the second quartile for the five-year period. The Board also noted that the investment performance of the fund was lower than its benchmark for the one- and three-year periods, although the five-year cumulative total return of the retail class compared favorably to its benchmark. The Board considered that the variations in performance between the fund's classes reflect the variations in class expenses, which result in lower performance for the higher expense class. The Board discussed with FMR actions that have been taken by FMR to improve the fund's more recent disappointing performance relative to its peer group and benchmark. The Board also reviewed the fund's performance since inception as well as performance in the current year. The Board will continue to closely monitor the performance of the fund in the coming year and discuss with FMR other appropriate actions to address the performance of the fund.
The Board also considered that the fund's management fee is subject to upward or downward adjustment depending upon whether, and to what extent, the fund's investment performance for the performance period exceeds, or is exceeded by, the record (over the same period) of a Board-approved performance adjustment index. The Board realizes that the performance adjustment provides FMR with a strong economic incentive to seek to achieve superior performance for the fund's shareholders and helps to more closely align the interests of FMR and the fund's shareholders.
Annual Report
Based on its review, and giving particular weight to the nature and quality of the resources dedicated by the Investment Advisers to maintain and improve relative performance and factoring in the unprecedented market events in recent years, the Board concluded that the nature, extent, and quality of investment management and support services and of shareholder and administrative services provided to the fund will benefit the fund's shareholders, particularly in light of the Board's view that the fund's shareholders benefit from investing in a fund that is part of a large family of funds offering a variety of investment disciplines and services.
Competitiveness of Management Fee and Total Fund Expenses. The Board considered the fund's management fee and total expenses compared to "mapped groups" of competitive funds and classes. Fidelity creates "mapped groups" by combining similar Lipper investment objective categories that have comparable management fee characteristics. Combining Lipper investment objective categories aids the Board's management fee and total expense comparisons by broadening the competitive group used for comparison and by reducing the number of universes to which various Fidelity funds are compared.
Management Fee. The Board considered two proprietary management fee comparisons for the 12-month periods shown in the chart below. The group of Lipper funds used by the Board for management fee comparisons is referred to below as the "Total Mapped Group." The Total Mapped Group comparison focuses on a fund's standing relative to the total universe of comparable funds available to investors, in terms of gross management fees before expense reimbursements or caps, and without giving effect to the fund's performance adjustment. "TMG %" represents the percentage of funds in the Total Mapped Group that had management fees that were lower than the fund's. For example, a TMG % of 10% means that 90% of the funds in the Total Mapped Group had higher management fees than the fund. The "Asset-Size Peer Group" (ASPG) comparison focuses on a fund's standing relative to non-Fidelity funds similar in size to the fund within the Total Mapped Group. The ASPG represents at least 15% of the funds in the Total Mapped Group with comparable asset size and management fee characteristics, subject to a minimum of 50 funds (or all funds in the Total Mapped Group if fewer than 50). Additional information, such as the ASPG quartile in which the fund's management fee ranked and the impact of the fund's performance adjustment, is also included in the chart and considered by the Board.
Annual Report
Board Approval of Investment Advisory Contracts and
Management Fees - continued
Fidelity Disciplined Equity Fund
The Board noted that the fund's management fee ranked below the median of its Total Mapped Group and below the median of its ASPG for 2009. The Board also noted the effect of the fund's negative performance adjustment on the fund's management fee ranking. The Board noted that the performance adjustment for each year represents calculations for performance periods that differ from the periods shown in the performance charts above.
Based on its review, the Board concluded that the fund's management fee is fair and reasonable in light of the services that the fund receives and the other factors considered.
Total Expenses. In its review of each class's total expenses, the Board considered the fund's management fee as well as other fund or class expenses, as applicable, such as transfer agent fees, pricing and bookkeeping fees, and custodial, legal, and audit fees. The Board also noted the effects of any waivers and reimbursements on fees and expenses, as well as the impact of the fund's performance adjustment. As part of its review, the Board also considered current and historical total expenses of each class of the fund compared to competitive fund median expenses. Each class of the fund is compared to those funds and classes in the Total Mapped Group (used by the Board for management fee comparisons) that have a similar sales load structure.
The Board noted that the total expenses of each class ranked below its competitive median for the period.
Annual Report
Fees Charged to Other Fidelity Clients. The Board also considered Fidelity fee structures and other information with respect to clients of FMR and its affiliates, such as other mutual funds advised or subadvised by FMR or its affiliates, pension plan clients, and other institutional clients. In March 2010, the Board created an ad hoc joint committee with the board of other Fidelity funds (the Committee) to review and compare Fidelity's institutional investment advisory business with its business of providing services to the Fidelity funds, including the differences in services provided, fees charged, and costs incurred, as well as competition in their respective marketplaces.
Based on its review of total expenses and fees charged to other Fidelity clients, the Board concluded that the total expenses of each class of the fund were reasonable in light of the services that the fund and its shareholders receive and the other factors considered, including the findings of the Committee.
Costs of the Services and Profitability. The Board considered the revenues earned and the expenses incurred by Fidelity in conducting the business of developing, marketing, distributing, managing, administering and servicing the fund and its shareholders. The Board also considered the level of Fidelity's profits in respect of all the Fidelity funds.
On an annual basis, FMR presents to the Board Fidelity's profitability for the fund. Fidelity calculates the profitability for each fund, as well as aggregate profitability for groups of Fidelity funds and all Fidelity funds, using a series of detailed revenue and cost allocation methodologies which originate with the audited books and records of Fidelity. The Audit Committee of the Board reviews any significant changes from the prior year's methodologies.
PricewaterhouseCoopers LLP (PwC), independent registered public accounting firm and auditor to Fidelity and certain Fidelity funds, has been engaged annually by the Board as part of the Board's assessment of Fidelity's profitability analysis. PwC's engagement includes the review and assessment of Fidelity's methodologies used in determining the revenues and expenses attributable to Fidelity's mutual fund business, and completion of agreed-upon procedures surrounding the mathematical accuracy of fund profitability and its conformity to allocation methodologies. After considering PwC's reports issued under the engagement and information provided by Fidelity, the Board believes that while other allocation methods may also be reasonable, Fidelity's profitability methodologies are reasonable in all material respects.
The Board has also reviewed Fidelity's non-fund businesses and fall-out benefits related to the mutual fund business as well as cases where Fidelity's affiliates may benefit from or be related to the fund's business.
Annual Report
Board Approval of Investment Advisory Contracts and
Management Fees - continued
The Board considered the costs of the services provided by and the profits realized by Fidelity in connection with the operation of the fund and were satisfied that the profitability was not excessive in the circumstances.
Economies of Scale. The Board considered whether there have been economies of scale in respect of the management of the Fidelity funds, whether the Fidelity funds (including the fund) have appropriately benefited from any such economies of scale, and whether there is potential for realization of any further economies of scale. The Board considered the extent to which the fund will benefit from economies of scale through increased services to the fund, through waivers or reimbursements, or through fee or expense reductions.
In February 2009, the Board and the board of other Fidelity funds created an ad hoc committee (the Economies of Scale Committee) to analyze whether FMR attains economies of scale in respect of the management and servicing of the Fidelity funds, whether the Fidelity funds have appropriately benefited from such economies of scale, and whether there is potential for realization of any further economies of scale.
The Board recognized that the fund's management contract incorporates a "group fee" structure, which provides for lower group fee rates as total fund assets under FMR's management increase, and for higher group fee rates as total fund assets under FMR's management decrease. FMR calculates the group fee rates based on a tiered asset "breakpoint" schedule that varies based on asset class. The Board considered that the group fee is designed to deliver the benefits of economies of scale to fund shareholders when total Fidelity fund assets increase, even if assets of any particular fund are unchanged or have declined, because some portion of Fidelity's costs are attributable to services provided to all Fidelity funds, and all funds benefit if those costs can be allocated among more assets. The Board concluded that, given the group fee structure, fund shareholders will benefit from lower management fees as assets under FMR's management increase at the fund complex level, regardless of whether Fidelity achieves any such economies of scale.
The Board concluded, considering the findings of the Economies of Scale Committee, that any potential economies of scale are being appropriately shared between fund shareholders and Fidelity.
Additional Information Requested by the Board. In order to develop fully the factual basis for consideration of the Fidelity funds' Advisory Contracts, the Board requested and received additional information on certain topics, including (i) fund performance trends, actions to be taken by FMR to improve certain funds' overall performance, and Fidelity's long-term strategies for certain funds; (ii) portfolio manager changes that have occurred during the past year and length of portfolio manager tenure for different categories of funds over time; (iii) Fidelity's compensation structure for portfolio managers, research analysts, and other key personnel, the rationale for the compensation structure, and how the compensation structure provides appropriate performance incentives; (iv) the amount of the investment that each portfolio manager has made in the Fidelity fund(s) that he or she manages; (v) management and other fees paid by FMR to affiliated sub-advisers on behalf of the Fidelity funds; (vi) Fidelity's fee structures and rationale for recommending different fees among different categories of funds; (vii) Fidelity's rationale for recommending which funds should have a performance adjustment component as part of their management fees; (viii) the rationale for any differences between fund fee structures and fee structures in place for other Fidelity clients; and (ix) explanations regarding the relative total expenses borne by certain funds and classes, total expense competitive trends, and actions that might be taken by FMR to reduce total expenses for certain funds and classes.
Annual Report
Based on its evaluation of all of the conclusions noted above, and after considering all factors it believed relevant, the Board ultimately concluded that the advisory fee structures are fair and reasonable, and that the fund's Advisory Contracts should be renewed.
Annual Report
Managing Your Investments
Fidelity offers several ways to conveniently manage your workplace benefits (including your workplace savings plan, investments, and additional services) via your telephone or PC. You can access your plan and account information and research your investments 24 hours a day.
By Phone
Fidelity provides a single toll-free number to access plan information, account balances, positions, and quotes*. It's easy to navigate the service, and on your first call, the system will help you create a personal identification number (PIN) for security.
(phone_graphic)
Fidelity Workplace
Investing
1-800-835-5092
By PC
Fidelity's web site on the Internet provides a wide range of information, including plan information, daily financial news, fund performance, interactive planning tools, and news about Fidelity products and services.
(computer_graphic)
Fidelity's Web Site
www.401k.com
* When you call the quotes line, please remember that a fund's yield and return will vary and, except for money market funds, share price will also vary. This means that you may have a gain or loss when you sell your shares. There is no assurance that money market funds will be able to maintain a stable $1 share price; an investment in a money market fund is not insured or guaranteed by the U.S. government. Total returns are historical and include changes in share price, reinvestment of dividends and capital gains, and the effects of any sales charges.
Annual Report
To Write Fidelity
We'll give your correspondence immediate attention and send you written confirmation upon completion of your request.
(letter_graphic)
For Non-Retirement
Accounts
Buying shares
Fidelity Investments
P.O. Box 770001
Cincinnati, OH 45277-0003
Overnight Express
Fidelity Investments
Attn: Distribution Services
100 Crosby Parkway - KC1H
Covington, KY 41015
Selling shares
Fidelity Investments
P.O. Box 770001
Cincinnati, OH 45277-0035
Overnight Express
Fidelity Investments
Attn: Distribution Services
100 Crosby Parkway - KC1H
Covington, KY 41015
General Correspondence
Fidelity Investments
P.O. Box 500
Merrimack, NH 03054-0500
(letter_graphic)
For Retirement
Accounts
Buying shares
Fidelity Investments
P.O. Box 770001
Cincinnati, OH 45277-0003
Selling shares
Fidelity Investments
P.O. Box 770001
Cincinnati, OH 45277-0035
Overnight Express
Fidelity Investments
Attn: Distribution Services
100 Crosby Parkway - KC1H
Covington, KY 41015
General Correspondence
Fidelity Investments
P.O. Box 500
Merrimack, NH 03054-0500
Annual Report
Investment Adviser
Fidelity Management & Research Company
Boston, MA
Investment Sub-Advisers
FMR Co., Inc.
Fidelity Management & Research
(U.K.) Inc.
Fidelity Research & Analysis Company
Fidelity Management & Research
(Hong Kong) Limited
Fidelity Management & Research
(Japan) Inc.
General Distributor
Fidelity Distributors Corporation
Boston, MA
Transfer and Service Agents
Fidelity Investments Institutional
Operations Company, Inc. (FIIOC)
Boston, MA
Fidelity Service Company, Inc.
Boston, MA
Custodian
State Street Bank and Trust Company
Quincy, MA
FDE-K-UANN-1210
1.863074.102
Fidelity®
Focused Stock
Fund
Annual Report
October 31, 2010
(2_fidelity_logos) (Registered_Trademark)
Contents
Chairman's Message | <Click Here> | The Chairman's message to shareholders. |
Performance | <Click Here> | How the fund has done over time. |
Management's Discussion
of Fund Performance | <Click Here> | The Portfolio Manager's review of fund performance, strategy and outlook. |
Shareholder Expense Example | <Click Here> | An example of shareholder expenses. |
Investment Changes | <Click Here> | A summary of major shifts in the fund's investments over the past six months. |
Investments | <Click Here> | A complete list of the fund's investments with their market values. |
Financial Statements | <Click Here> | Statements of assets and liabilities, operations, and changes in net assets,
as well as financial highlights. |
Notes | <Click Here> | Notes to the financial statements. |
Report of Independent Registered Public Accounting Firm | <Click Here> | |
Trustees and Officers | <Click Here> | |
Distributions | <Click Here> | |
Board Approval of Investment Advisory Contracts and Management Fees | <Click Here> | |
To view a fund's proxy voting guidelines and proxy voting record for the 12-month period ended June 30, visit http://www.fidelity.com/proxyvotingresults or visit the Securities and Exchange Commission's (SEC) web site at http://www.sec.gov. You may also call 1-800-544-8544 to request a free copy of the proxy voting guidelines.
Standard & Poor's, S&P and S&P 500 are registered service marks of The McGraw-Hill Companies, Inc. and have been licensed for use by Fidelity Distributors Corporation.
Other third party marks appearing herein are the property of their respective owners.
All other marks appearing herein are registered or unregistered trademarks or service marks of FMR LLC or an affiliated company.
Annual Report
This report and the financial statements contained herein are submitted for the general information of the shareholders of the fund. This report is not authorized for distribution to prospective investors in the fund unless preceded or accompanied by an effective prospectus.
A fund files its complete schedule of portfolio holdings with the SEC for the first and third quarters of each fiscal year on Form N-Q. Forms N-Q are available on the SEC's web site at http://www.sec.gov. A fund's Forms N-Q may be reviewed and copied at the SEC's Public Reference Room in Washington, DC. Information regarding the operation of the SEC's Public Reference Room may be obtained by calling 1-800-SEC-0330. For a complete list of a fund's portfolio holdings, view the most recent holdings listing, semiannual report, or annual report on Fidelity's web site at http://www.fidelity.com or http://www.advisor.fidelity.com, as applicable.
NOT FDIC INSURED • MAY LOSE VALUE • NO BANK GUARANTEE
Neither the fund nor Fidelity Distributors Corporation is a bank.
Annual Report
(photo_of_Edward_C_Johnson_3d)
Dear Shareholder:
Equities have staged a rally in the second half of 2010, shaking off concerns about the European debt crisis and the possibility of a double-dip recession in the U.S. Although the short-term surge pushed major equity indexes back into positive territory for the year, several questions remain about the longer-term outlook, including lackluster economic growth and persistently high unemployment. Financial markets are always unpredictable, of course, but there also are several time-tested investment principles that can help put the odds in your favor.
One of the basic tenets is to invest for the long term. Over time, riding out the markets' inevitable ups and downs has proven much more effective than selling into panic or chasing the hottest trend. Even missing only a few of the markets' best days can significantly diminish investor returns. Patience also affords the benefits of compounding - of earning interest on additional income or reinvested dividends and capital gains. There can be tax advantages and cost benefits to consider as well. While staying the course doesn't eliminate risk, it can considerably lessen the effect of short-term declines.
You can further manage your investing risk through diversification. And today, more than ever, geographic diversification should be taken into account. Studies indicate that asset allocation is the single most important determinant of a portfolio's long-term success. The right mix of stocks, bonds and cash - aligned to your particular risk tolerance and investment objective - is very important. Age-appropriate rebalancing is also an essential aspect of asset allocation. For younger investors, an emphasis on equities - which historically have been the best-performing asset class over time - is encouraged. As investors near their specific goal, such as retirement or sending a child to college, consideration may be given to replacing volatile assets (e.g. common stocks) with more-stable fixed investments (bonds or savings plans).
A third principle - investing regularly - can help lower the average cost of your purchases. Investing a certain amount of money each month or quarter helps ensure you won't pay for all your shares at market highs. This strategy - known as dollar cost averaging - also reduces "emotion" from investing, helping shareholders avoid selling weak performers just prior to an upswing, or chasing a hot performer just before a correction.
We invite you to contact us via the Internet, through our Investor Centers or by phone. It is our privilege to provide you the information you need to make the investments that are right for you.
Sincerely,
(The chairman's signature appears here.)
Edward C. Johnson 3d
Annual Report
Average annual total return reflects the change in the value of an investment, assuming reinvestment of the fund's distributions from dividend income and capital gains (the profits earned upon the sale of securities that have grown in value, if any) and assuming a constant rate of performance each year. The $10,000 table and the fund's returns do not reflect the deduction of taxes that a shareholder would pay on fund distributions or the redemption of fund shares. During periods of reimbursement by Fidelity, a fund's total return will be greater than it would be had the reimbursement not occurred. How a fund did yesterday is no guarantee of how it will do tomorrow.
Average Annual Total Returns
Periods ended October 31, 2010 | Past 1
year | Past 5
years | Past 10
years |
Fidelity® Focused Stock Fund A | 22.44% | 4.06% | -0.45% |
A Prior to December 29, 2001, Fidelity Focused Stock Fund operated under certain different investment policies. The fund's historical performance may not represent its current investment policies.
$10,000 Over 10 Years
Let's say hypothetically that $10,000 was invested in Fidelity® Focused Stock Fund on October 31, 2000. The chart shows how the value of your investment would have changed, and also shows how the S&P® 500 Index performed over the same period.
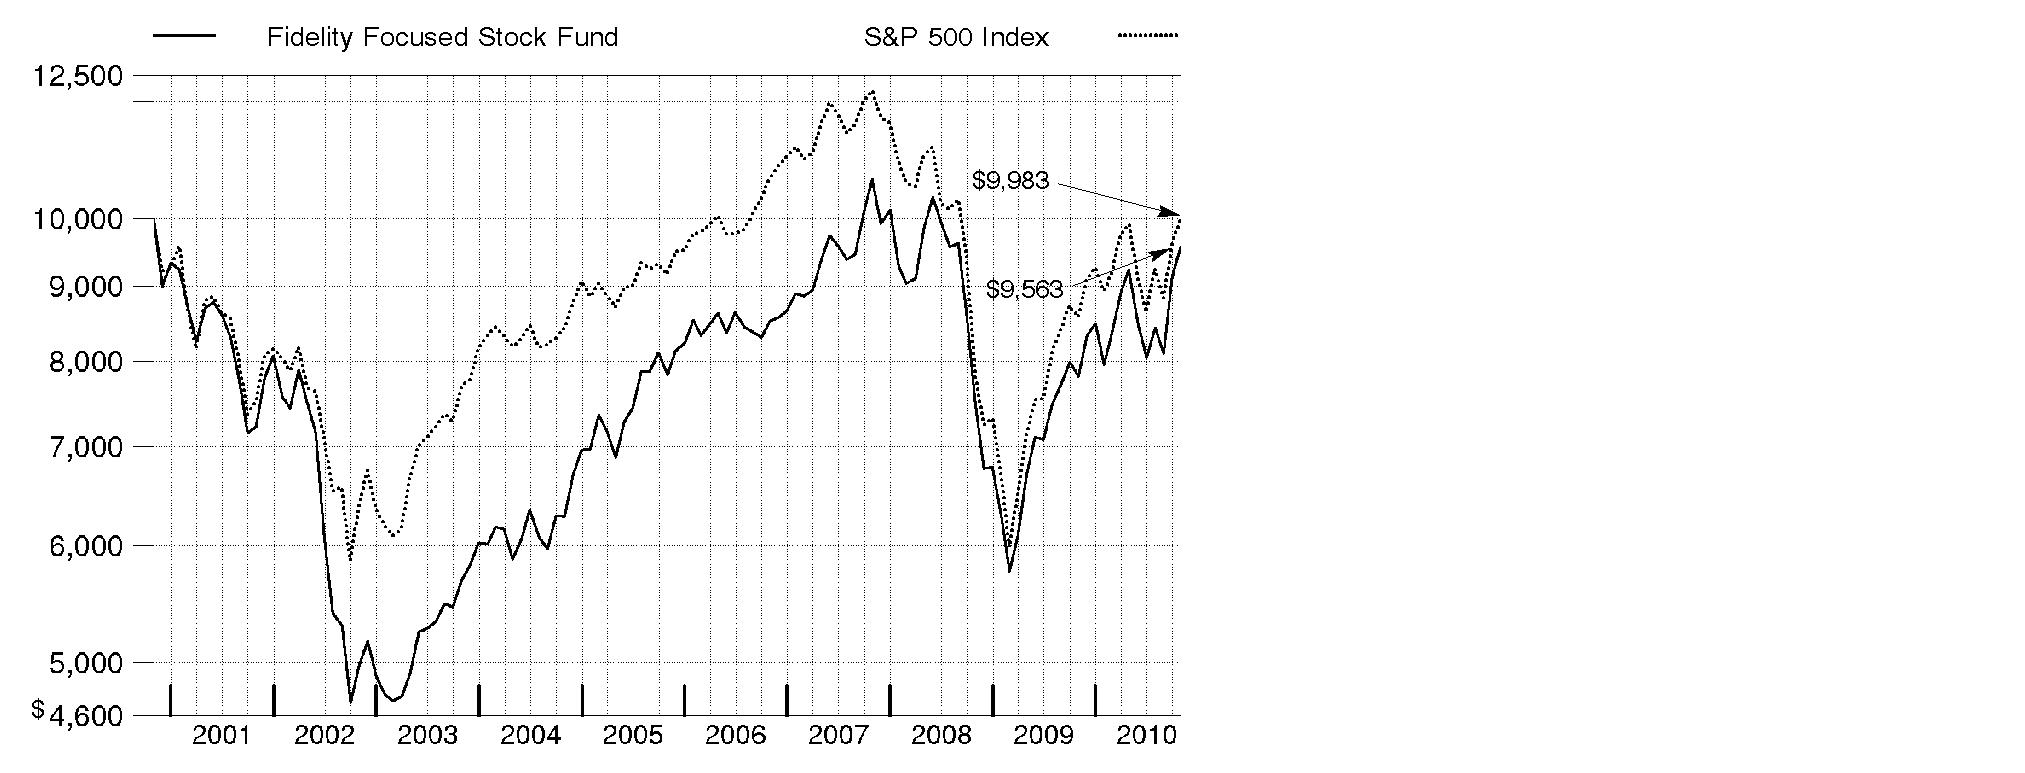
Annual Report
Market Recap: Amid bouts of volatility, major U.S. stock market indexes recorded double-digit gains for the year ending October 31, 2010, lifted by economic optimism, encouraging earnings reports and a wave of corporate mergers. Aside from a January dip, stocks trended upward for the first half of the period amid indications the Great Recession was over. However, in April, lingering high unemployment and heightened concern over European debt sent equities falling. Markets regrouped in July, but fell again in August on mixed economic data. The final two months of the period brought renewed optimism, with the large-cap S&P 500® Index posting its best September/October performance since 1998. For the full 12 months, the S&P 500® rose 16.52%, while the blue-chip-laden Dow Jones Industrial AverageSM added 17.62% and the technology-heavy Nasdaq Composite® Index rose 23.72%. Among market segments, all 10 sectors in the S&P 500 posted gains, with more than half outperforming the broad-market index. Stocks of mid- and small-sized companies surged, with the Russell Midcap® Index adding 27.71% and Russell 2000® Index climbing 26.58%. Looking abroad, debt problems in several European countries cooled gains in developed markets, and yet the MSCI® EAFE® (Europe, Australasia, Far East) Index still rose 8.49%.
Comments from Stephen DuFour, Portfolio Manager of Fidelity® Focused Stock Fund: For the 12 months ending October 31, 2010, the fund returned 22.44%, outpacing the S&P 500. Performance was driven by strong stock picking, particularly in the technology, health care and industrials sectors. Among the top individual contributors versus the index were Skyworks Solutions and Apple. Skyworks - which makes radio frequency devices for wireless phones and tablet computers - benefited from a proliferation of new devices requiring much more radio frequency content than previous generations. Apple's shares gained from the successful launch of its iPad tablet computer, as well as worldwide growth of its iPhone. Winners in industrials included Cummins, a diesel engine manufacturer, and Union Pacific, a West Coast railroad company. A focus in health care on companies with strong unit growth, innovative products or offerings to reduce health care costs also aided results. Stock selection in energy detracted from performance. Disappointments included Petrohawk Energy, a natural gas company, and Peabody Energy, a coal company, both of which suffered as gas prices fell. I sold these names - neither of which was in the index - by period end. A small cash position also hindered results.
The views expressed above reflect those of the portfolio manager(s) only through the end of the period as stated on the cover of this report and do not necessarily represent the views of Fidelity or any other person in the Fidelity organization. Any such views are subject to change at any time based upon market or other conditions and Fidelity disclaims any responsibility to update such views. These views may not be relied on as investment advice and, because investment decisions for a Fidelity fund are based on numerous factors, may not be relied on as an indication of trading intent on behalf of any Fidelity fund.
Annual Report
Shareholder Expense Example
As a shareholder of the Fund, you incur two types of costs: (1) transaction costs, and (2) ongoing costs, including management fees and other Fund expenses. This Example is intended to help you understand your ongoing costs (in dollars) of investing in the Fund and to compare these costs with the ongoing costs of investing in other mutual funds.
The Example is based on an investment of $1,000 invested at the beginning of the period and held for the entire period (May 1, 2010 to October 31, 2010).
Actual Expenses
The first line of the accompanying table provides information about actual account values and actual expenses. You may use the information in this line, together with the amount you invested, to estimate the expenses that you paid over the period. Simply divide your account value by $1,000.00 (for example, an $8,600 account value divided by $1,000.00 = 8.6), then multiply the result by the number in the first line under the heading entitled "Expenses Paid During Period" to estimate the expenses you paid on your account during this period. A small balance maintenance fee of $12.00 that is charged once a year may apply for certain accounts with a value of less than $2,000. This fee is not included in the table below. If it was, the estimate of expenses you paid during the period would be higher, and your ending account value lower, by this amount. In addition, the Fund, as a shareholder in the underlying Fidelity Central Funds, will indirectly bear its pro-rata share of the fees and expenses incurred by the underlying Fidelity Central Funds. These fees and expenses are not included in the Fund's annualized expense ratio used to calculate the expense estimate in the table below.
Hypothetical Example for Comparison Purposes
The second line of the accompanying table provides information about hypothetical account values and hypothetical expenses based on the Fund's actual expense ratio and an assumed rate of return of 5% per year before expenses, which is not the Fund's actual return. The hypothetical account values and expenses may not be used to estimate the actual ending account balance or expenses you paid for the period. You may use this information to compare the ongoing costs of investing in the Fund and other funds. To do so, compare this 5% hypothetical example with the 5% hypothetical examples that appear in the shareholder reports of the other funds. A small balance maintenance fee of $12.00 that is charged once a year may apply for certain accounts with a value of less than $2,000. This fee is not included in the table below. If it was, the estimate of expenses you paid during the period would be higher, and your ending account value lower, by this amount. In addition, the Fund, as a shareholder in the underlying Fidelity Central Funds, will indirectly bear its pro-rata share of the fees and expenses incurred by the underlying Fidelity Central Funds. These fees and expenses are not included in the Fund's annualized expense ratio used to calculate the expense estimate in the table below.
Please note that the expenses shown in the table are meant to highlight your ongoing costs only and do not reflect any transaction costs. Therefore, the second line of the table is useful in comparing ongoing costs only, and will not help you determine the relative total costs of owning different funds.
Annual Report
| Annualized Expense Ratio | Beginning
Account Value
May 1, 2010 | Ending
Account Value
October 31, 2010 | Expenses Paid
During Period*
May 1, 2010 to
October 31, 2010 |
Actual | 1.00% | $ 1,000.00 | $ 1,036.80 | $ 5.13 |
Hypothetical (5% return per year before expenses) | | $ 1,000.00 | $ 1,020.16 | $ 5.09 |
* Expenses are equal to the Fund's annualized expense ratio, multiplied by the average account value over the period, multiplied by 184/365 (to reflect the one-half year period).
Annual Report
Investment Changes (Unaudited)
Top Ten Stocks as of October 31, 2010 |
| % of fund's
net assets | % of fund's net assets
6 months ago |
Union Pacific Corp. | 6.0 | 6.0 |
Estee Lauder Companies, Inc. Class A | 4.9 | 3.9 |
Cummins, Inc. | 4.8 | 5.5 |
Exxon Mobil Corp. | 4.5 | 0.0 |
Google, Inc. Class A | 4.5 | 0.0 |
Skyworks Solutions, Inc. | 4.4 | 2.9 |
Perrigo Co. | 3.9 | 1.3 |
Edwards Lifesciences Corp. | 3.8 | 2.8 |
eBay, Inc. | 3.7 | 0.0 |
Apple, Inc. | 3.7 | 5.3 |
| 44.2 | |
Top Five Market Sectors as of October 31, 2010 |
| % of fund's
net assets | % of fund's net assets
6 months ago |
Information Technology | 32.7 | 22.5 |
Industrials | 21.8 | 19.4 |
Consumer Discretionary | 12.2 | 11.6 |
Health Care | 9.5 | 10.4 |
Energy | 8.6 | 11.4 |
Asset Allocation (% of fund's net assets) |
As of October 31, 2010 * | As of April 30, 2010 ** |
| Stocks 97.7% | | | Stocks 96.9% | |
| Short-Term
Investments and
Net Other Assets 2.3% | | | Short-Term
Investments and
Net Other Assets 3.1% | |
* Foreign investments | 6.2% | | ** Foreign investments | 3.9% | |

Annual Report
Investments October 31, 2010
Showing Percentage of Net Assets
Common Stocks - 96.4% |
| Shares | | Value |
CONSUMER DISCRETIONARY - 10.9% |
Automobiles - 1.0% |
Bayerische Motoren Werke AG (BMW) | 20,000 | | $ 1,433,472 |
Household Durables - 1.0% |
iRobot Corp. (a)(d) | 73,465 | | 1,533,949 |
Internet & Catalog Retail - 1.9% |
Amazon.com, Inc. (a) | 16,800 | | 2,774,352 |
Multiline Retail - 0.7% |
Dollarama, Inc. | 39,078 | | 1,029,921 |
Specialty Retail - 2.7% |
AnnTaylor Stores Corp. (a) | 28,000 | | 652,400 |
Jos. A. Bank Clothiers, Inc. (a) | 75,262 | | 3,281,423 |
| | 3,933,823 |
Textiles, Apparel & Luxury Goods - 3.6% |
Evergreen International Holdings Ltd. (a) | 9,000 | | 5,341 |
Fossil, Inc. (a) | 38,280 | | 2,258,137 |
Phillips-Van Heusen Corp. | 51,000 | | 3,128,340 |
| | 5,391,818 |
TOTAL CONSUMER DISCRETIONARY | | 16,097,335 |
CONSUMER STAPLES - 5.6% |
Personal Products - 5.6% |
Estee Lauder Companies, Inc. Class A | 101,000 | | 7,188,170 |
Prestige Brands Holdings, Inc. (a) | 98,710 | | 1,061,133 |
| | 8,249,303 |
ENERGY - 8.6% |
Oil, Gas & Consumable Fuels - 8.6% |
Anadarko Petroleum Corp. | 67,000 | | 4,125,190 |
Chevron Corp. | 23,000 | | 1,900,030 |
Exxon Mobil Corp. | 101,000 | | 6,713,470 |
| | 12,738,690 |
FINANCIALS - 5.0% |
Capital Markets - 1.7% |
Ameriprise Financial, Inc. | 49,000 | | 2,532,810 |
Commercial Banks - 0.5% |
SVB Financial Group (a) | 14,600 | | 632,764 |
Insurance - 2.2% |
Berkshire Hathaway, Inc. Class B (a) | 41,000 | | 3,261,960 |
Common Stocks - continued |
| Shares | | Value |
FINANCIALS - continued |
Real Estate Investment Trusts - 0.6% |
Public Storage | 9,000 | | $ 892,980 |
TOTAL FINANCIALS | | 7,320,514 |
HEALTH CARE - 9.5% |
Health Care Equipment & Supplies - 4.2% |
Edwards Lifesciences Corp. (a) | 87,800 | | 5,611,298 |
Volcano Corp. (a) | 27,400 | | 669,108 |
| | 6,280,406 |
Pharmaceuticals - 5.3% |
Endo Pharmaceuticals Holdings, Inc. (a) | 56,000 | | 2,057,440 |
Perrigo Co. | 87,000 | | 5,731,560 |
| | 7,789,000 |
TOTAL HEALTH CARE | | 14,069,406 |
INDUSTRIALS - 21.8% |
Air Freight & Logistics - 2.9% |
C.H. Robinson Worldwide, Inc. | 19,000 | | 1,339,120 |
UTI Worldwide, Inc. | 154,000 | | 2,959,880 |
| | 4,299,000 |
Airlines - 2.2% |
Southwest Airlines Co. | 233,000 | | 3,206,080 |
Electrical Equipment - 3.0% |
Emerson Electric Co. | 81,000 | | 4,446,900 |
Machinery - 7.7% |
Cummins, Inc. | 79,500 | | 7,003,950 |
Eaton Corp. | 27,000 | | 2,398,410 |
Greenbrier Companies, Inc. (a) | 60,000 | | 1,092,000 |
Titan International, Inc. (d) | 57,000 | | 864,690 |
| | 11,359,050 |
Road & Rail - 6.0% |
Union Pacific Corp. | 101,000 | | 8,855,681 |
TOTAL INDUSTRIALS | | 32,166,711 |
Common Stocks - continued |
| Shares | | Value |
INFORMATION TECHNOLOGY - 32.7% |
Communications Equipment - 3.5% |
Juniper Networks, Inc. (a) | 40,000 | | $ 1,295,600 |
QUALCOMM, Inc. | 87,000 | | 3,926,310 |
| | 5,221,910 |
Computers & Peripherals - 3.7% |
Apple, Inc. (a) | 18,100 | | 5,445,747 |
Internet Software & Services - 8.8% |
eBay, Inc. (a) | 183,000 | | 5,455,230 |
Google, Inc. Class A (a) | 10,900 | | 6,681,591 |
Zix Corp. (a)(d) | 235,000 | | 914,150 |
| | 13,050,971 |
IT Services - 2.3% |
Cognizant Technology Solutions Corp. Class A (a) | 52,000 | | 3,389,880 |
Semiconductors & Semiconductor Equipment - 7.5% |
Broadcom Corp. Class A | 66,000 | | 2,688,840 |
MIPS Technologies, Inc. (a) | 132,000 | | 1,940,400 |
Skyworks Solutions, Inc. (a) | 279,000 | | 6,391,890 |
| | 11,021,130 |
Software - 6.9% |
Citrix Systems, Inc. (a) | 32,000 | | 2,050,240 |
Informatica Corp. (a) | 69,600 | | 2,832,024 |
Oracle Corp. | 89,000 | | 2,616,600 |
Salesforce.com, Inc. (a) | 22,600 | | 2,623,182 |
| | 10,122,046 |
TOTAL INFORMATION TECHNOLOGY | | 48,251,684 |
MATERIALS - 2.3% |
Chemicals - 1.2% |
Syngenta AG sponsored ADR | 31,000 | | 1,716,780 |
Metals & Mining - 1.1% |
Freeport-McMoRan Copper & Gold, Inc. | 18,000 | | 1,704,240 |
TOTAL MATERIALS | | 3,421,020 |
TOTAL COMMON STOCKS (Cost $118,178,757) | 142,314,663 |
Nonconvertible Preferred Stocks - 1.3% |
| Shares | | Value |
CONSUMER DISCRETIONARY - 1.3% |
Automobiles - 1.3% |
Volkswagen AG (Cost $1,746,533) | 13,400 | | $ 2,013,706 |
Money Market Funds - 2.1% |
| | | |
Fidelity Cash Central Fund, 0.23% (b) | 2,284,807 | | 2,284,807 |
Fidelity Securities Lending Cash Central Fund, 0.24% (b)(c) | 808,500 | | 808,500 |
TOTAL MONEY MARKET FUNDS (Cost $3,093,307) | 3,093,307 |
TOTAL INVESTMENT PORTFOLIO - 99.8% (Cost $123,018,597) | 147,421,676 |
NET OTHER ASSETS (LIABILITIES) - 0.2% | | 247,188 |
NET ASSETS - 100% | $ 147,668,864 |
Legend |
(a) Non-income producing |
(b) Affiliated fund that is available only to investment companies and other accounts managed by Fidelity Investments. The rate quoted is the annualized seven-day yield of the fund at period end. A complete unaudited listing of the fund's holdings as of its most recent quarter end is available upon request. In addition, each Fidelity Central Fund's financial statements, which are not covered by the Fund's report of Independent Registered Public Accounting Firm, are available on the SEC's website or upon request. |
(c) Investment made with cash collateral received from securities on loan. |
(d) Security or a portion of the security is on loan at period end. |
Affiliated Central Funds |
Information regarding fiscal year to date income earned by the Fund from investments in Fidelity Central Funds is as follows: |
Fund | Income earned |
Fidelity Cash Central Fund | $ 7,663 |
Fidelity Securities Lending Cash Central Fund | 4,439 |
Total | $ 12,102 |
Other Information |
The following is a summary of the inputs used, as of October 31, 2010, involving the Fund's assets and liabilities carried at fair value. The inputs or methodology used for valuing securities may not be an indication of the risk associated with investing in those securities. For more information on valuation inputs, and their aggregation into the levels used in the table below, please refer to the Security Valuation section in the accompanying Notes to Financial Statements. |
Valuation Inputs at Reporting Date: |
Description | Total | Level 1 | Level 2 | Level 3 |
Investments in Securities: | | | | |
Equities: | | | | |
Consumer Discretionary | $ 18,111,041 | $ 18,105,700 | $ 5,341 | $ - |
Consumer Staples | 8,249,303 | 8,249,303 | - | - |
Energy | 12,738,690 | 12,738,690 | - | - |
Financials | 7,320,514 | 7,320,514 | - | - |
Health Care | 14,069,406 | 14,069,406 | - | - |
Industrials | 32,166,711 | 32,166,711 | - | - |
Information Technology | 48,251,684 | 48,251,684 | - | - |
Materials | 3,421,020 | 3,421,020 | - | - |
Money Market Funds | 3,093,307 | 3,093,307 | - | - |
Total Investments in Securities: | $ 147,421,676 | $ 147,416,335 | $ 5,341 | $ - |
Income Tax Information |
At October 31, 2010, the Fund had a capital loss carryforward of approximately $10,808,640 of which $3,179,162 and $7,629,478 will expire on October 31, 2016 and 2017, respectively. Capital loss carryforwards are only available to offset future capital gains of the Fund to the extent provided by regulations and may be limited. |
See accompanying notes which are an integral part of the financial statements.
Annual Report
Statement of Assets and Liabilities
| October 31, 2010 |
| | |
Assets | | |
Investment in securities, at value (including securities loaned of $786,690) - See accompanying schedule: Unaffiliated issuers (cost $119,925,290) | $ 144,328,369 | |
Fidelity Central Funds (cost $3,093,307) | 3,093,307 | |
Total Investments (cost $123,018,597) | | $ 147,421,676 |
Receivable for investments sold | | 6,733,664 |
Receivable for fund shares sold | | 657,227 |
Dividends receivable | | 14,700 |
Distributions receivable from Fidelity Central Funds | | 803 |
Receivable from investment adviser for expense reductions | | 6,367 |
Other receivables | | 1,968 |
Total assets | | 154,836,405 |
| | |
Liabilities | | |
Payable for investments purchased | $ 6,110,292 | |
Payable for fund shares redeemed | 102,773 | |
Accrued management fee | 80,558 | |
Other affiliated payables | 31,702 | |
Other payables and accrued expenses | 33,716 | |
Collateral on securities loaned, at value | 808,500 | |
Total liabilities | | 7,167,541 |
| | |
Net Assets | | $ 147,668,864 |
Net Assets consist of: | | |
Paid in capital | | $ 134,476,958 |
Accumulated undistributed net realized gain (loss) on investments and foreign currency transactions | | (11,211,938) |
Net unrealized appreciation (depreciation) on investments and assets and liabilities in foreign currencies | | 24,403,844 |
Net Assets, for 11,918,618 shares outstanding | | $ 147,668,864 |
Net Asset Value, offering price and redemption price per share ($147,668,864 ÷ 11,918,618 shares) | | $ 12.39 |
See accompanying notes which are an integral part of the financial statements.
Annual Report
Financial Statements - continued
Statement of Operations
| Year ended October 31, 2010 |
| | |
Investment Income | | |
Dividends | | $ 911,245 |
Income from Fidelity Central Funds | | 12,102 |
Total income | | 923,347 |
| | |
Expenses | | |
Management fee
Basic fee | $ 700,710 | |
Performance adjustment | 207,858 | |
Transfer agent fees | 341,517 | |
Accounting and security lending fees | 49,308 | |
Custodian fees and expenses | 20,943 | |
Independent trustees' compensation | 706 | |
Registration fees | 27,649 | |
Audit | 39,744 | |
Legal | 712 | |
Miscellaneous | 1,659 | |
Total expenses before reductions | 1,390,806 | |
Expense reductions | (143,549) | 1,247,257 |
Net investment income (loss) | | (323,910) |
Realized and Unrealized Gain (Loss) Net realized gain (loss) on: | | |
Investment securities: | | |
Unaffiliated issuers | 14,232,045 | |
Foreign currency transactions | 29,851 | |
Total net realized gain (loss) | | 14,261,896 |
Change in net unrealized appreciation (depreciation) on: Investment securities | 11,826,906 | |
Assets and liabilities in foreign currencies | (9,293) | |
Total change in net unrealized appreciation (depreciation) | | 11,817,613 |
Net gain (loss) | | 26,079,509 |
Net increase (decrease) in net assets resulting from operations | | $ 25,755,599 |
See accompanying notes which are an integral part of the financial statements.
Annual Report
Statement of Changes in Net Assets
| Year ended October 31,
2010 | Year ended October 31,
2009 |
Increase (Decrease) in Net Assets | | |
Operations | | |
Net investment income (loss) | $ (323,910) | $ 836,058 |
Net realized gain (loss) | 14,261,896 | (3,813,383) |
Change in net unrealized appreciation (depreciation) | 11,817,613 | 15,153,627 |
Net increase (decrease) in net assets resulting
from operations | 25,755,599 | 12,176,302 |
Distributions to shareholders from net investment income | (648,249) | (737,098) |
Share transactions
Proceeds from sales of shares | 48,342,517 | 130,216,603 |
Reinvestment of distributions | 616,010 | 708,416 |
Cost of shares redeemed | (49,177,002) | (116,454,566) |
Net increase (decrease) in net assets resulting from share transactions | (218,475) | 14,470,453 |
Total increase (decrease) in net assets | 24,888,875 | 25,909,657 |
| | |
Net Assets | | |
Beginning of period | 122,779,989 | 96,870,332 |
End of period (including undistributed net investment income of $0 and undistributed net investment income of $521,075, respectively) | $ 147,668,864 | $ 122,779,989 |
Other Information Shares | | |
Sold | 4,217,175 | 14,976,498 |
Issued in reinvestment of distributions | 56,494 | 80,593 |
Redeemed | (4,428,825) | (12,847,062) |
Net increase (decrease) | (155,156) | 2,210,029 |
See accompanying notes which are an integral part of the financial statements.
Annual Report
Financial Highlights
Years ended October 31, | 2010 | 2009 | 2008 | 2007 | 2006 |
Selected Per-Share Data | | | | | |
Net asset value, beginning of period | $ 10.17 | $ 9.82 | $ 15.35 | $ 12.32 | $ 11.37 |
Income from Investment Operations | | | | | |
Net investment income (loss) B | (.03) | .06 | .09 | .06 | .01 E |
Net realized and unrealized gain (loss) | 2.31 | .36 | (4.27) | 2.98 | .98 |
Total from investment operations | 2.28 | .42 | (4.18) | 3.04 | .99 |
Distributions from net investment income | (.06) | (.07) | (.06) | (.01) | (.04) |
Distributions from net realized gain | - | - | (1.29) | - | - |
Total distributions | (.06) | (.07) | (1.35) | (.01) | (.04) |
Redemption fees added to paid in capital G | - | - | - | - | - B, H |
Net asset value, end of period | $ 12.39 | $ 10.17 | $ 9.82 | $ 15.35 | $ 12.32 |
Total Return A | 22.44% | 4.39% | (29.58)% | 24.70% | 8.72% |
Ratios to Average Net Assets C, F | | | | | |
Expenses before reductions | 1.11% | 1.09% | 1.20% | 1.20% | 1.08% |
Expenses net of fee waivers,
if any | 1.00% | 1.00% | 1.00% | 1.00% | 1.00% |
Expenses net of all reductions | 1.00% | .99% | .99% | .99% | .98% |
Net investment income (loss) | (.26)% | .63% | .70% | .47% | .12% E |
Supplemental Data | | | | | |
Net assets, end of period (000 omitted) | $ 147,669 | $ 122,780 | $ 96,870 | $ 97,388 | $ 88,908 |
Portfolio turnover rate D | 275% | 363% | 491% | 343% | 202% |
A Total returns would have been lower had certain expenses not been reduced during the periods shown.
B Calculated based on average shares outstanding during the period.
C Fees and expenses of the underlying Fidelity Central Funds are not included in the Fund's expense ratio. The Fund indirectly bears its proportionate share of the expenses of any underlying Fidelity Central Funds.
D Amount does not include the portfolio activity of any underlying Fidelity Central Funds.
E Investment income per share reflects a special dividend which amounted to $.01 per share. Excluding the special dividend, the ratio of net investment income (loss) to average net assets would have been .01%.
F Expense ratios reflect operating expenses of the Fund. Expenses before reductions do not reflect amounts reimbursed by the investment adviser or reductions from brokerage service arrangements or reductions from other expense offset arrangements and do not represent the amount paid by the Fund during periods when reimbursements or reductions occur. Expenses net of fee waivers reflect expenses after reimbursement by the investment adviser but prior to reductions from brokerage service arrangements or other expense offset arrangements. Expenses net of all reductions represent the net expenses paid by the Fund.
G The redemption fee was eliminated during the year ended October 31, 2006.
H Amount represents less than $.01 per share.
See accompanying notes which are an integral part of the financial statements.
Annual Report
Notes to Financial Statements
For the period ended October 31, 2010
1. Organization.
Fidelity Focused Stock Fund (the Fund) is a fund of Fidelity Capital Trust (the Trust) and is authorized to issue an unlimited number of shares. The Trust is registered under the Investment Company Act of 1940, as amended (the 1940 Act), as an open-end management investment company organized as a Massachusetts business trust.
2. Investments in Fidelity Central Funds.
The Fund may invest in Fidelity Central Funds, which are open-end investment companies available only to other investment companies and accounts managed by Fidelity Management & Research Company (FMR) and its affiliates. The Fund's Schedule of Investments lists each of the Fidelity Central Funds held as of period end, if any, as an investment of the Fund, but does not include the underlying holdings of each Fidelity Central Fund. As an Investing Fund, the Fund indirectly bears its proportionate share of the expenses of the underlying Fidelity Central Funds.
The Money Market Central Funds seek preservation of capital and current income and are managed by Fidelity Investments Money Management, Inc. (FIMM), an affiliate of FMR.
A complete unaudited list of holdings for each Fidelity Central Fund is available upon request or at the Securities and Exchange Commission (the SEC) web site at www.sec.gov. In addition, the financial statements of the Fidelity Central Funds, which are not covered by the Fund's Report of Independent Registered Public Accounting Firm, are available on the SEC web site or upon request.
3. Significant Accounting Policies.
The financial statements have been prepared in conformity with accounting principles generally accepted in the United States of America (GAAP), which require management to make certain estimates and assumptions at the date of the financial statements. Actual results could differ from those estimates. The following summarizes the significant accounting policies of the Fund:
Security Valuation. Investments are valued as of 4:00 p.m. Eastern time on the last calendar day of the period. The Fund uses independent pricing services approved by the Board of Trustees to value its investments. When current market prices or quotations are not readily available or reliable, valuations may be determined in good faith in accordance with procedures adopted by the Board of Trustees. Factors used in determining value may include market or security specific events. The frequency with which these procedures are used cannot be predicted and they may be utilized to a significant extent. The value used for net asset value (NAV) calculation under these procedures may differ from published prices for the same securities.
Annual Report
3. Significant Accounting Policies - continued
Security Valuation - continued
The Fund categorizes the inputs to valuation techniques used to value its investments into a disclosure hierarchy consisting of three levels as shown below.
Level 1 - quoted prices in active markets for identical investments
Level 2 - other significant observable inputs (including quoted prices for similar investments, interest rates, prepayment speeds, etc.)
Level 3 - unobservable inputs (including the fund's own assumptions based on the best information available)
Changes in valuation techniques may result in transfers in or out of an assigned level within the disclosure hierarchy. The aggregate value of investments by input level, as of October 31, 2010, is included at the end of the Fund's Schedule of Investments. Valuation techniques used to value the Fund's investments by major category are as follows.
Equity securities, including restricted securities, for which market quotations are readily available, are valued at the last reported sale price or official closing price as reported by an independent pricing service on the primary market or exchange on which they are traded and are categorized as Level 1 in the hierarchy. In the event there were no sales during the day or closing prices are not available, securities are valued at the last quoted bid price or may be valued using the last available price and are generally categorized as Level 2 in the hierarchy. For foreign equity securities, when significant market or security specific events arise, comparisons to the valuation of American Depositary Receipts (ADRs), futures contracts, Exchange-traded funds (ETFs) and certain indexes as well as quoted prices for similar securities are used and are categorized as Level 2 in the hierarchy in these circumstances. Utilizing these techniques may result in transfers between Level 1 and Level 2. For restricted equity securities and private placements where observable inputs are limited, assumptions about market activity and risk are used and are categorized as Level 3 in the hierarchy.
Investments in open-end mutual funds, including the Fidelity Central Funds, are valued at their closing net asset value each business day and are categorized as Level 1 in the hierarchy. Short-term securities with remaining maturities of sixty days or less for which quotations are not readily available are valued at amortized cost, which approximates fair value and are categorized as Level 2 in the hierarchy.
Annual Report
Notes to Financial Statements - continued
3. Significant Accounting Policies - continued
Foreign Currency. The Fund uses foreign currency contracts to facilitate transactions in foreign-denominated securities. Gains and losses from these transactions may arise from changes in the value of the foreign currency or if the counterparties do not perform under the contracts' terms.
Foreign-denominated assets, including investment securities, and liabilities are translated into U.S. dollars at the exchange rate at period end. Purchases and sales of investment securities, income and dividends received and expenses denominated in foreign currencies are translated into U.S. dollars at the exchange rate in effect on the transaction date.
The effects of exchange rate fluctuations on investments are included with the net realized and unrealized gain (loss) on investment securities. Other foreign currency transactions resulting in realized and unrealized gain (loss) are disclosed separately.
Investment Transactions and Income. For financial reporting purposes, the Fund's investment holdings and NAV include trades executed through the end of the last business day of the period. The NAV per share for processing shareholder transactions is calculated as of the close of business of the New York Stock Exchange (NYSE), normally 4:00 p.m. Eastern time and includes trades executed through the end of the prior business day. Gains and losses on securities sold are determined on the basis of identified cost and may include proceeds received from litigation. Dividend income is recorded on the ex-dividend date, except for certain dividends from foreign securities where the ex-dividend date may have passed, which are recorded as soon as the Fund is informed of the ex-dividend date. Non-cash dividends included in dividend income, if any, are recorded at the fair market value of the securities received. Distributions received on securities that represent a return of capital or capital gain are recorded as a reduction of cost of investments and/or as a realized gain. The Fund estimates the components of distributions received that may be considered return of capital distributions or capital gain distributions. Interest income and distributions from the Fidelity Central Funds are accrued as earned. Interest income includes coupon interest and amortization of premium and accretion of discount on debt securities. Investment income is recorded net of foreign taxes withheld where recovery of such taxes is uncertain.
Expenses. Most expenses of the Trust can be directly attributed to a fund. Expenses which cannot be directly attributed are apportioned amongst each fund in the Trust. Expense estimates are accrued in the period to which they relate and adjustments are made when actual amounts are known.
Annual Report
3. Significant Accounting Policies - continued
Income Tax Information and Distributions to Shareholders. Each year the Fund intends to qualify as a regulated investment company, including distributing substantially all of its taxable income and realized gains under Subchapter M of the Internal Revenue Code and filing its U.S. federal tax return. As a result, no provision for income taxes is required. As of October 31, 2010, the Fund did not have any unrecognized tax benefits in the accompanying financial statements. A fund's federal tax return is subject to examination by the Internal Revenue Service (IRS) for a period of three years. Foreign taxes are provided for based on the Fund's understanding of the tax rules and rates that exist in the foreign markets in which it invests.
Distributions are declared and recorded on the ex-dividend date. Income and capital gain distributions are determined in accordance with income tax regulations, which may differ from GAAP.
Capital accounts within the financial statements are adjusted for permanent book-tax differences. These adjustments have no impact on net assets or the results of operations. Temporary book-tax differences will reverse in a subsequent period.
Book-tax differences are primarily due to the short-term gain distributions from the Fidelity Central Funds, foreign currency transactions, net operating losses, capital loss carryforwards and losses deferred due to wash sales.
The federal tax cost of investment securities and unrealized appreciation (depreciation) as of period end were as follows:
Gross unrealized appreciation | $ 24,197,500 |
Gross unrealized depreciation | (197,719) |
Net unrealized appreciation (depreciation) | $ 23,999,781 |
| |
Tax Cost | $ 123,421,895 |
The tax-based components of distributable earnings as of period end were as follows:
Undistributed ordinary income | $ - |
Capital loss carryforward | $ (10,808,640) |
Net unrealized appreciation (depreciation) | $ 24,000,546 |
The tax character of distributions paid was as follows:
| October 31, 2010 | October 31, 2009 |
Ordinary Income | $ 648,249 | $ 737,098 |
Annual Report
Notes to Financial Statements - continued
4. Purchases and Sales of Investments.
Purchases and sales of securities, other than short-term securities, aggregated $333,414,976 and $329,232,983, respectively.
5. Fees and Other Transactions with Affiliates.
Management Fee. FMR and its affiliates provide the Fund with investment management related services for which the Fund pays a monthly management fee. The management fee is the sum of an individual fund fee rate that is based on an annual rate of .30% of the Fund's average net assets and a group fee rate that averaged .26% during the period. The group fee rate is based upon the average net assets of all the mutual funds advised by FMR. The group fee rate decreases as assets under management increase and increases as assets under management decrease. In addition, the management fee is subject to a performance adjustment (up to a maximum of ± .20% of the Fund's average net assets over a 36 month performance period). The upward or downward adjustment to the management fee is based on the Fund's relative investment performance as compared to an appropriate benchmark index. For the period, the total annual management fee rate, including the performance adjustment, was .72% of the Fund's average net assets.
Transfer Agent Fees. Fidelity Investments Institutional Operations Company, Inc. (FIIOC), an affiliate of FMR, is the Fund's transfer, dividend disbursing and shareholder servicing agent. FIIOC receives account fees and asset-based fees that vary according to account size and type of account. FIIOC pays for typesetting, printing and mailing of shareholder reports, except proxy statements. For the period, the transfer agent fees were equivalent to an annual rate of .27% of average net assets.
Accounting and Security Lending Fees. Fidelity Service Company, Inc. (FSC), an affiliate of FMR, maintains the Fund's accounting records. The accounting fee is based on the level of average net assets for the month. Under a separate contract, FSC administers the security lending program. The security lending fee is based on the number and duration of lending transactions.
Brokerage Commissions. The Fund placed a portion of its portfolio transactions with brokerage firms which are affiliates of the investment adviser. The commissions paid to these affiliated firms were $12,062 for the period.
6. Committed Line of Credit.
The Fund participates with other funds managed by FMR or an affiliate in a $3.75 billion credit facility (the "line of credit") to be utilized for temporary or emergency purposes to fund shareholder redemptions or for other short-term liquidity purposes. The Fund has agreed to pay commitment fees on its pro-rata portion of the line of credit, which amounted to $491 and is reflected in Miscellaneous expenses on the Statement of Operations. During the period, there were no borrowings on this line of credit.
Annual Report
7. Security Lending.
The Fund lends portfolio securities through a lending agent from time to time in order to earn additional income. The lending agent may loan securities to certain qualified borrowers, including Fidelity Capital Markets (FCM), a broker-dealer affiliated with the Fund. On the settlement date of the loan, the Fund receives collateral (in the form of U.S. Treasury obligations, letters of credit and/or cash) against the loaned securities and maintains collateral in an amount not less than 100% of the market value of the loaned securities during the period of the loan. The market value of the loaned securities is determined at the close of business of the Fund and any additional required collateral is delivered to the Fund on the next business day. If the borrower defaults on its obligation to return the securities loaned because of insolvency or other reasons, a fund could experience delays and costs in recovering the securities loaned or in gaining access to the collateral. Any cash collateral received is invested in the Fidelity Securities Lending Cash Central Fund. The value of loaned securities and cash collateral at period end are disclosed on the Fund's Statement of Assets and Liabilities. Security lending income represents the income earned on investing cash collateral, less rebates paid to borrowers and lending agent fees associated with the loan, plus any premium payments received for lending certain types of securities. Security lending income is presented in the Statement of Operations as a component of income from Fidelity Central Funds. Total security lending income during the period amounted to $4,439. During the period, there were no securities loaned to FCM.
8. Expense Reductions.
FMR voluntarily agreed to reimburse the Fund to the extent annual operating expenses exceeded 1.00% of average net assets. Some expenses, for example interest expense, including commitment fees, are excluded from this reimbursement. During the period this reimbursement reduced the Fund's expenses by $137,693.
Many of the brokers with whom FMR places trades on behalf of the Fund provided services to the Fund in addition to trade execution. These services included payments of certain expenses on behalf of the Fund totaling $5,856 for the period.
9. Other.
The Fund's organizational documents provide former and current trustees and officers with a limited indemnification against liabilities arising in connection with the performance of their duties to the Fund. In the normal course of business, the Fund may also enter into contracts that provide general indemnifications. The Fund's maximum exposure under these arrangements is unknown as this would be dependent on future claims that may be made against the Fund. The risk of material loss from such claims is considered remote.
Annual Report
To the Trustees of Fidelity Capital Trust and the Shareholders of Fidelity Focused Stock Fund:
In our opinion, the accompanying statement of assets and liabilities, including the schedule of investments, and the related statements of operations and of changes in net assets and the financial highlights present fairly, in all material respects, the financial position of Fidelity Focused Stock Fund (a fund of Fidelity Capital Trust) at October 31, 2010, the results of its operations for the year then ended, the changes in its net assets for each of the two years in the period then ended and the financial highlights for each of the five years in the period then ended, in conformity with accounting principles generally accepted in the United States of America. These financial statements and financial highlights (hereafter referred to as "financial statements") are the responsibility of the Fidelity Focused Stock Fund's management. Our responsibility is to express an opinion on these financial statements based on our audits. We conducted our audits of these financial statements in accordance with the standards of the Public Company Accounting Oversight Board (United States). Those standards require that we plan and perform the audit to obtain reasonable assurance about whether the financial statements are free of material misstatement. An audit includes examining, on a test basis, evidence supporting the amounts and disclosures in the financial statements, assessing the accounting principles used and significant estimates made by management, and evaluating the overall financial statement presentation. We believe that our audits, which included confirmation of securities at October 31, 2010 by correspondence with the custodian and brokers, provide a reasonable basis for our opinion.
/s/ PricewaterhouseCoopers LLP
PricewaterhouseCoopers LLP
Boston, Massachusetts
December 10, 2010
Annual Report
The Trustees, Member of the Advisory Board, and executive officers of the trust and fund, as applicable, are listed below. The Board of Trustees governs the fund and is responsible for protecting the interests of shareholders. The Trustees are experienced executives who meet periodically throughout the year to oversee the fund's activities, review contractual arrangements with companies that provide services to the fund, oversee management of the risks associated with such activities and contractual arrangements, and review the fund's performance. Except for James C. Curvey, each of the Trustees oversees 221 funds advised by FMR or an affiliate. Mr. Curvey oversees 410 funds advised by FMR or an affiliate.
The Trustees hold office without limit in time except that (a) any Trustee may resign; (b) any Trustee may be removed by written instrument, signed by at least two-thirds of the number of Trustees prior to such removal; (c) any Trustee who requests to be retired or who has become incapacitated by illness or injury may be retired by written instrument signed by a majority of the other Trustees; and (d) any Trustee may be removed at any special meeting of shareholders by a two-thirds vote of the outstanding voting securities of the trust. Each Trustee who is not an interested person (as defined in the 1940 Act) (Independent Trustee), shall retire not later than the last day of the calendar year in which his or her 72nd birthday occurs. The Independent Trustees may waive this mandatory retirement age policy with respect to individual Trustees. The executive officers and Advisory Board Member hold office without limit in time, except that any officer and Advisory Board Member may resign or may be removed by a vote of a majority of the Trustees at any regular meeting or any special meeting of the Trustees. Except as indicated, each individual has held the office shown or other offices in the same company for the past five years.
Experience, Skills, Attributes, and Qualifications of the Fund's Trustees. The Governance and Nominating Committee has adopted a statement of policy that describes the experience, qualifications, attributes, and skills that are necessary and desirable for potential Independent Trustee candidates (Statement of Policy). The Board believes that each Trustee satisfied at the time he or she was initially elected or appointed a Trustee, and continues to satisfy, the standards contemplated by the Statement of Policy. The Governance and Nominating Committee also engages professional search firms to help identify potential Independent Trustee candidates who have the experience, qualifications, attributes, and skills consistent with the Statement of Policy. From time to time, additional criteria based on the composition and skills of the current Independent Trustees, as well as experience or skills that may be appropriate in light of future changes to board composition, business conditions, and regulatory or other developments, have also been considered by the professional search firms and the Governance and Nominating Committee. In addition, the Board takes into account the Trustees' commitment and participation in Board and committee meetings, as well as their leadership of standing and ad hoc committees throughout their tenure.
In determining that a particular Trustee was and continues to be qualified to serve as a Trustee, the Board has considered a variety of criteria, none of which, in isolation, was controlling. The Board believes that, collectively, the Trustees have balanced and diverse experience, qualifications, attributes, and skills, which allow the Board to operate effectively in governing the fund and protecting the interests of shareholders. Information about the specific experience, skills, attributes, and qualifications of each Trustee, which in each case led to the Board's conclusion that the Trustee should serve (or continue to serve) as a trustee of the fund, is provided below.
Annual Report
Trustees and Officers - continued
Board Structure and Oversight Function. Edward C. Johnson 3d is an interested person (as defined in the 1940 Act) and currently serves as Chairman. The Trustees have determined that an interested Chairman is appropriate and benefits shareholders because an interested Chairman has a personal and professional stake in the quality and continuity of services provided to the fund. Independent Trustees exercise their informed business judgment to appoint an individual of their choosing to serve as Chairman, regardless of whether the Trustee happens to be independent or a member of management. The Independent Trustees have determined that they can act independently and effectively without having an Independent Trustee serve as Chairman and that a key structural component for assuring that they are in a position to do so is for the Independent Trustees to constitute a substantial majority for the Board. The Independent Trustees also regularly meet in executive session. Ned C. Lautenbach serves as Chairman of the Independent Trustees and as such (i) acts as a liaison between the Independent Trustees and management with respect to matters important to the Independent Trustees and (ii) with management prepares agendas for Board meetings.
Fidelity funds are overseen by different Boards of Trustees. The fund's Board oversees Fidelity's equity and high income funds and another Board oversees Fidelity's investment-grade bond, money market, and asset allocation funds. The asset allocation funds may invest in Fidelity funds overseen by the fund's Board. The use of separate Boards, each with its own committee structure, allows the Trustees of each group of Fidelity funds to focus on the unique issues of the funds they oversee, including common research, investment, and operational issues. On occasion, the separate Boards establish joint committees to address issues of overlapping consequences for the Fidelity funds overseen by each Board.
The Trustees operate using a system of committees to facilitate the timely and efficient consideration of all matters of importance to the Trustees, the fund, and fund shareholders and to facilitate compliance with legal and regulatory requirements and oversight of the fund's activities and associated risks. The Board, acting through its committees, has charged FMR and its affiliates with (i) identifying events or circumstances the occurrence of which could have demonstrably adverse effects on the fund's business and/or reputation; (ii) implementing processes and controls to lessen the possibility that such events or circumstances occur or to mitigate the effects of such events or circumstances if they do occur; and (iii) creating and maintaining a system designed to evaluate continuously business and market conditions in order to facilitate the identification and implementation processes described in (i) and (ii) above. Because the day-to-day operations and activities of the fund are carried out by or through FMR, its affiliates and other service providers, the fund's exposure to risks is mitigated but not eliminated by the processes overseen by the Trustees. While each of the Board's committees has responsibility for overseeing different aspects of the fund's activities, oversight is exercised primarily through the Operations, Audit, and Compliance Committees. Appropriate personnel, including but not limited to the fund's Chief Compliance Officer (CCO), FMR's internal auditor, the independent accountants, the fund's Treasurer and portfolio management personnel, make periodic reports to the Board's committees, as appropriate. The responsibilities of each committee, including their oversight responsibilities, are described further under "Standing Committees of the Fund's Trustees."
Annual Report
The fund's Statement of Additional Information (SAI) includes more information about the Trustees. To request a free copy, call Fidelity at 1-800-544-8544.
Interested Trustees*:
Correspondence intended for each Trustee who is an interested person may be sent to Fidelity Investments, 82 Devonshire Street, Boston, Massachusetts 02109.
Name, Age; Principal Occupations and Other Relevant Experience+ |
Edward C. Johnson 3d (80) |
| Year of Election or Appointment: 1984 Mr. Johnson is Trustee and Chairman of the Board of Trustees of certain Trusts. Mr. Johnson serves as Chief Executive Officer, Chairman, and a Director of FMR LLC; Chairman and a Director of FMR; Chairman and a Director of Fidelity Research & Analysis Company (FRAC); Chairman and a Director of Fidelity Investments Money Management, Inc.; and Chairman and a Director of FMR Co., Inc. In addition, Mr. Johnson serves as Chairman and Director of FIL Limited. Previously, Mr. Johnson served as President of FMR LLC (2006-2007). |
James C. Curvey (75) |
| Year of Election or Appointment: 2007 Mr. Curvey also serves as Trustee (2007-present) of other investment companies advised by FMR. Mr. Curvey is a Director of Fidelity Investments Money Management, Inc. (2009-present), Director of Fidelity Research & Analysis Co. (2009-present) and Director of FMR and FMR Co., Inc. (2007-present). Mr. Curvey is also Vice Chairman (2007-present) and Director of FMR LLC. In addition, Mr. Curvey serves as an Overseer for the Boston Symphony Orchestra and a member of the Trustees of Villanova University. Previously, Mr. Curvey was the Vice Chairman (2006-2007) and Director (2000-2007) of FMR Corp. |
* Trustees have been determined to be "Interested Trustees" by virtue of, among other things, their affiliation with the trust or various entities under common control with FMR.
Annual Report
Trustees and Officers - continued
+ The information above includes each Trustee's principal occupation during the last five years and other information relating to the experience, attributes, and skills relevant to each Trustee's qualifications to serve as a Trustee, which led to the conclusion that each Trustee should serve as a Trustee for the fund.
Independent Trustees:
Correspondence intended for each Independent Trustee (that is, the Trustees other than the Interested Trustees) may be sent to Fidelity Investments, P.O. Box 55235, Boston, Massachusetts 02205-5235.
Name, Age; Principal Occupations and Other Relevant Experience+ |
Dennis J. Dirks (62) |
| Year of Election or Appointment: 2005 Prior to his retirement in May 2003, Mr. Dirks was Chief Operating Officer and a member of the Board of The Depository Trust & Clearing Corporation (DTCC). He also served as President, Chief Operating Officer, and Board member of The Depository Trust Company (DTC) and President and Board member of the National Securities Clearing Corporation (NSCC). In addition, Mr. Dirks served as Chief Executive Officer and Board member of the Government Securities Clearing Corporation, Chief Executive Officer and Board member of the Mortgage-Backed Securities Clearing Corporation, as a Trustee and a member of the Finance Committee of Manhattan College (2005-2008), and as a Trustee and a member of the Finance Committee of AHRC of Nassau County (2006-2008). Mr. Dirks is a member of the Independent Directors Council (IDC) Governing Council (2010-Present) and Board of Directors for The Brookville Center for Children's Services, Inc. (2009-present). |
Alan J. Lacy (57) |
| Year of Election or Appointment: 2008 Mr. Lacy serves as Senior Adviser (2007-present) of Oak Hill Capital Partners, L.P. (private equity). Mr. Lacy also served as Chief Executive Officer (2000-2005) and Vice Chairman (2005-2006) of Sears Holdings Corporation and Sears, Roebuck and Co. (retail). In addition, Mr. Lacy serves as a member of the Board of Directors of The Western Union Company (global money transfer, 2006-present) and Bristol-Myers Squibb Company (global pharmaceuticals, 2007-present). Mr. Lacy is Chairman (2008-present) and a member (2006-present) of the Board of Trustees of The National Parks Conservation Association. |
Ned C. Lautenbach (66) |
| Year of Election or Appointment: 2000 Mr. Lautenbach is Chairman of the Independent Trustees of the Equity and High Income Funds (2006-present). Mr. Lautenbach currently serves as the Lead Director of the Eaton Corporation Board of Directors (diversified industrial, 1997-present). Mr. Lautenbach is also a member of the Board of Directors of the Philharmonic Center for the Arts in Naples, Florida (1999-present); a member of the Board of Trustees of Fairfield University (2005-present); and a member of the Council on Foreign Relations (1994-present). Previously, Mr. Lautenbach was a Partner/Advisory Partner at Clayton, Dubilier & Rice, Inc. (private equity investment, 1998-2010), as well as a Director of Sony Corporation (2006-2007). |
Joseph Mauriello (66) |
| Year of Election or Appointment: 2008 Prior to his retirement in January 2006, Mr. Mauriello served in numerous senior management positions including Deputy Chairman and Chief Operating Officer (2004-2005), and Vice Chairman of Financial Services (2002-2004) of KPMG LLP US (professional services, 1965-2005). Mr. Mauriello currently serves as a member of the Board of Directors of XL Group plc. (global insurance and re-insurance, 2006-present) and of Arcadia Resources Inc. (health care services and products, 2007-present). Previously, Mr. Mauriello served as a Director of the Hamilton Funds of the Bank of New York (2006-2007). |
Cornelia M. Small (66) |
| Year of Election or Appointment: 2005 Ms. Small is a member of the Board of Directors of the Teagle Foundation (2009-present). Ms. Small is also a member of the Investment Committee, and Chair (2008-present) and a member of the Board of Trustees of Smith College. In addition, Ms. Small serves on the Investment Committee of the Berkshire Taconic Community Foundation (2008-present). Previously, Ms. Small served as Chairperson of the Investment Committee (2002-2008) of Smith College. In addition, Ms. Small served as Chief Investment Officer, Director of Global Equity Investments, and a member of the Board of Directors of Scudder, Stevens & Clark and Scudder Kemper Investments. |
William S. Stavropoulos (71) |
| Year of Election or Appointment: 2001 Mr. Stavropoulos is Vice Chairman of the Independent Trustees of the Equity and High Income Funds (2006-present). Mr. Stavropoulos serves as President and Founder of the Michigan Baseball Foundation, the Great Lakes Loons (2007-present). Mr. Stavropoulos is Chairman Emeritus of the Board of Directors of The Dow Chemical Company, where he previously served in numerous senior management positions, including President, CEO (1995-2000; 2002-2004), Chairman of the Executive Committee (2000-2006), and as a member of the Board of Directors (1990-2006). Currently, Mr. Stavropoulos is Chairman of Univar (global distributor of commodity and specialty chemicals, 2010-present), a Director of Teradata Corporation (data warehousing and technology solutions, 2008-present), Chemical Financial Corporation, Maersk Inc. (industrial conglomerate), Tyco International, Inc. (multinational manufacturing and services, 2007-present), and a member of the Advisory Board for Metalmark Capital (private equity investment, 2005-present). Mr. Stavropoulos is a special advisor to Clayton, Dubilier & Rice, Inc. (private equity investment). In addition, Mr. Stavropoulos is a member of the University of Notre Dame Advisory Council for the College of Science. |
David M. Thomas (61) |
| Year of Election or Appointment: 2008 Previously, Mr. Thomas served as Executive Chairman (2005-2006) and Chairman and Chief Executive Officer (2000-2005) of IMS Health, Inc. (pharmaceutical and healthcare information solutions). In addition, Mr. Thomas serves as a member of the Board of Directors of Fortune Brands, Inc. (consumer products), and Interpublic Group of Companies, Inc. (marketing communication, 2004-present). |
Michael E. Wiley (60) |
| Year of Election or Appointment: 2008 Mr. Wiley also serves as a Director of Asia Pacific Exploration Consolidated (international oil and gas exploration and production, 2008-present). Mr. Wiley serves as a Director of Tesoro Corporation (independent oil refiner and marketer, 2005-present), and a Director of Bill Barrett Corporation (exploration and production, 2005-present). In addition, Mr. Wiley also serves as a Director of Post Oak Bank (privately-held bank, 2004-present). Previously, Mr. Wiley served as a member of the Board of Trustees of the University of Tulsa (2000-2006; 2007-2010), as a Senior Energy Advisor of Katzenbach Partners, LLC (consulting, 2006-2007), as an Advisory Director of Riverstone Holdings (private investment), Chairman, President, and CEO of Baker Hughes, Inc. (oilfield services, 2000-2004), and as Director of Spinnaker Exploration Company (exploration and production, 2001-2005). |
Annual Report
+ The information above includes each Trustee's principal occupation during the last five years and other information relating to the experience, attributes, and skills relevant to each Trustee's qualifications to serve as a Trustee, which led to the conclusion that each Trustee should serve as a Trustee for the fund.
Advisory Board Member and Executive Officers:
Correspondence intended for each executive officer and Peter S. Lynch may be sent to Fidelity Investments, 82 Devonshire Street, Boston, Massachusetts 02109.
Name, Age; Principal Occupation |
Peter S. Lynch (66) |
| Year of Election or Appointment: 2003 Member of the Advisory Board of Fidelity's Equity and High Income Funds. Mr. Lynch is Vice Chairman and a Director of FMR and FMR Co., Inc. In addition, Mr. Lynch serves as a Trustee of Boston College and as the Chairman of the Inner-City Scholarship Fund. Previously, Mr. Lynch served on the Special Olympics International Board of Directors (1997-2006). |
Kenneth B. Robins (41) |
| Year of Election or Appointment: 2008 President and Treasurer of Fidelity's Equity and High Income Funds. Mr. Robins also serves as President and Treasurer (2010-present) and Assistant Treasurer (2009-present) of other Fidelity funds and is an employee of Fidelity Investments (2004-present). Previously, Mr. Robins served as Deputy Treasurer of the Fidelity funds (2005-2008) and Treasurer and Chief Financial Officer of The North Carolina Capital Management Trust: Cash and Term Portfolios (2006-2008). |
Bruce T. Herring (45) |
| Year of Election or Appointment: 2006 Vice President of certain Equity Funds. Mr. Herring also serves as Chief Investment Officer and Director of Fidelity Management & Research (U.K.) Inc. (2010-present) and Group Chief Investments Officer of FMR. Previously, Mr. Herring served as Vice President (2005-2006) and Senior Vice President (2006-2007) of Fidelity Management & Research Company, Vice President of FMR Co., Inc. (2001-2007) and as a portfolio manager for Fidelity U.S. Equity Funds. |
Brian B. Hogan (46) |
| Year of Election or Appointment: 2009 Vice President of certain Equity Funds and Vice President of Sector Funds. Mr. Hogan also serves as President of FMR's Equity Division (2009-present). Previously, Mr. Hogan served as Senior Vice President, Equity Research of FMR (2006-2009) and as a portfolio manager. |
Scott C. Goebel (42) |
| Year of Election or Appointment: 2008 Secretary and Chief Legal Officer (CLO) of the Fidelity funds. Mr. Goebel also serves as Secretary and CLO of The North Carolina Capital Management Trust: Cash and Term Portfolio (2008-present); General Counsel, Secretary, and Senior Vice President of FMR (2008-present) and FMR Co., Inc. (2008-present); Deputy General Counsel of FMR LLC; Chief Legal Officer of Fidelity Management & Research (Hong Kong) Limited (2008-present) and Assistant Secretary of Fidelity Management & Research (Japan) Inc. (2008-present), Fidelity Investments Money Management, Inc. (2008-present), Fidelity Management & Research (U.K.) Inc. (2008-present), and Fidelity Research and Analysis Company (2008-present). Previously, Mr. Goebel served as Assistant Secretary of the Funds (2007-2008) and as Vice President and Secretary of Fidelity Distributors Corporation (FDC) (2005-2007). |
William C. Coffey (41) |
| Year of Election or Appointment: 2009 Assistant Secretary of Fidelity's Equity and High Income Funds. Mr. Coffey also serves as Senior Vice President and Deputy General Counsel of FMR LLC (2010-present), and is an employee of Fidelity Investments. Previously, Mr. Coffey served as Vice President and Associate General Counsel of FMR LLC (2005-2009). |
Holly C. Laurent (56) |
| Year of Election or Appointment: 2008 Anti-Money Laundering (AML) Officer of the Fidelity funds. Ms. Laurent also serves as AML Officer of The North Carolina Capital Management Trust: Cash and Term Portfolio (2008-present) and is an employee of Fidelity Investments. Previously, Ms. Laurent was Senior Vice President and Head of Legal for Fidelity Business Services India Pvt. Ltd. (2006-2008), and Senior Vice President, Deputy General Counsel and Group Head for FMR LLC (2005-2006). |
Christine Reynolds (52) |
| Year of Election or Appointment: 2008 Chief Financial Officer of the Fidelity funds. Ms. Reynolds became President of Fidelity Pricing and Cash Management Services (FPCMS) in August 2008. Ms. Reynolds served as Chief Operating Officer of FPCMS (2007-2008). Previously, Ms. Reynolds served as President, Treasurer, and Anti-Money Laundering officer of the Fidelity funds (2004-2007). |
Kenneth A. Rathgeber (63) |
| Year of Election or Appointment: 2004 Chief Compliance Officer of Fidelity's Equity and High Income Funds. Mr. Rathgeber is Chief Compliance Officer of Fidelity Management & Research (Hong Kong) Limited (2008-present), Fidelity Management & Research (Japan) Inc. (2008-present), FMR (2005-present), FMR Co., Inc. (2005-present), Fidelity Management & Research (U.K.) Inc. (2005-present), Fidelity Research & Analysis Company (2005-present), Fidelity Investments Money Management, Inc. (2005-present), Pyramis Global Advisors, LLC (2005-present), and Strategic Advisers, Inc. (2005-present). |
Jeffrey S. Christian (49) |
| Year of Election or Appointment: 2009 Deputy Treasurer of the Fidelity funds. Mr. Christian is an employee of Fidelity Investments. Previously, Mr. Christian served as Chief Financial Officer (2008-2009) of certain Fidelity funds and Senior Vice President of Fidelity Pricing and Cash Management Services (FPCMS) (2004-2009). |
Bryan A. Mehrmann (49) |
| Year of Election or Appointment: 2005 Deputy Treasurer of the Fidelity funds. Mr. Mehrmann is an employee of Fidelity Investments. |
Adrien E. Deberghes (43) |
| Year of Election or Appointment: 2008 Deputy Treasurer of Fidelity's Equity and High Income Funds. Mr. Deberghes also serves as Assistant Treasurer of other Fidelity funds (2010-present) and is an employee of Fidelity Investments (2008-present). Previously, Mr. Deberghes served as Senior Vice President of Mutual Fund Administration at State Street Corporation (2007-2008), Senior Director of Mutual Fund Administration at Investors Bank & Trust (2005-2007), and Director of Finance for Dunkin' Brands (2000-2005). |
Stephanie J. Dorsey (41) |
| Year of Election or Appointment: 2010 Assistant Treasurer of Fidelity's Equity and High Income Funds. Ms. Dorsey also serves as Deputy Treasurer of other Fidelity funds (2008-present) and is an employee of Fidelity Investments (2008-present). Previously, Ms. Dorsey served as Treasurer (2004-2008) of the JPMorgan Mutual Funds and Vice President (2004-2008) of JPMorgan Chase Bank. |
Name, Age; Principal Occupation |
John R. Hebble (52) |
| Year of Election or Appointment: 2009 Assistant Treasurer of Fidelity's Equity and High Income Funds. Mr. Hebble also serves as Treasurer and Chief Financial Officer of The North Carolina Capital Management Trust: Cash and Term Portfolio (2008-present), President and Treasurer of other Fidelity funds (2008-present) and is an employee of Fidelity Investments. |
Gary W. Ryan (52) |
| Year of Election or Appointment: 2005 Assistant Treasurer of the Fidelity funds. Mr. Ryan is an employee of Fidelity Investments. Previously, Mr. Ryan served as Vice President of Fund Reporting in Fidelity Pricing and Cash Management Services (FPCMS) (1999-2005). |
Jonathan Davis (42) |
| Year of Election or Appointment: 2010 Assistant Treasurer of the Fidelity funds. Mr. Davis is an employee of Fidelity Investments. Previously, Mr. Davis served as Vice President and Associate General Counsel of FMR LLC (2003-2010). |
Annual Report
The fund designates 100% of the dividend distributed during the fiscal year as qualifying for the dividends-received deduction for corporate shareholders.
The fund designates 100% of the dividends distributed in December during the fiscal year as amounts which may be taken into account as a dividend for the purposes of the maximum rate under section 1(h)(11) of the Internal Revenue Code.
The fund will notify shareholders in January 2011 of amounts for use in preparing 2010 income tax returns.
Annual Report
Board Approval of Investment Advisory Contracts and Management Fees
Fidelity Focused Stock Fund
Each year, the Board of Trustees, including the Independent Trustees (together, the Board), votes on the renewal of the management contract and sub-advisory agreements (together, the Advisory Contracts) for the fund. The Board, assisted by the advice of fund counsel and Independent Trustees' counsel, requests and considers a broad range of information relevant to the renewal of the Advisory Contracts throughout the year.
The Board meets regularly and considers at each of its meetings factors that are relevant to its annual consideration of the renewal of the fund's Advisory Contracts, including the services and support provided to the fund and its shareholders. The Board has established various standing committees, each composed of Independent Trustees with varying backgrounds, to which the Board has assigned specific subject matter responsibilities in order to enhance effective decision-making by the Board. The Board, acting directly and through its Committees, requests and receives information concerning the annual consideration of the renewal of the fund's Advisory Contracts. The Board also meets as needed to consider matters specifically related to the Board's annual consideration of the renewal of Advisory Contracts. Members of the Board may also meet with trustees of other Fidelity funds through ad hoc joint committees to discuss certain matters relevant to the Fidelity funds.
At its July 2010 meeting, the Board of Trustees, including the Independent Trustees, unanimously determined to renew the fund's Advisory Contracts. In reaching its determination, the Board considered all factors it believed relevant, including (i) the nature, extent, and quality of the services to be provided to the fund and its shareholders (including the investment performance of the fund); (ii) the competitiveness of the fund's management fee and total expenses; (iii) the total costs of the services to be provided by and the profits to be realized by Fidelity from its relationship with the fund; (iv) the extent to which economies of scale would be realized as the fund grows; and (v) whether fee levels reflect these economies of scale, if any, for the benefit of fund shareholders.
In considering whether to renew the Advisory Contracts for the fund, the Board reached a determination, with the assistance of fund counsel and Independent Trustees' counsel and through the exercise of its business judgment, that the renewal of the Advisory Contracts is in the best interests of fund shareholders and that the compensation to be received by Fidelity under the management contract is fair and reasonable. The Board's decision to renew the Advisory Contracts was not based on any single factor noted above, but rather was based on a comprehensive consideration of all the information provided to the Board at its meetings throughout the year. The Board, in reaching its determination to renew the Advisory Contracts, is aware that shareholders in the fund have a broad range of investment choices available to them, including a wide choice among mutual funds offered by Fidelity's competitors, and that the fund's shareholders, with the opportunity to review and weigh the disclosure provided by the fund in its prospectus and other public disclosures, have chosen to invest in this fund, managed by Fidelity.
Annual Report
Nature, Extent, and Quality of Services Provided. The Board considered the staffing within the investment adviser, FMR, and the sub-advisers (together, the Investment Advisers), including the backgrounds of the fund's investment personnel and the fund's investment objective and discipline. The Independent Trustees also had discussions with senior management of Fidelity's investment operations and investment groups. The Board considered the structure of the portfolio manager compensation program and whether this structure provides appropriate incentives to act in the best interest of the fund.
Resources Dedicated to Investment Management and Support Services. The Board and the equity research subcommittee of the Board's Fund Oversight Committee reviewed the size, education, and experience of the Investment Advisers' investment staff, their use of technology, and the Investment Advisers' approach to recruiting, training, and retaining portfolio managers and other research, advisory, and management personnel. The Board noted that Fidelity's analysts have access to a variety of technological tools and market and securities data that enable them to perform both fundamental and quantitative analysis and to specialize in various disciplines. The Board considered Fidelity's extensive global research capabilities that enable the Investment Advisers to aggregate data from various sources in an effort to produce positive investment results. The Board also considered that Fidelity's portfolio managers and analysts have access to daily portfolio attribution that allows for monitoring of a fund's portfolio, as well as an electronic communication system that provides immediate real-time access to research concerning issuers and credit enhancers. The Board noted FMR's continued focus on strengthening the organization and discipline of equity portfolio management and research.
Shareholder and Administrative Services. The Board considered (i) the nature, extent, quality, and cost of advisory, administrative, and shareholder services performed by the Investment Advisers and their affiliates under the Advisory Contracts and under separate agreements covering transfer agency, pricing and bookkeeping, and securities lending services for the fund; (ii) the nature and extent of the investment adviser's supervision of third party service providers, principally custodians and subcustodians; and (iii) the resources devoted to, and the record of compliance with, the fund's compliance policies and procedures. The Board also reviewed the allocation of fund brokerage, including allocations to brokers affiliated with the Investment Advisers, the use of brokerage commissions to pay fund expenses, and the use of "soft" commission dollars to pay for research services.
The Board noted that the growth of fund assets over time across the complex allows Fidelity to reinvest in the development of services designed to enhance the value or convenience of the Fidelity funds as investment vehicles. These services include 24-hour access to account information and market information through phone representatives and over the Internet, and investor education materials and asset allocation tools.
Annual Report
Board Approval of Investment Advisory Contracts and
Management Fees - continued
Investment in a Large Fund Family. The Board considered the benefits to shareholders of investing in a Fidelity fund, including the benefits of investing in a fund that is part of a large family of funds offering a variety of investment disciplines and providing a large variety of mutual fund investor services. The Board noted that Fidelity had taken, or had made recommendations that resulted in the Fidelity funds taking, a number of actions over the previous year that benefited particular funds, including (i) dedicating additional resources to investment research and restructuring and broadening the focus of the investment research teams; (ii) bolstering the senior management team that oversees asset management; (iii) launching Class F of certain funds as a lower-fee class available to Freedom K and Freedom Index Funds; (iv) lowering the initial investment minimums and ongoing balance requirements for Real Estate High Income Fund; (v) eliminating subsequent purchase minimums for all funds and adding a waiver of the investment minimum requirement for new accounts opened with the proceeds of a systematic withdrawal plan; (vi) eliminating the withdrawal minimum and maximum limits for systematic withdrawals from Advisor funds; (vii) expanding sales load waivers on Class A shares for Destiny Planholders and expanding Institutional Class eligibility for Class O Destiny Planholders; and (viii) changing certain Class A and Class T sales charge structures to further align them with industry practices.
Investment Performance. The Board considered whether the fund has operated in accordance with its investment objective, as well as its record of compliance with its investment restrictions. It also reviewed the fund's absolute investment performance, as well as the fund's relative investment performance measured over multiple periods against (i) a broad-based securities market index, and (ii) a custom peer group of mutual funds deemed appropriate by Fidelity and reviewed by the Board. The following charts considered by the Board show, over the one-, three-, and five-year periods ended December 31, 2009, the fund's cumulative total returns, the cumulative total returns of a broad-based securities market index ("benchmark"), and a range of cumulative total returns of a custom peer group of mutual funds defined by FMR based on categories assigned by Morningstar, Inc. The box within each chart shows the 25th percentile return (bottom of box) and the 75th percentile return (top of box) of the peer group. Returns shown above the box are in the first quartile and returns shown below the box are in the fourth quartile. The percentage beaten number noted below each chart corresponds to the percentile box and represents the percentage of funds in the peer group whose performance was equal to or lower than that of the fund. The fund's custom peer group, defined by FMR, is a peer group that FMR believes provides a more meaningful performance comparison than the peer group assigned by Morningstar, Inc., which assigns mutual funds to categories based on their investment styles as measured by their underlying portfolio holdings.
Annual Report
Fidelity Focused Stock Fund
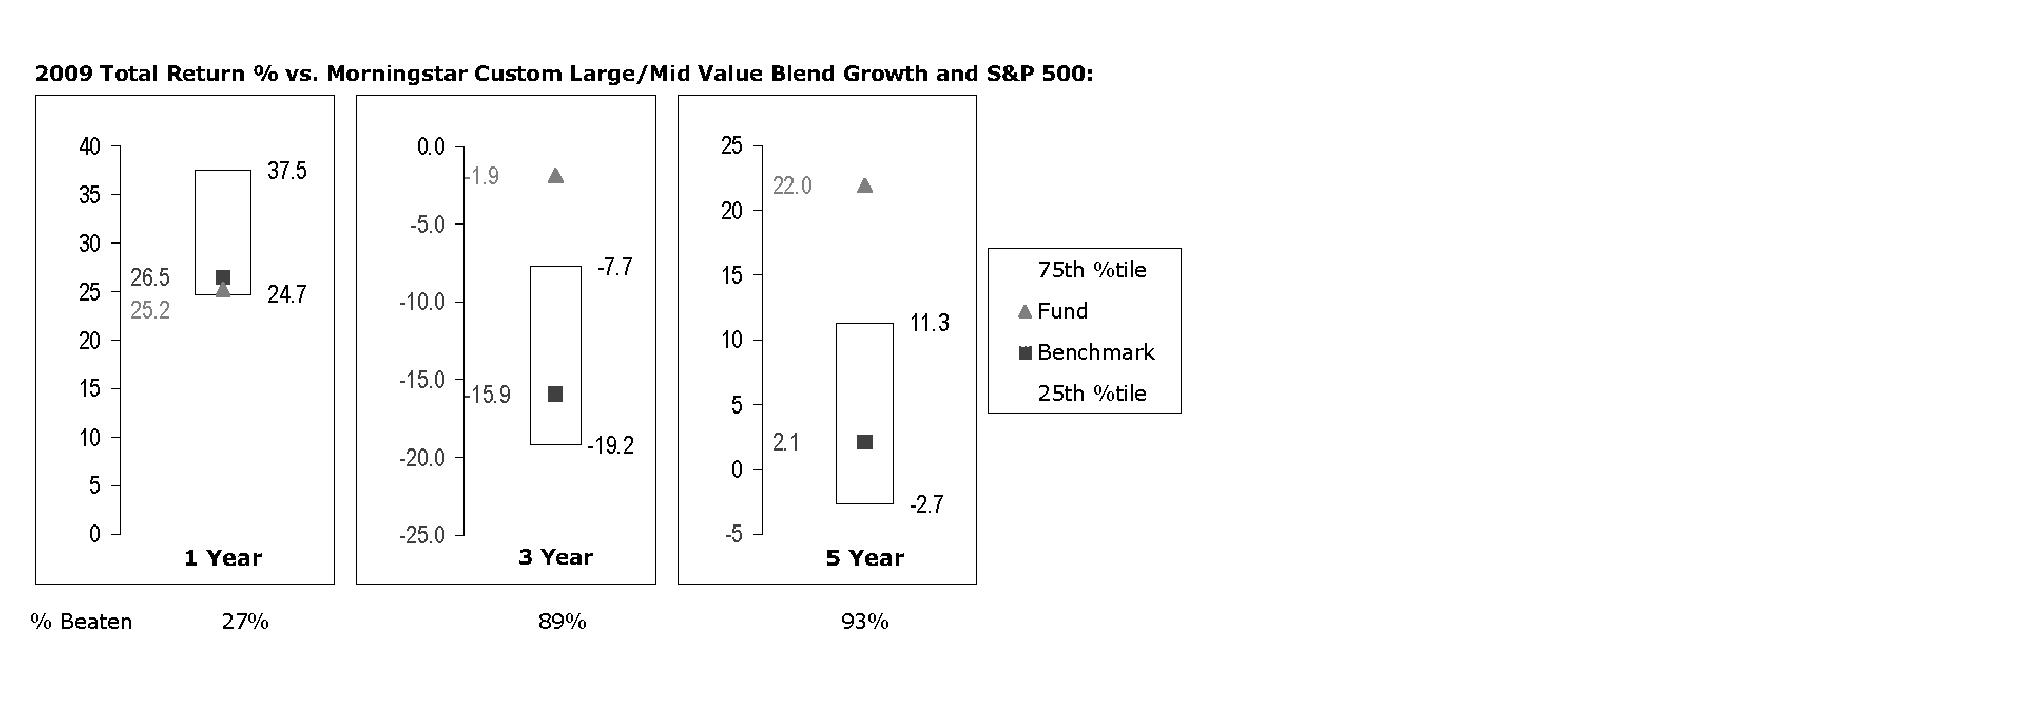
The Board reviewed the fund's relative investment performance against its peer group and noted that the performance of the fund was in the third quartile for the one-year period and the first quartile for the three- and five-year periods. The Board also noted that the investment performance of the fund compared favorably to its benchmark for the three- and five-year periods, although the fund's one-year cumulative total return was lower than its benchmark. The Board also reviewed the fund's performance since inception as well as performance in the current year.
The Board also considered that the fund's management fee is subject to upward or downward adjustment depending upon whether, and to what extent, the fund's investment performance for the performance period exceeds, or is exceeded by, the record (over the same period) of a Board-approved performance adjustment index. The Board realizes that the performance adjustment provides FMR with a strong economic incentive to seek to achieve superior performance for the fund's shareholders and helps to more closely align the interests of FMR and the fund's shareholders.
Based on its review, and giving particular weight to the nature and quality of the resources dedicated by the Investment Advisers to maintain and improve relative performance and factoring in the unprecedented market events in recent years, the Board concluded that the nature, extent, and quality of investment management and support services and of shareholder and administrative services provided to the fund will benefit the fund's shareholders, particularly in light of the Board's view that the fund's shareholders benefit from investing in a fund that is part of a large family of funds offering a variety of investment disciplines and services.
Annual Report
Board Approval of Investment Advisory Contracts and
Management Fees - continued
Competitiveness of Management Fee and Total Fund Expenses. The Board considered the fund's management fee and total expenses compared to "mapped groups" of competitive funds and classes. Fidelity creates "mapped groups" by combining similar Lipper investment objective categories that have comparable management fee characteristics. Combining Lipper investment objective categories aids the Board's management fee and total expense comparisons by broadening the competitive group used for comparison and by reducing the number of universes to which various Fidelity funds are compared.
Management Fee. The Board considered two proprietary management fee comparisons for the 12-month periods shown in the chart below. The group of Lipper funds used by the Board for management fee comparisons is referred to below as the "Total Mapped Group." The Total Mapped Group comparison focuses on a fund's standing relative to the total universe of comparable funds available to investors, in terms of gross management fees before expense reimbursements or caps, and without giving effect to the fund's performance adjustment. "TMG %" represents the percentage of funds in the Total Mapped Group that had management fees that were lower than the fund's. For example, a TMG % of 10% means that 90% of the funds in the Total Mapped Group had higher management fees than the fund. The "Asset-Size Peer Group" (ASPG) comparison focuses on a fund's standing relative to non-Fidelity funds similar in size to the fund within the Total Mapped Group. The ASPG represents at least 15% of the funds in the Total Mapped Group with comparable asset size and management fee characteristics, subject to a minimum of 50 funds (or all funds in the Total Mapped Group if fewer than 50). Additional information, such as the ASPG quartile in which the fund's management fee ranked and the impact of the fund's performance adjustment, is also included in the chart and considered by the Board.
Annual Report
Fidelity Focused Stock Fund
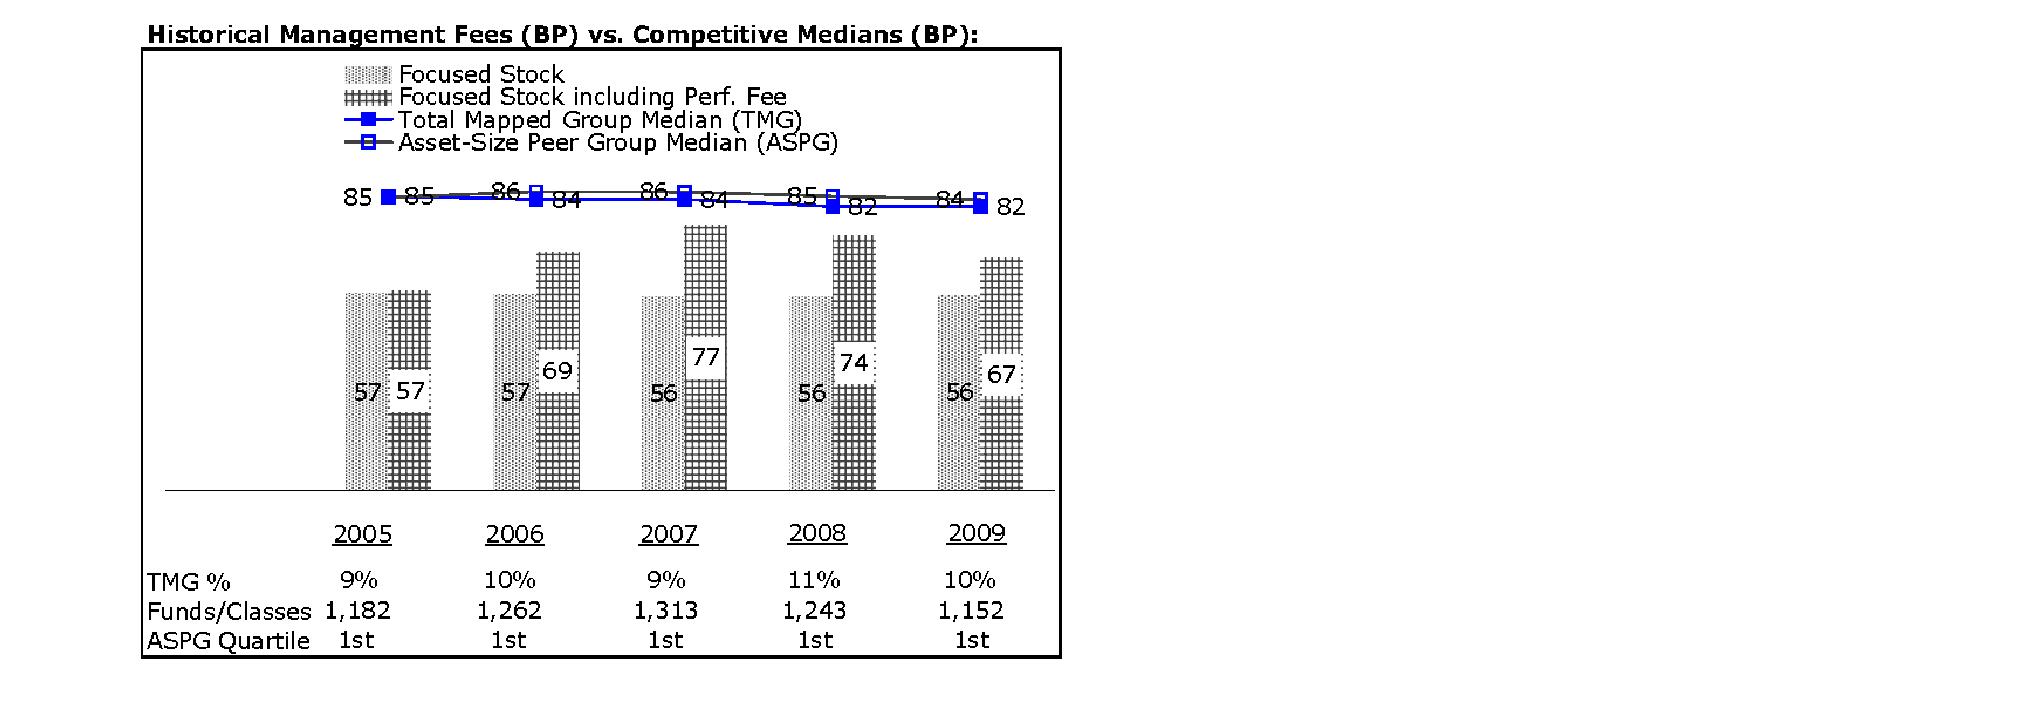
The Board noted that the fund's management fee ranked below the median of its Total Mapped Group and below the median of its ASPG for 2009. The Board also noted the effect of the fund's positive performance adjustment on the fund's management fee ranking. The Board noted that the performance adjustment for each year represents calculations for performance periods that differ from the periods shown in the performance charts above.
Based on its review, the Board concluded that the fund's management fee is fair and reasonable in light of the services that the fund receives and the other factors considered.
Total Expenses. In its review of the fund's total expenses, the Board considered the fund's management fee as well as other fund expenses, such as transfer agent fees, pricing and bookkeeping fees, and custodial, legal, and audit fees. The Board also noted the effects of any waivers and reimbursements on fees and expenses, as well as the impact of the fund's performance adjustment. As part of its review, the Board also considered current and historical total expenses of the fund compared to competitive fund median expenses. The fund is compared to those funds and classes in the Total Mapped Group (used by the Board for management fee comparisons) that have a similar sales load structure.
The Board noted that the fund's total expenses ranked below its competitive median for 2009.
Fees Charged to Other Fidelity Clients. The Board also considered Fidelity fee structures and other information with respect to clients of FMR and its affiliates, such as other mutual funds advised or subadvised by FMR or its affiliates, pension plan clients, and other institutional clients. In March 2010, the Board created an ad hoc joint committee with the board of other Fidelity funds (the Committee) to review and compare Fidelity's institutional investment advisory business with its business of providing services to the Fidelity funds, including the differences in services provided, fees charged, and costs incurred, as well as competition in their respective marketplaces.
Annual Report
Board Approval of Investment Advisory Contracts and
Management Fees - continued
Based on its review of total expenses and fees charged to other Fidelity clients, the Board concluded that the fund's total expenses were reasonable in light of the services that the fund and its shareholders receive and the other factors considered, including the findings of the Committee.
Costs of the Services and Profitability. The Board considered the revenues earned and the expenses incurred by Fidelity in conducting the business of developing, marketing, distributing, managing, administering and servicing the fund and its shareholders. The Board also considered the level of Fidelity's profits in respect of all the Fidelity funds.
On an annual basis, FMR presents to the Board Fidelity's profitability for the fund. Fidelity calculates the profitability for each fund, as well as aggregate profitability for groups of Fidelity funds and all Fidelity funds, using a series of detailed revenue and cost allocation methodologies which originate with the audited books and records of Fidelity. The Audit Committee of the Board reviews any significant changes from the prior year's methodologies.
PricewaterhouseCoopers LLP (PwC), independent registered public accounting firm and auditor to Fidelity and certain Fidelity funds, has been engaged annually by the Board as part of the Board's assessment of Fidelity's profitability analysis. PwC's engagement includes the review and assessment of Fidelity's methodologies used in determining the revenues and expenses attributable to Fidelity's mutual fund business, and completion of agreed-upon procedures surrounding the mathematical accuracy of fund profitability and its conformity to allocation methodologies. After considering PwC's reports issued under the engagement and information provided by Fidelity, the Board believes that while other allocation methods may also be reasonable, Fidelity's profitability methodologies are reasonable in all material respects.
The Board has also reviewed Fidelity's non-fund businesses and fall-out benefits related to the mutual fund business as well as cases where Fidelity's affiliates may benefit from or be related to the fund's business.
The Board considered the costs of the services provided by and the profits realized by Fidelity in connection with the operation of the fund and were satisfied that the profitability was not excessive in the circumstances.
Economies of Scale. The Board considered whether there have been economies of scale in respect of the management of the Fidelity funds, whether the Fidelity funds (including the fund) have appropriately benefited from any such economies of scale, and whether there is potential for realization of any further economies of scale. The Board considered the extent to which the fund will benefit from economies of scale through increased services to the fund, through waivers or reimbursements, or through fee or expense reductions.
Annual Report
In February 2009, the Board and the board of other Fidelity funds created an ad hoc committee (the Economies of Scale Committee) to analyze whether FMR attains economies of scale in respect of the management and servicing of the Fidelity funds, whether the Fidelity funds have appropriately benefited from such economies of scale, and whether there is potential for realization of any further economies of scale.
The Board recognized that the fund's management contract incorporates a "group fee" structure, which provides for lower group fee rates as total fund assets under FMR's management increase, and for higher group fee rates as total fund assets under FMR's management decrease. FMR calculates the group fee rates based on a tiered asset "breakpoint" schedule that varies based on asset class. The Board considered that the group fee is designed to deliver the benefits of economies of scale to fund shareholders when total Fidelity fund assets increase, even if assets of any particular fund are unchanged or have declined, because some portion of Fidelity's costs are attributable to services provided to all Fidelity funds, and all funds benefit if those costs can be allocated among more assets. The Board concluded that, given the group fee structure, fund shareholders will benefit from lower management fees as assets under FMR's management increase at the fund complex level, regardless of whether Fidelity achieves any such economies of scale.
The Board concluded, considering the findings of the Economies of Scale Committee, that any potential economies of scale are being appropriately shared between fund shareholders and Fidelity.
Additional Information Requested by the Board. In order to develop fully the factual basis for consideration of the Fidelity funds' Advisory Contracts, the Board requested and received additional information on certain topics, including (i) fund performance trends, actions to be taken by FMR to improve certain funds' overall performance, and Fidelity's long-term strategies for certain funds; (ii) portfolio manager changes that have occurred during the past year and length of portfolio manager tenure for different categories of funds over time; (iii) Fidelity's compensation structure for portfolio managers, research analysts, and other key personnel, the rationale for the compensation structure, and how the compensation structure provides appropriate performance incentives; (iv) the amount of the investment that each portfolio manager has made in the Fidelity fund(s) that he or she manages; (v) management and other fees paid by FMR to affiliated sub-advisers on behalf of the Fidelity funds; (vi) Fidelity's fee structures and rationale for recommending different fees among different categories of funds; (vii) Fidelity's rationale for recommending which funds should have a performance adjustment component as part of their management fees; (viii) the rationale for any differences between fund fee structures and fee structures in place for other Fidelity clients; and (ix) explanations regarding the relative total expenses borne by certain funds and classes, total expense competitive trends, and actions that might be taken by FMR to reduce total expenses for certain funds and classes.
Annual Report
Board Approval of Investment Advisory Contracts and
Management Fees - continued
Based on its evaluation of all of the conclusions noted above, and after considering all factors it believed relevant, the Board ultimately concluded that the advisory fee structures are fair and reasonable, and that the fund's Advisory Contracts should be renewed.
Annual Report
Managing Your Investments
Fidelity offers several ways to conveniently manage your personal investments via your telephone or PC. You can access your account information, conduct trades and research your investments 24 hours a day.
By Phone
Fidelity Automated Service Telephone provides a single toll-free number to access account balances, positions, quotes and trading. It's easy to navigate the service, and on your first call, the system will help you create a personal identification number (PIN) for security.
(phone_graphic)
Fidelity Automated
Service Telephone (FAST®)
1-800-544-5555
Press
For mutual fund and brokerage trading.
For quotes.*
For account balances and holdings.
To review orders and mutual
fund activity.
To change your PIN.
To speak to a Fidelity representative.
By PC
Fidelity's web site on the Internet provides a wide range of information, including daily financial news, fund performance, interactive planning tools and news about Fidelity products and services.
(computer_graphic)
Fidelity's Web Site
www.fidelity.com
* When you call the quotes line, please remember that a fund's yield and return will vary and, except for money market funds, share price will also vary. This means that you may have a gain or loss when you sell your shares. There is no assurance that money market funds will be able to maintain a stable $1 share price; an investment in a money market fund is not insured or guaranteed by the U.S. government. Total returns are historical and include changes in share price, reinvestment of dividends and capital gains, and the effects of any sales charges.
Annual Report
To Write Fidelity
We'll give your correspondence immediate attention and send you written confirmation upon completion of your request.
(letter_graphic)
Making Changes
To Your Account
(such as changing name, address, bank, etc.)
Fidelity Investments
P.O. Box 770001
Cincinnati, OH 45277-0002
(letter_graphic)
For Non-Retirement
Accounts
Buying shares
Fidelity Investments
P.O. Box 770001
Cincinnati, OH 45277-0003
Overnight Express
Fidelity Investments
Attn: Distribution Services
100 Crosby Parkway - KC1H
Covington, KY 41015
Selling shares
Fidelity Investments
P.O. Box 770001
Cincinnati, OH 45277-0035
Overnight Express
Fidelity Investments
Attn: Distribution Services
100 Crosby Parkway - KC1H
Covington, KY 41015
General Correspondence
Fidelity Investments
P.O. Box 500
Merrimack, NH 03054-0500
(letter_graphic)
For Retirement
Accounts
Buying shares
Fidelity Investments
P.O. Box 770001
Cincinnati, OH 45277-0003
Selling shares
Fidelity Investments
P.O. Box 770001
Cincinnati, OH 45277-0035
Overnight Express
Fidelity Investments
Attn: Distribution Services
100 Crosby Parkway - KC1H
Covington, KY 41015
General Correspondence
Fidelity Investments
P.O. Box 500
Merrimack, NH 03054-0500
Annual Report
Investment Adviser
Fidelity Management &
Research Company
Boston, MA
Investment Sub-Advisers
FMR Co., Inc.
Fidelity Management & Research
(U.K.) Inc.
Fidelity Research & Analysis Company
Fidelity Management & Research
(Japan) Inc.
Fidelity Management & Research
(Hong Kong) Limited
General Distributor
Fidelity Distributors Corporation
Boston, MA
Transfer and Service Agents
Fidelity Investments Institutional
Operations Company, Inc.
Boston, MA
Fidelity Service Company, Inc.
Boston, MA
Custodian
JPMorgan Chase Bank
New York, NY
The Fidelity Telephone Connection
Mutual Fund 24-Hour Service
Exchanges/Redemptions
and Account Assistance 1-800-544-6666
Product Information 1-800-544-6666
Retirement Accounts 1-800-544-4774
(8 a.m. - 9 p.m.)
TDD Service 1-800-544-0118
for the deaf and hearing impaired
(9 a.m. - 9 p.m. Eastern time)
Fidelity Automated Service
Telephone (FAST®) 1-800-544-5555
Automated line for quickest service
TQG-UANN-1210
1.784778.107
Fidelity®
Stock Selector All Cap Fund
(formerly Fidelity Stock Selector)
Annual Report
October 31, 2010
(2_fidelity_logos) (Registered_Trademark)
Contents
Chairman's Message | <Click Here> | The Chairman's message to shareholders. |
Performance | <Click Here> | How the fund has done over time. |
Management's Discussion of Fund Performance | <Click Here> | The Portfolio Managers' review of fund performance and strategy. |
Shareholder Expense Example | <Click Here> | An example of shareholder expenses. |
Investment Changes | <Click Here> | A summary of major shifts in the fund's investments over the past six months. |
Investment Summary | <Click Here> | A summary of the fund's holdings. |
Investments | <Click Here> | A complete list of the fund's investments with their market values. |
Financial Statements | <Click Here> | Statements of assets and liabilities, operations, and changes in net assets, as well as financial highlights. |
Notes | <Click Here> | Notes to the financial statements. |
Report of Independent Registered Public Accounting Firm | <Click Here> | |
Trustees and Officers | <Click Here> | |
Distributions | <Click Here> | |
Board Approval of Investment Advisory Contracts and Management Fees | <Click Here> | |
To view a fund's proxy voting guidelines and proxy voting record for the 12-month period ended June 30, visit http://www.fidelity.com/proxyvotingresults or visit the Securities and Exchange Commission's (SEC) web site at http://www.sec.gov. You may also call 1-800-544-8544 to request a free copy of the proxy voting guidelines.
Standard & Poor's, S&P and S&P 500 are registered service marks of The McGraw-Hill Companies, Inc. and have been licensed for use by Fidelity Distributors Corporation.
Other third party marks appearing herein are the property of their respective owners.
All other marks appearing herein are registered or unregistered trademarks or service marks of FMR LLC or an affiliated company.
Annual Report
This report and the financial statements contained herein are submitted for the general information of the shareholders of the fund. This report is not authorized for distribution to prospective investors in the fund unless preceded or accompanied by an effective prospectus.
A fund files its complete schedule of portfolio holdings with the SEC for the first and third quarters of each fiscal year on Form N-Q. Forms N-Q are available on the SEC's web site at http://www.sec.gov. A fund's Forms N-Q may be reviewed and copied at the SEC's Public Reference Room in Washington, DC. Information regarding the operation of the SEC's Public Reference Room may be obtained by calling 1-800-SEC-0330. For a complete list of a fund's portfolio holdings, view the most recent holdings listing, semiannual report, or annual report on Fidelity's web site at http://www.fidelity.com or http://www.advisor.fidelity.com, as applicable.
NOT FDIC INSURED • MAY LOSE VALUE • NO BANK GUARANTEE
Neither the fund nor Fidelity Distributors Corporation is a bank.
Annual Report
(photo_of_Edward_C_Johnson_3d)
Dear Shareholder:
Equities have staged a rally in the second half of 2010, shaking off concerns about the European debt crisis and the possibility of a double-dip recession in the U.S. Although the short-term surge pushed major equity indexes back into positive territory for the year, several questions remain about the longer-term outlook, including lackluster economic growth and persistently high unemployment. Financial markets are always unpredictable, of course, but there also are several time-tested investment principles that can help put the odds in your favor.
One of the basic tenets is to invest for the long term. Over time, riding out the markets' inevitable ups and downs has proven much more effective than selling into panic or chasing the hottest trend. Even missing only a few of the markets' best days can significantly diminish investor returns. Patience also affords the benefits of compounding - of earning interest on additional income or reinvested dividends and capital gains. There can be tax advantages and cost benefits to consider as well. While staying the course doesn't eliminate risk, it can considerably lessen the effect of short-term declines.
You can further manage your investing risk through diversification. And today, more than ever, geographic diversification should be taken into account. Studies indicate that asset allocation is the single most important determinant of a portfolio's long-term success. The right mix of stocks, bonds and cash - aligned to your particular risk tolerance and investment objective - is very important. Age-appropriate rebalancing is also an essential aspect of asset allocation. For younger investors, an emphasis on equities - which historically have been the best-performing asset class over time - is encouraged. As investors near their specific goal, such as retirement or sending a child to college, consideration may be given to replacing volatile assets (e.g. common stocks) with more-stable fixed investments (bonds or savings plans).
A third principle - investing regularly - can help lower the average cost of your purchases. Investing a certain amount of money each month or quarter helps ensure you won't pay for all your shares at market highs. This strategy - known as dollar cost averaging - also reduces "emotion" from investing, helping shareholders avoid selling weak performers just prior to an upswing, or chasing a hot performer just before a correction.
We invite you to contact us via the Internet, through our Investor Centers or by phone. It is our privilege to provide you the information you need to make the investments that are right for you.
Sincerely,
(The chairman's signature appears here.)
Edward C. Johnson 3d
Annual Report
Average annual total return reflects the change in the value of an investment, assuming reinvestment of the class' distributions from dividend income and capital gains (the profits earned upon the sale of securities that have grown in value, if any) and assuming a constant rate of performance each year. The $10,000 table and the fund's returns do not reflect the deduction of taxes that a shareholder would pay on fund distributions or the redemption of fund shares. During periods of reimbursement by Fidelity, a fund's total return will be greater than it would be had the reimbursement not occurred. How a fund did yesterday is no guarantee of how it will do tomorrow.
Average Annual Total Returns
Periods ended October 31, 2010 | Past 1
year | Past 5
years | Past 10
years |
Fidelity Stock Selector All Cap Fund | 19.35% | 1.64% | -0.03% |
$10,000 Over 10 Years
Let's say hypothetically that $10,000 was invested in Fidelity Stock Selector All Cap Fund, a class of the fund, on October 31, 2000. The chart shows how the value of your investment would have changed, and also shows how the S&P 500® Index performed over the same period.
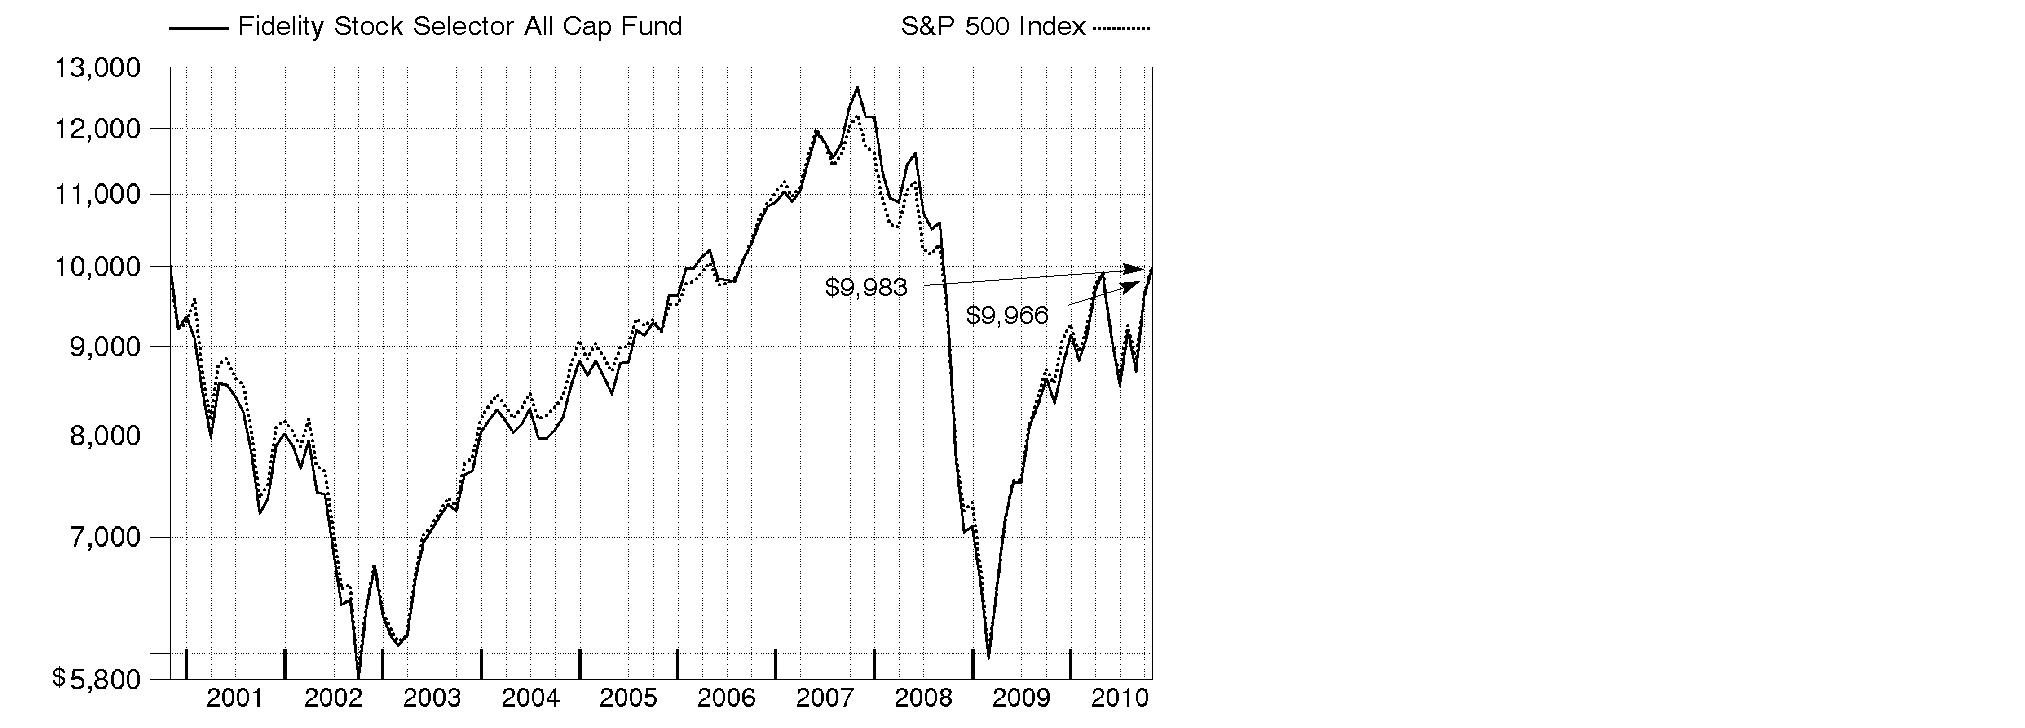
Annual Report
Market Recap: Amid bouts of volatility, major U.S. stock market indexes recorded double-digit gains for the year ending October 31, 2010, lifted by economic optimism, encouraging earnings reports and a wave of corporate mergers. Aside from a January dip, stocks trended upward for the first half of the period amid indications the Great Recession was over. However, in April, lingering high unemployment and heightened concern over European debt sent equities falling. Markets regrouped in July, but fell again in August on mixed economic data. The final two months of the period brought renewed optimism, with the large-cap S&P 500® Index posting its best September/October performance since 1998. For the full 12 months, the S&P 500® rose 16.52%, while the blue-chip-laden Dow Jones Industrial AverageSM added 17.62% and the technology-heavy Nasdaq Composite® Index rose 23.72%. Among market segments, all 10 sectors in the S&P 500 posted gains, with more than half outperforming the broad-market index. Stocks of mid- and small-sized companies surged, with the Russell Midcap® Index adding 27.71% and Russell 2000® Index climbing 26.58%. Looking abroad, debt problems in several European countries cooled gains in developed markets, and yet the MSCI® EAFE® (Europe, Australasia, Far East) Index still rose 8.49%.
Comments from Geoff Stein and Christopher Sharpe, Lead Co-Portfolio Managers of Fidelity® Stock Selector All Cap Fund: The fund's Retail Class shares advanced 19.35% for the year, substantially outperforming the S&P 500. The fund adopted a multi-manager investment approach at the beginning of the period and moved from individual equity holdings to a central fund structure, allocating assets in a sector-neutral manner among Fidelity's sector specialists. During the period, strong stock selection fueled the fund's outperformance. Eight of the 10 underlying equity sector central funds outperformed their respective components of the S&P 500, with consumer staples lagging modestly and financials trailing by a larger margin. Stock selection in information technology contributed the most, followed by stock picks in health care, consumer discretionary, industrials, materials and utilities. Market positioning in consumer discretionary also helped. Security selection in financials was the primary detractor by far. In terms of individual holdings, underweighting several poor-performing stocks - such as Exxon Mobil, Bank of America, Wells Fargo and Hewlett-Packard - was most beneficial, as was an overweighting in power tool maker Black & Decker. On the downside, a non-index position in regional bank Synovus Financial and an overweighting in regional bank Marshall & Ilsley were among the principal detractors.
The views expressed above reflect those of the portfolio manager(s) only through the end of the period as stated on the cover of this report and do not necessarily represent the views of Fidelity or any other person in the Fidelity organization. Any such views are subject to change at any time based upon market or other conditions and Fidelity disclaims any responsibility to update such views. These views may not be relied on as investment advice and, because investment decisions for a Fidelity fund are based on numerous factors, may not be relied on as an indication of trading intent on behalf of any Fidelity fund.
Annual Report
Shareholder Expense Example
The Fund invests in Fidelity Central Funds, which are open-end investment companies with similar investment objectives to those of the Fund, available only to other mutual funds and accounts managed by Fidelity Management & Research Company, (FMR) and its affiliates. In addition to the direct expenses incurred by the Fund presented in the table, as a shareholder of the underlying Fidelity Central Funds, the Fund also indirectly bears its proportionate share of the expenses of the underlying Fidelity Central Funds. These expenses are not included in the Fund's annualized expense ratio used to calculate either the actual or hypothetical expense estimates presented in the table but are summarized in a footnote to the table.
As a shareholder of the Fund, you incur two types of costs: (1) transaction costs, and (2) ongoing costs, including management fees and other Fund expenses. This Example is intended to help you understand your ongoing costs (in dollars) of investing in the Fund and to compare these costs with the ongoing costs of investing in other mutual funds.
The Example is based on an investment of $1,000 invested at the beginning of the period and held for the entire period (May 1, 2010 to October 31, 2010).
Actual Expenses
The first line of the accompanying table for each class of the Fund provides information about actual account values and actual expenses. You may use the information in this line, together with the amount you invested, to estimate the expenses that you paid over the period. Simply divide your account value by $1,000.00 (for example, an $8,600 account value divided by $1,000.00 = 8.6), then multiply the result by the number in the first line for a class of the Fund under the heading entitled "Expenses Paid During Period" to estimate the expenses you paid on your account during this period. A small balance maintenance fee of $12.00 that is charged once a year may apply for certain accounts with a value of less than $2,000. This fee is not included in the table below. If it was, the estimate of expenses you paid during the period would be higher, and your ending account value lower, by this amount. In addition, the Fund, as a shareholder in the underlying Fidelity Central Funds, will indirectly bear its pro-rata share of the fees and expenses incurred by the underlying Fidelity Central Funds. These fees and expenses are not included in the Fund's annualized expense ratio used to calculate the expense estimate in the table below.
Hypothetical Example for Comparison Purposes
The second line of the accompanying table for each class of the Fund provides information about hypothetical account values and hypothetical expenses based on a Class' actual expense ratio and an assumed rate of return of 5% per year before expenses, which is not the Class' actual return. The hypothetical account values and expenses may not be used to estimate the actual ending account balance or expenses you paid for the period. You may use this information to compare the ongoing costs of investing in the Fund and other funds. To do so, compare this 5% hypothetical example with the 5% hypothetical examples that appear in the shareholder reports of the other funds. A small balance maintenance fee of $12.00 that is charged once a year may apply for certain accounts with a value of less than $2,000. This fee is not included in the table below. If it was, the estimate of expenses you paid during the period would be higher, and your ending account value lower, by this amount. In addition, the Fund, as a shareholder in the underlying Fidelity Central Funds, will indirectly bear its pro-rata share of the fees and expenses incurred by the underlying Fidelity Central Funds. These fees and expenses are not included in the Fund's annualized expense ratio used to calculate the expense estimate in the table below.
Annual Report
Shareholder Expense Example - continued
Please note that the expenses shown in the table are meant to highlight your ongoing costs only and do not reflect any transaction costs. Therefore, the second line of the table is useful in comparing ongoing costs only, and will not help you determine the relative total costs of owning different funds.
| Annualized
Expense Ratio | Beginning
Account Value
May 1, 2010 | Ending
Account Value
October 31, 2010 | Expenses Paid
During Period*
May 1, 2010
to October 31, 2010 |
Stock Selector All Cap | .86% | | | |
Actual | | $ 1,000.00 | $ 1,005.90 | $ 4.35 |
HypotheticalA | | $ 1,000.00 | $ 1,020.87 | $ 4.38 |
Class K | .65% | | | |
Actual | | $ 1,000.00 | $ 1,006.80 | $ 3.29 |
HypotheticalA | | $ 1,000.00 | $ 1,021.93 | $ 3.31 |
A 5% return per year before expenses
* Expenses are equal to each Class' annualized expense ratio, multiplied by the average account value over the period, multiplied by 184/365 (to reflect the one-half year period). The fees and expenses of the underlying Fidelity Central Funds in which the Fund invests are not included in the Fund's annualized expense ratio. In addition to the expenses noted above, the Fund also indirectly bears its proportional share of the expenses of the underlying Fidelity Central Funds. Annualized expenses of the underlying Fidelity Central Funds as of their most recent fiscal half year ranged from less than .01% to .01%.
Annual Report
Investment Changes (Unaudited)
The information in the following tables is based on the combined investments of the Fund and its pro-rata share of investments of Fidelity's Equity Central Funds. |
Top Ten Stocks as of October 31, 2010 |
| % of fund's
net assets | % of fund's net assets
6 months ago |
Apple, Inc. | 2.5 | 2.1 |
Exxon Mobil Corp. | 2.2 | 1.0 |
Google, Inc. Class A | 1.6 | 0.5 |
Procter & Gamble Co. | 1.6 | 1.4 |
The Coca-Cola Co. | 1.4 | 1.2 |
General Electric Co. | 1.3 | 1.1 |
Visa, Inc. Class A | 1.2 | 0.1 |
Comerica, Inc. | 1.2 | 0.0 |
Chevron Corp. | 1.2 | 0.7 |
Citigroup, Inc. | 0.9 | 0.4 |
| 15.1 | |
Top Five Market Sectors as of October 31, 2010 |
| % of fund's
net assets | % of fund's net assets
6 months ago |
Information Technology | 18.9 | 18.5 |
Financials | 15.0 | 15.7 |
Health Care | 11.4 | 11.8 |
Consumer Staples | 11.1 | 10.8 |
Energy | 11.0 | 10.5 |
Foreign investments | 12.9% | 13.2% |
Annual Report
Investment Summary (Unaudited)
The information in the following table is based on direct investments of the Fund. |
Fund Holdings as of October 31, 2010 |
| % of fund's
net assets |
Equity Central Funds | |
Fidelity Financials Central Fund | 17.2 |
Fidelity Information Technology Central Fund | 16.8 |
Fidelity Consumer Staples Central Fund | 11.7 |
Fidelity Health Care Central Fund | 11.6 |
Fidelity Energy Central Fund | 11.4 |
Fidelity Industrials Central Fund | 10.7 |
Fidelity Consumer Discretionary Central Fund | 9.8 |
Fidelity Materials Central Fund | 3.9 |
Fidelity Utilities Central Fund | 3.8 |
Fidelity Telecom Services Central Fund | 3.2 |
Total Equity Central Funds | 100.1 |
Net Other Assets (Liabilities) | (0.1) |
Total | 100.0 |
A holdings listed for the Fund, which presents direct holdings as well as the pro-rata share of any securities and other investments in non-money market Fidelity Central Funds, is available at fidelity.com.
Annual Report
Investments October 31, 2010
Showing Percentage of Net Assets
Equity Central Funds - 100.1% |
| Shares | | Value (000s) |
Fidelity Consumer Discretionary Central Fund (a) | 625,080 | | $ 74,778 |
Fidelity Consumer Staples Central Fund (a) | 693,097 | | 89,784 |
Fidelity Energy Central Fund (a) | 829,663 | | 87,413 |
Fidelity Financials Central Fund (a) | 2,417,087 | | 131,393 |
Fidelity Health Care Central Fund (a) | 769,804 | | 89,020 |
Fidelity Industrials Central Fund (a) | 638,541 | | 81,823 |
Fidelity Information Technology Central Fund (a) | 791,994 | | 128,715 |
Fidelity Materials Central Fund (a) | 192,849 | | 29,438 |
Fidelity Telecom Services Central Fund (a) | 209,377 | | 24,748 |
Fidelity Utilities Central Fund (a) | 289,799 | | 29,073 |
TOTAL INVESTMENT PORTFOLIO - 100.1% (Cost $701,483) | 766,185 |
NET OTHER ASSETS (LIABILITIES) - (0.1)% | | (513) |
NET ASSETS - 100% | $ 765,672 |
Legend |
(a) Affiliated fund that is available only to investment companies and other accounts managed by Fidelity Investments. A complete unaudited schedule of portfolio holdings for each Fidelity Central Fund is filed with the SEC for the first and third quarters of each fiscal year on Form N-Q and is available upon request or at the SEC's web site at www.sec.gov. An unaudited holdings listing for the Fund, which presents direct holdings as well as the pro rata share of securities and other investments held indirectly through its investment in underlying non-money market Fidelity Central Funds, is available at fidelity.com. In addition, each Fidelity Central Fund's financial statements, which are not covered by the Fund's Report of Independent Registered Public Accounting Firm, are available on the SEC's web site or upon request. |
Affiliated Central Funds |
Information regarding fiscal year to date income earned by the Fund from investments in Fidelity Central Funds is as follows: |
Fund | Income earned
(Amounts in thousands) |
Fidelity Cash Central Fund | $ 22 |
Fidelity Consumer Discretionary Central Fund | 330 |
Fidelity Consumer Staples Central Fund | 928 |
Fidelity Energy Central Fund | 448 |
Fidelity Financials Central Fund | 617 |
Fidelity Health Care Central Fund | 341 |
Fidelity Industrials Central Fund | 432 |
Fidelity Information Technology Central Fund | 175 |
Fidelity Materials Central Fund | 636 |
Fidelity Securities Lending Cash Central Fund | 21 |
Fidelity Telecom Services Central Fund | 297 |
Fidelity Utilities Central Fund | 351 |
Total | $ 4,598 |
Additional information regarding the Fund's fiscal year to date purchases and sales, including the ownership percentage, of the non Money Market Central Funds is as follows: |
Fund
(Amounts in thousands) | Value, beginning of period | Purchases* | Sales
Proceeds | Value, end of period | % ownership, end of period |
Fidelity Consumer Discretionary Central Fund | $ - | $ 64,425 | $ 1,150 | $ 74,778 | 11.7% |
Fidelity Consumer Staples Central Fund | - | 88,121 | 5,027 | 89,784 | 14.1% |
Fidelity Energy Central Fund | - | 88,082 | 3,032 | 87,413 | 13.3% |
Fidelity Financials Central Fund | - | 153,124 | 5,497 | 131,393 | 12.7% |
Fidelity Health Care Central Fund | - | 86,337 | 5,749 | 89,020 | 12.4% |
Fidelity Industrials Central Fund | - | 72,650 | 2,490 | 81,823 | 12.0% |
Fidelity Information Technology Central Fund | - | 109,816 | 14,568 | 128,715 | 12.3% |
Fidelity Materials Central Fund | - | 25,445 | 129 | 29,438 | 12.1% |
Fidelity Telecom Services Central Fund | - | 23,396 | 463 | 24,748 | 13.6% |
Fidelity Utilities Central Fund | - | 25,629 | 19 | 29,073 | 12.7% |
Total | $ 0 | $ 737,025 | $ 38,124 | $ 766,185 | |
* Includes in-kind transactions. See Note 2 of the Notes to Financial Statements. |
Other Information |
All investments are categorized as Level 1 under the Fair Value Hierarchy. The inputs or methodology used for valuing securities may not be an indication of the risk associated with investing in those securities. For more information on valuation inputs, please refer to the Security Valuation section in the accompanying Notes to Financial Statements. |
The information in the following table is based on the combined investment of the Fund and its pro-rata share of the investments of Fidelity Equity Central Funds. |
Distribution of investments by country of issue, as a percentage of total net assets, is as follows: (Unaudited) |
United States of America | 87.1% |
United Kingdom | 1.6% |
Switzerland | 1.3% |
Ireland | 1.3% |
Others (Individually Less Than 1%) | 8.7% |
| 100.0% |
Income Tax Information |
At October 31, 2010, the Fund had a capital loss carryforward of approximately $194,202,000 of which $59,231,000 and $134,971,000 will expire on October 31, 2016 and 2017, respectively. Capital loss carryforwards are only available to offset future capital gains of the Fund to the extent provided by regulations and may be limited. |
See accompanying notes which are an integral part of the financial statements.
Annual Report
Statement of Assets and Liabilities
Amounts in thousands (except per-share amounts) | October 31, 2010 |
| | |
Assets | | |
Investments in Fidelity Central Funds (cost $701,483) | | $ 766,185 |
Cash | | 1 |
Receivable for investments sold | | 4 |
Receivable for fund shares sold | | 483 |
Dividends receivable | | 28 |
Other receivables | | 12 |
Total assets | | 766,713 |
| | |
Liabilities | | |
Payable for investments purchased | $ 280 | |
Payable for fund shares redeemed | 219 | |
Accrued management fee | 316 | |
Transfer agent fee payable | 150 | |
Other affiliated payables | 23 | |
Other payables and accrued expenses | 53 | |
Total liabilities | | 1,041 |
| | |
Net Assets | | $ 765,672 |
Net Assets consist of: | | |
Paid in capital | | $ 899,851 |
Undistributed net investment income | | 2,732 |
Accumulated undistributed net realized gain (loss) on investments and foreign currency transactions | | (201,615) |
Net unrealized appreciation (depreciation) on investments | | 64,704 |
Net Assets | | $ 765,672 |
| | |
Stock Selector All Cap:
Net Asset Value, offering price and redemption price per share ($729,875 ÷ 30,823.6 shares) | | $ 23.68 |
| | |
Class K:
Net Asset Value, offering price and redemption price per share ($35,797 ÷ 1,510.2 shares) | | $ 23.70 |
See accompanying notes which are an integral part of the financial statements.
Annual Report
Financial Statements - continued
Statement of Operations
Amounts in thousands | Year ended October 31, 2010 |
| | |
Investment Income | | |
Dividends | | $ 6,486 |
Interest | | 2 |
Income from Fidelity Central Funds | | 4,598 |
Total income | | 11,086 |
| | |
Expenses | | |
Management fee
Basic fee | $ 3,938 | |
Performance adjustment | (153) | |
Transfer agent fees | 1,693 | |
Accounting and security lending fees | 255 | |
Custodian fees and expenses | 217 | |
Independent trustees' compensation | 4 | |
Registration fees | 53 | |
Audit | 63 | |
Legal | 4 | |
Miscellaneous | 10 | |
Total expenses before reductions | 6,084 | |
Expense reductions | (95) | 5,989 |
Net investment income (loss) | | 5,097 |
Realized and Unrealized Gain (Loss) Net realized gain (loss) on: | | |
Investment securities: | | |
Unaffiliated issuers | 81,776 | |
Fidelity Central Funds | 2,631 | |
Foreign currency transactions | (37) | |
Futures contracts | 2,460 | |
Total net realized gain (loss) | | 86,830 |
Change in net unrealized appreciation (depreciation) on: Investment securities | 23,282 | |
Assets and liabilities in foreign currencies | 1 | |
Total change in net unrealized appreciation (depreciation) | | 23,283 |
Net gain (loss) | | 110,113 |
Net increase (decrease) in net assets resulting from operations | | $ 115,210 |
See accompanying notes which are an integral part of the financial statements.
Annual Report
Statement of Changes in Net Assets
Amounts in thousands | Year ended
October 31,
2010 | Year ended
October 31,
2009 |
Increase (Decrease) in Net Assets | | |
Operations | | |
Net investment income (loss) | $ 5,097 | $ 4,559 |
Net realized gain (loss) | 86,830 | (132,880) |
Change in net unrealized appreciation (depreciation) | 23,283 | 155,498 |
Net increase (decrease) in net assets resulting
from operations | 115,210 | 27,177 |
Distributions to shareholders from net investment income | (4,230) | (7,570) |
Share transactions - net increase (decrease) | 80,564 | (179,204) |
Total increase (decrease) in net assets | 191,544 | (159,597) |
| | |
Net Assets | | |
Beginning of period | 574,128 | 733,725 |
End of period (including undistributed net investment income of $2,732 and undistributed net investment income of $3,441, respectively) | $ 765,672 | $ 574,128 |
See accompanying notes which are an integral part of the financial statements.
Annual Report
Financial Highlights - Stock Selector All Cap
Years ended October 31, | 2010 | 2009 | 2008 | 2007 | 2006 |
Selected Per-Share Data | | | | | |
Net asset value, beginning of period | $ 19.98 | $ 18.79 | $ 32.37 | $ 27.24 | $ 23.74 |
Income from Investment Operations | | | | | |
Net investment income (loss) B | .16 | .14 | .20 | .19 | .16 |
Net realized and unrealized gain (loss) | 3.69 | 1.27 | (12.14) | 5.10 | 3.46 |
Total from investment operations | 3.85 | 1.41 | (11.94) | 5.29 | 3.62 |
Distributions from net investment income | (.15) | (.22) | (.16) | (.13) | (.12) |
Distributions from net realized gain | - | - | (1.48) | (.03) | - |
Total distributions | (.15) | (.22) | (1.64) | (.16) | (.12) |
Net asset value, end of period | $ 23.68 | $ 19.98 | $ 18.79 | $ 32.37 | $ 27.24 |
Total ReturnA | 19.35% | 7.77% | (38.78)% | 19.52% | 15.29% |
Ratios to Average Net Assets C, E | | | | | |
Expenses before reductions | .87% | .87% | .93% | .87% | .88% |
Expenses net of fee waivers, if any | .87% | .87% | .93% | .87% | .88% |
Expenses net of all reductions | .86% | .87% | 93% | .87% | .87% |
Net investment income (loss) | .72% | .82% | .77% | .64% | .61% |
Supplemental Data | | | | | |
Net assets, end of period (in millions) | $ 730 | $ 552 | $ 698 | $ 1,005 | $ 853 |
Portfolio turnover rate D | 147% | 109% | 121% | 91% | 109% |
A Total returns would have been lower had certain expenses not been reduced during the periods shown.
B Calculated based on average shares outstanding during the period.
C Fees and expenses of the underlying Fidelity Central Funds are not included in the Fund's expense ratio. The Fund indirectly bears its proportionate share of the expenses of any underlying Fidelity Central Funds. Based on their most recent shareholder report date, the expenses ranged from less than .01% to .01%.
D Amount does not include the portfolio activity of any underlying Fidelity Central Funds.
E Expense ratios reflect operating expenses of the class. Expenses before reductions do not reflect amounts reimbursed by the investment adviser or reductions from brokerage service arrangements or reductions from other expense offset arrangements and do not represent the amount paid by the class during periods when reimbursements or reductions occur. Expenses net of fee waivers reflect expenses after reimbursement by the investment adviser but prior to reductions from brokerage service arrangements or other expense offset arrangements. Expenses net of all reductions represent the net expenses paid by the class.
See accompanying notes which are an integral part of the financial statements.
Annual Report
Financial Highlights - Class K
Years ended October 31, | 2010 | 2009 | 2008 G |
Selected Per-Share Data | | | |
Net asset value, beginning of period | $ 20.00 | $ 18.81 | $ 27.80 |
Income from Investment Operations | | | |
Net investment income (loss) D | .20 | .18 | .06 |
Net realized and unrealized gain (loss) | 3.69 | 1.27 | (9.05) |
Total from investment operations | 3.89 | 1.45 | (8.99) |
Distributions from net investment income | (.19) | (.26) | - |
Net asset value, end of period | $ 23.70 | $ 20.00 | $ 18.81 |
Total Return B, C | 19.54% | 8.00% | (32.34)% |
Ratios to Average Net AssetsE, H | | | |
Expenses before reductions | .68% | .65% | .79% A |
Expenses net of fee waivers, if any | .68% | .65% | .79% A |
Expenses net of all reductions | .66% | .65% | .78% A |
Net investment income (loss) | .91% | 1.04% | .63% A |
Supplemental Data | | | |
Net assets, end of period (in millions) | $ 36 | $ 22 | $ 35 |
Portfolio turnover rate F | 147% | 109% | 121% |
A Annualized
B Total returns for periods of less than one year are not annualized.
C Total returns would have been lower had certain expenses not been reduced during the periods shown.
D Calculated based on average shares outstanding during the period.
E Fees and expenses of the underlying Fidelity Central Funds are not included in the Fund's expense ratio. The Fund indirectly bears its proportionate share of the expenses of any underlying Fidelity Central Funds. Based on their most recent shareholder report date, the expenses ranged from less than .01% to .01%.
F Amount does not include the portfolio activity of any underlying Fidelity Central Funds.
G For the period May 9, 2008 (commencement of sale of shares) to October 31, 2008.
H Expense ratios reflect operating expenses of the class. Expenses before reductions do not reflect amounts reimbursed by the investment adviser or reductions from brokerage service arrangements or reductions from other expense offset arrangements and do not represent the amount paid by the class during periods when reimbursements or reductions occur. Expense ratios before reductions for start-up periods may not be representative of longer-term operating periods. Expenses net of fee waivers reflect expenses after reimbursement by the investment adviser but prior to reductions from brokerage service arrangements or other expense offset arrangements. Expenses net of all reductions represent the net expenses paid by the class.
See accompanying notes which are an integral part of the financial statements.
Annual Report
Notes to Financial Statements
For the period ended October 31, 2010
(Amounts in thousands except ratios)
1. Organization.
Fidelity Stock Selector All Cap (the Fund) (formerly Fidelity Stock Selector) is a fund of Fidelity Capital Trust (the Trust) and is authorized to issue an unlimited number of shares. The Trust is registered under the Investment Company Act of 1940, as amended (the 1940 Act), as an open-end management investment company organized as a Massachusetts business trust. The Fund offers Stock Selector All Cap and Class K Shares, each of which has equal rights as to assets and voting privileges. Each class has exclusive voting rights with respect to matters that affect that class. Investment income, realized and unrealized capital gains and losses, the common expenses of the Fund, and certain fund-level expense reductions, if any, are allocated on a pro-rata basis to each class based on the relative net assets of each class to the total net assets of the Fund. Each class differs with respect to transfer agent fees incurred. Certain expense reductions also differ by class.
2. Investment in Fidelity Central Funds.
The Fund invests in Fidelity Central Funds which are open-end investment companies available only to other investment companies and accounts managed by Fidelity Management & Research Company (FMR) and its affiliates. The Fund's Schedule of Investments lists each of the Fidelity Central Funds held as of period end as an investment of the Fund but does not include the underlying holdings of each Fidelity Central Fund. As an Investing Fund, the Fund indirectly bears its proportionate share of the expenses of the underlying Fidelity Central Funds.
During the period, the Fund exchanged securities for shares of 10 Fidelity Equity Central Funds ("Equity Central Funds") all of which are affiliated investment companies managed by FMR Co., Inc. (FMRC), an affiliate of FMR. Each of the Equity Central Funds seeks capital appreciation and invests primarily in securities of companies whose principal business activities fall within specific industries. The Fund delivered securities to each Equity Central Fund in exchange for shares of each respective Equity Central Fund, as presented in the accompanying table. The exchange with Telecom Services resulted in a realized gain of $1,495 and $1,475 to the Fund for Financial Statement and federal income tax purposes, respectively.
Annual Report
Notes to Financial Statements - continued
(Amounts in thousands except ratios)
2. Investment in Fidelity Central Funds - continued
Fidelity Equity
Central Fund | Value of Securities
Delivered | Unrealized
Appreciation/
(Depreciation) | Shares of Equity
Central Fund Exchanged |
Consumer Discretionary | $ 66,653 | $ 4,794 | 611 |
Consumer Staples | 84,675 | (2,471) | 727 |
Energy | 81,481 | (3,429) | 827 |
Financials | 128,747 | (8,297) | 2,221 |
Health Care | 89,980 | 4,110 | 820 |
Industrials | 75,931 | 5,965 | 638 |
Information Technology | 126,191 | 16,948 | 894 |
Materials | 23,829 | 220 | 180 |
Telecom Services | 21,821 | (971) | 208 |
Utilities | 25,888 | 1,285 | 279 |
Total | $ 725,196 | $ 18,154 | 7,405 |
Based on their investment objectives, each Fidelity Central Fund may invest or participate in various investment vehicles or strategies that are similar to those of the Fund. These strategies are consistent with the investment objectives of the Fund and may involve certain economic risks which may cause a decline in the value of each of the Fidelity Central Funds and thus a decline in the value of the Fund. The following summarizes the Fund's investment in Fidelity Central Funds:
Fidelity
Central Fund | | Investment
Manager | | Investment Objective | | Investment Practices | | Expense Ratio* |
Fidelity Equity Central Funds | | FMRC | | Each fund seeks capital appreciation by investing primarily in common stocks, with a concentration in a particular industry. | | Foreign Securities Repurchase Agreements Restricted Securities | | Less than .01%
to .01% |
* Expenses expressed as a percentage of average net assets and are as of each underlying Central Fund's most recent annual or semi-annual shareholder report.
An unaudited holdings listing for the Fund, which presents direct holdings as well as the pro-rata share of any securities and other investments held indirectly through its investment in underlying non-money market Fidelity Central Funds, is available at fidelity.com. A complete unaudited list of holdings for each Fidelity Central Fund is available upon request or at the Securities and Exchange Commission (the SEC) web site at www.sec.gov. In addition, the financial statements of the Fidelity Central Funds which contain the significant accounting policies (including security valuation policies) of those funds are available on the SEC web site or upon request.
Annual Report
3. Significant Accounting Policies.
The financial statements have been prepared in conformity with accounting principles generally accepted in the United States of America (GAAP), which require management to make certain estimates and assumptions at the date of the financial statements. Actual results could differ from those estimates. The following summarizes the significant accounting policies of the Fund:
Security Valuation. Investments are valued as of 4:00 p.m. Eastern time on the last calendar day of the period. The Fund categorizes the inputs to valuation techniques used to value its investments into a disclosure hierarchy consisting of three levels as shown below.
Level 1 - quoted prices in active markets for identical investments
Level 2 - other significant observable inputs (including quoted prices for similar investments, interest rates, prepayment speeds, etc.)
Level 3 - unobservable inputs (including the fund's own assumptions based on the best information available)
Valuation techniques used to value the Fund's investments by major category are as follows. Investments in open-end mutual funds, including the Fidelity Central Funds, are valued at their closing net asset value (NAV) each business day and are categorized as Level 1 in the hierarchy.
Investment Transactions and Income. For financial reporting purposes, the Fund's investment holdings and NAV include trades executed through the end of the last business day of the period. The NAV per share for processing shareholder transactions is calculated as of the close of business of the New York Stock Exchange (NYSE), normally 4:00 p.m. Eastern time and includes trades executed through the end of the prior business day. Gains and losses on securities sold are determined on the basis of identified cost and may include proceeds received from litigation. Dividend income is recorded on the ex-dividend date, except for certain dividends from foreign securities where the ex-dividend date may have passed, which are recorded as soon as the Fund is informed of the ex-dividend date. Non-cash dividends included in dividend income, if any, are recorded at the fair market value of the securities received. Distributions received on securities that represent a return of capital or capital gains are recorded as a reduction of cost of investments and/or as a realized gain. The Funds estimates the components of distributions received that may be considered return of capital distributions or capital gain distributions. Interest income and distributions from the Fidelity Central Funds are accrued as earned. Interest income includes coupon interest and amortization of premium and accretion of discount on debt securities. Investment income is recorded net of foreign taxes withheld where recovery of such taxes is uncertain.
Annual Report
Notes to Financial Statements - continued
(Amounts in thousands except ratios)
3. Significant Accounting Policies - continued
Expenses. Most expenses of the Trust can be directly attributed to a fund. Expenses which cannot be directly attributed are apportioned amongst each fund in the Trust. Expense estimates are accrued in the period to which they relate and adjustments are made when actual amounts are known. Expenses included in the accompanying financial statements reflect the expenses of the Fund and do not include any expenses of Fidelity Central Funds. Although not included in the Fund's expenses, the Fund indirectly bears its proportionate share of the Fidelity Central Funds' expenses through the impact of these expenses on each Fidelity Central Fund's net asset value. Based on their most recent shareholder report date, expenses of the Fidelity Central Funds ranged from less than .01% to .01%.
Income Tax Information and Distributions to Shareholders. Each year the Fund intends to qualify as a regulated investment company, including distributing substantially all of its taxable income and realized gains under Subchapter M of the Internal Revenue Code and filing its U.S. federal tax return. As a result, no provision for income taxes is required. As of October 31, 2010, the Fund did not have any unrecognized tax benefits in the accompanying financial statements. A fund's federal tax return is subject to examination by the Internal Revenue Service (IRS) for a period of three years. Foreign taxes are provided for based on the Fund's understanding of the tax rules and rates that exist in the foreign markets in which it invests.
Distributions are declared and recorded on the ex-dividend date. Income dividends and capital gain distributions are declared separately for each class. Income and capital gain distributions are determined in accordance with income tax regulations, which may differ from GAAP.
Capital accounts within the financial statements are adjusted for permanent book-tax differences. These adjustments have no impact on net assets or the results of operations. Temporary book-tax differences will reverse in a subsequent period.
Book-tax differences are primarily due to the short-term gain distributions from the Fidelity Central Funds, futures transactions, foreign currency transactions, deferred trustees compensation, certain foreign taxes, passive foreign investment companies (PFIC), partnerships (including allocations from Fidelity Central Funds), capital loss carryforwards and losses deferred due to wash sales.
The federal tax cost of investment securities and unrealized appreciation (depreciation) as of period end were as follows:
Gross unrealized appreciation | $ 75,479 |
Gross unrealized depreciation | (18,190) |
Net unrealized appreciation (depreciation) | $ 57,289 |
| |
Tax Cost | $ 708,896 |
Annual Report
3. Significant Accounting Policies - continued
Income Tax Information and Distributions to Shareholders - continued
The tax-based components of distributable earnings as of period end were as follows:
Undistributed ordinary income | $ 2,732 |
Capital loss carryforward | $ (194,202) |
Net unrealized appreciation (depreciation) | $ 57,291 |
The tax character of distributions paid was as follows:
| October 31, 2010 | October 31, 2009 |
Ordinary Income | $ 4,230 | $ 7,570 |
4. Derivative Instruments.
Risk Exposures and the Use of Derivative Instruments. The Fund uses derivative instruments (derivatives), including futures contract in order to meet its investment objectives. The strategy is to use derivatives to increase returns and to manage exposure to certain risks as defined below. The success of any strategy involving derivatives depends on analysis of numerous economic factors, and if the strategies for investment do not work as intended, the Fund may not achieve its objectives.
The Fund's use of derivatives may increase or decrease its exposure to the following risk:
Equity Risk | Equity risk relates to the fluctuations in the value of financial instruments as a result of changes in market prices (other than those arising from interest rate risk or foreign exchange risk), whether caused by factors specific to an individual investment, its issuer, or all factors affecting all instruments traded in a market or market segment. |
The Fund is also exposed to additional risks from investing in derivatives, such as liquidity risk and counterparty credit risk. Liquidity risk is the risk that the Fund will be unable to sell the derivative in the open market in a timely manner. Counterparty credit risk is the risk that the counterparty will not be able to fulfill its obligation to the Fund. The Fund's maximum risk of loss from counterparty credit risk is generally the aggregate unrealized appreciation and unpaid counterparty fees in excess of any collateral pledged by the counterparty to the Fund. Counterparty risk related to exchange-traded futures contracts is minimal because of the protection provided by the exchange on which they trade. Risk of loss may exceed the amounts recognized in the Statement of Assets and Liabilities.
Annual Report
Notes to Financial Statements - continued
(Amounts in thousands except ratios)
4. Derivative Instruments - continued
Futures Contracts. A futures contract is an agreement between two parties to buy or sell a specified underlying instrument for a fixed price at a specified future date. The Fund uses futures contracts to manage its exposure to the stock market.
Upon entering into a futures contract, a fund is required to deposit either cash or securities (initial margin) with a clearing broker in an amount equal to a certain percentage of the face value of the contract. Futures contracts are marked-to-market daily and subsequent payments (variation margin) are made or received by a fund depending on the daily fluctuations in the value of the futures contracts and are recorded as unrealized appreciation or (depreciation). Realized gain or (loss) is recorded upon the expiration or closing of a futures contract.
The underlying face amount at value of open futures contracts at period end, if any, is shown in the Schedule of Investments under the caption "Futures Contracts." This amount reflects each contract's exposure to the underlying instrument at period end. Securities deposited to meet initial margin requirements are identified in the Schedule of Investments. The receivable and/or payable for the variation margin are reflected in the Statement of Assets and Liabilities.
Certain risks may arise upon entering into futures contracts, including the risk that an illiquid market may limit the ability to close out a futures contract prior to settlement date.
During the period the Fund recognized net realized gain (loss) of $2,460 related to its investment in futures contracts. This amount is included in the Statement of Operations.
5. Purchases and Sales of Investments.
Purchases and sales of securities including the Equity Central Funds, other than short-term securities, aggregated $1,092,718 and $1,001,922, respectively.
6. Fees and Other Transactions with Affiliates.
Management Fee. FMR and its affiliates provide the Fund with investment management related services for which the Fund pays a monthly management fee. The management fee is the sum of an individual fund fee rate that is based on an annual rate of .30% of the Fund's average net assets and a group fee rate that averaged .26% during the period. The group fee rate is based upon the average net assets of all the mutual funds advised by FMR. The group fee rate decreases as assets under management increase and increases as assets under management decrease. In addition, the management fee is subject to a performance adjustment (up to a maximum of ± .20% of the Fund's average net assets over a 36 month performance period). The upward or downward adjustment to the management fee is based on the relative investment performance of the Stock Selector All Cap share class as compared to an appropriate benchmark index.
Annual Report
6. Fees and Other Transactions with Affiliates - continued
Management Fee - continued
For the period, the total annual management fee rate, including the performance adjustment, was .54% of the Fund's average net assets. FMR pays a portion of the management fees received from the Fund to the Fidelity Central Funds' investment advisers, who are also affiliates, for managing the assets of the Fidelity Central Funds.
Transfer Agent Fees. Fidelity Investments Institutional Operations Company, Inc. (FIIOC), an affiliate of FMR, is the transfer, dividend disbursing and shareholder servicing agent for each class of the Fund. FIIOC receives account fees and asset-based fees that vary according to the account size and type of account of the shareholders of Stock Selector All Cap. FIIOC receives an asset-based fee of Class K's average net assets. FIIOC pays for typesetting, printing and mailing of shareholder reports, except proxy statements. For the period, transfer agent fees for each class were as follows:
| Amount | % of
Average
Net Assets |
Stock Selector All Cap | 1,680 | .25 |
Class K | 13 | .05 |
| $ 1,693 | |
Accounting and Security Lending Fees. Fidelity Service Company, Inc. (FSC), an affiliate of FMR, maintains the Fund's accounting records. The accounting fee is based on the level of average net assets for the month. Under a separate contract, FSC administered the security lending program. The security lending fee was based on the number and duration of lending transactions.
Brokerage Commissions. The Fund placed a portion of its portfolio transactions with brokerage firms which are affiliates of the investment adviser. The commissions paid to these affiliated firms were $28 for the period.
7. Committed Line of Credit.
The Fund participates with other funds managed by FMR or an affiliate in a $3.75 billion credit facility (the "line of credit") to be utilized for temporary or emergency purposes to fund shareholder redemptions or for other short-term liquidity purposes. The Fund has agreed to pay commitment fees on its pro-rata portion of the line of credit, which amounted to $3 and is reflected in Miscellaneous expenses on the Statement of Operations. During the period, there were no borrowings on this line of credit.
Annual Report
Notes to Financial Statements - continued
(Amounts in thousands except ratios)
8. Security Lending.
The Fund loaned portfolio securities from time to time in order to earn additional income. On the settlement date of the loan, the Fund receives collateral (in the form of U.S. Treasury obligations, letters of credit and/or cash) against the loaned securities and maintains collateral in an amount not less than 100% of the market value of the loaned securities during the period of the loan. The market value of the loaned securities is determined at the close of business of the Fund and any additional required collateral is delivered to the Fund on the next business day. If the borrower defaults on its obligation to return the securities loaned because of insolvency or other reasons, a fund could experience delays and costs in recovering the securities loaned or in gaining access to the collateral. Any cash collateral received is invested in the Fidelity Securities Lending Cash Central Fund. At period end, there were no security loans outstanding. Security lending income represents the income earned on investing cash collateral, less fees and expenses associated with the loan, plus any premium payments that may be received on the loan of certain types of securities. Security lending income is presented in the Statement of Operations as a component of income from Fidelity Central Funds. Net income from lending portfolio securities during the period amounted to $21.
9. Expense Reductions.
Many of the brokers with whom FMR places trades on behalf of the Fund and the Equity Central Funds provided services in addition to trade execution. These services included payments of certain expenses on behalf of the Fund totaling $95 for the period.
10. Distributions to Shareholders.
Distributions to shareholders of each class were as follows:
Years ended October 31, | 2010 | 2009 |
From net investment income | | |
Stock Selector All Cap | $ 4,028 | $ 7,152 |
Class K | 202 | 418 |
Total | $ 4,230 | $ 7,570 |
Annual Report
11. Share Transactions.
Transactions for each class of shares were as follows:
| Shares | Dollars |
Years ended October 31, | 2010 | 2009 | 2010 | 2009 |
Stock Selector All Cap | | | | |
Shares sold | 9,171 | 2,210 | $ 203,020 | $ 37,596 |
Conversion to Class K A | - | (261) | - | (4,548) |
Reinvestment of distributions | 181 | 414 | 3,844 | 6,843 |
Shares redeemed | (6,135) | (11,919) | (134,933) | (206,868) |
Net increase (decrease) | 3,217 | (9,556) | $ 71,931 | $ (166,977) |
Class K | | | | |
Shares sold | 739 | 525 | $ 16,419 | $ 8,881 |
Conversion from Stock Selector A | - | 261 | - | 4,548 |
Reinvestment of distributions | 10 | 25 | 202 | 418 |
Shares redeemed | (363) | (1,571) | (7,988) | (26,074) |
Net increase (decrease) | 386 | (760) | $ 8,633 | $ (12,227) |
A Conversion transactions for Class K and Stock Selector are presented for the period November 1, 2008 through August 31, 2009.
12. Other.
The Fund's organizational documents provide former and current trustees and officers with a limited indemnification against liabilities arising in connection with the performance of their duties to the Fund. In the normal course of business, the Fund may also enter into contracts that provide general indemnifications. The Fund's maximum exposure under these arrangements is unknown as this would be dependent on future claims that may be made against the Fund. The risk of material loss from such claims is considered remote.
Annual Report
To the Trustees of Fidelity Capital Trust and Shareholders of Fidelity Stock Selector All Cap:
We have audited the accompanying statement of assets and liabilities of Fidelity Stock Selector All Cap (the Fund), previously Fidelity Stock Selector a fund of Fidelity Capital Trust, including the schedule of investments, as of October 31, 2010, and the related statement of operations for the year then ended, the statement of changes in net assets for each of the two years in the period then ended, and the financial highlights for each of the periods presented. These financial statements and financial highlights are the responsibility of the Fund's management. Our responsibility is to express an opinion on these financial statements and financial highlights based on our audits.
We conducted our audits in accordance with standards of the Public Company Accounting Oversight Board (United States). Those standards require that we plan and perform the audit to obtain reasonable assurance about whether the financial statements and financial highlights are free of material misstatement. The Fund is not required to have, nor were we engaged to perform, an audit of its internal control over financial reporting. Our audits included consideration of internal control over financial reporting as a basis for designing audit procedures that are appropriate in the circumstances, but not for the purpose of expressing an opinion on the effectiveness of the Fund's internal control over financial reporting. Accordingly, we express no such opinion. An audit also includes examining, on a test basis, evidence supporting the amounts and disclosures in the financial statements, assessing the accounting principles used and significant estimates made by management, as well as evaluating the overall financial statement presentation. Our procedures included confirmation of securities owned as of October 31, 2010, by correspondence with the transfer agent. We believe that our audits provide a reasonable basis for our opinion.
In our opinion, the financial statements and financial highlights referred to above present fairly, in all material respects, the financial position of Fidelity Stock Selector All Cap as of October 31, 2010, the results of its operations for the year then ended, the changes in its net assets for each of the two years in the period then ended, and the financial highlights for each of the periods presented, in conformity with accounting principles generally accepted in the United States of America.
/s/ Deloitte & Touche LLP
DELOITTE & TOUCHE LLP
Boston, Massachusetts
December 21, 2010
Annual Report
The Trustees, Member of the Advisory Board, and executive officers of the trust and fund, as applicable, are listed below. The Board of Trustees governs the fund and is responsible for protecting the interests of shareholders. The Trustees are experienced executives who meet periodically throughout the year to oversee the fund's activities, review contractual arrangements with companies that provide services to the fund, oversee management of the risks associated with such activities and contractual arrangements, and review the fund's performance. Except for James C. Curvey, each of the Trustees oversees 221 funds advised by FMR or an affiliate. Mr. Curvey oversees 410 funds advised by FMR or an affiliate.
The Trustees hold office without limit in time except that (a) any Trustee may resign; (b) any Trustee may be removed by written instrument, signed by at least two-thirds of the number of Trustees prior to such removal; (c) any Trustee who requests to be retired or who has become incapacitated by illness or injury may be retired by written instrument signed by a majority of the other Trustees; and (d) any Trustee may be removed at any special meeting of shareholders by a two-thirds vote of the outstanding voting securities of the trust.
Each Trustee who is not an interested person (as defined in the 1940 Act) (Independent Trustee), shall retire not later than the last day of the calendar year in which his or her 72nd birthday occurs. The Independent Trustees may waive this mandatory retirement age policy with respect to individual Trustees.
The executive officers and Advisory Board Member hold office without limit in time, except that any officer and Advisory Board Member may resign or may be removed by a vote of a majority of the Trustees at any regular meeting or any special meeting of the Trustees. Except as indicated, each individual has held the office shown or other offices in the same company for the past five years.
Experience, Skills, Attributes, and Qualifications of the Fund's Trustees. The Governance and Nominating Committee has adopted a statement of policy that describes the experience, qualifications, attributes, and skills that are necessary and desirable for potential Independent Trustee candidates (Statement of Policy). The Board believes that each Trustee satisfied at the time he or she was initially elected or appointed a Trustee, and continues to satisfy, the standards contemplated by the Statement of Policy. The Governance and Nominating Committee also engages professional search firms to help identify potential Independent Trustee candidates who have the experience, qualifications, attributes, and skills consistent with the Statement of Policy. From time to time, additional criteria based on the composition and skills of the current Independent Trustees, as well as experience or skills that may be appropriate in light of future changes to board composition, business conditions, and regulatory or other developments, have also been considered by the professional search firms and the Governance and Nominating Committee. In addition, the Board takes into account the Trustees' commitment and participation in Board and committee meetings, as well as their leadership of standing and ad hoc committees throughout their tenure.
Annual Report
In determining that a particular Trustee was and continues to be qualified to serve as a Trustee, the Board has considered a variety of criteria, none of which, in isolation, was controlling. The Board believes that, collectively, the Trustees have balanced and diverse experience, qualifications, attributes, and skills, which allow the Board to operate effectively in governing the fund and protecting the interests of shareholders. Information about the specific experience, skills, attributes, and qualifications of each Trustee, which in each case led to the Board's conclusion that the Trustee should serve (or continue to serve) as a trustee of the fund, is provided below.
Board Structure and Oversight Function. Edward C. Johnson 3d is an interested person (as defined in the 1940 Act) and currently serves as Chairman. The Trustees have determined that an interested Chairman is appropriate and benefits shareholders because an interested Chairman has a personal and professional stake in the quality and continuity of services provided to the fund. Independent Trustees exercise their informed business judgment to appoint an individual of their choosing to serve as Chairman, regardless of whether the Trustee happens to be independent or a member of management. The Independent Trustees have determined that they can act independently and effectively without having an Independent Trustee serve as Chairman and that a key structural component for assuring that they are in a position to do so is for the Independent Trustees to constitute a substantial majority for the Board. The Independent Trustees also regularly meet in executive session. Ned C. Lautenbach serves as Chairman of the Independent Trustees and as such (i) acts as a liaison between the Independent Trustees and management with respect to matters important to the Independent Trustees and (ii) with management prepares agendas for Board meetings.
Fidelity funds are overseen by different Boards of Trustees. The fund's Board oversees Fidelity's equity and high income funds and another Board oversees Fidelity's investment-grade bond, money market, and asset allocation funds. The asset allocation funds may invest in Fidelity funds overseen by the fund's Board. The use of separate Boards, each with its own committee structure, allows the Trustees of each group of Fidelity funds to focus on the unique issues of the funds they oversee, including common research, investment, and operational issues. On occasion, the separate Boards establish joint committees to address issues of overlapping consequences for the Fidelity funds overseen by each Board.
The Trustees operate using a system of committees to facilitate the timely and efficient consideration of all matters of importance to the Trustees, the fund, and fund shareholders and to facilitate compliance with legal and regulatory requirements and oversight of the fund's activities and associated risks. The Board, acting through its committees, has charged FMR and its affiliates with (i) identifying events or circumstances the occurrence of which could have demonstrably adverse effects on the fund's business and/or reputation; (ii) implementing processes and controls to lessen the possibility that such events or circumstances occur or to mitigate the effects of such events or circumstances if they do occur; and (iii) creating and maintaining a system designed to evaluate continuously business and market conditions in order to facilitate the identification and implementation processes described in (i) and (ii) above. Because the day-to-day operations and activities of the fund are carried out by or through FMR, its affiliates and other service providers, the fund's exposure to risks is mitigated but not eliminated by the processes overseen by the Trustees. While each of the Board's committees has responsibility for overseeing different aspects of the fund's activities, oversight is exercised primarily through the Operations, Audit, and Compliance Committees. Appropriate personnel, including but not limited to the fund's Chief Compliance Officer (CCO), FMR's internal auditor, the independent accountants, the fund's Treasurer and portfolio management personnel, make periodic reports to the Board's committees, as appropriate. The responsibilities of each committee, including their oversight responsibilities, are described further under "Standing Committees of the Fund's Trustees."
Annual Report
Trustees and Officers - continued
The fund's Statement of Additional Information (SAI) includes more information about the Trustees. To request a free copy, call Fidelity at 1-800-544-8544.
Interested Trustees*:
Correspondence intended for each Trustee who is an interested person may be sent to Fidelity Investments, 82 Devonshire Street, Boston, Massachusetts 02109.
Name, Age; Principal Occupations and Other Relevant Experience+ |
Edward C. Johnson 3d (80) |
| Year of Election or Appointment: 1978 Mr. Johnson is Trustee and Chairman of the Board of Trustees of certain Trusts. Mr. Johnson serves as Chief Executive Officer, Chairman, and a Director of FMR LLC; Chairman and a Director of FMR; Chairman and a Director of Fidelity Research & Analysis Company (FRAC); Chairman and a Director of Fidelity Investments Money Management, Inc.; and Chairman and a Director of FMR Co., Inc. In addition, Mr. Johnson serves as Chairman and Director of FIL Limited. Previously, Mr. Johnson served as President of FMR LLC (2006-2007). |
James C. Curvey (75) |
| Year of Election or Appointment: 2007 Mr. Curvey also serves as Trustee (2007-present) of other investment companies advised by FMR. Mr. Curvey is a Director of Fidelity Investments Money Management, Inc. (2009-present), Director of Fidelity Research & Analysis Co. (2009-present) and Director of FMR and FMR Co., Inc. (2007-present). Mr. Curvey is also Vice Chairman (2007-present) and Director of FMR LLC. In addition, Mr. Curvey serves as an Overseer for the Boston Symphony Orchestra and a member of the Trustees of Villanova University. Previously, Mr. Curvey was the Vice Chairman (2006-2007) and Director (2000-2007) of FMR Corp. |
Annual Report
* Trustees have been determined to be "Interested Trustees" by virtue of, among other things, their affiliation with the trust or various entities under common control with FMR.
+ The information above includes each Trustee's principal occupation during the last five years and other information relating to the experience, attributes, and skills relevant to each Trustee's qualifications to serve as a Trustee, which led to the conclusion that each Trustee should serve as a Trustee for the fund.
Independent Trustees:
Correspondence intended for each Independent Trustee (that is, the Trustees other than the Interested Trustees) may be sent to Fidelity Investments, P.O. Box 55235, Boston, Massachusetts 02205-5235.
Name, Age; Principal Occupations and Other Relevant Experience+ |
Dennis J. Dirks (62) |
| Year of Election or Appointment: 2005 Prior to his retirement in May 2003, Mr. Dirks was Chief Operating Officer and a member of the Board of The Depository Trust & Clearing Corporation (DTCC). He also served as President, Chief Operating Officer, and Board member of The Depository Trust Company (DTC) and President and Board member of the National Securities Clearing Corporation (NSCC). In addition, Mr. Dirks served as Chief Executive Officer and Board member of the Government Securities Clearing Corporation, Chief Executive Officer and Board member of the Mortgage-Backed Securities Clearing Corporation, as a Trustee and a member of the Finance Committee of Manhattan College (2005-2008), and as a Trustee and a member of the Finance Committee of AHRC of Nassau County (2006-2008). Mr. Dirks is a member of the Independent Directors Council (IDC) Governing Council (2010-Present) and Board of Directors for The Brookville Center for Children's Services, Inc. (2009-present). |
Alan J. Lacy (57) |
| Year of Election or Appointment: 2008 Mr. Lacy serves as Senior Adviser (2007-present) of Oak Hill Capital Partners, L.P. (private equity). Mr. Lacy also served as Chief Executive Officer (2000-2005) and Vice Chairman (2005-2006) of Sears Holdings Corporation and Sears, Roebuck and Co. (retail). In addition, Mr. Lacy serves as a member of the Board of Directors of The Western Union Company (global money transfer, 2006-present) and Bristol-Myers Squibb Company (global pharmaceuticals, 2007-present). Mr. Lacy is Chairman (2008-present) and a member (2006-present) of the Board of Trustees of The National Parks Conservation Association. |
Ned C. Lautenbach (66) |
| Year of Election or Appointment: 2000 Mr. Lautenbach is Chairman of the Independent Trustees of the Equity and High Income Funds (2006-present). Mr. Lautenbach currently serves as the Lead Director of the Eaton Corporation Board of Directors (diversified industrial, 1997-present). Mr. Lautenbach is also a member of the Board of Directors of the Philharmonic Center for the Arts in Naples, Florida (1999-present); a member of the Board of Trustees of Fairfield University (2005-present); and a member of the Council on Foreign Relations (1994-present). Previously, Mr. Lautenbach was a Partner/Advisory Partner at Clayton, Dubilier & Rice, Inc. (private equity investment, 1998-2010), as well as a Director of Sony Corporation (2006-2007). |
Joseph Mauriello (66) |
| Year of Election or Appointment: 2008 Prior to his retirement in January 2006, Mr. Mauriello served in numerous senior management positions including Deputy Chairman and Chief Operating Officer (2004-2005), and Vice Chairman of Financial Services (2002-2004) of KPMG LLP US (professional services, 1965-2005).
Mr. Mauriello currently serves as a member of the Board of Directors of XL Group plc. (global insurance and re-insurance, 2006-present) and of Arcadia Resources Inc. (health care services and products, 2007-present). Previously, Mr. Mauriello served as a Director of the Hamilton Funds of the Bank of New York (2006-2007). |
Cornelia M. Small (66) |
| Year of Election or Appointment: 2005 Ms. Small is a member of the Board of Directors of the Teagle Foundation (2009-present). Ms. Small is also a member of the Investment Committee, and Chair (2008-present) and a member of the Board of Trustees of Smith College. In addition, Ms. Small serves on the Investment Committee of the Berkshire Taconic Community Foundation (2008-present). Previously, Ms. Small served as Chairperson of the Investment Committee (2002-2008) of Smith College. In addition, Ms. Small served as Chief Investment Officer, Director of Global Equity Investments, and a member of the Board of Directors of Scudder, Stevens & Clark and Scudder Kemper Investments. |
William S. Stavropoulos (71) |
| Year of Election or Appointment: 2001 Mr. Stavropoulos is Vice Chairman of the Independent Trustees of the Equity and High Income Funds (2006-present). Mr. Stavropoulos serves as President and Founder of the Michigan Baseball Foundation, the Great Lakes Loons (2007-present). Mr. Stavropoulos is Chairman Emeritus of the Board of Directors of The Dow Chemical Company, where he previously served in numerous senior management positions, including President, CEO (1995-2000; 2002-2004), Chairman of the Executive Committee (2000-2006), and as a member of the Board of Directors (1990-2006). Currently, Mr. Stavropoulos is Chairman of Univar (global distributor of commodity and specialty chemicals, 2010-present), a Director of Teradata Corporation (data warehousing and technology solutions, 2008-present), Chemical Financial Corporation, Maersk Inc. (industrial conglomerate), Tyco International, Inc. (multinational manufacturing and services, 2007-present), and a member of the Advisory Board for Metalmark Capital (private equity investment, 2005-present). Mr. Stavropoulos is a special advisor to Clayton, Dubilier & Rice, Inc. (private equity investment). In addition, Mr. Stavropoulos is a member of the University of Notre Dame Advisory Council for the College of Science. |
David M. Thomas (61) |
| Year of Election or Appointment: 2008 Previously, Mr. Thomas served as Executive Chairman (2005-2006) and Chairman and Chief Executive Officer (2000-2005) of IMS Health, Inc. (pharmaceutical and healthcare information solutions). In addition, Mr. Thomas serves as a member of the Board of Directors of Fortune Brands, Inc. (consumer products), and Interpublic Group of Companies, Inc. (marketing communication, 2004-present). |
Michael E. Wiley (60) |
| Year of Election or Appointment: 2008 Mr. Wiley also serves as a Director of Asia Pacific Exploration Consolidated (international oil and gas exploration and production, 2008-present). Mr. Wiley serves as a Director of Tesoro Corporation
(independent oil refiner and marketer, 2005-present), and a Director of Bill Barrett Corporation (exploration and production, 2005-present). In addition, Mr. Wiley also serves as a Director of Post Oak Bank (privately-held bank, 2004-present). Previously, Mr. Wiley served as a member of the Board of Trustees of the University of Tulsa (2000-2006; 2007-2010), as a Senior Energy Advisor of Katzenbach Partners, LLC (consulting, 2006-2007), as an Advisory Director of Riverstone Holdings (private investment), Chairman, President, and CEO of Baker Hughes, Inc. (oilfield services, 2000-2004), and as Director of Spinnaker Exploration Company (exploration and production, 2001-2005). |
Annual Report
Trustees and Officers - continued
+ The information above includes each Trustee's principal occupation during the last five years and other information relating to the experience, attributes, and skills relevant to each Trustee's qualifications to serve as a Trustee, which led to the conclusion that each Trustee should serve as a Trustee for the fund.
Advisory Board Member and Executive Officers:
Correspondence intended for each executive officer and Peter S. Lynch may be sent to Fidelity Investments, 82 Devonshire Street, Boston, Massachusetts 02109.
Name, Age; Principal Occupation |
Peter S. Lynch (66) |
| Year of Election or Appointment: 2003 Member of the Advisory Board of Fidelity's Equity and High Income Funds. Mr. Lynch is Vice Chairman and a Director of FMR and FMR Co., Inc. In addition, Mr. Lynch serves as a Trustee of Boston College and as the Chairman of the Inner-City Scholarship Fund. Previously, Mr. Lynch served on the Special Olympics International Board of Directors (1997-2006). |
Kenneth B. Robins (41) |
| Year of Election or Appointment: 2008 President and Treasurer of Fidelity's Equity and High Income Funds.
Mr. Robins also serves as President and Treasurer (2010-present) and Assistant Treasurer (2009-present) of other Fidelity funds and is an employee of Fidelity Investments (2004-present). Previously, Mr. Robins served as Deputy Treasurer of the Fidelity funds (2005-2008) and Treasurer and Chief Financial Officer of The North Carolina Capital Management Trust: Cash and Term Portfolios (2006-2008). |
Bruce T. Herring (45) |
| Year of Election or Appointment: 2006 Vice President of certain Equity Funds. Mr. Herring also serves as Chief Investment Officer and Director of Fidelity Management & Research (U.K.) Inc. (2010-present) and Group Chief Investments Officer of FMR. Previously, Mr. Herring served as Vice President (2005-2006) and Senior Vice President (2006-2007) of Fidelity Management & Research Company, Vice President of FMR Co., Inc. (2001-2007) and as a portfolio manager for Fidelity U.S. Equity Funds. |
Brian B. Hogan (46) |
| Year of Election or Appointment: 2009 Vice President of certain Equity Funds and Vice President of Sector Funds. Mr. Hogan also serves as President of FMR's Equity Division (2009-present). Previously, Mr. Hogan served as Senior Vice President, Equity Research of FMR (2006-2009) and as a portfolio manager. |
Scott C. Goebel (42) |
| Year of Election or Appointment: 2008 Secretary and Chief Legal Officer (CLO) of the Fidelity funds. Mr. Goebel also serves as Secretary and CLO of The North Carolina Capital Management Trust: Cash and Term Portfolio (2008-present); General Counsel, Secretary, and Senior Vice President of FMR (2008-present) and FMR Co., Inc. (2008-present); Deputy General Counsel of FMR LLC; Chief Legal Officer of Fidelity Management & Research (Hong Kong) Limited (2008-present) and Assistant Secretary of Fidelity Management & Research (Japan) Inc. (2008-present), Fidelity Investments Money Management, Inc. (2008-present), Fidelity Management & Research (U.K.) Inc. (2008-present), and Fidelity Research and Analysis Company (2008-present). Previously, Mr. Goebel served as Assistant Secretary of the Funds (2007-2008) and as Vice President and Secretary of Fidelity Distributors Corporation (FDC) (2005-2007). |
William C. Coffey (41) |
| Year of Election or Appointment: 2009 Assistant Secretary of Fidelity's Equity and High Income Funds. Mr. Coffey also serves as Senior Vice President and Deputy General Counsel of FMR LLC (2010-present), and is an employee of Fidelity Investments. Previously, Mr. Coffey served as Vice President and Associate General Counsel of FMR LLC (2005-2009). |
Holly C. Laurent (56) |
| Year of Election or Appointment: 2008 Anti-Money Laundering (AML) Officer of the Fidelity funds. Ms. Laurent also serves as AML Officer of The North Carolina Capital Management Trust: Cash and Term Portfolio (2008-present) and is an employee of Fidelity Investments. Previously, Ms. Laurent was Senior Vice President and Head of Legal for Fidelity Business Services India Pvt. Ltd. (2006-2008), and Senior Vice President, Deputy General Counsel and Group Head for FMR LLC (2005-2006). |
Christine Reynolds (52) |
| Year of Election or Appointment: 2008 Chief Financial Officer of the Fidelity funds. Ms. Reynolds became President of Fidelity Pricing and Cash Management Services (FPCMS) in August 2008. Ms. Reynolds served as Chief Operating Officer of FPCMS (2007-2008). Previously, Ms. Reynolds served as President, Treasurer, and Anti-Money Laundering officer of the Fidelity funds (2004-2007). |
Kenneth A. Rathgeber (63) |
| Year of Election or Appointment: 2004 Chief Compliance Officer of Fidelity's Equity and High Income Funds. Mr. Rathgeber is Chief Compliance Officer of Fidelity Management & Research (Hong Kong) Limited (2008-present), Fidelity Management & Research (Japan) Inc. (2008-present), FMR (2005-present), FMR Co., Inc. (2005-present), Fidelity Management & Research (U.K.) Inc. (2005-present), Fidelity Research & Analysis Company (2005-present), Fidelity Investments Money Management, Inc. (2005-present), Pyramis Global Advisors, LLC (2005-present), and Strategic Advisers, Inc. (2005-present). |
Jeffrey S. Christian (49) |
| Year of Election or Appointment: 2009 Deputy Treasurer of the Fidelity funds. Mr. Christian is an employee of Fidelity Investments. Previously, Mr. Christian served as Chief Financial Officer (2008-2009) of certain Fidelity funds and Senior Vice President of Fidelity Pricing and Cash Management Services (FPCMS) (2004-2009). |
Bryan A. Mehrmann (49) |
| Year of Election or Appointment: 2005 Deputy Treasurer of the Fidelity funds. Mr. Mehrmann is an employee of Fidelity Investments. |
Adrien E. Deberghes (43) |
| Year of Election or Appointment: 2008 Deputy Treasurer of Fidelity's Equity and High Income Funds.
Mr. Deberghes also serves as Assistant Treasurer of other Fidelity funds (2010-present) and is an employee of Fidelity Investments (2008-present). Previously, Mr. Deberghes served as Senior Vice President of Mutual Fund Administration at State Street Corporation (2007-2008), Senior Director of Mutual Fund Administration at Investors Bank & Trust (2005-2007), and Director of Finance for Dunkin' Brands (2000-2005). |
Stephanie J. Dorsey (41) |
| Year of Election or Appointment: 2010 Assistant Treasurer of Fidelity's Equity and High Income Funds. Ms. Dorsey also serves as Deputy Treasurer of other Fidelity funds (2008-present) and is an employee of Fidelity Investments (2008-present). Previously,
Ms. Dorsey served as Treasurer (2004-2008) of the JPMorgan Mutual Funds and Vice President (2004-2008) of JPMorgan Chase Bank. |
John R. Hebble (52) |
| Year of Election or Appointment: 2009 Assistant Treasurer of Fidelity's Equity and High Income Funds. Mr. Hebble also serves as Treasurer and Chief Financial Officer of The North Carolina Capital Management Trust: Cash and Term Portfolio (2008-present), President and Treasurer of other Fidelity funds (2008-present) and is an employee of Fidelity Investments. |
Gary W. Ryan (52) |
| Year of Election or Appointment: 2005 Assistant Treasurer of the Fidelity funds. Mr. Ryan is an employee of Fidelity Investments. Previously, Mr. Ryan served as Vice President of Fund Reporting in Fidelity Pricing and Cash Management Services (FPCMS) (1999-2005). |
Jonathan Davis (42) |
| Year of Election or Appointment: 2010 Assistant Treasurer of the Fidelity funds. Mr. Davis is an employee of Fidelity Investments. Previously, Mr. Davis served as Vice President and Associate General Counsel of FMR LLC (2003-2010). |
Annual Report
Stock Selector All Cap designates 100% of the dividend distributed during the fiscal year as qualifying for the dividends-received deduction for corporate shareholders.
Stock Selector All Cap designates 100% of the dividend distributed during the fiscal year as amounts which may be taken into account as a dividend for the purposes of the maximum rate under section 1(h)(11) of the Internal Revenue Code.
The fund will notify shareholders in January 2011 of amounts for use in preparing 2010 income tax returns.
Annual Report
Board Approval of Investment Advisory Contracts and Management Fees
Fidelity Stock Selector All Cap Fund (formerly known as Fidelity Stock Selector)
Each year, the Board of Trustees, including the Independent Trustees (together, the Board), votes on the renewal of the management contract and sub-advisory agreements (together, the Advisory Contracts) for the fund. The Board, assisted by the advice of fund counsel and Independent Trustees' counsel, requests and considers a broad range of information relevant to the renewal of the Advisory Contracts throughout the year.
The Board meets regularly and considers at each of its meetings factors that are relevant to its annual consideration of the renewal of the fund's Advisory Contracts, including the services and support provided to the fund and its shareholders. The Board has established various standing committees, each composed of Independent Trustees with varying backgrounds, to which the Board has assigned specific subject matter responsibilities in order to enhance effective decision-making by the Board. The Board, acting directly and through its Committees, requests and receives information concerning the annual consideration of the renewal of the fund's Advisory Contracts. The Board also meets as needed to consider matters specifically related to the Board's annual consideration of the renewal of Advisory Contracts. Members of the Board may also meet with trustees of other Fidelity funds through ad hoc joint committees to discuss certain matters relevant to the Fidelity funds.
At its July 2010 meeting, the Board of Trustees, including the Independent Trustees, unanimously determined to renew the fund's Advisory Contracts. In reaching its determination, the Board considered all factors it believed relevant, including (i) the nature, extent, and quality of the services to be provided to the fund and its shareholders (including the investment performance of the fund); (ii) the competitiveness of the fund's management fee and total expenses; (iii) the total costs of the services to be provided by and the profits to be realized by Fidelity from its relationship with the fund; (iv) the extent to which economies of scale would be realized as the fund grows; and (v) whether fee levels reflect these economies of scale, if any, for the benefit of fund shareholders.
In considering whether to renew the Advisory Contracts for the fund, the Board reached a determination, with the assistance of fund counsel and Independent Trustees' counsel and through the exercise of its business judgment, that the renewal of the Advisory Contracts is in the best interests of fund shareholders and that the compensation to be received by Fidelity under the management contract is fair and reasonable. The Board's decision to renew the Advisory Contracts was not based on any single factor noted above, but rather was based on a comprehensive consideration of all the information provided to the Board at its meetings throughout the year. The Board, in reaching its determination to renew the Advisory Contracts, is aware that shareholders in the fund have a broad range of investment choices available to them, including a wide choice among mutual funds offered by Fidelity's competitors, and that the fund's shareholders, with the opportunity to review and weigh the disclosure provided by the fund in its prospectus and other public disclosures, have chosen to invest in this fund, managed by Fidelity.
Annual Report
Nature, Extent, and Quality of Services Provided. The Board considered the staffing within the investment adviser, FMR, and the sub-advisers (together, the Investment Advisers), including the backgrounds of the fund's investment personnel and the fund's investment objective and discipline. The Independent Trustees also had discussions with senior management of Fidelity's investment operations and investment groups. The Board considered the structure of the portfolio manager compensation program and whether this structure provides appropriate incentives to act in the best interest of the fund.
Resources Dedicated to Investment Management and Support Services. The Board and the equity research subcommittee of the Board's Fund Oversight Committee reviewed the size, education, and experience of the Investment Advisers' investment staff, their use of technology, and the Investment Advisers' approach to recruiting, training, and retaining portfolio managers and other research, advisory, and management personnel. The Board noted that Fidelity's analysts have access to a variety of technological tools and market and securities data that enable them to perform both fundamental and quantitative analysis and to specialize in various disciplines. The Board considered Fidelity's extensive global research capabilities that enable the Investment Advisers to aggregate data from various sources in an effort to produce positive investment results. The Board also considered that Fidelity's portfolio managers and analysts have access to daily portfolio attribution that allows for monitoring of a fund's portfolio, as well as an electronic communication system that provides immediate real-time access to research concerning issuers and credit enhancers. The Board noted FMR's continued focus on strengthening the organization and discipline of equity portfolio management and research.
Shareholder and Administrative Services. The Board considered (i) the nature, extent, quality, and cost of advisory, administrative, and shareholder services performed by the Investment Advisers and their affiliates under the Advisory Contracts and under separate agreements covering transfer agency, pricing and bookkeeping, and securities lending services for the fund; (ii) the nature and extent of the investment adviser's supervision of third party service providers, principally custodians and subcustodians; and (iii) the resources devoted to, and the record of compliance with, the fund's compliance policies and procedures. The Board also reviewed the allocation of fund brokerage, including allocations to brokers affiliated with the Investment Advisers, the use of brokerage commissions to pay fund expenses, and the use of "soft" commission dollars to pay for research services.
The Board noted that the growth of fund assets over time across the complex allows Fidelity to reinvest in the development of services designed to enhance the value or convenience of the Fidelity funds as investment vehicles. These services include 24-hour access to account information and market information through phone representatives and over the Internet, and investor education materials and asset allocation tools.
Annual Report
Board Approval of Investment Advisory Contracts and
Management Fees - continued
Investment in a Large Fund Family. The Board considered the benefits to shareholders of investing in a Fidelity fund, including the benefits of investing in a fund that is part of a large family of funds offering a variety of investment disciplines and providing a large variety of mutual fund investor services. The Board noted that Fidelity had taken, or had made recommendations that resulted in the Fidelity funds taking, a number of actions over the previous year that benefited particular funds, including (i) dedicating additional resources to investment research and restructuring and broadening the focus of the investment research teams; (ii) bolstering the senior management team that oversees asset management; (iii) launching Class F of certain funds as a lower-fee class available to Freedom K and Freedom Index Funds; (iv) lowering the initial investment minimums and ongoing balance requirements for Real Estate High Income Fund; (v) eliminating subsequent purchase minimums for all funds and adding a waiver of the investment minimum requirement for new accounts opened with the proceeds of a systematic withdrawal plan; (vi) eliminating the withdrawal minimum and maximum limits for systematic withdrawals from Advisor funds; (vii) expanding sales load waivers on Class A shares for Destiny Planholders and expanding Institutional Class eligibility for Class O Destiny Planholders; and (viii) changing certain Class A and Class T sales charge structures to further align them with industry practices.
Investment Performance. The Board considered whether the fund has operated in accordance with its investment objective, as well as its record of compliance with its investment restrictions. It also reviewed the fund's absolute investment performance for each class, as well as the fund's relative investment performance for each class measured over multiple periods against (i) a broad-based securities market index, and (ii) a peer group of mutual funds deemed appropriate by Fidelity and reviewed by the Board. The following charts considered by the Board show, over the one-, three-, and five-year periods ended December 31, 2009, as available, the cumulative total returns of Class K and the retail class of the fund, the cumulative total returns of a broad-based securities market index ("benchmark"), and a range of cumulative total returns of a peer group of mutual funds identified by Morningstar, Inc. as having an investment style similar to that of the fund based on underlying portfolio holdings. The box within each chart shows the 25th percentile return (bottom of box) and the 75th percentile return (top of box) of the peer group. Returns shown above the box are in the first quartile and returns shown below the box are in the fourth quartile. The percentage beaten numbers noted below each chart correspond to the percentile box and represent the percentage of funds in the peer group whose performance was equal to or lower than that of the class indicated.
Annual Report
Fidelity Stock Selector All Cap Fund
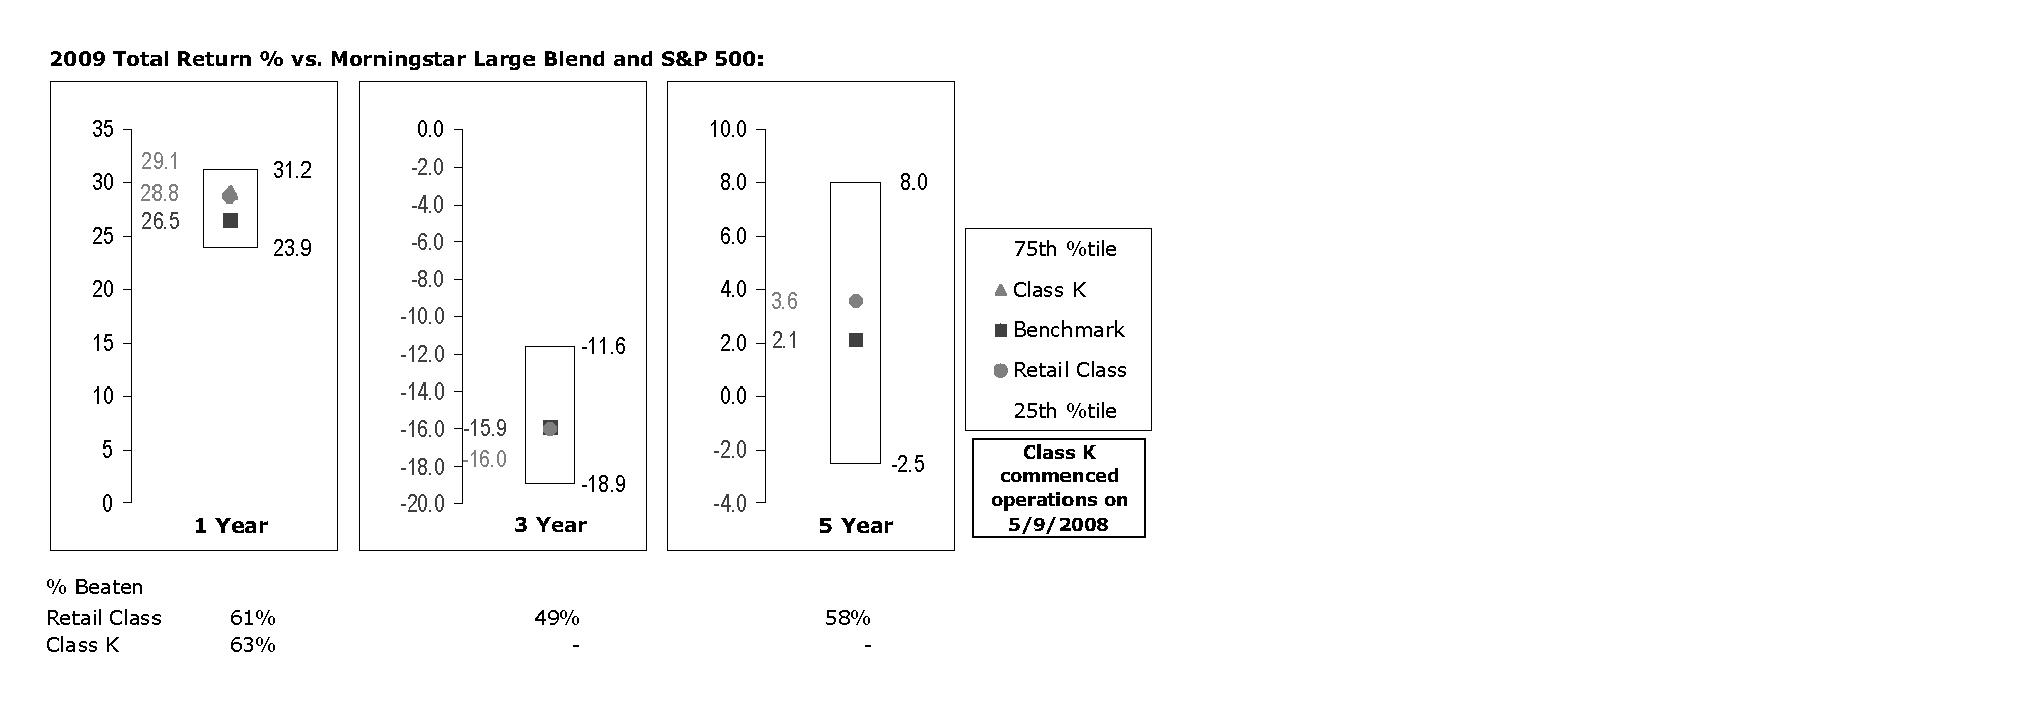
The Board reviewed the fund's relative investment performance against its peer group and noted that the performance of the retail class of the fund (the class with the longer performance record) was in the second quartile for the one- and five-year periods and the third quartile for the three-year period. The Board also noted that the investment performance of the retail class of the fund compared favorably to its benchmark for the one- and five-year periods, although the fund's three-year cumulative total return was lower than its benchmark. The Board considered that the variations in performance between the fund's classes reflect the variations in class expenses, which result in lower performance for the higher expense class. The Board also reviewed the fund's performance since inception as well as performance in the current year.
The Board also considered that the fund's management fee is subject to upward or downward adjustment depending upon whether, and to what extent, the fund's investment performance for the performance period exceeds, or is exceeded by, the record (over the same period) of a Board-approved performance adjustment index. The Board realizes that the performance adjustment provides FMR with a strong economic incentive to seek to achieve superior performance for the fund's shareholders and helps to more closely align the interests of FMR and the fund's shareholders.
Based on its review, and giving particular weight to the nature and quality of the resources dedicated by the Investment Advisers to maintain and improve relative performance and factoring in the unprecedented market events in recent years, the Board concluded that the nature, extent, and quality of investment management and support services and of shareholder and administrative services provided to the fund will benefit the fund's shareholders, particularly in light of the Board's view that the fund's shareholders benefit from investing in a fund that is part of a large family of funds offering a variety of investment disciplines and services.
Annual Report
Board Approval of Investment Advisory Contracts and
Management Fees - continued
Competitiveness of Management Fee and Total Fund Expenses. The Board considered the fund's management fee and total expenses compared to "mapped groups" of competitive funds and classes. Fidelity creates "mapped groups" by combining similar Lipper investment objective categories that have comparable management fee characteristics. Combining Lipper investment objective categories aids the Board's management fee and total expense comparisons by broadening the competitive group used for comparison and by reducing the number of universes to which various Fidelity funds are compared.
Management Fee. The Board considered two proprietary management fee comparisons for the 12-month periods shown in the chart below. The group of Lipper funds used by the Board for management fee comparisons is referred to below as the "Total Mapped Group." The Total Mapped Group comparison focuses on a fund's standing relative to the total universe of comparable funds available to investors, in terms of gross management fees before expense reimbursements or caps, and without giving effect to the fund's performance adjustment. "TMG %" represents the percentage of funds in the Total Mapped Group that had management fees that were lower than the fund's. For example, a TMG % of 10% means that 90% of the funds in the Total Mapped Group had higher management fees than the fund. The "Asset-Size Peer Group" (ASPG) comparison focuses on a fund's standing relative to non-Fidelity funds similar in size to the fund within the Total Mapped Group. The ASPG represents at least 15% of the funds in the Total Mapped Group with comparable asset size and management fee characteristics, subject to a minimum of 50 funds (or all funds in the Total Mapped Group if fewer than 50). Additional information, such as the ASPG quartile in which the fund's management fee ranked and the impact of the fund's performance adjustment, is also included in the chart and considered by the Board.
Annual Report
Fidelity Stock Selector All Cap Fund
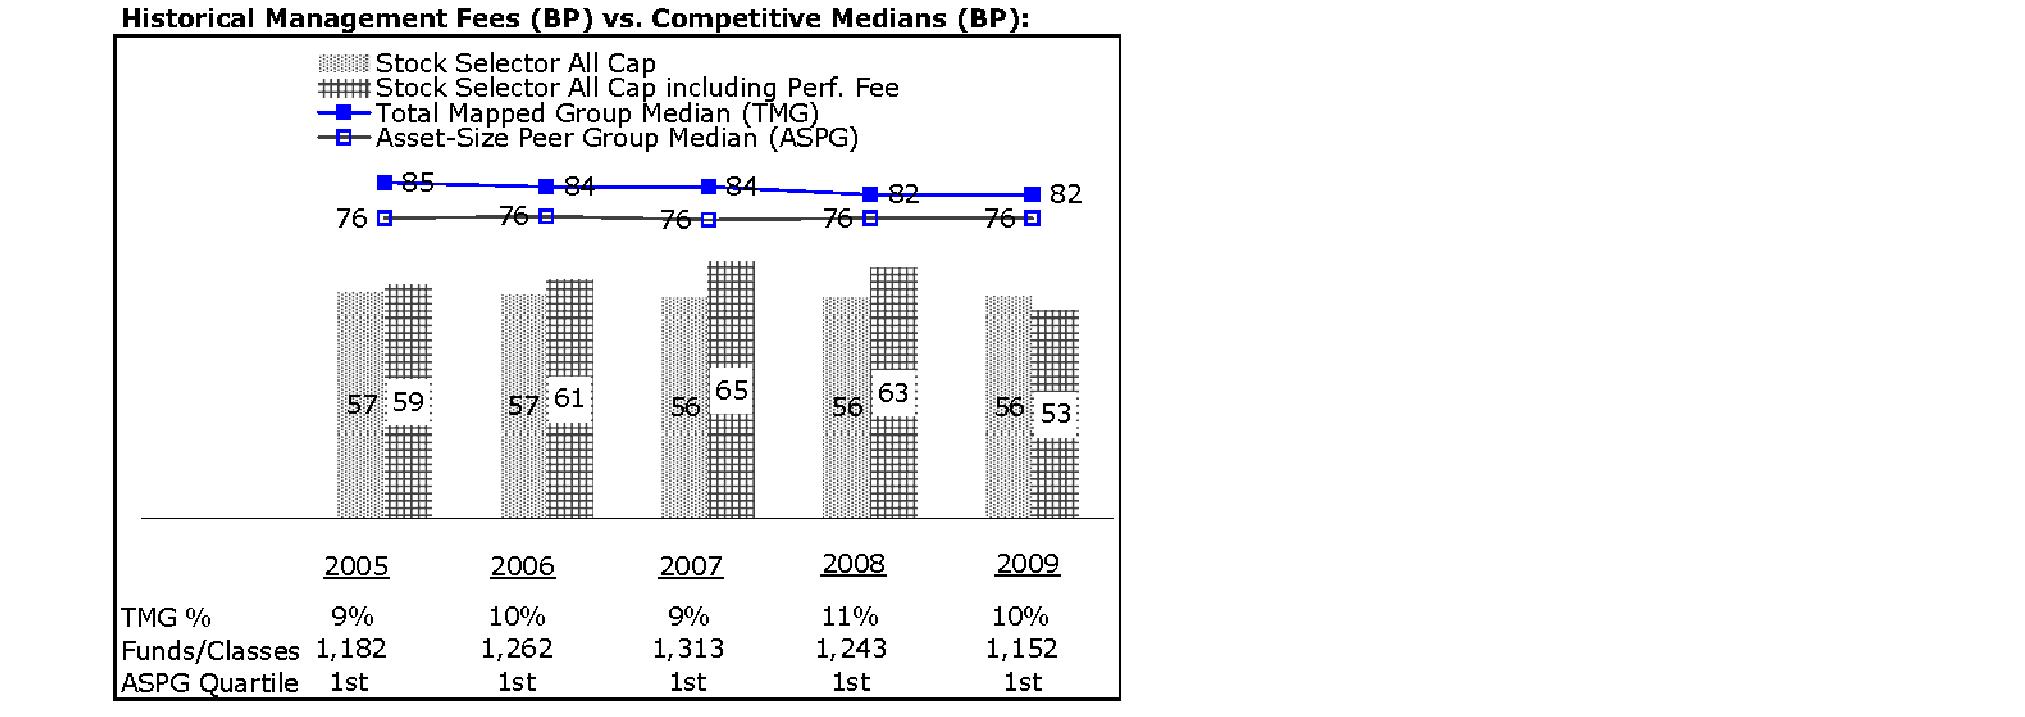
The Board noted that the fund's management fee ranked below the median of its Total Mapped Group and below the median of its ASPG for 2009. The Board also noted the effect of the fund's negative performance adjustment on the fund's management fee ranking. The Board noted that the performance adjustment for each year represents calculations for performance periods that differ from the periods shown in the performance charts above.
Based on its review, the Board concluded that the fund's management fee is fair and reasonable in light of the services that the fund receives and the other factors considered.
Total Expenses. In its review of each class's total expenses, the Board considered the fund's management fee as well as other fund or class expenses, as applicable, such as transfer agent fees, pricing and bookkeeping fees, and custodial, legal, and audit fees. The Board also noted the effects of any waivers and reimbursements on fees and expenses, as well as the impact of the fund's performance adjustment. As part of its review, the Board also considered current and historical total expenses of each class of the fund compared to competitive fund median expenses. Each class of the fund is compared to those funds and classes in the Total Mapped Group (used by the Board for management fee comparisons) that have a similar sales load structure.
The Board noted that the total expenses of each class ranked below its competitive median for 2009.
Annual Report
Board Approval of Investment Advisory Contracts and
Management Fees - continued
Fees Charged to Other Fidelity Clients. The Board also considered Fidelity fee structures and other information with respect to clients of FMR and its affiliates, such as other mutual funds advised or subadvised by FMR or its affiliates, pension plan clients, and other institutional clients. In March 2010, the Board created an ad hoc joint committee with the board of other Fidelity funds (the Committee) to review and compare Fidelity's institutional investment advisory business with its business of providing services to the Fidelity funds, including the differences in services provided, fees charged, and costs incurred, as well as competition in their respective marketplaces.
Based on its review of total expenses and fees charged to other Fidelity clients, the Board concluded that the total expenses of each class of the fund were reasonable in light of the services that the fund and its shareholders receive and the other factors considered, including the findings of the Committee.
Costs of the Services and Profitability. The Board considered the revenues earned and the expenses incurred by Fidelity in conducting the business of developing, marketing, distributing, managing, administering and servicing the fund and its shareholders. The Board also considered the level of Fidelity's profits in respect of all the Fidelity funds.
On an annual basis, FMR presents to the Board Fidelity's profitability for the fund. Fidelity calculates the profitability for each fund, as well as aggregate profitability for groups of Fidelity funds and all Fidelity funds, using a series of detailed revenue and cost allocation methodologies which originate with the audited books and records of Fidelity. The Audit Committee of the Board reviews any significant changes from the prior year's methodologies.
PricewaterhouseCoopers LLP (PwC), independent registered public accounting firm and auditor to Fidelity and certain Fidelity funds, has been engaged annually by the Board as part of the Board's assessment of Fidelity's profitability analysis. PwC's engagement includes the review and assessment of Fidelity's methodologies used in determining the revenues and expenses attributable to Fidelity's mutual fund business, and completion of agreed-upon procedures surrounding the mathematical accuracy of fund profitability and its conformity to allocation methodologies. After considering PwC's reports issued under the engagement and information provided by Fidelity, the Board believes that while other allocation methods may also be reasonable, Fidelity's profitability methodologies are reasonable in all material respects.
The Board has also reviewed Fidelity's non-fund businesses and fall-out benefits related to the mutual fund business as well as cases where Fidelity's affiliates may benefit from or be related to the fund's business.
The Board considered the costs of the services provided by and the profits realized by Fidelity in connection with the operation of the fund and were satisfied that the profitability was not excessive in the circumstances.
Annual Report
Economies of Scale. The Board considered whether there have been economies of scale in respect of the management of the Fidelity funds, whether the Fidelity funds (including the fund) have appropriately benefited from any such economies of scale, and whether there is potential for realization of any further economies of scale. The Board considered the extent to which the fund will benefit from economies of scale through increased services to the fund, through waivers or reimbursements, or through fee or expense reductions.
In February 2009, the Board and the board of other Fidelity funds created an ad hoc committee (the Economies of Scale Committee) to analyze whether FMR attains economies of scale in respect of the management and servicing of the Fidelity funds, whether the Fidelity funds have appropriately benefited from such economies of scale, and whether there is potential for realization of any further economies of scale.
The Board recognized that the fund's management contract incorporates a "group fee" structure, which provides for lower group fee rates as total fund assets under FMR's management increase, and for higher group fee rates as total fund assets under FMR's management decrease. FMR calculates the group fee rates based on a tiered asset "breakpoint" schedule that varies based on asset class. The Board considered that the group fee is designed to deliver the benefits of economies of scale to fund shareholders when total Fidelity fund assets increase, even if assets of any particular fund are unchanged or have declined, because some portion of Fidelity's costs are attributable to services provided to all Fidelity funds, and all funds benefit if those costs can be allocated among more assets. The Board concluded that, given the group fee structure, fund shareholders will benefit from lower management fees as assets under FMR's management increase at the fund complex level, regardless of whether Fidelity achieves any such economies of scale.
The Board concluded, considering the findings of the Economies of Scale Committee, that any potential economies of scale are being appropriately shared between fund shareholders and Fidelity.
Additional Information Requested by the Board. In order to develop fully the factual basis for consideration of the Fidelity funds' Advisory Contracts, the Board requested and received additional information on certain topics, including (i) fund performance trends, actions to be taken by FMR to improve certain funds' overall performance, and Fidelity's long-term strategies for certain funds; (ii) portfolio manager changes that have occurred during the past year and length of portfolio manager tenure for different categories of funds over time; (iii) Fidelity's compensation structure for portfolio managers, research analysts, and other key personnel, the rationale for the compensation structure, and how the compensation structure provides appropriate performance incentives; (iv) the amount of the investment that each portfolio manager has made in the Fidelity fund(s) that he or she manages; (v) management and other fees paid by FMR to affiliated sub-advisers on behalf of the Fidelity funds; (vi) Fidelity's fee structures and rationale for recommending different fees among different categories of funds; (vii) Fidelity's rationale for recommending which funds should have a performance adjustment component as part of their management fees; (viii) the rationale for any differences between fund fee structures and fee structures in place for other Fidelity clients; and (ix) explanations regarding the relative total expenses borne by certain funds and classes, total expense competitive trends, and actions that might be taken by FMR to reduce total expenses for certain funds and classes.
Annual Report
Board Approval of Investment Advisory Contracts and
Management Fees - continued
Based on its evaluation of all of the conclusions noted above, and after considering all factors it believed relevant, the Board ultimately concluded that the advisory fee structures are fair and reasonable, and that the fund's Advisory Contracts should be renewed.
Annual Report
Managing Your Investments
Fidelity offers several ways to conveniently manage your personal investments via your telephone or PC. You can access your account information, conduct trades and research your investments 24 hours a day.
By Phone
Fidelity Automated Service Telephone provides a single toll-free number to access account balances, positions, quotes and trading. It's easy to navigate the service, and on your first call, the system will help you create a personal identification number (PIN) for security.
(phone_graphic)
Fidelity Automated
Service Telephone (FAST®)
1-800-544-5555
Press
For mutual fund and brokerage trading.
For quotes.*
For account balances and holdings.
To review orders and mutual
fund activity.
To change your PIN.
To speak to a Fidelity representative.
By PC
Fidelity's web site on the Internet provides a wide range of information, including daily financial news, fund performance, interactive planning tools and news about Fidelity products and services.
(computer_graphic)
Fidelity's Web Site
www.fidelity.com
* When you call the quotes line, please remember that a fund's yield and return will vary and, except for money market funds, share price will also vary. This means that you may have a gain or loss when you sell your shares. There is no assurance that money market funds will be able to maintain a stable $1 share price; an investment in a money market fund is not insured or guaranteed by the U.S. government. Total returns are historical and include changes in share price, reinvestment of dividends and capital gains, and the effects of any sales charges.
Annual Report
To Visit Fidelity
For directions and hours,
please call 1-800-544-9797.
Arizona
7001 West Ray Road
Chandler, AZ
15445 N. Scottsdale Road
Scottsdale, AZ
17550 North 75th Avenue
Glendale, AZ
5330 E. Broadway Blvd
Tucson, AZ
California
815 East Birch Street
Brea, CA
1411 Chapin Avenue
Burlingame, CA
851 East Hamilton Avenue
Campbell, CA
601 Larkspur Landing Circle
Larkspur, CA
2000 Avenue of the Stars
Los Angeles, CA
27101 Puerta Real
Mission Viejo, CA
73575 El Paseo
Palm Desert, CA
251 University Avenue
Palo Alto, CA
123 South Lake Avenue
Pasadena, CA
16656 Bernardo Ctr. Drive
Rancho Bernardo, CA
1220 Roseville Parkway
Roseville, CA
1740 Arden Way
Sacramento, CA
7676 Hazard Center Drive
San Diego, CA
11943 El Camino Real
San Diego, CA
8 Montgomery Street
San Francisco, CA
3793 State Street
Santa Barbara, CA
1200 Wilshire Boulevard
Santa Monica, CA
398 West El Camino Real
Sunnyvale, CA
111 South Westlake Blvd
Thousand Oaks, CA
21701 Hawthorne Boulevard
Torrance, CA
2001 North Main Street
Walnut Creek, CA
6326 Canoga Avenue
Woodland Hills, CA
2211 Michelson Drive
Irvine, CA
Colorado
281 East Flatiron Circle
Broomfield, CO
1625 Broadway
Denver, CO
9185 Westview Road
Lone Tree, CO
Connecticut
48 West Putnam Avenue
Greenwich, CT
265 Church Street
New Haven, CT
300 Atlantic Street
Stamford, CT
29 South Main Street
West Hartford, CT
1261 Post Road
Fairfield, CT
Delaware
400 Delaware Avenue
Wilmington, DE
Florida
175 East Altamonte Drive
Altamonte Springs, FL
1400 Glades Road
Boca Raton, FL
121 Alhambra Plaza
Coral Gables, FL
2948 N. Federal Highway
Ft. Lauderdale, FL
4671 Town Center Parkway
Jacksonville, FL
8880 Tamiami Trail, North
Naples, FL
230 Royal Palm Way
Palm Beach, FL
3501 PGA Boulevard
Palm Beach Gardens, FL
3550 Tamiami Trail, South
Sarasota, FL
1502 N. Westshore Blvd.
Tampa, FL
2465 State Road 7
Wellington, FL
Georgia
3242 Peachtree Road
Atlanta, GA
1000 Abernathy Road
Atlanta, GA
Illinois
One North LaSalle Street
Chicago, IL
401 North Michigan Avenue
Chicago, IL
One Skokie Valley Road
Highland Park, IL
1415 West 22nd Street
Oak Brook, IL
15105 S LaGrange Road
Orland Park, IL
1572 East Golf Road
Schaumburg, IL
1823 Freedom Drive
Naperville, IL
Indiana
8480 Keystone Crossing
Indianapolis, IN
Kansas
5400 College Boulevard
Overland Park, KS
Maine
Three Canal Plaza
Portland, ME
Maryland
7315 Wisconsin Avenue
Bethesda, MD
610 York Road
Towson, MD
Massachusetts
801 Boylston Street
Boston, MA
155 Congress Street
Boston, MA
300 Granite Street
Braintree, MA
44 Mall Road
Burlington, MA
238 Main Street
Cambridge, MA
200 Endicott Street
Danvers, MA
Fidelity Brokerage Services, Inc., 100 Summer St., Boston, MA 02110 Member NYSE/SIPC
Annual Report
405 Cochituate Road
Framingham, MA
551 Boston Turnpike
Shrewsbury, MA
Michigan
500 E. Eisenhower Pkwy.
Ann Arbor, MI
280 N. Old Woodward Ave.
Birmingham, MI
30200 Northwestern Hwy.
Farmington Hills, MI
43420 Grand River Avenue
Novi, MI
3480 28th Street
Grand Rapids, MI
2425 S. Linden Road STE E
Flint, MI
Minnesota
7740 France Avenue South
Edina, MN
8342 3rd Street North
Oakdale, MN
Missouri
1524 South Lindbergh Blvd.
St. Louis, MO
Nevada
2225 Village Walk Drive
Henderson, NV
New Jersey
501 Route 73 South
Marlton, NJ
150 Essex Street
Millburn, NJ
35 Morris Street
Morristown, NJ
396 Route 17, North
Paramus, NJ
3518 Route 1 North
Princeton, NJ
530 Broad Street
Shrewsbury, NJ
New Mexico
2261 Q Street NE
Albuquerque, NM
New York
1130 Franklin Avenue
Garden City, NY
37 West Jericho Turnpike
Huntington Station, NY
1271 Avenue of the Americas
New York, NY
980 Madison Avenue
New York, NY
61 Broadway
New York, NY
350 Park Avenue
New York, NY
200 Fifth Avenue
New York, NY
733 Third Avenue
New York, NY
2070 Broadway
New York, NY
1075 Northern Blvd.
Roslyn, NY
799 Central Park Avenue
Scarsdale, NY
3349 Monroe Avenue
Rochester, NY
North Carolina
4611 Sharon Road
Charlotte, NC
7011 Fayetteville Road
Durham, NC
Ohio
3805 Edwards Road
Cincinnati, OH
1324 Polaris Parkway
Columbus, OH
1800 Crocker Road
Westlake, OH
28699 Chagrin Boulevard
Woodmere Village, OH
Oregon
7493 SW Bridgeport Road
Tigard, OR
Pennsylvania
600 West DeKalb Pike
King of Prussia, PA
1735 Market Street
Philadelphia, PA
12001 Perry Highway
Wexford, PA
Rhode Island
10 Memorial Boulevard
Providence, RI
Tennessee
3018 Peoples Street
Johnson City, TN
7628 West Farmington Blvd.
Germantown, TN
2035 Mallory Lane
Franklin, TN
Texas
10000 Research Boulevard
Austin, TX
4001 Northwest Parkway
Dallas, TX
12532 Memorial Drive
Houston, TX
2701 Drexel Drive
Houston, TX
6560 Fannin Street
Houston, TX
1701 Lake Robbins Drive
The Woodlands, TX
6500 N. MacArthur Blvd.
Irving, TX
6005 West Park Boulevard
Plano, TX
1576 East Southlake Blvd.
Southlake, TX
15600 Southwest Freeway
Sugar Land, TX
139 N. Loop 1604 East
San Antonio, TX
Utah
279 West South Temple
Salt Lake City, UT
Virginia
1861 International Drive
McLean, VA
11957 Democracy Drive
Reston, VA
Washington
10500 NE 8th Street
Bellevue, WA
1518 6th Avenue
Seattle, WA
304 Strander Blvd
Tukwila, WA
Washington, DC
1900 K Street, N.W.
Washington, DC
Wisconsin
16020 West Bluemound Road
Brookfield, WI
Annual Report
To Write Fidelity
We'll give your correspondence immediate attention and send you written confirmation upon completion of your request.
(letter_graphic)
Making Changes
To Your Account
(such as changing name, address, bank, etc.)
Fidelity Investments
P.O. Box 770001
Cincinnati, OH 45277-0002
(letter_graphic)
For Non-Retirement
Accounts
Buying shares
Fidelity Investments
P.O. Box 770001
Cincinnati, OH 45277-0003
Overnight Express
Fidelity Investments
Attn: Distribution Services
100 Crosby Parkway - KC1H
Covington, KY 41015
Selling shares
Fidelity Investments
P.O. Box 770001
Cincinnati, OH 45277-0035
Overnight Express
Fidelity Investments
Attn: Distribution Services
100 Crosby Parkway - KC1H
Covington, KY 41015
General Correspondence
Fidelity Investments
P.O. Box 500
Merrimack, NH 03054-0500
(letter_graphic)
For Retirement
Accounts
Buying shares
Fidelity Investments
P.O. Box 770001
Cincinnati, OH 45277-0003
Selling shares
Fidelity Investments
P.O. Box 770001
Cincinnati, OH 45277-0035
Overnight Express
Fidelity Investments
Attn: Distribution Services
100 Crosby Parkway - KC1H
Covington, KY 41015
General Correspondence
Fidelity Investments
P.O. Box 500
Merrimack, NH 03054-0500
Annual Report
Investment Adviser
Fidelity Management & Research Company
Boston, MA
Investment Sub-Advisers
FMR Co., Inc.
Fidelity Management & Research
(U.K.) Inc.
Fidelity Research & Analysis Company
Fidelity Management & Research
(Hong Kong) Limited
Fidelity Management & Research
(Japan) Inc.
General Distributor
Fidelity Distributors Corporation
Boston, MA
Transfer and Service Agents
Fidelity Investments Institutional
Operations Company, Inc.
Boston, MA
Fidelity Service Company, Inc.
Boston, MA
Custodian
JPMorgan Chase Bank, N.A.
New York, NY
The Fidelity Telephone Connection
Mutual Fund 24-Hour Service
Exchanges/Redemptions
and Account Assistance 1-800-544-6666
Product Information 1-800-544-6666
Retirement Accounts 1-800-544-4774
(8 a.m. - 9 p.m.)
TDD Service 1-800-544-0118
for the deaf and hearing impaired
(9 a.m. - 9 p.m. Eastern time)
Fidelity Automated Service
Telephone (FAST®) 1-800-544-5555
Automated line for quickest service
FSS-UANN-1210
1.784780.107
Fidelity®
Stock Selector All Cap Fund -
Class K
(formerly Fidelity Stock Selector)
Annual Report
October 31, 2010
(2_fidelity_logos) (Registered_Trademark)
Contents
Chairman's Message | <Click Here> | The Chairman's message to shareholders. |
Performance | <Click Here> | How the fund has done over time. |
Management's Discussion of Fund Performance | <Click Here> | The Portfolio Managers' review of fund performance and strategy. |
Shareholder Expense Example | <Click Here> | An example of shareholder expenses. |
Investment Changes | <Click Here> | A summary of major shifts in the fund's investments over the past six months. |
Investments | <Click Here> | A complete list of the fund's investments with their market values. |
Financial Statements | <Click Here> | Statements of assets and liabilities, operations, and changes in net assets, as well as financial highlights. |
Notes | <Click Here> | Notes to the financial statements. |
Report of Independent Registered Public Accounting Firm | <Click Here> | |
Trustees and Officers | <Click Here> | |
Distributions | <Click Here> | |
Board Approval of Investment Advisory Contracts and Management Fees | <Click Here> | |
To view a fund's proxy voting guidelines and proxy voting record for the 12-month period ended June 30, visit http://www.fidelity.com/proxyvotingresults or visit the Securities and Exchange Commission's (SEC) web site at http://www.sec.gov. You may also call 1-800-835-5092 to request a free copy of the proxy voting guidelines.
Standard & Poor's, S&P and S&P 500 are registered service marks of The McGraw-Hill Companies, Inc. and have been licensed for use by Fidelity Distributors Corporation.
Other third party marks appearing herein are the property of their respective owners.
All other marks appearing herein are registered or unregistered trademarks or service marks of FMR LLC or an affiliated company.
Annual Report
This report and the financial statements contained herein are submitted for the general information of the shareholders of the fund. This report is not authorized for distribution to prospective investors in the fund unless preceded or accompanied by an effective prospectus.
A fund files its complete schedule of portfolio holdings with the SEC for the first and third quarters of each fiscal year on Form N-Q. Forms N-Q are available on the SEC's web site at http://www.sec.gov. A fund's Forms N-Q may be reviewed and copied at the SEC's Public Reference Room in Washington, DC. Information regarding the operation of the SEC's Public Reference Room may be obtained by calling 1-800-SEC-0330. For a complete list of a fund's portfolio holdings, view the most recent holdings listing, semiannual report, or annual report on Fidelity's web site at http://www.fidelity.com or http://www.advisor.fidelity.com, as applicable.
NOT FDIC INSURED • MAY LOSE VALUE • NO BANK GUARANTEE
Neither the fund nor Fidelity Distributors Corporation is a bank.
Annual Report
(photo_of_Edward_C_Johnson_3d)
Dear Shareholder:
Equities have staged a rally in the second half of 2010, shaking off concerns about the European debt crisis and the possibility of a double-dip recession in the U.S. Although the short-term surge pushed major equity indexes back into positive territory for the year, several questions remain about the longer-term outlook, including lackluster economic growth and persistently high unemployment. Financial markets are always unpredictable, of course, but there also are several time-tested investment principles that can help put the odds in your favor.
One of the basic tenets is to invest for the long term. Over time, riding out the markets' inevitable ups and downs has proven much more effective than selling into panic or chasing the hottest trend. Even missing only a few of the markets' best days can significantly diminish investor returns. Patience also affords the benefits of compounding - of earning interest on additional income or reinvested dividends and capital gains. There can be tax advantages and cost benefits to consider as well. While staying the course doesn't eliminate risk, it can considerably lessen the effect of short-term declines.
You can further manage your investing risk through diversification. And today, more than ever, geographic diversification should be taken into account. Studies indicate that asset allocation is the single most important determinant of a portfolio's long-term success. The right mix of stocks, bonds and cash - aligned to your particular risk tolerance and investment objective - is very important. Age-appropriate rebalancing is also an essential aspect of asset allocation. For younger investors, an emphasis on equities - which historically have been the best-performing asset class over time - is encouraged. As investors near their specific goal, such as retirement or sending a child to college, consideration may be given to replacing volatile assets (e.g. common stocks) with more-stable fixed investments (bonds or savings plans).
A third principle - investing regularly - can help lower the average cost of your purchases. Investing a certain amount of money each month or quarter helps ensure you won't pay for all your shares at market highs. This strategy - known as dollar cost averaging - also reduces "emotion" from investing, helping shareholders avoid selling weak performers just prior to an upswing, or chasing a hot performer just before a correction.
We invite you to contact us via the Internet, through our Investor Centers or by phone. It is our privilege to provide you the information you need to make the investments that are right for you.
Sincerely,
(The chairman's signature appears here.)
Edward C. Johnson 3d
Annual Report
Average annual total return reflects the change in the value of an investment, assuming reinvestment of the class' distributions from dividend income and capital gains (the profits earned upon the sale of securities that have grown in value, if any) and assuming a constant rate of performance each year. The $10,000 table and the fund's returns do not reflect the deduction of taxes that a shareholder would pay on fund distributions or the redemption of fund shares. During periods of reimbursement by Fidelity, a fund's total return will be greater than it would be had the reimbursement not occurred. How a fund did yesterday is no guarantee of how it will do tomorrow.
Average Annual Total Returns
Periods ended October 31, 2010 | Past 1
year | Past 5
years | Past 10
years |
Class KA | 19.54% | 1.74% | 0.01% |
A The initial offering of Class K shares took place on May 9, 2008. Returns prior to May 9, 2008 are those of Fidelity Stock Selector All Cap Fund, the original class of the fund.
$10,000 Over 10 Years
Let's say hypothetically that $10,000 was invested in Fidelity Stock Selector All Cap Fund - Class K on October 31, 2000. The chart shows how the value of your investment would have changed, and also shows how the S&P 500® Index performed over the same period. The initial offering of Class K took place on May 9, 2008. See above for additional information regarding the performance of Class K.
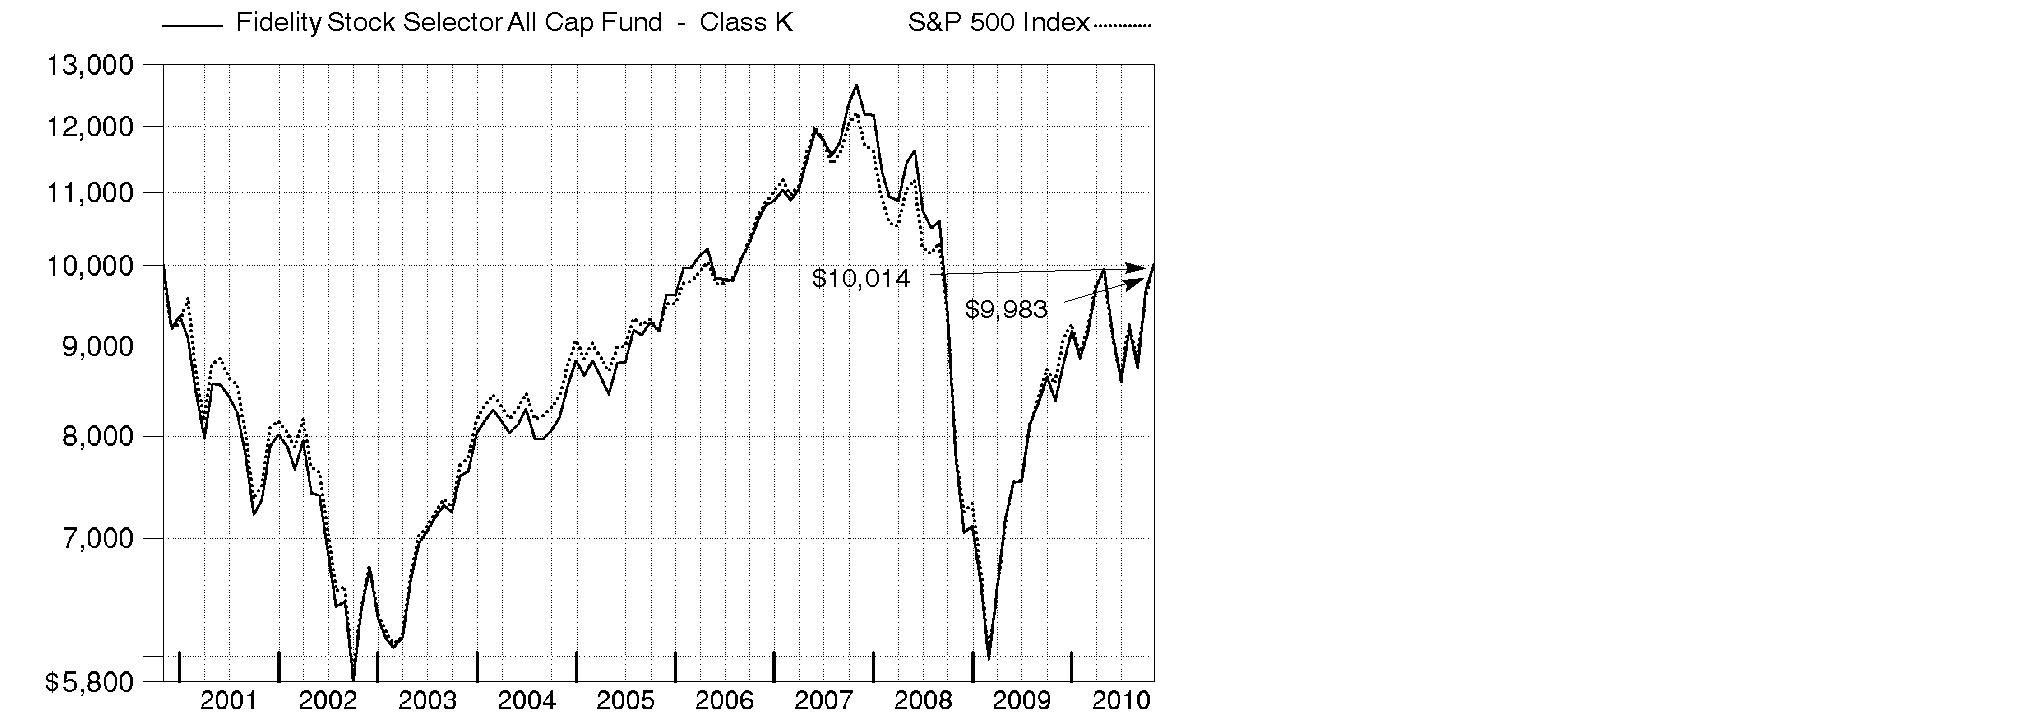
Annual Report
Market Recap: Amid bouts of volatility, major U.S. stock market indexes recorded double-digit gains for the year ending October 31, 2010, lifted by economic optimism, encouraging earnings reports and a wave of corporate mergers. Aside from a January dip, stocks trended upward for the first half of the period amid indications the Great Recession was over. However, in April, lingering high unemployment and heightened concern over European debt sent equities falling. Markets regrouped in July, but fell again in August on mixed economic data. The final two months of the period brought renewed optimism, with the large-cap S&P 500® Index posting its best September/October performance since 1998. For the full 12 months, the S&P 500® rose 16.52%, while the blue-chip-laden Dow Jones Industrial AverageSM added 17.62% and the technology-heavy Nasdaq Composite® Index rose 23.72%. Among market segments, all 10 sectors in the S&P 500 posted gains, with more than half outperforming the broad-market index. Stocks of mid- and small-sized companies surged, with the Russell Midcap® Index adding 27.71% and Russell 2000® Index climbing 26.58%. Looking abroad, debt problems in several European countries cooled gains in developed markets, and yet the MSCI® EAFE® (Europe, Australasia, Far East) Index still rose 8.49%.
Comments from Geoff Stein and Christopher Sharpe, Co-Portfolio Managers of Fidelity® Stock Selector All Cap Fund: The fund's Class K shares advanced 19.54% for the year, substantially outperforming the S&P 500. The fund adopted a multi-manager investment approach at the beginning of the period and moved from individual equity holdings to a central fund structure, allocating assets in a sector-neutral manner among Fidelity's sector specialists. During the period, strong stock selection fueled the fund's outperformance. Eight of the 10 underlying equity sector central funds outperformed their respective components of the S&P 500, with consumer staples lagging modestly and financials trailing by a larger margin. Stock selection in information technology contributed the most, followed by stock picks in health care, consumer discretionary, industrials, materials and utilities. Market positioning in consumer discretionary also helped. Security selection in financials was the primary detractor by far. In terms of individual holdings, underweighting several poor-performing stocks - such as Exxon Mobil, Bank of America, Wells Fargo and Hewlett-Packard - was most beneficial, as was an overweighting in power tool maker Black & Decker. On the downside, a non-index position in regional bank Synovus Financial and an overweighting in regional bank Marshall & Ilsley were among the principal detractors.
The views expressed above reflect those of the portfolio manager(s) only through the end of the period as stated on the cover of this report and do not necessarily represent the views of Fidelity or any other person in the Fidelity organization. Any such views are subject to change at any time based upon market or other conditions and Fidelity disclaims any responsibility to update such views. These views may not be relied on as investment advice and, because investment decisions for a Fidelity fund are based on numerous factors, may not be relied on as an indication of trading intent on behalf of any Fidelity fund.
Annual Report
Shareholder Expense Example
The Fund invests in Fidelity Central Funds, which are open-end investment companies with similar investment objectives to those of the Fund, available only to other mutual funds and accounts managed by Fidelity Management & Research Company, (FMR) and its affiliates. In addition to the direct expenses incurred by the Fund presented in the table, as a shareholder of the underlying Fidelity Central Funds, the Fund also indirectly bears its proportionate share of the expenses of the underlying Fidelity Central Funds. These expenses are not included in the Fund's annualized expense ratio used to calculate either the actual or hypothetical expense estimates presented in the table but are summarized in a footnote to the table.
As a shareholder of the Fund, you incur two types of costs: (1) transaction costs, and (2) ongoing costs, including management fees and other Fund expenses. This Example is intended to help you understand your ongoing costs (in dollars) of investing in the Fund and to compare these costs with the ongoing costs of investing in other mutual funds.
The Example is based on an investment of $1,000 invested at the beginning of the period and held for the entire period (May 1, 2010 to October 31, 2010).
Actual Expenses
The first line of the accompanying table for each class of the Fund provides information about actual account values and actual expenses. You may use the information in this line, together with the amount you invested, to estimate the expenses that you paid over the period. Simply divide your account value by $1,000.00 (for example, an $8,600 account value divided by $1,000.00 = 8.6), then multiply the result by the number in the first line for a class of the Fund under the heading entitled "Expenses Paid During Period" to estimate the expenses you paid on your account during this period. A small balance maintenance fee of $12.00 that is charged once a year may apply for certain accounts with a value of less than $2,000. This fee is not included in the table below. If it was, the estimate of expenses you paid during the period would be higher, and your ending account value lower, by this amount. In addition, the Fund, as a shareholder in the underlying Fidelity Central Funds, will indirectly bear its pro-rata share of the fees and expenses incurred by the underlying Fidelity Central Funds. These fees and expenses are not included in the Fund's annualized expense ratio used to calculate the expense estimate in the table below.
Hypothetical Example for Comparison Purposes
The second line of the accompanying table for each class of the Fund provides information about hypothetical account values and hypothetical expenses based on a Class' actual expense ratio and an assumed rate of return of 5% per year before expenses, which is not the Class' actual return. The hypothetical account values and expenses may not be used to estimate the actual ending account balance or expenses you paid for the period. You may use this information to compare the ongoing costs of investing in the Fund and other funds. To do so, compare this 5% hypothetical example with the 5% hypothetical examples that appear in the shareholder reports of the other funds. A small balance maintenance fee of $12.00 that is charged once a year may apply for certain accounts with a value of less than $2,000. This fee is not included in the table below. If it was, the estimate of expenses you paid during the period would be higher, and your ending account value lower, by this amount. In addition, the Fund, as a shareholder in the underlying Fidelity Central Funds, will indirectly bear its pro-rata share of the fees and expenses incurred by the underlying Fidelity Central Funds. These fees and expenses are not included in the Fund's annualized expense ratio used to calculate the expense estimate in the table below.
Annual Report
Please note that the expenses shown in the table are meant to highlight your ongoing costs only and do not reflect any transaction costs. Therefore, the second line of the table is useful in comparing ongoing costs only, and will not help you determine the relative total costs of owning different funds.
| Annualized
Expense Ratio | Beginning
Account Value
May 1, 2010 | Ending
Account Value
October 31, 2010 | Expenses Paid
During Period*
May 1, 2010
to October 31, 2010 |
Stock Selector All Cap | .86% | | | |
Actual | | $ 1,000.00 | $ 1,005.90 | $ 4.35 |
HypotheticalA | | $ 1,000.00 | $ 1,020.87 | $ 4.38 |
Class K | .65% | | | |
Actual | | $ 1,000.00 | $ 1,006.80 | $ 3.29 |
HypotheticalA | | $ 1,000.00 | $ 1,021.93 | $ 3.31 |
A 5% return per year before expenses
* Expenses are equal to each Class' annualized expense ratio, multiplied by the average account value over the period, multiplied by 184/365 (to reflect the one-half year period). The fees and expenses of the underlying Fidelity Central Funds in which the Fund invests are not included in the Fund's annualized expense ratio. In addition to the expenses noted above, the Fund also indirectly bears its proportional share of the expenses of the underlying Fidelity Central Funds. Annualized expenses of the underlying Fidelity Central Funds as of their most recent fiscal half year ranged from less than .01% to .01%.
Annual Report
Investment Changes (Unaudited)
The information in the following tables is based on the combined investments of the Fund and its pro-rata share of investments of Fidelity's Equity Central Funds. |
Top Ten Stocks as of October 31, 2010 |
| % of fund's
net assets | % of fund's net assets
6 months ago |
Apple, Inc. | 2.5 | 2.1 |
Exxon Mobil Corp. | 2.2 | 1.0 |
Google, Inc. Class A | 1.6 | 0.5 |
Procter & Gamble Co. | 1.6 | 1.4 |
The Coca-Cola Co. | 1.4 | 1.2 |
General Electric Co. | 1.3 | 1.1 |
Visa, Inc. Class A | 1.2 | 0.1 |
Comerica, Inc. | 1.2 | 0.0 |
Chevron Corp. | 1.2 | 0.7 |
Citigroup, Inc. | 0.9 | 0.4 |
| 15.1 | |
Top Five Market Sectors as of October 31, 2010 |
| % of fund's
net assets | % of fund's net assets
6 months ago |
Information Technology | 18.9 | 18.5 |
Financials | 15.0 | 15.7 |
Health Care | 11.4 | 11.8 |
Consumer Staples | 11.1 | 10.8 |
Energy | 11.0 | 10.5 |
Foreign investments | 12.9% | 13.2% |
Annual Report
Investment Summary (Unaudited)
The information in the following table is based on direct investments of the Fund. |
Fund Holdings as of October 31, 2010 |
| % of fund's
net assets |
Equity Central Funds | |
Fidelity Financials Central Fund | 17.2 |
Fidelity Information Technology Central Fund | 16.8 |
Fidelity Consumer Staples Central Fund | 11.7 |
Fidelity Health Care Central Fund | 11.6 |
Fidelity Energy Central Fund | 11.4 |
Fidelity Industrials Central Fund | 10.7 |
Fidelity Consumer Discretionary Central Fund | 9.8 |
Fidelity Materials Central Fund | 3.9 |
Fidelity Utilities Central Fund | 3.8 |
Fidelity Telecom Services Central Fund | 3.2 |
Total Equity Central Funds | 100.1 |
Net Other Assets (Liabilities) | (0.1) |
Total | 100.0 |
A holdings listed for the Fund, which presents direct holdings as well as the pro-rata share of any securities and other investments in non-money market Fidelity Central Funds, is available at fidelity.com.
Annual Report
Investments October 31, 2010
Showing Percentage of Net Assets
Equity Central Funds - 100.1% |
| Shares | | Value (000s) |
Fidelity Consumer Discretionary Central Fund (a) | 625,080 | | $ 74,778 |
Fidelity Consumer Staples Central Fund (a) | 693,097 | | 89,784 |
Fidelity Energy Central Fund (a) | 829,663 | | 87,413 |
Fidelity Financials Central Fund (a) | 2,417,087 | | 131,393 |
Fidelity Health Care Central Fund (a) | 769,804 | | 89,020 |
Fidelity Industrials Central Fund (a) | 638,541 | | 81,823 |
Fidelity Information Technology Central Fund (a) | 791,994 | | 128,715 |
Fidelity Materials Central Fund (a) | 192,849 | | 29,438 |
Fidelity Telecom Services Central Fund (a) | 209,377 | | 24,748 |
Fidelity Utilities Central Fund (a) | 289,799 | | 29,073 |
TOTAL INVESTMENT PORTFOLIO - 100.1% (Cost $701,483) | 766,185 |
NET OTHER ASSETS (LIABILITIES) - (0.1)% | | (513) |
NET ASSETS - 100% | $ 765,672 |
Legend |
(a) Affiliated fund that is available only to investment companies and other accounts managed by Fidelity Investments. A complete unaudited schedule of portfolio holdings for each Fidelity Central Fund is filed with the SEC for the first and third quarters of each fiscal year on Form N-Q and is available upon request or at the SEC's web site at www.sec.gov. An unaudited holdings listing for the Fund, which presents direct holdings as well as the pro rata share of securities and other investments held indirectly through its investment in underlying non-money market Fidelity Central Funds, is available at fidelity.com. In addition, each Fidelity Central Fund's financial statements, which are not covered by the Fund's Report of Independent Registered Public Accounting Firm, are available on the SEC's web site or upon request. |
Affiliated Central Funds |
Information regarding fiscal year to date income earned by the Fund from investments in Fidelity Central Funds is as follows: |
Fund | Income earned
(Amounts in thousands) |
Fidelity Cash Central Fund | $ 22 |
Fidelity Consumer Discretionary Central Fund | 330 |
Fidelity Consumer Staples Central Fund | 928 |
Fidelity Energy Central Fund | 448 |
Fidelity Financials Central Fund | 617 |
Fidelity Health Care Central Fund | 341 |
Fidelity Industrials Central Fund | 432 |
Fidelity Information Technology Central Fund | 175 |
Fidelity Materials Central Fund | 636 |
Fidelity Securities Lending Cash Central Fund | 21 |
Fidelity Telecom Services Central Fund | 297 |
Fidelity Utilities Central Fund | 351 |
Total | $ 4,598 |
Additional information regarding the Fund's fiscal year to date purchases and sales, including the ownership percentage, of the non Money Market Central Funds is as follows: |
Fund
(Amounts in thousands) | Value, beginning of period | Purchases* | Sales
Proceeds | Value, end of period | % ownership, end of period |
Fidelity Consumer Discretionary Central Fund | $ - | $ 64,425 | $ 1,150 | $ 74,778 | 11.7% |
Fidelity Consumer Staples Central Fund | - | 88,121 | 5,027 | 89,784 | 14.1% |
Fidelity Energy Central Fund | - | 88,082 | 3,032 | 87,413 | 13.3% |
Fidelity Financials Central Fund | - | 153,124 | 5,497 | 131,393 | 12.7% |
Fidelity Health Care Central Fund | - | 86,337 | 5,749 | 89,020 | 12.4% |
Fidelity Industrials Central Fund | - | 72,650 | 2,490 | 81,823 | 12.0% |
Fidelity Information Technology Central Fund | - | 109,816 | 14,568 | 128,715 | 12.3% |
Fidelity Materials Central Fund | - | 25,445 | 129 | 29,438 | 12.1% |
Fidelity Telecom Services Central Fund | - | 23,396 | 463 | 24,748 | 13.6% |
Fidelity Utilities Central Fund | - | 25,629 | 19 | 29,073 | 12.7% |
Total | $ 0 | $ 737,025 | $ 38,124 | $ 766,185 | |
* Includes in-kind transactions. See Note 2 of the Notes to Financial Statements. |
Other Information |
All investments are categorized as Level 1 under the Fair Value Hierarchy. The inputs or methodology used for valuing securities may not be an indication of the risk associated with investing in those securities. For more information on valuation inputs, please refer to the Security Valuation section in the accompanying Notes to Financial Statements. |
The information in the following table is based on the combined investment of the Fund and its pro-rata share of the investments of Fidelity Equity Central Funds. |
Distribution of investments by country of issue, as a percentage of total net assets, is as follows: (Unaudited) |
United States of America | 87.1% |
United Kingdom | 1.6% |
Switzerland | 1.3% |
Ireland | 1.3% |
Others (Individually Less Than 1%) | 8.7% |
| 100.0% |
Income Tax Information |
At October 31, 2010, the Fund had a capital loss carryforward of approximately $194,202,000 of which $59,231,000 and $134,971,000 will expire on October 31, 2016 and 2017, respectively. Capital loss carryforwards are only available to offset future capital gains of the Fund to the extent provided by regulations and may be limited. |
See accompanying notes which are an integral part of the financial statements.
Annual Report
Statement of Assets and Liabilities
Amounts in thousands (except per-share amounts) | October 31, 2010 |
| | |
Assets | | |
Investments in Fidelity Central Funds (cost $701,483) | �� | $ 766,185 |
Cash | | 1 |
Receivable for investments sold | | 4 |
Receivable for fund shares sold | | 483 |
Dividends receivable | | 28 |
Other receivables | | 12 |
Total assets | | 766,713 |
| | |
Liabilities | | |
Payable for investments purchased | $ 280 | |
Payable for fund shares redeemed | 219 | |
Accrued management fee | 316 | |
Transfer agent fee payable | 150 | |
Other affiliated payables | 23 | |
Other payables and accrued expenses | 53 | |
Total liabilities | | 1,041 |
| | |
Net Assets | | $ 765,672 |
Net Assets consist of: | | |
Paid in capital | | $ 899,851 |
Undistributed net investment income | | 2,732 |
Accumulated undistributed net realized gain (loss) on investments and foreign currency transactions | | (201,615) |
Net unrealized appreciation (depreciation) on investments | | 64,704 |
Net Assets | | $ 765,672 |
| | |
Stock Selector All Cap:
Net Asset Value, offering price and redemption price per share ($729,875 ÷ 30,823.6 shares) | | $ 23.68 |
| | |
Class K:
Net Asset Value, offering price and redemption price per share ($35,797 ÷ 1,510.2 shares) | | $ 23.70 |
See accompanying notes which are an integral part of the financial statements.
Annual Report
Statement of Operations
Amounts in thousands | Year ended October 31, 2010 |
| | |
Investment Income | | |
Dividends | | $ 6,486 |
Interest | | 2 |
Income from Fidelity Central Funds | | 4,598 |
Total income | | 11,086 |
| | |
Expenses | | |
Management fee
Basic fee | $ 3,938 | |
Performance adjustment | (153) | |
Transfer agent fees | 1,693 | |
Accounting and security lending fees | 255 | |
Custodian fees and expenses | 217 | |
Independent trustees' compensation | 4 | |
Registration fees | 53 | |
Audit | 63 | |
Legal | 4 | |
Miscellaneous | 10 | |
Total expenses before reductions | 6,084 | |
Expense reductions | (95) | 5,989 |
Net investment income (loss) | | 5,097 |
Realized and Unrealized Gain (Loss) Net realized gain (loss) on: | | |
Investment securities: | | |
Unaffiliated issuers | 81,776 | |
Fidelity Central Funds | 2,631 | |
Foreign currency transactions | (37) | |
Futures contracts | 2,460 | |
Total net realized gain (loss) | | 86,830 |
Change in net unrealized appreciation (depreciation) on: Investment securities | 23,282 | |
Assets and liabilities in foreign currencies | 1 | |
Total change in net unrealized appreciation (depreciation) | | 23,283 |
Net gain (loss) | | 110,113 |
Net increase (decrease) in net assets resulting from operations | | $ 115,210 |
See accompanying notes which are an integral part of the financial statements.
Annual Report
Financial Statements - continued
Statement of Changes in Net Assets
Amounts in thousands | Year ended
October 31,
2010 | Year ended
October 31,
2009 |
Increase (Decrease) in Net Assets | | |
Operations | | |
Net investment income (loss) | $ 5,097 | $ 4,559 |
Net realized gain (loss) | 86,830 | (132,880) |
Change in net unrealized appreciation (depreciation) | 23,283 | 155,498 |
Net increase (decrease) in net assets resulting
from operations | 115,210 | 27,177 |
Distributions to shareholders from net investment income | (4,230) | (7,570) |
Share transactions - net increase (decrease) | 80,564 | (179,204) |
Total increase (decrease) in net assets | 191,544 | (159,597) |
| | |
Net Assets | | |
Beginning of period | 574,128 | 733,725 |
End of period (including undistributed net investment income of $2,732 and undistributed net investment income of $3,441, respectively) | $ 765,672 | $ 574,128 |
See accompanying notes which are an integral part of the financial statements.
Annual Report
Financial Highlights - Stock Selector All Cap
Years ended October 31, | 2010 | 2009 | 2008 | 2007 | 2006 |
Selected Per-Share Data | | | | | |
Net asset value, beginning of period | $ 19.98 | $ 18.79 | $ 32.37 | $ 27.24 | $ 23.74 |
Income from Investment Operations | | | | | |
Net investment income (loss) B | .16 | .14 | .20 | .19 | .16 |
Net realized and unrealized gain (loss) | 3.69 | 1.27 | (12.14) | 5.10 | 3.46 |
Total from investment operations | 3.85 | 1.41 | (11.94) | 5.29 | 3.62 |
Distributions from net investment income | (.15) | (.22) | (.16) | (.13) | (.12) |
Distributions from net realized gain | - | - | (1.48) | (.03) | - |
Total distributions | (.15) | (.22) | (1.64) | (.16) | (.12) |
Net asset value, end of period | $ 23.68 | $ 19.98 | $ 18.79 | $ 32.37 | $ 27.24 |
Total ReturnA | 19.35% | 7.77% | (38.78)% | 19.52% | 15.29% |
Ratios to Average Net Assets C, E | | | | | |
Expenses before reductions | .87% | .87% | .93% | .87% | .88% |
Expenses net of fee waivers, if any | .87% | .87% | .93% | .87% | .88% |
Expenses net of all reductions | .86% | .87% | 93% | .87% | .87% |
Net investment income (loss) | .72% | .82% | .77% | .64% | .61% |
Supplemental Data | | | | | |
Net assets, end of period (in millions) | $ 730 | $ 552 | $ 698 | $ 1,005 | $ 853 |
Portfolio turnover rate D | 147% | 109% | 121% | 91% | 109% |
A Total returns would have been lower had certain expenses not been reduced during the periods shown.
B Calculated based on average shares outstanding during the period.
C Fees and expenses of the underlying Fidelity Central Funds are not included in the Fund's expense ratio. The Fund indirectly bears its proportionate share of the expenses of any underlying Fidelity Central Funds. Based on their most recent shareholder report date, the expenses ranged from less than .01% to .01%.
D Amount does not include the portfolio activity of any underlying Fidelity Central Funds.
E Expense ratios reflect operating expenses of the class. Expenses before reductions do not reflect amounts reimbursed by the investment adviser or reductions from brokerage service arrangements or reductions from other expense offset arrangements and do not represent the amount paid by the class during periods when reimbursements or reductions occur. Expenses net of fee waivers reflect expenses after reimbursement by the investment adviser but prior to reductions from brokerage service arrangements or other expense offset arrangements. Expenses net of all reductions represent the net expenses paid by the class.
See accompanying notes which are an integral part of the financial statements.
Annual Report
Financial Highlights - Class K
Years ended October 31, | 2010 | 2009 | 2008 G |
Selected Per-Share Data | | | |
Net asset value, beginning of period | $ 20.00 | $ 18.81 | $ 27.80 |
Income from Investment Operations | | | |
Net investment income (loss) D | .20 | .18 | .06 |
Net realized and unrealized gain (loss) | 3.69 | 1.27 | (9.05) |
Total from investment operations | 3.89 | 1.45 | (8.99) |
Distributions from net investment income | (.19) | (.26) | - |
Net asset value, end of period | $ 23.70 | $ 20.00 | $ 18.81 |
Total Return B, C | 19.54% | 8.00% | (32.34)% |
Ratios to Average Net AssetsE, H | | | |
Expenses before reductions | .68% | .65% | .79% A |
Expenses net of fee waivers, if any | .68% | .65% | .79% A |
Expenses net of all reductions | .66% | .65% | .78% A |
Net investment income (loss) | .91% | 1.04% | .63% A |
Supplemental Data | | | |
Net assets, end of period (in millions) | $ 36 | $ 22 | $ 35 |
Portfolio turnover rate F | 147% | 109% | 121% |
A Annualized
B Total returns for periods of less than one year are not annualized.
C Total returns would have been lower had certain expenses not been reduced during the periods shown.
D Calculated based on average shares outstanding during the period.
E Fees and expenses of the underlying Fidelity Central Funds are not included in the Fund's expense ratio. The Fund indirectly bears its proportionate share of the expenses of any underlying Fidelity Central Funds. Based on their most recent shareholder report date, the expenses ranged from less than .01% to .01%.
F Amount does not include the portfolio activity of any underlying Fidelity Central Funds.
G For the period May 9, 2008 (commencement of sale of shares) to October 31, 2008.
H Expense ratios reflect operating expenses of the class. Expenses before reductions do not reflect amounts reimbursed by the investment adviser or reductions from brokerage service arrangements or reductions from other expense offset arrangements and do not represent the amount paid by the class during periods when reimbursements or reductions occur. Expense ratios before reductions for start-up periods may not be representative of longer-term operating periods. Expenses net of fee waivers reflect expenses after reimbursement by the investment adviser but prior to reductions from brokerage service arrangements or other expense offset arrangements. Expenses net of all reductions represent the net expenses paid by the class.
See accompanying notes which are an integral part of the financial statements.
Annual Report
Notes to Financial Statements
For the period ended October 31, 2010
(Amounts in thousands except ratios)
1. Organization.
Fidelity Stock Selector All Cap (the Fund) (formerly Fidelity Stock Selector) is a fund of Fidelity Capital Trust (the Trust) and is authorized to issue an unlimited number of shares. The Trust is registered under the Investment Company Act of 1940, as amended (the 1940 Act), as an open-end management investment company organized as a Massachusetts business trust. The Fund offers Stock Selector All Cap and Class K Shares, each of which has equal rights as to assets and voting privileges. Each class has exclusive voting rights with respect to matters that affect that class. Investment income, realized and unrealized capital gains and losses, the common expenses of the Fund, and certain fund-level expense reductions, if any, are allocated on a pro-rata basis to each class based on the relative net assets of each class to the total net assets of the Fund. Each class differs with respect to transfer agent fees incurred. Certain expense reductions also differ by class.
2. Investment in Fidelity Central Funds.
The Fund invests in Fidelity Central Funds which are open-end investment companies available only to other investment companies and accounts managed by Fidelity Management & Research Company (FMR) and its affiliates. The Fund's Schedule of Investments lists each of the Fidelity Central Funds held as of period end as an investment of the Fund but does not include the underlying holdings of each Fidelity Central Fund. As an Investing Fund, the Fund indirectly bears its proportionate share of the expenses of the underlying Fidelity Central Funds.
During the period, the Fund exchanged securities for shares of 10 Fidelity Equity Central Funds ("Equity Central Funds") all of which are affiliated investment companies managed by FMR Co., Inc. (FMRC), an affiliate of FMR. Each of the Equity Central Funds seeks capital appreciation and invests primarily in securities of companies whose principal business activities fall within specific industries. The Fund delivered securities to each Equity Central Fund in exchange for shares of each respective Equity Central Fund, as presented in the accompanying table. The exchange with Telecom Services resulted in a realized gain of $1,495 and $1,475 to the Fund for Financial Statement and federal income tax purposes, respectively.
Annual Report
2. Investment in Fidelity Central Funds - continued
Fidelity Equity
Central Fund | Value of Securities
Delivered | Unrealized
Appreciation/
(Depreciation) | Shares of Equity
Central Fund Exchanged |
Consumer Discretionary | $ 66,653 | $ 4,794 | 611 |
Consumer Staples | 84,675 | (2,471) | 727 |
Energy | 81,481 | (3,429) | 827 |
Financials | 128,747 | (8,297) | 2,221 |
Health Care | 89,980 | 4,110 | 820 |
Industrials | 75,931 | 5,965 | 638 |
Information Technology | 126,191 | 16,948 | 894 |
Materials | 23,829 | 220 | 180 |
Telecom Services | 21,821 | (971) | 208 |
Utilities | 25,888 | 1,285 | 279 |
Total | $ 725,196 | $ 18,154 | 7,405 |
Based on their investment objectives, each Fidelity Central Fund may invest or participate in various investment vehicles or strategies that are similar to those of the Fund. These strategies are consistent with the investment objectives of the Fund and may involve certain economic risks which may cause a decline in the value of each of the Fidelity Central Funds and thus a decline in the value of the Fund. The following summarizes the Fund's investment in Fidelity Central Funds:
Fidelity
Central Fund | | Investment
Manager | | Investment Objective | | Investment Practices | | Expense Ratio* |
Fidelity Equity Central Funds | | FMRC | | Each fund seeks capital appreciation by investing primarily in common stocks, with a concentration in a particular industry. | | Foreign Securities Repurchase Agreements Restricted Securities | | Less than .01%
to .01% |
* Expenses expressed as a percentage of average net assets and are as of each underlying Central Fund's most recent annual or semi-annual shareholder report.
An unaudited holdings listing for the Fund, which presents direct holdings as well as the pro-rata share of any securities and other investments held indirectly through its investment in underlying non-money market Fidelity Central Funds, is available at fidelity.com. A complete unaudited list of holdings for each Fidelity Central Fund is available upon request or at the Securities and Exchange Commission (the SEC) web site at www.sec.gov. In addition, the financial statements of the Fidelity Central Funds which contain the significant accounting policies (including security valuation policies) of those funds are available on the SEC web site or upon request.
Annual Report
Notes to Financial Statements - continued
(Amounts in thousands except ratios)
3. Significant Accounting Policies.
The financial statements have been prepared in conformity with accounting principles generally accepted in the United States of America (GAAP), which require management to make certain estimates and assumptions at the date of the financial statements. Actual results could differ from those estimates. The following summarizes the significant accounting policies of the Fund:
Security Valuation. Investments are valued as of 4:00 p.m. Eastern time on the last calendar day of the period. The Fund categorizes the inputs to valuation techniques used to value its investments into a disclosure hierarchy consisting of three levels as shown below.
Level 1 - quoted prices in active markets for identical investments
Level 2 - other significant observable inputs (including quoted prices for similar investments, interest rates, prepayment speeds, etc.)
Level 3 - unobservable inputs (including the fund's own assumptions based on the best information available)
Valuation techniques used to value the Fund's investments by major category are as follows. Investments in open-end mutual funds, including the Fidelity Central Funds, are valued at their closing net asset value (NAV) each business day and are categorized as Level 1 in the hierarchy.
Investment Transactions and Income. For financial reporting purposes, the Fund's investment holdings and NAV include trades executed through the end of the last business day of the period. The NAV per share for processing shareholder transactions is calculated as of the close of business of the New York Stock Exchange (NYSE), normally 4:00 p.m. Eastern time and includes trades executed through the end of the prior business day. Gains and losses on securities sold are determined on the basis of identified cost and may include proceeds received from litigation. Dividend income is recorded on the ex-dividend date, except for certain dividends from foreign securities where the ex-dividend date may have passed, which are recorded as soon as the Fund is informed of the ex-dividend date. Non-cash dividends included in dividend income, if any, are recorded at the fair market value of the securities received. Distributions received on securities that represent a return of capital or capital gains are recorded as a reduction of cost of investments and/or as a realized gain. The Funds estimates the components of distributions received that may be considered return of capital distributions or capital gain distributions. Interest income and distributions from the Fidelity Central Funds are accrued as earned. Interest income includes coupon interest and amortization of premium and accretion of discount on debt securities. Investment income is recorded net of foreign taxes withheld where recovery of such taxes is uncertain.
Annual Report
3. Significant Accounting Policies - continued
Expenses. Most expenses of the Trust can be directly attributed to a fund. Expenses which cannot be directly attributed are apportioned amongst each fund in the Trust. Expense estimates are accrued in the period to which they relate and adjustments are made when actual amounts are known. Expenses included in the accompanying financial statements reflect the expenses of the Fund and do not include any expenses of Fidelity Central Funds. Although not included in the Fund's expenses, the Fund indirectly bears its proportionate share of the Fidelity Central Funds' expenses through the impact of these expenses on each Fidelity Central Fund's net asset value. Based on their most recent shareholder report date, expenses of the Fidelity Central Funds ranged from less than .01% to .01%.
Income Tax Information and Distributions to Shareholders. Each year the Fund intends to qualify as a regulated investment company, including distributing substantially all of its taxable income and realized gains under Subchapter M of the Internal Revenue Code and filing its U.S. federal tax return. As a result, no provision for income taxes is required. As of October 31, 2010, the Fund did not have any unrecognized tax benefits in the accompanying financial statements. A fund's federal tax return is subject to examination by the Internal Revenue Service (IRS) for a period of three years. Foreign taxes are provided for based on the Fund's understanding of the tax rules and rates that exist in the foreign markets in which it invests.
Distributions are declared and recorded on the ex-dividend date. Income dividends and capital gain distributions are declared separately for each class. Income and capital gain distributions are determined in accordance with income tax regulations, which may differ from GAAP.
Capital accounts within the financial statements are adjusted for permanent book-tax differences. These adjustments have no impact on net assets or the results of operations. Temporary book-tax differences will reverse in a subsequent period.
Book-tax differences are primarily due to the short-term gain distributions from the Fidelity Central Funds, futures transactions, foreign currency transactions, deferred trustees compensation, certain foreign taxes, passive foreign investment companies (PFIC), partnerships (including allocations from Fidelity Central Funds), capital loss carryforwards and losses deferred due to wash sales.
The federal tax cost of investment securities and unrealized appreciation (depreciation) as of period end were as follows:
Gross unrealized appreciation | $ 75,479 |
Gross unrealized depreciation | (18,190) |
Net unrealized appreciation (depreciation) | $ 57,289 |
| |
Tax Cost | $ 708,896 |
Annual Report
Notes to Financial Statements - continued
(Amounts in thousands except ratios)
3. Significant Accounting Policies - continued
Income Tax Information and Distributions to Shareholders - continued
The tax-based components of distributable earnings as of period end were as follows:
Undistributed ordinary income | $ 2,732 |
Capital loss carryforward | $ (194,202) |
Net unrealized appreciation (depreciation) | $ 57,291 |
The tax character of distributions paid was as follows:
| October 31, 2010 | October 31, 2009 |
Ordinary Income | $ 4,230 | $ 7,570 |
4. Derivative Instruments.
Risk Exposures and the Use of Derivative Instruments. The Fund uses derivative instruments (derivatives), including futures contract in order to meet its investment objectives. The strategy is to use derivatives to increase returns and to manage exposure to certain risks as defined below. The success of any strategy involving derivatives depends on analysis of numerous economic factors, and if the strategies for investment do not work as intended, the Fund may not achieve its objectives.
The Fund's use of derivatives may increase or decrease its exposure to the following risk:
Equity Risk | Equity risk relates to the fluctuations in the value of financial instruments as a result of changes in market prices (other than those arising from interest rate risk or foreign exchange risk), whether caused by factors specific to an individual investment, its issuer, or all factors affecting all instruments traded in a market or market segment. |
The Fund is also exposed to additional risks from investing in derivatives, such as liquidity risk and counterparty credit risk. Liquidity risk is the risk that the Fund will be unable to sell the derivative in the open market in a timely manner. Counterparty credit risk is the risk that the counterparty will not be able to fulfill its obligation to the Fund. The Fund's maximum risk of loss from counterparty credit risk is generally the aggregate unrealized appreciation and unpaid counterparty fees in excess of any collateral pledged by the counterparty to the Fund. Counterparty risk related to exchange-traded futures contracts is minimal because of the protection provided by the exchange on which they trade. Risk of loss may exceed the amounts recognized in the Statement of Assets and Liabilities.
Annual Report
4. Derivative Instruments - continued
Futures Contracts. A futures contract is an agreement between two parties to buy or sell a specified underlying instrument for a fixed price at a specified future date. The Fund uses futures contracts to manage its exposure to the stock market.
Upon entering into a futures contract, a fund is required to deposit either cash or securities (initial margin) with a clearing broker in an amount equal to a certain percentage of the face value of the contract. Futures contracts are marked-to-market daily and subsequent payments (variation margin) are made or received by a fund depending on the daily fluctuations in the value of the futures contracts and are recorded as unrealized appreciation or (depreciation). Realized gain or (loss) is recorded upon the expiration or closing of a futures contract.
The underlying face amount at value of open futures contracts at period end, if any, is shown in the Schedule of Investments under the caption "Futures Contracts." This amount reflects each contract's exposure to the underlying instrument at period end. Securities deposited to meet initial margin requirements are identified in the Schedule of Investments. The receivable and/or payable for the variation margin are reflected in the Statement of Assets and Liabilities.
Certain risks may arise upon entering into futures contracts, including the risk that an illiquid market may limit the ability to close out a futures contract prior to settlement date.
During the period the Fund recognized net realized gain (loss) of $2,460 related to its investment in futures contracts. This amount is included in the Statement of Operations.
5. Purchases and Sales of Investments.
Purchases and sales of securities including the Equity Central Funds, other than short-term securities, aggregated $1,092,718 and $1,001,922, respectively.
6. Fees and Other Transactions with Affiliates.
Management Fee. FMR and its affiliates provide the Fund with investment management related services for which the Fund pays a monthly management fee. The management fee is the sum of an individual fund fee rate that is based on an annual rate of .30% of the Fund's average net assets and a group fee rate that averaged .26% during the period. The group fee rate is based upon the average net assets of all the mutual funds advised by FMR. The group fee rate decreases as assets under management increase and increases as assets under management decrease. In addition, the management fee is subject to a performance adjustment (up to a maximum of ± .20% of the Fund's average net assets over a 36 month performance period). The upward or downward adjustment to the management fee is based on the relative investment performance of the Stock Selector All Cap share class as compared to an appropriate benchmark index.
Annual Report
Notes to Financial Statements - continued
(Amounts in thousands except ratios)
6. Fees and Other Transactions with Affiliates - continued
Management Fee - continued
For the period, the total annual management fee rate, including the performance adjustment, was .54% of the Fund's average net assets. FMR pays a portion of the management fees received from the Fund to the Fidelity Central Funds' investment advisers, who are also affiliates, for managing the assets of the Fidelity Central Funds.
Transfer Agent Fees. Fidelity Investments Institutional Operations Company, Inc. (FIIOC), an affiliate of FMR, is the transfer, dividend disbursing and shareholder servicing agent for each class of the Fund. FIIOC receives account fees and asset-based fees that vary according to the account size and type of account of the shareholders of Stock Selector All Cap. FIIOC receives an asset-based fee of Class K's average net assets. FIIOC pays for typesetting, printing and mailing of shareholder reports, except proxy statements. For the period, transfer agent fees for each class were as follows:
| Amount | % of
Average
Net Assets |
Stock Selector All Cap | 1,680 | .25 |
Class K | 13 | .05 |
| $ 1,693 | |
Accounting and Security Lending Fees. Fidelity Service Company, Inc. (FSC), an affiliate of FMR, maintains the Fund's accounting records. The accounting fee is based on the level of average net assets for the month. Under a separate contract, FSC administered the security lending program. The security lending fee was based on the number and duration of lending transactions.
Brokerage Commissions. The Fund placed a portion of its portfolio transactions with brokerage firms which are affiliates of the investment adviser. The commissions paid to these affiliated firms were $28 for the period.
7. Committed Line of Credit.
The Fund participates with other funds managed by FMR or an affiliate in a $3.75 billion credit facility (the "line of credit") to be utilized for temporary or emergency purposes to fund shareholder redemptions or for other short-term liquidity purposes. The Fund has agreed to pay commitment fees on its pro-rata portion of the line of credit, which amounted to $3 and is reflected in Miscellaneous expenses on the Statement of Operations. During the period, there were no borrowings on this line of credit.
Annual Report
8. Security Lending.
The Fund loaned portfolio securities from time to time in order to earn additional income. On the settlement date of the loan, the Fund receives collateral (in the form of U.S. Treasury obligations, letters of credit and/or cash) against the loaned securities and maintains collateral in an amount not less than 100% of the market value of the loaned securities during the period of the loan. The market value of the loaned securities is determined at the close of business of the Fund and any additional required collateral is delivered to the Fund on the next business day. If the borrower defaults on its obligation to return the securities loaned because of insolvency or other reasons, a fund could experience delays and costs in recovering the securities loaned or in gaining access to the collateral. Any cash collateral received is invested in the Fidelity Securities Lending Cash Central Fund. At period end, there were no security loans outstanding. Security lending income represents the income earned on investing cash collateral, less fees and expenses associated with the loan, plus any premium payments that may be received on the loan of certain types of securities. Security lending income is presented in the Statement of Operations as a component of income from Fidelity Central Funds. Net income from lending portfolio securities during the period amounted to $21.
9. Expense Reductions.
Many of the brokers with whom FMR places trades on behalf of the Fund and the Equity Central Funds provided services in addition to trade execution. These services included payments of certain expenses on behalf of the Fund totaling $95 for the period.
10. Distributions to Shareholders.
Distributions to shareholders of each class were as follows:
Years ended October 31, | 2010 | 2009 |
From net investment income | | |
Stock Selector All Cap | $ 4,028 | $ 7,152 |
Class K | 202 | 418 |
Total | $ 4,230 | $ 7,570 |
Annual Report
Notes to Financial Statements - continued
(Amounts in thousands except ratios)
11. Share Transactions.
Transactions for each class of shares were as follows:
| Shares | Dollars |
Years ended October 31, | 2010 | 2009 | 2010 | 2009 |
Stock Selector All Cap | | | | |
Shares sold | 9,171 | 2,210 | $ 203,020 | $ 37,596 |
Conversion to Class K A | - | (261) | - | (4,548) |
Reinvestment of distributions | 181 | 414 | 3,844 | 6,843 |
Shares redeemed | (6,135) | (11,919) | (134,933) | (206,868) |
Net increase (decrease) | 3,217 | (9,556) | $ 71,931 | $ (166,977) |
Class K | | | | |
Shares sold | 739 | 525 | $ 16,419 | $ 8,881 |
Conversion from Stock Selector A | - | 261 | - | 4,548 |
Reinvestment of distributions | 10 | 25 | 202 | 418 |
Shares redeemed | (363) | (1,571) | (7,988) | (26,074) |
Net increase (decrease) | 386 | (760) | $ 8,633 | $ (12,227) |
A Conversion transactions for Class K and Stock Selector are presented for the period November 1, 2008 through August 31, 2009.
12. Other.
The Fund's organizational documents provide former and current trustees and officers with a limited indemnification against liabilities arising in connection with the performance of their duties to the Fund. In the normal course of business, the Fund may also enter into contracts that provide general indemnifications. The Fund's maximum exposure under these arrangements is unknown as this would be dependent on future claims that may be made against the Fund. The risk of material loss from such claims is considered remote.
Annual Report
To the Trustees of Fidelity Capital Trust and Shareholders of Fidelity Stock Selector All Cap:
We have audited the accompanying statement of assets and liabilities of Fidelity Stock Selector All Cap (the Fund), previously Fidelity Stock Selector a fund of Fidelity Capital Trust, including the schedule of investments, as of October 31, 2010, and the related statement of operations for the year then ended, the statement of changes in net assets for each of the two years in the period then ended, and the financial highlights for each of the periods presented. These financial statements and financial highlights are the responsibility of the Fund's management. Our responsibility is to express an opinion on these financial statements and financial highlights based on our audits.
We conducted our audits in accordance with standards of the Public Company Accounting Oversight Board (United States). Those standards require that we plan and perform the audit to obtain reasonable assurance about whether the financial statements and financial highlights are free of material misstatement. The Fund is not required to have, nor were we engaged to perform, an audit of its internal control over financial reporting. Our audits included consideration of internal control over financial reporting as a basis for designing audit procedures that are appropriate in the circumstances, but not for the purpose of expressing an opinion on the effectiveness of the Fund's internal control over financial reporting. Accordingly, we express no such opinion. An audit also includes examining, on a test basis, evidence supporting the amounts and disclosures in the financial statements, assessing the accounting principles used and significant estimates made by management, as well as evaluating the overall financial statement presentation. Our procedures included confirmation of securities owned as of October 31, 2010, by correspondence with the transfer agent. We believe that our audits provide a reasonable basis for our opinion.
In our opinion, the financial statements and financial highlights referred to above present fairly, in all material respects, the financial position of Fidelity Stock Selector All Cap as of October 31, 2010, the results of its operations for the year then ended, the changes in its net assets for each of the two years in the period then ended, and the financial highlights for each of the periods presented, in conformity with accounting principles generally accepted in the United States of America.
/s/ Deloitte & Touche LLP
DELOITTE & TOUCHE LLP
Boston, Massachusetts
December 21, 2010
Annual Report
The Trustees, Member of the Advisory Board, and executive officers of the trust and fund, as applicable, are listed below. The Board of Trustees governs the fund and is responsible for protecting the interests of shareholders. The Trustees are experienced executives who meet periodically throughout the year to oversee the fund's activities, review contractual arrangements with companies that provide services to the fund, oversee management of the risks associated with such activities and contractual arrangements, and review the fund's performance. Except for James C. Curvey, each of the Trustees oversees 221 funds advised by FMR or an affiliate. Mr. Curvey oversees 410 funds advised by FMR or an affiliate.
The Trustees hold office without limit in time except that (a) any Trustee may resign; (b) any Trustee may be removed by written instrument, signed by at least two-thirds of the number of Trustees prior to such removal; (c) any Trustee who requests to be retired or who has become incapacitated by illness or injury may be retired by written instrument signed by a majority of the other Trustees; and (d) any Trustee may be removed at any special meeting of shareholders by a two-thirds vote of the outstanding voting securities of the trust.
Each Trustee who is not an interested person (as defined in the 1940 Act) (Independent Trustee), shall retire not later than the last day of the calendar year in which his or her 72nd birthday occurs. The Independent Trustees may waive this mandatory retirement age policy with respect to individual Trustees.
The executive officers and Advisory Board Member hold office without limit in time, except that any officer and Advisory Board Member may resign or may be removed by a vote of a majority of the Trustees at any regular meeting or any special meeting of the Trustees. Except as indicated, each individual has held the office shown or other offices in the same company for the past five years.
Experience, Skills, Attributes, and Qualifications of the Fund's Trustees. The Governance and Nominating Committee has adopted a statement of policy that describes the experience, qualifications, attributes, and skills that are necessary and desirable for potential Independent Trustee candidates (Statement of Policy). The Board believes that each Trustee satisfied at the time he or she was initially elected or appointed a Trustee, and continues to satisfy, the standards contemplated by the Statement of Policy. The Governance and Nominating Committee also engages professional search firms to help identify potential Independent Trustee candidates who have the experience, qualifications, attributes, and skills consistent with the Statement of Policy. From time to time, additional criteria based on the composition and skills of the current Independent Trustees, as well as experience or skills that may be appropriate in light of future changes to board composition, business conditions, and regulatory or other developments, have also been considered by the professional search firms and the Governance and Nominating Committee. In addition, the Board takes into account the Trustees' commitment and participation in Board and committee meetings, as well as their leadership of standing and ad hoc committees throughout their tenure.
Annual Report
In determining that a particular Trustee was and continues to be qualified to serve as a Trustee, the Board has considered a variety of criteria, none of which, in isolation, was controlling. The Board believes that, collectively, the Trustees have balanced and diverse experience, qualifications, attributes, and skills, which allow the Board to operate effectively in governing the fund and protecting the interests of shareholders. Information about the specific experience, skills, attributes, and qualifications of each Trustee, which in each case led to the Board's conclusion that the Trustee should serve (or continue to serve) as a trustee of the fund, is provided below.
Board Structure and Oversight Function. Edward C. Johnson 3d is an interested person (as defined in the 1940 Act) and currently serves as Chairman. The Trustees have determined that an interested Chairman is appropriate and benefits shareholders because an interested Chairman has a personal and professional stake in the quality and continuity of services provided to the fund. Independent Trustees exercise their informed business judgment to appoint an individual of their choosing to serve as Chairman, regardless of whether the Trustee happens to be independent or a member of management. The Independent Trustees have determined that they can act independently and effectively without having an Independent Trustee serve as Chairman and that a key structural component for assuring that they are in a position to do so is for the Independent Trustees to constitute a substantial majority for the Board. The Independent Trustees also regularly meet in executive session. Ned C. Lautenbach serves as Chairman of the Independent Trustees and as such (i) acts as a liaison between the Independent Trustees and management with respect to matters important to the Independent Trustees and (ii) with management prepares agendas for Board meetings.
Fidelity funds are overseen by different Boards of Trustees. The fund's Board oversees Fidelity's equity and high income funds and another Board oversees Fidelity's investment-grade bond, money market, and asset allocation funds. The asset allocation funds may invest in Fidelity funds overseen by the fund's Board. The use of separate Boards, each with its own committee structure, allows the Trustees of each group of Fidelity funds to focus on the unique issues of the funds they oversee, including common research, investment, and operational issues. On occasion, the separate Boards establish joint committees to address issues of overlapping consequences for the Fidelity funds overseen by each Board.
The Trustees operate using a system of committees to facilitate the timely and efficient consideration of all matters of importance to the Trustees, the fund, and fund shareholders and to facilitate compliance with legal and regulatory requirements and oversight of the fund's activities and associated risks. The Board, acting through its committees, has charged FMR and its affiliates with (i) identifying events or circumstances the occurrence of which could have demonstrably adverse effects on the fund's business and/or reputation; (ii) implementing processes and controls to lessen the possibility that such events or circumstances occur or to mitigate the effects of such events or circumstances if they do occur; and (iii) creating and maintaining a system designed to evaluate continuously business and market conditions in order to facilitate the identification and implementation processes described in (i) and (ii) above. Because the day-to-day operations and activities of the fund are carried out by or through FMR, its affiliates and other service providers, the fund's exposure to risks is mitigated but not eliminated by the processes overseen by the Trustees. While each of the Board's committees has responsibility for overseeing different aspects of the fund's activities, oversight is exercised primarily through the Operations, Audit, and Compliance Committees. Appropriate personnel, including but not limited to the fund's Chief Compliance Officer (CCO), FMR's internal auditor, the independent accountants, the fund's Treasurer and portfolio management personnel, make periodic reports to the Board's committees, as appropriate. The responsibilities of each committee, including their oversight responsibilities, are described further under "Standing Committees of the Fund's Trustees."
Annual Report
Trustees and Officers - continued
The fund's Statement of Additional Information (SAI) includes more information about the Trustees. To request a free copy, call Fidelity at 1-800-835-5092.
Interested Trustees*:
Correspondence intended for each Trustee who is an interested person may be sent to Fidelity Investments, 82 Devonshire Street, Boston, Massachusetts 02109.
Name, Age; Principal Occupations and Other Relevant Experience+ |
Edward C. Johnson 3d (80) |
| Year of Election or Appointment: 1978 Mr. Johnson is Trustee and Chairman of the Board of Trustees of certain Trusts. Mr. Johnson serves as Chief Executive Officer, Chairman, and a Director of FMR LLC; Chairman and a Director of FMR; Chairman and a Director of Fidelity Research & Analysis Company (FRAC); Chairman and a Director of Fidelity Investments Money Management, Inc.; and Chairman and a Director of FMR Co., Inc. In addition, Mr. Johnson serves as Chairman and Director of FIL Limited. Previously, Mr. Johnson served as President of FMR LLC (2006-2007). |
James C. Curvey (75) |
| Year of Election or Appointment: 2007 Mr. Curvey also serves as Trustee (2007-present) of other investment companies advised by FMR. Mr. Curvey is a Director of Fidelity Investments Money Management, Inc. (2009-present), Director of Fidelity Research & Analysis Co. (2009-present) and Director of FMR and FMR Co., Inc. (2007-present). Mr. Curvey is also Vice Chairman (2007-present) and Director of FMR LLC. In addition, Mr. Curvey serves as an Overseer for the Boston Symphony Orchestra and a member of the Trustees of Villanova University. Previously, Mr. Curvey was the Vice Chairman (2006-2007) and Director (2000-2007) of FMR Corp. |
Annual Report
* Trustees have been determined to be "Interested Trustees" by virtue of, among other things, their affiliation with the trust or various entities under common control with FMR.
+ The information above includes each Trustee's principal occupation during the last five years and other information relating to the experience, attributes, and skills relevant to each Trustee's qualifications to serve as a Trustee, which led to the conclusion that each Trustee should serve as a Trustee for the fund.
Independent Trustees:
Correspondence intended for each Independent Trustee (that is, the Trustees other than the Interested Trustees) may be sent to Fidelity Investments, P.O. Box 55235, Boston, Massachusetts 02205-5235.
Name, Age; Principal Occupations and Other Relevant Experience+ |
Dennis J. Dirks (62) |
| Year of Election or Appointment: 2005 Prior to his retirement in May 2003, Mr. Dirks was Chief Operating Officer and a member of the Board of The Depository Trust & Clearing Corporation (DTCC). He also served as President, Chief Operating Officer, and Board member of The Depository Trust Company (DTC) and President and Board member of the National Securities Clearing Corporation (NSCC). In addition, Mr. Dirks served as Chief Executive Officer and Board member of the Government Securities Clearing Corporation, Chief Executive Officer and Board member of the Mortgage-Backed Securities Clearing Corporation, as a Trustee and a member of the Finance Committee of Manhattan College (2005-2008), and as a Trustee and a member of the Finance Committee of AHRC of Nassau County (2006-2008). Mr. Dirks is a member of the Independent Directors Council (IDC) Governing Council (2010-Present) and Board of Directors for The Brookville Center for Children's Services, Inc. (2009-present). |
Alan J. Lacy (57) |
| Year of Election or Appointment: 2008 Mr. Lacy serves as Senior Adviser (2007-present) of Oak Hill Capital Partners, L.P. (private equity). Mr. Lacy also served as Chief Executive Officer (2000-2005) and Vice Chairman (2005-2006) of Sears Holdings Corporation and Sears, Roebuck and Co. (retail). In addition, Mr. Lacy serves as a member of the Board of Directors of The Western Union Company (global money transfer, 2006-present) and Bristol-Myers Squibb Company (global pharmaceuticals, 2007-present). Mr. Lacy is Chairman (2008-present) and a member (2006-present) of the Board of Trustees of The National Parks Conservation Association. |
Ned C. Lautenbach (66) |
| Year of Election or Appointment: 2000 Mr. Lautenbach is Chairman of the Independent Trustees of the Equity and High Income Funds (2006-present). Mr. Lautenbach currently serves as the Lead Director of the Eaton Corporation Board of Directors (diversified industrial, 1997-present). Mr. Lautenbach is also a member of the Board of Directors of the Philharmonic Center for the Arts in Naples, Florida (1999-present); a member of the Board of Trustees of Fairfield University (2005-present); and a member of the Council on Foreign Relations (1994-present). Previously, Mr. Lautenbach was a Partner/Advisory Partner at Clayton, Dubilier & Rice, Inc. (private equity investment, 1998-2010), as well as a Director of Sony Corporation (2006-2007). |
Joseph Mauriello (66) |
| Year of Election or Appointment: 2008 Prior to his retirement in January 2006, Mr. Mauriello served in numerous senior management positions including Deputy Chairman and Chief Operating Officer (2004-2005), and Vice Chairman of Financial Services (2002-2004) of KPMG LLP US (professional services, 1965-2005). Mr. Mauriello currently serves as a member of the Board of Directors of XL Group plc. (global insurance and re-insurance, 2006-present) and of Arcadia Resources Inc. (health care services and products, 2007-present). Previously, Mr. Mauriello served as a Director of the Hamilton Funds of the Bank of New York (2006-2007). |
Cornelia M. Small (66) |
| Year of Election or Appointment: 2005 Ms. Small is a member of the Board of Directors of the Teagle Foundation (2009-present). Ms. Small is also a member of the Investment Committee, and Chair (2008-present) and a member of the Board of Trustees of Smith College. In addition, Ms. Small serves on the Investment Committee of the Berkshire Taconic Community Foundation (2008-present). Previously, Ms. Small served as Chairperson of the Investment Committee (2002-2008) of Smith College. In addition, Ms. Small served as Chief Investment Officer, Director of Global Equity Investments, and a member of the Board of Directors of Scudder, Stevens & Clark and Scudder Kemper Investments. |
William S. Stavropoulos (71) |
| Year of Election or Appointment: 2001 Mr. Stavropoulos is Vice Chairman of the Independent Trustees of the Equity and High Income Funds (2006-present). Mr. Stavropoulos serves as President and Founder of the Michigan Baseball Foundation, the Great Lakes Loons (2007-present). Mr. Stavropoulos is Chairman Emeritus of the Board of Directors of The Dow Chemical Company, where he previously served in numerous senior management positions, including President, CEO (1995-2000; 2002-2004), Chairman of the Executive Committee (2000-2006), and as a member of the Board of Directors (1990-2006). Currently, Mr. Stavropoulos is Chairman of Univar (global distributor of commodity and specialty chemicals, 2010-present), a Director of Teradata Corporation (data warehousing and technology solutions, 2008-present), Chemical Financial Corporation, Maersk Inc. (industrial conglomerate), Tyco International, Inc. (multinational manufacturing and services, 2007-present), and a member of the Advisory Board for Metalmark Capital (private equity investment, 2005-present). Mr. Stavropoulos is a special advisor to Clayton, Dubilier & Rice, Inc. (private equity investment). In addition, Mr. Stavropoulos is a member of the University of Notre Dame Advisory Council for the College of Science. |
David M. Thomas (61) |
| Year of Election or Appointment: 2008 Previously, Mr. Thomas served as Executive Chairman (2005-2006) and Chairman and Chief Executive Officer (2000-2005) of IMS Health, Inc. (pharmaceutical and healthcare information solutions). In addition, Mr. Thomas serves as a member of the Board of Directors of Fortune Brands, Inc. (consumer products), and Interpublic Group of Companies, Inc. (marketing communication, 2004-present). |
Michael E. Wiley (60) |
| Year of Election or Appointment: 2008 Mr. Wiley also serves as a Director of Asia Pacific Exploration Consolidated (international oil and gas exploration and production, 2008-present). Mr. Wiley serves as a Director of Tesoro Corporation (independent oil refiner and marketer, 2005-present), and a Director of Bill Barrett Corporation (exploration and production, 2005-present). In addition, Mr. Wiley also serves as a Director of Post Oak Bank (privately-held bank, 2004-present). Previously, Mr. Wiley served as a member of the Board of Trustees of the University of Tulsa (2000-2006; 2007-2010), as a Senior Energy Advisor of Katzenbach Partners, LLC (consulting, 2006-2007), as an Advisory Director of Riverstone Holdings (private investment), Chairman, President, and CEO of Baker Hughes, Inc. (oilfield services, 2000-2004), and as Director of Spinnaker Exploration Company (exploration and production, 2001-2005). |
Annual Report
Trustees and Officers - continued
+ The information above includes each Trustee's principal occupation during the last five years and other information relating to the experience, attributes, and skills relevant to each Trustee's qualifications to serve as a Trustee, which led to the conclusion that each Trustee should serve as a Trustee for the fund.
Advisory Board Member and Executive Officers:
Correspondence intended for each executive officer and Peter S. Lynch may be sent to Fidelity Investments, 82 Devonshire Street, Boston, Massachusetts 02109.
Name, Age; Principal Occupation |
Peter S. Lynch (66) |
| Year of Election or Appointment: 2003 Member of the Advisory Board of Fidelity's Equity and High Income Funds. Mr. Lynch is Vice Chairman and a Director of FMR and FMR Co., Inc. In addition, Mr. Lynch serves as a Trustee of Boston College and as the Chairman of the Inner-City Scholarship Fund. Previously, Mr. Lynch served on the Special Olympics International Board of Directors (1997-2006). |
Kenneth B. Robins (41) |
| Year of Election or Appointment: 2008 President and Treasurer of Fidelity's Equity and High Income Funds. Mr. Robins also serves as President and Treasurer (2010-present) and Assistant Treasurer (2009-present) of other Fidelity funds and is an employee of Fidelity Investments (2004-present). Previously, Mr. Robins served as Deputy Treasurer of the Fidelity funds (2005-2008) and Treasurer and Chief Financial Officer of The North Carolina Capital Management Trust: Cash and Term Portfolios (2006-2008). |
Bruce T. Herring (45) |
| Year of Election or Appointment: 2006 Vice President of certain Equity Funds. Mr. Herring also serves as Chief Investment Officer and Director of Fidelity Management & Research (U.K.) Inc. (2010-present) and Group Chief Investments Officer of FMR. Previously, Mr. Herring served as Vice President (2005-2006) and Senior Vice President (2006-2007) of Fidelity Management & Research Company, Vice President of FMR Co., Inc. (2001-2007) and as a portfolio manager for Fidelity U.S. Equity Funds. |
Brian B. Hogan (46) |
| Year of Election or Appointment: 2009 Vice President of certain Equity Funds and Vice President of Sector Funds. Mr. Hogan also serves as President of FMR's Equity Division (2009-present). Previously, Mr. Hogan served as Senior Vice President, Equity Research of FMR (2006-2009) and as a portfolio manager. |
Scott C. Goebel (42) |
| Year of Election or Appointment: 2008 Secretary and Chief Legal Officer (CLO) of the Fidelity funds. Mr. Goebel also serves as Secretary and CLO of The North Carolina Capital Management Trust: Cash and Term Portfolio (2008-present); General Counsel, Secretary, and Senior Vice President of FMR (2008-present) and FMR Co., Inc. (2008-present); Deputy General Counsel of FMR LLC; Chief Legal Officer of Fidelity Management & Research (Hong Kong) Limited (2008-present) and Assistant Secretary of Fidelity Management & Research (Japan) Inc. (2008-present), Fidelity Investments Money Management, Inc. (2008-present), Fidelity Management & Research (U.K.) Inc. (2008-present), and Fidelity Research and Analysis Company (2008-present). Previously, Mr. Goebel served as Assistant Secretary of the Funds (2007-2008) and as Vice President and Secretary of Fidelity Distributors Corporation (FDC) (2005-2007). |
William C. Coffey (41) |
| Year of Election or Appointment: 2009 Assistant Secretary of Fidelity's Equity and High Income Funds. Mr. Coffey also serves as Senior Vice President and Deputy General Counsel of FMR LLC (2010-present), and is an employee of Fidelity Investments. Previously, Mr. Coffey served as Vice President and Associate General Counsel of FMR LLC (2005-2009). |
Holly C. Laurent (56) |
| Year of Election or Appointment: 2008 Anti-Money Laundering (AML) Officer of the Fidelity funds. Ms. Laurent also serves as AML Officer of The North Carolina Capital Management Trust: Cash and Term Portfolio (2008-present) and is an employee of Fidelity Investments. Previously, Ms. Laurent was Senior Vice President and Head of Legal for Fidelity Business Services India Pvt. Ltd. (2006-2008), and Senior Vice President, Deputy General Counsel and Group Head for FMR LLC (2005-2006). |
Christine Reynolds (52) |
| Year of Election or Appointment: 2008 Chief Financial Officer of the Fidelity funds. Ms. Reynolds became President of Fidelity Pricing and Cash Management Services (FPCMS) in August 2008. Ms. Reynolds served as Chief Operating Officer of FPCMS (2007-2008). Previously, Ms. Reynolds served as President, Treasurer, and Anti-Money Laundering officer of the Fidelity funds (2004-2007). |
Kenneth A. Rathgeber (63) |
| Year of Election or Appointment: 2004 Chief Compliance Officer of Fidelity's Equity and High Income Funds. Mr. Rathgeber is Chief Compliance Officer of Fidelity Management & Research (Hong Kong) Limited (2008-present), Fidelity Management & Research (Japan) Inc. (2008-present), FMR (2005-present), FMR Co., Inc. (2005-present), Fidelity Management & Research (U.K.) Inc. (2005-present), Fidelity Research & Analysis Company (2005-present), Fidelity Investments Money Management, Inc. (2005-present), Pyramis Global Advisors, LLC (2005-present), and Strategic Advisers, Inc. (2005-present). |
Jeffrey S. Christian (49) |
| Year of Election or Appointment: 2009 Deputy Treasurer of the Fidelity funds. Mr. Christian is an employee of Fidelity Investments. Previously, Mr. Christian served as Chief Financial Officer (2008-2009) of certain Fidelity funds and Senior Vice President of Fidelity Pricing and Cash Management Services (FPCMS) (2004-2009). |
Bryan A. Mehrmann (49) |
| Year of Election or Appointment: 2005 Deputy Treasurer of the Fidelity funds. Mr. Mehrmann is an employee of Fidelity Investments. |
Adrien E. Deberghes (43) |
| Year of Election or Appointment: 2008 Deputy Treasurer of Fidelity's Equity and High Income Funds. Mr. Deberghes also serves as Assistant Treasurer of other Fidelity funds (2010-present) and is an employee of Fidelity Investments (2008-present). Previously, Mr. Deberghes served as Senior Vice President of Mutual Fund Administration at State Street Corporation (2007-2008), Senior Director of Mutual Fund Administration at Investors Bank & Trust (2005-2007), and Director of Finance for Dunkin' Brands (2000-2005). |
Stephanie J. Dorsey (41) |
| Year of Election or Appointment: 2010 Assistant Treasurer of Fidelity's Equity and High Income Funds. Ms. Dorsey also serves as Deputy Treasurer of other Fidelity funds (2008-present) and is an employee of Fidelity Investments (2008-present). Previously, Ms. Dorsey served as Treasurer (2004-2008) of the JPMorgan Mutual Funds and Vice President (2004-2008) of JPMorgan Chase Bank. |
John R. Hebble (52) |
| Year of Election or Appointment: 2009 Assistant Treasurer of Fidelity's Equity and High Income Funds. Mr. Hebble also serves as Treasurer and Chief Financial Officer of The North Carolina Capital Management Trust: Cash and Term Portfolio (2008-present), President and Treasurer of other Fidelity funds (2008-present) and is an employee of Fidelity Investments. |
Gary W. Ryan (52) |
| Year of Election or Appointment: 2005 Assistant Treasurer of the Fidelity funds. Mr. Ryan is an employee of Fidelity Investments. Previously, Mr. Ryan served as Vice President of Fund Reporting in Fidelity Pricing and Cash Management Services (FPCMS) (1999-2005). |
Jonathan Davis (42) |
| Year of Election or Appointment: 2010 Assistant Treasurer of the Fidelity funds. Mr. Davis is an employee of Fidelity Investments. Previously, Mr. Davis served as Vice President and Associate General Counsel of FMR LLC (2003-2010). |
Annual Report
Class K designates 100% of the dividend distributed during the fiscal year as qualifying for the dividends-received deduction for corporate shareholders.
Class K designates 100% of the dividend distributed during the fiscal year as amounts which may be taken into account as a dividend for the purposes of the maximum rate under section 1(h)(11) of the Internal Revenue Code.
The fund will notify shareholders in January 2011 of amounts for use in preparing 2010 income tax returns.
Annual Report
Board Approval of Investment Advisory Contracts and Management Fees
Fidelity Stock Selector All Cap Fund (formerly known as Fidelity Stock Selector)
Each year, the Board of Trustees, including the Independent Trustees (together, the Board), votes on the renewal of the management contract and sub-advisory agreements (together, the Advisory Contracts) for the fund. The Board, assisted by the advice of fund counsel and Independent Trustees' counsel, requests and considers a broad range of information relevant to the renewal of the Advisory Contracts throughout the year.
The Board meets regularly and considers at each of its meetings factors that are relevant to its annual consideration of the renewal of the fund's Advisory Contracts, including the services and support provided to the fund and its shareholders. The Board has established various standing committees, each composed of Independent Trustees with varying backgrounds, to which the Board has assigned specific subject matter responsibilities in order to enhance effective decision-making by the Board. The Board, acting directly and through its Committees, requests and receives information concerning the annual consideration of the renewal of the fund's Advisory Contracts. The Board also meets as needed to consider matters specifically related to the Board's annual consideration of the renewal of Advisory Contracts. Members of the Board may also meet with trustees of other Fidelity funds through ad hoc joint committees to discuss certain matters relevant to the Fidelity funds.
At its July 2010 meeting, the Board of Trustees, including the Independent Trustees, unanimously determined to renew the fund's Advisory Contracts. In reaching its determination, the Board considered all factors it believed relevant, including (i) the nature, extent, and quality of the services to be provided to the fund and its shareholders (including the investment performance of the fund); (ii) the competitiveness of the fund's management fee and total expenses; (iii) the total costs of the services to be provided by and the profits to be realized by Fidelity from its relationship with the fund; (iv) the extent to which economies of scale would be realized as the fund grows; and (v) whether fee levels reflect these economies of scale, if any, for the benefit of fund shareholders.
In considering whether to renew the Advisory Contracts for the fund, the Board reached a determination, with the assistance of fund counsel and Independent Trustees' counsel and through the exercise of its business judgment, that the renewal of the Advisory Contracts is in the best interests of fund shareholders and that the compensation to be received by Fidelity under the management contract is fair and reasonable. The Board's decision to renew the Advisory Contracts was not based on any single factor noted above, but rather was based on a comprehensive consideration of all the information provided to the Board at its meetings throughout the year. The Board, in reaching its determination to renew the Advisory Contracts, is aware that shareholders in the fund have a broad range of investment choices available to them, including a wide choice among mutual funds offered by Fidelity's competitors, and that the fund's shareholders, with the opportunity to review and weigh the disclosure provided by the fund in its prospectus and other public disclosures, have chosen to invest in this fund, managed by Fidelity.
Annual Report
Nature, Extent, and Quality of Services Provided. The Board considered the staffing within the investment adviser, FMR, and the sub-advisers (together, the Investment Advisers), including the backgrounds of the fund's investment personnel and the fund's investment objective and discipline. The Independent Trustees also had discussions with senior management of Fidelity's investment operations and investment groups. The Board considered the structure of the portfolio manager compensation program and whether this structure provides appropriate incentives to act in the best interest of the fund.
Resources Dedicated to Investment Management and Support Services. The Board and the equity research subcommittee of the Board's Fund Oversight Committee reviewed the size, education, and experience of the Investment Advisers' investment staff, their use of technology, and the Investment Advisers' approach to recruiting, training, and retaining portfolio managers and other research, advisory, and management personnel. The Board noted that Fidelity's analysts have access to a variety of technological tools and market and securities data that enable them to perform both fundamental and quantitative analysis and to specialize in various disciplines. The Board considered Fidelity's extensive global research capabilities that enable the Investment Advisers to aggregate data from various sources in an effort to produce positive investment results. The Board also considered that Fidelity's portfolio managers and analysts have access to daily portfolio attribution that allows for monitoring of a fund's portfolio, as well as an electronic communication system that provides immediate real-time access to research concerning issuers and credit enhancers. The Board noted FMR's continued focus on strengthening the organization and discipline of equity portfolio management and research.
Shareholder and Administrative Services. The Board considered (i) the nature, extent, quality, and cost of advisory, administrative, and shareholder services performed by the Investment Advisers and their affiliates under the Advisory Contracts and under separate agreements covering transfer agency, pricing and bookkeeping, and securities lending services for the fund; (ii) the nature and extent of the investment adviser's supervision of third party service providers, principally custodians and subcustodians; and (iii) the resources devoted to, and the record of compliance with, the fund's compliance policies and procedures. The Board also reviewed the allocation of fund brokerage, including allocations to brokers affiliated with the Investment Advisers, the use of brokerage commissions to pay fund expenses, and the use of "soft" commission dollars to pay for research services.
The Board noted that the growth of fund assets over time across the complex allows Fidelity to reinvest in the development of services designed to enhance the value or convenience of the Fidelity funds as investment vehicles. These services include 24-hour access to account information and market information through phone representatives and over the Internet, and investor education materials and asset allocation tools.
Annual Report
Board Approval of Investment Advisory Contracts and
Management Fees - continued
Investment in a Large Fund Family. The Board considered the benefits to shareholders of investing in a Fidelity fund, including the benefits of investing in a fund that is part of a large family of funds offering a variety of investment disciplines and providing a large variety of mutual fund investor services. The Board noted that Fidelity had taken, or had made recommendations that resulted in the Fidelity funds taking, a number of actions over the previous year that benefited particular funds, including (i) dedicating additional resources to investment research and restructuring and broadening the focus of the investment research teams; (ii) bolstering the senior management team that oversees asset management; (iii) launching Class F of certain funds as a lower-fee class available to Freedom K and Freedom Index Funds; (iv) lowering the initial investment minimums and ongoing balance requirements for Real Estate High Income Fund; (v) eliminating subsequent purchase minimums for all funds and adding a waiver of the investment minimum requirement for new accounts opened with the proceeds of a systematic withdrawal plan; (vi) eliminating the withdrawal minimum and maximum limits for systematic withdrawals from Advisor funds; (vii) expanding sales load waivers on Class A shares for Destiny Planholders and expanding Institutional Class eligibility for Class O Destiny Planholders; and (viii) changing certain Class A and Class T sales charge structures to further align them with industry practices.
Investment Performance. The Board considered whether the fund has operated in accordance with its investment objective, as well as its record of compliance with its investment restrictions. It also reviewed the fund's absolute investment performance for each class, as well as the fund's relative investment performance for each class measured over multiple periods against (i) a broad-based securities market index, and (ii) a peer group of mutual funds deemed appropriate by Fidelity and reviewed by the Board. The following charts considered by the Board show, over the one-, three-, and five-year periods ended December 31, 2009, as available, the cumulative total returns of Class K and the retail class of the fund, the cumulative total returns of a broad-based securities market index ("benchmark"), and a range of cumulative total returns of a peer group of mutual funds identified by Morningstar, Inc. as having an investment style similar to that of the fund based on underlying portfolio holdings. The box within each chart shows the 25th percentile return (bottom of box) and the 75th percentile return (top of box) of the peer group. Returns shown above the box are in the first quartile and returns shown below the box are in the fourth quartile. The percentage beaten numbers noted below each chart correspond to the percentile box and represent the percentage of funds in the peer group whose performance was equal to or lower than that of the class indicated.
Annual Report
Fidelity Stock Selector All Cap Fund
The Board reviewed the fund's relative investment performance against its peer group and noted that the performance of the retail class of the fund (the class with the longer performance record) was in the second quartile for the one- and five-year periods and the third quartile for the three-year period. The Board also noted that the investment performance of the retail class of the fund compared favorably to its benchmark for the one- and five-year periods, although the fund's three-year cumulative total return was lower than its benchmark. The Board considered that the variations in performance between the fund's classes reflect the variations in class expenses, which result in lower performance for the higher expense class. The Board also reviewed the fund's performance since inception as well as performance in the current year.
The Board also considered that the fund's management fee is subject to upward or downward adjustment depending upon whether, and to what extent, the fund's investment performance for the performance period exceeds, or is exceeded by, the record (over the same period) of a Board-approved performance adjustment index. The Board realizes that the performance adjustment provides FMR with a strong economic incentive to seek to achieve superior performance for the fund's shareholders and helps to more closely align the interests of FMR and the fund's shareholders.
Based on its review, and giving particular weight to the nature and quality of the resources dedicated by the Investment Advisers to maintain and improve relative performance and factoring in the unprecedented market events in recent years, the Board concluded that the nature, extent, and quality of investment management and support services and of shareholder and administrative services provided to the fund will benefit the fund's shareholders, particularly in light of the Board's view that the fund's shareholders benefit from investing in a fund that is part of a large family of funds offering a variety of investment disciplines and services.
Annual Report
Board Approval of Investment Advisory Contracts and
Management Fees - continued
Competitiveness of Management Fee and Total Fund Expenses. The Board considered the fund's management fee and total expenses compared to "mapped groups" of competitive funds and classes. Fidelity creates "mapped groups" by combining similar Lipper investment objective categories that have comparable management fee characteristics. Combining Lipper investment objective categories aids the Board's management fee and total expense comparisons by broadening the competitive group used for comparison and by reducing the number of universes to which various Fidelity funds are compared.
Management Fee. The Board considered two proprietary management fee comparisons for the 12-month periods shown in the chart below. The group of Lipper funds used by the Board for management fee comparisons is referred to below as the "Total Mapped Group." The Total Mapped Group comparison focuses on a fund's standing relative to the total universe of comparable funds available to investors, in terms of gross management fees before expense reimbursements or caps, and without giving effect to the fund's performance adjustment. "TMG %" represents the percentage of funds in the Total Mapped Group that had management fees that were lower than the fund's. For example, a TMG % of 10% means that 90% of the funds in the Total Mapped Group had higher management fees than the fund. The "Asset-Size Peer Group" (ASPG) comparison focuses on a fund's standing relative to non-Fidelity funds similar in size to the fund within the Total Mapped Group. The ASPG represents at least 15% of the funds in the Total Mapped Group with comparable asset size and management fee characteristics, subject to a minimum of 50 funds (or all funds in the Total Mapped Group if fewer than 50). Additional information, such as the ASPG quartile in which the fund's management fee ranked and the impact of the fund's performance adjustment, is also included in the chart and considered by the Board.
Annual Report
Fidelity Stock Selector All Cap Fund
The Board noted that the fund's management fee ranked below the median of its Total Mapped Group and below the median of its ASPG for 2009. The Board also noted the effect of the fund's negative performance adjustment on the fund's management fee ranking. The Board noted that the performance adjustment for each year represents calculations for performance periods that differ from the periods shown in the performance charts above.
Based on its review, the Board concluded that the fund's management fee is fair and reasonable in light of the services that the fund receives and the other factors considered.
Total Expenses. In its review of each class's total expenses, the Board considered the fund's management fee as well as other fund or class expenses, as applicable, such as transfer agent fees, pricing and bookkeeping fees, and custodial, legal, and audit fees. The Board also noted the effects of any waivers and reimbursements on fees and expenses, as well as the impact of the fund's performance adjustment. As part of its review, the Board also considered current and historical total expenses of each class of the fund compared to competitive fund median expenses. Each class of the fund is compared to those funds and classes in the Total Mapped Group (used by the Board for management fee comparisons) that have a similar sales load structure.
The Board noted that the total expenses of each class ranked below its competitive median for 2009.
Annual Report
Board Approval of Investment Advisory Contracts and
Management Fees - continued
Fees Charged to Other Fidelity Clients. The Board also considered Fidelity fee structures and other information with respect to clients of FMR and its affiliates, such as other mutual funds advised or subadvised by FMR or its affiliates, pension plan clients, and other institutional clients. In March 2010, the Board created an ad hoc joint committee with the board of other Fidelity funds (the Committee) to review and compare Fidelity's institutional investment advisory business with its business of providing services to the Fidelity funds, including the differences in services provided, fees charged, and costs incurred, as well as competition in their respective marketplaces.
Based on its review of total expenses and fees charged to other Fidelity clients, the Board concluded that the total expenses of each class of the fund were reasonable in light of the services that the fund and its shareholders receive and the other factors considered, including the findings of the Committee.
Costs of the Services and Profitability. The Board considered the revenues earned and the expenses incurred by Fidelity in conducting the business of developing, marketing, distributing, managing, administering and servicing the fund and its shareholders. The Board also considered the level of Fidelity's profits in respect of all the Fidelity funds.
On an annual basis, FMR presents to the Board Fidelity's profitability for the fund. Fidelity calculates the profitability for each fund, as well as aggregate profitability for groups of Fidelity funds and all Fidelity funds, using a series of detailed revenue and cost allocation methodologies which originate with the audited books and records of Fidelity. The Audit Committee of the Board reviews any significant changes from the prior year's methodologies.
PricewaterhouseCoopers LLP (PwC), independent registered public accounting firm and auditor to Fidelity and certain Fidelity funds, has been engaged annually by the Board as part of the Board's assessment of Fidelity's profitability analysis. PwC's engagement includes the review and assessment of Fidelity's methodologies used in determining the revenues and expenses attributable to Fidelity's mutual fund business, and completion of agreed-upon procedures surrounding the mathematical accuracy of fund profitability and its conformity to allocation methodologies. After considering PwC's reports issued under the engagement and information provided by Fidelity, the Board believes that while other allocation methods may also be reasonable, Fidelity's profitability methodologies are reasonable in all material respects.
The Board has also reviewed Fidelity's non-fund businesses and fall-out benefits related to the mutual fund business as well as cases where Fidelity's affiliates may benefit from or be related to the fund's business.
The Board considered the costs of the services provided by and the profits realized by Fidelity in connection with the operation of the fund and were satisfied that the profitability was not excessive in the circumstances.
Annual Report
Economies of Scale. The Board considered whether there have been economies of scale in respect of the management of the Fidelity funds, whether the Fidelity funds (including the fund) have appropriately benefited from any such economies of scale, and whether there is potential for realization of any further economies of scale. The Board considered the extent to which the fund will benefit from economies of scale through increased services to the fund, through waivers or reimbursements, or through fee or expense reductions.
In February 2009, the Board and the board of other Fidelity funds created an ad hoc committee (the Economies of Scale Committee) to analyze whether FMR attains economies of scale in respect of the management and servicing of the Fidelity funds, whether the Fidelity funds have appropriately benefited from such economies of scale, and whether there is potential for realization of any further economies of scale.
The Board recognized that the fund's management contract incorporates a "group fee" structure, which provides for lower group fee rates as total fund assets under FMR's management increase, and for higher group fee rates as total fund assets under FMR's management decrease. FMR calculates the group fee rates based on a tiered asset "breakpoint" schedule that varies based on asset class. The Board considered that the group fee is designed to deliver the benefits of economies of scale to fund shareholders when total Fidelity fund assets increase, even if assets of any particular fund are unchanged or have declined, because some portion of Fidelity's costs are attributable to services provided to all Fidelity funds, and all funds benefit if those costs can be allocated among more assets. The Board concluded that, given the group fee structure, fund shareholders will benefit from lower management fees as assets under FMR's management increase at the fund complex level, regardless of whether Fidelity achieves any such economies of scale.
The Board concluded, considering the findings of the Economies of Scale Committee, that any potential economies of scale are being appropriately shared between fund shareholders and Fidelity.
Additional Information Requested by the Board. In order to develop fully the factual basis for consideration of the Fidelity funds' Advisory Contracts, the Board requested and received additional information on certain topics, including (i) fund performance trends, actions to be taken by FMR to improve certain funds' overall performance, and Fidelity's long-term strategies for certain funds; (ii) portfolio manager changes that have occurred during the past year and length of portfolio manager tenure for different categories of funds over time; (iii) Fidelity's compensation structure for portfolio managers, research analysts, and other key personnel, the rationale for the compensation structure, and how the compensation structure provides appropriate performance incentives; (iv) the amount of the investment that each portfolio manager has made in the Fidelity fund(s) that he or she manages; (v) management and other fees paid by FMR to affiliated sub-advisers on behalf of the Fidelity funds; (vi) Fidelity's fee structures and rationale for recommending different fees among different categories of funds; (vii) Fidelity's rationale for recommending which funds should have a performance adjustment component as part of their management fees; (viii) the rationale for any differences between fund fee structures and fee structures in place for other Fidelity clients; and (ix) explanations regarding the relative total expenses borne by certain funds and classes, total expense competitive trends, and actions that might be taken by FMR to reduce total expenses for certain funds and classes.
Annual Report
Board Approval of Investment Advisory Contracts and
Management Fees - continued
Based on its evaluation of all of the conclusions noted above, and after considering all factors it believed relevant, the Board ultimately concluded that the advisory fee structures are fair and reasonable, and that the fund's Advisory Contracts should be renewed.
Annual Report
Managing Your Investments
Fidelity offers several ways to conveniently manage your workplace benefits (including your workplace savings plan, investments, and additional services) via your telephone or PC. You can access your plan and account information and research your investments 24 hours a day.
By Phone
Fidelity provides a single toll-free number to access plan information, account balances, positions, and quotes*. It's easy to navigate the service, and on your first call, the system will help you create a personal identification number (PIN) for security.
(phone_graphic)
Fidelity Workplace
Investing
1-800-835-5092
By PC
Fidelity's web site on the Internet provides a wide range of information, including plan information, daily financial news, fund performance, interactive planning tools, and news about Fidelity products and services.
(computer_graphic)
Fidelity's Web Site
www.401k.com
* When you call the quotes line, please remember that a fund's yield and return will vary and, except for money market funds, share price will also vary. This means that you may have a gain or loss when you sell your shares. There is no assurance that money market funds will be able to maintain a stable $1 share price; an investment in a money market fund is not insured or guaranteed by the U.S. government. Total returns are historical and include changes in share price, reinvestment of dividends and capital gains, and the effects of any sales charges.
Annual Report
To Write Fidelity
We'll give your correspondence immediate attention and send you written confirmation upon completion of your request.
(letter_graphic)
For Non-Retirement
Accounts
Buying shares
Fidelity Investments
P.O. Box 770001
Cincinnati, OH 45277-0003
Overnight Express
Fidelity Investments
Attn: Distribution Services
100 Crosby Parkway - KC1H
Covington, KY 41015
Selling shares
Fidelity Investments
P.O. Box 770001
Cincinnati, OH 45277-0035
Overnight Express
Fidelity Investments
Attn: Distribution Services
100 Crosby Parkway - KC1H
Covington, KY 41015
General Correspondence
Fidelity Investments
P.O. Box 500
Merrimack, NH 03054-0500
(letter_graphic)
For Retirement
Accounts
Buying shares
Fidelity Investments
P.O. Box 770001
Cincinnati, OH 45277-0003
Selling shares
Fidelity Investments
P.O. Box 770001
Cincinnati, OH 45277-0035
Overnight Express
Fidelity Investments
Attn: Distribution Services
100 Crosby Parkway - KC1H
Covington, KY 41015
General Correspondence
Fidelity Investments
P.O. Box 500
Merrimack, NH 03054-0500
Annual Report
Investment Adviser
Fidelity Management & Research Company
Boston, MA
Investment Sub-Advisers
FMR Co., Inc.
Fidelity Management & Research
(U.K.) Inc.
Fidelity Research & Analysis Company
Fidelity Management & Research
(Hong Kong) Limited
Fidelity Management & Research
(Japan) Inc.
General Distributor
Fidelity Distributors Corporation
Boston, MA
Transfer and Service Agents
Fidelity Investments Institutional
Operations Company, Inc.
Boston, MA
Fidelity Service Company, Inc.
Boston, MA
Custodian
JPMorgan Chase Bank, N.A.
New York, NY
FSS-K-UANN-1210
1.863286.102
Fidelity®
Stock Selector Small Cap
Fund
(formerly Fidelity Small Cap Independence Fund)
Annual Report
October 31, 2010
(2_fidelity_logos) (Registered_Trademark)
Contents
Chairman's Message | <Click Here> | The Chairman's message to shareholders. |
Performance | <Click Here> | How the fund has done over time. |
Management's Discussion of Fund Performance | <Click Here> | The Portfolio Manager's review of fundperformance and strategy. |
Shareholder Expense Example | <Click Here> | An example of shareholder expenses. |
Investment Changes | <Click Here> | A summary of major shifts in the fund's investments over the past six months. |
Investments | <Click Here> | A complete list of the fund's investments with their market values. |
Financial Statements | <Click Here> | Statements of assets and liabilities, operations, and changes in net assets,
as well as financial highlights. |
Notes | <Click Here> | Notes to the financial statements. |
Report of Independent Registered Public Accounting Firm | <Click Here> | |
Trustees and Officers | <Click Here> | |
Distributions | <Click Here> | |
Board Approval of Investment Advisory Contracts and Management Fees | <Click Here> | |
To view a fund's proxy voting guidelines and proxy voting record for the 12-month period ended June 30, visit http://www.fidelity.com/proxyvotingresults or visit the Securities and Exchange Commission's (SEC) web site at http://www.sec.gov. You may also call 1-800-544-8544 to request a free copy of the proxy voting guidelines.
Standard & Poor's, S&P and S&P 500 are registered service marks of The McGraw-Hill Companies, Inc. and have been licensed for use by Fidelity Distributors Corporation.
Other third party marks appearing herein are the property of their respective owners.
All other marks appearing herein are registered or unregistered trademarks or service marks of FMR LLC or an affiliated company.
Annual Report
This report and the financial statements contained herein are submitted for the general information of the shareholders of the fund. This report is not authorized for distribution to prospective investors in the fund unless preceded or accompanied by an effective prospectus.
A fund files its complete schedule of portfolio holdings with the SEC for the first and third quarters of each fiscal year on Form N-Q. Forms N-Q are available on the SEC's web site at http://www.sec.gov. A fund's Forms N-Q may be reviewed and copied at the SEC's Public Reference Room in Washington, DC. Information regarding the operation of the SEC's Public Reference Room may be obtained by calling 1-800-SEC-0330. For a complete list of a fund's portfolio holdings, view the most recent holdings listing, semiannual report, or annual report on Fidelity's web site at http://www.fidelity.com or http://www.advisor.fidelity.com, as applicable.
NOT FDIC INSURED • MAY LOSE VALUE • NO BANK GUARANTEE
Neither the fund nor Fidelity Distributors Corporation is a bank.
Annual Report
(photo_of_Edward_C_Johnson_3d)
Dear Shareholder:
Equities have staged a rally in the second half of 2010, shaking off concerns about the European debt crisis and the possibility of a double-dip recession in the U.S. Although the short-term surge pushed major equity indexes back into positive territory for the year, several questions remain about the longer-term outlook, including lackluster economic growth and persistently high unemployment. Financial markets are always unpredictable, of course, but there also are several time-tested investment principles that can help put the odds in your favor.
One of the basic tenets is to invest for the long term. Over time, riding out the markets' inevitable ups and downs has proven much more effective than selling into panic or chasing the hottest trend. Even missing only a few of the markets' best days can significantly diminish investor returns. Patience also affords the benefits of compounding - of earning interest on additional income or reinvested dividends and capital gains. There can be tax advantages and cost benefits to consider as well. While staying the course doesn't eliminate risk, it can considerably lessen the effect of short-term declines.
You can further manage your investing risk through diversification. And today, more than ever, geographic diversification should be taken into account. Studies indicate that asset allocation is the single most important determinant of a portfolio's long-term success. The right mix of stocks, bonds and cash - aligned to your particular risk tolerance and investment objective - is very important. Age-appropriate rebalancing is also an essential aspect of asset allocation. For younger investors, an emphasis on equities - which historically have been the best-performing asset class over time - is encouraged. As investors near their specific goal, such as retirement or sending a child to college, consideration may be given to replacing volatile assets (e.g. common stocks) with more-stable fixed investments (bonds or savings plans).
A third principle - investing regularly - can help lower the average cost of your purchases. Investing a certain amount of money each month or quarter helps ensure you won't pay for all your shares at market highs. This strategy - known as dollar cost averaging - also reduces "emotion" from investing, helping shareholders avoid selling weak performers just prior to an upswing, or chasing a hot performer just before a correction.
We invite you to contact us via the Internet, through our Investor Centers or by phone. It is our privilege to provide you the information you need to make the investments that are right for you.
Sincerely,
(The chairman's signature appears here.)
Edward C. Johnson 3d
Annual Report
Average annual total return reflects the change in the value of an investment, assuming reinvestment of the class' distributions from dividend income and capital gains (the profits earned upon the sale of securities that have grown in value, if any) and assuming a constant rate of performance each year. The $10,000 table and the fund's returns do not reflect the deduction of taxes that a shareholder would pay on fund distributions or the redemption of fund shares. During periods of reimbursement by Fidelity, a fund's total return will be greater than it would be had the reimbursement not occurred. How a fund did yesterday is no guarantee of how it will do tomorrow.
Average Annual Total Returns
Periods ended October 31, 2010 | Past 1
year | Past 5
years | Past 10
years |
Fidelity® Stock Selector Small Cap Fund | 29.75% | 1.25% | 4.00% |
$10,000 Over 10 Years
Let's say hypothetically that $10,000 was invested in Fidelity® Stock Selector Small Cap Fund, a class of the fund, on October 31, 2000. The chart shows how the value of your investment would have changed, and also shows how the Russell 2000® Index performed over the same period.
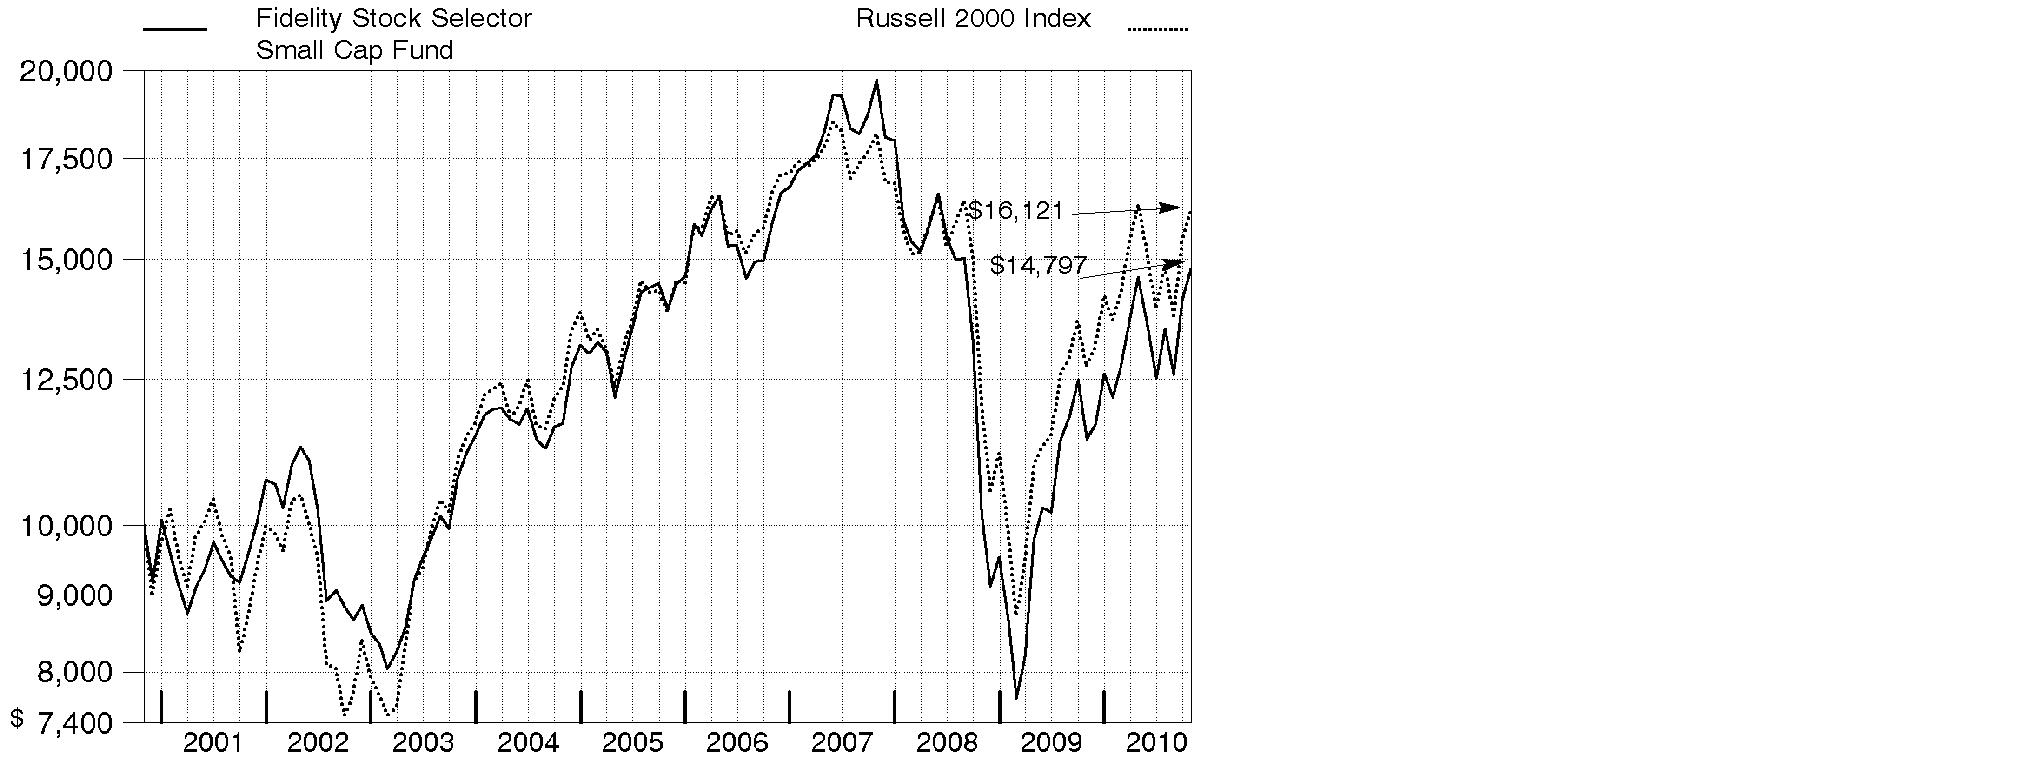
Annual Report
Market Recap: Amid bouts of volatility, major U.S. stock market indexes recorded double-digit gains for the year ending October 31, 2010, lifted by economic optimism, encouraging earnings reports and a wave of corporate mergers. Aside from a January dip, stocks trended upward for the first half of the period amid indications the Great Recession was over. However, in April, lingering high unemployment and heightened concern over European debt sent equities falling. Markets regrouped in July, but fell again in August on mixed economic data. The final two months of the period brought renewed optimism, with the large-cap S&P 500® Index posting its best September/October performance since 1998. For the full 12 months, the S&P 500® rose 16.52%, while the blue-chip-laden Dow Jones Industrial AverageSM added 17.62% and the technology-heavy Nasdaq Composite® Index rose 23.72%. Among market segments, all 10 sectors in the S&P 500 posted gains, with more than half outperforming the broad-market index. Stocks of mid- and small-sized companies surged, with the Russell Midcap® Index adding 27.71% and Russell 2000® Index climbing 26.58%. Looking abroad, debt problems in several European countries cooled gains in developed markets, and yet the MSCI® EAFE® (Europe, Australasia, Far East) Index still rose 8.49%.
Comments from Rayna Lesser and Charles Myers, Co-Portfolio Managers of Fidelity® Stock Selector Small Cap Fund: For the year ending October 31, 2010, the fund's Retail Class shares rose 29.75%, solidly outpacing the Russell 2000. The fund adopted a multi-manager structure at the beginning of the period, allocating assets in a sector-neutral manner among a team of sector portfolio managers. Most of the fund's outperformance came from strong stock selection, particularly within consumer staples, materials and energy. Good picks in health care and pockets of consumer discretionary also provided a boost, as did favorable positioning within financials - specifically banks - among other sectors. Our top individual contributors included gold producer Red Back Mining - which was acquired during the period - flash-memory-card maker SanDisk, auto-emission control product manufacturer Tenneco and real estate services firm Jones Lang LaSalle. Conversely, stock selection in retailing and industrials notably detracted from results. Fourlis Holdings, owner of the Greek franchise of Swedish furnishing group Ikea, was the biggest individual detractor, followed by lender Washington Federal and pharmacy benefit manager BioScrip. Some stocks mentioned were out-of-benchmark positions, and some were sold by period end.
The views expressed above reflect those of the portfolio manager(s) only through the end of the period as stated on the cover of this report and do not necessarily represent the views of Fidelity or any other person in the Fidelity organization. Any such views are subject to change at any time based upon market or other conditions and Fidelity disclaims any responsibility to update such views. These views may not be relied on as investment advice and, because investment decisions for a Fidelity fund are based on numerous factors, may not be relied on as an indication of trading intent on behalf of any Fidelity fund.
Annual Report
Shareholder Expense Example
As a shareholder of the Fund, you incur two types of costs: (1) transaction costs, including sales charges (loads) on purchase payments or redemption proceeds, redemption fees, and (2) ongoing costs, including management fees, distribution and/or service (12b-1) fees and other Fund expenses. This Example is intended to help you understand your ongoing costs (in dollars) of investing in the Fund and to compare these costs with the ongoing costs of investing in other mutual funds.
The Example is based on an investment of $1,000 invested at the beginning of the period and held for the entire period (May 1, 2010 to October 31, 2010).
Actual Expenses
The first line of the accompanying table for each class of the Fund provides information about actual account values and actual expenses. You may use the information in this line, together with the amount you invested, to estimate the expenses that you paid over the period. Simply divide your account value by $1,000.00 (for example, an $8,600 account value divided by $1,000.00 = 8.6), then multiply the result by the number in the first line for a class of the Fund under the heading entitled "Expenses Paid During Period" to estimate the expenses you paid on your account during this period. A small balance maintenance fee of $12.00 that is charged once a year may apply for certain accounts with a value of less than $2,000. This fee is not included in the table below. If it was, the estimate of expenses you paid during the period would be higher, and your ending account value lower, by this amount. In addition, the Fund, as a shareholder in the underlying Fidelity Central Funds, will indirectly bear its pro-rata share of the fees and expenses incurred by the underlying Fidelity Central Funds. These fees and expenses are not included in the Fund's annualized expense ratio used to calculate the expense estimate in the table below.
Hypothetical Example for Comparison Purposes
The second line of the accompanying table for each class of the Fund provides information about hypothetical account values and hypothetical expenses based on a Class' actual expense ratio and an assumed rate of return of 5% per year before expenses, which is not the Class' actual return. The hypothetical account values and expenses may not be used to estimate the actual ending account balance or expenses you paid for the period. You may use this information to compare the ongoing costs of investing in the Fund and other funds. To do so, compare this 5% hypothetical example with the 5% hypothetical examples that appear in the shareholder reports of the other funds. A small balance maintenance fee of $12.00 that is charged once a year may apply for certain accounts with a value of less than $2,000. This fee is not included in the table below. If it was, the estimate of expenses you paid during the period would be higher, and your ending account value lower, by this amount. In addition, the Fund, as a shareholder in the underlying Fidelity Central Funds, will indirectly bear its pro-rata share of the fees and expenses incurred by the underlying Fidelity Central Funds. These fees and expenses are not included in the Fund's annualized expense ratio used to calculate the expense estimate in the table below.
Please note that the expenses shown in the table are meant to highlight your ongoing costs only and do not reflect any transaction costs. Therefore, the second line of the table is useful in comparing ongoing costs only, and will not help you determine the relative total costs of owning different funds. In addition, if these transactional costs were included, your costs would have been higher.
Annual Report
| Annualized Expense Ratio | Beginning
Account Value
May 1, 2010 | Ending
Account Value
October 31, 2010 | Expenses Paid
During Period*
May 1, 2010
to October 31, 2010 |
Class A | .99% | | | |
Actual | | $ 1,000.00 | $ 1,011.90 | $ 5.02 |
HypotheticalA | | $ 1,000.00 | $ 1,020.21 | $ 5.04 |
Class T | 1.27% | | | |
Actual | | $ 1,000.00 | $ 1,010.70 | $ 6.44 |
HypotheticalA | | $ 1,000.00 | $ 1,018.80 | $ 6.46 |
Class B | 1.74% | | | |
Actual | | $ 1,000.00 | $ 1,008.30 | $ 8.81 |
HypotheticalA | | $ 1,000.00 | $ 1,016.43 | $ 8.84 |
Class C | 1.74% | | | |
Actual | | $ 1,000.00 | $ 1,008.30 | $ 8.81 |
HypotheticalA | | $ 1,000.00 | $ 1,016.43 | $ 8.84 |
Stock Selector Small Cap | .71% | | | |
Actual | | $ 1,000.00 | $ 1,013.60 | $ 3.60 |
HypotheticalA | | $ 1,000.00 | $ 1,021.63 | $ 3.62 |
Institutional Class | .64% | | | |
Actual | | $ 1,000.00 | $ 1,014.20 | $ 3.25 |
HypotheticalA | | $ 1,000.00 | $ 1,021.98 | $ 3.26 |
A 5% return per year before expenses
* Expenses are equal to each Class' annualized expense ratio, multiplied by the average account value over the period, multiplied by 184/365 (to reflect the one-half year period).
Annual Report
Investment Changes (Unaudited)
Top Ten Stocks as of October 31, 2010 |
| % of fund's
net assets | % of fund's net assets
6 months ago |
Platinum Underwriters Holdings Ltd. | 1.2 | 0.9 |
Forestar Group, Inc. | 1.1 | 1.2 |
CapitalSource, Inc. | 1.1 | 1.0 |
Tenneco, Inc. | 1.1 | 0.9 |
Affiliated Managers Group, Inc. | 1.0 | 0.9 |
National Penn Bancshares, Inc. | 1.0 | 1.1 |
Alexandria Real Estate Equities, Inc. | 1.0 | 1.1 |
Tempur-Pedic International, Inc. | 1.0 | 0.8 |
Franklin Street Properties Corp. | 1.0 | 0.0 |
Waddell & Reed Financial, Inc. Class A | 1.0 | 1.2 |
| 10.5 | |
Top Five Market Sectors as of October 31, 2010 |
| % of fund's
net assets | % of fund's net assets
6 months ago |
Information Technology | 21.0 | 18.7 |
Financials | 19.9 | 20.4 |
Consumer Discretionary | 14.2 | 15.6 |
Industrials | 13.8 | 14.0 |
Health Care | 12.1 | 13.5 |
Asset Allocation (% of fund's net assets) |
As of October 31, 2010 * | As of April 30, 2010 ** |
| Stocks and
Equity Futures 99.0% | | | Stocks and
Equity Futures 99.5% | |
| Short-Term
Investments and
Net Other Assets 1.0% | | | Short-Term
Investments and
Net Other Assets 0.5% | |
* Foreign investments | 7.7% | | ** Foreign investments | 8.5% | |

Annual Report
Investments October 31, 2010
Showing Percentage of Net Assets
Common Stocks - 98.9% |
| Shares | | Value (000s) |
CONSUMER DISCRETIONARY - 14.2% |
Auto Components - 1.5% |
BorgWarner, Inc. (a) | 105,200 | | $ 5,903 |
Tenneco, Inc. (a) | 462,100 | | 15,074 |
| | 20,977 |
Diversified Consumer Services - 0.2% |
Bridgepoint Education, Inc. (a)(d) | 231,342 | | 3,294 |
Hotels, Restaurants & Leisure - 1.9% |
Red Robin Gourmet Burgers, Inc. (a) | 135,000 | | 2,741 |
Vail Resorts, Inc. (a)(d) | 207,700 | | 8,424 |
WMS Industries, Inc. (a) | 155,700 | | 6,793 |
Wyndham Worldwide Corp. | 315,315 | | 9,065 |
| | 27,023 |
Household Durables - 2.6% |
iRobot Corp. (a) | 308,470 | | 6,441 |
Meritage Homes Corp. (a) | 448,000 | | 8,203 |
Mohawk Industries, Inc. (a) | 145,500 | | 8,343 |
Tempur-Pedic International, Inc. (a) | 402,546 | | 13,888 |
| | 36,875 |
Media - 0.6% |
Lamar Advertising Co. Class A (a) | 253,400 | | 8,613 |
Multiline Retail - 0.9% |
Dollarama, Inc. | 282,934 | | 7,457 |
Retail Ventures, Inc. (a) | 340,299 | | 4,625 |
| | 12,082 |
Specialty Retail - 4.5% |
Cabela's, Inc. Class A (a)(d) | 525,662 | | 9,746 |
Fourlis Holdings SA | 519,230 | | 4,963 |
Gymboree Corp. (a) | 168,000 | | 10,930 |
RadioShack Corp. (d) | 398,100 | | 8,014 |
Shoe Carnival, Inc. (a) | 468,347 | | 10,725 |
Signet Jewelers Ltd. (a) | 242,900 | | 8,545 |
Ulta Salon, Cosmetics & Fragrance, Inc. (a) | 272,619 | | 8,367 |
West Marine, Inc. (a)(d) | 273,200 | | 2,680 |
| | 63,970 |
Textiles, Apparel & Luxury Goods - 2.0% |
Deckers Outdoor Corp. (a) | 93,467 | | 5,430 |
Common Stocks - continued |
| Shares | | Value (000s) |
CONSUMER DISCRETIONARY - continued |
Textiles, Apparel & Luxury Goods - continued |
G-III Apparel Group Ltd. (a) | 451,300 | | $ 11,914 |
Phillips-Van Heusen Corp. | 167,200 | | 10,256 |
| | 27,600 |
TOTAL CONSUMER DISCRETIONARY | | 200,434 |
CONSUMER STAPLES - 3.2% |
Beverages - 0.4% |
Hansen Natural Corp. (a) | 116,900 | | 5,986 |
Food & Staples Retailing - 0.8% |
BJ's Wholesale Club, Inc. (a) | 145,700 | | 6,080 |
United Natural Foods, Inc. (a) | 142,126 | | 5,082 |
| | 11,162 |
Food Products - 1.2% |
Chiquita Brands International, Inc. (a) | 442,770 | | 5,876 |
Green Mountain Coffee Roasters, Inc. (a)(d) | 222,903 | | 7,354 |
J&J Snack Foods Corp. | 34,708 | | 1,488 |
Lance, Inc. | 89,223 | | 2,029 |
| | 16,747 |
Personal Products - 0.8% |
Elizabeth Arden, Inc. (a) | 390,155 | | 7,979 |
Nutraceutical International Corp. (a) | 185,112 | | 3,008 |
| | 10,987 |
TOTAL CONSUMER STAPLES | | 44,882 |
ENERGY - 5.0% |
Energy Equipment & Services - 1.5% |
Complete Production Services, Inc. (a) | 257,429 | | 6,032 |
Newpark Resources, Inc. (a) | 908,472 | | 5,342 |
Superior Energy Services, Inc. (a) | 245,400 | | 6,778 |
Willbros Group, Inc. (a) | 429,700 | | 3,807 |
| | 21,959 |
Oil, Gas & Consumable Fuels - 3.5% |
Atlas Pipeline Partners, LP | 489,813 | | 9,693 |
Berry Petroleum Co. Class A | 249,100 | | 8,522 |
Cloud Peak Energy, Inc. | 475,000 | | 8,251 |
EXCO Resources, Inc. | 334,000 | | 4,953 |
Common Stocks - continued |
| Shares | | Value (000s) |
ENERGY - continued |
Oil, Gas & Consumable Fuels - continued |
SM Energy Co. | 228,668 | | $ 9,531 |
Whiting Petroleum Corp. (a) | 83,065 | | 8,343 |
| | 49,293 |
TOTAL ENERGY | | 71,252 |
FINANCIALS - 19.9% |
Capital Markets - 2.9% |
Affiliated Managers Group, Inc. (a) | 165,400 | | 14,160 |
optionsXpress Holdings, Inc. (a) | 796,600 | | 12,722 |
Waddell & Reed Financial, Inc. Class A | 471,600 | | 13,709 |
| | 40,591 |
Commercial Banks - 5.4% |
Associated Banc-Corp. | 951,923 | | 12,061 |
CapitalSource, Inc. | 2,540,800 | | 15,524 |
City National Corp. | 228,400 | | 11,779 |
National Penn Bancshares, Inc. | 2,180,900 | | 14,154 |
PacWest Bancorp | 587,900 | | 10,247 |
TCF Financial Corp. | 990,800 | | 13,039 |
| | 76,804 |
Diversified Financial Services - 0.4% |
Gimv NV | 102,300 | | 5,655 |
Insurance - 3.7% |
Alterra Capital Holdings Ltd. | 521,700 | | 10,538 |
Amerisafe, Inc. (a) | 661,800 | | 12,634 |
Endurance Specialty Holdings Ltd. | 321,300 | | 13,302 |
Platinum Underwriters Holdings Ltd. | 376,100 | | 16,185 |
| | 52,659 |
Real Estate Investment Trusts - 4.0% |
Alexandria Real Estate Equities, Inc. (d) | 189,900 | | 13,954 |
Franklin Street Properties Corp. | 1,033,200 | | 13,793 |
Highwoods Properties, Inc. (SBI) | 245,300 | | 8,127 |
Home Properties, Inc. | 182,361 | | 9,930 |
National Retail Properties, Inc. | 377,100 | | 10,219 |
| | 56,023 |
Real Estate Management & Development - 2.0% |
Forestar Group, Inc. (a) | 914,700 | | 15,641 |
Jones Lang LaSalle, Inc. | 156,900 | | 12,248 |
| | 27,889 |
Common Stocks - continued |
| Shares | | Value (000s) |
FINANCIALS - continued |
Thrifts & Mortgage Finance - 1.5% |
Astoria Financial Corp. | 736,000 | | $ 9,141 |
Washington Federal, Inc. | 767,300 | | 11,533 |
| | 20,674 |
TOTAL FINANCIALS | | 280,295 |
HEALTH CARE - 12.1% |
Biotechnology - 3.4% |
Allos Therapeutics, Inc. (a)(d) | 854,912 | | 3,403 |
Amarin Corp. PLC ADR (a)(d) | 616,430 | | 1,886 |
Anadys Pharmaceuticals, Inc. (a) | 1,008,358 | | 1,462 |
ARIAD Pharmaceuticals, Inc. (a) | 1,069,718 | | 3,937 |
ArQule, Inc. (a) | 413,558 | | 2,283 |
BioMarin Pharmaceutical, Inc. (a) | 140,400 | | 3,673 |
Dynavax Technologies Corp. (a) | 1,428,141 | | 2,599 |
Incyte Corp. (a) | 242,220 | | 4,035 |
Inhibitex, Inc. (a) | 602,137 | | 1,198 |
Keryx Biopharmaceuticals, Inc. (a)(d) | 626,557 | | 3,233 |
Lexicon Pharmaceuticals, Inc. (a) | 1,690,152 | | 2,992 |
Metabolix, Inc. (a)(d) | 134,798 | | 1,882 |
Pharmasset, Inc. (a) | 64,200 | | 2,408 |
SIGA Technologies, Inc. (a) | 175,887 | | 2,331 |
Targacept, Inc. (a) | 137,359 | | 3,401 |
Telik, Inc. (a) | 965,343 | | 791 |
Theravance, Inc. (a) | 162,434 | | 3,310 |
ZIOPHARM Oncology, Inc. (a)(d) | 724,202 | | 3,121 |
| | 47,945 |
Health Care Equipment & Supplies - 2.4% |
AGA Medical Holdings, Inc. | 47,100 | | 977 |
American Medical Systems Holdings, Inc. (a) | 558,983 | | 11,291 |
Hill-Rom Holdings, Inc. | 151,600 | | 5,875 |
Masimo Corp. | 360,843 | | 10,887 |
Medical Action Industries, Inc. (a) | 58,405 | | 579 |
NxStage Medical, Inc. (a) | 241,876 | | 4,876 |
| | 34,485 |
Health Care Providers & Services - 3.7% |
Air Methods Corp. (a) | 153,822 | | 6,291 |
Alliance Healthcare Services, Inc. (a) | 1,283,435 | | 5,057 |
Centene Corp. (a) | 388,969 | | 8,682 |
Corvel Corp. (a) | 5,200 | | 233 |
Common Stocks - continued |
| Shares | | Value (000s) |
HEALTH CARE - continued |
Health Care Providers & Services - continued |
Hanger Orthopedic Group, Inc. (a) | 248,499 | | $ 4,652 |
HMS Holdings Corp. (a) | 168,314 | | 10,117 |
Humana, Inc. (a) | 150,700 | | 8,784 |
MWI Veterinary Supply, Inc. (a) | 151,000 | | 8,637 |
| | 52,453 |
Life Sciences Tools & Services - 1.2% |
eResearchTechnology, Inc. (a) | 1,004,068 | | 7,651 |
Illumina, Inc. (a) | 176,950 | | 9,610 |
| | 17,261 |
Pharmaceuticals - 1.4% |
Ardea Biosciences, Inc. (a) | 187,205 | | 3,991 |
Cardiome Pharma Corp. (a) | 315,757 | | 1,607 |
Par Pharmaceutical Companies, Inc. (a) | 68,278 | | 2,220 |
Perrigo Co. | 53,218 | | 3,506 |
Piramal Healthcare Ltd. | 70,636 | | 761 |
Questcor Pharmaceuticals, Inc. (a) | 574,319 | | 7,047 |
| | 19,132 |
TOTAL HEALTH CARE | | 171,276 |
INDUSTRIALS - 13.8% |
Aerospace & Defense - 1.1% |
Teledyne Technologies, Inc. (a) | 177,700 | | 7,387 |
Triumph Group, Inc. | 92,820 | | 7,759 |
| | 15,146 |
Air Freight & Logistics - 0.6% |
UTI Worldwide, Inc. | 471,600 | | 9,064 |
Building Products - 1.9% |
A.O. Smith Corp. | 186,326 | | 10,440 |
AAON, Inc. (d) | 294,200 | | 7,223 |
Armstrong World Industries, Inc. (a) | 229,058 | | 9,563 |
| | 27,226 |
Commercial Services & Supplies - 1.2% |
Sykes Enterprises, Inc. (a) | 309,406 | | 5,139 |
United Stationers, Inc. (a) | 203,642 | | 11,445 |
| | 16,584 |
Construction & Engineering - 1.4% |
Chicago Bridge & Iron Co. NV unit (a) | 223,100 | | 5,624 |
Common Stocks - continued |
| Shares | | Value (000s) |
INDUSTRIALS - continued |
Construction & Engineering - continued |
Foster Wheeler AG (a) | 313,272 | | $ 7,337 |
Granite Construction, Inc. | 291,200 | | 7,041 |
| | 20,002 |
Electrical Equipment - 1.3% |
General Cable Corp. (a) | 340,315 | | 9,508 |
Regal-Beloit Corp. | 151,600 | | 8,749 |
| | 18,257 |
Industrial Conglomerates - 0.5% |
Carlisle Companies, Inc. | 202,000 | | 7,084 |
Machinery - 3.4% |
Accuride Corp. (a) | 3,840,500 | | 4,762 |
Actuant Corp. Class A | 418,921 | | 9,413 |
CLARCOR, Inc. | 244,214 | | 9,686 |
Gardner Denver, Inc. | 55,900 | | 3,232 |
John Bean Technologies Corp. | 445,800 | | 7,623 |
Manitowoc Co., Inc. | 613,700 | | 6,837 |
Wabtec Corp. | 132,329 | | 6,198 |
| | 47,751 |
Professional Services - 0.5% |
Advisory Board Co. (a) | 160,116 | | 7,495 |
Road & Rail - 0.5% |
Kansas City Southern (a) | 161,500 | | 7,077 |
Trading Companies & Distributors - 1.4% |
Interline Brands, Inc. (a) | 512,200 | | 10,290 |
WESCO International, Inc. (a) | 207,600 | | 8,889 |
| | 19,179 |
TOTAL INDUSTRIALS | | 194,865 |
INFORMATION TECHNOLOGY - 21.0% |
Communications Equipment - 3.6% |
Blue Coat Systems, Inc. (a) | 296,025 | | 7,984 |
DG FastChannel, Inc. (a) | 298,711 | | 7,035 |
DragonWave, Inc. (a)(d) | 647,000 | | 5,291 |
Emulex Corp. (a) | 968,500 | | 11,041 |
Ixia (a) | 615,692 | | 9,636 |
NETGEAR, Inc. (a) | 311,532 | | 9,598 |
| | 50,585 |
Common Stocks - continued |
| Shares | | Value (000s) |
INFORMATION TECHNOLOGY - continued |
Computers & Peripherals - 2.8% |
NCR Corp. (a) | 468,100 | | $ 6,422 |
Quantum Corp. (a) | 1,776,300 | | 6,004 |
SanDisk Corp. (a) | 168,502 | | 6,332 |
Super Micro Computer, Inc. (a) | 879,447 | | 9,779 |
Synaptics, Inc. (a)(d) | 394,480 | | 10,623 |
| | 39,160 |
Electronic Equipment & Components - 3.2% |
Anixter International, Inc. | 187,200 | | 10,051 |
Avnet, Inc. (a) | 384,730 | | 11,457 |
Electro Scientific Industries, Inc. (a) | 159,398 | | 1,852 |
Jabil Circuit, Inc. | 439,100 | | 6,736 |
Plexus Corp. (a) | 254,178 | | 7,714 |
Vishay Intertechnology, Inc. (a) | 623,863 | | 7,050 |
| | 44,860 |
Internet Software & Services - 3.6% |
Art Technology Group, Inc. (a) | 2,632,439 | | 11,030 |
Constant Contact, Inc. (a) | 192,728 | | 4,433 |
Rackspace Hosting, Inc. (a)(d) | 447,501 | | 11,170 |
Terremark Worldwide, Inc. (a)(d) | 1,249,556 | | 12,483 |
VeriSign, Inc. (a) | 324,591 | | 11,280 |
| | 50,396 |
IT Services - 1.7% |
Alliance Data Systems Corp. (a) | 174,600 | | 10,602 |
Sapient Corp. | 437,497 | | 5,757 |
Wright Express Corp. (a) | 224,599 | | 8,470 |
| | 24,829 |
Semiconductors & Semiconductor Equipment - 2.8% |
Amkor Technology, Inc. (a) | 586,759 | | 4,231 |
MEMC Electronic Materials, Inc. (a) | 436,482 | | 5,596 |
Micron Technology, Inc. (a) | 726,324 | | 6,007 |
Power Integrations, Inc. | 121,917 | | 4,165 |
Standard Microsystems Corp. (a) | 279,490 | | 6,747 |
TriQuint Semiconductor, Inc. (a) | 696,304 | | 7,172 |
Varian Semiconductor Equipment Associates, Inc. (a) | 187,600 | | 6,129 |
| | 40,047 |
Software - 3.3% |
Blackboard, Inc. (a)(d) | 202,540 | | 8,454 |
JDA Software Group, Inc. (a) | 255,593 | | 6,467 |
Kenexa Corp. (a) | 277,035 | | 5,067 |
Common Stocks - continued |
| Shares | | Value (000s) |
INFORMATION TECHNOLOGY - continued |
Software - continued |
Mentor Graphics Corp. (a) | 675,302 | | $ 7,293 |
Nuance Communications, Inc. (a) | 610,100 | | 9,585 |
Parametric Technology Corp. (a) | 390,970 | | 8,394 |
Synchronoss Technologies, Inc. (a) | 38,300 | | 816 |
| | 46,076 |
TOTAL INFORMATION TECHNOLOGY | | 295,953 |
MATERIALS - 5.3% |
Chemicals - 2.4% |
Cabot Corp. | 302,700 | | 10,298 |
Rockwood Holdings, Inc. (a) | 365,700 | | 12,405 |
Solutia, Inc. (a) | 586,500 | | 10,622 |
| | 33,325 |
Construction Materials - 0.3% |
Texas Industries, Inc. (d) | 136,800 | | 4,674 |
Metals & Mining - 2.6% |
Carpenter Technology Corp. | 295,373 | | 10,533 |
Coeur d'Alene Mines Corp. (a) | 328,600 | | 6,772 |
Compass Minerals International, Inc. | 136,600 | | 10,774 |
HudBay Minerals, Inc. | 568,400 | | 8,973 |
| | 37,052 |
TOTAL MATERIALS | | 75,051 |
TELECOMMUNICATION SERVICES - 1.2% |
Diversified Telecommunication Services - 0.9% |
AboveNet, Inc. (a) | 65,207 | | 3,710 |
Cbeyond, Inc. (a) | 188,472 | | 2,554 |
Global Crossing Ltd. (a) | 217,701 | | 2,961 |
PAETEC Holding Corp. (a) | 655,679 | | 2,767 |
| | 11,992 |
Wireless Telecommunication Services - 0.3% |
Syniverse Holdings, Inc. (a) | 140,476 | | 4,283 |
TOTAL TELECOMMUNICATION SERVICES | | 16,275 |
UTILITIES - 3.2% |
Electric Utilities - 1.8% |
Cleco Corp. | 228,300 | | 7,139 |
Common Stocks - continued |
| Shares | | Value (000s) |
UTILITIES - continued |
Electric Utilities - continued |
Great Plains Energy, Inc. | 312,900 | | $ 5,954 |
Otter Tail Corp. | 99,372 | | 2,039 |
Portland General Electric Co. | 201,000 | | 4,201 |
Westar Energy, Inc. | 233,600 | | 5,910 |
| | 25,243 |
Gas Utilities - 1.0% |
Northwest Natural Gas Co. | 118,700 | | 5,851 |
Southwest Gas Corp. | 229,200 | | 7,967 |
| | 13,818 |
Multi-Utilities - 0.4% |
NorthWestern Energy Corp. | 220,200 | | 6,555 |
TOTAL UTILITIES | | 45,616 |
TOTAL COMMON STOCKS (Cost $1,201,387) | 1,395,899 |
U.S. Treasury Obligations - 0.3% |
| Principal Amount (000s) | | |
U.S. Treasury Bills, yield at date of purchase 0.12% to 0.15% 11/4/10 to 11/26/10 (e)
(Cost $3,980) | | $ 3,980 | | 3,980 |
Money Market Funds - 8.2% |
| Shares | | |
Fidelity Cash Central Fund, 0.23% (b) | 45,994,592 | | 45,995 |
Fidelity Securities Lending Cash Central Fund, 0.24% (b)(c) | 69,216,960 | | 69,217 |
TOTAL MONEY MARKET FUNDS (Cost $115,212) | 115,212 |
Cash Equivalents - 0.0% |
| Maturity Amount (000s) | | Value (000s) |
Investments in repurchase agreements in a joint trading account at 0.22%, dated 10/29/10 due 11/1/10 (Collateralized by U.S. Treasury Obligations) #
(Cost $38) | $ 38 | | $ 38 |
TOTAL INVESTMENT PORTFOLIO - 107.4% (Cost $1,320,617) | | 1,515,129 |
NET OTHER ASSETS (LIABILITIES) - (7.4)% | | (103,762) |
NET ASSETS - 100% | $ 1,411,367 |
Futures Contracts |
| Expiration Date | | Underlying Face Amount at Value (000s) | | Unrealized Appreciation/
(Depreciation) (000s) |
Purchased |
Equity Index Contracts |
17 NYFE Russell Mini Index Contracts | Dec. 2010 | | $ 1,194 | | $ (8) |
The face value of futures purchased as a percentage of net assets is 0.1% |
Legend |
(a) Non-income producing |
(b) Affiliated fund that is available only to investment companies and other accounts managed by Fidelity Investments. The rate quoted is the annualized seven-day yield of the fund at period end. A complete unaudited listing of the fund's holdings as of its most recent quarter end is available upon request. In addition, each Fidelity Central Fund's financial statements, which are not covered by the Fund's report of Independent Registered Public Accounting Firm, are available on the SEC's website or upon request. |
(c) Investment made with cash collateral received from securities on loan. |
(d) Security or a portion of the security is on loan at period end. |
(e) Security or a portion of the security was pledged to cover margin requirements for futures contracts. At the period end, the value of securities pledged amounted to $2,500,000. |
# Additional information on each counterparty to the repurchase agreement is as follows: |
Repurchase Agreement / Counterparty | Value
(Amounts in thousands) |
$38,000 due 11/01/10 at 0.22% |
BNP Paribas Securities Corp. | $ 6 |
Barclays Capital, Inc. | 9 |
Credit Agricole Securities (USA), Inc. | 2 |
Credit Suisse Securities (USA) LLC | 2 |
Deutsche Bank Securities, Inc. | 3 |
HSBC Securities (USA), Inc. | 3 |
J.P. Morgan Securities, Inc. | 8 |
Mizuho Securities USA, Inc. | 2 |
Societe Generale, New York Branch | 2 |
UBS Securities LLC | 1 |
Wells Fargo Securities LLC | 0 * |
| $ 38 |
* Amount represents less than $1,000 |
Affiliated Central Funds |
Information regarding fiscal year to date income earned by the Fund from investments in Fidelity Central Funds is as follows: |
Fund | Income earned
(Amounts in thousands) |
Fidelity Cash Central Fund | $ 40 |
Fidelity Securities Lending Cash Central Fund | 968 |
Total | $ 1,008 |
Other Affiliated Issuers |
An affiliated company is a company in which the Fund has ownership of at least 5% of the voting securities. Fiscal year to date transactions with companies which are or were affiliates are as follows: |
Affiliate
(Amounts in thousands) | Value, beginning of period | Purchases | Sales Proceeds | Dividend Income | Value,
end of period |
Carluccio's PLC | $ 5,605 | $ - | $ 4,845 | $ - | $ - |
Conceptus, Inc. | 28,241 | - | 28,343 | - | - |
Diedrich Coffee, Inc. | 7,253 | - | 10,075 | - | - |
Ruth's Hospitality Group, Inc. | 5,602 | - | 4,375 | - | - |
Zale Corp. | 7,613 | - | 4,489 | - | - |
Total | $ 54,314 | $ - | $ 52,127 | $ - | $ - |
Other Information |
The following is a summary of the inputs used, as of October 31, 2010, involving the Fund's assets and liabilities carried at fair value. The inputs or methodology used for valuing securities may not be an indication of the risk associated with investing in those securities. For more information on valuation inputs, and their aggregation into the levels used in the table below, please refer to the Security Valuation section in the accompanying Notes to Financial Statements. |
Valuation Inputs at Reporting Date: |
Description
(Amounts in thousands) | Total | Level 1 | Level 2 | Level 3 |
Investments in Securities: | | | | |
Equities: | | | | |
Consumer Discretionary | $ 200,434 | $ 200,434 | $ - | $ - |
Consumer Staples | 44,882 | 44,882 | - | - |
Energy | 71,252 | 71,252 | - | - |
Financials | 280,295 | 280,295 | - | - |
Health Care | 171,276 | 171,276 | - | - |
Industrials | 194,865 | 194,865 | - | - |
Information Technology | 295,953 | 295,953 | - | - |
Materials | 75,051 | 75,051 | - | - |
Telecommunication Services | 16,275 | 16,275 | - | - |
Utilities | 45,616 | 45,616 | - | - |
U.S. Government and Government Agency Obligations | 3,980 | - | 3,980 | - |
Money Market Funds | 115,212 | 115,212 | - | - |
Cash Equivalents | 38 | - | 38 | - |
Total Investments in Securities: | $ 1,515,129 | $ 1,511,111 | $ 4,018 | $ - |
Derivative Instruments: | | | | |
Liabilities | | | | |
Futures Contracts | $ (8) | $ (8) | $ - | $ - |
Value of Derivative Instruments |
The following table is a summary of the Fund's value of derivative instruments by risk exposure as of October 31, 2010. For additional information on derivative instruments, please refer to the Derivative Instruments section in the accompanying Notes to Financial Statements. |
Risk Exposure /
Derivative Type | Value
(Amounts in thousands) |
| Asset | Liability |
Equity Risk | | |
Futures Contracts (a) | $ - | $ (8) |
Total Value of Derivatives | $ - | $ (8) |
(a) Reflects cumulative appreciation/(depreciation) on futures contracts as disclosed on the Schedule of Investments. Only the period end variation margin is separately disclosed on the Statement of Assets and Liabilities. |
Income Tax Information |
At October 31, 2010, the Fund had a capital loss carryforward of approximately $519,765,000 of which $190,671,000 and $329,094,000 will expire on October 31, 2016 and 2017, respectively. Capital loss carryforwards are only available to offset future capital gains of the Fund to the extent provided by regulations and may be limited. |
See accompanying notes which are an integral part of the financial statements.
Annual Report
Statement of Assets and Liabilities
Amounts in thousands (except per-share amounts) | October 31, 2010 |
| | |
Assets | | |
Investment in securities, at value (including securities loaned of $67,090 and repurchase agreements of $38) - See accompanying schedule: Unaffiliated issuers (cost $1,205,405) | $ 1,399,917 | |
Fidelity Central Funds (cost $115,212) | 115,212 | |
Total Investments (cost $1,320,617) | | $ 1,515,129 |
Receivable for investments sold | | 16,422 |
Receivable for fund shares sold | | 1,608 |
Dividends receivable | | 641 |
Distributions receivable from Fidelity Central Funds | | 85 |
Receivable for daily variation on futures contracts | | 186 |
Other receivables | | 293 |
Total assets | | 1,534,364 |
| | |
Liabilities | | |
Payable to custodian bank | $ 2,664 | |
Payable for investments purchased | 17,105 | |
Payable for fund shares redeemed | 33,118 | |
Accrued management fee | 464 | |
Distribution and service plan fees payable | 2 | |
Other affiliated payables | 358 | |
Other payables and accrued expenses | 69 | |
Collateral on securities loaned, at value | 69,217 | |
Total liabilities | | 122,997 |
| | |
Net Assets | | $ 1,411,367 |
Net Assets consist of: | | |
Paid in capital | | $ 1,735,139 |
Undistributed net investment income | | 2,128 |
Accumulated undistributed net realized gain (loss) on investments and foreign currency transactions | | (520,405) |
Net unrealized appreciation (depreciation) on investments and assets and liabilities in foreign currencies | | 194,505 |
Net Assets | | $ 1,411,367 |
See accompanying notes which are an integral part of the financial statements.
Annual Report
Statement of Assets and Liabilities - continued
Amounts in thousands (except per-share amounts) | October 31, 2010 |
| | |
Calculation of Maximum Offering Price
Class A:
Net Asset Value and redemption price per share
($3,333.26 ÷ 205.718 shares) | | $ 16.20 |
| | |
Maximum offering price per share (100/94.25 of $16.20) | | $ 17.19 |
Class T:
Net Asset Value and redemption price per share
($723.22 ÷ 45.018 shares) | | $ 16.07 |
| | |
Maximum offering price per share (100/96.50 of $16.07) | | $ 16.65 |
Class B:
Net Asset Value and offering price per share
($220.18 ÷ 13.878 shares)A | | $ 15.87 |
| | |
Class C:
Net Asset Value and offering price per share
($820.35 ÷ 51.847 shares)A | | $ 15.82 |
| | |
Stock Selector Small Cap:
Net Asset Value, offering price and redemption price per share ($1,405,590.11 ÷ 85,986.331 shares) | | $ 16.35 |
| | |
Institutional Class:
Net Asset Value, offering price and redemption price per share ($680.18 ÷ 41.509 shares) | | $ 16.39 |
A Redemption price per share is equal to net asset value less any applicable contingent deferred sales charge.
See accompanying notes which are an integral part of the financial statements.
Annual Report
Financial Statements - continued
Statement of Operations
Amounts in thousands | Year ended October 31, 2010 |
| | |
Investment Income | | |
Dividends | | $ 11,311 |
Special dividends | | 1,410 |
Interest | | 26 |
Income from Fidelity Central Funds (including $968 from security lending) | | 1,008 |
Total income | | 13,755 |
| | |
Expenses | | |
Management fee
Basic fee | $ 9,025 | |
Performance adjustment | (3,256) | |
Transfer agent fees | 4,158 | |
Distribution and service plan fees | 20 | |
Accounting and security lending fees | 495 | |
Custodian fees and expenses | 142 | |
Independent trustees' compensation | 9 | |
Registration fees | 95 | |
Audit | 56 | |
Legal | 14 | |
Interest | 1 | |
Miscellaneous | 21 | |
Total expenses before reductions | 10,780 | |
Expense reductions | (154) | 10,626 |
Net investment income (loss) | | 3,129 |
Realized and Unrealized Gain (Loss) Net realized gain (loss) on: | | |
Investment securities: | | |
Unaffiliated issuers | 276,007 | |
Other affiliated issuers | 1,647 | |
Foreign currency transactions | (62) | |
Futures contracts | 2,661 | |
Capital gain distributions from Fidelity Central Funds | 3 | |
Total net realized gain (loss) | | 280,256 |
Change in net unrealized appreciation (depreciation) on: Investment securities | 94,903 | |
Assets and liabilities in foreign currencies | (13) | |
Futures contracts | (8) | |
Total change in net unrealized appreciation (depreciation) | | 94,882 |
Net gain (loss) | | 375,138 |
Net increase (decrease) in net assets resulting from operations | | $ 378,267 |
See accompanying notes which are an integral part of the financial statements.
Annual Report
Statement of Changes in Net Assets
Amounts in thousands | Year ended October 31,
2010 | Year ended October 31,
2009 |
Increase (Decrease) in Net Assets | | |
Operations | | |
Net investment income (loss) | $ 3,129 | $ 2,776 |
Net realized gain (loss) | 280,256 | (315,874) |
Change in net unrealized appreciation (depreciation) | 94,882 | 465,364 |
Net increase (decrease) in net assets resulting
from operations | 378,267 | 152,266 |
Distributions to shareholders from net investment income | (976) | (2,638) |
Share transactions - net increase (decrease) | (349,513) | (62,137) |
Redemption fees | 175 | 136 |
Total increase (decrease) in net assets | 27,953 | 87,627 |
| | |
Net Assets | | |
Beginning of period | 1,383,414 | 1,295,787 |
End of period (including undistributed net investment income of $2,128 and accumulated net investment loss of $0, respectively) | $ 1,411,367 | $ 1,383,414 |
See accompanying notes which are an integral part of the financial statements.
Annual Report
Financial Highlights - Class A
Years ended October 31, | 2010 | 2009 | 2008 | 2007 I |
Selected Per-Share Data | | | | |
Net asset value, beginning of period | $ 12.53 | $ 11.24 | $ 24.79 | $ 23.20 |
Income from Investment Operations | | | | |
Net investment income (loss) E | (.01)L | - K | (.04) | (.07) H |
Net realized and unrealized gain (loss) | 3.68 | 1.31 | (10.77) | 1.66 |
Total from investment operations | 3.67 | 1.31 | (10.81) | 1.59 |
Distributions from net investment income | - K | (.02) | - | - |
Distributions from net realized gain | - | - | (2.74) | - |
Total distributions | - K | (.02) | (2.74) | - |
Redemption fees added to paid in capital E, K | - | - | - | - |
Net asset value, end of period | $ 16.20 | $ 12.53 | $ 11.24 | $ 24.79 |
Total Return B, C, D | 29.32% | 11.69% | (48.52)% | 6.85% |
Ratios to Average Net Assets F, J | | | | |
Expenses before reductions | 1.00% | 1.03% | 1.24% | 1.27% A |
Expenses net of fee waivers, if any | 1.00% | 1.03% | 1.24% | 1.27% A |
Expenses net of all reductions | .99% | 1.01% | 1.23% | 1.26% A |
Net investment income (loss) | (.07)%L | (.03)% | (.24)% | (.57)% A, H |
Supplemental Data | | | | |
Net assets, end of period (in millions) | $ 3 | $ 3 | $ 2 | $ 1 |
Portfolio turnover rate G | 138% | 135% | 101% | 84% |
A Annualized
B Total returns for periods of less than one year are not annualized.
C Total returns would have been lower had certain expenses not been reduced during the periods shown.
D Total returns do not include the effect of the sales charges.
E Calculated based on average shares outstanding during the period.
F Fees and expenses of the underlying Fidelity Central Funds are not included in the Fund's expense ratio. The Fund indirectly bears its proportionate share of the expenses of any underlying Fidelity Central Funds.
G Amount does not include the portfolio activity of any underlying Fidelity Central Funds.
H Investment income per share reflects a special dividend which amounted to $.01 per share. Excluding the special dividend, the ratio of net investment income (loss) to average net assets would have been (.66)%.
I For the period May 2, 2007 (commencement of sale of shares) to October 31, 2007.
J Expense ratios reflect operating expenses of the class. Expenses before reductions do not reflect amounts reimbursed by the investment adviser or reductions from brokerage service arrangements or reductions from other expense offset arrangements and do not represent the amount paid by the class during periods when reimbursements or reductions occur. Expense ratios before reductions for start-up periods may not be representative of longer-term operating periods. Expenses net of fee waivers reflect expenses after reimbursement by the investment adviser but prior to reductions from brokerage service arrangements or other expense offset arrangements. Expenses net of all reductions represent the net expenses paid by the class.
K Amount represents less than $.01 per share.
L Investment income per share reflects a special dividend which amounted to $.01 per share. Excluding the special dividend, the ratio of net investment income (loss) to average net assets would have been (.16)%.
See accompanying notes which are an integral part of the financial statements.
Annual Report
Financial Highlights - Class T
Years ended October 31, | 2010 | 2009 | 2008 | 2007 I |
Selected Per-Share Data | | | | |
Net asset value, beginning of period | $ 12.45 | $ 11.19 | $ 24.74 | $ 23.20 |
Income from Investment Operations | | | | |
Net investment income (loss) E | (.05)L | (.03) | (.08) | (.10) H |
Net realized and unrealized gain (loss) | 3.67 | 1.30 | (10.76) | 1.64 |
Total from investment operations | 3.62 | 1.27 | (10.84) | 1.54 |
Distributions from net investment income | - | (.01) | - | - |
Distributions from net realized gain | - | - | (2.71) | - |
Total distributions | - | (.01) | (2.71) | - |
Redemption fees added to paid in capital E, K | - | - | - | - |
Net asset value, end of period | $ 16.07 | $ 12.45 | $ 11.19 | $ 24.74 |
Total Return B, C, D | 29.08% | 11.42% | (48.70)% | 6.64% |
Ratios to Average Net Assets F, J | | | | |
Expenses before reductions | 1.27% | 1.30% | 1.50% | 1.53% A |
Expenses net of fee waivers, if any | 1.27% | 1.30% | 1.50% | 1.53% A |
Expenses net of all reductions | 1.26% | 1.29% | 1.49% | 1.52% A |
Net investment income (loss) | (.33)%L | (.31)% | (.50)% | (.83)% A, H |
Supplemental Data | | | | |
Net assets, end of period (000 omitted) | $ 723 | $ 550 | $ 409 | $ 420 |
Portfolio turnover rate G | 138% | 135% | 101% | 84% |
A Annualized
B Total returns for periods of less than one year are not annualized.
C Total returns would have been lower had certain expenses not been reduced during the periods shown.
D Total returns do not include the effect of the sales charges.
E Calculated based on average shares outstanding during the period.
F Fees and expenses of the underlying Fidelity Central Funds are not included in the Fund's expense ratio. The Fund indirectly bears its proportionate share of the expenses of any underlying Fidelity Central Funds.
G Amount does not include the portfolio activity of any underlying Fidelity Central Funds.
H Investment income per share reflects a special dividend which amounted to $.01 per share. Excluding the special dividend, the ratio of net investment income (loss) to average net assets would have been (.92)%.
I For the period May 2, 2007 (commencement of sale of shares) to October 31, 2007.
J Expense ratios reflect operating expenses of the class. Expenses before reductions do not reflect amounts reimbursed by the investment adviser or reductions from brokerage service arrangements or reductions from other expense offset arrangements and do not represent the amount paid by the class during periods when reimbursements or reductions occur. Expense ratios before reductions for start-up periods may not be representative of longer-term operating periods. Expenses net of fee waivers reflect expenses after reimbursement by the investment adviser but prior to reductions from brokerage service arrangements or other expense offset arrangements. Expenses net of all reductions represent the net expenses paid by the class.
K Amount represents less than $.01 per share.
L Investment income per share reflects a special dividend which amounted to $.01 per share. Excluding the special dividend, the ratio of net investment income (loss) to average net assets would have been (.43)%.
See accompanying notes which are an integral part of the financial statements.
Annual Report
Financial Highlights - Class B
Years ended October 31, | 2010 | 2009 | 2008 | 2007 I |
Selected Per-Share Data | | | | |
Net asset value, beginning of period | $ 12.36 | $ 11.15 | $ 24.69 | $ 23.20 |
Income from Investment Operations | | | | |
Net investment income (loss) E | (.12)L | (.08) | (.17) | (.15) H |
Net realized and unrealized gain (loss) | 3.63 | 1.30 | (10.73) | 1.64 |
Total from investment operations | 3.51 | 1.22 | (10.90) | 1.49 |
Distributions from net investment income | - | (.01) | - | - |
Distributions from net realized gain | - | - | (2.64) | - |
Total distributions | - | (.01) | (2.64) | - |
Redemption fees added to paid in capital E, K | - | - | - | - |
Net asset value, end of period | $ 15.87 | $ 12.36 | $ 11.15 | $ 24.69 |
Total Return B, C, D | 28.40% | 10.92% | (48.94)% | 6.42% |
Ratios to Average Net Assets F, J | | | | |
Expenses before reductions | 1.76% | 1.77% | 1.99% | 2.07% A |
Expenses net of fee waivers, if any | 1.76% | 1.77% | 1.99% | 2.05% A |
Expenses net of all reductions | 1.75% | 1.75% | 1.99% | 2.04% A |
Net investment income (loss) | (.82)%L | (.78)% | (1.00)% | (1.32)% A, H |
Supplemental Data | | | | |
Net assets, end of period (000 omitted) | $ 220 | $ 219 | $ 199 | $ 419 |
Portfolio turnover rate G | 138% | 135% | 101% | 84% |
A Annualized
B Total returns for periods of less than one year are not annualized.
C Total returns would have been lower had certain expenses not been reduced during the periods shown.
D Total returns do not include the effect of the contingent deferred sales charge.
E Calculated based on average shares outstanding during the period.
F Fees and expenses of the underlying Fidelity Central Funds are not included in the Fund's expense ratio. The Fund indirectly bears its proportionate share of the expenses of any underlying Fidelity Central Funds.
G Amount does not include the portfolio activity of any underlying Fidelity Central Funds.
H Investment income per share reflects a special dividend which amounted to $.01 per share. Excluding the special dividend, the ratio of net investment income (loss) to average net assets would have been (1.41)%.
I For the period May 2, 2007 (commencement of sale of shares) to October 31, 2007.
J Expense ratios reflect operating expenses of the class. Expenses before reductions do not reflect amounts reimbursed by the investment adviser or reductions from brokerage service arrangements or reductions from other expense offset arrangements and do not represent the amount paid by the class during periods when reimbursements or reductions occur. Expense ratios before reductions for start-up periods may not be representative of longer-term operating periods. Expenses net of fee waivers reflect expenses after reimbursement by the investment adviser but prior to reductions from brokerage service arrangements or other expense offset arrangements. Expenses net of all reductions represent the net expenses paid by the class.
K Amount represents less than $.01 per share.
L Investment income per share reflects a special dividend which amounted to $.01 per share. Excluding the special dividend, the ratio of net investment income (loss) to average net assets would have been (.92)%.
See accompanying notes which are an integral part of the financial statements.
Annual Report
Financial Highlights - Class C
Years ended October 31, | 2010 | 2009 | 2008 | 2007 I |
Selected Per-Share Data | | | | |
Net asset value, beginning of period | $ 12.33 | $ 11.12 | $ 24.71 | $ 23.20 |
Income from Investment Operations | | | | |
Net investment income (loss) E | (.12)L | (.09) | (.17) | (.15) H |
Net realized and unrealized gain (loss) | 3.61 | 1.31 | (10.72) | 1.66 |
Total from investment operations | 3.49 | 1.22 | (10.89) | 1.51 |
Distributions from net investment income | - | (.01) | - | - |
Distributions from net realized gain | - | - | (2.70) | - |
Total distributions | - | (.01) | (2.70) | - |
Redemption fees added to paid in capital E, K | - | - | - | - |
Net asset value, end of period | $ 15.82 | $ 12.33 | $ 11.12 | $ 24.71 |
Total Return B, C, D | 28.30% | 10.96% | (48.95)% | 6.51% |
Ratios to Average Net Assets F, J | | | | |
Expenses before reductions | 1.75% | 1.76% | 2.00% | 1.98% A |
Expenses net of fee waivers, if any | 1.75% | 1.76% | 2.00% | 1.98% A |
Expenses net of all reductions | 1.74% | 1.75% | 1.99% | 1.97% A |
Net investment income (loss) | (.81)%L | (.77)% | (1.01)% | (1.27)% A, H |
Supplemental Data | | | | |
Net assets, end of period (000 omitted) | $ 820 | $ 428 | $ 183 | $ 294 |
Portfolio turnover rate G | 138% | 135% | 101% | 84% |
A Annualized
B Total returns for periods of less than one year are not annualized.
C Total returns would have been lower had certain expenses not been reduced during the periods shown.
D Total returns do not include the effect of the contingent deferred sales charge.
E Calculated based on average shares outstanding during the period.
F Fees and expenses of the underlying Fidelity Central Funds are not included in the Fund's expense ratio. The Fund indirectly bears its proportionate share of the expenses of any underlying Fidelity Central Funds.
G Amount does not include the portfolio activity of any underlying Fidelity Central Funds.
H Investment income per share reflects a special dividend which amounted to $.01 per share. Excluding the special dividend, the ratio of net investment income (loss) to average net assets would have been (1.36)%.
I For the period May 2, 2007 (commencement of sale of shares) to October 31, 2007.
J Expense ratios reflect operating expenses of the class. Expenses before reductions do not reflect amounts reimbursed by the investment adviser or reductions from brokerage service arrangements or reductions from other expense offset arrangements and do not represent the amount paid by the class during periods when reimbursements or reductions occur. Expense ratios before reductions for start-up periods may not be representative of longer-term operating periods. Expenses net of fee waivers reflect expenses after reimbursement by the investment adviser but prior to reductions from brokerage service arrangements or other expense offset arrangements. Expenses net of all reductions represent the net expenses paid by the class.
K Amount represents less than $.01 per share.
L Investment income per share reflects a special dividend which amounted to $.01 per share. Excluding the special dividend, the ratio of net investment income (loss) to average net assets would have been (.91)%.
See accompanying notes which are an integral part of the financial statements.
Annual Report
Financial Highlights - Stock Selector Small Cap
Years ended October 31, | 2010 | 2009 | 2008 | 2007 | 2006 |
Selected Per-Share Data | | | | | |
Net asset value, beginning of period | $ 12.61 | $ 11.28 | $ 24.81 | $ 22.23 | $ 20.82 |
Income from Investment Operations | | | | | |
Net investment income (loss) B | .03I | .02 | .01 | (.04) E | .07 F |
Net realized and unrealized gain (loss) | 3.72 | 1.33 | (10.82) | 5.01 | 2.75 |
Total from investment operations | 3.75 | 1.35 | (10.81) | 4.97 | 2.82 |
Distributions from net investment income | (.01) | (.02) | - | (.05) | (.07) |
Distributions from net realized gain | - | - | (2.72) | (2.34) | (1.34) |
Total distributions | (.01) | (.02) | (2.72) | (2.39) | (1.41) |
Redemption fees added to paid in capital B, H | - | - | - | - | - |
Net asset value, end of period | $ 16.35 | $ 12.61 | $ 11.28 | $ 24.81 | $ 22.23 |
Total Return A | 29.75% | 12.05% | (48.42)% | 24.42% | 14.08% |
Ratios to Average Net Assets C, G | | | | | |
Expenses before reductions | .73% | .77% | .95% | 1.01% | .86% |
Expenses net of fee waivers, if any | .73% | .77% | .95% | 1.00% | .86% |
Expenses net of all reductions | .72% | .75% | .94% | .99% | .81% |
Net investment income (loss) | .21%I | .22% | .05% | (.20)% E | .32% F |
Supplemental Data | | | | | |
Net assets, end of period (in millions) | $ 1,406 | $ 1,379 | $ 1,292 | $ 2,602 | $ 2,623 |
Portfolio turnover rate D | 138% | 135% | 101% | 84% | 126% |
A Total returns would have been lower had certain expenses not been reduced during the periods shown.
B Calculated based on average shares outstanding during the period.
C Fees and expenses of the underlying Fidelity Central Funds are not included in the Fund's expense ratio. The Fund indirectly bears its proportionate share of the expenses of any underlying Fidelity Central Funds.
D Amount does not include the portfolio activity of any underlying Fidelity Central Funds.
E Investment income per share reflects a special dividend which amounted to $.02 per share. Excluding the special dividend, the ratio of net investment income (loss) to average net assets would have been (.29)%.
F Investment income per share reflects a special dividend which amounted to $.02 per share. Excluding the special dividend, the ratio of net investment income (loss) to average net assets would have been (.22%).
G Expense ratios reflect operating expenses of the class. Expenses before reductions do not reflect amounts reimbursed by the investment adviser or reductions from brokerage service arrangements or reductions from other expense offset arrangements and do not represent the amount paid by the class during periods when reimbursements or reductions occur. Expenses net of fee waivers reflect expenses after reimbursement by the investment adviser but prior to reductions from brokerage service arrangements or other expense offset arrangements. Expenses net of all reductions represent the net expenses paid by the class.
H Amount represents less than $.01 per share.
I Investment income per share reflects a special dividend which amounted to $.01 per share. Excluding the special dividend, the ratio of net investment income (loss) to average net assets would have been .12%.
See accompanying notes which are an integral part of the financial statements.
Annual Report
Financial Highlights - Institutional Class
Years ended October 31, | 2010 | 2009 | 2008 | 2007 H |
Selected Per-Share Data | | | | |
Net asset value, beginning of period | $ 12.63 | $ 11.29 | $ 24.82 | $ 23.20 |
Income from Investment Operations | | | | |
Net investment income (loss) D | .05 K | .04 | .02 | (.03) G |
Net realized and unrealized gain (loss) | 3.72 | 1.32 | (10.82) | 1.65 |
Total from investment operations | 3.77 | 1.36 | (10.80) | 1.62 |
Distributions from net investment income | (.01) | (.02) | - | - |
Distributions from net realized gain | - | - | (2.73) | - |
Total distributions | (.01) | (.02) | (2.73) | - |
Redemption fees added to paid in capitalD, J | - | - | - | - |
Net asset value, end of period | $ 16.39 | $ 12.63 | $ 11.29 | $ 24.82 |
Total Return B, C | 29.89% | 12.14% | (48.36)% | 6.98% |
Ratios to Average Net Assets E, I | | | | |
Expenses before reductions | .63% | .63% | .84% | .94% A |
Expenses net of fee waivers, if any | .63% | .63% | .84% | .94% A |
Expenses net of all reductions | .62% | .62% | .84% | .93% A |
Net investment income (loss) | .31%K | .36% | .15% | (.24)% A, G |
Supplemental Data | | | | |
Net assets, end of period (000 omitted) | $ 680 | $ 413 | $ 376 | $ 162 |
Portfolio turnover rate F | 138% | 135% | 101% | 84% |
A Annualized
B Total returns for periods of less than one year are not annualized.
C Total returns would have been lower had certain expenses not been reduced during the periods shown.
D Calculated based on average shares outstanding during the period.
E Fees and expenses of the underlying Fidelity Central Funds are not included in the Fund's expense ratio. The Fund indirectly bears its proportionate share of the expenses of any underlying Fidelity Central Funds.
F Amount does not include the portfolio activity of any underlying Fidelity Central Funds.
G Investment income per share reflects a special dividend which amounted to $.01 per share. Excluding the special dividend, the ratio of net investment income (loss) to average net assets would have been (.33)%.
H For the period May 2, 2007 (commencement of sale of shares) to October 31, 2007.
I Expense ratios reflect operating expenses of the class. Expenses before reductions do not reflect amounts reimbursed by the investment adviser or reductions from brokerage service arrangements or reductions from other expense offset arrangements and do not represent the amount paid by the class during periods when reimbursements or reductions occur. Expense ratios before reductions for start-up periods may not be representative of longer-term operating periods. Expenses net of fee waivers reflect expenses after reimbursement by the investment adviser but prior to reductions from brokerage service arrangements or other expense offset arrangements. Expenses net of all reductions represent the net expenses paid by the class.
J Amount represents less than $.01 per share.
K Investment income per share reflects a special dividend which amounted to $.01 per share. Excluding the special dividend, the ratio of net investment income (loss) to average net assets would have been .21%.
See accompanying notes which are an integral part of the financial statements.
Annual Report
Notes to Financial Statements
For the period ended October 31, 2010
1. Organization.
Fidelity Stock Selector Small Cap Fund (the Fund) (formerly Fidelity Small Cap Independence Fund) is a fund of Fidelity Capital Trust (the Trust) and is authorized to issue an unlimited number of shares. The Trust is registered under the Investment Company Act of 1940, as amended (the 1940 Act), as an open-end management investment company organized as a Massachusetts business trust. The Fund offers Class A, Class T, Class C, Stock Selector Small Cap and Institutional Class shares, each of which has equal rights as to assets and voting privileges. Effective after the close of business on September 1, 2010, Class B shares were closed to new accounts and additional purchases by existing shareholders. Each class has exclusive voting rights with respect to matters that affect that class. In order to disclose class level financial information dollar amounts presented in the notes are unrounded. Class B shares will automatically convert to Class A shares after a holding period of seven years from the initial date of purchase. Investment income, realized and unrealized capital gains and losses, the common expenses of the Fund, and certain fund-level expense reductions, if any, are allocated on a pro-rata basis to each class based on the relative net assets of each class to the total net assets of the Fund. Each class differs with respect to transfer agent and distribution and service plan fees incurred. Certain expense reductions also differ by class.
2. Investments in Fidelity Central Funds.
The Fund may invest in Fidelity Central Funds, which are open-end investment companies available only to other investment companies and accounts managed by Fidelity Management & Research Company (FMR) and its affiliates. The Fund's Schedule of Investments lists each of the Fidelity Central Funds held as of period end, if any, as an investment of the Fund, but does not include the underlying holdings of each Fidelity Central Fund. As an Investing Fund, the Fund indirectly bears its proportionate share of the expenses of the underlying Fidelity Central Funds.
The Money Market Central Funds seek preservation of capital and current income and are managed by Fidelity Investments Money Management, Inc. (FIMM), an affiliate of FMR.
A complete unaudited list of holdings for each Fidelity Central Fund is available upon request or at the Securities and Exchange Commission (the SEC) web site at www.sec.gov. In addition, the financial statements of the Fidelity Central Funds, which are not covered by the Fund's Report of Independent Registered Public Accounting Firm, are available on the SEC web site or upon request.
Annual Report
Notes to Financial Statements - continued
3. Significant Accounting Policies.
The financial statements have been prepared in conformity with accounting principles generally accepted in the United States of America (GAAP), which require management to make certain estimates and assumptions at the date of the financial statements. Actual results could differ from those estimates. The following summarizes the significant accounting policies of the Fund:
Security Valuation. Investments are valued as of 4:00 p.m. Eastern time on the last calendar day of the period. The Fund uses independent pricing services approved by the Board of Trustees to value its investments. When current market prices or quotations are not readily available or reliable, valuations may be determined in good faith in accordance with procedures adopted by the Board of Trustees. Factors used in determining value may include market or security specific events. The frequency with which these procedures are used cannot be predicted and they may be utilized to a significant extent. The value used for net asset value (NAV) calculation under these procedures may differ from published prices for the same securities.
The Fund categorizes the inputs to valuation techniques used to value its investments into a disclosure hierarchy consisting of three levels as shown below.
Level 1 - quoted prices in active markets for identical investments
Level 2 - other significant observable inputs (including quoted prices for similar investments, interest rates, prepayment speeds, etc.)
Level 3 - unobservable inputs (including the fund's own assumptions based on the best information available)
Changes in valuation techniques may result in transfers in or out of an assigned level within the disclosure hierarchy. The aggregate value of investments by input level, as of October 31, 2010, is included at the end of the Fund's Schedule of Investments. Valuation techniques used to value the Fund's investments by major category are as follows.
Equity securities, including restricted securities, for which market quotations are readily available, are valued at the last reported sale price or official closing price as reported by an independent pricing service on the primary market or exchange on which they are traded and are categorized as Level 1 in the hierarchy. In the event there were no sales during the day or closing prices are not available, securities are valued at the last quoted bid price or may be valued using the last available price and are generally categorized as Level 2 in the hierarchy. For foreign equity securities, when significant market or security specific events arise, comparisons to the valuation of American Depositary Receipts (ADRs), futures contracts, Exchange-traded funds (ETFs) and certain indexes as well as
Annual Report
3. Significant Accounting Policies - continued
Security Valuation - continued
quoted prices for similar securities are used and are categorized as Level 2 in the hierarchy in these circumstances. Utilizing these techniques may result in transfers between Level 1 and Level 2. For restricted equity securities and private placements where observable inputs are limited, assumptions about market activity and risk are used and are categorized as Level 3 in the hierarchy.
Futures contracts are valued at the settlement price established each day by the board of trade or exchange on which they are traded and are categorized as Level 1 in the hierarchy. Investments in open-end mutual funds, including the Fidelity Central Funds, are valued at their closing net asset value each business day and are categorized as Level 1 in the hierarchy. Short-term securities with remaining maturities of sixty days or less for which quotations are not readily available are valued at amortized cost, which approximates fair value and are categorized as Level 2 in the hierarchy.
Foreign Currency. The Fund uses foreign currency contracts to facilitate transactions in foreign-denominated securities. Gains and losses from these transactions may arise from changes in the value of the foreign currency or if the counterparties do not perform under the contracts' terms.
Foreign-denominated assets, including investment securities, and liabilities are translated into U.S. dollars at the exchange rate at period end. Purchases and sales of investment securities, income and dividends received and expenses denominated in foreign currencies are translated into U.S. dollars at the exchange rate in effect on the transaction date.
The effects of exchange rate fluctuations on investments are included with the net realized and unrealized gain (loss) on investment securities. Other foreign currency transactions resulting in realized and unrealized gain (loss) are disclosed separately.
Investment Transactions and Income. For financial reporting purposes, the Fund's investment holdings and NAV include trades executed through the end of the last business day of the period. The NAV per share for processing shareholder transactions is calculated as of the close of business of the New York Stock Exchange (NYSE), normally 4:00 p.m. Eastern time and includes trades executed through the end of the prior business day. Gains and losses on securities sold are determined on the basis of identified cost and may include proceeds received from litigation. Dividend income is recorded on the ex-dividend date, except for certain dividends from foreign securities where the ex-dividend date may have passed, which are recorded as soon as the Fund is informed of the ex-dividend date. Non-cash dividends included in dividend income, if any, are recorded at the fair market value of the securities received. Distributions received on
Annual Report
Notes to Financial Statements - continued
3. Significant Accounting Policies - continued
Investment Transactions and Income - continued
securities that represent a return of capital or capital gain are recorded as a reduction of cost of investments and/or as a realized gain. The Fund estimates the components of distributions received that may be considered return of capital distributions or capital gain distributions. Large, non-recurring dividends recognized by the Fund are presented separately on the Statement of Operations as "Special Dividends" and the impact of these dividends is presented in the Financial Highlights. Interest income and distributions from the Fidelity Central Funds are accrued as earned. Interest income includes coupon interest and amortization of premium and accretion of discount on debt securities. Investment income is recorded net of foreign taxes withheld where recovery of such taxes is uncertain.
Expenses. Most expenses of the Trust can be directly attributed to a fund. Expenses which cannot be directly attributed are apportioned amongst each fund in the Trust. Expense estimates are accrued in the period to which they relate and adjustments are made when actual amounts are known.
Income Tax Information and Distributions to Shareholders. Each year the Fund intends to qualify as a regulated investment company, including distributing substantially all of its taxable income and realized gains under Subchapter M of the Internal Revenue Code and filing its U.S. federal tax return. As a result, no provision for income taxes is required. As of October 31, 2010, the Fund did not have any unrecognized tax benefits in the accompanying financial statements. A fund's federal tax return is subject to examination by the Internal Revenue Service (IRS) for a period of three years. Foreign taxes are provided for based on the Fund's understanding of the tax rules and rates that exist in the foreign markets in which it invests.
Distributions are declared and recorded on the ex-dividend date. Income dividends and capital gain distributions are declared separately for each class. Income and capital gain distributions are determined in accordance with income tax regulations, which may differ from GAAP.
Capital accounts within the financial statements are adjusted for permanent book-tax differences. These adjustments have no impact on net assets or the results of operations. Temporary book-tax differences will reverse in a subsequent period.
Book-tax differences are primarily due to the short-term gain distributions from the Fidelity Central Funds, futures transactions, foreign currency transactions, passive foreign investment companies (PFIC), market discount, partnerships, capital loss carryforwards and losses deferred due to wash sales.
Annual Report
3. Significant Accounting Policies - continued
Income Tax Information and Distributions to Shareholders - continued
The federal tax cost of investment securities and unrealized appreciation (depreciation) as of period end were as follows:
Gross unrealized appreciation | $ 241,615,641 |
Gross unrealized depreciation | (47,750,582) |
Net unrealized appreciation (depreciation) | $ 193,865,059 |
| |
Tax Cost | $ 1,321,264,245 |
The tax-based components of distributable earnings as of period end were as follows:
Undistributed ordinary income | $ 2,128,561 |
Capital loss carryforward | $ (519,765,399) |
Net unrealized appreciation (depreciation) | $ 193,866,512 |
The tax character of distributions paid was as follows:
| October 31, 2010 | October 31, 2009 |
Ordinary Income | $ 975,942 | $ 2,638,469 |
Short-Term Trading (Redemption) Fees. Shares held by investors in the Fund less than 90 days are subject to a redemption fee equal to 1.50% of the net asset value of shares redeemed. All redemption fees, which reduce the proceeds of the shareholder redemption, are retained by the Fund and accounted for as an addition to paid in capital.
4. Operating Policies.
Repurchase Agreements. FMR has received an Exemptive Order from the SEC which permits the Fund and other affiliated entities of FMR to transfer uninvested cash balances into joint trading accounts which are then invested in repurchase agreements. The Fund may also invest directly with institutions in repurchase agreements. Repurchase agreements are collateralized by government or non-government securities. Upon settlement date, collateral is held in segregated accounts with custodian banks and may be obtained in the event of a default of the counterparty. The Fund monitors, on a daily basis, the value of the collateral to ensure it is at least equal to the principal amount of the repurchase agreement (including accrued interest). In the event of a default by the counterparty, realization of the collateral proceeds could be delayed, during which time the value of the collateral may decline.
Annual Report
Notes to Financial Statements - continued
5. Derivative Instruments.
Risk Exposures and the Use of Derivative Instruments. The Fund uses derivative instruments (derivatives), including futures contracts in order to meet its investment objectives. The strategy is to use derivatives to increase returns and to manage exposure to certain risks as defined below. The success of any strategy involving derivatives depends on analysis of numerous economic factors, and if the strategies for investment do not work as intended, the Fund may not achieve its objectives.
The Fund's use of derivatives may increase or decrease its exposure to the following risk:
Equity Risk | Equity risk relates to the fluctuations in the value of financial instruments as a result of changes in market prices (other than those arising from interest rate risk or foreign exchange risk), whether caused by factors specific to an individual investment, its issuer, or all factors affecting all instruments traded in a market or market segment. |
The Fund is also exposed to additional risks from investing in derivatives, such as liquidity risk and counterparty credit risk. Liquidity risk is the risk that the Fund will be unable to sell the derivative in the open market in a timely manner. Counterparty credit risk is the risk that the counterparty will not be able to fulfill its obligation to the Fund. The Fund's maximum risk of loss from counterparty credit risk is generally the aggregate unrealized appreciation and unpaid counterparty fees in excess of any collateral pledged by the counterparty to the Fund. Counterparty risk related to exchange-traded futures contracts is minimal because of the protection provided by the exchange on which they trade. Risk of loss may exceed the amounts recognized in the Statement of Assets and Liabilities.
Futures Contracts. A futures contract is an agreement between two parties to buy or sell a specified underlying instrument for a fixed price at a specified future date. The Fund uses futures contracts to manage its exposure to the stock market.
Upon entering into a futures contract, a fund is required to deposit either cash or securities (initial margin) with a clearing broker in an amount equal to a certain percentage of the face value of the contract. Futures contracts are marked-to-market daily and subsequent payments (variation margin) are made or received by a fund depending on the daily fluctuations in the value of the futures contracts and are recorded as unrealized appreciation or (depreciation). Realized gain or (loss) is recorded upon the expiration or closing of a futures contract.
The underlying face amount at value of open futures contracts at period end is shown in the Schedule of Investments under the caption "Futures Contracts." This amount reflects each contract's exposure to the underlying instrument at period end and is representative of activity for the period. Securities deposited to meet initial margin requirements are identified in the Schedule of Investments. The receivable and/or payable for the variation margin are reflected in the Statement of Assets and Liabilities.
Annual Report
5. Derivative Instruments - continued
Futures Contracts - continued
Certain risks may arise upon entering into futures contracts, including the risk that an illiquid market may limit the ability to close out a futures contract prior to settlement date.
During the period the Fund recognized net realized gain (loss) of $2,661,216 and a change in net unrealized appreciation (depreciation) of ($7,562) related to its investment in futures contracts. These amounts are included in the Statement of Operations.
6. Purchases and Sales of Investments.
Purchases and sales of securities, other than short-term securities, aggregated $1,981,252,095 and $2,313,047,933, respectively.
7. Fees and Other Transactions with Affiliates.
Management Fee. FMR and its affiliates provide the Fund with investment management related services for which the Fund pays a monthly management fee. The management fee is the sum of an individual fund fee rate that is based on an annual rate of .35% of the Fund's average net assets and a group fee rate that averaged .26% during the period. The group fee rate is based upon the average net assets of all the mutual funds advised by FMR. The group fee rate decreases as assets under management increase and increases as assets under management decrease. In addition, the management fee is subject to a performance adjustment (up to a maximum of ± .20% of the Fund's average net assets over a 36 month performance period). The upward or downward adjustment to the management fee is based on the relative investment performance of Stock Selector Small Cap as compared to an appropriate benchmark index. For the period, the total annual management fee rate, including the performance adjustment, was .39% of the Fund's average net assets.
Distribution and Service Plan Fees. In accordance with Rule 12b-1 of the 1940 Act, the Fund has adopted separate Distribution and Service Plans for each class of shares. Certain classes pay Fidelity Distributors Corporation (FDC), an affiliate of FMR, separate Distribution and Service Fees, each of which is based on an annual percentage of each class' average net assets. In addition, FDC may pay financial intermediaries for selling shares of the Fund and providing shareholder support services. For the period, the Distribution and Service Fee rates, total fees and amounts retained by FDC were as follows:
Annual Report
Notes to Financial Statements - continued
7. Fees and Other Transactions with Affiliates - continued
Distribution and Service Plan Fees - continued
| Distribution
Fee | Service
Fee | Total Fees | Retained
by FDC |
Class A | -% | .25% | $ 7,815 | $ 13 |
Class T | .25% | .25% | 3,474 | 5 |
Class B | .75% | .25% | 2,267 | 1,701 |
Class C | .75% | .25% | 6,265 | 2,935 |
| | | $ 19,821 | $ 4,654 |
Sales Load. FDC receives a front-end sales charge of up to 5.75% for selling Class A shares, and 3.50% for selling Class T shares, some of which is paid to financial intermediaries for selling shares of the Fund. FDC receives the proceeds of contingent deferred sales charges levied on Class A, Class T, Class B, and Class C redemptions. These charges depend on the holding period. The deferred sales charges range from 5% to 1% for Class B, 1% for Class C, 1.00% for certain purchases of Class A shares (1.00% to .50% prior to July 12, 2010) and .25% for certain purchases of Class T shares.
For the period, sales charge amounts retained by FDC were as follows:
| Retained
by FDC |
Class A | $ 1,295 |
Class T | 527 |
Class B* | 297 |
Class C* | 66 |
| $ 2,185 |
* When Class B and Class C shares are initially sold, FDC pays commissions from its own resources to financial intermediaries through which the sales are made.
Transfer Agent Fees. Fidelity Investments Institutional Operations Company, Inc. (FIIOC), an affiliate of FMR, is the transfer, dividend disbursing and shareholder servicing agent for each class of the Fund. FIIOC receives account fees and asset-based fees that vary according to the account size and type of account of the shareholders of the respective classes of the Fund. FIIOC pays for typesetting, printing and mailing of shareholder reports, except proxy statements. For the period, transfer agent fees for each class were as follows:
Annual Report
7. Fees and Other Transactions with Affiliates - continued
Transfer Agent Fees - continued
| Amount | % of
Average
Net Assets |
Class A | $ 9,678 | .31 |
Class T | 2,278 | .33 |
Class B | 717 | .32 |
Class C | 1,955 | .31 |
Stock Selector Small Cap | 4,142,036 | .28 |
Institutional Class | 1,046 | .18 |
| $ 4,157,710 | |
Accounting and Security Lending Fees. Fidelity Service Company, Inc. (FSC), an affiliate of FMR, maintains the Fund's accounting records. The accounting fee is based on the level of average net assets for the month. Under a separate contract, FSC administers the security lending program. The security lending fee is based on the number and duration of lending transactions.
Brokerage Commissions. The Fund placed a portion of its portfolio transactions with brokerage firms which are affiliates of the investment adviser. The commissions paid to these affiliated firms were $46,467 for the period.
Interfund Lending Program. Pursuant to an Exemptive Order issued by the SEC, the Fund, along with other registered investment companies having management contracts with FMR, may participate in an interfund lending program. This program provides an alternative credit facility allowing the funds to borrow from, or lend money to, other participating affiliated funds. At period end, there were no interfund loans outstanding. The Fund's activity in this program during the period for which loans were outstanding was as follows:
Borrower or Lender | Average Daily Loan Balance | Weighted Average Interest Rate | Interest
Expense |
Borrower | $ 26,296,000 | .48% | $ 1,398 |
Annual Report
Notes to Financial Statements - continued
8. Committed Line of Credit.
The Fund participates with other funds managed by FMR or an affiliate in a $3.75 billion credit facility (the "line of credit") to be utilized for temporary or emergency purposes to fund shareholder redemptions or for other short-term liquidity purposes. The Fund has agreed to pay commitment fees on its pro-rata portion of the line of credit, which amounted to $5,862 and is reflected in Miscellaneous expenses on the Statement of Operations. During the period, there were no borrowings on this line of credit.
9. Security Lending.
The Fund lends portfolio securities through a lending agent from time to time in order to earn additional income. The lending agent may loan securities to certain qualified borrowers, including Fidelity Capital Markets (FCM), a broker-dealer affiliated with the Fund. On the settlement date of the loan, the Fund receives collateral (in the form of U.S. Treasury obligations, letters of credit and/or cash) against the loaned securities and maintains collateral in an amount not less than 100% of the market value of the loaned securities during the period of the loan. The market value of the loaned securities is determined at the close of business of the Fund and any additional required collateral is delivered to the Fund on the next business day. If the borrower defaults on its obligation to return the securities loaned because of insolvency or other reasons, a fund could experience delays and costs in recovering the securities loaned or in gaining access to the collateral. Any cash collateral received is invested in the Fidelity Securities Lending Cash Central Fund. The value of loaned securities and cash collateral at period end are disclosed on the Fund's Statement of Assets and Liabilities. Security lending income represents the income earned on investing cash collateral, less rebates paid to borrowers and lending agent fees associated with the loan, plus any premium payments received for lending certain types of securities. Security lending income is presented in the Statement of Operations as a component of income from Fidelity Central Funds. During the period, there were no securities loaned to FCM.
10. Expense Reductions.
Many of the brokers with whom FMR places trades on behalf of the Fund provided services to the Fund in addition to trade execution. These services included payments of certain expenses on behalf of the Fund totaling $154,161 for the period.
Annual Report
11. Distributions to Shareholders.
Distributions to shareholders of each class were as follows:
Years ended October 31, | 2010 | 2009 |
From net investment income | | |
Class A | $ 649 | $ 4,025 |
Class T | - | 517 |
Class B | - | 104 |
Class C | - | 117 |
Stock Selector Small Cap | 974,901 | 2,632,884 |
Institutional Class | 392 | 822 |
Total | $ 975,942 | $ 2,638,469 |
12. Share Transactions.
Transactions for each class of shares were as follows:
| Shares | Dollars |
Years ended October 31, | 2010 | 2009 | 2010 | 2009 |
Class A | | | | |
Shares sold | 60,233 | 71,378 | $ 878,328 | $ 788,883 |
Reinvestment of distributions | 48 | 387 | 635 | 3,793 |
Shares redeemed | (69,529) | (67,529) | (1,022,424) | (721,666) |
Net increase (decrease) | (9,248) | 4,236 | $ (143,461) | $ 71,010 |
Class T | | | | |
Shares sold | 27,634 | 15,043 | $ 398,291 | $ 167,984 |
Reinvestment of distributions | - | 52 | - | 513 |
Shares redeemed | (26,782) | (7,474) | (382,007) | (81,545) |
Net increase (decrease) | 852 | 7,621 | $ 16,284 | $ 86,952 |
Class B | | | | |
Shares sold | 2,875 | 12,626 | $ 40,053 | $ 143,810 |
Reinvestment of distributions | - | 10 | - | 101 |
Shares redeemed | (6,748) | (12,734) | (94,173) | (136,707) |
Net increase (decrease) | (3,873) | (98) | $ (54,120) | $ 7,204 |
Class C | | | | |
Shares sold | 24,030 | 26,160 | $ 347,201 | $ 298,029 |
Reinvestment of distributions | - | 11 | - | 107 |
Shares redeemed | (6,890) | (7,946) | (99,553) | (87,470) |
Net increase (decrease) | 17,140 | 18,225 | $ 247,648 | $ 210,666 |
Annual Report
Notes to Financial Statements - continued
12. Share Transactions - continued
| Shares | Dollars |
Years ended October 31, | 2010 | 2009 | 2010 | 2009 |
Stock Selector Small Cap | | | | |
Shares sold | 14,958,012 | 20,943,346 | $ 219,809,002 | $ 222,060,311 |
Reinvestment of distributions | 72,340 | 263,408 | 962,840 | 2,594,575 |
Shares redeemed | (38,394,961) | (26,369,097) | (570,480,008) | (287,151,117) |
Net increase (decrease) | (23,364,609) | (5,162,343) | $ (349,708,166) | $ (62,496,231) |
Institutional Class | | | | |
Shares sold | 13,011 | 6,785 | $ 190,234 | $ 75,484 |
Reinvestment of distributions | 4 | 9 | 53 | 87 |
Shares redeemed | (4,160) | (7,415) | (62,596) | (91,575) |
Net increase (decrease) | 8,855 | (621) | $ 127,691 | $ (16,004) |
13. Other.
The Fund's organizational documents provide former and current trustees and officers with a limited indemnification against liabilities arising in connection with the performance of their duties to the Fund. In the normal course of business, the Fund may also enter into contracts that provide general indemnifications. The Fund's maximum exposure under these arrangements is unknown as this would be dependent on future claims that may be made against the Fund. The risk of material loss from such claims is considered remote.
Annual Report
To the Trustees of Fidelity Capital Trust and Shareholders of Fidelity Stock Selector Small Cap Fund:
We have audited the accompanying statement of assets and liabilities of Fidelity Stock Selector Small Cap Fund, previously Fidelity Small Cap Independence Fund (the Fund), a fund of Fidelity Capital Trust, including the schedule of investments, as of October 31, 2010, and the related statement of operations for the year then ended, the statement of changes in net assets for each of the two years in the period then ended, and the financial highlights for each of the periods presented. These financial statements and financial highlights are the responsibility of the Fund's management. Our responsibility is to express an opinion on these financial statements and financial highlights based on our audits.
We conducted our audits in accordance with standards of the Public Company Accounting Oversight Board (United States). Those standards require that we plan and perform the audit to obtain reasonable assurance about whether the financial statements and financial highlights are free of material misstatement. The Fund is not required to have, nor were we engaged to perform, an audit of its internal control over financial reporting. Our audits included consideration of internal control over financial reporting as a basis for designing audit procedures that are appropriate in the circumstances, but not for the purpose of expressing an opinion on the effectiveness of the Fund's internal control over financial reporting. Accordingly, we express no such opinion. An audit also includes examining, on a test basis, evidence supporting the amounts and disclosures in the financial statements, assessing the accounting principles used and significant estimates made by management, as well as evaluating the overall financial statement presentation. Our procedures included confirmation of securities owned as of October 31, 2010, by correspondence with the custodians and brokers; where replies were not received from brokers, we performed other auditing procedures. We believe that our audits provide a reasonable basis for our opinion.
In our opinion, the financial statements and financial highlights referred to above present fairly, in all material respects, the financial position of Fidelity Stock Selector Small Cap Fund as of October 31, 2010, the results of its operations for the year then ended, the changes in its net assets for each of the two years in the period then ended, and the financial highlights for each of the periods presented, in conformity with accounting principles generally accepted in the United States of America.
/s/ Deloitte & Touche LLP
DELOITTE & TOUCHE LLP
Boston, Massachusetts
December 16, 2010
Annual Report
The Trustees, Member of the Advisory Board, and executive officers of the trust and fund, as applicable, are listed below. The Board of Trustees governs the fund and is responsible for protecting the interests of shareholders. The Trustees are experienced executives who meet periodically throughout the year to oversee the fund's activities, review contractual arrangements with companies that provide services to the fund, oversee management of the risks associated with such activities and contractual arrangements, and review the fund's performance. Except for James C. Curvey, each of the Trustees oversees 221 funds advised by FMR or an affiliate. Mr. Curvey oversees 410 funds advised by FMR or an affiliate.
The Trustees hold office without limit in time except that (a) any Trustee may resign; (b) any Trustee may be removed by written instrument, signed by at least two-thirds of the number of Trustees prior to such removal; (c) any Trustee who requests to be retired or who has become incapacitated by illness or injury may be retired by written instrument signed by a majority of the other Trustees; and (d) any Trustee may be removed at any special meeting of shareholders by a two-thirds vote of the outstanding voting securities of the trust. Each Trustee who is not an interested person (as defined in the 1940 Act) (Independent Trustee), shall retire not later than the last day of the calendar year in which his or her 72nd birthday occurs. The Independent Trustees may waive this mandatory retirement age policy with respect to individual Trustees. The executive officers and Advisory Board Member hold office without limit in time, except that any officer and Advisory Board Member may resign or may be removed by a vote of a majority of the Trustees at any regular meeting or any special meeting of the Trustees. Except as indicated, each individual has held the office shown or other offices in the same company for the past five years.
Experience, Skills, Attributes, and Qualifications of the Fund's Trustees. The Governance and Nominating Committee has adopted a statement of policy that describes the experience, qualifications, attributes, and skills that are necessary and desirable for potential Independent Trustee candidates (Statement of Policy). The Board believes that each Trustee satisfied at the time he or she was initially elected or appointed a Trustee, and continues to satisfy, the standards contemplated by the Statement of Policy. The Governance and Nominating Committee also engages professional search firms to help identify potential Independent Trustee candidates who have the experience, qualifications, attributes, and skills consistent with the Statement of Policy. From time to time, additional criteria based on the composition and skills of the current Independent Trustees, as well as experience or skills that may be appropriate in light of future changes to board composition, business conditions, and regulatory or other developments, have also been considered by the professional search firms and the Governance and Nominating Committee. In addition, the Board takes into account the Trustees' commitment and participation in Board and committee meetings, as well as their leadership of standing and ad hoc committees throughout their tenure.
In determining that a particular Trustee was and continues to be qualified to serve as a Trustee, the Board has considered a variety of criteria, none of which, in isolation, was controlling. The Board believes that, collectively, the Trustees have balanced and diverse experience, qualifications, attributes, and skills, which allow the Board to operate effectively in governing the fund and protecting the interests of shareholders. Information about the specific experience, skills, attributes, and qualifications of each Trustee, which in each case led to the Board's conclusion that the Trustee should serve (or continue to serve) as a trustee of the fund, is provided below.
Annual Report
Board Structure and Oversight Function. Edward C. Johnson 3d is an interested person (as defined in the 1940 Act) and currently serves as Chairman. The Trustees have determined that an interested Chairman is appropriate and benefits shareholders because an interested Chairman has a personal and professional stake in the quality and continuity of services provided to the fund. Independent Trustees exercise their informed business judgment to appoint an individual of their choosing to serve as Chairman, regardless of whether the Trustee happens to be independent or a member of management. The Independent Trustees have determined that they can act independently and effectively without having an Independent Trustee serve as Chairman and that a key structural component for assuring that they are in a position to do so is for the Independent Trustees to constitute a substantial majority for the Board. The Independent Trustees also regularly meet in executive session. Ned C. Lautenbach serves as Chairman of the Independent Trustees and as such (i) acts as a liaison between the Independent Trustees and management with respect to matters important to the Independent Trustees and (ii) with management prepares agendas for Board meetings.
Fidelity funds are overseen by different Boards of Trustees. The fund's Board oversees Fidelity's equity and high income funds and another Board oversees Fidelity's investment-grade bond, money market, and asset allocation funds. The asset allocation funds may invest in Fidelity funds overseen by the fund's Board. The use of separate Boards, each with its own committee structure, allows the Trustees of each group of Fidelity funds to focus on the unique issues of the funds they oversee, including common research, investment, and operational issues. On occasion, the separate Boards establish joint committees to address issues of overlapping consequences for the Fidelity funds overseen by each Board.
The Trustees operate using a system of committees to facilitate the timely and efficient consideration of all matters of importance to the Trustees, the fund, and fund shareholders and to facilitate compliance with legal and regulatory requirements and oversight of the fund's activities and associated risks. The Board, acting through its committees, has charged FMR and its affiliates with (i) identifying events or circumstances the occurrence of which could have demonstrably adverse effects on the fund's business and/or reputation; (ii) implementing processes and controls to lessen the possibility that such events or circumstances occur or to mitigate the effects of such events or circumstances if they do occur; and (iii) creating and maintaining a system designed to evaluate continuously business and market conditions in order to facilitate the identification and implementation processes described in (i) and (ii) above. Because the day-to-day operations and activities of the fund are carried out by or through FMR, its affiliates and other service providers, the fund's exposure to risks is mitigated but not eliminated by the processes overseen by the Trustees. While each of the Board's committees has responsibility for overseeing different aspects of the fund's activities, oversight is exercised primarily through the Operations, Audit, and Compliance Committees. Appropriate personnel, including but not limited to the fund's Chief Compliance Officer (CCO), FMR's internal auditor, the independent accountants, the fund's Treasurer and portfolio management personnel, make periodic reports to the Board's committees, as appropriate. The responsibilities of each committee, including their oversight responsibilities, are described further under "Standing Committees of the Fund's Trustees."
Annual Report
Trustees and Officers - continued
The fund's Statement of Additional Information (SAI) includes more information about the Trustees. To request a free copy, call Fidelity at 1-800-544-8544.
Interested Trustees*:
Correspondence intended for each Trustee who is an interested person may be sent to Fidelity Investments, 82 Devonshire Street, Boston, Massachusetts 02109.
Name, Age; Principal Occupations and Other Relevant Experience+ |
Edward C. Johnson 3d (80) |
| Year of Election or Appointment: 1978 Mr. Johnson is Trustee and Chairman of the Board of Trustees of certain Trusts. Mr. Johnson serves as Chief Executive Officer, Chairman, and a Director of FMR LLC; Chairman and a Director of FMR; Chairman and a Director of Fidelity Research & Analysis Company (FRAC); Chairman and a Director of Fidelity Investments Money Management, Inc.; and Chairman and a Director of FMR Co., Inc. In addition, Mr. Johnson serves as Chairman and Director of FIL Limited. Previously, Mr. Johnson served as President of FMR LLC (2006-2007). |
James C. Curvey (75) |
| Year of Election or Appointment: 2007 Mr. Curvey also serves as Trustee (2007-present) of other investment companies advised by FMR. Mr. Curvey is a Director of Fidelity Investments Money Management, Inc. (2009-present), Director of Fidelity Research & Analysis Co. (2009-present) and Director of FMR and FMR Co., Inc. (2007-present). Mr. Curvey is also Vice Chairman (2007-present) and Director of FMR LLC. In addition, Mr. Curvey serves as an Overseer for the Boston Symphony Orchestra and a member of the Trustees of Villanova University. Previously, Mr. Curvey was the Vice Chairman (2006-2007) and Director (2000-2007) of FMR Corp. |
Annual Report
* Trustees have been determined to be "Interested Trustees" by virtue of, among other things, their affiliation with the trust or various entities under common control with FMR.
+ The information above includes each Trustee's principal occupation during the last five years and other information relating to the experience, attributes, and skills relevant to each Trustee's qualifications to serve as a Trustee, which led to the conclusion that each Trustee should serve as a Trustee for the fund.
Independent Trustees:
Correspondence intended for each Independent Trustee (that is, the Trustees other than the Interested Trustees) may be sent to Fidelity Investments, P.O. Box 55235, Boston, Massachusetts 02205-5235.
Name, Age; Principal Occupations and Other Relevant Experience+ |
Dennis J. Dirks (62) |
| Year of Election or Appointment: 2005 Prior to his retirement in May 2003, Mr. Dirks was Chief Operating Officer and a member of the Board of The Depository Trust & Clearing Corporation (DTCC). He also served as President, Chief Operating Officer, and Board member of The Depository Trust Company (DTC) and President and Board member of the National Securities Clearing Corporation (NSCC). In addition, Mr. Dirks served as Chief Executive Officer and Board member of the Government Securities Clearing Corporation, Chief Executive Officer and Board member of the Mortgage-Backed Securities Clearing Corporation, as a Trustee and a member of the Finance Committee of Manhattan College (2005-2008), and as a Trustee and a member of the Finance Committee of AHRC of Nassau County (2006-2008). Mr. Dirks is a member of the Independent Directors Council (IDC) Governing Council (2010-Present) and Board of Directors for The Brookville Center for Children's Services, Inc. (2009-present). |
Alan J. Lacy (57) |
| Year of Election or Appointment: 2008 Mr. Lacy serves as Senior Adviser (2007-present) of Oak Hill Capital Partners, L.P. (private equity). Mr. Lacy also served as Chief Executive Officer (2000-2005) and Vice Chairman (2005-2006) of Sears Holdings Corporation and Sears, Roebuck and Co. (retail). In addition, Mr. Lacy serves as a member of the Board of Directors of The Western Union Company (global money transfer, 2006-present) and Bristol-Myers Squibb Company (global pharmaceuticals, 2007-present). Mr. Lacy is Chairman (2008-present) and a member (2006-present) of the Board of Trustees of The National Parks Conservation Association. |
Ned C. Lautenbach (66) |
| Year of Election or Appointment: 2000 Mr. Lautenbach is Chairman of the Independent Trustees of the Equity and High Income Funds (2006-present). Mr. Lautenbach currently serves as the Lead Director of the Eaton Corporation Board of Directors (diversified industrial, 1997-present). Mr. Lautenbach is also a member of the Board of Directors of the Philharmonic Center for the Arts in Naples, Florida (1999-present); a member of the Board of Trustees of Fairfield University (2005-present); and a member of the Council on Foreign Relations (1994-present). Previously, Mr. Lautenbach was a Partner/Advisory Partner at Clayton, Dubilier & Rice, Inc. (private equity investment, 1998-2010), as well as a Director of Sony Corporation (2006-2007). |
Joseph Mauriello (66) |
| Year of Election or Appointment: 2008 Prior to his retirement in January 2006, Mr. Mauriello served in numerous senior management positions including Deputy Chairman and Chief Operating Officer (2004-2005), and Vice Chairman of Financial Services (2002-2004) of KPMG LLP US (professional services, 1965-2005). Mr. Mauriello currently serves as a member of the Board of Directors of XL Group plc. (global insurance and re-insurance, 2006-present) and of Arcadia Resources Inc. (health care services and products, 2007-present). Previously, Mr. Mauriello served as a Director of the Hamilton Funds of the Bank of New York (2006-2007). |
Cornelia M. Small (66) |
| Year of Election or Appointment: 2005 Ms. Small is a member of the Board of Directors of the Teagle Foundation (2009-present). Ms. Small is also a member of the Investment Committee, and Chair (2008-present) and a member of the Board of Trustees of Smith College. In addition, Ms. Small serves on the Investment Committee of the Berkshire Taconic Community Foundation (2008-present). Previously, Ms. Small served as Chairperson of the Investment Committee (2002- 2008) of Smith College. In addition, Ms. Small served as Chief Investment Officer, Director of Global Equity Investments, and a member of the Board of Directors of Scudder, Stevens & Clark and Scudder Kemper Investments. |
William S. Stavropoulos (71) |
| Year of Election or Appointment: 2002 Mr. Stavropoulos is Vice Chairman of the Independent Trustees of the Equity and High Income Funds (2006-present). Mr. Stavropoulos serves as President and Founder of the Michigan Baseball Foundation, the Great Lakes Loons (2007-present). Mr. Stavropoulos is Chairman Emeritus of the Board of Directors of The Dow Chemical Company, where he previously served in numerous senior management positions, including President, CEO (1995-2000; 2002-2004), Chairman of the Executive Committee (2000-2006), and as a member of the Board of Directors (1990-2006). Currently, Mr. Stavropoulos is Chairman of Univar (global distributor of commodity and specialty chemicals, 2010-present), a Director of Teradata Corporation (data warehousing and technology solutions, 2008-present), Chemical Financial Corporation, Maersk Inc. (industrial conglomerate), Tyco International, Inc. (multinational manufacturing and services, 2007-present), and a member of the Advisory Board for Metalmark Capital (private equity investment, 2005-present). Mr. Stavropoulos is a special advisor to Clayton, Dubilier & Rice, Inc. (private equity investment). In addition, Mr. Stavropoulos is a member of the University of Notre Dame Advisory Council for the College of Science. |
David M. Thomas (61) |
| Year of Election or Appointment: 2008 Previously, Mr. Thomas served as Executive Chairman (2005-2006) and Chairman and Chief Executive Officer (2000-2005) of IMS Health, Inc. (pharmaceutical and healthcare information solutions). In addition, Mr. Thomas serves as a member of the Board of Directors of Fortune Brands, Inc. (consumer products), and Interpublic Group of Companies, Inc. (marketing communication, 2004-present). |
Michael E. Wiley (60) |
| Year of Election or Appointment: 2008 Mr. Wiley also serves as a Director of Asia Pacific Exploration Consolidated (international oil and gas exploration and production, 2008- present). Mr. Wiley serves as a Director of Tesoro Corporation (independent oil refiner and marketer, 2005-present), and a Director of Bill Barrett Corporation (exploration and production, 2005-present). In addition, Mr. Wiley also serves as a Director of Post Oak Bank (privately-held bank, 2004-present). Previously, Mr. Wiley served as a member of the Board of Trustees of the University of Tulsa (2000-2006; 2007-2010), as a Senior Energy Advisor of Katzenbach Partners, LLC (consulting, 2006-2007), as an Advisory Director of Riverstone Holdings (private investment), Chairman, President, and CEO of Baker Hughes, Inc. (oilfield services, 2000- 2004), and as Director of Spinnaker Exploration Company (exploration and production, 2001-2005). |
Annual Report
Trustees and Officers - continued
+ The information above includes each Trustee's principal occupation during the last five years and other information relating to the experience, attributes, and skills relevant to each Trustee's qualifications to serve as a Trustee, which led to the conclusion that each Trustee should serve as a Trustee for the fund.
Advisory Board Member and Executive Officers:
Correspondence intended for each executive officer and Peter S. Lynch may be sent to Fidelity Investments, 82 Devonshire Street, Boston, Massachusetts 02109.
Name, Age; Principal Occupation |
Peter S. Lynch (66) |
| Year of Election or Appointment: 2003 Member of the Advisory Board of Fidelity's Equity and High Income Funds. Mr. Lynch is Vice Chairman and a Director of FMR and FMR Co., Inc. In addition, Mr. Lynch serves as a Trustee of Boston College and as the Chairman of the Inner-City Scholarship Fund. Previously, Mr. Lynch served on the Special Olympics International Board of Directors (1997-2006). |
Kenneth B. Robins (41) |
| Year of Election or Appointment: 2008 President and Treasurer of Fidelity's Equity and High Income Funds. Mr. Robins also serves as President and Treasurer (2010-present) and Assistant Treasurer (2009-present) of other Fidelity funds and is an employee of Fidelity Investments (2004-present). Previously, Mr. Robins served as Deputy Treasurer of the Fidelity funds (2005-2008) and Treasurer and Chief Financial Officer of The North Carolina Capital Management Trust: Cash and Term Portfolios (2006-2008). |
Brian B. Hogan (46) |
| Year of Election or Appointment: 2009 Vice President of certain Equity Funds and Vice President of Sector Funds. Mr. Hogan also serves as President of FMR's Equity Division (2009-present). Previously, Mr. Hogan served as Senior Vice President, Equity Research of FMR (2006-2009) and as a portfolio manager. |
Thomas C. Hense (46) |
| Year of Election or Appointment: 2008 or 2010 Vice President of Fidelity's High Income (2008), Small Cap (2008), and Value (2010) Funds. Previously, Mr. Hense served as a portfolio manager for Fidelity's Institutional Money Management Group (Pyramis) (2003-2008). |
Scott C. Goebel (42) |
| Year of Election or Appointment: 2008 Secretary and Chief Legal Officer (CLO) of the Fidelity funds. Mr. Goebel also serves as Secretary and CLO of The North Carolina Capital Management Trust: Cash and Term Portfolio (2008-present); General Counsel, Secretary, and Senior Vice President of FMR (2008-present) and FMR Co., Inc. (2008-present); Deputy General Counsel of FMR LLC; Chief Legal Officer of Fidelity Management & Research (Hong Kong) Limited (2008-present) and Assistant Secretary of Fidelity Management & Research (Japan) Inc. (2008-present), Fidelity Investments Money Management, Inc. (2008-present), Fidelity Management & Research (U.K.) Inc. (2008-present), and Fidelity Research and Analysis Company (2008-present). Previously, Mr. Goebel served as Assistant Secretary of the Funds (2007-2008) and as Vice President and Secretary of Fidelity Distributors Corporation (FDC) (2005-2007). |
William C. Coffey (41) |
| Year of Election or Appointment: 2009 Assistant Secretary of Fidelity's Equity and High Income Funds. Mr. Coffey also serves as Senior Vice President and Deputy General Counsel of FMR LLC (2010-present), and is an employee of Fidelity Investments. Previously, Mr. Coffey served as Vice President and Associate General Counsel of FMR LLC (2005-2009). |
Holly C. Laurent (56) |
| Year of Election or Appointment: 2008 Anti-Money Laundering (AML) Officer of the Fidelity funds. Ms. Laurent also serves as AML Officer of The North Carolina Capital Management Trust: Cash and Term Portfolio (2008-present) and is an employee of Fidelity Investments. Previously, Ms. Laurent was Senior Vice President and Head of Legal for Fidelity Business Services India Pvt. Ltd. (2006-2008), and Senior Vice President, Deputy General Counsel and Group Head for FMR LLC (2005-2006). |
Christine Reynolds (52) |
| Year of Election or Appointment: 2008 Chief Financial Officer of the Fidelity funds. Ms. Reynolds became President of Fidelity Pricing and Cash Management Services (FPCMS) in
August 2008. Ms. Reynolds served as Chief Operating Officer of FPCMS (2007-2008). Previously, Ms. Reynolds served as President, Treasurer, and Anti-Money Laundering officer of the Fidelity funds (2004-2007). |
Kenneth A. Rathgeber (63) |
| Year of Election or Appointment: 2004 Chief Compliance Officer of Fidelity's Equity and High Income Funds. Mr. Rathgeber is Chief Compliance Officer of Fidelity Management & Research (Hong Kong) Limited (2008-present), Fidelity Management & Research (Japan) Inc. (2008-present), FMR (2005-present), FMR Co., Inc. (2005-present), Fidelity Management & Research (U.K.) Inc. (2005-present), Fidelity Research & Analysis Company (2005-present), Fidelity Investments Money Management, Inc. (2005-present), Pyramis Global Advisors, LLC (2005-present), and Strategic Advisers, Inc. (2005-present). |
Jeffrey S. Christian (49) |
| Year of Election or Appointment: 2009 Deputy Treasurer of the Fidelity funds. Mr. Christian is an employee of Fidelity Investments. Previously, Mr. Christian served as Chief Financial Officer (2008-2009) of certain Fidelity funds and Senior Vice President of Fidelity Pricing and Cash Management Services (FPCMS) (2004-2009). |
Bryan A. Mehrmann (49) |
| Year of Election or Appointment: 2005 Deputy Treasurer of the Fidelity funds. Mr. Mehrmann is an employee of Fidelity Investments. |
Adrien E. Deberghes (43) |
| Year of Election or Appointment: 2008 Deputy Treasurer of Fidelity's Equity and High Income Funds. Mr. Deberghes also serves as Assistant Treasurer of other Fidelity funds (2010-present) and is an employee of Fidelity Investments (2008-present). Previously, Mr. Deberghes served as Senior Vice President of Mutual Fund Administration at State Street Corporation (2007-2008), Senior Director of Mutual Fund Administration at Investors Bank & Trust (2005-2007), and Director of Finance for Dunkin' Brands (2000-2005). |
Stephanie J. Dorsey (41) |
| Year of Election or Appointment: 2010 Assistant Treasurer of Fidelity's Equity and High Income Funds. Ms. Dorsey also serves as Deputy Treasurer of other Fidelity funds (2008-present) and is an employee of Fidelity Investments (2008-present). Previously, Ms. Dorsey served as Treasurer (2004-2008) of the JPMorgan Mutual Funds and Vice President (2004-2008) of JPMorgan Chase Bank. |
John R. Hebble (52) |
| Year of Election or Appointment: 2009 Assistant Treasurer of Fidelity's Equity and High Income Funds. Mr. Hebble also serves as Treasurer and Chief Financial Officer of The North Carolina Capital Management Trust: Cash and Term Portfolio (2008-present), President and Treasurer of other Fidelity funds (2008-present) and is an employee of Fidelity Investments. |
Gary W. Ryan (52) |
| Year of Election or Appointment: 2005 Assistant Treasurer of the Fidelity funds. Mr. Ryan is an employee of Fidelity Investments. Previously, Mr. Ryan served as Vice President of Fund Reporting in Fidelity Pricing and Cash Management Services (FPCMS) (1999-2005). |
Jonathan Davis (42) |
| Year of Election or Appointment: 2010 Assistant Treasurer of the Fidelity funds. Mr. Davis is an employee of Fidelity Investments. Previously, Mr. Davis served as Vice President and Associate General Counsel of FMR LLC (2003-2010). |
Annual Report
The fund designates 100% of dividends distributed during the fiscal year as qualifying for the dividends-received deduction for corporate shareholders.
The fund designates 100% of dividends distributed in December 2009 during the fiscal year as amounts which may be taken into account as a dividend for purposes of the maximum rate under section 1(h)(11) of the Internal Revenue Code.
The fund will notify shareholders in January 2011 of amounts for use in preparing 2010 income tax returns.
Annual Report
Board Approval of Investment Advisory Contracts and Management Fees
Fidelity Stock Selector Small Cap Fund (formerly known as Fidelity Small Cap Independence Fund)
Each year, the Board of Trustees, including the Independent Trustees (together, the Board), votes on the renewal of the management contract and sub-advisory agreements (together, the Advisory Contracts) for the fund. The Board, assisted by the advice of fund counsel and Independent Trustees' counsel, requests and considers a broad range of information relevant to the renewal of the Advisory Contracts throughout the year.
The Board meets regularly and considers at each of its meetings factors that are relevant to its annual consideration of the renewal of the fund's Advisory Contracts, including the services and support provided to the fund and its shareholders. The Board has established various standing committees, each composed of Independent Trustees with varying backgrounds, to which the Board has assigned specific subject matter responsibilities in order to enhance effective decision-making by the Board. The Board, acting directly and through its Committees, requests and receives information concerning the annual consideration of the renewal of the fund's Advisory Contracts. The Board also meets as needed to consider matters specifically related to the Board's annual consideration of the renewal of Advisory Contracts. Members of the Board may also meet with trustees of other Fidelity funds through ad hoc joint committees to discuss certain matters relevant to the Fidelity funds.
At its July 2010 meeting, the Board of Trustees, including the Independent Trustees, unanimously determined to renew the fund's Advisory Contracts. In reaching its determination, the Board considered all factors it believed relevant, including (i) the nature, extent, and quality of the services to be provided to the fund and its shareholders (including the investment performance of the fund); (ii) the competitiveness of the fund's management fee and total expenses; (iii) the total costs of the services to be provided by and the profits to be realized by Fidelity from its relationship with the fund; (iv) the extent to which economies of scale would be realized as the fund grows; and (v) whether fee levels reflect these economies of scale, if any, for the benefit of fund shareholders.
In considering whether to renew the Advisory Contracts for the fund, the Board reached a determination, with the assistance of fund counsel and Independent Trustees' counsel and through the exercise of its business judgment, that the renewal of the Advisory Contracts is in the best interests of fund shareholders and that the compensation to be received by Fidelity under the management contract is fair and reasonable. The Board's decision to renew the Advisory Contracts was not based on any single factor noted above, but rather was based on a comprehensive consideration of all the information provided to the Board at its meetings throughout the year. The Board, in reaching its determination to renew the Advisory Contracts, is aware that shareholders in the fund have a broad range of investment choices available to them, including a wide choice among mutual funds offered by Fidelity's competitors, and that the fund's shareholders, with the opportunity to review and weigh the disclosure provided by the fund in its prospectus and other public disclosures, have chosen to invest in this fund, managed by Fidelity.
Annual Report
Nature, Extent, and Quality of Services Provided. The Board considered the staffing within the investment adviser, FMR, and the sub-advisers (together, the Investment Advisers), including the backgrounds of the fund's investment personnel and the fund's investment objective and discipline. The Independent Trustees also had discussions with senior management of Fidelity's investment operations and investment groups. The Board considered the structure of the portfolio manager compensation program and whether this structure provides appropriate incentives to act in the best interest of the fund.
Resources Dedicated to Investment Management and Support Services. The Board and the equity research subcommittee of the Board's Fund Oversight Committee reviewed the size, education, and experience of the Investment Advisers' investment staff, their use of technology, and the Investment Advisers' approach to recruiting, training, and retaining portfolio managers and other research, advisory, and management personnel. The Board noted that Fidelity's analysts have access to a variety of technological tools and market and securities data that enable them to perform both fundamental and quantitative analysis and to specialize in various disciplines. The Board considered Fidelity's extensive global research capabilities that enable the Investment Advisers to aggregate data from various sources in an effort to produce positive investment results. The Board also considered that Fidelity's portfolio managers and analysts have access to daily portfolio attribution that allows for monitoring of a fund's portfolio, as well as an electronic communication system that provides immediate real-time access to research concerning issuers and credit enhancers. The Board noted FMR's continued focus on strengthening the organization and discipline of equity portfolio management and research.
Shareholder and Administrative Services. The Board considered (i) the nature, extent, quality, and cost of advisory, administrative, and shareholder services performed by the Investment Advisers and their affiliates under the Advisory Contracts and under separate agreements covering transfer agency, pricing and bookkeeping, and securities lending services for the fund; (ii) the nature and extent of the investment adviser's supervision of third party service providers, principally custodians and subcustodians; and (iii) the resources devoted to, and the record of compliance with, the fund's compliance policies and procedures. The Board also reviewed the allocation of fund brokerage, including allocations to brokers affiliated with the Investment Advisers, the use of brokerage commissions to pay fund expenses, and the use of "soft" commission dollars to pay for research services.
The Board noted that the growth of fund assets over time across the complex allows Fidelity to reinvest in the development of services designed to enhance the value or convenience of the Fidelity funds as investment vehicles. These services include 24-hour access to account information and market information through phone representatives and over the Internet, and investor education materials and asset allocation tools.
Annual Report
Board Approval of Investment Advisory Contracts and
Management Fees - continued
Investment in a Large Fund Family. The Board considered the benefits to shareholders of investing in a Fidelity fund, including the benefits of investing in a fund that is part of a large family of funds offering a variety of investment disciplines and providing a large variety of mutual fund investor services. The Board noted that Fidelity had taken, or had made recommendations that resulted in the Fidelity funds taking, a number of actions over the previous year that benefited particular funds, including (i) dedicating additional resources to investment research and restructuring and broadening the focus of the investment research teams; (ii) bolstering the senior management team that oversees asset management; (iii) launching Class F of certain funds as a lower-fee class available to Freedom K and Freedom Index Funds; (iv) lowering the initial investment minimums and ongoing balance requirements for Real Estate High Income Fund; (v) eliminating subsequent purchase minimums for all funds and adding a waiver of the investment minimum requirement for new accounts opened with the proceeds of a systematic withdrawal plan; (vi) eliminating the withdrawal minimum and maximum limits for systematic withdrawals from Advisor funds; (vii) expanding sales load waivers on Class A shares for Destiny Planholders and expanding Institutional Class eligibility for Class O Destiny Planholders; and (viii) changing certain Class A and Class T sales charge structures to further align them with industry practices.
Investment Performance. The Board considered whether the fund has operated in accordance with its investment objective, as well as its record of compliance with its investment restrictions. It also reviewed the fund's absolute investment performance for each class, as well as the fund's relative investment performance for each class measured over multiple periods against (i) a broad-based securities market index, and (ii) a peer group of mutual funds deemed appropriate by Fidelity and reviewed by the Board. The following charts considered by the Board show, over the one-, three-, and five-year periods ended December 31, 2009, as available, the cumulative total returns of Institutional Class (Class I) and the retail class of the fund, the cumulative total returns of a broad-based securities market index ("benchmark"), and a range of cumulative total returns of a peer group of mutual funds identified by Morningstar, Inc. as having an investment style similar to that of the fund based on underlying portfolio holdings. The box within each chart shows the 25th percentile return (bottom of box) and the 75th percentile return (top of box) of the peer group. Returns shown above the box are in the first quartile and returns shown below the box are in the fourth quartile. The percentage beaten numbers noted below each chart correspond to the percentile box and represent the percentage of funds in the peer group whose performance was equal to or lower than that of the class indicated.
Annual Report
Fidelity Stock Selector Small Cap Fund
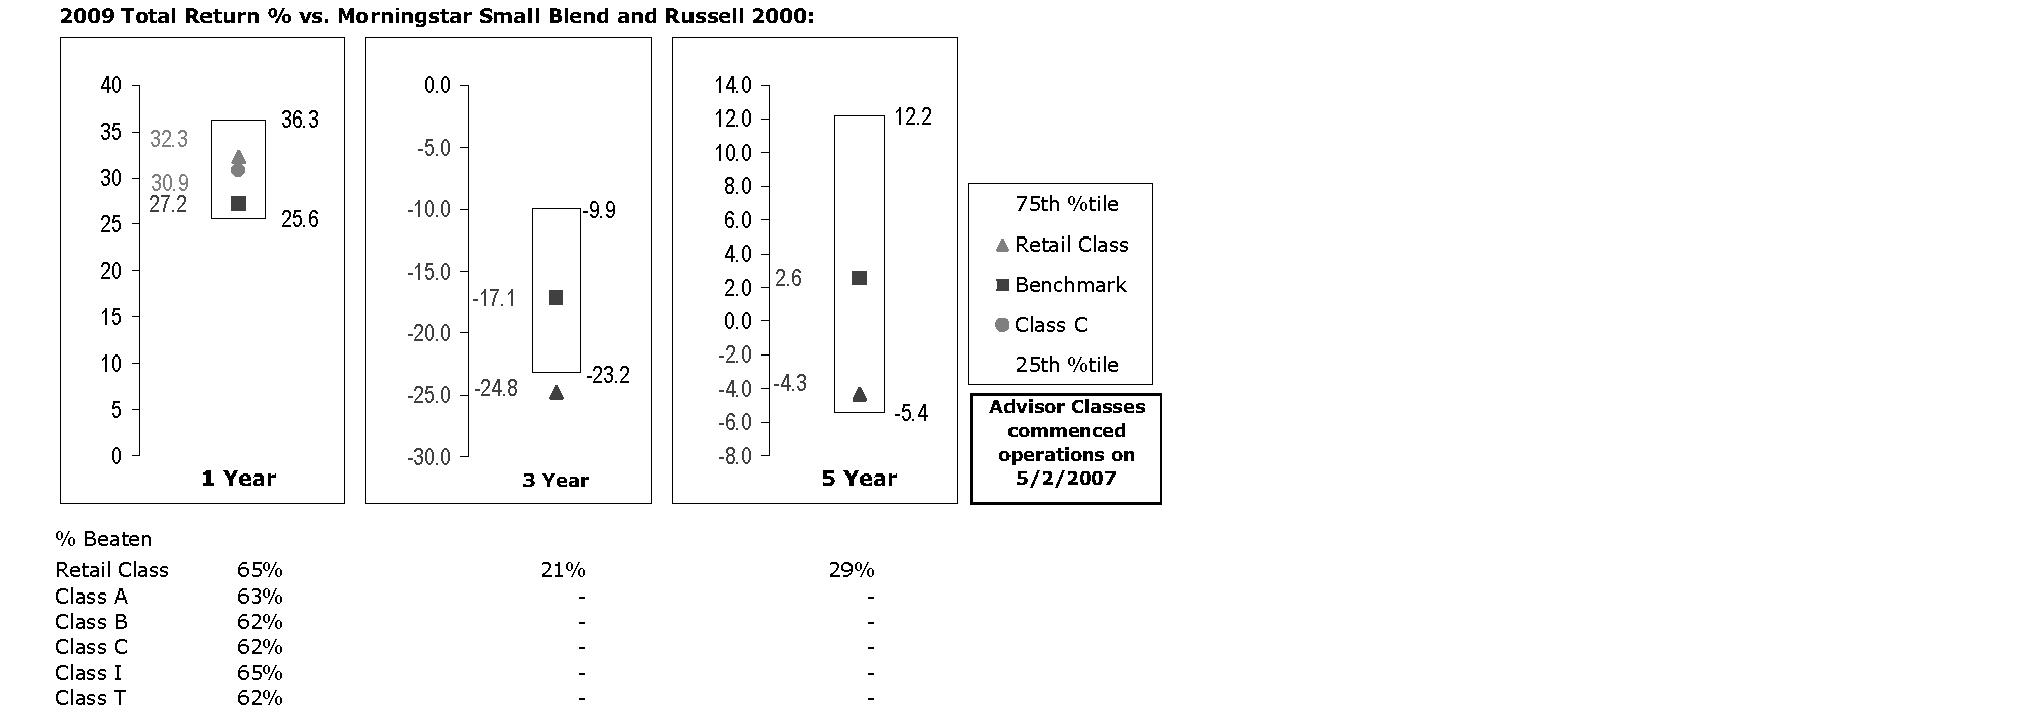
The Board reviewed the fund's relative investment performance against its peer group and noted that the performance of the retail class of the fund (the class with the longer performance record) was in the second quartile for the one-year period, the fourth quartile for the three-year period, and the third quartile for the five-year period. The Board also noted that the investment performance of the fund was lower than its benchmark for the three- and five-year periods, although the one-year cumulative total return of the retail class compared favorably to its benchmark. The Board considered that the variations in performance among the fund's classes reflect the variations in class expenses, which result in lower performance for higher expense classes. The Board also reviewed the fund's performance since inception as well as performance in the current year.
The Board also considered that the fund's management fee is subject to upward or downward adjustment depending upon whether, and to what extent, the fund's investment performance for the performance period exceeds, or is exceeded by, the record (over the same period) of a Board-approved performance adjustment index. The Board realizes that the performance adjustment provides FMR with a strong economic incentive to seek to achieve superior performance for the fund's shareholders and helps to more closely align the interests of FMR and the fund's shareholders.
Based on its review, and giving particular weight to the nature and quality of the resources dedicated by the Investment Advisers to maintain and improve relative performance and factoring in the unprecedented market events in recent years, the Board concluded that the nature, extent, and quality of investment management and support services and of shareholder and administrative services provided to the fund will benefit the fund's shareholders, particularly in light of the Board's view that the fund's shareholders benefit from investing in a fund that is part of a large family of funds offering a variety of investment disciplines and services.
Annual Report
Board Approval of Investment Advisory Contracts and
Management Fees - continued
Competitiveness of Management Fee and Total Fund Expenses. The Board considered the fund's management fee and total expenses compared to "mapped groups" of competitive funds and classes. Fidelity creates "mapped groups" by combining similar Lipper investment objective categories that have comparable management fee characteristics. Combining Lipper investment objective categories aids the Board's management fee and total expense comparisons by broadening the competitive group used for comparison and by reducing the number of universes to which various Fidelity funds are compared.
Management Fee. The Board considered two proprietary management fee comparisons for the 12-month periods shown in the chart below. The group of Lipper funds used by the Board for management fee comparisons is referred to below as the "Total Mapped Group." The Total Mapped Group comparison focuses on a fund's standing relative to the total universe of comparable funds available to investors, in terms of gross management fees before expense reimbursements or caps, and without giving effect to the fund's performance adjustment. "TMG %" represents the percentage of funds in the Total Mapped Group that had management fees that were lower than the fund's. For example, a TMG % of 5% means that 95% of the funds in the Total Mapped Group had higher management fees than the fund. The "Asset-Size Peer Group" (ASPG) comparison focuses on a fund's standing relative to non-Fidelity funds similar in size to the fund within the Total Mapped Group. The ASPG represents at least 15% of the funds in the Total Mapped Group with comparable asset size and management fee characteristics, subject to a minimum of 50 funds (or all funds in the Total Mapped Group if fewer than 50). Additional information, such as the ASPG quartile in which the fund's management fee ranked and the impact of the fund's performance adjustment, is also included in the chart and considered by the Board.
Annual Report
Fidelity Stock Selector Small Cap Fund
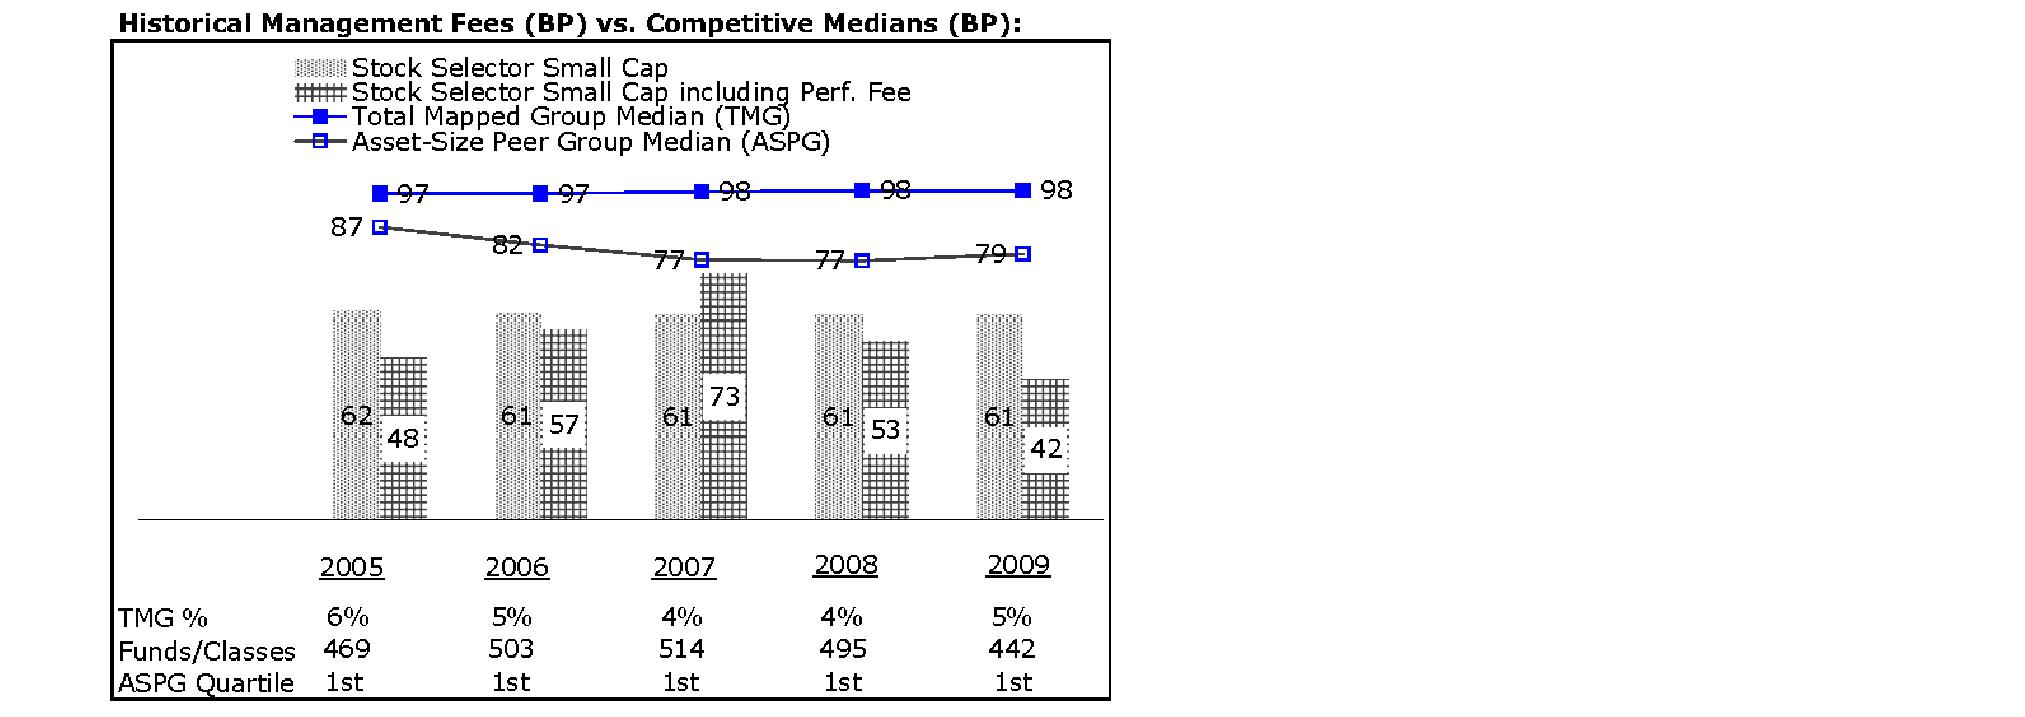
The Board noted that the fund's management fee ranked below the median of its Total Mapped Group and below the median of its ASPG for 2009. The Board also noted the effect of the fund's negative performance adjustment on the fund's management fee ranking. The Board noted that the performance adjustment for each year represents calculations for performance periods that differ from the periods shown in the performance charts above.
Based on its review, the Board concluded that the fund's management fee is fair and reasonable in light of the services that the fund receives and the other factors considered.
Total Expenses. In its review of each class's total expenses, the Board considered the fund's management fee as well as other fund or class expenses, as applicable, such as transfer agent fees, pricing and bookkeeping fees, fund-paid 12b-1 fees, and custodial, legal, and audit fees. The Board also noted the effects of any waivers and reimbursements on fees and expenses, as well as the impact of the fund's performance adjustment. As part of its review, the Board also considered current and historical total expenses of each class of the fund compared to competitive fund median expenses. Each class of the fund is compared to those funds and classes in the Total Mapped Group (used by the Board for management fee comparisons) that have a similar sales load structure.
The Board noted that the total expenses of each class ranked below its competitive median for 2009.
Fees Charged to Other Fidelity Clients. The Board also considered Fidelity fee structures and other information with respect to clients of FMR and its affiliates, such as other mutual funds advised or subadvised by FMR or its affiliates, pension plan clients, and other institutional clients. In March 2010, the Board created an ad hoc joint committee with the board of other Fidelity funds (the Committee) to review and compare Fidelity's institutional investment advisory business with its business of providing services to the Fidelity funds, including the differences in services provided, fees charged, and costs incurred, as well as competition in their respective marketplaces.
Annual Report
Board Approval of Investment Advisory Contracts and
Management Fees - continued
Based on its review of total expenses and fees charged to other Fidelity clients, the Board concluded that the total expenses of each class of the fund were reasonable in light of the services that the fund and its shareholders receive and the other factors considered, including the findings of the Committee.
Costs of the Services and Profitability. The Board considered the revenues earned and the expenses incurred by Fidelity in conducting the business of developing, marketing, distributing, managing, administering and servicing the fund and its shareholders. The Board also considered the level of Fidelity's profits in respect of all the Fidelity funds.
On an annual basis, FMR presents to the Board Fidelity's profitability for the fund. Fidelity calculates the profitability for each fund, as well as aggregate profitability for groups of Fidelity funds and all Fidelity funds, using a series of detailed revenue and cost allocation methodologies which originate with the audited books and records of Fidelity. The Audit Committee of the Board reviews any significant changes from the prior year's methodologies.
PricewaterhouseCoopers LLP (PwC), independent registered public accounting firm and auditor to Fidelity and certain Fidelity funds, has been engaged annually by the Board as part of the Board's assessment of Fidelity's profitability analysis. PwC's engagement includes the review and assessment of Fidelity's methodologies used in determining the revenues and expenses attributable to Fidelity's mutual fund business, and completion of agreed-upon procedures surrounding the mathematical accuracy of fund profitability and its conformity to allocation methodologies. After considering PwC's reports issued under the engagement and information provided by Fidelity, the Board believes that while other allocation methods may also be reasonable, Fidelity's profitability methodologies are reasonable in all material respects.
The Board has also reviewed Fidelity's non-fund businesses and fall-out benefits related to the mutual fund business as well as cases where Fidelity's affiliates may benefit from or be related to the fund's business.
The Board considered the costs of the services provided by and the profits realized by Fidelity in connection with the operation of the fund and were satisfied that the profitability was not excessive in the circumstances.
Annual Report
Economies of Scale. The Board considered whether there have been economies of scale in respect of the management of the Fidelity funds, whether the Fidelity funds (including the fund) have appropriately benefited from any such economies of scale, and whether there is potential for realization of any further economies of scale. The Board considered the extent to which the fund will benefit from economies of scale through increased services to the fund, through waivers or reimbursements, or through fee or expense reductions.
In February 2009, the Board and the board of other Fidelity funds created an ad hoc committee (the Economies of Scale Committee) to analyze whether FMR attains economies of scale in respect of the management and servicing of the Fidelity funds, whether the Fidelity funds have appropriately benefited from such economies of scale, and whether there is potential for realization of any further economies of scale.
The Board recognized that the fund's management contract incorporates a "group fee" structure, which provides for lower group fee rates as total fund assets under FMR's management increase, and for higher group fee rates as total fund assets under FMR's management decrease. FMR calculates the group fee rates based on a tiered asset "breakpoint" schedule that varies based on asset class. The Board considered that the group fee is designed to deliver the benefits of economies of scale to fund shareholders when total Fidelity fund assets increase, even if assets of any particular fund are unchanged or have declined, because some portion of Fidelity's costs are attributable to services provided to all Fidelity funds, and all funds benefit if those costs can be allocated among more assets. The Board concluded that, given the group fee structure, fund shareholders will benefit from lower management fees as assets under FMR's management increase at the fund complex level, regardless of whether Fidelity achieves any such economies of scale.
The Board concluded, considering the findings of the Economies of Scale Committee, that any potential economies of scale are being appropriately shared between fund shareholders and Fidelity.
Additional Information Requested by the Board. In order to develop fully the factual basis for consideration of the Fidelity funds' Advisory Contracts, the Board requested and received additional information on certain topics, including (i) fund performance trends, actions to be taken by FMR to improve certain funds' overall performance, and Fidelity's long-term strategies for certain funds; (ii) portfolio manager changes that have occurred during the past year and length of portfolio manager tenure for different categories of funds over time; (iii) Fidelity's compensation structure for portfolio managers, research analysts, and other key personnel, the rationale for the compensation structure, and how the compensation structure provides appropriate performance incentives; (iv) the amount of the investment that each portfolio manager has made in the Fidelity fund(s) that he or she manages; (v) management and other fees paid by FMR to affiliated sub-advisers on behalf of the Fidelity funds; (vi) Fidelity's fee structures and rationale for recommending different fees among different categories of funds; (vii) Fidelity's rationale for recommending which funds should have a performance adjustment component as part of their management fees; (viii) the rationale for any differences between fund fee structures and fee structures in place for other Fidelity clients; and (ix) explanations regarding the relative total expenses borne by certain funds and classes, total expense competitive trends, and actions that might be taken by FMR to reduce total expenses for certain funds and classes.
Annual Report
Board Approval of Investment Advisory Contracts and
Management Fees - continued
Based on its evaluation of all of the conclusions noted above, and after considering all factors it believed relevant, the Board ultimately concluded that the advisory fee structures are fair and reasonable, and that the fund's Advisory Contracts should be renewed.
Annual Report
Managing Your Investments
Fidelity offers several ways to conveniently manage your personal investments via your telephone or PC. You can access your account information, conduct trades and research your investments 24 hours a day.
By Phone
Fidelity Automated Service Telephone provides a single toll-free number to access account balances, positions, quotes and trading. It's easy to navigate the service, and on your first call, the system will help you create a personal identification number (PIN) for security.
(phone_graphic)
Fidelity Automated
Service Telephone (FAST®)
1-800-544-5555
Press
For mutual fund and brokerage trading.
For quotes.*
For account balances and holdings.
To review orders and mutual
fund activity.
To change your PIN.
To speak to a Fidelity representative.
By PC
Fidelity's web site on the Internet provides a wide range of information, including daily financial news, fund performance, interactive planning tools and news about Fidelity products and services.
(computer_graphic)
Fidelity's Web Site
www.fidelity.com
* When you call the quotes line, please remember that a fund's yield and return will vary and, except for money market funds, share price will also vary. This means that you may have a gain or loss when you sell your shares. There is no assurance that money market funds will be able to maintain a stable $1 share price; an investment in a money market fund is not insured or guaranteed by the U.S. government. Total returns are historical and include changes in share price, reinvestment of dividends and capital gains, and the effects of any sales charges.
Annual Report
To Write Fidelity
We'll give your correspondence immediate attention and send you written confirmation upon completion of your request.
(letter_graphic)
Making Changes
To Your Account
(such as changing name, address, bank, etc.)
Fidelity Investments
P.O. Box 770001
Cincinnati, OH 45277-0002
(letter_graphic)
For Non-Retirement
Accounts
Buying shares
Fidelity Investments
P.O. Box 770001
Cincinnati, OH 45277-0003
Overnight Express
Fidelity Investments
Attn: Distribution Services
100 Crosby Parkway - KC1H
Covington, KY 41015
Selling shares
Fidelity Investments
P.O. Box 770001
Cincinnati, OH 45277-0035
Overnight Express
Fidelity Investments
Attn: Distribution Services
100 Crosby Parkway - KC1H
Covington, KY 41015
General Correspondence
Fidelity Investments
P.O. Box 500
Merrimack, NH 03054-0500
(letter_graphic)
For Retirement
Accounts
Buying shares
Fidelity Investments
P.O. Box 770001
Cincinnati, OH 45277-0003
Selling shares
Fidelity Investments
P.O. Box 770001
Cincinnati, OH 45277-0035
Overnight Express
Fidelity Investments
Attn: Distribution Services
100 Crosby Parkway - KC1H
Covington, KY 41015
General Correspondence
Fidelity Investments
P.O. Box 500
Merrimack, NH 03054-0500
Annual Report
To Visit Fidelity
For directions and hours,
please call 1-800-544-9797.
Arizona
7001 West Ray Road
Chandler, AZ
15445 N. Scottsdale Road
Scottsdale, AZ
17550 North 75th Avenue
Glendale, AZ
5330 E. Broadway Blvd
Tucson, AZ
California
815 East Birch Street
Brea, CA
1411 Chapin Avenue
Burlingame, CA
851 East Hamilton Avenue
Campbell, CA
601 Larkspur Landing Circle
Larkspur, CA
2000 Avenue of the Stars
Los Angeles, CA
27101 Puerta Real
Mission Viejo, CA
73575 El Paseo
Palm Desert, CA
251 University Avenue
Palo Alto, CA
123 South Lake Avenue
Pasadena, CA
16656 Bernardo Ctr. Drive
Rancho Bernardo, CA
1220 Roseville Parkway
Roseville, CA
1740 Arden Way
Sacramento, CA
7676 Hazard Center Drive
San Diego, CA
11943 El Camino Real
San Diego, CA
8 Montgomery Street
San Francisco, CA
3793 State Street
Santa Barbara, CA
1200 Wilshire Boulevard
Santa Monica, CA
398 West El Camino Real
Sunnyvale, CA
111 South Westlake Blvd
Thousand Oaks, CA
21701 Hawthorne Boulevard
Torrance, CA
2001 North Main Street
Walnut Creek, CA
6326 Canoga Avenue
Woodland Hills, CA
2211 Michelson Drive
Irvine, CA
Colorado
281 East Flatiron Circle
Broomfield, CO
1625 Broadway
Denver, CO
9185 Westview Road
Lone Tree, CO
Connecticut
48 West Putnam Avenue
Greenwich, CT
265 Church Street
New Haven, CT
300 Atlantic Street
Stamford, CT
29 South Main Street
West Hartford, CT
1261 Post Road
Fairfield, CT
Delaware
400 Delaware Avenue
Wilmington, DE
Florida
175 East Altamonte Drive
Altamonte Springs, FL
1400 Glades Road
Boca Raton, FL
121 Alhambra Plaza
Coral Gables, FL
2948 N. Federal Highway
Ft. Lauderdale, FL
4671 Town Center Parkway
Jacksonville, FL
8880 Tamiami Trail, North
Naples, FL
230 Royal Palm Way
Palm Beach, FL
3501 PGA Boulevard
Palm Beach Gardens, FL
3550 Tamiami Trail, South
Sarasota, FL
1502 N. Westshore Blvd.
Tampa, FL
2465 State Road 7
Wellington, FL
Georgia
3242 Peachtree Road
Atlanta, GA
1000 Abernathy Road
Atlanta, GA
Illinois
One North LaSalle Street
Chicago, IL
401 North Michigan Avenue
Chicago, IL
One Skokie Valley Road
Highland Park, IL
1415 West 22nd Street
Oak Brook, IL
15105 S LaGrange Road
Orland Park, IL
1572 East Golf Road
Schaumburg, IL
1823 Freedom Drive
Naperville, IL
Indiana
8480 Keystone Crossing
Indianapolis, IN
Kansas
5400 College Boulevard
Overland Park, KS
Maine
Three Canal Plaza
Portland, ME
Maryland
7315 Wisconsin Avenue
Bethesda, MD
610 York Road
Towson, MD
Massachusetts
801 Boylston Street
Boston, MA
155 Congress Street
Boston, MA
300 Granite Street
Braintree, MA
44 Mall Road
Burlington, MA
238 Main Street
Cambridge, MA
200 Endicott Street
Danvers, MA
Fidelity Brokerage Services, Inc., 100 Summer St., Boston, MA 02110 Member NYSE/SIPC
Annual Report
405 Cochituate Road
Framingham, MA
551 Boston Turnpike
Shrewsbury, MA
Michigan
500 E. Eisenhower Pkwy.
Ann Arbor, MI
280 N. Old Woodward Ave.
Birmingham, MI
30200 Northwestern Hwy.
Farmington Hills, MI
43420 Grand River Avenue
Novi, MI
3480 28th Street
Grand Rapids, MI
2425 S. Linden Road STE E
Flint, MI
Minnesota
7740 France Avenue South
Edina, MN
8342 3rd Street North
Oakdale, MN
Missouri
1524 South Lindbergh Blvd.
St. Louis, MO
Nevada
2225 Village Walk Drive
Henderson, NV
New Jersey
501 Route 73 South
Marlton, NJ
150 Essex Street
Millburn, NJ
35 Morris Street
Morristown, NJ
396 Route 17, North
Paramus, NJ
3518 Route 1 North
Princeton, NJ
530 Broad Street
Shrewsbury, NJ
New Mexico
2261 Q Street NE
Albuquerque, NM
New York
1130 Franklin Avenue
Garden City, NY
37 West Jericho Turnpike
Huntington Station, NY
1271 Avenue of the Americas
New York, NY
980 Madison Avenue
New York, NY
61 Broadway
New York, NY
350 Park Avenue
New York, NY
200 Fifth Avenue
New York, NY
733 Third Avenue
New York, NY
2070 Broadway
New York, NY
1075 Northern Blvd.
Roslyn, NY
799 Central Park Avenue
Scarsdale, NY
3349 Monroe Avenue
Rochester, NY
North Carolina
4611 Sharon Road
Charlotte, NC
7011 Fayetteville Road
Durham, NC
Ohio
3805 Edwards Road
Cincinnati, OH
1324 Polaris Parkway
Columbus, OH
1800 Crocker Road
Westlake, OH
28699 Chagrin Boulevard
Woodmere Village, OH
Oregon
7493 SW Bridgeport Road
Tigard, OR
Pennsylvania
600 West DeKalb Pike
King of Prussia, PA
1735 Market Street
Philadelphia, PA
12001 Perry Highway
Wexford, PA
Rhode Island
10 Memorial Boulevard
Providence, RI
Tennessee
3018 Peoples Street
Johnson City, TN
7628 West Farmington Blvd.
Germantown, TN
2035 Mallory Lane
Franklin, TN
Texas
10000 Research Boulevard
Austin, TX
4001 Northwest Parkway
Dallas, TX
12532 Memorial Drive
Houston, TX
2701 Drexel Drive
Houston, TX
6560 Fannin Street
Houston, TX
1701 Lake Robbins Drive
The Woodlands, TX
6500 N. MacArthur Blvd.
Irving, TX
6005 West Park Boulevard
Plano, TX
1576 East Southlake Blvd.
Southlake, TX
15600 Southwest Freeway
Sugar Land, TX
139 N. Loop 1604 East
San Antonio, TX
Utah
279 West South Temple
Salt Lake City, UT
Virginia
1861 International Drive
McLean, VA
11957 Democracy Drive
Reston, VA
Washington
10500 NE 8th Street
Bellevue, WA
1518 6th Avenue
Seattle, WA
304 Strander Blvd
Tukwila, WA
Washington, DC
1900 K Street, N.W.
Washington, DC
Wisconsin
16020 West Bluemound Road
Brookfield, WI
Annual Report
Investment Adviser
Fidelity Management & Research Company
Boston, MA
Investment Sub-Advisers
FMR Co., Inc.
Fidelity Research & Analysis Company
Fidelity Management & Research
(U.K.) Inc.
Fidelity Management & Research
(Hong Kong) Limited
Fidelity Management & Research
(Japan) Inc.
General Distributor
Fidelity Distributors Corporation
Boston, MA
Transfer and Service Agents
Fidelity Investments Institutional
Operations Company, Inc.
Boston, MA
Fidelity Service Company, Inc.
Boston, MA
Custodian
Brown Brothers Harriman & Co.
Boston, MA
The Fidelity Telephone Connection
Mutual Fund 24-Hour Service
Exchanges/Redemptions
and Account Assistance 1-800-544-6666
Product Information 1-800-544-6666
Retirement Accounts 1-800-544-4774
(8 a.m. - 9 p.m.)
TDD Service 1-800-544-0118
for the deaf and hearing impaired
(9 a.m. - 9 p.m. Eastern time)
Fidelity Automated Service
Telephone (FAST®) 1-800-544-5555
Automated line for quickest service
SCS-UANN-1210
1.784779.107
(Fidelity Investment logo)(registered trademark)
Fidelity AdvisorSM
Stock Selector Small Cap
Fund - Class A, Class T, Class B
and Class C
(formerly Fidelity Advisor Small Cap
Independence Fund)
Annual Report
October 31, 2010
(2_fidelity_logos) (Registered_Trademark)
Class A, Class T, Class B,
and Class C are classes of
Fidelity® Stock Selector
Small Cap Fund
Contents
Chairman's Message | <Click Here> | The Chairman's message to shareholders. |
Performance | <Click Here> | How the fund has done over time. |
Management's Discussion of Fund Performance | <Click Here> | The Portfolio Manager's review of fundperformance and strategy. |
Shareholder Expense Example | <Click Here> | An example of shareholder expenses. |
Investment Changes | <Click Here> | A summary of major shifts in the fund's investments over the past six months. |
Investments | <Click Here> | A complete list of the fund's investments with their market values. |
Financial Statements | <Click Here> | Statements of assets and liabilities, operations, and changes in net assets,
as well as financial highlights. |
Notes | <Click Here> | Notes to the financial statements. |
Report of Independent Registered Public Accounting Firm | <Click Here> | |
Trustees and Officers | <Click Here> | |
Distributions | <Click Here> | |
Board Approval of Investment Advisory Contracts and Management Fees | <Click Here> | |
To view a fund's proxy voting guidelines and proxy voting record for the 12-month period ended June 30, visit http://www.fidelity.com/proxyvotingresults or visit the Securities and Exchange Commission's (SEC) web site at http://www.sec.gov. You may also call 1-877-208-0098 to request a free copy of the proxy voting guidelines.
Standard & Poor's, S&P and S&P 500 are registered service marks of The McGraw-Hill Companies, Inc. and have been licensed for use by Fidelity Distributors Corporation.
Other third party marks appearing herein are the property of their respective owners.
All other marks appearing herein are registered or unregistered trademarks or service marks of FMR LLC or an affiliated company.
Annual Report
This report and the financial statements contained herein are submitted for the general information of the shareholders of the fund. This report is not authorized for distribution to prospective investors in the fund unless preceded or accompanied by an effective prospectus.
A fund files its complete schedule of portfolio holdings with the SEC for the first and third quarters of each fiscal year on Form N-Q. Forms N-Q are available on the SEC's web site at http://www.sec.gov. A fund's Forms N-Q may be reviewed and copied at the SEC's Public Reference Room in Washington, DC. Information regarding the operation of the SEC's Public Reference Room may be obtained by calling 1-800-SEC-0330. For a complete list of a fund's portfolio holdings, view the most recent holdings listing, semiannual report, or annual report on Fidelity's web site at http://www.fidelity.com or http://www.advisor.fidelity.com, as applicable.
NOT FDIC INSURED • MAY LOSE VALUE • NO BANK GUARANTEE
Neither the fund nor Fidelity Distributors Corporation is a bank.
Annual Report
(photo_of_Edward_C_Johnson_3d)
Dear Shareholder:
Equities have staged a rally in the second half of 2010, shaking off concerns about the European debt crisis and the possibility of a double-dip recession in the U.S. Although the short-term surge pushed major equity indexes back into positive territory for the year, several questions remain about the longer-term outlook, including lackluster economic growth and persistently high unemployment. Financial markets are always unpredictable, of course, but there also are several time-tested investment principles that can help put the odds in your favor.
One of the basic tenets is to invest for the long term. Over time, riding out the markets' inevitable ups and downs has proven much more effective than selling into panic or chasing the hottest trend. Even missing only a few of the markets' best days can significantly diminish investor returns. Patience also affords the benefits of compounding - of earning interest on additional income or reinvested dividends and capital gains. There can be tax advantages and cost benefits to consider as well. While staying the course doesn't eliminate risk, it can considerably lessen the effect of short-term declines.
You can further manage your investing risk through diversification. And today, more than ever, geographic diversification should be taken into account. Studies indicate that asset allocation is the single most important determinant of a portfolio's long-term success. The right mix of stocks, bonds and cash - aligned to your particular risk tolerance and investment objective - is very important. Age-appropriate rebalancing is also an essential aspect of asset allocation. For younger investors, an emphasis on equities - which historically have been the best-performing asset class over time - is encouraged. As investors near their specific goal, such as retirement or sending a child to college, consideration may be given to replacing volatile assets (e.g. common stocks) with more-stable fixed investments (bonds or savings plans).
A third principle - investing regularly - can help lower the average cost of your purchases. Investing a certain amount of money each month or quarter helps ensure you won't pay for all your shares at market highs. This strategy - known as dollar cost averaging - also reduces "emotion" from investing, helping shareholders avoid selling weak performers just prior to an upswing, or chasing a hot performer just before a correction.
We invite you to contact us via the Internet, through our Investor Centers or by phone. It is our privilege to provide you the information you need to make the investments that are right for you.
Sincerely,
(The chairman's signature appears here.)
Edward C. Johnson 3d
Annual Report
Average annual total return reflects the change in the value of an investment, assuming reinvestment of the class' distributions from dividend income and capital gains (the profits earned upon the sale of securities that have grown in value, if any) and assuming a constant rate of performance each year. The $10,000 table and the fund's returns do not reflect the deduction of taxes that a shareholder would pay on fund distributions or the redemption of fund shares. During periods of reimbursement by Fidelity, a fund's total return will be greater than it would be had the reimbursement not occurred. How a fund did yesterday is no guarantee of how it will do tomorrow.
Average Annual Total Returns
Periods ended October 31, 2010 | Past 1
year | Past 5
years | Past 10
years |
Class A (incl. sales charge)A | 21.88% | -0.12% | 3.29% |
Class T (incl. sales charge)B | 24.56% | 0.15% | 3.43% |
Class B (incl. contingent deferred sales charge) C | 23.40% | 0.24% | 3.63% |
Class C (incl. contingent deferred sales charge) D | 27.30% | 0.54% | 3.63% |
A Class A shares bear a 0.25% 12b-1 fee. The initial offering of Class A shares took place on May 2, 2007. Returns prior to May 2, 2007 are those of Fidelity® Stock Selector Small Cap Fund, the original class of the fund, which has no 12b-1 fee. Had Class A shares' 12b-1 fee been reflected, returns prior to May 2, 2007 would have been lower.
B Class T shares bear a 0.50% 12b-1 fee. The initial offering of Class T shares took place on May 2, 2007. Returns prior to May 2, 2007 are those of Fidelity Stock Selector Small Cap Fund, the original class of the fund, which has no 12b-1 fee. Had Class T shares' 12b-1 fee been reflected, returns prior to May 2, 2007 would have been lower.
C Class B shares bear a 1.00% 12b-1 fee. The initial offering of Class B shares took place on May 2, 2007. Returns prior to May 2, 2007 are those of Fidelity Stock Selector Small Cap Fund, the original class of the fund, which has no 12b-1 fee. Had Class B shares' 12b-1 fee been reflected, returns prior to May 2, 2007 would have been lower. Class B shares' contingent deferred sales charges included in the past one year, past five years, and past 10 years total return figures are 5%, 2% ,and 0%, respectively.
D Class C shares bear a 1.00% 12b-1 fee. The initial offering of Class C shares took place on May 2, 2007. Returns prior to May 2, 2007 are those of Fidelity Stock Selector Small Cap Fund, the original class of the fund, which has no 12b-1 fee. Had Class C shares' 12b-1 fee been reflected, returns prior to May 2, 2007 would have been lower. Class C shares' contingent deferred sales charges included in the past one year, past five years, and past 10 years total return figures are 1%, 0%, and 0%, respectively.
Annual Report
$10,000 Over 10 Years
Let's say hypothetically that $10,000 was invested in Fidelity AdvisorSM Stock Selector Small Cap Fund - Class A on October 31, 2000, and the current 5.75% sales charge was paid. The chart shows how the value of your investment would have changed, and also shows how the Russell 2000® Index performed over the same period. The initial offering of Class A took place on May 2, 2007. See the previous page for additional information regarding the performance of Class A.
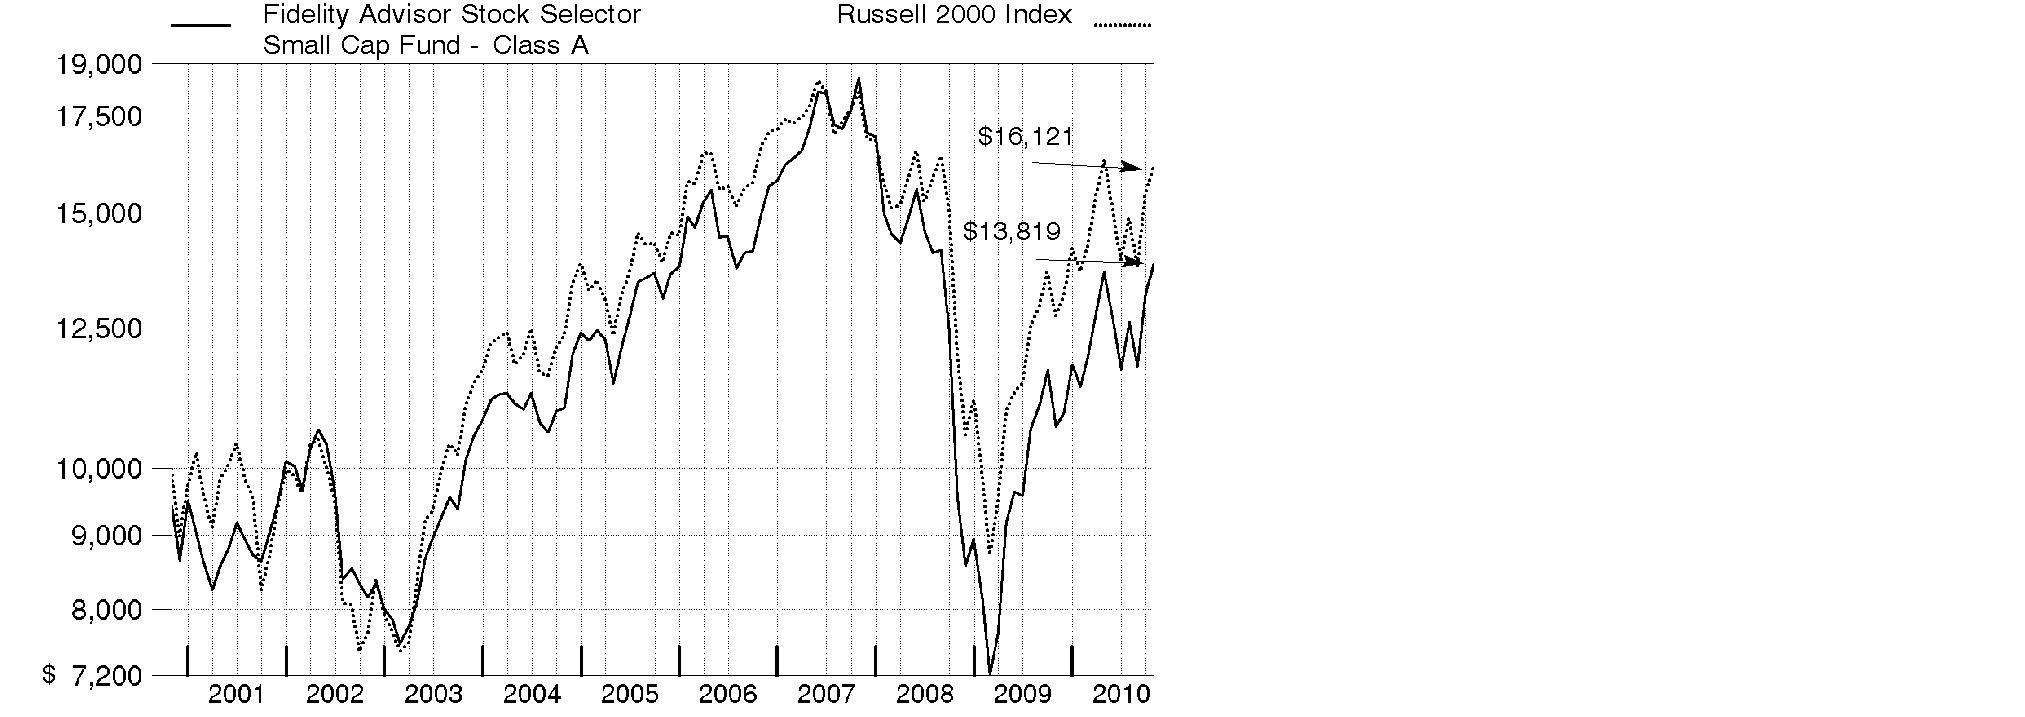
Annual Report
Market Recap: Amid bouts of volatility, major U.S. stock market indexes recorded double-digit gains for the year ending October 31, 2010, lifted by economic optimism, encouraging earnings reports and a wave of corporate mergers. Aside from a January dip, stocks trended upward for the first half of the period amid indications the Great Recession was over. However, in April, lingering high unemployment and heightened concern over European debt sent equities falling. Markets regrouped in July, but fell again in August on mixed economic data. The final two months of the period brought renewed optimism, with the large-cap S&P 500® Index posting its best September/October performance since 1998. For the full 12 months, the S&P 500® rose 16.52%, while the blue-chip-laden Dow Jones Industrial AverageSM added 17.62% and the technology-heavy Nasdaq Composite® Index rose 23.72%. Among market segments, all 10 sectors in the S&P 500 posted gains, with more than half outperforming the broad-market index. Stocks of mid- and small-sized companies surged, with the Russell Midcap® Index adding 27.71% and Russell 2000® Index climbing 26.58%. Looking abroad, debt problems in several European countries cooled gains in developed markets, and yet the MSCI® EAFE® (Europe, Australasia, Far East) Index still rose 8.49%.
Comments from Rayna Lesser and Charles Myers, Co-Portfolio Managers of Fidelity AdvisorSM Stock Selector Small Cap Fund: For the year ending October 31, 2010, the fund's Class A, Class T, Class B and Class C shares returned 29.32%, 29.08%, 28.40% and 28.30%, respectively (excluding sales charges), solidly outpacing the Russell 2000. The fund adopted a multi-manager structure at the beginning of the period, allocating assets in a sector-neutral manner among a team of sector portfolio managers. Most of the fund's outperformance came from strong stock selection, particularly within consumer staples, materials and energy. Good picks in health care and pockets of consumer discretionary also provided a boost, as did favorable positioning within financials - specifically banks - among other sectors. Our top individual contributors included gold producer Red Back Mining - which was acquired during the period - flash-memory-card maker SanDisk, auto-emission control product manufacturer Tenneco and real estate services firm Jones Lang LaSalle. Conversely, stock selection in retailing and industrials notably detracted from results. Fourlis Holdings, owner of the Greek franchise of Swedish furnishing group Ikea, was the biggest individual detractor, followed by lender Washington Federal and pharmacy benefit manager BioScrip. Some stocks mentioned were out-of-benchmark positions, and some were sold by period end.
Comments from Rayna Lesser and Charles Myers, Co-Portfolio Managers of Fidelity AdvisorSM Stock Selector Small Cap Fund: For the year ending October 31, 2010, the fund's Institutional Class shares returned 29.89%, solidly outpacing the Russell 2000. The fund adopted a multi-manager structure at the beginning of the period, allocating assets in a sector-neutral manner among a team of sector portfolio managers. Most of the fund's outperformance came from strong stock selection, particularly within consumer staples, materials and energy. Good picks in health care and pockets of consumer discretionary also provided a boost, as did favorable positioning within financials - specifically banks - among other sectors. Our top individual contributors included gold producer Red Back Mining - which was acquired during the period - flash-memory-card maker SanDisk, auto-emission control product manufacturer Tenneco and real estate services firm Jones Lang LaSalle. Conversely, stock selection in retailing and industrials notably detracted from results. Fourlis Holdings, owner of the Greek franchise of Swedish furnishing group Ikea, was the biggest individual detractor, followed by lender Washington Federal and pharmacy benefit manager BioScrip. Some stocks mentioned were out-of-benchmark positions, and some were sold by period end.
Annual Report
The views expressed above reflect those of the portfolio manager(s) only through the end of the period as stated on the cover of this report and do not necessarily represent the views of Fidelity or any other person in the Fidelity organization. Any such views are subject to change at any time based upon market or other conditions and Fidelity disclaims any responsibility to update such views. These views may not be relied on as investment advice and, because investment decisions for a Fidelity fund are based on numerous factors, may not be relied on as an indication of trading intent on behalf of any Fidelity fund.
Annual Report
Shareholder Expense Example
As a shareholder of the Fund, you incur two types of costs: (1) transaction costs, including sales charges (loads) on purchase payments or redemption proceeds, redemption fees, and (2) ongoing costs, including management fees, distribution and/or service (12b-1) fees and other Fund expenses. This Example is intended to help you understand your ongoing costs (in dollars) of investing in the Fund and to compare these costs with the ongoing costs of investing in other mutual funds.
The Example is based on an investment of $1,000 invested at the beginning of the period and held for the entire period (May 1, 2010 to October 31, 2010).
Actual Expenses
The first line of the accompanying table for each class of the Fund provides information about actual account values and actual expenses. You may use the information in this line, together with the amount you invested, to estimate the expenses that you paid over the period. Simply divide your account value by $1,000.00 (for example, an $8,600 account value divided by $1,000.00 = 8.6), then multiply the result by the number in the first line for a class of the Fund under the heading entitled "Expenses Paid During Period" to estimate the expenses you paid on your account during this period. A small balance maintenance fee of $12.00 that is charged once a year may apply for certain accounts with a value of less than $2,000. This fee is not included in the table below. If it was, the estimate of expenses you paid during the period would be higher, and your ending account value lower, by this amount. In addition, the Fund, as a shareholder in the underlying Fidelity Central Funds, will indirectly bear its pro-rata share of the fees and expenses incurred by the underlying Fidelity Central Funds. These fees and expenses are not included in the Fund's annualized expense ratio used to calculate the expense estimate in the table below.
Hypothetical Example for Comparison Purposes
The second line of the accompanying table for each class of the Fund provides information about hypothetical account values and hypothetical expenses based on a Class' actual expense ratio and an assumed rate of return of 5% per year before expenses, which is not the Class' actual return. The hypothetical account values and expenses may not be used to estimate the actual ending account balance or expenses you paid for the period. You may use this information to compare the ongoing costs of investing in the Fund and other funds. To do so, compare this 5% hypothetical example with the 5% hypothetical examples that appear in the shareholder reports of the other funds. A small balance maintenance fee of $12.00 that is charged once a year may apply for certain accounts with a value of less than $2,000. This fee is not included in the table below. If it was, the estimate of expenses you paid during the period would be higher, and your ending account value lower, by this amount. In addition, the Fund, as a shareholder in the underlying Fidelity Central Funds, will indirectly bear its pro-rata share of the fees and expenses incurred by the underlying Fidelity Central Funds. These fees and expenses are not included in the Fund's annualized expense ratio used to calculate the expense estimate in the table below.
Please note that the expenses shown in the table are meant to highlight your ongoing costs only and do not reflect any transaction costs. Therefore, the second line of the table is useful in comparing ongoing costs only, and will not help you determine the relative total costs of owning different funds. In addition, if these transactional costs were included, your costs would have been higher.
Annual Report
| Annualized Expense Ratio | Beginning
Account Value
May 1, 2010 | Ending
Account Value
October 31, 2010 | Expenses Paid
During Period*
May 1, 2010
to October 31, 2010 |
Class A | .99% | | | |
Actual | | $ 1,000.00 | $ 1,011.90 | $ 5.02 |
HypotheticalA | | $ 1,000.00 | $ 1,020.21 | $ 5.04 |
Class T | 1.27% | | | |
Actual | | $ 1,000.00 | $ 1,010.70 | $ 6.44 |
HypotheticalA | | $ 1,000.00 | $ 1,018.80 | $ 6.46 |
Class B | 1.74% | | | |
Actual | | $ 1,000.00 | $ 1,008.30 | $ 8.81 |
HypotheticalA | | $ 1,000.00 | $ 1,016.43 | $ 8.84 |
Class C | 1.74% | | | |
Actual | | $ 1,000.00 | $ 1,008.30 | $ 8.81 |
HypotheticalA | | $ 1,000.00 | $ 1,016.43 | $ 8.84 |
Stock Selector Small Cap | .71% | | | |
Actual | | $ 1,000.00 | $ 1,013.60 | $ 3.60 |
HypotheticalA | | $ 1,000.00 | $ 1,021.63 | $ 3.62 |
Institutional Class | .64% | | | |
Actual | | $ 1,000.00 | $ 1,014.20 | $ 3.25 |
HypotheticalA | | $ 1,000.00 | $ 1,021.98 | $ 3.26 |
A 5% return per year before expenses
* Expenses are equal to each Class' annualized expense ratio, multiplied by the average account value over the period, multiplied by 184/365 (to reflect the one-half year period).
Annual Report
Investment Changes (Unaudited)
Top Ten Stocks as of October 31, 2010 |
| % of fund's
net assets | % of fund's net assets
6 months ago |
Platinum Underwriters Holdings Ltd. | 1.2 | 0.9 |
Forestar Group, Inc. | 1.1 | 1.2 |
CapitalSource, Inc. | 1.1 | 1.0 |
Tenneco, Inc. | 1.1 | 0.9 |
Affiliated Managers Group, Inc. | 1.0 | 0.9 |
National Penn Bancshares, Inc. | 1.0 | 1.1 |
Alexandria Real Estate Equities, Inc. | 1.0 | 1.1 |
Tempur-Pedic International, Inc. | 1.0 | 0.8 |
Franklin Street Properties Corp. | 1.0 | 0.0 |
Waddell & Reed Financial, Inc. Class A | 1.0 | 1.2 |
| 10.5 | |
Top Five Market Sectors as of October 31, 2010 |
| % of fund's
net assets | % of fund's net assets
6 months ago |
Information Technology | 21.0 | 18.7 |
Financials | 19.9 | 20.4 |
Consumer Discretionary | 14.2 | 15.6 |
Industrials | 13.8 | 14.0 |
Health Care | 12.1 | 13.5 |
Asset Allocation (% of fund's net assets) |
As of October 31, 2010 * | As of April 30, 2010 ** |
| Stocks and
Equity Futures 99.0% | | | Stocks and
Equity Futures 99.5% | |
| Short-Term
Investments and
Net Other Assets 1.0% | | | Short-Term
Investments and
Net Other Assets 0.5% | |
* Foreign investments | 7.7% | | ** Foreign investments | 8.5% | |
Annual Report
Investments October 31, 2010
Showing Percentage of Net Assets
Common Stocks - 98.9% |
| Shares | | Value (000s) |
CONSUMER DISCRETIONARY - 14.2% |
Auto Components - 1.5% |
BorgWarner, Inc. (a) | 105,200 | | $ 5,903 |
Tenneco, Inc. (a) | 462,100 | | 15,074 |
| | 20,977 |
Diversified Consumer Services - 0.2% |
Bridgepoint Education, Inc. (a)(d) | 231,342 | | 3,294 |
Hotels, Restaurants & Leisure - 1.9% |
Red Robin Gourmet Burgers, Inc. (a) | 135,000 | | 2,741 |
Vail Resorts, Inc. (a)(d) | 207,700 | | 8,424 |
WMS Industries, Inc. (a) | 155,700 | | 6,793 |
Wyndham Worldwide Corp. | 315,315 | | 9,065 |
| | 27,023 |
Household Durables - 2.6% |
iRobot Corp. (a) | 308,470 | | 6,441 |
Meritage Homes Corp. (a) | 448,000 | | 8,203 |
Mohawk Industries, Inc. (a) | 145,500 | | 8,343 |
Tempur-Pedic International, Inc. (a) | 402,546 | | 13,888 |
| | 36,875 |
Media - 0.6% |
Lamar Advertising Co. Class A (a) | 253,400 | | 8,613 |
Multiline Retail - 0.9% |
Dollarama, Inc. | 282,934 | | 7,457 |
Retail Ventures, Inc. (a) | 340,299 | | 4,625 |
| | 12,082 |
Specialty Retail - 4.5% |
Cabela's, Inc. Class A (a)(d) | 525,662 | | 9,746 |
Fourlis Holdings SA | 519,230 | | 4,963 |
Gymboree Corp. (a) | 168,000 | | 10,930 |
RadioShack Corp. (d) | 398,100 | | 8,014 |
Shoe Carnival, Inc. (a) | 468,347 | | 10,725 |
Signet Jewelers Ltd. (a) | 242,900 | | 8,545 |
Ulta Salon, Cosmetics & Fragrance, Inc. (a) | 272,619 | | 8,367 |
West Marine, Inc. (a)(d) | 273,200 | | 2,680 |
| | 63,970 |
Textiles, Apparel & Luxury Goods - 2.0% |
Deckers Outdoor Corp. (a) | 93,467 | | 5,430 |
Common Stocks - continued |
| Shares | | Value (000s) |
CONSUMER DISCRETIONARY - continued |
Textiles, Apparel & Luxury Goods - continued |
G-III Apparel Group Ltd. (a) | 451,300 | | $ 11,914 |
Phillips-Van Heusen Corp. | 167,200 | | 10,256 |
| | 27,600 |
TOTAL CONSUMER DISCRETIONARY | | 200,434 |
CONSUMER STAPLES - 3.2% |
Beverages - 0.4% |
Hansen Natural Corp. (a) | 116,900 | | 5,986 |
Food & Staples Retailing - 0.8% |
BJ's Wholesale Club, Inc. (a) | 145,700 | | 6,080 |
United Natural Foods, Inc. (a) | 142,126 | | 5,082 |
| | 11,162 |
Food Products - 1.2% |
Chiquita Brands International, Inc. (a) | 442,770 | | 5,876 |
Green Mountain Coffee Roasters, Inc. (a)(d) | 222,903 | | 7,354 |
J&J Snack Foods Corp. | 34,708 | | 1,488 |
Lance, Inc. | 89,223 | | 2,029 |
| | 16,747 |
Personal Products - 0.8% |
Elizabeth Arden, Inc. (a) | 390,155 | | 7,979 |
Nutraceutical International Corp. (a) | 185,112 | | 3,008 |
| | 10,987 |
TOTAL CONSUMER STAPLES | | 44,882 |
ENERGY - 5.0% |
Energy Equipment & Services - 1.5% |
Complete Production Services, Inc. (a) | 257,429 | | 6,032 |
Newpark Resources, Inc. (a) | 908,472 | | 5,342 |
Superior Energy Services, Inc. (a) | 245,400 | | 6,778 |
Willbros Group, Inc. (a) | 429,700 | | 3,807 |
| | 21,959 |
Oil, Gas & Consumable Fuels - 3.5% |
Atlas Pipeline Partners, LP | 489,813 | | 9,693 |
Berry Petroleum Co. Class A | 249,100 | | 8,522 |
Cloud Peak Energy, Inc. | 475,000 | | 8,251 |
EXCO Resources, Inc. | 334,000 | | 4,953 |
Common Stocks - continued |
| Shares | | Value (000s) |
ENERGY - continued |
Oil, Gas & Consumable Fuels - continued |
SM Energy Co. | 228,668 | | $ 9,531 |
Whiting Petroleum Corp. (a) | 83,065 | | 8,343 |
| | 49,293 |
TOTAL ENERGY | | 71,252 |
FINANCIALS - 19.9% |
Capital Markets - 2.9% |
Affiliated Managers Group, Inc. (a) | 165,400 | | 14,160 |
optionsXpress Holdings, Inc. (a) | 796,600 | | 12,722 |
Waddell & Reed Financial, Inc. Class A | 471,600 | | 13,709 |
| | 40,591 |
Commercial Banks - 5.4% |
Associated Banc-Corp. | 951,923 | | 12,061 |
CapitalSource, Inc. | 2,540,800 | | 15,524 |
City National Corp. | 228,400 | | 11,779 |
National Penn Bancshares, Inc. | 2,180,900 | | 14,154 |
PacWest Bancorp | 587,900 | | 10,247 |
TCF Financial Corp. | 990,800 | | 13,039 |
| | 76,804 |
Diversified Financial Services - 0.4% |
Gimv NV | 102,300 | | 5,655 |
Insurance - 3.7% |
Alterra Capital Holdings Ltd. | 521,700 | | 10,538 |
Amerisafe, Inc. (a) | 661,800 | | 12,634 |
Endurance Specialty Holdings Ltd. | 321,300 | | 13,302 |
Platinum Underwriters Holdings Ltd. | 376,100 | | 16,185 |
| | 52,659 |
Real Estate Investment Trusts - 4.0% |
Alexandria Real Estate Equities, Inc. (d) | 189,900 | | 13,954 |
Franklin Street Properties Corp. | 1,033,200 | | 13,793 |
Highwoods Properties, Inc. (SBI) | 245,300 | | 8,127 |
Home Properties, Inc. | 182,361 | | 9,930 |
National Retail Properties, Inc. | 377,100 | | 10,219 |
| | 56,023 |
Real Estate Management & Development - 2.0% |
Forestar Group, Inc. (a) | 914,700 | | 15,641 |
Jones Lang LaSalle, Inc. | 156,900 | | 12,248 |
| | 27,889 |
Common Stocks - continued |
| Shares | | Value (000s) |
FINANCIALS - continued |
Thrifts & Mortgage Finance - 1.5% |
Astoria Financial Corp. | 736,000 | | $ 9,141 |
Washington Federal, Inc. | 767,300 | | 11,533 |
| | 20,674 |
TOTAL FINANCIALS | | 280,295 |
HEALTH CARE - 12.1% |
Biotechnology - 3.4% |
Allos Therapeutics, Inc. (a)(d) | 854,912 | | 3,403 |
Amarin Corp. PLC ADR (a)(d) | 616,430 | | 1,886 |
Anadys Pharmaceuticals, Inc. (a) | 1,008,358 | | 1,462 |
ARIAD Pharmaceuticals, Inc. (a) | 1,069,718 | | 3,937 |
ArQule, Inc. (a) | 413,558 | | 2,283 |
BioMarin Pharmaceutical, Inc. (a) | 140,400 | | 3,673 |
Dynavax Technologies Corp. (a) | 1,428,141 | | 2,599 |
Incyte Corp. (a) | 242,220 | | 4,035 |
Inhibitex, Inc. (a) | 602,137 | | 1,198 |
Keryx Biopharmaceuticals, Inc. (a)(d) | 626,557 | | 3,233 |
Lexicon Pharmaceuticals, Inc. (a) | 1,690,152 | | 2,992 |
Metabolix, Inc. (a)(d) | 134,798 | | 1,882 |
Pharmasset, Inc. (a) | 64,200 | | 2,408 |
SIGA Technologies, Inc. (a) | 175,887 | | 2,331 |
Targacept, Inc. (a) | 137,359 | | 3,401 |
Telik, Inc. (a) | 965,343 | | 791 |
Theravance, Inc. (a) | 162,434 | | 3,310 |
ZIOPHARM Oncology, Inc. (a)(d) | 724,202 | | 3,121 |
| | 47,945 |
Health Care Equipment & Supplies - 2.4% |
AGA Medical Holdings, Inc. | 47,100 | | 977 |
American Medical Systems Holdings, Inc. (a) | 558,983 | | 11,291 |
Hill-Rom Holdings, Inc. | 151,600 | | 5,875 |
Masimo Corp. | 360,843 | | 10,887 |
Medical Action Industries, Inc. (a) | 58,405 | | 579 |
NxStage Medical, Inc. (a) | 241,876 | | 4,876 |
| | 34,485 |
Health Care Providers & Services - 3.7% |
Air Methods Corp. (a) | 153,822 | | 6,291 |
Alliance Healthcare Services, Inc. (a) | 1,283,435 | | 5,057 |
Centene Corp. (a) | 388,969 | | 8,682 |
Corvel Corp. (a) | 5,200 | | 233 |
Common Stocks - continued |
| Shares | | Value (000s) |
HEALTH CARE - continued |
Health Care Providers & Services - continued |
Hanger Orthopedic Group, Inc. (a) | 248,499 | | $ 4,652 |
HMS Holdings Corp. (a) | 168,314 | | 10,117 |
Humana, Inc. (a) | 150,700 | | 8,784 |
MWI Veterinary Supply, Inc. (a) | 151,000 | | 8,637 |
| | 52,453 |
Life Sciences Tools & Services - 1.2% |
eResearchTechnology, Inc. (a) | 1,004,068 | | 7,651 |
Illumina, Inc. (a) | 176,950 | | 9,610 |
| | 17,261 |
Pharmaceuticals - 1.4% |
Ardea Biosciences, Inc. (a) | 187,205 | | 3,991 |
Cardiome Pharma Corp. (a) | 315,757 | | 1,607 |
Par Pharmaceutical Companies, Inc. (a) | 68,278 | | 2,220 |
Perrigo Co. | 53,218 | | 3,506 |
Piramal Healthcare Ltd. | 70,636 | | 761 |
Questcor Pharmaceuticals, Inc. (a) | 574,319 | | 7,047 |
| | 19,132 |
TOTAL HEALTH CARE | | 171,276 |
INDUSTRIALS - 13.8% |
Aerospace & Defense - 1.1% |
Teledyne Technologies, Inc. (a) | 177,700 | | 7,387 |
Triumph Group, Inc. | 92,820 | | 7,759 |
| | 15,146 |
Air Freight & Logistics - 0.6% |
UTI Worldwide, Inc. | 471,600 | | 9,064 |
Building Products - 1.9% |
A.O. Smith Corp. | 186,326 | | 10,440 |
AAON, Inc. (d) | 294,200 | | 7,223 |
Armstrong World Industries, Inc. (a) | 229,058 | | 9,563 |
| | 27,226 |
Commercial Services & Supplies - 1.2% |
Sykes Enterprises, Inc. (a) | 309,406 | | 5,139 |
United Stationers, Inc. (a) | 203,642 | | 11,445 |
| | 16,584 |
Construction & Engineering - 1.4% |
Chicago Bridge & Iron Co. NV unit (a) | 223,100 | | 5,624 |
Common Stocks - continued |
| Shares | | Value (000s) |
INDUSTRIALS - continued |
Construction & Engineering - continued |
Foster Wheeler AG (a) | 313,272 | | $ 7,337 |
Granite Construction, Inc. | 291,200 | | 7,041 |
| | 20,002 |
Electrical Equipment - 1.3% |
General Cable Corp. (a) | 340,315 | | 9,508 |
Regal-Beloit Corp. | 151,600 | | 8,749 |
| | 18,257 |
Industrial Conglomerates - 0.5% |
Carlisle Companies, Inc. | 202,000 | | 7,084 |
Machinery - 3.4% |
Accuride Corp. (a) | 3,840,500 | | 4,762 |
Actuant Corp. Class A | 418,921 | | 9,413 |
CLARCOR, Inc. | 244,214 | | 9,686 |
Gardner Denver, Inc. | 55,900 | | 3,232 |
John Bean Technologies Corp. | 445,800 | | 7,623 |
Manitowoc Co., Inc. | 613,700 | | 6,837 |
Wabtec Corp. | 132,329 | | 6,198 |
| | 47,751 |
Professional Services - 0.5% |
Advisory Board Co. (a) | 160,116 | | 7,495 |
Road & Rail - 0.5% |
Kansas City Southern (a) | 161,500 | | 7,077 |
Trading Companies & Distributors - 1.4% |
Interline Brands, Inc. (a) | 512,200 | | 10,290 |
WESCO International, Inc. (a) | 207,600 | | 8,889 |
| | 19,179 |
TOTAL INDUSTRIALS | | 194,865 |
INFORMATION TECHNOLOGY - 21.0% |
Communications Equipment - 3.6% |
Blue Coat Systems, Inc. (a) | 296,025 | | 7,984 |
DG FastChannel, Inc. (a) | 298,711 | | 7,035 |
DragonWave, Inc. (a)(d) | 647,000 | | 5,291 |
Emulex Corp. (a) | 968,500 | | 11,041 |
Ixia (a) | 615,692 | | 9,636 |
NETGEAR, Inc. (a) | 311,532 | | 9,598 |
| | 50,585 |
Common Stocks - continued |
| Shares | | Value (000s) |
INFORMATION TECHNOLOGY - continued |
Computers & Peripherals - 2.8% |
NCR Corp. (a) | 468,100 | | $ 6,422 |
Quantum Corp. (a) | 1,776,300 | | 6,004 |
SanDisk Corp. (a) | 168,502 | | 6,332 |
Super Micro Computer, Inc. (a) | 879,447 | | 9,779 |
Synaptics, Inc. (a)(d) | 394,480 | | 10,623 |
| | 39,160 |
Electronic Equipment & Components - 3.2% |
Anixter International, Inc. | 187,200 | | 10,051 |
Avnet, Inc. (a) | 384,730 | | 11,457 |
Electro Scientific Industries, Inc. (a) | 159,398 | | 1,852 |
Jabil Circuit, Inc. | 439,100 | | 6,736 |
Plexus Corp. (a) | 254,178 | | 7,714 |
Vishay Intertechnology, Inc. (a) | 623,863 | | 7,050 |
| | 44,860 |
Internet Software & Services - 3.6% |
Art Technology Group, Inc. (a) | 2,632,439 | | 11,030 |
Constant Contact, Inc. (a) | 192,728 | | 4,433 |
Rackspace Hosting, Inc. (a)(d) | 447,501 | | 11,170 |
Terremark Worldwide, Inc. (a)(d) | 1,249,556 | | 12,483 |
VeriSign, Inc. (a) | 324,591 | | 11,280 |
| | 50,396 |
IT Services - 1.7% |
Alliance Data Systems Corp. (a) | 174,600 | | 10,602 |
Sapient Corp. | 437,497 | | 5,757 |
Wright Express Corp. (a) | 224,599 | | 8,470 |
| | 24,829 |
Semiconductors & Semiconductor Equipment - 2.8% |
Amkor Technology, Inc. (a) | 586,759 | | 4,231 |
MEMC Electronic Materials, Inc. (a) | 436,482 | | 5,596 |
Micron Technology, Inc. (a) | 726,324 | | 6,007 |
Power Integrations, Inc. | 121,917 | | 4,165 |
Standard Microsystems Corp. (a) | 279,490 | | 6,747 |
TriQuint Semiconductor, Inc. (a) | 696,304 | | 7,172 |
Varian Semiconductor Equipment Associates, Inc. (a) | 187,600 | | 6,129 |
| | 40,047 |
Software - 3.3% |
Blackboard, Inc. (a)(d) | 202,540 | | 8,454 |
JDA Software Group, Inc. (a) | 255,593 | | 6,467 |
Kenexa Corp. (a) | 277,035 | | 5,067 |
Common Stocks - continued |
| Shares | | Value (000s) |
INFORMATION TECHNOLOGY - continued |
Software - continued |
Mentor Graphics Corp. (a) | 675,302 | | $ 7,293 |
Nuance Communications, Inc. (a) | 610,100 | | 9,585 |
Parametric Technology Corp. (a) | 390,970 | | 8,394 |
Synchronoss Technologies, Inc. (a) | 38,300 | | 816 |
| | 46,076 |
TOTAL INFORMATION TECHNOLOGY | | 295,953 |
MATERIALS - 5.3% |
Chemicals - 2.4% |
Cabot Corp. | 302,700 | | 10,298 |
Rockwood Holdings, Inc. (a) | 365,700 | | 12,405 |
Solutia, Inc. (a) | 586,500 | | 10,622 |
| | 33,325 |
Construction Materials - 0.3% |
Texas Industries, Inc. (d) | 136,800 | | 4,674 |
Metals & Mining - 2.6% |
Carpenter Technology Corp. | 295,373 | | 10,533 |
Coeur d'Alene Mines Corp. (a) | 328,600 | | 6,772 |
Compass Minerals International, Inc. | 136,600 | | 10,774 |
HudBay Minerals, Inc. | 568,400 | | 8,973 |
| | 37,052 |
TOTAL MATERIALS | | 75,051 |
TELECOMMUNICATION SERVICES - 1.2% |
Diversified Telecommunication Services - 0.9% |
AboveNet, Inc. (a) | 65,207 | | 3,710 |
Cbeyond, Inc. (a) | 188,472 | | 2,554 |
Global Crossing Ltd. (a) | 217,701 | | 2,961 |
PAETEC Holding Corp. (a) | 655,679 | | 2,767 |
| | 11,992 |
Wireless Telecommunication Services - 0.3% |
Syniverse Holdings, Inc. (a) | 140,476 | | 4,283 |
TOTAL TELECOMMUNICATION SERVICES | | 16,275 |
UTILITIES - 3.2% |
Electric Utilities - 1.8% |
Cleco Corp. | 228,300 | | 7,139 |
Common Stocks - continued |
| Shares | | Value (000s) |
UTILITIES - continued |
Electric Utilities - continued |
Great Plains Energy, Inc. | 312,900 | | $ 5,954 |
Otter Tail Corp. | 99,372 | | 2,039 |
Portland General Electric Co. | 201,000 | | 4,201 |
Westar Energy, Inc. | 233,600 | | 5,910 |
| | 25,243 |
Gas Utilities - 1.0% |
Northwest Natural Gas Co. | 118,700 | | 5,851 |
Southwest Gas Corp. | 229,200 | | 7,967 |
| | 13,818 |
Multi-Utilities - 0.4% |
NorthWestern Energy Corp. | 220,200 | | 6,555 |
TOTAL UTILITIES | | 45,616 |
TOTAL COMMON STOCKS (Cost $1,201,387) | 1,395,899 |
U.S. Treasury Obligations - 0.3% |
| Principal Amount (000s) | | |
U.S. Treasury Bills, yield at date of purchase 0.12% to 0.15% 11/4/10 to 11/26/10 (e)
(Cost $3,980) | | $ 3,980 | | 3,980 |
Money Market Funds - 8.2% |
| Shares | | |
Fidelity Cash Central Fund, 0.23% (b) | 45,994,592 | | 45,995 |
Fidelity Securities Lending Cash Central Fund, 0.24% (b)(c) | 69,216,960 | | 69,217 |
TOTAL MONEY MARKET FUNDS (Cost $115,212) | 115,212 |
Cash Equivalents - 0.0% |
| Maturity Amount (000s) | | Value (000s) |
Investments in repurchase agreements in a joint trading account at 0.22%, dated 10/29/10 due 11/1/10 (Collateralized by U.S. Treasury Obligations) #
(Cost $38) | $ 38 | | $ 38 |
TOTAL INVESTMENT PORTFOLIO - 107.4% (Cost $1,320,617) | | 1,515,129 |
NET OTHER ASSETS (LIABILITIES) - (7.4)% | | (103,762) |
NET ASSETS - 100% | $ 1,411,367 |
Futures Contracts |
| Expiration Date | | Underlying Face Amount at Value (000s) | | Unrealized Appreciation/
(Depreciation) (000s) |
Purchased |
Equity Index Contracts |
17 NYFE Russell Mini Index Contracts | Dec. 2010 | | $ 1,194 | | $ (8) |
The face value of futures purchased as a percentage of net assets is 0.1% |
Legend |
(a) Non-income producing |
(b) Affiliated fund that is available only to investment companies and other accounts managed by Fidelity Investments. The rate quoted is the annualized seven-day yield of the fund at period end. A complete unaudited listing of the fund's holdings as of its most recent quarter end is available upon request. In addition, each Fidelity Central Fund's financial statements, which are not covered by the Fund's report of Independent Registered Public Accounting Firm, are available on the SEC's website or upon request. |
(c) Investment made with cash collateral received from securities on loan. |
(d) Security or a portion of the security is on loan at period end. |
(e) Security or a portion of the security was pledged to cover margin requirements for futures contracts. At the period end, the value of securities pledged amounted to $2,500,000. |
# Additional information on each counterparty to the repurchase agreement is as follows: |
Repurchase Agreement / Counterparty | Value
(Amounts in thousands) |
$38,000 due 11/01/10 at 0.22% |
BNP Paribas Securities Corp. | $ 6 |
Barclays Capital, Inc. | 9 |
Credit Agricole Securities (USA), Inc. | 2 |
Credit Suisse Securities (USA) LLC | 2 |
Deutsche Bank Securities, Inc. | 3 |
HSBC Securities (USA), Inc. | 3 |
J.P. Morgan Securities, Inc. | 8 |
Mizuho Securities USA, Inc. | 2 |
Societe Generale, New York Branch | 2 |
UBS Securities LLC | 1 |
Wells Fargo Securities LLC | 0 * |
| $ 38 |
* Amount represents less than $1,000 |
Affiliated Central Funds |
Information regarding fiscal year to date income earned by the Fund from investments in Fidelity Central Funds is as follows: |
Fund | Income earned
(Amounts in thousands) |
Fidelity Cash Central Fund | $ 40 |
Fidelity Securities Lending Cash Central Fund | 968 |
Total | $ 1,008 |
Other Affiliated Issuers |
An affiliated company is a company in which the Fund has ownership of at least 5% of the voting securities. Fiscal year to date transactions with companies which are or were affiliates are as follows: |
Affiliate
(Amounts in thousands) | Value, beginning of period | Purchases | Sales Proceeds | Dividend Income | Value,
end of period |
Carluccio's PLC | $ 5,605 | $ - | $ 4,845 | $ - | $ - |
Conceptus, Inc. | 28,241 | - | 28,343 | - | - |
Diedrich Coffee, Inc. | 7,253 | - | 10,075 | - | - |
Ruth's Hospitality Group, Inc. | 5,602 | - | 4,375 | - | - |
Zale Corp. | 7,613 | - | 4,489 | - | - |
Total | $ 54,314 | $ - | $ 52,127 | $ - | $ - |
Other Information |
The following is a summary of the inputs used, as of October 31, 2010, involving the Fund's assets and liabilities carried at fair value. The inputs or methodology used for valuing securities may not be an indication of the risk associated with investing in those securities. For more information on valuation inputs, and their aggregation into the levels used in the table below, please refer to the Security Valuation section in the accompanying Notes to Financial Statements. |
Valuation Inputs at Reporting Date: |
Description
(Amounts in thousands) | Total | Level 1 | Level 2 | Level 3 |
Investments in Securities: | | | | |
Equities: | | | | |
Consumer Discretionary | $ 200,434 | $ 200,434 | $ - | $ - |
Consumer Staples | 44,882 | 44,882 | - | - |
Energy | 71,252 | 71,252 | - | - |
Financials | 280,295 | 280,295 | - | - |
Health Care | 171,276 | 171,276 | - | - |
Industrials | 194,865 | 194,865 | - | - |
Information Technology | 295,953 | 295,953 | - | - |
Materials | 75,051 | 75,051 | - | - |
Telecommunication Services | 16,275 | 16,275 | - | - |
Utilities | 45,616 | 45,616 | - | - |
U.S. Government and Government Agency Obligations | 3,980 | - | 3,980 | - |
Money Market Funds | 115,212 | 115,212 | - | - |
Cash Equivalents | 38 | - | 38 | - |
Total Investments in Securities: | $ 1,515,129 | $ 1,511,111 | $ 4,018 | $ - |
Derivative Instruments: | | | | |
Liabilities | | | | |
Futures Contracts | $ (8) | $ (8) | $ - | $ - |
Value of Derivative Instruments |
The following table is a summary of the Fund's value of derivative instruments by risk exposure as of October 31, 2010. For additional information on derivative instruments, please refer to the Derivative Instruments section in the accompanying Notes to Financial Statements. |
Risk Exposure /
Derivative Type | Value
(Amounts in thousands) |
| Asset | Liability |
Equity Risk | | |
Futures Contracts (a) | $ - | $ (8) |
Total Value of Derivatives | $ - | $ (8) |
(a) Reflects cumulative appreciation/(depreciation) on futures contracts as disclosed on the Schedule of Investments. Only the period end variation margin is separately disclosed on the Statement of Assets and Liabilities. |
Income Tax Information |
At October 31, 2010, the Fund had a capital loss carryforward of approximately $519,765,000 of which $190,671,000 and $329,094,000 will expire on October 31, 2016 and 2017, respectively. Capital loss carryforwards are only available to offset future capital gains of the Fund to the extent provided by regulations and may be limited. |
See accompanying notes which are an integral part of the financial statements.
Annual Report
Statement of Assets and Liabilities
Amounts in thousands (except per-share amounts) | October 31, 2010 |
| | |
Assets | | |
Investment in securities, at value (including securities loaned of $67,090 and repurchase agreements of $38) - See accompanying schedule: Unaffiliated issuers (cost $1,205,405) | $ 1,399,917 | |
Fidelity Central Funds (cost $115,212) | 115,212 | |
Total Investments (cost $1,320,617) | | $ 1,515,129 |
Receivable for investments sold | | 16,422 |
Receivable for fund shares sold | | 1,608 |
Dividends receivable | | 641 |
Distributions receivable from Fidelity Central Funds | | 85 |
Receivable for daily variation on futures contracts | | 186 |
Other receivables | | 293 |
Total assets | | 1,534,364 |
| | |
Liabilities | | |
Payable to custodian bank | $ 2,664 | |
Payable for investments purchased | 17,105 | |
Payable for fund shares redeemed | 33,118 | |
Accrued management fee | 464 | |
Distribution and service plan fees payable | 2 | |
Other affiliated payables | 358 | |
Other payables and accrued expenses | 69 | |
Collateral on securities loaned, at value | 69,217 | |
Total liabilities | | 122,997 |
| | |
Net Assets | | $ 1,411,367 |
Net Assets consist of: | | |
Paid in capital | | $ 1,735,139 |
Undistributed net investment income | | 2,128 |
Accumulated undistributed net realized gain (loss) on investments and foreign currency transactions | | (520,405) |
Net unrealized appreciation (depreciation) on investments and assets and liabilities in foreign currencies | | 194,505 |
Net Assets | | $ 1,411,367 |
See accompanying notes which are an integral part of the financial statements.
Annual Report
Statement of Assets and Liabilities - continued
Amounts in thousands (except per-share amounts) | October 31, 2010 |
| | |
Calculation of Maximum Offering Price
Class A:
Net Asset Value and redemption price per share
($3,333.26 ÷ 205.718 shares) | | $ 16.20 |
| | |
Maximum offering price per share (100/94.25 of $16.20) | | $ 17.19 |
Class T:
Net Asset Value and redemption price per share
($723.22 ÷ 45.018 shares) | | $ 16.07 |
| | |
Maximum offering price per share (100/96.50 of $16.07) | | $ 16.65 |
Class B:
Net Asset Value and offering price per share
($220.18 ÷ 13.878 shares)A | | $ 15.87 |
| | |
Class C:
Net Asset Value and offering price per share
($820.35 ÷ 51.847 shares)A | | $ 15.82 |
| | |
Stock Selector Small Cap:
Net Asset Value, offering price and redemption price per share ($1,405,590.11 ÷ 85,986.331 shares) | | $ 16.35 |
| | |
Institutional Class:
Net Asset Value, offering price and redemption price per share ($680.18 ÷ 41.509 shares) | | $ 16.39 |
A Redemption price per share is equal to net asset value less any applicable contingent deferred sales charge.
See accompanying notes which are an integral part of the financial statements.
Annual Report
Financial Statements - continued
Statement of Operations
Amounts in thousands | Year ended October 31, 2010 |
| | |
Investment Income | | |
Dividends | | $ 11,311 |
Special dividends | | 1,410 |
Interest | | 26 |
Income from Fidelity Central Funds (including $968 from security lending) | | 1,008 |
Total income | | 13,755 |
| | |
Expenses | | |
Management fee
Basic fee | $ 9,025 | |
Performance adjustment | (3,256) | |
Transfer agent fees | 4,158 | |
Distribution and service plan fees | 20 | |
Accounting and security lending fees | 495 | |
Custodian fees and expenses | 142 | |
Independent trustees' compensation | 9 | |
Registration fees | 95 | |
Audit | 56 | |
Legal | 14 | |
Interest | 1 | |
Miscellaneous | 21 | |
Total expenses before reductions | 10,780 | |
Expense reductions | (154) | 10,626 |
Net investment income (loss) | | 3,129 |
Realized and Unrealized Gain (Loss) Net realized gain (loss) on: | | |
Investment securities: | | |
Unaffiliated issuers | 276,007 | |
Other affiliated issuers | 1,647 | |
Foreign currency transactions | (62) | |
Futures contracts | 2,661 | |
Capital gain distributions from Fidelity Central Funds | 3 | |
Total net realized gain (loss) | | 280,256 |
Change in net unrealized appreciation (depreciation) on: Investment securities | 94,903 | |
Assets and liabilities in foreign currencies | (13) | |
Futures contracts | (8) | |
Total change in net unrealized appreciation (depreciation) | | 94,882 |
Net gain (loss) | | 375,138 |
Net increase (decrease) in net assets resulting from operations | | $ 378,267 |
See accompanying notes which are an integral part of the financial statements.
Annual Report
Statement of Changes in Net Assets
Amounts in thousands | Year ended October 31,
2010 | Year ended October 31,
2009 |
Increase (Decrease) in Net Assets | | |
Operations | | |
Net investment income (loss) | $ 3,129 | $ 2,776 |
Net realized gain (loss) | 280,256 | (315,874) |
Change in net unrealized appreciation (depreciation) | 94,882 | 465,364 |
Net increase (decrease) in net assets resulting
from operations | 378,267 | 152,266 |
Distributions to shareholders from net investment income | (976) | (2,638) |
Share transactions - net increase (decrease) | (349,513) | (62,137) |
Redemption fees | 175 | 136 |
Total increase (decrease) in net assets | 27,953 | 87,627 |
| | |
Net Assets | | |
Beginning of period | 1,383,414 | 1,295,787 |
End of period (including undistributed net investment income of $2,128 and accumulated net investment loss of $0, respectively) | $ 1,411,367 | $ 1,383,414 |
See accompanying notes which are an integral part of the financial statements.
Annual Report
Financial Highlights - Class A
Years ended October 31, | 2010 | 2009 | 2008 | 2007 I |
Selected Per-Share Data | | | | |
Net asset value, beginning of period | $ 12.53 | $ 11.24 | $ 24.79 | $ 23.20 |
Income from Investment Operations | | | | |
Net investment income (loss) E | (.01)L | - K | (.04) | (.07) H |
Net realized and unrealized gain (loss) | 3.68 | 1.31 | (10.77) | 1.66 |
Total from investment operations | 3.67 | 1.31 | (10.81) | 1.59 |
Distributions from net investment income | - K | (.02) | - | - |
Distributions from net realized gain | - | - | (2.74) | - |
Total distributions | - K | (.02) | (2.74) | - |
Redemption fees added to paid in capital E, K | - | - | - | - |
Net asset value, end of period | $ 16.20 | $ 12.53 | $ 11.24 | $ 24.79 |
Total Return B, C, D | 29.32% | 11.69% | (48.52)% | 6.85% |
Ratios to Average Net Assets F, J | | | | |
Expenses before reductions | 1.00% | 1.03% | 1.24% | 1.27% A |
Expenses net of fee waivers, if any | 1.00% | 1.03% | 1.24% | 1.27% A |
Expenses net of all reductions | .99% | 1.01% | 1.23% | 1.26% A |
Net investment income (loss) | (.07)%L | (.03)% | (.24)% | (.57)% A, H |
Supplemental Data | | | | |
Net assets, end of period (in millions) | $ 3 | $ 3 | $ 2 | $ 1 |
Portfolio turnover rate G | 138% | 135% | 101% | 84% |
A Annualized
B Total returns for periods of less than one year are not annualized.
C Total returns would have been lower had certain expenses not been reduced during the periods shown.
D Total returns do not include the effect of the sales charges.
E Calculated based on average shares outstanding during the period.
F Fees and expenses of the underlying Fidelity Central Funds are not included in the Fund's expense ratio. The Fund indirectly bears its proportionate share of the expenses of any underlying Fidelity Central Funds.
G Amount does not include the portfolio activity of any underlying Fidelity Central Funds.
H Investment income per share reflects a special dividend which amounted to $.01 per share. Excluding the special dividend, the ratio of net investment income (loss) to average net assets would have been (.66)%.
I For the period May 2, 2007 (commencement of sale of shares) to October 31, 2007.
J Expense ratios reflect operating expenses of the class. Expenses before reductions do not reflect amounts reimbursed by the investment adviser or reductions from brokerage service arrangements or reductions from other expense offset arrangements and do not represent the amount paid by the class during periods when reimbursements or reductions occur. Expense ratios before reductions for start-up periods may not be representative of longer-term operating periods. Expenses net of fee waivers reflect expenses after reimbursement by the investment adviser but prior to reductions from brokerage service arrangements or other expense offset arrangements. Expenses net of all reductions represent the net expenses paid by the class.
K Amount represents less than $.01 per share.
L Investment income per share reflects a special dividend which amounted to $.01 per share. Excluding the special dividend, the ratio of net investment income (loss) to average net assets would have been (.16)%.
See accompanying notes which are an integral part of the financial statements.
Annual Report
Financial Highlights - Class T
Years ended October 31, | 2010 | 2009 | 2008 | 2007 I |
Selected Per-Share Data | | | | |
Net asset value, beginning of period | $ 12.45 | $ 11.19 | $ 24.74 | $ 23.20 |
Income from Investment Operations | | | | |
Net investment income (loss) E | (.05)L | (.03) | (.08) | (.10) H |
Net realized and unrealized gain (loss) | 3.67 | 1.30 | (10.76) | 1.64 |
Total from investment operations | 3.62 | 1.27 | (10.84) | 1.54 |
Distributions from net investment income | - | (.01) | - | - |
Distributions from net realized gain | - | - | (2.71) | - |
Total distributions | - | (.01) | (2.71) | - |
Redemption fees added to paid in capital E, K | - | - | - | - |
Net asset value, end of period | $ 16.07 | $ 12.45 | $ 11.19 | $ 24.74 |
Total Return B, C, D | 29.08% | 11.42% | (48.70)% | 6.64% |
Ratios to Average Net Assets F, J | | | | |
Expenses before reductions | 1.27% | 1.30% | 1.50% | 1.53% A |
Expenses net of fee waivers, if any | 1.27% | 1.30% | 1.50% | 1.53% A |
Expenses net of all reductions | 1.26% | 1.29% | 1.49% | 1.52% A |
Net investment income (loss) | (.33)%L | (.31)% | (.50)% | (.83)% A, H |
Supplemental Data | | | | |
Net assets, end of period (000 omitted) | $ 723 | $ 550 | $ 409 | $ 420 |
Portfolio turnover rate G | 138% | 135% | 101% | 84% |
A Annualized
B Total returns for periods of less than one year are not annualized.
C Total returns would have been lower had certain expenses not been reduced during the periods shown.
D Total returns do not include the effect of the sales charges.
E Calculated based on average shares outstanding during the period.
F Fees and expenses of the underlying Fidelity Central Funds are not included in the Fund's expense ratio. The Fund indirectly bears its proportionate share of the expenses of any underlying Fidelity Central Funds.
G Amount does not include the portfolio activity of any underlying Fidelity Central Funds.
H Investment income per share reflects a special dividend which amounted to $.01 per share. Excluding the special dividend, the ratio of net investment income (loss) to average net assets would have been (.92)%.
I For the period May 2, 2007 (commencement of sale of shares) to October 31, 2007.
J Expense ratios reflect operating expenses of the class. Expenses before reductions do not reflect amounts reimbursed by the investment adviser or reductions from brokerage service arrangements or reductions from other expense offset arrangements and do not represent the amount paid by the class during periods when reimbursements or reductions occur. Expense ratios before reductions for start-up periods may not be representative of longer-term operating periods. Expenses net of fee waivers reflect expenses after reimbursement by the investment adviser but prior to reductions from brokerage service arrangements or other expense offset arrangements. Expenses net of all reductions represent the net expenses paid by the class.
K Amount represents less than $.01 per share.
L Investment income per share reflects a special dividend which amounted to $.01 per share. Excluding the special dividend, the ratio of net investment income (loss) to average net assets would have been (.43)%.
See accompanying notes which are an integral part of the financial statements.
Annual Report
Financial Highlights - Class B
Years ended October 31, | 2010 | 2009 | 2008 | 2007 I |
Selected Per-Share Data | | | | |
Net asset value, beginning of period | $ 12.36 | $ 11.15 | $ 24.69 | $ 23.20 |
Income from Investment Operations | | | | |
Net investment income (loss) E | (.12)L | (.08) | (.17) | (.15) H |
Net realized and unrealized gain (loss) | 3.63 | 1.30 | (10.73) | 1.64 |
Total from investment operations | 3.51 | 1.22 | (10.90) | 1.49 |
Distributions from net investment income | - | (.01) | - | - |
Distributions from net realized gain | - | - | (2.64) | - |
Total distributions | - | (.01) | (2.64) | - |
Redemption fees added to paid in capital E, K | - | - | - | - |
Net asset value, end of period | $ 15.87 | $ 12.36 | $ 11.15 | $ 24.69 |
Total Return B, C, D | 28.40% | 10.92% | (48.94)% | 6.42% |
Ratios to Average Net Assets F, J | | | | |
Expenses before reductions | 1.76% | 1.77% | 1.99% | 2.07% A |
Expenses net of fee waivers, if any | 1.76% | 1.77% | 1.99% | 2.05% A |
Expenses net of all reductions | 1.75% | 1.75% | 1.99% | 2.04% A |
Net investment income (loss) | (.82)%L | (.78)% | (1.00)% | (1.32)% A, H |
Supplemental Data | | | | |
Net assets, end of period (000 omitted) | $ 220 | $ 219 | $ 199 | $ 419 |
Portfolio turnover rate G | 138% | 135% | 101% | 84% |
A Annualized
B Total returns for periods of less than one year are not annualized.
C Total returns would have been lower had certain expenses not been reduced during the periods shown.
D Total returns do not include the effect of the contingent deferred sales charge.
E Calculated based on average shares outstanding during the period.
F Fees and expenses of the underlying Fidelity Central Funds are not included in the Fund's expense ratio. The Fund indirectly bears its proportionate share of the expenses of any underlying Fidelity Central Funds.
G Amount does not include the portfolio activity of any underlying Fidelity Central Funds.
H Investment income per share reflects a special dividend which amounted to $.01 per share. Excluding the special dividend, the ratio of net investment income (loss) to average net assets would have been (1.41)%.
I For the period May 2, 2007 (commencement of sale of shares) to October 31, 2007.
J Expense ratios reflect operating expenses of the class. Expenses before reductions do not reflect amounts reimbursed by the investment adviser or reductions from brokerage service arrangements or reductions from other expense offset arrangements and do not represent the amount paid by the class during periods when reimbursements or reductions occur. Expense ratios before reductions for start-up periods may not be representative of longer-term operating periods. Expenses net of fee waivers reflect expenses after reimbursement by the investment adviser but prior to reductions from brokerage service arrangements or other expense offset arrangements. Expenses net of all reductions represent the net expenses paid by the class.
K Amount represents less than $.01 per share.
L Investment income per share reflects a special dividend which amounted to $.01 per share. Excluding the special dividend, the ratio of net investment income (loss) to average net assets would have been (.92)%.
See accompanying notes which are an integral part of the financial statements.
Annual Report
Financial Highlights - Class C
Years ended October 31, | 2010 | 2009 | 2008 | 2007 I |
Selected Per-Share Data | | | | |
Net asset value, beginning of period | $ 12.33 | $ 11.12 | $ 24.71 | $ 23.20 |
Income from Investment Operations | | | | |
Net investment income (loss) E | (.12)L | (.09) | (.17) | (.15) H |
Net realized and unrealized gain (loss) | 3.61 | 1.31 | (10.72) | 1.66 |
Total from investment operations | 3.49 | 1.22 | (10.89) | 1.51 |
Distributions from net investment income | - | (.01) | - | - |
Distributions from net realized gain | - | - | (2.70) | - |
Total distributions | - | (.01) | (2.70) | - |
Redemption fees added to paid in capital E, K | - | - | - | - |
Net asset value, end of period | $ 15.82 | $ 12.33 | $ 11.12 | $ 24.71 |
Total Return B, C, D | 28.30% | 10.96% | (48.95)% | 6.51% |
Ratios to Average Net Assets F, J | | | | |
Expenses before reductions | 1.75% | 1.76% | 2.00% | 1.98% A |
Expenses net of fee waivers, if any | 1.75% | 1.76% | 2.00% | 1.98% A |
Expenses net of all reductions | 1.74% | 1.75% | 1.99% | 1.97% A |
Net investment income (loss) | (.81)%L | (.77)% | (1.01)% | (1.27)% A, H |
Supplemental Data | | | | |
Net assets, end of period (000 omitted) | $ 820 | $ 428 | $ 183 | $ 294 |
Portfolio turnover rate G | 138% | 135% | 101% | 84% |
A Annualized
B Total returns for periods of less than one year are not annualized.
C Total returns would have been lower had certain expenses not been reduced during the periods shown.
D Total returns do not include the effect of the contingent deferred sales charge.
E Calculated based on average shares outstanding during the period.
F Fees and expenses of the underlying Fidelity Central Funds are not included in the Fund's expense ratio. The Fund indirectly bears its proportionate share of the expenses of any underlying Fidelity Central Funds.
G Amount does not include the portfolio activity of any underlying Fidelity Central Funds.
H Investment income per share reflects a special dividend which amounted to $.01 per share. Excluding the special dividend, the ratio of net investment income (loss) to average net assets would have been (1.36)%.
I For the period May 2, 2007 (commencement of sale of shares) to October 31, 2007.
J Expense ratios reflect operating expenses of the class. Expenses before reductions do not reflect amounts reimbursed by the investment adviser or reductions from brokerage service arrangements or reductions from other expense offset arrangements and do not represent the amount paid by the class during periods when reimbursements or reductions occur. Expense ratios before reductions for start-up periods may not be representative of longer-term operating periods. Expenses net of fee waivers reflect expenses after reimbursement by the investment adviser but prior to reductions from brokerage service arrangements or other expense offset arrangements. Expenses net of all reductions represent the net expenses paid by the class.
K Amount represents less than $.01 per share.
L Investment income per share reflects a special dividend which amounted to $.01 per share. Excluding the special dividend, the ratio of net investment income (loss) to average net assets would have been (.91)%.
See accompanying notes which are an integral part of the financial statements.
Annual Report
Financial Highlights - Stock Selector Small Cap
Years ended October 31, | 2010 | 2009 | 2008 | 2007 | 2006 |
Selected Per-Share Data | | | | | |
Net asset value, beginning of period | $ 12.61 | $ 11.28 | $ 24.81 | $ 22.23 | $ 20.82 |
Income from Investment Operations | | | | | |
Net investment income (loss) B | .03I | .02 | .01 | (.04) E | .07 F |
Net realized and unrealized gain (loss) | 3.72 | 1.33 | (10.82) | 5.01 | 2.75 |
Total from investment operations | 3.75 | 1.35 | (10.81) | 4.97 | 2.82 |
Distributions from net investment income | (.01) | (.02) | - | (.05) | (.07) |
Distributions from net realized gain | - | - | (2.72) | (2.34) | (1.34) |
Total distributions | (.01) | (.02) | (2.72) | (2.39) | (1.41) |
Redemption fees added to paid in capital B, H | - | - | - | - | - |
Net asset value, end of period | $ 16.35 | $ 12.61 | $ 11.28 | $ 24.81 | $ 22.23 |
Total Return A | 29.75% | 12.05% | (48.42)% | 24.42% | 14.08% |
Ratios to Average Net Assets C, G | | | | | |
Expenses before reductions | .73% | .77% | .95% | 1.01% | .86% |
Expenses net of fee waivers, if any | .73% | .77% | .95% | 1.00% | .86% |
Expenses net of all reductions | .72% | .75% | .94% | .99% | .81% |
Net investment income (loss) | .21%I | .22% | .05% | (.20)% E | .32% F |
Supplemental Data | | | | | |
Net assets, end of period (in millions) | $ 1,406 | $ 1,379 | $ 1,292 | $ 2,602 | $ 2,623 |
Portfolio turnover rate D | 138% | 135% | 101% | 84% | 126% |
A Total returns would have been lower had certain expenses not been reduced during the periods shown.
B Calculated based on average shares outstanding during the period.
C Fees and expenses of the underlying Fidelity Central Funds are not included in the Fund's expense ratio. The Fund indirectly bears its proportionate share of the expenses of any underlying Fidelity Central Funds.
D Amount does not include the portfolio activity of any underlying Fidelity Central Funds.
E Investment income per share reflects a special dividend which amounted to $.02 per share. Excluding the special dividend, the ratio of net investment income (loss) to average net assets would have been (.29)%.
F Investment income per share reflects a special dividend which amounted to $.02 per share. Excluding the special dividend, the ratio of net investment income (loss) to average net assets would have been (.22%).
G Expense ratios reflect operating expenses of the class. Expenses before reductions do not reflect amounts reimbursed by the investment adviser or reductions from brokerage service arrangements or reductions from other expense offset arrangements and do not represent the amount paid by the class during periods when reimbursements or reductions occur. Expenses net of fee waivers reflect expenses after reimbursement by the investment adviser but prior to reductions from brokerage service arrangements or other expense offset arrangements. Expenses net of all reductions represent the net expenses paid by the class.
H Amount represents less than $.01 per share.
I Investment income per share reflects a special dividend which amounted to $.01 per share. Excluding the special dividend, the ratio of net investment income (loss) to average net assets would have been .12%.
See accompanying notes which are an integral part of the financial statements.
Annual Report
Financial Highlights - Institutional Class
Years ended October 31, | 2010 | 2009 | 2008 | 2007 H |
Selected Per-Share Data | | | | |
Net asset value, beginning of period | $ 12.63 | $ 11.29 | $ 24.82 | $ 23.20 |
Income from Investment Operations | | | | |
Net investment income (loss) D | .05 K | .04 | .02 | (.03) G |
Net realized and unrealized gain (loss) | 3.72 | 1.32 | (10.82) | 1.65 |
Total from investment operations | 3.77 | 1.36 | (10.80) | 1.62 |
Distributions from net investment income | (.01) | (.02) | - | - |
Distributions from net realized gain | - | - | (2.73) | - |
Total distributions | (.01) | (.02) | (2.73) | - |
Redemption fees added to paid in capitalD, J | - | - | - | - |
Net asset value, end of period | $ 16.39 | $ 12.63 | $ 11.29 | $ 24.82 |
Total Return B, C | 29.89% | 12.14% | (48.36)% | 6.98% |
Ratios to Average Net Assets E, I | | | | |
Expenses before reductions | .63% | .63% | .84% | .94% A |
Expenses net of fee waivers, if any | .63% | .63% | .84% | .94% A |
Expenses net of all reductions | .62% | .62% | .84% | .93% A |
Net investment income (loss) | .31%K | .36% | .15% | (.24)% A, G |
Supplemental Data | | | | |
Net assets, end of period (000 omitted) | $ 680 | $ 413 | $ 376 | $ 162 |
Portfolio turnover rate F | 138% | 135% | 101% | 84% |
A Annualized
B Total returns for periods of less than one year are not annualized.
C Total returns would have been lower had certain expenses not been reduced during the periods shown.
D Calculated based on average shares outstanding during the period.
E Fees and expenses of the underlying Fidelity Central Funds are not included in the Fund's expense ratio. The Fund indirectly bears its proportionate share of the expenses of any underlying Fidelity Central Funds.
F Amount does not include the portfolio activity of any underlying Fidelity Central Funds.
G Investment income per share reflects a special dividend which amounted to $.01 per share. Excluding the special dividend, the ratio of net investment income (loss) to average net assets would have been (.33)%.
H For the period May 2, 2007 (commencement of sale of shares) to October 31, 2007.
I Expense ratios reflect operating expenses of the class. Expenses before reductions do not reflect amounts reimbursed by the investment adviser or reductions from brokerage service arrangements or reductions from other expense offset arrangements and do not represent the amount paid by the class during periods when reimbursements or reductions occur. Expense ratios before reductions for start-up periods may not be representative of longer-term operating periods. Expenses net of fee waivers reflect expenses after reimbursement by the investment adviser but prior to reductions from brokerage service arrangements or other expense offset arrangements. Expenses net of all reductions represent the net expenses paid by the class.
J Amount represents less than $.01 per share.
K Investment income per share reflects a special dividend which amounted to $.01 per share. Excluding the special dividend, the ratio of net investment income (loss) to average net assets would have been .21%.
See accompanying notes which are an integral part of the financial statements.
Annual Report
Notes to Financial Statements
For the period ended October 31, 2010
1. Organization.
Fidelity Stock Selector Small Cap Fund (the Fund) (formerly Fidelity Small Cap Independence Fund) is a fund of Fidelity Capital Trust (the Trust) and is authorized to issue an unlimited number of shares. The Trust is registered under the Investment Company Act of 1940, as amended (the 1940 Act), as an open-end management investment company organized as a Massachusetts business trust. The Fund offers Class A, Class T, Class C, Stock Selector Small Cap and Institutional Class shares, each of which has equal rights as to assets and voting privileges. Effective after the close of business on September 1, 2010, Class B shares were closed to new accounts and additional purchases by existing shareholders. Each class has exclusive voting rights with respect to matters that affect that class. In order to disclose class level financial information dollar amounts presented in the notes are unrounded. Class B shares will automatically convert to Class A shares after a holding period of seven years from the initial date of purchase. Investment income, realized and unrealized capital gains and losses, the common expenses of the Fund, and certain fund-level expense reductions, if any, are allocated on a pro-rata basis to each class based on the relative net assets of each class to the total net assets of the Fund. Each class differs with respect to transfer agent and distribution and service plan fees incurred. Certain expense reductions also differ by class.
2. Investments in Fidelity Central Funds.
The Fund may invest in Fidelity Central Funds, which are open-end investment companies available only to other investment companies and accounts managed by Fidelity Management & Research Company (FMR) and its affiliates. The Fund's Schedule of Investments lists each of the Fidelity Central Funds held as of period end, if any, as an investment of the Fund, but does not include the underlying holdings of each Fidelity Central Fund. As an Investing Fund, the Fund indirectly bears its proportionate share of the expenses of the underlying Fidelity Central Funds.
The Money Market Central Funds seek preservation of capital and current income and are managed by Fidelity Investments Money Management, Inc. (FIMM), an affiliate of FMR.
A complete unaudited list of holdings for each Fidelity Central Fund is available upon request or at the Securities and Exchange Commission (the SEC) web site at www.sec.gov. In addition, the financial statements of the Fidelity Central Funds, which are not covered by the Fund's Report of Independent Registered Public Accounting Firm, are available on the SEC web site or upon request.
Annual Report
Notes to Financial Statements - continued
3. Significant Accounting Policies.
The financial statements have been prepared in conformity with accounting principles generally accepted in the United States of America (GAAP), which require management to make certain estimates and assumptions at the date of the financial statements. Actual results could differ from those estimates. The following summarizes the significant accounting policies of the Fund:
Security Valuation. Investments are valued as of 4:00 p.m. Eastern time on the last calendar day of the period. The Fund uses independent pricing services approved by the Board of Trustees to value its investments. When current market prices or quotations are not readily available or reliable, valuations may be determined in good faith in accordance with procedures adopted by the Board of Trustees. Factors used in determining value may include market or security specific events. The frequency with which these procedures are used cannot be predicted and they may be utilized to a significant extent. The value used for net asset value (NAV) calculation under these procedures may differ from published prices for the same securities.
The Fund categorizes the inputs to valuation techniques used to value its investments into a disclosure hierarchy consisting of three levels as shown below.
Level 1 - quoted prices in active markets for identical investments
Level 2 - other significant observable inputs (including quoted prices for similar investments, interest rates, prepayment speeds, etc.)
Level 3 - unobservable inputs (including the fund's own assumptions based on the best information available)
Changes in valuation techniques may result in transfers in or out of an assigned level within the disclosure hierarchy. The aggregate value of investments by input level, as of October 31, 2010, is included at the end of the Fund's Schedule of Investments. Valuation techniques used to value the Fund's investments by major category are as follows.
Equity securities, including restricted securities, for which market quotations are readily available, are valued at the last reported sale price or official closing price as reported by an independent pricing service on the primary market or exchange on which they are traded and are categorized as Level 1 in the hierarchy. In the event there were no sales during the day or closing prices are not available, securities are valued at the last quoted bid price or may be valued using the last available price and are generally categorized as Level 2 in the hierarchy. For foreign equity securities, when significant market or security specific events arise, comparisons to the valuation of American Depositary Receipts (ADRs), futures contracts, Exchange-traded funds (ETFs) and certain indexes as well as
Annual Report
3. Significant Accounting Policies - continued
Security Valuation - continued
quoted prices for similar securities are used and are categorized as Level 2 in the hierarchy in these circumstances. Utilizing these techniques may result in transfers between Level 1 and Level 2. For restricted equity securities and private placements where observable inputs are limited, assumptions about market activity and risk are used and are categorized as Level 3 in the hierarchy.
Futures contracts are valued at the settlement price established each day by the board of trade or exchange on which they are traded and are categorized as Level 1 in the hierarchy. Investments in open-end mutual funds, including the Fidelity Central Funds, are valued at their closing net asset value each business day and are categorized as Level 1 in the hierarchy. Short-term securities with remaining maturities of sixty days or less for which quotations are not readily available are valued at amortized cost, which approximates fair value and are categorized as Level 2 in the hierarchy.
Foreign Currency. The Fund uses foreign currency contracts to facilitate transactions in foreign-denominated securities. Gains and losses from these transactions may arise from changes in the value of the foreign currency or if the counterparties do not perform under the contracts' terms.
Foreign-denominated assets, including investment securities, and liabilities are translated into U.S. dollars at the exchange rate at period end. Purchases and sales of investment securities, income and dividends received and expenses denominated in foreign currencies are translated into U.S. dollars at the exchange rate in effect on the transaction date.
The effects of exchange rate fluctuations on investments are included with the net realized and unrealized gain (loss) on investment securities. Other foreign currency transactions resulting in realized and unrealized gain (loss) are disclosed separately.
Investment Transactions and Income. For financial reporting purposes, the Fund's investment holdings and NAV include trades executed through the end of the last business day of the period. The NAV per share for processing shareholder transactions is calculated as of the close of business of the New York Stock Exchange (NYSE), normally 4:00 p.m. Eastern time and includes trades executed through the end of the prior business day. Gains and losses on securities sold are determined on the basis of identified cost and may include proceeds received from litigation. Dividend income is recorded on the ex-dividend date, except for certain dividends from foreign securities where the ex-dividend date may have passed, which are recorded as soon as the Fund is informed of the ex-dividend date. Non-cash dividends included in dividend income, if any, are recorded at the fair market value of the securities received. Distributions received on
Annual Report
Notes to Financial Statements - continued
3. Significant Accounting Policies - continued
Investment Transactions and Income - continued
securities that represent a return of capital or capital gain are recorded as a reduction of cost of investments and/or as a realized gain. The Fund estimates the components of distributions received that may be considered return of capital distributions or capital gain distributions. Large, non-recurring dividends recognized by the Fund are presented separately on the Statement of Operations as "Special Dividends" and the impact of these dividends is presented in the Financial Highlights. Interest income and distributions from the Fidelity Central Funds are accrued as earned. Interest income includes coupon interest and amortization of premium and accretion of discount on debt securities. Investment income is recorded net of foreign taxes withheld where recovery of such taxes is uncertain.
Expenses. Most expenses of the Trust can be directly attributed to a fund. Expenses which cannot be directly attributed are apportioned amongst each fund in the Trust. Expense estimates are accrued in the period to which they relate and adjustments are made when actual amounts are known.
Income Tax Information and Distributions to Shareholders. Each year the Fund intends to qualify as a regulated investment company, including distributing substantially all of its taxable income and realized gains under Subchapter M of the Internal Revenue Code and filing its U.S. federal tax return. As a result, no provision for income taxes is required. As of October 31, 2010, the Fund did not have any unrecognized tax benefits in the accompanying financial statements. A fund's federal tax return is subject to examination by the Internal Revenue Service (IRS) for a period of three years. Foreign taxes are provided for based on the Fund's understanding of the tax rules and rates that exist in the foreign markets in which it invests.
Distributions are declared and recorded on the ex-dividend date. Income dividends and capital gain distributions are declared separately for each class. Income and capital gain distributions are determined in accordance with income tax regulations, which may differ from GAAP.
Capital accounts within the financial statements are adjusted for permanent book-tax differences. These adjustments have no impact on net assets or the results of operations. Temporary book-tax differences will reverse in a subsequent period.
Book-tax differences are primarily due to the short-term gain distributions from the Fidelity Central Funds, futures transactions, foreign currency transactions, passive foreign investment companies (PFIC), market discount, partnerships, capital loss carryforwards and losses deferred due to wash sales.
Annual Report
3. Significant Accounting Policies - continued
Income Tax Information and Distributions to Shareholders - continued
The federal tax cost of investment securities and unrealized appreciation (depreciation) as of period end were as follows:
Gross unrealized appreciation | $ 241,615,641 |
Gross unrealized depreciation | (47,750,582) |
Net unrealized appreciation (depreciation) | $ 193,865,059 |
| |
Tax Cost | $ 1,321,264,245 |
The tax-based components of distributable earnings as of period end were as follows:
Undistributed ordinary income | $ 2,128,561 |
Capital loss carryforward | $ (519,765,399) |
Net unrealized appreciation (depreciation) | $ 193,866,512 |
The tax character of distributions paid was as follows:
| October 31, 2010 | October 31, 2009 |
Ordinary Income | $ 975,942 | $ 2,638,469 |
Short-Term Trading (Redemption) Fees. Shares held by investors in the Fund less than 90 days are subject to a redemption fee equal to 1.50% of the net asset value of shares redeemed. All redemption fees, which reduce the proceeds of the shareholder redemption, are retained by the Fund and accounted for as an addition to paid in capital.
4. Operating Policies.
Repurchase Agreements. FMR has received an Exemptive Order from the SEC which permits the Fund and other affiliated entities of FMR to transfer uninvested cash balances into joint trading accounts which are then invested in repurchase agreements. The Fund may also invest directly with institutions in repurchase agreements. Repurchase agreements are collateralized by government or non-government securities. Upon settlement date, collateral is held in segregated accounts with custodian banks and may be obtained in the event of a default of the counterparty. The Fund monitors, on a daily basis, the value of the collateral to ensure it is at least equal to the principal amount of the repurchase agreement (including accrued interest). In the event of a default by the counterparty, realization of the collateral proceeds could be delayed, during which time the value of the collateral may decline.
Annual Report
Notes to Financial Statements - continued
5. Derivative Instruments.
Risk Exposures and the Use of Derivative Instruments. The Fund uses derivative instruments (derivatives), including futures contracts in order to meet its investment objectives. The strategy is to use derivatives to increase returns and to manage exposure to certain risks as defined below. The success of any strategy involving derivatives depends on analysis of numerous economic factors, and if the strategies for investment do not work as intended, the Fund may not achieve its objectives.
The Fund's use of derivatives may increase or decrease its exposure to the following risk:
Equity Risk | Equity risk relates to the fluctuations in the value of financial instruments as a result of changes in market prices (other than those arising from interest rate risk or foreign exchange risk), whether caused by factors specific to an individual investment, its issuer, or all factors affecting all instruments traded in a market or market segment. |
The Fund is also exposed to additional risks from investing in derivatives, such as liquidity risk and counterparty credit risk. Liquidity risk is the risk that the Fund will be unable to sell the derivative in the open market in a timely manner. Counterparty credit risk is the risk that the counterparty will not be able to fulfill its obligation to the Fund. The Fund's maximum risk of loss from counterparty credit risk is generally the aggregate unrealized appreciation and unpaid counterparty fees in excess of any collateral pledged by the counterparty to the Fund. Counterparty risk related to exchange-traded futures contracts is minimal because of the protection provided by the exchange on which they trade. Risk of loss may exceed the amounts recognized in the Statement of Assets and Liabilities.
Futures Contracts. A futures contract is an agreement between two parties to buy or sell a specified underlying instrument for a fixed price at a specified future date. The Fund uses futures contracts to manage its exposure to the stock market.
Upon entering into a futures contract, a fund is required to deposit either cash or securities (initial margin) with a clearing broker in an amount equal to a certain percentage of the face value of the contract. Futures contracts are marked-to-market daily and subsequent payments (variation margin) are made or received by a fund depending on the daily fluctuations in the value of the futures contracts and are recorded as unrealized appreciation or (depreciation). Realized gain or (loss) is recorded upon the expiration or closing of a futures contract.
The underlying face amount at value of open futures contracts at period end is shown in the Schedule of Investments under the caption "Futures Contracts." This amount reflects each contract's exposure to the underlying instrument at period end and is representative of activity for the period. Securities deposited to meet initial margin requirements are identified in the Schedule of Investments. The receivable and/or payable for the variation margin are reflected in the Statement of Assets and Liabilities.
Annual Report
5. Derivative Instruments - continued
Futures Contracts - continued
Certain risks may arise upon entering into futures contracts, including the risk that an illiquid market may limit the ability to close out a futures contract prior to settlement date.
During the period the Fund recognized net realized gain (loss) of $2,661,216 and a change in net unrealized appreciation (depreciation) of ($7,562) related to its investment in futures contracts. These amounts are included in the Statement of Operations.
6. Purchases and Sales of Investments.
Purchases and sales of securities, other than short-term securities, aggregated $1,981,252,095 and $2,313,047,933, respectively.
7. Fees and Other Transactions with Affiliates.
Management Fee. FMR and its affiliates provide the Fund with investment management related services for which the Fund pays a monthly management fee. The management fee is the sum of an individual fund fee rate that is based on an annual rate of .35% of the Fund's average net assets and a group fee rate that averaged .26% during the period. The group fee rate is based upon the average net assets of all the mutual funds advised by FMR. The group fee rate decreases as assets under management increase and increases as assets under management decrease. In addition, the management fee is subject to a performance adjustment (up to a maximum of ± .20% of the Fund's average net assets over a 36 month performance period). The upward or downward adjustment to the management fee is based on the relative investment performance of Stock Selector Small Cap as compared to an appropriate benchmark index. For the period, the total annual management fee rate, including the performance adjustment, was .39% of the Fund's average net assets.
Distribution and Service Plan Fees. In accordance with Rule 12b-1 of the 1940 Act, the Fund has adopted separate Distribution and Service Plans for each class of shares. Certain classes pay Fidelity Distributors Corporation (FDC), an affiliate of FMR, separate Distribution and Service Fees, each of which is based on an annual percentage of each class' average net assets. In addition, FDC may pay financial intermediaries for selling shares of the Fund and providing shareholder support services. For the period, the Distribution and Service Fee rates, total fees and amounts retained by FDC were as follows:
Annual Report
Notes to Financial Statements - continued
7. Fees and Other Transactions with Affiliates - continued
Distribution and Service Plan Fees - continued
| Distribution
Fee | Service
Fee | Total Fees | Retained
by FDC |
Class A | -% | .25% | $ 7,815 | $ 13 |
Class T | .25% | .25% | 3,474 | 5 |
Class B | .75% | .25% | 2,267 | 1,701 |
Class C | .75% | .25% | 6,265 | 2,935 |
| | | $ 19,821 | $ 4,654 |
Sales Load. FDC receives a front-end sales charge of up to 5.75% for selling Class A shares, and 3.50% for selling Class T shares, some of which is paid to financial intermediaries for selling shares of the Fund. FDC receives the proceeds of contingent deferred sales charges levied on Class A, Class T, Class B, and Class C redemptions. These charges depend on the holding period. The deferred sales charges range from 5% to 1% for Class B, 1% for Class C, 1.00% for certain purchases of Class A shares (1.00% to .50% prior to July 12, 2010) and .25% for certain purchases of Class T shares.
For the period, sales charge amounts retained by FDC were as follows:
| Retained
by FDC |
Class A | $ 1,295 |
Class T | 527 |
Class B* | 297 |
Class C* | 66 |
| $ 2,185 |
* When Class B and Class C shares are initially sold, FDC pays commissions from its own resources to financial intermediaries through which the sales are made.
Transfer Agent Fees. Fidelity Investments Institutional Operations Company, Inc. (FIIOC), an affiliate of FMR, is the transfer, dividend disbursing and shareholder servicing agent for each class of the Fund. FIIOC receives account fees and asset-based fees that vary according to the account size and type of account of the shareholders of the respective classes of the Fund. FIIOC pays for typesetting, printing and mailing of shareholder reports, except proxy statements. For the period, transfer agent fees for each class were as follows:
Annual Report
7. Fees and Other Transactions with Affiliates - continued
Transfer Agent Fees - continued
| Amount | % of
Average
Net Assets |
Class A | $ 9,678 | .31 |
Class T | 2,278 | .33 |
Class B | 717 | .32 |
Class C | 1,955 | .31 |
Stock Selector Small Cap | 4,142,036 | .28 |
Institutional Class | 1,046 | .18 |
| $ 4,157,710 | |
Accounting and Security Lending Fees. Fidelity Service Company, Inc. (FSC), an affiliate of FMR, maintains the Fund's accounting records. The accounting fee is based on the level of average net assets for the month. Under a separate contract, FSC administers the security lending program. The security lending fee is based on the number and duration of lending transactions.
Brokerage Commissions. The Fund placed a portion of its portfolio transactions with brokerage firms which are affiliates of the investment adviser. The commissions paid to these affiliated firms were $46,467 for the period.
Interfund Lending Program. Pursuant to an Exemptive Order issued by the SEC, the Fund, along with other registered investment companies having management contracts with FMR, may participate in an interfund lending program. This program provides an alternative credit facility allowing the funds to borrow from, or lend money to, other participating affiliated funds. At period end, there were no interfund loans outstanding. The Fund's activity in this program during the period for which loans were outstanding was as follows:
Borrower or Lender | Average Daily Loan Balance | Weighted Average Interest Rate | Interest
Expense |
Borrower | $ 26,296,000 | .48% | $ 1,398 |
Annual Report
Notes to Financial Statements - continued
8. Committed Line of Credit.
The Fund participates with other funds managed by FMR or an affiliate in a $3.75 billion credit facility (the "line of credit") to be utilized for temporary or emergency purposes to fund shareholder redemptions or for other short-term liquidity purposes. The Fund has agreed to pay commitment fees on its pro-rata portion of the line of credit, which amounted to $5,862 and is reflected in Miscellaneous expenses on the Statement of Operations. During the period, there were no borrowings on this line of credit.
9. Security Lending.
The Fund lends portfolio securities through a lending agent from time to time in order to earn additional income. The lending agent may loan securities to certain qualified borrowers, including Fidelity Capital Markets (FCM), a broker-dealer affiliated with the Fund. On the settlement date of the loan, the Fund receives collateral (in the form of U.S. Treasury obligations, letters of credit and/or cash) against the loaned securities and maintains collateral in an amount not less than 100% of the market value of the loaned securities during the period of the loan. The market value of the loaned securities is determined at the close of business of the Fund and any additional required collateral is delivered to the Fund on the next business day. If the borrower defaults on its obligation to return the securities loaned because of insolvency or other reasons, a fund could experience delays and costs in recovering the securities loaned or in gaining access to the collateral. Any cash collateral received is invested in the Fidelity Securities Lending Cash Central Fund. The value of loaned securities and cash collateral at period end are disclosed on the Fund's Statement of Assets and Liabilities. Security lending income represents the income earned on investing cash collateral, less rebates paid to borrowers and lending agent fees associated with the loan, plus any premium payments received for lending certain types of securities. Security lending income is presented in the Statement of Operations as a component of income from Fidelity Central Funds. During the period, there were no securities loaned to FCM.
10. Expense Reductions.
Many of the brokers with whom FMR places trades on behalf of the Fund provided services to the Fund in addition to trade execution. These services included payments of certain expenses on behalf of the Fund totaling $154,161 for the period.
Annual Report
11. Distributions to Shareholders.
Distributions to shareholders of each class were as follows:
Years ended October 31, | 2010 | 2009 |
From net investment income | | |
Class A | $ 649 | $ 4,025 |
Class T | - | 517 |
Class B | - | 104 |
Class C | - | 117 |
Stock Selector Small Cap | 974,901 | 2,632,884 |
Institutional Class | 392 | 822 |
Total | $ 975,942 | $ 2,638,469 |
12. Share Transactions.
Transactions for each class of shares were as follows:
| Shares | Dollars |
Years ended October 31, | 2010 | 2009 | 2010 | 2009 |
Class A | | | | |
Shares sold | 60,233 | 71,378 | $ 878,328 | $ 788,883 |
Reinvestment of distributions | 48 | 387 | 635 | 3,793 |
Shares redeemed | (69,529) | (67,529) | (1,022,424) | (721,666) |
Net increase (decrease) | (9,248) | 4,236 | $ (143,461) | $ 71,010 |
Class T | | | | |
Shares sold | 27,634 | 15,043 | $ 398,291 | $ 167,984 |
Reinvestment of distributions | - | 52 | - | 513 |
Shares redeemed | (26,782) | (7,474) | (382,007) | (81,545) |
Net increase (decrease) | 852 | 7,621 | $ 16,284 | $ 86,952 |
Class B | | | | |
Shares sold | 2,875 | 12,626 | $ 40,053 | $ 143,810 |
Reinvestment of distributions | - | 10 | - | 101 |
Shares redeemed | (6,748) | (12,734) | (94,173) | (136,707) |
Net increase (decrease) | (3,873) | (98) | $ (54,120) | $ 7,204 |
Class C | | | | |
Shares sold | 24,030 | 26,160 | $ 347,201 | $ 298,029 |
Reinvestment of distributions | - | 11 | - | 107 |
Shares redeemed | (6,890) | (7,946) | (99,553) | (87,470) |
Net increase (decrease) | 17,140 | 18,225 | $ 247,648 | $ 210,666 |
Annual Report
Notes to Financial Statements - continued
12. Share Transactions - continued
| Shares | Dollars |
Years ended October 31, | 2010 | 2009 | 2010 | 2009 |
Stock Selector Small Cap | | | | |
Shares sold | 14,958,012 | 20,943,346 | $ 219,809,002 | $ 222,060,311 |
Reinvestment of distributions | 72,340 | 263,408 | 962,840 | 2,594,575 |
Shares redeemed | (38,394,961) | (26,369,097) | (570,480,008) | (287,151,117) |
Net increase (decrease) | (23,364,609) | (5,162,343) | $ (349,708,166) | $ (62,496,231) |
Institutional Class | | | | |
Shares sold | 13,011 | 6,785 | $ 190,234 | $ 75,484 |
Reinvestment of distributions | 4 | 9 | 53 | 87 |
Shares redeemed | (4,160) | (7,415) | (62,596) | (91,575) |
Net increase (decrease) | 8,855 | (621) | $ 127,691 | $ (16,004) |
13. Other.
The Fund's organizational documents provide former and current trustees and officers with a limited indemnification against liabilities arising in connection with the performance of their duties to the Fund. In the normal course of business, the Fund may also enter into contracts that provide general indemnifications. The Fund's maximum exposure under these arrangements is unknown as this would be dependent on future claims that may be made against the Fund. The risk of material loss from such claims is considered remote.
Annual Report
To the Trustees of Fidelity Capital Trust and Shareholders of Fidelity Stock Selector Small Cap Fund:
We have audited the accompanying statement of assets and liabilities of Fidelity Stock Selector Small Cap Fund, previously Fidelity Small Cap Independence Fund (the Fund), a fund of Fidelity Capital Trust, including the schedule of investments, as of October 31, 2010, and the related statement of operations for the year then ended, the statement of changes in net assets for each of the two years in the period then ended, and the financial highlights for each of the periods presented. These financial statements and financial highlights are the responsibility of the Fund's management. Our responsibility is to express an opinion on these financial statements and financial highlights based on our audits.
We conducted our audits in accordance with standards of the Public Company Accounting Oversight Board (United States). Those standards require that we plan and perform the audit to obtain reasonable assurance about whether the financial statements and financial highlights are free of material misstatement. The Fund is not required to have, nor were we engaged to perform, an audit of its internal control over financial reporting. Our audits included consideration of internal control over financial reporting as a basis for designing audit procedures that are appropriate in the circumstances, but not for the purpose of expressing an opinion on the effectiveness of the Fund's internal control over financial reporting. Accordingly, we express no such opinion. An audit also includes examining, on a test basis, evidence supporting the amounts and disclosures in the financial statements, assessing the accounting principles used and significant estimates made by management, as well as evaluating the overall financial statement presentation. Our procedures included confirmation of securities owned as of October 31, 2010, by correspondence with the custodians and brokers; where replies were not received from brokers, we performed other auditing procedures. We believe that our audits provide a reasonable basis for our opinion.
In our opinion, the financial statements and financial highlights referred to above present fairly, in all material respects, the financial position of Fidelity Stock Selector Small Cap Fund as of October 31, 2010, the results of its operations for the year then ended, the changes in its net assets for each of the two years in the period then ended, and the financial highlights for each of the periods presented, in conformity with accounting principles generally accepted in the United States of America.
/s/ Deloitte & Touche LLP
DELOITTE & TOUCHE LLP
Boston, Massachusetts
December 16, 2010
Annual Report
The Trustees, Member of the Advisory Board, and executive officers of the trust and fund, as applicable, are listed below. The Board of Trustees governs the fund and is responsible for protecting the interests of shareholders. The Trustees are experienced executives who meet periodically throughout the year to oversee the fund's activities, review contractual arrangements with companies that provide services to the fund, oversee management of the risks associated with such activities and contractual arrangements, and review the fund's performance. Except for James C. Curvey, each of the Trustees oversees 221 funds advised by FMR or an affiliate. Mr. Curvey oversees 410 funds advised by FMR or an affiliate.
The Trustees hold office without limit in time except that (a) any Trustee may resign; (b) any Trustee may be removed by written instrument, signed by at least two-thirds of the number of Trustees prior to such removal; (c) any Trustee who requests to be retired or who has become incapacitated by illness or injury may be retired by written instrument signed by a majority of the other Trustees; and (d) any Trustee may be removed at any special meeting of shareholders by a two-thirds vote of the outstanding voting securities of the trust. Each Trustee who is not an interested person (as defined in the 1940 Act) (Independent Trustee), shall retire not later than the last day of the calendar year in which his or her 72nd birthday occurs. The Independent Trustees may waive this mandatory retirement age policy with respect to individual Trustees. The executive officers and Advisory Board Member hold office without limit in time, except that any officer and Advisory Board Member may resign or may be removed by a vote of a majority of the Trustees at any regular meeting or any special meeting of the Trustees. Except as indicated, each individual has held the office shown or other offices in the same company for the past five years.
Experience, Skills, Attributes, and Qualifications of the Fund's Trustees. The Governance and Nominating Committee has adopted a statement of policy that describes the experience, qualifications, attributes, and skills that are necessary and desirable for potential Independent Trustee candidates (Statement of Policy). The Board believes that each Trustee satisfied at the time he or she was initially elected or appointed a Trustee, and continues to satisfy, the standards contemplated by the Statement of Policy. The Governance and Nominating Committee also engages professional search firms to help identify potential Independent Trustee candidates who have the experience, qualifications, attributes, and skills consistent with the Statement of Policy. From time to time, additional criteria based on the composition and skills of the current Independent Trustees, as well as experience or skills that may be appropriate in light of future changes to board composition, business conditions, and regulatory or other developments, have also been considered by the professional search firms and the Governance and Nominating Committee. In addition, the Board takes into account the Trustees' commitment and participation in Board and committee meetings, as well as their leadership of standing and ad hoc committees throughout their tenure.
In determining that a particular Trustee was and continues to be qualified to serve as a Trustee, the Board has considered a variety of criteria, none of which, in isolation, was controlling. The Board believes that, collectively, the Trustees have balanced and diverse experience, qualifications, attributes, and skills, which allow the Board to operate effectively in governing the fund and protecting the interests of shareholders. Information about the specific experience, skills, attributes, and qualifications of each Trustee, which in each case led to the Board's conclusion that the Trustee should serve (or continue to serve) as a trustee of the fund, is provided below.
Annual Report
Board Structure and Oversight Function. Edward C. Johnson 3d is an interested person (as defined in the 1940 Act) and currently serves as Chairman. The Trustees have determined that an interested Chairman is appropriate and benefits shareholders because an interested Chairman has a personal and professional stake in the quality and continuity of services provided to the fund. Independent Trustees exercise their informed business judgment to appoint an individual of their choosing to serve as Chairman, regardless of whether the Trustee happens to be independent or a member of management. The Independent Trustees have determined that they can act independently and effectively without having an Independent Trustee serve as Chairman and that a key structural component for assuring that they are in a position to do so is for the Independent Trustees to constitute a substantial majority for the Board. The Independent Trustees also regularly meet in executive session. Ned C. Lautenbach serves as Chairman of the Independent Trustees and as such (i) acts as a liaison between the Independent Trustees and management with respect to matters important to the Independent Trustees and (ii) with management prepares agendas for Board meetings.
Fidelity funds are overseen by different Boards of Trustees. The fund's Board oversees Fidelity's equity and high income funds and another Board oversees Fidelity's investment-grade bond, money market, and asset allocation funds. The asset allocation funds may invest in Fidelity funds overseen by the fund's Board. The use of separate Boards, each with its own committee structure, allows the Trustees of each group of Fidelity funds to focus on the unique issues of the funds they oversee, including common research, investment, and operational issues. On occasion, the separate Boards establish joint committees to address issues of overlapping consequences for the Fidelity funds overseen by each Board.
The Trustees operate using a system of committees to facilitate the timely and efficient consideration of all matters of importance to the Trustees, the fund, and fund shareholders and to facilitate compliance with legal and regulatory requirements and oversight of the fund's activities and associated risks. The Board, acting through its committees, has charged FMR and its affiliates with (i) identifying events or circumstances the occurrence of which could have demonstrably adverse effects on the fund's business and/or reputation; (ii) implementing processes and controls to lessen the possibility that such events or circumstances occur or to mitigate the effects of such events or circumstances if they do occur; and (iii) creating and maintaining a system designed to evaluate continuously business and market conditions in order to facilitate the identification and implementation processes described in (i) and (ii) above. Because the day-to-day operations and activities of the fund are carried out by or through FMR, its affiliates and other service providers, the fund's exposure to risks is mitigated but not eliminated by the processes overseen by the Trustees. While each of the Board's committees has responsibility for overseeing different aspects of the fund's activities, oversight is exercised primarily through the Operations, Audit, and Compliance Committees. Appropriate personnel, including but not limited to the fund's Chief Compliance Officer (CCO), FMR's internal auditor, the independent accountants, the fund's Treasurer and portfolio management personnel, make periodic reports to the Board's committees, as appropriate. The responsibilities of each committee, including their oversight responsibilities, are described further under "Standing Committees of the Fund's Trustees."
Annual Report
Trustees and Officers - continued
The fund's Statement of Additional Information (SAI) includes more information about the Trustees. To request a free copy, call Fidelity at 1-877-208-0098.
Interested Trustees*:
Correspondence intended for each Trustee who is an interested person may be sent to Fidelity Investments, 82 Devonshire Street, Boston, Massachusetts 02109.
Name, Age; Principal Occupations and Other Relevant Experience+ |
Edward C. Johnson 3d (80) |
| Year of Election or Appointment: 1978 Mr. Johnson is Trustee and Chairman of the Board of Trustees of certain Trusts. Mr. Johnson serves as Chief Executive Officer, Chairman, and a Director of FMR LLC; Chairman and a Director of FMR; Chairman and a Director of Fidelity Research & Analysis Company (FRAC); Chairman and a Director of Fidelity Investments Money Management, Inc.; and Chairman and a Director of FMR Co., Inc. In addition, Mr. Johnson serves as Chairman and Director of FIL Limited. Previously, Mr. Johnson served as President of FMR LLC (2006-2007). |
James C. Curvey (75) |
| Year of Election or Appointment: 2007 Mr. Curvey also serves as Trustee (2007-present) of other investment companies advised by FMR. Mr. Curvey is a Director of Fidelity Investments Money Management, Inc. (2009-present), Director of Fidelity Research & Analysis Co. (2009-present) and Director of FMR and FMR Co., Inc. (2007-present). Mr. Curvey is also Vice Chairman (2007-present) and Director of FMR LLC. In addition, Mr. Curvey serves as an Overseer for the Boston Symphony Orchestra and a member of the Trustees of Villanova University. Previously, Mr. Curvey was the Vice Chairman (2006-2007) and Director (2000-2007) of FMR Corp. |
Annual Report
* Trustees have been determined to be "Interested Trustees" by virtue of, among other things, their affiliation with the trust or various entities under common control with FMR.
+ The information above includes each Trustee's principal occupation during the last five years and other information relating to the experience, attributes, and skills relevant to each Trustee's qualifications to serve as a Trustee, which led to the conclusion that each Trustee should serve as a Trustee for the fund.
Independent Trustees:
Correspondence intended for each Independent Trustee (that is, the Trustees other than the Interested Trustees) may be sent to Fidelity Investments, P.O. Box 55235, Boston, Massachusetts 02205-5235.
Name, Age; Principal Occupations and Other Relevant Experience+ |
Dennis J. Dirks (62) |
| Year of Election or Appointment: 2005 Prior to his retirement in May 2003, Mr. Dirks was Chief Operating Officer and a member of the Board of The Depository Trust & Clearing Corporation (DTCC). He also served as President, Chief Operating Officer, and Board member of The Depository Trust Company (DTC) and President and Board member of the National Securities Clearing Corporation (NSCC). In addition, Mr. Dirks served as Chief Executive Officer and Board member of the Government Securities Clearing Corporation, Chief Executive Officer and Board member of the Mortgage-Backed Securities Clearing Corporation, as a Trustee and a member of the Finance Committee of Manhattan College (2005-2008), and as a Trustee and a member of the Finance Committee of AHRC of Nassau County (2006-2008). Mr. Dirks is a member of the Independent Directors Council (IDC) Governing Council (2010-Present) and Board of Directors for The Brookville Center for Children's Services, Inc. (2009-present). |
Alan J. Lacy (57) |
| Year of Election or Appointment: 2008 Mr. Lacy serves as Senior Adviser (2007-present) of Oak Hill Capital Partners, L.P. (private equity). Mr. Lacy also served as Chief Executive Officer (2000-2005) and Vice Chairman (2005-2006) of Sears Holdings Corporation and Sears, Roebuck and Co. (retail). In addition, Mr. Lacy serves as a member of the Board of Directors of The Western Union Company (global money transfer, 2006-present) and Bristol-Myers Squibb Company (global pharmaceuticals, 2007-present). Mr. Lacy is Chairman (2008-present) and a member (2006-present) of the Board of Trustees of The National Parks Conservation Association. |
Ned C. Lautenbach (66) |
| Year of Election or Appointment: 2000 Mr. Lautenbach is Chairman of the Independent Trustees of the Equity and High Income Funds (2006-present). Mr. Lautenbach currently serves as the Lead Director of the Eaton Corporation Board of Directors (diversified industrial, 1997-present). Mr. Lautenbach is also a member of the Board of Directors of the Philharmonic Center for the Arts in Naples, Florida (1999-present); a member of the Board of Trustees of Fairfield University (2005-present); and a member of the Council on Foreign Relations (1994-present). Previously, Mr. Lautenbach was a Partner/Advisory Partner at Clayton, Dubilier & Rice, Inc. (private equity investment, 1998-2010), as well as a Director of Sony Corporation (2006-2007). |
Joseph Mauriello (66) |
| Year of Election or Appointment: 2008 Prior to his retirement in January 2006, Mr. Mauriello served in numerous senior management positions including Deputy Chairman and Chief Operating Officer (2004-2005), and Vice Chairman of Financial Services (2002-2004) of KPMG LLP US (professional services, 1965-2005). Mr. Mauriello currently serves as a member of the Board of Directors of XL Group plc. (global insurance and re-insurance, 2006-present) and of Arcadia Resources Inc. (health care services and products, 2007-present). Previously, Mr. Mauriello served as a Director of the Hamilton Funds of the Bank of New York (2006-2007). |
Cornelia M. Small (66) |
| Year of Election or Appointment: 2005 Ms. Small is a member of the Board of Directors of the Teagle Foundation (2009-present). Ms. Small is also a member of the Investment Committee, and Chair (2008-present) and a member of the Board of Trustees of Smith College. In addition, Ms. Small serves on the Investment Committee of the Berkshire Taconic Community Foundation (2008-present). Previously, Ms. Small served as Chairperson of the Investment Committee (2002-2008) of Smith College. In addition, Ms. Small served as Chief Investment Officer, Director of Global Equity Investments, and a member of the Board of Directors of Scudder, Stevens & Clark and Scudder Kemper Investments. |
William S. Stavropoulos (71) |
| Year of Election or Appointment: 2002 Mr. Stavropoulos is Vice Chairman of the Independent Trustees of the Equity and High Income Funds (2006-present). Mr. Stavropoulos serves as President and Founder of the Michigan Baseball Foundation, the Great Lakes Loons (2007-present). Mr. Stavropoulos is Chairman Emeritus of the Board of Directors of The Dow Chemical Company, where he previously served in numerous senior management positions, including President, CEO (1995-2000; 2002-2004), Chairman of the Executive Committee (2000-2006), and as a member of the Board of Directors (1990-2006). Currently, Mr. Stavropoulos is Chairman of Univar (global distributor of commodity and specialty chemicals, 2010-present), a Director of Teradata Corporation (data warehousing and technology solutions, 2008-present), Chemical Financial Corporation, Maersk Inc. (industrial conglomerate), Tyco International, Inc. (multinational manufacturing and services, 2007-present), and a member of the Advisory Board for Metalmark Capital (private equity investment, 2005-present). Mr. Stavropoulos is a special advisor to Clayton, Dubilier & Rice, Inc. (private equity investment). In addition, Mr. Stavropoulos is a member of the University of Notre Dame Advisory Council for the College of Science. |
David M. Thomas (61) |
| Year of Election or Appointment: 2008 Previously, Mr. Thomas served as Executive Chairman (2005-2006) and Chairman and Chief Executive Officer (2000-2005) of IMS Health, Inc. (pharmaceutical and healthcare information solutions). In addition, Mr. Thomas serves as a member of the Board of Directors of Fortune Brands, Inc. (consumer products), and Interpublic Group of Companies, Inc. (marketing communication, 2004-present). |
Michael E. Wiley (60) |
| Year of Election or Appointment: 2008 Mr. Wiley also serves as a Director of Asia Pacific Exploration Consolidated (international oil and gas exploration and production, 2008-present). Mr. Wiley serves as a Director of Tesoro Corporation (independent oil refiner and marketer, 2005-present), and a Director of Bill Barrett Corporation (exploration and production, 2005-present). In addition, Mr. Wiley also serves as a Director of Post Oak Bank (privately-held bank, 2004-present). Previously, Mr. Wiley served as a member of the Board of Trustees of the University of Tulsa (2000-2006; 2007-2010), as a Senior Energy Advisor of Katzenbach Partners, LLC (consulting, 2006-2007), as an Advisory Director of Riverstone Holdings (private investment), Chairman, President, and CEO of Baker Hughes, Inc. (oilfield services, 2000-2004), and as Director of Spinnaker Exploration Company (exploration and production, 2001-2005). |
Annual Report
Trustees and Officers - continued
+ The information above includes each Trustee's principal occupation during the last five years and other information relating to the experience, attributes, and skills relevant to each Trustee's qualifications to serve as a Trustee, which led to the conclusion that each Trustee should serve as a Trustee for the fund.
Advisory Board Member and Executive Officers:
Correspondence intended for each executive officer and Peter S. Lynch may be sent to Fidelity Investments, 82 Devonshire Street, Boston, Massachusetts 02109.
Name, Age; Principal Occupation |
Peter S. Lynch (66) |
| Year of Election or Appointment: 2003 Member of the Advisory Board of Fidelity's Equity and High Income Funds. Mr. Lynch is Vice Chairman and a Director of FMR and FMR Co., Inc. In addition, Mr. Lynch serves as a Trustee of Boston College and as the Chairman of the Inner-City Scholarship Fund. Previously, Mr. Lynch served on the Special Olympics International Board of Directors (1997-2006). |
Kenneth B. Robins (41) |
| Year of Election or Appointment: 2008 President and Treasurer of Fidelity's Equity and High Income Funds. Mr. Robins also serves as President and Treasurer (2010-present) and Assistant Treasurer (2009-present) of other Fidelity funds and is an employee of Fidelity Investments (2004-present). Previously, Mr. Robins served as Deputy Treasurer of the Fidelity funds (2005-2008) and Treasurer and Chief Financial Officer of The North Carolina Capital Management Trust: Cash and Term Portfolios (2006-2008). |
Brian B. Hogan (46) |
| Year of Election or Appointment: 2009 Vice President of certain Equity Funds and Vice President of Sector Funds. Mr. Hogan also serves as President of FMR's Equity Division (2009-present). Previously, Mr. Hogan served as Senior Vice President, Equity Research of FMR (2006-2009) and as a portfolio manager. |
Thomas C. Hense (46) |
| Year of Election or Appointment: 2008 or 2010 Vice President of Fidelity's High Income (2008), Small Cap (2008), and Value (2010) Funds. Previously, Mr. Hense served as a portfolio manager for Fidelity's Institutional Money Management Group (Pyramis) (2003-2008). |
Scott C. Goebel (42) |
| Year of Election or Appointment: 2008 Secretary and Chief Legal Officer (CLO) of the Fidelity funds. Mr. Goebel also serves as Secretary and CLO of The North Carolina Capital Management Trust: Cash and Term Portfolio (2008-present); General Counsel, Secretary, and Senior Vice President of FMR (2008-present) and FMR Co., Inc. (2008-present); Deputy General Counsel of FMR LLC; Chief Legal Officer of Fidelity Management & Research (Hong Kong) Limited (2008-present) and Assistant Secretary of Fidelity Management & Research (Japan) Inc. (2008-present), Fidelity Investments Money Management, Inc. (2008-present), Fidelity Management & Research (U.K.) Inc. (2008-present), and Fidelity Research and Analysis Company (2008-present). Previously, Mr. Goebel served as Assistant Secretary of the Funds (2007-2008) and as Vice President and Secretary of Fidelity Distributors Corporation (FDC) (2005-2007). |
William C. Coffey (41) |
| Year of Election or Appointment: 2009 Assistant Secretary of Fidelity's Equity and High Income Funds. Mr. Coffey also serves as Senior Vice President and Deputy General Counsel of FMR LLC (2010-present), and is an employee of Fidelity Investments. Previously, Mr. Coffey served as Vice President and Associate General Counsel of FMR LLC (2005-2009). |
Holly C. Laurent (56) |
| Year of Election or Appointment: 2008 Anti-Money Laundering (AML) Officer of the Fidelity funds. Ms. Laurent also serves as AML Officer of The North Carolina Capital Management Trust: Cash and Term Portfolio (2008-present) and is an employee of Fidelity Investments. Previously, Ms. Laurent was Senior Vice President and Head of Legal for Fidelity Business Services India Pvt. Ltd. (2006-2008), and Senior Vice President, Deputy General Counsel and Group Head for FMR LLC (2005-2006). |
Christine Reynolds (52) |
| Year of Election or Appointment: 2008 Chief Financial Officer of the Fidelity funds. Ms. Reynolds became President of Fidelity Pricing and Cash Management Services (FPCMS) in August 2008. Ms. Reynolds served as Chief Operating Officer of FPCMS (2007-2008). Previously, Ms. Reynolds served as President, Treasurer, and Anti-Money Laundering officer of the Fidelity funds (2004-2007). |
Kenneth A. Rathgeber (63) |
| Year of Election or Appointment: 2004 Chief Compliance Officer of Fidelity's Equity and High Income Funds. Mr. Rathgeber is Chief Compliance Officer of Fidelity Management & Research (Hong Kong) Limited (2008-present), Fidelity Management & Research (Japan) Inc. (2008-present), FMR (2005-present), FMR Co., Inc. (2005-present), Fidelity Management & Research (U.K.) Inc. (2005-present), Fidelity Research & Analysis Company (2005-present), Fidelity Investments Money Management, Inc. (2005-present), Pyramis Global Advisors, LLC (2005-present), and Strategic Advisers, Inc. (2005-present). |
Jeffrey S. Christian (49) |
| Year of Election or Appointment: 2009 Deputy Treasurer of the Fidelity funds. Mr. Christian is an employee of Fidelity Investments. Previously, Mr. Christian served as Chief Financial Officer (2008-2009) of certain Fidelity funds and Senior Vice President of Fidelity Pricing and Cash Management Services (FPCMS) (2004-2009). |
Bryan A. Mehrmann (49) |
| Year of Election or Appointment: 2005 Deputy Treasurer of the Fidelity funds. Mr. Mehrmann is an employee of Fidelity Investments. |
Adrien E. Deberghes (43) |
| Year of Election or Appointment: 2008 Deputy Treasurer of Fidelity's Equity and High Income Funds. Mr. Deberghes also serves as Assistant Treasurer of other Fidelity funds (2010-present) and is an employee of Fidelity Investments (2008-present). Previously, Mr. Deberghes served as Senior Vice President of Mutual Fund Administration at State Street Corporation (2007-2008), Senior Director of Mutual Fund Administration at Investors Bank & Trust (2005-2007), and Director of Finance for Dunkin' Brands (2000-2005). |
Stephanie J. Dorsey (41) |
| Year of Election or Appointment: 2010 Assistant Treasurer of Fidelity's Equity and High Income Funds. Ms. Dorsey also serves as Deputy Treasurer of other Fidelity funds (2008-present) and is an employee of Fidelity Investments (2008-present). Previously, Ms. Dorsey served as Treasurer (2004-2008) of the JPMorgan Mutual Funds and Vice President (2004-2008) of JPMorgan Chase Bank. |
John R. Hebble (52) |
| Year of Election or Appointment: 2009 Assistant Treasurer of Fidelity's Equity and High Income Funds. Mr. Hebble also serves as Treasurer and Chief Financial Officer of The North Carolina Capital Management Trust: Cash and Term Portfolio (2008-present), President and Treasurer of other Fidelity funds (2008-present) and is an employee of Fidelity Investments. |
Gary W. Ryan (52) |
| Year of Election or Appointment: 2005 Assistant Treasurer of the Fidelity funds. Mr. Ryan is an employee of Fidelity Investments. Previously, Mr. Ryan served as Vice President of Fund Reporting in Fidelity Pricing and Cash Management Services (FPCMS) (1999-2005). |
Jonathan Davis (42) |
| Year of Election or Appointment: 2010 Assistant Treasurer of the Fidelity funds. Mr. Davis is an employee of Fidelity Investments. Previously, Mr. Davis served as Vice President and Associate General Counsel of FMR LLC (2003-2010). |
Annual Report
Class A designates 100% of each dividends distributed during the fiscal year as qualifying for the dividends-received deduction for corporate shareholders.
Class A designates 100% of each dividends distributed in December 2009 during the fiscal year as amounts which may be taken into account as a dividend for purposes of the maximum rate under section 1(h)(11) of the Internal Revenue Code.
The fund will notify shareholders in January 2011 of amounts for use in preparing 2010 income tax returns.
Annual Report
Board Approval of Investment Advisory Contracts and Management Fees
Fidelity Stock Selector Small Cap Fund (formerly known as Fidelity Small Cap Independence Fund)
Each year, the Board of Trustees, including the Independent Trustees (together, the Board), votes on the renewal of the management contract and sub-advisory agreements (together, the Advisory Contracts) for the fund. The Board, assisted by the advice of fund counsel and Independent Trustees' counsel, requests and considers a broad range of information relevant to the renewal of the Advisory Contracts throughout the year.
The Board meets regularly and considers at each of its meetings factors that are relevant to its annual consideration of the renewal of the fund's Advisory Contracts, including the services and support provided to the fund and its shareholders. The Board has established various standing committees, each composed of Independent Trustees with varying backgrounds, to which the Board has assigned specific subject matter responsibilities in order to enhance effective decision-making by the Board. The Board, acting directly and through its Committees, requests and receives information concerning the annual consideration of the renewal of the fund's Advisory Contracts. The Board also meets as needed to consider matters specifically related to the Board's annual consideration of the renewal of Advisory Contracts. Members of the Board may also meet with trustees of other Fidelity funds through ad hoc joint committees to discuss certain matters relevant to the Fidelity funds.
At its July 2010 meeting, the Board of Trustees, including the Independent Trustees, unanimously determined to renew the fund's Advisory Contracts. In reaching its determination, the Board considered all factors it believed relevant, including (i) the nature, extent, and quality of the services to be provided to the fund and its shareholders (including the investment performance of the fund); (ii) the competitiveness of the fund's management fee and total expenses; (iii) the total costs of the services to be provided by and the profits to be realized by Fidelity from its relationship with the fund; (iv) the extent to which economies of scale would be realized as the fund grows; and (v) whether fee levels reflect these economies of scale, if any, for the benefit of fund shareholders.
In considering whether to renew the Advisory Contracts for the fund, the Board reached a determination, with the assistance of fund counsel and Independent Trustees' counsel and through the exercise of its business judgment, that the renewal of the Advisory Contracts is in the best interests of fund shareholders and that the compensation to be received by Fidelity under the management contract is fair and reasonable. The Board's decision to renew the Advisory Contracts was not based on any single factor noted above, but rather was based on a comprehensive consideration of all the information provided to the Board at its meetings throughout the year. The Board, in reaching its determination to renew the Advisory Contracts, is aware that shareholders in the fund have a broad range of investment choices available to them, including a wide choice among mutual funds offered by Fidelity's competitors, and that the fund's shareholders, with the opportunity to review and weigh the disclosure provided by the fund in its prospectus and other public disclosures, have chosen to invest in this fund, managed by Fidelity.
Annual Report
Nature, Extent, and Quality of Services Provided. The Board considered the staffing within the investment adviser, FMR, and the sub-advisers (together, the Investment Advisers), including the backgrounds of the fund's investment personnel and the fund's investment objective and discipline. The Independent Trustees also had discussions with senior management of Fidelity's investment operations and investment groups. The Board considered the structure of the portfolio manager compensation program and whether this structure provides appropriate incentives to act in the best interest of the fund.
Resources Dedicated to Investment Management and Support Services. The Board and the equity research subcommittee of the Board's Fund Oversight Committee reviewed the size, education, and experience of the Investment Advisers' investment staff, their use of technology, and the Investment Advisers' approach to recruiting, training, and retaining portfolio managers and other research, advisory, and management personnel. The Board noted that Fidelity's analysts have access to a variety of technological tools and market and securities data that enable them to perform both fundamental and quantitative analysis and to specialize in various disciplines. The Board considered Fidelity's extensive global research capabilities that enable the Investment Advisers to aggregate data from various sources in an effort to produce positive investment results. The Board also considered that Fidelity's portfolio managers and analysts have access to daily portfolio attribution that allows for monitoring of a fund's portfolio, as well as an electronic communication system that provides immediate real-time access to research concerning issuers and credit enhancers. The Board noted FMR's continued focus on strengthening the organization and discipline of equity portfolio management and research.
Shareholder and Administrative Services. The Board considered (i) the nature, extent, quality, and cost of advisory, administrative, and shareholder services performed by the Investment Advisers and their affiliates under the Advisory Contracts and under separate agreements covering transfer agency, pricing and bookkeeping, and securities lending services for the fund; (ii) the nature and extent of the investment adviser's supervision of third party service providers, principally custodians and subcustodians; and (iii) the resources devoted to, and the record of compliance with, the fund's compliance policies and procedures. The Board also reviewed the allocation of fund brokerage, including allocations to brokers affiliated with the Investment Advisers, the use of brokerage commissions to pay fund expenses, and the use of "soft" commission dollars to pay for research services.
The Board noted that the growth of fund assets over time across the complex allows Fidelity to reinvest in the development of services designed to enhance the value or convenience of the Fidelity funds as investment vehicles. These services include 24-hour access to account information and market information through phone representatives and over the Internet, and investor education materials and asset allocation tools.
Annual Report
Board Approval of Investment Advisory Contracts and
Management Fees - continued
Investment in a Large Fund Family. The Board considered the benefits to shareholders of investing in a Fidelity fund, including the benefits of investing in a fund that is part of a large family of funds offering a variety of investment disciplines and providing a large variety of mutual fund investor services. The Board noted that Fidelity had taken, or had made recommendations that resulted in the Fidelity funds taking, a number of actions over the previous year that benefited particular funds, including (i) dedicating additional resources to investment research and restructuring and broadening the focus of the investment research teams; (ii) bolstering the senior management team that oversees asset management; (iii) launching Class F of certain funds as a lower-fee class available to Freedom K and Freedom Index Funds; (iv) lowering the initial investment minimums and ongoing balance requirements for Real Estate High Income Fund; (v) eliminating subsequent purchase minimums for all funds and adding a waiver of the investment minimum requirement for new accounts opened with the proceeds of a systematic withdrawal plan; (vi) eliminating the withdrawal minimum and maximum limits for systematic withdrawals from Advisor funds; (vii) expanding sales load waivers on Class A shares for Destiny Planholders and expanding Institutional Class eligibility for Class O Destiny Planholders; and (viii) changing certain Class A and Class T sales charge structures to further align them with industry practices.
Investment Performance. The Board considered whether the fund has operated in accordance with its investment objective, as well as its record of compliance with its investment restrictions. It also reviewed the fund's absolute investment performance for each class, as well as the fund's relative investment performance for each class measured over multiple periods against (i) a broad-based securities market index, and (ii) a peer group of mutual funds deemed appropriate by Fidelity and reviewed by the Board. The following charts considered by the Board show, over the one-, three-, and five-year periods ended December 31, 2009, as available, the cumulative total returns of Institutional Class (Class I) and the retail class of the fund, the cumulative total returns of a broad-based securities market index ("benchmark"), and a range of cumulative total returns of a peer group of mutual funds identified by Morningstar, Inc. as having an investment style similar to that of the fund based on underlying portfolio holdings. The box within each chart shows the 25th percentile return (bottom of box) and the 75th percentile return (top of box) of the peer group. Returns shown above the box are in the first quartile and returns shown below the box are in the fourth quartile. The percentage beaten numbers noted below each chart correspond to the percentile box and represent the percentage of funds in the peer group whose performance was equal to or lower than that of the class indicated.
Annual Report
Fidelity Stock Selector Small Cap Fund

The Board reviewed the fund's relative investment performance against its peer group and noted that the performance of the retail class of the fund (the class with the longer performance record) was in the second quartile for the one-year period, the fourth quartile for the three-year period, and the third quartile for the five-year period. The Board also noted that the investment performance of the fund was lower than its benchmark for the three- and five-year periods, although the one-year cumulative total return of the retail class compared favorably to its benchmark. The Board considered that the variations in performance among the fund's classes reflect the variations in class expenses, which result in lower performance for higher expense classes. The Board also reviewed the fund's performance since inception as well as performance in the current year.
The Board also considered that the fund's management fee is subject to upward or downward adjustment depending upon whether, and to what extent, the fund's investment performance for the performance period exceeds, or is exceeded by, the record (over the same period) of a Board-approved performance adjustment index. The Board realizes that the performance adjustment provides FMR with a strong economic incentive to seek to achieve superior performance for the fund's shareholders and helps to more closely align the interests of FMR and the fund's shareholders.
Based on its review, and giving particular weight to the nature and quality of the resources dedicated by the Investment Advisers to maintain and improve relative performance and factoring in the unprecedented market events in recent years, the Board concluded that the nature, extent, and quality of investment management and support services and of shareholder and administrative services provided to the fund will benefit the fund's shareholders, particularly in light of the Board's view that the fund's shareholders benefit from investing in a fund that is part of a large family of funds offering a variety of investment disciplines and services.
Annual Report
Board Approval of Investment Advisory Contracts and
Management Fees - continued
Competitiveness of Management Fee and Total Fund Expenses. The Board considered the fund's management fee and total expenses compared to "mapped groups" of competitive funds and classes. Fidelity creates "mapped groups" by combining similar Lipper investment objective categories that have comparable management fee characteristics. Combining Lipper investment objective categories aids the Board's management fee and total expense comparisons by broadening the competitive group used for comparison and by reducing the number of universes to which various Fidelity funds are compared.
Management Fee. The Board considered two proprietary management fee comparisons for the 12-month periods shown in the chart below. The group of Lipper funds used by the Board for management fee comparisons is referred to below as the "Total Mapped Group." The Total Mapped Group comparison focuses on a fund's standing relative to the total universe of comparable funds available to investors, in terms of gross management fees before expense reimbursements or caps, and without giving effect to the fund's performance adjustment. "TMG %" represents the percentage of funds in the Total Mapped Group that had management fees that were lower than the fund's. For example, a TMG % of 5% means that 95% of the funds in the Total Mapped Group had higher management fees than the fund. The "Asset-Size Peer Group" (ASPG) comparison focuses on a fund's standing relative to non-Fidelity funds similar in size to the fund within the Total Mapped Group. The ASPG represents at least 15% of the funds in the Total Mapped Group with comparable asset size and management fee characteristics, subject to a minimum of 50 funds (or all funds in the Total Mapped Group if fewer than 50). Additional information, such as the ASPG quartile in which the fund's management fee ranked and the impact of the fund's performance adjustment, is also included in the chart and considered by the Board.
Annual Report
Fidelity Stock Selector Small Cap Fund

The Board noted that the fund's management fee ranked below the median of its Total Mapped Group and below the median of its ASPG for 2009. The Board also noted the effect of the fund's negative performance adjustment on the fund's management fee ranking. The Board noted that the performance adjustment for each year represents calculations for performance periods that differ from the periods shown in the performance charts above.
Based on its review, the Board concluded that the fund's management fee is fair and reasonable in light of the services that the fund receives and the other factors considered.
Total Expenses. In its review of each class's total expenses, the Board considered the fund's management fee as well as other fund or class expenses, as applicable, such as transfer agent fees, pricing and bookkeeping fees, fund-paid 12b-1 fees, and custodial, legal, and audit fees. The Board also noted the effects of any waivers and reimbursements on fees and expenses, as well as the impact of the fund's performance adjustment. As part of its review, the Board also considered current and historical total expenses of each class of the fund compared to competitive fund median expenses. Each class of the fund is compared to those funds and classes in the Total Mapped Group (used by the Board for management fee comparisons) that have a similar sales load structure.
The Board noted that the total expenses of each class ranked below its competitive median for 2009.
Fees Charged to Other Fidelity Clients. The Board also considered Fidelity fee structures and other information with respect to clients of FMR and its affiliates, such as other mutual funds advised or subadvised by FMR or its affiliates, pension plan clients, and other institutional clients. In March 2010, the Board created an ad hoc joint committee with the board of other Fidelity funds (the Committee) to review and compare Fidelity's institutional investment advisory business with its business of providing services to the Fidelity funds, including the differences in services provided, fees charged, and costs incurred, as well as competition in their respective marketplaces.
Annual Report
Board Approval of Investment Advisory Contracts and
Management Fees - continued
Based on its review of total expenses and fees charged to other Fidelity clients, the Board concluded that the total expenses of each class of the fund were reasonable in light of the services that the fund and its shareholders receive and the other factors considered, including the findings of the Committee.
Costs of the Services and Profitability. The Board considered the revenues earned and the expenses incurred by Fidelity in conducting the business of developing, marketing, distributing, managing, administering and servicing the fund and its shareholders. The Board also considered the level of Fidelity's profits in respect of all the Fidelity funds.
On an annual basis, FMR presents to the Board Fidelity's profitability for the fund. Fidelity calculates the profitability for each fund, as well as aggregate profitability for groups of Fidelity funds and all Fidelity funds, using a series of detailed revenue and cost allocation methodologies which originate with the audited books and records of Fidelity. The Audit Committee of the Board reviews any significant changes from the prior year's methodologies.
PricewaterhouseCoopers LLP (PwC), independent registered public accounting firm and auditor to Fidelity and certain Fidelity funds, has been engaged annually by the Board as part of the Board's assessment of Fidelity's profitability analysis. PwC's engagement includes the review and assessment of Fidelity's methodologies used in determining the revenues and expenses attributable to Fidelity's mutual fund business, and completion of agreed-upon procedures surrounding the mathematical accuracy of fund profitability and its conformity to allocation methodologies. After considering PwC's reports issued under the engagement and information provided by Fidelity, the Board believes that while other allocation methods may also be reasonable, Fidelity's profitability methodologies are reasonable in all material respects.
The Board has also reviewed Fidelity's non-fund businesses and fall-out benefits related to the mutual fund business as well as cases where Fidelity's affiliates may benefit from or be related to the fund's business.
The Board considered the costs of the services provided by and the profits realized by Fidelity in connection with the operation of the fund and were satisfied that the profitability was not excessive in the circumstances.
Annual Report
Economies of Scale. The Board considered whether there have been economies of scale in respect of the management of the Fidelity funds, whether the Fidelity funds (including the fund) have appropriately benefited from any such economies of scale, and whether there is potential for realization of any further economies of scale. The Board considered the extent to which the fund will benefit from economies of scale through increased services to the fund, through waivers or reimbursements, or through fee or expense reductions.
In February 2009, the Board and the board of other Fidelity funds created an ad hoc committee (the Economies of Scale Committee) to analyze whether FMR attains economies of scale in respect of the management and servicing of the Fidelity funds, whether the Fidelity funds have appropriately benefited from such economies of scale, and whether there is potential for realization of any further economies of scale.
The Board recognized that the fund's management contract incorporates a "group fee" structure, which provides for lower group fee rates as total fund assets under FMR's management increase, and for higher group fee rates as total fund assets under FMR's management decrease. FMR calculates the group fee rates based on a tiered asset "breakpoint" schedule that varies based on asset class. The Board considered that the group fee is designed to deliver the benefits of economies of scale to fund shareholders when total Fidelity fund assets increase, even if assets of any particular fund are unchanged or have declined, because some portion of Fidelity's costs are attributable to services provided to all Fidelity funds, and all funds benefit if those costs can be allocated among more assets. The Board concluded that, given the group fee structure, fund shareholders will benefit from lower management fees as assets under FMR's management increase at the fund complex level, regardless of whether Fidelity achieves any such economies of scale.
The Board concluded, considering the findings of the Economies of Scale Committee, that any potential economies of scale are being appropriately shared between fund shareholders and Fidelity.
Additional Information Requested by the Board. In order to develop fully the factual basis for consideration of the Fidelity funds' Advisory Contracts, the Board requested and received additional information on certain topics, including (i) fund performance trends, actions to be taken by FMR to improve certain funds' overall performance, and Fidelity's long-term strategies for certain funds; (ii) portfolio manager changes that have occurred during the past year and length of portfolio manager tenure for different categories of funds over time; (iii) Fidelity's compensation structure for portfolio managers, research analysts, and other key personnel, the rationale for the compensation structure, and how the compensation structure provides appropriate performance incentives; (iv) the amount of the investment that each portfolio manager has made in the Fidelity fund(s) that he or she manages; (v) management and other fees paid by FMR to affiliated sub-advisers on behalf of the Fidelity funds; (vi) Fidelity's fee structures and rationale for recommending different fees among different categories of funds; (vii) Fidelity's rationale for recommending which funds should have a performance adjustment component as part of their management fees; (viii) the rationale for any differences between fund fee structures and fee structures in place for other Fidelity clients; and (ix) explanations regarding the relative total expenses borne by certain funds and classes, total expense competitive trends, and actions that might be taken by FMR to reduce total expenses for certain funds and classes.
Annual Report
Board Approval of Investment Advisory Contracts and
Management Fees - continued
Based on its evaluation of all of the conclusions noted above, and after considering all factors it believed relevant, the Board ultimately concluded that the advisory fee structures are fair and reasonable, and that the fund's Advisory Contracts should be renewed.
Annual Report
Investment Adviser
Fidelity Management & Research Company
Boston, MA
Investment Sub-Advisers
FMR Co., Inc.
Fidelity Research & Analysis Company
Fidelity Management & Research
(U.K.) Inc.
Fidelity Management & Research
(Hong Kong) Limited
Fidelity Management & Research
(Japan) Inc.
General Distributor
Fidelity Distributors Corporation
Boston, MA
Transfer and Service Agents
Fidelity Investments Institutional
Operations Company, Inc.
Boston, MA
Fidelity Service Company, Inc.
Boston, MA
Custodian
Brown Brothers Harriman & Co.
Boston, MA
ASCS-UANN-1210
1.843150.103
(Fidelity Investment logo)(registered trademark)
Fidelity AdvisorSM
Stock Selector Small Cap
Fund - Institutional Class
(formerly Fidelity Advisor Small Cap
Independence Fund)
Annual Report
October 31, 2010
(2_fidelity_logos) (Registered_Trademark)
Institutional Class is a
class of Fidelity® Stock Selector Small Cap Fund
Contents
Chairman's Message | <Click Here> | The Chairman's message to shareholders. |
Performance | <Click Here> | How the fund has done over time. |
Management's Discussion of Fund Performance | <Click Here> | The Portfolio Manager's review of fundperformance and strategy. |
Shareholder Expense Example | <Click Here> | An example of shareholder expenses. |
Investment Changes | <Click Here> | A summary of major shifts in the fund's investments over the past six months. |
Investments | <Click Here> | A complete list of the fund's investments with their market values. |
Financial Statements | <Click Here> | Statements of assets and liabilities, operations, and changes in net assets,
as well as financial highlights. |
Notes | <Click Here> | Notes to the financial statements. |
Report of Independent Registered Public Accounting Firm | <Click Here> | |
Trustees and Officers | <Click Here> | |
Distributions | <Click Here> | |
Board Approval of Investment Advisory Contracts and Management Fees | <Click Here> | |
To view a fund's proxy voting guidelines and proxy voting record for the 12-month period ended June 30, visit http://www.fidelity.com/proxyvotingresults or visit the Securities and Exchange Commission's (SEC) web site at http://www.sec.gov. You may also call 1-877-208-0098 to request a free copy of the proxy voting guidelines.
Standard & Poor's, S&P and S&P 500 are registered service marks of The McGraw-Hill Companies, Inc. and have been licensed for use by Fidelity Distributors Corporation.
Other third party marks appearing herein are the property of their respective owners.
All other marks appearing herein are registered or unregistered trademarks or service marks of FMR LLC or an affiliated company.
Annual Report
This report and the financial statements contained herein are submitted for the general information of the shareholders of the fund. This report is not authorized for distribution to prospective investors in the fund unless preceded or accompanied by an effective prospectus.
A fund files its complete schedule of portfolio holdings with the SEC for the first and third quarters of each fiscal year on Form N-Q. Forms N-Q are available on the SEC's web site at http://www.sec.gov. A fund's Forms N-Q may be reviewed and copied at the SEC's Public Reference Room in Washington, DC. Information regarding the operation of the SEC's Public Reference Room may be obtained by calling 1-800-SEC-0330. For a complete list of a fund's portfolio holdings, view the most recent holdings listing, semiannual report, or annual report on Fidelity's web site at http://www.fidelity.com or http://www.advisor.fidelity.com, as applicable.
NOT FDIC INSURED • MAY LOSE VALUE • NO BANK GUARANTEE
Neither the fund nor Fidelity Distributors Corporation is a bank.
Annual Report
(photo_of_Edward_C_Johnson_3d)
Dear Shareholder:
Equities have staged a rally in the second half of 2010, shaking off concerns about the European debt crisis and the possibility of a double-dip recession in the U.S. Although the short-term surge pushed major equity indexes back into positive territory for the year, several questions remain about the longer-term outlook, including lackluster economic growth and persistently high unemployment. Financial markets are always unpredictable, of course, but there also are several time-tested investment principles that can help put the odds in your favor.
One of the basic tenets is to invest for the long term. Over time, riding out the markets' inevitable ups and downs has proven much more effective than selling into panic or chasing the hottest trend. Even missing only a few of the markets' best days can significantly diminish investor returns. Patience also affords the benefits of compounding - of earning interest on additional income or reinvested dividends and capital gains. There can be tax advantages and cost benefits to consider as well. While staying the course doesn't eliminate risk, it can considerably lessen the effect of short-term declines.
You can further manage your investing risk through diversification. And today, more than ever, geographic diversification should be taken into account. Studies indicate that asset allocation is the single most important determinant of a portfolio's long-term success. The right mix of stocks, bonds and cash - aligned to your particular risk tolerance and investment objective - is very important. Age-appropriate rebalancing is also an essential aspect of asset allocation. For younger investors, an emphasis on equities - which historically have been the best-performing asset class over time - is encouraged. As investors near their specific goal, such as retirement or sending a child to college, consideration may be given to replacing volatile assets (e.g. common stocks) with more-stable fixed investments (bonds or savings plans).
A third principle - investing regularly - can help lower the average cost of your purchases. Investing a certain amount of money each month or quarter helps ensure you won't pay for all your shares at market highs. This strategy - known as dollar cost averaging - also reduces "emotion" from investing, helping shareholders avoid selling weak performers just prior to an upswing, or chasing a hot performer just before a correction.
We invite you to contact us via the Internet, through our Investor Centers or by phone. It is our privilege to provide you the information you need to make the investments that are right for you.
Sincerely,
(The chairman's signature appears here.)
Edward C. Johnson 3d
Annual Report
Average annual total return reflects the change in the value of an investment, assuming reinvestment of the class' distributions from dividend income and capital gains (the profits earned upon the sale of securities that have grown in value, if any) and assuming a constant rate of performance each year. The $10,000 table and the fund's returns do not reflect the deduction of taxes that a shareholder would pay on fund distributions or the redemption of fund shares. During periods of reimbursement by Fidelity, a fund's total return will be greater than it would be had the reimbursement not occurred. How a fund did yesterday is no guarantee of how it will do tomorrow.
Average Annual Total Returns
Periods ended October 31, 2010 | Past 1
year | Past 5
years | Past 10
years |
Institutional ClassA | 29.89% | 1.33% | 4.03% |
A The initial offering of Institutional Class shares took place on May 2, 2007. Returns prior to May 2, 2007 are those of Fidelity® Stock Selector Small Cap Fund, the original class of the fund.
$10,000 Over 10 Years
Let's say hypothetically that $10,000 was invested in Fidelity AdvisorSM Stock Selector Small Cap Fund - Institutional Class on October 31, 2000. The chart shows how the value of your investment would have changed, and also shows how the Russell 2000® Index performed over the same period. The initial offering of Institutional Class took place on May 2, 2007. See above for additional information regarding the performance of Institutional Class.
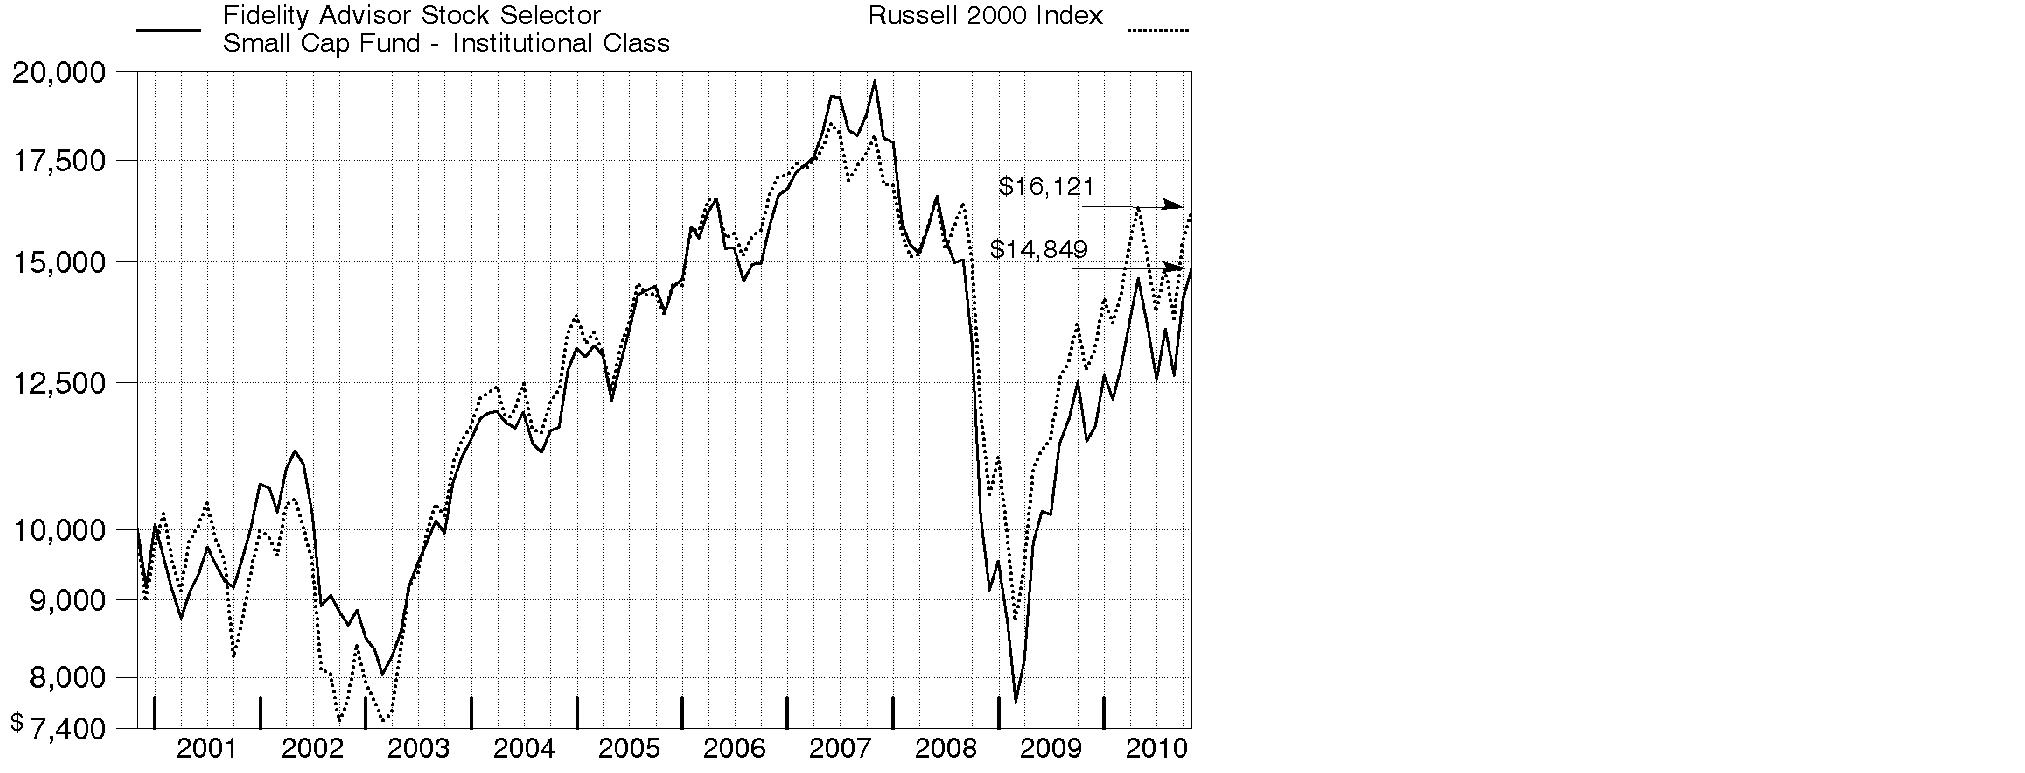
Annual Report
Market Recap: Amid bouts of volatility, major U.S. stock market indexes recorded double-digit gains for the year ending October 31, 2010, lifted by economic optimism, encouraging earnings reports and a wave of corporate mergers. Aside from a January dip, stocks trended upward for the first half of the period amid indications the Great Recession was over. However, in April, lingering high unemployment and heightened concern over European debt sent equities falling. Markets regrouped in July, but fell again in August on mixed economic data. The final two months of the period brought renewed optimism, with the large-cap S&P 500® Index posting its best September/October performance since 1998. For the full 12 months, the S&P 500® rose 16.52%, while the blue-chip-laden Dow Jones Industrial AverageSM added 17.62% and the technology-heavy Nasdaq Composite® Index rose 23.72%. Among market segments, all 10 sectors in the S&P 500 posted gains, with more than half outperforming the broad-market index. Stocks of mid- and small-sized companies surged, with the Russell Midcap® Index adding 27.71% and Russell 2000® Index climbing 26.58%. Looking abroad, debt problems in several European countries cooled gains in developed markets, and yet the MSCI® EAFE® (Europe, Australasia, Far East) Index still rose 8.49%.
Comments from Rayna Lesser and Charles Myers, Co-Portfolio Managers of Fidelity AdvisorSM Stock Selector Small Cap Fund: For the year ending October 31, 2010, the fund's Class A, Class T, Class B and Class C shares returned 29.32%, 29.08%, 28.40% and 28.30%, respectively (excluding sales charges), solidly outpacing the Russell 2000. The fund adopted a multi-manager structure at the beginning of the period, allocating assets in a sector-neutral manner among a team of sector portfolio managers. Most of the fund's outperformance came from strong stock selection, particularly within consumer staples, materials and energy. Good picks in health care and pockets of consumer discretionary also provided a boost, as did favorable positioning within financials - specifically banks - among other sectors. Our top individual contributors included gold producer Red Back Mining - which was acquired during the period - flash-memory-card maker SanDisk, auto-emission control product manufacturer Tenneco and real estate services firm Jones Lang LaSalle. Conversely, stock selection in retailing and industrials notably detracted from results. Fourlis Holdings, owner of the Greek franchise of Swedish furnishing group Ikea, was the biggest individual detractor, followed by lender Washington Federal and pharmacy benefit manager BioScrip. Some stocks mentioned were out-of-benchmark positions, and some were sold by period end.
Comments from Rayna Lesser and Charles Myers, Co-Portfolio Managers of Fidelity AdvisorSM Stock Selector Small Cap Fund: For the year ending October 31, 2010, the fund's Institutional Class shares returned 29.89%, solidly outpacing the Russell 2000. The fund adopted a multi-manager structure at the beginning of the period, allocating assets in a sector-neutral manner among a team of sector portfolio managers. Most of the fund's outperformance came from strong stock selection, particularly within consumer staples, materials and energy. Good picks in health care and pockets of consumer discretionary also provided a boost, as did favorable positioning within financials - specifically banks - among other sectors. Our top individual contributors included gold producer Red Back Mining - which was acquired during the period - flash-memory-card maker SanDisk, auto-emission control product manufacturer Tenneco and real estate services firm Jones Lang LaSalle. Conversely, stock selection in retailing and industrials notably detracted from results. Fourlis Holdings, owner of the Greek franchise of Swedish furnishing group Ikea, was the biggest individual detractor, followed by lender Washington Federal and pharmacy benefit manager BioScrip. Some stocks mentioned were out-of-benchmark positions, and some were sold by period end.
Annual Report
The views expressed above reflect those of the portfolio manager(s) only through the end of the period as stated on the cover of this report and do not necessarily represent the views of Fidelity or any other person in the Fidelity organization. Any such views are subject to change at any time based upon market or other conditions and Fidelity disclaims any responsibility to update such views. These views may not be relied on as investment advice and, because investment decisions for a Fidelity fund are based on numerous factors, may not be relied on as an indication of trading intent on behalf of any Fidelity fund.
Annual Report
Shareholder Expense Example
As a shareholder of the Fund, you incur two types of costs: (1) transaction costs, including sales charges (loads) on purchase payments or redemption proceeds, redemption fees, and (2) ongoing costs, including management fees, distribution and/or service (12b-1) fees and other Fund expenses. This Example is intended to help you understand your ongoing costs (in dollars) of investing in the Fund and to compare these costs with the ongoing costs of investing in other mutual funds.
The Example is based on an investment of $1,000 invested at the beginning of the period and held for the entire period (May 1, 2010 to October 31, 2010).
Actual Expenses
The first line of the accompanying table for each class of the Fund provides information about actual account values and actual expenses. You may use the information in this line, together with the amount you invested, to estimate the expenses that you paid over the period. Simply divide your account value by $1,000.00 (for example, an $8,600 account value divided by $1,000.00 = 8.6), then multiply the result by the number in the first line for a class of the Fund under the heading entitled "Expenses Paid During Period" to estimate the expenses you paid on your account during this period. A small balance maintenance fee of $12.00 that is charged once a year may apply for certain accounts with a value of less than $2,000. This fee is not included in the table below. If it was, the estimate of expenses you paid during the period would be higher, and your ending account value lower, by this amount. In addition, the Fund, as a shareholder in the underlying Fidelity Central Funds, will indirectly bear its pro-rata share of the fees and expenses incurred by the underlying Fidelity Central Funds. These fees and expenses are not included in the Fund's annualized expense ratio used to calculate the expense estimate in the table below.
Hypothetical Example for Comparison Purposes
The second line of the accompanying table for each class of the Fund provides information about hypothetical account values and hypothetical expenses based on a Class' actual expense ratio and an assumed rate of return of 5% per year before expenses, which is not the Class' actual return. The hypothetical account values and expenses may not be used to estimate the actual ending account balance or expenses you paid for the period. You may use this information to compare the ongoing costs of investing in the Fund and other funds. To do so, compare this 5% hypothetical example with the 5% hypothetical examples that appear in the shareholder reports of the other funds. A small balance maintenance fee of $12.00 that is charged once a year may apply for certain accounts with a value of less than $2,000. This fee is not included in the table below. If it was, the estimate of expenses you paid during the period would be higher, and your ending account value lower, by this amount. In addition, the Fund, as a shareholder in the underlying Fidelity Central Funds, will indirectly bear its pro-rata share of the fees and expenses incurred by the underlying Fidelity Central Funds. These fees and expenses are not included in the Fund's annualized expense ratio used to calculate the expense estimate in the table below.
Please note that the expenses shown in the table are meant to highlight your ongoing costs only and do not reflect any transaction costs. Therefore, the second line of the table is useful in comparing ongoing costs only, and will not help you determine the relative total costs of owning different funds. In addition, if these transactional costs were included, your costs would have been higher.
Annual Report
| Annualized Expense Ratio | Beginning
Account Value
May 1, 2010 | Ending
Account Value
October 31, 2010 | Expenses Paid
During Period*
May 1, 2010
to October 31, 2010 |
Class A | .99% | | | |
Actual | | $ 1,000.00 | $ 1,011.90 | $ 5.02 |
HypotheticalA | | $ 1,000.00 | $ 1,020.21 | $ 5.04 |
Class T | 1.27% | | | |
Actual | | $ 1,000.00 | $ 1,010.70 | $ 6.44 |
HypotheticalA | | $ 1,000.00 | $ 1,018.80 | $ 6.46 |
Class B | 1.74% | | | |
Actual | | $ 1,000.00 | $ 1,008.30 | $ 8.81 |
HypotheticalA | | $ 1,000.00 | $ 1,016.43 | $ 8.84 |
Class C | 1.74% | | | |
Actual | | $ 1,000.00 | $ 1,008.30 | $ 8.81 |
HypotheticalA | | $ 1,000.00 | $ 1,016.43 | $ 8.84 |
Stock Selector Small Cap | .71% | | | |
Actual | | $ 1,000.00 | $ 1,013.60 | $ 3.60 |
HypotheticalA | | $ 1,000.00 | $ 1,021.63 | $ 3.62 |
Institutional Class | .64% | | | |
Actual | | $ 1,000.00 | $ 1,014.20 | $ 3.25 |
HypotheticalA | | $ 1,000.00 | $ 1,021.98 | $ 3.26 |
A 5% return per year before expenses
* Expenses are equal to each Class' annualized expense ratio, multiplied by the average account value over the period, multiplied by 184/365 (to reflect the one-half year period).
Annual Report
Investment Changes (Unaudited)
Top Ten Stocks as of October 31, 2010 |
| % of fund's
net assets | % of fund's net assets
6 months ago |
Platinum Underwriters Holdings Ltd. | 1.2 | 0.9 |
Forestar Group, Inc. | 1.1 | 1.2 |
CapitalSource, Inc. | 1.1 | 1.0 |
Tenneco, Inc. | 1.1 | 0.9 |
Affiliated Managers Group, Inc. | 1.0 | 0.9 |
National Penn Bancshares, Inc. | 1.0 | 1.1 |
Alexandria Real Estate Equities, Inc. | 1.0 | 1.1 |
Tempur-Pedic International, Inc. | 1.0 | 0.8 |
Franklin Street Properties Corp. | 1.0 | 0.0 |
Waddell & Reed Financial, Inc. Class A | 1.0 | 1.2 |
| 10.5 | |
Top Five Market Sectors as of October 31, 2010 |
| % of fund's
net assets | % of fund's net assets
6 months ago |
Information Technology | 21.0 | 18.7 |
Financials | 19.9 | 20.4 |
Consumer Discretionary | 14.2 | 15.6 |
Industrials | 13.8 | 14.0 |
Health Care | 12.1 | 13.5 |
Asset Allocation (% of fund's net assets) |
As of October 31, 2010 * | As of April 30, 2010 ** |
| Stocks and
Equity Futures 99.0% | | | Stocks and
Equity Futures 99.5% | |
| Short-Term
Investments and
Net Other Assets 1.0% | | | Short-Term
Investments and
Net Other Assets 0.5% | |
* Foreign investments | 7.7% | | ** Foreign investments | 8.5% | |
Annual Report
Investments October 31, 2010
Showing Percentage of Net Assets
Common Stocks - 98.9% |
| Shares | | Value (000s) |
CONSUMER DISCRETIONARY - 14.2% |
Auto Components - 1.5% |
BorgWarner, Inc. (a) | 105,200 | | $ 5,903 |
Tenneco, Inc. (a) | 462,100 | | 15,074 |
| | 20,977 |
Diversified Consumer Services - 0.2% |
Bridgepoint Education, Inc. (a)(d) | 231,342 | | 3,294 |
Hotels, Restaurants & Leisure - 1.9% |
Red Robin Gourmet Burgers, Inc. (a) | 135,000 | | 2,741 |
Vail Resorts, Inc. (a)(d) | 207,700 | | 8,424 |
WMS Industries, Inc. (a) | 155,700 | | 6,793 |
Wyndham Worldwide Corp. | 315,315 | | 9,065 |
| | 27,023 |
Household Durables - 2.6% |
iRobot Corp. (a) | 308,470 | | 6,441 |
Meritage Homes Corp. (a) | 448,000 | | 8,203 |
Mohawk Industries, Inc. (a) | 145,500 | | 8,343 |
Tempur-Pedic International, Inc. (a) | 402,546 | | 13,888 |
| | 36,875 |
Media - 0.6% |
Lamar Advertising Co. Class A (a) | 253,400 | | 8,613 |
Multiline Retail - 0.9% |
Dollarama, Inc. | 282,934 | | 7,457 |
Retail Ventures, Inc. (a) | 340,299 | | 4,625 |
| | 12,082 |
Specialty Retail - 4.5% |
Cabela's, Inc. Class A (a)(d) | 525,662 | | 9,746 |
Fourlis Holdings SA | 519,230 | | 4,963 |
Gymboree Corp. (a) | 168,000 | | 10,930 |
RadioShack Corp. (d) | 398,100 | | 8,014 |
Shoe Carnival, Inc. (a) | 468,347 | | 10,725 |
Signet Jewelers Ltd. (a) | 242,900 | | 8,545 |
Ulta Salon, Cosmetics & Fragrance, Inc. (a) | 272,619 | | 8,367 |
West Marine, Inc. (a)(d) | 273,200 | | 2,680 |
| | 63,970 |
Textiles, Apparel & Luxury Goods - 2.0% |
Deckers Outdoor Corp. (a) | 93,467 | | 5,430 |
Common Stocks - continued |
| Shares | | Value (000s) |
CONSUMER DISCRETIONARY - continued |
Textiles, Apparel & Luxury Goods - continued |
G-III Apparel Group Ltd. (a) | 451,300 | | $ 11,914 |
Phillips-Van Heusen Corp. | 167,200 | | 10,256 |
| | 27,600 |
TOTAL CONSUMER DISCRETIONARY | | 200,434 |
CONSUMER STAPLES - 3.2% |
Beverages - 0.4% |
Hansen Natural Corp. (a) | 116,900 | | 5,986 |
Food & Staples Retailing - 0.8% |
BJ's Wholesale Club, Inc. (a) | 145,700 | | 6,080 |
United Natural Foods, Inc. (a) | 142,126 | | 5,082 |
| | 11,162 |
Food Products - 1.2% |
Chiquita Brands International, Inc. (a) | 442,770 | | 5,876 |
Green Mountain Coffee Roasters, Inc. (a)(d) | 222,903 | | 7,354 |
J&J Snack Foods Corp. | 34,708 | | 1,488 |
Lance, Inc. | 89,223 | | 2,029 |
| | 16,747 |
Personal Products - 0.8% |
Elizabeth Arden, Inc. (a) | 390,155 | | 7,979 |
Nutraceutical International Corp. (a) | 185,112 | | 3,008 |
| | 10,987 |
TOTAL CONSUMER STAPLES | | 44,882 |
ENERGY - 5.0% |
Energy Equipment & Services - 1.5% |
Complete Production Services, Inc. (a) | 257,429 | | 6,032 |
Newpark Resources, Inc. (a) | 908,472 | | 5,342 |
Superior Energy Services, Inc. (a) | 245,400 | | 6,778 |
Willbros Group, Inc. (a) | 429,700 | | 3,807 |
| | 21,959 |
Oil, Gas & Consumable Fuels - 3.5% |
Atlas Pipeline Partners, LP | 489,813 | | 9,693 |
Berry Petroleum Co. Class A | 249,100 | | 8,522 |
Cloud Peak Energy, Inc. | 475,000 | | 8,251 |
EXCO Resources, Inc. | 334,000 | | 4,953 |
Common Stocks - continued |
| Shares | | Value (000s) |
ENERGY - continued |
Oil, Gas & Consumable Fuels - continued |
SM Energy Co. | 228,668 | | $ 9,531 |
Whiting Petroleum Corp. (a) | 83,065 | | 8,343 |
| | 49,293 |
TOTAL ENERGY | | 71,252 |
FINANCIALS - 19.9% |
Capital Markets - 2.9% |
Affiliated Managers Group, Inc. (a) | 165,400 | | 14,160 |
optionsXpress Holdings, Inc. (a) | 796,600 | | 12,722 |
Waddell & Reed Financial, Inc. Class A | 471,600 | | 13,709 |
| | 40,591 |
Commercial Banks - 5.4% |
Associated Banc-Corp. | 951,923 | | 12,061 |
CapitalSource, Inc. | 2,540,800 | | 15,524 |
City National Corp. | 228,400 | | 11,779 |
National Penn Bancshares, Inc. | 2,180,900 | | 14,154 |
PacWest Bancorp | 587,900 | | 10,247 |
TCF Financial Corp. | 990,800 | | 13,039 |
| | 76,804 |
Diversified Financial Services - 0.4% |
Gimv NV | 102,300 | | 5,655 |
Insurance - 3.7% |
Alterra Capital Holdings Ltd. | 521,700 | | 10,538 |
Amerisafe, Inc. (a) | 661,800 | | 12,634 |
Endurance Specialty Holdings Ltd. | 321,300 | | 13,302 |
Platinum Underwriters Holdings Ltd. | 376,100 | | 16,185 |
| | 52,659 |
Real Estate Investment Trusts - 4.0% |
Alexandria Real Estate Equities, Inc. (d) | 189,900 | | 13,954 |
Franklin Street Properties Corp. | 1,033,200 | | 13,793 |
Highwoods Properties, Inc. (SBI) | 245,300 | | 8,127 |
Home Properties, Inc. | 182,361 | | 9,930 |
National Retail Properties, Inc. | 377,100 | | 10,219 |
| | 56,023 |
Real Estate Management & Development - 2.0% |
Forestar Group, Inc. (a) | 914,700 | | 15,641 |
Jones Lang LaSalle, Inc. | 156,900 | | 12,248 |
| | 27,889 |
Common Stocks - continued |
| Shares | | Value (000s) |
FINANCIALS - continued |
Thrifts & Mortgage Finance - 1.5% |
Astoria Financial Corp. | 736,000 | | $ 9,141 |
Washington Federal, Inc. | 767,300 | | 11,533 |
| | 20,674 |
TOTAL FINANCIALS | | 280,295 |
HEALTH CARE - 12.1% |
Biotechnology - 3.4% |
Allos Therapeutics, Inc. (a)(d) | 854,912 | | 3,403 |
Amarin Corp. PLC ADR (a)(d) | 616,430 | | 1,886 |
Anadys Pharmaceuticals, Inc. (a) | 1,008,358 | | 1,462 |
ARIAD Pharmaceuticals, Inc. (a) | 1,069,718 | | 3,937 |
ArQule, Inc. (a) | 413,558 | | 2,283 |
BioMarin Pharmaceutical, Inc. (a) | 140,400 | | 3,673 |
Dynavax Technologies Corp. (a) | 1,428,141 | | 2,599 |
Incyte Corp. (a) | 242,220 | | 4,035 |
Inhibitex, Inc. (a) | 602,137 | | 1,198 |
Keryx Biopharmaceuticals, Inc. (a)(d) | 626,557 | | 3,233 |
Lexicon Pharmaceuticals, Inc. (a) | 1,690,152 | | 2,992 |
Metabolix, Inc. (a)(d) | 134,798 | | 1,882 |
Pharmasset, Inc. (a) | 64,200 | | 2,408 |
SIGA Technologies, Inc. (a) | 175,887 | | 2,331 |
Targacept, Inc. (a) | 137,359 | | 3,401 |
Telik, Inc. (a) | 965,343 | | 791 |
Theravance, Inc. (a) | 162,434 | | 3,310 |
ZIOPHARM Oncology, Inc. (a)(d) | 724,202 | | 3,121 |
| | 47,945 |
Health Care Equipment & Supplies - 2.4% |
AGA Medical Holdings, Inc. | 47,100 | | 977 |
American Medical Systems Holdings, Inc. (a) | 558,983 | | 11,291 |
Hill-Rom Holdings, Inc. | 151,600 | | 5,875 |
Masimo Corp. | 360,843 | | 10,887 |
Medical Action Industries, Inc. (a) | 58,405 | | 579 |
NxStage Medical, Inc. (a) | 241,876 | | 4,876 |
| | 34,485 |
Health Care Providers & Services - 3.7% |
Air Methods Corp. (a) | 153,822 | | 6,291 |
Alliance Healthcare Services, Inc. (a) | 1,283,435 | | 5,057 |
Centene Corp. (a) | 388,969 | | 8,682 |
Corvel Corp. (a) | 5,200 | | 233 |
Common Stocks - continued |
| Shares | | Value (000s) |
HEALTH CARE - continued |
Health Care Providers & Services - continued |
Hanger Orthopedic Group, Inc. (a) | 248,499 | | $ 4,652 |
HMS Holdings Corp. (a) | 168,314 | | 10,117 |
Humana, Inc. (a) | 150,700 | | 8,784 |
MWI Veterinary Supply, Inc. (a) | 151,000 | | 8,637 |
| | 52,453 |
Life Sciences Tools & Services - 1.2% |
eResearchTechnology, Inc. (a) | 1,004,068 | | 7,651 |
Illumina, Inc. (a) | 176,950 | | 9,610 |
| | 17,261 |
Pharmaceuticals - 1.4% |
Ardea Biosciences, Inc. (a) | 187,205 | | 3,991 |
Cardiome Pharma Corp. (a) | 315,757 | | 1,607 |
Par Pharmaceutical Companies, Inc. (a) | 68,278 | | 2,220 |
Perrigo Co. | 53,218 | | 3,506 |
Piramal Healthcare Ltd. | 70,636 | | 761 |
Questcor Pharmaceuticals, Inc. (a) | 574,319 | | 7,047 |
| | 19,132 |
TOTAL HEALTH CARE | | 171,276 |
INDUSTRIALS - 13.8% |
Aerospace & Defense - 1.1% |
Teledyne Technologies, Inc. (a) | 177,700 | | 7,387 |
Triumph Group, Inc. | 92,820 | | 7,759 |
| | 15,146 |
Air Freight & Logistics - 0.6% |
UTI Worldwide, Inc. | 471,600 | | 9,064 |
Building Products - 1.9% |
A.O. Smith Corp. | 186,326 | | 10,440 |
AAON, Inc. (d) | 294,200 | | 7,223 |
Armstrong World Industries, Inc. (a) | 229,058 | | 9,563 |
| | 27,226 |
Commercial Services & Supplies - 1.2% |
Sykes Enterprises, Inc. (a) | 309,406 | | 5,139 |
United Stationers, Inc. (a) | 203,642 | | 11,445 |
| | 16,584 |
Construction & Engineering - 1.4% |
Chicago Bridge & Iron Co. NV unit (a) | 223,100 | | 5,624 |
Common Stocks - continued |
| Shares | | Value (000s) |
INDUSTRIALS - continued |
Construction & Engineering - continued |
Foster Wheeler AG (a) | 313,272 | | $ 7,337 |
Granite Construction, Inc. | 291,200 | | 7,041 |
| | 20,002 |
Electrical Equipment - 1.3% |
General Cable Corp. (a) | 340,315 | | 9,508 |
Regal-Beloit Corp. | 151,600 | | 8,749 |
| | 18,257 |
Industrial Conglomerates - 0.5% |
Carlisle Companies, Inc. | 202,000 | | 7,084 |
Machinery - 3.4% |
Accuride Corp. (a) | 3,840,500 | | 4,762 |
Actuant Corp. Class A | 418,921 | | 9,413 |
CLARCOR, Inc. | 244,214 | | 9,686 |
Gardner Denver, Inc. | 55,900 | | 3,232 |
John Bean Technologies Corp. | 445,800 | | 7,623 |
Manitowoc Co., Inc. | 613,700 | | 6,837 |
Wabtec Corp. | 132,329 | | 6,198 |
| | 47,751 |
Professional Services - 0.5% |
Advisory Board Co. (a) | 160,116 | | 7,495 |
Road & Rail - 0.5% |
Kansas City Southern (a) | 161,500 | | 7,077 |
Trading Companies & Distributors - 1.4% |
Interline Brands, Inc. (a) | 512,200 | | 10,290 |
WESCO International, Inc. (a) | 207,600 | | 8,889 |
| | 19,179 |
TOTAL INDUSTRIALS | | 194,865 |
INFORMATION TECHNOLOGY - 21.0% |
Communications Equipment - 3.6% |
Blue Coat Systems, Inc. (a) | 296,025 | | 7,984 |
DG FastChannel, Inc. (a) | 298,711 | | 7,035 |
DragonWave, Inc. (a)(d) | 647,000 | | 5,291 |
Emulex Corp. (a) | 968,500 | | 11,041 |
Ixia (a) | 615,692 | | 9,636 |
NETGEAR, Inc. (a) | 311,532 | | 9,598 |
| | 50,585 |
Common Stocks - continued |
| Shares | | Value (000s) |
INFORMATION TECHNOLOGY - continued |
Computers & Peripherals - 2.8% |
NCR Corp. (a) | 468,100 | | $ 6,422 |
Quantum Corp. (a) | 1,776,300 | | 6,004 |
SanDisk Corp. (a) | 168,502 | | 6,332 |
Super Micro Computer, Inc. (a) | 879,447 | | 9,779 |
Synaptics, Inc. (a)(d) | 394,480 | | 10,623 |
| | 39,160 |
Electronic Equipment & Components - 3.2% |
Anixter International, Inc. | 187,200 | | 10,051 |
Avnet, Inc. (a) | 384,730 | | 11,457 |
Electro Scientific Industries, Inc. (a) | 159,398 | | 1,852 |
Jabil Circuit, Inc. | 439,100 | | 6,736 |
Plexus Corp. (a) | 254,178 | | 7,714 |
Vishay Intertechnology, Inc. (a) | 623,863 | | 7,050 |
| | 44,860 |
Internet Software & Services - 3.6% |
Art Technology Group, Inc. (a) | 2,632,439 | | 11,030 |
Constant Contact, Inc. (a) | 192,728 | | 4,433 |
Rackspace Hosting, Inc. (a)(d) | 447,501 | | 11,170 |
Terremark Worldwide, Inc. (a)(d) | 1,249,556 | | 12,483 |
VeriSign, Inc. (a) | 324,591 | | 11,280 |
| | 50,396 |
IT Services - 1.7% |
Alliance Data Systems Corp. (a) | 174,600 | | 10,602 |
Sapient Corp. | 437,497 | | 5,757 |
Wright Express Corp. (a) | 224,599 | | 8,470 |
| | 24,829 |
Semiconductors & Semiconductor Equipment - 2.8% |
Amkor Technology, Inc. (a) | 586,759 | | 4,231 |
MEMC Electronic Materials, Inc. (a) | 436,482 | | 5,596 |
Micron Technology, Inc. (a) | 726,324 | | 6,007 |
Power Integrations, Inc. | 121,917 | | 4,165 |
Standard Microsystems Corp. (a) | 279,490 | | 6,747 |
TriQuint Semiconductor, Inc. (a) | 696,304 | | 7,172 |
Varian Semiconductor Equipment Associates, Inc. (a) | 187,600 | | 6,129 |
| | 40,047 |
Software - 3.3% |
Blackboard, Inc. (a)(d) | 202,540 | | 8,454 |
JDA Software Group, Inc. (a) | 255,593 | | 6,467 |
Kenexa Corp. (a) | 277,035 | | 5,067 |
Common Stocks - continued |
| Shares | | Value (000s) |
INFORMATION TECHNOLOGY - continued |
Software - continued |
Mentor Graphics Corp. (a) | 675,302 | | $ 7,293 |
Nuance Communications, Inc. (a) | 610,100 | | 9,585 |
Parametric Technology Corp. (a) | 390,970 | | 8,394 |
Synchronoss Technologies, Inc. (a) | 38,300 | | 816 |
| | 46,076 |
TOTAL INFORMATION TECHNOLOGY | | 295,953 |
MATERIALS - 5.3% |
Chemicals - 2.4% |
Cabot Corp. | 302,700 | | 10,298 |
Rockwood Holdings, Inc. (a) | 365,700 | | 12,405 |
Solutia, Inc. (a) | 586,500 | | 10,622 |
| | 33,325 |
Construction Materials - 0.3% |
Texas Industries, Inc. (d) | 136,800 | | 4,674 |
Metals & Mining - 2.6% |
Carpenter Technology Corp. | 295,373 | | 10,533 |
Coeur d'Alene Mines Corp. (a) | 328,600 | | 6,772 |
Compass Minerals International, Inc. | 136,600 | | 10,774 |
HudBay Minerals, Inc. | 568,400 | | 8,973 |
| | 37,052 |
TOTAL MATERIALS | | 75,051 |
TELECOMMUNICATION SERVICES - 1.2% |
Diversified Telecommunication Services - 0.9% |
AboveNet, Inc. (a) | 65,207 | | 3,710 |
Cbeyond, Inc. (a) | 188,472 | | 2,554 |
Global Crossing Ltd. (a) | 217,701 | | 2,961 |
PAETEC Holding Corp. (a) | 655,679 | | 2,767 |
| | 11,992 |
Wireless Telecommunication Services - 0.3% |
Syniverse Holdings, Inc. (a) | 140,476 | | 4,283 |
TOTAL TELECOMMUNICATION SERVICES | | 16,275 |
UTILITIES - 3.2% |
Electric Utilities - 1.8% |
Cleco Corp. | 228,300 | | 7,139 |
Common Stocks - continued |
| Shares | | Value (000s) |
UTILITIES - continued |
Electric Utilities - continued |
Great Plains Energy, Inc. | 312,900 | | $ 5,954 |
Otter Tail Corp. | 99,372 | | 2,039 |
Portland General Electric Co. | 201,000 | | 4,201 |
Westar Energy, Inc. | 233,600 | | 5,910 |
| | 25,243 |
Gas Utilities - 1.0% |
Northwest Natural Gas Co. | 118,700 | | 5,851 |
Southwest Gas Corp. | 229,200 | | 7,967 |
| | 13,818 |
Multi-Utilities - 0.4% |
NorthWestern Energy Corp. | 220,200 | | 6,555 |
TOTAL UTILITIES | | 45,616 |
TOTAL COMMON STOCKS (Cost $1,201,387) | 1,395,899 |
U.S. Treasury Obligations - 0.3% |
| Principal Amount (000s) | | |
U.S. Treasury Bills, yield at date of purchase 0.12% to 0.15% 11/4/10 to 11/26/10 (e)
(Cost $3,980) | | $ 3,980 | | 3,980 |
Money Market Funds - 8.2% |
| Shares | | |
Fidelity Cash Central Fund, 0.23% (b) | 45,994,592 | | 45,995 |
Fidelity Securities Lending Cash Central Fund, 0.24% (b)(c) | 69,216,960 | | 69,217 |
TOTAL MONEY MARKET FUNDS (Cost $115,212) | 115,212 |
Cash Equivalents - 0.0% |
| Maturity Amount (000s) | | Value (000s) |
Investments in repurchase agreements in a joint trading account at 0.22%, dated 10/29/10 due 11/1/10 (Collateralized by U.S. Treasury Obligations) #
(Cost $38) | $ 38 | | $ 38 |
TOTAL INVESTMENT PORTFOLIO - 107.4% (Cost $1,320,617) | | 1,515,129 |
NET OTHER ASSETS (LIABILITIES) - (7.4)% | | (103,762) |
NET ASSETS - 100% | $ 1,411,367 |
Futures Contracts |
| Expiration Date | | Underlying Face Amount at Value (000s) | | Unrealized Appreciation/
(Depreciation) (000s) |
Purchased |
Equity Index Contracts |
17 NYFE Russell Mini Index Contracts | Dec. 2010 | | $ 1,194 | | $ (8) |
The face value of futures purchased as a percentage of net assets is 0.1% |
Legend |
(a) Non-income producing |
(b) Affiliated fund that is available only to investment companies and other accounts managed by Fidelity Investments. The rate quoted is the annualized seven-day yield of the fund at period end. A complete unaudited listing of the fund's holdings as of its most recent quarter end is available upon request. In addition, each Fidelity Central Fund's financial statements, which are not covered by the Fund's report of Independent Registered Public Accounting Firm, are available on the SEC's website or upon request. |
(c) Investment made with cash collateral received from securities on loan. |
(d) Security or a portion of the security is on loan at period end. |
(e) Security or a portion of the security was pledged to cover margin requirements for futures contracts. At the period end, the value of securities pledged amounted to $2,500,000. |
# Additional information on each counterparty to the repurchase agreement is as follows: |
Repurchase Agreement / Counterparty | Value
(Amounts in thousands) |
$38,000 due 11/01/10 at 0.22% |
BNP Paribas Securities Corp. | $ 6 |
Barclays Capital, Inc. | 9 |
Credit Agricole Securities (USA), Inc. | 2 |
Credit Suisse Securities (USA) LLC | 2 |
Deutsche Bank Securities, Inc. | 3 |
HSBC Securities (USA), Inc. | 3 |
J.P. Morgan Securities, Inc. | 8 |
Mizuho Securities USA, Inc. | 2 |
Societe Generale, New York Branch | 2 |
UBS Securities LLC | 1 |
Wells Fargo Securities LLC | 0 * |
| $ 38 |
* Amount represents less than $1,000 |
Affiliated Central Funds |
Information regarding fiscal year to date income earned by the Fund from investments in Fidelity Central Funds is as follows: |
Fund | Income earned
(Amounts in thousands) |
Fidelity Cash Central Fund | $ 40 |
Fidelity Securities Lending Cash Central Fund | 968 |
Total | $ 1,008 |
Other Affiliated Issuers |
An affiliated company is a company in which the Fund has ownership of at least 5% of the voting securities. Fiscal year to date transactions with companies which are or were affiliates are as follows: |
Affiliate
(Amounts in thousands) | Value, beginning of period | Purchases | Sales Proceeds | Dividend Income | Value,
end of period |
Carluccio's PLC | $ 5,605 | $ - | $ 4,845 | $ - | $ - |
Conceptus, Inc. | 28,241 | - | 28,343 | - | - |
Diedrich Coffee, Inc. | 7,253 | - | 10,075 | - | - |
Ruth's Hospitality Group, Inc. | 5,602 | - | 4,375 | - | - |
Zale Corp. | 7,613 | - | 4,489 | - | - |
Total | $ 54,314 | $ - | $ 52,127 | $ - | $ - |
Other Information |
The following is a summary of the inputs used, as of October 31, 2010, involving the Fund's assets and liabilities carried at fair value. The inputs or methodology used for valuing securities may not be an indication of the risk associated with investing in those securities. For more information on valuation inputs, and their aggregation into the levels used in the table below, please refer to the Security Valuation section in the accompanying Notes to Financial Statements. |
Valuation Inputs at Reporting Date: |
Description
(Amounts in thousands) | Total | Level 1 | Level 2 | Level 3 |
Investments in Securities: | | | | |
Equities: | | | | |
Consumer Discretionary | $ 200,434 | $ 200,434 | $ - | $ - |
Consumer Staples | 44,882 | 44,882 | - | - |
Energy | 71,252 | 71,252 | - | - |
Financials | 280,295 | 280,295 | - | - |
Health Care | 171,276 | 171,276 | - | - |
Industrials | 194,865 | 194,865 | - | - |
Information Technology | 295,953 | 295,953 | - | - |
Materials | 75,051 | 75,051 | - | - |
Telecommunication Services | 16,275 | 16,275 | - | - |
Utilities | 45,616 | 45,616 | - | - |
U.S. Government and Government Agency Obligations | 3,980 | - | 3,980 | - |
Money Market Funds | 115,212 | 115,212 | - | - |
Cash Equivalents | 38 | - | 38 | - |
Total Investments in Securities: | $ 1,515,129 | $ 1,511,111 | $ 4,018 | $ - |
Derivative Instruments: | | | | |
Liabilities | | | | |
Futures Contracts | $ (8) | $ (8) | $ - | $ - |
Value of Derivative Instruments |
The following table is a summary of the Fund's value of derivative instruments by risk exposure as of October 31, 2010. For additional information on derivative instruments, please refer to the Derivative Instruments section in the accompanying Notes to Financial Statements. |
Risk Exposure /
Derivative Type | Value
(Amounts in thousands) |
| Asset | Liability |
Equity Risk | | |
Futures Contracts (a) | $ - | $ (8) |
Total Value of Derivatives | $ - | $ (8) |
(a) Reflects cumulative appreciation/(depreciation) on futures contracts as disclosed on the Schedule of Investments. Only the period end variation margin is separately disclosed on the Statement of Assets and Liabilities. |
Income Tax Information |
At October 31, 2010, the Fund had a capital loss carryforward of approximately $519,765,000 of which $190,671,000 and $329,094,000 will expire on October 31, 2016 and 2017, respectively. Capital loss carryforwards are only available to offset future capital gains of the Fund to the extent provided by regulations and may be limited. |
See accompanying notes which are an integral part of the financial statements.
Annual Report
Statement of Assets and Liabilities
Amounts in thousands (except per-share amounts) | October 31, 2010 |
| | |
Assets | | |
Investment in securities, at value (including securities loaned of $67,090 and repurchase agreements of $38) - See accompanying schedule: Unaffiliated issuers (cost $1,205,405) | $ 1,399,917 | |
Fidelity Central Funds (cost $115,212) | 115,212 | |
Total Investments (cost $1,320,617) | | $ 1,515,129 |
Receivable for investments sold | | 16,422 |
Receivable for fund shares sold | | 1,608 |
Dividends receivable | | 641 |
Distributions receivable from Fidelity Central Funds | | 85 |
Receivable for daily variation on futures contracts | | 186 |
Other receivables | | 293 |
Total assets | | 1,534,364 |
| | |
Liabilities | | |
Payable to custodian bank | $ 2,664 | |
Payable for investments purchased | 17,105 | |
Payable for fund shares redeemed | 33,118 | |
Accrued management fee | 464 | |
Distribution and service plan fees payable | 2 | |
Other affiliated payables | 358 | |
Other payables and accrued expenses | 69 | |
Collateral on securities loaned, at value | 69,217 | |
Total liabilities | | 122,997 |
| | |
Net Assets | | $ 1,411,367 |
Net Assets consist of: | | |
Paid in capital | | $ 1,735,139 |
Undistributed net investment income | | 2,128 |
Accumulated undistributed net realized gain (loss) on investments and foreign currency transactions | | (520,405) |
Net unrealized appreciation (depreciation) on investments and assets and liabilities in foreign currencies | | 194,505 |
Net Assets | | $ 1,411,367 |
See accompanying notes which are an integral part of the financial statements.
Annual Report
Statement of Assets and Liabilities - continued
Amounts in thousands (except per-share amounts) | October 31, 2010 |
| | |
Calculation of Maximum Offering Price
Class A:
Net Asset Value and redemption price per share
($3,333.26 ÷ 205.718 shares) | | $ 16.20 |
| | |
Maximum offering price per share (100/94.25 of $16.20) | | $ 17.19 |
Class T:
Net Asset Value and redemption price per share
($723.22 ÷ 45.018 shares) | | $ 16.07 |
| | |
Maximum offering price per share (100/96.50 of $16.07) | | $ 16.65 |
Class B:
Net Asset Value and offering price per share
($220.18 ÷ 13.878 shares)A | | $ 15.87 |
| | |
Class C:
Net Asset Value and offering price per share
($820.35 ÷ 51.847 shares)A | | $ 15.82 |
| | |
Stock Selector Small Cap:
Net Asset Value, offering price and redemption price per share ($1,405,590.11 ÷ 85,986.331 shares) | | $ 16.35 |
| | |
Institutional Class:
Net Asset Value, offering price and redemption price per share ($680.18 ÷ 41.509 shares) | | $ 16.39 |
A Redemption price per share is equal to net asset value less any applicable contingent deferred sales charge.
See accompanying notes which are an integral part of the financial statements.
Annual Report
Financial Statements - continued
Statement of Operations
Amounts in thousands | Year ended October 31, 2010 |
| | |
Investment Income | | |
Dividends | | $ 11,311 |
Special dividends | | 1,410 |
Interest | | 26 |
Income from Fidelity Central Funds (including $968 from security lending) | | 1,008 |
Total income | | 13,755 |
| | |
Expenses | | |
Management fee
Basic fee | $ 9,025 | |
Performance adjustment | (3,256) | |
Transfer agent fees | 4,158 | |
Distribution and service plan fees | 20 | |
Accounting and security lending fees | 495 | |
Custodian fees and expenses | 142 | |
Independent trustees' compensation | 9 | |
Registration fees | 95 | |
Audit | 56 | |
Legal | 14 | |
Interest | 1 | |
Miscellaneous | 21 | |
Total expenses before reductions | 10,780 | |
Expense reductions | (154) | 10,626 |
Net investment income (loss) | | 3,129 |
Realized and Unrealized Gain (Loss) Net realized gain (loss) on: | | |
Investment securities: | | |
Unaffiliated issuers | 276,007 | |
Other affiliated issuers | 1,647 | |
Foreign currency transactions | (62) | |
Futures contracts | 2,661 | |
Capital gain distributions from Fidelity Central Funds | 3 | |
Total net realized gain (loss) | | 280,256 |
Change in net unrealized appreciation (depreciation) on: Investment securities | 94,903 | |
Assets and liabilities in foreign currencies | (13) | |
Futures contracts | (8) | |
Total change in net unrealized appreciation (depreciation) | | 94,882 |
Net gain (loss) | | 375,138 |
Net increase (decrease) in net assets resulting from operations | | $ 378,267 |
See accompanying notes which are an integral part of the financial statements.
Annual Report
Statement of Changes in Net Assets
Amounts in thousands | Year ended October 31,
2010 | Year ended October 31,
2009 |
Increase (Decrease) in Net Assets | | |
Operations | | |
Net investment income (loss) | $ 3,129 | $ 2,776 |
Net realized gain (loss) | 280,256 | (315,874) |
Change in net unrealized appreciation (depreciation) | 94,882 | 465,364 |
Net increase (decrease) in net assets resulting
from operations | 378,267 | 152,266 |
Distributions to shareholders from net investment income | (976) | (2,638) |
Share transactions - net increase (decrease) | (349,513) | (62,137) |
Redemption fees | 175 | 136 |
Total increase (decrease) in net assets | 27,953 | 87,627 |
| | |
Net Assets | | |
Beginning of period | 1,383,414 | 1,295,787 |
End of period (including undistributed net investment income of $2,128 and accumulated net investment loss of $0, respectively) | $ 1,411,367 | $ 1,383,414 |
See accompanying notes which are an integral part of the financial statements.
Annual Report
Financial Highlights - Class A
Years ended October 31, | 2010 | 2009 | 2008 | 2007 I |
Selected Per-Share Data | | | | |
Net asset value, beginning of period | $ 12.53 | $ 11.24 | $ 24.79 | $ 23.20 |
Income from Investment Operations | | | | |
Net investment income (loss) E | (.01)L | - K | (.04) | (.07) H |
Net realized and unrealized gain (loss) | 3.68 | 1.31 | (10.77) | 1.66 |
Total from investment operations | 3.67 | 1.31 | (10.81) | 1.59 |
Distributions from net investment income | - K | (.02) | - | - |
Distributions from net realized gain | - | - | (2.74) | - |
Total distributions | - K | (.02) | (2.74) | - |
Redemption fees added to paid in capital E, K | - | - | - | - |
Net asset value, end of period | $ 16.20 | $ 12.53 | $ 11.24 | $ 24.79 |
Total Return B, C, D | 29.32% | 11.69% | (48.52)% | 6.85% |
Ratios to Average Net Assets F, J | | | | |
Expenses before reductions | 1.00% | 1.03% | 1.24% | 1.27% A |
Expenses net of fee waivers, if any | 1.00% | 1.03% | 1.24% | 1.27% A |
Expenses net of all reductions | .99% | 1.01% | 1.23% | 1.26% A |
Net investment income (loss) | (.07)%L | (.03)% | (.24)% | (.57)% A, H |
Supplemental Data | | | | |
Net assets, end of period (in millions) | $ 3 | $ 3 | $ 2 | $ 1 |
Portfolio turnover rate G | 138% | 135% | 101% | 84% |
A Annualized
B Total returns for periods of less than one year are not annualized.
C Total returns would have been lower had certain expenses not been reduced during the periods shown.
D Total returns do not include the effect of the sales charges.
E Calculated based on average shares outstanding during the period.
F Fees and expenses of the underlying Fidelity Central Funds are not included in the Fund's expense ratio. The Fund indirectly bears its proportionate share of the expenses of any underlying Fidelity Central Funds.
G Amount does not include the portfolio activity of any underlying Fidelity Central Funds.
H Investment income per share reflects a special dividend which amounted to $.01 per share. Excluding the special dividend, the ratio of net investment income (loss) to average net assets would have been (.66)%.
I For the period May 2, 2007 (commencement of sale of shares) to October 31, 2007.
J Expense ratios reflect operating expenses of the class. Expenses before reductions do not reflect amounts reimbursed by the investment adviser or reductions from brokerage service arrangements or reductions from other expense offset arrangements and do not represent the amount paid by the class during periods when reimbursements or reductions occur. Expense ratios before reductions for start-up periods may not be representative of longer-term operating periods. Expenses net of fee waivers reflect expenses after reimbursement by the investment adviser but prior to reductions from brokerage service arrangements or other expense offset arrangements. Expenses net of all reductions represent the net expenses paid by the class.
K Amount represents less than $.01 per share.
L Investment income per share reflects a special dividend which amounted to $.01 per share. Excluding the special dividend, the ratio of net investment income (loss) to average net assets would have been (.16)%.
See accompanying notes which are an integral part of the financial statements.
Annual Report
Financial Highlights - Class T
Years ended October 31, | 2010 | 2009 | 2008 | 2007 I |
Selected Per-Share Data | | | | |
Net asset value, beginning of period | $ 12.45 | $ 11.19 | $ 24.74 | $ 23.20 |
Income from Investment Operations | | | | |
Net investment income (loss) E | (.05)L | (.03) | (.08) | (.10) H |
Net realized and unrealized gain (loss) | 3.67 | 1.30 | (10.76) | 1.64 |
Total from investment operations | 3.62 | 1.27 | (10.84) | 1.54 |
Distributions from net investment income | - | (.01) | - | - |
Distributions from net realized gain | - | - | (2.71) | - |
Total distributions | - | (.01) | (2.71) | - |
Redemption fees added to paid in capital E, K | - | - | - | - |
Net asset value, end of period | $ 16.07 | $ 12.45 | $ 11.19 | $ 24.74 |
Total Return B, C, D | 29.08% | 11.42% | (48.70)% | 6.64% |
Ratios to Average Net Assets F, J | | | | |
Expenses before reductions | 1.27% | 1.30% | 1.50% | 1.53% A |
Expenses net of fee waivers, if any | 1.27% | 1.30% | 1.50% | 1.53% A |
Expenses net of all reductions | 1.26% | 1.29% | 1.49% | 1.52% A |
Net investment income (loss) | (.33)%L | (.31)% | (.50)% | (.83)% A, H |
Supplemental Data | | | | |
Net assets, end of period (000 omitted) | $ 723 | $ 550 | $ 409 | $ 420 |
Portfolio turnover rate G | 138% | 135% | 101% | 84% |
A Annualized
B Total returns for periods of less than one year are not annualized.
C Total returns would have been lower had certain expenses not been reduced during the periods shown.
D Total returns do not include the effect of the sales charges.
E Calculated based on average shares outstanding during the period.
F Fees and expenses of the underlying Fidelity Central Funds are not included in the Fund's expense ratio. The Fund indirectly bears its proportionate share of the expenses of any underlying Fidelity Central Funds.
G Amount does not include the portfolio activity of any underlying Fidelity Central Funds.
H Investment income per share reflects a special dividend which amounted to $.01 per share. Excluding the special dividend, the ratio of net investment income (loss) to average net assets would have been (.92)%.
I For the period May 2, 2007 (commencement of sale of shares) to October 31, 2007.
J Expense ratios reflect operating expenses of the class. Expenses before reductions do not reflect amounts reimbursed by the investment adviser or reductions from brokerage service arrangements or reductions from other expense offset arrangements and do not represent the amount paid by the class during periods when reimbursements or reductions occur. Expense ratios before reductions for start-up periods may not be representative of longer-term operating periods. Expenses net of fee waivers reflect expenses after reimbursement by the investment adviser but prior to reductions from brokerage service arrangements or other expense offset arrangements. Expenses net of all reductions represent the net expenses paid by the class.
K Amount represents less than $.01 per share.
L Investment income per share reflects a special dividend which amounted to $.01 per share. Excluding the special dividend, the ratio of net investment income (loss) to average net assets would have been (.43)%.
See accompanying notes which are an integral part of the financial statements.
Annual Report
Financial Highlights - Class B
Years ended October 31, | 2010 | 2009 | 2008 | 2007 I |
Selected Per-Share Data | | | | |
Net asset value, beginning of period | $ 12.36 | $ 11.15 | $ 24.69 | $ 23.20 |
Income from Investment Operations | | | | |
Net investment income (loss) E | (.12)L | (.08) | (.17) | (.15) H |
Net realized and unrealized gain (loss) | 3.63 | 1.30 | (10.73) | 1.64 |
Total from investment operations | 3.51 | 1.22 | (10.90) | 1.49 |
Distributions from net investment income | - | (.01) | - | - |
Distributions from net realized gain | - | - | (2.64) | - |
Total distributions | - | (.01) | (2.64) | - |
Redemption fees added to paid in capital E, K | - | - | - | - |
Net asset value, end of period | $ 15.87 | $ 12.36 | $ 11.15 | $ 24.69 |
Total Return B, C, D | 28.40% | 10.92% | (48.94)% | 6.42% |
Ratios to Average Net Assets F, J | | | | |
Expenses before reductions | 1.76% | 1.77% | 1.99% | 2.07% A |
Expenses net of fee waivers, if any | 1.76% | 1.77% | 1.99% | 2.05% A |
Expenses net of all reductions | 1.75% | 1.75% | 1.99% | 2.04% A |
Net investment income (loss) | (.82)%L | (.78)% | (1.00)% | (1.32)% A, H |
Supplemental Data | | | | |
Net assets, end of period (000 omitted) | $ 220 | $ 219 | $ 199 | $ 419 |
Portfolio turnover rate G | 138% | 135% | 101% | 84% |
A Annualized
B Total returns for periods of less than one year are not annualized.
C Total returns would have been lower had certain expenses not been reduced during the periods shown.
D Total returns do not include the effect of the contingent deferred sales charge.
E Calculated based on average shares outstanding during the period.
F Fees and expenses of the underlying Fidelity Central Funds are not included in the Fund's expense ratio. The Fund indirectly bears its proportionate share of the expenses of any underlying Fidelity Central Funds.
G Amount does not include the portfolio activity of any underlying Fidelity Central Funds.
H Investment income per share reflects a special dividend which amounted to $.01 per share. Excluding the special dividend, the ratio of net investment income (loss) to average net assets would have been (1.41)%.
I For the period May 2, 2007 (commencement of sale of shares) to October 31, 2007.
J Expense ratios reflect operating expenses of the class. Expenses before reductions do not reflect amounts reimbursed by the investment adviser or reductions from brokerage service arrangements or reductions from other expense offset arrangements and do not represent the amount paid by the class during periods when reimbursements or reductions occur. Expense ratios before reductions for start-up periods may not be representative of longer-term operating periods. Expenses net of fee waivers reflect expenses after reimbursement by the investment adviser but prior to reductions from brokerage service arrangements or other expense offset arrangements. Expenses net of all reductions represent the net expenses paid by the class.
K Amount represents less than $.01 per share.
L Investment income per share reflects a special dividend which amounted to $.01 per share. Excluding the special dividend, the ratio of net investment income (loss) to average net assets would have been (.92)%.
See accompanying notes which are an integral part of the financial statements.
Annual Report
Financial Highlights - Class C
Years ended October 31, | 2010 | 2009 | 2008 | 2007 I |
Selected Per-Share Data | | | | |
Net asset value, beginning of period | $ 12.33 | $ 11.12 | $ 24.71 | $ 23.20 |
Income from Investment Operations | | | | |
Net investment income (loss) E | (.12)L | (.09) | (.17) | (.15) H |
Net realized and unrealized gain (loss) | 3.61 | 1.31 | (10.72) | 1.66 |
Total from investment operations | 3.49 | 1.22 | (10.89) | 1.51 |
Distributions from net investment income | - | (.01) | - | - |
Distributions from net realized gain | - | - | (2.70) | - |
Total distributions | - | (.01) | (2.70) | - |
Redemption fees added to paid in capital E, K | - | - | - | - |
Net asset value, end of period | $ 15.82 | $ 12.33 | $ 11.12 | $ 24.71 |
Total Return B, C, D | 28.30% | 10.96% | (48.95)% | 6.51% |
Ratios to Average Net Assets F, J | | | | |
Expenses before reductions | 1.75% | 1.76% | 2.00% | 1.98% A |
Expenses net of fee waivers, if any | 1.75% | 1.76% | 2.00% | 1.98% A |
Expenses net of all reductions | 1.74% | 1.75% | 1.99% | 1.97% A |
Net investment income (loss) | (.81)%L | (.77)% | (1.01)% | (1.27)% A, H |
Supplemental Data | | | | |
Net assets, end of period (000 omitted) | $ 820 | $ 428 | $ 183 | $ 294 |
Portfolio turnover rate G | 138% | 135% | 101% | 84% |
A Annualized
B Total returns for periods of less than one year are not annualized.
C Total returns would have been lower had certain expenses not been reduced during the periods shown.
D Total returns do not include the effect of the contingent deferred sales charge.
E Calculated based on average shares outstanding during the period.
F Fees and expenses of the underlying Fidelity Central Funds are not included in the Fund's expense ratio. The Fund indirectly bears its proportionate share of the expenses of any underlying Fidelity Central Funds.
G Amount does not include the portfolio activity of any underlying Fidelity Central Funds.
H Investment income per share reflects a special dividend which amounted to $.01 per share. Excluding the special dividend, the ratio of net investment income (loss) to average net assets would have been (1.36)%.
I For the period May 2, 2007 (commencement of sale of shares) to October 31, 2007.
J Expense ratios reflect operating expenses of the class. Expenses before reductions do not reflect amounts reimbursed by the investment adviser or reductions from brokerage service arrangements or reductions from other expense offset arrangements and do not represent the amount paid by the class during periods when reimbursements or reductions occur. Expense ratios before reductions for start-up periods may not be representative of longer-term operating periods. Expenses net of fee waivers reflect expenses after reimbursement by the investment adviser but prior to reductions from brokerage service arrangements or other expense offset arrangements. Expenses net of all reductions represent the net expenses paid by the class.
K Amount represents less than $.01 per share.
L Investment income per share reflects a special dividend which amounted to $.01 per share. Excluding the special dividend, the ratio of net investment income (loss) to average net assets would have been (.91)%.
See accompanying notes which are an integral part of the financial statements.
Annual Report
Financial Highlights - Stock Selector Small Cap
Years ended October 31, | 2010 | 2009 | 2008 | 2007 | 2006 |
Selected Per-Share Data | | | | | |
Net asset value, beginning of period | $ 12.61 | $ 11.28 | $ 24.81 | $ 22.23 | $ 20.82 |
Income from Investment Operations | | | | | |
Net investment income (loss) B | .03I | .02 | .01 | (.04) E | .07 F |
Net realized and unrealized gain (loss) | 3.72 | 1.33 | (10.82) | 5.01 | 2.75 |
Total from investment operations | 3.75 | 1.35 | (10.81) | 4.97 | 2.82 |
Distributions from net investment income | (.01) | (.02) | - | (.05) | (.07) |
Distributions from net realized gain | - | - | (2.72) | (2.34) | (1.34) |
Total distributions | (.01) | (.02) | (2.72) | (2.39) | (1.41) |
Redemption fees added to paid in capital B, H | - | - | - | - | - |
Net asset value, end of period | $ 16.35 | $ 12.61 | $ 11.28 | $ 24.81 | $ 22.23 |
Total Return A | 29.75% | 12.05% | (48.42)% | 24.42% | 14.08% |
Ratios to Average Net Assets C, G | | | | | |
Expenses before reductions | .73% | .77% | .95% | 1.01% | .86% |
Expenses net of fee waivers, if any | .73% | .77% | .95% | 1.00% | .86% |
Expenses net of all reductions | .72% | .75% | .94% | .99% | .81% |
Net investment income (loss) | .21%I | .22% | .05% | (.20)% E | .32% F |
Supplemental Data | | | | | |
Net assets, end of period (in millions) | $ 1,406 | $ 1,379 | $ 1,292 | $ 2,602 | $ 2,623 |
Portfolio turnover rate D | 138% | 135% | 101% | 84% | 126% |
A Total returns would have been lower had certain expenses not been reduced during the periods shown.
B Calculated based on average shares outstanding during the period.
C Fees and expenses of the underlying Fidelity Central Funds are not included in the Fund's expense ratio. The Fund indirectly bears its proportionate share of the expenses of any underlying Fidelity Central Funds.
D Amount does not include the portfolio activity of any underlying Fidelity Central Funds.
E Investment income per share reflects a special dividend which amounted to $.02 per share. Excluding the special dividend, the ratio of net investment income (loss) to average net assets would have been (.29)%.
F Investment income per share reflects a special dividend which amounted to $.02 per share. Excluding the special dividend, the ratio of net investment income (loss) to average net assets would have been (.22%).
G Expense ratios reflect operating expenses of the class. Expenses before reductions do not reflect amounts reimbursed by the investment adviser or reductions from brokerage service arrangements or reductions from other expense offset arrangements and do not represent the amount paid by the class during periods when reimbursements or reductions occur. Expenses net of fee waivers reflect expenses after reimbursement by the investment adviser but prior to reductions from brokerage service arrangements or other expense offset arrangements. Expenses net of all reductions represent the net expenses paid by the class.
H Amount represents less than $.01 per share.
I Investment income per share reflects a special dividend which amounted to $.01 per share. Excluding the special dividend, the ratio of net investment income (loss) to average net assets would have been .12%.
See accompanying notes which are an integral part of the financial statements.
Annual Report
Financial Highlights - Institutional Class
Years ended October 31, | 2010 | 2009 | 2008 | 2007 H |
Selected Per-Share Data | | | | |
Net asset value, beginning of period | $ 12.63 | $ 11.29 | $ 24.82 | $ 23.20 |
Income from Investment Operations | | | | |
Net investment income (loss) D | .05 K | .04 | .02 | (.03) G |
Net realized and unrealized gain (loss) | 3.72 | 1.32 | (10.82) | 1.65 |
Total from investment operations | 3.77 | 1.36 | (10.80) | 1.62 |
Distributions from net investment income | (.01) | (.02) | - | - |
Distributions from net realized gain | - | - | (2.73) | - |
Total distributions | (.01) | (.02) | (2.73) | - |
Redemption fees added to paid in capitalD, J | - | - | - | - |
Net asset value, end of period | $ 16.39 | $ 12.63 | $ 11.29 | $ 24.82 |
Total Return B, C | 29.89% | 12.14% | (48.36)% | 6.98% |
Ratios to Average Net Assets E, I | | | | |
Expenses before reductions | .63% | .63% | .84% | .94% A |
Expenses net of fee waivers, if any | .63% | .63% | .84% | .94% A |
Expenses net of all reductions | .62% | .62% | .84% | .93% A |
Net investment income (loss) | .31%K | .36% | .15% | (.24)% A, G |
Supplemental Data | | | | |
Net assets, end of period (000 omitted) | $ 680 | $ 413 | $ 376 | $ 162 |
Portfolio turnover rate F | 138% | 135% | 101% | 84% |
A Annualized
B Total returns for periods of less than one year are not annualized.
C Total returns would have been lower had certain expenses not been reduced during the periods shown.
D Calculated based on average shares outstanding during the period.
E Fees and expenses of the underlying Fidelity Central Funds are not included in the Fund's expense ratio. The Fund indirectly bears its proportionate share of the expenses of any underlying Fidelity Central Funds.
F Amount does not include the portfolio activity of any underlying Fidelity Central Funds.
G Investment income per share reflects a special dividend which amounted to $.01 per share. Excluding the special dividend, the ratio of net investment income (loss) to average net assets would have been (.33)%.
H For the period May 2, 2007 (commencement of sale of shares) to October 31, 2007.
I Expense ratios reflect operating expenses of the class. Expenses before reductions do not reflect amounts reimbursed by the investment adviser or reductions from brokerage service arrangements or reductions from other expense offset arrangements and do not represent the amount paid by the class during periods when reimbursements or reductions occur. Expense ratios before reductions for start-up periods may not be representative of longer-term operating periods. Expenses net of fee waivers reflect expenses after reimbursement by the investment adviser but prior to reductions from brokerage service arrangements or other expense offset arrangements. Expenses net of all reductions represent the net expenses paid by the class.
J Amount represents less than $.01 per share.
K Investment income per share reflects a special dividend which amounted to $.01 per share. Excluding the special dividend, the ratio of net investment income (loss) to average net assets would have been .21%.
See accompanying notes which are an integral part of the financial statements.
Annual Report
Notes to Financial Statements
For the period ended October 31, 2010
1. Organization.
Fidelity Stock Selector Small Cap Fund (the Fund) (formerly Fidelity Small Cap Independence Fund) is a fund of Fidelity Capital Trust (the Trust) and is authorized to issue an unlimited number of shares. The Trust is registered under the Investment Company Act of 1940, as amended (the 1940 Act), as an open-end management investment company organized as a Massachusetts business trust. The Fund offers Class A, Class T, Class C, Stock Selector Small Cap and Institutional Class shares, each of which has equal rights as to assets and voting privileges. Effective after the close of business on September 1, 2010, Class B shares were closed to new accounts and additional purchases by existing shareholders. Each class has exclusive voting rights with respect to matters that affect that class. In order to disclose class level financial information dollar amounts presented in the notes are unrounded. Class B shares will automatically convert to Class A shares after a holding period of seven years from the initial date of purchase. Investment income, realized and unrealized capital gains and losses, the common expenses of the Fund, and certain fund-level expense reductions, if any, are allocated on a pro-rata basis to each class based on the relative net assets of each class to the total net assets of the Fund. Each class differs with respect to transfer agent and distribution and service plan fees incurred. Certain expense reductions also differ by class.
2. Investments in Fidelity Central Funds.
The Fund may invest in Fidelity Central Funds, which are open-end investment companies available only to other investment companies and accounts managed by Fidelity Management & Research Company (FMR) and its affiliates. The Fund's Schedule of Investments lists each of the Fidelity Central Funds held as of period end, if any, as an investment of the Fund, but does not include the underlying holdings of each Fidelity Central Fund. As an Investing Fund, the Fund indirectly bears its proportionate share of the expenses of the underlying Fidelity Central Funds.
The Money Market Central Funds seek preservation of capital and current income and are managed by Fidelity Investments Money Management, Inc. (FIMM), an affiliate of FMR.
A complete unaudited list of holdings for each Fidelity Central Fund is available upon request or at the Securities and Exchange Commission (the SEC) web site at www.sec.gov. In addition, the financial statements of the Fidelity Central Funds, which are not covered by the Fund's Report of Independent Registered Public Accounting Firm, are available on the SEC web site or upon request.
Annual Report
Notes to Financial Statements - continued
3. Significant Accounting Policies.
The financial statements have been prepared in conformity with accounting principles generally accepted in the United States of America (GAAP), which require management to make certain estimates and assumptions at the date of the financial statements. Actual results could differ from those estimates. The following summarizes the significant accounting policies of the Fund:
Security Valuation. Investments are valued as of 4:00 p.m. Eastern time on the last calendar day of the period. The Fund uses independent pricing services approved by the Board of Trustees to value its investments. When current market prices or quotations are not readily available or reliable, valuations may be determined in good faith in accordance with procedures adopted by the Board of Trustees. Factors used in determining value may include market or security specific events. The frequency with which these procedures are used cannot be predicted and they may be utilized to a significant extent. The value used for net asset value (NAV) calculation under these procedures may differ from published prices for the same securities.
The Fund categorizes the inputs to valuation techniques used to value its investments into a disclosure hierarchy consisting of three levels as shown below.
Level 1 - quoted prices in active markets for identical investments
Level 2 - other significant observable inputs (including quoted prices for similar investments, interest rates, prepayment speeds, etc.)
Level 3 - unobservable inputs (including the fund's own assumptions based on the best information available)
Changes in valuation techniques may result in transfers in or out of an assigned level within the disclosure hierarchy. The aggregate value of investments by input level, as of October 31, 2010, is included at the end of the Fund's Schedule of Investments. Valuation techniques used to value the Fund's investments by major category are as follows.
Equity securities, including restricted securities, for which market quotations are readily available, are valued at the last reported sale price or official closing price as reported by an independent pricing service on the primary market or exchange on which they are traded and are categorized as Level 1 in the hierarchy. In the event there were no sales during the day or closing prices are not available, securities are valued at the last quoted bid price or may be valued using the last available price and are generally categorized as Level 2 in the hierarchy. For foreign equity securities, when significant market or security specific events arise, comparisons to the valuation of American Depositary Receipts (ADRs), futures contracts, Exchange-traded funds (ETFs) and certain indexes as well as
Annual Report
3. Significant Accounting Policies - continued
Security Valuation - continued
quoted prices for similar securities are used and are categorized as Level 2 in the hierarchy in these circumstances. Utilizing these techniques may result in transfers between Level 1 and Level 2. For restricted equity securities and private placements where observable inputs are limited, assumptions about market activity and risk are used and are categorized as Level 3 in the hierarchy.
Futures contracts are valued at the settlement price established each day by the board of trade or exchange on which they are traded and are categorized as Level 1 in the hierarchy. Investments in open-end mutual funds, including the Fidelity Central Funds, are valued at their closing net asset value each business day and are categorized as Level 1 in the hierarchy. Short-term securities with remaining maturities of sixty days or less for which quotations are not readily available are valued at amortized cost, which approximates fair value and are categorized as Level 2 in the hierarchy.
Foreign Currency. The Fund uses foreign currency contracts to facilitate transactions in foreign-denominated securities. Gains and losses from these transactions may arise from changes in the value of the foreign currency or if the counterparties do not perform under the contracts' terms.
Foreign-denominated assets, including investment securities, and liabilities are translated into U.S. dollars at the exchange rate at period end. Purchases and sales of investment securities, income and dividends received and expenses denominated in foreign currencies are translated into U.S. dollars at the exchange rate in effect on the transaction date.
The effects of exchange rate fluctuations on investments are included with the net realized and unrealized gain (loss) on investment securities. Other foreign currency transactions resulting in realized and unrealized gain (loss) are disclosed separately.
Investment Transactions and Income. For financial reporting purposes, the Fund's investment holdings and NAV include trades executed through the end of the last business day of the period. The NAV per share for processing shareholder transactions is calculated as of the close of business of the New York Stock Exchange (NYSE), normally 4:00 p.m. Eastern time and includes trades executed through the end of the prior business day. Gains and losses on securities sold are determined on the basis of identified cost and may include proceeds received from litigation. Dividend income is recorded on the ex-dividend date, except for certain dividends from foreign securities where the ex-dividend date may have passed, which are recorded as soon as the Fund is informed of the ex-dividend date. Non-cash dividends included in dividend income, if any, are recorded at the fair market value of the securities received. Distributions received on
Annual Report
Notes to Financial Statements - continued
3. Significant Accounting Policies - continued
Investment Transactions and Income - continued
securities that represent a return of capital or capital gain are recorded as a reduction of cost of investments and/or as a realized gain. The Fund estimates the components of distributions received that may be considered return of capital distributions or capital gain distributions. Large, non-recurring dividends recognized by the Fund are presented separately on the Statement of Operations as "Special Dividends" and the impact of these dividends is presented in the Financial Highlights. Interest income and distributions from the Fidelity Central Funds are accrued as earned. Interest income includes coupon interest and amortization of premium and accretion of discount on debt securities. Investment income is recorded net of foreign taxes withheld where recovery of such taxes is uncertain.
Expenses. Most expenses of the Trust can be directly attributed to a fund. Expenses which cannot be directly attributed are apportioned amongst each fund in the Trust. Expense estimates are accrued in the period to which they relate and adjustments are made when actual amounts are known.
Income Tax Information and Distributions to Shareholders. Each year the Fund intends to qualify as a regulated investment company, including distributing substantially all of its taxable income and realized gains under Subchapter M of the Internal Revenue Code and filing its U.S. federal tax return. As a result, no provision for income taxes is required. As of October 31, 2010, the Fund did not have any unrecognized tax benefits in the accompanying financial statements. A fund's federal tax return is subject to examination by the Internal Revenue Service (IRS) for a period of three years. Foreign taxes are provided for based on the Fund's understanding of the tax rules and rates that exist in the foreign markets in which it invests.
Distributions are declared and recorded on the ex-dividend date. Income dividends and capital gain distributions are declared separately for each class. Income and capital gain distributions are determined in accordance with income tax regulations, which may differ from GAAP.
Capital accounts within the financial statements are adjusted for permanent book-tax differences. These adjustments have no impact on net assets or the results of operations. Temporary book-tax differences will reverse in a subsequent period.
Book-tax differences are primarily due to the short-term gain distributions from the Fidelity Central Funds, futures transactions, foreign currency transactions, passive foreign investment companies (PFIC), market discount, partnerships, capital loss carryforwards and losses deferred due to wash sales.
Annual Report
3. Significant Accounting Policies - continued
Income Tax Information and Distributions to Shareholders - continued
The federal tax cost of investment securities and unrealized appreciation (depreciation) as of period end were as follows:
Gross unrealized appreciation | $ 241,615,641 |
Gross unrealized depreciation | (47,750,582) |
Net unrealized appreciation (depreciation) | $ 193,865,059 |
| |
Tax Cost | $ 1,321,264,245 |
The tax-based components of distributable earnings as of period end were as follows:
Undistributed ordinary income | $ 2,128,561 |
Capital loss carryforward | $ (519,765,399) |
Net unrealized appreciation (depreciation) | $ 193,866,512 |
The tax character of distributions paid was as follows:
| October 31, 2010 | October 31, 2009 |
Ordinary Income | $ 975,942 | $ 2,638,469 |
Short-Term Trading (Redemption) Fees. Shares held by investors in the Fund less than 90 days are subject to a redemption fee equal to 1.50% of the net asset value of shares redeemed. All redemption fees, which reduce the proceeds of the shareholder redemption, are retained by the Fund and accounted for as an addition to paid in capital.
4. Operating Policies.
Repurchase Agreements. FMR has received an Exemptive Order from the SEC which permits the Fund and other affiliated entities of FMR to transfer uninvested cash balances into joint trading accounts which are then invested in repurchase agreements. The Fund may also invest directly with institutions in repurchase agreements. Repurchase agreements are collateralized by government or non-government securities. Upon settlement date, collateral is held in segregated accounts with custodian banks and may be obtained in the event of a default of the counterparty. The Fund monitors, on a daily basis, the value of the collateral to ensure it is at least equal to the principal amount of the repurchase agreement (including accrued interest). In the event of a default by the counterparty, realization of the collateral proceeds could be delayed, during which time the value of the collateral may decline.
Annual Report
Notes to Financial Statements - continued
5. Derivative Instruments.
Risk Exposures and the Use of Derivative Instruments. The Fund uses derivative instruments (derivatives), including futures contracts in order to meet its investment objectives. The strategy is to use derivatives to increase returns and to manage exposure to certain risks as defined below. The success of any strategy involving derivatives depends on analysis of numerous economic factors, and if the strategies for investment do not work as intended, the Fund may not achieve its objectives.
The Fund's use of derivatives may increase or decrease its exposure to the following risk:
Equity Risk | Equity risk relates to the fluctuations in the value of financial instruments as a result of changes in market prices (other than those arising from interest rate risk or foreign exchange risk), whether caused by factors specific to an individual investment, its issuer, or all factors affecting all instruments traded in a market or market segment. |
The Fund is also exposed to additional risks from investing in derivatives, such as liquidity risk and counterparty credit risk. Liquidity risk is the risk that the Fund will be unable to sell the derivative in the open market in a timely manner. Counterparty credit risk is the risk that the counterparty will not be able to fulfill its obligation to the Fund. The Fund's maximum risk of loss from counterparty credit risk is generally the aggregate unrealized appreciation and unpaid counterparty fees in excess of any collateral pledged by the counterparty to the Fund. Counterparty risk related to exchange-traded futures contracts is minimal because of the protection provided by the exchange on which they trade. Risk of loss may exceed the amounts recognized in the Statement of Assets and Liabilities.
Futures Contracts. A futures contract is an agreement between two parties to buy or sell a specified underlying instrument for a fixed price at a specified future date. The Fund uses futures contracts to manage its exposure to the stock market.
Upon entering into a futures contract, a fund is required to deposit either cash or securities (initial margin) with a clearing broker in an amount equal to a certain percentage of the face value of the contract. Futures contracts are marked-to-market daily and subsequent payments (variation margin) are made or received by a fund depending on the daily fluctuations in the value of the futures contracts and are recorded as unrealized appreciation or (depreciation). Realized gain or (loss) is recorded upon the expiration or closing of a futures contract.
The underlying face amount at value of open futures contracts at period end is shown in the Schedule of Investments under the caption "Futures Contracts." This amount reflects each contract's exposure to the underlying instrument at period end and is representative of activity for the period. Securities deposited to meet initial margin requirements are identified in the Schedule of Investments. The receivable and/or payable for the variation margin are reflected in the Statement of Assets and Liabilities.
Annual Report
5. Derivative Instruments - continued
Futures Contracts - continued
Certain risks may arise upon entering into futures contracts, including the risk that an illiquid market may limit the ability to close out a futures contract prior to settlement date.
During the period the Fund recognized net realized gain (loss) of $2,661,216 and a change in net unrealized appreciation (depreciation) of ($7,562) related to its investment in futures contracts. These amounts are included in the Statement of Operations.
6. Purchases and Sales of Investments.
Purchases and sales of securities, other than short-term securities, aggregated $1,981,252,095 and $2,313,047,933, respectively.
7. Fees and Other Transactions with Affiliates.
Management Fee. FMR and its affiliates provide the Fund with investment management related services for which the Fund pays a monthly management fee. The management fee is the sum of an individual fund fee rate that is based on an annual rate of .35% of the Fund's average net assets and a group fee rate that averaged .26% during the period. The group fee rate is based upon the average net assets of all the mutual funds advised by FMR. The group fee rate decreases as assets under management increase and increases as assets under management decrease. In addition, the management fee is subject to a performance adjustment (up to a maximum of ± .20% of the Fund's average net assets over a 36 month performance period). The upward or downward adjustment to the management fee is based on the relative investment performance of Stock Selector Small Cap as compared to an appropriate benchmark index. For the period, the total annual management fee rate, including the performance adjustment, was .39% of the Fund's average net assets.
Distribution and Service Plan Fees. In accordance with Rule 12b-1 of the 1940 Act, the Fund has adopted separate Distribution and Service Plans for each class of shares. Certain classes pay Fidelity Distributors Corporation (FDC), an affiliate of FMR, separate Distribution and Service Fees, each of which is based on an annual percentage of each class' average net assets. In addition, FDC may pay financial intermediaries for selling shares of the Fund and providing shareholder support services. For the period, the Distribution and Service Fee rates, total fees and amounts retained by FDC were as follows:
Annual Report
Notes to Financial Statements - continued
7. Fees and Other Transactions with Affiliates - continued
Distribution and Service Plan Fees - continued
| Distribution
Fee | Service
Fee | Total Fees | Retained
by FDC |
Class A | -% | .25% | $ 7,815 | $ 13 |
Class T | .25% | .25% | 3,474 | 5 |
Class B | .75% | .25% | 2,267 | 1,701 |
Class C | .75% | .25% | 6,265 | 2,935 |
| | | $ 19,821 | $ 4,654 |
Sales Load. FDC receives a front-end sales charge of up to 5.75% for selling Class A shares, and 3.50% for selling Class T shares, some of which is paid to financial intermediaries for selling shares of the Fund. FDC receives the proceeds of contingent deferred sales charges levied on Class A, Class T, Class B, and Class C redemptions. These charges depend on the holding period. The deferred sales charges range from 5% to 1% for Class B, 1% for Class C, 1.00% for certain purchases of Class A shares (1.00% to .50% prior to July 12, 2010) and .25% for certain purchases of Class T shares.
For the period, sales charge amounts retained by FDC were as follows:
| Retained
by FDC |
Class A | $ 1,295 |
Class T | 527 |
Class B* | 297 |
Class C* | 66 |
| $ 2,185 |
* When Class B and Class C shares are initially sold, FDC pays commissions from its own resources to financial intermediaries through which the sales are made.
Transfer Agent Fees. Fidelity Investments Institutional Operations Company, Inc. (FIIOC), an affiliate of FMR, is the transfer, dividend disbursing and shareholder servicing agent for each class of the Fund. FIIOC receives account fees and asset-based fees that vary according to the account size and type of account of the shareholders of the respective classes of the Fund. FIIOC pays for typesetting, printing and mailing of shareholder reports, except proxy statements. For the period, transfer agent fees for each class were as follows:
Annual Report
7. Fees and Other Transactions with Affiliates - continued
Transfer Agent Fees - continued
| Amount | % of
Average
Net Assets |
Class A | $ 9,678 | .31 |
Class T | 2,278 | .33 |
Class B | 717 | .32 |
Class C | 1,955 | .31 |
Stock Selector Small Cap | 4,142,036 | .28 |
Institutional Class | 1,046 | .18 |
| $ 4,157,710 | |
Accounting and Security Lending Fees. Fidelity Service Company, Inc. (FSC), an affiliate of FMR, maintains the Fund's accounting records. The accounting fee is based on the level of average net assets for the month. Under a separate contract, FSC administers the security lending program. The security lending fee is based on the number and duration of lending transactions.
Brokerage Commissions. The Fund placed a portion of its portfolio transactions with brokerage firms which are affiliates of the investment adviser. The commissions paid to these affiliated firms were $46,467 for the period.
Interfund Lending Program. Pursuant to an Exemptive Order issued by the SEC, the Fund, along with other registered investment companies having management contracts with FMR, may participate in an interfund lending program. This program provides an alternative credit facility allowing the funds to borrow from, or lend money to, other participating affiliated funds. At period end, there were no interfund loans outstanding. The Fund's activity in this program during the period for which loans were outstanding was as follows:
Borrower or Lender | Average Daily Loan Balance | Weighted Average Interest Rate | Interest
Expense |
Borrower | $ 26,296,000 | .48% | $ 1,398 |
Annual Report
Notes to Financial Statements - continued
8. Committed Line of Credit.
The Fund participates with other funds managed by FMR or an affiliate in a $3.75 billion credit facility (the "line of credit") to be utilized for temporary or emergency purposes to fund shareholder redemptions or for other short-term liquidity purposes. The Fund has agreed to pay commitment fees on its pro-rata portion of the line of credit, which amounted to $5,862 and is reflected in Miscellaneous expenses on the Statement of Operations. During the period, there were no borrowings on this line of credit.
9. Security Lending.
The Fund lends portfolio securities through a lending agent from time to time in order to earn additional income. The lending agent may loan securities to certain qualified borrowers, including Fidelity Capital Markets (FCM), a broker-dealer affiliated with the Fund. On the settlement date of the loan, the Fund receives collateral (in the form of U.S. Treasury obligations, letters of credit and/or cash) against the loaned securities and maintains collateral in an amount not less than 100% of the market value of the loaned securities during the period of the loan. The market value of the loaned securities is determined at the close of business of the Fund and any additional required collateral is delivered to the Fund on the next business day. If the borrower defaults on its obligation to return the securities loaned because of insolvency or other reasons, a fund could experience delays and costs in recovering the securities loaned or in gaining access to the collateral. Any cash collateral received is invested in the Fidelity Securities Lending Cash Central Fund. The value of loaned securities and cash collateral at period end are disclosed on the Fund's Statement of Assets and Liabilities. Security lending income represents the income earned on investing cash collateral, less rebates paid to borrowers and lending agent fees associated with the loan, plus any premium payments received for lending certain types of securities. Security lending income is presented in the Statement of Operations as a component of income from Fidelity Central Funds. During the period, there were no securities loaned to FCM.
10. Expense Reductions.
Many of the brokers with whom FMR places trades on behalf of the Fund provided services to the Fund in addition to trade execution. These services included payments of certain expenses on behalf of the Fund totaling $154,161 for the period.
Annual Report
11. Distributions to Shareholders.
Distributions to shareholders of each class were as follows:
Years ended October 31, | 2010 | 2009 |
From net investment income | | |
Class A | $ 649 | $ 4,025 |
Class T | - | 517 |
Class B | - | 104 |
Class C | - | 117 |
Stock Selector Small Cap | 974,901 | 2,632,884 |
Institutional Class | 392 | 822 |
Total | $ 975,942 | $ 2,638,469 |
12. Share Transactions.
Transactions for each class of shares were as follows:
| Shares | Dollars |
Years ended October 31, | 2010 | 2009 | 2010 | 2009 |
Class A | | | | |
Shares sold | 60,233 | 71,378 | $ 878,328 | $ 788,883 |
Reinvestment of distributions | 48 | 387 | 635 | 3,793 |
Shares redeemed | (69,529) | (67,529) | (1,022,424) | (721,666) |
Net increase (decrease) | (9,248) | 4,236 | $ (143,461) | $ 71,010 |
Class T | | | | |
Shares sold | 27,634 | 15,043 | $ 398,291 | $ 167,984 |
Reinvestment of distributions | - | 52 | - | 513 |
Shares redeemed | (26,782) | (7,474) | (382,007) | (81,545) |
Net increase (decrease) | 852 | 7,621 | $ 16,284 | $ 86,952 |
Class B | | | | |
Shares sold | 2,875 | 12,626 | $ 40,053 | $ 143,810 |
Reinvestment of distributions | - | 10 | - | 101 |
Shares redeemed | (6,748) | (12,734) | (94,173) | (136,707) |
Net increase (decrease) | (3,873) | (98) | $ (54,120) | $ 7,204 |
Class C | | | | |
Shares sold | 24,030 | 26,160 | $ 347,201 | $ 298,029 |
Reinvestment of distributions | - | 11 | - | 107 |
Shares redeemed | (6,890) | (7,946) | (99,553) | (87,470) |
Net increase (decrease) | 17,140 | 18,225 | $ 247,648 | $ 210,666 |
Annual Report
Notes to Financial Statements - continued
12. Share Transactions - continued
| Shares | Dollars |
Years ended October 31, | 2010 | 2009 | 2010 | 2009 |
Stock Selector Small Cap | | | | |
Shares sold | 14,958,012 | 20,943,346 | $ 219,809,002 | $ 222,060,311 |
Reinvestment of distributions | 72,340 | 263,408 | 962,840 | 2,594,575 |
Shares redeemed | (38,394,961) | (26,369,097) | (570,480,008) | (287,151,117) |
Net increase (decrease) | (23,364,609) | (5,162,343) | $ (349,708,166) | $ (62,496,231) |
Institutional Class | | | | |
Shares sold | 13,011 | 6,785 | $ 190,234 | $ 75,484 |
Reinvestment of distributions | 4 | 9 | 53 | 87 |
Shares redeemed | (4,160) | (7,415) | (62,596) | (91,575) |
Net increase (decrease) | 8,855 | (621) | $ 127,691 | $ (16,004) |
13. Other.
The Fund's organizational documents provide former and current trustees and officers with a limited indemnification against liabilities arising in connection with the performance of their duties to the Fund. In the normal course of business, the Fund may also enter into contracts that provide general indemnifications. The Fund's maximum exposure under these arrangements is unknown as this would be dependent on future claims that may be made against the Fund. The risk of material loss from such claims is considered remote.
Annual Report
To the Trustees of Fidelity Capital Trust and Shareholders of Fidelity Stock Selector Small Cap Fund:
We have audited the accompanying statement of assets and liabilities of Fidelity Stock Selector Small Cap Fund, previously Fidelity Small Cap Independence Fund (the Fund), a fund of Fidelity Capital Trust, including the schedule of investments, as of October 31, 2010, and the related statement of operations for the year then ended, the statement of changes in net assets for each of the two years in the period then ended, and the financial highlights for each of the periods presented. These financial statements and financial highlights are the responsibility of the Fund's management. Our responsibility is to express an opinion on these financial statements and financial highlights based on our audits.
We conducted our audits in accordance with standards of the Public Company Accounting Oversight Board (United States). Those standards require that we plan and perform the audit to obtain reasonable assurance about whether the financial statements and financial highlights are free of material misstatement. The Fund is not required to have, nor were we engaged to perform, an audit of its internal control over financial reporting. Our audits included consideration of internal control over financial reporting as a basis for designing audit procedures that are appropriate in the circumstances, but not for the purpose of expressing an opinion on the effectiveness of the Fund's internal control over financial reporting. Accordingly, we express no such opinion. An audit also includes examining, on a test basis, evidence supporting the amounts and disclosures in the financial statements, assessing the accounting principles used and significant estimates made by management, as well as evaluating the overall financial statement presentation. Our procedures included confirmation of securities owned as of October 31, 2010, by correspondence with the custodians and brokers; where replies were not received from brokers, we performed other auditing procedures. We believe that our audits provide a reasonable basis for our opinion.
In our opinion, the financial statements and financial highlights referred to above present fairly, in all material respects, the financial position of Fidelity Stock Selector Small Cap Fund as of October 31, 2010, the results of its operations for the year then ended, the changes in its net assets for each of the two years in the period then ended, and the financial highlights for each of the periods presented, in conformity with accounting principles generally accepted in the United States of America.
/s/ Deloitte & Touche LLP
DELOITTE & TOUCHE LLP
Boston, Massachusetts
December 16, 2010
Annual Report
The Trustees, Member of the Advisory Board, and executive officers of the trust and fund, as applicable, are listed below. The Board of Trustees governs the fund and is responsible for protecting the interests of shareholders. The Trustees are experienced executives who meet periodically throughout the year to oversee the fund's activities, review contractual arrangements with companies that provide services to the fund, oversee management of the risks associated with such activities and contractual arrangements, and review the fund's performance. Except for James C. Curvey, each of the Trustees oversees 221 funds advised by FMR or an affiliate. Mr. Curvey oversees 410 funds advised by FMR or an affiliate.
The Trustees hold office without limit in time except that (a) any Trustee may resign; (b) any Trustee may be removed by written instrument, signed by at least two-thirds of the number of Trustees prior to such removal; (c) any Trustee who requests to be retired or who has become incapacitated by illness or injury may be retired by written instrument signed by a majority of the other Trustees; and (d) any Trustee may be removed at any special meeting of shareholders by a two-thirds vote of the outstanding voting securities of the trust. Each Trustee who is not an interested person (as defined in the 1940 Act) (Independent Trustee), shall retire not later than the last day of the calendar year in which his or her 72nd birthday occurs. The Independent Trustees may waive this mandatory retirement age policy with respect to individual Trustees. The executive officers and Advisory Board Member hold office without limit in time, except that any officer and Advisory Board Member may resign or may be removed by a vote of a majority of the Trustees at any regular meeting or any special meeting of the Trustees. Except as indicated, each individual has held the office shown or other offices in the same company for the past five years.
Experience, Skills, Attributes, and Qualifications of the Fund's Trustees. The Governance and Nominating Committee has adopted a statement of policy that describes the experience, qualifications, attributes, and skills that are necessary and desirable for potential Independent Trustee candidates (Statement of Policy). The Board believes that each Trustee satisfied at the time he or she was initially elected or appointed a Trustee, and continues to satisfy, the standards contemplated by the Statement of Policy. The Governance and Nominating Committee also engages professional search firms to help identify potential Independent Trustee candidates who have the experience, qualifications, attributes, and skills consistent with the Statement of Policy. From time to time, additional criteria based on the composition and skills of the current Independent Trustees, as well as experience or skills that may be appropriate in light of future changes to board composition, business conditions, and regulatory or other developments, have also been considered by the professional search firms and the Governance and Nominating Committee. In addition, the Board takes into account the Trustees' commitment and participation in Board and committee meetings, as well as their leadership of standing and ad hoc committees throughout their tenure.
In determining that a particular Trustee was and continues to be qualified to serve as a Trustee, the Board has considered a variety of criteria, none of which, in isolation, was controlling. The Board believes that, collectively, the Trustees have balanced and diverse experience, qualifications, attributes, and skills, which allow the Board to operate effectively in governing the fund and protecting the interests of shareholders. Information about the specific experience, skills, attributes, and qualifications of each Trustee, which in each case led to the Board's conclusion that the Trustee should serve (or continue to serve) as a trustee of the fund, is provided below.
Annual Report
Board Structure and Oversight Function. Edward C. Johnson 3d is an interested person (as defined in the 1940 Act) and currently serves as Chairman. The Trustees have determined that an interested Chairman is appropriate and benefits shareholders because an interested Chairman has a personal and professional stake in the quality and continuity of services provided to the fund. Independent Trustees exercise their informed business judgment to appoint an individual of their choosing to serve as Chairman, regardless of whether the Trustee happens to be independent or a member of management. The Independent Trustees have determined that they can act independently and effectively without having an Independent Trustee serve as Chairman and that a key structural component for assuring that they are in a position to do so is for the Independent Trustees to constitute a substantial majority for the Board. The Independent Trustees also regularly meet in executive session. Ned C. Lautenbach serves as Chairman of the Independent Trustees and as such (i) acts as a liaison between the Independent Trustees and management with respect to matters important to the Independent Trustees and (ii) with management prepares agendas for Board meetings.
Fidelity funds are overseen by different Boards of Trustees. The fund's Board oversees Fidelity's equity and high income funds and another Board oversees Fidelity's investment-grade bond, money market, and asset allocation funds. The asset allocation funds may invest in Fidelity funds overseen by the fund's Board. The use of separate Boards, each with its own committee structure, allows the Trustees of each group of Fidelity funds to focus on the unique issues of the funds they oversee, including common research, investment, and operational issues. On occasion, the separate Boards establish joint committees to address issues of overlapping consequences for the Fidelity funds overseen by each Board.
The Trustees operate using a system of committees to facilitate the timely and efficient consideration of all matters of importance to the Trustees, the fund, and fund shareholders and to facilitate compliance with legal and regulatory requirements and oversight of the fund's activities and associated risks. The Board, acting through its committees, has charged FMR and its affiliates with (i) identifying events or circumstances the occurrence of which could have demonstrably adverse effects on the fund's business and/or reputation; (ii) implementing processes and controls to lessen the possibility that such events or circumstances occur or to mitigate the effects of such events or circumstances if they do occur; and (iii) creating and maintaining a system designed to evaluate continuously business and market conditions in order to facilitate the identification and implementation processes described in (i) and (ii) above. Because the day-to-day operations and activities of the fund are carried out by or through FMR, its affiliates and other service providers, the fund's exposure to risks is mitigated but not eliminated by the processes overseen by the Trustees. While each of the Board's committees has responsibility for overseeing different aspects of the fund's activities, oversight is exercised primarily through the Operations, Audit, and Compliance Committees. Appropriate personnel, including but not limited to the fund's Chief Compliance Officer (CCO), FMR's internal auditor, the independent accountants, the fund's Treasurer and portfolio management personnel, make periodic reports to the Board's committees, as appropriate. The responsibilities of each committee, including their oversight responsibilities, are described further under "Standing Committees of the Fund's Trustees."
Annual Report
Trustees and Officers - continued
The fund's Statement of Additional Information (SAI) includes more information about the Trustees. To request a free copy, call Fidelity at 1-877-208-0098.
Interested Trustees*:
Correspondence intended for each Trustee who is an interested person may be sent to Fidelity Investments, 82 Devonshire Street, Boston, Massachusetts 02109.
Name, Age; Principal Occupations and Other Relevant Experience+ |
Edward C. Johnson 3d (80) |
| Year of Election or Appointment: 1978 Mr. Johnson is Trustee and Chairman of the Board of Trustees of certain Trusts. Mr. Johnson serves as Chief Executive Officer, Chairman, and a Director of FMR LLC; Chairman and a Director of FMR; Chairman and a Director of Fidelity Research & Analysis Company (FRAC); Chairman and a Director of Fidelity Investments Money Management, Inc.; and Chairman and a Director of FMR Co., Inc. In addition, Mr. Johnson serves as Chairman and Director of FIL Limited. Previously, Mr. Johnson served as President of FMR LLC (2006-2007). |
James C. Curvey (75) |
| Year of Election or Appointment: 2007 Mr. Curvey also serves as Trustee (2007-present) of other investment companies advised by FMR. Mr. Curvey is a Director of Fidelity Investments Money Management, Inc. (2009-present), Director of Fidelity Research & Analysis Co. (2009-present) and Director of FMR and FMR Co., Inc. (2007-present). Mr. Curvey is also Vice Chairman (2007-present) and Director of FMR LLC. In addition, Mr. Curvey serves as an Overseer for the Boston Symphony Orchestra and a member of the Trustees of Villanova University. Previously, Mr. Curvey was the Vice Chairman (2006-2007) and Director (2000-2007) of FMR Corp. |
Annual Report
* Trustees have been determined to be "Interested Trustees" by virtue of, among other things, their affiliation with the trust or various entities under common control with FMR.
+ The information above includes each Trustee's principal occupation during the last five years and other information relating to the experience, attributes, and skills relevant to each Trustee's qualifications to serve as a Trustee, which led to the conclusion that each Trustee should serve as a Trustee for the fund.
Independent Trustees:
Correspondence intended for each Independent Trustee (that is, the Trustees other than the Interested Trustees) may be sent to Fidelity Investments, P.O. Box 55235, Boston, Massachusetts 02205-5235.
Name, Age; Principal Occupations and Other Relevant Experience+ |
Dennis J. Dirks (62) |
| Year of Election or Appointment: 2005 Prior to his retirement in May 2003, Mr. Dirks was Chief Operating Officer and a member of the Board of The Depository Trust & Clearing Corporation (DTCC). He also served as President, Chief Operating Officer, and Board member of The Depository Trust Company (DTC) and President and Board member of the National Securities Clearing Corporation (NSCC). In addition, Mr. Dirks served as Chief Executive Officer and Board member of the Government Securities Clearing Corporation, Chief Executive Officer and Board member of the Mortgage-Backed Securities Clearing Corporation, as a Trustee and a member of the Finance Committee of Manhattan College (2005-2008), and as a Trustee and a member of the Finance Committee of AHRC of Nassau County (2006-2008). Mr. Dirks is a member of the Independent Directors Council (IDC) Governing Council (2010-Present) and Board of Directors for The Brookville Center for Children's Services, Inc. (2009-present). |
Alan J. Lacy (57) |
| Year of Election or Appointment: 2008 Mr. Lacy serves as Senior Adviser (2007-present) of Oak Hill Capital Partners, L.P. (private equity). Mr. Lacy also served as Chief Executive Officer (2000-2005) and Vice Chairman (2005-2006) of Sears Holdings Corporation and Sears, Roebuck and Co. (retail). In addition, Mr. Lacy serves as a member of the Board of Directors of The Western Union Company (global money transfer, 2006-present) and Bristol-Myers Squibb Company (global pharmaceuticals, 2007-present). Mr. Lacy is Chairman (2008-present) and a member (2006-present) of the Board of Trustees of The National Parks Conservation Association. |
Ned C. Lautenbach (66) |
| Year of Election or Appointment: 2000 Mr. Lautenbach is Chairman of the Independent Trustees of the Equity and High Income Funds (2006-present). Mr. Lautenbach currently serves as the Lead Director of the Eaton Corporation Board of Directors (diversified industrial, 1997-present). Mr. Lautenbach is also a member of the Board of Directors of the Philharmonic Center for the Arts in Naples, Florida (1999-present); a member of the Board of Trustees of Fairfield University (2005-present); and a member of the Council on Foreign Relations (1994-present). Previously, Mr. Lautenbach was a Partner/Advisory Partner at Clayton, Dubilier & Rice, Inc. (private equity investment, 1998-2010), as well as a Director of Sony Corporation (2006-2007). |
Joseph Mauriello (66) |
| Year of Election or Appointment: 2008 Prior to his retirement in January 2006, Mr. Mauriello served in numerous senior management positions including Deputy Chairman and Chief Operating Officer (2004-2005), and Vice Chairman of Financial Services (2002-2004) of KPMG LLP US (professional services, 1965-2005). Mr. Mauriello currently serves as a member of the Board of Directors of XL Group plc. (global insurance and re-insurance, 2006-present) and of Arcadia Resources Inc. (health care services and products, 2007-present). Previously, Mr. Mauriello served as a Director of the Hamilton Funds of the Bank of New York (2006-2007). |
Cornelia M. Small (66) |
| Year of Election or Appointment: 2005 Ms. Small is a member of the Board of Directors of the Teagle Foundation (2009-present). Ms. Small is also a member of the Investment Committee, and Chair (2008-present) and a member of the Board of Trustees of Smith College. In addition, Ms. Small serves on the Investment Committee of the Berkshire Taconic Community Foundation (2008-present). Previously, Ms. Small served as Chairperson of the Investment Committee (2002-2008) of Smith College. In addition, Ms. Small served as Chief Investment Officer, Director of Global Equity Investments, and a member of the Board of Directors of Scudder, Stevens & Clark and Scudder Kemper Investments. |
William S. Stavropoulos (71) |
| Year of Election or Appointment: 2002 Mr. Stavropoulos is Vice Chairman of the Independent Trustees of the Equity and High Income Funds (2006-present). Mr. Stavropoulos serves as President and Founder of the Michigan Baseball Foundation, the Great Lakes Loons (2007-present). Mr. Stavropoulos is Chairman Emeritus of the Board of Directors of The Dow Chemical Company, where he previously served in numerous senior management positions, including President, CEO (1995-2000; 2002-2004), Chairman of the Executive Committee (2000-2006), and as a member of the Board of Directors (1990-2006). Currently, Mr. Stavropoulos is Chairman of Univar (global distributor of commodity and specialty chemicals, 2010-present), a Director of Teradata Corporation (data warehousing and technology solutions, 2008-present), Chemical Financial Corporation, Maersk Inc. (industrial conglomerate), Tyco International, Inc. (multinational manufacturing and services, 2007-present), and a member of the Advisory Board for Metalmark Capital (private equity investment, 2005-present). Mr. Stavropoulos is a special advisor to Clayton, Dubilier & Rice, Inc. (private equity investment). In addition, Mr. Stavropoulos is a member of the University of Notre Dame Advisory Council for the College of Science. |
David M. Thomas (61) |
| Year of Election or Appointment: 2008 Previously, Mr. Thomas served as Executive Chairman (2005-2006) and Chairman and Chief Executive Officer (2000-2005) of IMS Health, Inc. (pharmaceutical and healthcare information solutions). In addition, Mr. Thomas serves as a member of the Board of Directors of Fortune Brands, Inc. (consumer products), and Interpublic Group of Companies, Inc. (marketing communication, 2004-present). |
Michael E. Wiley (60) |
| Year of Election or Appointment: 2008 Mr. Wiley also serves as a Director of Asia Pacific Exploration Consolidated (international oil and gas exploration and production, 2008-present). Mr. Wiley serves as a Director of Tesoro Corporation (independent oil refiner and marketer, 2005-present), and a Director of Bill Barrett Corporation (exploration and production, 2005-present). In addition, Mr. Wiley also serves as a Director of Post Oak Bank (privately-held bank, 2004-present). Previously, Mr. Wiley served as a member of the Board of Trustees of the University of Tulsa (2000-2006; 2007-2010), as a Senior Energy Advisor of Katzenbach Partners, LLC (consulting, 2006-2007), as an Advisory Director of Riverstone Holdings (private investment), Chairman, President, and CEO of Baker Hughes, Inc. (oilfield services, 2000-2004), and as Director of Spinnaker Exploration Company (exploration and production, 2001-2005). |
Annual Report
Trustees and Officers - continued
+ The information above includes each Trustee's principal occupation during the last five years and other information relating to the experience, attributes, and skills relevant to each Trustee's qualifications to serve as a Trustee, which led to the conclusion that each Trustee should serve as a Trustee for the fund.
Advisory Board Member and Executive Officers:
Correspondence intended for each executive officer and Peter S. Lynch may be sent to Fidelity Investments, 82 Devonshire Street, Boston, Massachusetts 02109.
Name, Age; Principal Occupation |
Peter S. Lynch (66) |
| Year of Election or Appointment: 2003 Member of the Advisory Board of Fidelity's Equity and High Income Funds. Mr. Lynch is Vice Chairman and a Director of FMR and FMR Co., Inc. In addition, Mr. Lynch serves as a Trustee of Boston College and as the Chairman of the Inner-City Scholarship Fund. Previously, Mr. Lynch served on the Special Olympics International Board of Directors (1997-2006). |
Kenneth B. Robins (41) |
| Year of Election or Appointment: 2008 President and Treasurer of Fidelity's Equity and High Income Funds. Mr. Robins also serves as President and Treasurer (2010-present) and Assistant Treasurer (2009-present) of other Fidelity funds and is an employee of Fidelity Investments (2004-present). Previously, Mr. Robins served as Deputy Treasurer of the Fidelity funds (2005-2008) and Treasurer and Chief Financial Officer of The North Carolina Capital Management Trust: Cash and Term Portfolios (2006-2008). |
Brian B. Hogan (46) |
| Year of Election or Appointment: 2009 Vice President of certain Equity Funds and Vice President of Sector Funds. Mr. Hogan also serves as President of FMR's Equity Division (2009-present). Previously, Mr. Hogan served as Senior Vice President, Equity Research of FMR (2006-2009) and as a portfolio manager. |
Thomas C. Hense (46) |
| Year of Election or Appointment: 2008 or 2010 Vice President of Fidelity's High Income (2008), Small Cap (2008), and Value (2010) Funds. Previously, Mr. Hense served as a portfolio manager for Fidelity's Institutional Money Management Group (Pyramis) (2003-2008). |
Scott C. Goebel (42) |
| Year of Election or Appointment: 2008 Secretary and Chief Legal Officer (CLO) of the Fidelity funds. Mr. Goebel also serves as Secretary and CLO of The North Carolina Capital Management Trust: Cash and Term Portfolio (2008-present); General Counsel, Secretary, and Senior Vice President of FMR (2008-present) and FMR Co., Inc. (2008-present); Deputy General Counsel of FMR LLC; Chief Legal Officer of Fidelity Management & Research (Hong Kong) Limited (2008-present) and Assistant Secretary of Fidelity Management & Research (Japan) Inc. (2008-present), Fidelity Investments Money Management, Inc. (2008-present), Fidelity Management & Research (U.K.) Inc. (2008-present), and Fidelity Research and Analysis Company (2008-present). Previously, Mr. Goebel served as Assistant Secretary of the Funds (2007-2008) and as Vice President and Secretary of Fidelity Distributors Corporation (FDC) (2005-2007). |
William C. Coffey (41) |
| Year of Election or Appointment: 2009 Assistant Secretary of Fidelity's Equity and High Income Funds. Mr. Coffey also serves as Senior Vice President and Deputy General Counsel of FMR LLC (2010-present), and is an employee of Fidelity Investments. Previously, Mr. Coffey served as Vice President and Associate General Counsel of FMR LLC (2005-2009). |
Holly C. Laurent (56) |
| Year of Election or Appointment: 2008 Anti-Money Laundering (AML) Officer of the Fidelity funds. Ms. Laurent also serves as AML Officer of The North Carolina Capital Management Trust: Cash and Term Portfolio (2008-present) and is an employee of Fidelity Investments. Previously, Ms. Laurent was Senior Vice President and Head of Legal for Fidelity Business Services India Pvt. Ltd. (2006-2008), and Senior Vice President, Deputy General Counsel and Group Head for FMR LLC (2005-2006). |
Christine Reynolds (52) |
| Year of Election or Appointment: 2008 Chief Financial Officer of the Fidelity funds. Ms. Reynolds became President of Fidelity Pricing and Cash Management Services (FPCMS) in August 2008. Ms. Reynolds served as Chief Operating Officer of FPCMS (2007-2008). Previously, Ms. Reynolds served as President, Treasurer, and Anti-Money Laundering officer of the Fidelity funds (2004-2007). |
Kenneth A. Rathgeber (63) |
| Year of Election or Appointment: 2004 Chief Compliance Officer of Fidelity's Equity and High Income Funds. Mr. Rathgeber is Chief Compliance Officer of Fidelity Management & Research (Hong Kong) Limited (2008-present), Fidelity Management & Research (Japan) Inc. (2008-present), FMR (2005-present), FMR Co., Inc. (2005-present), Fidelity Management & Research (U.K.) Inc. (2005-present), Fidelity Research & Analysis Company (2005-present), Fidelity Investments Money Management, Inc. (2005-present), Pyramis Global Advisors, LLC (2005-present), and Strategic Advisers, Inc. (2005-present). |
Jeffrey S. Christian (49) |
| Year of Election or Appointment: 2009 Deputy Treasurer of the Fidelity funds. Mr. Christian is an employee of Fidelity Investments. Previously, Mr. Christian served as Chief Financial Officer (2008-2009) of certain Fidelity funds and Senior Vice President of Fidelity Pricing and Cash Management Services (FPCMS) (2004-2009). |
Bryan A. Mehrmann (49) |
| Year of Election or Appointment: 2005 Deputy Treasurer of the Fidelity funds. Mr. Mehrmann is an employee of Fidelity Investments. |
Adrien E. Deberghes (43) |
| Year of Election or Appointment: 2008 Deputy Treasurer of Fidelity's Equity and High Income Funds. Mr. Deberghes also serves as Assistant Treasurer of other Fidelity funds (2010-present) and is an employee of Fidelity Investments (2008-present). Previously, Mr. Deberghes served as Senior Vice President of Mutual Fund Administration at State Street Corporation (2007-2008), Senior Director of Mutual Fund Administration at Investors Bank & Trust (2005-2007), and Director of Finance for Dunkin' Brands (2000-2005). |
Stephanie J. Dorsey (41) |
| Year of Election or Appointment: 2010 Assistant Treasurer of Fidelity's Equity and High Income Funds. Ms. Dorsey also serves as Deputy Treasurer of other Fidelity funds (2008-present) and is an employee of Fidelity Investments (2008-present). Previously, Ms. Dorsey served as Treasurer (2004-2008) of the JPMorgan Mutual Funds and Vice President (2004-2008) of JPMorgan Chase Bank. |
John R. Hebble (52) |
| Year of Election or Appointment: 2009 Assistant Treasurer of Fidelity's Equity and High Income Funds. Mr. Hebble also serves as Treasurer and Chief Financial Officer of The North Carolina Capital Management Trust: Cash and Term Portfolio (2008-present), President and Treasurer of other Fidelity funds (2008-present) and is an employee of Fidelity Investments. |
Gary W. Ryan (52) |
| Year of Election or Appointment: 2005 Assistant Treasurer of the Fidelity funds. Mr. Ryan is an employee of Fidelity Investments. Previously, Mr. Ryan served as Vice President of Fund Reporting in Fidelity Pricing and Cash Management Services (FPCMS) (1999-2005). |
Jonathan Davis (42) |
| Year of Election or Appointment: 2010 Assistant Treasurer of the Fidelity funds. Mr. Davis is an employee of Fidelity Investments. Previously, Mr. Davis served as Vice President and Associate General Counsel of FMR LLC (2003-2010). |
Annual Report
Institutional Class designates 100% of dividends distributed during the fiscal year as qualifying for the dividends-received deduction for corporate shareholders.
Institutional Class designates 100% of dividends distributed in December 2009 during the fiscal year as amounts which may be taken into account as a dividend for purposes of the maximum rate under section 1(h)(11) of the Internal Revenue Code.
The fund will notify shareholders in January 2011 of amounts for use in preparing 2010 income tax returns.
Annual Report
Board Approval of Investment Advisory Contracts and Management Fees
Fidelity Stock Selector Small Cap Fund (formerly known as Fidelity Small Cap Independence Fund)
Each year, the Board of Trustees, including the Independent Trustees (together, the Board), votes on the renewal of the management contract and sub-advisory agreements (together, the Advisory Contracts) for the fund. The Board, assisted by the advice of fund counsel and Independent Trustees' counsel, requests and considers a broad range of information relevant to the renewal of the Advisory Contracts throughout the year.
The Board meets regularly and considers at each of its meetings factors that are relevant to its annual consideration of the renewal of the fund's Advisory Contracts, including the services and support provided to the fund and its shareholders. The Board has established various standing committees, each composed of Independent Trustees with varying backgrounds, to which the Board has assigned specific subject matter responsibilities in order to enhance effective decision-making by the Board. The Board, acting directly and through its Committees, requests and receives information concerning the annual consideration of the renewal of the fund's Advisory Contracts. The Board also meets as needed to consider matters specifically related to the Board's annual consideration of the renewal of Advisory Contracts. Members of the Board may also meet with trustees of other Fidelity funds through ad hoc joint committees to discuss certain matters relevant to the Fidelity funds.
At its July 2010 meeting, the Board of Trustees, including the Independent Trustees, unanimously determined to renew the fund's Advisory Contracts. In reaching its determination, the Board considered all factors it believed relevant, including (i) the nature, extent, and quality of the services to be provided to the fund and its shareholders (including the investment performance of the fund); (ii) the competitiveness of the fund's management fee and total expenses; (iii) the total costs of the services to be provided by and the profits to be realized by Fidelity from its relationship with the fund; (iv) the extent to which economies of scale would be realized as the fund grows; and (v) whether fee levels reflect these economies of scale, if any, for the benefit of fund shareholders.
In considering whether to renew the Advisory Contracts for the fund, the Board reached a determination, with the assistance of fund counsel and Independent Trustees' counsel and through the exercise of its business judgment, that the renewal of the Advisory Contracts is in the best interests of fund shareholders and that the compensation to be received by Fidelity under the management contract is fair and reasonable. The Board's decision to renew the Advisory Contracts was not based on any single factor noted above, but rather was based on a comprehensive consideration of all the information provided to the Board at its meetings throughout the year. The Board, in reaching its determination to renew the Advisory Contracts, is aware that shareholders in the fund have a broad range of investment choices available to them, including a wide choice among mutual funds offered by Fidelity's competitors, and that the fund's shareholders, with the opportunity to review and weigh the disclosure provided by the fund in its prospectus and other public disclosures, have chosen to invest in this fund, managed by Fidelity.
Annual Report
Nature, Extent, and Quality of Services Provided. The Board considered the staffing within the investment adviser, FMR, and the sub-advisers (together, the Investment Advisers), including the backgrounds of the fund's investment personnel and the fund's investment objective and discipline. The Independent Trustees also had discussions with senior management of Fidelity's investment operations and investment groups. The Board considered the structure of the portfolio manager compensation program and whether this structure provides appropriate incentives to act in the best interest of the fund.
Resources Dedicated to Investment Management and Support Services. The Board and the equity research subcommittee of the Board's Fund Oversight Committee reviewed the size, education, and experience of the Investment Advisers' investment staff, their use of technology, and the Investment Advisers' approach to recruiting, training, and retaining portfolio managers and other research, advisory, and management personnel. The Board noted that Fidelity's analysts have access to a variety of technological tools and market and securities data that enable them to perform both fundamental and quantitative analysis and to specialize in various disciplines. The Board considered Fidelity's extensive global research capabilities that enable the Investment Advisers to aggregate data from various sources in an effort to produce positive investment results. The Board also considered that Fidelity's portfolio managers and analysts have access to daily portfolio attribution that allows for monitoring of a fund's portfolio, as well as an electronic communication system that provides immediate real-time access to research concerning issuers and credit enhancers. The Board noted FMR's continued focus on strengthening the organization and discipline of equity portfolio management and research.
Shareholder and Administrative Services. The Board considered (i) the nature, extent, quality, and cost of advisory, administrative, and shareholder services performed by the Investment Advisers and their affiliates under the Advisory Contracts and under separate agreements covering transfer agency, pricing and bookkeeping, and securities lending services for the fund; (ii) the nature and extent of the investment adviser's supervision of third party service providers, principally custodians and subcustodians; and (iii) the resources devoted to, and the record of compliance with, the fund's compliance policies and procedures. The Board also reviewed the allocation of fund brokerage, including allocations to brokers affiliated with the Investment Advisers, the use of brokerage commissions to pay fund expenses, and the use of "soft" commission dollars to pay for research services.
The Board noted that the growth of fund assets over time across the complex allows Fidelity to reinvest in the development of services designed to enhance the value or convenience of the Fidelity funds as investment vehicles. These services include 24-hour access to account information and market information through phone representatives and over the Internet, and investor education materials and asset allocation tools.
Annual Report
Board Approval of Investment Advisory Contracts and
Management Fees - continued
Investment in a Large Fund Family. The Board considered the benefits to shareholders of investing in a Fidelity fund, including the benefits of investing in a fund that is part of a large family of funds offering a variety of investment disciplines and providing a large variety of mutual fund investor services. The Board noted that Fidelity had taken, or had made recommendations that resulted in the Fidelity funds taking, a number of actions over the previous year that benefited particular funds, including (i) dedicating additional resources to investment research and restructuring and broadening the focus of the investment research teams; (ii) bolstering the senior management team that oversees asset management; (iii) launching Class F of certain funds as a lower-fee class available to Freedom K and Freedom Index Funds; (iv) lowering the initial investment minimums and ongoing balance requirements for Real Estate High Income Fund; (v) eliminating subsequent purchase minimums for all funds and adding a waiver of the investment minimum requirement for new accounts opened with the proceeds of a systematic withdrawal plan; (vi) eliminating the withdrawal minimum and maximum limits for systematic withdrawals from Advisor funds; (vii) expanding sales load waivers on Class A shares for Destiny Planholders and expanding Institutional Class eligibility for Class O Destiny Planholders; and (viii) changing certain Class A and Class T sales charge structures to further align them with industry practices.
Investment Performance. The Board considered whether the fund has operated in accordance with its investment objective, as well as its record of compliance with its investment restrictions. It also reviewed the fund's absolute investment performance for each class, as well as the fund's relative investment performance for each class measured over multiple periods against (i) a broad-based securities market index, and (ii) a peer group of mutual funds deemed appropriate by Fidelity and reviewed by the Board. The following charts considered by the Board show, over the one-, three-, and five-year periods ended December 31, 2009, as available, the cumulative total returns of Institutional Class (Class I) and the retail class of the fund, the cumulative total returns of a broad-based securities market index ("benchmark"), and a range of cumulative total returns of a peer group of mutual funds identified by Morningstar, Inc. as having an investment style similar to that of the fund based on underlying portfolio holdings. The box within each chart shows the 25th percentile return (bottom of box) and the 75th percentile return (top of box) of the peer group. Returns shown above the box are in the first quartile and returns shown below the box are in the fourth quartile. The percentage beaten numbers noted below each chart correspond to the percentile box and represent the percentage of funds in the peer group whose performance was equal to or lower than that of the class indicated.
Annual Report
Fidelity Stock Selector Small Cap Fund

The Board reviewed the fund's relative investment performance against its peer group and noted that the performance of the retail class of the fund (the class with the longer performance record) was in the second quartile for the one-year period, the fourth quartile for the three-year period, and the third quartile for the five-year period. The Board also noted that the investment performance of the fund was lower than its benchmark for the three- and five-year periods, although the one-year cumulative total return of the retail class compared favorably to its benchmark. The Board considered that the variations in performance among the fund's classes reflect the variations in class expenses, which result in lower performance for higher expense classes. The Board also reviewed the fund's performance since inception as well as performance in the current year.
The Board also considered that the fund's management fee is subject to upward or downward adjustment depending upon whether, and to what extent, the fund's investment performance for the performance period exceeds, or is exceeded by, the record (over the same period) of a Board-approved performance adjustment index. The Board realizes that the performance adjustment provides FMR with a strong economic incentive to seek to achieve superior performance for the fund's shareholders and helps to more closely align the interests of FMR and the fund's shareholders.
Based on its review, and giving particular weight to the nature and quality of the resources dedicated by the Investment Advisers to maintain and improve relative performance and factoring in the unprecedented market events in recent years, the Board concluded that the nature, extent, and quality of investment management and support services and of shareholder and administrative services provided to the fund will benefit the fund's shareholders, particularly in light of the Board's view that the fund's shareholders benefit from investing in a fund that is part of a large family of funds offering a variety of investment disciplines and services.
Annual Report
Board Approval of Investment Advisory Contracts and
Management Fees - continued
Competitiveness of Management Fee and Total Fund Expenses. The Board considered the fund's management fee and total expenses compared to "mapped groups" of competitive funds and classes. Fidelity creates "mapped groups" by combining similar Lipper investment objective categories that have comparable management fee characteristics. Combining Lipper investment objective categories aids the Board's management fee and total expense comparisons by broadening the competitive group used for comparison and by reducing the number of universes to which various Fidelity funds are compared.
Management Fee. The Board considered two proprietary management fee comparisons for the 12-month periods shown in the chart below. The group of Lipper funds used by the Board for management fee comparisons is referred to below as the "Total Mapped Group." The Total Mapped Group comparison focuses on a fund's standing relative to the total universe of comparable funds available to investors, in terms of gross management fees before expense reimbursements or caps, and without giving effect to the fund's performance adjustment. "TMG %" represents the percentage of funds in the Total Mapped Group that had management fees that were lower than the fund's. For example, a TMG % of 5% means that 95% of the funds in the Total Mapped Group had higher management fees than the fund. The "Asset-Size Peer Group" (ASPG) comparison focuses on a fund's standing relative to non-Fidelity funds similar in size to the fund within the Total Mapped Group. The ASPG represents at least 15% of the funds in the Total Mapped Group with comparable asset size and management fee characteristics, subject to a minimum of 50 funds (or all funds in the Total Mapped Group if fewer than 50). Additional information, such as the ASPG quartile in which the fund's management fee ranked and the impact of the fund's performance adjustment, is also included in the chart and considered by the Board.
Annual Report
Fidelity Stock Selector Small Cap Fund

The Board noted that the fund's management fee ranked below the median of its Total Mapped Group and below the median of its ASPG for 2009. The Board also noted the effect of the fund's negative performance adjustment on the fund's management fee ranking. The Board noted that the performance adjustment for each year represents calculations for performance periods that differ from the periods shown in the performance charts above.
Based on its review, the Board concluded that the fund's management fee is fair and reasonable in light of the services that the fund receives and the other factors considered.
Total Expenses. In its review of each class's total expenses, the Board considered the fund's management fee as well as other fund or class expenses, as applicable, such as transfer agent fees, pricing and bookkeeping fees, fund-paid 12b-1 fees, and custodial, legal, and audit fees. The Board also noted the effects of any waivers and reimbursements on fees and expenses, as well as the impact of the fund's performance adjustment. As part of its review, the Board also considered current and historical total expenses of each class of the fund compared to competitive fund median expenses. Each class of the fund is compared to those funds and classes in the Total Mapped Group (used by the Board for management fee comparisons) that have a similar sales load structure.
The Board noted that the total expenses of each class ranked below its competitive median for 2009.
Fees Charged to Other Fidelity Clients. The Board also considered Fidelity fee structures and other information with respect to clients of FMR and its affiliates, such as other mutual funds advised or subadvised by FMR or its affiliates, pension plan clients, and other institutional clients. In March 2010, the Board created an ad hoc joint committee with the board of other Fidelity funds (the Committee) to review and compare Fidelity's institutional investment advisory business with its business of providing services to the Fidelity funds, including the differences in services provided, fees charged, and costs incurred, as well as competition in their respective marketplaces.
Annual Report
Board Approval of Investment Advisory Contracts and
Management Fees - continued
Based on its review of total expenses and fees charged to other Fidelity clients, the Board concluded that the total expenses of each class of the fund were reasonable in light of the services that the fund and its shareholders receive and the other factors considered, including the findings of the Committee.
Costs of the Services and Profitability. The Board considered the revenues earned and the expenses incurred by Fidelity in conducting the business of developing, marketing, distributing, managing, administering and servicing the fund and its shareholders. The Board also considered the level of Fidelity's profits in respect of all the Fidelity funds.
On an annual basis, FMR presents to the Board Fidelity's profitability for the fund. Fidelity calculates the profitability for each fund, as well as aggregate profitability for groups of Fidelity funds and all Fidelity funds, using a series of detailed revenue and cost allocation methodologies which originate with the audited books and records of Fidelity. The Audit Committee of the Board reviews any significant changes from the prior year's methodologies.
PricewaterhouseCoopers LLP (PwC), independent registered public accounting firm and auditor to Fidelity and certain Fidelity funds, has been engaged annually by the Board as part of the Board's assessment of Fidelity's profitability analysis. PwC's engagement includes the review and assessment of Fidelity's methodologies used in determining the revenues and expenses attributable to Fidelity's mutual fund business, and completion of agreed-upon procedures surrounding the mathematical accuracy of fund profitability and its conformity to allocation methodologies. After considering PwC's reports issued under the engagement and information provided by Fidelity, the Board believes that while other allocation methods may also be reasonable, Fidelity's profitability methodologies are reasonable in all material respects.
The Board has also reviewed Fidelity's non-fund businesses and fall-out benefits related to the mutual fund business as well as cases where Fidelity's affiliates may benefit from or be related to the fund's business.
The Board considered the costs of the services provided by and the profits realized by Fidelity in connection with the operation of the fund and were satisfied that the profitability was not excessive in the circumstances.
Annual Report
Economies of Scale. The Board considered whether there have been economies of scale in respect of the management of the Fidelity funds, whether the Fidelity funds (including the fund) have appropriately benefited from any such economies of scale, and whether there is potential for realization of any further economies of scale. The Board considered the extent to which the fund will benefit from economies of scale through increased services to the fund, through waivers or reimbursements, or through fee or expense reductions.
In February 2009, the Board and the board of other Fidelity funds created an ad hoc committee (the Economies of Scale Committee) to analyze whether FMR attains economies of scale in respect of the management and servicing of the Fidelity funds, whether the Fidelity funds have appropriately benefited from such economies of scale, and whether there is potential for realization of any further economies of scale.
The Board recognized that the fund's management contract incorporates a "group fee" structure, which provides for lower group fee rates as total fund assets under FMR's management increase, and for higher group fee rates as total fund assets under FMR's management decrease. FMR calculates the group fee rates based on a tiered asset "breakpoint" schedule that varies based on asset class. The Board considered that the group fee is designed to deliver the benefits of economies of scale to fund shareholders when total Fidelity fund assets increase, even if assets of any particular fund are unchanged or have declined, because some portion of Fidelity's costs are attributable to services provided to all Fidelity funds, and all funds benefit if those costs can be allocated among more assets. The Board concluded that, given the group fee structure, fund shareholders will benefit from lower management fees as assets under FMR's management increase at the fund complex level, regardless of whether Fidelity achieves any such economies of scale.
The Board concluded, considering the findings of the Economies of Scale Committee, that any potential economies of scale are being appropriately shared between fund shareholders and Fidelity.
Additional Information Requested by the Board. In order to develop fully the factual basis for consideration of the Fidelity funds' Advisory Contracts, the Board requested and received additional information on certain topics, including (i) fund performance trends, actions to be taken by FMR to improve certain funds' overall performance, and Fidelity's long-term strategies for certain funds; (ii) portfolio manager changes that have occurred during the past year and length of portfolio manager tenure for different categories of funds over time; (iii) Fidelity's compensation structure for portfolio managers, research analysts, and other key personnel, the rationale for the compensation structure, and how the compensation structure provides appropriate performance incentives; (iv) the amount of the investment that each portfolio manager has made in the Fidelity fund(s) that he or she manages; (v) management and other fees paid by FMR to affiliated sub-advisers on behalf of the Fidelity funds; (vi) Fidelity's fee structures and rationale for recommending different fees among different categories of funds; (vii) Fidelity's rationale for recommending which funds should have a performance adjustment component as part of their management fees; (viii) the rationale for any differences between fund fee structures and fee structures in place for other Fidelity clients; and (ix) explanations regarding the relative total expenses borne by certain funds and classes, total expense competitive trends, and actions that might be taken by FMR to reduce total expenses for certain funds and classes.
Annual Report
Board Approval of Investment Advisory Contracts and
Management Fees - continued
Based on its evaluation of all of the conclusions noted above, and after considering all factors it believed relevant, the Board ultimately concluded that the advisory fee structures are fair and reasonable, and that the fund's Advisory Contracts should be renewed.
Annual Report
Investment Adviser
Fidelity Management & Research Company
Boston, MA
Investment Sub-Advisers
FMR Co., Inc.
Fidelity Research & Analysis Company
Fidelity Management & Research
(U.K.) Inc.
Fidelity Management & Research
(Hong Kong) Limited
Fidelity Management & Research
(Japan) Inc.
General Distributor
Fidelity Distributors Corporation
Boston, MA
Transfer and Service Agents
Fidelity Investments Institutional
Operations Company, Inc.
Boston, MA
Fidelity Service Company, Inc.
Boston, MA
Custodian
Brown Brothers Harriman & Co.
Boston, MA
ASCSI-UANN-1210
1.843142.103
Fidelity®
Value
Fund
Annual Report
October 31, 2010
(2_fidelity_logos) (Registered_Trademark)
Contents
Chairman's Message | <Click Here> | The Chairman's message to shareholders. |
Performance | <Click Here> | How the fund has done over time. |
Management's Discussion of Fund Performance | <Click Here> | The Portfolio Managers' review of fundperformance and strategy. |
Shareholder Expense Example | <Click Here> | An example of shareholder expenses. |
Investment Changes | <Click Here> | A summary of major shifts in the fund's investments over the past six months. |
Investments | <Click Here> | A complete list of the fund's investments with their market values. |
Financial Statements | <Click Here> | Statements of assets and liabilities, operations, and changes in net assets,
as well as financial highlights. |
Notes | <Click Here> | Notes to the financial statements. |
Report of Independent Registered Public Accounting Firm | <Click Here> | |
Trustees and Officers | <Click Here> | |
Distributions | <Click Here> | |
Board Approval of Investment Advisory Contracts and Management Fees | <Click Here> | |
To view a fund's proxy voting guidelines and proxy voting record for the 12-month period ended June 30, visit http://www.fidelity.com/proxyvotingresults or visit the Securities and Exchange Commission's (SEC) web site at http://www.sec.gov. You may also call 1-800-544-8544 to request a free copy of the proxy voting guidelines.
Standard & Poor's, S&P and S&P 500 are registered service marks of The McGraw-Hill Companies, Inc. and have been licensed for use by Fidelity Distributors Corporation.
Other third party marks appearing herein are the property of their respective owners.
All other marks appearing herein are registered or unregistered trademarks or service marks of FMR LLC or an affiliated company.
Annual Report
This report and the financial statements contained herein are submitted for the general information of the shareholders of the fund. This report is not authorized for distribution to prospective investors in the fund unless preceded or accompanied by an effective prospectus.
A fund files its complete schedule of portfolio holdings with the SEC for the first and third quarters of each fiscal year on Form N-Q. Forms N-Q are available on the SEC's web site at http://www.sec.gov. A fund's Forms N-Q may be reviewed and copied at the SEC's Public Reference Room in Washington, DC. Information regarding the operation of the SEC's Public Reference Room may be obtained by calling 1-800-SEC-0330. For a complete list of a fund's portfolio holdings, view the most recent holdings listing, semiannual report, or annual report on Fidelity's web site at http://www.fidelity.com or http://www.advisor.fidelity.com, as applicable.
NOT FDIC INSURED • MAY LOSE VALUE • NO BANK GUARANTEE
Neither the fund nor Fidelity Distributors Corporation is a bank.
Annual Report
(photo_of_Edward_C_Johnson_3d)
Dear Shareholder:
Equities have staged a rally in the second half of 2010, shaking off concerns about the European debt crisis and the possibility of a double-dip recession in the U.S. Although the short-term surge pushed major equity indexes back into positive territory for the year, several questions remain about the longer-term outlook, including lackluster economic growth and persistently high unemployment. Financial markets are always unpredictable, of course, but there also are several time-tested investment principles that can help put the odds in your favor.
One of the basic tenets is to invest for the long term. Over time, riding out the markets' inevitable ups and downs has proven much more effective than selling into panic or chasing the hottest trend. Even missing only a few of the markets' best days can significantly diminish investor returns. Patience also affords the benefits of compounding - of earning interest on additional income or reinvested dividends and capital gains. There can be tax advantages and cost benefits to consider as well. While staying the course doesn't eliminate risk, it can considerably lessen the effect of short-term declines.
You can further manage your investing risk through diversification. And today, more than ever, geographic diversification should be taken into account. Studies indicate that asset allocation is the single most important determinant of a portfolio's long-term success. The right mix of stocks, bonds and cash - aligned to your particular risk tolerance and investment objective - is very important. Age-appropriate rebalancing is also an essential aspect of asset allocation. For younger investors, an emphasis on equities - which historically have been the best-performing asset class over time - is encouraged. As investors near their specific goal, such as retirement or sending a child to college, consideration may be given to replacing volatile assets (e.g. common stocks) with more-stable fixed investments (bonds or savings plans).
A third principle - investing regularly - can help lower the average cost of your purchases. Investing a certain amount of money each month or quarter helps ensure you won't pay for all your shares at market highs. This strategy - known as dollar cost averaging - also reduces "emotion" from investing, helping shareholders avoid selling weak performers just prior to an upswing, or chasing a hot performer just before a correction.
We invite you to contact us via the Internet, through our Investor Centers or by phone. It is our privilege to provide you the information you need to make the investments that are right for you.
Sincerely,
(The chairman's signature appears here.)
Edward C. Johnson 3d
Annual Report
Average annual total return reflects the change in the value of an investment, assuming reinvestment of the class' distributions from dividend income and capital gains (the profits earned upon the sale of securities that have grown in value, if any) and assuming a constant rate of performance each year. The $10,000 table and the fund's returns do not reflect the deduction of taxes that a shareholder would pay on fund distributions or the redemption of fund shares. During periods of reimbursement by Fidelity, a fund's total return will be greater than it would be had the reimbursement not occurred. How a fund did yesterday is no guarantee of how it will do tomorrow.
Average Annual Total Returns
Periods ended October 31, 2010 | Past 1
year | Past 5
years | Past 10
years |
Fidelity® Value Fund | 24.74% | 1.91% | 7.91% |
$10,000 Over 10 Years
Let's say hypothetically that $10,000 was invested in Fidelity® Value Fund, a class of the fund, on October 31, 2000. The chart shows how the value of your investment would have changed, and also shows how the Russell Midcap® Value Index performed over the same period.
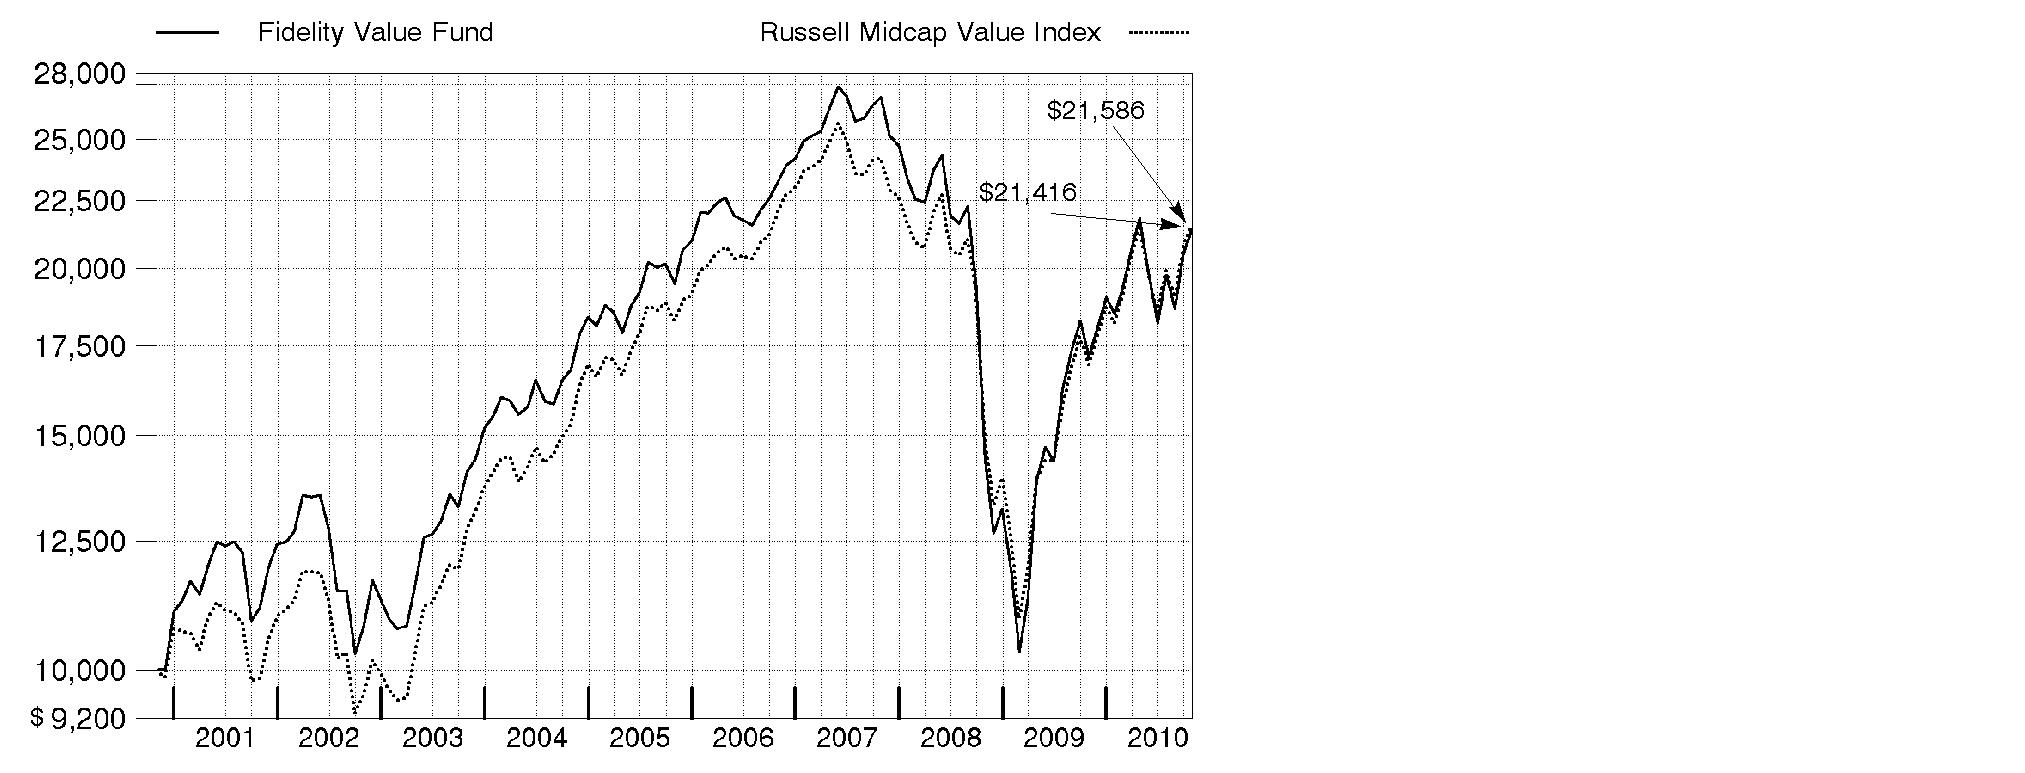
Annual Report
Market Recap: Amid bouts of volatility, major U.S. stock market indexes recorded double-digit gains for the year ending October 31, 2010, lifted by economic optimism, encouraging earnings reports and a wave of corporate mergers. Aside from a January dip, stocks trended upward for the first half of the period amid indications the Great Recession was over. However, in April, lingering high unemployment and heightened concern over European debt sent equities falling. Markets regrouped in July, but fell again in August on mixed economic data. The final two months of the period brought renewed optimism, with the large-cap S&P 500® Index posting its best September/October performance since 1998. For the full 12 months, the S&P 500® rose 16.52%, while the blue-chip-laden Dow Jones Industrial AverageSM added 17.62% and the technology-heavy Nasdaq Composite® Index rose 23.72%. Among market segments, all 10 sectors in the S&P 500 posted gains, with more than half outperforming the broad-market index. Stocks of mid- and small-sized companies surged, with the Russell Midcap® Index adding 27.71% and Russell 2000® Index climbing 26.58%. Looking abroad, debt problems in several European countries cooled gains in developed markets, and yet the MSCI® EAFE® (Europe, Australasia, Far East) Index still rose 8.49%.
Comments from Matthew Friedman, who became Co-Portfolio Manager of Fidelity® Value Fund on May 1, 2010, and Lead Portfolio Manager on July 30, 2010: During the year, the fund's Retail Class shares returned 24.74%, lagging the 27.49% gain of the Russell Midcap Value Index. The fund adopted a multi-manager structure in July, giving me full responsibility for investing 50% of assets across all market sectors, with the other half spread among a team of sector portfolio managers. Weak results in energy and financials were the biggest relative detractors. Within energy, stakes in Petrohawk Energy and Weatherford International were hurt by unfavorable natural gas pricing. A significant overweighting in large-cap diversified financials that suffered from fears of increased government regulation held back performance. JPMorgan Chase and Bank of New York Mellon were in this category, as were banks Wells Fargo and BB&T. The fund had weak security selection in utilities and health care. On the upside, an overweighting and good choices in consumer discretionary led the way, including office supply retailer OfficeMax and commercial real estate broker CB Richard Ellis Group. The fund also had positive results from regional banking firm Huntington Bancshares, food packaging products provider Pactiv and some good stock picks within industrials. Some of these stocks were not in the benchmark, and some were sold prior to period end.
The views expressed above reflect those of the portfolio manager(s) only through the end of the period as stated on the cover of this report and do not necessarily represent the views of Fidelity or any other person in the Fidelity organization. Any such views are subject to change at any time based upon market or other conditions and Fidelity disclaims any responsibility to update such views. These views may not be relied on as investment advice and, because investment decisions for a Fidelity fund are based on numerous factors, may not be relied on as an indication of trading intent on behalf of any Fidelity fund.
Annual Report
Shareholder Expense Example
As a shareholder of the Fund, you incur two types of costs: (1) transaction costs, and (2) ongoing costs, including management fees and other Fund expenses. This Example is intended to help you understand your ongoing costs (in dollars) of investing in the Fund and to compare these costs with the ongoing costs of investing in other mutual funds.
The Example is based on an investment of $1,000 invested at the beginning of the period and held for the entire period (May 1, 2010 to October 31, 2010).
Actual Expenses
The first line of the accompanying table for each class of the Fund provides information about actual account values and actual expenses. You may use the information in this line, together with the amount you invested, to estimate the expenses that you paid over the period. Simply divide your account value by $1,000.00 (for example, an $8,600 account value divided by $1,000.00 = 8.6), then multiply the result by the number in the first line for a class of the Fund under the heading entitled "Expenses Paid During Period" to estimate the expenses you paid on your account during this period. A small balance maintenance fee of $12.00 that is charged once a year may apply for certain accounts with a value of less than $2,000. This fee is not included in the table below. If it was, the estimate of expenses you paid during the period would be higher, and your ending account value lower, by this amount. In addition, the Fund, as a shareholder in the underlying Fidelity Central Funds, will indirectly bear its pro-rata share of the fees and expenses incurred by the underlying Fidelity Central Funds. These fees and expenses are not included in the Fund's annualized expense ratio used to calculate the expense estimate in the table below.
Hypothetical Example for Comparison Purposes
The second line of the accompanying table for each class of the Fund provides information about hypothetical account values and hypothetical expenses based on a Class' actual expense ratio and an assumed rate of return of 5% per year before expenses, which is not the Class' actual return. The hypothetical account values and expenses may not be used to estimate the actual ending account balance or expenses you paid for the period. You may use this information to compare the ongoing costs of investing in the Fund and other funds. To do so, compare this 5% hypothetical example with the 5% hypothetical examples that appear in the shareholder reports of the other funds. A small balance maintenance fee of $12.00 that is charged once a year may apply for certain accounts with a value of less than $2,000. This fee is not included in the table below. If it was, the estimate of expenses you paid during the period would be higher, and your ending account value lower, by this amount. In addition, the Fund, as a shareholder in the underlying Fidelity Central Funds, will indirectly bear its pro-rata share of the fees and expenses incurred by the underlying Fidelity Central Funds. These fees and expenses are not included in the Fund's annualized expense ratio used to calculate the expense estimate in the table below.
Annual Report
Please note that the expenses shown in the table are meant to highlight your ongoing costs only and do not reflect any transaction costs. Therefore, the second line of the table is useful in comparing ongoing costs only, and will not help you determine the relative total costs of owning different funds.
|
Annualized
Expense Ratio
|
Beginning
Account Value
May 1, 2010
|
Ending
Account Value
October 31, 2010
| Expenses Paid
During Period*
May 1, 2010 to
October 31, 2010 |
Value | .57% | | | |
Actual | | $ 1,000.00 | $ 982.20 | $ 2.85 |
HypotheticalA | | $ 1,000.00 | $ 1,022.33 | $ 2.91 |
Class K | .42% | | | |
Actual | | $ 1,000.00 | $ 983.20 | $ 2.10 |
HypotheticalA | | $ 1,000.00 | $ 1,023.09 | $ 2.14 |
A 5% return per year before expenses
* Expenses are equal to each Class' annualized expense ratio, multiplied by the average account value over the period, multiplied by 184/365 (to reflect the one-half year period).
Annual Report
Investment Changes (Unaudited)
Top Ten Stocks as of October 31, 2010 |
| % of fund's
net assets | % of fund's net assets
6 months ago |
Sempra Energy | 1.5 | 0.6 |
PPL Corp. | 1.4 | 0.0 |
PG&E Corp. | 1.3 | 0.5 |
U.S. Bancorp, Delaware | 1.2 | 0.8 |
National Grid PLC | 1.2 | 0.0 |
Wells Fargo & Co. | 1.2 | 1.3 |
Public Service Enterprise Group, Inc. | 1.1 | 0.0 |
Stanley Black & Decker, Inc. | 1.1 | 1.4 |
AES Corp. | 1.1 | 0.6 |
JPMorgan Chase & Co. | 1.1 | 1.1 |
| 12.2 | |
Top Five Market Sectors as of October 31, 2010 |
| % of fund's
net assets | % of fund's net assets
6 months ago |
Financials | 26.4 | 26.5 |
Consumer Discretionary | 12.0 | 11.8 |
Industrials | 11.8 | 14.7 |
Utilities | 10.6 | 6.2 |
Energy | 9.6 | 8.4 |
Asset Allocation (% of fund's net assets) |
As of October 31, 2010* | As of April 30, 2010** |
| Stocks and Equity
Futures 98.1% | | | Stocks 96.6% | |
 | Convertible
Securities 0.0% | |  | Convertible
Securities 0.4% | |
| Short-Term
Investments and
Net Other Assets 1.9% | | | Short-Term
Investments and
Net Other Assets 3.0% | |
* Foreign investments | 13.4% | | ** Foreign investments | 11.3% | |

Annual Report
Investments October 31, 2010
Showing Percentage of Net Assets
Common Stocks - 97.7% |
| Shares | | Value (000s) |
CONSUMER DISCRETIONARY - 12.0% |
Automobiles - 0.9% |
Fiat SpA | 2,953,000 | | $ 49,965 |
Harley-Davidson, Inc. | 710,441 | | 21,796 |
| | 71,761 |
Diversified Consumer Services - 0.2% |
H&R Block, Inc. | 1,411,200 | | 16,638 |
Hotels, Restaurants & Leisure - 1.7% |
Accor SA | 211,436 | | 8,669 |
Ameristar Casinos, Inc. | 1,265,134 | | 22,621 |
Bally Technologies, Inc. (a) | 436,038 | | 15,732 |
Brinker International, Inc. | 1,498,200 | | 27,777 |
Vail Resorts, Inc. (a)(d) | 243,480 | | 9,876 |
WMS Industries, Inc. (a) | 459,021 | | 20,027 |
Wyndham Worldwide Corp. | 1,185,083 | | 34,071 |
| | 138,773 |
Household Durables - 2.4% |
Ethan Allen Interiors, Inc. (d)(e) | 2,637,759 | | 40,015 |
Garmin Ltd. | 548,000 | | 17,996 |
Jarden Corp. | 412,634 | | 13,229 |
PulteGroup, Inc. (a) | 4,377,554 | | 34,364 |
Stanley Black & Decker, Inc. | 1,494,600 | | 92,620 |
| | 198,224 |
Internet & Catalog Retail - 0.7% |
Expedia, Inc. | 473,938 | | 13,721 |
Liberty Media Corp. Interactive Series A (a) | 2,994,915 | | 44,205 |
| | 57,926 |
Leisure Equipment & Products - 0.8% |
Brunswick Corp. | 3,106,008 | | 49,137 |
Eastman Kodak Co. (a)(d) | 3,027,200 | | 14,258 |
| | 63,395 |
Media - 2.1% |
Interpublic Group of Companies, Inc. (a) | 4,499,098 | | 46,566 |
Liberty Global, Inc. Class A (a)(d) | 616,000 | | 23,279 |
MDC Partners, Inc. Class A (sub. vtg.) | 612,500 | | 8,514 |
United Business Media Ltd. | 1,107,766 | | 11,678 |
Valassis Communications, Inc. (a) | 1,048,085 | | 34,587 |
Virgin Media, Inc. | 1,913,676 | | 48,665 |
| | 173,289 |
Common Stocks - continued |
| Shares | | Value (000s) |
CONSUMER DISCRETIONARY - continued |
Multiline Retail - 0.4% |
Big Lots, Inc. (a) | 521,371 | | $ 16,355 |
Kohl's Corp. (a) | 112,436 | | 5,757 |
Retail Ventures, Inc. (a) | 443,269 | | 6,024 |
| | 28,136 |
Specialty Retail - 2.1% |
Advance Auto Parts, Inc. | 188,489 | | 12,248 |
Best Buy Co., Inc. | 894,360 | | 38,440 |
OfficeMax, Inc. (a)(e) | 4,537,769 | | 80,319 |
Sally Beauty Holdings, Inc. (a) | 2,251,841 | | 27,405 |
Staples, Inc. | 719,410 | | 14,726 |
| | 173,138 |
Textiles, Apparel & Luxury Goods - 0.7% |
Hanesbrands, Inc. (a) | 803,154 | | 19,918 |
Iconix Brand Group, Inc. (a) | 1,550,371 | | 27,131 |
Warnaco Group, Inc. (a) | 230,464 | | 12,240 |
| | 59,289 |
TOTAL CONSUMER DISCRETIONARY | | 980,569 |
CONSUMER STAPLES - 4.9% |
Beverages - 2.2% |
Britvic PLC | 953,687 | | 7,371 |
Carlsberg AS Series B | 232,400 | | 25,412 |
Coca-Cola Enterprises, Inc. | 1,689,500 | | 40,565 |
Dr Pepper Snapple Group, Inc. | 1,498,923 | | 54,786 |
Molson Coors Brewing Co. Class B | 526,200 | | 24,852 |
The Coca-Cola Co. | 440,536 | | 27,014 |
| | 180,000 |
Food & Staples Retailing - 1.3% |
Kroger Co. | 3,538,177 | | 77,840 |
SUPERVALU, Inc. | 337,600 | | 3,643 |
Walgreen Co. | 453,612 | | 15,368 |
Winn-Dixie Stores, Inc. (a) | 988,093 | | 6,620 |
| | 103,471 |
Food Products - 0.9% |
Bunge Ltd. | 1,194,659 | | 71,763 |
Common Stocks - continued |
| Shares | | Value (000s) |
CONSUMER STAPLES - continued |
Personal Products - 0.5% |
Avon Products, Inc. | 1,521,250 | | $ 46,322 |
TOTAL CONSUMER STAPLES | | 401,556 |
ENERGY - 9.6% |
Energy Equipment & Services - 3.1% |
Baker Hughes, Inc. | 1,810,876 | | 83,898 |
Cameron International Corp. (a) | 669,040 | | 29,271 |
Halliburton Co. | 1,766,600 | | 56,284 |
McDermott International, Inc. (a) | 1,456,084 | | 22,467 |
Pride International, Inc. (a) | 1,022,100 | | 30,990 |
Transocean Ltd. (a) | 528,575 | | 33,491 |
| | 256,401 |
Oil, Gas & Consumable Fuels - 6.5% |
Apache Corp. | 234,400 | | 23,679 |
Atlas Pipeline Partners, LP | 1,343,311 | | 26,584 |
Cimarex Energy Co. | 592,729 | | 45,492 |
Concho Resources, Inc. (a)(h) | 182,000 | | 11,248 |
Denbury Resources, Inc. (a) | 1,609,300 | | 27,390 |
Enbridge Energy Partners LP | 578,305 | | 35,560 |
EXCO Resources, Inc. | 1,201,500 | | 17,818 |
Forest Oil Corp. (a) | 552,200 | | 16,969 |
Marathon Oil Corp. | 1,273,897 | | 45,313 |
NuStar Energy LP | 326,032 | | 20,540 |
Peabody Energy Corp. | 851,700 | | 45,055 |
Petrohawk Energy Corp. (a) | 1,233,116 | | 20,975 |
Pioneer Natural Resources Co. | 355,799 | | 24,835 |
Southwestern Energy Co. (a) | 819,743 | | 27,748 |
Talisman Energy, Inc. | 2,432,000 | | 44,090 |
Whiting Petroleum Corp. (a) | 697,000 | | 70,007 |
Williams Companies, Inc. | 1,168,030 | | 25,136 |
| | 528,439 |
TOTAL ENERGY | | 784,840 |
FINANCIALS - 26.4% |
Capital Markets - 3.0% |
Bank of New York Mellon Corp. | 1,929,372 | | 48,350 |
Invesco Ltd. | 1,698,956 | | 39,076 |
Morgan Stanley | 2,271,280 | | 56,487 |
Common Stocks - continued |
| Shares | | Value (000s) |
FINANCIALS - continued |
Capital Markets - continued |
State Street Corp. | 1,524,600 | | $ 63,667 |
TD Ameritrade Holding Corp. | 2,335,150 | | 39,908 |
| | 247,488 |
Commercial Banks - 6.1% |
BB&T Corp. | 2,630,861 | | 61,588 |
CapitalSource, Inc. | 3,911,150 | | 23,897 |
CIT Group, Inc. (a) | 795,076 | | 34,451 |
Comerica, Inc. | 654,696 | | 23,425 |
Itau Unibanco Banco Multiplo SA ADR (a)(f) | 1,460,300 | | 35,865 |
PNC Financial Services Group, Inc. | 400,955 | | 21,611 |
Regions Financial Corp. | 3,405,611 | | 21,455 |
SunTrust Banks, Inc. | 1,644,118 | | 41,136 |
TCF Financial Corp. | 1,495,100 | | 19,676 |
U.S. Bancorp, Delaware | 4,224,532 | | 102,149 |
Wells Fargo & Co. | 3,625,105 | | 94,543 |
Zions Bancorporation | 902,096 | | 18,637 |
| | 498,433 |
Consumer Finance - 0.6% |
SLM Corp. (a) | 3,838,200 | | 45,675 |
Diversified Financial Services - 1.6% |
CME Group, Inc. | 90,516 | | 26,218 |
JPMorgan Chase & Co. | 2,257,921 | | 84,966 |
Moody's Corp. | 566,086 | | 15,318 |
| | 126,502 |
Insurance - 8.0% |
AEGON NV (a) | 4,555,714 | | 28,866 |
AFLAC, Inc. | 912,774 | | 51,015 |
Allstate Corp. | 1,074,488 | | 32,761 |
Aon Corp. | 141,500 | | 5,625 |
Assured Guaranty Ltd. | 732,627 | | 13,957 |
Berkshire Hathaway, Inc. Class B (a) | 336,100 | | 26,740 |
Delphi Financial Group, Inc. Class A | 1,266,937 | | 34,296 |
Everest Re Group Ltd. | 338,349 | | 28,516 |
Fairfax Financial Holdings Ltd. (sub. vtg.) | 62,600 | | 25,607 |
First American Financial Corp. | 1,713,892 | | 24,063 |
Genworth Financial, Inc. Class A (a) | 2,013,453 | | 22,833 |
Lincoln National Corp. | 2,342,948 | | 57,355 |
Marsh & McLennan Companies, Inc. | 684,000 | | 17,086 |
MetLife, Inc. | 1,528,700 | | 61,652 |
Reinsurance Group of America, Inc. | 1,100,550 | | 55,105 |
Common Stocks - continued |
| Shares | | Value (000s) |
FINANCIALS - continued |
Insurance - continued |
StanCorp Financial Group, Inc. | 1,002,975 | | $ 43,028 |
Torchmark Corp. | 483,434 | | 27,691 |
Unum Group | 1,922,713 | | 43,107 |
XL Capital Ltd. Class A | 2,505,852 | | 52,999 |
| | 652,302 |
Real Estate Investment Trusts - 5.2% |
Alexandria Real Estate Equities, Inc. | 742,109 | | 54,530 |
CBL & Associates Properties, Inc. | 982,175 | | 15,401 |
Corporate Office Properties Trust (SBI) | 536,524 | | 19,041 |
iStar Financial, Inc. (a)(d) | 421,139 | | 1,925 |
Post Properties, Inc. | 822,492 | | 25,037 |
ProLogis Trust | 5,596,644 | | 76,394 |
Public Storage | 241,577 | | 23,969 |
Rayonier, Inc. | 64,223 | | 3,352 |
SL Green Realty Corp. | 916,962 | | 60,263 |
The Macerich Co. | 552,300 | | 24,638 |
Ventas, Inc. | 980,592 | | 52,521 |
Vornado Realty Trust | 168,695 | | 14,742 |
Weyerhaeuser Co. | 3,100,597 | | 50,292 |
| | 422,105 |
Real Estate Management & Development - 1.6% |
CB Richard Ellis Group, Inc. Class A (a) | 1,626,805 | | 29,852 |
Forest City Enterprises, Inc. Class A (a)(d) | 3,123,376 | | 45,570 |
Forestar Group, Inc. (a)(e) | 1,979,491 | | 33,849 |
Wharf Holdings Ltd. | 3,537,000 | | 23,226 |
| | 132,497 |
Thrifts & Mortgage Finance - 0.3% |
People's United Financial, Inc. | 1,683,000 | | 20,718 |
TOTAL FINANCIALS | | 2,145,720 |
HEALTH CARE - 5.6% |
Biotechnology - 0.4% |
AMAG Pharmaceuticals, Inc. (a) | 166,700 | | 2,652 |
Clinical Data, Inc. (a) | 282,179 | | 5,359 |
Gilead Sciences, Inc. (a) | 365,889 | | 14,515 |
PDL BioPharma, Inc. | 1,826,200 | | 9,551 |
| | 32,077 |
Common Stocks - continued |
| Shares | | Value (000s) |
HEALTH CARE - continued |
Health Care Equipment & Supplies - 1.1% |
Alere, Inc. (a) | 57,400 | | $ 1,696 |
C. R. Bard, Inc. | 49,400 | | 4,106 |
Conceptus, Inc. (a)(d) | 823,100 | | 11,696 |
Hill-Rom Holdings, Inc. | 260,752 | | 10,104 |
Orthofix International NV (a) | 150,000 | | 4,202 |
Wright Medical Group, Inc. (a) | 1,077,482 | | 14,374 |
Zimmer Holdings, Inc. (a) | 872,260 | | 41,380 |
| | 87,558 |
Health Care Providers & Services - 2.9% |
Brookdale Senior Living, Inc. (a) | 1,103,496 | | 20,724 |
Centene Corp. (a) | 554,855 | | 12,384 |
DaVita, Inc. (a) | 540,690 | | 38,795 |
Health Net, Inc. (a) | 584,500 | | 15,717 |
HealthSouth Corp. (a) | 484,600 | | 8,766 |
Henry Schein, Inc. (a) | 72,900 | | 4,093 |
Lincare Holdings, Inc. | 1,217,044 | | 31,911 |
McKesson Corp. | 462,579 | | 30,521 |
Medco Health Solutions, Inc. (a) | 404,100 | | 21,227 |
Omnicare, Inc. | 243,900 | | 5,883 |
Quest Diagnostics, Inc. | 294,460 | | 14,470 |
Sun Healthcare Group, Inc. (a) | 582,800 | | 5,542 |
Universal American Financial Corp. | 340,366 | | 5,473 |
Universal Health Services, Inc. Class B | 417,581 | | 17,234 |
| | 232,740 |
Life Sciences Tools & Services - 0.7% |
Charles River Laboratories International, Inc. (a) | 60,800 | | 1,992 |
ICON PLC sponsored ADR (a) | 555,198 | | 10,743 |
Lonza Group AG | 254,784 | | 22,299 |
PerkinElmer, Inc. | 987,000 | | 23,145 |
| | 58,179 |
Pharmaceuticals - 0.5% |
Cadence Pharmaceuticals, Inc. (a)(d) | 731,067 | | 6,492 |
Mylan, Inc. (a)(d) | 260,700 | | 5,297 |
Teva Pharmaceutical Industries Ltd. sponsored ADR | 376,550 | | 19,543 |
Valeant Pharmaceuticals International, Inc. | 391,619 | | 10,836 |
| | 42,168 |
TOTAL HEALTH CARE | | 452,722 |
Common Stocks - continued |
| Shares | | Value (000s) |
INDUSTRIALS - 11.8% |
Aerospace & Defense - 1.8% |
AerCap Holdings NV (a) | 974,068 | | $ 12,575 |
DigitalGlobe, Inc. (a) | 734,624 | | 23,985 |
Esterline Technologies Corp. (a) | 555,620 | | 33,582 |
Goodrich Corp. | 372,041 | | 30,533 |
ITT Corp. | 315,676 | | 14,897 |
Precision Castparts Corp. | 96,146 | | 13,132 |
Raytheon Co. | 403,425 | | 18,590 |
| | 147,294 |
Airlines - 0.2% |
Pinnacle Airlines Corp. (a)(e) | 1,925,465 | | 11,091 |
Building Products - 1.1% |
Armstrong World Industries, Inc. (a) | 742,094 | | 30,982 |
Masco Corp. | 1,765,088 | | 18,816 |
Owens Corning (a) | 1,553,312 | | 42,002 |
| | 91,800 |
Commercial Services & Supplies - 2.2% |
Avery Dennison Corp. | 466,000 | | 16,939 |
Interface, Inc. Class A | 841,455 | | 12,109 |
Iron Mountain, Inc. | 2,602,529 | | 56,709 |
Quad/Graphics, Inc. (a) | 165,382 | | 7,394 |
Republic Services, Inc. | 1,062,866 | | 31,684 |
Sykes Enterprises, Inc. (a) | 927,497 | | 15,406 |
The Geo Group, Inc. (a) | 1,538,202 | | 39,455 |
| | 179,696 |
Construction & Engineering - 1.9% |
Fluor Corp. | 1,209,275 | | 58,275 |
Foster Wheeler AG (a) | 1,725,203 | | 40,404 |
Jacobs Engineering Group, Inc. (a) | 1,512,725 | | 58,406 |
| | 157,085 |
Electrical Equipment - 0.1% |
EnerSys (a) | 212,171 | | 5,593 |
Industrial Conglomerates - 0.3% |
Textron, Inc. | 1,169,544 | | 24,350 |
Machinery - 1.7% |
Actuant Corp. Class A | 373,393 | | 8,390 |
AGCO Corp. (a) | 382,375 | | 16,239 |
ArvinMeritor, Inc. (a) | 590,508 | | 9,791 |
Dover Corp. | 200,789 | | 10,662 |
Ingersoll-Rand Co. Ltd. | 830,600 | | 32,651 |
Common Stocks - continued |
| Shares | | Value (000s) |
INDUSTRIALS - continued |
Machinery - continued |
Navistar International Corp. (a) | 676,606 | | $ 32,599 |
Pall Corp. | 411,279 | | 17,549 |
Vallourec SA | 116,900 | | 12,130 |
| | 140,011 |
Marine - 0.1% |
Ultrapetrol (Bahamas) Ltd. (a) | 1,082,677 | | 7,048 |
Professional Services - 0.6% |
Towers Watson & Co. | 994,327 | | 51,128 |
Road & Rail - 1.8% |
Con-way, Inc. | 964,243 | | 31,830 |
Contrans Group, Inc. Class A | 1,801,100 | | 15,452 |
Quality Distribution, Inc. (a)(d)(e) | 1,731,188 | | 12,378 |
Union Pacific Corp. | 803,335 | | 70,436 |
Vitran Corp., Inc. (a)(e) | 1,349,445 | | 15,100 |
| | 145,196 |
TOTAL INDUSTRIALS | | 960,292 |
INFORMATION TECHNOLOGY - 8.8% |
Communications Equipment - 0.4% |
Comverse Technology, Inc. (a) | 2,144,560 | | 17,156 |
Research In Motion Ltd. (a) | 198,700 | | 11,316 |
| | 28,472 |
Computers & Peripherals - 0.6% |
Gemalto NV | 469,171 | | 21,361 |
Hewlett-Packard Co. | 390,750 | | 16,435 |
Western Digital Corp. (a) | 242,237 | | 7,756 |
| | 45,552 |
Electronic Equipment & Components - 1.3% |
Agilent Technologies, Inc. (a) | 534,924 | | 18,615 |
Avnet, Inc. (a) | 1,593,919 | | 47,467 |
Flextronics International Ltd. (a) | 3,123,655 | | 22,365 |
Molex, Inc. (d) | 614,208 | | 12,468 |
TTM Technologies, Inc. (a) | 45,154 | | 473 |
| | 101,388 |
Internet Software & Services - 0.7% |
eBay, Inc. (a) | 1,097,425 | | 32,714 |
Monster Worldwide, Inc. (a) | 1,480,145 | | 26,731 |
| | 59,445 |
Common Stocks - continued |
| Shares | | Value (000s) |
INFORMATION TECHNOLOGY - continued |
IT Services - 1.1% |
Acxiom Corp. (a) | 2,011,795 | | $ 35,307 |
Atos Origin SA (a) | 134,105 | | 6,200 |
Fiserv, Inc. (a) | 313,578 | | 17,096 |
MasterCard, Inc. Class A | 85,049 | | 20,417 |
Wright Express Corp. (a) | 275,099 | | 10,374 |
| | 89,394 |
Office Electronics - 0.2% |
Xerox Corp. | 1,556,666 | | 18,213 |
Semiconductors & Semiconductor Equipment - 3.2% |
Advanced Micro Devices, Inc. (a) | 2,050,996 | | 15,034 |
Avago Technologies Ltd. (a) | 1,220,990 | | 30,134 |
Intersil Corp. Class A | 2,776,632 | | 36,346 |
KLA-Tencor Corp. | 1,015,350 | | 36,268 |
Lam Research Corp. (a) | 1,266,725 | | 58,003 |
Marvell Technology Group Ltd. (a) | 1,128,609 | | 21,793 |
Micron Technology, Inc. (a) | 4,848,252 | | 40,095 |
NXP Semiconductors NV | 338,704 | | 4,468 |
ON Semiconductor Corp. (a) | 1,729,284 | | 13,264 |
PMC-Sierra, Inc. (a) | 999,900 | | 7,689 |
| | 263,094 |
Software - 1.3% |
BMC Software, Inc. (a) | 938,671 | | 42,672 |
CA, Inc. | 803,262 | | 18,644 |
Epicor Software Corp. (a) | 1,644,478 | | 15,458 |
Micro Focus International PLC | 847,500 | | 5,184 |
Symantec Corp. (a) | 1,600,350 | | 25,894 |
| | 107,852 |
TOTAL INFORMATION TECHNOLOGY | | 713,410 |
MATERIALS - 6.1% |
Chemicals - 3.8% |
Air Products & Chemicals, Inc. | 215,880 | | 18,343 |
Ashland, Inc. | 980,487 | | 50,623 |
Cabot Corp. | 815,900 | | 27,757 |
Celanese Corp. Class A | 1,483,025 | | 52,870 |
CF Industries Holdings, Inc. | 180,007 | | 22,056 |
Clariant AG (Reg.) (a) | 972,480 | | 16,439 |
Innophos Holdings, Inc. | 475,889 | | 17,475 |
LyondellBasell Industries NV Class A (a) | 181,100 | | 4,864 |
Common Stocks - continued |
| Shares | | Value (000s) |
MATERIALS - continued |
Chemicals - continued |
Solutia, Inc. (a) | 2,832,841 | | $ 51,303 |
Solvay SA Class A | 62,600 | | 6,628 |
Valspar Corp. | 344,600 | | 11,062 |
W.R. Grace & Co. (a) | 652,672 | | 20,925 |
Wacker Chemie AG | 58,600 | | 12,088 |
| | 312,433 |
Construction Materials - 0.3% |
HeidelbergCement AG | 515,166 | | 26,942 |
Containers & Packaging - 0.9% |
Aptargroup, Inc. | 273,992 | | 12,297 |
Ball Corp. | 638,071 | | 41,066 |
Owens-Illinois, Inc. (a) | 643,227 | | 18,030 |
| | 71,393 |
Metals & Mining - 1.1% |
Commercial Metals Co. | 774,551 | | 10,751 |
Compania de Minas Buenaventura SA sponsored ADR | 420,200 | | 22,287 |
Compass Minerals International, Inc. | 504,469 | | 39,787 |
Walter Energy, Inc. | 158,125 | | 13,909 |
| | 86,734 |
TOTAL MATERIALS | | 497,502 |
TELECOMMUNICATION SERVICES - 1.9% |
Diversified Telecommunication Services - 1.0% |
AboveNet, Inc. (a) | 14,600 | | 831 |
Cbeyond, Inc. (a) | 823,830 | | 11,163 |
Cincinnati Bell, Inc. (a) | 1,828,400 | | 4,480 |
Global Crossing Ltd. (a) | 644,094 | | 8,760 |
Iliad Group SA | 77,297 | | 8,701 |
Qwest Communications International, Inc. | 5,607,869 | | 37,012 |
Verizon Communications, Inc. | 302,789 | | 9,832 |
| | 80,779 |
Wireless Telecommunication Services - 0.9% |
American Tower Corp. Class A (a) | 705,900 | | 36,431 |
NII Holdings, Inc. (a) | 753,910 | | 31,521 |
Sprint Nextel Corp. (a) | 1,606,340 | | 6,618 |
| | 74,570 |
TOTAL TELECOMMUNICATION SERVICES | | 155,349 |
Common Stocks - continued |
| Shares | | Value (000s) |
UTILITIES - 10.6% |
Electric Utilities - 3.0% |
American Electric Power Co., Inc. | 2,150,170 | | $ 80,502 |
NextEra Energy, Inc. | 947,993 | | 52,178 |
PPL Corp. | 4,259,899 | | 114,591 |
| | 247,271 |
Gas Utilities - 0.6% |
China Gas Holdings Ltd. (d) | 30,414,000 | | 17,382 |
UGI Corp. | 941,177 | | 28,320 |
| | 45,702 |
Independent Power Producers & Energy Traders - 1.9% |
AES Corp. (a) | 7,257,200 | | 86,651 |
Calpine Corp. (a) | 5,332,900 | | 66,661 |
| | 153,312 |
Multi-Utilities - 5.1% |
National Grid PLC | 10,635,963 | | 100,566 |
PG&E Corp. | 2,189,363 | | 104,695 |
Public Service Enterprise Group, Inc. | 2,877,586 | | 93,090 |
Sempra Energy | 2,277,500 | | 121,799 |
| | 420,150 |
TOTAL UTILITIES | | 866,435 |
TOTAL COMMON STOCKS (Cost $7,976,856) | 7,958,395 |
U.S. Treasury Obligations - 0.1% |
| Principal Amount (000s) | | |
U.S. Treasury Bills, yield at date of purchase 0.11% to 0.15% 11/4/10 (g)
(Cost $10,325) | | $ 10,325 | | 10,325 |
Money Market Funds - 3.2% |
| Shares | | Value (000s) |
Fidelity Cash Central Fund, 0.23% (b) | 177,396,361 | | $ 177,396 |
Fidelity Securities Lending Cash Central Fund, 0.24% (b)(c) | 83,287,769 | | 83,288 |
TOTAL MONEY MARKET FUNDS (Cost $260,684) | 260,684 |
TOTAL INVESTMENT PORTFOLIO - 101.0% (Cost $8,247,865) | | 8,229,404 |
NET OTHER ASSETS (LIABILITIES) - (1.0)% | | (82,382) |
NET ASSETS - 100% | 8,147,022 |
Futures Contracts |
| Expiration Date | | Underlying Face Amount at Value (000s) | | Unrealized Appreciation/
(Depreciation) (000s) |
Purchased |
Equity Index Contracts |
379 CME E-mini S&P Midcap 400 Index Contracts | Dec. 2010 | | $ 31,362 | | $ 447 |
The face value of futures purchased as a percentage of net assets is 0.4% |
Legend |
(a) Non-income producing |
(b) Affiliated fund that is available only to investment companies and other accounts managed by Fidelity Investments. The rate quoted is the annualized seven-day yield of the fund at period end. A complete unaudited listing of the fund's holdings as of its most recent quarter end is available upon request. In addition, each Fidelity Central Fund's financial statements, which are not covered by the Fund's report of Independent Registered Public Accounting Firm, are available on the SEC's website or upon request. |
(c) Investment made with cash collateral received from securities on loan. |
(d) Security or a portion of the security is on loan at period end. |
(e) Affiliated company |
(f) Security exempt from registration under Rule 144A of the Securities Act of 1933. These securities may be resold in transactions exempt from registration, normally to qualified institutional buyers. At the end of the period, the value of these securities amounted to $35,865,000 or 0.4% of net assets. |
(g) Security or a portion of the security was pledged to cover margin requirements for futures contracts. At the period end, the value of securities pledged amounted to $2,600,000. |
(h) Restricted securities - Investment in securities not registered under the Securities Act of 1933 (excluding 144A issues). At the end of the period, the value of restricted securities (excluding 144A issues) amounted to $11,248,000 or 0.1% of net assets. |
Additional information on each holding is as follows: |
Security | Acquisition Date | Acquisition Cost (000s) |
Concho Resources, Inc. | 7/20/10 | $ 8,245 |
Affiliated Central Funds |
Information regarding fiscal year to date income earned by the Fund from investments in Fidelity Central Funds is as follows: |
Fund | Income earned
(Amounts in thousands) |
Fidelity Cash Central Fund | $ 142 |
Fidelity Securities Lending Cash Central Fund | 643 |
Total | $ 785 |
Other Affiliated Issuers |
An affiliated company is a company in which the Fund has ownership of at least 5% of the voting securities. Fiscal year to date transactions with companies which are or were affiliates are as follows: |
Affiliates
(Amounts in thousands) | Value,
beginning of
period | Purchases | Sales
Proceeds | Dividend
Income | Value,
end of
period |
ACCO Brands Corp. | $ 16,690 | $ - | $ 20,754 | $ - | $ - |
Consolidated Graphics, Inc. | 16,227 | - | 32,708 | - | - |
Ethan Allen Interiors, Inc. | 35,142 | 406 | 3,420 | 546 | 40,015 |
Fairchild Semiconductor International, Inc. | 50,021 | - | 69,381 | - | - |
Forestar Group, Inc. | - | 34,550 | 1,172 | - | 33,849 |
OfficeMax, Inc. | 50,778 | 18,155 | 19,947 | - | 80,319 |
Pinnacle Airlines Corp. | - | 11,730 | 1,213 | - | 11,091 |
Quality Distribution, Inc. | - | 9,982 | 2,292 | - | 12,378 |
Vitran Corp., Inc. | - | 12,387 | - | - | 15,100 |
Winnebago Industries, Inc. | 29,575 | - | 39,169 | - | - |
Total | $ 198,433 | $ 87,210 | $ 190,056 | $ 546 | $ 192,752 |
Other Information |
The following is a summary of the inputs used, as of October 31, 2010, involving the Fund's assets and liabilities carried at fair value. The inputs or methodology used for valuing securities may not be an indication of the risk associated with investing in those securities. For more information on valuation inputs, and their aggregation into the levels used in the tables below, please refer to the Security Valuation section in the accompanying Notes to Financial Statements. |
Valuation Inputs at Reporting Date: |
Description
(Amounts in thousands) | Total | Level 1 | Level 2 | Level 3 |
Investments in Securities: | | | | |
Equities: | | | | |
Consumer Discretionary | $ 980,569 | $ 980,569 | $ - | $ - |
Consumer Staples | 401,556 | 401,556 | - | - |
Energy | 784,840 | 773,592 | 11,248 | - |
Financials | 2,145,720 | 2,116,854 | 28,866 | - |
Health Care | 452,722 | 452,722 | - | - |
Industrials | 960,292 | 960,292 | - | - |
Information Technology | 713,410 | 713,410 | - | - |
Materials | 497,502 | 497,502 | - | - |
Telecommunication Services | 155,349 | 155,349 | - | - |
Utilities | 866,435 | 765,869 | 100,566 | - |
U.S. Government and Government Agency Obligations | 10,325 | - | 10,325 | - |
Money Market Funds | 260,684 | 260,684 | - | - |
Total Investments in Securities: | $ 8,229,404 | $ 8,078,399 | $ 151,005 | $ - |
Derivative Instruments: | | | | |
Assets | | | | |
Futures Contracts | $ 447 | $ 447 | $ - | $ - |
Value of Derivative Instruments |
The following table is a summary of the Fund's value of derivative instruments by risk exposure as of October 31, 2010. For additional information on derivative instruments, please refer to the Derivative Instruments section in the accompanying Notes to Financial Statements. |
Risk Exposure /
Derivative Type | Value
(Amounts in thousands) |
| Asset | Liability |
Equity Risk | | |
Futures Contracts (a) | $ 447 | $ - |
Total Value of Derivatives | $ 447 | $ - |
(a) Reflects cumulative appreciation/(depreciation) on futures contracts as disclosed on the Schedule of Investments. Only the period end variation margin is separately disclosed on the Statement of Assets and Liabilities. |
Distribution of investments by country of issue, as a percentage of total net assets, is as follows: (Unaudited) |
United States of America | 86.6% |
Bermuda | 2.2% |
Canada | 1.6% |
Switzerland | 1.6% |
United Kingdom | 1.4% |
Ireland | 1.2% |
Others (Individually Less Than 1%) | 5.4% |
| 100.0% |
Income Tax Information |
At October 31, 2010, the Fund had a capital loss carryforward of approximately $3,208,718,000 of which $104,186,000, $2,771,650,000 and $332,882,000 will expire on October 31, 2016, 2017 and 2018, respectively. Capital loss carryforwards are only available to offset future capital gains of the Fund to the extent provided by regulations and may be limited. |
See accompanying notes which are an integral part of the financial statements.
Annual Report
Statement of Assets and Liabilities
Amounts in thousands (except per-share amounts) | October 31, 2010 |
| | |
Assets | | |
Investment in securities, at value (including securities loaned of $82,357) - See accompanying schedule: Unaffiliated issuers (cost $7,697,493) | $ 7,775,968 | |
Fidelity Central Funds (cost $260,684) | 260,684 | |
Other affiliated issuers (cost $289,688) | 192,752 | |
Total Investments (cost $8,247,865) | | $ 8,229,404 |
Receivable for investments sold | | 114,608 |
Receivable for fund shares sold | | 4,325 |
Dividends receivable | | 3,105 |
Distributions receivable from Fidelity Central Funds | | 47 |
Receivable for daily variation on futures contracts | | 148 |
Other receivables | | 465 |
Total assets | | 8,352,102 |
| | |
Liabilities | | |
Payable to custodian bank | $ 3,518 | |
Payable for investments purchased | 101,567 | |
Payable for fund shares redeemed | 12,950 | |
Accrued management fee | 1,932 | |
Other affiliated payables | 1,424 | |
Other payables and accrued expenses | 401 | |
Collateral on securities loaned, at value | 83,288 | |
Total liabilities | | 205,080 |
| | |
Net Assets | | $ 8,147,022 |
Net Assets consist of: | | |
Paid in capital | | $ 11,391,370 |
Undistributed net investment income | | 88,210 |
Accumulated undistributed net realized gain (loss) on investments and foreign currency transactions | | (3,314,541) |
Net unrealized appreciation (depreciation) on investments and assets and liabilities in foreign currencies | | (18,017) |
Net Assets | | $ 8,147,022 |
See accompanying notes which are an integral part of the financial statements.
Annual Report
Financial Statements - continued
Statement of Assets and Liabilities - continued
Amounts in thousands (except per-share amounts) | October 31, 2010 |
| | |
Value: Net Asset Value, offering price and redemption price per share ($7,275,519 ÷ 113,513 shares) | | $ 64.09 |
| | |
Class K:
Net Asset Value, offering price and redemption price per share ($871,503 ÷ 13,566 shares) | | $ 64.24 |
See accompanying notes which are an integral part of the financial statements.
Annual Report
Statement of Operations
Amounts in thousands | Year ended October 31, 2010 |
| | |
Investment Income | | |
Dividends (including $546 earned from other affiliated issuers) | | $ 110,244 |
Special dividends | | 31,677 |
Interest | | 774 |
Income from Fidelity Central Funds | | 785 |
Total income | | 143,480 |
| | |
Expenses | | |
Management fee
Basic fee | $ 45,967 | |
Performance adjustment | (13,984) | |
Transfer agent fees | 17,448 | |
Accounting and security lending fees | 1,290 | |
Custodian fees and expenses | 319 | |
Independent trustees' compensation | 48 | |
Registration fees | 113 | |
Audit | 85 | |
Legal | 44 | |
Interest | 10 | |
Miscellaneous | 118 | |
Total expenses before reductions | 51,458 | |
Expense reductions | (850) | 50,608 |
Net investment income (loss) | | 92,872 |
Realized and Unrealized Gain (Loss) Net realized gain (loss) on: | | |
Investment securities: | | |
Unaffiliated issuers | (268,477) | |
Other affiliated issuers | (138,197) | |
Foreign currency transactions | (576) | |
Futures contracts | 3,574 | |
Capital gain distributions from Fidelity Central Funds | 11 | |
Total net realized gain (loss) | | (403,665) |
Change in net unrealized appreciation (depreciation) on: Investment securities | 2,074,780 | |
Assets and liabilities in foreign currencies | (3) | |
Futures contracts | 447 | |
Total change in net unrealized appreciation (depreciation) | | 2,075,224 |
Net gain (loss) | | 1,671,559 |
Net increase (decrease) in net assets resulting from operations | | $ 1,764,431 |
See accompanying notes which are an integral part of the financial statements.
Annual Report
Financial Statements - continued
Statement of Changes in Net Assets
Amounts in thousands | Year ended
October 31,
2010 | Year ended
October 31,
2009 |
Increase (Decrease) in Net Assets | | |
Operations | | |
Net investment income (loss) | $ 92,872 | $ 109,685 |
Net realized gain (loss) | (403,665) | (4,054,417) |
Change in net unrealized appreciation (depreciation) | 2,075,224 | 4,591,566 |
Net increase (decrease) in net assets resulting
from operations | 1,764,431 | 646,834 |
Distributions to shareholders from net investment income | (70,609) | (59,373) |
Share transactions - net increase (decrease) | (1,308,650) | (4,068,805) |
Total increase (decrease) in net assets | 385,172 | (3,481,344) |
| | |
Net Assets | | |
Beginning of period | 7,761,850 | 11,243,194 |
End of period (including undistributed net investment income of $88,210 and undistributed net investment income of $53,143, respectively) | $ 8,147,022 | $ 7,761,850 |
See accompanying notes which are an integral part of the financial statements.
Annual Report
Financial Highlights - Value
Years ended October 31, | 2010 | 2009 | 2008 | 2007 | 2006 |
Selected Per-Share Data | | | | | |
Net asset value, beginning of period | $ 51.82 | $ 43.78 | $ 89.60 | $ 83.82 | $ 75.61 |
Income from Investment Operations | | | | | |
Net investment income (loss) B | .66 E | .59 | .75 | .64 | .61 |
Net realized and unrealized gain (loss) | 12.09 | 7.69 | (38.92) | 11.79 | 13.17 |
Total from investment operations | 12.75 | 8.28 | (38.17) | 12.43 | 13.78 |
Distributions from net investment income | (.48) | (.24) | (.56) | (.56) | (.43) |
Distributions from net realized gain | - | - | (7.09) | (6.09) | (5.14) |
Total distributions | (.48) | (.24) | (7.65) | (6.65) | (5.57) |
Net asset value, end of period | $ 64.09 | $ 51.82 | $ 43.78 | $ 89.60 | $ 83.82 |
Total Return A | 24.74% | 19.12% | (46.34)% | 15.82% | 19.01% |
Ratios to Average Net Assets C, F | | | | | |
Expenses before reductions | .64% | .64% | .76% | .70% | .67% |
Expenses net of fee waivers, if any | .64% | .64% | .76% | .70% | .67% |
Expenses net of all reductions | .63% | .64% | .76% | .69% | .66% |
Net investment income (loss) | 1.12% E | 1.41% | 1.10% | .74% | .76% |
Supplemental Data | | | | | |
Net assets, end of period (in millions) | $ 7,276 | $ 7,278 | $ 11,066 | $ 22,558 | $ 17,153 |
Portfolio turnover rate D | 148% | 51% | 50% | 44% | 36% |
A Total returns would have been lower had certain expenses not been reduced during the periods shown.
B Calculated based on average shares outstanding during the period.
C Fees and expenses of the underlying Fidelity Central Funds are not included in the Fund's expense ratio. The Fund indirectly bears its proportionate share of the expenses of any underlying Fidelity Central Funds.
D Amount does not include the portfolio activity of any underlying Fidelity Central Funds.
E Investment income per share reflects a special dividend which amounted to $.23 per share. Excluding the special dividend, the ratio of net investment income (loss) to average net assets would have been .73%.
F Expense ratios reflect operating expenses of the class. Expenses before reductions do not reflect amounts reimbursed by the investment adviser or reductions from brokerage service arrangements or reductions from other expense offset arrangements and do not represent the amount paid by the class during periods when reimbursements or reductions occur. Expenses net of fee waivers reflect expenses after reimbursement by the investment adviser but prior to reductions from brokerage service arrangements or other expense offset arrangements. Expenses net of all reductions represent the net expenses paid by the class.
See accompanying notes which are an integral part of the financial statements.
Annual Report
Financial Highlights - Class K
Years ended October 31, | 2010 | 2009 | 2008 H |
Selected Per-Share Data | | | |
Net asset value, beginning of period | $ 51.96 | $ 43.82 | $ 72.61 |
Income from Investment Operations | | | |
Net investment income (loss) D | .76 G | .72 | .25 |
Net realized and unrealized gain (loss) | 12.12 | 7.67 | (29.04) |
Total from investment operations | 12.88 | 8.39 | (28.79) |
Distributions from net investment income | (.60) | (.25) | - |
Total distributions | (.60) | (.25) | - |
Net asset value, end of period | $ 64.24 | $ 51.96 | $ 43.82 |
Total Return B, C | 24.96% | 19.39% | (39.65)% |
Ratios to Average Net Assets E, I | | | |
Expenses before reductions | .47% | .40% | .60% A |
Expenses net of fee waivers, if any | .47% | .40% | .60% A |
Expenses net of all reductions | .46% | .40% | .60% A |
Net investment income (loss) | 1.29% G | 1.64% | 1.17% A |
Supplemental Data | | | |
Net assets, end of period (in millions) | $ 872 | $ 484 | $ 177 |
Portfolio turnover rate F | 148% | 51% | 50% |
A Annualized
B Total returns for periods of less than one year are not annualized.
C Total returns would have been lower had certain expenses not been reduced during the periods shown.
D Calculated based on average shares outstanding during the period.
E Fees and expenses of the underlying Fidelity Central Funds are not included in the Fund's expense ratio. The Fund indirectly bears its proportionate share of the expenses of any underlying Fidelity Central Funds.
F Amount does not include the portfolio activity of any underlying Fidelity Central Funds.
G Investment income per share reflects a special dividend which amounted to $.23 per share. Excluding the special dividend, the ratio of net investment income (loss) to average net assets would have been .90%.
H For the period May 9, 2008 (commencement of sale of shares) to October 31, 2008.
I Expense ratios reflect operating expenses of the class. Expenses before reductions do not reflect amounts reimbursed by the investment adviser or reductions from brokerage service arrangements or reductions from other expense offset arrangements and do not represent the amount paid by the class during periods when reimbursements or reductions occur. Expense ratios before reductions for start-up periods may not be representative of longer-term operating periods. Expenses net of fee waivers reflect expenses after reimbursement by the investment adviser but prior to reductions from brokerage service arrangements or other expense offset arrangements. Expenses net of all reductions represent the net expenses paid by the class.
See accompanying notes which are an integral part of the financial statements.
Annual Report
Notes to Financial Statements
For the period ended October 31, 2010
(Amounts in thousands except ratios)
1. Organization.
Fidelity Value Fund (the Fund) is a fund of Fidelity Capital Trust (the Trust) and is authorized to issue an unlimited number of shares. The Trust is registered under the Investment Company Act of 1940, as amended (the 1940 Act), as an open-end management investment company organized as a Massachusetts business trust. The Fund offers Value and Class K shares, each of which has equal rights as to assets and voting privileges. Investment income, realized and unrealized capital gains and losses, the common expenses of the Fund, and certain fund-level expense reductions, if any, are allocated on a pro-rata basis to each class based on the relative net assets of each class to the total net assets of the Fund. Each class differs with respect to transfer agent fees incurred. Certain expense reductions also differ by class.
2. Investments in Fidelity Central Funds.
The Fund may invest in Fidelity Central Funds, which are open-end investment companies available only to other investment companies and accounts managed by Fidelity Management & Research Company (FMR) and its affiliates. The Fund's Schedule of Investments lists each of the Fidelity Central Funds held as of period end, if any, as an investment of the Fund, but does not include the underlying holdings of each Fidelity Central Fund. As an Investing Fund, the Fund indirectly bears its proportionate share of the expenses of the underlying Fidelity Central Funds.
The Money Market Central Funds seek preservation of capital and current income and are managed by Fidelity Investments Money Management, Inc. (FIMM), an affiliate of FMR.
A complete unaudited list of holdings for each Fidelity Central Fund is available upon request or at the Securities and Exchange Commission (the SEC) web site at www.sec.gov. In addition, the financial statements of the Fidelity Central Funds, which are not covered by the Fund's Report of Independent Registered Public Accounting Firm, are available on the SEC web site or upon request.
3. Significant Accounting Policies.
The financial statements have been prepared in conformity with accounting principles generally accepted in the United States of America (GAAP), which require management to make certain estimates and assumptions at the date of the financial statements. Actual results could differ from those estimates. The following summarizes the significant accounting policies of the Fund:
Security Valuation. Investments are valued as of 4:00 p.m. Eastern time on the last calendar day of the period. The Fund uses independent pricing services approved by the Board of Trustees to value its investments. When current market prices or quotations are not readily available or reliable, valuations may be determined in good faith in accordance
Annual Report
Notes to Financial Statements - continued
(Amounts in thousands except ratios)
3. Significant Accounting Policies - continued
Security Valuation - continued
with procedures adopted by the Board of Trustees. Factors used in determining value may include market or security specific events, changes in interest rates and credit quality. The frequency with which these procedures are used cannot be predicted and they may be utilized to a significant extent. The value used for net asset value (NAV) calculation under these procedures may differ from published prices for the same securities.
The Fund categorizes the inputs to valuation techniques used to value its investments into a disclosure hierarchy consisting of three levels as shown below.
Level 1 - quoted prices in active markets for identical investments
Level 2 - other significant observable inputs (including quoted prices for similar investments, interest rates, prepayment speeds, etc.)
Level 3 - unobservable inputs (including the fund's own assumptions based on the best information available)
Changes in valuation techniques may result in transfers in or out of an assigned level within the disclosure hierarchy. The aggregate value of investments by input level, as of October 31, 2010 is included at the end of the Fund's Schedule of Investments. Valuation techniques used to value the Fund's investments by major category are as follows.
Equity securities, including restricted securities, for which market quotations are readily available, are valued at the last reported sale price or official closing price as reported by an independent pricing service on the primary market or exchange on which they are traded and are categorized as Level 1 in the hierarchy. In the event there were no sales during the day or closing prices are not available, securities are valued at the last quoted bid price or may be valued using the last available price and are generally categorized as Level 2 in the hierarchy. For foreign equity securities, when significant market or security specific events arise, comparisons to the valuation of American Depositary Receipts (ADRs), futures contracts, Exchange-traded funds (ETFs) and certain indexes as well as quoted prices for similar securities are used and are categorized as Level 2 in the hierarchy in these circumstances. Utilizing these techniques may result in transfers between Level 1 and Level 2. For restricted equity securities and private placements where observable inputs are limited, assumptions about market activity and risk are used and are categorized as Level 3 in the hierarchy.
Debt securities, including restricted securities, are valued based on evaluated prices received from independent pricing services or from dealers who make markets in such securities. For U.S. government and government agency obligations, pricing services utilize matrix pricing which considers yield or price of bonds of comparable quality, coupon, maturity and type as well as dealer supplied prices and are generally categorized as Level 2 in the hierarchy.
Annual Report
3. Significant Accounting Policies - continued
Security Valuation - continued
Futures contracts are valued at the settlement price or official closing price established each day by the board of trade or exchange on which they are traded and are categorized as Level 1 in the hierarchy. Investments in open-end mutual funds, including the Fidelity Central Funds, are valued at their closing net asset value each business day and are categorized as Level 1 in the hierarchy. Short-term securities with remaining maturities of sixty days or less for which quotations are not readily available are valued at amortized cost, which approximates fair value and are categorized as Level 2 in the hierarchy.
When independent prices are unavailable or unreliable, debt securities may be valued utilizing pricing matrices which consider similar factors that would be used by independent pricing services. These are generally categorized as Level 2 in the hierarchy but may be Level 3 depending on the circumstances.
Foreign Currency. The Fund uses foreign currency contracts to facilitate transactions in foreign-denominated securities. Gains and losses from these transactions may arise from changes in the value of the foreign currency or if the counterparties do not perform under the contracts' terms.
Foreign-denominated assets, including investment securities, and liabilities are translated into U.S. dollars at the exchange rate at period end. Purchases and sales of investment securities, income and dividends received and expenses denominated in foreign currencies are translated into U.S. dollars at the exchange rate in effect on the transaction date.
The effects of exchange rate fluctuations on investments are included with the net realized and unrealized gain (loss) on investment securities. Other foreign currency transactions resulting in realized and unrealized gain (loss) are disclosed separately.
Investment Transactions and Income. For financial reporting purposes, the Fund's investment holdings and NAV include trades executed through the end of the last business day of the period. The NAV per share for processing shareholder transactions is calculated as of the close of business of the New York Stock Exchange (NYSE), normally 4:00 p.m. Eastern time and includes trades executed through the end of the prior business day. Gains and losses on securities sold are determined on the basis of identified cost and may include proceeds received from litigation. Dividend income is recorded on the ex-dividend date, except for certain dividends from foreign securities where the ex-dividend date may have passed, which are recorded as soon as the Fund is informed of the ex-dividend date. Non-cash dividends included in dividend income, if any, are recorded at the fair market value of the securities received. Distributions received on securities that represent a return of capital or capital gain are recorded as a reduction of cost of investments and/or as a realized gain. The Fund estimates the components of distributions received that may be considered return of capital distributions or capital gain distributions. Large, non-recurring
Annual Report
Notes to Financial Statements - continued
(Amounts in thousands except ratios)
3. Significant Accounting Policies - continued
Investment Transactions and Income - continued
dividends recognized by the Fund are presented separately on the Statement of Operations as "Special Dividends" and the impact of these dividends is presented in the Financial Highlights. Interest income and distributions from the Fidelity Central Funds are accrued as earned. Interest income includes coupon interest and amortization of premium and accretion of discount on debt securities. Investment income is recorded net of foreign taxes withheld where recovery of such taxes is uncertain.
Expenses. Most expenses of the Trust can be directly attributed to a fund. Expenses which cannot be directly attributed are apportioned amongst each fund in the Trust. Expense estimates are accrued in the period to which they relate and adjustments are made when actual amounts are known.
Deferred Trustee Compensation. Under a Deferred Compensation Plan (the Plan), independent Trustees may elect to defer receipt of a portion of their annual compensation. Deferred amounts are invested in a cross-section of Fidelity funds, are marked-to-market and remain in the Fund until distributed in accordance with the Plan. The investment of deferred amounts and the offsetting payable to the Trustees are included in the accompanying Statement of Assets and Liabilities.
Income Tax Information and Distributions to Shareholders. Each year the Fund intends to qualify as a regulated investment company, including distributing substantially all of its taxable income and realized gains under Subchapter M of the Internal Revenue Code and filing its U.S. federal tax return. As a result, no provision for income taxes is required. As of October 31, 2010, the Fund did not have any unrecognized tax benefits in the accompanying financial statements. A fund's federal tax return is subject to examination by the Internal Revenue Service (IRS) for a period of three years. Foreign taxes are provided for based on the Fund's understanding of the tax rules and rates that exist in the foreign markets in which it invests.
Distributions are declared and recorded on the ex-dividend date. Income dividends and capital gain distributions are declared separately for each class. Income and capital gain distributions are determined in accordance with income tax regulations, which may differ from GAAP.
Capital accounts within the financial statements are adjusted for permanent book-tax differences. These adjustments have no impact on net assets or the results of operations. Temporary book-tax differences will reverse in a subsequent period.
Book-tax differences are primarily due to the short-term gain distributions from the Fidelity Central Funds, futures transactions, foreign currency transactions, passive
Annual Report
3. Significant Accounting Policies - continued
Income Tax Information and Distributions to Shareholders - continued
foreign investment companies (PFIC), market discount, partnerships, deferred trustees compensation, capital loss carryforwards and losses deferred due to wash sales.
The federal tax cost of investment securities and unrealized appreciation (depreciation) as of period end were as follows:
Gross unrealized appreciation | $ 703,528 |
Gross unrealized depreciation | (827,366) |
Net unrealized appreciation (depreciation) | $ (123,838) |
| |
Tax Cost | $ 8,353,242 |
The tax-based components of distributable earnings as of period end were as follows:
Undistributed ordinary income | $ 88,489 |
Capital loss carryforward | $ (3,208,718) |
Net unrealized appreciation (depreciation) | $ (123,842) |
The tax character of distributions paid was as follows:
| October 31, 2010 | October 31, 2009 |
Ordinary Income | $ 70,609 | $ 59,373 |
4. Operating Policies.
Restricted Securities. The Fund may invest in securities that are subject to legal or contractual restrictions on resale. These securities generally may be resold in transactions exempt from registration or to the public if the securities are registered. Disposal of these securities may involve time-consuming negotiations and expense, and prompt sale at an acceptable price may be difficult. Information regarding restricted securities is included at the end of the Fund's Schedule of Investments.
5. Derivative Instruments.
Risk Exposures and the Use of Derivative Instruments. The Fund uses derivative instruments (derivatives), including futures contracts, in order to meet its investment objectives. The strategy is to use derivatives to increase returns and to manage exposure to certain risks as defined below. The success of any strategy involving derivatives depends on analysis of numerous economic factors, and if the strategies for investment do not work as intended, the Fund may not achieve its objectives.
Annual Report
Notes to Financial Statements - continued
(Amounts in thousands except ratios)
5. Derivative Instruments - continued
Risk Exposures and the Use of Derivative Instruments - continued
The Fund's use of derivatives may increase or decrease its exposure to the following risk:
Equity Risk | Equity risk relates to the fluctuations in the value of financial instruments as a result of changes in market prices (other than those arising from interest rate risk or foreign exchange risk), whether caused by factors specific to an individual investment, its issuer, or all factors affecting all instruments traded in a market or market segment. |
The Fund is also exposed to additional risks from investing in derivatives, such as liquidity risk and counterparty credit risk. Liquidity risk is the risk that the Fund will be unable to sell the derivative in the open market in a timely manner. Counterparty credit risk is the risk that the counterparty will not be able to fulfill its obligation to the Fund. The Fund's maximum risk of loss from counterparty credit risk is generally the aggregate unrealized appreciation and unpaid counterparty fees in excess of any collateral pledged by the counterparty to the Fund. Counterparty risk related to exchange-traded futures contracts is minimal because of the protection provided by the exchange on which they trade. Risk of loss may exceed the amounts recognized in the Statement of Assets and Liabilities.
Futures Contracts. A futures contract is an agreement between two parties to buy or sell a specified underlying instrument for a fixed price at a specified future date. The Fund uses futures contracts to manage its exposure to the stock market.
Upon entering into a futures contract, a fund is required to deposit either cash or securities (initial margin) with a clearing broker in an amount equal to a certain percentage of the face value of the contract. Futures contracts are marked-to-market daily and subsequent payments (variation margin) are made or received by a fund depending on the daily fluctuations in the value of the futures contracts and are recorded as unrealized appreciation or (depreciation). Realized gain or (loss) is recorded upon the expiration or closing of a futures contract.
The underlying face amount at value of open futures contracts at period end is shown in the Schedule of Investments under the caption "Futures Contracts." This amount reflects each contract's exposure to the underlying instrument at period end and is representative of activity for the period. Securities deposited to meet initial margin requirements are identified in the Schedule of Investments. The receivable and/or payable for the variation margin are reflected in the Statement of Assets and Liabilities.
Certain risks may arise upon entering into futures contracts, including the risk that an illiquid market may limit the ability to close out a futures contract prior to settlement date.
During the period the Fund recognized net realized gain (loss) of $3,574 and a change in net unrealized appreciation (depreciation) of $447 related to its investment in futures contracts. These amounts are included in the Statement of Operations.
Annual Report
6. Purchases and Sales of Investments.
Purchases and sales of securities, other than short-term securities, aggregated $11,847,044 and $13,272,765, respectively.
7. Fees and Other Transactions with Affiliates.
Management Fee. FMR and its affiliates provide the Fund with investment management related services for which the Fund pays a monthly management fee. The management fee is the sum of an individual fund fee rate that is based on an annual rate of .30% of the Fund's average net assets and a group fee rate that averaged .26% during the period. The group fee rate is based upon the average net assets of all the mutual funds advised by FMR. The group fee rate decreases as assets under management increase and increases as assets under management decrease. In addition, the management fee is subject to a performance adjustment (up to a maximum of ± .20% of the Fund's average net assets over a 36 month performance period). The upward or downward adjustment to the management fee is based on the relative investment performance of the retail class of the Fund, Value, as compared to an appropriate benchmark index. For the period, the total annual management fee rate, including the performance adjustment, was .39% of the Fund's average net assets.
Transfer Agent Fees. Fidelity Investments Institutional Operations Company, Inc. (FIIOC), an affiliate of FMR, is the transfer, dividend disbursing and shareholder servicing agent for each class of the Fund. FIIOC receives account fees and asset-based fees that vary according to the account size and type of account of the shareholders of Value. FIIOC receives an asset-based fee of Class K's average net assets. FIIOC pays for typesetting, printing and mailing of shareholder reports, except proxy statements. For the period, transfer agent fees for each class were as follows:
| Amount | % of
Average
Net Assets |
Value | $ 17,106 | .23 |
Class K | 342 | .05 |
| $ 17,448 | |
Accounting and Security Lending Fees. Fidelity Service Company, Inc. (FSC), an affiliate of FMR, maintains the Fund's accounting records. The accounting fee is based on the level of average net assets for the month. Under a separate contract, FSC administers the security lending program. The security lending fee is based on the number and duration of lending transactions.
Annual Report
Notes to Financial Statements - continued
(Amounts in thousands except ratios)
7. Fees and Other Transactions with Affiliates - continued
Brokerage Commissions. The Fund placed a portion of its portfolio transactions with brokerage firms which are affiliates of the investment adviser. The commissions paid to these affiliated firms were $271 for the period.
Interfund Lending Program. Pursuant to an Exemptive Order issued by the SEC, the Fund, along with other registered investment companies having management contracts with FMR, may participate in an interfund lending program. This program provides an alternative credit facility allowing the funds to borrow from, or lend money to, other participating affiliated funds. At period end, there were no interfund loans outstanding. The Fund's activity in this program during the period for which loans were outstanding was as follows:
Borrower or Lender | Average Daily
Loan Balance | Weighted Average
Interest Rate | Interest
Expense |
Borrower | $ 13,513 | .41% | $ 8 |
8. Committed Line of Credit.
The Fund participates with other funds managed by FMR or an affiliate in a $3.75 billion credit facility (the "line of credit") to be utilized for temporary or emergency purposes to fund shareholder redemptions or for other short-term liquidity purposes. The Fund has agreed to pay commitment fees on its pro-rata portion of the line of credit, which amounted to $32 and is reflected in Miscellaneous expenses on the Statement of Operations. During the period, there were no borrowings on this line of credit.
9. Security Lending.
The Fund lends portfolio securities through a lending agent from time to time in order to earn additional income. The lending agent may loan securities to certain qualified borrowers, including Fidelity Capital Markets (FCM), a broker-dealer affiliated with the Fund. On the settlement date of the loan, the Fund receives collateral (in the form of U.S. Treasury obligations, letters of credit and/or cash) against the loaned securities and maintains collateral in an amount not less than 100% of the market value of the loaned securities during the period of the loan. The market value of the loaned securities is determined at the close of business of the Fund and any additional required collateral is delivered to the Fund on the next business day. If the borrower defaults on its obligation to return the securities loaned because of insolvency or other reasons, a fund could experience delays and costs in recovering the securities loaned or in gaining access to the collateral. Any cash collateral received is invested in the Fidelity Securities Lending Cash Central Fund. The value of loaned securities and cash collateral at period end are disclosed on the Fund's Statement of Assets and Liabilities. Security lending income
Annual Report
9. Security Lending - continued
represents the income earned on investing cash collateral, less rebates paid to borrowers and lending agent fees associated with the loan, plus any premium payments received for lending certain types of securities. Security lending income is presented in the Statement of Operations as a component of income from Fidelity Central Funds. Total security lending income during the period amounted to $643.
10. Bank Borrowings.
The Fund is permitted to have bank borrowings for temporary or emergency purposes to fund shareholder redemptions. The Fund has established borrowing arrangements with certain banks. The interest rate on the borrowings is the bank's base rate, as revised from time to time. The average daily loan balance during the period for which loans were outstanding amounted to $32,110. The weighted average interest rate was .70%. The interest expense amounted to $2 under the bank borrowing program. At period end, there were no bank borrowings outstanding.
11. Expense Reductions.
Many of the brokers with whom FMR places trades on behalf of the Fund provided services to the Fund in addition to trade execution. These services included payments of certain expenses on behalf of the Fund totaling $850 for the period.
12. Distributions to Shareholders.
Distributions to shareholders of each class were as follows:
Years ended October 31, | 2010 | 2009 |
From net investment income | | |
Value | $ 65,010 | $ 58,273 |
Class K | 5,599 | 1,100 |
Total | $ 70,609 | $ 59,373 |
Annual Report
Notes to Financial Statements - continued
(Amounts in thousands except ratios)
13. Share Transactions.
Transactions for each class of shares were as follows:
| Shares | Dollars |
Years ended October 31, | 2010 | 2009 A | 2010 | 2009 A |
Value | | | | |
Shares sold | 15,905 | 25,560 | $ 953,857 | $ 1,067,061 |
Conversion to Class K | - | (5,438) | - | (212,325) |
Reinvestment of distributions | 1,127 | 1,539 | 62,576 | 56,603 |
Shares redeemed | (43,950) | (133,977) | (2,561,113) | (5,186,771) |
Net increase (decrease) | (26,918) | (112,316) | $ (1,544,680) | $ (4,275,432) |
Class K | | | | |
Shares sold | 9,653 | 1,937 | $ 558,763 | $ 85,453 |
Conversion from Value | - | 5,430 | - | 212,325 |
Reinvestment of distributions | 101 | 30 | 5,599 | 1,100 |
Shares redeemed | (5,506) | (2,118) | (328,332) | (92,251) |
Net increase (decrease) | 4,248 | 5,279 | $ 236,030 | $ 206,627 |
A Conversion transactions for Value and Class K are presented for the period November 1, 2008 through August 31, 2009.
14. Other.
The Fund's organizational documents provide former and current trustees and officers with a limited indemnification against liabilities arising in connection with the performance of their duties to the Fund. In the normal course of business, the Fund may also enter into contracts that provide general indemnifications. The Fund's maximum exposure under these arrangements is unknown as this would be dependent on future claims that may be made against the Fund. The risk of material loss from such claims is considered remote.
Annual Report
To the Trustees of Fidelity Capital Trust and the Shareholders of Fidelity Value Fund:
In our opinion, the accompanying statement of assets and liabilities, including the schedule of investments, and the related statements of operations and of changes in net assets and the financial highlights present fairly, in all material respects, the financial position of Fidelity Value Fund (a fund of Fidelity Capital Trust) at October 31, 2010, the results of its operations for the year then ended, the changes in its net assets for each of the two years in the period then ended and the financial highlights for each of the periods indicated, in conformity with accounting principles generally accepted in the United States of America. These financial statements and financial highlights (hereafter referred to as "financial statements") are the responsibility of the Fidelity Value Fund's management. Our responsibility is to express an opinion on these financial statements based on our audits. We conducted our audits of these financial statements in accordance with the standards of the Public Company Accounting Oversight Board (United States). Those standards require that we plan and perform the audit to obtain reasonable assurance about whether the financial statements are free of material misstatement. An audit includes examining, on a test basis, evidence supporting the amounts and disclosures in the financial statements, assessing the accounting principles used and significant estimates made by management, and evaluating the overall financial statement presentation. We believe that our audits, which included confirmation of securities at October 31, 2010 by correspondence with the custodian and brokers, provide a reasonable basis for our opinion.
/s/ PricewaterhouseCoopers LLP
PricewaterhouseCoopers LLP
Boston, Massachusetts
December 10, 2010
Annual Report
The Trustees, Member of the Advisory Board, and executive officers of the trust and fund, as applicable, are listed below. The Board of Trustees governs the fund and is responsible for protecting the interests of shareholders. The Trustees are experienced executives who meet periodically throughout the year to oversee the fund's activities, review contractual arrangements with companies that provide services to the fund, oversee management of the risks associated with such activities and contractual arrangements, and review the fund's performance. Except for James C. Curvey, each of the Trustees oversees 221 funds advised by FMR or an affiliate. Mr. Curvey oversees 410 funds advised by FMR or an affiliate.
The Trustees hold office without limit in time except that (a) any Trustee may resign; (b) any Trustee may be removed by written instrument, signed by at least two-thirds of the number of Trustees prior to such removal; (c) any Trustee who requests to be retired or who has become incapacitated by illness or injury may be retired by written instrument signed by a majority of the other Trustees; and (d) any Trustee may be removed at any special meeting of shareholders by a two-thirds vote of the outstanding voting securities of the trust. Each Trustee who is not an interested person (as defined in the 1940 Act) (Independent Trustee), shall retire not later than the last day of the calendar year in which his or her 72nd birthday occurs. The Independent Trustees may waive this mandatory retirement age policy with respect to individual Trustees. The executive officers and Advisory Board Member hold office without limit in time, except that any officer and Advisory Board Member may resign or may be removed by a vote of a majority of the Trustees at any regular meeting or any special meeting of the Trustees. Except as indicated, each individual has held the office shown or other offices in the same company for the past five years.
Experience, Skills, Attributes, and Qualifications of the Fund's Trustees. The Governance and Nominating Committee has adopted a statement of policy that describes the experience, qualifications, attributes, and skills that are necessary and desirable for potential Independent Trustee candidates (Statement of Policy). The Board believes that each Trustee satisfied at the time he or she was initially elected or appointed a Trustee, and continues to satisfy, the standards contemplated by the Statement of Policy. The Governance and Nominating Committee also engages professional search firms to help identify potential Independent Trustee candidates who have the experience, qualifications, attributes, and skills consistent with the Statement of Policy. From time to time, additional criteria based on the composition and skills of the current Independent Trustees, as well as experience or skills that may be appropriate in light of future changes to board composition, business conditions, and regulatory or other developments, have also been considered by the professional search firms and the Governance and Nominating Committee. In addition, the Board takes into account the Trustees' commitment and participation in Board and committee meetings, as well as their leadership of standing and ad hoc committees throughout their tenure.
In determining that a particular Trustee was and continues to be qualified to serve as a Trustee, the Board has considered a variety of criteria, none of which, in isolation, was controlling. The Board believes that, collectively, the Trustees have balanced and diverse experience, qualifications, attributes, and skills, which allow the Board to operate effectively in governing the fund and protecting the interests of shareholders. Information about the specific experience, skills, attributes, and qualifications of each Trustee, which in each case led to the Board's conclusion that the Trustee should serve (or continue to serve) as a trustee of the fund, is provided below.
Annual Report
Board Structure and Oversight Function. Edward C. Johnson 3d is an interested person (as defined in the 1940 Act) and currently serves as Chairman. The Trustees have determined that an interested Chairman is appropriate and benefits shareholders because an interested Chairman has a personal and professional stake in the quality and continuity of services provided to the fund. Independent Trustees exercise their informed business judgment to appoint an individual of their choosing to serve as Chairman, regardless of whether the Trustee happens to be independent or a member of management. The Independent Trustees have determined that they can act independently and effectively without having an Independent Trustee serve as Chairman and that a key structural component for assuring that they are in a position to do so is for the Independent Trustees to constitute a substantial majority for the Board. The Independent Trustees also regularly meet in executive session. Ned C. Lautenbach serves as Chairman of the Independent Trustees and as such (i) acts as a liaison between the Independent Trustees and management with respect to matters important to the Independent Trustees and (ii) with management prepares agendas for Board meetings.
Fidelity funds are overseen by different Boards of Trustees. The fund's Board oversees Fidelity's equity and high income funds and another Board oversees Fidelity's investment-grade bond, money market, and asset allocation funds. The asset allocation funds may invest in Fidelity funds overseen by the fund's Board. The use of separate Boards, each with its own committee structure, allows the Trustees of each group of Fidelity funds to focus on the unique issues of the funds they oversee, including common research, investment, and operational issues. On occasion, the separate Boards establish joint committees to address issues of overlapping consequences for the Fidelity funds overseen by each Board.
The Trustees operate using a system of committees to facilitate the timely and efficient consideration of all matters of importance to the Trustees, the fund, and fund shareholders and to facilitate compliance with legal and regulatory requirements and oversight of the fund's activities and associated risks. The Board, acting through its committees, has charged FMR and its affiliates with (i) identifying events or circumstances the occurrence of which could have demonstrably adverse effects on the fund's business and/or reputation; (ii) implementing processes and controls to lessen the possibility that such events or circumstances occur or to mitigate the effects of such events or circumstances if they do occur; and (iii) creating and maintaining a system designed to evaluate continuously business and market conditions in order to facilitate the identification and implementation processes described in (i) and (ii) above. Because the day-to-day operations and activities of the fund are carried out by or through FMR, its affiliates and other service providers, the fund's exposure to risks is mitigated but not eliminated by the processes overseen by the Trustees. While each of the Board's committees has responsibility for overseeing different aspects of the fund's activities, oversight is exercised primarily through the Operations, Audit, and Compliance Committees. Appropriate personnel, including but not limited to the fund's Chief Compliance Officer (CCO), FMR's internal auditor, the independent accountants, the fund's Treasurer and portfolio management personnel, make periodic reports to the Board's committees, as appropriate. The responsibilities of each committee, including their oversight responsibilities, are described further under "Standing Committees of the Fund's Trustees."
Annual Report
Trustees and Officers - continued
The fund's Statement of Additional Information (SAI) includes more information about the Trustees. To request a free copy, call Fidelity at 1-800-544-8544.
Interested Trustees*:
Correspondence intended for each Trustee who is an interested person may be sent to Fidelity Investments, 82 Devonshire Street, Boston, Massachusetts 02109.
Name, Age; Principal Occupations and Other Relevant Experience+ |
Edward C. Johnson 3d (80) |
| Year of Election or Appointment: 1978 Mr. Johnson is Trustee and Chairman of the Board of Trustees of certain Trusts. Mr. Johnson serves as Chief Executive Officer, Chairman, and a Director of FMR LLC; Chairman and a Director of FMR; Chairman and a Director of Fidelity Research & Analysis Company (FRAC); Chairman and a Director of Fidelity Investments Money Management, Inc.; and Chairman and a Director of FMR Co., Inc. In addition, Mr. Johnson serves as Chairman and Director of FIL Limited. Previously, Mr. Johnson served as President of FMR LLC (2006-2007). |
James C. Curvey (75) |
| Year of Election or Appointment: 2007 Mr. Curvey also serves as Trustee (2007-present) of other investment companies advised by FMR. Mr. Curvey is a Director of Fidelity Investments Money Management, Inc. (2009-present), Director of Fidelity Research & Analysis Co. (2009-present) and Director of FMR and FMR Co., Inc. (2007-present). Mr. Curvey is also Vice Chairman (2007-present) and Director of FMR LLC. In addition, Mr. Curvey serves as an Overseer for the Boston Symphony Orchestra and a member of the Trustees of Villanova University. Previously, Mr. Curvey was the Vice Chairman (2006-2007) and Director (2000-2007) of FMR Corp. |
* Trustees have been determined to be "Interested Trustees" by virtue of, among other things, their affiliation with the trust or various entities under common control with FMR.
+ The information above includes each Trustee's principal occupation during the last five years and other information relating to the experience, attributes, and skills relevant to each Trustee's qualifications to serve as a Trustee, which led to the conclusion that each Trustee should serve as a Trustee for the fund.
Independent Trustees:
Correspondence intended for each Independent Trustee (that is, the Trustees other than the Interested Trustees) may be sent to Fidelity Investments, P.O. Box 55235, Boston, Massachusetts 02205-5235.
Name, Age; Principal Occupations and Other Relevant Experience+ |
Dennis J. Dirks (62) |
| Year of Election or Appointment: 2005 Prior to his retirement in May 2003, Mr. Dirks was Chief Operating Officer and a member of the Board of The Depository Trust & Clearing Corporation (DTCC). He also served as President, Chief Operating Officer, and Board member of The Depository Trust Company (DTC) and President and Board member of the National Securities Clearing Corporation (NSCC). In addition, Mr. Dirks served as Chief Executive Officer and Board member of the Government Securities Clearing Corporation, Chief Executive Officer and Board member of the Mortgage-Backed Securities Clearing Corporation, as a Trustee and a member of the Finance Committee of Manhattan College (2005-2008), and as a Trustee and a member of the Finance Committee of AHRC of Nassau County (2006-2008). Mr. Dirks is a member of the Independent Directors Council (IDC) Governing Council (2010-Present) and Board of Directors for The Brookville Center for Children's Services, Inc. (2009-present). |
Alan J. Lacy (57) |
| Year of Election or Appointment: 2008 Mr. Lacy serves as Senior Adviser (2007-present) of Oak Hill Capital Partners, L.P. (private equity). Mr. Lacy also served as Chief Executive Officer (2000-2005) and Vice Chairman (2005-2006) of Sears Holdings Corporation and Sears, Roebuck and Co. (retail). In addition, Mr. Lacy serves as a member of the Board of Directors of The Western Union Company (global money transfer, 2006-present) and Bristol-Myers Squibb Company (global pharmaceuticals, 2007-present). Mr. Lacy is Chairman (2008-present) and a member (2006-present) of the Board of Trustees of The National Parks Conservation Association. |
Ned C. Lautenbach (66) |
| Year of Election or Appointment: 2000 Mr. Lautenbach is Chairman of the Independent Trustees of the Equity and High Income Funds (2006-present). Mr. Lautenbach currently serves as the Lead Director of the Eaton Corporation Board of Directors (diversified industrial, 1997-present). Mr. Lautenbach is also a member of the Board of Directors of the Philharmonic Center for the Arts in Naples, Florida (1999 - present); a member of the Board of Trustees of Fairfield University (2005-present); and a member of the Council on Foreign Relations (1994 - present). Previously, Mr. Lautenbach was a Partner/Advisory Partner at Clayton, Dubilier & Rice, Inc. (private equity investment, 1998-2010), as well as a Director of Sony Corporation (2006-2007). |
Joseph Mauriello (66) |
| Year of Election or Appointment: 2008 Prior to his retirement in January 2006, Mr. Mauriello served in numerous senior management positions including Deputy Chairman and Chief Operating Officer (2004-2005), and Vice Chairman of Financial Services (2002-2004) of KPMG LLP US (professional services, 1965-2005). Mr. Mauriello currently serves as a member of the Board of Directors of XL Group plc. (global insurance and re-insurance, 2006-present) and of Arcadia Resources Inc. (health care services and products, 2007-present). Previously, Mr. Mauriello served as a Director of the Hamilton Funds of the Bank of New York (2006-2007). |
Cornelia M. Small (66) |
| Year of Election or Appointment: 2005 Ms. Small is a member of the Board of Directors of the Teagle Foundation (2009-present). Ms. Small is also a member of the Investment Committee, and Chair (2008-present) and a member of the Board of Trustees of Smith College. In addition, Ms. Small serves on the Investment Committee of the Berkshire Taconic Community Foundation (2008-present). Previously, Ms. Small served as Chairperson of the Investment Committee (2002-2008) of Smith College. In addition, Ms. Small served as Chief Investment Officer, Director of Global Equity Investments, and a member of the Board of Directors of Scudder, Stevens & Clark and Scudder Kemper Investments. |
William S. Stavropoulos (71) |
| Year of Election or Appointment: 2002 Mr. Stavropoulos is Vice Chairman of the Independent Trustees of the Equity and High Income Funds (2006-present). Mr. Stavropoulos serves as President and Founder of the Michigan Baseball Foundation, the Great Lakes Loons (2007-present). Mr. Stavropoulos is Chairman Emeritus of the Board of Directors of The Dow Chemical Company, where he previously served in numerous senior management positions, including President, CEO (1995-2000; 2002-2004), Chairman of the Executive Committee (2000-2006), and as a member of the Board of Directors (1990-2006). Currently, Mr. Stavropoulos is Chairman of Univar (global distributor of commodity and specialty chemicals, 2010-present), a Director of Teradata Corporation (data warehousing and technology solutions, 2008-present), Chemical Financial Corporation, Maersk Inc. (industrial conglomerate), Tyco International, Inc. (multinational manufacturing and services, 2007-present), and a member of the Advisory Board for Metalmark Capital (private equity investment, 2005-present). Mr. Stavropoulos is a special advisor to Clayton, Dubilier & Rice, Inc. (private equity investment). In addition, Mr. Stavropoulos is a member of the University of Notre Dame Advisory Council for the College of Science. |
David M. Thomas (61) |
| Year of Election or Appointment: 2008 Previously, Mr. Thomas served as Executive Chairman (2005-2006) and Chairman and Chief Executive Officer (2000-2005) of IMS Health, Inc. (pharmaceutical and healthcare information solutions). In addition, Mr. Thomas serves as a member of the Board of Directors of Fortune Brands, Inc. (consumer products), and Interpublic Group of Companies, Inc. (marketing communication, 2004-present). |
Michael E. Wiley (60) |
| Year of Election or Appointment: 2008 Mr. Wiley also serves as a Director of Asia Pacific Exploration Consolidated (international oil and gas exploration and production, 2008-present). Mr. Wiley serves as a Director of Tesoro Corporation (independent oil refiner and marketer, 2005-present), and a Director of Bill Barrett Corporation (exploration and production, 2005-present). In addition, Mr. Wiley also serves as a Director of Post Oak Bank (privately-held bank, 2004-present). Previously, Mr. Wiley served as a member of the Board of Trustees of the University of Tulsa (2000-2006; 2007-2010), as a Senior Energy Advisor of Katzenbach Partners, LLC (consulting, 2006-2007), as an Advisory Director of Riverstone Holdings (private investment), Chairman, President, and CEO of Baker Hughes, Inc. (oilfield services, 2000-2004), and as Director of Spinnaker Exploration Company (exploration and production, 2001-2005). |
+ The information above includes each Trustee's principal occupation during the last five years and other information relating to the experience, attributes, and skills relevant to each Trustee's qualifications to serve as a Trustee, which led to the conclusion that each Trustee should serve as a Trustee for the fund.
Advisory Board Member and Executive Officers:
Correspondence intended for each executive officer and Peter S. Lynch may be sent to Fidelity Investments, 82 Devonshire Street, Boston, Massachusetts 02109.
Name, Age; Principal Occupation |
Peter S. Lynch (66) |
| Year of Election or Appointment: 2003 Member of the Advisory Board of Fidelity's Equity and High Income Funds. Mr. Lynch is Vice Chairman and a Director of FMR and FMR Co., Inc. In addition, Mr. Lynch serves as a Trustee of Boston College and as the Chairman of the Inner-City Scholarship Fund. Previously, Mr. Lynch served on the Special Olympics International Board of Directors (1997-2006). |
Kenneth B. Robins (41) |
| Year of Election or Appointment: 2008 President and Treasurer of Fidelity's Equity and High Income Funds. Mr. Robins also serves as President and Treasurer (2010-present) and Assistant Treasurer (2009-present) of other Fidelity funds and is an employee of Fidelity Investments (2004-present). Previously, Mr. Robins served as Deputy Treasurer of the Fidelity funds (2005-2008) and Treasurer and Chief Financial Officer of The North Carolina Capital Management Trust: Cash and Term Portfolios (2006-2008). |
Brian B. Hogan (46) |
| Year of Election or Appointment: 2009 Vice President of certain Equity Funds and Vice President of Sector Funds. Mr. Hogan also serves as President of FMR's Equity Division (2009-present). Previously, Mr. Hogan served as Senior Vice President, Equity Research of FMR (2006-2009) and as a portfolio manager. |
Thomas C. Hense (46) |
| Year of Election or Appointment: 2008 or 2010 Vice President of Fidelity's High Income (2008), Small Cap (2008), and Value (2010) Funds. Previously, Mr. Hense served as a portfolio manager for Fidelity's Institutional Money Management Group (Pyramis) (2003-2008). |
Scott C. Goebel (42) |
| Year of Election or Appointment: 2008 Secretary and Chief Legal Officer (CLO) of the Fidelity funds. Mr. Goebel also serves as Secretary and CLO of The North Carolina Capital Management Trust: Cash and Term Portfolio (2008-present); General Counsel, Secretary, and Senior Vice President of FMR (2008-present) and FMR Co., Inc. (2008-present); Deputy General Counsel of FMR LLC; Chief Legal Officer of Fidelity Management & Research (Hong Kong) Limited (2008-present) and Assistant Secretary of Fidelity Management & Research (Japan) Inc. (2008-present), Fidelity Investments Money Management, Inc. (2008-present), Fidelity Management & Research (U.K.) Inc. (2008-present), and Fidelity Research and Analysis Company (2008-present). Previously, Mr. Goebel served as Assistant Secretary of the Funds (2007-2008) and as Vice President and Secretary of Fidelity Distributors Corporation (FDC) (2005-2007). |
William C. Coffey (41) |
| Year of Election or Appointment: 2009 Assistant Secretary of Fidelity's Equity and High Income Funds. Mr. Coffey also serves as Senior Vice President and Deputy General Counsel of FMR LLC (2010-present), and is an employee of Fidelity Investments. Previously, Mr. Coffey served as Vice President and Associate General Counsel of FMR LLC (2005-2009). |
Holly C. Laurent (56) |
| Year of Election or Appointment: 2008 Anti-Money Laundering (AML) Officer of the Fidelity funds. Ms. Laurent also serves as AML Officer of The North Carolina Capital Management Trust: Cash and Term Portfolio (2008-present) and is an employee of Fidelity Investments. Previously, Ms. Laurent was Senior Vice President and Head of Legal for Fidelity Business Services India Pvt. Ltd. (2006-2008), and Senior Vice President, Deputy General Counsel and Group Head for FMR LLC (2005-2006). |
Christine Reynolds (52) |
| Year of Election or Appointment: 2008 Chief Financial Officer of the Fidelity funds. Ms. Reynolds became President of Fidelity Pricing and Cash Management Services (FPCMS) in August 2008. Ms. Reynolds served as Chief Operating Officer of FPCMS (2007-2008). Previously, Ms. Reynolds served as President, Treasurer, and Anti-Money Laundering officer of the Fidelity funds (2004-2007). |
Kenneth A. Rathgeber (63) |
| Year of Election or Appointment: 2004 Chief Compliance Officer of Fidelity's Equity and High Income Funds. Mr. Rathgeber is Chief Compliance Officer of Fidelity Management & Research (Hong Kong) Limited (2008-present), Fidelity Management & Research (Japan) Inc. (2008-present), FMR (2005-present), FMR Co., Inc. (2005-present), Fidelity Management & Research (U.K.) Inc. (2005-present), Fidelity Research & Analysis Company (2005-present), Fidelity Investments Money Management, Inc. (2005-present), Pyramis Global Advisors, LLC (2005-present), and Strategic Advisers, Inc. (2005-present). |
Jeffrey S. Christian (49) |
| Year of Election or Appointment: 2009 Deputy Treasurer of the Fidelity funds. Mr. Christian is an employee of Fidelity Investments. Previously, Mr. Christian served as Chief Financial Officer (2008-2009) of certain Fidelity funds and Senior Vice President of Fidelity Pricing and Cash Management Services (FPCMS) (2004-2009). |
Bryan A. Mehrmann (49) |
| Year of Election or Appointment: 2005 Deputy Treasurer of the Fidelity funds. Mr. Mehrmann is an employee of Fidelity Investments. |
Adrien E. Deberghes (43) |
| Year of Election or Appointment: 2008 Deputy Treasurer of Fidelity's Equity and High Income Funds. Mr. Deberghes also serves as Assistant Treasurer of other Fidelity funds (2010-present) and is an employee of Fidelity Investments (2008-present). Previously, Mr. Deberghes served as Senior Vice President of Mutual Fund Administration at State Street Corporation (2007-2008), Senior Director of Mutual Fund Administration at Investors Bank & Trust (2005-2007), and Director of Finance for Dunkin' Brands (2000-2005). |
Stephanie J. Dorsey (41) |
| Year of Election or Appointment: 2010 Assistant Treasurer of Fidelity's Equity and High Income Funds. Ms. Dorsey also serves as Deputy Treasurer of other Fidelity funds (2008-present) and is an employee of Fidelity Investments (2008-present). Previously, Ms. Dorsey served as Treasurer (2004-2008) of the JPMorgan Mutual Funds and Vice President (2004-2008) of JPMorgan Chase Bank. |
John R. Hebble (52) |
| Year of Election or Appointment: 2009 Assistant Treasurer of Fidelity's Equity and High Income Funds. Mr. Hebble also serves as Treasurer and Chief Financial Officer of The North Carolina Capital Management Trust: Cash and Term Portfolio (2008-present), President and Treasurer of other Fidelity funds (2008-present) and is an employee of Fidelity Investments. |
Gary W. Ryan (52) |
| Year of Election or Appointment: 2005 Assistant Treasurer of the Fidelity funds. Mr. Ryan is an employee of Fidelity Investments. Previously, Mr. Ryan served as Vice President of Fund Reporting in Fidelity Pricing and Cash Management Services (FPCMS) (1999-2005). |
Jonathan Davis (42) |
| Year of Election or Appointment: 2010 Assistant Treasurer of the Fidelity funds. Mr. Davis is an employee of Fidelity Investments. Previously, Mr. Davis served as Vice President and Associate General Counsel of FMR LLC (2003-2010). |
Annual Report
The Board of Trustees of Fidelity Value Fund voted to pay on December 6, 2010, to shareholders of record at the opening of business on December 3, 2010, a distribution of $.02 per share derived from capital gains realized from sales of portfolio securities and a dividend of $.88 per share from net investment income.
Fidelity Value Fund designates 100% of the dividends distributed during the fiscal year as qualifying for the dividends-received deduction for corporate shareholders.
Fidelity Value Fund designates 100% of the dividends distributed in during the fiscal year as amounts which may be taken into account as a dividend for the purposes of the maximum rate under section 1(h)(11) of the Internal Revenue Code.
The fund will notify shareholders in January 2011 of amounts for use in preparing 2010 income tax returns.
Annual Report
Board Approval of Investment Advisory Contracts and Management Fees
Fidelity Value Fund
Each year, the Board of Trustees, including the Independent Trustees (together, the Board), votes on the renewal of the management contract and sub-advisory agreements (together, the Advisory Contracts) for the fund. The Board, assisted by the advice of fund counsel and Independent Trustees' counsel, requests and considers a broad range of information relevant to the renewal of the Advisory Contracts throughout the year.
The Board meets regularly and considers at each of its meetings factors that are relevant to its annual consideration of the renewal of the fund's Advisory Contracts, including the services and support provided to the fund and its shareholders. The Board has established various standing committees, each composed of Independent Trustees with varying backgrounds, to which the Board has assigned specific subject matter responsibilities in order to enhance effective decision-making by the Board. The Board, acting directly and through its Committees, requests and receives information concerning the annual consideration of the renewal of the fund's Advisory Contracts. The Board also meets as needed to consider matters specifically related to the Board's annual consideration of the renewal of Advisory Contracts. Members of the Board may also meet with trustees of other Fidelity funds through ad hoc joint committees to discuss certain matters relevant to the Fidelity funds.
At its July 2010 meeting, the Board of Trustees, including the Independent Trustees, unanimously determined to renew the fund's Advisory Contracts. In reaching its determination, the Board considered all factors it believed relevant, including (i) the nature, extent, and quality of the services to be provided to the fund and its shareholders (including the investment performance of the fund); (ii) the competitiveness of the fund's management fee and total expenses; (iii) the total costs of the services to be provided by and the profits to be realized by Fidelity from its relationship with the fund; (iv) the extent to which economies of scale would be realized as the fund grows; and (v) whether fee levels reflect these economies of scale, if any, for the benefit of fund shareholders.
In considering whether to renew the Advisory Contracts for the fund, the Board reached a determination, with the assistance of fund counsel and Independent Trustees' counsel and through the exercise of its business judgment, that the renewal of the Advisory Contracts is in the best interests of fund shareholders and that the compensation to be received by Fidelity under the management contract is fair and reasonable. The Board's decision to renew the Advisory Contracts was not based on any single factor noted above, but rather was based on a comprehensive consideration of all the information provided to the Board at its meetings throughout the year. The Board, in reaching its determination to renew the Advisory Contracts, is aware that shareholders in the fund have a broad range of investment choices available to them, including a wide choice among mutual funds offered by Fidelity's competitors, and that the fund's shareholders, with the opportunity to review and weigh the disclosure provided by the fund in its prospectus and other public disclosures, have chosen to invest in this fund, managed by Fidelity.
Annual Report
Nature, Extent, and Quality of Services Provided. The Board considered the staffing within the investment adviser, FMR, and the sub-advisers (together, the Investment Advisers), including the backgrounds of the fund's investment personnel and the fund's investment objective and discipline. The Independent Trustees also had discussions with senior management of Fidelity's investment operations and investment groups. The Board considered the structure of the portfolio manager compensation program and whether this structure provides appropriate incentives to act in the best interest of the fund.
Resources Dedicated to Investment Management and Support Services. The Board and the equity research subcommittee of the Board's Fund Oversight Committee reviewed the size, education, and experience of the Investment Advisers' investment staff, their use of technology, and the Investment Advisers' approach to recruiting, training, and retaining portfolio managers and other research, advisory, and management personnel. The Board noted that Fidelity's analysts have access to a variety of technological tools and market and securities data that enable them to perform both fundamental and quantitative analysis and to specialize in various disciplines. The Board considered Fidelity's extensive global research capabilities that enable the Investment Advisers to aggregate data from various sources in an effort to produce positive investment results. The Board also considered that Fidelity's portfolio managers and analysts have access to daily portfolio attribution that allows for monitoring of a fund's portfolio, as well as an electronic communication system that provides immediate real-time access to research concerning issuers and credit enhancers. The Board noted FMR's continued focus on strengthening the organization and discipline of equity portfolio management and research.
Shareholder and Administrative Services. The Board considered (i) the nature, extent, quality, and cost of advisory, administrative, and shareholder services performed by the Investment Advisers and their affiliates under the Advisory Contracts and under separate agreements covering transfer agency, pricing and bookkeeping, and securities lending services for the fund; (ii) the nature and extent of the investment adviser's supervision of third party service providers, principally custodians and subcustodians; and (iii) the resources devoted to, and the record of compliance with, the fund's compliance policies and procedures. The Board also reviewed the allocation of fund brokerage, including allocations to brokers affiliated with the Investment Advisers, the use of brokerage commissions to pay fund expenses, and the use of "soft" commission dollars to pay for research services.
The Board noted that the growth of fund assets over time across the complex allows Fidelity to reinvest in the development of services designed to enhance the value or convenience of the Fidelity funds as investment vehicles. These services include 24-hour access to account information and market information through phone representatives and over the Internet, and investor education materials and asset allocation tools.
Annual Report
Board Approval of Investment Advisory Contracts and
Management Fees - continued
Investment in a Large Fund Family. The Board considered the benefits to shareholders of investing in a Fidelity fund, including the benefits of investing in a fund that is part of a large family of funds offering a variety of investment disciplines and providing a large variety of mutual fund investor services. The Board noted that Fidelity had taken, or had made recommendations that resulted in the Fidelity funds taking, a number of actions over the previous year that benefited particular funds, including (i) dedicating additional resources to investment research and restructuring and broadening the focus of the investment research teams; (ii) bolstering the senior management team that oversees asset management; (iii) launching Class F of certain funds as a lower-fee class available to Freedom K and Freedom Index Funds; (iv) lowering the initial investment minimums and ongoing balance requirements for Real Estate High Income Fund; (v) eliminating subsequent purchase minimums for all funds and adding a waiver of the investment minimum requirement for new accounts opened with the proceeds of a systematic withdrawal plan; (vi) eliminating the withdrawal minimum and maximum limits for systematic withdrawals from Advisor funds; (vii) expanding sales load waivers on Class A shares for Destiny Planholders and expanding Institutional Class eligibility for Class O Destiny Planholders; and (viii) changing certain Class A and Class T sales charge structures to further align them with industry practices.
Investment Performance. The Board considered whether the fund has operated in accordance with its investment objective, as well as its record of compliance with its investment restrictions. It also reviewed the fund's absolute investment performance for each class, as well as the fund's relative investment performance for each class measured over multiple periods against (i) a broad-based securities market index, and (ii) a peer group of mutual funds deemed appropriate by Fidelity and reviewed by the Board. The following charts considered by the Board show, over the one-, three-, and five-year periods ended December 31, 2009, as available, the cumulative total returns of Class K and the retail class of the fund, the cumulative total returns of a broad-based securities market index ("benchmark"), and a range of cumulative total returns of a peer group of mutual funds identified by Morningstar, Inc. as having an investment style similar to that of the fund based on underlying portfolio holdings. The box within each chart shows the 25th percentile return (bottom of box) and the 75th percentile return (top of box) of the peer group. Returns shown above the box are in the first quartile and returns shown below the box are in the fourth quartile. The percentage beaten numbers noted below each chart correspond to the percentile box and represent the percentage of funds in the peer group whose performance was equal to or lower than that of the class indicated.
Annual Report
Fidelity Value Fund
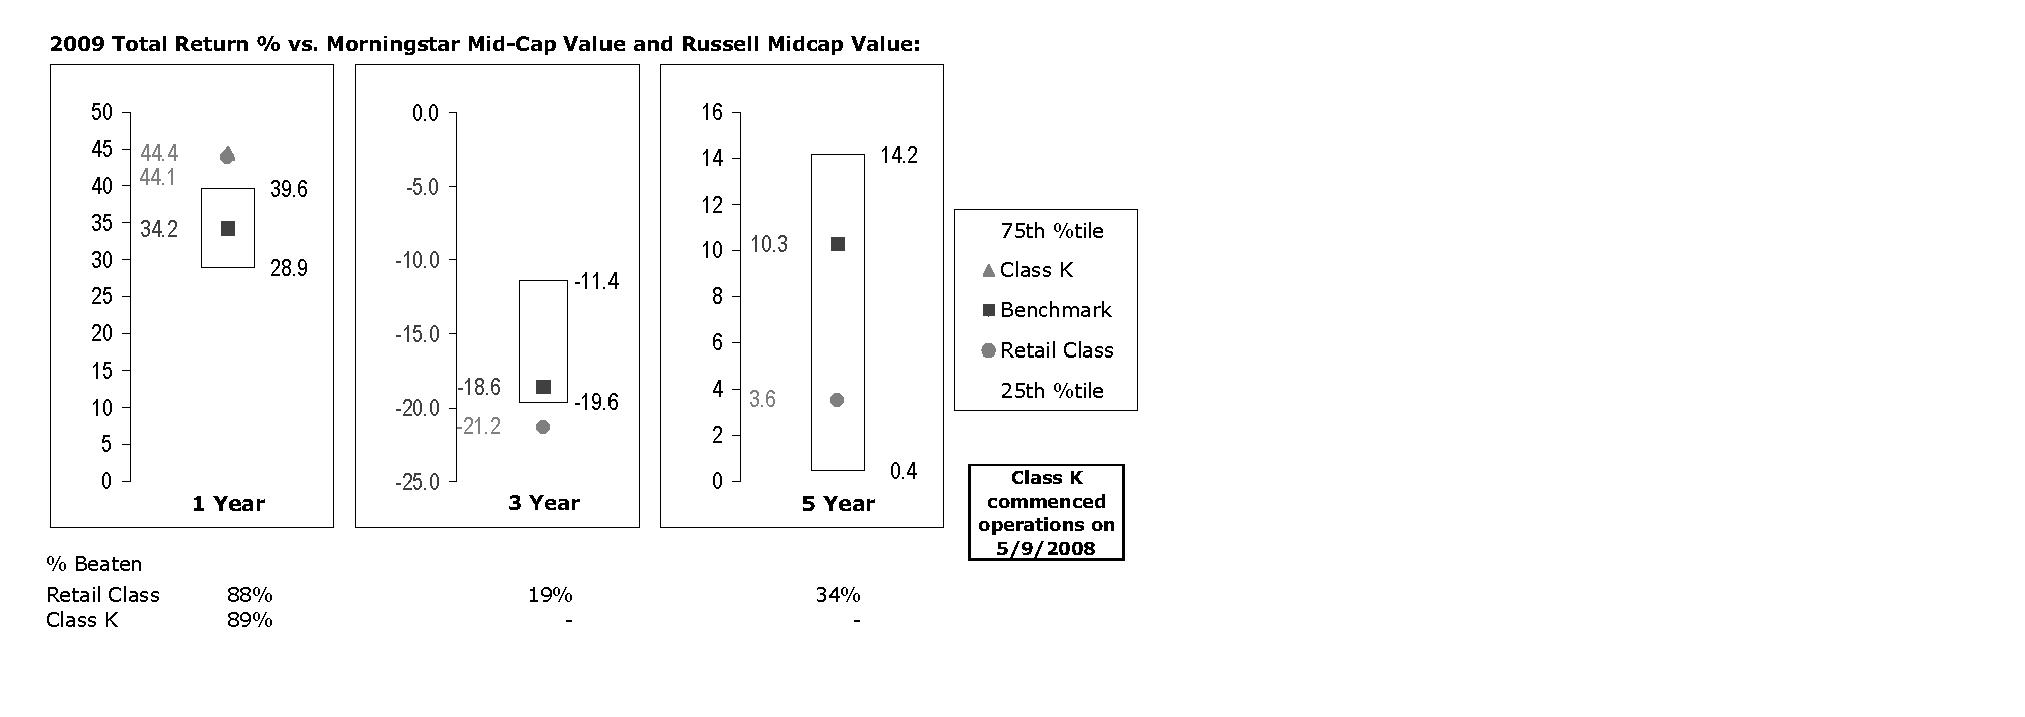
The Board reviewed the fund's relative investment performance against its peer group and noted that the performance of the retail class of the fund (the class with the longer performance record) was in the first quartile for the one-year period, the fourth quartile for the three-year period, and the third quartile for the five-year period. The Board also noted that the investment performance of the fund was lower than its benchmark for the three- and five-year periods, although the one-year cumulative total return of the retail class compared favorably to its benchmark. The Board considered that the variations in performance between the fund's classes reflect the variations in class expenses, which result in lower performance for the higher expense class. The Board also reviewed the fund's performance since inception as well as performance in the current year.
The Board also considered that the fund's management fee is subject to upward or downward adjustment depending upon whether, and to what extent, the fund's investment performance for the performance period exceeds, or is exceeded by, the record (over the same period) of a Board-approved performance adjustment index. The Board realizes that the performance adjustment provides FMR with a strong economic incentive to seek to achieve superior performance for the fund's shareholders and helps to more closely align the interests of FMR and the fund's shareholders.
Based on its review, and giving particular weight to the nature and quality of the resources dedicated by the Investment Advisers to maintain and improve relative performance and factoring in the unprecedented market events in recent years, the Board concluded that the nature, extent, and quality of investment management and support services and of shareholder and administrative services provided to the fund will benefit the fund's shareholders, particularly in light of the Board's view that the fund's shareholders benefit from investing in a fund that is part of a large family of funds offering a variety of investment disciplines and services.
Annual Report
Board Approval of Investment Advisory Contracts and
Management Fees - continued
Competitiveness of Management Fee and Total Fund Expenses. The Board considered the fund's management fee and total expenses compared to "mapped groups" of competitive funds and classes. Fidelity creates "mapped groups" by combining similar Lipper investment objective categories that have comparable management fee characteristics. Combining Lipper investment objective categories aids the Board's management fee and total expense comparisons by broadening the competitive group used for comparison and by reducing the number of universes to which various Fidelity funds are compared.
Management Fee. The Board considered two proprietary management fee comparisons for the 12-month periods shown in the chart below. The group of Lipper funds used by the Board for management fee comparisons is referred to below as the "Total Mapped Group." The Total Mapped Group comparison focuses on a fund's standing relative to the total universe of comparable funds available to investors, in terms of gross management fees before expense reimbursements or caps, and without giving effect to the fund's performance adjustment. "TMG %" represents the percentage of funds in the Total Mapped Group that had management fees that were lower than the fund's. For example, a TMG % of 10% means that 90% of the funds in the Total Mapped Group had higher management fees than the fund. The "Asset-Size Peer Group" (ASPG) comparison focuses on a fund's standing relative to non-Fidelity funds similar in size to the fund within the Total Mapped Group. The ASPG represents at least 15% of the funds in the Total Mapped Group with comparable asset size and management fee characteristics, subject to a minimum of 50 funds (or all funds in the Total Mapped Group if fewer than 50). Additional information, such as the ASPG quartile in which the fund's management fee ranked and the impact of the fund's performance adjustment, is also included in the chart and considered by the Board.
Annual Report
Fidelity Value Fund
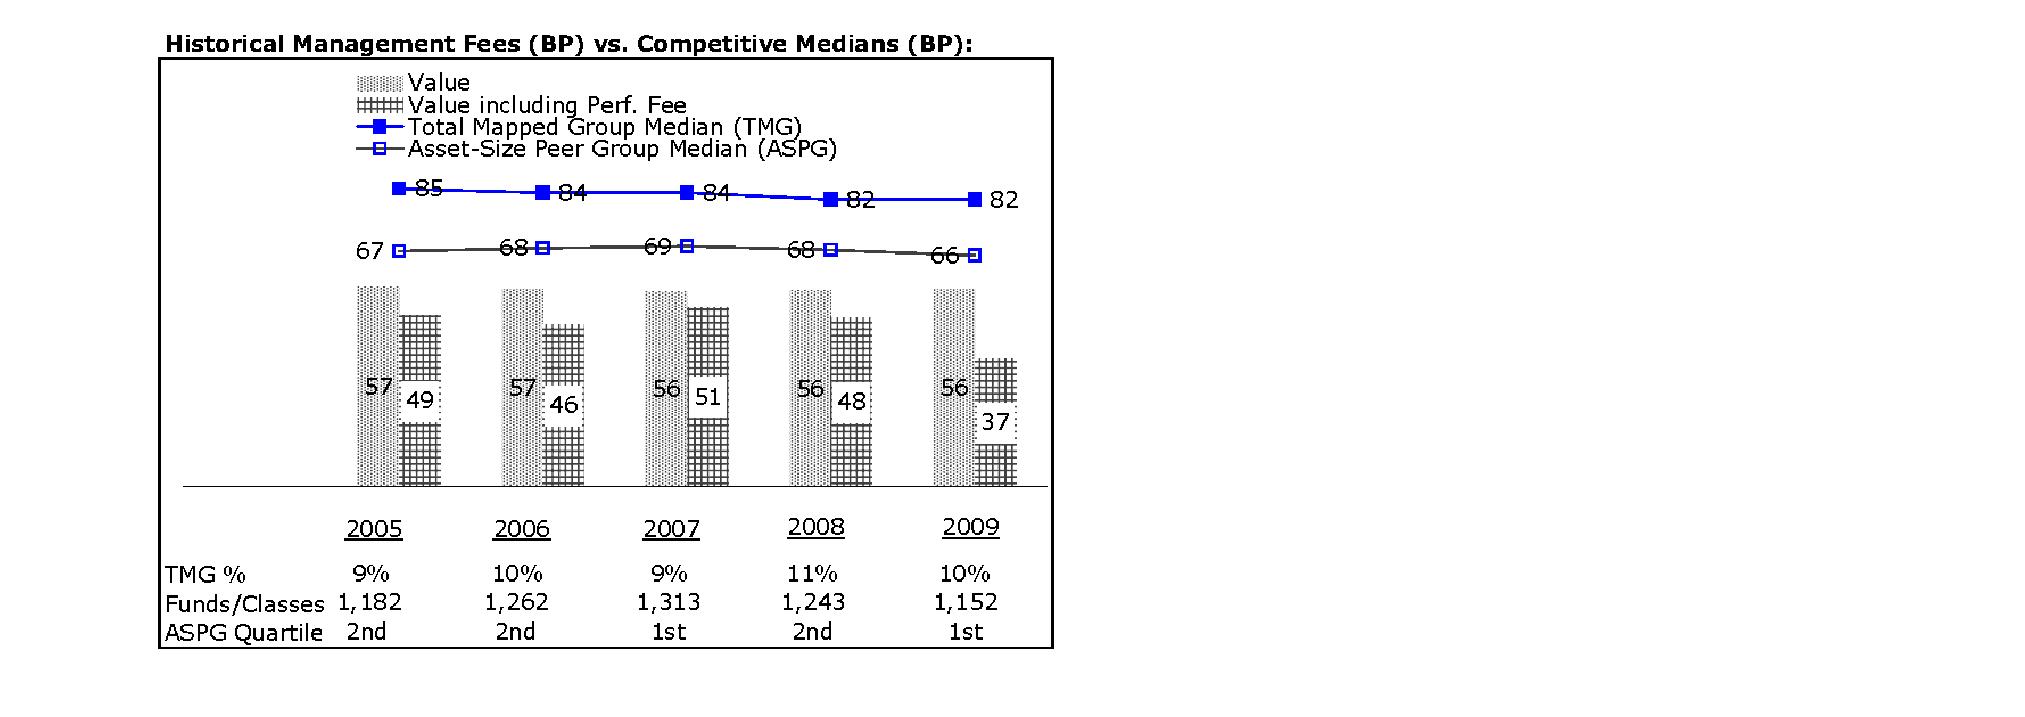
The Board noted that the fund's management fee ranked below the median of its Total Mapped Group and below the median of its ASPG for 2009. The Board also noted the effect of the fund's negative performance adjustment on the fund's management fee ranking. The Board noted that the performance adjustment for each year represents calculations for performance periods that differ from the periods shown in the performance charts above.
Furthermore, the Board considered that shareholders approved a prospective change in the index used to calculate the fund's performance adjustment, beginning December 1, 2002. The Board also considered that, because the performance adjustment is based on a rolling 36-month measurement period, during a transition period the fund's performance is compared to a blended index return that reflects the performance of the former index for the portion of the measurement period prior to December 1, 2002 and the performance of the current index for the remainder of the measurement period. The Board noted that the fund's performance adjustment for 2005 shown in the chart above reflects the effect of using the blended index return to calculate the fund's performance adjustment.
Based on its review, the Board concluded that the fund's management fee is fair and reasonable in light of the services that the fund receives and the other factors considered.
Total Expenses. In its review of each class's total expenses, the Board considered the fund's management fee as well as other fund or class expenses, as applicable, such as transfer agent fees, pricing and bookkeeping fees, and custodial, legal, and audit fees. The Board also noted the effects of any waivers and reimbursements on fees and expenses, as well as the impact of the fund's performance adjustment. As part of its review, the Board also considered current and historical total expenses of each class of the fund compared to competitive fund median expenses. Each class of the fund is compared to those funds and classes in the Total Mapped Group (used by the Board for management fee comparisons) that have a similar sales load structure.
Annual Report
Board Approval of Investment Advisory Contracts and
Management Fees - continued
The Board noted that the total expenses of each class ranked below its competitive median for 2009.
Fees Charged to Other Fidelity Clients. The Board also considered Fidelity fee structures and other information with respect to clients of FMR and its affiliates, such as other mutual funds advised or subadvised by FMR or its affiliates, pension plan clients, and other institutional clients. In March 2010, the Board created an ad hoc joint committee with the board of other Fidelity funds (the Committee) to review and compare Fidelity's institutional investment advisory business with its business of providing services to the Fidelity funds, including the differences in services provided, fees charged, and costs incurred, as well as competition in their respective marketplaces.
Based on its review of total expenses and fees charged to other Fidelity clients, the Board concluded that the total expenses of each class of the fund were reasonable in light of the services that the fund and its shareholders receive and the other factors considered, including the findings of the Committee.
Costs of the Services and Profitability. The Board considered the revenues earned and the expenses incurred by Fidelity in conducting the business of developing, marketing, distributing, managing, administering and servicing the fund and its shareholders. The Board also considered the level of Fidelity's profits in respect of all the Fidelity funds.
On an annual basis, FMR presents to the Board Fidelity's profitability for the fund. Fidelity calculates the profitability for each fund, as well as aggregate profitability for groups of Fidelity funds and all Fidelity funds, using a series of detailed revenue and cost allocation methodologies which originate with the audited books and records of Fidelity. The Audit Committee of the Board reviews any significant changes from the prior year's methodologies.
PricewaterhouseCoopers LLP (PwC), independent registered public accounting firm and auditor to Fidelity and certain Fidelity funds, has been engaged annually by the Board as part of the Board's assessment of Fidelity's profitability analysis. PwC's engagement includes the review and assessment of Fidelity's methodologies used in determining the revenues and expenses attributable to Fidelity's mutual fund business, and completion of agreed-upon procedures surrounding the mathematical accuracy of fund profitability and its conformity to allocation methodologies. After considering PwC's reports issued under the engagement and information provided by Fidelity, the Board believes that while other allocation methods may also be reasonable, Fidelity's profitability methodologies are reasonable in all material respects.
Annual Report
The Board has also reviewed Fidelity's non-fund businesses and fall-out benefits related to the mutual fund business as well as cases where Fidelity's affiliates may benefit from or be related to the fund's business.
The Board considered the costs of the services provided by and the profits realized by Fidelity in connection with the operation of the fund and were satisfied that the profitability was not excessive in the circumstances.
Economies of Scale. The Board considered whether there have been economies of scale in respect of the management of the Fidelity funds, whether the Fidelity funds (including the fund) have appropriately benefited from any such economies of scale, and whether there is potential for realization of any further economies of scale. The Board considered the extent to which the fund will benefit from economies of scale through increased services to the fund, through waivers or reimbursements, or through fee or expense reductions.
In February 2009, the Board and the board of other Fidelity funds created an ad hoc committee (the Economies of Scale Committee) to analyze whether FMR attains economies of scale in respect of the management and servicing of the Fidelity funds, whether the Fidelity funds have appropriately benefited from such economies of scale, and whether there is potential for realization of any further economies of scale.
The Board recognized that the fund's management contract incorporates a "group fee" structure, which provides for lower group fee rates as total fund assets under FMR's management increase, and for higher group fee rates as total fund assets under FMR's management decrease. FMR calculates the group fee rates based on a tiered asset "breakpoint" schedule that varies based on asset class. The Board considered that the group fee is designed to deliver the benefits of economies of scale to fund shareholders when total Fidelity fund assets increase, even if assets of any particular fund are unchanged or have declined, because some portion of Fidelity's costs are attributable to services provided to all Fidelity funds, and all funds benefit if those costs can be allocated among more assets. The Board concluded that, given the group fee structure, fund shareholders will benefit from lower management fees as assets under FMR's management increase at the fund complex level, regardless of whether Fidelity achieves any such economies of scale.
The Board concluded, considering the findings of the Economies of Scale Committee, that any potential economies of scale are being appropriately shared between fund shareholders and Fidelity.
Additional Information Requested by the Board. In order to develop fully the factual basis for consideration of the Fidelity funds' Advisory Contracts, the Board requested and received additional information on certain topics, including (i) fund performance trends, actions to be taken by FMR to improve certain funds' overall performance, and Fidelity's long-term strategies for certain funds; (ii) portfolio manager changes that have occurred during the past year and length of portfolio manager tenure for different categories of funds over time; (iii) Fidelity's compensation structure for portfolio managers, research analysts, and other key personnel, the rationale for the compensation structure, and how the compensation structure provides appropriate performance incentives; (iv) the amount of the investment that each portfolio manager has made in the Fidelity fund(s) that he or she manages; (v) management and other fees paid by FMR to affiliated sub-advisers on behalf of the Fidelity funds; (vi) Fidelity's fee structures and rationale for recommending different fees among different categories of funds; (vii) Fidelity's rationale for recommending which funds should have a performance adjustment component as part of their management fees; (viii) the rationale for any differences between fund fee structures and fee structures in place for other Fidelity clients; and (ix) explanations regarding the relative total expenses borne by certain funds and classes, total expense competitive trends, and actions that might be taken by FMR to reduce total expenses for certain funds and classes.
Annual Report
Board Approval of Investment Advisory Contracts and
Management Fees - continued
Based on its evaluation of all of the conclusions noted above, and after considering all factors it believed relevant, the Board ultimately concluded that the advisory fee structures are fair and reasonable, and that the fund's Advisory Contracts should be renewed.
Annual Report
Investment Adviser
Fidelity Management & Research Company
Boston, MA
Investment Sub-Advisers
FMR Co., Inc.
Fidelity Management & Research
(U.K.) Inc.
Fidelity Management & Research
(Hong Kong) Limited
Fidelity Management & Research
(Japan) Inc.
Fidelity Research & Analysis Company
General Distributor
Fidelity Distributors Corporation
Boston, MA
Transfer and Service Agents
Fidelity Investments Institutional
Operations Company Inc.
Boston, MA
Fidelity Service Company, Inc.
Boston, MA
Custodian
The Bank of New York Mellon
New York, NY
The Fidelity Telephone Connection
Mutual Fund 24-Hour Service
Exchanges/Redemptions
and Account Assistance 1-800-544-6666
Product Information 1-800-544-6666
Retirement Accounts 1-800-544-4774
(8 a.m. - 9 p.m.)
TDD Service 1-800-544-0118
for the deaf and hearing impaired
(9 a.m. - 9 p.m. Eastern time)
Fidelity Automated Service
Telephone (FAST®) 1-800-544-5555
Automated line for quickest service
VAL-UANN-1210
1.784783.107
Fidelity®
Value
Fund -
Class K
Annual Report
October 31, 2010
(2_fidelity_logos) (Registered_Trademark)
Contents
Chairman's Message | <Click Here> | The Chairman's message to shareholders. |
Performance | <Click Here> | How the fund has done over time. |
Management's Discussion of Fund Performance | <Click Here> | The Portfolio Managers' review of fund performance and strategy. |
Shareholder Expense Example | <Click Here> | An example of shareholder expenses. |
Investment Changes | <Click Here> | A summary of major shifts in the fund's investments over the past six months. |
Investments | <Click Here> | A complete list of the fund's investments with their market values. |
Financial Statements | <Click Here> | Statements of assets and liabilities, operations, and changes in net assets,
as well as financial highlights. |
Notes | <Click Here> | Notes to the financial statements. |
Report of Independent Registered Public Accounting Firm | <Click Here> | |
Trustees and Officers | <Click Here> | |
Distributions | <Click Here> | |
Board Approval of Investment Advisory Contracts and Management Fees | <Click Here> | |
To view a fund's proxy voting guidelines and proxy voting record for the 12-month period ended June 30, visit http://www.fidelity.com/proxyvotingresults or visit the Securities and Exchange Commission's (SEC) web site at http://www.sec.gov. You may also call 1-800-835-5092 to request a free copy of the proxy voting guidelines.
Standard & Poor's, S&P and S&P 500 are registered service marks of The McGraw-Hill Companies, Inc. and have been licensed for use by Fidelity Distributors Corporation.
Other third party marks appearing herein are the property of their respective owners.
All other marks appearing herein are registered or unregistered trademarks or service marks of FMR LLC or an affiliated company.
Annual Report
This report and the financial statements contained herein are submitted for the general information of the shareholders of the fund. This report is not authorized for distribution to prospective investors in the fund unless preceded or accompanied by an effective prospectus.
A fund files its complete schedule of portfolio holdings with the SEC for the first and third quarters of each fiscal year on Form N-Q. Forms N-Q are available on the SEC's web site at http://www.sec.gov. A fund's Forms N-Q may be reviewed and copied at the SEC's Public Reference Room in Washington, DC. Information regarding the operation of the SEC's Public Reference Room may be obtained by calling 1-800-SEC-0330. For a complete list of a fund's portfolio holdings, view the most recent holdings listing, semiannual report, or annual report on Fidelity's web site at http://www.fidelity.com or http://www.advisor.fidelity.com, as applicable.
NOT FDIC INSURED • MAY LOSE VALUE • NO BANK GUARANTEE
Neither the fund nor Fidelity Distributors Corporation is a bank.
Annual Report
(photo_of_Edward_C_Johnson_3d)
Dear Shareholder:
Equities have staged a rally in the second half of 2010, shaking off concerns about the European debt crisis and the possibility of a double-dip recession in the U.S. Although the short-term surge pushed major equity indexes back into positive territory for the year, several questions remain about the longer-term outlook, including lackluster economic growth and persistently high unemployment. Financial markets are always unpredictable, of course, but there also are several time-tested investment principles that can help put the odds in your favor.
One of the basic tenets is to invest for the long term. Over time, riding out the markets' inevitable ups and downs has proven much more effective than selling into panic or chasing the hottest trend. Even missing only a few of the markets' best days can significantly diminish investor returns. Patience also affords the benefits of compounding - of earning interest on additional income or reinvested dividends and capital gains. There can be tax advantages and cost benefits to consider as well. While staying the course doesn't eliminate risk, it can considerably lessen the effect of short-term declines.
You can further manage your investing risk through diversification. And today, more than ever, geographic diversification should be taken into account. Studies indicate that asset allocation is the single most important determinant of a portfolio's long-term success. The right mix of stocks, bonds and cash - aligned to your particular risk tolerance and investment objective - is very important. Age-appropriate rebalancing is also an essential aspect of asset allocation. For younger investors, an emphasis on equities - which historically have been the best-performing asset class over time - is encouraged. As investors near their specific goal, such as retirement or sending a child to college, consideration may be given to replacing volatile assets (e.g. common stocks) with more-stable fixed investments (bonds or savings plans).
A third principle - investing regularly - can help lower the average cost of your purchases. Investing a certain amount of money each month or quarter helps ensure you won't pay for all your shares at market highs. This strategy - known as dollar cost averaging - also reduces "emotion" from investing, helping shareholders avoid selling weak performers just prior to an upswing, or chasing a hot performer just before a correction.
We invite you to contact us via the Internet, through our Investor Centers or by phone. It is our privilege to provide you the information you need to make the investments that are right for you.
Sincerely,
(The chairman's signature appears here.)
Edward C. Johnson 3d
Annual Report
Average annual total return reflects the change in the value of an investment, assuming reinvestment of the class' distributions from dividend income and capital gains (the profits earned upon the sale of securities that have grown in value, if any) and assuming a constant rate of performance each year. The $10,000 table and the fund's returns do not reflect the deduction of taxes that a shareholder would pay on fund distributions or the redemption of fund shares. During periods of reimbursement by Fidelity, a fund's total return will be greater than it would be had the reimbursement not occurred. How a fund did yesterday is no guarantee of how it will do tomorrow.
Average Annual Total Returns
Periods ended October 31, 2010 | Past 1
year | Past 5
years | Past 10
years |
Class K A | 24.96% | 2.01% | 7.97% |
A The initial offering of Class K shares took place on May 9, 2008. Returns prior to May 9, 2008 are those of Fidelity® Value Fund, the original class of the fund.
$10,000 Over 10 Years
Let's say hypothetically that $10,000 was invested in Fidelity® Value Fund - Class K on October 31, 2000. The chart shows how the value of your investment would have changed, and also shows how the Russell Midcap® Value Index performed over the same period. The initial offering of Class K took place on May 9, 2008. See above for additional information regarding the performance of Class K.
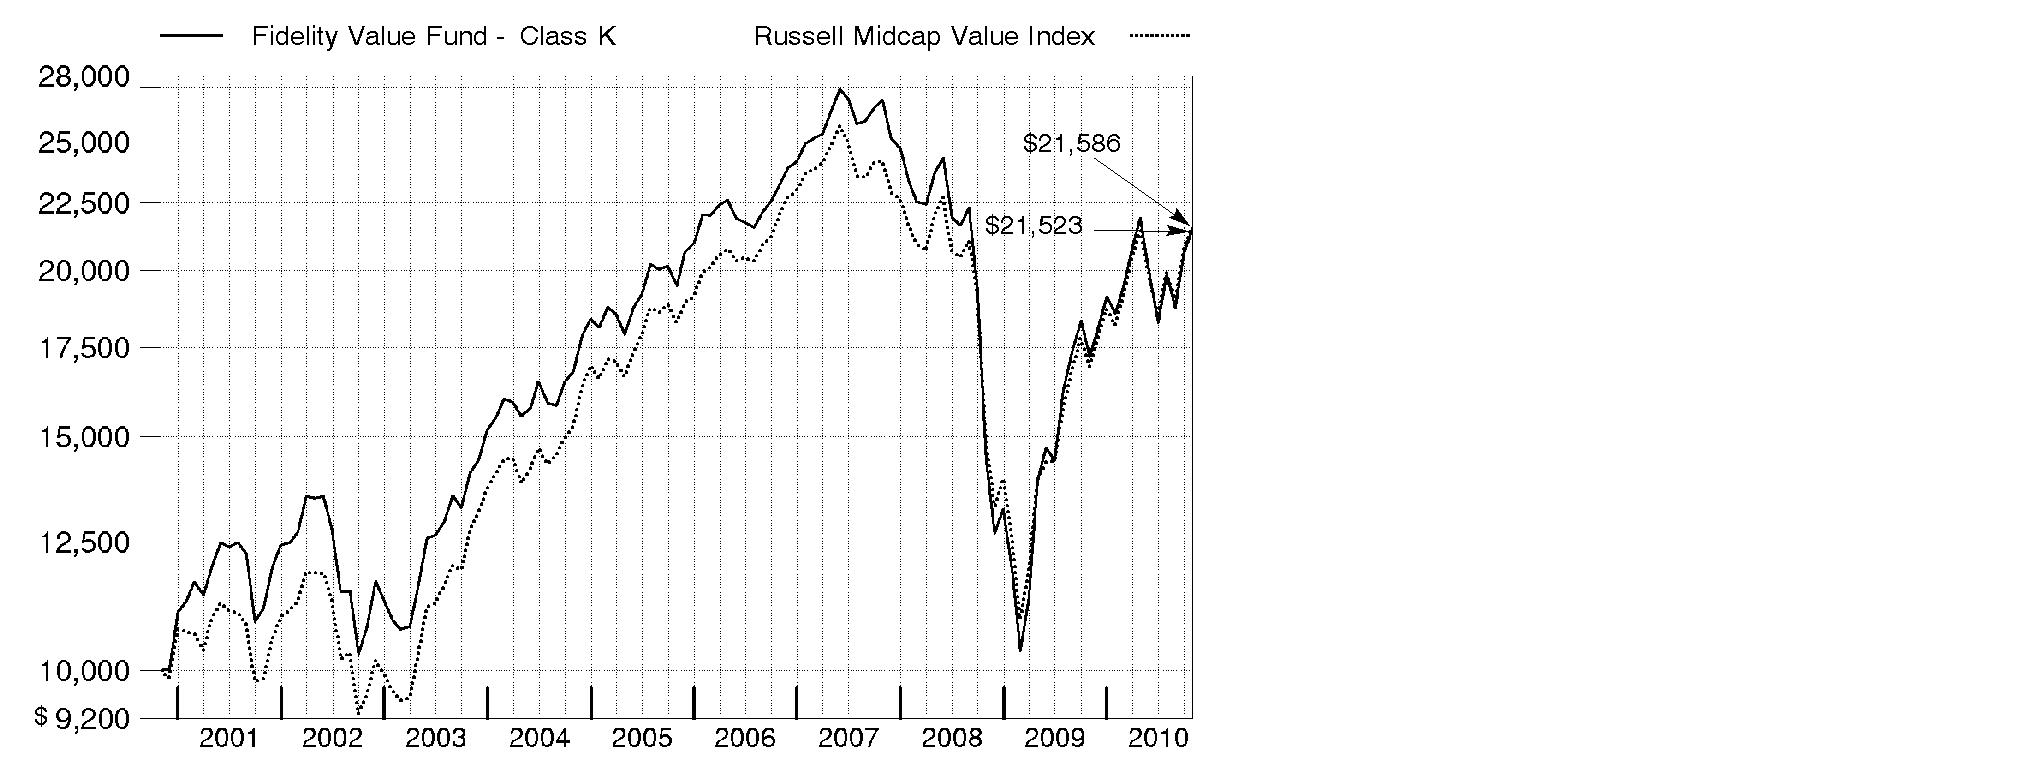
Annual Report
Market Recap: Amid bouts of volatility, major U.S. stock market indexes recorded double-digit gains for the year ending October 31, 2010, lifted by economic optimism, encouraging earnings reports and a wave of corporate mergers. Aside from a January dip, stocks trended upward for the first half of the period amid indications the Great Recession was over. However, in April, lingering high unemployment and heightened concern over European debt sent equities falling. Markets regrouped in July, but fell again in August on mixed economic data. The final two months of the period brought renewed optimism, with the large-cap S&P 500® Index posting its best September/October performance since 1998. For the full 12 months, the S&P 500® rose 16.52%, while the blue-chip-laden Dow Jones Industrial AverageSM added 17.62% and the technology-heavy Nasdaq Composite® Index rose 23.72%. Among market segments, all 10 sectors in the S&P 500 posted gains, with more than half outperforming the broad-market index. Stocks of mid- and small-sized companies surged, with the Russell Midcap® Index adding 27.71% and Russell 2000® Index climbing 26.58%. Looking abroad, debt problems in several European countries cooled gains in developed markets, and yet the MSCI® EAFE® (Europe, Australasia, Far East) Index still rose 8.49%.
Comments from Matthew Friedman, who became Co-Portfolio Manager of Fidelity® Value Fund on May 1, 2010, and Lead Portfolio Manager on July 30, 2010: During the year, the fund's Class K shares returned 24.96%, lagging the 27.49% gain of the Russell Midcap Value Index. The fund adopted a multi-manager structure in July, giving me full responsibility for investing 50% of assets across all market sectors, with the other half spread among a team of sector portfolio managers. Weak results in energy and financials were the biggest relative detractors. Within energy, stakes in Petrohawk Energy and Weatherford International were hurt by unfavorable natural gas pricing. A significant overweighting in large-cap diversified financials that suffered from fears of increased government regulation held back performance. JPMorgan Chase and Bank of New York Mellon were in this category, as were banks Wells Fargo and BB&T. The fund had weak security selection in utilities and health care. On the upside, an overweighting and good choices in consumer discretionary led the way, including office supply retailer OfficeMax and commercial real estate broker CB Richard Ellis Group. The fund also had positive results from regional banking firm Huntington Bancshares, food packaging products provider Pactiv and some good stock picks within industrials. Some of these stocks were not in the benchmark, and some were sold prior to period end.
The views expressed above reflect those of the portfolio manager(s) only through the end of the period as stated on the cover of this report and do not necessarily represent the views of Fidelity or any other person in the Fidelity organization. Any such views are subject to change at any time based upon market or other conditions and Fidelity disclaims any responsibility to update such views. These views may not be relied on as investment advice and, because investment decisions for a Fidelity fund are based on numerous factors, may not be relied on as an indication of trading intent on behalf of any Fidelity fund.
Annual Report
Shareholder Expense Example
As a shareholder of the Fund, you incur two types of costs: (1) transaction costs, and (2) ongoing costs, including management fees and other Fund expenses. This Example is intended to help you understand your ongoing costs (in dollars) of investing in the Fund and to compare these costs with the ongoing costs of investing in other mutual funds.
The Example is based on an investment of $1,000 invested at the beginning of the period and held for the entire period (May 1, 2010 to October 31, 2010).
Actual Expenses
The first line of the accompanying table for each class of the Fund provides information about actual account values and actual expenses. You may use the information in this line, together with the amount you invested, to estimate the expenses that you paid over the period. Simply divide your account value by $1,000.00 (for example, an $8,600 account value divided by $1,000.00 = 8.6), then multiply the result by the number in the first line for a class of the Fund under the heading entitled "Expenses Paid During Period" to estimate the expenses you paid on your account during this period. A small balance maintenance fee of $12.00 that is charged once a year may apply for certain accounts with a value of less than $2,000. This fee is not included in the table below. If it was, the estimate of expenses you paid during the period would be higher, and your ending account value lower, by this amount. In addition, the Fund, as a shareholder in the underlying Fidelity Central Funds, will indirectly bear its pro-rata share of the fees and expenses incurred by the underlying Fidelity Central Funds. These fees and expenses are not included in the Fund's annualized expense ratio used to calculate the expense estimate in the table below.
Hypothetical Example for Comparison Purposes
The second line of the accompanying table for each class of the Fund provides information about hypothetical account values and hypothetical expenses based on a Class' actual expense ratio and an assumed rate of return of 5% per year before expenses, which is not the Class' actual return. The hypothetical account values and expenses may not be used to estimate the actual ending account balance or expenses you paid for the period. You may use this information to compare the ongoing costs of investing in the Fund and other funds. To do so, compare this 5% hypothetical example with the 5% hypothetical examples that appear in the shareholder reports of the other funds. A small balance maintenance fee of $12.00 that is charged once a year may apply for certain accounts with a value of less than $2,000. This fee is not included in the table below. If it was, the estimate of expenses you paid during the period would be higher, and your ending account value lower, by this amount. In addition, the Fund, as a shareholder in the underlying Fidelity Central Funds, will indirectly bear its pro-rata share of the fees and expenses incurred by the underlying Fidelity Central Funds. These fees and expenses are not included in the Fund's annualized expense ratio used to calculate the expense estimate in the table below.
Annual Report
Please note that the expenses shown in the table are meant to highlight your ongoing costs only and do not reflect any transaction costs. Therefore, the second line of the table is useful in comparing ongoing costs only, and will not help you determine the relative total costs of owning different funds.
|
Annualized
Expense Ratio
|
Beginning
Account Value
May 1, 2010
|
Ending
Account Value
October 31, 2010
| Expenses Paid
During Period*
May 1, 2010 to
October 31, 2010 |
Value | .57% | | | |
Actual | | $ 1,000.00 | $ 982.20 | $ 2.85 |
HypotheticalA | | $ 1,000.00 | $ 1,022.33 | $ 2.91 |
Class K | .42% | | | |
Actual | | $ 1,000.00 | $ 983.20 | $ 2.10 |
HypotheticalA | | $ 1,000.00 | $ 1,023.09 | $ 2.14 |
A 5% return per year before expenses
* Expenses are equal to each Class' annualized expense ratio, multiplied by the average account value over the period, multiplied by 184/365 (to reflect the one-half year period).
Annual Report
Investment Changes (Unaudited)
Top Ten Stocks as of October 31, 2010 |
| % of fund's
net assets | % of fund's net assets
6 months ago |
Sempra Energy | 1.5 | 0.6 |
PPL Corp. | 1.4 | 0.0 |
PG&E Corp. | 1.3 | 0.5 |
U.S. Bancorp, Delaware | 1.2 | 0.8 |
National Grid PLC | 1.2 | 0.0 |
Wells Fargo & Co. | 1.2 | 1.3 |
Public Service Enterprise Group, Inc. | 1.1 | 0.0 |
Stanley Black & Decker, Inc. | 1.1 | 1.4 |
AES Corp. | 1.1 | 0.6 |
JPMorgan Chase & Co. | 1.1 | 1.1 |
| 12.2 | |
Top Five Market Sectors as of October 31, 2010 |
| % of fund's
net assets | % of fund's net assets
6 months ago |
Financials | 26.4 | 26.5 |
Consumer Discretionary | 12.0 | 11.8 |
Industrials | 11.8 | 14.7 |
Utilities | 10.6 | 6.2 |
Energy | 9.6 | 8.4 |
Asset Allocation (% of fund's net assets) |
As of October 31, 2010* | As of April 30, 2010** |
| Stocks and Equity
Futures 98.1% | | | Stocks 96.6% | |
| Convertible
Securities 0.0% | | | Convertible
Securities 0.4% | |
| Short-Term
Investments and
Net Other Assets 1.9% | | | Short-Term
Investments and
Net Other Assets 3.0% | |
* Foreign investments | 13.4% | | ** Foreign investments | 11.3% | |
Annual Report
Investments October 31, 2010
Showing Percentage of Net Assets
Common Stocks - 97.7% |
| Shares | | Value (000s) |
CONSUMER DISCRETIONARY - 12.0% |
Automobiles - 0.9% |
Fiat SpA | 2,953,000 | | $ 49,965 |
Harley-Davidson, Inc. | 710,441 | | 21,796 |
| | 71,761 |
Diversified Consumer Services - 0.2% |
H&R Block, Inc. | 1,411,200 | | 16,638 |
Hotels, Restaurants & Leisure - 1.7% |
Accor SA | 211,436 | | 8,669 |
Ameristar Casinos, Inc. | 1,265,134 | | 22,621 |
Bally Technologies, Inc. (a) | 436,038 | | 15,732 |
Brinker International, Inc. | 1,498,200 | | 27,777 |
Vail Resorts, Inc. (a)(d) | 243,480 | | 9,876 |
WMS Industries, Inc. (a) | 459,021 | | 20,027 |
Wyndham Worldwide Corp. | 1,185,083 | | 34,071 |
| | 138,773 |
Household Durables - 2.4% |
Ethan Allen Interiors, Inc. (d)(e) | 2,637,759 | | 40,015 |
Garmin Ltd. | 548,000 | | 17,996 |
Jarden Corp. | 412,634 | | 13,229 |
PulteGroup, Inc. (a) | 4,377,554 | | 34,364 |
Stanley Black & Decker, Inc. | 1,494,600 | | 92,620 |
| | 198,224 |
Internet & Catalog Retail - 0.7% |
Expedia, Inc. | 473,938 | | 13,721 |
Liberty Media Corp. Interactive Series A (a) | 2,994,915 | | 44,205 |
| | 57,926 |
Leisure Equipment & Products - 0.8% |
Brunswick Corp. | 3,106,008 | | 49,137 |
Eastman Kodak Co. (a)(d) | 3,027,200 | | 14,258 |
| | 63,395 |
Media - 2.1% |
Interpublic Group of Companies, Inc. (a) | 4,499,098 | | 46,566 |
Liberty Global, Inc. Class A (a)(d) | 616,000 | | 23,279 |
MDC Partners, Inc. Class A (sub. vtg.) | 612,500 | | 8,514 |
United Business Media Ltd. | 1,107,766 | | 11,678 |
Valassis Communications, Inc. (a) | 1,048,085 | | 34,587 |
Virgin Media, Inc. | 1,913,676 | | 48,665 |
| | 173,289 |
Common Stocks - continued |
| Shares | | Value (000s) |
CONSUMER DISCRETIONARY - continued |
Multiline Retail - 0.4% |
Big Lots, Inc. (a) | 521,371 | | $ 16,355 |
Kohl's Corp. (a) | 112,436 | | 5,757 |
Retail Ventures, Inc. (a) | 443,269 | | 6,024 |
| | 28,136 |
Specialty Retail - 2.1% |
Advance Auto Parts, Inc. | 188,489 | | 12,248 |
Best Buy Co., Inc. | 894,360 | | 38,440 |
OfficeMax, Inc. (a)(e) | 4,537,769 | | 80,319 |
Sally Beauty Holdings, Inc. (a) | 2,251,841 | | 27,405 |
Staples, Inc. | 719,410 | | 14,726 |
| | 173,138 |
Textiles, Apparel & Luxury Goods - 0.7% |
Hanesbrands, Inc. (a) | 803,154 | | 19,918 |
Iconix Brand Group, Inc. (a) | 1,550,371 | | 27,131 |
Warnaco Group, Inc. (a) | 230,464 | | 12,240 |
| | 59,289 |
TOTAL CONSUMER DISCRETIONARY | | 980,569 |
CONSUMER STAPLES - 4.9% |
Beverages - 2.2% |
Britvic PLC | 953,687 | | 7,371 |
Carlsberg AS Series B | 232,400 | | 25,412 |
Coca-Cola Enterprises, Inc. | 1,689,500 | | 40,565 |
Dr Pepper Snapple Group, Inc. | 1,498,923 | | 54,786 |
Molson Coors Brewing Co. Class B | 526,200 | | 24,852 |
The Coca-Cola Co. | 440,536 | | 27,014 |
| | 180,000 |
Food & Staples Retailing - 1.3% |
Kroger Co. | 3,538,177 | | 77,840 |
SUPERVALU, Inc. | 337,600 | | 3,643 |
Walgreen Co. | 453,612 | | 15,368 |
Winn-Dixie Stores, Inc. (a) | 988,093 | | 6,620 |
| | 103,471 |
Food Products - 0.9% |
Bunge Ltd. | 1,194,659 | | 71,763 |
Common Stocks - continued |
| Shares | | Value (000s) |
CONSUMER STAPLES - continued |
Personal Products - 0.5% |
Avon Products, Inc. | 1,521,250 | | $ 46,322 |
TOTAL CONSUMER STAPLES | | 401,556 |
ENERGY - 9.6% |
Energy Equipment & Services - 3.1% |
Baker Hughes, Inc. | 1,810,876 | | 83,898 |
Cameron International Corp. (a) | 669,040 | | 29,271 |
Halliburton Co. | 1,766,600 | | 56,284 |
McDermott International, Inc. (a) | 1,456,084 | | 22,467 |
Pride International, Inc. (a) | 1,022,100 | | 30,990 |
Transocean Ltd. (a) | 528,575 | | 33,491 |
| | 256,401 |
Oil, Gas & Consumable Fuels - 6.5% |
Apache Corp. | 234,400 | | 23,679 |
Atlas Pipeline Partners, LP | 1,343,311 | | 26,584 |
Cimarex Energy Co. | 592,729 | | 45,492 |
Concho Resources, Inc. (a)(h) | 182,000 | | 11,248 |
Denbury Resources, Inc. (a) | 1,609,300 | | 27,390 |
Enbridge Energy Partners LP | 578,305 | | 35,560 |
EXCO Resources, Inc. | 1,201,500 | | 17,818 |
Forest Oil Corp. (a) | 552,200 | | 16,969 |
Marathon Oil Corp. | 1,273,897 | | 45,313 |
NuStar Energy LP | 326,032 | | 20,540 |
Peabody Energy Corp. | 851,700 | | 45,055 |
Petrohawk Energy Corp. (a) | 1,233,116 | | 20,975 |
Pioneer Natural Resources Co. | 355,799 | | 24,835 |
Southwestern Energy Co. (a) | 819,743 | | 27,748 |
Talisman Energy, Inc. | 2,432,000 | | 44,090 |
Whiting Petroleum Corp. (a) | 697,000 | | 70,007 |
Williams Companies, Inc. | 1,168,030 | | 25,136 |
| | 528,439 |
TOTAL ENERGY | | 784,840 |
FINANCIALS - 26.4% |
Capital Markets - 3.0% |
Bank of New York Mellon Corp. | 1,929,372 | | 48,350 |
Invesco Ltd. | 1,698,956 | | 39,076 |
Morgan Stanley | 2,271,280 | | 56,487 |
Common Stocks - continued |
| Shares | | Value (000s) |
FINANCIALS - continued |
Capital Markets - continued |
State Street Corp. | 1,524,600 | | $ 63,667 |
TD Ameritrade Holding Corp. | 2,335,150 | | 39,908 |
| | 247,488 |
Commercial Banks - 6.1% |
BB&T Corp. | 2,630,861 | | 61,588 |
CapitalSource, Inc. | 3,911,150 | | 23,897 |
CIT Group, Inc. (a) | 795,076 | | 34,451 |
Comerica, Inc. | 654,696 | | 23,425 |
Itau Unibanco Banco Multiplo SA ADR (a)(f) | 1,460,300 | | 35,865 |
PNC Financial Services Group, Inc. | 400,955 | | 21,611 |
Regions Financial Corp. | 3,405,611 | | 21,455 |
SunTrust Banks, Inc. | 1,644,118 | | 41,136 |
TCF Financial Corp. | 1,495,100 | | 19,676 |
U.S. Bancorp, Delaware | 4,224,532 | | 102,149 |
Wells Fargo & Co. | 3,625,105 | | 94,543 |
Zions Bancorporation | 902,096 | | 18,637 |
| | 498,433 |
Consumer Finance - 0.6% |
SLM Corp. (a) | 3,838,200 | | 45,675 |
Diversified Financial Services - 1.6% |
CME Group, Inc. | 90,516 | | 26,218 |
JPMorgan Chase & Co. | 2,257,921 | | 84,966 |
Moody's Corp. | 566,086 | | 15,318 |
| | 126,502 |
Insurance - 8.0% |
AEGON NV (a) | 4,555,714 | | 28,866 |
AFLAC, Inc. | 912,774 | | 51,015 |
Allstate Corp. | 1,074,488 | | 32,761 |
Aon Corp. | 141,500 | | 5,625 |
Assured Guaranty Ltd. | 732,627 | | 13,957 |
Berkshire Hathaway, Inc. Class B (a) | 336,100 | | 26,740 |
Delphi Financial Group, Inc. Class A | 1,266,937 | | 34,296 |
Everest Re Group Ltd. | 338,349 | | 28,516 |
Fairfax Financial Holdings Ltd. (sub. vtg.) | 62,600 | | 25,607 |
First American Financial Corp. | 1,713,892 | | 24,063 |
Genworth Financial, Inc. Class A (a) | 2,013,453 | | 22,833 |
Lincoln National Corp. | 2,342,948 | | 57,355 |
Marsh & McLennan Companies, Inc. | 684,000 | | 17,086 |
MetLife, Inc. | 1,528,700 | | 61,652 |
Reinsurance Group of America, Inc. | 1,100,550 | | 55,105 |
Common Stocks - continued |
| Shares | | Value (000s) |
FINANCIALS - continued |
Insurance - continued |
StanCorp Financial Group, Inc. | 1,002,975 | | $ 43,028 |
Torchmark Corp. | 483,434 | | 27,691 |
Unum Group | 1,922,713 | | 43,107 |
XL Capital Ltd. Class A | 2,505,852 | | 52,999 |
| | 652,302 |
Real Estate Investment Trusts - 5.2% |
Alexandria Real Estate Equities, Inc. | 742,109 | | 54,530 |
CBL & Associates Properties, Inc. | 982,175 | | 15,401 |
Corporate Office Properties Trust (SBI) | 536,524 | | 19,041 |
iStar Financial, Inc. (a)(d) | 421,139 | | 1,925 |
Post Properties, Inc. | 822,492 | | 25,037 |
ProLogis Trust | 5,596,644 | | 76,394 |
Public Storage | 241,577 | | 23,969 |
Rayonier, Inc. | 64,223 | | 3,352 |
SL Green Realty Corp. | 916,962 | | 60,263 |
The Macerich Co. | 552,300 | | 24,638 |
Ventas, Inc. | 980,592 | | 52,521 |
Vornado Realty Trust | 168,695 | | 14,742 |
Weyerhaeuser Co. | 3,100,597 | | 50,292 |
| | 422,105 |
Real Estate Management & Development - 1.6% |
CB Richard Ellis Group, Inc. Class A (a) | 1,626,805 | | 29,852 |
Forest City Enterprises, Inc. Class A (a)(d) | 3,123,376 | | 45,570 |
Forestar Group, Inc. (a)(e) | 1,979,491 | | 33,849 |
Wharf Holdings Ltd. | 3,537,000 | | 23,226 |
| | 132,497 |
Thrifts & Mortgage Finance - 0.3% |
People's United Financial, Inc. | 1,683,000 | | 20,718 |
TOTAL FINANCIALS | | 2,145,720 |
HEALTH CARE - 5.6% |
Biotechnology - 0.4% |
AMAG Pharmaceuticals, Inc. (a) | 166,700 | | 2,652 |
Clinical Data, Inc. (a) | 282,179 | | 5,359 |
Gilead Sciences, Inc. (a) | 365,889 | | 14,515 |
PDL BioPharma, Inc. | 1,826,200 | | 9,551 |
| | 32,077 |
Common Stocks - continued |
| Shares | | Value (000s) |
HEALTH CARE - continued |
Health Care Equipment & Supplies - 1.1% |
Alere, Inc. (a) | 57,400 | | $ 1,696 |
C. R. Bard, Inc. | 49,400 | | 4,106 |
Conceptus, Inc. (a)(d) | 823,100 | | 11,696 |
Hill-Rom Holdings, Inc. | 260,752 | | 10,104 |
Orthofix International NV (a) | 150,000 | | 4,202 |
Wright Medical Group, Inc. (a) | 1,077,482 | | 14,374 |
Zimmer Holdings, Inc. (a) | 872,260 | | 41,380 |
| | 87,558 |
Health Care Providers & Services - 2.9% |
Brookdale Senior Living, Inc. (a) | 1,103,496 | | 20,724 |
Centene Corp. (a) | 554,855 | | 12,384 |
DaVita, Inc. (a) | 540,690 | | 38,795 |
Health Net, Inc. (a) | 584,500 | | 15,717 |
HealthSouth Corp. (a) | 484,600 | | 8,766 |
Henry Schein, Inc. (a) | 72,900 | | 4,093 |
Lincare Holdings, Inc. | 1,217,044 | | 31,911 |
McKesson Corp. | 462,579 | | 30,521 |
Medco Health Solutions, Inc. (a) | 404,100 | | 21,227 |
Omnicare, Inc. | 243,900 | | 5,883 |
Quest Diagnostics, Inc. | 294,460 | | 14,470 |
Sun Healthcare Group, Inc. (a) | 582,800 | | 5,542 |
Universal American Financial Corp. | 340,366 | | 5,473 |
Universal Health Services, Inc. Class B | 417,581 | | 17,234 |
| | 232,740 |
Life Sciences Tools & Services - 0.7% |
Charles River Laboratories International, Inc. (a) | 60,800 | | 1,992 |
ICON PLC sponsored ADR (a) | 555,198 | | 10,743 |
Lonza Group AG | 254,784 | | 22,299 |
PerkinElmer, Inc. | 987,000 | | 23,145 |
| | 58,179 |
Pharmaceuticals - 0.5% |
Cadence Pharmaceuticals, Inc. (a)(d) | 731,067 | | 6,492 |
Mylan, Inc. (a)(d) | 260,700 | | 5,297 |
Teva Pharmaceutical Industries Ltd. sponsored ADR | 376,550 | | 19,543 |
Valeant Pharmaceuticals International, Inc. | 391,619 | | 10,836 |
| | 42,168 |
TOTAL HEALTH CARE | | 452,722 |
Common Stocks - continued |
| Shares | | Value (000s) |
INDUSTRIALS - 11.8% |
Aerospace & Defense - 1.8% |
AerCap Holdings NV (a) | 974,068 | | $ 12,575 |
DigitalGlobe, Inc. (a) | 734,624 | | 23,985 |
Esterline Technologies Corp. (a) | 555,620 | | 33,582 |
Goodrich Corp. | 372,041 | | 30,533 |
ITT Corp. | 315,676 | | 14,897 |
Precision Castparts Corp. | 96,146 | | 13,132 |
Raytheon Co. | 403,425 | | 18,590 |
| | 147,294 |
Airlines - 0.2% |
Pinnacle Airlines Corp. (a)(e) | 1,925,465 | | 11,091 |
Building Products - 1.1% |
Armstrong World Industries, Inc. (a) | 742,094 | | 30,982 |
Masco Corp. | 1,765,088 | | 18,816 |
Owens Corning (a) | 1,553,312 | | 42,002 |
| | 91,800 |
Commercial Services & Supplies - 2.2% |
Avery Dennison Corp. | 466,000 | | 16,939 |
Interface, Inc. Class A | 841,455 | | 12,109 |
Iron Mountain, Inc. | 2,602,529 | | 56,709 |
Quad/Graphics, Inc. (a) | 165,382 | | 7,394 |
Republic Services, Inc. | 1,062,866 | | 31,684 |
Sykes Enterprises, Inc. (a) | 927,497 | | 15,406 |
The Geo Group, Inc. (a) | 1,538,202 | | 39,455 |
| | 179,696 |
Construction & Engineering - 1.9% |
Fluor Corp. | 1,209,275 | | 58,275 |
Foster Wheeler AG (a) | 1,725,203 | | 40,404 |
Jacobs Engineering Group, Inc. (a) | 1,512,725 | | 58,406 |
| | 157,085 |
Electrical Equipment - 0.1% |
EnerSys (a) | 212,171 | | 5,593 |
Industrial Conglomerates - 0.3% |
Textron, Inc. | 1,169,544 | | 24,350 |
Machinery - 1.7% |
Actuant Corp. Class A | 373,393 | | 8,390 |
AGCO Corp. (a) | 382,375 | | 16,239 |
ArvinMeritor, Inc. (a) | 590,508 | | 9,791 |
Dover Corp. | 200,789 | | 10,662 |
Ingersoll-Rand Co. Ltd. | 830,600 | | 32,651 |
Common Stocks - continued |
| Shares | | Value (000s) |
INDUSTRIALS - continued |
Machinery - continued |
Navistar International Corp. (a) | 676,606 | | $ 32,599 |
Pall Corp. | 411,279 | | 17,549 |
Vallourec SA | 116,900 | | 12,130 |
| | 140,011 |
Marine - 0.1% |
Ultrapetrol (Bahamas) Ltd. (a) | 1,082,677 | | 7,048 |
Professional Services - 0.6% |
Towers Watson & Co. | 994,327 | | 51,128 |
Road & Rail - 1.8% |
Con-way, Inc. | 964,243 | | 31,830 |
Contrans Group, Inc. Class A | 1,801,100 | | 15,452 |
Quality Distribution, Inc. (a)(d)(e) | 1,731,188 | | 12,378 |
Union Pacific Corp. | 803,335 | | 70,436 |
Vitran Corp., Inc. (a)(e) | 1,349,445 | | 15,100 |
| | 145,196 |
TOTAL INDUSTRIALS | | 960,292 |
INFORMATION TECHNOLOGY - 8.8% |
Communications Equipment - 0.4% |
Comverse Technology, Inc. (a) | 2,144,560 | | 17,156 |
Research In Motion Ltd. (a) | 198,700 | | 11,316 |
| | 28,472 |
Computers & Peripherals - 0.6% |
Gemalto NV | 469,171 | | 21,361 |
Hewlett-Packard Co. | 390,750 | | 16,435 |
Western Digital Corp. (a) | 242,237 | | 7,756 |
| | 45,552 |
Electronic Equipment & Components - 1.3% |
Agilent Technologies, Inc. (a) | 534,924 | | 18,615 |
Avnet, Inc. (a) | 1,593,919 | | 47,467 |
Flextronics International Ltd. (a) | 3,123,655 | | 22,365 |
Molex, Inc. (d) | 614,208 | | 12,468 |
TTM Technologies, Inc. (a) | 45,154 | | 473 |
| | 101,388 |
Internet Software & Services - 0.7% |
eBay, Inc. (a) | 1,097,425 | | 32,714 |
Monster Worldwide, Inc. (a) | 1,480,145 | | 26,731 |
| | 59,445 |
Common Stocks - continued |
| Shares | | Value (000s) |
INFORMATION TECHNOLOGY - continued |
IT Services - 1.1% |
Acxiom Corp. (a) | 2,011,795 | | $ 35,307 |
Atos Origin SA (a) | 134,105 | | 6,200 |
Fiserv, Inc. (a) | 313,578 | | 17,096 |
MasterCard, Inc. Class A | 85,049 | | 20,417 |
Wright Express Corp. (a) | 275,099 | | 10,374 |
| | 89,394 |
Office Electronics - 0.2% |
Xerox Corp. | 1,556,666 | | 18,213 |
Semiconductors & Semiconductor Equipment - 3.2% |
Advanced Micro Devices, Inc. (a) | 2,050,996 | | 15,034 |
Avago Technologies Ltd. (a) | 1,220,990 | | 30,134 |
Intersil Corp. Class A | 2,776,632 | | 36,346 |
KLA-Tencor Corp. | 1,015,350 | | 36,268 |
Lam Research Corp. (a) | 1,266,725 | | 58,003 |
Marvell Technology Group Ltd. (a) | 1,128,609 | | 21,793 |
Micron Technology, Inc. (a) | 4,848,252 | | 40,095 |
NXP Semiconductors NV | 338,704 | | 4,468 |
ON Semiconductor Corp. (a) | 1,729,284 | | 13,264 |
PMC-Sierra, Inc. (a) | 999,900 | | 7,689 |
| | 263,094 |
Software - 1.3% |
BMC Software, Inc. (a) | 938,671 | | 42,672 |
CA, Inc. | 803,262 | | 18,644 |
Epicor Software Corp. (a) | 1,644,478 | | 15,458 |
Micro Focus International PLC | 847,500 | | 5,184 |
Symantec Corp. (a) | 1,600,350 | | 25,894 |
| | 107,852 |
TOTAL INFORMATION TECHNOLOGY | | 713,410 |
MATERIALS - 6.1% |
Chemicals - 3.8% |
Air Products & Chemicals, Inc. | 215,880 | | 18,343 |
Ashland, Inc. | 980,487 | | 50,623 |
Cabot Corp. | 815,900 | | 27,757 |
Celanese Corp. Class A | 1,483,025 | | 52,870 |
CF Industries Holdings, Inc. | 180,007 | | 22,056 |
Clariant AG (Reg.) (a) | 972,480 | | 16,439 |
Innophos Holdings, Inc. | 475,889 | | 17,475 |
LyondellBasell Industries NV Class A (a) | 181,100 | | 4,864 |
Common Stocks - continued |
| Shares | | Value (000s) |
MATERIALS - continued |
Chemicals - continued |
Solutia, Inc. (a) | 2,832,841 | | $ 51,303 |
Solvay SA Class A | 62,600 | | 6,628 |
Valspar Corp. | 344,600 | | 11,062 |
W.R. Grace & Co. (a) | 652,672 | | 20,925 |
Wacker Chemie AG | 58,600 | | 12,088 |
| | 312,433 |
Construction Materials - 0.3% |
HeidelbergCement AG | 515,166 | | 26,942 |
Containers & Packaging - 0.9% |
Aptargroup, Inc. | 273,992 | | 12,297 |
Ball Corp. | 638,071 | | 41,066 |
Owens-Illinois, Inc. (a) | 643,227 | | 18,030 |
| | 71,393 |
Metals & Mining - 1.1% |
Commercial Metals Co. | 774,551 | | 10,751 |
Compania de Minas Buenaventura SA sponsored ADR | 420,200 | | 22,287 |
Compass Minerals International, Inc. | 504,469 | | 39,787 |
Walter Energy, Inc. | 158,125 | | 13,909 |
| | 86,734 |
TOTAL MATERIALS | | 497,502 |
TELECOMMUNICATION SERVICES - 1.9% |
Diversified Telecommunication Services - 1.0% |
AboveNet, Inc. (a) | 14,600 | | 831 |
Cbeyond, Inc. (a) | 823,830 | | 11,163 |
Cincinnati Bell, Inc. (a) | 1,828,400 | | 4,480 |
Global Crossing Ltd. (a) | 644,094 | | 8,760 |
Iliad Group SA | 77,297 | | 8,701 |
Qwest Communications International, Inc. | 5,607,869 | | 37,012 |
Verizon Communications, Inc. | 302,789 | | 9,832 |
| | 80,779 |
Wireless Telecommunication Services - 0.9% |
American Tower Corp. Class A (a) | 705,900 | | 36,431 |
NII Holdings, Inc. (a) | 753,910 | | 31,521 |
Sprint Nextel Corp. (a) | 1,606,340 | | 6,618 |
| | 74,570 |
TOTAL TELECOMMUNICATION SERVICES | | 155,349 |
Common Stocks - continued |
| Shares | | Value (000s) |
UTILITIES - 10.6% |
Electric Utilities - 3.0% |
American Electric Power Co., Inc. | 2,150,170 | | $ 80,502 |
NextEra Energy, Inc. | 947,993 | | 52,178 |
PPL Corp. | 4,259,899 | | 114,591 |
| | 247,271 |
Gas Utilities - 0.6% |
China Gas Holdings Ltd. (d) | 30,414,000 | | 17,382 |
UGI Corp. | 941,177 | | 28,320 |
| | 45,702 |
Independent Power Producers & Energy Traders - 1.9% |
AES Corp. (a) | 7,257,200 | | 86,651 |
Calpine Corp. (a) | 5,332,900 | | 66,661 |
| | 153,312 |
Multi-Utilities - 5.1% |
National Grid PLC | 10,635,963 | | 100,566 |
PG&E Corp. | 2,189,363 | | 104,695 |
Public Service Enterprise Group, Inc. | 2,877,586 | | 93,090 |
Sempra Energy | 2,277,500 | | 121,799 |
| | 420,150 |
TOTAL UTILITIES | | 866,435 |
TOTAL COMMON STOCKS (Cost $7,976,856) | 7,958,395 |
U.S. Treasury Obligations - 0.1% |
| Principal Amount (000s) | | |
U.S. Treasury Bills, yield at date of purchase 0.11% to 0.15% 11/4/10 (g)
(Cost $10,325) | | $ 10,325 | | 10,325 |
Money Market Funds - 3.2% |
| Shares | | Value (000s) |
Fidelity Cash Central Fund, 0.23% (b) | 177,396,361 | | $ 177,396 |
Fidelity Securities Lending Cash Central Fund, 0.24% (b)(c) | 83,287,769 | | 83,288 |
TOTAL MONEY MARKET FUNDS (Cost $260,684) | 260,684 |
TOTAL INVESTMENT PORTFOLIO - 101.0% (Cost $8,247,865) | | 8,229,404 |
NET OTHER ASSETS (LIABILITIES) - (1.0)% | | (82,382) |
NET ASSETS - 100% | 8,147,022 |
Futures Contracts |
| Expiration Date | | Underlying Face Amount at Value (000s) | | Unrealized Appreciation/
(Depreciation) (000s) |
Purchased |
Equity Index Contracts |
379 CME E-mini S&P Midcap 400 Index Contracts | Dec. 2010 | | $ 31,362 | | $ 447 |
The face value of futures purchased as a percentage of net assets is 0.4% |
Legend |
(a) Non-income producing |
(b) Affiliated fund that is available only to investment companies and other accounts managed by Fidelity Investments. The rate quoted is the annualized seven-day yield of the fund at period end. A complete unaudited listing of the fund's holdings as of its most recent quarter end is available upon request. In addition, each Fidelity Central Fund's financial statements, which are not covered by the Fund's report of Independent Registered Public Accounting Firm, are available on the SEC's website or upon request. |
(c) Investment made with cash collateral received from securities on loan. |
(d) Security or a portion of the security is on loan at period end. |
(e) Affiliated company |
(f) Security exempt from registration under Rule 144A of the Securities Act of 1933. These securities may be resold in transactions exempt from registration, normally to qualified institutional buyers. At the end of the period, the value of these securities amounted to $35,865,000 or 0.4% of net assets. |
(g) Security or a portion of the security was pledged to cover margin requirements for futures contracts. At the period end, the value of securities pledged amounted to $2,600,000. |
(h) Restricted securities - Investment in securities not registered under the Securities Act of 1933 (excluding 144A issues). At the end of the period, the value of restricted securities (excluding 144A issues) amounted to $11,248,000 or 0.1% of net assets. |
Additional information on each holding is as follows: |
Security | Acquisition Date | Acquisition Cost (000s) |
Concho Resources, Inc. | 7/20/10 | $ 8,245 |
Affiliated Central Funds |
Information regarding fiscal year to date income earned by the Fund from investments in Fidelity Central Funds is as follows: |
Fund | Income earned
(Amounts in thousands) |
Fidelity Cash Central Fund | $ 142 |
Fidelity Securities Lending Cash Central Fund | 643 |
Total | $ 785 |
Other Affiliated Issuers |
An affiliated company is a company in which the Fund has ownership of at least 5% of the voting securities. Fiscal year to date transactions with companies which are or were affiliates are as follows: |
Affiliates
(Amounts in thousands) | Value,
beginning of
period | Purchases | Sales
Proceeds | Dividend
Income | Value,
end of
period |
ACCO Brands Corp. | $ 16,690 | $ - | $ 20,754 | $ - | $ - |
Consolidated Graphics, Inc. | 16,227 | - | 32,708 | - | - |
Ethan Allen Interiors, Inc. | 35,142 | 406 | 3,420 | 546 | 40,015 |
Fairchild Semiconductor International, Inc. | 50,021 | - | 69,381 | - | - |
Forestar Group, Inc. | - | 34,550 | 1,172 | - | 33,849 |
OfficeMax, Inc. | 50,778 | 18,155 | 19,947 | - | 80,319 |
Pinnacle Airlines Corp. | - | 11,730 | 1,213 | - | 11,091 |
Quality Distribution, Inc. | - | 9,982 | 2,292 | - | 12,378 |
Vitran Corp., Inc. | - | 12,387 | - | - | 15,100 |
Winnebago Industries, Inc. | 29,575 | - | 39,169 | - | - |
Total | $ 198,433 | $ 87,210 | $ 190,056 | $ 546 | $ 192,752 |
Other Information |
The following is a summary of the inputs used, as of October 31, 2010, involving the Fund's assets and liabilities carried at fair value. The inputs or methodology used for valuing securities may not be an indication of the risk associated with investing in those securities. For more information on valuation inputs, and their aggregation into the levels used in the tables below, please refer to the Security Valuation section in the accompanying Notes to Financial Statements. |
Valuation Inputs at Reporting Date: |
Description
(Amounts in thousands) | Total | Level 1 | Level 2 | Level 3 |
Investments in Securities: | | | | |
Equities: | | | | |
Consumer Discretionary | $ 980,569 | $ 980,569 | $ - | $ - |
Consumer Staples | 401,556 | 401,556 | - | - |
Energy | 784,840 | 773,592 | 11,248 | - |
Financials | 2,145,720 | 2,116,854 | 28,866 | - |
Health Care | 452,722 | 452,722 | - | - |
Industrials | 960,292 | 960,292 | - | - |
Information Technology | 713,410 | 713,410 | - | - |
Materials | 497,502 | 497,502 | - | - |
Telecommunication Services | 155,349 | 155,349 | - | - |
Utilities | 866,435 | 765,869 | 100,566 | - |
U.S. Government and Government Agency Obligations | 10,325 | - | 10,325 | - |
Money Market Funds | 260,684 | 260,684 | - | - |
Total Investments in Securities: | $ 8,229,404 | $ 8,078,399 | $ 151,005 | $ - |
Derivative Instruments: | | | | |
Assets | | | | |
Futures Contracts | $ 447 | $ 447 | $ - | $ - |
Value of Derivative Instruments |
The following table is a summary of the Fund's value of derivative instruments by risk exposure as of October 31, 2010. For additional information on derivative instruments, please refer to the Derivative Instruments section in the accompanying Notes to Financial Statements. |
Risk Exposure /
Derivative Type | Value
(Amounts in thousands) |
| Asset | Liability |
Equity Risk | | |
Futures Contracts (a) | $ 447 | $ - |
Total Value of Derivatives | $ 447 | $ - |
(a) Reflects cumulative appreciation/(depreciation) on futures contracts as disclosed on the Schedule of Investments. Only the period end variation margin is separately disclosed on the Statement of Assets and Liabilities. |
Distribution of investments by country of issue, as a percentage of total net assets, is as follows: (Unaudited) |
United States of America | 86.6% |
Bermuda | 2.2% |
Canada | 1.6% |
Switzerland | 1.6% |
United Kingdom | 1.4% |
Ireland | 1.2% |
Others (Individually Less Than 1%) | 5.4% |
| 100.0% |
Income Tax Information |
At October 31, 2010, the Fund had a capital loss carryforward of approximately $3,208,718,000 of which $104,186,000, $2,771,650,000 and $332,882,000 will expire on October 31, 2016, 2017 and 2018, respectively. Capital loss carryforwards are only available to offset future capital gains of the Fund to the extent provided by regulations and may be limited. |
See accompanying notes which are an integral part of the financial statements.
Annual Report
Statement of Assets and Liabilities
Amounts in thousands (except per-share amounts) | October 31, 2010 |
| | |
Assets | | |
Investment in securities, at value (including securities loaned of $82,357) - See accompanying schedule: Unaffiliated issuers (cost $7,697,493) | $ 7,775,968 | |
Fidelity Central Funds (cost $260,684) | 260,684 | |
Other affiliated issuers (cost $289,688) | 192,752 | |
Total Investments (cost $8,247,865) | | $ 8,229,404 |
Receivable for investments sold | | 114,608 |
Receivable for fund shares sold | | 4,325 |
Dividends receivable | | 3,105 |
Distributions receivable from Fidelity Central Funds | | 47 |
Receivable for daily variation on futures contracts | | 148 |
Other receivables | | 465 |
Total assets | | 8,352,102 |
| | |
Liabilities | | |
Payable to custodian bank | $ 3,518 | |
Payable for investments purchased | 101,567 | |
Payable for fund shares redeemed | 12,950 | |
Accrued management fee | 1,932 | |
Other affiliated payables | 1,424 | |
Other payables and accrued expenses | 401 | |
Collateral on securities loaned, at value | 83,288 | |
Total liabilities | | 205,080 |
| | |
Net Assets | | $ 8,147,022 |
Net Assets consist of: | | |
Paid in capital | | $ 11,391,370 |
Undistributed net investment income | | 88,210 |
Accumulated undistributed net realized gain (loss) on investments and foreign currency transactions | | (3,314,541) |
Net unrealized appreciation (depreciation) on investments and assets and liabilities in foreign currencies | | (18,017) |
Net Assets | | $ 8,147,022 |
See accompanying notes which are an integral part of the financial statements.
Annual Report
Financial Statements - continued
Statement of Assets and Liabilities - continued
Amounts in thousands (except per-share amounts) | October 31, 2010 |
| | |
Value: Net Asset Value, offering price and redemption price per share ($7,275,519 ÷ 113,513 shares) | | $ 64.09 |
| | |
Class K:
Net Asset Value, offering price and redemption price per share ($871,503 ÷ 13,566 shares) | | $ 64.24 |
See accompanying notes which are an integral part of the financial statements.
Annual Report
Statement of Operations
Amounts in thousands | Year ended October 31, 2010 |
| | |
Investment Income | | |
Dividends (including $546 earned from other affiliated issuers) | | $ 110,244 |
Special dividends | | 31,677 |
Interest | | 774 |
Income from Fidelity Central Funds | | 785 |
Total income | | 143,480 |
| | |
Expenses | | |
Management fee
Basic fee | $ 45,967 | |
Performance adjustment | (13,984) | |
Transfer agent fees | 17,448 | |
Accounting and security lending fees | 1,290 | |
Custodian fees and expenses | 319 | |
Independent trustees' compensation | 48 | |
Registration fees | 113 | |
Audit | 85 | |
Legal | 44 | |
Interest | 10 | |
Miscellaneous | 118 | |
Total expenses before reductions | 51,458 | |
Expense reductions | (850) | 50,608 |
Net investment income (loss) | | 92,872 |
Realized and Unrealized Gain (Loss) Net realized gain (loss) on: | | |
Investment securities: | | |
Unaffiliated issuers | (268,477) | |
Other affiliated issuers | (138,197) | |
Foreign currency transactions | (576) | |
Futures contracts | 3,574 | |
Capital gain distributions from Fidelity Central Funds | 11 | |
Total net realized gain (loss) | | (403,665) |
Change in net unrealized appreciation (depreciation) on: Investment securities | 2,074,780 | |
Assets and liabilities in foreign currencies | (3) | |
Futures contracts | 447 | |
Total change in net unrealized appreciation (depreciation) | | 2,075,224 |
Net gain (loss) | | 1,671,559 |
Net increase (decrease) in net assets resulting from operations | | $ 1,764,431 |
See accompanying notes which are an integral part of the financial statements.
Annual Report
Financial Statements - continued
Statement of Changes in Net Assets
Amounts in thousands | Year ended
October 31,
2010 | Year ended
October 31,
2009 |
Increase (Decrease) in Net Assets | | |
Operations | | |
Net investment income (loss) | $ 92,872 | $ 109,685 |
Net realized gain (loss) | (403,665) | (4,054,417) |
Change in net unrealized appreciation (depreciation) | 2,075,224 | 4,591,566 |
Net increase (decrease) in net assets resulting
from operations | 1,764,431 | 646,834 |
Distributions to shareholders from net investment income | (70,609) | (59,373) |
Share transactions - net increase (decrease) | (1,308,650) | (4,068,805) |
Total increase (decrease) in net assets | 385,172 | (3,481,344) |
| | |
Net Assets | | |
Beginning of period | 7,761,850 | 11,243,194 |
End of period (including undistributed net investment income of $88,210 and undistributed net investment income of $53,143, respectively) | $ 8,147,022 | $ 7,761,850 |
See accompanying notes which are an integral part of the financial statements.
Annual Report
Financial Highlights - Value
Years ended October 31, | 2010 | 2009 | 2008 | 2007 | 2006 |
Selected Per-Share Data | | | | | |
Net asset value, beginning of period | $ 51.82 | $ 43.78 | $ 89.60 | $ 83.82 | $ 75.61 |
Income from Investment Operations | | | | | |
Net investment income (loss) B | .66 E | .59 | .75 | .64 | .61 |
Net realized and unrealized gain (loss) | 12.09 | 7.69 | (38.92) | 11.79 | 13.17 |
Total from investment operations | 12.75 | 8.28 | (38.17) | 12.43 | 13.78 |
Distributions from net investment income | (.48) | (.24) | (.56) | (.56) | (.43) |
Distributions from net realized gain | - | - | (7.09) | (6.09) | (5.14) |
Total distributions | (.48) | (.24) | (7.65) | (6.65) | (5.57) |
Net asset value, end of period | $ 64.09 | $ 51.82 | $ 43.78 | $ 89.60 | $ 83.82 |
Total Return A | 24.74% | 19.12% | (46.34)% | 15.82% | 19.01% |
Ratios to Average Net Assets C, F | | | | | |
Expenses before reductions | .64% | .64% | .76% | .70% | .67% |
Expenses net of fee waivers, if any | .64% | .64% | .76% | .70% | .67% |
Expenses net of all reductions | .63% | .64% | .76% | .69% | .66% |
Net investment income (loss) | 1.12% E | 1.41% | 1.10% | .74% | .76% |
Supplemental Data | | | | | |
Net assets, end of period (in millions) | $ 7,276 | $ 7,278 | $ 11,066 | $ 22,558 | $ 17,153 |
Portfolio turnover rate D | 148% | 51% | 50% | 44% | 36% |
A Total returns would have been lower had certain expenses not been reduced during the periods shown.
B Calculated based on average shares outstanding during the period.
C Fees and expenses of the underlying Fidelity Central Funds are not included in the Fund's expense ratio. The Fund indirectly bears its proportionate share of the expenses of any underlying Fidelity Central Funds.
D Amount does not include the portfolio activity of any underlying Fidelity Central Funds.
E Investment income per share reflects a special dividend which amounted to $.23 per share. Excluding the special dividend, the ratio of net investment income (loss) to average net assets would have been .73%.
F Expense ratios reflect operating expenses of the class. Expenses before reductions do not reflect amounts reimbursed by the investment adviser or reductions from brokerage service arrangements or reductions from other expense offset arrangements and do not represent the amount paid by the class during periods when reimbursements or reductions occur. Expenses net of fee waivers reflect expenses after reimbursement by the investment adviser but prior to reductions from brokerage service arrangements or other expense offset arrangements. Expenses net of all reductions represent the net expenses paid by the class.
See accompanying notes which are an integral part of the financial statements.
Annual Report
Financial Highlights - Class K
Years ended October 31, | 2010 | 2009 | 2008 H |
Selected Per-Share Data | | | |
Net asset value, beginning of period | $ 51.96 | $ 43.82 | $ 72.61 |
Income from Investment Operations | | | |
Net investment income (loss) D | .76 G | .72 | .25 |
Net realized and unrealized gain (loss) | 12.12 | 7.67 | (29.04) |
Total from investment operations | 12.88 | 8.39 | (28.79) |
Distributions from net investment income | (.60) | (.25) | - |
Total distributions | (.60) | (.25) | - |
Net asset value, end of period | $ 64.24 | $ 51.96 | $ 43.82 |
Total Return B, C | 24.96% | 19.39% | (39.65)% |
Ratios to Average Net Assets E, I | | | |
Expenses before reductions | .47% | .40% | .60% A |
Expenses net of fee waivers, if any | .47% | .40% | .60% A |
Expenses net of all reductions | .46% | .40% | .60% A |
Net investment income (loss) | 1.29% G | 1.64% | 1.17% A |
Supplemental Data | | | |
Net assets, end of period (in millions) | $ 872 | $ 484 | $ 177 |
Portfolio turnover rate F | 148% | 51% | 50% |
A Annualized
B Total returns for periods of less than one year are not annualized.
C Total returns would have been lower had certain expenses not been reduced during the periods shown.
D Calculated based on average shares outstanding during the period.
E Fees and expenses of the underlying Fidelity Central Funds are not included in the Fund's expense ratio. The Fund indirectly bears its proportionate share of the expenses of any underlying Fidelity Central Funds.
F Amount does not include the portfolio activity of any underlying Fidelity Central Funds.
G Investment income per share reflects a special dividend which amounted to $.23 per share. Excluding the special dividend, the ratio of net investment income (loss) to average net assets would have been .90%.
H For the period May 9, 2008 (commencement of sale of shares) to October 31, 2008.
I Expense ratios reflect operating expenses of the class. Expenses before reductions do not reflect amounts reimbursed by the investment adviser or reductions from brokerage service arrangements or reductions from other expense offset arrangements and do not represent the amount paid by the class during periods when reimbursements or reductions occur. Expense ratios before reductions for start-up periods may not be representative of longer-term operating periods. Expenses net of fee waivers reflect expenses after reimbursement by the investment adviser but prior to reductions from brokerage service arrangements or other expense offset arrangements. Expenses net of all reductions represent the net expenses paid by the class.
See accompanying notes which are an integral part of the financial statements.
Annual Report
Notes to Financial Statements
For the period ended October 31, 2010
(Amounts in thousands except ratios)
1. Organization.
Fidelity Value Fund (the Fund) is a fund of Fidelity Capital Trust (the Trust) and is authorized to issue an unlimited number of shares. The Trust is registered under the Investment Company Act of 1940, as amended (the 1940 Act), as an open-end management investment company organized as a Massachusetts business trust. The Fund offers Value and Class K shares, each of which has equal rights as to assets and voting privileges. Investment income, realized and unrealized capital gains and losses, the common expenses of the Fund, and certain fund-level expense reductions, if any, are allocated on a pro-rata basis to each class based on the relative net assets of each class to the total net assets of the Fund. Each class differs with respect to transfer agent fees incurred. Certain expense reductions also differ by class.
2. Investments in Fidelity Central Funds.
The Fund may invest in Fidelity Central Funds, which are open-end investment companies available only to other investment companies and accounts managed by Fidelity Management & Research Company (FMR) and its affiliates. The Fund's Schedule of Investments lists each of the Fidelity Central Funds held as of period end, if any, as an investment of the Fund, but does not include the underlying holdings of each Fidelity Central Fund. As an Investing Fund, the Fund indirectly bears its proportionate share of the expenses of the underlying Fidelity Central Funds.
The Money Market Central Funds seek preservation of capital and current income and are managed by Fidelity Investments Money Management, Inc. (FIMM), an affiliate of FMR.
A complete unaudited list of holdings for each Fidelity Central Fund is available upon request or at the Securities and Exchange Commission (the SEC) web site at www.sec.gov. In addition, the financial statements of the Fidelity Central Funds, which are not covered by the Fund's Report of Independent Registered Public Accounting Firm, are available on the SEC web site or upon request.
3. Significant Accounting Policies.
The financial statements have been prepared in conformity with accounting principles generally accepted in the United States of America (GAAP), which require management to make certain estimates and assumptions at the date of the financial statements. Actual results could differ from those estimates. The following summarizes the significant accounting policies of the Fund:
Security Valuation. Investments are valued as of 4:00 p.m. Eastern time on the last calendar day of the period. The Fund uses independent pricing services approved by the Board of Trustees to value its investments. When current market prices or quotations are not readily available or reliable, valuations may be determined in good faith in accordance
Annual Report
Notes to Financial Statements - continued
(Amounts in thousands except ratios)
3. Significant Accounting Policies - continued
Security Valuation - continued
with procedures adopted by the Board of Trustees. Factors used in determining value may include market or security specific events, changes in interest rates and credit quality. The frequency with which these procedures are used cannot be predicted and they may be utilized to a significant extent. The value used for net asset value (NAV) calculation under these procedures may differ from published prices for the same securities.
The Fund categorizes the inputs to valuation techniques used to value its investments into a disclosure hierarchy consisting of three levels as shown below.
Level 1 - quoted prices in active markets for identical investments
Level 2 - other significant observable inputs (including quoted prices for similar investments, interest rates, prepayment speeds, etc.)
Level 3 - unobservable inputs (including the fund's own assumptions based on the best information available)
Changes in valuation techniques may result in transfers in or out of an assigned level within the disclosure hierarchy. The aggregate value of investments by input level, as of October 31, 2010 is included at the end of the Fund's Schedule of Investments. Valuation techniques used to value the Fund's investments by major category are as follows.
Equity securities, including restricted securities, for which market quotations are readily available, are valued at the last reported sale price or official closing price as reported by an independent pricing service on the primary market or exchange on which they are traded and are categorized as Level 1 in the hierarchy. In the event there were no sales during the day or closing prices are not available, securities are valued at the last quoted bid price or may be valued using the last available price and are generally categorized as Level 2 in the hierarchy. For foreign equity securities, when significant market or security specific events arise, comparisons to the valuation of American Depositary Receipts (ADRs), futures contracts, Exchange-traded funds (ETFs) and certain indexes as well as quoted prices for similar securities are used and are categorized as Level 2 in the hierarchy in these circumstances. Utilizing these techniques may result in transfers between Level 1 and Level 2. For restricted equity securities and private placements where observable inputs are limited, assumptions about market activity and risk are used and are categorized as Level 3 in the hierarchy.
Debt securities, including restricted securities, are valued based on evaluated prices received from independent pricing services or from dealers who make markets in such securities. For U.S. government and government agency obligations, pricing services utilize matrix pricing which considers yield or price of bonds of comparable quality, coupon, maturity and type as well as dealer supplied prices and are generally categorized as Level 2 in the hierarchy.
Annual Report
3. Significant Accounting Policies - continued
Security Valuation - continued
Futures contracts are valued at the settlement price or official closing price established each day by the board of trade or exchange on which they are traded and are categorized as Level 1 in the hierarchy. Investments in open-end mutual funds, including the Fidelity Central Funds, are valued at their closing net asset value each business day and are categorized as Level 1 in the hierarchy. Short-term securities with remaining maturities of sixty days or less for which quotations are not readily available are valued at amortized cost, which approximates fair value and are categorized as Level 2 in the hierarchy.
When independent prices are unavailable or unreliable, debt securities may be valued utilizing pricing matrices which consider similar factors that would be used by independent pricing services. These are generally categorized as Level 2 in the hierarchy but may be Level 3 depending on the circumstances.
Foreign Currency. The Fund uses foreign currency contracts to facilitate transactions in foreign-denominated securities. Gains and losses from these transactions may arise from changes in the value of the foreign currency or if the counterparties do not perform under the contracts' terms.
Foreign-denominated assets, including investment securities, and liabilities are translated into U.S. dollars at the exchange rate at period end. Purchases and sales of investment securities, income and dividends received and expenses denominated in foreign currencies are translated into U.S. dollars at the exchange rate in effect on the transaction date.
The effects of exchange rate fluctuations on investments are included with the net realized and unrealized gain (loss) on investment securities. Other foreign currency transactions resulting in realized and unrealized gain (loss) are disclosed separately.
Investment Transactions and Income. For financial reporting purposes, the Fund's investment holdings and NAV include trades executed through the end of the last business day of the period. The NAV per share for processing shareholder transactions is calculated as of the close of business of the New York Stock Exchange (NYSE), normally 4:00 p.m. Eastern time and includes trades executed through the end of the prior business day. Gains and losses on securities sold are determined on the basis of identified cost and may include proceeds received from litigation. Dividend income is recorded on the ex-dividend date, except for certain dividends from foreign securities where the ex-dividend date may have passed, which are recorded as soon as the Fund is informed of the ex-dividend date. Non-cash dividends included in dividend income, if any, are recorded at the fair market value of the securities received. Distributions received on securities that represent a return of capital or capital gain are recorded as a reduction of cost of investments and/or as a realized gain. The Fund estimates the components of distributions received that may be considered return of capital distributions or capital gain distributions. Large, non-recurring
Annual Report
Notes to Financial Statements - continued
(Amounts in thousands except ratios)
3. Significant Accounting Policies - continued
Investment Transactions and Income - continued
dividends recognized by the Fund are presented separately on the Statement of Operations as "Special Dividends" and the impact of these dividends is presented in the Financial Highlights. Interest income and distributions from the Fidelity Central Funds are accrued as earned. Interest income includes coupon interest and amortization of premium and accretion of discount on debt securities. Investment income is recorded net of foreign taxes withheld where recovery of such taxes is uncertain.
Expenses. Most expenses of the Trust can be directly attributed to a fund. Expenses which cannot be directly attributed are apportioned amongst each fund in the Trust. Expense estimates are accrued in the period to which they relate and adjustments are made when actual amounts are known.
Deferred Trustee Compensation. Under a Deferred Compensation Plan (the Plan), independent Trustees may elect to defer receipt of a portion of their annual compensation. Deferred amounts are invested in a cross-section of Fidelity funds, are marked-to-market and remain in the Fund until distributed in accordance with the Plan. The investment of deferred amounts and the offsetting payable to the Trustees are included in the accompanying Statement of Assets and Liabilities.
Income Tax Information and Distributions to Shareholders. Each year the Fund intends to qualify as a regulated investment company, including distributing substantially all of its taxable income and realized gains under Subchapter M of the Internal Revenue Code and filing its U.S. federal tax return. As a result, no provision for income taxes is required. As of October 31, 2010, the Fund did not have any unrecognized tax benefits in the accompanying financial statements. A fund's federal tax return is subject to examination by the Internal Revenue Service (IRS) for a period of three years. Foreign taxes are provided for based on the Fund's understanding of the tax rules and rates that exist in the foreign markets in which it invests.
Distributions are declared and recorded on the ex-dividend date. Income dividends and capital gain distributions are declared separately for each class. Income and capital gain distributions are determined in accordance with income tax regulations, which may differ from GAAP.
Capital accounts within the financial statements are adjusted for permanent book-tax differences. These adjustments have no impact on net assets or the results of operations. Temporary book-tax differences will reverse in a subsequent period.
Book-tax differences are primarily due to the short-term gain distributions from the Fidelity Central Funds, futures transactions, foreign currency transactions, passive
Annual Report
3. Significant Accounting Policies - continued
Income Tax Information and Distributions to Shareholders - continued
foreign investment companies (PFIC), market discount, partnerships, deferred trustees compensation, capital loss carryforwards and losses deferred due to wash sales.
The federal tax cost of investment securities and unrealized appreciation (depreciation) as of period end were as follows:
Gross unrealized appreciation | $ 703,528 |
Gross unrealized depreciation | (827,366) |
Net unrealized appreciation (depreciation) | $ (123,838) |
| |
Tax Cost | $ 8,353,242 |
The tax-based components of distributable earnings as of period end were as follows:
Undistributed ordinary income | $ 88,489 |
Capital loss carryforward | $ (3,208,718) |
Net unrealized appreciation (depreciation) | $ (123,842) |
The tax character of distributions paid was as follows:
| October 31, 2010 | October 31, 2009 |
Ordinary Income | $ 70,609 | $ 59,373 |
4. Operating Policies.
Restricted Securities. The Fund may invest in securities that are subject to legal or contractual restrictions on resale. These securities generally may be resold in transactions exempt from registration or to the public if the securities are registered. Disposal of these securities may involve time-consuming negotiations and expense, and prompt sale at an acceptable price may be difficult. Information regarding restricted securities is included at the end of the Fund's Schedule of Investments.
5. Derivative Instruments.
Risk Exposures and the Use of Derivative Instruments. The Fund uses derivative instruments (derivatives), including futures contracts, in order to meet its investment objectives. The strategy is to use derivatives to increase returns and to manage exposure to certain risks as defined below. The success of any strategy involving derivatives depends on analysis of numerous economic factors, and if the strategies for investment do not work as intended, the Fund may not achieve its objectives.
Annual Report
Notes to Financial Statements - continued
(Amounts in thousands except ratios)
5. Derivative Instruments - continued
Risk Exposures and the Use of Derivative Instruments - continued
The Fund's use of derivatives may increase or decrease its exposure to the following risk:
Equity Risk | Equity risk relates to the fluctuations in the value of financial instruments as a result of changes in market prices (other than those arising from interest rate risk or foreign exchange risk), whether caused by factors specific to an individual investment, its issuer, or all factors affecting all instruments traded in a market or market segment. |
The Fund is also exposed to additional risks from investing in derivatives, such as liquidity risk and counterparty credit risk. Liquidity risk is the risk that the Fund will be unable to sell the derivative in the open market in a timely manner. Counterparty credit risk is the risk that the counterparty will not be able to fulfill its obligation to the Fund. The Fund's maximum risk of loss from counterparty credit risk is generally the aggregate unrealized appreciation and unpaid counterparty fees in excess of any collateral pledged by the counterparty to the Fund. Counterparty risk related to exchange-traded futures contracts is minimal because of the protection provided by the exchange on which they trade. Risk of loss may exceed the amounts recognized in the Statement of Assets and Liabilities.
Futures Contracts. A futures contract is an agreement between two parties to buy or sell a specified underlying instrument for a fixed price at a specified future date. The Fund uses futures contracts to manage its exposure to the stock market.
Upon entering into a futures contract, a fund is required to deposit either cash or securities (initial margin) with a clearing broker in an amount equal to a certain percentage of the face value of the contract. Futures contracts are marked-to-market daily and subsequent payments (variation margin) are made or received by a fund depending on the daily fluctuations in the value of the futures contracts and are recorded as unrealized appreciation or (depreciation). Realized gain or (loss) is recorded upon the expiration or closing of a futures contract.
The underlying face amount at value of open futures contracts at period end is shown in the Schedule of Investments under the caption "Futures Contracts." This amount reflects each contract's exposure to the underlying instrument at period end and is representative of activity for the period. Securities deposited to meet initial margin requirements are identified in the Schedule of Investments. The receivable and/or payable for the variation margin are reflected in the Statement of Assets and Liabilities.
Certain risks may arise upon entering into futures contracts, including the risk that an illiquid market may limit the ability to close out a futures contract prior to settlement date.
During the period the Fund recognized net realized gain (loss) of $3,574 and a change in net unrealized appreciation (depreciation) of $447 related to its investment in futures contracts. These amounts are included in the Statement of Operations.
Annual Report
6. Purchases and Sales of Investments.
Purchases and sales of securities, other than short-term securities, aggregated $11,847,044 and $13,272,765, respectively.
7. Fees and Other Transactions with Affiliates.
Management Fee. FMR and its affiliates provide the Fund with investment management related services for which the Fund pays a monthly management fee. The management fee is the sum of an individual fund fee rate that is based on an annual rate of .30% of the Fund's average net assets and a group fee rate that averaged .26% during the period. The group fee rate is based upon the average net assets of all the mutual funds advised by FMR. The group fee rate decreases as assets under management increase and increases as assets under management decrease. In addition, the management fee is subject to a performance adjustment (up to a maximum of ± .20% of the Fund's average net assets over a 36 month performance period). The upward or downward adjustment to the management fee is based on the relative investment performance of the retail class of the Fund, Value, as compared to an appropriate benchmark index. For the period, the total annual management fee rate, including the performance adjustment, was .39% of the Fund's average net assets.
Transfer Agent Fees. Fidelity Investments Institutional Operations Company, Inc. (FIIOC), an affiliate of FMR, is the transfer, dividend disbursing and shareholder servicing agent for each class of the Fund. FIIOC receives account fees and asset-based fees that vary according to the account size and type of account of the shareholders of Value. FIIOC receives an asset-based fee of Class K's average net assets. FIIOC pays for typesetting, printing and mailing of shareholder reports, except proxy statements. For the period, transfer agent fees for each class were as follows:
| Amount | % of
Average
Net Assets |
Value | $ 17,106 | .23 |
Class K | 342 | .05 |
| $ 17,448 | |
Accounting and Security Lending Fees. Fidelity Service Company, Inc. (FSC), an affiliate of FMR, maintains the Fund's accounting records. The accounting fee is based on the level of average net assets for the month. Under a separate contract, FSC administers the security lending program. The security lending fee is based on the number and duration of lending transactions.
Annual Report
Notes to Financial Statements - continued
(Amounts in thousands except ratios)
7. Fees and Other Transactions with Affiliates - continued
Brokerage Commissions. The Fund placed a portion of its portfolio transactions with brokerage firms which are affiliates of the investment adviser. The commissions paid to these affiliated firms were $271 for the period.
Interfund Lending Program. Pursuant to an Exemptive Order issued by the SEC, the Fund, along with other registered investment companies having management contracts with FMR, may participate in an interfund lending program. This program provides an alternative credit facility allowing the funds to borrow from, or lend money to, other participating affiliated funds. At period end, there were no interfund loans outstanding. The Fund's activity in this program during the period for which loans were outstanding was as follows:
Borrower or Lender | Average Daily
Loan Balance | Weighted Average
Interest Rate | Interest
Expense |
Borrower | $ 13,513 | .41% | $ 8 |
8. Committed Line of Credit.
The Fund participates with other funds managed by FMR or an affiliate in a $3.75 billion credit facility (the "line of credit") to be utilized for temporary or emergency purposes to fund shareholder redemptions or for other short-term liquidity purposes. The Fund has agreed to pay commitment fees on its pro-rata portion of the line of credit, which amounted to $32 and is reflected in Miscellaneous expenses on the Statement of Operations. During the period, there were no borrowings on this line of credit.
9. Security Lending.
The Fund lends portfolio securities through a lending agent from time to time in order to earn additional income. The lending agent may loan securities to certain qualified borrowers, including Fidelity Capital Markets (FCM), a broker-dealer affiliated with the Fund. On the settlement date of the loan, the Fund receives collateral (in the form of U.S. Treasury obligations, letters of credit and/or cash) against the loaned securities and maintains collateral in an amount not less than 100% of the market value of the loaned securities during the period of the loan. The market value of the loaned securities is determined at the close of business of the Fund and any additional required collateral is delivered to the Fund on the next business day. If the borrower defaults on its obligation to return the securities loaned because of insolvency or other reasons, a fund could experience delays and costs in recovering the securities loaned or in gaining access to the collateral. Any cash collateral received is invested in the Fidelity Securities Lending Cash Central Fund. The value of loaned securities and cash collateral at period end are disclosed on the Fund's Statement of Assets and Liabilities. Security lending income
Annual Report
9. Security Lending - continued
represents the income earned on investing cash collateral, less rebates paid to borrowers and lending agent fees associated with the loan, plus any premium payments received for lending certain types of securities. Security lending income is presented in the Statement of Operations as a component of income from Fidelity Central Funds. Total security lending income during the period amounted to $643.
10. Bank Borrowings.
The Fund is permitted to have bank borrowings for temporary or emergency purposes to fund shareholder redemptions. The Fund has established borrowing arrangements with certain banks. The interest rate on the borrowings is the bank's base rate, as revised from time to time. The average daily loan balance during the period for which loans were outstanding amounted to $32,110. The weighted average interest rate was .70%. The interest expense amounted to $2 under the bank borrowing program. At period end, there were no bank borrowings outstanding.
11. Expense Reductions.
Many of the brokers with whom FMR places trades on behalf of the Fund provided services to the Fund in addition to trade execution. These services included payments of certain expenses on behalf of the Fund totaling $850 for the period.
12. Distributions to Shareholders.
Distributions to shareholders of each class were as follows:
Years ended October 31, | 2010 | 2009 |
From net investment income | | |
Value | $ 65,010 | $ 58,273 |
Class K | 5,599 | 1,100 |
Total | $ 70,609 | $ 59,373 |
Annual Report
Notes to Financial Statements - continued
(Amounts in thousands except ratios)
13. Share Transactions.
Transactions for each class of shares were as follows:
| Shares | Dollars |
Years ended October 31, | 2010 | 2009 A | 2010 | 2009 A |
Value | | | | |
Shares sold | 15,905 | 25,560 | $ 953,857 | $ 1,067,061 |
Conversion to Class K | - | (5,438) | - | (212,325) |
Reinvestment of distributions | 1,127 | 1,539 | 62,576 | 56,603 |
Shares redeemed | (43,950) | (133,977) | (2,561,113) | (5,186,771) |
Net increase (decrease) | (26,918) | (112,316) | $ (1,544,680) | $ (4,275,432) |
Class K | | | | |
Shares sold | 9,653 | 1,937 | $ 558,763 | $ 85,453 |
Conversion from Value | - | 5,430 | - | 212,325 |
Reinvestment of distributions | 101 | 30 | 5,599 | 1,100 |
Shares redeemed | (5,506) | (2,118) | (328,332) | (92,251) |
Net increase (decrease) | 4,248 | 5,279 | $ 236,030 | $ 206,627 |
A Conversion transactions for Value and Class K are presented for the period November 1, 2008 through August 31, 2009.
14. Other.
The Fund's organizational documents provide former and current trustees and officers with a limited indemnification against liabilities arising in connection with the performance of their duties to the Fund. In the normal course of business, the Fund may also enter into contracts that provide general indemnifications. The Fund's maximum exposure under these arrangements is unknown as this would be dependent on future claims that may be made against the Fund. The risk of material loss from such claims is considered remote.
Annual Report
To the Trustees of Fidelity Capital Trust and the Shareholders of Fidelity Value Fund:
In our opinion, the accompanying statement of assets and liabilities, including the schedule of investments, and the related statements of operations and of changes in net assets and the financial highlights present fairly, in all material respects, the financial position of Fidelity Value Fund (a fund of Fidelity Capital Trust) at October 31, 2010, the results of its operations for the year then ended, the changes in its net assets for each of the two years in the period then ended and the financial highlights for each of the periods indicated, in conformity with accounting principles generally accepted in the United States of America. These financial statements and financial highlights (hereafter referred to as "financial statements") are the responsibility of the Fidelity Value Fund's management. Our responsibility is to express an opinion on these financial statements based on our audits. We conducted our audits of these financial statements in accordance with the standards of the Public Company Accounting Oversight Board (United States). Those standards require that we plan and perform the audit to obtain reasonable assurance about whether the financial statements are free of material misstatement. An audit includes examining, on a test basis, evidence supporting the amounts and disclosures in the financial statements, assessing the accounting principles used and significant estimates made by management, and evaluating the overall financial statement presentation. We believe that our audits, which included confirmation of securities at October 31, 2010 by correspondence with the custodian and brokers, provide a reasonable basis for our opinion.
/s/ PricewaterhouseCoopers LLP
PricewaterhouseCoopers LLP
Boston, Massachusetts
December 10, 2010
Annual Report
The Trustees, Member of the Advisory Board, and executive officers of the trust and fund, as applicable, are listed below. The Board of Trustees governs the fund and is responsible for protecting the interests of shareholders. The Trustees are experienced executives who meet periodically throughout the year to oversee the fund's activities, review contractual arrangements with companies that provide services to the fund, oversee management of the risks associated with such activities and contractual arrangements, and review the fund's performance. Except for James C. Curvey, each of the Trustees oversees 221 funds advised by FMR or an affiliate. Mr. Curvey oversees 410 funds advised by FMR or an affiliate.
The Trustees hold office without limit in time except that (a) any Trustee may resign; (b) any Trustee may be removed by written instrument, signed by at least two-thirds of the number of Trustees prior to such removal; (c) any Trustee who requests to be retired or who has become incapacitated by illness or injury may be retired by written instrument signed by a majority of the other Trustees; and (d) any Trustee may be removed at any special meeting of shareholders by a two-thirds vote of the outstanding voting securities of the trust. Each Trustee who is not an interested person (as defined in the 1940 Act) (Independent Trustee), shall retire not later than the last day of the calendar year in which his or her 72nd birthday occurs. The Independent Trustees may waive this mandatory retirement age policy with respect to individual Trustees. The executive officers and Advisory Board Member hold office without limit in time, except that any officer and Advisory Board Member may resign or may be removed by a vote of a majority of the Trustees at any regular meeting or any special meeting of the Trustees. Except as indicated, each individual has held the office shown or other offices in the same company for the past five years.
Experience, Skills, Attributes, and Qualifications of the Fund's Trustees. The Governance and Nominating Committee has adopted a statement of policy that describes the experience, qualifications, attributes, and skills that are necessary and desirable for potential Independent Trustee candidates (Statement of Policy). The Board believes that each Trustee satisfied at the time he or she was initially elected or appointed a Trustee, and continues to satisfy, the standards contemplated by the Statement of Policy. The Governance and Nominating Committee also engages professional search firms to help identify potential Independent Trustee candidates who have the experience, qualifications, attributes, and skills consistent with the Statement of Policy. From time to time, additional criteria based on the composition and skills of the current Independent Trustees, as well as experience or skills that may be appropriate in light of future changes to board composition, business conditions, and regulatory or other developments, have also been considered by the professional search firms and the Governance and Nominating Committee. In addition, the Board takes into account the Trustees' commitment and participation in Board and committee meetings, as well as their leadership of standing and ad hoc committees throughout their tenure.
In determining that a particular Trustee was and continues to be qualified to serve as a Trustee, the Board has considered a variety of criteria, none of which, in isolation, was controlling. The Board believes that, collectively, the Trustees have balanced and diverse experience, qualifications, attributes, and skills, which allow the Board to operate effectively in governing the fund and protecting the interests of shareholders. Information about the specific experience, skills, attributes, and qualifications of each Trustee, which in each case led to the Board's conclusion that the Trustee should serve (or continue to serve) as a trustee of the fund, is provided below.
Annual Report
Board Structure and Oversight Function. Edward C. Johnson 3d is an interested person (as defined in the 1940 Act) and currently serves as Chairman. The Trustees have determined that an interested Chairman is appropriate and benefits shareholders because an interested Chairman has a personal and professional stake in the quality and continuity of services provided to the fund. Independent Trustees exercise their informed business judgment to appoint an individual of their choosing to serve as Chairman, regardless of whether the Trustee happens to be independent or a member of management. The Independent Trustees have determined that they can act independently and effectively without having an Independent Trustee serve as Chairman and that a key structural component for assuring that they are in a position to do so is for the Independent Trustees to constitute a substantial majority for the Board. The Independent Trustees also regularly meet in executive session. Ned C. Lautenbach serves as Chairman of the Independent Trustees and as such (i) acts as a liaison between the Independent Trustees and management with respect to matters important to the Independent Trustees and (ii) with management prepares agendas for Board meetings.
Fidelity funds are overseen by different Boards of Trustees. The fund's Board oversees Fidelity's equity and high income funds and another Board oversees Fidelity's investment-grade bond, money market, and asset allocation funds. The asset allocation funds may invest in Fidelity funds overseen by the fund's Board. The use of separate Boards, each with its own committee structure, allows the Trustees of each group of Fidelity funds to focus on the unique issues of the funds they oversee, including common research, investment, and operational issues. On occasion, the separate Boards establish joint committees to address issues of overlapping consequences for the Fidelity funds overseen by each Board.
The Trustees operate using a system of committees to facilitate the timely and efficient consideration of all matters of importance to the Trustees, the fund, and fund shareholders and to facilitate compliance with legal and regulatory requirements and oversight of the fund's activities and associated risks. The Board, acting through its committees, has charged FMR and its affiliates with (i) identifying events or circumstances the occurrence of which could have demonstrably adverse effects on the fund's business and/or reputation; (ii) implementing processes and controls to lessen the possibility that such events or circumstances occur or to mitigate the effects of such events or circumstances if they do occur; and (iii) creating and maintaining a system designed to evaluate continuously business and market conditions in order to facilitate the identification and implementation processes described in (i) and (ii) above. Because the day-to-day operations and activities of the fund are carried out by or through FMR, its affiliates and other service providers, the fund's exposure to risks is mitigated but not eliminated by the processes overseen by the Trustees. While each of the Board's committees has responsibility for overseeing different aspects of the fund's activities, oversight is exercised primarily through the Operations, Audit, and Compliance Committees. Appropriate personnel, including but not limited to the fund's Chief Compliance Officer (CCO), FMR's internal auditor, the independent accountants, the fund's Treasurer and portfolio management personnel, make periodic reports to the Board's committees, as appropriate. The responsibilities of each committee, including their oversight responsibilities, are described further under "Standing Committees of the Fund's Trustees."
Annual Report
Trustees and Officers - continued
The fund's Statement of Additional Information (SAI) includes more information about the Trustees. To request a free copy, call Fidelity at 1-800-835-5092.
Interested Trustees*:
Correspondence intended for each Trustee who is an interested person may be sent to Fidelity Investments, 82 Devonshire Street, Boston, Massachusetts 02109.
Name, Age; Principal Occupations and Other Relevant Experience+ |
Edward C. Johnson 3d (80) |
| Year of Election or Appointment: 1978 Mr. Johnson is Trustee and Chairman of the Board of Trustees of certain Trusts. Mr. Johnson serves as Chief Executive Officer, Chairman, and a Director of FMR LLC; Chairman and a Director of FMR; Chairman and a Director of Fidelity Research & Analysis Company (FRAC); Chairman and a Director of Fidelity Investments Money Management, Inc.; and Chairman and a Director of FMR Co., Inc. In addition, Mr. Johnson serves as Chairman and Director of FIL Limited. Previously, Mr. Johnson served as President of FMR LLC (2006-2007). |
James C. Curvey (75) |
| Year of Election or Appointment: 2007 Mr. Curvey also serves as Trustee (2007-present) of other investment companies advised by FMR. Mr. Curvey is a Director of Fidelity Investments Money Management, Inc. (2009-present), Director of Fidelity Research & Analysis Co. (2009-present) and Director of FMR and FMR Co., Inc. (2007-present). Mr. Curvey is also Vice Chairman (2007-present) and Director of FMR LLC. In addition, Mr. Curvey serves as an Overseer for the Boston Symphony Orchestra and a member of the Trustees of Villanova University. Previously, Mr. Curvey was the Vice Chairman (2006-2007) and Director (2000-2007) of FMR Corp. |
* Trustees have been determined to be "Interested Trustees" by virtue of, among other things, their affiliation with the trust or various entities under common control with FMR.
+ The information above includes each Trustee's principal occupation during the last five years and other information relating to the experience, attributes, and skills relevant to each Trustee's qualifications to serve as a Trustee, which led to the conclusion that each Trustee should serve as a Trustee for the fund.
Independent Trustees:
Correspondence intended for each Independent Trustee (that is, the Trustees other than the Interested Trustees) may be sent to Fidelity Investments, P.O. Box 55235, Boston, Massachusetts 02205-5235.
Name, Age; Principal Occupations and Other Relevant Experience+ |
Dennis J. Dirks (62) |
| Year of Election or Appointment: 2005 Prior to his retirement in May 2003, Mr. Dirks was Chief Operating Officer and a member of the Board of The Depository Trust & Clearing Corporation (DTCC). He also served as President, Chief Operating Officer, and Board member of The Depository Trust Company (DTC) and President and Board member of the National Securities Clearing Corporation (NSCC). In addition, Mr. Dirks served as Chief Executive Officer and Board member of the Government Securities Clearing Corporation, Chief Executive Officer and Board member of the Mortgage-Backed Securities Clearing Corporation, as a Trustee and a member of the Finance Committee of Manhattan College (2005-2008), and as a Trustee and a member of the Finance Committee of AHRC of Nassau County (2006-2008). Mr. Dirks is a member of the Independent Directors Council (IDC) Governing Council (2010-Present) and Board of Directors for The Brookville Center for Children's Services, Inc. (2009-present). |
Alan J. Lacy (57) |
| Year of Election or Appointment: 2008 Mr. Lacy serves as Senior Adviser (2007-present) of Oak Hill Capital Partners, L.P. (private equity). Mr. Lacy also served as Chief Executive Officer (2000-2005) and Vice Chairman (2005-2006) of Sears Holdings Corporation and Sears, Roebuck and Co. (retail). In addition, Mr. Lacy serves as a member of the Board of Directors of The Western Union Company (global money transfer, 2006-present) and Bristol-Myers Squibb Company (global pharmaceuticals, 2007-present). Mr. Lacy is Chairman (2008-present) and a member (2006-present) of the Board of Trustees of The National Parks Conservation Association. |
Ned C. Lautenbach (66) |
| Year of Election or Appointment: 2000 Mr. Lautenbach is Chairman of the Independent Trustees of the Equity and High Income Funds (2006-present). Mr. Lautenbach currently serves as the Lead Director of the Eaton Corporation Board of Directors (diversified industrial, 1997-present). Mr. Lautenbach is also a member of the Board of Directors of the Philharmonic Center for the Arts in Naples, Florida (1999 - present); a member of the Board of Trustees of Fairfield University (2005-present); and a member of the Council on Foreign Relations (1994 - present). Previously, Mr. Lautenbach was a Partner/Advisory Partner at Clayton, Dubilier & Rice, Inc. (private equity investment, 1998-2010), as well as a Director of Sony Corporation (2006-2007). |
Joseph Mauriello (66) |
| Year of Election or Appointment: 2008 Prior to his retirement in January 2006, Mr. Mauriello served in numerous senior management positions including Deputy Chairman and Chief Operating Officer (2004-2005), and Vice Chairman of Financial Services (2002-2004) of KPMG LLP US (professional services, 1965-2005). Mr. Mauriello currently serves as a member of the Board of Directors of XL Group plc. (global insurance and re-insurance, 2006-present) and of Arcadia Resources Inc. (health care services and products, 2007-present). Previously, Mr. Mauriello served as a Director of the Hamilton Funds of the Bank of New York (2006-2007). |
Cornelia M. Small (66) |
| Year of Election or Appointment: 2005 Ms. Small is a member of the Board of Directors of the Teagle Foundation (2009-present). Ms. Small is also a member of the Investment Committee, and Chair (2008-present) and a member of the Board of Trustees of Smith College. In addition, Ms. Small serves on the Investment Committee of the Berkshire Taconic Community Foundation (2008-present). Previously, Ms. Small served as Chairperson of the Investment Committee (2002-2008) of Smith College. In addition, Ms. Small served as Chief Investment Officer, Director of Global Equity Investments, and a member of the Board of Directors of Scudder, Stevens & Clark and Scudder Kemper Investments. |
William S. Stavropoulos (71) |
| Year of Election or Appointment: 2002 Mr. Stavropoulos is Vice Chairman of the Independent Trustees of the Equity and High Income Funds (2006-present). Mr. Stavropoulos serves as President and Founder of the Michigan Baseball Foundation, the Great Lakes Loons (2007-present). Mr. Stavropoulos is Chairman Emeritus of the Board of Directors of The Dow Chemical Company, where he previously served in numerous senior management positions, including President, CEO (1995-2000; 2002-2004), Chairman of the Executive Committee (2000-2006), and as a member of the Board of Directors (1990-2006). Currently, Mr. Stavropoulos is Chairman of Univar (global distributor of commodity and specialty chemicals, 2010-present), a Director of Teradata Corporation (data warehousing and technology solutions, 2008-present), Chemical Financial Corporation, Maersk Inc. (industrial conglomerate), Tyco International, Inc. (multinational manufacturing and services, 2007-present), and a member of the Advisory Board for Metalmark Capital (private equity investment, 2005-present). Mr. Stavropoulos is a special advisor to Clayton, Dubilier & Rice, Inc. (private equity investment). In addition, Mr. Stavropoulos is a member of the University of Notre Dame Advisory Council for the College of Science. |
David M. Thomas (61) |
| Year of Election or Appointment: 2008 Previously, Mr. Thomas served as Executive Chairman (2005-2006) and Chairman and Chief Executive Officer (2000-2005) of IMS Health, Inc. (pharmaceutical and healthcare information solutions). In addition, Mr. Thomas serves as a member of the Board of Directors of Fortune Brands, Inc. (consumer products), and Interpublic Group of Companies, Inc. (marketing communication, 2004-present). |
Michael E. Wiley (60) |
| Year of Election or Appointment: 2008 Mr. Wiley also serves as a Director of Asia Pacific Exploration Consolidated (international oil and gas exploration and production, 2008-present). Mr. Wiley serves as a Director of Tesoro Corporation (independent oil refiner and marketer, 2005-present), and a Director of Bill Barrett Corporation (exploration and production, 2005-present). In addition, Mr. Wiley also serves as a Director of Post Oak Bank (privately-held bank, 2004-present). Previously, Mr. Wiley served as a member of the Board of Trustees of the University of Tulsa (2000-2006; 2007-2010), as a Senior Energy Advisor of Katzenbach Partners, LLC (consulting, 2006-2007), as an Advisory Director of Riverstone Holdings (private investment), Chairman, President, and CEO of Baker Hughes, Inc. (oilfield services, 2000-2004), and as Director of Spinnaker Exploration Company (exploration and production, 2001-2005). |
+ The information above includes each Trustee's principal occupation during the last five years and other information relating to the experience, attributes, and skills relevant to each Trustee's qualifications to serve as a Trustee, which led to the conclusion that each Trustee should serve as a Trustee for the fund.
Advisory Board Member and Executive Officers:
Correspondence intended for each executive officer and Peter S. Lynch may be sent to Fidelity Investments, 82 Devonshire Street, Boston, Massachusetts 02109.
Name, Age; Principal Occupation |
Peter S. Lynch (66) |
| Year of Election or Appointment: 2003 Member of the Advisory Board of Fidelity's Equity and High Income Funds. Mr. Lynch is Vice Chairman and a Director of FMR and FMR Co., Inc. In addition, Mr. Lynch serves as a Trustee of Boston College and as the Chairman of the Inner-City Scholarship Fund. Previously, Mr. Lynch served on the Special Olympics International Board of Directors (1997-2006). |
Kenneth B. Robins (41) |
| Year of Election or Appointment: 2008 President and Treasurer of Fidelity's Equity and High Income Funds. Mr. Robins also serves as President and Treasurer (2010-present) and Assistant Treasurer (2009-present) of other Fidelity funds and is an employee of Fidelity Investments (2004-present). Previously, Mr. Robins served as Deputy Treasurer of the Fidelity funds (2005-2008) and Treasurer and Chief Financial Officer of The North Carolina Capital Management Trust: Cash and Term Portfolios (2006-2008). |
Brian B. Hogan (46) |
| Year of Election or Appointment: 2009 Vice President of certain Equity Funds and Vice President of Sector Funds. Mr. Hogan also serves as President of FMR's Equity Division (2009-present). Previously, Mr. Hogan served as Senior Vice President, Equity Research of FMR (2006-2009) and as a portfolio manager. |
Thomas C. Hense (46) |
| Year of Election or Appointment: 2008 or 2010 Vice President of Fidelity's High Income (2008), Small Cap (2008), and Value (2010) Funds. Previously, Mr. Hense served as a portfolio manager for Fidelity's Institutional Money Management Group (Pyramis) (2003-2008). |
Scott C. Goebel (42) |
| Year of Election or Appointment: 2008 Secretary and Chief Legal Officer (CLO) of the Fidelity funds. Mr. Goebel also serves as Secretary and CLO of The North Carolina Capital Management Trust: Cash and Term Portfolio (2008-present); General Counsel, Secretary, and Senior Vice President of FMR (2008-present) and FMR Co., Inc. (2008-present); Deputy General Counsel of FMR LLC; Chief Legal Officer of Fidelity Management & Research (Hong Kong) Limited (2008-present) and Assistant Secretary of Fidelity Management & Research (Japan) Inc. (2008-present), Fidelity Investments Money Management, Inc. (2008-present), Fidelity Management & Research (U.K.) Inc. (2008-present), and Fidelity Research and Analysis Company (2008-present). Previously, Mr. Goebel served as Assistant Secretary of the Funds (2007-2008) and as Vice President and Secretary of Fidelity Distributors Corporation (FDC) (2005-2007). |
William C. Coffey (41) |
| Year of Election or Appointment: 2009 Assistant Secretary of Fidelity's Equity and High Income Funds. Mr. Coffey also serves as Senior Vice President and Deputy General Counsel of FMR LLC (2010-present), and is an employee of Fidelity Investments. Previously, Mr. Coffey served as Vice President and Associate General Counsel of FMR LLC (2005-2009). |
Holly C. Laurent (56) |
| Year of Election or Appointment: 2008 Anti-Money Laundering (AML) Officer of the Fidelity funds. Ms. Laurent also serves as AML Officer of The North Carolina Capital Management Trust: Cash and Term Portfolio (2008-present) and is an employee of Fidelity Investments. Previously, Ms. Laurent was Senior Vice President and Head of Legal for Fidelity Business Services India Pvt. Ltd. (2006-2008), and Senior Vice President, Deputy General Counsel and Group Head for FMR LLC (2005-2006). |
Christine Reynolds (52) |
| Year of Election or Appointment: 2008 Chief Financial Officer of the Fidelity funds. Ms. Reynolds became President of Fidelity Pricing and Cash Management Services (FPCMS) in August 2008. Ms. Reynolds served as Chief Operating Officer of FPCMS (2007-2008). Previously, Ms. Reynolds served as President, Treasurer, and Anti-Money Laundering officer of the Fidelity funds (2004-2007). |
Kenneth A. Rathgeber (63) |
| Year of Election or Appointment: 2004 Chief Compliance Officer of Fidelity's Equity and High Income Funds. Mr. Rathgeber is Chief Compliance Officer of Fidelity Management & Research (Hong Kong) Limited (2008-present), Fidelity Management & Research (Japan) Inc. (2008-present), FMR (2005-present), FMR Co., Inc. (2005-present), Fidelity Management & Research (U.K.) Inc. (2005-present), Fidelity Research & Analysis Company (2005-present), Fidelity Investments Money Management, Inc. (2005-present), Pyramis Global Advisors, LLC (2005-present), and Strategic Advisers, Inc. (2005-present). |
Jeffrey S. Christian (49) |
| Year of Election or Appointment: 2009 Deputy Treasurer of the Fidelity funds. Mr. Christian is an employee of Fidelity Investments. Previously, Mr. Christian served as Chief Financial Officer (2008-2009) of certain Fidelity funds and Senior Vice President of Fidelity Pricing and Cash Management Services (FPCMS) (2004-2009). |
Bryan A. Mehrmann (49) |
| Year of Election or Appointment: 2005 Deputy Treasurer of the Fidelity funds. Mr. Mehrmann is an employee of Fidelity Investments. |
Adrien E. Deberghes (43) |
| Year of Election or Appointment: 2008 Deputy Treasurer of Fidelity's Equity and High Income Funds. Mr. Deberghes also serves as Assistant Treasurer of other Fidelity funds (2010-present) and is an employee of Fidelity Investments (2008-present). Previously, Mr. Deberghes served as Senior Vice President of Mutual Fund Administration at State Street Corporation (2007-2008), Senior Director of Mutual Fund Administration at Investors Bank & Trust (2005-2007), and Director of Finance for Dunkin' Brands (2000-2005). |
Stephanie J. Dorsey (41) |
| Year of Election or Appointment: 2010 Assistant Treasurer of Fidelity's Equity and High Income Funds. Ms. Dorsey also serves as Deputy Treasurer of other Fidelity funds (2008-present) and is an employee of Fidelity Investments (2008-present). Previously, Ms. Dorsey served as Treasurer (2004-2008) of the JPMorgan Mutual Funds and Vice President (2004-2008) of JPMorgan Chase Bank. |
John R. Hebble (52) |
| Year of Election or Appointment: 2009 Assistant Treasurer of Fidelity's Equity and High Income Funds. Mr. Hebble also serves as Treasurer and Chief Financial Officer of The North Carolina Capital Management Trust: Cash and Term Portfolio (2008-present), President and Treasurer of other Fidelity funds (2008-present) and is an employee of Fidelity Investments. |
Gary W. Ryan (52) |
| Year of Election or Appointment: 2005 Assistant Treasurer of the Fidelity funds. Mr. Ryan is an employee of Fidelity Investments. Previously, Mr. Ryan served as Vice President of Fund Reporting in Fidelity Pricing and Cash Management Services (FPCMS) (1999-2005). |
Jonathan Davis (42) |
| Year of Election or Appointment: 2010 Assistant Treasurer of the Fidelity funds. Mr. Davis is an employee of Fidelity Investments. Previously, Mr. Davis served as Vice President and Associate General Counsel of FMR LLC (2003-2010). |
Annual Report
The Board of Trustees of Fidelity Value Fund voted to pay to shareholders of record at the opening of business on record date, the following distributions per share derived from capital gains realized from sales of portfolio securities, and dividends derived from net investment income:
| Pay Date | Record Date | Dividends | Capital Gains |
Class K | 12/06/10 | 12/03/10 | $1.002 | $0.02 |
Class K designates 100% of the dividend distributed during the fiscal year as qualifying for the dividends-received deduction for corporate shareholders.
Class K designates 100% of the dividends distributed during the fiscal year as amounts which may be taken into account as a dividend for the purposes of the maximum rate under section 1(h)(11) of the Internal Revenue Code.
The fund will notify shareholders in January 2011 of amounts for use in preparing 2010 income tax returns.
Annual Report
Board Approval of Investment Advisory Contracts and Management Fees
Fidelity Value Fund
Each year, the Board of Trustees, including the Independent Trustees (together, the Board), votes on the renewal of the management contract and sub-advisory agreements (together, the Advisory Contracts) for the fund. The Board, assisted by the advice of fund counsel and Independent Trustees' counsel, requests and considers a broad range of information relevant to the renewal of the Advisory Contracts throughout the year.
The Board meets regularly and considers at each of its meetings factors that are relevant to its annual consideration of the renewal of the fund's Advisory Contracts, including the services and support provided to the fund and its shareholders. The Board has established various standing committees, each composed of Independent Trustees with varying backgrounds, to which the Board has assigned specific subject matter responsibilities in order to enhance effective decision-making by the Board. The Board, acting directly and through its Committees, requests and receives information concerning the annual consideration of the renewal of the fund's Advisory Contracts. The Board also meets as needed to consider matters specifically related to the Board's annual consideration of the renewal of Advisory Contracts. Members of the Board may also meet with trustees of other Fidelity funds through ad hoc joint committees to discuss certain matters relevant to the Fidelity funds.
At its July 2010 meeting, the Board of Trustees, including the Independent Trustees, unanimously determined to renew the fund's Advisory Contracts. In reaching its determination, the Board considered all factors it believed relevant, including (i) the nature, extent, and quality of the services to be provided to the fund and its shareholders (including the investment performance of the fund); (ii) the competitiveness of the fund's management fee and total expenses; (iii) the total costs of the services to be provided by and the profits to be realized by Fidelity from its relationship with the fund; (iv) the extent to which economies of scale would be realized as the fund grows; and (v) whether fee levels reflect these economies of scale, if any, for the benefit of fund shareholders.
In considering whether to renew the Advisory Contracts for the fund, the Board reached a determination, with the assistance of fund counsel and Independent Trustees' counsel and through the exercise of its business judgment, that the renewal of the Advisory Contracts is in the best interests of fund shareholders and that the compensation to be received by Fidelity under the management contract is fair and reasonable. The Board's decision to renew the Advisory Contracts was not based on any single factor noted above, but rather was based on a comprehensive consideration of all the information provided to the Board at its meetings throughout the year. The Board, in reaching its determination to renew the Advisory Contracts, is aware that shareholders in the fund have a broad range of investment choices available to them, including a wide choice among mutual funds offered by Fidelity's competitors, and that the fund's shareholders, with the opportunity to review and weigh the disclosure provided by the fund in its prospectus and other public disclosures, have chosen to invest in this fund, managed by Fidelity.
Annual Report
Nature, Extent, and Quality of Services Provided. The Board considered the staffing within the investment adviser, FMR, and the sub-advisers (together, the Investment Advisers), including the backgrounds of the fund's investment personnel and the fund's investment objective and discipline. The Independent Trustees also had discussions with senior management of Fidelity's investment operations and investment groups. The Board considered the structure of the portfolio manager compensation program and whether this structure provides appropriate incentives to act in the best interest of the fund.
Resources Dedicated to Investment Management and Support Services. The Board and the equity research subcommittee of the Board's Fund Oversight Committee reviewed the size, education, and experience of the Investment Advisers' investment staff, their use of technology, and the Investment Advisers' approach to recruiting, training, and retaining portfolio managers and other research, advisory, and management personnel. The Board noted that Fidelity's analysts have access to a variety of technological tools and market and securities data that enable them to perform both fundamental and quantitative analysis and to specialize in various disciplines. The Board considered Fidelity's extensive global research capabilities that enable the Investment Advisers to aggregate data from various sources in an effort to produce positive investment results. The Board also considered that Fidelity's portfolio managers and analysts have access to daily portfolio attribution that allows for monitoring of a fund's portfolio, as well as an electronic communication system that provides immediate real-time access to research concerning issuers and credit enhancers. The Board noted FMR's continued focus on strengthening the organization and discipline of equity portfolio management and research.
Shareholder and Administrative Services. The Board considered (i) the nature, extent, quality, and cost of advisory, administrative, and shareholder services performed by the Investment Advisers and their affiliates under the Advisory Contracts and under separate agreements covering transfer agency, pricing and bookkeeping, and securities lending services for the fund; (ii) the nature and extent of the investment adviser's supervision of third party service providers, principally custodians and subcustodians; and (iii) the resources devoted to, and the record of compliance with, the fund's compliance policies and procedures. The Board also reviewed the allocation of fund brokerage, including allocations to brokers affiliated with the Investment Advisers, the use of brokerage commissions to pay fund expenses, and the use of "soft" commission dollars to pay for research services.
The Board noted that the growth of fund assets over time across the complex allows Fidelity to reinvest in the development of services designed to enhance the value or convenience of the Fidelity funds as investment vehicles. These services include 24-hour access to account information and market information through phone representatives and over the Internet, and investor education materials and asset allocation tools.
Annual Report
Board Approval of Investment Advisory Contracts and
Management Fees - continued
Investment in a Large Fund Family. The Board considered the benefits to shareholders of investing in a Fidelity fund, including the benefits of investing in a fund that is part of a large family of funds offering a variety of investment disciplines and providing a large variety of mutual fund investor services. The Board noted that Fidelity had taken, or had made recommendations that resulted in the Fidelity funds taking, a number of actions over the previous year that benefited particular funds, including (i) dedicating additional resources to investment research and restructuring and broadening the focus of the investment research teams; (ii) bolstering the senior management team that oversees asset management; (iii) launching Class F of certain funds as a lower-fee class available to Freedom K and Freedom Index Funds; (iv) lowering the initial investment minimums and ongoing balance requirements for Real Estate High Income Fund; (v) eliminating subsequent purchase minimums for all funds and adding a waiver of the investment minimum requirement for new accounts opened with the proceeds of a systematic withdrawal plan; (vi) eliminating the withdrawal minimum and maximum limits for systematic withdrawals from Advisor funds; (vii) expanding sales load waivers on Class A shares for Destiny Planholders and expanding Institutional Class eligibility for Class O Destiny Planholders; and (viii) changing certain Class A and Class T sales charge structures to further align them with industry practices.
Investment Performance. The Board considered whether the fund has operated in accordance with its investment objective, as well as its record of compliance with its investment restrictions. It also reviewed the fund's absolute investment performance for each class, as well as the fund's relative investment performance for each class measured over multiple periods against (i) a broad-based securities market index, and (ii) a peer group of mutual funds deemed appropriate by Fidelity and reviewed by the Board. The following charts considered by the Board show, over the one-, three-, and five-year periods ended December 31, 2009, as available, the cumulative total returns of Class K and the retail class of the fund, the cumulative total returns of a broad-based securities market index ("benchmark"), and a range of cumulative total returns of a peer group of mutual funds identified by Morningstar, Inc. as having an investment style similar to that of the fund based on underlying portfolio holdings. The box within each chart shows the 25th percentile return (bottom of box) and the 75th percentile return (top of box) of the peer group. Returns shown above the box are in the first quartile and returns shown below the box are in the fourth quartile. The percentage beaten numbers noted below each chart correspond to the percentile box and represent the percentage of funds in the peer group whose performance was equal to or lower than that of the class indicated.
Annual Report
Fidelity Value Fund
The Board reviewed the fund's relative investment performance against its peer group and noted that the performance of the retail class of the fund (the class with the longer performance record) was in the first quartile for the one-year period, the fourth quartile for the three-year period, and the third quartile for the five-year period. The Board also noted that the investment performance of the fund was lower than its benchmark for the three- and five-year periods, although the one-year cumulative total return of the retail class compared favorably to its benchmark. The Board considered that the variations in performance between the fund's classes reflect the variations in class expenses, which result in lower performance for the higher expense class. The Board also reviewed the fund's performance since inception as well as performance in the current year.
The Board also considered that the fund's management fee is subject to upward or downward adjustment depending upon whether, and to what extent, the fund's investment performance for the performance period exceeds, or is exceeded by, the record (over the same period) of a Board-approved performance adjustment index. The Board realizes that the performance adjustment provides FMR with a strong economic incentive to seek to achieve superior performance for the fund's shareholders and helps to more closely align the interests of FMR and the fund's shareholders.
Based on its review, and giving particular weight to the nature and quality of the resources dedicated by the Investment Advisers to maintain and improve relative performance and factoring in the unprecedented market events in recent years, the Board concluded that the nature, extent, and quality of investment management and support services and of shareholder and administrative services provided to the fund will benefit the fund's shareholders, particularly in light of the Board's view that the fund's shareholders benefit from investing in a fund that is part of a large family of funds offering a variety of investment disciplines and services.
Annual Report
Board Approval of Investment Advisory Contracts and
Management Fees - continued
Competitiveness of Management Fee and Total Fund Expenses. The Board considered the fund's management fee and total expenses compared to "mapped groups" of competitive funds and classes. Fidelity creates "mapped groups" by combining similar Lipper investment objective categories that have comparable management fee characteristics. Combining Lipper investment objective categories aids the Board's management fee and total expense comparisons by broadening the competitive group used for comparison and by reducing the number of universes to which various Fidelity funds are compared.
Management Fee. The Board considered two proprietary management fee comparisons for the 12-month periods shown in the chart below. The group of Lipper funds used by the Board for management fee comparisons is referred to below as the "Total Mapped Group." The Total Mapped Group comparison focuses on a fund's standing relative to the total universe of comparable funds available to investors, in terms of gross management fees before expense reimbursements or caps, and without giving effect to the fund's performance adjustment. "TMG %" represents the percentage of funds in the Total Mapped Group that had management fees that were lower than the fund's. For example, a TMG % of 10% means that 90% of the funds in the Total Mapped Group had higher management fees than the fund. The "Asset-Size Peer Group" (ASPG) comparison focuses on a fund's standing relative to non-Fidelity funds similar in size to the fund within the Total Mapped Group. The ASPG represents at least 15% of the funds in the Total Mapped Group with comparable asset size and management fee characteristics, subject to a minimum of 50 funds (or all funds in the Total Mapped Group if fewer than 50). Additional information, such as the ASPG quartile in which the fund's management fee ranked and the impact of the fund's performance adjustment, is also included in the chart and considered by the Board.
Annual Report
Fidelity Value Fund
The Board noted that the fund's management fee ranked below the median of its Total Mapped Group and below the median of its ASPG for 2009. The Board also noted the effect of the fund's negative performance adjustment on the fund's management fee ranking. The Board noted that the performance adjustment for each year represents calculations for performance periods that differ from the periods shown in the performance charts above.
Furthermore, the Board considered that shareholders approved a prospective change in the index used to calculate the fund's performance adjustment, beginning December 1, 2002. The Board also considered that, because the performance adjustment is based on a rolling 36-month measurement period, during a transition period the fund's performance is compared to a blended index return that reflects the performance of the former index for the portion of the measurement period prior to December 1, 2002 and the performance of the current index for the remainder of the measurement period. The Board noted that the fund's performance adjustment for 2005 shown in the chart above reflects the effect of using the blended index return to calculate the fund's performance adjustment.
Based on its review, the Board concluded that the fund's management fee is fair and reasonable in light of the services that the fund receives and the other factors considered.
Total Expenses. In its review of each class's total expenses, the Board considered the fund's management fee as well as other fund or class expenses, as applicable, such as transfer agent fees, pricing and bookkeeping fees, and custodial, legal, and audit fees. The Board also noted the effects of any waivers and reimbursements on fees and expenses, as well as the impact of the fund's performance adjustment. As part of its review, the Board also considered current and historical total expenses of each class of the fund compared to competitive fund median expenses. Each class of the fund is compared to those funds and classes in the Total Mapped Group (used by the Board for management fee comparisons) that have a similar sales load structure.
Annual Report
Board Approval of Investment Advisory Contracts and
Management Fees - continued
The Board noted that the total expenses of each class ranked below its competitive median for 2009.
Fees Charged to Other Fidelity Clients. The Board also considered Fidelity fee structures and other information with respect to clients of FMR and its affiliates, such as other mutual funds advised or subadvised by FMR or its affiliates, pension plan clients, and other institutional clients. In March 2010, the Board created an ad hoc joint committee with the board of other Fidelity funds (the Committee) to review and compare Fidelity's institutional investment advisory business with its business of providing services to the Fidelity funds, including the differences in services provided, fees charged, and costs incurred, as well as competition in their respective marketplaces.
Based on its review of total expenses and fees charged to other Fidelity clients, the Board concluded that the total expenses of each class of the fund were reasonable in light of the services that the fund and its shareholders receive and the other factors considered, including the findings of the Committee.
Costs of the Services and Profitability. The Board considered the revenues earned and the expenses incurred by Fidelity in conducting the business of developing, marketing, distributing, managing, administering and servicing the fund and its shareholders. The Board also considered the level of Fidelity's profits in respect of all the Fidelity funds.
On an annual basis, FMR presents to the Board Fidelity's profitability for the fund. Fidelity calculates the profitability for each fund, as well as aggregate profitability for groups of Fidelity funds and all Fidelity funds, using a series of detailed revenue and cost allocation methodologies which originate with the audited books and records of Fidelity. The Audit Committee of the Board reviews any significant changes from the prior year's methodologies.
PricewaterhouseCoopers LLP (PwC), independent registered public accounting firm and auditor to Fidelity and certain Fidelity funds, has been engaged annually by the Board as part of the Board's assessment of Fidelity's profitability analysis. PwC's engagement includes the review and assessment of Fidelity's methodologies used in determining the revenues and expenses attributable to Fidelity's mutual fund business, and completion of agreed-upon procedures surrounding the mathematical accuracy of fund profitability and its conformity to allocation methodologies. After considering PwC's reports issued under the engagement and information provided by Fidelity, the Board believes that while other allocation methods may also be reasonable, Fidelity's profitability methodologies are reasonable in all material respects.
Annual Report
The Board has also reviewed Fidelity's non-fund businesses and fall-out benefits related to the mutual fund business as well as cases where Fidelity's affiliates may benefit from or be related to the fund's business.
The Board considered the costs of the services provided by and the profits realized by Fidelity in connection with the operation of the fund and were satisfied that the profitability was not excessive in the circumstances.
Economies of Scale. The Board considered whether there have been economies of scale in respect of the management of the Fidelity funds, whether the Fidelity funds (including the fund) have appropriately benefited from any such economies of scale, and whether there is potential for realization of any further economies of scale. The Board considered the extent to which the fund will benefit from economies of scale through increased services to the fund, through waivers or reimbursements, or through fee or expense reductions.
In February 2009, the Board and the board of other Fidelity funds created an ad hoc committee (the Economies of Scale Committee) to analyze whether FMR attains economies of scale in respect of the management and servicing of the Fidelity funds, whether the Fidelity funds have appropriately benefited from such economies of scale, and whether there is potential for realization of any further economies of scale.
The Board recognized that the fund's management contract incorporates a "group fee" structure, which provides for lower group fee rates as total fund assets under FMR's management increase, and for higher group fee rates as total fund assets under FMR's management decrease. FMR calculates the group fee rates based on a tiered asset "breakpoint" schedule that varies based on asset class. The Board considered that the group fee is designed to deliver the benefits of economies of scale to fund shareholders when total Fidelity fund assets increase, even if assets of any particular fund are unchanged or have declined, because some portion of Fidelity's costs are attributable to services provided to all Fidelity funds, and all funds benefit if those costs can be allocated among more assets. The Board concluded that, given the group fee structure, fund shareholders will benefit from lower management fees as assets under FMR's management increase at the fund complex level, regardless of whether Fidelity achieves any such economies of scale.
The Board concluded, considering the findings of the Economies of Scale Committee, that any potential economies of scale are being appropriately shared between fund shareholders and Fidelity.
Additional Information Requested by the Board. In order to develop fully the factual basis for consideration of the Fidelity funds' Advisory Contracts, the Board requested and received additional information on certain topics, including (i) fund performance trends, actions to be taken by FMR to improve certain funds' overall performance, and Fidelity's long-term strategies for certain funds; (ii) portfolio manager changes that have occurred during the past year and length of portfolio manager tenure for different categories of funds over time; (iii) Fidelity's compensation structure for portfolio managers, research analysts, and other key personnel, the rationale for the compensation structure, and how the compensation structure provides appropriate performance incentives; (iv) the amount of the investment that each portfolio manager has made in the Fidelity fund(s) that he or she manages; (v) management and other fees paid by FMR to affiliated sub-advisers on behalf of the Fidelity funds; (vi) Fidelity's fee structures and rationale for recommending different fees among different categories of funds; (vii) Fidelity's rationale for recommending which funds should have a performance adjustment component as part of their management fees; (viii) the rationale for any differences between fund fee structures and fee structures in place for other Fidelity clients; and (ix) explanations regarding the relative total expenses borne by certain funds and classes, total expense competitive trends, and actions that might be taken by FMR to reduce total expenses for certain funds and classes.
Annual Report
Board Approval of Investment Advisory Contracts and
Management Fees - continued
Based on its evaluation of all of the conclusions noted above, and after considering all factors it believed relevant, the Board ultimately concluded that the advisory fee structures are fair and reasonable, and that the fund's Advisory Contracts should be renewed.
Annual Report
Investment Adviser
Fidelity Management & Research Company
Boston, MA
Investment Sub-Advisers
FMR Co., Inc.
Fidelity Management & Research
(U.K.) Inc.
Fidelity Research & Analysis Company
Fidelity Management & Research
(Hong Kong) Limited
Fidelity Management & Research
(Japan) Inc.
General Distributor
Fidelity Distributors Corporation
Boston, MA
Transfer and Service Agents
Fidelity Investments Institutional
Operations Company Inc.
Boston, MA
Fidelity Service Company, Inc.
Boston, MA
Custodian
The Bank of New York Mellon
New York, NY
VAL-K-UANN-1210
1.863246.102
Item 2. Code of Ethics
As of the end of the period, October 31, 2010, Fidelity Capital Trust (the trust) has adopted a code of ethics, as defined in Item 2 of Form N-CSR, that applies to its President and Treasurer and its Chief Financial Officer. A copy of the code of ethics is filed as an exhibit to this Form N-CSR.
Item 3. Audit Committee Financial Expert
The Board of Trustees of the trust has determined that Joseph Mauriello is an audit committee financial expert, as defined in Item 3 of Form N-CSR. Mr. Mauriello is independent for purposes of Item 3 of Form N-CSR.
Item 4. Principal Accountant Fees and Services
Fees and Services
The following table presents fees billed by Deloitte & Touche LLP, the member firms of Deloitte Touche Tohmatsu, and their respective affiliates (collectively, "Deloitte Entities") in each of the last two fiscal years for services rendered to Fidelity Stock Selector All Cap Fund and Fidelity Stock Selector Small Cap Fund (the "Funds"):
Services Billed by Deloitte Entities
October 31, 2010 FeesA
| Audit Fees | Audit-Related Fees | Tax Fees | All Other Fees |
Fidelity Stock Selector All Cap Fund | $49,000 | $- | $4,500 | $- |
Fidelity Stock Selector Small Cap Fund | $41,000 | $- | $4,800 | $- |
October 31, 2009 FeesA
| Audit Fees | Audit-Related Fees | Tax Fees | All Other Fees |
Fidelity Stock Selector All Cap Fund | $50,000 | $- | $4,500 | $- |
Fidelity Stock Selector Small Cap Fund | $42,000 | $- | $4,700 | $- |
A Amounts may reflect rounding.
The following table presents fees billed by PricewaterhouseCoopers LLP ("PwC") in each of the last two fiscal years for services rendered to Fidelity Capital Appreciation Fund, Fidelity Disciplined Equity Fund, Fidelity Focused Stock Fund, and Fidelity Value Fund (the "Funds"):
Services Billed by PwC
October 31, 2010 FeesA
| Audit Fees | Audit-Related Fees | Tax Fees | All Other Fees |
Fidelity Capital Appreciation Fund | $58,000 | $- | $3,200 | $4,200 |
Fidelity Disciplined Equity Fund | $73,000 | $- | $3,200 | $6,800 |
Fidelity Focused Stock Fund | $35,000 | $- | $3,200 | $1,700 |
Fidelity Value Fund | $70,000 | $- | $4,100 | $5,600 |
October 31, 2009 FeesA
| Audit Fees | Audit-Related Fees | Tax Fees | All Other Fees |
Fidelity Capital Appreciation Fund | $62,000 | $- | $3,200 | $5,000 |
Fidelity Disciplined Equity Fund | $81,000 | $- | $3,200 | $8,800 |
Fidelity Focused Stock Fund | $42,000 | $- | $3,200 | $1,500 |
Fidelity Value Fund | $76,000 | $- | $4,200 | $7,300 |
A Amounts may reflect rounding.
The following table presents fees billed by PwC and Deloitte Entities that were required to be approved by the Audit Committee for services that relate directly to the operations and financial reporting of the Funds and that are rendered on behalf of Fidelity Management & Research Company ("FMR") and entities controlling, controlled by, or under common control with FMR (not including any sub-adviser whose role is primarily portfolio management and is subcontracted with or overseen by another investment adviser) that provide ongoing services to the Funds ("Fund Service Providers"):
Services Billed by Deloitte Entities
| October 31, 2010A | October 31, 2009A |
Audit-Related Fees | $720,000 | $685,000 |
Tax Fees | $- | $2,000 |
All Other Fees | $790,000 | $215,000 |
A Amounts may reflect rounding.
Services Billed by PwC
| October 31, 2010A | October 31, 2009A |
Audit-Related Fees | $2,150,000 | $2,825,000 |
Tax Fees | $- | $2,000 |
All Other Fees | $510,000 | $- |
A Amounts may reflect rounding.
"Audit-Related Fees" represent fees billed for assurance and related services that are reasonably related to the performance of the fund audit or the review of the fund's financial statements and that are not reported under Audit Fees.
"Tax Fees" represent fees billed for tax compliance, tax advice or tax planning that relate directly to the operations and financial reporting of the fund.
"All Other Fees" represent fees billed for assurance services provided to the fund or Fund Service Provider that relate directly to the operations and financial reporting of the fund, excluding those services that are reported under Audit Fees, Audit-Related Fees or Tax Fees.
Assurance services must be performed by an independent public accountant.
* * *
The aggregate non-audit fees billed by PwC and Deloitte Entities for services rendered to the Funds, FMR (not including any sub-adviser whose role is primarily portfolio management and is subcontracted with or overseen by another investment adviser), and any Fund Service Provider for each of the last two fiscal years of the Funds are as follows:
Billed By | October 31, 2010 A | October 31, 2009 A |
PwC | $5,230,000 | $3,490,000 |
Deloitte Entities | $1,610,000 | $955,000 |
A Amounts may reflect rounding.
The trust's Audit Committee has considered non-audit services that were not pre-approved that were provided by PwC and Deloitte Entities to Fund Service Providers to be compatible with maintaining the independence of PwC and Deloitte Entities in their audits of the Funds, taking into account representations from PwC and Deloitte Entities, in accordance with Public Company Accounting Oversight Board rules, regarding their independence from the Funds and their related entities and FMR's review of the appropriateness and permissibility under applicable law of such non-audit services prior to their provision to the Fund Service Providers.
Audit Committee Pre-Approval Policies and Procedures
The trust's Audit Committee must pre-approve all audit and non-audit services provided by a fund's independent registered public accounting firm relating to the operations or financial reporting of the fund. Prior to the commencement of any audit or non-audit services to a fund, the Audit Committee reviews the services to determine whether they are appropriate and permissible under applicable law.
The Audit Committee has adopted policies and procedures to, among other purposes, provide a framework for the Committee's consideration of non-audit services by the audit firms that audit the Fidelity funds. The policies and procedures require that any non-audit service provided by a fund audit firm to a Fidelity fund and any non-audit service provided by a fund auditor to a Fund Service Provider that relates directly to the operations and financial reporting of a Fidelity fund ("Covered Service") are subject to approval by the Audit Committee before such service is provided.
All Covered Services must be approved in advance of provision of the service either: (i) by formal resolution of the Audit Committee, or (ii) by oral or written approval of the service by the Chair of the Audit Committee (or if the Chair is unavailable, such other member of the Audit Committee as may be designated by the Chair to act in the Chair's absence). The approval contemplated by (ii) above is permitted where the Treasurer determines that action on such an engagement is necessary before the next meeting of the Audit Committee.
Non-audit services provided by a fund audit firm to a Fund Service Provider that do not relate directly to the operations and financial reporting of a Fidelity fund are reported to the Audit Committee on a periodic basis.
Non-Audit Services Approved Pursuant to Rule 2-01(c)(7)(i)(C) and (ii) of Regulation S-X ("De Minimis Exception")
There were no non-audit services approved or required to be approved by the Audit Committee pursuant to the De Minimis Exception during the Funds' last two fiscal years relating to services provided to (i) the Funds or (ii) any Fund Service Provider that relate directly to the operations and financial reporting of the Funds.
Item 5. Audit Committee of Listed Registrants
Not applicable.
Item 6. Investments
(a) Not applicable.
(b) Not applicable
Item 7. Disclosure of Proxy Voting Policies and Procedures for Closed-End Management Investment Companies
Not applicable.
Item 8. Portfolio Managers of Closed-End Management Investment Companies
Not applicable.
Item 9. Purchase of Equity Securities by Closed-End Management Investment Company and Affiliated Purchasers
Not applicable.
Item 10. Submission of Matters to a Vote of Security Holders
There were no material changes to the procedures by which shareholders may recommend nominees to the trust's Board of Trustees.
Item 11. Controls and Procedures
(a)(i) The President and Treasurer and the Chief Financial Officer have concluded that the trust's disclosure controls and procedures (as defined in Rule 30a-3(c) under the Investment Company Act) provide reasonable assurances that material information relating to the trust is made known to them by the appropriate persons, based on their evaluation of these controls and procedures as of a date within 90 days of the filing date of this report.
(a)(ii) There was no change in the trust's internal control over financial reporting (as defined in Rule 30a-3(d) under the Investment Company Act) that occurred during the second fiscal quarter of the period covered by this report that has materially affected, or is reasonably likely to materially affect, the trust's internal control over financial reporting.
Item 12. Exhibits
(a) | (1) | Code of Ethics pursuant to Item 2 of Form N-CSR is filed and attached hereto as EX-99.CODE ETH. |
(a) | (2) | Certification pursuant to Rule 30a-2(a) under the Investment Company Act of 1940 (17 CFR 270.30a-2(a)) is filed and attached hereto as Exhibit 99.CERT. |
(a) | (3) | Not applicable. |
(b) | | Certification pursuant to Rule 30a-2(b) under the Investment Company Act of 1940 (17 CFR 270.30a-2(b)) is furnished and attached hereto as Exhibit 99.906CERT. |
SIGNATURES
Pursuant to the requirements of the Securities Exchange Act of 1934 and the Investment Company Act of 1940, the registrant has duly caused this report to be signed on its behalf by the undersigned, thereunto duly authorized.
Fidelity Capital Trust
By: | /s/Kenneth B. Robins |
| Kenneth B. Robins |
| President and Treasurer |
| |
Date: | December 28, 2010 |
Pursuant to the requirements of the Securities Exchange Act of 1934 and the Investment Company Act of 1940, this report has been signed below by the following persons on behalf of the registrant and in the capacities and on the dates indicated.
By: | /s/Kenneth B. Robins |
| Kenneth B. Robins |
| President and Treasurer |
| |
Date: | December 28, 2010 |
By: | /s/Christine Reynolds |
| Christine Reynolds |
| Chief Financial Officer |
| |
Date: | December 28, 2010 |