UNITED STATES
SECURITIES AND EXCHANGE COMMISSION
Washington, D.C. 20549
FORM N-CSR
CERTIFIED SHAREHOLDER REPORT OF REGISTERED
MANAGEMENT INVESTMENT COMPANIES
Investment Company Act file number 811-2841
Fidelity Capital Trust
(Exact name of registrant as specified in charter)
245 Summer St., Boston, Massachusetts 02210
(Address of principal executive offices) (Zip code)
Marc Bryant, Secretary
245 Summer St.
Boston, Massachusetts 02210
(Name and address of agent for service)
Registrant's telephone number, including area code:
617-563-7000
Date of fiscal year end: | October 31 |
|
|
Date of reporting period: | October 31, 2015 |
Item 1.
Reports to Stockholders
Fidelity® Stock Selector Small Cap Fund Annual Report October 31, 2015 |
 |
Contents
Board Approval of Investment Advisory Contracts and Management Fees |
To view a fund's proxy voting guidelines and proxy voting record for the 12-month period ended June 30, visit http://www.fidelity.com/proxyvotingresults or visit the Securities and Exchange Commission's (SEC) web site at http://www.sec.gov.
You may also call 1-800-544-8544 to request a free copy of the proxy voting guidelines.
Standard & Poor's, S&P and S&P 500 are registered service marks of The McGraw-Hill Companies, Inc. and have been licensed for use by Fidelity Distributors Corporation.
Other third-party marks appearing herein are the property of their respective owners.
All other marks appearing herein are registered or unregistered trademarks or service marks of FMR LLC or an affiliated company. © 2015 FMR LLC. All rights reserved.
This report and the financial statements contained herein are submitted for the general information of the shareholders of the Fund. This report is not authorized for distribution to prospective investors in the Fund unless preceded or accompanied by an effective prospectus.
A fund files its complete schedule of portfolio holdings with the SEC for the first and third quarters of each fiscal year on Form N-Q. Forms N-Q are available on the SEC’s web site at http://www.sec.gov. A fund's Forms N-Q may be reviewed and copied at the SEC’s Public Reference Room in Washington, DC. Information regarding the operation of the SEC's Public Reference Room may be obtained by calling 1-800-SEC-0330.
For a complete list of a fund's portfolio holdings, view the most recent holdings listing, semiannual report, or annual report on Fidelity's web site at http://www.fidelity.com, http://www.advisor.fidelity.com, or http://www.401k.com, as applicable.
NOT FDIC INSURED •MAY LOSE VALUE •NO BANK GUARANTEE
Neither the Fund nor Fidelity Distributors Corporation is a bank.
Performance: The Bottom Line
Average annual total return reflects the change in the value of an investment, assuming reinvestment of distributions from dividend income and capital gains (the profits earned upon the sale of securities that have grown in value, if any) and assuming a constant rate of performance each year.
The hypothetical investment and the average annual total returns do not reflect the deduction of taxes that a shareholder would pay on fund distributions or the redemption of fund shares.
During periods of reimbursement by Fidelity, a fund’s total return will be greater than it would be had the reimbursement not occurred.
How a fund did yesterday is no guarantee of how it will do tomorrow.
Average Annual Total Returns
| For the periods ended October 31, 2015 | Past 1 year | Past 5 years | Past 10 years |
| Fidelity® Stock Selector Small Cap Fund | 4.46% | 12.14% | 6.56% |
$10,000 Over 10 Years
Let's say hypothetically that $10,000 was invested in Fidelity® Stock Selector Small Cap Fund, a class of the fund, on October 31, 2005.
The chart shows how the value of your investment would have changed, and also shows how the Russell 2000® Index performed over the same period.

| Period Ending Values | ||
| $18,878 | Fidelity® Stock Selector Small Cap Fund | |
| $20,556 | Russell 2000® Index | |
Management's Discussion of Fund Performance
Market Recap: U.S. stocks gained moderately for the 12 months ending October 31, 2015, helped by a strong October that largely erased a steep decline in August and September on concern about slowing global economic growth emanating from China. Stocks benefited late in the period amid waning expectations for a near-term interest-rate hike by the U.S. Federal Reserve, additional economic stimulus in Europe and an interest-rate cut in China. The large-cap S&P 500® index advanced 5.20% for the period, with growth stocks in the index significantly outpacing value stocks, as investors continued to seek growth in a subpar economic environment. The growth-oriented Nasdaq Composite Index® also benefited, gaining 10.39%, while the small-cap Russell 2000® Index lost its edge, returning only 0.34%, as risk appetites waned. Among sectors in the widely followed S&P 500®, consumer discretionary (+21%) led the way, benefiting from a combination of rising personal income and still-benign inflation. Technology (+11%) and consumer staples (+9%) also outpaced the index. Conversely, energy (-19%) performed worst, in an environment of depressed commodity prices that also hit materials (-4%). At period end, investors remained focused on the potential global implications of a relatively stronger U.S. dollar and how China’s transition toward a consumption-led economy may affect corporate earnings.Comments from Lead Portfolio Manager Richard Thompson: For the year, the fund’s share classes (excluding sales charges, if applicable) strongly outpaced the roughly flat return of its benchmark Russell 2000® Index, with significant performance dispersion by sector. For example, energy was down 44%, while information technology advanced 10%. Amid this volatile environment, the fund’s stock selection was the primary driver of relative outperformance. An out-of-index stake in transaction processor Global Payments was the fund’s top individual contributor. The stock performed well, mainly due to the company’s stable business and investors’ perception of the stock as a defensive name. Pharmaceuticals, biotechnology & life sciences companies bluebird bio and Auspex Pharmaceuticals also helped. Auspex was sold by period end. Conversely, stock choices in materials, led by titanium dioxide producer Tronox, dragged on the fund’s return. Over the course of the past year, China’s economic slowdown derailed demand for titanium dioxide, which provides brightness to coatings, plastics and paper. We sold some of the fund’s stake in Tronox by period end. Several energy names also hampered performance, including our position in Stone Energy. Bristow Group, which provides helicopter services to offshore energy companies, also declined.The views expressed above reflect those of the portfolio manager(s) only through the end of the period as stated on the cover of this report and do not necessarily represent the views of Fidelity or any other person in the Fidelity organization. Any such views are subject to change at any time based upon market or other conditions and Fidelity disclaims any responsibility to update such views. These views may not be relied on as investment advice and, because investment decisions for a Fidelity fund are based on numerous factors, may not be relied on as an indication of trading intent on behalf of any Fidelity fund.
Investment Summary (Unaudited)
Top Ten Stocks as of October 31, 2015
| % of fund's net assets | % of fund's net assets 6 months ago | |
| Bank of the Ozarks, Inc. | 1.8 | 1.3 |
| PacWest Bancorp | 1.4 | 1.2 |
| Huntington Bancshares, Inc. | 1.4 | 1.2 |
| Global Payments, Inc. | 1.4 | 1.2 |
| Banner Corp. | 1.2 | 1.0 |
| MB Financial, Inc. | 1.2 | 0.9 |
| Associated Banc-Corp. | 1.2 | 1.2 |
| WSFS Financial Corp. | 1.2 | 0.9 |
| Mid-America Apartment Communities, Inc. | 1.1 | 1.0 |
| Allied World Assurance Co. Holdings AG | 1.1 | 1.0 |
| 13.0 |
Top Five Market Sectors as of October 31, 2015
| % of fund's net assets | % of fund's net assets 6 months ago | |
| Financials | 24.0 | 22.7 |
| Information Technology | 17.9 | 18.4 |
| Health Care | 14.6 | 15.1 |
| Consumer Discretionary | 12.8 | 13.5 |
| Industrials | 12.7 | 13.2 |
Asset Allocation (% of fund's net assets)
| As of October 31, 2015 * | ||
| Stocks and Equity Futures | 96.3% | |
| Short-Term Investments and Net Other Assets (Liabilities) | 3.7% | |

* Foreign investments - 7.1%
| As of April 30, 2015 * | ||
| Stocks and Equity Futures | 98.2% | |
| Short-Term Investments and Net Other Assets (Liabilities) | 1.8% | |

* Foreign investments - 8.2%
Investments October 31, 2015
Showing Percentage of Net Assets
| Common Stocks - 95.5% | |||
| Shares | Value (000s) | ||
| CONSUMER DISCRETIONARY - 12.8% | |||
| Auto Components - 2.3% | |||
| Cooper Tire & Rubber Co. | 176,620 | $7,381 | |
| Standard Motor Products, Inc. | 121,402 | 5,372 | |
| Tenneco, Inc. (a) | 227,984 | 12,902 | |
| Visteon Corp. (a) | 67,200 | 7,330 | |
| 32,985 | |||
| Diversified Consumer Services - 0.7% | |||
| Service Corp. International | 333,000 | 9,411 | |
| Hotels, Restaurants & Leisure - 1.9% | |||
| Bloomin' Brands, Inc. | 370,084 | 6,280 | |
| Buffalo Wild Wings, Inc. (a) | 49,000 | 7,559 | |
| Domino's Pizza, Inc. | 41,800 | 4,459 | |
| Texas Roadhouse, Inc. Class A | 270,657 | 9,297 | |
| 27,595 | |||
| Household Durables - 1.6% | |||
| Ethan Allen Interiors, Inc. (b) | 357,179 | 9,719 | |
| Helen of Troy Ltd. (a) | 59,700 | 5,923 | |
| Jarden Corp. (a) | 168,877 | 7,566 | |
| 23,208 | |||
| Leisure Products - 1.3% | |||
| Brunswick Corp. | 193,900 | 10,434 | |
| Vista Outdoor, Inc. (a) | 168,566 | 7,538 | |
| 17,972 | |||
| Media - 0.8% | |||
| Nexstar Broadcasting Group, Inc. Class A (b) | 210,335 | 11,196 | |
| Multiline Retail - 0.5% | |||
| Dillard's, Inc. Class A | 82,256 | 7,360 | |
| Specialty Retail - 1.7% | |||
| Chico's FAS, Inc. | 355,627 | 4,915 | |
| Genesco, Inc. (a) | 104,675 | 6,558 | |
| GNC Holdings, Inc. | 206,900 | 6,155 | |
| Murphy U.S.A., Inc. (a) | 104,600 | 6,419 | |
| 24,047 | |||
| Textiles, Apparel & Luxury Goods - 2.0% | |||
| Deckers Outdoor Corp. (a) | 116,000 | 6,457 | |
| G-III Apparel Group Ltd. (a) | 201,810 | 11,118 | |
| Steven Madden Ltd. (a) | 340,959 | 11,882 | |
| 29,457 | |||
| TOTAL CONSUMER DISCRETIONARY | 183,231 | ||
| CONSUMER STAPLES - 3.0% | |||
| Beverages - 0.3% | |||
| Coca-Cola Bottling Co. Consolidated | 23,080 | 4,875 | |
| Food & Staples Retailing - 0.6% | |||
| Casey's General Stores, Inc. | 87,650 | 9,310 | |
| Food Products - 1.4% | |||
| Greencore Group PLC | 1,094,600 | 5,096 | |
| Ingredion, Inc. | 44,000 | 4,183 | |
| J&J Snack Foods Corp. | 56,050 | 6,882 | |
| Pinnacle Foods, Inc. | 74,100 | 3,266 | |
| 19,427 | |||
| Personal Products - 0.7% | |||
| Coty, Inc. Class A (b) | 144,500 | 4,183 | |
| Inter Parfums, Inc. | 189,000 | 5,220 | |
| 9,403 | |||
| TOTAL CONSUMER STAPLES | 43,015 | ||
| ENERGY - 3.1% | |||
| Energy Equipment & Services - 0.8% | |||
| Atwood Oceanics, Inc. | 119,474 | 1,977 | |
| Bristow Group, Inc. | 149,251 | 5,183 | |
| Total Energy Services, Inc. | 334,100 | 3,748 | |
| 10,908 | |||
| Oil, Gas & Consumable Fuels - 2.3% | |||
| Boardwalk Pipeline Partners, LP | 372,300 | 4,773 | |
| Diamondback Energy, Inc. | 85,807 | 6,336 | |
| Newfield Exploration Co. (a) | 165,488 | 6,651 | |
| PDC Energy, Inc. (a) | 107,700 | 6,499 | |
| Stone Energy Corp. (a)(b) | 443,267 | 2,478 | |
| Western Refining, Inc. | 158,988 | 6,617 | |
| 33,354 | |||
| TOTAL ENERGY | 44,262 | ||
| FINANCIALS - 24.0% | |||
| Banks - 11.1% | |||
| Associated Banc-Corp. | 872,023 | 16,865 | |
| BancFirst Corp. | 135,683 | 8,362 | |
| Bank of the Ozarks, Inc. | 514,336 | 25,723 | |
| Banner Corp. | 357,029 | 17,519 | |
| BBCN Bancorp, Inc. | 826,586 | 13,878 | |
| Community Bank System, Inc. | 139,363 | 5,680 | |
| Huntington Bancshares, Inc. | 1,812,600 | 19,884 | |
| Investors Bancorp, Inc. | 1,138,800 | 14,246 | |
| MB Financial, Inc. | 525,100 | 16,929 | |
| PacWest Bancorp | 444,775 | 20,033 | |
| 159,119 | |||
| Capital Markets - 2.1% | |||
| AURELIUS AG | 249,242 | 11,122 | |
| OM Asset Management Ltd. | 630,689 | 9,574 | |
| Raymond James Financial, Inc. | 180,700 | 9,958 | |
| 30,654 | |||
| Insurance - 3.1% | |||
| Allied World Assurance Co. Holdings AG | 444,887 | 16,176 | |
| Aspen Insurance Holdings Ltd. | 210,010 | 10,209 | |
| Primerica, Inc. | 229,069 | 10,911 | |
| StanCorp Financial Group, Inc. | 64,323 | 7,379 | |
| 44,675 | |||
| Real Estate Investment Trusts - 6.5% | |||
| Coresite Realty Corp. | 204,100 | 11,215 | |
| Cousins Properties, Inc. | 1,224,180 | 12,291 | |
| Equity Lifestyle Properties, Inc. | 221,000 | 13,366 | |
| Kite Realty Group Trust | 386,726 | 10,213 | |
| Mid-America Apartment Communities, Inc. | 193,800 | 16,510 | |
| National Retail Properties, Inc. (b) | 222,359 | 8,450 | |
| Ramco-Gershenson Properties Trust (SBI) | 729,850 | 12,261 | |
| Store Capital Corp. | 391,180 | 8,868 | |
| 93,174 | |||
| Thrifts & Mortgage Finance - 1.2% | |||
| WSFS Financial Corp. | 528,242 | 16,782 | |
| TOTAL FINANCIALS | 344,404 | ||
| HEALTH CARE - 14.6% | |||
| Biotechnology - 7.5% | |||
| ACADIA Pharmaceuticals, Inc. (a) | 173,352 | 6,036 | |
| Agios Pharmaceuticals, Inc. (a)(b) | 44,420 | 3,236 | |
| Anacor Pharmaceuticals, Inc. (a) | 66,600 | 7,487 | |
| BioMarin Pharmaceutical, Inc. (a) | 35,256 | 4,126 | |
| Biotie Therapies Corp. sponsored ADR | 171,200 | 2,244 | |
| bluebird bio, Inc. (a) | 30,800 | 2,376 | |
| Cellectis SA sponsored ADR | 117,600 | 3,111 | |
| Chimerix, Inc. (a) | 126,560 | 4,959 | |
| Coherus BioSciences, Inc. (b) | 155,500 | 4,331 | |
| Curis, Inc. (a) | 1,466,283 | 2,991 | |
| CytomX Therapeutics, Inc. | 27,627 | 259 | |
| CytomX Therapeutics, Inc. | 68,600 | 713 | |
| DBV Technologies SA sponsored ADR (a) | 900 | 31 | |
| Dyax Corp. (a) | 297,985 | 8,204 | |
| Genocea Biosciences, Inc. (a) | 238,158 | 1,141 | |
| Heron Therapeutics, Inc. (a)(b) | 144,200 | 3,954 | |
| Insmed, Inc. (a) | 192,672 | 3,823 | |
| Intercept Pharmaceuticals, Inc. (a) | 19,503 | 3,066 | |
| Isis Pharmaceuticals, Inc. (a) | 73,128 | 3,521 | |
| La Jolla Pharmaceutical Co. (a) | 140,800 | 3,519 | |
| Mirati Therapeutics, Inc. (a)(b) | 158,506 | 5,608 | |
| Neurocrine Biosciences, Inc. (a) | 165,160 | 8,108 | |
| Novavax, Inc. (a) | 579,638 | 3,913 | |
| ProNai Therapeutics, Inc. (a)(b) | 141,600 | 2,430 | |
| Spark Therapeutics, Inc. | 81,100 | 4,371 | |
| TESARO, Inc. (a) | 98,300 | 4,470 | |
| Ultragenyx Pharmaceutical, Inc. (a) | 70,300 | 6,984 | |
| Xencor, Inc. (a) | 235,800 | 2,554 | |
| 107,566 | |||
| Health Care Equipment & Supplies - 3.3% | |||
| CONMED Corp. | 77,859 | 3,158 | |
| Hologic, Inc. (a) | 159,900 | 6,214 | |
| Integra LifeSciences Holdings Corp. (a) | 113,106 | 6,738 | |
| NxStage Medical, Inc. (a) | 373,400 | 6,240 | |
| Sirona Dental Systems, Inc. (a) | 53,500 | 5,838 | |
| Steris Corp. | 53,400 | 4,002 | |
| Teleflex, Inc. | 62,000 | 8,246 | |
| Wright Medical Group NV (a) | 359,577 | 6,951 | |
| 47,387 | |||
| Health Care Providers & Services - 2.4% | |||
| AmSurg Corp. (a) | 102,500 | 7,184 | |
| Molina Healthcare, Inc. (a) | 112,400 | 6,969 | |
| Surgical Care Affiliates, Inc. (a) | 224,664 | 6,652 | |
| Team Health Holdings, Inc. (a) | 83,000 | 4,953 | |
| Wellcare Health Plans, Inc. (a) | 100,900 | 8,940 | |
| 34,698 | |||
| Health Care Technology - 0.1% | |||
| Press Ganey Holdings, Inc. | 34,318 | 1,076 | |
| Life Sciences Tools & Services - 0.4% | |||
| Bruker Corp. (a) | 314,234 | 5,772 | |
| Pharmaceuticals - 0.9% | |||
| Prestige Brands Holdings, Inc. (a) | 116,046 | 5,687 | |
| Theravance, Inc. (b) | 300,451 | 2,638 | |
| ZS Pharma, Inc. (a) | 79,900 | 5,194 | |
| 13,519 | |||
| TOTAL HEALTH CARE | 210,018 | ||
| INDUSTRIALS - 12.7% | |||
| Aerospace & Defense - 1.9% | |||
| Moog, Inc. Class A (a) | 120,105 | 7,418 | |
| Orbital ATK, Inc. | 100,559 | 8,610 | |
| Teledyne Technologies, Inc. (a) | 128,366 | 11,454 | |
| 27,482 | |||
| Air Freight & Logistics - 0.8% | |||
| Hub Group, Inc. Class A (a) | 296,020 | 11,835 | |
| Airlines - 0.6% | |||
| JetBlue Airways Corp. (a)(b) | 337,200 | 8,376 | |
| Commercial Services & Supplies - 2.2% | |||
| Deluxe Corp. | 186,300 | 11,094 | |
| Interface, Inc. | 258,000 | 5,044 | |
| Multi-Color Corp. | 100,300 | 7,807 | |
| West Corp. | 334,700 | 7,969 | |
| 31,914 | |||
| Construction & Engineering - 0.9% | |||
| EMCOR Group, Inc. | 259,100 | 12,509 | |
| Electrical Equipment - 0.4% | |||
| OSRAM Licht AG | 103,749 | 6,105 | |
| Machinery - 2.8% | |||
| AGCO Corp. (b) | 153,600 | 7,433 | |
| Kornit Digital Ltd. (a) | 357,100 | 4,264 | |
| KUKA AG (b) | 74,100 | 6,265 | |
| Terex Corp. | 102,400 | 2,054 | |
| TriMas Corp. (a) | 317,286 | 6,349 | |
| Valmont Industries, Inc. | 75,400 | 8,176 | |
| Wabtec Corp. | 67,116 | 5,562 | |
| 40,103 | |||
| Professional Services - 1.0% | |||
| Dun & Bradstreet Corp. | 75,294 | 8,574 | |
| Stantec, Inc. | 236,000 | 5,923 | |
| 14,497 | |||
| Trading Companies & Distributors - 2.1% | |||
| Kaman Corp. | 215,200 | 8,369 | |
| Titan Machinery, Inc. (a)(b) | 469,061 | 5,737 | |
| Watsco, Inc. | 93,900 | 11,553 | |
| WESCO International, Inc. (a) | 82,000 | 4,012 | |
| 29,671 | |||
| TOTAL INDUSTRIALS | 182,492 | ||
| INFORMATION TECHNOLOGY - 17.9% | |||
| Communications Equipment - 1.0% | |||
| F5 Networks, Inc. (a) | 38,300 | 4,221 | |
| Ixia (a) | 511,631 | 7,373 | |
| Radware Ltd. (a) | 140,296 | 2,092 | |
| 13,686 | |||
| Electronic Equipment & Components - 2.0% | |||
| CDW Corp. | 282,300 | 12,616 | |
| Fitbit, Inc. (b) | 100,700 | 4,082 | |
| Jabil Circuit, Inc. | 229,600 | 5,276 | |
| Trimble Navigation Ltd. (a) | 315,900 | 7,187 | |
| 29,161 | |||
| Internet Software & Services - 3.9% | |||
| Bankrate, Inc. (a) | 687,665 | 8,163 | |
| Constant Contact, Inc. (a) | 112,400 | 2,934 | |
| Gogo, Inc. (a)(b) | 102,800 | 1,453 | |
| HomeAway, Inc. (a) | 135,800 | 4,286 | |
| IAC/InterActiveCorp | 89,600 | 6,004 | |
| MINDBODY, Inc. (b) | 142,800 | 2,233 | |
| NIC, Inc. | 388,549 | 7,371 | |
| Pandora Media, Inc. (a) | 236,500 | 2,722 | |
| Rackspace Hosting, Inc. (a) | 275,383 | 7,119 | |
| Stamps.com, Inc. (a) | 80,598 | 6,094 | |
| Web.com Group, Inc. (a) | 317,795 | 7,459 | |
| 55,838 | |||
| IT Services - 4.0% | |||
| ExlService Holdings, Inc. (a) | 328,638 | 14,546 | |
| Global Payments, Inc. | 144,100 | 19,657 | |
| Maximus, Inc. | 234,700 | 16,007 | |
| WEX, Inc. (a) | 84,100 | 7,561 | |
| 57,771 | |||
| Semiconductors & Semiconductor Equipment - 1.9% | |||
| Cirrus Logic, Inc. (a) | 209,300 | 6,453 | |
| Intersil Corp. Class A | 473,200 | 6,412 | |
| Monolithic Power Systems, Inc. | 176,930 | 11,044 | |
| Qorvo, Inc. (a) | 65,850 | 2,893 | |
| 26,802 | |||
| Software - 3.5% | |||
| BroadSoft, Inc. (a) | 136,285 | 4,357 | |
| CommVault Systems, Inc. (a) | 186,723 | 7,566 | |
| Fair Isaac Corp. | 70,700 | 6,531 | |
| Fleetmatics Group PLC (a) | 47,700 | 2,655 | |
| HubSpot, Inc. | 6,851 | 355 | |
| Interactive Intelligence Group, Inc. (a) | 13,695 | 443 | |
| Pegasystems, Inc. | 157,000 | 4,379 | |
| Qlik Technologies, Inc. (a) | 106,800 | 3,350 | |
| RealPage, Inc. (a) | 152,700 | 2,581 | |
| RingCentral, Inc. (a) | 128,100 | 2,370 | |
| Rovi Corp. (a) | 128,341 | 1,174 | |
| SolarWinds, Inc. (a) | 133,100 | 7,724 | |
| Synchronoss Technologies, Inc. (a) | 215,086 | 7,567 | |
| 51,052 | |||
| Technology Hardware, Storage & Peripherals - 1.6% | |||
| Electronics for Imaging, Inc. (a) | 165,475 | 7,685 | |
| Nimble Storage, Inc. (a) | 202,100 | 4,567 | |
| Quantum Corp. (a) | 2,987,041 | 2,509 | |
| Silicon Graphics International Corp. (a)(b) | 666,557 | 2,913 | |
| Super Micro Computer, Inc. (a)(b) | 205,488 | 5,797 | |
| 23,471 | |||
| TOTAL INFORMATION TECHNOLOGY | 257,781 | ||
| MATERIALS - 3.6% | |||
| Chemicals - 1.5% | |||
| Axiall Corp. | 146,654 | 2,970 | |
| Innospec, Inc. | 64,199 | 3,546 | |
| PolyOne Corp. | 206,999 | 6,922 | |
| Sensient Technologies Corp. | 129,900 | 8,479 | |
| 21,917 | |||
| Containers & Packaging - 1.5% | |||
| Avery Dennison Corp. | 83,000 | 5,393 | |
| Berry Plastics Group, Inc. (a) | 316,040 | 10,587 | |
| Silgan Holdings, Inc. | 97,200 | 4,945 | |
| 20,925 | |||
| Metals & Mining - 0.6% | |||
| Compass Minerals International, Inc. | 80,700 | 6,556 | |
| Steel Dynamics, Inc. | 131,200 | 2,423 | |
| 8,979 | |||
| TOTAL MATERIALS | 51,821 | ||
| TELECOMMUNICATION SERVICES - 0.6% | |||
| Diversified Telecommunication Services - 0.6% | |||
| 8x8, Inc. (a) | 145,601 | 1,552 | |
| Cogent Communications Group, Inc. | 121,300 | 3,726 | |
| FairPoint Communications, Inc. (a) | 25,500 | 409 | |
| Lumos Networks Corp. | 37,100 | 481 | |
| Towerstream Corp. (a)(b) | 2,829,372 | 2,252 | |
| 8,420 | |||
| UTILITIES - 3.2% | |||
| Electric Utilities - 1.7% | |||
| El Paso Electric Co. | 142,720 | 5,519 | |
| Great Plains Energy, Inc. | 167,320 | 4,601 | |
| IDACORP, Inc. | 102,700 | 6,865 | |
| Portland General Electric Co. | 191,568 | 7,103 | |
| 24,088 | |||
| Gas Utilities - 1.5% | |||
| Atmos Energy Corp. | 110,138 | 6,939 | |
| Laclede Group, Inc. | 128,600 | 7,532 | |
| New Jersey Resources Corp. | 46,659 | 1,478 | |
| Southwest Gas Corp. | 105,300 | 6,472 | |
| 22,421 | |||
| TOTAL UTILITIES | 46,509 | ||
| TOTAL COMMON STOCKS | |||
| (Cost $1,205,620) | 1,371,953 | ||
| Principal Amount (000s) | Value (000s) | ||
| U.S. Treasury Obligations - 0.0% | |||
| U.S. Treasury Bills, yield at date of purchase 0.01% to 0.06% 12/3/15 to 12/17/15 (c) | |||
| (Cost $390) | 390 | 390 | |
| Shares | Value (000s) | ||
| Money Market Funds - 9.9% | |||
| Fidelity Cash Central Fund, 0.18% (d) | 85,833,387 | $85,833 | |
| Fidelity Securities Lending Cash Central Fund, 0.19% (d)(e) | 56,685,976 | 56,686 | |
| TOTAL MONEY MARKET FUNDS | |||
| (Cost $142,519) | 142,519 | ||
| TOTAL INVESTMENT PORTFOLIO - 105.4% | |||
| (Cost $1,348,529) | 1,514,862 | ||
| NET OTHER ASSETS (LIABILITIES) - (5.4)% | (77,512) | ||
| NET ASSETS - 100% | $1,437,350 |
| Futures Contracts | |||
| Expiration Date | Underlying Face Amount at Value (000s) | Unrealized Appreciation/(Depreciation) (000s) | |
| Purchased | |||
| Equity Index Contracts | |||
| 102 ICE Russell 2000 Index Contracts (United States) | Dec. 2015 | 11,815 | $583 |
The face value of futures purchased as a percentage of Net Assets is 0.8%
Legend
(a) Non-income producing
(b) Security or a portion of the security is on loan at period end.
(c) Security or a portion of the security was pledged to cover margin requirements for futures contracts. At period end, the value of securities pledged amounted to $390,000.
(d) Affiliated fund that is generally available only to investment companies and other accounts managed by Fidelity Investments. The rate quoted is the annualized seven-day yield of the fund at period end. A complete unaudited listing of the fund's holdings as of its most recent quarter end is available upon request. In addition, each Fidelity Central Fund's financial statements which are not covered by the Fund's Report of Independent Registered Public Accounting Firm are available on the SEC's website or upon request.
(e) Investment made with cash collateral received from securities on loan.
Affiliated Central Funds
Information regarding fiscal year to date income earned by the Fund from investments in Fidelity Central Funds is as follows:
| Fund | Income earned |
| (Amounts in thousands) | |
| Fidelity Cash Central Fund | $68 |
| Fidelity Securities Lending Cash Central Fund | 572 |
| Total | $640 |
Investment Valuation
The following is a summary of the inputs used, as of October 31, 2015, involving the Fund's assets and liabilities carried at fair value. The inputs or methodology used for valuing securities may not be an indication of the risk associated with investing in those securities. For more information on valuation inputs, and their aggregation into the levels used below, please refer to the Investment Valuation section in the accompanying Notes to Financial Statements.
| Valuation Inputs at Reporting Date: | ||||
| Description | Total | Level 1 | Level 2 | Level 3 |
| (Amounts in thousands) | ||||
| Investments in Securities: | ||||
| Equities: | ||||
| Consumer Discretionary | $183,231 | $183,231 | $-- | $-- |
| Consumer Staples | 43,015 | 43,015 | -- | -- |
| Energy | 44,262 | 44,262 | -- | -- |
| Financials | 344,404 | 344,404 | -- | -- |
| Health Care | 210,018 | 209,759 | 259 | -- |
| Industrials | 182,492 | 182,492 | -- | -- |
| Information Technology | 257,781 | 257,781 | -- | -- |
| Materials | 51,821 | 51,821 | -- | -- |
| Telecommunication Services | 8,420 | 8,420 | -- | -- |
| Utilities | 46,509 | 46,509 | -- | -- |
| U.S. Government and Government Agency Obligations | 390 | -- | 390 | -- |
| Money Market Funds | 142,519 | 142,519 | -- | -- |
| Total Investments in Securities: | $1,514,862 | $1,514,213 | $649 | $-- |
| Derivative Instruments: | ||||
| Assets | ||||
| Futures Contracts | $583 | $583 | $-- | $-- |
| Total Assets | $583 | $583 | $-- | $-- |
| Total Derivative Instruments: | $583 | $583 | $-- | $-- |
Value of Derivative Instruments
The following table is a summary of the Fund's value of derivative instruments by primary risk exposure as of October 31, 2015. For additional information on derivative instruments, please refer to the Derivative Instruments section in the accompanying Notes to Financial Statements.
| Primary Risk Exposure / Derivative Type | Value | |
| (Amounts in thousands) | Asset | Liability |
| Equity Risk | ||
| Futures Contracts(a) | $583 | $0 |
| Total Equity Risk | 583 | 0 |
| Total Value of Derivatives | $583 | $0 |
(a) Reflects gross cumulative appreciation (depreciation) on futures contracts as presented in the Schedule of Investments. Only the period end receivable or payable for daily variation margin and net unrealized appreciation (depreciation) are presented in the Statement of Assets and Liabilities.
See accompanying notes which are an integral part of the financial statements.
Financial Statements
Statement of Assets and Liabilities
| Amounts in thousands (except per-share amounts) | October 31, 2015 | |
| Assets | ||
| Investment in securities, at value (including securities loaned of $55,317) — See accompanying schedule: Unaffiliated issuers (cost $1,206,010) | $1,372,343 | |
| Fidelity Central Funds (cost $142,519) | 142,519 | |
| Total Investments (cost $1,348,529) | $1,514,862 | |
| Segregated cash with brokers for derivative instruments | 504 | |
| Cash | 342 | |
| Foreign currency held at value (cost $13) | 13 | |
| Receivable for investments sold | 4,859 | |
| Receivable for fund shares sold | 1,988 | |
| Dividends receivable | 471 | |
| Distributions receivable from Fidelity Central Funds | 93 | |
| Prepaid expenses | 4 | |
| Other receivables | 21 | |
| Total assets | 1,523,157 | |
| Liabilities | ||
| Payable for investments purchased | $22,228 | |
| Payable for fund shares redeemed | 5,766 | |
| Accrued management fee | 679 | |
| Distribution and service plan fees payable | 7 | |
| Payable for daily variation margin for derivative instruments | 47 | |
| Other affiliated payables | 343 | |
| Other payables and accrued expenses | 51 | |
| Collateral on securities loaned, at value | 56,686 | |
| Total liabilities | 85,807 | |
| Net Assets | $1,437,350 | |
| Net Assets consist of: | ||
| Paid in capital | $1,181,424 | |
| Undistributed net investment income | 4,607 | |
| Accumulated undistributed net realized gain (loss) on investments and foreign currency transactions | 84,404 | |
| Net unrealized appreciation (depreciation) on investments and assets and liabilities in foreign currencies | 166,915 | |
| Net Assets | $1,437,350 | |
| Calculation of Maximum Offering Price | ||
| Class A: | ||
| Net Asset Value and redemption price per share ($11,429.9 ÷ 466.83 shares) | $24.48 | |
| Maximum offering price per share (100/94.25 of $24.48) | $25.97 | |
| Class T: | ||
| Net Asset Value and redemption price per share ($2,842.8 ÷ 118.47 shares) | $24.00 | |
| Maximum offering price per share (100/96.50 of $24.00) | $24.87 | |
| Class B: | ||
| Net Asset Value and offering price per share ($168.1 ÷ 7.22 shares)(a) | $23.28 | |
| Class C: | ||
| Net Asset Value and offering price per share ($3,965.3 ÷ 171.24 shares)(a) | $23.16 | |
| Stock Selector Small Cap: | ||
| Net Asset Value, offering price and redemption price per share ($1,372,459.7 ÷ 55,132.21 shares) | $24.89 | |
| Class I: | ||
| Net Asset Value, offering price and redemption price per share ($46,483.6 ÷ 1,862.64 shares) | $24.96 |
(a) Redemption price per share is equal to net asset value less any applicable contingent deferred sales charge.
See accompanying notes which are an integral part of the financial statements.
Statement of Operations
| Amounts in thousands | Year ended October 31, 2015 | |
| Investment Income | ||
| Dividends | $17,604 | |
| Income from Fidelity Central Funds | 640 | |
| Total income | 18,244 | |
| Expenses | ||
| Management fee | ||
| Basic fee | $8,817 | |
| Performance adjustment | (1,653) | |
| Transfer agent fees | 3,505 | |
| Distribution and service plan fees | 86 | |
| Accounting and security lending fees | 472 | |
| Custodian fees and expenses | 55 | |
| Independent trustees' compensation | 6 | |
| Registration fees | 99 | |
| Audit | 57 | |
| Legal | 6 | |
| Interest | 1 | |
| Miscellaneous | 11 | |
| Total expenses before reductions | 11,462 | |
| Expense reductions | (142) | 11,320 |
| Net investment income (loss) | 6,924 | |
| Realized and Unrealized Gain (Loss) | ||
| Net realized gain (loss) on: | ||
| Investment securities: | ||
| Unaffiliated issuers | 97,594 | |
| Foreign currency transactions | (2) | |
| Futures contracts | 1,775 | |
| Total net realized gain (loss) | 99,367 | |
| Change in net unrealized appreciation (depreciation) on: Investment securities | (38,594) | |
| Assets and liabilities in foreign currencies | 2 | |
| Futures contracts | (254) | |
| Total change in net unrealized appreciation (depreciation) | (38,846) | |
| Net gain (loss) | 60,521 | |
| Net increase (decrease) in net assets resulting from operations | $67,445 |
See accompanying notes which are an integral part of the financial statements.
Statement of Changes in Net Assets
| Amounts in thousands | Year ended October 31, 2015 | Year ended October 31, 2014 |
| Increase (Decrease) in Net Assets | ||
| Operations | ||
| Net investment income (loss) | $6,924 | $4,913 |
| Net realized gain (loss) | 99,367 | 141,263 |
| Change in net unrealized appreciation (depreciation) | (38,846) | (39,201) |
| Net increase (decrease) in net assets resulting from operations | 67,445 | 106,975 |
| Distributions to shareholders from net investment income | (5,082) | (589) |
| Distributions to shareholders from net realized gain | (126,261) | (75,700) |
| Total distributions | (131,343) | (76,289) |
| Share transactions - net increase (decrease) | 26,734 | (112,902) |
| Redemption fees | 102 | 99 |
| Total increase (decrease) in net assets | (37,062) | (82,117) |
| Net Assets | ||
| Beginning of period | 1,474,412 | 1,556,529 |
| End of period (including undistributed net investment income of $4,607 and undistributed net investment income of $3,242, respectively) | $1,437,350 | $1,474,412 |
See accompanying notes which are an integral part of the financial statements.
Financial Highlights — Fidelity Stock Selector Small Cap Fund Class A
| Years ended October 31, | 2015 | 2014 | 2013 | 2012 | 2011 |
| Selected Per–Share Data | |||||
| Net asset value, beginning of period | $25.76 | $25.32 | $19.40 | $17.87 | $16.20 |
| Income from Investment Operations | |||||
| Net investment income (loss)A | .06 | .01 | (.02) | (.02) | –B,C |
| Net realized and unrealized gain (loss) | .96 | 1.68 | 5.98 | 1.55 | 1.73 |
| Total from investment operations | 1.02 | 1.69 | 5.96 | 1.53 | 1.73 |
| Distributions from net investment income | (.03) | –C | (.04) | – | (.07) |
| Distributions from net realized gain | (2.27) | (1.25) | (.01) | – | – |
| Total distributions | (2.30) | (1.25) | (.04)D | – | (.07) |
| Redemption fees added to paid in capitalA | –C | –C | –C | –C | .01 |
| Net asset value, end of period | $24.48 | $25.76 | $25.32 | $19.40 | $17.87 |
| Total ReturnE,F | 4.19% | 6.83% | 30.81% | 8.56% | 10.71% |
| Ratios to Average Net AssetsG,H | |||||
| Expenses before reductions | 1.01% | .99% | 1.22% | 1.37% | 1.15% |
| Expenses net of fee waivers, if any | 1.01% | .99% | 1.22% | 1.37% | 1.15% |
| Expenses net of all reductions | 1.00% | .99% | 1.20% | 1.36% | 1.14% |
| Net investment income (loss) | .24% | .06% | (.09)% | (.10)% | - %B,I |
| Supplemental Data | |||||
| Net assets, end of period (in millions) | $11 | $10 | $8 | $4 | $4 |
| Portfolio turnover rateJ | 48% | 73% | 79% | 61% | 73% |
A Calculated based on average shares outstanding during the period.
B Investment income per share reflects a large, non-recurring dividend which amounted to $.04 per share. Excluding this non-recurring dividend, the ratio of net investment income (loss) to average net assets would have been (.21) %.
C Amount represents less than $.005 per share.
D Total distributions of $.04 per share is comprised of distributions from net investment income of $.037 and distributions from net realized gain of $.007 per share.
E Total returns would have been lower if certain expenses had not been reduced during the applicable periods shown.
F Total returns do not include the effect of the sales charges.
G Fees and expenses of any underlying Fidelity Central Funds are not included in the Fund's expense ratio. The Fund indirectly bears its proportionate share of the expenses of any underlying Fidelity Central Funds.
H Expense ratios reflect operating expenses of the class. Expenses before reductions do not reflect amounts reimbursed by the investment adviser or reductions from brokerage service arrangements or reductions from other expense offset arrangements and do not represent the amount paid by the class during periods when reimbursements or reductions occur. Expenses net of fee waivers reflect expenses after reimbursement by the investment adviser but prior to reductions from brokerage service arrangements or other expense offset arrangements. Expenses net of all reductions represent the net expenses paid by the class.
I Amount represents less than .005%.
J Amount does not include the portfolio activity of any underlying Fidelity Central Funds.
See accompanying notes which are an integral part of the financial statements.
Financial Highlights — Fidelity Stock Selector Small Cap Fund Class T
| Years ended October 31, | 2015 | 2014 | 2013 | 2012 | 2011 |
| Selected Per–Share Data | |||||
| Net asset value, beginning of period | $25.30 | $24.97 | $19.15 | $17.68 | $16.07 |
| Income from Investment Operations | |||||
| Net investment income (loss)A | (.03) | (.07) | (.08) | (.07) | (.05)B |
| Net realized and unrealized gain (loss) | .97 | 1.65 | 5.90 | 1.54 | 1.70 |
| Total from investment operations | .94 | 1.58 | 5.82 | 1.47 | 1.65 |
| Distributions from net investment income | – | – | – | – | (.05) |
| Distributions from net realized gain | (2.24) | (1.25) | – | – | – |
| Total distributions | (2.24) | (1.25) | – | – | (.05) |
| Redemption fees added to paid in capitalA | –C | –C | –C | –C | .01 |
| Net asset value, end of period | $24.00 | $25.30 | $24.97 | $19.15 | $17.68 |
| Total ReturnD,E | 3.90% | 6.46% | 30.39% | 8.31% | 10.34% |
| Ratios to Average Net AssetsF,G | |||||
| Expenses before reductions | 1.35% | 1.32% | 1.51% | 1.64% | 1.42% |
| Expenses net of fee waivers, if any | 1.35% | 1.32% | 1.51% | 1.64% | 1.42% |
| Expenses net of all reductions | 1.34% | 1.31% | 1.49% | 1.63% | 1.41% |
| Net investment income (loss) | (.10)% | (.27)% | (.38)% | (.37)% | (.27)%B |
| Supplemental Data | |||||
| Net assets, end of period (000 omitted) | $2,843 | $2,668 | $1,880 | $1,073 | $1,539 |
| Portfolio turnover rateH | 48% | 73% | 79% | 61% | 73% |
A Calculated based on average shares outstanding during the period.
B Investment income per share reflects a large, non-recurring dividend which amounted to $.04 per share. Excluding this non-recurring dividend, the ratio of net investment income (loss) to average net assets would have been (.48) %.
C Amount represents less than $.005 per share.
D Total returns would have been lower if certain expenses had not been reduced during the applicable periods shown.
E Total returns do not include the effect of the sales charges.
F Fees and expenses of any underlying Fidelity Central Funds are not included in the Fund's expense ratio. The Fund indirectly bears its proportionate share of the expenses of any underlying Fidelity Central Funds.
G Expense ratios reflect operating expenses of the class. Expenses before reductions do not reflect amounts reimbursed by the investment adviser or reductions from brokerage service arrangements or reductions from other expense offset arrangements and do not represent the amount paid by the class during periods when reimbursements or reductions occur. Expenses net of fee waivers reflect expenses after reimbursement by the investment adviser but prior to reductions from brokerage service arrangements or other expense offset arrangements. Expenses net of all reductions represent the net expenses paid by the class.
H Amount does not include the portfolio activity of any underlying Fidelity Central Funds.
See accompanying notes which are an integral part of the financial statements.
Financial Highlights — Fidelity Stock Selector Small Cap Fund Class B
| Years ended October 31, | 2015 | 2014 | 2013 | 2012 | 2011 |
| Selected Per–Share Data | |||||
| Net asset value, beginning of period | $24.55 | $24.38 | $18.79 | $17.43 | $15.87 |
| Income from Investment Operations | |||||
| Net investment income (loss)A | (.14) | (.19) | (.19) | (.16) | (.14)B |
| Net realized and unrealized gain (loss) | .94 | 1.61 | 5.78 | 1.52 | 1.69 |
| Total from investment operations | .80 | 1.42 | 5.59 | 1.36 | 1.55 |
| Distributions from net realized gain | (2.07) | (1.25) | – | – | – |
| Redemption fees added to paid in capitalA | –C | –C | –C | –C | .01 |
| Net asset value, end of period | $23.28 | $24.55 | $24.38 | $18.79 | $17.43 |
| Total ReturnD,E | 3.39% | 5.94% | 29.75% | 7.80% | 9.83% |
| Ratios to Average Net AssetsF,G | |||||
| Expenses before reductions | 1.84% | 1.81% | 1.99% | 2.12% | 1.90% |
| Expenses net of fee waivers, if any | 1.84% | 1.81% | 1.99% | 2.12% | 1.90% |
| Expenses net of all reductions | 1.83% | 1.80% | 1.97% | 2.11% | 1.90% |
| Net investment income (loss) | (.60)% | (.76)% | (.86)% | (.85)% | (.76)%B |
| Supplemental Data | |||||
| Net assets, end of period (000 omitted) | $168 | $273 | $307 | $225 | $246 |
| Portfolio turnover rateH | 48% | 73% | 79% | 61% | 73% |
A Calculated based on average shares outstanding during the period.
B Investment income per share reflects a large, non-recurring dividend which amounted to $.04 per share. Excluding this non-recurring dividend, the ratio of net investment income (loss) to average net assets would have been (.96) %.
C Amount represents less than $.005 per share.
D Total returns would have been lower if certain expenses had not been reduced during the applicable periods shown.
E Total returns do not include the effect of the contingent deferred sales charge.
F Fees and expenses of any underlying Fidelity Central Funds are not included in the Fund's expense ratio. The Fund indirectly bears its proportionate share of the expenses of any underlying Fidelity Central Funds.
G Expense ratios reflect operating expenses of the class. Expenses before reductions do not reflect amounts reimbursed by the investment adviser or reductions from brokerage service arrangements or reductions from other expense offset arrangements and do not represent the amount paid by the class during periods when reimbursements or reductions occur. Expenses net of fee waivers reflect expenses after reimbursement by the investment adviser but prior to reductions from brokerage service arrangements or other expense offset arrangements. Expenses net of all reductions represent the net expenses paid by the class.
H Amount does not include the portfolio activity of any underlying Fidelity Central Funds.
See accompanying notes which are an integral part of the financial statements.
Financial Highlights — Fidelity Stock Selector Small Cap Fund Class C
| Years ended October 31, | 2015 | 2014 | 2013 | 2012 | 2011 |
| Selected Per–Share Data | |||||
| Net asset value, beginning of period | $24.49 | $24.32 | $18.73 | $17.38 | $15.82 |
| Income from Investment Operations | |||||
| Net investment income (loss)A | (.14) | (.18) | (.19) | (.16) | (.14)B |
| Net realized and unrealized gain (loss) | .93 | 1.60 | 5.78 | 1.51 | 1.69 |
| Total from investment operations | .79 | 1.42 | 5.59 | 1.35 | 1.55 |
| Distributions from net realized gain | (2.12) | (1.25) | – | – | – |
| Redemption fees added to paid in capitalA | –C | –C | –C | –C | .01 |
| Net asset value, end of period | $23.16 | $24.49 | $24.32 | $18.73 | $17.38 |
| Total ReturnD,E | 3.36% | 5.95% | 29.85% | 7.77% | 9.86% |
| Ratios to Average Net AssetsF,G | |||||
| Expenses before reductions | 1.84% | 1.79% | 1.98% | 2.12% | 1.90% |
| Expenses net of fee waivers, if any | 1.84% | 1.79% | 1.98% | 2.12% | 1.90% |
| Expenses net of all reductions | 1.83% | 1.79% | 1.96% | 2.11% | 1.89% |
| Net investment income (loss) | (.59)% | (.74)% | (.85)% | (.85)% | (.76)%B |
| Supplemental Data | |||||
| Net assets, end of period (000 omitted) | $3,965 | $3,946 | $3,252 | $1,504 | $1,370 |
| Portfolio turnover rateH | 48% | 73% | 79% | 61% | 73% |
A Calculated based on average shares outstanding during the period.
B Investment income per share reflects a large, non-recurring dividend which amounted to $.04 per share. Excluding this non-recurring dividend, the ratio of net investment income (loss) to average net assets would have been (.96) %.
C Amount represents less than $.005 per share.
D Total returns would have been lower if certain expenses had not been reduced during the applicable periods shown.
E Total returns do not include the effect of the contingent deferred sales charge.
F Fees and expenses of any underlying Fidelity Central Funds are not included in the Fund's expense ratio. The Fund indirectly bears its proportionate share of the expenses of any underlying Fidelity Central Funds.
G Expense ratios reflect operating expenses of the class. Expenses before reductions do not reflect amounts reimbursed by the investment adviser or reductions from brokerage service arrangements or reductions from other expense offset arrangements and do not represent the amount paid by the class during periods when reimbursements or reductions occur. Expenses net of fee waivers reflect expenses after reimbursement by the investment adviser but prior to reductions from brokerage service arrangements or other expense offset arrangements. Expenses net of all reductions represent the net expenses paid by the class.
H Amount does not include the portfolio activity of any underlying Fidelity Central Funds.
See accompanying notes which are an integral part of the financial statements.
Financial Highlights — Fidelity Stock Selector Small Cap Fund
| Years ended October 31, | 2015 | 2014 | 2013 | 2012 | 2011 |
| Selected Per–Share Data | |||||
| Net asset value, beginning of period | $26.15 | $25.64 | $19.65 | $18.05 | $16.35 |
| Income from Investment Operations | |||||
| Net investment income (loss)A | .12 | .08 | .04 | .04 | .05B |
| Net realized and unrealized gain (loss) | .98 | 1.70 | 6.06 | 1.56 | 1.74 |
| Total from investment operations | 1.10 | 1.78 | 6.10 | 1.60 | 1.79 |
| Distributions from net investment income | (.09) | (.01)C | (.10) | – | (.10) |
| Distributions from net realized gain | (2.27) | (1.26)C | (.01) | – | – |
| Total distributions | (2.36) | (1.27) | (.11) | – | (.10) |
| Redemption fees added to paid in capitalA | –D | –D | –D | –D | .01 |
| Net asset value, end of period | $24.89 | $26.15 | $25.64 | $19.65 | $18.05 |
| Total ReturnE | 4.46% | 7.08% | 31.20% | 8.86% | 11.03% |
| Ratios to Average Net AssetsF,G | |||||
| Expenses before reductions | .77% | .73% | .94% | 1.07% | .85% |
| Expenses net of fee waivers, if any | .77% | .73% | .93% | 1.07% | .85% |
| Expenses net of all reductions | .76% | .72% | .91% | 1.06% | .85% |
| Net investment income (loss) | .48% | .32% | .20% | .20% | .29%B |
| Supplemental Data | |||||
| Net assets, end of period (in millions) | $1,372 | $1,406 | $1,487 | $1,311 | $1,698 |
| Portfolio turnover rateH | 48% | 73% | 79% | 61% | 73% |
A Calculated based on average shares outstanding during the period.
B Investment income per share reflects a large, non-recurring dividend which amounted to $.04 per share. Excluding this non-recurring dividend, the ratio of net investment income (loss) to average net assets would have been .09%.
C The amounts shown reflect certain reclassifications related to book to tax differences that were made in the year shown.
D Amount represents less than $.005 per share.
E Total returns would have been lower if certain expenses had not been reduced during the applicable periods shown.
F Fees and expenses of any underlying Fidelity Central Funds are not included in the Fund's expense ratio. The Fund indirectly bears its proportionate share of the expenses of any underlying Fidelity Central Funds.
G Expense ratios reflect operating expenses of the class. Expenses before reductions do not reflect amounts reimbursed by the investment adviser or reductions from brokerage service arrangements or reductions from other expense offset arrangements and do not represent the amount paid by the class during periods when reimbursements or reductions occur. Expenses net of fee waivers reflect expenses after reimbursement by the investment adviser but prior to reductions from brokerage service arrangements or other expense offset arrangements. Expenses net of all reductions represent the net expenses paid by the class.
H Amount does not include the portfolio activity of any underlying Fidelity Central Funds.
See accompanying notes which are an integral part of the financial statements.
Financial Highlights — Fidelity Stock Selector Small Cap Fund Class I
| Years ended October 31, | 2015 | 2014 | 2013 | 2012 | 2011 |
| Selected Per–Share Data | |||||
| Net asset value, beginning of period | $26.21 | $25.69 | $19.72 | $18.07 | $16.39 |
| Income from Investment Operations | |||||
| Net investment income (loss)A | .13 | .09 | .05 | .04 | .05B |
| Net realized and unrealized gain (loss) | .99 | 1.70 | 6.06 | 1.61 | 1.74 |
| Total from investment operations | 1.12 | 1.79 | 6.11 | 1.65 | 1.79 |
| Distributions from net investment income | (.10) | (.01)C | (.14) | – | (.12) |
| Distributions from net realized gain | (2.27) | (1.26)C | (.01) | – | – |
| Total distributions | (2.37) | (1.27) | (.14)D | – | (.12) |
| Redemption fees added to paid in capitalA | –E | –E | –E | –E | .01 |
| Net asset value, end of period | $24.96 | $26.21 | $25.69 | $19.72 | $18.07 |
| Total ReturnF | 4.52% | 7.11% | 31.22% | 9.13% | 10.99% |
| Ratios to Average Net AssetsG,H | |||||
| Expenses before reductions | .74% | .70% | .91% | 1.06% | .86% |
| Expenses net of fee waivers, if any | .73% | .70% | .91% | 1.06% | .86% |
| Expenses net of all reductions | .73% | .70% | .89% | 1.05% | .85% |
| Net investment income (loss) | .51% | .35% | .22% | .21% | .29%B |
| Supplemental Data | |||||
| Net assets, end of period (000 omitted) | $46,484 | $50,988 | $55,860 | $39,592 | $10,038 |
| Portfolio turnover rateI | 48% | 73% | 79% | 61% | 73% |
A Calculated based on average shares outstanding during the period.
B Investment income per share reflects a large, non-recurring dividend which amounted to $.04 per share. Excluding this non-recurring dividend, the ratio of net investment income (loss) to average net assets would have been .08%.
C The amounts shown reflect certain reclassifications related to book to tax differences that were made in the year shown.
D Total distributions of $.14 per share is comprised of distributions from net investment income of $.136 and distributions from net realized gain of $.007 per share.
E Amount represents less than $.005 per share.
F Total returns would have been lower if certain expenses had not been reduced during the applicable periods shown.
G Fees and expenses of any underlying Fidelity Central Funds are not included in the Fund's expense ratio. The Fund indirectly bears its proportionate share of the expenses of any underlying Fidelity Central Funds.
H Expense ratios reflect operating expenses of the class. Expenses before reductions do not reflect amounts reimbursed by the investment adviser or reductions from brokerage service arrangements or reductions from other expense offset arrangements and do not represent the amount paid by the class during periods when reimbursements or reductions occur. Expenses net of fee waivers reflect expenses after reimbursement by the investment adviser but prior to reductions from brokerage service arrangements or other expense offset arrangements. Expenses net of all reductions represent the net expenses paid by the class.
I Amount does not include the portfolio activity of any underlying Fidelity Central Funds.
See accompanying notes which are an integral part of the financial statements.
Notes to Financial Statements
For the period ended October 31, 2015
(Amounts in thousands except percentages)
1. Organization.
Fidelity Stock Selector Small Cap Fund (the Fund) is a fund of Fidelity Capital Trust (the Trust) and is authorized to issue an unlimited number of shares. The Trust is registered under the Investment Company Act of 1940, as amended (the 1940 Act), as an open-end management investment company organized as a Massachusetts business trust. The Fund offers Class A, Class T, Class C, Stock Selector Small Cap and Class I shares(formerly Institutional Class) , each of which, along with Class B shares, has equal rights as to assets and voting privileges. Class B shares are closed to new accounts and additional purchases, except for exchanges and reinvestments. Each class has exclusive voting rights with respect to matters that affect that class. Class B shares will automatically convert to Class A shares after a holding period of seven years from the initial date of purchase.
2. Investments in Fidelity Central Funds.
The Fund invests in Fidelity Central Funds, which are open-end investment companies generally available only to other investment companies and accounts managed by the investment adviser and its affiliates. The Fund's Schedule of Investments lists each of the Fidelity Central Funds held as of period end, if any, as an investment of the Fund, but does not include the underlying holdings of each Fidelity Central Fund. As an Investing Fund, the Fund indirectly bears its proportionate share of the expenses of the underlying Fidelity Central Funds.
The Money Market Central Funds seek preservation of capital and current income and are managed by Fidelity Investments Money Management, Inc. (FIMM), an affiliate of the investment adviser. Annualized expenses of the Money Market Central Funds as of their most recent shareholder report date are less than .005%.
A complete unaudited list of holdings for each Fidelity Central Fund is available upon request or at the Securities and Exchange Commission (the SEC) website at www.sec.gov. In addition, the financial statements of the Fidelity Central Funds, which are not covered by the Fund's Report of Independent Registered Public Accounting Firm, are available on the SEC website or upon request.
3. Significant Accounting Policies.
The financial statements have been prepared in conformity with accounting principles generally accepted in the United States of America (GAAP), which require management to make certain estimates and assumptions at the date of the financial statements. Actual results could differ from those estimates. Subsequent events, if any, through the date that the financial statements were issued have been evaluated in the preparation of the financial statements. The following summarizes the significant accounting policies of the Fund:
Investment Valuation. Investments are valued as of 4:00 p.m. Eastern time on the last calendar day of the period. The Board of Trustees (the Board) has delegated the day to day responsibility for the valuation of the Fund's investments to the Fidelity Management & Research Company (FMR) Fair Value Committee (the Committee). In accordance with valuation policies and procedures approved by the Board, the Fund attempts to obtain prices from one or more third party pricing vendors or brokers to value its investments. When current market prices, quotations or currency exchange rates are not readily available or reliable, investments will be fair valued in good faith by the Committee, in accordance with procedures adopted by the Board. Factors used in determining fair value vary by investment type and may include market or investment specific events, changes in interest rates and credit quality. The frequency with which these procedures are used cannot be predicted and they may be utilized to a significant extent. The Committee oversees the Fund's valuation policies and procedures and reports to the Board on the Committee's activities and fair value determinations. The Board monitors the appropriateness of the procedures used in valuing the Fund's investments and ratifies the fair value determinations of the Committee.
The Fund categorizes the inputs to valuation techniques used to value its investments into a disclosure hierarchy consisting of three levels as shown below:
- Level 1 – quoted prices in active markets for identical investments
- Level 2 – other significant observable inputs (including quoted prices for similar investments, interest rates, prepayment speeds, etc.)
- Level 3 – unobservable inputs (including the Fund's own assumptions based on the best information available)
Valuation techniques used to value the Fund's investments by major category are as follows:
Equity securities, including restricted securities, for which market quotations are readily available, are valued at the last reported sale price or official closing price as reported by a third party pricing vendor on the primary market or exchange on which they are traded and are categorized as Level 1 in the hierarchy. In the event there were no sales during the day or closing prices are not available, securities are valued at the last quoted bid price or may be valued using the last available price and are generally categorized as Level 2 in the hierarchy. For foreign equity securities, when market or security specific events arise, comparisons to the valuation of American Depositary Receipts (ADRs), futures contracts, Exchange-Traded Funds (ETFs) and certain indexes as well as quoted prices for similar securities may be used and would be categorized as Level 2 in the hierarchy. Utilizing these techniques may result in transfers between Level 1 and Level 2. For equity securities, including restricted securities, where observable inputs are limited, assumptions about market activity and risk are used and these securities may be categorized as Level 3 in the hierarchy.
Debt securities, including restricted securities, are valued based on evaluated prices received from third party pricing vendors or from brokers who make markets in such securities. U.S. government and government agency obligations are valued by pricing vendors who utilize matrix pricing which considers yield or price of bonds of comparable quality, coupon, maturity and type or by broker-supplied prices. When independent prices are unavailable or unreliable, debt securities may be valued utilizing pricing methodologies which consider similar factors that would be used by third party pricing vendors. Debt securities are generally categorized as Level 2 in the hierarchy but may be Level 3 depending on the circumstances.
Futures contracts are valued at the settlement price established each day by the board of trade or exchange on which they are traded and are categorized as Level 1 in the hierarchy. Investments in open-end mutual funds ,including the Fidelity Central Funds, are valued at their closing net asset value (NAV) each business day and are categorized as Level 1 in the hierarchy.
Changes in valuation techniques may result in transfers in or out of an assigned level within the disclosure hierarchy. The aggregate value of investments by input level as of October 31, 2015 is included at the end of the Fund's Schedule of Investments.
Foreign Currency. The Fund may use foreign currency contracts to facilitate transactions in foreign-denominated securities. Gains and losses from these transactions may arise from changes in the value of the foreign currency or if the counterparties do not perform under the contracts' terms.
Foreign-denominated assets, including investment securities, and liabilities are translated into U.S. dollars at the exchange rates at period end. Purchases and sales of investment securities, income and dividends received and expenses denominated in foreign currencies are translated into U.S. dollars at the exchange rate in effect on the transaction date.
The effects of exchange rate fluctuations on investments are included with the net realized and unrealized gain (loss) on investment securities. Other foreign currency transactions resulting in realized and unrealized gain (loss) are disclosed separately.
Investment Transactions and Income. For financial reporting purposes, the Fund's investment holdings and NAV include trades executed through the end of the last business day of the period. The NAV per share for processing shareholder transactions is calculated as of the close of business of the New York Stock Exchange (NYSE), normally 4:00 p.m. Eastern time and includes trades executed through the end of the prior business day. Gains and losses on securities sold are determined on the basis of identified cost and may include proceeds received from litigation. Dividend income is recorded on the ex-dividend date, except for certain dividends from foreign securities where the ex-dividend date may have passed, which are recorded as soon as the Fund is informed of the ex-dividend date. Non-cash dividends included in dividend income, if any, are recorded at the fair market value of the securities received. Income and capital gain distributions from Fidelity Central Funds, if any, are recorded on the ex-dividend date. Distributions received on securities that represent a return of capital or capital gain are recorded as a reduction of cost of investments and/or as a realized gain. Subsequent to ex-dividend date the Fund determines the components of these distributions, based upon receipt of tax filings or other correspondence relating to the underlying investment. Interest income is accrued as earned and includes coupon interest and amortization of premium and accretion of discount on debt securities as applicable. Investment income is recorded net of foreign taxes withheld where recovery of such taxes is uncertain.
Class Allocations and Expenses. Investment income, realized and unrealized capital gains and losses, common expenses of the Fund, and certain fund-level expense reductions, if any, are allocated daily on a pro-rata basis to each class based on the relative net assets of each class to the total net assets of the Fund. Each class differs with respect to transfer agent and distribution and service plan fees incurred. Certain expense reductions may also differ by class. For the reporting period, the allocated portion of income and expenses to each class as a percent of its average net assets may vary due to the timing of recording these transactions in relation to fluctuating net assets of the classes. Expenses directly attributable to a fund are charged to that fund. Expenses attributable to more than one fund are allocated among the respective funds on the basis of relative net assets or other appropriate methods. Expense estimates are accrued in the period to which they relate and adjustments are made when actual amounts are known.
Income Tax Information and Distributions to Shareholders. Each year, the Fund intends to qualify as a regulated investment company under Subchapter M of the Internal Revenue Code, including distributing substantially all of its taxable income and realized gains. As a result, no provision for U.S. Federal income taxes is required. As of October 31, 2015, the Fund did not have any unrecognized tax benefits in the financial statements; nor is the Fund aware of any tax positions for which it is reasonably possible that the total amounts of unrecognized tax benefits will significantly change in the next twelve months. The Fund files a U.S. federal tax return, in addition to state and local tax returns as required. The Fund's federal income tax returns are subject to examination by the Internal Revenue Service (IRS) for a period of three fiscal years after they are filed. State and local tax returns may be subject to examination for an additional fiscal year depending on the jurisdiction. Foreign taxes are provided for based on the Fund's understanding of the tax rules and rates that exist in the foreign markets in which it invests.
Distributions are declared and recorded on the ex-dividend date. Income dividends and capital gain distributions are declared separately for each class. Income and capital gain distributions are determined in accordance with income tax regulations, which may differ from GAAP. These differences resulted in distribution reclassifications. In addition, the Fund claimed a portion of the payment made to redeeming shareholders as a distribution for income tax purposes.
Capital accounts within the financial statements are adjusted for permanent book-tax differences. These adjustments have no impact on net assets or the results of operations. Capital accounts are not adjusted for temporary book-tax differences which will reverse in a subsequent period.
Book-tax differences are primarily due to foreign currency transactions, partnerships, futures transactions, deferred trustees compensation, and losses deferred due to wash sales.
The federal tax cost of investment securities and unrealized appreciation (depreciation) as of period end were as follows:
| Gross unrealized appreciation | $275,396 |
| Gross unrealized depreciation | (112,027) |
| Net unrealized appreciation (depreciation) on securities | $163,369 |
| Tax Cost | $1,351,493 |
The tax-based components of distributable earnings as of period end were as follows:
| Undistributed ordinary income | $4,607 |
| Undistributed long-term capital gain | $87,951 |
| Net unrealized appreciation (depreciation) on securities and other investments | $163,368 |
The tax character of distributions paid was as follows:
| October 31, 2015 | October 31, 2014 | |
| Ordinary Income | $19,906 | $ 899 |
| Long-term Capital Gains | 111,437 | 75,390 |
| Total | $131,343 | $ 76,289 |
Short-Term Trading (Redemption) Fees. Shares held by investors in the Fund less than 90 days may have been subject to a redemption fee equal to 1.50% of the NAV of shares redeemed. All redemption fees, which reduce the proceeds of the shareholder redemption, are retained by the Fund and accounted for as an addition to paid in capital.
4. Derivative Instruments.
Risk Exposures and the Use of Derivative Instruments. The Fund's investment objective allows the Fund to enter into various types of derivative contracts, including futures contracts. Derivatives are investments whose value is primarily derived from underlying assets, indices or reference rates and may be transacted on an exchange or over-the-counter (OTC). Derivatives may involve a future commitment to buy or sell a specified asset based on specified terms, to exchange future cash flows at periodic intervals based on a notional principal amount, or for one party to make one or more payments upon the occurrence of specified events in exchange for periodic payments from the other party.
The Fund used derivatives to increase returns and to manage exposure to certain risks as defined below. The success of any strategy involving derivatives depends on analysis of numerous economic factors, and if the strategies for investment do not work as intended, the Fund may not achieve its objectives.
The Fund's use of derivatives increased or decreased its exposure to the following risk:
| Equity Risk | Equity risk relates to the fluctuations in the value of financial instruments as a result of changes in market prices (other than those arising from interest rate risk or foreign exchange risk), whether caused by factors specific to an individual investment, its issuer, or all factors affecting all instruments traded in a market or market segment. |
The Fund is also exposed to additional risks from investing in derivatives, such as liquidity risk and counterparty credit risk. Liquidity risk is the risk that the Fund will be unable to close out the derivative in the open market in a timely manner. Counterparty credit risk is the risk that the counterparty will not be able to fulfill its obligation to the Fund. Counterparty credit risk related to exchange-traded futures contracts may be mitigated by the protection provided by the exchange on which they trade.
Investing in derivatives may involve greater risks than investing in the underlying assets directly and, to varying degrees, may involve risk of loss in excess of any initial investment and collateral received and amounts recognized in the Statement of Assets and Liabilities. In addition, there may be the risk that the change in value of the derivative contract does not correspond to the change in value of the underlying instrument.
Futures Contracts. A futures contract is an agreement between two parties to buy or sell a specified underlying instrument for a fixed price at a specified future date. The Fund used futures contracts to manage its exposure to the stock market.
Upon entering into a futures contract, a fund is required to deposit either cash or securities (initial margin) with a clearing broker in an amount equal to a certain percentage of the face value of the contract. Futures contracts are marked-to-market daily and subsequent daily payments (variation margin) are made or received by a fund depending on the daily fluctuations in the value of the futures contracts and are recorded as unrealized appreciation or (depreciation). This receivable and/or payable, if any, is included in daily variation margin for derivative instruments in the Statement of Assets and Liabilities. Realized gain or (loss) is recorded upon the expiration or closing of a futures contract.
Any open futures contracts at period end are presented in the Schedule of Investments under the caption "Futures Contracts". The underlying face amount at value reflects each contract's exposure to the underlying instrument or index at period end and is representative of volume of activity during the period. Securities deposited to meet initial margin requirements are identified in the Schedule of Investments.
During the period the Fund recognized net realized gain (loss) of $1,775 and a change in net unrealized appreciation (depreciation) of $(254) related to its investment in futures contracts. These amounts are included in the Statement of Operations.
5. Purchases and Sales of Investments.
Purchases and sales of securities, other than short-term securities, aggregated $678,476 and $784,129, respectively.
6. Fees and Other Transactions with Affiliates.
Management Fee. Fidelity Management & Research Company (the investment adviser) and its affiliates provide the Fund with investment management related services for which the Fund pays a monthly management fee. The management fee is the sum of an individual fund fee rate that is based on an annual rate of .35% of the Fund's average net assets and an annualized group fee rate that averaged .25% during the period. The group fee rate is based upon the average net assets of all the mutual funds advised by the investment adviser, including any mutual funds previously advised by the investment adviser that are currently advised by Fidelity SelectCo, LLC, an affiliate of the investment adviser. The group fee rate decreases as assets under management increase and increases as assets under management decrease. In addition, the management fee is subject to a performance adjustment (up to a maximum of +/- .20% of the Fund's average net assets over a 36 month performance period). The upward or downward adjustment to the management fee is based on the relative investment performance of Stock Selector Small Cap as compared to its benchmark index, the Russell 2000 Index, over the same 36 month performance period. For the reporting period, the total annual management fee rate, including the performance adjustment, was .49% of the Fund's average net assets. The performance adjustment included in the management fee rate may be higher or lower than the maximum performance adjustment rate due to the difference between the average net assets for the reporting and performance periods.
Distribution and Service Plan Fees. In accordance with Rule 12b-1 of the 1940 Act, the Fund has adopted separate Distribution and Service Plans for each class of shares. Certain classes pay Fidelity Distributors Corporation (FDC), an affiliate of the investment adviser, separate Distribution and Service Fees, each of which is based on an annual percentage of each class' average net assets. In addition, FDC may pay financial intermediaries for selling shares of the Fund and providing shareholder support services. For the period, the Distribution and Service Fee rates, total fees and amounts retained by FDC were as follows:
| Distribution Fee | Service Fee | Total Fees | Retained by FDC | |
| Class A | -% | .25% | $28 | $2 |
| Class T | .25% | .25% | 15 | – |
| Class B | .75% | .25% | 2 | 2 |
| Class C | .75% | .25% | 41 | 9 |
| $86 | $13 |
Sales Load. FDC may receive a front-end sales charge of up to 5.75% for selling Class A shares and 3.50% for selling Class T shares, some of which is paid to financial intermediaries for selling shares of the Fund. Depending on the holding period, FDC may receive contingent deferred sales charges levied on Class A, Class T, Class B, and Class C redemptions. The deferred sales charges range from 5.00% to 1.00% for Class B shares, 1.00% for Class C shares, 1.00% for certain purchases of Class A shares and .25% for certain purchases of Class T shares.
For the period, sales charge amounts retained by FDC were as follows:
| Retained by FDC | |
| Class A | $6 |
| Class T | 2 |
| Class B(a) | -(b) |
| Class C(a) | 1 |
| $9 |
(a) When Class B and Class C shares are initially sold, FDC pays commissions from its own resources to financial intermediaries through which the sales are made.
(b) In the amount of less than five hundred dollars.
Transfer Agent Fees. Fidelity Investments Institutional Operations Company, Inc., (FIIOC), an affiliate of the investment adviser, is the transfer, dividend disbursing and shareholder servicing agent for each class of the Fund. FIIOC receives account fees and asset-based fees that vary according to the account size and type of account of the shareholders of the respective classes of the Fund. FIIOC pays for typesetting, printing and mailing of shareholder reports, except proxy statements.
For the period, transfer agent fees for each class were as follows:
| Amount | % of Class-Level Average Net Assets | |
| Class A | $25 | .22 |
| Class T | 9 | .31 |
| Class B | 1 | .30 |
| Class C | 13 | .30 |
| Stock Selector Small Cap | 3,357 | .24 |
| Class I | 100 | .20 |
| $3,505 |
Accounting and Security Lending Fees. Fidelity Service Company, Inc. (FSC), an affiliate of the investment adviser, maintains the Fund's accounting records. The accounting fee is based on the level of average net assets for each month. Under a separate contract, FSC administers the security lending program. The security lending fee is based on the number and duration of lending transactions.
Brokerage Commissions. The Fund placed a portion of its portfolio transactions with brokerage firms which are affiliates of the investment adviser. Brokerage commissions are included in net realized gain (loss) and change in net unrealized appreciation (depreciation) in the Statement of Operations. The commissions paid to these affiliated firms were $26 for the period.
Interfund Lending Program. Pursuant to an Exemptive Order issued by the SEC, the Fund, along with other registered investment companies having management contracts with FMR or other affiliated entities of FMR, may participate in an interfund lending program. This program provides an alternative credit facility allowing the funds to borrow from, or lend money to, other participating affiliated funds. The Fund's activity in this program during the period for which loans were outstanding was as follows:
| Borrower or Lender | Average Loan Balance | Weighted Average Interest Rate | Interest Expense |
| Borrower | $11,169 | .35% | $1 |
7. Committed Line of Credit.
The Fund participates with other funds managed by the investment adviser or an affiliate in a $4.25 billion credit facility (the "line of credit") to be utilized for temporary or emergency purposes to fund shareholder redemptions or for other short-term liquidity purposes. The Fund has agreed to pay commitment fees on its pro-rata portion of the line of credit, which amounted to $2 and is reflected in Miscellaneous expenses on the Statement of Operations. During the period, the Fund did not borrow on this line of credit.
8. Security Lending.
The Fund lends portfolio securities through a lending agent from time to time in order to earn additional income. For equity securities, a lending agent is used and may loan securities to certain qualified borrowers, including Fidelity Capital Markets (FCM), a broker-dealer affiliated with the Fund. On the settlement date of the loan, the Fund receives collateral (in the form of U.S. Treasury obligations, letters of credit and/or cash) against the loaned securities and maintains collateral in an amount not less than 100% of the market value of the loaned securities during the period of the loan. The market value of the loaned securities is determined at the close of business of the Fund and any additional required collateral is delivered to the Fund on the next business day. The Fund or borrower may terminate the loan at any time, and if the borrower defaults on its obligation to return the securities loaned because of insolvency or other reasons, the Fund may apply collateral received from the borrower against the obligation. The Fund may experience delays and costs in recovering the securities loaned. Any cash collateral received is invested in the Fidelity Securities Lending Cash Central Fund. The value of loaned securities and cash collateral at period end are disclosed on the Fund's Statement of Assets and Liabilities. The value of securities loaned to FCM at period end was $4,291. Security lending income represents the income earned on investing cash collateral, less rebates paid to borrowers and any lending agent fees associated with the loan, plus any premium payments received for lending certain types of securities. Security lending income is presented in the Statement of Operations as a component of income from Fidelity Central Funds. Total security lending income during the period amounted to $572 including $34 from securities loaned to FCM.
9. Expense Reductions.
Commissions paid to certain brokers with whom the investment adviser, or its affiliates, places trades on behalf of the Fund include an amount in addition to trade execution, which may be rebated back to the Fund to offset certain expenses. This amount totaled $101 for the period.
In addition, during the period the investment adviser reimbursed and/or waived a portion of fund-level operating expenses in the amount of $6 and a portion of class-level operating expenses as follows:
| Amount | |
| Class A | $-(a) |
| Class B | -(a) |
| Class C | -(a) |
| Class I | 1 |
| Stock Selector Small Cap | 34 |
| Class T | -(a) |
| $35 |
(a) In the amount of less than five hundred dollars.
10. Distributions to Shareholders.
Distributions to shareholders of each class were as follows:
| Years ended October 31, | 2015 | 2014 |
| From net investment income | ||
| Class A | $13 | $0 |
| Stock Selector Small Cap | 4,877 | 565 |
| Class I | 192 | 24 |
| Total | $5,082 | $589 |
| From net realized gain | ||
| Class A | $925 | $396 |
| Class T | 240 | 95 |
| Class B | 22 | 16 |
| Class C | 343 | 175 |
| Stock Selector Small Cap | 120,344 | 72,289 |
| Class I | 4,387 | 2,729 |
| Total | $126,261 | $75,700 |
11. Share Transactions.
Share transactions for each class were as follows and may contain automatic conversions between classes or exchanges between funds:
| Shares | Shares | Dollars | Dollars | |
| Years ended October 31, | 2015 | 2014 | 2015 | 2014 |
| Class A | ||||
| Shares sold | 100 | 152 | $2,535 | $3,885 |
| Reinvestment of distributions | 38 | 15 | 917 | 377 |
| Shares redeemed | (76) | (73) | (1,902) | (1,870) |
| Net increase (decrease) | 62 | 94 | $1,550 | $2,392 |
| Class T | ||||
| Shares sold | 25 | 50 | $620 | $1,259 |
| Reinvestment of distributions | 10 | 4 | 240 | 95 |
| Shares redeemed | (22) | (24) | (550) | (602) |
| Net increase (decrease) | 13 | 30 | $310 | $752 |
| Class B | ||||
| Shares sold | - | - | $5 | $5 |
| Reinvestment of distributions | 1 | - | 21 | 15 |
| Shares redeemed | (5) | (2) | (123) | (56) |
| Net increase (decrease) | (4) | (2) | $(97) | $(36) |
| Class C | ||||
| Shares sold | 64 | 66 | $1,523 | $1,636 |
| Reinvestment of distributions | 14 | 7 | 325 | 163 |
| Shares redeemed | (68) | (46) | (1,632) | (1,123) |
| Net increase (decrease) | 10 | 27 | $216 | $676 |
| Stock Selector Small Cap | ||||
| Shares sold | 8,425 | 5,956 | $213,955 | $154,419 |
| Reinvestment of distributions | 5,054 | 2,814 | 122,501 | 71,273 |
| Shares redeemed | (12,118) | (13,012) | (309,333) | (336,317) |
| Net increase (decrease) | 1,361 | (4,242) | $27,123 | $(110,625) |
| Class I | ||||
| Shares sold | 362 | 264 | $9,007 | $6,855 |
| Reinvestment of distributions | 186 | 87 | 4,521 | 2,217 |
| Shares redeemed | (631) | (580) | (15,896) | (15,133) |
| Net increase (decrease) | (83) | (229) | $(2,368) | $(6,061) |
12. Other.
The Fund's organizational documents provide former and current trustees and officers with a limited indemnification against liabilities arising in connection with the performance of their duties to the Fund. In the normal course of business, the Fund may also enter into contracts that provide general indemnifications. The Fund's maximum exposure under these arrangements is unknown as this would be dependent on future claims that may be made against the Fund. The risk of material loss from such claims is considered remote.
Report of Independent Registered Public Accounting Firm
To the Trustees of Fidelity Capital Trust and Shareholders of Fidelity® Stock Selector Small Cap Fund:
We have audited the accompanying statement of assets and liabilities of Fidelity® Stock Selector Small Cap Fund (the Fund), a fund of Fidelity Capital Trust, including the schedule of investments, as of October 31, 2015, and the related statement of operations for the year then ended, the statement of changes in net assets for each of the two years in the period then ended, and the financial highlights for each of the five years in the period then ended. These financial statements and financial highlights are the responsibility of the Fund's management. Our responsibility is to express an opinion on these financial statements and financial highlights based on our audits.
We conducted our audits in accordance with the standards of the Public Company Accounting Oversight Board (United States). Those standards require that we plan and perform the audit to obtain reasonable assurance about whether the financial statements and financial highlights are free of material misstatement. The Fund is not required to have, nor were we engaged to perform, an audit of its internal control over financial reporting. Our audits included consideration of internal control over financial reporting as a basis for designing audit procedures that are appropriate in the circumstances, but not for the purpose of expressing an opinion on the effectiveness of the Fund's internal control over financial reporting. Accordingly, we express no such opinion. An audit also includes examining, on a test basis, evidence supporting the amounts and disclosures in the financial statements, assessing the accounting principles used and significant estimates made by management, as well as evaluating the overall financial statement presentation. Our procedures included confirmation of securities owned as of October 31, 2015, by correspondence with the custodians and brokers; when replies were not received from brokers, we performed other auditing procedures. We believe that our audits provide a reasonable basis for our opinion.
In our opinion, such financial statements and financial highlights referred to above present fairly, in all material respects, the financial position of Fidelity® Stock Selector Small Cap Fund as of October 31, 2015, the results of its operations for the year then ended, the changes in its net assets for each of the two years in the period then ended, and the financial highlights for each of the five years in the period then ended, in conformity with accounting principles generally accepted in the United States of America.
DELOITTE & TOUCHE LLP
Boston, Massachusetts
December 17, 2015
Trustees and Officers
The Trustees, Members of the Advisory Board (if any), and officers of the trust and fund, as applicable, are listed below. The Board of Trustees governs the fund and is responsible for protecting the interests of shareholders. The Trustees are experienced executives who meet periodically throughout the year to oversee the fund's activities, review contractual arrangements with companies that provide services to the fund, oversee management of the risks associated with such activities and contractual arrangements, and review the fund's performance. Each of the Trustees oversees 170 funds.
The Trustees hold office without limit in time except that (a) any Trustee may resign; (b) any Trustee may be removed by written instrument, signed by at least two-thirds of the number of Trustees prior to such removal; (c) any Trustee who requests to be retired or who has become incapacitated by illness or injury may be retired by written instrument signed by a majority of the other Trustees; and (d) any Trustee may be removed at any special meeting of shareholders by a two-thirds vote of the outstanding voting securities of the trust. Each Trustee who is not an interested person (as defined in the 1940 Act) of the trust and the fund is referred to herein as an Independent Trustee. Each Independent Trustee shall retire not later than the last day of the calendar year in which his or her 75th birthday occurs. The Independent Trustees may waive this mandatory retirement age policy with respect to individual Trustees. Officers and Advisory Board Members hold office without limit in time, except that any officer or Advisory Board Member may resign or may be removed by a vote of a majority of the Trustees at any regular meeting or any special meeting of the Trustees. Except as indicated, each individual has held the office shown or other offices in the same company for the past five years.
The fund’s Statement of Additional Information (SAI) includes more information about the Trustees. To request a free copy, call Fidelity at 1-800-544-8544.
Experience, Skills, Attributes, and Qualifications of the Trustees. The Governance and Nominating Committee has adopted a statement of policy that describes the experience, qualifications, attributes, and skills that are necessary and desirable for potential Independent Trustee candidates (Statement of Policy). The Board believes that each Trustee satisfied at the time he or she was initially elected or appointed a Trustee, and continues to satisfy, the standards contemplated by the Statement of Policy. The Governance and Nominating Committee also engages professional search firms to help identify potential Independent Trustee candidates who have the experience, qualifications, attributes, and skills consistent with the Statement of Policy. From time to time, additional criteria based on the composition and skills of the current Independent Trustees, as well as experience or skills that may be appropriate in light of future changes to board composition, business conditions, and regulatory or other developments, have also been considered by the professional search firms and the Governance and Nominating Committee. In addition, the Board takes into account the Trustees' commitment and participation in Board and committee meetings, as well as their leadership of standing and ad hoc committees throughout their tenure.
In determining that a particular Trustee was and continues to be qualified to serve as a Trustee, the Board has considered a variety of criteria, none of which, in isolation, was controlling. The Board believes that, collectively, the Trustees have balanced and diverse experience, qualifications, attributes, and skills, which allow the Board to operate effectively in governing the fund and protecting the interests of shareholders. Information about the specific experience, skills, attributes, and qualifications of each Trustee, which in each case led to the Board's conclusion that the Trustee should serve (or continue to serve) as a trustee of the fund, is provided below.
Board Structure and Oversight Function. James C. Curvey is an interested person and currently serves as Chairman. The Trustees have determined that an interested Chairman is appropriate and benefits shareholders because an interested Chairman has a personal and professional stake in the quality and continuity of services provided to the fund. Independent Trustees exercise their informed business judgment to appoint an individual of their choosing to serve as Chairman, regardless of whether the Trustee happens to be independent or a member of management. The Independent Trustees have determined that they can act independently and effectively without having an Independent Trustee serve as Chairman and that a key structural component for assuring that they are in a position to do so is for the Independent Trustees to constitute a substantial majority for the Board. The Independent Trustees also regularly meet in executive session. Ned C. Lautenbach serves as Chairman of the Independent Trustees and as such (i) acts as a liaison between the Independent Trustees and management with respect to matters important to the Independent Trustees and (ii) with management prepares agendas for Board meetings.
Fidelity® funds are overseen by different Boards of Trustees. The fund's Board oversees Fidelity's high income and certain equity funds, and other Boards oversee Fidelity's investment-grade bond, money market, asset allocation, and sector funds. The asset allocation funds may invest in Fidelity® funds overseen by the fund's Board. The use of separate Boards, each with its own committee structure, allows the Trustees of each group of Fidelity® funds to focus on the unique issues of the funds they oversee, including common research, investment, and operational issues. On occasion, the separate Boards establish joint committees to address issues of overlapping consequences for the Fidelity® funds overseen by each Board.
The Trustees operate using a system of committees to facilitate the timely and efficient consideration of all matters of importance to the Trustees, the fund, and fund shareholders and to facilitate compliance with legal and regulatory requirements and oversight of the fund's activities and associated risks. The Board, acting through its committees, has charged FMR and its affiliates with (i) identifying events or circumstances the occurrence of which could have demonstrably adverse effects on the fund's business and/or reputation; (ii) implementing processes and controls to lessen the possibility that such events or circumstances occur or to mitigate the effects of such events or circumstances if they do occur; and (iii) creating and maintaining a system designed to evaluate continuously business and market conditions in order to facilitate the identification and implementation processes described in (i) and (ii) above. Because the day-to-day operations and activities of the fund are carried out by or through FMR, its affiliates, and other service providers, the fund's exposure to risks is mitigated but not eliminated by the processes overseen by the Trustees. While each of the Board's committees has responsibility for overseeing different aspects of the fund's activities, oversight is exercised primarily through the Operations, Audit, and Compliance Committees. In addition, the Independent Trustees have worked with FMR to enhance the Board's oversight of investment and financial risks, legal and regulatory risks, technology risks, and operational risks, including the development of additional risk reporting to the Board. For example, a working group comprised of Independent Trustees and FMR has worked and continues to work to review the Fidelity® funds' valuation-related activities, reporting and risk management. Appropriate personnel, including but not limited to the fund's Chief Compliance Officer (CCO), FMR's internal auditor, the independent accountants, the fund's Treasurer and portfolio management personnel, make periodic reports to the Board's committees, as appropriate, including an annual review of Fidelity's risk management program for the Fidelity® funds. The responsibilities of each standing committee, including their oversight responsibilities, are described further under "Standing Committees of the Trustees."
Interested Trustees*:
Correspondence intended for a Trustee who is an interested person may be sent to Fidelity Investments, 245 Summer Street, Boston, Massachusetts 02210.
Name, Year of Birth; Principal Occupations and Other Relevant Experience+
James C. Curvey (1935)
Year of Election or Appointment: 2007
Trustee
Chairman of the Board of Trustees
Mr. Curvey also serves as Trustee of other Fidelity® funds. Mr. Curvey is a Director of Fidelity Research & Analysis Co. (investment adviser firm, 2009-present), and Vice Chairman (2007-present) and Director of FMR LLC (diversified financial services company). In addition, Mr. Curvey serves as an Overseer for the Boston Symphony Orchestra and a member of the board of Artis-Naples, Naples, Florida, and as a Trustee for Brewster Academy, Wolfeboro, New Hampshire. Previously, Mr. Curvey served as a Director of Fidelity Investments Money Management, Inc. (investment adviser firm, 2009-2014) and a Director of FMR and FMR Co., Inc. (investment adviser firms, 2007-2014).
Charles S. Morrison (1960)
Year of Election or Appointment: 2014
Trustee
Mr. Morrison also serves as Trustee of other funds. He serves as a Director of Fidelity Investments Money Management, Inc. (FIMM) (investment adviser firm, 2014-present), Director of Fidelity SelectCo, LLC (investment adviser firm, 2014-present), President, Asset Management (2014-present), and is an employee of Fidelity Investments. Previously, Mr. Morrison served as Vice President of Fidelity's Fixed Income and Asset Allocation Funds (2012-2014), President, Fixed Income (2011-2014), Vice President of Fidelity's Money Market Funds (2005-2009), President, Money Market Group Leader of FMR (investment adviser firm, 2009), and Senior Vice President, Money Market Group of FMR (2004-2009). Mr. Morrison also served as Vice President of Fidelity's Bond Funds (2002-2005), certain Balanced Funds (2002-2005), and certain Asset Allocation Funds (2002-2007), and as Senior Vice President (2002-2005) of Fidelity's Bond Division.
* Determined to be an “Interested Trustee” by virtue of, among other things, his or her affiliation with the trust or various entities under common control with FMR.
+ The information includes the Trustee's principal occupation during the last five years and other information relating to the experience, attributes, and skills relevant to the Trustee's qualifications to serve as a Trustee, which led to the conclusion that the Trustee should serve as a Trustee for the fund.
Independent Trustees:
Correspondence intended for an Independent Trustee may be sent to Fidelity Investments, P.O. Box 55235, Boston, Massachusetts 02205-5235.
Name, Year of Birth; Principal Occupations and Other Relevant Experience+
Dennis J. Dirks (1948)
Year of Election or Appointment: 2005
Trustee
Mr. Dirks also serves as Trustee of other Fidelity® funds. Prior to his retirement in May 2003, Mr. Dirks was Chief Operating Officer and a member of the Board of The Depository Trust & Clearing Corporation (DTCC). He also served as President, Chief Operating Officer, and Board member of The Depository Trust Company (DTC) and President and Board member of the National Securities Clearing Corporation (NSCC). In addition, Mr. Dirks served as Chief Executive Officer and Board member of the Government Securities Clearing Corporation, Chief Executive Officer and Board member of the Mortgage-Backed Securities Clearing Corporation, as a Trustee and a member of the Finance Committee of Manhattan College (2005-2008), as a Trustee and a member of the Finance Committee of AHRC of Nassau County (2006-2008), and as a member of the Independent Directors Council (IDC) Governing Council (2010-2015). Mr. Dirks is a member of the Board of Directors for The Brookville Center for Children's Services, Inc. (2009-present).
Alan J. Lacy (1953)
Year of Election or Appointment: 2008
Trustee
Mr. Lacy also serves as Trustee of other Fidelity® funds. Mr. Lacy serves as a member of the Board of Directors of Dave & Buster's Entertainment, Inc. (restaurant and entertainment complexes, 2010-present) and Bristol-Myers Squibb Company (global pharmaceuticals, 2008-present). In addition, Mr. Lacy served as Senior Adviser (2007-2014) of Oak Hill Capital Partners, L.P. (private equity) and also served as Chief Executive Officer (2000-2005) and Vice Chairman (2005-2006) of Sears Holdings Corporation and Sears, Roebuck and Co. (retail). Mr. Lacy is a member of the Board of Trustees of The National Parks Conservation Association (2006-present). Previously, Mr. Lacy served as Chairman of the Board of Trustees of the National Parks Conservation Association (2008-2011) and as a member of the Board of Directors for The Western Union Company (global money transfer, 2006-2011), The Hillman Companies, Inc. (hardware wholesalers, 2010-2014), and Earth Fare, Inc. (retail grocery, 2010-2014).
Ned C. Lautenbach (1944)
Year of Election or Appointment: 2000
Trustee
Chairman of the Independent Trustees
Mr. Lautenbach also serves as Trustee of other Fidelity® funds. Mr. Lautenbach currently serves as the Lead Director of the Eaton Corporation Board of Directors (diversified industrial, 1997-present). Mr. Lautenbach is Chairman of the Board of Directors of Artis-Naples in Naples, Florida (2012-present), a member of the Council on Foreign Relations (1994-present), and a member of the Board of Governors, State University System of Florida (2013-present). Previously, Mr. Lautenbach was a Partner/Advisory Partner at Clayton, Dubilier & Rice, LLC (private equity investment, 1998-2010), as well as a Director of Sony Corporation (2006-2007).
Joseph Mauriello (1944)
Year of Election or Appointment: 2008
Trustee
Mr. Mauriello also serves as Trustee of other Fidelity® funds. Prior to his retirement in January 2006, Mr. Mauriello served in numerous senior management positions including Deputy Chairman and Chief Operating Officer (2004-2005), and Vice Chairman of Financial Services (2002-2004) of KPMG LLP US (professional services, 1965-2005). Mr. Mauriello currently serves as a member of the Board of Directors of XL Group plc. (global insurance and re-insurance, 2006-present) and the Independent Directors Council (IDC) Governing Council (2015-present). Previously, Mr. Mauriello served as a Director of the Hamilton Funds of the Bank of New York (2006-2007) and of Arcadia Resources Inc. (health care services and products, 2007-2012).
Robert W. Selander (1950)
Year of Election or Appointment: 2011
Trustee
Mr. Selander also serves as Trustee of other Fidelity® funds. Mr. Selander serves as a Director of The Western Union Company (global money transfer, 2014-present). Previously, Mr. Selander served as a Member of the Advisory Board of other Fidelity® funds (2011), and Executive Vice Chairman (2010), Chief Executive Officer (2009-2010), and President and Chief Executive Officer (1997-2009) of Mastercard, Inc.
Cornelia M. Small (1944)
Year of Election or Appointment: 2005
Trustee
Ms. Small also serves as Trustee of other Fidelity® funds. Ms. Small is a member of the Board of Directors (2009-present) and Chair of the Investment Committee (2010-present) of the Teagle Foundation. Ms. Small also serves on the Investment Committee of the Berkshire Taconic Community Foundation (2008-present). Previously, Ms. Small served as Chairperson (2002-2008) and a member of the Investment Committee and Chairperson (2008-2012) and a member of the Board of Trustees of Smith College. In addition, Ms. Small served as Chief Investment Officer, Director of Global Equity Investments, and a member of the Board of Directors of Scudder, Stevens & Clark and Scudder Kemper Investments.
William S. Stavropoulos (1939)
Year of Election or Appointment: 2002
Trustee
Vice Chairman of the Independent Trustees
Mr. Stavropoulos also serves as Trustee of other Fidelity® funds. Mr. Stavropoulos serves as President and Founder of the Michigan Baseball Foundation, the Great Lakes Loons (2007-present). Mr. Stavropoulos is Chairman Emeritus of the Board of Directors of The Dow Chemical Company, where he previously served in numerous senior management positions, including President, CEO (1995-2000; 2002-2004), Chairman of the Executive Committee (2000-2006), and as a member of the Board of Directors (1990-2006). Currently, Mr. Stavropoulos is Chairman of the Board of Directors of Univar Inc. (global distributor of commodity and specialty chemicals), a Director of Teradata Corporation (data warehousing and technology solutions), and Maersk Inc. (industrial conglomerate), and a member of the Advisory Board for Metalmark Capital LLC (private equity investment, 2005-present). Mr. Stavropoulos is an operating advisor to Clayton, Dubilier & Rice, LLC (private equity investment). In addition, Mr. Stavropoulos is a member of the University of Notre Dame Advisory Council for the College of Science, a Trustee of the Rollin L. Gerstacker Foundation, and a Director of the Naples Philharmonic Center for the Arts. Previously, Mr. Stavropoulos served as a Director of Chemical Financial Corporation (bank holding company, 1993-2012) and Tyco International, Ltd. (multinational manufacturing and services, 2007-2012).
David M. Thomas (1949)
Year of Election or Appointment: 2008
Trustee
Mr. Thomas also serves as Trustee of other Fidelity® funds. Mr. Thomas serves as Non-Executive Chairman of the Board of Directors of Fortune Brands Home and Security (home and security products, 2011-present), as a member of the Board of Directors (2004-present) and Presiding Director (2013-present) of Interpublic Group of Companies, Inc. (marketing communication), and as a member of the Board of Trustees of the University of Florida (2013-present). Previously, Mr. Thomas served as Executive Chairman (2005-2006) and Chairman and Chief Executive Officer (2000-2005) of IMS Health, Inc. (pharmaceutical and healthcare information solutions), and a Director of Fortune Brands, Inc. (consumer products, 2000-2011).
+ The information includes the Trustee's principal occupation during the last five years and other information relating to the experience, attributes, and skills relevant to the Trustee's qualifications to serve as a Trustee, which led to the conclusion that the Trustee should serve as a Trustee for the fund.
Advisory Board Members and Officers:
Correspondence intended for an officer or Peter S. Lynch may be sent to Fidelity Investments, 245 Summer Street, Boston, Massachusetts 02210. Officers appear below in alphabetical order.
Name, Year of Birth; Principal Occupation
Peter S. Lynch (1944)
Year of Election or Appointment: 2003
Member of the Advisory Board
Mr. Lynch also serves as Member of the Advisory Board of other Fidelity® funds. Mr. Lynch is Vice Chairman and a Director of FMR (investment adviser firm) and FMR Co., Inc. (investment adviser firm). In addition, Mr. Lynch serves as a Trustee of Boston College and as the Chairman of the Inner-City Scholarship Fund. Previously, Mr. Lynch served on the Special Olympics International Board of Directors (1997-2006).
Elizabeth Paige Baumann (1968)
Year of Election or Appointment: 2012
Anti-Money Laundering (AML) Officer
Ms. Baumann also serves as AML Officer of other funds. She is Chief AML Officer of FMR LLC (diversified financial services company, 2012-present) and is an employee of Fidelity Investments. Previously, Ms. Baumann served as Vice President and Deputy Anti-Money Laundering Officer (2007-2012).
Marc R. Bryant (1966)
Year of Election or Appointment: 2015
Secretary and Chief Legal Officer (CLO)
Mr. Bryant also serves as Secretary and CLO of other funds. Mr. Bryant serves as CLO, Secretary, and Senior Vice President of Fidelity Management & Research Company (investment adviser firm, 2015-present) and FMR Co., Inc. (investment adviser firm, 2015-present); Secretary of Fidelity SelectCo, LLC (investment adviser firm, 2015-present) and Fidelity Investments Money Management, Inc. (investment adviser firm, 2015-present); and CLO of Fidelity Management & Research (Hong Kong) Limited (investment adviser firm, 2015-present). He is Senior Vice President and Deputy General Counsel of FMR LLC (diversified financial services company). Previously, Mr. Bryant served as Secretary and Chief Legal Officer of Fidelity Rutland Square Trust II (2010-2014) and Assistant Secretary of Fidelity's Fixed Income and Asset Allocation Funds (2013-2015). Prior to joining Fidelity Investments, Mr. Bryant served as a Senior Vice President and the Head of Global Retail Legal for AllianceBernstein L.P. (2006-2010), and as the General Counsel for ProFund Advisors LLC (2001-2006).
William C. Coffey (1969)
Year of Election or Appointment: 2009
Assistant Secretary
Mr. Coffey also serves as Assistant Secretary of other funds. He is Senior Vice President and Deputy General Counsel of FMR LLC (diversified financial services company, 2010-present), and is an employee of Fidelity Investments. Previously, Mr. Coffey served as Vice President and Associate General Counsel of FMR LLC (2005-2009).
Jonathan Davis (1968)
Year of Election or Appointment: 2010
Assistant Treasurer
Mr. Davis also serves as Assistant Treasurer of other funds, and is an employee of Fidelity Investments. Previously, Mr. Davis served as Vice President and Associate General Counsel of FMR LLC (diversified financial services company, 2003-2010).
Adrien E. Deberghes (1967)
Year of Election or Appointment: 2008
Deputy Treasurer
Mr. Deberghes also serves as an officer of other funds. He is an employee of Fidelity Investments (2008-present). Prior to joining Fidelity Investments, Mr. Deberghes was Senior Vice President of Mutual Fund Administration at State Street Corporation (2007-2008), Senior Director of Mutual Fund Administration at Investors Bank & Trust (2005-2007), and Director of Finance for Dunkin' Brands (2000-2005).
Stephanie J. Dorsey (1969)
Year of Election or Appointment: 2010
Assistant Treasurer
Ms. Dorsey also serves as an officer of other funds. She is an employee of Fidelity Investments (2008-present) and has served in other fund officer roles. Prior to joining Fidelity Investments, Ms. Dorsey served as Treasurer (2004-2008) of the JPMorgan Mutual Funds and Vice President (2004-2008) of JPMorgan Chase Bank.
Howard J. Galligan III (1966)
Year of Election or Appointment: 2014
Chief Financial Officer
Mr. Galligan also serves as Chief Financial Officer of other funds. Mr. Galligan serves as President of Fidelity Pricing and Cash Management Services (FPCMS) (2014-present) and as a Director of Strategic Advisers, Inc. (investment adviser firm, 2008-present). Previously, Mr. Galligan served as Chief Administrative Officer of Asset Management (2011-2014) and Chief Operating Officer and Senior Vice President of Investment Support for Strategic Advisers, Inc. (2003-2011).
Scott C. Goebel (1968)
Year of Election or Appointment: 2015
Vice President
Mr. Goebel serves as Vice President of other funds and is an employee of Fidelity Investments (2001-present). Previously, Mr. Goebel served as Secretary of Fidelity SelectCo, LLC (investment adviser firm, 2013-2015), Fidelity Investments Money Management, Inc. (FIMM) (investment adviser firm, 2010-2015), and Fidelity Research and Analysis Company (FRAC) (investment adviser firm, 2010-2015); General Counsel, Secretary, and Senior Vice President of Fidelity Management & Research Company (investment adviser firm, 2008-2015) and FMR Co., Inc. (investment adviser firm, 2008-2015); Assistant Secretary of Fidelity Management & Research (Japan) Limited (investment adviser firm, 2008-2015) and FMR Investment Management (U.K.) Limited (investment adviser firm, 2008-2015); Chief Legal Officer (CLO) of Fidelity Management & Research (Hong Kong) Limited (investment adviser firm, 2008-2015); Secretary and CLO of certain Fidelity® funds (2008-2015); Assistant Secretary of FIMM (2008-2010), FRAC (2008-2010), and certain funds (2007-2008); and as Vice President and Secretary of Fidelity Distributors Corporation (FDC) (2005-2007).
Thomas C. Hense (1964)
Year of Election or Appointment: 2008, 2010, or 2015
Vice President
Mr. Hense serves as Vice President of Fidelity Advisor® Multi-Asset Income Fund (2015) and other funds (High Income (2008), Small Cap (2008), and Value (2010) funds), and is an employee of Fidelity Investments (1993-present). Previously, Mr. Hense served as a portfolio manager for Fidelity's Institutional Money Management Group (Pyramis) (2003-2008).
Brian B. Hogan (1964)
Year of Election or Appointment: 2009
Vice President
Mr. Hogan also serves as Trustee or Vice President of other funds. Mr. Hogan serves as a Director of Fidelity SelectCo, LLC (investment adviser firm, 2014-present) and President of the Equity Division of FMR (investment adviser firm, 2009-present). Previously, Mr. Hogan served as Senior Vice President, Equity Research of FMR (2006-2009) and as a portfolio manager.
Chris Maher (1972)
Year of Election or Appointment: 2013
Assistant Treasurer
Mr. Maher serves as Assistant Treasurer of other funds. Mr. Maher is Vice President of Valuation Oversight and is an employee of Fidelity Investments. Previously, Mr. Maher served as Vice President of Asset Management Compliance (2013), Vice President of the Program Management Group of FMR (investment adviser firm, 2010-2013), and Vice President of Valuation Oversight (2008-2010).
Kenneth B. Robins (1969)
Year of Election or Appointment: 2008
President and Treasurer
Mr. Robins also serves as an officer of other funds. Mr. Robins serves as Executive Vice President of Fidelity Investments Money Management, Inc. (FIMM) (investment adviser firm, 2013-present) and is an employee of Fidelity Investments (2004-present). Previously, Mr. Robins served in other fund officer roles.
Stacie M. Smith (1974)
Year of Election or Appointment: 2013
Deputy Treasurer
Ms. Smith also serves as an officer of other funds. She is an employee of Fidelity Investments (2009-present) and has served in other fund officer roles. Prior to joining Fidelity Investments, Ms. Smith served as Senior Audit Manager of Ernst & Young LLP (1996-2009).
Renee Stagnone (1975)
Year of Election or Appointment: 2013
Deputy Treasurer
Ms. Stagnone also serves as Deputy Treasurer of other funds. Ms. Stagnone is an employee of Fidelity Investments (1997-present).
Linda J. Wondrack (1964)
Year of Election or Appointment: 2014
Chief Compliance Officer
Ms. Wondrack also serves as Chief Compliance Officer of other funds. Ms. Wondrack is Executive Vice President and head of the Ethics Office and Asset Management Compliance for Fidelity Investments (2012-present). Ms. Wondrack also serves as Chief Compliance Officer of Fidelity SelectCo, LLC (investment adviser firm, 2014-present); Chief Compliance Officer of Impresa Management LLC (2013-present); and Chief Compliance Officer of FMR Co., Inc. (investment adviser firm), Fidelity Investments Money Management, Inc. (investment adviser firm), Fidelity Management & Research (Japan) Limited (investment adviser firm), FMR Investment Management (U.K.) Limited (investment adviser firm), Fidelity Management & Research (Hong Kong) (investment adviser firm), Fidelity Management & Research Company (investment adviser firm), FIAM LLC (investment adviser firm), and Strategic Advisers, Inc. (investment adviser firm), Ballyrock Investment Advisors LLC, and Northern Neck Investors LLC (2012-present). Previously, Ms. Wondrack served as Senior Vice President and Chief Compliance Officer for Columbia Management Investment Advisers, LLC (2005-2012); Chief Compliance Officer for certain funds within the Columbia Family of Funds (2007-2012); and Senior Vice President of Compliance Risk Management at Bank of America (2005-2010).
Joseph F. Zambello (1957)
Year of Election or Appointment: 2011
Deputy Treasurer
Mr. Zambello also serves as Deputy Treasurer of other funds. Mr. Zambello is an employee of Fidelity Investments (1991-present). Previously, Mr. Zambello served as Vice President of the Program Management Group of FMR (investment adviser firm, 2009-2011) and Vice President of the Transfer Agent Oversight Group (2005-2009).
Shareholder Expense Example
As a shareholder of the Fund, you incur two types of costs: (1) transaction costs, including sales charges (loads) on purchase payments or redemption proceeds, redemption fees and (2) ongoing costs, including management fees, distribution and/or service (12b-1) fees and other Fund expenses. This Example is intended to help you understand your ongoing costs (in dollars) of investing in the Fund and to compare these costs with the ongoing costs of investing in other mutual funds.
The Example is based on an investment of $1,000 invested at the beginning of the period and held for the entire period (May 1, 2015 to October 31, 2015).
Actual Expenses
The first line of the accompanying table for each class of the Fund provides information about actual account values and actual expenses. You may use the information in this line, together with the amount you invested, to estimate the expenses that you paid over the period. Simply divide your account value by $1,000.00 (for example, an $8,600 account value divided by $1,000.00 = 8.6), then multiply the result by the number in the first line for a class of the Fund under the heading entitled "Expenses Paid During Period" to estimate the expenses you paid on your account during this period. A small balance maintenance fee of $12.00 that is charged once a year may apply for certain accounts with a value of less than $2,000. This fee is not included in the table below. If it was, the estimate of expenses you paid during the period would be higher, and your ending account value lower, by this amount. In addition, the Fund, as a shareholder in the underlying Fidelity Central Funds, will indirectly bear its pro-rata share of the fees and expenses incurred by the underlying Fidelity Central Funds. These fees and expenses are not included in the Fund's annualized expense ratio used to calculate the expense estimate in the table below.
Hypothetical Example for Comparison Purposes
The second line of the accompanying table for each class of the Fund provides information about hypothetical account values and hypothetical expenses based on a Class' actual expense ratio and an assumed rate of return of 5% per year before expenses, which is not the Class' actual return. The hypothetical account values and expenses may not be used to estimate the actual ending account balance or expenses you paid for the period. You may use this information to compare the ongoing costs of investing in the Fund and other funds. To do so, compare this 5% hypothetical example with the 5% hypothetical examples that appear in the shareholder reports of the other funds. A small balance maintenance fee of $12.00 that is charged once a year may apply for certain accounts with a value of less than $2,000. This fee is not included in the table below. If it was, the estimate of expenses you paid during the period would be higher, and your ending account value lower, by this amount. In addition, the Fund, as a shareholder in the underlying Fidelity Central Funds, will indirectly bear its pro-rata share of the fees and expenses incurred by the underlying Fidelity Central Funds. These fees and expenses are not included in the Fund's annualized expense ratio used to calculate the expense estimate in the table below.
Please note that the expenses shown in the table are meant to highlight your ongoing costs only and do not reflect any transaction costs. Therefore, the second line of the table is useful in comparing ongoing costs only, and will not help you determine the relative total costs of owning different funds. In addition, if these transactional costs were included, your costs would have been higher.
| Annualized Expense Ratio-A | Beginning Account Value May 1, 2015 | Ending Account Value October 31, 2015 | Expenses Paid During Period-B May 1, 2015 to October 31, 2015 | |
| Class A | 1.05% | |||
| Actual | $1,000.00 | $971.00 | $5.22 | |
| Hypothetical-C | $1,000.00 | $1,019.91 | $5.35 | |
| Class T | 1.40% | |||
| Actual | $1,000.00 | $969.70 | $6.95 | |
| Hypothetical-C | $1,000.00 | $1,018.15 | $7.12 | |
| Class B | 1.90% | |||
| Actual | $1,000.00 | $967.20 | $9.42 | |
| Hypothetical-C | $1,000.00 | $1,015.63 | $9.65 | |
| Class C | 1.89% | |||
| Actual | $1,000.00 | $967.00 | $9.37 | |
| Hypothetical-C | $1,000.00 | $1,015.68 | $9.60 | |
| Stock Selector Small Cap | .83% | |||
| Actual | $1,000.00 | $971.90 | $4.13 | |
| Hypothetical-C | $1,000.00 | $1,021.02 | $4.23 | |
| Class I | .78% | |||
| Actual | $1,000.00 | $972.70 | $3.88 | |
| Hypothetical-C | $1,000.00 | $1,021.27 | $3.97 |
A Annualized expense ratio reflects expenses net of applicable fee waivers.
B Expenses are equal to each Class' annualized expense ratio, multiplied by the average account value over the period, multiplied by 184/365 (to reflect the one-half year period).
C 5% return per year before expenses
Distributions (Unaudited)
The Board of Trustees of Fidelity Stock Selector Small Cap Fund voted to pay to shareholders of record at the opening of business on record date, the following distributions per share derived from capital gains realized from sales of portfolio securities, and dividends derived from net investment income:
| Pay Date | Record Date | Dividends | Capital Gains | |
| Fidelity Stock Selector Small Cap Fund | 12/07/15 | 12/04/15 | $0.107 | $1.520 |
The fund hereby designates as a capital gain dividend with respect to the taxable year ended October 31, 2015 $99,563,019, or, if subsequently determined to be different, the net capital gain of such year.
Fidelity Stock Selector Small Cap Fund designates 52% of each dividends distributed during the fiscal year as qualifying for the dividends-received deduction for corporate shareholders.
Fidelity Stock Selector Small Cap Fund designates 63% of each dividends distributed during the fiscal year as amounts which may be taken into account as a dividend for purposes of the maximum rate under section 1(h)(11) of the Internal Revenue Code.
The fund will notify shareholders in January 2016 of amounts for use in preparing 2015 income tax returns.
Board Approval of Investment Advisory Contracts and Management Fees
Fidelity Stock Selector Small Cap Fund
Each year, the Board of Trustees, including the Independent Trustees (together, the Board), votes on the renewal of the management contract with Fidelity Management & Research Company (FMR) and the sub-advisory agreements (together, the Advisory Contracts) for the fund. The Board, assisted by the advice of fund counsel and Independent Trustees' counsel, requests and considers a broad range of information relevant to the renewal of the Advisory Contracts throughout the year.
The Board meets regularly and, at each of its meetings, covers an extensive agenda of topics and materials and considers factors that are relevant to its annual consideration of the renewal of the fund's Advisory Contracts, including the services and support provided to the fund and its shareholders. The Board has established various standing committees (Committees), each composed of and chaired by Independent Trustees with varying backgrounds, to which the Board has assigned specific subject matter responsibilities in order to enhance effective decision-making by the Board. The Board, acting directly and through its Committees, requests and receives information concerning the annual consideration of the renewal of the fund's Advisory Contracts. The Board also meets as needed to consider matters specifically related to the Board's annual consideration of the renewal of the Advisory Contracts. Members of the Board may also meet with trustees of other Fidelity funds through ad hoc joint committees to discuss certain matters relevant to all of the Fidelity funds.
At its July 2015 meeting, the Board unanimously determined to renew the fund's Advisory Contracts. In reaching its determination, the Board considered all factors it believed relevant, including (i) the nature, extent, and quality of the services to be provided to the fund and its shareholders (including the investment performance of the fund); (ii) the competitiveness of the fund's management fee and total expense ratio relative to peer funds; (iii) the total costs of the services to be provided by and the profits to be realized by Fidelity from its relationship with the fund; and (iv) the extent to which (if any) economies of scale exist and would be realized as the fund grows, and whether any economies of scale are appropriately shared with fund shareholders.
In considering whether to renew the Advisory Contracts for the fund, the Board reached a determination, with the assistance of fund counsel and Independent Trustees' counsel and through the exercise of its business judgment, that the renewal of the Advisory Contracts was in the best interests of the fund and its shareholders and that the compensation payable under the Advisory Contracts was fair and reasonable. The Board's decision to renew the Advisory Contracts was not based on any single factor, but rather was based on a comprehensive consideration of all the information provided to the Board at its meetings throughout the year. The Board, in reaching its determination to renew the Advisory Contracts, was aware that shareholders of the fund have a broad range of investment choices available to them, including a wide choice among funds offered by Fidelity's competitors, and that the fund's shareholders, who have the opportunity to review and weigh the disclosure provided by the fund in its prospectus and other public disclosures, have chosen to invest in this fund, which is part of the Fidelity family of funds.
Nature, Extent, and Quality of Services Provided. The Board considered Fidelity's staffing as it relates to the fund, including the backgrounds of investment personnel of Fidelity, and also considered the fund's investment objective, strategies, and related investment philosophy. The Independent Trustees also had discussions with senior management of Fidelity's investment operations and investment groups. The Board considered the structure of the portfolio manager compensation program and whether this structure provides appropriate incentives to act in the best interests of the fund. Additionally, the Board considered the portfolio managers' investments, if any, in the funds that they manage.Resources Dedicated to Investment Management and Support Services. The Board and the Fund Oversight and Research Committees reviewed the general qualifications and capabilities of Fidelity's investment staff, including its size, education, experience, and resources, as well as Fidelity's approach to recruiting, training, managing, and compensating investment personnel. The Board noted that Fidelity has continued to increase the resources devoted to non-U.S. offices, including expansion of Fidelity's global investment organization. The Board also noted that Fidelity's analysts have extensive resources, tools and capabilities that allow them to conduct sophisticated quantitative and fundamental analysis, as well as credit analysis of issuers, counterparties and guarantors. Further, the Board considered that Fidelity's investment professionals have sufficient access to global information and data so as to provide competitive investment results over time, and that those professionals also have access to sophisticated tools that permit them to assess portfolio construction and risk and performance attribution characteristics continuously, as well as to transmit new information and research conclusions rapidly around the world. Additionally, in its deliberations, the Board considered Fidelity's trading, risk management, and compliance capabilities and resources, which are integral parts of the investment management process.Shareholder and Administrative Services. The Board considered (i) the nature, extent, quality, and cost of advisory, administrative, and shareholder services performed by FMR, the sub-advisers (together with FMR, the Investment Advisers), and their affiliates under the Advisory Contracts and under separate agreements covering transfer agency, pricing and bookkeeping, and securities lending services for the fund; (ii) the nature and extent of the supervision of third party service providers, principally custodians and subcustodians; and (iii) the resources devoted to, and the record of compliance with, the fund's compliance policies and procedures. The Board also reviewed the allocation of fund brokerage, including allocations to brokers affiliated with the Investment Advisers, the use of brokerage commissions to pay fund expenses, and the use of "soft" commission dollars to pay for research services.The Board noted that the growth of fund assets over time across the complex allows Fidelity to reinvest in the development of services designed to enhance the value or convenience of the Fidelity funds as investment vehicles. These services include 24-hour access to account information and market information through telephone representatives and over the Internet, investor education materials and asset allocation tools, and the expanded availability of Fidelity Investor Centers.In 2014, the Board formed an ad hoc Committee on Transfer Agency Fees to review the variety of transfer agency fee structures throughout the industry and Fidelity's competitive positioning with respect to industry participants.Investment in a Large Fund Family. The Board considered the benefits to shareholders of investing in a Fidelity fund, including the benefits of investing in a fund that is part of a large family of funds offering a variety of investment disciplines and providing a large variety of mutual fund investor services. The Board noted that Fidelity had taken, or had made recommendations that resulted in the Fidelity funds taking, a number of actions over the previous year that benefited particular funds, including (i) continuing to dedicate additional resources to investment research and to the support of the senior management team that oversees asset management; (ii) continuing efforts to enhance Fidelity's global research capabilities; (iii) launching new funds and making other enhancements to meet client needs; (iv) reducing management fees and total expenses for certain index funds and diversified international funds; (v) continuing to launch dedicated lower cost underlying funds to meet portfolio construction needs related to expanding underlying fund options for Fidelity funds of funds, specifically for the Freedom Fund product lines; (vi) rationalizing product lines and gaining increased efficiencies through fund mergers; (vii) launching active fixed-income exchange-traded funds; (viii) continuing to develop, acquire and implement systems and technology to improve services to the funds and information security and to increase efficiency; (ix) implementing investment enhancements to further strengthen Fidelity's target date product line to increase investors' probability of success in achieving their goals; (x) modifying the eligibility criteria for certain share classes to accommodate roll-over assets from employer-sponsored retirement plans; (xi) launching a new Class W of the Freedom Index Funds to attract and retain Fidelity record-kept retirement plan assets; and (xii) implementing changes to Fidelity's money market product line in response to recent money market regulatory reforms.Investment Performance. The Board considered whether the fund has operated in accordance with its investment objective, as well as its record of compliance with its investment restrictions and its performance history. The Board noted that there were portfolio management changes for the fund in January 2013, April 2013, October 2013, and September 2014.The Board took into account discussions with representatives of the Investment Advisers about fund investment performance that occur at Board meetings throughout the year. In this regard the Board noted that as part of regularly scheduled fund reviews and other reports to the Board on fund performance, the Board considers annualized return information for the fund, for different time periods, measured against a securities market index ("benchmark index") and a peer group of funds with similar objectives ("peer group"), if any. In its evaluation of fund investment performance, the Board gave particular attention to information indicating changes in performance of certain Fidelity funds for specific time periods and discussed with the Investment Advisers the reasons for any overperformance or underperformance.In addition to reviewing absolute and relative fund performance, the Independent Trustees periodically consider the appropriateness of fund performance metrics in evaluating the results achieved. In general, the Independent Trustees believe that fund performance should be evaluated based on net performance (after fees and expenses) of both the highest performing and lowest performing fund share classes, where applicable, compared to appropriate benchmark indices, over appropriate time periods that may include full market cycles, and compared to peer groups, as applicable, over the same periods, taking into account relevant factors including the following: general market conditions; issuer-specific information; and fund cash flows and other factors.The Independent Trustees recognize that shareholders evaluate performance on a net basis over their own holding periods, for which one-, three-, and five-year periods are often used as a proxy. For this reason, the performance information reviewed by the Board also included net cumulative calendar year total return information for the fund and an appropriate benchmark index and peer group for the most recent one-, three-, and five-year periods, as shown below. Returns are shown compared to the 25th percentile (top of box, 75% beaten) and 75th percentile (bottom of box, 25% beaten) of the peer universe.Fidelity Stock Selector Small Cap Fund
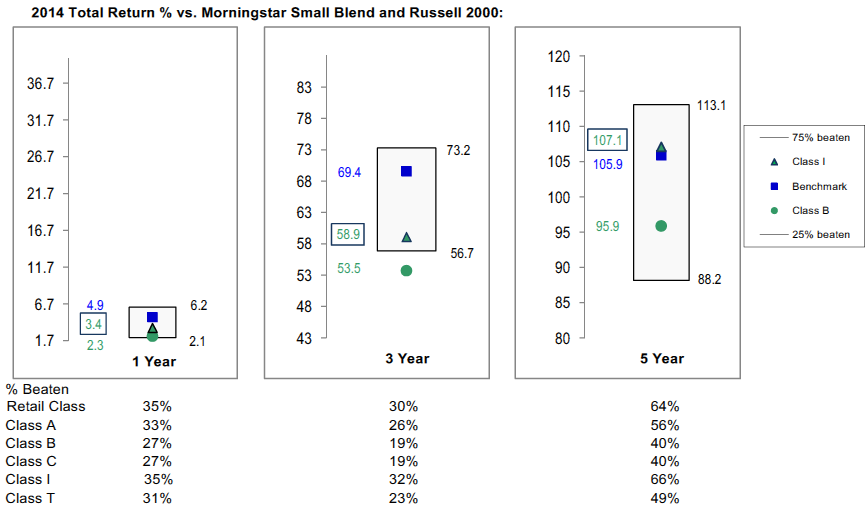
Fidelity Stock Selector Small Cap Fund
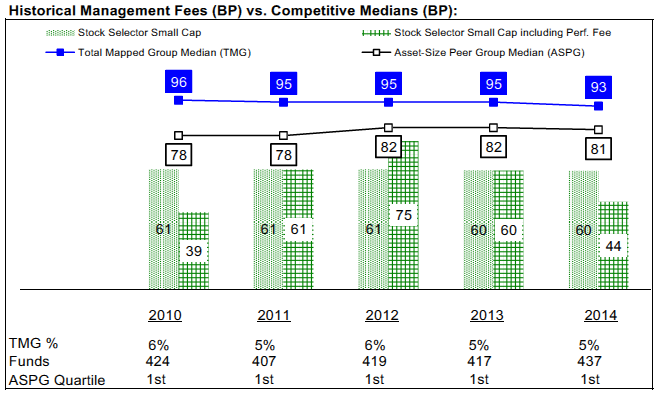
![]()
Corporate Headquarters
245 Summer St.
Boston, MA 02210
www.fidelity.com
SCS-ANN-1215
1.703160.118
Fidelity® Capital Appreciation Fund Annual Report October 31, 2015 |
|
Contents
Board Approval of Investment Advisory Contracts and Management Fees |
To view a fund's proxy voting guidelines and proxy voting record for the 12-month period ended June 30, visit http://www.fidelity.com/proxyvotingresults or visit the Securities and Exchange Commission's (SEC) web site at http://www.sec.gov.
You may also call 1-800-544-8544 to request a free copy of the proxy voting guidelines.
Standard & Poor's, S&P and S&P 500 are registered service marks of The McGraw-Hill Companies, Inc. and have been licensed for use by Fidelity Distributors Corporation.
Other third-party marks appearing herein are the property of their respective owners.
All other marks appearing herein are registered or unregistered trademarks or service marks of FMR LLC or an affiliated company. © 2015 FMR LLC. All rights reserved.
This report and the financial statements contained herein are submitted for the general information of the shareholders of the Fund. This report is not authorized for distribution to prospective investors in the Fund unless preceded or accompanied by an effective prospectus.
A fund files its complete schedule of portfolio holdings with the SEC for the first and third quarters of each fiscal year on Form N-Q. Forms N-Q are available on the SEC’s web site at http://www.sec.gov. A fund's Forms N-Q may be reviewed and copied at the SEC’s Public Reference Room in Washington, DC. Information regarding the operation of the SEC's Public Reference Room may be obtained by calling 1-800-SEC-0330.
For a complete list of a fund's portfolio holdings, view the most recent holdings listing, semiannual report, or annual report on Fidelity's web site at http://www.fidelity.com, http://www.advisor.fidelity.com, or http://www.401k.com, as applicable.
NOT FDIC INSURED •MAY LOSE VALUE •NO BANK GUARANTEE
Neither the Fund nor Fidelity Distributors Corporation is a bank.
Performance: The Bottom Line
Average annual total return reflects the change in the value of an investment, assuming reinvestment of distributions from dividend income and capital gains (the profits earned upon the sale of securities that have grown in value, if any) and assuming a constant rate of performance each year.
The hypothetical investment and the average annual total returns do not reflect the deduction of taxes that a shareholder would pay on fund distributions or the redemption of fund shares.
During periods of reimbursement by Fidelity, a fund’s total return will be greater than it would be had the reimbursement not occurred.
How a fund did yesterday is no guarantee of how it will do tomorrow.
Average Annual Total Returns
| For the periods ended October 31, 2015 | Past 1 year | Past 5 years | Past 10 years |
| Fidelity® Capital Appreciation Fund | 3.50% | 14.27% | 8.51% |
$10,000 Over 10 Years
Let's say hypothetically that $10,000 was invested in Fidelity® Capital Appreciation Fund, a class of the fund, on October 31, 2005.
The chart shows how the value of your investment would have changed, and also shows how the S&P 500® Index performed over the same period.
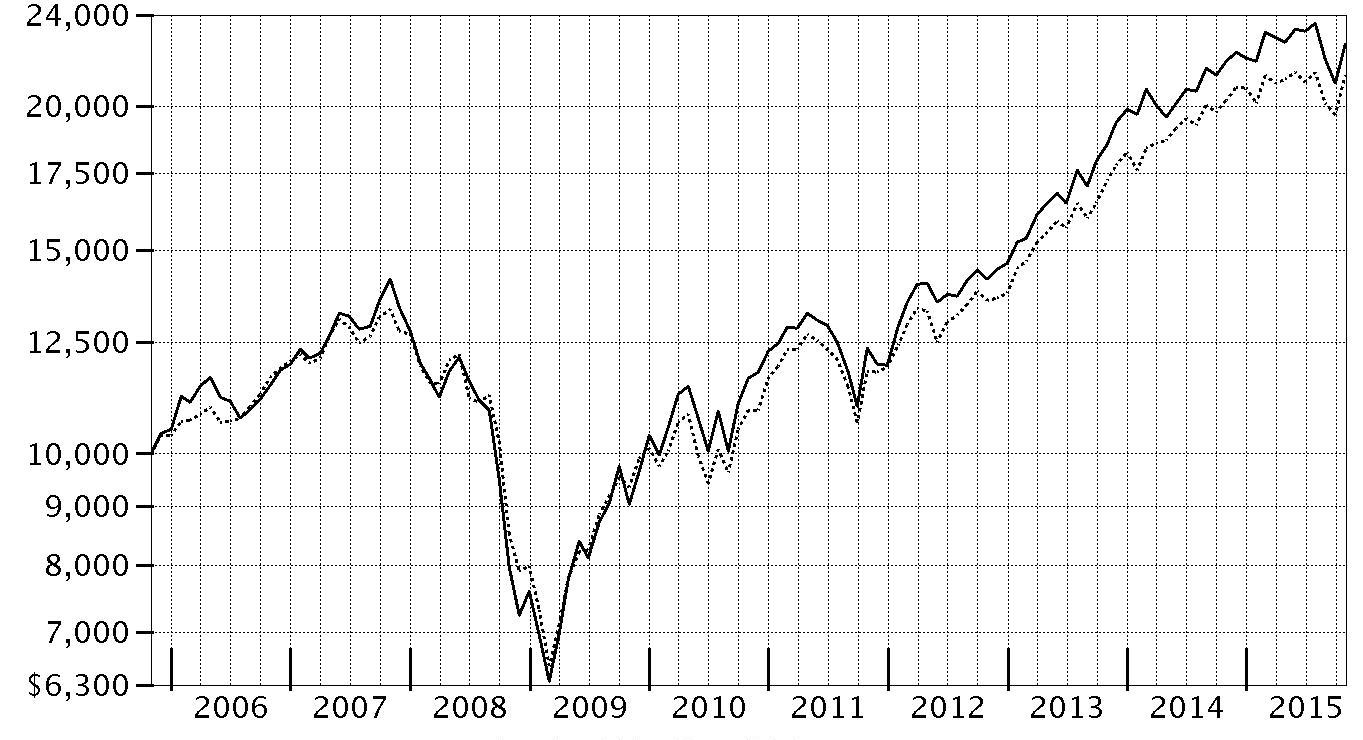
| Period Ending Values | ||
| $22,641 | Fidelity® Capital Appreciation Fund | |
| $21,289 | S&P 500® Index | |
Management's Discussion of Fund Performance
Market Recap: U.S. stocks gained moderately for the 12 months ending October 31, 2015, helped by a strong October that largely erased a steep decline in August and September on concern about slowing global economic growth emanating from China. Stocks benefited late in the period amid waning expectations for a near-term interest-rate hike by the U.S. Federal Reserve, additional economic stimulus in Europe and an interest-rate cut in China. The large-cap S&P 500® index advanced 5.20% for the period, with growth stocks in the index significantly outpacing value stocks, as investors continued to seek growth in a subpar economic environment. The growth-oriented Nasdaq Composite Index® also benefited, gaining 10.39%, while the small-cap Russell 2000® Index lost its edge, returning only 0.34%, as risk appetites waned. Among sectors in the widely followed S&P 500®, consumer discretionary (+21%) led the way, benefiting from a combination of rising personal income and still-benign inflation. Technology (+11%) and consumer staples (+9%) also outpaced the index. Conversely, energy (-19%) performed worst, in an environment of depressed commodity prices that also hit materials (-4%). At period end, investors remained focused on the potential global implications of a relatively stronger U.S. dollar and how China’s transition toward a consumption-led economy may affect corporate earnings.Comments from Portfolio Manager Fergus Shiel: For the year, the fund’s share classes posted modest single-digit gains, lagging the benchmark S&P 500® index. One factor holding back the fund’s return versus the benchmark was its large allocation to pharmaceuticals, biotechnology & life sciences, a group that suffered a sharp correction. Against this backdrop, the three biggest detractors from relative performance were non-benchmark pharma/biotech holdings: Pacira Pharmaceuticals, Ireland-based Jazz Pharmaceuticals and Medivation. Positioning in the software & services area of information technology also worked against the fund’s relative result. Here, the largest detractor was index component Microsoft, which we owned for only part of the period. Conversely, a sizable underweighting in the weak-performing energy sector was a noteworthy positive. At the stock level, coffee chain Starbucks, a longtime overweighting for the fund, was by far the fund’s largest contributor. Other contributors included medical device maker Boston Scientific and Paddy Power, a Dublin-based international sports-betting and gaming company that was not in our benchmark. I significantly reduced our positions in the first two contributors and sold the third. Thanks in part to Paddy Power, the fund’s foreign exposure helped performance despite the headwind of a stronger U.S. dollar.The views expressed above reflect those of the portfolio manager(s) only through the end of the period as stated on the cover of this report and do not necessarily represent the views of Fidelity or any other person in the Fidelity organization. Any such views are subject to change at any time based upon market or other conditions and Fidelity disclaims any responsibility to update such views. These views may not be relied on as investment advice and, because investment decisions for a Fidelity fund are based on numerous factors, may not be relied on as an indication of trading intent on behalf of any Fidelity fund.
Investment Summary (Unaudited)
Top Ten Stocks as of October 31, 2015
| % of fund's net assets | % of fund's net assets 6 months ago | |
| Gilead Sciences, Inc. | 7.8 | 7.0 |
| Celgene Corp. | 5.5 | 4.7 |
| Las Vegas Sands Corp. | 4.3 | 1.9 |
| Amgen, Inc. | 3.0 | 3.8 |
| Home Depot, Inc. | 2.8 | 2.1 |
| Ameriprise Financial, Inc. | 2.7 | 4.2 |
| Adobe Systems, Inc. | 2.5 | 1.4 |
| E*TRADE Financial Corp. | 2.3 | 1.9 |
| Ford Motor Co. | 2.1 | 2.0 |
| JPMorgan Chase & Co. | 2.0 | 2.1 |
| 35.0 |
Top Five Market Sectors as of October 31, 2015
| % of fund's net assets | % of fund's net assets 6 months ago | |
| Consumer Discretionary | 30.3 | 22.1 |
| Health Care | 28.9 | 33.6 |
| Financials | 16.6 | 17.2 |
| Information Technology | 9.5 | 9.2 |
| Industrials | 6.6 | 4.4 |
Asset Allocation (% of fund's net assets)
| As of October 31, 2015 * | ||
| Stocks | 99.0% | |
| Short-Term Investments and Net Other Assets (Liabilities) | 1.0% | |

* Foreign investments 12.7%
| As of April 30, 2015 * | ||
| Stocks | 92.5% | |
| Short-Term Investments and Net Other Assets (Liabilities) | 7.5% | |

* Foreign investments 11.0%
Investments October 31, 2015
Showing Percentage of Net Assets
| Common Stocks - 99.0% | |||
| Shares | Value (000s) | ||
| CONSUMER DISCRETIONARY - 30.3% | |||
| Automobiles - 3.0% | |||
| Ford Motor Co. | 11,942,690 | $176,871 | |
| Suzuki Motor Corp. | 1,055,800 | 34,571 | |
| Tesla Motors, Inc. (a) | 185,000 | 38,282 | |
| 249,724 | |||
| Hotels, Restaurants & Leisure - 8.4% | |||
| Dalata Hotel Group PLC (a) | 5,773,760 | 28,698 | |
| Las Vegas Sands Corp. | 7,331,396 | 362,977 | |
| Starbucks Corp. | 1,778,748 | 111,296 | |
| Whitbread PLC | 1,885,561 | 144,351 | |
| Wyndham Worldwide Corp. | 699,458 | 56,901 | |
| 704,223 | |||
| Household Durables - 0.8% | |||
| Cairn Homes PLC (a)(b) | 25,671,100 | 28,512 | |
| Tempur Sealy International, Inc. (a) | 515,609 | 40,135 | |
| 68,647 | |||
| Internet & Catalog Retail - 1.9% | |||
| Amazon.com, Inc. (a) | 263,150 | 164,706 | |
| Leisure Products - 1.7% | |||
| Polaris Industries, Inc. (c) | 1,263,004 | 141,886 | |
| Media - 4.1% | |||
| Altice NV Class A (a) | 1,947,170 | 33,724 | |
| Havas SA | 4,175,200 | 36,225 | |
| Interpublic Group of Companies, Inc. | 3,912,294 | 89,709 | |
| ITV PLC | 9,348,600 | 36,375 | |
| The Walt Disney Co. | 1,282,185 | 145,836 | |
| 341,869 | |||
| Multiline Retail - 1.7% | |||
| Dillard's, Inc. Class A (c) | 607,725 | 54,379 | |
| Dollar General Corp. | 89,699 | 6,079 | |
| JC Penney Corp., Inc. (a)(c) | 9,197,478 | 84,341 | |
| 144,799 | |||
| Specialty Retail - 8.7% | |||
| AutoZone, Inc. (a) | 203,827 | 159,884 | |
| Home Depot, Inc. | 1,902,300 | 235,200 | |
| L Brands, Inc. | 398,220 | 38,221 | |
| Ross Stores, Inc. | 608,400 | 30,773 | |
| TJX Companies, Inc. | 1,466,515 | 107,334 | |
| Ulta Salon, Cosmetics & Fragrance, Inc. (a) | 515,354 | 89,651 | |
| Williams-Sonoma, Inc. | 1,023,000 | 75,446 | |
| 736,509 | |||
| TOTAL CONSUMER DISCRETIONARY | 2,552,363 | ||
| CONSUMER STAPLES - 2.5% | |||
| Tobacco - 2.5% | |||
| Altria Group, Inc. | 827,500 | 50,039 | |
| Imperial Tobacco Group PLC | 1,491,119 | 80,432 | |
| Reynolds American, Inc. | 1,615,525 | 78,062 | |
| 208,533 | |||
| ENERGY - 2.2% | |||
| Energy Equipment & Services - 0.3% | |||
| Schlumberger Ltd. | 329,301 | 25,738 | |
| Oil, Gas & Consumable Fuels - 1.9% | |||
| Anadarko Petroleum Corp. | 151,995 | 10,165 | |
| Apache Corp. | 233,700 | 11,014 | |
| Chevron Corp. | 223,900 | 20,348 | |
| Cimarex Energy Co. | 62,137 | 7,336 | |
| Concho Resources, Inc. (a) | 58,800 | 6,816 | |
| ConocoPhillips Co. | 360,300 | 19,222 | |
| Devon Energy Corp. | 233,700 | 9,799 | |
| EOG Resources, Inc. | 179,300 | 15,393 | |
| Exxon Mobil Corp. | 311,600 | 25,782 | |
| Pioneer Natural Resources Co. | 68,200 | 9,353 | |
| Southwestern Energy Co. (a) | 1,070,700 | 11,821 | |
| Whiting Petroleum Corp. (a) | 710,500 | 12,242 | |
| 159,291 | |||
| TOTAL ENERGY | 185,029 | ||
| FINANCIALS - 16.6% | |||
| Banks - 2.7% | |||
| Citigroup, Inc. | 1,106,771 | 58,847 | |
| JPMorgan Chase & Co. | 2,663,600 | 171,136 | |
| 229,983 | |||
| Capital Markets - 8.9% | |||
| Ameriprise Financial, Inc. | 1,963,531 | 226,513 | |
| BlackRock, Inc. Class A | 227,716 | 80,149 | |
| Charles Schwab Corp. | 1,523,493 | 46,497 | |
| E*TRADE Financial Corp. (a) | 6,919,987 | 197,289 | |
| Goldman Sachs Group, Inc. | 787,612 | 147,677 | |
| Morgan Stanley | 1,666,700 | 54,951 | |
| 753,076 | |||
| Diversified Financial Services - 4.5% | |||
| CME Group, Inc. | 1,589,744 | 150,183 | |
| McGraw Hill Financial, Inc. | 1,705,895 | 158,034 | |
| Moody's Corp. | 758,037 | 72,893 | |
| 381,110 | |||
| Insurance - 0.5% | |||
| ACE Ltd. | 146,000 | 16,577 | |
| Progressive Corp. | 146,000 | 4,837 | |
| The Travelers Companies, Inc. | 146,000 | 16,482 | |
| 37,896 | |||
| TOTAL FINANCIALS | 1,402,065 | ||
| HEALTH CARE - 28.9% | |||
| Biotechnology - 21.9% | |||
| Actelion Ltd. | 791,990 | 110,091 | |
| Amgen, Inc. | 1,608,523 | 254,436 | |
| Baxalta, Inc. | 1,067,549 | 36,788 | |
| Biogen, Inc. (a) | 400,116 | 116,238 | |
| BioMarin Pharmaceutical, Inc. (a) | 354,495 | 41,490 | |
| Celgene Corp. (a) | 3,764,391 | 461,928 | |
| Gilead Sciences, Inc. | 6,059,478 | 655,209 | |
| Medivation, Inc. (a) | 3,997,526 | 168,136 | |
| 1,844,316 | |||
| Health Care Equipment & Supplies - 1.2% | |||
| Boston Scientific Corp. (a) | 3,267,369 | 59,728 | |
| Intuitive Surgical, Inc. (a) | 82,990 | 41,213 | |
| 100,941 | |||
| Pharmaceuticals - 5.8% | |||
| Allergan PLC (a) | 410,636 | 126,669 | |
| Astellas Pharma, Inc. | 3,469,200 | 50,354 | |
| Cardiome Pharma Corp. (a) | 611,563 | 5,003 | |
| Jazz Pharmaceuticals PLC (a) | 1,094,010 | 150,186 | |
| Johnson & Johnson | 671,800 | 67,872 | |
| Pacira Pharmaceuticals, Inc. (a)(c) | 1,617,583 | 80,798 | |
| The Medicines Company (a) | 301,320 | 10,317 | |
| 491,199 | |||
| TOTAL HEALTH CARE | 2,436,456 | ||
| INDUSTRIALS - 6.6% | |||
| Aerospace & Defense - 1.5% | |||
| General Dynamics Corp. | 86,647 | 12,874 | |
| Lockheed Martin Corp. | 207,987 | 45,722 | |
| Northrop Grumman Corp. | 214,200 | 40,216 | |
| Raytheon Co. | 146,000 | 17,140 | |
| Textron, Inc. | 146,000 | 6,157 | |
| United Technologies Corp. | 68,100 | 6,702 | |
| 128,811 | |||
| Air Freight & Logistics - 0.2% | |||
| United Parcel Service, Inc. Class B | 175,200 | 18,049 | |
| Airlines - 0.9% | |||
| Ryanair Holdings PLC sponsored ADR | 996,742 | 77,935 | |
| Electrical Equipment - 0.5% | |||
| Acuity Brands, Inc. | 105,997 | 23,171 | |
| Eaton Corp. PLC | 282,300 | 15,783 | |
| 38,954 | |||
| Industrial Conglomerates - 2.3% | |||
| 3M Co. | 292,100 | 45,921 | |
| General Electric Co. | 5,172,868 | 149,599 | |
| 195,520 | |||
| Machinery - 0.7% | |||
| Pentair PLC | 214,200 | 11,978 | |
| Wabtec Corp. | 547,054 | 45,334 | |
| 57,312 | |||
| Road & Rail - 0.4% | |||
| Norfolk Southern Corp. | 350,500 | 28,051 | |
| Trading Companies & Distributors - 0.1% | |||
| HD Supply Holdings, Inc. (a) | 292,100 | 8,702 | |
| TOTAL INDUSTRIALS | 553,334 | ||
| INFORMATION TECHNOLOGY - 9.5% | |||
| Electronic Equipment & Components - 0.1% | |||
| CDW Corp. | 194,700 | 8,701 | |
| Internet Software & Services - 3.7% | |||
| Alphabet, Inc. Class A (a) | 166,748 | 122,958 | |
| Facebook, Inc. Class A (a) | 1,529,700 | 155,984 | |
| Twitter, Inc. (a) | 973,600 | 27,709 | |
| 306,651 | |||
| IT Services - 0.7% | |||
| PayPal Holdings, Inc. (a) | 1,670,147 | 60,142 | |
| Semiconductors & Semiconductor Equipment - 0.5% | |||
| Intel Corp. | 1,314,400 | 44,506 | |
| Software - 4.5% | |||
| Adobe Systems, Inc. (a) | 2,372,760 | 210,369 | |
| FireEye, Inc. (a)(c) | 641,401 | 16,773 | |
| Microsoft Corp. | 2,946,700 | 155,114 | |
| 382,256 | |||
| TOTAL INFORMATION TECHNOLOGY | 802,256 | ||
| MATERIALS - 2.4% | |||
| Chemicals - 2.4% | |||
| Celanese Corp. Class A | 204,500 | 14,530 | |
| CF Industries Holdings, Inc. | 815,983 | 41,427 | |
| E.I. du Pont de Nemours & Co. | 940,650 | 59,637 | |
| LyondellBasell Industries NV Class A | 233,700 | 21,713 | |
| Potash Corp. of Saskatchewan, Inc. | 1,361,860 | 27,579 | |
| PPG Industries, Inc. | 132,700 | 13,835 | |
| The Dow Chemical Co. | 486,800 | 25,153 | |
| 203,874 | |||
| Metals & Mining - 0.0% | |||
| Silver Standard Resources, Inc. (a) | 194,700 | 1,342 | |
| TOTAL MATERIALS | 205,216 | ||
| TOTAL COMMON STOCKS | |||
| (Cost $6,952,089) | 8,345,252 | ||
| Money Market Funds - 3.2% | |||
| Fidelity Cash Central Fund, 0.18% (d) | 102,778,820 | 102,779 | |
| Fidelity Securities Lending Cash Central Fund, 0.19% (d)(e) | 170,673,300 | 170,673 | |
| TOTAL MONEY MARKET FUNDS | |||
| (Cost $273,452) | 273,452 | ||
| TOTAL INVESTMENT PORTFOLIO - 102.2% | |||
| (Cost $7,225,541) | 8,618,704 | ||
| NET OTHER ASSETS (LIABILITIES) - (2.2)% | (188,768) | ||
| NET ASSETS - 100% | $8,429,936 |
Legend
(a) Non-income producing
(b) Affiliated company
(c) Security or a portion of the security is on loan at period end.
(d) Affiliated fund that is generally available only to investment companies and other accounts managed by Fidelity Investments. The rate quoted is the annualized seven-day yield of the fund at period end. A complete unaudited listing of the fund's holdings as of its most recent quarter end is available upon request. In addition, each Fidelity Central Fund's financial statements, which are not covered by the Fund's Report of Independent Registered Public Accounting Firm, are available on the SEC's website or upon request.
(e) Investment made with cash collateral received from securities on loan.
Affiliated Central Funds
Information regarding fiscal year to date income earned by the Fund from investments in Fidelity Central Funds is as follows:
| Fund | Income earned |
| (Amounts in thousands) | |
| Fidelity Cash Central Fund | $746 |
| Fidelity Securities Lending Cash Central Fund | 1,286 |
| Total | $2,032 |
Other Affiliated Issuers
An affiliated company is a company in which the Fund has ownership of at least 5% of the voting securities. Fiscal year to date transactions with companies which are or were affiliates are as follows:
| Affiliate (Amounts in thousands) | Value, beginning of period | Purchases | Sales Proceeds | Dividend Income | Value, end of period |
| Cairn Homes PLC | $-- | $29,084 | $-- | $-- | $28,512 |
| Oxford Industries, Inc. | 52,998 | -- | 57,067 | 188 | -- |
| Total | $52,998 | $29,084 | $57,067 | $188 | $28,512 |
Investment Valuation
The following is a summary of the inputs used, as of October 31, 2015, involving the Fund's assets and liabilities carried at fair value. The inputs or methodology used for valuing securities may not be an indication of the risk associated with investing in those securities. For more information on valuation inputs, and their aggregation into the levels used below, please refer to the Investment Valuation section in the accompanying Notes to Financial Statements.
| Valuation Inputs at Reporting Date: | ||||
| Description | Total | Level 1 | Level 2 | Level 3 |
| (Amounts in thousands) | ||||
| Investments in Securities: | ||||
| Equities: | ||||
| Consumer Discretionary | $2,552,363 | $2,517,792 | $34,571 | $-- |
| Consumer Staples | 208,533 | 208,533 | -- | -- |
| Energy | 185,029 | 185,029 | -- | -- |
| Financials | 1,402,065 | 1,402,065 | -- | -- |
| Health Care | 2,436,456 | 2,386,102 | 50,354 | -- |
| Industrials | 553,334 | 553,334 | -- | -- |
| Information Technology | 802,256 | 802,256 | -- | -- |
| Materials | 205,216 | 205,216 | -- | -- |
| Money Market Funds | 273,452 | 273,452 | -- | -- |
| Total Investments in Securities: | $8,618,704 | $8,533,779 | $84,925 | $-- |
Other Information
Distribution of investments by country or territory of incorporation, as a percentage of Total Net Assets, is as follows (Unaudited):
| United States of America | 87.3% |
| Ireland | 5.3% |
| United Kingdom | 3.2% |
| Switzerland | 1.5% |
| Japan | 1.0% |
| Others (Individually Less Than 1%) | 1.7% |
| 100.0% |
See accompanying notes which are an integral part of the financial statements.
Financial Statements
Statement of Assets and Liabilities
| Amounts in thousands (except per-share amounts) | October 31, 2015 | |
| Assets | ||
| Investment in securities, at value (including securities loaned of $165,486) — See accompanying schedule: Unaffiliated issuers (cost $6,923,005) | $8,316,740 | |
| Fidelity Central Funds (cost $273,452) | 273,452 | |
| Other affiliated issuers (cost $29,084) | 28,512 | |
| Total Investments (cost $7,225,541) | $8,618,704 | |
| Receivable for investments sold | 240,104 | |
| Receivable for fund shares sold | 13,909 | |
| Dividends receivable | 9,122 | |
| Distributions receivable from Fidelity Central Funds | 175 | |
| Prepaid expenses | 24 | |
| Other receivables | 272 | |
| Total assets | 8,882,310 | |
| Liabilities | ||
| Payable for investments purchased | $257,866 | |
| Payable for fund shares redeemed | 18,502 | |
| Accrued management fee | 4,196 | |
| Other affiliated payables | 966 | |
| Other payables and accrued expenses | 171 | |
| Collateral on securities loaned, at value | 170,673 | |
| Total liabilities | 452,374 | |
| Net Assets | $8,429,936 | |
| Net Assets consist of: | ||
| Paid in capital | $6,102,772 | |
| Undistributed net investment income | 44,842 | |
| Accumulated undistributed net realized gain (loss) on investments and foreign currency transactions | 889,187 | |
| Net unrealized appreciation (depreciation) on investments and assets and liabilities in foreign currencies | 1,393,135 | |
| Net Assets | $8,429,936 | |
| Capital Appreciation: | ||
| Net Asset Value, offering price and redemption price per share ($5,906,402 ÷ 159,513 shares) | $37.03 | |
| Class K: | ||
| Net Asset Value, offering price and redemption price per share ($2,523,534 ÷ 68,003 shares) | $37.11 |
See accompanying notes which are an integral part of the financial statements.
Statement of Operations
| Amounts in thousands | Year ended October 31, 2015 | |
| Investment Income | ||
| Dividends (including $188 earned from other affiliated issuers) | $125,043 | |
| Income from Fidelity Central Funds | 2,032 | |
| Total income | 127,075 | |
| Expenses | ||
| Management fee | ||
| Basic fee | $47,991 | |
| Performance adjustment | 9,395 | |
| Transfer agent fees | 10,872 | |
| Accounting and security lending fees | 1,257 | |
| Custodian fees and expenses | 155 | |
| Independent trustees' compensation | 37 | |
| Registration fees | 122 | |
| Audit | 73 | |
| Legal | 28 | |
| Miscellaneous | 59 | |
| Total expenses before reductions | 69,989 | |
| Expense reductions | (688) | 69,301 |
| Net investment income (loss) | 57,774 | |
| Realized and Unrealized Gain (Loss) | ||
| Net realized gain (loss) on: | ||
| Investment securities: | ||
| Unaffiliated issuers | 962,293 | |
| Other affiliated issuers | 27,384 | |
| Foreign currency transactions | (324) | |
| Total net realized gain (loss) | 989,353 | |
| Change in net unrealized appreciation (depreciation) on: Investment securities | (743,659) | |
| Assets and liabilities in foreign currencies | 4 | |
| Total change in net unrealized appreciation (depreciation) | (743,655) | |
| Net gain (loss) | 245,698 | |
| Net increase (decrease) in net assets resulting from operations | $303,472 |
See accompanying notes which are an integral part of the financial statements.
Statement of Changes in Net Assets
| Amounts in thousands | Year ended October 31, 2015 | Year ended October 31, 2014 |
| Increase (Decrease) in Net Assets | ||
| Operations | ||
| Net investment income (loss) | $57,774 | $26,312 |
| Net realized gain (loss) | 989,353 | 989,698 |
| Change in net unrealized appreciation (depreciation) | (743,655) | 340,038 |
| Net increase (decrease) in net assets resulting from operations | 303,472 | 1,356,048 |
| Distributions to shareholders from net investment income | (24,987) | (33,391) |
| Distributions to shareholders from net realized gain | (877,095) | (749,339) |
| Total distributions | (902,082) | (782,730) |
| Share transactions - net increase (decrease) | 437,305 | (27,628) |
| Total increase (decrease) in net assets | (161,305) | 545,690 |
| Net Assets | ||
| Beginning of period | 8,591,241 | 8,045,551 |
| End of period (including undistributed net investment income of $44,842 and undistributed net investment income of $16,540, respectively) | $8,429,936 | $8,591,241 |
See accompanying notes which are an integral part of the financial statements.
Financial Highlights — Fidelity Capital Appreciation Fund
| Years ended October 31, | 2015 | 2014 | 2013 | 2012 | 2011 |
| Selected Per–Share Data | |||||
| Net asset value, beginning of period | $39.82 | $37.30 | $29.21 | $25.51 | $24.03 |
| Income from Investment Operations | |||||
| Net investment income (loss)A | .24 | .11 | .19 | .15 | .06 |
| Net realized and unrealized gain (loss) | 1.13 | 6.05 | 8.66 | 3.59 | 1.44 |
| Total from investment operations | 1.37 | 6.16 | 8.85 | 3.74 | 1.50 |
| Distributions from net investment income | (.10) | (.14) | (.17) | (.04) | (.02) |
| Distributions from net realized gain | (4.06) | (3.50) | (.59) | – | – |
| Total distributions | (4.16) | (3.64) | (.76) | (.04) | (.02) |
| Net asset value, end of period | $37.03 | $39.82 | $37.30 | $29.21 | $25.51 |
| Total ReturnB | 3.50% | 17.86% | 31.03% | 14.70% | 6.24% |
| Ratios to Average Net AssetsC,D | |||||
| Expenses before reductions | .83% | .82% | .79% | .96% | .91% |
| Expenses net of fee waivers, if any | .83% | .82% | .79% | .96% | .91% |
| Expenses net of all reductions | .82% | .81% | .77% | .95% | .90% |
| Net investment income (loss) | .63% | .28% | .57% | .53% | .25% |
| Supplemental Data | |||||
| Net assets, end of period (in millions) | $5,906 | $6,132 | $5,920 | $4,678 | $4,319 |
| Portfolio turnover rateE | 126% | 112% | 156% | 169% | 182% |
A Calculated based on average shares outstanding during the period.
B Total returns would have been lower if certain expenses had not been reduced during the applicable periods shown.
C Fees and expenses of any underlying Fidelity Central Funds are not included in the Fund's expense ratio. The Fund indirectly bears its proportionate share of the expenses of any underlying Fidelity Central Funds.
D Expense ratios reflect operating expenses of the class. Expenses before reductions do not reflect amounts reimbursed by the investment adviser or reductions from brokerage service arrangements or reductions from other expense offset arrangements and do not represent the amount paid by the class during periods when reimbursements or reductions occur. Expenses net of fee waivers reflect expenses after reimbursement by the investment adviser but prior to reductions from brokerage service arrangements or other expense offset arrangements. Expenses net of all reductions represent the net expenses paid by the class.
E Amount does not include the portfolio activity of any underlying Fidelity Central Funds.
See accompanying notes which are an integral part of the financial statements.
Financial Highlights — Fidelity Capital Appreciation Fund Class K
| Years ended October 31, | 2015 | 2014 | 2013 | 2012 | 2011 |
| Selected Per–Share Data | |||||
| Net asset value, beginning of period | $39.90 | $37.38 | $29.28 | $25.57 | $24.09 |
| Income from Investment Operations | |||||
| Net investment income (loss)A | .28 | .15 | .23 | .19 | .10 |
| Net realized and unrealized gain (loss) | 1.14 | 6.06 | 8.67 | 3.61 | 1.44 |
| Total from investment operations | 1.42 | 6.21 | 8.90 | 3.80 | 1.54 |
| Distributions from net investment income | (.15) | (.19) | (.21) | (.09) | (.06) |
| Distributions from net realized gain | (4.06) | (3.50) | (.59) | – | – |
| Total distributions | (4.21) | (3.69) | (.80) | (.09) | (.06) |
| Net asset value, end of period | $37.11 | $39.90 | $37.38 | $29.28 | $25.57 |
| Total ReturnB | 3.62% | 17.97% | 31.19% | 14.92% | 6.41% |
| Ratios to Average Net AssetsC,D | |||||
| Expenses before reductions | .72% | .70% | .66% | .81% | .75% |
| Expenses net of fee waivers, if any | .72% | .70% | .66% | .81% | .75% |
| Expenses net of all reductions | .72% | .70% | .63% | .80% | .74% |
| Net investment income (loss) | .74% | .40% | .70% | .68% | .41% |
| Supplemental Data | |||||
| Net assets, end of period (in millions) | $2,524 | $2,460 | $2,125 | $1,438 | $856 |
| Portfolio turnover rateE | 126% | 112% | 156% | 169% | 182% |
A Calculated based on average shares outstanding during the period.
B Total returns would have been lower if certain expenses had not been reduced during the applicable periods shown.
C Fees and expenses of any underlying Fidelity Central Funds are not included in the Fund's expense ratio. The Fund indirectly bears its proportionate share of the expenses of any underlying Fidelity Central Funds.
D Expense ratios reflect operating expenses of the class. Expenses before reductions do not reflect amounts reimbursed by the investment adviser or reductions from brokerage service arrangements or reductions from other expense offset arrangements and do not represent the amount paid by the class during periods when reimbursements or reductions occur. Expenses net of fee waivers reflect expenses after reimbursement by the investment adviser but prior to reductions from brokerage service arrangements or other expense offset arrangements. Expenses net of all reductions represent the net expenses paid by the class.
E Amount does not include the portfolio activity of any underlying Fidelity Central Funds.
See accompanying notes which are an integral part of the financial statements.
Notes to Financial Statements
For the period ended October 31, 2015
(Amounts in thousands except percentages)
1. Organization.
Fidelity Capital Appreciation Fund (the Fund) is a fund of Fidelity Capital Trust (the Trust) and is authorized to issue an unlimited number of shares. The Trust is registered under the Investment Company Act of 1940, as amended (the 1940 Act), as an open-end management investment company organized as a Massachusetts business trust. The Fund offers Capital Appreciation and Class K shares, each of which has equal rights as to assets and voting privileges. Each class has exclusive voting rights with respect to matters that affect that class.
2. Investments in Fidelity Central Funds.
The Fund invests in Fidelity Central Funds, which are open-end investment companies generally available only to other investment companies and accounts managed by the investment adviser and its affiliates. The Fund's Schedule of Investments lists each of the Fidelity Central Funds held as of period end, if any, as an investment of the Fund, but does not include the underlying holdings of each Fidelity Central Fund. As an Investing Fund, the Fund indirectly bears its proportionate share of the expenses of the underlying Fidelity Central Funds.
The Money Market Central Funds seek preservation of capital and current income and are managed by Fidelity Investments Money Management, Inc. (FIMM), an affiliate of the investment adviser. Annualized expenses of the Money Market Central Funds as of their most recent shareholder report date are less than .005%.
A complete unaudited list of holdings for each Fidelity Central Fund is available upon request or at the Securities and Exchange Commission (the SEC) website at www.sec.gov. In addition, the financial statements of the Fidelity Central Funds, which are not covered by the Fund's Report of Independent Registered Public Accounting Firm, are available on the SEC website or upon request.
3. Significant Accounting Policies.
The financial statements have been prepared in conformity with accounting principles generally accepted in the United States of America (GAAP), which require management to make certain estimates and assumptions at the date of the financial statements. Actual results could differ from those estimates. Subsequent events, if any, through the date that the financial statements were issued have been evaluated in the preparation of the financial statements. The following summarizes the significant accounting policies of the Fund:
Investment Valuation. Investments are valued as of 4:00 p.m. Eastern time on the last calendar day of the period. The Board of Trustees (the Board) has delegated the day to day responsibility for the valuation of the Fund's investments to the Fidelity Management & Research Company (FMR) Fair Value Committee (the Committee). In accordance with valuation policies and procedures approved by the Board, the Fund attempts to obtain prices from one or more third party pricing vendors or brokers to value its investments. When current market prices, quotations or currency exchange rates are not readily available or reliable, investments will be fair valued in good faith by the Committee, in accordance with procedures adopted by the Board. Factors used in determining fair value vary by investment type and may include market or investment specific events. The frequency with which these procedures are used cannot be predicted and they may be utilized to a significant extent. The Committee oversees the Fund's valuation policies and procedures and reports to the Board on the Committee's activities and fair value determinations. The Board monitors the appropriateness of the procedures used in valuing the Fund's investments and ratifies the fair value determinations of the Committee.
The Fund categorizes the inputs to valuation techniques used to value its investments into a disclosure hierarchy consisting of three levels as shown below:
- Level 1 – quoted prices in active markets for identical investments
- Level 2 – other significant observable inputs (including quoted prices for similar investments, interest rates, prepayment speeds, etc.)
- Level 3 – unobservable inputs (including the Fund's own assumptions based on the best information available)
Valuation techniques used to value the Fund's investments by major category are as follows:
Equity securities, including restricted securities, for which market quotations are readily available, are valued at the last reported sale price or official closing price as reported by a third party pricing vendor on the primary market or exchange on which they are traded and are categorized as Level 1 in the hierarchy. In the event there were no sales during the day or closing prices are not available, securities are valued at the last quoted bid price or may be valued using the last available price and are generally categorized as Level 2 in the hierarchy. For foreign equity securities, when market or security specific events arise, comparisons to the valuation of American Depositary Receipts (ADRs), futures contracts, Exchange-Traded Funds (ETFs) and certain indexes as well as quoted prices for similar securities may be used and would be categorized as Level 2 in the hierarchy. Utilizing these techniques may result in transfers between Level 1 and Level 2. For equity securities, including restricted securities, where observable inputs are limited, assumptions about market activity and risk are used and these securities may be categorized as Level 3 in the hierarchy.
Investments in open-end mutual funds, including the Fidelity Central Funds, are valued at their closing net asset value (NAV) each business day and are categorized as Level 1 in the hierarchy.
Changes in valuation techniques may result in transfers in or out of an assigned level within the disclosure hierarchy. The aggregate value of investments by input level as of October 31, 2015 is included at the end of the Fund's Schedule of Investments.
Foreign Currency. The Fund may use foreign currency contracts to facilitate transactions in foreign-denominated securities. Gains and losses from these transactions may arise from changes in the value of the foreign currency or if the counterparties do not perform under the contracts' terms.
Foreign-denominated assets, including investment securities, and liabilities are translated into U.S. dollars at the exchange rates at period end. Purchases and sales of investment securities, income and dividends received and expenses denominated in foreign currencies are translated into U.S. dollars at the exchange rate in effect on the transaction date.
The effects of exchange rate fluctuations on investments are included with the net realized and unrealized gain (loss) on investment securities. Other foreign currency transactions resulting in realized and unrealized gain (loss) are disclosed separately.
Investment Transactions and Income. For financial reporting purposes, the Fund's investment holdings and NAV include trades executed through the end of the last business day of the period. The NAV per share for processing shareholder transactions is calculated as of the close of business of the New York Stock Exchange (NYSE), normally 4:00 p.m. Eastern time and includes trades executed through the end of the prior business day. Gains and losses on securities sold are determined on the basis of identified cost and may include proceeds received from litigation. Dividend income is recorded on the ex-dividend date, except for certain dividends from foreign securities where the ex-dividend date may have passed, which are recorded as soon as the Fund is informed of the ex-dividend date. Non-cash dividends included in dividend income, if any, are recorded at the fair market value of the securities received. Income and capital gain distributions from Fidelity Central Funds, if any, are recorded on the ex-dividend date. Distributions received on securities that represent a return of capital or capital gain are recorded as a reduction of cost of investments and/or as a realized gain. Subsequent to ex-dividend date the Fund determines the components of these distributions, based upon receipt of tax filings or other correspondence relating to the underlying investment. Investment income is recorded net of foreign taxes withheld where recovery of such taxes is uncertain.
Class Allocations and Expenses. Investment income, realized and unrealized capital gains and losses, common expenses of the Fund, and certain fund-level expense reductions, if any, are allocated daily on a pro-rata basis to each class based on the relative net assets of each class to the total net assets of the Fund. Each class differs with respect to transfer agent fees incurred. Certain expense reductions may also differ by class. For the reporting period, the allocated portion of income and expenses to each class as a percent of its average net assets may vary due to the timing of recording these transactions in relation to fluctuating net assets of the classes. Expenses directly attributable to a fund are charged to that fund. Expenses attributable to more than one fund are allocated among the respective funds on the basis of relative net assets or other appropriate methods. Expense estimates are accrued in the period to which they relate and adjustments are made when actual amounts are known.
Deferred Trustee Compensation. Under a Deferred Compensation Plan (the Plan), independent Trustees may elect to defer receipt of a portion of their annual compensation. Deferred amounts are invested in a cross-section of Fidelity funds, are marked-to-market and remain in the Fund until distributed in accordance with the Plan. The investment of deferred amounts and the offsetting payable to the Trustees are included in the accompanying Statement of Assets and Liabilities.
Income Tax Information and Distributions to Shareholders. Each year, the Fund intends to qualify as a regulated investment company under Subchapter M of the Internal Revenue Code, including distributing substantially all of its taxable income and realized gains. As a result, no provision for U.S. Federal income taxes is required. As of October 31, 2015, the Fund did not have any unrecognized tax benefits in the financial statements; nor is the Fund aware of any tax positions for which it is reasonably possible that the total amounts of unrecognized tax benefits will significantly change in the next twelve months. The Fund files a U.S. federal tax return, in addition to state and local tax returns as required. The Fund's federal income tax returns are subject to examination by the Internal Revenue Service (IRS) for a period of three fiscal years after they are filed. State and local tax returns may be subject to examination for an additional fiscal year depending on the jurisdiction. Foreign taxes are provided for based on the Fund's understanding of the tax rules and rates that exist in the foreign markets in which it invests.
Distributions are declared and recorded on the ex-dividend date. Income dividends and capital gain distributions are declared separately for each class. Income and capital gain distributions are determined in accordance with income tax regulations, which may differ from GAAP. In addition, the Fund claimed a portion of the payment made to redeeming shareholders as a distribution for income tax purposes.
Capital accounts within the financial statements are adjusted for permanent book-tax differences. These adjustments have no impact on net assets or the results of operations. Capital accounts are not adjusted for temporary book-tax differences which will reverse in a subsequent period.
Book-tax differences are primarily due to foreign currency transactions, deferred trustees compensation and losses deferred due to wash sales.
The federal tax cost of investment securities and unrealized appreciation (depreciation) as of period end were as follows:
| Gross unrealized appreciation | $1,580,196 |
| Gross unrealized depreciation | (196,921) |
| Net unrealized appreciation (depreciation) on securities | $1,383,275 |
| Tax Cost | $7,235,429 |
The tax-based components of distributable earnings as of period end were as follows:
| Undistributed ordinary income | $44,868 |
| Undistributed long-term capital gain | $899,075 |
| Net unrealized appreciation (depreciation) on securities and other investments | $1,383,319 |
The tax character of distributions paid was as follows:
| October 31, 2015 | October 31, 2014 | |
| Ordinary Income | $76,670 | $ 372,930 |
| Long-term Capital Gains | 825,412 | 409,800 |
| Total | $902,082 | $ 782,730 |
4. Purchases and Sales of Investments.
Purchases and sales of securities, other than short-term securities, aggregated $10,395,406 and $10,856,820, respectively.
5. Fees and Other Transactions with Affiliates.
Management Fee. Fidelity Management & Research Company (the investment adviser) and its affiliates provide the Fund with investment management related services for which the Fund pays a monthly management fee. The management fee is the sum of an individual fund fee rate that is based on an annual rate of .30% of the Fund's average net assets and an annualized group fee rate that averaged .25% during the period. The group fee rate is based upon the average net assets of all the mutual funds advised by the investment adviser, including any mutual funds previously advised by the investment adviser that are currently advised by Fidelity SelectCo, LLC, an affiliate of the investment adviser. The group fee rate decreases as assets under management increase and increases as assets under management decrease. In addition, the management fee is subject to a performance adjustment (up to a maximum of +/- .20% of the Fund's average net assets over a 36 month performance period). The upward or downward adjustment to the management fee is based on the relative investment performance of Capital Appreciation as compared to its benchmark index, the S&P 500 Index, over the same 36 month performance period. For the reporting period, the total annual management fee rate, including the performance adjustment, was .66% of the Fund's average net assets. The performance adjustment included in the management fee rate may be higher or lower than the maximum performance adjustment rate due to the difference between the average net assets for the reporting and performance periods.
Transfer Agent Fees. Fidelity Investments Institutional Operations Company, Inc., (FIIOC), an affiliate of the investment adviser, is the transfer, dividend disbursing and shareholder servicing agent for each class of the Fund. FIIOC receives account fees and asset-based fees that vary according to the account size and type of account of the shareholders of Capital Appreciation. FIIOC receives an asset-based fee of Class K's average net assets. FIIOC pays for typesetting, printing and mailing of shareholder reports, except proxy statements.
For the period, transfer agent fees for each class were as follows:
| Amount | % of Class-Level Average Net Assets | |
| Capital Appreciation | $9,657 | .16 |
| Class K | 1,215 | .05 |
| $ 10,872 |
Accounting and Security Lending Fees. Fidelity Service Company, Inc. (FSC), an affiliate of the investment adviser, maintains the Fund's accounting records. The accounting fee is based on the level of average net assets for each month. Under a separate contract, FSC administers the security lending program. The security lending fee is based on the number and duration of lending transactions.
Brokerage Commissions. The Fund placed a portion of its portfolio transactions with brokerage firms which are affiliates of the investment adviser. Brokerage commissions are included in net realized gain (loss) and change in net unrealized appreciation (depreciation) in the Statement of Operations. The commissions paid to these affiliated firms were $171 for the period.
6. Committed Line of Credit.
The Fund participates with other funds managed by the investment adviser or an affiliate in a $4.25 billion credit facility (the "line of credit") to be utilized for temporary or emergency purposes to fund shareholder redemptions or for other short-term liquidity purposes. The Fund has agreed to pay commitment fees on its pro-rata portion of the line of credit, which amounted to $13 and is reflected in Miscellaneous expenses on the Statement of Operations. During the period, the Fund did not borrow on this line of credit.
7. Security Lending.
The Fund lends portfolio securities through a lending agent from time to time in order to earn additional income. For equity securities, a lending agent is used and may loan securities to certain qualified borrowers, including Fidelity Capital Markets (FCM), a broker-dealer affiliated with the Fund. On the settlement date of the loan, the Fund receives collateral (in the form of U.S. Treasury obligations, letters of credit and/or cash) against the loaned securities and maintains collateral in an amount not less than 100% of the market value of the loaned securities during the period of the loan. The market value of the loaned securities is determined at the close of business of the Fund and any additional required collateral is delivered to the Fund on the next business day. The Fund or borrower may terminate the loan at any time, and if the borrower defaults on its obligation to return the securities loaned because of insolvency or other reasons, the Fund may apply collateral received from the borrower against the obligation. The Fund may experience delays and costs in recovering the securities loaned. Any cash collateral received is invested in the Fidelity Securities Lending Cash Central Fund. The value of loaned securities and cash collateral at period end are disclosed on the Fund's Statement of Assets and Liabilities. The value of securities loaned to FCM at period end was $2,381. Security lending income represents the income earned on investing cash collateral, less rebates paid to borrowers and any lending agent fees associated with the loan, plus any premium payments received for lending certain types of securities. Security lending income is presented in the Statement of Operations as a component of income from Fidelity Central Funds. Total security lending income during the period amounted to $1,286, including $31 from securities loaned to FCM.
8. Expense Reductions.
Commissions paid to certain brokers with whom the investment adviser, or its affiliates, places trades on behalf of the Fund include an amount in addition to trade execution, which may be rebated back to the Fund to offset certain expenses. This amount totaled $513 for the period.
In addition, through arrangements with the Fund's custodian, credits realized as a result of certain uninvested cash balances were used to reduce the Fund's expenses. During the period, these credits reduced the Fund's custody expenses by $1.
In addition, during the period the investment adviser reimbursed and/or waived a portion of fund-level operating expenses in the amount of $36 and a portion of class-level operating expenses as follows:
| Amount | |
| Capital Appreciation | $138 |
9. Distributions to Shareholders.
Distributions to shareholders of each class were as follows:
| Years ended October 31, | 2015 | 2014 |
| From net investment income | ||
| Capital Appreciation | $15,699 | $22,746 |
| Class K | 9,288 | 10,645 |
| Total | $24,987 | $33,391 |
| From net realized gain | ||
| Capital Appreciation | $624,269 | $552,386 |
| Class K | 252,826 | 196,953 |
| Total | $877,095 | $749,339 |
10. Share Transactions.
Share transactions for each class were as follows and may contain automatic conversions between classes or exchanges between funds:
| Shares | Shares | Dollars | Dollars | |
| Years ended October 31, | 2015 | 2014 | 2015 | 2014 |
| Capital Appreciation | ||||
| Shares sold | 17,374 | 18,813 | $651,570 | $698,436 |
| Reinvestment of distributions | 16,417 | 15,586 | 604,128 | 545,521 |
| Shares redeemed | (28,264) | (39,134) | (1,053,538) | (1,434,918) |
| Net increase (decrease) | 5,527 | (4,735) | $202,160 | $(190,961) |
| Class K | ||||
| Shares sold | 13,762 | 17,919 | $515,116 | $655,739 |
| Reinvestment of distributions | 7,113 | 5,926 | 262,114 | 207,598 |
| Shares redeemed | (14,510) | (19,075) | (542,085) | (700,004) |
| Net increase (decrease) | 6,365 | 4,770 | $235,145 | $163,333 |
11. Other.
The Fund's organizational documents provide former and current trustees and officers with a limited indemnification against liabilities arising in connection with the performance of their duties to the Fund. In the normal course of business, the Fund may also enter into contracts that provide general indemnifications. The Fund's maximum exposure under these arrangements is unknown as this would be dependent on future claims that may be made against the Fund. The risk of material loss from such claims is considered remote.
Report of Independent Registered Public Accounting Firm
To the Trustees of Fidelity Capital Trust and Shareholders of Fidelity® Capital Appreciation Fund:
In our opinion, the accompanying statement of assets and liabilities, including the schedule of investments, and the related statements of operations and of changes in net assets and the financial highlights present fairly, in all material respects, the financial position of Fidelity® Capital Appreciation Fund (a fund of Fidelity Capital Trust) at October 31, 2015, the results of its operations for the year then ended, the changes in its net assets for each of the two years in the period then ended and the financial highlights for each of the five years in the period then ended, in conformity with accounting principles generally accepted in the United States of America. These financial statements and financial highlights (hereafter referred to as “financial statements”) are the responsibility of the Fidelity® Capital Appreciation Fund’s management. Our responsibility is to express an opinion on these financial statements based on our audits. We conducted our audits of these financial statements in accordance with the standards of the Public Company Accounting Oversight Board (United States). Those standards require that we plan and perform the audit to obtain reasonable assurance about whether the financial statements are free of material misstatement. An audit includes examining, on a test basis, evidence supporting the amounts and disclosures in the financial statements, assessing the accounting principles used and significant estimates made by management, and evaluating the overall financial statement presentation. We believe that our audits, which included confirmation of securities at October 31, 2015 by correspondence with the custodian and brokers, provide a reasonable basis for our opinion.
PricewaterhouseCoopers LLP
Boston, Massachusetts
December 16, 2015
Trustees and Officers
The Trustees, Members of the Advisory Board (if any), and officers of the trust and fund, as applicable, are listed below. The Board of Trustees governs the fund and is responsible for protecting the interests of shareholders. The Trustees are experienced executives who meet periodically throughout the year to oversee the fund's activities, review contractual arrangements with companies that provide services to the fund, oversee management of the risks associated with such activities and contractual arrangements, and review the fund's performance. Each of the Trustees oversees 170 funds.
The Trustees hold office without limit in time except that (a) any Trustee may resign; (b) any Trustee may be removed by written instrument, signed by at least two-thirds of the number of Trustees prior to such removal; (c) any Trustee who requests to be retired or who has become incapacitated by illness or injury may be retired by written instrument signed by a majority of the other Trustees; and (d) any Trustee may be removed at any special meeting of shareholders by a two-thirds vote of the outstanding voting securities of the trust. Each Trustee who is not an interested person (as defined in the 1940 Act) of the trust and the fund is referred to herein as an Independent Trustee. Each Independent Trustee shall retire not later than the last day of the calendar year in which his or her 75th birthday occurs. The Independent Trustees may waive this mandatory retirement age policy with respect to individual Trustees. Officers and Advisory Board Members hold office without limit in time, except that any officer or Advisory Board Member may resign or may be removed by a vote of a majority of the Trustees at any regular meeting or any special meeting of the Trustees. Except as indicated, each individual has held the office shown or other offices in the same company for the past five years.
The fund’s Statement of Additional Information (SAI) includes more information about the Trustees. To request a free copy, call Fidelity at 1-800-544-8544.
Experience, Skills, Attributes, and Qualifications of the Trustees. The Governance and Nominating Committee has adopted a statement of policy that describes the experience, qualifications, attributes, and skills that are necessary and desirable for potential Independent Trustee candidates (Statement of Policy). The Board believes that each Trustee satisfied at the time he or she was initially elected or appointed a Trustee, and continues to satisfy, the standards contemplated by the Statement of Policy. The Governance and Nominating Committee also engages professional search firms to help identify potential Independent Trustee candidates who have the experience, qualifications, attributes, and skills consistent with the Statement of Policy. From time to time, additional criteria based on the composition and skills of the current Independent Trustees, as well as experience or skills that may be appropriate in light of future changes to board composition, business conditions, and regulatory or other developments, have also been considered by the professional search firms and the Governance and Nominating Committee. In addition, the Board takes into account the Trustees' commitment and participation in Board and committee meetings, as well as their leadership of standing and ad hoc committees throughout their tenure.
In determining that a particular Trustee was and continues to be qualified to serve as a Trustee, the Board has considered a variety of criteria, none of which, in isolation, was controlling. The Board believes that, collectively, the Trustees have balanced and diverse experience, qualifications, attributes, and skills, which allow the Board to operate effectively in governing the fund and protecting the interests of shareholders. Information about the specific experience, skills, attributes, and qualifications of each Trustee, which in each case led to the Board's conclusion that the Trustee should serve (or continue to serve) as a trustee of the fund, is provided below.
Board Structure and Oversight Function. James C. Curvey is an interested person and currently serves as Chairman. The Trustees have determined that an interested Chairman is appropriate and benefits shareholders because an interested Chairman has a personal and professional stake in the quality and continuity of services provided to the fund. Independent Trustees exercise their informed business judgment to appoint an individual of their choosing to serve as Chairman, regardless of whether the Trustee happens to be independent or a member of management. The Independent Trustees have determined that they can act independently and effectively without having an Independent Trustee serve as Chairman and that a key structural component for assuring that they are in a position to do so is for the Independent Trustees to constitute a substantial majority for the Board. The Independent Trustees also regularly meet in executive session. Ned C. Lautenbach serves as Chairman of the Independent Trustees and as such (i) acts as a liaison between the Independent Trustees and management with respect to matters important to the Independent Trustees and (ii) with management prepares agendas for Board meetings.
Fidelity® funds are overseen by different Boards of Trustees. The fund's Board oversees Fidelity's high income and certain equity funds, and other Boards oversee Fidelity's investment-grade bond, money market, asset allocation, and sector funds. The asset allocation funds may invest in Fidelity® funds overseen by the fund's Board. The use of separate Boards, each with its own committee structure, allows the Trustees of each group of Fidelity® funds to focus on the unique issues of the funds they oversee, including common research, investment, and operational issues. On occasion, the separate Boards establish joint committees to address issues of overlapping consequences for the Fidelity® funds overseen by each Board.
The Trustees operate using a system of committees to facilitate the timely and efficient consideration of all matters of importance to the Trustees, the fund, and fund shareholders and to facilitate compliance with legal and regulatory requirements and oversight of the fund's activities and associated risks. The Board, acting through its committees, has charged FMR and its affiliates with (i) identifying events or circumstances the occurrence of which could have demonstrably adverse effects on the fund's business and/or reputation; (ii) implementing processes and controls to lessen the possibility that such events or circumstances occur or to mitigate the effects of such events or circumstances if they do occur; and (iii) creating and maintaining a system designed to evaluate continuously business and market conditions in order to facilitate the identification and implementation processes described in (i) and (ii) above. Because the day-to-day operations and activities of the fund are carried out by or through FMR, its affiliates, and other service providers, the fund's exposure to risks is mitigated but not eliminated by the processes overseen by the Trustees. While each of the Board's committees has responsibility for overseeing different aspects of the fund's activities, oversight is exercised primarily through the Operations, Audit, and Compliance Committees. In addition, the Independent Trustees have worked with FMR to enhance the Board's oversight of investment and financial risks, legal and regulatory risks, technology risks, and operational risks, including the development of additional risk reporting to the Board. For example, a working group comprised of Independent Trustees and FMR has worked and continues to work to review the Fidelity® funds' valuation-related activities, reporting and risk management. Appropriate personnel, including but not limited to the fund's Chief Compliance Officer (CCO), FMR's internal auditor, the independent accountants, the fund's Treasurer and portfolio management personnel, make periodic reports to the Board's committees, as appropriate, including an annual review of Fidelity's risk management program for the Fidelity® funds. The responsibilities of each standing committee, including their oversight responsibilities, are described further under "Standing Committees of the Trustees."
Interested Trustees*:
Correspondence intended for a Trustee who is an interested person may be sent to Fidelity Investments, 245 Summer Street, Boston, Massachusetts 02210.
Name, Year of Birth; Principal Occupations and Other Relevant Experience+
James C. Curvey (1935)
Year of Election or Appointment: 2007
Trustee
Chairman of the Board of Trustees
Mr. Curvey also serves as Trustee of other Fidelity® funds. Mr. Curvey is a Director of Fidelity Research & Analysis Co. (investment adviser firm, 2009-present), and Vice Chairman (2007-present) and Director of FMR LLC (diversified financial services company). In addition, Mr. Curvey serves as an Overseer for the Boston Symphony Orchestra and a member of the board of Artis-Naples, Naples, Florida, and as a Trustee for Brewster Academy, Wolfeboro, New Hampshire. Previously, Mr. Curvey served as a Director of Fidelity Investments Money Management, Inc. (investment adviser firm, 2009-2014) and a Director of FMR and FMR Co., Inc. (investment adviser firms, 2007-2014).
Charles S. Morrison (1960)
Year of Election or Appointment: 2014
Trustee
Mr. Morrison also serves as Trustee of other funds. He serves as a Director of Fidelity Investments Money Management, Inc. (FIMM) (investment adviser firm, 2014-present), Director of Fidelity SelectCo, LLC (investment adviser firm, 2014-present), President, Asset Management (2014-present), and is an employee of Fidelity Investments. Previously, Mr. Morrison served as Vice President of Fidelity's Fixed Income and Asset Allocation Funds (2012-2014), President, Fixed Income (2011-2014), Vice President of Fidelity's Money Market Funds (2005-2009), President, Money Market Group Leader of FMR (investment adviser firm, 2009), and Senior Vice President, Money Market Group of FMR (2004-2009). Mr. Morrison also served as Vice President of Fidelity's Bond Funds (2002-2005), certain Balanced Funds (2002-2005), and certain Asset Allocation Funds (2002-2007), and as Senior Vice President (2002-2005) of Fidelity's Bond Division.
* Determined to be an “Interested Trustee” by virtue of, among other things, his or her affiliation with the trust or various entities under common control with FMR.
+ The information includes the Trustee's principal occupation during the last five years and other information relating to the experience, attributes, and skills relevant to the Trustee's qualifications to serve as a Trustee, which led to the conclusion that the Trustee should serve as a Trustee for the fund.
Independent Trustees:
Correspondence intended for an Independent Trustee may be sent to Fidelity Investments, P.O. Box 55235, Boston, Massachusetts 02205-5235.
Name, Year of Birth; Principal Occupations and Other Relevant Experience+
Dennis J. Dirks (1948)
Year of Election or Appointment: 2005
Trustee
Mr. Dirks also serves as Trustee of other Fidelity® funds. Prior to his retirement in May 2003, Mr. Dirks was Chief Operating Officer and a member of the Board of The Depository Trust & Clearing Corporation (DTCC). He also served as President, Chief Operating Officer, and Board member of The Depository Trust Company (DTC) and President and Board member of the National Securities Clearing Corporation (NSCC). In addition, Mr. Dirks served as Chief Executive Officer and Board member of the Government Securities Clearing Corporation, Chief Executive Officer and Board member of the Mortgage-Backed Securities Clearing Corporation, as a Trustee and a member of the Finance Committee of Manhattan College (2005-2008), as a Trustee and a member of the Finance Committee of AHRC of Nassau County (2006-2008), and as a member of the Independent Directors Council (IDC) Governing Council (2010-2015). Mr. Dirks is a member of the Board of Directors for The Brookville Center for Children's Services, Inc. (2009-present).
Alan J. Lacy (1953)
Year of Election or Appointment: 2008
Trustee
Mr. Lacy also serves as Trustee of other Fidelity® funds. Mr. Lacy serves as a member of the Board of Directors of Dave & Buster's Entertainment, Inc. (restaurant and entertainment complexes, 2010-present) and Bristol-Myers Squibb Company (global pharmaceuticals, 2008-present). In addition, Mr. Lacy served as Senior Adviser (2007-2014) of Oak Hill Capital Partners, L.P. (private equity) and also served as Chief Executive Officer (2000-2005) and Vice Chairman (2005-2006) of Sears Holdings Corporation and Sears, Roebuck and Co. (retail). Mr. Lacy is a member of the Board of Trustees of The National Parks Conservation Association (2006-present). Previously, Mr. Lacy served as Chairman of the Board of Trustees of the National Parks Conservation Association (2008-2011) and as a member of the Board of Directors for The Western Union Company (global money transfer, 2006-2011), The Hillman Companies, Inc. (hardware wholesalers, 2010-2014), and Earth Fare, Inc. (retail grocery, 2010-2014).
Ned C. Lautenbach (1944)
Year of Election or Appointment: 2000
Trustee
Chairman of the Independent Trustees
Mr. Lautenbach also serves as Trustee of other Fidelity® funds. Mr. Lautenbach currently serves as the Lead Director of the Eaton Corporation Board of Directors (diversified industrial, 1997-present). Mr. Lautenbach is Chairman of the Board of Directors of Artis-Naples in Naples, Florida (2012-present), a member of the Council on Foreign Relations (1994-present), and a member of the Board of Governors, State University System of Florida (2013-present). Previously, Mr. Lautenbach was a Partner/Advisory Partner at Clayton, Dubilier & Rice, LLC (private equity investment, 1998-2010), as well as a Director of Sony Corporation (2006-2007).
Joseph Mauriello (1944)
Year of Election or Appointment: 2008
Trustee
Mr. Mauriello also serves as Trustee of other Fidelity® funds. Prior to his retirement in January 2006, Mr. Mauriello served in numerous senior management positions including Deputy Chairman and Chief Operating Officer (2004-2005), and Vice Chairman of Financial Services (2002-2004) of KPMG LLP US (professional services, 1965-2005). Mr. Mauriello currently serves as a member of the Board of Directors of XL Group plc. (global insurance and re-insurance, 2006-present) and the Independent Directors Council (IDC) Governing Council (2015-present). Previously, Mr. Mauriello served as a Director of the Hamilton Funds of the Bank of New York (2006-2007) and of Arcadia Resources Inc. (health care services and products, 2007-2012).
Robert W. Selander (1950)
Year of Election or Appointment: 2011
Trustee
Mr. Selander also serves as Trustee of other Fidelity® funds. Mr. Selander serves as a Director of The Western Union Company (global money transfer, 2014-present). Previously, Mr. Selander served as a Member of the Advisory Board of other Fidelity® funds (2011), and Executive Vice Chairman (2010), Chief Executive Officer (2009-2010), and President and Chief Executive Officer (1997-2009) of Mastercard, Inc.
Cornelia M. Small (1944)
Year of Election or Appointment: 2005
Trustee
Ms. Small also serves as Trustee of other Fidelity® funds. Ms. Small is a member of the Board of Directors (2009-present) and Chair of the Investment Committee (2010-present) of the Teagle Foundation. Ms. Small also serves on the Investment Committee of the Berkshire Taconic Community Foundation (2008-present). Previously, Ms. Small served as Chairperson (2002-2008) and a member of the Investment Committee and Chairperson (2008-2012) and a member of the Board of Trustees of Smith College. In addition, Ms. Small served as Chief Investment Officer, Director of Global Equity Investments, and a member of the Board of Directors of Scudder, Stevens & Clark and Scudder Kemper Investments.
William S. Stavropoulos (1939)
Year of Election or Appointment: 2002
Trustee
Vice Chairman of the Independent Trustees
Mr. Stavropoulos also serves as Trustee of other Fidelity® funds. Mr. Stavropoulos serves as President and Founder of the Michigan Baseball Foundation, the Great Lakes Loons (2007-present). Mr. Stavropoulos is Chairman Emeritus of the Board of Directors of The Dow Chemical Company, where he previously served in numerous senior management positions, including President, CEO (1995-2000; 2002-2004), Chairman of the Executive Committee (2000-2006), and as a member of the Board of Directors (1990-2006). Currently, Mr. Stavropoulos is Chairman of the Board of Directors of Univar Inc. (global distributor of commodity and specialty chemicals), a Director of Teradata Corporation (data warehousing and technology solutions), and Maersk Inc. (industrial conglomerate), and a member of the Advisory Board for Metalmark Capital LLC (private equity investment, 2005-present). Mr. Stavropoulos is an operating advisor to Clayton, Dubilier & Rice, LLC (private equity investment). In addition, Mr. Stavropoulos is a member of the University of Notre Dame Advisory Council for the College of Science, a Trustee of the Rollin L. Gerstacker Foundation, and a Director of the Naples Philharmonic Center for the Arts. Previously, Mr. Stavropoulos served as a Director of Chemical Financial Corporation (bank holding company, 1993-2012) and Tyco International, Ltd. (multinational manufacturing and services, 2007-2012).
David M. Thomas (1949)
Year of Election or Appointment: 2008
Trustee
Mr. Thomas also serves as Trustee of other Fidelity® funds. Mr. Thomas serves as Non-Executive Chairman of the Board of Directors of Fortune Brands Home and Security (home and security products, 2011-present), as a member of the Board of Directors (2004-present) and Presiding Director (2013-present) of Interpublic Group of Companies, Inc. (marketing communication), and as a member of the Board of Trustees of the University of Florida (2013-present). Previously, Mr. Thomas served as Executive Chairman (2005-2006) and Chairman and Chief Executive Officer (2000-2005) of IMS Health, Inc. (pharmaceutical and healthcare information solutions), and a Director of Fortune Brands, Inc. (consumer products, 2000-2011).
+ The information includes the Trustee's principal occupation during the last five years and other information relating to the experience, attributes, and skills relevant to the Trustee's qualifications to serve as a Trustee, which led to the conclusion that the Trustee should serve as a Trustee for the fund.
Advisory Board Members and Officers:
Correspondence intended for an officer or Peter S. Lynch may be sent to Fidelity Investments, 245 Summer Street, Boston, Massachusetts 02210. Officers appear below in alphabetical order.
Name, Year of Birth; Principal Occupation
Peter S. Lynch (1944)
Year of Election or Appointment: 2003
Member of the Advisory Board
Mr. Lynch also serves as Member of the Advisory Board of other Fidelity® funds. Mr. Lynch is Vice Chairman and a Director of FMR (investment adviser firm) and FMR Co., Inc. (investment adviser firm). In addition, Mr. Lynch serves as a Trustee of Boston College and as the Chairman of the Inner-City Scholarship Fund. Previously, Mr. Lynch served on the Special Olympics International Board of Directors (1997-2006).
Elizabeth Paige Baumann (1968)
Year of Election or Appointment: 2012
Anti-Money Laundering (AML) Officer
Ms. Baumann also serves as AML Officer of other funds. She is Chief AML Officer of FMR LLC (diversified financial services company, 2012-present) and is an employee of Fidelity Investments. Previously, Ms. Baumann served as Vice President and Deputy Anti-Money Laundering Officer (2007-2012).
Marc R. Bryant (1966)
Year of Election or Appointment: 2015
Secretary and Chief Legal Officer (CLO)
Mr. Bryant also serves as Secretary and CLO of other funds. Mr. Bryant serves as CLO, Secretary, and Senior Vice President of Fidelity Management & Research Company (investment adviser firm, 2015-present) and FMR Co., Inc. (investment adviser firm, 2015-present); Secretary of Fidelity SelectCo, LLC (investment adviser firm, 2015-present) and Fidelity Investments Money Management, Inc. (investment adviser firm, 2015-present); and CLO of Fidelity Management & Research (Hong Kong) Limited (investment adviser firm, 2015-present). He is Senior Vice President and Deputy General Counsel of FMR LLC (diversified financial services company). Previously, Mr. Bryant served as Secretary and Chief Legal Officer of Fidelity Rutland Square Trust II (2010-2014) and Assistant Secretary of Fidelity's Fixed Income and Asset Allocation Funds (2013-2015). Prior to joining Fidelity Investments, Mr. Bryant served as a Senior Vice President and the Head of Global Retail Legal for AllianceBernstein L.P. (2006-2010), and as the General Counsel for ProFund Advisors LLC (2001-2006).
William C. Coffey (1969)
Year of Election or Appointment: 2009
Assistant Secretary
Mr. Coffey also serves as Assistant Secretary of other funds. He is Senior Vice President and Deputy General Counsel of FMR LLC (diversified financial services company, 2010-present), and is an employee of Fidelity Investments. Previously, Mr. Coffey served as Vice President and Associate General Counsel of FMR LLC (2005-2009).
Jonathan Davis (1968)
Year of Election or Appointment: 2010
Assistant Treasurer
Mr. Davis also serves as Assistant Treasurer of other funds, and is an employee of Fidelity Investments. Previously, Mr. Davis served as Vice President and Associate General Counsel of FMR LLC (diversified financial services company, 2003-2010).
Adrien E. Deberghes (1967)
Year of Election or Appointment: 2008
Deputy Treasurer
Mr. Deberghes also serves as an officer of other funds. He is an employee of Fidelity Investments (2008-present). Prior to joining Fidelity Investments, Mr. Deberghes was Senior Vice President of Mutual Fund Administration at State Street Corporation (2007-2008), Senior Director of Mutual Fund Administration at Investors Bank & Trust (2005-2007), and Director of Finance for Dunkin' Brands (2000-2005).
Stephanie J. Dorsey (1969)
Year of Election or Appointment: 2010
Assistant Treasurer
Ms. Dorsey also serves as an officer of other funds. She is an employee of Fidelity Investments (2008-present) and has served in other fund officer roles. Prior to joining Fidelity Investments, Ms. Dorsey served as Treasurer (2004-2008) of the JPMorgan Mutual Funds and Vice President (2004-2008) of JPMorgan Chase Bank.
Howard J. Galligan III (1966)
Year of Election or Appointment: 2014
Chief Financial Officer
Mr. Galligan also serves as Chief Financial Officer of other funds. Mr. Galligan serves as President of Fidelity Pricing and Cash Management Services (FPCMS) (2014-present) and as a Director of Strategic Advisers, Inc. (investment adviser firm, 2008-present). Previously, Mr. Galligan served as Chief Administrative Officer of Asset Management (2011-2014) and Chief Operating Officer and Senior Vice President of Investment Support for Strategic Advisers, Inc. (2003-2011).
Scott C. Goebel (1968)
Year of Election or Appointment: 2015
Vice President
Mr. Goebel serves as Vice President of other funds and is an employee of Fidelity Investments (2001-present). Previously, Mr. Goebel served as Secretary of Fidelity SelectCo, LLC (investment adviser firm, 2013-2015), Fidelity Investments Money Management, Inc. (FIMM) (investment adviser firm, 2010-2015), and Fidelity Research and Analysis Company (FRAC) (investment adviser firm, 2010-2015); General Counsel, Secretary, and Senior Vice President of Fidelity Management & Research Company (investment adviser firm, 2008-2015) and FMR Co., Inc. (investment adviser firm, 2008-2015); Assistant Secretary of Fidelity Management & Research (Japan) Limited (investment adviser firm, 2008-2015) and FMR Investment Management (U.K.) Limited (investment adviser firm, 2008-2015); Chief Legal Officer (CLO) of Fidelity Management & Research (Hong Kong) Limited (investment adviser firm, 2008-2015); Secretary and CLO of certain Fidelity® funds (2008-2015); Assistant Secretary of FIMM (2008-2010), FRAC (2008-2010), and certain funds (2007-2008); and as Vice President and Secretary of Fidelity Distributors Corporation (FDC) (2005-2007).
Brian B. Hogan (1964)
Year of Election or Appointment: 2009
Vice President
Mr. Hogan also serves as Trustee or Vice President of other funds. Mr. Hogan serves as a Director of Fidelity SelectCo, LLC (investment adviser firm, 2014-present) and President of the Equity Division of FMR (investment adviser firm, 2009-present). Previously, Mr. Hogan served as Senior Vice President, Equity Research of FMR (2006-2009) and as a portfolio manager.
Chris Maher (1972)
Year of Election or Appointment: 2013
Assistant Treasurer
Mr. Maher serves as Assistant Treasurer of other funds. Mr. Maher is Vice President of Valuation Oversight and is an employee of Fidelity Investments. Previously, Mr. Maher served as Vice President of Asset Management Compliance (2013), Vice President of the Program Management Group of FMR (investment adviser firm, 2010-2013), and Vice President of Valuation Oversight (2008-2010).
Melissa M. Reilly (1971)
Year of Election or Appointment: 2014
Vice President of certain Equity Funds
Ms. Reilly also serves as Vice President of other funds. Ms. Reilly is an employee of Fidelity Investments (2004-present).
Kenneth B. Robins (1969)
Year of Election or Appointment: 2008
President and Treasurer
Mr. Robins also serves as an officer of other funds. Mr. Robins serves as Executive Vice President of Fidelity Investments Money Management, Inc. (FIMM) (investment adviser firm, 2013-present) and is an employee of Fidelity Investments (2004-present). Previously, Mr. Robins served in other fund officer roles.
Stacie M. Smith (1974)
Year of Election or Appointment: 2013
Deputy Treasurer
Ms. Smith also serves as an officer of other funds. She is an employee of Fidelity Investments (2009-present) and has served in other fund officer roles. Prior to joining Fidelity Investments, Ms. Smith served as Senior Audit Manager of Ernst & Young LLP (1996-2009).
Renee Stagnone (1975)
Year of Election or Appointment: 2013
Deputy Treasurer
Ms. Stagnone also serves as Deputy Treasurer of other funds. Ms. Stagnone is an employee of Fidelity Investments (1997-present).
Linda J. Wondrack (1964)
Year of Election or Appointment: 2014
Chief Compliance Officer
Ms. Wondrack also serves as Chief Compliance Officer of other funds. Ms. Wondrack is Executive Vice President and head of the Ethics Office and Asset Management Compliance for Fidelity Investments (2012-present). Ms. Wondrack also serves as Chief Compliance Officer of Fidelity SelectCo, LLC (investment adviser firm, 2014-present); Chief Compliance Officer of Impresa Management LLC (2013-present); and Chief Compliance Officer of FMR Co., Inc. (investment adviser firm), Fidelity Investments Money Management, Inc. (investment adviser firm), Fidelity Management & Research (Japan) Limited (investment adviser firm), FMR Investment Management (U.K.) Limited (investment adviser firm), Fidelity Management & Research (Hong Kong) (investment adviser firm), Fidelity Management & Research Company (investment adviser firm), FIAM LLC (investment adviser firm), and Strategic Advisers, Inc. (investment adviser firm), Ballyrock Investment Advisors LLC, and Northern Neck Investors LLC (2012-present). Previously, Ms. Wondrack served as Senior Vice President and Chief Compliance Officer for Columbia Management Investment Advisers, LLC (2005-2012); Chief Compliance Officer for certain funds within the Columbia Family of Funds (2007-2012); and Senior Vice President of Compliance Risk Management at Bank of America (2005-2010).
Joseph F. Zambello (1957)
Year of Election or Appointment: 2011
Deputy Treasurer
Mr. Zambello also serves as Deputy Treasurer of other funds. Mr. Zambello is an employee of Fidelity Investments (1991-present). Previously, Mr. Zambello served as Vice President of the Program Management Group of FMR (investment adviser firm, 2009-2011) and Vice President of the Transfer Agent Oversight Group (2005-2009).
Shareholder Expense Example
As a shareholder of the Fund, you incur two types of costs: (1) transaction costs and (2) ongoing costs, including management fees and other Fund expenses. This Example is intended to help you understand your ongoing costs (in dollars) of investing in the Fund and to compare these costs with the ongoing costs of investing in other mutual funds.
The Example is based on an investment of $1,000 invested at the beginning of the period and held for the entire period (May 1, 2015 to October 31, 2015).
Actual Expenses
The first line of the accompanying table for each class of the Fund provides information about actual account values and actual expenses. You may use the information in this line, together with the amount you invested, to estimate the expenses that you paid over the period. Simply divide your account value by $1,000.00 (for example, an $8,600 account value divided by $1,000.00 = 8.6), then multiply the result by the number in the first line for a class of the Fund under the heading entitled "Expenses Paid During Period" to estimate the expenses you paid on your account during this period. A small balance maintenance fee of $12.00 that is charged once a year may apply for certain accounts with a value of less than $2,000. This fee is not included in the table below. If it was, the estimate of expenses you paid during the period would be higher, and your ending account value lower, by this amount. In addition, the Fund, as a shareholder in the underlying Fidelity Central Funds, will indirectly bear its pro-rata share of the fees and expenses incurred by the underlying Fidelity Central Funds. These fees and expenses are not included in the Fund's annualized expense ratio used to calculate the expense estimate in the table below.
Hypothetical Example for Comparison Purposes
The second line of the accompanying table for each class of the Fund provides information about hypothetical account values and hypothetical expenses based on a Class' actual expense ratio and an assumed rate of return of 5% per year before expenses, which is not the Class' actual return. The hypothetical account values and expenses may not be used to estimate the actual ending account balance or expenses you paid for the period. You may use this information to compare the ongoing costs of investing in the Fund and other funds. To do so, compare this 5% hypothetical example with the 5% hypothetical examples that appear in the shareholder reports of the other funds. A small balance maintenance fee of $12.00 that is charged once a year may apply for certain accounts with a value of less than $2,000. This fee is not included in the table below. If it was, the estimate of expenses you paid during the period would be higher, and your ending account value lower, by this amount. In addition, the Fund, as a shareholder in the underlying Fidelity Central Funds, will indirectly bear its pro-rata share of the fees and expenses incurred by the underlying Fidelity Central Funds. These fees and expenses are not included in the Fund's annualized expense ratio used to calculate the expense estimate in the table below.
Please note that the expenses shown in the table are meant to highlight your ongoing costs only and do not reflect any transaction costs. Therefore, the second line of the table is useful in comparing ongoing costs only, and will not help you determine the relative total costs of owning different funds.
| Annualized Expense Ratio-A | Beginning Account Value May 1, 2015 | Ending Account Value October 31, 2015 | Expenses Paid During Period-B May 1, 2015 to October 31, 2015 | |
| Capital Appreciation | .81% | |||
| Actual | $1,000.00 | $996.00 | $4.08 | |
| Hypothetical-C | $1,000.00 | $1,021.12 | $4.13 | |
| Class K | .71% | |||
| Actual | $1,000.00 | $996.50 | $3.57 | |
| Hypothetical-C | $1,000.00 | $1,021.63 | $3.62 |
A Annualized expense ratio reflects expenses net of applicable fee waivers.
B Expenses are equal to each Class' annualized expense ratio, multiplied by the average account value over the period, multiplied by 184/365 (to reflect the one-half year period).
C 5% return per year before expenses
Distributions (Unaudited)
The Board of Trustees of Fidelity Capital Appreciation Fund voted to pay on December 07, 2015, to shareholders of record at the opening of business on December 04, 2015, a distribution of $4.010 per share derived from capital gains realized from sales of portfolio securities and a dividend of $0.265 per share from net investment income.
The fund hereby designates as a capital gain dividend with respect to the taxable year ended October 31, 2015, $ 988,692,388, or, if subsequently determined to be different, the net capital gain of such year.
The fund designates 100% of the dividends distributed during the fiscal year as qualifying for the dividends–received deduction for corporate shareholders.
The fund designates 100% of the dividends distributed during the fiscal year as amounts which may be taken into account as a dividend for the purposes of the maximum rate under section 1(h)(11) of the Internal Revenue Code.
The fund will notify shareholders in January 2016 of amounts for use in preparing 2015 income tax returns.
Board Approval of Investment Advisory Contracts and Management Fees
Fidelity Capital Appreciation Fund
Each year, the Board of Trustees, including the Independent Trustees (together, the Board), votes on the renewal of the management contract with Fidelity Management & Research Company (FMR) and the sub-advisory agreements (together, the Advisory Contracts) for the fund. The Board, assisted by the advice of fund counsel and Independent Trustees' counsel, requests and considers a broad range of information relevant to the renewal of the Advisory Contracts throughout the year.
The Board meets regularly and, at each of its meetings, covers an extensive agenda of topics and materials and considers factors that are relevant to its annual consideration of the renewal of the fund's Advisory Contracts, including the services and support provided to the fund and its shareholders. The Board has established various standing committees (Committees), each composed of and chaired by Independent Trustees with varying backgrounds, to which the Board has assigned specific subject matter responsibilities in order to enhance effective decision-making by the Board. The Board, acting directly and through its Committees, requests and receives information concerning the annual consideration of the renewal of the fund's Advisory Contracts. The Board also meets as needed to consider matters specifically related to the Board's annual consideration of the renewal of the Advisory Contracts. Members of the Board may also meet with trustees of other Fidelity funds through ad hoc joint committees to discuss certain matters relevant to all of the Fidelity funds.
At its July 2015 meeting, the Board unanimously determined to renew the fund's Advisory Contracts. In reaching its determination, the Board considered all factors it believed relevant, including (i) the nature, extent, and quality of the services to be provided to the fund and its shareholders (including the investment performance of the fund); (ii) the competitiveness of the fund's management fee and total expense ratio relative to peer funds; (iii) the total costs of the services to be provided by and the profits to be realized by Fidelity from its relationship with the fund; and (iv) the extent to which (if any) economies of scale exist and would be realized as the fund grows, and whether any economies of scale are appropriately shared with fund shareholders.
In considering whether to renew the Advisory Contracts for the fund, the Board reached a determination, with the assistance of fund counsel and Independent Trustees' counsel and through the exercise of its business judgment, that the renewal of the Advisory Contracts was in the best interests of the fund and its shareholders and that the compensation payable under the Advisory Contracts was fair and reasonable. The Board's decision to renew the Advisory Contracts was not based on any single factor, but rather was based on a comprehensive consideration of all the information provided to the Board at its meetings throughout the year. The Board, in reaching its determination to renew the Advisory Contracts, was aware that shareholders of the fund have a broad range of investment choices available to them, including a wide choice among funds offered by Fidelity's competitors, and that the fund's shareholders, who have the opportunity to review and weigh the disclosure provided by the fund in its prospectus and other public disclosures, have chosen to invest in this fund, which is part of the Fidelity family of funds.
Nature, Extent, and Quality of Services Provided. The Board considered Fidelity's staffing as it relates to the fund, including the backgrounds of investment personnel of Fidelity, and also considered the fund's investment objective, strategies, and related investment philosophy. The Independent Trustees also had discussions with senior management of Fidelity's investment operations and investment groups. The Board considered the structure of the portfolio manager compensation program and whether this structure provides appropriate incentives to act in the best interests of the fund. Additionally, the Board considered the portfolio managers' investments, if any, in the funds that they manage.Resources Dedicated to Investment Management and Support Services. The Board and the Fund Oversight and Research Committees reviewed the general qualifications and capabilities of Fidelity's investment staff, including its size, education, experience, and resources, as well as Fidelity's approach to recruiting, training, managing, and compensating investment personnel. The Board noted that Fidelity has continued to increase the resources devoted to non-U.S. offices, including expansion of Fidelity's global investment organization. The Board also noted that Fidelity's analysts have extensive resources, tools and capabilities that allow them to conduct sophisticated quantitative and fundamental analysis, as well as credit analysis of issuers, counterparties and guarantors. Further, the Board considered that Fidelity's investment professionals have sufficient access to global information and data so as to provide competitive investment results over time, and that those professionals also have access to sophisticated tools that permit them to assess portfolio construction and risk and performance attribution characteristics continuously, as well as to transmit new information and research conclusions rapidly around the world. Additionally, in its deliberations, the Board considered Fidelity's trading, risk management, and compliance capabilities and resources, which are integral parts of the investment management process.Shareholder and Administrative Services. The Board considered (i) the nature, extent, quality, and cost of advisory, administrative, and shareholder services performed by FMR, the sub-advisers (together with FMR, the Investment Advisers), and their affiliates under the Advisory Contracts and under separate agreements covering transfer agency, pricing and bookkeeping, and securities lending services for the fund; (ii) the nature and extent of the supervision of third party service providers, principally custodians and subcustodians; and (iii) the resources devoted to, and the record of compliance with, the fund's compliance policies and procedures. The Board also reviewed the allocation of fund brokerage, including allocations to brokers affiliated with the Investment Advisers, the use of brokerage commissions to pay fund expenses, and the use of "soft" commission dollars to pay for research services.The Board noted that the growth of fund assets over time across the complex allows Fidelity to reinvest in the development of services designed to enhance the value or convenience of the Fidelity funds as investment vehicles. These services include 24-hour access to account information and market information through telephone representatives and over the Internet, investor education materials and asset allocation tools, and the expanded availability of Fidelity Investor Centers.In 2014, the Board formed an ad hoc Committee on Transfer Agency Fees to review the variety of transfer agency fee structures throughout the industry and Fidelity's competitive positioning with respect to industry participants.Investment in a Large Fund Family. The Board considered the benefits to shareholders of investing in a Fidelity fund, including the benefits of investing in a fund that is part of a large family of funds offering a variety of investment disciplines and providing a large variety of mutual fund investor services. The Board noted that Fidelity had taken, or had made recommendations that resulted in the Fidelity funds taking, a number of actions over the previous year that benefited particular funds, including (i) continuing to dedicate additional resources to investment research and to the support of the senior management team that oversees asset management; (ii) continuing efforts to enhance Fidelity's global research capabilities; (iii) launching new funds and making other enhancements to meet client needs; (iv) reducing management fees and total expenses for certain index funds and diversified international funds; (v) continuing to launch dedicated lower cost underlying funds to meet portfolio construction needs related to expanding underlying fund options for Fidelity funds of funds, specifically for the Freedom Fund product lines; (vi) rationalizing product lines and gaining increased efficiencies through fund mergers; (vii) launching active fixed-income exchange-traded funds; (viii) continuing to develop, acquire and implement systems and technology to improve services to the funds and information security and to increase efficiency; (ix) implementing investment enhancements to further strengthen Fidelity's target date product line to increase investors' probability of success in achieving their goals; (x) modifying the eligibility criteria for certain share classes to accommodate roll-over assets from employer-sponsored retirement plans; (xi) launching a new Class W of the Freedom Index Funds to attract and retain Fidelity record-kept retirement plan assets; and (xii) implementing changes to Fidelity's money market product line in response to recent money market regulatory reforms.Investment Performance. The Board considered whether the fund has operated in accordance with its investment objective, as well as its record of compliance with its investment restrictions and its performance history.The Board took into account discussions with representatives of the Investment Advisers about fund investment performance that occur at Board meetings throughout the year. In this regard the Board noted that as part of regularly scheduled fund reviews and other reports to the Board on fund performance, the Board considers annualized return information for the fund, for different time periods, measured against a securities market index ("benchmark index") and a peer group of funds with similar objectives ("peer group"), if any. In its evaluation of fund investment performance, the Board gave particular attention to information indicating changes in performance of certain Fidelity funds for specific time periods and discussed with the Investment Advisers the reasons for any overperformance or underperformance.In addition to reviewing absolute and relative fund performance, the Independent Trustees periodically consider the appropriateness of fund performance metrics in evaluating the results achieved. In general, the Independent Trustees believe that fund performance should be evaluated based on net performance (after fees and expenses) of both the highest performing and lowest performing fund share classes, where applicable, compared to appropriate benchmark indices, over appropriate time periods that may include full market cycles, and compared to peer groups, as applicable, over the same periods, taking into account relevant factors including the following: general market conditions; issuer-specific information; and fund cash flows and other factors.The Independent Trustees recognize that shareholders evaluate performance on a net basis over their own holding periods, for which one-, three-, and five-year periods are often used as a proxy. For this reason, the performance information reviewed by the Board also included net cumulative calendar year total return information for the fund and an appropriate benchmark index and peer group for the most recent one-, three-, and five-year periods, as shown below. Returns are shown compared to the 25th percentile (top of box, 75% beaten) and 75th percentile (bottom of box, 25% beaten) of the peer universe.Fidelity Capital Appreciation Fund
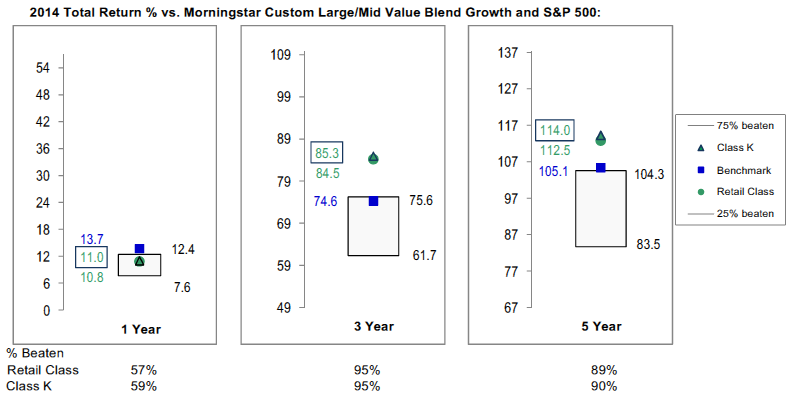
Fidelity Capital Appreciation Fund
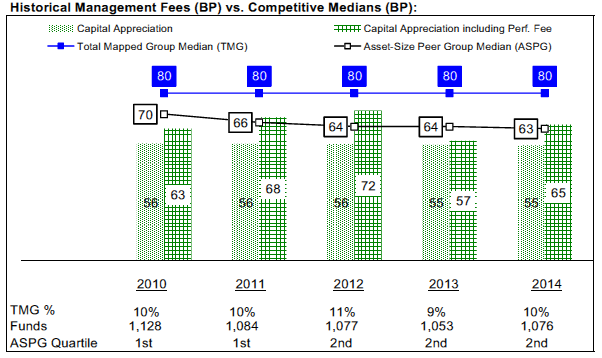
![]()
Corporate Headquarters
245 Summer St.
Boston, MA 02210
www.fidelity.com
CAF-ANN-1215
1.538293.118
Fidelity® Capital Appreciation Fund Class K Annual Report October 31, 2015 |
|
Contents
Board Approval of Investment Advisory Contracts and Management Fees |
To view a fund's proxy voting guidelines and proxy voting record for the 12-month period ended June 30, visit http://www.fidelity.com/proxyvotingresults or visit the Securities and Exchange Commission's (SEC) web site at http://www.sec.gov.
You may also call 1-800-835-5092 to request a free copy of the proxy voting guidelines.
Standard & Poor's, S&P and S&P 500 are registered service marks of The McGraw-Hill Companies, Inc. and have been licensed for use by Fidelity Distributors Corporation.
Other third-party marks appearing herein are the property of their respective owners.
All other marks appearing herein are registered or unregistered trademarks or service marks of FMR LLC or an affiliated company. © 2015 FMR LLC. All rights reserved.
This report and the financial statements contained herein are submitted for the general information of the shareholders of the Fund. This report is not authorized for distribution to prospective investors in the Fund unless preceded or accompanied by an effective prospectus.
A fund files its complete schedule of portfolio holdings with the SEC for the first and third quarters of each fiscal year on Form N-Q. Forms N-Q are available on the SEC’s web site at http://www.sec.gov. A fund's Forms N-Q may be reviewed and copied at the SEC’s Public Reference Room in Washington, DC. Information regarding the operation of the SEC's Public Reference Room may be obtained by calling 1-800-SEC-0330.
For a complete list of a fund's portfolio holdings, view the most recent holdings listing, semiannual report, or annual report on Fidelity's web site at http://www.fidelity.com, http://www.advisor.fidelity.com, or http://www.401k.com, as applicable.
NOT FDIC INSURED •MAY LOSE VALUE •NO BANK GUARANTEE
Neither the Fund nor Fidelity Distributors Corporation is a bank.
Performance: The Bottom Line
Average annual total return reflects the change in the value of an investment, assuming reinvestment of distributions from dividend income and capital gains (the profits earned upon the sale of securities that have grown in value, if any) and assuming a constant rate of performance each year.
The hypothetical investment and the average annual total returns do not reflect the deduction of taxes that a shareholder would pay on fund distributions or the redemption of fund shares.
During periods of reimbursement by Fidelity, a fund’s total return will be greater than it would be had the reimbursement not occurred.
How a fund did yesterday is no guarantee of how it will do tomorrow.
Average Annual Total Returns
| For the periods ended October 31, 2015 | Past 1 year | Past 5 years | Past 10 years |
| Class K | 3.62% | 14.42% | 8.64% |
The initial offering of Class K shares took place on May 9, 2008. Returns prior to May 9, 2008 are those of Fidelity® Capital Appreciation Fund, the original class of the fund.
$10,000 Over 10 Years
Let's say hypothetically that $10,000 was invested in Fidelity® Capital Appreciation Fund - Class K on October 31, 2005.
The chart shows how the value of your investment would have changed, and also shows how the S&P 500® Index performed over the same period.
See above for additional information regarding the performance of Class K.

| Period Ending Values | ||
| $22,909 | Fidelity® Capital Appreciation Fund - Class K | |
| $21,289 | S&P 500® Index | |
Management's Discussion of Fund Performance
Market Recap: U.S. stocks gained moderately for the 12 months ending October 31, 2015, helped by a strong October that largely erased a steep decline in August and September on concern about slowing global economic growth emanating from China. Stocks benefited late in the period amid waning expectations for a near-term interest-rate hike by the U.S. Federal Reserve, additional economic stimulus in Europe and an interest-rate cut in China. The large-cap S&P 500® index advanced 5.20% for the period, with growth stocks in the index significantly outpacing value stocks, as investors continued to seek growth in a subpar economic environment. The growth-oriented Nasdaq Composite Index® also benefited, gaining 10.39%, while the small-cap Russell 2000® Index lost its edge, returning only 0.34%, as risk appetites waned. Among sectors in the widely followed S&P 500®, consumer discretionary (+21%) led the way, benefiting from a combination of rising personal income and still-benign inflation. Technology (+11%) and consumer staples (+9%) also outpaced the index. Conversely, energy (-19%) performed worst, in an environment of depressed commodity prices that also hit materials (-4%). At period end, investors remained focused on the potential global implications of a relatively stronger U.S. dollar and how China’s transition toward a consumption-led economy may affect corporate earnings.Comments from Portfolio Manager Fergus Shiel: For the year, the fund’s share classes posted modest single-digit gains, lagging the benchmark S&P 500® index. One factor holding back the fund’s return versus the benchmark was its large allocation to pharmaceuticals, biotechnology & life sciences, a group that suffered a sharp correction. Against this backdrop, the three biggest detractors from relative performance were non-benchmark pharma/biotech holdings: Pacira Pharmaceuticals, Ireland-based Jazz Pharmaceuticals and Medivation. Positioning in the software & services area of information technology also worked against the fund’s relative result. Here, the largest detractor was index component Microsoft, which we owned for only part of the period. Conversely, a sizable underweighting in the weak-performing energy sector was a noteworthy positive. At the stock level, coffee chain Starbucks, a longtime overweighting for the fund, was by far the fund’s largest contributor. Other contributors included medical device maker Boston Scientific and Paddy Power, a Dublin-based international sports-betting and gaming company that was not in our benchmark. I significantly reduced our positions in the first two contributors and sold the third. Thanks in part to Paddy Power, the fund’s foreign exposure helped performance despite the headwind of a stronger U.S. dollar.The views expressed above reflect those of the portfolio manager(s) only through the end of the period as stated on the cover of this report and do not necessarily represent the views of Fidelity or any other person in the Fidelity organization. Any such views are subject to change at any time based upon market or other conditions and Fidelity disclaims any responsibility to update such views. These views may not be relied on as investment advice and, because investment decisions for a Fidelity fund are based on numerous factors, may not be relied on as an indication of trading intent on behalf of any Fidelity fund.
Investment Summary (Unaudited)
Top Ten Stocks as of October 31, 2015
| % of fund's net assets | % of fund's net assets 6 months ago | |
| Gilead Sciences, Inc. | 7.8 | 7.0 |
| Celgene Corp. | 5.5 | 4.7 |
| Las Vegas Sands Corp. | 4.3 | 1.9 |
| Amgen, Inc. | 3.0 | 3.8 |
| Home Depot, Inc. | 2.8 | 2.1 |
| Ameriprise Financial, Inc. | 2.7 | 4.2 |
| Adobe Systems, Inc. | 2.5 | 1.4 |
| E*TRADE Financial Corp. | 2.3 | 1.9 |
| Ford Motor Co. | 2.1 | 2.0 |
| JPMorgan Chase & Co. | 2.0 | 2.1 |
| 35.0 |
Top Five Market Sectors as of October 31, 2015
| % of fund's net assets | % of fund's net assets 6 months ago | |
| Consumer Discretionary | 30.3 | 22.1 |
| Health Care | 28.9 | 33.6 |
| Financials | 16.6 | 17.2 |
| Information Technology | 9.5 | 9.2 |
| Industrials | 6.6 | 4.4 |
Asset Allocation (% of fund's net assets)
| As of October 31, 2015 * | ||
| Stocks | 99.0% | |
| Short-Term Investments and Net Other Assets (Liabilities) | 1.0% | |

* Foreign investments 12.7%
| As of April 30, 2015 * | ||
| Stocks | 92.5% | |
| Short-Term Investments and Net Other Assets (Liabilities) | 7.5% | |

* Foreign investments 11.0%
Investments October 31, 2015
Showing Percentage of Net Assets
| Common Stocks - 99.0% | |||
| Shares | Value (000s) | ||
| CONSUMER DISCRETIONARY - 30.3% | |||
| Automobiles - 3.0% | |||
| Ford Motor Co. | 11,942,690 | $176,871 | |
| Suzuki Motor Corp. | 1,055,800 | 34,571 | |
| Tesla Motors, Inc. (a) | 185,000 | 38,282 | |
| 249,724 | |||
| Hotels, Restaurants & Leisure - 8.4% | |||
| Dalata Hotel Group PLC (a) | 5,773,760 | 28,698 | |
| Las Vegas Sands Corp. | 7,331,396 | 362,977 | |
| Starbucks Corp. | 1,778,748 | 111,296 | |
| Whitbread PLC | 1,885,561 | 144,351 | |
| Wyndham Worldwide Corp. | 699,458 | 56,901 | |
| 704,223 | |||
| Household Durables - 0.8% | |||
| Cairn Homes PLC (a)(b) | 25,671,100 | 28,512 | |
| Tempur Sealy International, Inc. (a) | 515,609 | 40,135 | |
| 68,647 | |||
| Internet & Catalog Retail - 1.9% | |||
| Amazon.com, Inc. (a) | 263,150 | 164,706 | |
| Leisure Products - 1.7% | |||
| Polaris Industries, Inc. (c) | 1,263,004 | 141,886 | |
| Media - 4.1% | |||
| Altice NV Class A (a) | 1,947,170 | 33,724 | |
| Havas SA | 4,175,200 | 36,225 | |
| Interpublic Group of Companies, Inc. | 3,912,294 | 89,709 | |
| ITV PLC | 9,348,600 | 36,375 | |
| The Walt Disney Co. | 1,282,185 | 145,836 | |
| 341,869 | |||
| Multiline Retail - 1.7% | |||
| Dillard's, Inc. Class A (c) | 607,725 | 54,379 | |
| Dollar General Corp. | 89,699 | 6,079 | |
| JC Penney Corp., Inc. (a)(c) | 9,197,478 | 84,341 | |
| 144,799 | |||
| Specialty Retail - 8.7% | |||
| AutoZone, Inc. (a) | 203,827 | 159,884 | |
| Home Depot, Inc. | 1,902,300 | 235,200 | |
| L Brands, Inc. | 398,220 | 38,221 | |
| Ross Stores, Inc. | 608,400 | 30,773 | |
| TJX Companies, Inc. | 1,466,515 | 107,334 | |
| Ulta Salon, Cosmetics & Fragrance, Inc. (a) | 515,354 | 89,651 | |
| Williams-Sonoma, Inc. | 1,023,000 | 75,446 | |
| 736,509 | |||
| TOTAL CONSUMER DISCRETIONARY | 2,552,363 | ||
| CONSUMER STAPLES - 2.5% | |||
| Tobacco - 2.5% | |||
| Altria Group, Inc. | 827,500 | 50,039 | |
| Imperial Tobacco Group PLC | 1,491,119 | 80,432 | |
| Reynolds American, Inc. | 1,615,525 | 78,062 | |
| 208,533 | |||
| ENERGY - 2.2% | |||
| Energy Equipment & Services - 0.3% | |||
| Schlumberger Ltd. | 329,301 | 25,738 | |
| Oil, Gas & Consumable Fuels - 1.9% | |||
| Anadarko Petroleum Corp. | 151,995 | 10,165 | |
| Apache Corp. | 233,700 | 11,014 | |
| Chevron Corp. | 223,900 | 20,348 | |
| Cimarex Energy Co. | 62,137 | 7,336 | |
| Concho Resources, Inc. (a) | 58,800 | 6,816 | |
| ConocoPhillips Co. | 360,300 | 19,222 | |
| Devon Energy Corp. | 233,700 | 9,799 | |
| EOG Resources, Inc. | 179,300 | 15,393 | |
| Exxon Mobil Corp. | 311,600 | 25,782 | |
| Pioneer Natural Resources Co. | 68,200 | 9,353 | |
| Southwestern Energy Co. (a) | 1,070,700 | 11,821 | |
| Whiting Petroleum Corp. (a) | 710,500 | 12,242 | |
| 159,291 | |||
| TOTAL ENERGY | 185,029 | ||
| FINANCIALS - 16.6% | |||
| Banks - 2.7% | |||
| Citigroup, Inc. | 1,106,771 | 58,847 | |
| JPMorgan Chase & Co. | 2,663,600 | 171,136 | |
| 229,983 | |||
| Capital Markets - 8.9% | |||
| Ameriprise Financial, Inc. | 1,963,531 | 226,513 | |
| BlackRock, Inc. Class A | 227,716 | 80,149 | |
| Charles Schwab Corp. | 1,523,493 | 46,497 | |
| E*TRADE Financial Corp. (a) | 6,919,987 | 197,289 | |
| Goldman Sachs Group, Inc. | 787,612 | 147,677 | |
| Morgan Stanley | 1,666,700 | 54,951 | |
| 753,076 | |||
| Diversified Financial Services - 4.5% | |||
| CME Group, Inc. | 1,589,744 | 150,183 | |
| McGraw Hill Financial, Inc. | 1,705,895 | 158,034 | |
| Moody's Corp. | 758,037 | 72,893 | |
| 381,110 | |||
| Insurance - 0.5% | |||
| ACE Ltd. | 146,000 | 16,577 | |
| Progressive Corp. | 146,000 | 4,837 | |
| The Travelers Companies, Inc. | 146,000 | 16,482 | |
| 37,896 | |||
| TOTAL FINANCIALS | 1,402,065 | ||
| HEALTH CARE - 28.9% | |||
| Biotechnology - 21.9% | |||
| Actelion Ltd. | 791,990 | 110,091 | |
| Amgen, Inc. | 1,608,523 | 254,436 | |
| Baxalta, Inc. | 1,067,549 | 36,788 | |
| Biogen, Inc. (a) | 400,116 | 116,238 | |
| BioMarin Pharmaceutical, Inc. (a) | 354,495 | 41,490 | |
| Celgene Corp. (a) | 3,764,391 | 461,928 | |
| Gilead Sciences, Inc. | 6,059,478 | 655,209 | |
| Medivation, Inc. (a) | 3,997,526 | 168,136 | |
| 1,844,316 | |||
| Health Care Equipment & Supplies - 1.2% | |||
| Boston Scientific Corp. (a) | 3,267,369 | 59,728 | |
| Intuitive Surgical, Inc. (a) | 82,990 | 41,213 | |
| 100,941 | |||
| Pharmaceuticals - 5.8% | |||
| Allergan PLC (a) | 410,636 | 126,669 | |
| Astellas Pharma, Inc. | 3,469,200 | 50,354 | |
| Cardiome Pharma Corp. (a) | 611,563 | 5,003 | |
| Jazz Pharmaceuticals PLC (a) | 1,094,010 | 150,186 | |
| Johnson & Johnson | 671,800 | 67,872 | |
| Pacira Pharmaceuticals, Inc. (a)(c) | 1,617,583 | 80,798 | |
| The Medicines Company (a) | 301,320 | 10,317 | |
| 491,199 | |||
| TOTAL HEALTH CARE | 2,436,456 | ||
| INDUSTRIALS - 6.6% | |||
| Aerospace & Defense - 1.5% | |||
| General Dynamics Corp. | 86,647 | 12,874 | |
| Lockheed Martin Corp. | 207,987 | 45,722 | |
| Northrop Grumman Corp. | 214,200 | 40,216 | |
| Raytheon Co. | 146,000 | 17,140 | |
| Textron, Inc. | 146,000 | 6,157 | |
| United Technologies Corp. | 68,100 | 6,702 | |
| 128,811 | |||
| Air Freight & Logistics - 0.2% | |||
| United Parcel Service, Inc. Class B | 175,200 | 18,049 | |
| Airlines - 0.9% | |||
| Ryanair Holdings PLC sponsored ADR | 996,742 | 77,935 | |
| Electrical Equipment - 0.5% | |||
| Acuity Brands, Inc. | 105,997 | 23,171 | |
| Eaton Corp. PLC | 282,300 | 15,783 | |
| 38,954 | |||
| Industrial Conglomerates - 2.3% | |||
| 3M Co. | 292,100 | 45,921 | |
| General Electric Co. | 5,172,868 | 149,599 | |
| 195,520 | |||
| Machinery - 0.7% | |||
| Pentair PLC | 214,200 | 11,978 | |
| Wabtec Corp. | 547,054 | 45,334 | |
| 57,312 | |||
| Road & Rail - 0.4% | |||
| Norfolk Southern Corp. | 350,500 | 28,051 | |
| Trading Companies & Distributors - 0.1% | |||
| HD Supply Holdings, Inc. (a) | 292,100 | 8,702 | |
| TOTAL INDUSTRIALS | 553,334 | ||
| INFORMATION TECHNOLOGY - 9.5% | |||
| Electronic Equipment & Components - 0.1% | |||
| CDW Corp. | 194,700 | 8,701 | |
| Internet Software & Services - 3.7% | |||
| Alphabet, Inc. Class A (a) | 166,748 | 122,958 | |
| Facebook, Inc. Class A (a) | 1,529,700 | 155,984 | |
| Twitter, Inc. (a) | 973,600 | 27,709 | |
| 306,651 | |||
| IT Services - 0.7% | |||
| PayPal Holdings, Inc. (a) | 1,670,147 | 60,142 | |
| Semiconductors & Semiconductor Equipment - 0.5% | |||
| Intel Corp. | 1,314,400 | 44,506 | |
| Software - 4.5% | |||
| Adobe Systems, Inc. (a) | 2,372,760 | 210,369 | |
| FireEye, Inc. (a)(c) | 641,401 | 16,773 | |
| Microsoft Corp. | 2,946,700 | 155,114 | |
| 382,256 | |||
| TOTAL INFORMATION TECHNOLOGY | 802,256 | ||
| MATERIALS - 2.4% | |||
| Chemicals - 2.4% | |||
| Celanese Corp. Class A | 204,500 | 14,530 | |
| CF Industries Holdings, Inc. | 815,983 | 41,427 | |
| E.I. du Pont de Nemours & Co. | 940,650 | 59,637 | |
| LyondellBasell Industries NV Class A | 233,700 | 21,713 | |
| Potash Corp. of Saskatchewan, Inc. | 1,361,860 | 27,579 | |
| PPG Industries, Inc. | 132,700 | 13,835 | |
| The Dow Chemical Co. | 486,800 | 25,153 | |
| 203,874 | |||
| Metals & Mining - 0.0% | |||
| Silver Standard Resources, Inc. (a) | 194,700 | 1,342 | |
| TOTAL MATERIALS | 205,216 | ||
| TOTAL COMMON STOCKS | |||
| (Cost $6,952,089) | 8,345,252 | ||
| Money Market Funds - 3.2% | |||
| Fidelity Cash Central Fund, 0.18% (d) | 102,778,820 | 102,779 | |
| Fidelity Securities Lending Cash Central Fund, 0.19% (d)(e) | 170,673,300 | 170,673 | |
| TOTAL MONEY MARKET FUNDS | |||
| (Cost $273,452) | 273,452 | ||
| TOTAL INVESTMENT PORTFOLIO - 102.2% | |||
| (Cost $7,225,541) | 8,618,704 | ||
| NET OTHER ASSETS (LIABILITIES) - (2.2)% | (188,768) | ||
| NET ASSETS - 100% | $8,429,936 |
Legend
(a) Non-income producing
(b) Affiliated company
(c) Security or a portion of the security is on loan at period end.
(d) Affiliated fund that is generally available only to investment companies and other accounts managed by Fidelity Investments. The rate quoted is the annualized seven-day yield of the fund at period end. A complete unaudited listing of the fund's holdings as of its most recent quarter end is available upon request. In addition, each Fidelity Central Fund's financial statements, which are not covered by the Fund's Report of Independent Registered Public Accounting Firm, are available on the SEC's website or upon request.
(e) Investment made with cash collateral received from securities on loan.
Affiliated Central Funds
Information regarding fiscal year to date income earned by the Fund from investments in Fidelity Central Funds is as follows:
| Fund | Income earned |
| (Amounts in thousands) | |
| Fidelity Cash Central Fund | $746 |
| Fidelity Securities Lending Cash Central Fund | 1,286 |
| Total | $2,032 |
Other Affiliated Issuers
An affiliated company is a company in which the Fund has ownership of at least 5% of the voting securities. Fiscal year to date transactions with companies which are or were affiliates are as follows:
| Affiliate (Amounts in thousands) | Value, beginning of period | Purchases | Sales Proceeds | Dividend Income | Value, end of period |
| Cairn Homes PLC | $-- | $29,084 | $-- | $-- | $28,512 |
| Oxford Industries, Inc. | 52,998 | -- | 57,067 | 188 | -- |
| Total | $52,998 | $29,084 | $57,067 | $188 | $28,512 |
Investment Valuation
The following is a summary of the inputs used, as of October 31, 2015, involving the Fund's assets and liabilities carried at fair value. The inputs or methodology used for valuing securities may not be an indication of the risk associated with investing in those securities. For more information on valuation inputs, and their aggregation into the levels used below, please refer to the Investment Valuation section in the accompanying Notes to Financial Statements.
| Valuation Inputs at Reporting Date: | ||||
| Description | Total | Level 1 | Level 2 | Level 3 |
| (Amounts in thousands) | ||||
| Investments in Securities: | ||||
| Equities: | ||||
| Consumer Discretionary | $2,552,363 | $2,517,792 | $34,571 | $-- |
| Consumer Staples | 208,533 | 208,533 | -- | -- |
| Energy | 185,029 | 185,029 | -- | -- |
| Financials | 1,402,065 | 1,402,065 | -- | -- |
| Health Care | 2,436,456 | 2,386,102 | 50,354 | -- |
| Industrials | 553,334 | 553,334 | -- | -- |
| Information Technology | 802,256 | 802,256 | -- | -- |
| Materials | 205,216 | 205,216 | -- | -- |
| Money Market Funds | 273,452 | 273,452 | -- | -- |
| Total Investments in Securities: | $8,618,704 | $8,533,779 | $84,925 | $-- |
Other Information
Distribution of investments by country or territory of incorporation, as a percentage of Total Net Assets, is as follows (Unaudited):
| United States of America | 87.3% |
| Ireland | 5.3% |
| United Kingdom | 3.2% |
| Switzerland | 1.5% |
| Japan | 1.0% |
| Others (Individually Less Than 1%) | 1.7% |
| 100.0% |
See accompanying notes which are an integral part of the financial statements.
Financial Statements
Statement of Assets and Liabilities
| Amounts in thousands (except per-share amounts) | October 31, 2015 | |
| Assets | ||
| Investment in securities, at value (including securities loaned of $165,486) — See accompanying schedule: Unaffiliated issuers (cost $6,923,005) | $8,316,740 | |
| Fidelity Central Funds (cost $273,452) | 273,452 | |
| Other affiliated issuers (cost $29,084) | 28,512 | |
| Total Investments (cost $7,225,541) | $8,618,704 | |
| Receivable for investments sold | 240,104 | |
| Receivable for fund shares sold | 13,909 | |
| Dividends receivable | 9,122 | |
| Distributions receivable from Fidelity Central Funds | 175 | |
| Prepaid expenses | 24 | |
| Other receivables | 272 | |
| Total assets | 8,882,310 | |
| Liabilities | ||
| Payable for investments purchased | $257,866 | |
| Payable for fund shares redeemed | 18,502 | |
| Accrued management fee | 4,196 | |
| Other affiliated payables | 966 | |
| Other payables and accrued expenses | 171 | |
| Collateral on securities loaned, at value | 170,673 | |
| Total liabilities | 452,374 | |
| Net Assets | $8,429,936 | |
| Net Assets consist of: | ||
| Paid in capital | $6,102,772 | |
| Undistributed net investment income | 44,842 | |
| Accumulated undistributed net realized gain (loss) on investments and foreign currency transactions | 889,187 | |
| Net unrealized appreciation (depreciation) on investments and assets and liabilities in foreign currencies | 1,393,135 | |
| Net Assets | $8,429,936 | |
| Capital Appreciation: | ||
| Net Asset Value, offering price and redemption price per share ($5,906,402 ÷ 159,513 shares) | $37.03 | |
| Class K: | ||
| Net Asset Value, offering price and redemption price per share ($2,523,534 ÷ 68,003 shares) | $37.11 |
See accompanying notes which are an integral part of the financial statements.
Statement of Operations
| Amounts in thousands | Year ended October 31, 2015 | |
| Investment Income | ||
| Dividends (including $188 earned from other affiliated issuers) | $125,043 | |
| Income from Fidelity Central Funds | 2,032 | |
| Total income | 127,075 | |
| Expenses | ||
| Management fee | ||
| Basic fee | $47,991 | |
| Performance adjustment | 9,395 | |
| Transfer agent fees | 10,872 | |
| Accounting and security lending fees | 1,257 | |
| Custodian fees and expenses | 155 | |
| Independent trustees' compensation | 37 | |
| Registration fees | 122 | |
| Audit | 73 | |
| Legal | 28 | |
| Miscellaneous | 59 | |
| Total expenses before reductions | 69,989 | |
| Expense reductions | (688) | 69,301 |
| Net investment income (loss) | 57,774 | |
| Realized and Unrealized Gain (Loss) | ||
| Net realized gain (loss) on: | ||
| Investment securities: | ||
| Unaffiliated issuers | 962,293 | |
| Other affiliated issuers | 27,384 | |
| Foreign currency transactions | (324) | |
| Total net realized gain (loss) | 989,353 | |
| Change in net unrealized appreciation (depreciation) on: Investment securities | (743,659) | |
| Assets and liabilities in foreign currencies | 4 | |
| Total change in net unrealized appreciation (depreciation) | (743,655) | |
| Net gain (loss) | 245,698 | |
| Net increase (decrease) in net assets resulting from operations | $303,472 |
See accompanying notes which are an integral part of the financial statements.
Statement of Changes in Net Assets
| Amounts in thousands | Year ended October 31, 2015 | Year ended October 31, 2014 |
| Increase (Decrease) in Net Assets | ||
| Operations | ||
| Net investment income (loss) | $57,774 | $26,312 |
| Net realized gain (loss) | 989,353 | 989,698 |
| Change in net unrealized appreciation (depreciation) | (743,655) | 340,038 |
| Net increase (decrease) in net assets resulting from operations | 303,472 | 1,356,048 |
| Distributions to shareholders from net investment income | (24,987) | (33,391) |
| Distributions to shareholders from net realized gain | (877,095) | (749,339) |
| Total distributions | (902,082) | (782,730) |
| Share transactions - net increase (decrease) | 437,305 | (27,628) |
| Total increase (decrease) in net assets | (161,305) | 545,690 |
| Net Assets | ||
| Beginning of period | 8,591,241 | 8,045,551 |
| End of period (including undistributed net investment income of $44,842 and undistributed net investment income of $16,540, respectively) | $8,429,936 | $8,591,241 |
See accompanying notes which are an integral part of the financial statements.
Financial Highlights — Fidelity Capital Appreciation Fund
| Years ended October 31, | 2015 | 2014 | 2013 | 2012 | 2011 |
| Selected Per–Share Data | |||||
| Net asset value, beginning of period | $39.82 | $37.30 | $29.21 | $25.51 | $24.03 |
| Income from Investment Operations | |||||
| Net investment income (loss)A | .24 | .11 | .19 | .15 | .06 |
| Net realized and unrealized gain (loss) | 1.13 | 6.05 | 8.66 | 3.59 | 1.44 |
| Total from investment operations | 1.37 | 6.16 | 8.85 | 3.74 | 1.50 |
| Distributions from net investment income | (.10) | (.14) | (.17) | (.04) | (.02) |
| Distributions from net realized gain | (4.06) | (3.50) | (.59) | – | – |
| Total distributions | (4.16) | (3.64) | (.76) | (.04) | (.02) |
| Net asset value, end of period | $37.03 | $39.82 | $37.30 | $29.21 | $25.51 |
| Total ReturnB | 3.50% | 17.86% | 31.03% | 14.70% | 6.24% |
| Ratios to Average Net AssetsC,D | |||||
| Expenses before reductions | .83% | .82% | .79% | .96% | .91% |
| Expenses net of fee waivers, if any | .83% | .82% | .79% | .96% | .91% |
| Expenses net of all reductions | .82% | .81% | .77% | .95% | .90% |
| Net investment income (loss) | .63% | .28% | .57% | .53% | .25% |
| Supplemental Data | |||||
| Net assets, end of period (in millions) | $5,906 | $6,132 | $5,920 | $4,678 | $4,319 |
| Portfolio turnover rateE | 126% | 112% | 156% | 169% | 182% |
A Calculated based on average shares outstanding during the period.
B Total returns would have been lower if certain expenses had not been reduced during the applicable periods shown.
C Fees and expenses of any underlying Fidelity Central Funds are not included in the Fund's expense ratio. The Fund indirectly bears its proportionate share of the expenses of any underlying Fidelity Central Funds.
D Expense ratios reflect operating expenses of the class. Expenses before reductions do not reflect amounts reimbursed by the investment adviser or reductions from brokerage service arrangements or reductions from other expense offset arrangements and do not represent the amount paid by the class during periods when reimbursements or reductions occur. Expenses net of fee waivers reflect expenses after reimbursement by the investment adviser but prior to reductions from brokerage service arrangements or other expense offset arrangements. Expenses net of all reductions represent the net expenses paid by the class.
E Amount does not include the portfolio activity of any underlying Fidelity Central Funds.
See accompanying notes which are an integral part of the financial statements.
Financial Highlights — Fidelity Capital Appreciation Fund Class K
| Years ended October 31, | 2015 | 2014 | 2013 | 2012 | 2011 |
| Selected Per–Share Data | |||||
| Net asset value, beginning of period | $39.90 | $37.38 | $29.28 | $25.57 | $24.09 |
| Income from Investment Operations | |||||
| Net investment income (loss)A | .28 | .15 | .23 | .19 | .10 |
| Net realized and unrealized gain (loss) | 1.14 | 6.06 | 8.67 | 3.61 | 1.44 |
| Total from investment operations | 1.42 | 6.21 | 8.90 | 3.80 | 1.54 |
| Distributions from net investment income | (.15) | (.19) | (.21) | (.09) | (.06) |
| Distributions from net realized gain | (4.06) | (3.50) | (.59) | – | – |
| Total distributions | (4.21) | (3.69) | (.80) | (.09) | (.06) |
| Net asset value, end of period | $37.11 | $39.90 | $37.38 | $29.28 | $25.57 |
| Total ReturnB | 3.62% | 17.97% | 31.19% | 14.92% | 6.41% |
| Ratios to Average Net AssetsC,D | |||||
| Expenses before reductions | .72% | .70% | .66% | .81% | .75% |
| Expenses net of fee waivers, if any | .72% | .70% | .66% | .81% | .75% |
| Expenses net of all reductions | .72% | .70% | .63% | .80% | .74% |
| Net investment income (loss) | .74% | .40% | .70% | .68% | .41% |
| Supplemental Data | |||||
| Net assets, end of period (in millions) | $2,524 | $2,460 | $2,125 | $1,438 | $856 |
| Portfolio turnover rateE | 126% | 112% | 156% | 169% | 182% |
A Calculated based on average shares outstanding during the period.
B Total returns would have been lower if certain expenses had not been reduced during the applicable periods shown.
C Fees and expenses of any underlying Fidelity Central Funds are not included in the Fund's expense ratio. The Fund indirectly bears its proportionate share of the expenses of any underlying Fidelity Central Funds.
D Expense ratios reflect operating expenses of the class. Expenses before reductions do not reflect amounts reimbursed by the investment adviser or reductions from brokerage service arrangements or reductions from other expense offset arrangements and do not represent the amount paid by the class during periods when reimbursements or reductions occur. Expenses net of fee waivers reflect expenses after reimbursement by the investment adviser but prior to reductions from brokerage service arrangements or other expense offset arrangements. Expenses net of all reductions represent the net expenses paid by the class.
E Amount does not include the portfolio activity of any underlying Fidelity Central Funds.
See accompanying notes which are an integral part of the financial statements.
Notes to Financial Statements
For the period ended October 31, 2015
(Amounts in thousands except percentages)
1. Organization.
Fidelity Capital Appreciation Fund (the Fund) is a fund of Fidelity Capital Trust (the Trust) and is authorized to issue an unlimited number of shares. The Trust is registered under the Investment Company Act of 1940, as amended (the 1940 Act), as an open-end management investment company organized as a Massachusetts business trust. The Fund offers Capital Appreciation and Class K shares, each of which has equal rights as to assets and voting privileges. Each class has exclusive voting rights with respect to matters that affect that class.
2. Investments in Fidelity Central Funds.
The Fund invests in Fidelity Central Funds, which are open-end investment companies generally available only to other investment companies and accounts managed by the investment adviser and its affiliates. The Fund's Schedule of Investments lists each of the Fidelity Central Funds held as of period end, if any, as an investment of the Fund, but does not include the underlying holdings of each Fidelity Central Fund. As an Investing Fund, the Fund indirectly bears its proportionate share of the expenses of the underlying Fidelity Central Funds.
The Money Market Central Funds seek preservation of capital and current income and are managed by Fidelity Investments Money Management, Inc. (FIMM), an affiliate of the investment adviser. Annualized expenses of the Money Market Central Funds as of their most recent shareholder report date are less than .005%.
A complete unaudited list of holdings for each Fidelity Central Fund is available upon request or at the Securities and Exchange Commission (the SEC) website at www.sec.gov. In addition, the financial statements of the Fidelity Central Funds, which are not covered by the Fund's Report of Independent Registered Public Accounting Firm, are available on the SEC website or upon request.
3. Significant Accounting Policies.
The financial statements have been prepared in conformity with accounting principles generally accepted in the United States of America (GAAP), which require management to make certain estimates and assumptions at the date of the financial statements. Actual results could differ from those estimates. Subsequent events, if any, through the date that the financial statements were issued have been evaluated in the preparation of the financial statements. The following summarizes the significant accounting policies of the Fund:
Investment Valuation. Investments are valued as of 4:00 p.m. Eastern time on the last calendar day of the period. The Board of Trustees (the Board) has delegated the day to day responsibility for the valuation of the Fund's investments to the Fidelity Management & Research Company (FMR) Fair Value Committee (the Committee). In accordance with valuation policies and procedures approved by the Board, the Fund attempts to obtain prices from one or more third party pricing vendors or brokers to value its investments. When current market prices, quotations or currency exchange rates are not readily available or reliable, investments will be fair valued in good faith by the Committee, in accordance with procedures adopted by the Board. Factors used in determining fair value vary by investment type and may include market or investment specific events. The frequency with which these procedures are used cannot be predicted and they may be utilized to a significant extent. The Committee oversees the Fund's valuation policies and procedures and reports to the Board on the Committee's activities and fair value determinations. The Board monitors the appropriateness of the procedures used in valuing the Fund's investments and ratifies the fair value determinations of the Committee.
The Fund categorizes the inputs to valuation techniques used to value its investments into a disclosure hierarchy consisting of three levels as shown below:
- Level 1 – quoted prices in active markets for identical investments
- Level 2 – other significant observable inputs (including quoted prices for similar investments, interest rates, prepayment speeds, etc.)
- Level 3 – unobservable inputs (including the Fund's own assumptions based on the best information available)
Valuation techniques used to value the Fund's investments by major category are as follows:
Equity securities, including restricted securities, for which market quotations are readily available, are valued at the last reported sale price or official closing price as reported by a third party pricing vendor on the primary market or exchange on which they are traded and are categorized as Level 1 in the hierarchy. In the event there were no sales during the day or closing prices are not available, securities are valued at the last quoted bid price or may be valued using the last available price and are generally categorized as Level 2 in the hierarchy. For foreign equity securities, when market or security specific events arise, comparisons to the valuation of American Depositary Receipts (ADRs), futures contracts, Exchange-Traded Funds (ETFs) and certain indexes as well as quoted prices for similar securities may be used and would be categorized as Level 2 in the hierarchy. Utilizing these techniques may result in transfers between Level 1 and Level 2. For equity securities, including restricted securities, where observable inputs are limited, assumptions about market activity and risk are used and these securities may be categorized as Level 3 in the hierarchy.
Investments in open-end mutual funds, including the Fidelity Central Funds, are valued at their closing net asset value (NAV) each business day and are categorized as Level 1 in the hierarchy.
Changes in valuation techniques may result in transfers in or out of an assigned level within the disclosure hierarchy. The aggregate value of investments by input level as of October 31, 2015 is included at the end of the Fund's Schedule of Investments.
Foreign Currency. The Fund may use foreign currency contracts to facilitate transactions in foreign-denominated securities. Gains and losses from these transactions may arise from changes in the value of the foreign currency or if the counterparties do not perform under the contracts' terms.
Foreign-denominated assets, including investment securities, and liabilities are translated into U.S. dollars at the exchange rates at period end. Purchases and sales of investment securities, income and dividends received and expenses denominated in foreign currencies are translated into U.S. dollars at the exchange rate in effect on the transaction date.
The effects of exchange rate fluctuations on investments are included with the net realized and unrealized gain (loss) on investment securities. Other foreign currency transactions resulting in realized and unrealized gain (loss) are disclosed separately.
Investment Transactions and Income. For financial reporting purposes, the Fund's investment holdings and NAV include trades executed through the end of the last business day of the period. The NAV per share for processing shareholder transactions is calculated as of the close of business of the New York Stock Exchange (NYSE), normally 4:00 p.m. Eastern time and includes trades executed through the end of the prior business day. Gains and losses on securities sold are determined on the basis of identified cost and may include proceeds received from litigation. Dividend income is recorded on the ex-dividend date, except for certain dividends from foreign securities where the ex-dividend date may have passed, which are recorded as soon as the Fund is informed of the ex-dividend date. Non-cash dividends included in dividend income, if any, are recorded at the fair market value of the securities received. Income and capital gain distributions from Fidelity Central Funds, if any, are recorded on the ex-dividend date. Distributions received on securities that represent a return of capital or capital gain are recorded as a reduction of cost of investments and/or as a realized gain. Subsequent to ex-dividend date the Fund determines the components of these distributions, based upon receipt of tax filings or other correspondence relating to the underlying investment. Investment income is recorded net of foreign taxes withheld where recovery of such taxes is uncertain.
Class Allocations and Expenses. Investment income, realized and unrealized capital gains and losses, common expenses of the Fund, and certain fund-level expense reductions, if any, are allocated daily on a pro-rata basis to each class based on the relative net assets of each class to the total net assets of the Fund. Each class differs with respect to transfer agent fees incurred. Certain expense reductions may also differ by class. For the reporting period, the allocated portion of income and expenses to each class as a percent of its average net assets may vary due to the timing of recording these transactions in relation to fluctuating net assets of the classes. Expenses directly attributable to a fund are charged to that fund. Expenses attributable to more than one fund are allocated among the respective funds on the basis of relative net assets or other appropriate methods. Expense estimates are accrued in the period to which they relate and adjustments are made when actual amounts are known.
Deferred Trustee Compensation. Under a Deferred Compensation Plan (the Plan), independent Trustees may elect to defer receipt of a portion of their annual compensation. Deferred amounts are invested in a cross-section of Fidelity funds, are marked-to-market and remain in the Fund until distributed in accordance with the Plan. The investment of deferred amounts and the offsetting payable to the Trustees are included in the accompanying Statement of Assets and Liabilities.
Income Tax Information and Distributions to Shareholders. Each year, the Fund intends to qualify as a regulated investment company under Subchapter M of the Internal Revenue Code, including distributing substantially all of its taxable income and realized gains. As a result, no provision for U.S. Federal income taxes is required. As of October 31, 2015, the Fund did not have any unrecognized tax benefits in the financial statements; nor is the Fund aware of any tax positions for which it is reasonably possible that the total amounts of unrecognized tax benefits will significantly change in the next twelve months. The Fund files a U.S. federal tax return, in addition to state and local tax returns as required. The Fund's federal income tax returns are subject to examination by the Internal Revenue Service (IRS) for a period of three fiscal years after they are filed. State and local tax returns may be subject to examination for an additional fiscal year depending on the jurisdiction. Foreign taxes are provided for based on the Fund's understanding of the tax rules and rates that exist in the foreign markets in which it invests.
Distributions are declared and recorded on the ex-dividend date. Income dividends and capital gain distributions are declared separately for each class. Income and capital gain distributions are determined in accordance with income tax regulations, which may differ from GAAP. In addition, the Fund claimed a portion of the payment made to redeeming shareholders as a distribution for income tax purposes.
Capital accounts within the financial statements are adjusted for permanent book-tax differences. These adjustments have no impact on net assets or the results of operations. Capital accounts are not adjusted for temporary book-tax differences which will reverse in a subsequent period.
Book-tax differences are primarily due to foreign currency transactions, deferred trustees compensation and losses deferred due to wash sales.
The federal tax cost of investment securities and unrealized appreciation (depreciation) as of period end were as follows:
| Gross unrealized appreciation | $1,580,196 |
| Gross unrealized depreciation | (196,921) |
| Net unrealized appreciation (depreciation) on securities | $1,383,275 |
| Tax Cost | $7,235,429 |
The tax-based components of distributable earnings as of period end were as follows:
| Undistributed ordinary income | $44,868 |
| Undistributed long-term capital gain | $899,075 |
| Net unrealized appreciation (depreciation) on securities and other investments | $1,383,319 |
The tax character of distributions paid was as follows:
| October 31, 2015 | October 31, 2014 | |
| Ordinary Income | $76,670 | $ 372,930 |
| Long-term Capital Gains | 825,412 | 409,800 |
| Total | $902,082 | $ 782,730 |
4. Purchases and Sales of Investments.
Purchases and sales of securities, other than short-term securities, aggregated $10,395,406 and $10,856,820, respectively.
5. Fees and Other Transactions with Affiliates.
Management Fee. Fidelity Management & Research Company (the investment adviser) and its affiliates provide the Fund with investment management related services for which the Fund pays a monthly management fee. The management fee is the sum of an individual fund fee rate that is based on an annual rate of .30% of the Fund's average net assets and an annualized group fee rate that averaged .25% during the period. The group fee rate is based upon the average net assets of all the mutual funds advised by the investment adviser, including any mutual funds previously advised by the investment adviser that are currently advised by Fidelity SelectCo, LLC, an affiliate of the investment adviser. The group fee rate decreases as assets under management increase and increases as assets under management decrease. In addition, the management fee is subject to a performance adjustment (up to a maximum of +/- .20% of the Fund's average net assets over a 36 month performance period). The upward or downward adjustment to the management fee is based on the relative investment performance of Capital Appreciation as compared to its benchmark index, the S&P 500 Index, over the same 36 month performance period. For the reporting period, the total annual management fee rate, including the performance adjustment, was .66% of the Fund's average net assets. The performance adjustment included in the management fee rate may be higher or lower than the maximum performance adjustment rate due to the difference between the average net assets for the reporting and performance periods.
Transfer Agent Fees. Fidelity Investments Institutional Operations Company, Inc., (FIIOC), an affiliate of the investment adviser, is the transfer, dividend disbursing and shareholder servicing agent for each class of the Fund. FIIOC receives account fees and asset-based fees that vary according to the account size and type of account of the shareholders of Capital Appreciation. FIIOC receives an asset-based fee of Class K's average net assets. FIIOC pays for typesetting, printing and mailing of shareholder reports, except proxy statements.
For the period, transfer agent fees for each class were as follows:
| Amount | % of Class-Level Average Net Assets | |
| Capital Appreciation | $9,657 | .16 |
| Class K | 1,215 | .05 |
| $ 10,872 |
Accounting and Security Lending Fees. Fidelity Service Company, Inc. (FSC), an affiliate of the investment adviser, maintains the Fund's accounting records. The accounting fee is based on the level of average net assets for each month. Under a separate contract, FSC administers the security lending program. The security lending fee is based on the number and duration of lending transactions.
Brokerage Commissions. The Fund placed a portion of its portfolio transactions with brokerage firms which are affiliates of the investment adviser. Brokerage commissions are included in net realized gain (loss) and change in net unrealized appreciation (depreciation) in the Statement of Operations. The commissions paid to these affiliated firms were $171 for the period.
6. Committed Line of Credit.
The Fund participates with other funds managed by the investment adviser or an affiliate in a $4.25 billion credit facility (the "line of credit") to be utilized for temporary or emergency purposes to fund shareholder redemptions or for other short-term liquidity purposes. The Fund has agreed to pay commitment fees on its pro-rata portion of the line of credit, which amounted to $13 and is reflected in Miscellaneous expenses on the Statement of Operations. During the period, the Fund did not borrow on this line of credit.
7. Security Lending.
The Fund lends portfolio securities through a lending agent from time to time in order to earn additional income. For equity securities, a lending agent is used and may loan securities to certain qualified borrowers, including Fidelity Capital Markets (FCM), a broker-dealer affiliated with the Fund. On the settlement date of the loan, the Fund receives collateral (in the form of U.S. Treasury obligations, letters of credit and/or cash) against the loaned securities and maintains collateral in an amount not less than 100% of the market value of the loaned securities during the period of the loan. The market value of the loaned securities is determined at the close of business of the Fund and any additional required collateral is delivered to the Fund on the next business day. The Fund or borrower may terminate the loan at any time, and if the borrower defaults on its obligation to return the securities loaned because of insolvency or other reasons, the Fund may apply collateral received from the borrower against the obligation. The Fund may experience delays and costs in recovering the securities loaned. Any cash collateral received is invested in the Fidelity Securities Lending Cash Central Fund. The value of loaned securities and cash collateral at period end are disclosed on the Fund's Statement of Assets and Liabilities. The value of securities loaned to FCM at period end was $2,381. Security lending income represents the income earned on investing cash collateral, less rebates paid to borrowers and any lending agent fees associated with the loan, plus any premium payments received for lending certain types of securities. Security lending income is presented in the Statement of Operations as a component of income from Fidelity Central Funds. Total security lending income during the period amounted to $1,286, including $31 from securities loaned to FCM.
8. Expense Reductions.
Commissions paid to certain brokers with whom the investment adviser, or its affiliates, places trades on behalf of the Fund include an amount in addition to trade execution, which may be rebated back to the Fund to offset certain expenses. This amount totaled $513 for the period.
In addition, through arrangements with the Fund's custodian, credits realized as a result of certain uninvested cash balances were used to reduce the Fund's expenses. During the period, these credits reduced the Fund's custody expenses by $1.
In addition, during the period the investment adviser reimbursed and/or waived a portion of fund-level operating expenses in the amount of $36 and a portion of class-level operating expenses as follows:
| Amount | |
| Capital Appreciation | $138 |
9. Distributions to Shareholders.
Distributions to shareholders of each class were as follows:
| Years ended October 31, | 2015 | 2014 |
| From net investment income | ||
| Capital Appreciation | $15,699 | $22,746 |
| Class K | 9,288 | 10,645 |
| Total | $24,987 | $33,391 |
| From net realized gain | ||
| Capital Appreciation | $624,269 | $552,386 |
| Class K | 252,826 | 196,953 |
| Total | $877,095 | $749,339 |
10. Share Transactions.
Share transactions for each class were as follows and may contain automatic conversions between classes or exchanges between funds:
| Shares | Shares | Dollars | Dollars | |
| Years ended October 31, | 2015 | 2014 | 2015 | 2014 |
| Capital Appreciation | ||||
| Shares sold | 17,374 | 18,813 | $651,570 | $698,436 |
| Reinvestment of distributions | 16,417 | 15,586 | 604,128 | 545,521 |
| Shares redeemed | (28,264) | (39,134) | (1,053,538) | (1,434,918) |
| Net increase (decrease) | 5,527 | (4,735) | $202,160 | $(190,961) |
| Class K | ||||
| Shares sold | 13,762 | 17,919 | $515,116 | $655,739 |
| Reinvestment of distributions | 7,113 | 5,926 | 262,114 | 207,598 |
| Shares redeemed | (14,510) | (19,075) | (542,085) | (700,004) |
| Net increase (decrease) | 6,365 | 4,770 | $235,145 | $163,333 |
11. Other.
The Fund's organizational documents provide former and current trustees and officers with a limited indemnification against liabilities arising in connection with the performance of their duties to the Fund. In the normal course of business, the Fund may also enter into contracts that provide general indemnifications. The Fund's maximum exposure under these arrangements is unknown as this would be dependent on future claims that may be made against the Fund. The risk of material loss from such claims is considered remote.
Report of Independent Registered Public Accounting Firm
To the Trustees of Fidelity Capital Trust and Shareholders of Fidelity® Capital Appreciation Fund:
In our opinion, the accompanying statement of assets and liabilities, including the schedule of investments, and the related statements of operations and of changes in net assets and the financial highlights present fairly, in all material respects, the financial position of Fidelity® Capital Appreciation Fund (a fund of Fidelity Capital Trust) at October 31, 2015, the results of its operations for the year then ended, the changes in its net assets for each of the two years in the period then ended and the financial highlights for each of the five years in the period then ended, in conformity with accounting principles generally accepted in the United States of America. These financial statements and financial highlights (hereafter referred to as “financial statements”) are the responsibility of the Fidelity® Capital Appreciation Fund’s management. Our responsibility is to express an opinion on these financial statements based on our audits. We conducted our audits of these financial statements in accordance with the standards of the Public Company Accounting Oversight Board (United States). Those standards require that we plan and perform the audit to obtain reasonable assurance about whether the financial statements are free of material misstatement. An audit includes examining, on a test basis, evidence supporting the amounts and disclosures in the financial statements, assessing the accounting principles used and significant estimates made by management, and evaluating the overall financial statement presentation. We believe that our audits, which included confirmation of securities at October 31, 2015 by correspondence with the custodian and brokers, provide a reasonable basis for our opinion.
PricewaterhouseCoopers LLP
Boston, Massachusetts
December 16, 2015
Trustees and Officers
The Trustees, Members of the Advisory Board (if any), and officers of the trust and fund, as applicable, are listed below. The Board of Trustees governs the fund and is responsible for protecting the interests of shareholders. The Trustees are experienced executives who meet periodically throughout the year to oversee the fund's activities, review contractual arrangements with companies that provide services to the fund, oversee management of the risks associated with such activities and contractual arrangements, and review the fund's performance. Each of the Trustees oversees 170 funds.
The Trustees hold office without limit in time except that (a) any Trustee may resign; (b) any Trustee may be removed by written instrument, signed by at least two-thirds of the number of Trustees prior to such removal; (c) any Trustee who requests to be retired or who has become incapacitated by illness or injury may be retired by written instrument signed by a majority of the other Trustees; and (d) any Trustee may be removed at any special meeting of shareholders by a two-thirds vote of the outstanding voting securities of the trust. Each Trustee who is not an interested person (as defined in the 1940 Act) of the trust and the fund is referred to herein as an Independent Trustee. Each Independent Trustee shall retire not later than the last day of the calendar year in which his or her 75th birthday occurs. The Independent Trustees may waive this mandatory retirement age policy with respect to individual Trustees. Officers and Advisory Board Members hold office without limit in time, except that any officer or Advisory Board Member may resign or may be removed by a vote of a majority of the Trustees at any regular meeting or any special meeting of the Trustees. Except as indicated, each individual has held the office shown or other offices in the same company for the past five years.
The fund’s Statement of Additional Information (SAI) includes more information about the Trustees. To request a free copy, call Fidelity at 1-800-835-5092.
Experience, Skills, Attributes, and Qualifications of the Trustees. The Governance and Nominating Committee has adopted a statement of policy that describes the experience, qualifications, attributes, and skills that are necessary and desirable for potential Independent Trustee candidates (Statement of Policy). The Board believes that each Trustee satisfied at the time he or she was initially elected or appointed a Trustee, and continues to satisfy, the standards contemplated by the Statement of Policy. The Governance and Nominating Committee also engages professional search firms to help identify potential Independent Trustee candidates who have the experience, qualifications, attributes, and skills consistent with the Statement of Policy. From time to time, additional criteria based on the composition and skills of the current Independent Trustees, as well as experience or skills that may be appropriate in light of future changes to board composition, business conditions, and regulatory or other developments, have also been considered by the professional search firms and the Governance and Nominating Committee. In addition, the Board takes into account the Trustees' commitment and participation in Board and committee meetings, as well as their leadership of standing and ad hoc committees throughout their tenure.
In determining that a particular Trustee was and continues to be qualified to serve as a Trustee, the Board has considered a variety of criteria, none of which, in isolation, was controlling. The Board believes that, collectively, the Trustees have balanced and diverse experience, qualifications, attributes, and skills, which allow the Board to operate effectively in governing the fund and protecting the interests of shareholders. Information about the specific experience, skills, attributes, and qualifications of each Trustee, which in each case led to the Board's conclusion that the Trustee should serve (or continue to serve) as a trustee of the fund, is provided below.
Board Structure and Oversight Function. James C. Curvey is an interested person and currently serves as Chairman. The Trustees have determined that an interested Chairman is appropriate and benefits shareholders because an interested Chairman has a personal and professional stake in the quality and continuity of services provided to the fund. Independent Trustees exercise their informed business judgment to appoint an individual of their choosing to serve as Chairman, regardless of whether the Trustee happens to be independent or a member of management. The Independent Trustees have determined that they can act independently and effectively without having an Independent Trustee serve as Chairman and that a key structural component for assuring that they are in a position to do so is for the Independent Trustees to constitute a substantial majority for the Board. The Independent Trustees also regularly meet in executive session. Ned C. Lautenbach serves as Chairman of the Independent Trustees and as such (i) acts as a liaison between the Independent Trustees and management with respect to matters important to the Independent Trustees and (ii) with management prepares agendas for Board meetings.
Fidelity® funds are overseen by different Boards of Trustees. The fund's Board oversees Fidelity's high income and certain equity funds, and other Boards oversee Fidelity's investment-grade bond, money market, asset allocation, and sector funds. The asset allocation funds may invest in Fidelity® funds overseen by the fund's Board. The use of separate Boards, each with its own committee structure, allows the Trustees of each group of Fidelity® funds to focus on the unique issues of the funds they oversee, including common research, investment, and operational issues. On occasion, the separate Boards establish joint committees to address issues of overlapping consequences for the Fidelity® funds overseen by each Board.
The Trustees operate using a system of committees to facilitate the timely and efficient consideration of all matters of importance to the Trustees, the fund, and fund shareholders and to facilitate compliance with legal and regulatory requirements and oversight of the fund's activities and associated risks. The Board, acting through its committees, has charged FMR and its affiliates with (i) identifying events or circumstances the occurrence of which could have demonstrably adverse effects on the fund's business and/or reputation; (ii) implementing processes and controls to lessen the possibility that such events or circumstances occur or to mitigate the effects of such events or circumstances if they do occur; and (iii) creating and maintaining a system designed to evaluate continuously business and market conditions in order to facilitate the identification and implementation processes described in (i) and (ii) above. Because the day-to-day operations and activities of the fund are carried out by or through FMR, its affiliates, and other service providers, the fund's exposure to risks is mitigated but not eliminated by the processes overseen by the Trustees. While each of the Board's committees has responsibility for overseeing different aspects of the fund's activities, oversight is exercised primarily through the Operations, Audit, and Compliance Committees. In addition, the Independent Trustees have worked with FMR to enhance the Board's oversight of investment and financial risks, legal and regulatory risks, technology risks, and operational risks, including the development of additional risk reporting to the Board. For example, a working group comprised of Independent Trustees and FMR has worked and continues to work to review the Fidelity® funds' valuation-related activities, reporting and risk management. Appropriate personnel, including but not limited to the fund's Chief Compliance Officer (CCO), FMR's internal auditor, the independent accountants, the fund's Treasurer and portfolio management personnel, make periodic reports to the Board's committees, as appropriate, including an annual review of Fidelity's risk management program for the Fidelity® funds. The responsibilities of each standing committee, including their oversight responsibilities, are described further under "Standing Committees of the Trustees."
Interested Trustees*:
Correspondence intended for a Trustee who is an interested person may be sent to Fidelity Investments, 245 Summer Street, Boston, Massachusetts 02210.
Name, Year of Birth; Principal Occupations and Other Relevant Experience+
James C. Curvey (1935)
Year of Election or Appointment: 2007
Trustee
Chairman of the Board of Trustees
Mr. Curvey also serves as Trustee of other Fidelity® funds. Mr. Curvey is a Director of Fidelity Research & Analysis Co. (investment adviser firm, 2009-present), and Vice Chairman (2007-present) and Director of FMR LLC (diversified financial services company). In addition, Mr. Curvey serves as an Overseer for the Boston Symphony Orchestra and a member of the board of Artis-Naples, Naples, Florida, and as a Trustee for Brewster Academy, Wolfeboro, New Hampshire. Previously, Mr. Curvey served as a Director of Fidelity Investments Money Management, Inc. (investment adviser firm, 2009-2014) and a Director of FMR and FMR Co., Inc. (investment adviser firms, 2007-2014).
Charles S. Morrison (1960)
Year of Election or Appointment: 2014
Trustee
Mr. Morrison also serves as Trustee of other funds. He serves as a Director of Fidelity Investments Money Management, Inc. (FIMM) (investment adviser firm, 2014-present), Director of Fidelity SelectCo, LLC (investment adviser firm, 2014-present), President, Asset Management (2014-present), and is an employee of Fidelity Investments. Previously, Mr. Morrison served as Vice President of Fidelity's Fixed Income and Asset Allocation Funds (2012-2014), President, Fixed Income (2011-2014), Vice President of Fidelity's Money Market Funds (2005-2009), President, Money Market Group Leader of FMR (investment adviser firm, 2009), and Senior Vice President, Money Market Group of FMR (2004-2009). Mr. Morrison also served as Vice President of Fidelity's Bond Funds (2002-2005), certain Balanced Funds (2002-2005), and certain Asset Allocation Funds (2002-2007), and as Senior Vice President (2002-2005) of Fidelity's Bond Division.
* Determined to be an “Interested Trustee” by virtue of, among other things, his or her affiliation with the trust or various entities under common control with FMR.
+ The information includes the Trustee's principal occupation during the last five years and other information relating to the experience, attributes, and skills relevant to the Trustee's qualifications to serve as a Trustee, which led to the conclusion that the Trustee should serve as a Trustee for the fund.
Independent Trustees:
Correspondence intended for an Independent Trustee may be sent to Fidelity Investments, P.O. Box 55235, Boston, Massachusetts 02205-5235.
Name, Year of Birth; Principal Occupations and Other Relevant Experience+
Dennis J. Dirks (1948)
Year of Election or Appointment: 2005
Trustee
Mr. Dirks also serves as Trustee of other Fidelity® funds. Prior to his retirement in May 2003, Mr. Dirks was Chief Operating Officer and a member of the Board of The Depository Trust & Clearing Corporation (DTCC). He also served as President, Chief Operating Officer, and Board member of The Depository Trust Company (DTC) and President and Board member of the National Securities Clearing Corporation (NSCC). In addition, Mr. Dirks served as Chief Executive Officer and Board member of the Government Securities Clearing Corporation, Chief Executive Officer and Board member of the Mortgage-Backed Securities Clearing Corporation, as a Trustee and a member of the Finance Committee of Manhattan College (2005-2008), as a Trustee and a member of the Finance Committee of AHRC of Nassau County (2006-2008), and as a member of the Independent Directors Council (IDC) Governing Council (2010-2015). Mr. Dirks is a member of the Board of Directors for The Brookville Center for Children's Services, Inc. (2009-present).
Alan J. Lacy (1953)
Year of Election or Appointment: 2008
Trustee
Mr. Lacy also serves as Trustee of other Fidelity® funds. Mr. Lacy serves as a member of the Board of Directors of Dave & Buster's Entertainment, Inc. (restaurant and entertainment complexes, 2010-present) and Bristol-Myers Squibb Company (global pharmaceuticals, 2008-present). In addition, Mr. Lacy served as Senior Adviser (2007-2014) of Oak Hill Capital Partners, L.P. (private equity) and also served as Chief Executive Officer (2000-2005) and Vice Chairman (2005-2006) of Sears Holdings Corporation and Sears, Roebuck and Co. (retail). Mr. Lacy is a member of the Board of Trustees of The National Parks Conservation Association (2006-present). Previously, Mr. Lacy served as Chairman of the Board of Trustees of the National Parks Conservation Association (2008-2011) and as a member of the Board of Directors for The Western Union Company (global money transfer, 2006-2011), The Hillman Companies, Inc. (hardware wholesalers, 2010-2014), and Earth Fare, Inc. (retail grocery, 2010-2014).
Ned C. Lautenbach (1944)
Year of Election or Appointment: 2000
Trustee
Chairman of the Independent Trustees
Mr. Lautenbach also serves as Trustee of other Fidelity® funds. Mr. Lautenbach currently serves as the Lead Director of the Eaton Corporation Board of Directors (diversified industrial, 1997-present). Mr. Lautenbach is Chairman of the Board of Directors of Artis-Naples in Naples, Florida (2012-present), a member of the Council on Foreign Relations (1994-present), and a member of the Board of Governors, State University System of Florida (2013-present). Previously, Mr. Lautenbach was a Partner/Advisory Partner at Clayton, Dubilier & Rice, LLC (private equity investment, 1998-2010), as well as a Director of Sony Corporation (2006-2007).
Joseph Mauriello (1944)
Year of Election or Appointment: 2008
Trustee
Mr. Mauriello also serves as Trustee of other Fidelity® funds. Prior to his retirement in January 2006, Mr. Mauriello served in numerous senior management positions including Deputy Chairman and Chief Operating Officer (2004-2005), and Vice Chairman of Financial Services (2002-2004) of KPMG LLP US (professional services, 1965-2005). Mr. Mauriello currently serves as a member of the Board of Directors of XL Group plc. (global insurance and re-insurance, 2006-present) and the Independent Directors Council (IDC) Governing Council (2015-present). Previously, Mr. Mauriello served as a Director of the Hamilton Funds of the Bank of New York (2006-2007) and of Arcadia Resources Inc. (health care services and products, 2007-2012).
Robert W. Selander (1950)
Year of Election or Appointment: 2011
Trustee
Mr. Selander also serves as Trustee of other Fidelity® funds. Mr. Selander serves as a Director of The Western Union Company (global money transfer, 2014-present). Previously, Mr. Selander served as a Member of the Advisory Board of other Fidelity® funds (2011), and Executive Vice Chairman (2010), Chief Executive Officer (2009-2010), and President and Chief Executive Officer (1997-2009) of Mastercard, Inc.
Cornelia M. Small (1944)
Year of Election or Appointment: 2005
Trustee
Ms. Small also serves as Trustee of other Fidelity® funds. Ms. Small is a member of the Board of Directors (2009-present) and Chair of the Investment Committee (2010-present) of the Teagle Foundation. Ms. Small also serves on the Investment Committee of the Berkshire Taconic Community Foundation (2008-present). Previously, Ms. Small served as Chairperson (2002-2008) and a member of the Investment Committee and Chairperson (2008-2012) and a member of the Board of Trustees of Smith College. In addition, Ms. Small served as Chief Investment Officer, Director of Global Equity Investments, and a member of the Board of Directors of Scudder, Stevens & Clark and Scudder Kemper Investments.
William S. Stavropoulos (1939)
Year of Election or Appointment: 2002
Trustee
Vice Chairman of the Independent Trustees
Mr. Stavropoulos also serves as Trustee of other Fidelity® funds. Mr. Stavropoulos serves as President and Founder of the Michigan Baseball Foundation, the Great Lakes Loons (2007-present). Mr. Stavropoulos is Chairman Emeritus of the Board of Directors of The Dow Chemical Company, where he previously served in numerous senior management positions, including President, CEO (1995-2000; 2002-2004), Chairman of the Executive Committee (2000-2006), and as a member of the Board of Directors (1990-2006). Currently, Mr. Stavropoulos is Chairman of the Board of Directors of Univar Inc. (global distributor of commodity and specialty chemicals), a Director of Teradata Corporation (data warehousing and technology solutions), and Maersk Inc. (industrial conglomerate), and a member of the Advisory Board for Metalmark Capital LLC (private equity investment, 2005-present). Mr. Stavropoulos is an operating advisor to Clayton, Dubilier & Rice, LLC (private equity investment). In addition, Mr. Stavropoulos is a member of the University of Notre Dame Advisory Council for the College of Science, a Trustee of the Rollin L. Gerstacker Foundation, and a Director of the Naples Philharmonic Center for the Arts. Previously, Mr. Stavropoulos served as a Director of Chemical Financial Corporation (bank holding company, 1993-2012) and Tyco International, Ltd. (multinational manufacturing and services, 2007-2012).
David M. Thomas (1949)
Year of Election or Appointment: 2008
Trustee
Mr. Thomas also serves as Trustee of other Fidelity® funds. Mr. Thomas serves as Non-Executive Chairman of the Board of Directors of Fortune Brands Home and Security (home and security products, 2011-present), as a member of the Board of Directors (2004-present) and Presiding Director (2013-present) of Interpublic Group of Companies, Inc. (marketing communication), and as a member of the Board of Trustees of the University of Florida (2013-present). Previously, Mr. Thomas served as Executive Chairman (2005-2006) and Chairman and Chief Executive Officer (2000-2005) of IMS Health, Inc. (pharmaceutical and healthcare information solutions), and a Director of Fortune Brands, Inc. (consumer products, 2000-2011).
+ The information includes the Trustee's principal occupation during the last five years and other information relating to the experience, attributes, and skills relevant to the Trustee's qualifications to serve as a Trustee, which led to the conclusion that the Trustee should serve as a Trustee for the fund.
Advisory Board Members and Officers:
Correspondence intended for an officer or Peter S. Lynch may be sent to Fidelity Investments, 245 Summer Street, Boston, Massachusetts 02210. Officers appear below in alphabetical order.
Name, Year of Birth; Principal Occupation
Peter S. Lynch (1944)
Year of Election or Appointment: 2003
Member of the Advisory Board
Mr. Lynch also serves as Member of the Advisory Board of other Fidelity® funds. Mr. Lynch is Vice Chairman and a Director of FMR (investment adviser firm) and FMR Co., Inc. (investment adviser firm). In addition, Mr. Lynch serves as a Trustee of Boston College and as the Chairman of the Inner-City Scholarship Fund. Previously, Mr. Lynch served on the Special Olympics International Board of Directors (1997-2006).
Elizabeth Paige Baumann (1968)
Year of Election or Appointment: 2012
Anti-Money Laundering (AML) Officer
Ms. Baumann also serves as AML Officer of other funds. She is Chief AML Officer of FMR LLC (diversified financial services company, 2012-present) and is an employee of Fidelity Investments. Previously, Ms. Baumann served as Vice President and Deputy Anti-Money Laundering Officer (2007-2012).
Marc R. Bryant (1966)
Year of Election or Appointment: 2015
Secretary and Chief Legal Officer (CLO)
Mr. Bryant also serves as Secretary and CLO of other funds. Mr. Bryant serves as CLO, Secretary, and Senior Vice President of Fidelity Management & Research Company (investment adviser firm, 2015-present) and FMR Co., Inc. (investment adviser firm, 2015-present); Secretary of Fidelity SelectCo, LLC (investment adviser firm, 2015-present) and Fidelity Investments Money Management, Inc. (investment adviser firm, 2015-present); and CLO of Fidelity Management & Research (Hong Kong) Limited (investment adviser firm, 2015-present). He is Senior Vice President and Deputy General Counsel of FMR LLC (diversified financial services company). Previously, Mr. Bryant served as Secretary and Chief Legal Officer of Fidelity Rutland Square Trust II (2010-2014) and Assistant Secretary of Fidelity's Fixed Income and Asset Allocation Funds (2013-2015). Prior to joining Fidelity Investments, Mr. Bryant served as a Senior Vice President and the Head of Global Retail Legal for AllianceBernstein L.P. (2006-2010), and as the General Counsel for ProFund Advisors LLC (2001-2006).
William C. Coffey (1969)
Year of Election or Appointment: 2009
Assistant Secretary
Mr. Coffey also serves as Assistant Secretary of other funds. He is Senior Vice President and Deputy General Counsel of FMR LLC (diversified financial services company, 2010-present), and is an employee of Fidelity Investments. Previously, Mr. Coffey served as Vice President and Associate General Counsel of FMR LLC (2005-2009).
Jonathan Davis (1968)
Year of Election or Appointment: 2010
Assistant Treasurer
Mr. Davis also serves as Assistant Treasurer of other funds, and is an employee of Fidelity Investments. Previously, Mr. Davis served as Vice President and Associate General Counsel of FMR LLC (diversified financial services company, 2003-2010).
Adrien E. Deberghes (1967)
Year of Election or Appointment: 2008
Deputy Treasurer
Mr. Deberghes also serves as an officer of other funds. He is an employee of Fidelity Investments (2008-present). Prior to joining Fidelity Investments, Mr. Deberghes was Senior Vice President of Mutual Fund Administration at State Street Corporation (2007-2008), Senior Director of Mutual Fund Administration at Investors Bank & Trust (2005-2007), and Director of Finance for Dunkin' Brands (2000-2005).
Stephanie J. Dorsey (1969)
Year of Election or Appointment: 2010
Assistant Treasurer
Ms. Dorsey also serves as an officer of other funds. She is an employee of Fidelity Investments (2008-present) and has served in other fund officer roles. Prior to joining Fidelity Investments, Ms. Dorsey served as Treasurer (2004-2008) of the JPMorgan Mutual Funds and Vice President (2004-2008) of JPMorgan Chase Bank.
Howard J. Galligan III (1966)
Year of Election or Appointment: 2014
Chief Financial Officer
Mr. Galligan also serves as Chief Financial Officer of other funds. Mr. Galligan serves as President of Fidelity Pricing and Cash Management Services (FPCMS) (2014-present) and as a Director of Strategic Advisers, Inc. (investment adviser firm, 2008-present). Previously, Mr. Galligan served as Chief Administrative Officer of Asset Management (2011-2014) and Chief Operating Officer and Senior Vice President of Investment Support for Strategic Advisers, Inc. (2003-2011).
Scott C. Goebel (1968)
Year of Election or Appointment: 2015
Vice President
Mr. Goebel serves as Vice President of other funds and is an employee of Fidelity Investments (2001-present). Previously, Mr. Goebel served as Secretary of Fidelity SelectCo, LLC (investment adviser firm, 2013-2015), Fidelity Investments Money Management, Inc. (FIMM) (investment adviser firm, 2010-2015), and Fidelity Research and Analysis Company (FRAC) (investment adviser firm, 2010-2015); General Counsel, Secretary, and Senior Vice President of Fidelity Management & Research Company (investment adviser firm, 2008-2015) and FMR Co., Inc. (investment adviser firm, 2008-2015); Assistant Secretary of Fidelity Management & Research (Japan) Limited (investment adviser firm, 2008-2015) and FMR Investment Management (U.K.) Limited (investment adviser firm, 2008-2015); Chief Legal Officer (CLO) of Fidelity Management & Research (Hong Kong) Limited (investment adviser firm, 2008-2015); Secretary and CLO of certain Fidelity® funds (2008-2015); Assistant Secretary of FIMM (2008-2010), FRAC (2008-2010), and certain funds (2007-2008); and as Vice President and Secretary of Fidelity Distributors Corporation (FDC) (2005-2007).
Brian B. Hogan (1964)
Year of Election or Appointment: 2009
Vice President
Mr. Hogan also serves as Trustee or Vice President of other funds. Mr. Hogan serves as a Director of Fidelity SelectCo, LLC (investment adviser firm, 2014-present) and President of the Equity Division of FMR (investment adviser firm, 2009-present). Previously, Mr. Hogan served as Senior Vice President, Equity Research of FMR (2006-2009) and as a portfolio manager.
Chris Maher (1972)
Year of Election or Appointment: 2013
Assistant Treasurer
Mr. Maher serves as Assistant Treasurer of other funds. Mr. Maher is Vice President of Valuation Oversight and is an employee of Fidelity Investments. Previously, Mr. Maher served as Vice President of Asset Management Compliance (2013), Vice President of the Program Management Group of FMR (investment adviser firm, 2010-2013), and Vice President of Valuation Oversight (2008-2010).
Melissa M. Reilly (1971)
Year of Election or Appointment: 2014
Vice President of certain Equity Funds
Ms. Reilly also serves as Vice President of other funds. Ms. Reilly is an employee of Fidelity Investments (2004-present).
Kenneth B. Robins (1969)
Year of Election or Appointment: 2008
President and Treasurer
Mr. Robins also serves as an officer of other funds. Mr. Robins serves as Executive Vice President of Fidelity Investments Money Management, Inc. (FIMM) (investment adviser firm, 2013-present) and is an employee of Fidelity Investments (2004-present). Previously, Mr. Robins served in other fund officer roles.
Stacie M. Smith (1974)
Year of Election or Appointment: 2013
Deputy Treasurer
Ms. Smith also serves as an officer of other funds. She is an employee of Fidelity Investments (2009-present) and has served in other fund officer roles. Prior to joining Fidelity Investments, Ms. Smith served as Senior Audit Manager of Ernst & Young LLP (1996-2009).
Renee Stagnone (1975)
Year of Election or Appointment: 2013
Deputy Treasurer
Ms. Stagnone also serves as Deputy Treasurer of other funds. Ms. Stagnone is an employee of Fidelity Investments (1997-present).
Linda J. Wondrack (1964)
Year of Election or Appointment: 2014
Chief Compliance Officer
Ms. Wondrack also serves as Chief Compliance Officer of other funds. Ms. Wondrack is Executive Vice President and head of the Ethics Office and Asset Management Compliance for Fidelity Investments (2012-present). Ms. Wondrack also serves as Chief Compliance Officer of Fidelity SelectCo, LLC (investment adviser firm, 2014-present); Chief Compliance Officer of Impresa Management LLC (2013-present); and Chief Compliance Officer of FMR Co., Inc. (investment adviser firm), Fidelity Investments Money Management, Inc. (investment adviser firm), Fidelity Management & Research (Japan) Limited (investment adviser firm), FMR Investment Management (U.K.) Limited (investment adviser firm), Fidelity Management & Research (Hong Kong) (investment adviser firm), Fidelity Management & Research Company (investment adviser firm), FIAM LLC (investment adviser firm), and Strategic Advisers, Inc. (investment adviser firm), Ballyrock Investment Advisors LLC, and Northern Neck Investors LLC (2012-present). Previously, Ms. Wondrack served as Senior Vice President and Chief Compliance Officer for Columbia Management Investment Advisers, LLC (2005-2012); Chief Compliance Officer for certain funds within the Columbia Family of Funds (2007-2012); and Senior Vice President of Compliance Risk Management at Bank of America (2005-2010).
Joseph F. Zambello (1957)
Year of Election or Appointment: 2011
Deputy Treasurer
Mr. Zambello also serves as Deputy Treasurer of other funds. Mr. Zambello is an employee of Fidelity Investments (1991-present). Previously, Mr. Zambello served as Vice President of the Program Management Group of FMR (investment adviser firm, 2009-2011) and Vice President of the Transfer Agent Oversight Group (2005-2009).
Shareholder Expense Example
As a shareholder of the Fund, you incur two types of costs: (1) transaction costs and (2) ongoing costs, including management fees and other Fund expenses. This Example is intended to help you understand your ongoing costs (in dollars) of investing in the Fund and to compare these costs with the ongoing costs of investing in other mutual funds.
The Example is based on an investment of $1,000 invested at the beginning of the period and held for the entire period (May 1, 2015 to October 31, 2015).
Actual Expenses
The first line of the accompanying table for each class of the Fund provides information about actual account values and actual expenses. You may use the information in this line, together with the amount you invested, to estimate the expenses that you paid over the period. Simply divide your account value by $1,000.00 (for example, an $8,600 account value divided by $1,000.00 = 8.6), then multiply the result by the number in the first line for a class of the Fund under the heading entitled "Expenses Paid During Period" to estimate the expenses you paid on your account during this period. A small balance maintenance fee of $12.00 that is charged once a year may apply for certain accounts with a value of less than $2,000. This fee is not included in the table below. If it was, the estimate of expenses you paid during the period would be higher, and your ending account value lower, by this amount. In addition, the Fund, as a shareholder in the underlying Fidelity Central Funds, will indirectly bear its pro-rata share of the fees and expenses incurred by the underlying Fidelity Central Funds. These fees and expenses are not included in the Fund's annualized expense ratio used to calculate the expense estimate in the table below.
Hypothetical Example for Comparison Purposes
The second line of the accompanying table for each class of the Fund provides information about hypothetical account values and hypothetical expenses based on a Class' actual expense ratio and an assumed rate of return of 5% per year before expenses, which is not the Class' actual return. The hypothetical account values and expenses may not be used to estimate the actual ending account balance or expenses you paid for the period. You may use this information to compare the ongoing costs of investing in the Fund and other funds. To do so, compare this 5% hypothetical example with the 5% hypothetical examples that appear in the shareholder reports of the other funds. A small balance maintenance fee of $12.00 that is charged once a year may apply for certain accounts with a value of less than $2,000. This fee is not included in the table below. If it was, the estimate of expenses you paid during the period would be higher, and your ending account value lower, by this amount. In addition, the Fund, as a shareholder in the underlying Fidelity Central Funds, will indirectly bear its pro-rata share of the fees and expenses incurred by the underlying Fidelity Central Funds. These fees and expenses are not included in the Fund's annualized expense ratio used to calculate the expense estimate in the table below.
Please note that the expenses shown in the table are meant to highlight your ongoing costs only and do not reflect any transaction costs. Therefore, the second line of the table is useful in comparing ongoing costs only, and will not help you determine the relative total costs of owning different funds.
| Annualized Expense Ratio-A | Beginning Account Value May 1, 2015 | Ending Account Value October 31, 2015 | Expenses Paid During Period-B May 1, 2015 to October 31, 2015 | |
| Capital Appreciation | .81% | |||
| Actual | $1,000.00 | $996.00 | $4.08 | |
| Hypothetical-C | $1,000.00 | $1,021.12 | $4.13 | |
| Class K | .71% | |||
| Actual | $1,000.00 | $996.50 | $3.57 | |
| Hypothetical-C | $1,000.00 | $1,021.63 | $3.62 |
A Annualized expense ratio reflects expenses net of applicable fee waivers.
B Expenses are equal to each Class' annualized expense ratio, multiplied by the average account value over the period, multiplied by 184/365 (to reflect the one-half year period).
C 5% return per year before expenses
Distributions (Unaudited)
The Board of Trustees of Fidelity Capital Appreciation Fund voted to pay shareholders of record at the opening of business on record date, the following distributions per share derived from capital gains realized from sales of portfolio securities and dividends derived from net investment income.
| Pay Date | Record Date | Dividends | Capital Gains | |
| Class K | 12/07/15 | 12/04/15 | $ 0.307 | $ 4.010 |
The fund hereby designates as a capital gain dividend with respect to the taxable year ended October 31, 2015, $ 988,692,388, or, if subsequently determined to be different, the net capital gain of such year.
Class K designates 100% of the dividends distributed during the fiscal year as qualifying for the dividends–received deduction for corporate shareholders.
Class K designates 100% of the dividends distributed during the fiscal year as amounts which may be taken into account as a dividend for the purposes of the maximum rate under section 1(h)(11) of the Internal Revenue Code.
The fund will notify shareholders in January 2016 of amounts for use in preparing 2015 income tax returns.
Board Approval of Investment Advisory Contracts and Management Fees
Fidelity Capital Appreciation Fund
Each year, the Board of Trustees, including the Independent Trustees (together, the Board), votes on the renewal of the management contract with Fidelity Management & Research Company (FMR) and the sub-advisory agreements (together, the Advisory Contracts) for the fund. The Board, assisted by the advice of fund counsel and Independent Trustees' counsel, requests and considers a broad range of information relevant to the renewal of the Advisory Contracts throughout the year.
The Board meets regularly and, at each of its meetings, covers an extensive agenda of topics and materials and considers factors that are relevant to its annual consideration of the renewal of the fund's Advisory Contracts, including the services and support provided to the fund and its shareholders. The Board has established various standing committees (Committees), each composed of and chaired by Independent Trustees with varying backgrounds, to which the Board has assigned specific subject matter responsibilities in order to enhance effective decision-making by the Board. The Board, acting directly and through its Committees, requests and receives information concerning the annual consideration of the renewal of the fund's Advisory Contracts. The Board also meets as needed to consider matters specifically related to the Board's annual consideration of the renewal of the Advisory Contracts. Members of the Board may also meet with trustees of other Fidelity funds through ad hoc joint committees to discuss certain matters relevant to all of the Fidelity funds.
At its July 2015 meeting, the Board unanimously determined to renew the fund's Advisory Contracts. In reaching its determination, the Board considered all factors it believed relevant, including (i) the nature, extent, and quality of the services to be provided to the fund and its shareholders (including the investment performance of the fund); (ii) the competitiveness of the fund's management fee and total expense ratio relative to peer funds; (iii) the total costs of the services to be provided by and the profits to be realized by Fidelity from its relationship with the fund; and (iv) the extent to which (if any) economies of scale exist and would be realized as the fund grows, and whether any economies of scale are appropriately shared with fund shareholders.
In considering whether to renew the Advisory Contracts for the fund, the Board reached a determination, with the assistance of fund counsel and Independent Trustees' counsel and through the exercise of its business judgment, that the renewal of the Advisory Contracts was in the best interests of the fund and its shareholders and that the compensation payable under the Advisory Contracts was fair and reasonable. The Board's decision to renew the Advisory Contracts was not based on any single factor, but rather was based on a comprehensive consideration of all the information provided to the Board at its meetings throughout the year. The Board, in reaching its determination to renew the Advisory Contracts, was aware that shareholders of the fund have a broad range of investment choices available to them, including a wide choice among funds offered by Fidelity's competitors, and that the fund's shareholders, who have the opportunity to review and weigh the disclosure provided by the fund in its prospectus and other public disclosures, have chosen to invest in this fund, which is part of the Fidelity family of funds.
Nature, Extent, and Quality of Services Provided. The Board considered Fidelity's staffing as it relates to the fund, including the backgrounds of investment personnel of Fidelity, and also considered the fund's investment objective, strategies, and related investment philosophy. The Independent Trustees also had discussions with senior management of Fidelity's investment operations and investment groups. The Board considered the structure of the portfolio manager compensation program and whether this structure provides appropriate incentives to act in the best interests of the fund. Additionally, the Board considered the portfolio managers' investments, if any, in the funds that they manage.Resources Dedicated to Investment Management and Support Services. The Board and the Fund Oversight and Research Committees reviewed the general qualifications and capabilities of Fidelity's investment staff, including its size, education, experience, and resources, as well as Fidelity's approach to recruiting, training, managing, and compensating investment personnel. The Board noted that Fidelity has continued to increase the resources devoted to non-U.S. offices, including expansion of Fidelity's global investment organization. The Board also noted that Fidelity's analysts have extensive resources, tools and capabilities that allow them to conduct sophisticated quantitative and fundamental analysis, as well as credit analysis of issuers, counterparties and guarantors. Further, the Board considered that Fidelity's investment professionals have sufficient access to global information and data so as to provide competitive investment results over time, and that those professionals also have access to sophisticated tools that permit them to assess portfolio construction and risk and performance attribution characteristics continuously, as well as to transmit new information and research conclusions rapidly around the world. Additionally, in its deliberations, the Board considered Fidelity's trading, risk management, and compliance capabilities and resources, which are integral parts of the investment management process.Shareholder and Administrative Services. The Board considered (i) the nature, extent, quality, and cost of advisory, administrative, and shareholder services performed by FMR, the sub-advisers (together with FMR, the Investment Advisers), and their affiliates under the Advisory Contracts and under separate agreements covering transfer agency, pricing and bookkeeping, and securities lending services for the fund; (ii) the nature and extent of the supervision of third party service providers, principally custodians and subcustodians; and (iii) the resources devoted to, and the record of compliance with, the fund's compliance policies and procedures. The Board also reviewed the allocation of fund brokerage, including allocations to brokers affiliated with the Investment Advisers, the use of brokerage commissions to pay fund expenses, and the use of "soft" commission dollars to pay for research services.The Board noted that the growth of fund assets over time across the complex allows Fidelity to reinvest in the development of services designed to enhance the value or convenience of the Fidelity funds as investment vehicles. These services include 24-hour access to account information and market information through telephone representatives and over the Internet, investor education materials and asset allocation tools, and the expanded availability of Fidelity Investor Centers.In 2014, the Board formed an ad hoc Committee on Transfer Agency Fees to review the variety of transfer agency fee structures throughout the industry and Fidelity's competitive positioning with respect to industry participants.Investment in a Large Fund Family. The Board considered the benefits to shareholders of investing in a Fidelity fund, including the benefits of investing in a fund that is part of a large family of funds offering a variety of investment disciplines and providing a large variety of mutual fund investor services. The Board noted that Fidelity had taken, or had made recommendations that resulted in the Fidelity funds taking, a number of actions over the previous year that benefited particular funds, including (i) continuing to dedicate additional resources to investment research and to the support of the senior management team that oversees asset management; (ii) continuing efforts to enhance Fidelity's global research capabilities; (iii) launching new funds and making other enhancements to meet client needs; (iv) reducing management fees and total expenses for certain index funds and diversified international funds; (v) continuing to launch dedicated lower cost underlying funds to meet portfolio construction needs related to expanding underlying fund options for Fidelity funds of funds, specifically for the Freedom Fund product lines; (vi) rationalizing product lines and gaining increased efficiencies through fund mergers; (vii) launching active fixed-income exchange-traded funds; (viii) continuing to develop, acquire and implement systems and technology to improve services to the funds and information security and to increase efficiency; (ix) implementing investment enhancements to further strengthen Fidelity's target date product line to increase investors' probability of success in achieving their goals; (x) modifying the eligibility criteria for certain share classes to accommodate roll-over assets from employer-sponsored retirement plans; (xi) launching a new Class W of the Freedom Index Funds to attract and retain Fidelity record-kept retirement plan assets; and (xii) implementing changes to Fidelity's money market product line in response to recent money market regulatory reforms.Investment Performance. The Board considered whether the fund has operated in accordance with its investment objective, as well as its record of compliance with its investment restrictions and its performance history.The Board took into account discussions with representatives of the Investment Advisers about fund investment performance that occur at Board meetings throughout the year. In this regard the Board noted that as part of regularly scheduled fund reviews and other reports to the Board on fund performance, the Board considers annualized return information for the fund, for different time periods, measured against a securities market index ("benchmark index") and a peer group of funds with similar objectives ("peer group"), if any. In its evaluation of fund investment performance, the Board gave particular attention to information indicating changes in performance of certain Fidelity funds for specific time periods and discussed with the Investment Advisers the reasons for any overperformance or underperformance.In addition to reviewing absolute and relative fund performance, the Independent Trustees periodically consider the appropriateness of fund performance metrics in evaluating the results achieved. In general, the Independent Trustees believe that fund performance should be evaluated based on net performance (after fees and expenses) of both the highest performing and lowest performing fund share classes, where applicable, compared to appropriate benchmark indices, over appropriate time periods that may include full market cycles, and compared to peer groups, as applicable, over the same periods, taking into account relevant factors including the following: general market conditions; issuer-specific information; and fund cash flows and other factors.The Independent Trustees recognize that shareholders evaluate performance on a net basis over their own holding periods, for which one-, three-, and five-year periods are often used as a proxy. For this reason, the performance information reviewed by the Board also included net cumulative calendar year total return information for the fund and an appropriate benchmark index and peer group for the most recent one-, three-, and five-year periods, as shown below. Returns are shown compared to the 25th percentile (top of box, 75% beaten) and 75th percentile (bottom of box, 25% beaten) of the peer universe.Fidelity Capital Appreciation Fund
Fidelity Capital Appreciation Fund
![]()
Corporate Headquarters
245 Summer St.
Boston, MA 02210
www.fidelity.com
CAF-K-ANN-1215
1.863090.107
Fidelity® Disciplined Equity Fund Annual Report October 31, 2015 |
|
Contents
Board Approval of Investment Advisory Contracts and Management Fees |
To view a fund's proxy voting guidelines and proxy voting record for the 12-month period ended June 30, visit http://www.fidelity.com/proxyvotingresults or visit the Securities and Exchange Commission's (SEC) web site at http://www.sec.gov.
You may also call 1-800-544-8544 to request a free copy of the proxy voting guidelines.
Standard & Poor's, S&P and S&P 500 are registered service marks of The McGraw-Hill Companies, Inc. and have been licensed for use by Fidelity Distributors Corporation.
Other third-party marks appearing herein are the property of their respective owners.
All other marks appearing herein are registered or unregistered trademarks or service marks of FMR LLC or an affiliated company. © 2015 FMR LLC. All rights reserved.
This report and the financial statements contained herein are submitted for the general information of the shareholders of the Fund. This report is not authorized for distribution to prospective investors in the Fund unless preceded or accompanied by an effective prospectus.
A fund files its complete schedule of portfolio holdings with the SEC for the first and third quarters of each fiscal year on Form N-Q. Forms N-Q are available on the SEC’s web site at http://www.sec.gov. A fund's Forms N-Q may be reviewed and copied at the SEC’s Public Reference Room in Washington, DC. Information regarding the operation of the SEC's Public Reference Room may be obtained by calling 1-800-SEC-0330.
For a complete list of a fund's portfolio holdings, view the most recent holdings listing, semiannual report, or annual report on Fidelity's web site at http://www.fidelity.com, http://www.advisor.fidelity.com, or http://www.401k.com, as applicable.
NOT FDIC INSURED •MAY LOSE VALUE •NO BANK GUARANTEE
Neither the Fund nor Fidelity Distributors Corporation is a bank.
Performance: The Bottom Line
Average annual total return reflects the change in the value of an investment, assuming reinvestment of distributions from dividend income and capital gains (the profits earned upon the sale of securities that have grown in value, if any) and assuming a constant rate of performance each year.
The hypothetical investment and the average annual total returns do not reflect the deduction of taxes that a shareholder would pay on fund distributions or the redemption of fund shares.
During periods of reimbursement by Fidelity, a fund’s total return will be greater than it would be had the reimbursement not occurred.
How a fund did yesterday is no guarantee of how it will do tomorrow.
Average Annual Total Returns
| For the periods ended October 31, 2015 | Past 1 year | Past 5 years | Past 10 years |
| Fidelity® Disciplined Equity Fund | 4.66% | 12.89% | 6.24% |
$10,000 Over 10 Years
Let's say hypothetically that $10,000 was invested in Fidelity® Disciplined Equity Fund, a class of the fund, on October 31, 2005.
The chart shows how the value of your investment would have changed, and also shows how the S&P 500® Index performed over the same period.

| Period Ending Values | ||
| $18,318 | Fidelity® Disciplined Equity Fund | |
| $21,289 | S&P 500® Index | |
Management's Discussion of Fund Performance
Market Recap: U.S. stocks gained moderately for the 12 months ending October 31, 2015, helped by a strong October that largely erased a steep decline in August and September on concern about slowing global economic growth emanating from China. Stocks benefited late in the period amid waning expectations for a near-term interest-rate hike by the U.S. Federal Reserve, additional economic stimulus in Europe and an interest-rate cut in China. The large-cap S&P 500® index advanced 5.20% for the period, with growth stocks in the index significantly outpacing value stocks, as investors continued to seek growth in a subpar economic environment. The growth-oriented Nasdaq Composite Index® also benefited, gaining 10.39%, while the small-cap Russell 2000® Index lost its edge, returning only 0.34%, as risk appetites waned. Among sectors in the widely followed S&P 500®, consumer discretionary (+21%) led the way, benefiting from a combination of rising personal income and still-benign inflation. Technology (+11%) and consumer staples (+9%) also outpaced the index. Conversely, energy (-19%) performed worst, in an environment of depressed commodity prices that also hit materials (-4%). At period end, investors remained focused on the potential global implications of a relatively stronger U.S. dollar and how China’s transition toward a consumption-led economy may affect corporate earnings.Comments from Portfolio Manager Alex Devereaux: For the year, the fund’s share classes returned solid mid-single-digit gains, modestly underperforming the benchmark S&P 500®. The fund was hurt by its exposure to higher-volatility and value-oriented investments that underperformed. Security selection was a positive, although picks among retailing and utilities names weighed on the fund’s relative results. An overweighting in Navient was the fund’s biggest detractor. Shares of the consumer finance company, which focuses on education loan servicing, declined. The firm suffered a number of hits, including canceled contracts and a possible lawsuit by the U.S. Consumer Financial Protection Bureau alleging mistreatment of its borrowers. We sold our Navient position by period end. Nabors Industries also hurt performance. It fell along with the rest of the energy sector as oil prices collapsed. We sold the position in January, but not soon enough to counter the significant loss. Conversely, stock picks within energy and industrials – particularly among airlines stocks – were a big plus. Supermarket and convenience store chain Kroger continued to be a core fund holding and was our top individual contributor. Investors were attracted to the firm’s expanding revenue and profits, which beat analyst estimates this period amid a slow-growth market.The views expressed above reflect those of the portfolio manager(s) only through the end of the period as stated on the cover of this report and do not necessarily represent the views of Fidelity or any other person in the Fidelity organization. Any such views are subject to change at any time based upon market or other conditions and Fidelity disclaims any responsibility to update such views. These views may not be relied on as investment advice and, because investment decisions for a Fidelity fund are based on numerous factors, may not be relied on as an indication of trading intent on behalf of any Fidelity fund.
Investment Summary (Unaudited)
Top Ten Stocks as of October 31, 2015
| % of fund's net assets | % of fund's net assets 6 months ago | |
| Apple, Inc. | 4.5 | 4.8 |
| General Electric Co. | 2.3 | 0.0 |
| Amazon.com, Inc. | 2.1 | 0.0 |
| Johnson & Johnson | 2.1 | 2.3 |
| Wells Fargo & Co. | 2.1 | 1.8 |
| JPMorgan Chase & Co. | 2.0 | 2.1 |
| Procter & Gamble Co. | 1.7 | 1.9 |
| Bank of America Corp. | 1.7 | 1.7 |
| Alphabet, Inc. Class A | 1.7 | 1.0 |
| AT&T, Inc. | 1.7 | 0.5 |
| 21.9 |
Top Five Market Sectors as of October 31, 2015
| % of fund's net assets | % of fund's net assets 6 months ago | |
| Information Technology | 21.3 | 21.5 |
| Health Care | 16.4 | 15.9 |
| Consumer Discretionary | 14.8 | 12.4 |
| Financials | 14.2 | 14.4 |
| Industrials | 8.5 | 8.4 |
Asset Allocation (% of fund's net assets)
| As of October 31, 2015* | ||
| Stocks | 98.1% | |
| Short-Term Investments and Net Other Assets (Liabilities) | 1.9% | |

* Foreign investments - 7.6%
| As of April 30, 2015* | ||
| Stocks | 98.3% | |
| Short-Term Investments and Net Other Assets (Liabilities) | 1.7% | |

* Foreign investments - 6.7%
Investments October 31, 2015
Showing Percentage of Net Assets
| Common Stocks - 98.1% | |||
| Shares | Value (000s) | ||
| CONSUMER DISCRETIONARY - 14.8% | |||
| Diversified Consumer Services - 1.2% | |||
| H&R Block, Inc. | 189,040 | $7,044 | |
| ServiceMaster Global Holdings, Inc. (a) | 294,500 | 10,499 | |
| 17,543 | |||
| Hotels, Restaurants & Leisure - 1.7% | |||
| Las Vegas Sands Corp. | 254,438 | 12,597 | |
| Starbucks Corp. | 218,524 | 13,673 | |
| 26,270 | |||
| Household Durables - 0.7% | |||
| Whirlpool Corp. | 65,067 | 10,420 | |
| Internet & Catalog Retail - 2.9% | |||
| Amazon.com, Inc. (a) | 51,623 | 32,311 | |
| Netflix, Inc. (a) | 110,212 | 11,945 | |
| 44,256 | |||
| Media - 1.3% | |||
| Comcast Corp. Class A | 161,633 | 10,121 | |
| Gannett Co., Inc. | 566,645 | 8,964 | |
| 19,085 | |||
| Multiline Retail - 1.2% | |||
| Macy's, Inc. | 245,664 | 12,524 | |
| Target Corp. | 66,221 | 5,111 | |
| 17,635 | |||
| Specialty Retail - 4.3% | |||
| Best Buy Co., Inc. | 145,185 | 5,086 | |
| GameStop Corp. Class A (b) | 242,556 | 11,175 | |
| Home Depot, Inc. | 178,790 | 22,106 | |
| Michaels Companies, Inc. (a) | 376,066 | 8,792 | |
| Ross Stores, Inc. | 111,584 | 5,644 | |
| Staples, Inc. | 955,458 | 12,411 | |
| 65,214 | |||
| Textiles, Apparel & Luxury Goods - 1.5% | |||
| Michael Kors Holdings Ltd. (a) | 115,981 | 4,482 | |
| NIKE, Inc. Class B | 63,716 | 8,349 | |
| PVH Corp. | 115,927 | 10,544 | |
| 23,375 | |||
| TOTAL CONSUMER DISCRETIONARY | 223,798 | ||
| CONSUMER STAPLES - 8.2% | |||
| Beverages - 0.8% | |||
| PepsiCo, Inc. | 98,622 | 10,078 | |
| The Coca-Cola Co. | 51,607 | 2,186 | |
| 12,264 | |||
| Food & Staples Retailing - 2.2% | |||
| CVS Health Corp. | 198,650 | 19,623 | |
| Kroger Co. | 366,998 | 13,873 | |
| 33,496 | |||
| Food Products - 0.6% | |||
| Flowers Foods, Inc. | 47,587 | 1,285 | |
| Mead Johnson Nutrition Co. Class A | 24,374 | 1,999 | |
| The J.M. Smucker Co. | 49,591 | 5,821 | |
| 9,105 | |||
| Household Products - 1.7% | |||
| Procter & Gamble Co. | 346,843 | 26,492 | |
| Personal Products - 1.6% | |||
| Coty, Inc. Class A | 355,267 | 10,285 | |
| Herbalife Ltd. (a) | 183,350 | 10,275 | |
| Nu Skin Enterprises, Inc. Class A | 76,801 | 2,935 | |
| 23,495 | |||
| Tobacco - 1.3% | |||
| Altria Group, Inc. | 69,901 | 4,227 | |
| Reynolds American, Inc. | 304,282 | 14,703 | |
| 18,930 | |||
| TOTAL CONSUMER STAPLES | 123,782 | ||
| ENERGY - 6.3% | |||
| Energy Equipment & Services - 1.9% | |||
| Baker Hughes, Inc. | 233,528 | 12,302 | |
| Cameron International Corp. (a) | 169,651 | 11,538 | |
| Schlumberger Ltd. | 56,333 | 4,403 | |
| 28,243 | |||
| Oil, Gas & Consumable Fuels - 4.4% | |||
| Chevron Corp. | 199,328 | 18,115 | |
| Cimarex Energy Co. | 13,261 | 1,566 | |
| Exxon Mobil Corp. | 43,801 | 3,624 | |
| HollyFrontier Corp. | 218,846 | 10,717 | |
| PBF Energy, Inc. Class A | 352,327 | 11,979 | |
| Phillips 66 Co. | 113,541 | 10,111 | |
| World Fuel Services Corp. | 254,845 | 11,330 | |
| 67,442 | |||
| TOTAL ENERGY | 95,685 | ||
| FINANCIALS - 14.2% | |||
| Banks - 7.4% | |||
| Bank of America Corp. | 1,549,293 | 25,997 | |
| Citigroup, Inc. | 451,554 | 24,009 | |
| JPMorgan Chase & Co. | 472,341 | 30,348 | |
| Wells Fargo & Co. | 596,071 | 32,271 | |
| 112,625 | |||
| Capital Markets - 1.0% | |||
| Goldman Sachs Group, Inc. | 81,069 | 15,200 | |
| Consumer Finance - 1.7% | |||
| Ally Financial, Inc. (a) | 38,115 | 759 | |
| Capital One Financial Corp. | 192,832 | 15,214 | |
| Santander Consumer U.S.A. Holdings, Inc. (a) | 491,601 | 8,854 | |
| Synchrony Financial (a)(b) | 27,729 | 853 | |
| 25,680 | |||
| Diversified Financial Services - 0.8% | |||
| Berkshire Hathaway, Inc. Class B (a) | 90,728 | 12,341 | |
| Insurance - 1.1% | |||
| ACE Ltd. | 1,163 | 132 | |
| American International Group, Inc. | 36,276 | 2,288 | |
| Assured Guaranty Ltd. | 412,695 | 11,324 | |
| MetLife, Inc. | 15,762 | 794 | |
| Prudential Financial, Inc. | 16,521 | 1,363 | |
| 15,901 | |||
| Real Estate Investment Trusts - 0.7% | |||
| Annaly Capital Management, Inc. | 1,066,078 | 10,607 | |
| Real Estate Management & Development - 1.5% | |||
| CBRE Group, Inc. (a) | 311,905 | 11,628 | |
| Jones Lang LaSalle, Inc. | 66,521 | 11,090 | |
| 22,718 | |||
| TOTAL FINANCIALS | 215,072 | ||
| HEALTH CARE - 16.4% | |||
| Biotechnology - 5.0% | |||
| AbbVie, Inc. | 319,904 | 19,050 | |
| Amgen, Inc. | 120,550 | 19,069 | |
| Gilead Sciences, Inc. | 194,850 | 21,069 | |
| Incyte Corp. (a) | 70,480 | 8,284 | |
| Medivation, Inc. (a) | 194,573 | 8,184 | |
| 75,656 | |||
| Health Care Equipment & Supplies - 0.4% | |||
| Medtronic PLC | 74,786 | 5,528 | |
| Health Care Providers & Services - 5.3% | |||
| AmerisourceBergen Corp. | 134,261 | 12,958 | |
| Cardinal Health, Inc. | 164,342 | 13,509 | |
| Centene Corp. (a) | 158,428 | 9,423 | |
| Express Scripts Holding Co. (a) | 187,432 | 16,190 | |
| McKesson Corp. | 76,389 | 13,658 | |
| UnitedHealth Group, Inc. | 127,384 | 15,003 | |
| 80,741 | |||
| Life Sciences Tools & Services - 0.3% | |||
| Agilent Technologies, Inc. | 121,727 | 4,596 | |
| Pharmaceuticals - 5.4% | |||
| Eli Lilly & Co. | 218,888 | 17,855 | |
| Endo Health Solutions, Inc. (a) | 188,847 | 11,329 | |
| Johnson & Johnson | 319,605 | 32,290 | |
| Mylan N.V. | 143,100 | 6,309 | |
| Pfizer, Inc. | 413,638 | 13,989 | |
| 81,772 | |||
| TOTAL HEALTH CARE | 248,293 | ||
| INDUSTRIALS - 8.5% | |||
| Aerospace & Defense - 2.2% | |||
| Huntington Ingalls Industries, Inc. | 98,298 | 11,790 | |
| Raytheon Co. | 72,723 | 8,538 | |
| The Boeing Co. | 88,429 | 13,094 | |
| 33,422 | |||
| Air Freight & Logistics - 0.1% | |||
| C.H. Robinson Worldwide, Inc. | 19,384 | 1,345 | |
| Airlines - 2.9% | |||
| American Airlines Group, Inc. | 305,236 | 14,108 | |
| Southwest Airlines Co. | 324,973 | 15,043 | |
| United Continental Holdings, Inc. (a) | 230,668 | 13,912 | |
| 43,063 | |||
| Construction & Engineering - 0.3% | |||
| AECOM Technology Corp. (a) | 172,493 | 5,083 | |
| Industrial Conglomerates - 2.3% | |||
| General Electric Co. | 1,224,348 | 35,408 | |
| Machinery - 0.7% | |||
| AGCO Corp. | 202,253 | 9,787 | |
| SPX Flow, Inc. (a) | 28,500 | 966 | |
| 10,753 | |||
| TOTAL INDUSTRIALS | 129,074 | ||
| INFORMATION TECHNOLOGY - 21.3% | |||
| Communications Equipment - 0.9% | |||
| Brocade Communications Systems, Inc. | 62,597 | 652 | |
| Cisco Systems, Inc. | 268,102 | 7,735 | |
| CommScope Holding Co., Inc. (a) | 172,318 | 5,588 | |
| 13,975 | |||
| Internet Software & Services - 3.5% | |||
| Alphabet, Inc.: | |||
| Class A (a) | 34,864 | 25,708 | |
| Class C | 3,530 | 2,509 | |
| eBay, Inc. (a) | 540,292 | 15,074 | |
| Facebook, Inc. Class A (a) | 99,178 | 10,113 | |
| 53,404 | |||
| IT Services - 6.2% | |||
| Accenture PLC Class A | 73,645 | 7,895 | |
| Cognizant Technology Solutions Corp. Class A (a) | 216,449 | 14,742 | |
| Computer Sciences Corp. | 17,795 | 1,185 | |
| Fidelity National Information Services, Inc. | 67,993 | 4,958 | |
| Global Payments, Inc. | 63,043 | 8,600 | |
| IBM Corp. | 11,290 | 1,582 | |
| Leidos Holdings, Inc. | 223,236 | 11,736 | |
| PayPal Holdings, Inc. (a) | 427,684 | 15,401 | |
| Visa, Inc. Class A | 222,073 | 17,228 | |
| Xerox Corp. | 1,063,665 | 9,988 | |
| 93,315 | |||
| Semiconductors & Semiconductor Equipment - 3.0% | |||
| Avago Technologies Ltd. | 114,868 | 14,144 | |
| Broadcom Corp. Class A | 230,866 | 11,867 | |
| Freescale Semiconductor, Inc. (a) | 279,630 | 9,365 | |
| Marvell Technology Group Ltd. | 1,189,026 | 9,762 | |
| 45,138 | |||
| Software - 3.1% | |||
| Citrix Systems, Inc. (a) | 134,553 | 11,047 | |
| Electronic Arts, Inc. (a) | 91,449 | 6,591 | |
| King Digital Entertainment PLC (b) | 386,526 | 5,782 | |
| Microsoft Corp. | 314,628 | 16,562 | |
| Oracle Corp. | 23,746 | 922 | |
| Workday, Inc. Class A (a) | 81,081 | 6,403 | |
| 47,307 | |||
| Technology Hardware, Storage & Peripherals - 4.6% | |||
| Apple, Inc. | 568,897 | 67,980 | |
| HP, Inc. | 45,587 | 1,229 | |
| 69,209 | |||
| TOTAL INFORMATION TECHNOLOGY | 322,348 | ||
| MATERIALS - 4.3% | |||
| Chemicals - 2.4% | |||
| Eastman Chemical Co. | 148,607 | 10,725 | |
| LyondellBasell Industries NV Class A | 151,883 | 14,111 | |
| The Mosaic Co. | 359,739 | 12,156 | |
| 36,992 | |||
| Containers & Packaging - 1.2% | |||
| Sealed Air Corp. | 150,233 | 7,379 | |
| WestRock Co. | 187,184 | 10,063 | |
| 17,442 | |||
| Metals & Mining - 0.3% | |||
| Steel Dynamics, Inc. | 248,995 | 4,599 | |
| Paper & Forest Products - 0.4% | |||
| Domtar Corp. | 160,085 | 6,602 | |
| TOTAL MATERIALS | 65,635 | ||
| TELECOMMUNICATION SERVICES - 2.7% | |||
| Diversified Telecommunication Services - 2.2% | |||
| AT&T, Inc. | 761,137 | 25,506 | |
| Verizon Communications, Inc. | 157,047 | 7,362 | |
| 32,868 | |||
| Wireless Telecommunication Services - 0.5% | |||
| T-Mobile U.S., Inc. (a) | 216,716 | 8,211 | |
| TOTAL TELECOMMUNICATION SERVICES | 41,079 | ||
| UTILITIES - 1.4% | |||
| Electric Utilities - 0.8% | |||
| Exelon Corp. | 425,586 | 11,882 | |
| Independent Power and Renewable Electricity Producers - 0.6% | |||
| NRG Energy, Inc. | 763,604 | 9,843 | |
| TOTAL UTILITIES | 21,725 | ||
| TOTAL COMMON STOCKS | |||
| (Cost $1,396,535) | 1,486,491 | ||
| Money Market Funds - 3.1% | |||
| Fidelity Cash Central Fund, 0.18% (c) | 33,468,832 | 33,469 | |
| Fidelity Securities Lending Cash Central Fund, 0.19% (c)(d) | 12,757,700 | 12,758 | |
| TOTAL MONEY MARKET FUNDS | |||
| (Cost $46,227) | 46,227 | ||
| TOTAL INVESTMENT PORTFOLIO - 101.2% | |||
| (Cost $1,442,762) | 1,532,718 | ||
| NET OTHER ASSETS (LIABILITIES) - (1.2)% | (18,129) | ||
| NET ASSETS - 100% | $1,514,589 |
Legend
(a) Non-income producing
(b) Security or a portion of the security is on loan at period end.
(c) Affiliated fund that is generally available only to investment companies and other accounts managed by Fidelity Investments. The rate quoted is the annualized seven-day yield of the fund at period end. A complete unaudited listing of the fund's holdings as of its most recent quarter end is available upon request. In addition, each Fidelity Central Fund's financial statements, which are not covered by the Fund's Report of Independent Registered Public Accounting Firm, are available on the SEC's website or upon request.
(d) Investment made with cash collateral received from securities on loan.
Affiliated Central Funds
Information regarding fiscal year to date income earned by the Fund from investments in Fidelity Central Funds is as follows:
| Fund | Income earned |
| (Amounts in thousands) | |
| Fidelity Cash Central Fund | $44 |
| Fidelity Securities Lending Cash Central Fund | 342 |
| Total | $386 |
Investment Valuation
All investments are categorized as Level 1 under the Fair Value Hierarchy. The inputs or methodology used for valuing securities may not be an indication of the risk associated with investing in those securities. For more information on valuation inputs please refer to the Investment Valuation section in the accompanying Notes to Financial Statements.
See accompanying notes which are an integral part of the financial statements.
Financial Statements
Statement of Assets and Liabilities
| Amounts in thousands (except per-share amounts) | October 31, 2015 | |
| Assets | ||
| Investment in securities, at value (including securities loaned of $12,455) — See accompanying schedule: Unaffiliated issuers (cost $1,396,535) | $1,486,491 | |
| Fidelity Central Funds (cost $46,227) | 46,227 | |
| Total Investments (cost $1,442,762) | $1,532,718 | |
| Receivable for fund shares sold | 4,509 | |
| Dividends receivable | 1,330 | |
| Distributions receivable from Fidelity Central Funds | 42 | |
| Prepaid expenses | 4 | |
| Other receivables | 348 | |
| Total assets | 1,538,951 | |
| Liabilities | ||
| Payable for fund shares redeemed | $10,293 | |
| Accrued management fee | 709 | |
| Other affiliated payables | 200 | |
| Other payables and accrued expenses | 402 | |
| Collateral on securities loaned, at value | 12,758 | |
| Total liabilities | 24,362 | |
| Net Assets | $1,514,589 | |
| Net Assets consist of: | ||
| Paid in capital | $1,444,708 | |
| Undistributed net investment income | 12,073 | |
| Accumulated undistributed net realized gain (loss) on investments | (32,148) | |
| Net unrealized appreciation (depreciation) on investments | 89,956 | |
| Net Assets | $1,514,589 | |
| Disciplined Equity: | ||
| Net Asset Value, offering price and redemption price per share ($1,385,386 ÷ 40,524.9 shares) | $34.19 | |
| Class K: | ||
| Net Asset Value, offering price and redemption price per share ($129,203 ÷ 3,782.6 shares) | $34.16 |
See accompanying notes which are an integral part of the financial statements.
Statement of Operations
| Amounts in thousands | Year ended October 31, 2015 | |
| Investment Income | ||
| Dividends | $26,409 | |
| Income from Fidelity Central Funds | 386 | |
| Total income | 26,795 | |
| Expenses | ||
| Management fee | ||
| Basic fee | $7,717 | |
| Performance adjustment | 2,093 | |
| Transfer agent fees | 1,989 | |
| Accounting and security lending fees | 448 | |
| Custodian fees and expenses | 23 | |
| Independent trustees' compensation | 6 | |
| Registration fees | 45 | |
| Audit | 70 | |
| Legal | 6 | |
| Interest | 2 | |
| Miscellaneous | 3 | |
| Total expenses before reductions | 12,402 | |
| Expense reductions | (47) | 12,355 |
| Net investment income (loss) | 14,440 | |
| Realized and Unrealized Gain (Loss) | ||
| Net realized gain (loss) on: | ||
| Investment securities: | ||
| Unaffiliated issuers | 120,276 | |
| Futures contracts | 626 | |
| Total net realized gain (loss) | 120,902 | |
| Change in net unrealized appreciation (depreciation) on investment securities | (59,067) | |
| Net gain (loss) | 61,835 | |
| Net increase (decrease) in net assets resulting from operations | $76,275 |
See accompanying notes which are an integral part of the financial statements.
Statement of Changes in Net Assets
| Amounts in thousands | Year ended October 31, 2015 | Year ended October 31, 2014 |
| Increase (Decrease) in Net Assets | ||
| Operations | ||
| Net investment income (loss) | $14,440 | $17,308 |
| Net realized gain (loss) | 120,902 | 165,730 |
| Change in net unrealized appreciation (depreciation) | (59,067) | 19,428 |
| Net increase (decrease) in net assets resulting from operations | 76,275 | 202,466 |
| Distributions to shareholders from net investment income | (15,079) | (29,580) |
| Distributions to shareholders from net realized gain | (87,691) | (11,309) |
| Total distributions | (102,770) | (40,889) |
| Share transactions - net increase (decrease) | 144,601 | (74,028) |
| Total increase (decrease) in net assets | 118,106 | 87,549 |
| Net Assets | ||
| Beginning of period | 1,396,483 | 1,308,934 |
| End of period (including undistributed net investment income of $12,073 and undistributed net investment income of $12,653, respectively) | $1,514,589 | $1,396,483 |
See accompanying notes which are an integral part of the financial statements.
Financial Highlights — Fidelity Disciplined Equity Fund
| Years ended October 31, | 2015 | 2014 | 2013 | 2012 | 2011 |
| Selected Per–Share Data | |||||
| Net asset value, beginning of period | $35.18 | $31.30 | $24.47 | $21.79 | $21.67 |
| Income from Investment Operations | |||||
| Net investment income (loss)A | .35 | .41 | .53 | .40 | .28 |
| Net realized and unrealized gain (loss) | 1.26 | 4.43 | 6.85 | 2.59 | .05 |
| Total from investment operations | 1.61 | 4.84 | 7.38 | 2.99 | .33 |
| Distributions from net investment income | (.38) | (.69) | (.55) | (.31) | (.21) |
| Distributions from net realized gain | (2.22) | (.27) | – | – | – |
| Total distributions | (2.60) | (.96) | (.55) | (.31) | (.21) |
| Net asset value, end of period | $34.19 | $35.18 | $31.30 | $24.47 | $21.79 |
| Total ReturnB | 4.66% | 15.80% | 30.80% | 13.95% | 1.51% |
| Ratios to Average Net AssetsC,D | |||||
| Expenses before reductions | .89% | .50% | .07% | .54% | .59% |
| Expenses net of fee waivers, if any | .89% | .50% | .07% | .54% | .59% |
| Expenses net of all reductions | .89% | .50% | (.01)%E | .52% | .58% |
| Net investment income (loss) | 1.02% | 1.24% | 1.97% | 1.72% | 1.22% |
| Supplemental Data | |||||
| Net assets, end of period (in millions) | $1,385 | $1,238 | $1,156 | $3,948 | $7,233 |
| Portfolio turnover rateF | 187% | 184% | 156% | 147% | 153% |
A Calculated based on average shares outstanding during the period.
B Total returns would have been lower if certain expenses had not been reduced during the applicable periods shown.
C Fees and expenses of any underlying Fidelity Central Funds are not included in the Fund's expense ratio. The Fund indirectly bears its proportionate share of the expenses of any underlying Fidelity Central Funds.
D Expense ratios reflect operating expenses of the class. Expenses before reductions do not reflect amounts reimbursed by the investment adviser or reductions from brokerage service arrangements or reductions from other expense offset arrangements and do not represent the amount paid by the class during periods when reimbursements or reductions occur. Expenses net of fee waivers reflect expenses after reimbursement by the investment adviser but prior to reductions from brokerage service arrangements or other expense offset arrangements. Expenses net of all reductions represent the net expenses paid by the class.
E The ratio of expenses net of all reductions to average net assets includes non-recurring payments by certain of the fund's brokers for commissions recaptured during the period. Excluding these payments, the ratio would have been 0.05% and the total return would've been 30.74%.
F Amount does not include the portfolio activity of any underlying Fidelity Central Funds.
See accompanying notes which are an integral part of the financial statements.
Financial Highlights — Fidelity Disciplined Equity Fund Class K
| Years ended October 31, | 2015 | 2014 | 2013 | 2012 | 2011 |
| Selected Per–Share Data | |||||
| Net asset value, beginning of period | $35.15 | $31.29 | $24.49 | $21.81 | $21.69 |
| Income from Investment Operations | |||||
| Net investment income (loss)A | .38 | .45 | .61 | .43 | .31 |
| Net realized and unrealized gain (loss) | 1.27 | 4.41 | 6.79 | 2.60 | .06 |
| Total from investment operations | 1.65 | 4.86 | 7.40 | 3.03 | .37 |
| Distributions from net investment income | (.42) | (.73) | (.60) | (.35) | (.25) |
| Distributions from net realized gain | (2.22) | (.27) | – | – | – |
| Total distributions | (2.64) | (1.00) | (.60) | (.35) | (.25) |
| Net asset value, end of period | $34.16 | $35.15 | $31.29 | $24.49 | $21.81 |
| Total ReturnB | 4.78% | 15.89% | 30.96% | 14.14% | 1.68% |
| Ratios to Average Net AssetsC,D | |||||
| Expenses before reductions | .79% | .39% | (.18)%E | .39% | .43% |
| Expenses net of fee waivers, if any | .79% | .39% | (.18)%E | .39% | .43% |
| Expenses net of all reductions | .79% | .39% | (.26)%E,F | .37% | .42% |
| Net investment income (loss) | 1.12% | 1.35% | 2.22% | 1.87% | 1.38% |
| Supplemental Data | |||||
| Net assets, end of period (in millions) | $129 | $158 | $153 | $131 | $95 |
| Portfolio turnover rateG | 187% | 184% | 156% | 147% | 153% |
A Calculated based on average shares outstanding during the period.
B Total returns would have been lower if certain expenses had not been reduced during the applicable periods shown.
C Fees and expenses of any underlying Fidelity Central Funds are not included in the Fund's expense ratio. The Fund indirectly bears its proportionate share of the expenses of any underlying Fidelity Central Funds.
D Expense ratios reflect operating expenses of the class. Expenses before reductions do not reflect amounts reimbursed by the investment adviser or reductions from brokerage service arrangements or reductions from other expense offset arrangements and do not represent the amount paid by the class during periods when reimbursements or reductions occur. Expenses net of fee waivers reflect expenses after reimbursement by the investment adviser but prior to reductions from brokerage service arrangements or other expense offset arrangements. Expenses net of all reductions represent the net expenses paid by the class.
E Expense ratio is negative due to the timing of negative management fee performance adjustments in relation to fluctuating net assets of the class.
F The ratio of expenses net of all reductions to average net assets includes non-recurring payments by certain of the fund's brokers for commissions recaptured during the period. Excluding these payments, the ratio would have been (0.20)% and the total return would've been 30.90%.
G Amount does not include the portfolio activity of any underlying Fidelity Central Funds.
See accompanying notes which are an integral part of the financial statements.
Notes to Financial Statements
For the period ended October 31, 2015
(Amounts in thousands except percentages)
1. Organization.
Fidelity Disciplined Equity Fund (the Fund) is a fund of Fidelity Capital Trust (the Trust) and is authorized to issue an unlimited number of shares. The Trust is registered under the Investment Company Act of 1940, as amended (the 1940 Act), as an open-end management investment company organized as a Massachusetts business trust. The Fund offers Class K shares, each of which has equal rights as to assets and voting privileges. Each class has exclusive voting rights with respect to matters that affect that class.
2. Investments in Fidelity Central Funds.
The Fund invests in Fidelity Central Funds, which are open-end investment companies generally available only to other investment companies and accounts managed by the investment adviser and its affiliates. The Fund's Schedule of Investments lists each of the Fidelity Central Funds held as of period end, if any, as an investment of the Fund, but does not include the underlying holdings of each Fidelity Central Fund. As an Investing Fund, the Fund indirectly bears its proportionate share of the expenses of the underlying Fidelity Central Funds.
The Money Market Central Funds seek preservation of capital and current income and are managed by Fidelity Investments Money Management, Inc. (FIMM), an affiliate of the investment adviser. Annualized expenses of the Money Market Central Funds as of their most recent shareholder report date are less than .005%.
A complete unaudited list of holdings for each Fidelity Central Fund is available upon request or at the Securities and Exchange Commission (the SEC) website at www.sec.gov. In addition, the financial statements of the Fidelity Central Funds, which are not covered by the Fund's Report of Independent Registered Public Accounting Firm, are available on the SEC website or upon request.
3. Significant Accounting Policies.
The financial statements have been prepared in conformity with accounting principles generally accepted in the United States of America (GAAP), which require management to make certain estimates and assumptions at the date of the financial statements. Actual results could differ from those estimates. Subsequent events, if any, through the date that the financial statements were issued have been evaluated in the preparation of the financial statements. The following summarizes the significant accounting policies of the Fund:
Investment Valuation. Investments are valued as of 4:00 p.m. Eastern time on the last calendar day of the period. The Board of Trustees (the Board) has delegated the day to day responsibility for the valuation of the Fund's investments to the Fidelity Management & Research Company (FMR) Fair Value Committee (the Committee). In accordance with valuation policies and procedures approved by the Board, the Fund attempts to obtain prices from one or more third party pricing vendors or brokers to value its investments. When current market prices, quotations or currency exchange rates are not readily available or reliable, investments will be fair valued in good faith by the Committee, in accordance with procedures adopted by the Board. Factors used in determining fair value vary by investment type and may include market or investment specific events. The frequency with which these procedures are used cannot be predicted and they may be utilized to a significant extent. The Committee oversees the Fund's valuation policies and procedures and reports to the Board on the Committee's activities and fair value determinations. The Board monitors the appropriateness of the procedures used in valuing the Fund's investments and ratifies the fair value determinations of the Committee.
The Fund categorizes the inputs to valuation techniques used to value its investments into a disclosure hierarchy consisting of three levels as shown below:
- Level 1 – quoted prices in active markets for identical investments
- Level 2 – other significant observable inputs (including quoted prices for similar investments, interest rates, prepayment speeds, etc.)
- Level 3 – unobservable inputs (including the Fund's own assumptions based on the best information available)
Valuation techniques used to value the Fund's investments by major category are as follows:
Equity securities, including restricted securities, for which market quotations are readily available, are valued at the last reported sale price or official closing price as reported by a third party pricing vendor on the primary market or exchange on which they are traded and are categorized as Level 1 in the hierarchy. In the event there were no sales during the day or closing prices are not available, securities are valued at the last quoted bid price or may be valued using the last available price and are generally categorized as Level 2 in the hierarchy. For foreign equity securities, when market or security specific events arise, comparisons to the valuation of American Depositary Receipts (ADRs), futures contracts, Exchange-Traded Funds (ETFs) and certain indexes as well as quoted prices for similar securities may be used and would be categorized as Level 2 in the hierarchy. Utilizing these techniques may result in transfers between Level 1 and Level 2. For equity securities, including restricted securities, where observable inputs are limited, assumptions about market activity and risk are used and these securities may be categorized as Level 3 in the hierarchy.
Investments in open-end mutual funds, including the Fidelity Central Funds, are valued at their closing net asset value (NAV) each business day and are categorized as Level 1 in the hierarchy.
Changes in valuation techniques may result in transfers in or out of an assigned level within the disclosure hierarchy.
Investment Transactions and Income. For financial reporting purposes, the Fund's investment holdings and NAV include trades executed through the end of the last business day of the period. The NAV per share for processing shareholder transactions is calculated as of the close of business of the New York Stock Exchange (NYSE), normally 4:00 p.m. Eastern time and includes trades executed through the end of the prior business day. Gains and losses on securities sold are determined on the basis of identified cost and may include proceeds received from litigation. Dividend income is recorded on the ex-dividend date, except for certain dividends from foreign securities where the ex-dividend date may have passed, which are recorded as soon as the Fund is informed of the ex-dividend date. Non-cash dividends included in dividend income, if any, are recorded at the fair market value of the securities received. Income and capital gain distributions from Fidelity Central Funds, if any, are recorded on the ex-dividend date. Distributions received on securities that represent a return of capital or capital gain are recorded as a reduction of cost of investments and/or as a realized gain. Subsequent to ex-dividend date the Fund determines the components of these distributions, based upon receipt of tax filings or other correspondence relating to the underlying investment.
Class Allocations and Expenses. Investment income, realized and unrealized capital gains and losses, common expenses of the Fund, and certain fund-level expense reductions, if any, are allocated daily on a pro-rata basis to each class based on the relative net assets of each class to the total net assets of the Fund. Each class differs with respect to transfer agent fees incurred. Certain expense reductions may also differ by class. For the reporting period, the allocated portion of income and expenses to each class as a percent of its average net assets may vary due to the timing of recording these transactions in relation to fluctuating net assets of the classes. Expenses directly attributable to a fund are charged to that fund. Expenses attributable to more than one fund are allocated among the respective funds on the basis of relative net assets or other appropriate methods. Expense estimates are accrued in the period to which they relate and adjustments are made when actual amounts are known.
Deferred Trustee Compensation. Under a Deferred Compensation Plan (the Plan), independent Trustees may elect to defer receipt of a portion of their annual compensation. Deferred amounts are invested in a cross-section of Fidelity funds, are marked-to-market and remain in the Fund until distributed in accordance with the Plan. The investment of deferred amounts and the offsetting payable to the Trustees are included in the accompanying Statement of Assets and Liabilities.
Income Tax Information and Distributions to Shareholders. Each year, the Fund intends to qualify as a regulated investment company under Subchapter M of the Internal Revenue Code, including distributing substantially all of its taxable income and realized gains. As a result, no provision for U.S. Federal income taxes is required. As of October 31, 2015, the Fund did not have any unrecognized tax benefits in the financial statements; nor is the Fund aware of any tax positions for which it is reasonably possible that the total amounts of unrecognized tax benefits will significantly change in the next twelve months. The Fund files a U.S. federal tax return, in addition to state and local tax returns as required. The Fund's federal income tax returns are subject to examination by the Internal Revenue Service (IRS) for a period of three fiscal years after they are filed. State and local tax returns may be subject to examination for an additional fiscal year depending on the jurisdiction.
Distributions are declared and recorded on the ex-dividend date. Income dividends and capital gain distributions are declared separately for each class. Income and capital gain distributions are determined in accordance with income tax regulations, which may differ from GAAP.
Capital accounts within the financial statements are adjusted for permanent book-tax differences. These adjustments have no impact on net assets or the results of operations. Capital accounts are not adjusted for temporary book-tax differences which will reverse in a subsequent period.
Book-tax differences are primarily due to futures contracts, deferred trustees compensation, capital loss carryforwards and losses deferred due to wash sales.
The federal tax cost of investment securities and unrealized appreciation (depreciation) as of period end were as follows:
| Gross unrealized appreciation | $138,999 |
| Gross unrealized depreciation | (51,765) |
| Net unrealized appreciation (depreciation) on securities | $87,234 |
| Tax Cost | $1,445,484 |
The tax-based components of distributable earnings as of period end were as follows:
| Undistributed ordinary income | $16,454 |
| Undistributed long-term capital gain | $69,109 |
| Net unrealized appreciation (depreciation) on securities and other investments | $87,235 |
Capital loss carryforwards are only available to offset future capital gains of the Fund to the extent provided by regulations and may be limited. Under the Regulated Investment Company Modernization Act of 2010 (the Act), the Fund is permitted to carry forward capital losses incurred in taxable years beginning after December 22, 2010 for an unlimited period and such capital losses are required to be used prior to any losses that expire. The capital loss carryforward information presented below, including any applicable limitation, is estimated as of fiscal period end and is subject to adjustment.
| Fiscal year of expiration | |
| 2017 | $(102,570) |
Due to large redemptions in a prior period, $102,570 of capital losses that will be available to offset future capital gains of the Fund will be limited to approximately $47,725 per year.
The tax character of distributions paid was as follows:
| October 31, 2015 | October 31, 2014 | |
| Ordinary Income | $57,032 | $ 40,889 |
| Long-term Capital Gains | 45,738 | – |
| Total | $102,770 | $ 40,889 |
4. Derivative Instruments.
Risk Exposures and the Use of Derivative Instruments. The Fund's investment objective allows the Fund to enter into various types of derivative contracts, including futures contracts. Derivatives are investments whose value is primarily derived from underlying assets, indices or reference rates and may be transacted on an exchange or over-the-counter (OTC). Derivatives may involve a future commitment to buy or sell a specified asset based on specified terms, to exchange future cash flows at periodic intervals based on a notional principal amount, or for one party to make one or more payments upon the occurrence of specified events in exchange for periodic payments from the other party.
The Fund used derivatives to increase returns and to manage exposure to certain risks as defined below. The success of any strategy involving derivatives depends on analysis of numerous economic factors, and if the strategies for investment do not work as intended, the Fund may not achieve its objectives.
The Fund's use of derivatives increased or decreased its exposure to the following risk:
| Equity Risk | Equity risk relates to the fluctuations in the value of financial instruments as a result of changes in market prices (other than those arising from interest rate risk or foreign exchange risk), whether caused by factors specific to an individual investment, its issuer, or all factors affecting all instruments traded in a market or market segment. |
The Fund is also exposed to additional risks from investing in derivatives, such as liquidity risk and counterparty credit risk. Liquidity risk is the risk that the Fund will be unable to close out the derivative in the open market in a timely manner. Counterparty credit risk is the risk that the counterparty will not be able to fulfill its obligation to the Fund.
Investing in derivatives may involve greater risks than investing in the underlying assets directly and, to varying degrees, may involve risk of loss in excess of any initial investment and collateral received and amounts recognized in the Statement of Assets and Liabilities. In addition, there may be the risk that the change in value of the derivative contract does not correspond to the change in value of the underlying instrument.
Futures Contracts. A futures contract is an agreement between two parties to buy or sell a specified underlying instrument for a fixed price at a specified future date. The Fund used futures contracts to manage its exposure to the stock market.
Upon entering into a futures contract, a fund is required to deposit either cash or securities (initial margin) with a clearing broker in an amount equal to a certain percentage of the face value of the contract. Futures contracts are marked-to-market daily and subsequent daily payments are made or received by a fund depending on the daily fluctuations in the value of the futures contracts and are recorded as unrealized appreciation or (depreciation). This receivable and/or payable, if any, is included in daily variation margin for derivative instruments in the Statement of Assets and Liabilities. Realized gain or (loss) is recorded upon the expiration or closing of a futures contract.
Any open futures contracts at period end are presented in the Schedule of Investments under the caption "Futures Contracts". The underlying face amount at value reflects each contract's exposure to the underlying instrument or index at period end.
During the period the Fund recognized net realized gain of $626 related to its investment in futures contracts. This amount is included in the Statement of Operations.
5. Purchases and Sales of Investments.
Purchases and sales of securities other than short-term securities, aggregated $2,631,948 and $2,580,613, respectively.
6. Fees and Other Transactions with Affiliates.
Management Fee. Fidelity Management & Research Company (the investment adviser) and its affiliates provide the Fund with investment management related services for which the Fund pays a monthly management fee. The management fee is the sum of an individual fund fee rate that is based on an annual rate of .30% of the Fund's average net assets and an annualized group fee rate that averaged .25% during the period. The group fee rate is based upon the average net assets of all the mutual funds advised by the investment adviser, including any mutual funds previously advised by the investment adviser that are currently advised by Fidelity SelectCo, LLC, an affiliate of the investment adviser. The group fee rate decreases as assets under management increase and increases as assets under management decrease. In addition, the management fee is subject to a performance adjustment(up to a maximum of +/- .20% of the Fund's average net assets over a 36 month performance period). The upward or downward adjustment to the management fee is based on the relative investment performance of Disciplined Equity as compared to its benchmark index, the S&P 500 Index, over the same 36 month performance period. For the reporting period, the total annual management fee rate, including the performance adjustment, was .70% of the Fund's average net assets. The performance adjustment included in the management fee rate may be higher or lower than the maximum performance adjustment rate due to the difference between the average net assets for the reporting and performance periods.
Transfer Agent Fees. Fidelity Investments Institutional Operations Company, Inc., (FIIOC), an affiliate of the investment adviser, is the transfer, dividend disbursing and shareholder servicing agent for each class of the Fund. FIIOC receives account fees and asset-based fees that vary according to the account size and type of account of the shareholders of Disciplined Equity. FIIOC receives an asset-based fee of Class K's average net assets. FIIOC pays for typesetting, printing and mailing of shareholder reports, except proxy statements.
For the period, transfer agent fees for each class were as follows:
| Amount | % of Class-Level Average Net Assets | |
| Disciplined Equity | $1,917 | .15 |
| Class K | 72 | .05 |
| $ 1,989 |
Accounting and Security Lending Fees. Fidelity Service Company, Inc. (FSC), an affiliate of the investment adviser, maintains the Fund's accounting records. The accounting fee is based on the level of average net assets for each month. Under a separate contract, FSC administers the security lending program. The security lending fee is based on the number and duration of lending transactions.
Brokerage Commissions. The Fund placed a portion of its portfolio transactions with brokerage firms which are affiliates of the investment adviser. Brokerage commissions are included in net realized gain (loss) and change in net unrealized appreciation (depreciation) in the Statement of Operations. The commissions paid to these affiliated firms were $10 for the period.
Interfund Lending Program. Pursuant to an Exemptive Order issued by the SEC, the Fund, along with other registered investment companies having management contracts with FMR or other affiliated entities of FMR, may participate in an interfund lending program. This program provides an alternative credit facility allowing the funds to borrow from, or lend money to, other participating affiliated funds. At period end, there were no interfund loans outstanding. The Fund's activity in this program during the period for which loans were outstanding was as follows:
| Borrower or Lender | Average Loan Balance | Weighted Average Interest Rate | Interest Expense |
| Borrower | $57,625 | .39% | $2 |
7. Committed Line of Credit.
The Fund participates with other funds managed by the investment adviser or an affiliate in a $4.25 billion credit facility (the "line of credit") to be utilized for temporary or emergency purposes to fund shareholder redemptions or for other short-term liquidity purposes. The Fund has agreed to pay commitment fees on its pro-rata portion of the line of credit, which amounted to $2 and is reflected in Miscellaneous expenses on the Statement of Operations. During the period, the Fund did not borrow on this line of credit.
8. Security Lending.
The Fund lends portfolio securities through a lending agent from time to time in order to earn additional income. For equity securities, a lending agent is used and may loan securities to certain qualified borrowers, including Fidelity Capital Markets (FCM), a broker-dealer affiliated with the Fund. On the settlement date of the loan, the Fund receives collateral (in the form of U.S. Treasury obligations, letters of credit and/or cash) against the loaned securities and maintains collateral in an amount not less than 100% of the market value of the loaned securities during the period of the loan. The market value of the loaned securities is determined at the close of business of the Fund and any additional required collateral is delivered to the Fund on the next business day. The Fund or borrower may terminate the loan at any time, and if the borrower defaults on its obligation to return the securities loaned because of insolvency or other reasons, the Fund may apply collateral received from the borrower against the obligation. The Fund may experience delays and costs in recovering the securities loaned. Any cash collateral received is invested in the Fidelity Securities Lending Cash Central Fund. The value of loaned securities and cash collateral at period end are disclosed on the Fund's Statement of Assets and Liabilities. The value of securities loaned to FCM at period end was $748. Security lending income represents the income earned on investing cash collateral, less rebates paid to borrowers, plus any premium payments received for lending certain types of securities. Security lending income is presented in the Statement of Operations as a component of income from Fidelity Central Funds. Total security lending income during the period amounted to $342, including $32 from securities loaned to FCM.
9. Expense Reductions.
Commissions paid to certain brokers with whom the investment adviser, or its affiliates, places trades on behalf of the Fund include an amount in addition to trade execution, which may be rebated back to the Fund to offset certain expenses. This amount totaled $11 for the period.
In addition, during the period the investment adviser reimbursed and/or waived a portion of fund-level operating expenses in the amount of $6 and a portion of class-level operating expenses as follows:
| Amount | |
| Disciplined Equity | $30 |
10. Distributions to Shareholders.
Distributions to shareholders of each class were as follows:
| Years ended October 31, | 2015 | 2014 |
| From net investment income | ||
| Disciplined Equity | $13,214 | $25,989 |
| Class K | 1,865 | 3,591 |
| Total | $15,079 | $29,580 |
| From net realized gain | ||
| Disciplined Equity | $77,745 | $10,004 |
| Class K | 9,946 | 1,305 |
| Total | $87,691 | $11,309 |
11. Share Transactions.
Share transactions for each class were as follows and may contain automatic conversions between classes or exchanges between funds:
| Shares | Shares | Dollars | Dollars | |
| Years ended October 31, | 2015 | 2014 | 2015 | 2014 |
| Disciplined Equity | ||||
| Shares sold | 6,822 | 2,332 | $221,673 | $75,217 |
| Reinvestment of distributions | 2,529 | 1,075 | 85,602 | 33,942 |
| Shares redeemed | (4,031) | (5,131) | (137,608) | (170,025) |
| Net increase (decrease) | 5,320 | (1,724) | $169,667 | $(60,866) |
| Class K | ||||
| Shares sold | 584 | 734 | $19,748 | $24,242 |
| Reinvestment of distributions | 350 | 155 | 11,810 | 4,896 |
| Shares redeemed | (1,646) | (1,281) | (56,624) | (42,300) |
| Net increase (decrease) | (712) | (392) | $(25,066) | $(13,162) |
12. Other.
The Fund's organizational documents provide former and current trustees and officers with a limited indemnification against liabilities arising in connection with the performance of their duties to the Fund. In the normal course of business, the Fund may also enter into contracts that provide general indemnifications. The Fund's maximum exposure under these arrangements is unknown as this would be dependent on future claims that may be made against the Fund. The risk of material loss from such claims is considered remote.
Report of Independent Registered Public Accounting Firm
To the Trustees of Fidelity Capital Trust and Shareholders of Fidelity® Disciplined Equity Fund:
In our opinion, the accompanying statement of assets and liabilities, including the schedule of investments, and the related statements of operations and of changes in net assets and the financial highlights present fairly, in all material respects, the financial position of Fidelity® Disciplined Equity Fund (a fund of Fidelity Capital Trust) at October 31, 2015, the results of its operations for the year then ended, the changes in its net assets for each of the two years in the period then ended and the financial highlights for each of the five years in the period then ended, in conformity with accounting principles generally accepted in the United States of America. These financial statements and financial highlights (hereafter referred to as “financial statements”) are the responsibility of the Fidelity® Disciplined Equity Fund’s management. Our responsibility is to express an opinion on these financial statements based on our audits. We conducted our audits of these financial statements in accordance with the standards of the Public Company Accounting Oversight Board (United States). Those standards require that we plan and perform the audit to obtain reasonable assurance about whether the financial statements are free of material misstatement. An audit includes examining, on a test basis, evidence supporting the amounts and disclosures in the financial statements, assessing the accounting principles used and significant estimates made by management, and evaluating the overall financial statement presentation. We believe that our audits, which included confirmation of securities at October 31, 2015 by correspondence with the custodian and brokers, provide a reasonable basis for our opinion.
PricewaterhouseCoopers LLP
Boston, Massachusetts
December 16, 2015
Trustees and Officers
The Trustees, Members of the Advisory Board (if any), and officers of the trust and fund, as applicable, are listed below. The Board of Trustees governs the fund and is responsible for protecting the interests of shareholders. The Trustees are experienced executives who meet periodically throughout the year to oversee the fund's activities, review contractual arrangements with companies that provide services to the fund, oversee management of the risks associated with such activities and contractual arrangements, and review the fund's performance. Each of the Trustees oversees 170 funds.
The Trustees hold office without limit in time except that (a) any Trustee may resign; (b) any Trustee may be removed by written instrument, signed by at least two-thirds of the number of Trustees prior to such removal; (c) any Trustee who requests to be retired or who has become incapacitated by illness or injury may be retired by written instrument signed by a majority of the other Trustees; and (d) any Trustee may be removed at any special meeting of shareholders by a two-thirds vote of the outstanding voting securities of the trust. Each Trustee who is not an interested person (as defined in the 1940 Act) of the trust and the fund is referred to herein as an Independent Trustee. Each Independent Trustee shall retire not later than the last day of the calendar year in which his or her 75th birthday occurs. The Independent Trustees may waive this mandatory retirement age policy with respect to individual Trustees. Officers and Advisory Board Members hold office without limit in time, except that any officer or Advisory Board Member may resign or may be removed by a vote of a majority of the Trustees at any regular meeting or any special meeting of the Trustees. Except as indicated, each individual has held the office shown or other offices in the same company for the past five years.
The fund’s Statement of Additional Information (SAI) includes more information about the Trustees. To request a free copy, call Fidelity at 1-800-544-8544.
Experience, Skills, Attributes, and Qualifications of the Trustees. The Governance and Nominating Committee has adopted a statement of policy that describes the experience, qualifications, attributes, and skills that are necessary and desirable for potential Independent Trustee candidates (Statement of Policy). The Board believes that each Trustee satisfied at the time he or she was initially elected or appointed a Trustee, and continues to satisfy, the standards contemplated by the Statement of Policy. The Governance and Nominating Committee also engages professional search firms to help identify potential Independent Trustee candidates who have the experience, qualifications, attributes, and skills consistent with the Statement of Policy. From time to time, additional criteria based on the composition and skills of the current Independent Trustees, as well as experience or skills that may be appropriate in light of future changes to board composition, business conditions, and regulatory or other developments, have also been considered by the professional search firms and the Governance and Nominating Committee. In addition, the Board takes into account the Trustees' commitment and participation in Board and committee meetings, as well as their leadership of standing and ad hoc committees throughout their tenure.
In determining that a particular Trustee was and continues to be qualified to serve as a Trustee, the Board has considered a variety of criteria, none of which, in isolation, was controlling. The Board believes that, collectively, the Trustees have balanced and diverse experience, qualifications, attributes, and skills, which allow the Board to operate effectively in governing the fund and protecting the interests of shareholders. Information about the specific experience, skills, attributes, and qualifications of each Trustee, which in each case led to the Board's conclusion that the Trustee should serve (or continue to serve) as a trustee of the fund, is provided below.
Board Structure and Oversight Function. James C. Curvey is an interested person and currently serves as Chairman. The Trustees have determined that an interested Chairman is appropriate and benefits shareholders because an interested Chairman has a personal and professional stake in the quality and continuity of services provided to the fund. Independent Trustees exercise their informed business judgment to appoint an individual of their choosing to serve as Chairman, regardless of whether the Trustee happens to be independent or a member of management. The Independent Trustees have determined that they can act independently and effectively without having an Independent Trustee serve as Chairman and that a key structural component for assuring that they are in a position to do so is for the Independent Trustees to constitute a substantial majority for the Board. The Independent Trustees also regularly meet in executive session. Ned C. Lautenbach serves as Chairman of the Independent Trustees and as such (i) acts as a liaison between the Independent Trustees and management with respect to matters important to the Independent Trustees and (ii) with management prepares agendas for Board meetings.
Fidelity® funds are overseen by different Boards of Trustees. The fund's Board oversees Fidelity's high income and certain equity funds, and other Boards oversee Fidelity's investment-grade bond, money market, asset allocation, and sector funds. The asset allocation funds may invest in Fidelity® funds overseen by the fund's Board. The use of separate Boards, each with its own committee structure, allows the Trustees of each group of Fidelity® funds to focus on the unique issues of the funds they oversee, including common research, investment, and operational issues. On occasion, the separate Boards establish joint committees to address issues of overlapping consequences for the Fidelity® funds overseen by each Board.
The Trustees operate using a system of committees to facilitate the timely and efficient consideration of all matters of importance to the Trustees, the fund, and fund shareholders and to facilitate compliance with legal and regulatory requirements and oversight of the fund's activities and associated risks. The Board, acting through its committees, has charged FMR and its affiliates with (i) identifying events or circumstances the occurrence of which could have demonstrably adverse effects on the fund's business and/or reputation; (ii) implementing processes and controls to lessen the possibility that such events or circumstances occur or to mitigate the effects of such events or circumstances if they do occur; and (iii) creating and maintaining a system designed to evaluate continuously business and market conditions in order to facilitate the identification and implementation processes described in (i) and (ii) above. Because the day-to-day operations and activities of the fund are carried out by or through FMR, its affiliates, and other service providers, the fund's exposure to risks is mitigated but not eliminated by the processes overseen by the Trustees. While each of the Board's committees has responsibility for overseeing different aspects of the fund's activities, oversight is exercised primarily through the Operations, Audit, and Compliance Committees. In addition, the Independent Trustees have worked with FMR to enhance the Board's oversight of investment and financial risks, legal and regulatory risks, technology risks, and operational risks, including the development of additional risk reporting to the Board. For example, a working group comprised of Independent Trustees and FMR has worked and continues to work to review the Fidelity® funds' valuation-related activities, reporting and risk management. Appropriate personnel, including but not limited to the fund's Chief Compliance Officer (CCO), FMR's internal auditor, the independent accountants, the fund's Treasurer and portfolio management personnel, make periodic reports to the Board's committees, as appropriate, including an annual review of Fidelity's risk management program for the Fidelity® funds. The responsibilities of each standing committee, including their oversight responsibilities, are described further under "Standing Committees of the Trustees."
Interested Trustees*:
Correspondence intended for a Trustee who is an interested person may be sent to Fidelity Investments, 245 Summer Street, Boston, Massachusetts 02210.
Name, Year of Birth; Principal Occupations and Other Relevant Experience+
James C. Curvey (1935)
Year of Election or Appointment: 2007
Trustee
Chairman of the Board of Trustees
Mr. Curvey also serves as Trustee of other Fidelity® funds. Mr. Curvey is a Director of Fidelity Research & Analysis Co. (investment adviser firm, 2009-present), and Vice Chairman (2007-present) and Director of FMR LLC (diversified financial services company). In addition, Mr. Curvey serves as an Overseer for the Boston Symphony Orchestra and a member of the board of Artis-Naples, Naples, Florida, and as a Trustee for Brewster Academy, Wolfeboro, New Hampshire. Previously, Mr. Curvey served as a Director of Fidelity Investments Money Management, Inc. (investment adviser firm, 2009-2014) and a Director of FMR and FMR Co., Inc. (investment adviser firms, 2007-2014).
Charles S. Morrison (1960)
Year of Election or Appointment: 2014
Trustee
Mr. Morrison also serves as Trustee of other funds. He serves as a Director of Fidelity Investments Money Management, Inc. (FIMM) (investment adviser firm, 2014-present), Director of Fidelity SelectCo, LLC (investment adviser firm, 2014-present), President, Asset Management (2014-present), and is an employee of Fidelity Investments. Previously, Mr. Morrison served as Vice President of Fidelity's Fixed Income and Asset Allocation Funds (2012-2014), President, Fixed Income (2011-2014), Vice President of Fidelity's Money Market Funds (2005-2009), President, Money Market Group Leader of FMR (investment adviser firm, 2009), and Senior Vice President, Money Market Group of FMR (2004-2009). Mr. Morrison also served as Vice President of Fidelity's Bond Funds (2002-2005), certain Balanced Funds (2002-2005), and certain Asset Allocation Funds (2002-2007), and as Senior Vice President (2002-2005) of Fidelity's Bond Division.
* Determined to be an “Interested Trustee” by virtue of, among other things, his or her affiliation with the trust or various entities under common control with FMR.
+ The information includes the Trustee's principal occupation during the last five years and other information relating to the experience, attributes, and skills relevant to the Trustee's qualifications to serve as a Trustee, which led to the conclusion that the Trustee should serve as a Trustee for the fund.
Independent Trustees:
Correspondence intended for an Independent Trustee may be sent to Fidelity Investments, P.O. Box 55235, Boston, Massachusetts 02205-5235.
Name, Year of Birth; Principal Occupations and Other Relevant Experience+
Dennis J. Dirks (1948)
Year of Election or Appointment: 2005
Trustee
Mr. Dirks also serves as Trustee of other Fidelity® funds. Prior to his retirement in May 2003, Mr. Dirks was Chief Operating Officer and a member of the Board of The Depository Trust & Clearing Corporation (DTCC). He also served as President, Chief Operating Officer, and Board member of The Depository Trust Company (DTC) and President and Board member of the National Securities Clearing Corporation (NSCC). In addition, Mr. Dirks served as Chief Executive Officer and Board member of the Government Securities Clearing Corporation, Chief Executive Officer and Board member of the Mortgage-Backed Securities Clearing Corporation, as a Trustee and a member of the Finance Committee of Manhattan College (2005-2008), as a Trustee and a member of the Finance Committee of AHRC of Nassau County (2006-2008), and as a member of the Independent Directors Council (IDC) Governing Council (2010-2015). Mr. Dirks is a member of the Board of Directors for The Brookville Center for Children's Services, Inc. (2009-present).
Alan J. Lacy (1953)
Year of Election or Appointment: 2008
Trustee
Mr. Lacy also serves as Trustee of other Fidelity® funds. Mr. Lacy serves as a member of the Board of Directors of Dave & Buster's Entertainment, Inc. (restaurant and entertainment complexes, 2010-present) and Bristol-Myers Squibb Company (global pharmaceuticals, 2008-present). In addition, Mr. Lacy served as Senior Adviser (2007-2014) of Oak Hill Capital Partners, L.P. (private equity) and also served as Chief Executive Officer (2000-2005) and Vice Chairman (2005-2006) of Sears Holdings Corporation and Sears, Roebuck and Co. (retail). Mr. Lacy is a member of the Board of Trustees of The National Parks Conservation Association (2006-present). Previously, Mr. Lacy served as Chairman of the Board of Trustees of the National Parks Conservation Association (2008-2011) and as a member of the Board of Directors for The Western Union Company (global money transfer, 2006-2011), The Hillman Companies, Inc. (hardware wholesalers, 2010-2014), and Earth Fare, Inc. (retail grocery, 2010-2014).
Ned C. Lautenbach (1944)
Year of Election or Appointment: 2000
Trustee
Chairman of the Independent Trustees
Mr. Lautenbach also serves as Trustee of other Fidelity® funds. Mr. Lautenbach currently serves as the Lead Director of the Eaton Corporation Board of Directors (diversified industrial, 1997-present). Mr. Lautenbach is Chairman of the Board of Directors of Artis-Naples in Naples, Florida (2012-present), a member of the Council on Foreign Relations (1994-present), and a member of the Board of Governors, State University System of Florida (2013-present). Previously, Mr. Lautenbach was a Partner/Advisory Partner at Clayton, Dubilier & Rice, LLC (private equity investment, 1998-2010), as well as a Director of Sony Corporation (2006-2007).
Joseph Mauriello (1944)
Year of Election or Appointment: 2008
Trustee
Mr. Mauriello also serves as Trustee of other Fidelity® funds. Prior to his retirement in January 2006, Mr. Mauriello served in numerous senior management positions including Deputy Chairman and Chief Operating Officer (2004-2005), and Vice Chairman of Financial Services (2002-2004) of KPMG LLP US (professional services, 1965-2005). Mr. Mauriello currently serves as a member of the Board of Directors of XL Group plc. (global insurance and re-insurance, 2006-present) and the Independent Directors Council (IDC) Governing Council (2015-present). Previously, Mr. Mauriello served as a Director of the Hamilton Funds of the Bank of New York (2006-2007) and of Arcadia Resources Inc. (health care services and products, 2007-2012).
Robert W. Selander (1950)
Year of Election or Appointment: 2011
Trustee
Mr. Selander also serves as Trustee of other Fidelity® funds. Mr. Selander serves as a Director of The Western Union Company (global money transfer, 2014-present). Previously, Mr. Selander served as a Member of the Advisory Board of other Fidelity® funds (2011), and Executive Vice Chairman (2010), Chief Executive Officer (2009-2010), and President and Chief Executive Officer (1997-2009) of Mastercard, Inc.
Cornelia M. Small (1944)
Year of Election or Appointment: 2005
Trustee
Ms. Small also serves as Trustee of other Fidelity® funds. Ms. Small is a member of the Board of Directors (2009-present) and Chair of the Investment Committee (2010-present) of the Teagle Foundation. Ms. Small also serves on the Investment Committee of the Berkshire Taconic Community Foundation (2008-present). Previously, Ms. Small served as Chairperson (2002-2008) and a member of the Investment Committee and Chairperson (2008-2012) and a member of the Board of Trustees of Smith College. In addition, Ms. Small served as Chief Investment Officer, Director of Global Equity Investments, and a member of the Board of Directors of Scudder, Stevens & Clark and Scudder Kemper Investments.
William S. Stavropoulos (1939)
Year of Election or Appointment: 2002
Trustee
Vice Chairman of the Independent Trustees
Mr. Stavropoulos also serves as Trustee of other Fidelity® funds. Mr. Stavropoulos serves as President and Founder of the Michigan Baseball Foundation, the Great Lakes Loons (2007-present). Mr. Stavropoulos is Chairman Emeritus of the Board of Directors of The Dow Chemical Company, where he previously served in numerous senior management positions, including President, CEO (1995-2000; 2002-2004), Chairman of the Executive Committee (2000-2006), and as a member of the Board of Directors (1990-2006). Currently, Mr. Stavropoulos is Chairman of the Board of Directors of Univar Inc. (global distributor of commodity and specialty chemicals), a Director of Teradata Corporation (data warehousing and technology solutions), and Maersk Inc. (industrial conglomerate), and a member of the Advisory Board for Metalmark Capital LLC (private equity investment, 2005-present). Mr. Stavropoulos is an operating advisor to Clayton, Dubilier & Rice, LLC (private equity investment). In addition, Mr. Stavropoulos is a member of the University of Notre Dame Advisory Council for the College of Science, a Trustee of the Rollin L. Gerstacker Foundation, and a Director of the Naples Philharmonic Center for the Arts. Previously, Mr. Stavropoulos served as a Director of Chemical Financial Corporation (bank holding company, 1993-2012) and Tyco International, Ltd. (multinational manufacturing and services, 2007-2012).
David M. Thomas (1949)
Year of Election or Appointment: 2008
Trustee
Mr. Thomas also serves as Trustee of other Fidelity® funds. Mr. Thomas serves as Non-Executive Chairman of the Board of Directors of Fortune Brands Home and Security (home and security products, 2011-present), as a member of the Board of Directors (2004-present) and Presiding Director (2013-present) of Interpublic Group of Companies, Inc. (marketing communication), and as a member of the Board of Trustees of the University of Florida (2013-present). Previously, Mr. Thomas served as Executive Chairman (2005-2006) and Chairman and Chief Executive Officer (2000-2005) of IMS Health, Inc. (pharmaceutical and healthcare information solutions), and a Director of Fortune Brands, Inc. (consumer products, 2000-2011).
+ The information includes the Trustee's principal occupation during the last five years and other information relating to the experience, attributes, and skills relevant to the Trustee's qualifications to serve as a Trustee, which led to the conclusion that the Trustee should serve as a Trustee for the fund.
Advisory Board Members and Officers:
Correspondence intended for an officer or Peter S. Lynch may be sent to Fidelity Investments, 245 Summer Street, Boston, Massachusetts 02210. Officers appear below in alphabetical order.
Name, Year of Birth; Principal Occupation
Peter S. Lynch (1944)
Year of Election or Appointment: 2003
Member of the Advisory Board
Mr. Lynch also serves as Member of the Advisory Board of other Fidelity® funds. Mr. Lynch is Vice Chairman and a Director of FMR (investment adviser firm) and FMR Co., Inc. (investment adviser firm). In addition, Mr. Lynch serves as a Trustee of Boston College and as the Chairman of the Inner-City Scholarship Fund. Previously, Mr. Lynch served on the Special Olympics International Board of Directors (1997-2006).
Elizabeth Paige Baumann (1968)
Year of Election or Appointment: 2012
Anti-Money Laundering (AML) Officer
Ms. Baumann also serves as AML Officer of other funds. She is Chief AML Officer of FMR LLC (diversified financial services company, 2012-present) and is an employee of Fidelity Investments. Previously, Ms. Baumann served as Vice President and Deputy Anti-Money Laundering Officer (2007-2012).
Marc R. Bryant (1966)
Year of Election or Appointment: 2015
Secretary and Chief Legal Officer (CLO)
Mr. Bryant also serves as Secretary and CLO of other funds. Mr. Bryant serves as CLO, Secretary, and Senior Vice President of Fidelity Management & Research Company (investment adviser firm, 2015-present) and FMR Co., Inc. (investment adviser firm, 2015-present); Secretary of Fidelity SelectCo, LLC (investment adviser firm, 2015-present) and Fidelity Investments Money Management, Inc. (investment adviser firm, 2015-present); and CLO of Fidelity Management & Research (Hong Kong) Limited (investment adviser firm, 2015-present). He is Senior Vice President and Deputy General Counsel of FMR LLC (diversified financial services company). Previously, Mr. Bryant served as Secretary and Chief Legal Officer of Fidelity Rutland Square Trust II (2010-2014) and Assistant Secretary of Fidelity's Fixed Income and Asset Allocation Funds (2013-2015). Prior to joining Fidelity Investments, Mr. Bryant served as a Senior Vice President and the Head of Global Retail Legal for AllianceBernstein L.P. (2006-2010), and as the General Counsel for ProFund Advisors LLC (2001-2006).
William C. Coffey (1969)
Year of Election or Appointment: 2009
Assistant Secretary
Mr. Coffey also serves as Assistant Secretary of other funds. He is Senior Vice President and Deputy General Counsel of FMR LLC (diversified financial services company, 2010-present), and is an employee of Fidelity Investments. Previously, Mr. Coffey served as Vice President and Associate General Counsel of FMR LLC (2005-2009).
Jonathan Davis (1968)
Year of Election or Appointment: 2010
Assistant Treasurer
Mr. Davis also serves as Assistant Treasurer of other funds, and is an employee of Fidelity Investments. Previously, Mr. Davis served as Vice President and Associate General Counsel of FMR LLC (diversified financial services company, 2003-2010).
Adrien E. Deberghes (1967)
Year of Election or Appointment: 2008
Deputy Treasurer
Mr. Deberghes also serves as an officer of other funds. He is an employee of Fidelity Investments (2008-present). Prior to joining Fidelity Investments, Mr. Deberghes was Senior Vice President of Mutual Fund Administration at State Street Corporation (2007-2008), Senior Director of Mutual Fund Administration at Investors Bank & Trust (2005-2007), and Director of Finance for Dunkin' Brands (2000-2005).
Stephanie J. Dorsey (1969)
Year of Election or Appointment: 2010
Assistant Treasurer
Ms. Dorsey also serves as an officer of other funds. She is an employee of Fidelity Investments (2008-present) and has served in other fund officer roles. Prior to joining Fidelity Investments, Ms. Dorsey served as Treasurer (2004-2008) of the JPMorgan Mutual Funds and Vice President (2004-2008) of JPMorgan Chase Bank.
Howard J. Galligan III (1966)
Year of Election or Appointment: 2014
Chief Financial Officer
Mr. Galligan also serves as Chief Financial Officer of other funds. Mr. Galligan serves as President of Fidelity Pricing and Cash Management Services (FPCMS) (2014-present) and as a Director of Strategic Advisers, Inc. (investment adviser firm, 2008-present). Previously, Mr. Galligan served as Chief Administrative Officer of Asset Management (2011-2014) and Chief Operating Officer and Senior Vice President of Investment Support for Strategic Advisers, Inc. (2003-2011).
Scott C. Goebel (1968)
Year of Election or Appointment: 2015
Vice President
Mr. Goebel serves as Vice President of other funds and is an employee of Fidelity Investments (2001-present). Previously, Mr. Goebel served as Secretary of Fidelity SelectCo, LLC (investment adviser firm, 2013-2015), Fidelity Investments Money Management, Inc. (FIMM) (investment adviser firm, 2010-2015), and Fidelity Research and Analysis Company (FRAC) (investment adviser firm, 2010-2015); General Counsel, Secretary, and Senior Vice President of Fidelity Management & Research Company (investment adviser firm, 2008-2015) and FMR Co., Inc. (investment adviser firm, 2008-2015); Assistant Secretary of Fidelity Management & Research (Japan) Limited (investment adviser firm, 2008-2015) and FMR Investment Management (U.K.) Limited (investment adviser firm, 2008-2015); Chief Legal Officer (CLO) of Fidelity Management & Research (Hong Kong) Limited (investment adviser firm, 2008-2015); Secretary and CLO of certain Fidelity® funds (2008-2015); Assistant Secretary of FIMM (2008-2010), FRAC (2008-2010), and certain funds (2007-2008); and as Vice President and Secretary of Fidelity Distributors Corporation (FDC) (2005-2007).
Brian B. Hogan (1964)
Year of Election or Appointment: 2009
Vice President
Mr. Hogan also serves as Trustee or Vice President of other funds. Mr. Hogan serves as a Director of Fidelity SelectCo, LLC (investment adviser firm, 2014-present) and President of the Equity Division of FMR (investment adviser firm, 2009-present). Previously, Mr. Hogan served as Senior Vice President, Equity Research of FMR (2006-2009) and as a portfolio manager.
Chris Maher (1972)
Year of Election or Appointment: 2013
Assistant Treasurer
Mr. Maher serves as Assistant Treasurer of other funds. Mr. Maher is Vice President of Valuation Oversight and is an employee of Fidelity Investments. Previously, Mr. Maher served as Vice President of Asset Management Compliance (2013), Vice President of the Program Management Group of FMR (investment adviser firm, 2010-2013), and Vice President of Valuation Oversight (2008-2010).
Melissa M. Reilly (1971)
Year of Election or Appointment: 2014
Vice President of certain Equity Funds
Ms. Reilly also serves as Vice President of other funds. Ms. Reilly is an employee of Fidelity Investments (2004-present).
Kenneth B. Robins (1969)
Year of Election or Appointment: 2008
President and Treasurer
Mr. Robins also serves as an officer of other funds. Mr. Robins serves as Executive Vice President of Fidelity Investments Money Management, Inc. (FIMM) (investment adviser firm, 2013-present) and is an employee of Fidelity Investments (2004-present). Previously, Mr. Robins served in other fund officer roles.
Stacie M. Smith (1974)
Year of Election or Appointment: 2013
Deputy Treasurer
Ms. Smith also serves as an officer of other funds. She is an employee of Fidelity Investments (2009-present) and has served in other fund officer roles. Prior to joining Fidelity Investments, Ms. Smith served as Senior Audit Manager of Ernst & Young LLP (1996-2009).
Renee Stagnone (1975)
Year of Election or Appointment: 2013
Deputy Treasurer
Ms. Stagnone also serves as Deputy Treasurer of other funds. Ms. Stagnone is an employee of Fidelity Investments (1997-present).
Linda J. Wondrack (1964)
Year of Election or Appointment: 2014
Chief Compliance Officer
Ms. Wondrack also serves as Chief Compliance Officer of other funds. Ms. Wondrack is Executive Vice President and head of the Ethics Office and Asset Management Compliance for Fidelity Investments (2012-present). Ms. Wondrack also serves as Chief Compliance Officer of Fidelity SelectCo, LLC (investment adviser firm, 2014-present); Chief Compliance Officer of Impresa Management LLC (2013-present); and Chief Compliance Officer of FMR Co., Inc. (investment adviser firm), Fidelity Investments Money Management, Inc. (investment adviser firm), Fidelity Management & Research (Japan) Limited (investment adviser firm), FMR Investment Management (U.K.) Limited (investment adviser firm), Fidelity Management & Research (Hong Kong) (investment adviser firm), Fidelity Management & Research Company (investment adviser firm), FIAM LLC (investment adviser firm), and Strategic Advisers, Inc. (investment adviser firm), Ballyrock Investment Advisors LLC, and Northern Neck Investors LLC (2012-present). Previously, Ms. Wondrack served as Senior Vice President and Chief Compliance Officer for Columbia Management Investment Advisers, LLC (2005-2012); Chief Compliance Officer for certain funds within the Columbia Family of Funds (2007-2012); and Senior Vice President of Compliance Risk Management at Bank of America (2005-2010).
Joseph F. Zambello (1957)
Year of Election or Appointment: 2011
Deputy Treasurer
Mr. Zambello also serves as Deputy Treasurer of other funds. Mr. Zambello is an employee of Fidelity Investments (1991-present). Previously, Mr. Zambello served as Vice President of the Program Management Group of FMR (investment adviser firm, 2009-2011) and Vice President of the Transfer Agent Oversight Group (2005-2009).
Shareholder Expense Example
As a shareholder of the Fund, you incur two types of costs: (1) transaction costs and (2) ongoing costs, including management fees and other Fund expenses. This Example is intended to help you understand your ongoing costs (in dollars) of investing in the Fund and to compare these costs with the ongoing costs of investing in other mutual funds.
The Example is based on an investment of $1,000 invested at the beginning of the period and held for the entire period (May 1, 2015 to October 31, 2015).
Actual Expenses
The first line of the accompanying table for each class of the Fund provides information about actual account values and actual expenses. You may use the information in this line, together with the amount you invested, to estimate the expenses that you paid over the period. Simply divide your account value by $1,000.00 (for example, an $8,600 account value divided by $1,000.00 = 8.6), then multiply the result by the number in the first line for a class of the Fund under the heading entitled "Expenses Paid During Period" to estimate the expenses you paid on your account during this period. A small balance maintenance fee of $12.00 that is charged once a year may apply for certain accounts with a value of less than $2,000. This fee is not included in the table below. If it was, the estimate of expenses you paid during the period would be higher, and your ending account value lower, by this amount. In addition, the Fund, as a shareholder in the underlying Fidelity Central Funds, will indirectly bear its pro-rata share of the fees and expenses incurred by the underlying Fidelity Central Funds. These fees and expenses are not included in the Fund's annualized expense ratio used to calculate the expense estimate in the table below.
Hypothetical Example for Comparison Purposes
The second line of the accompanying table for each class of the Fund provides information about hypothetical account values and hypothetical expenses based on a Class' actual expense ratio and an assumed rate of return of 5% per year before expenses, which is not the Class' actual return. The hypothetical account values and expenses may not be used to estimate the actual ending account balance or expenses you paid for the period. You may use this information to compare the ongoing costs of investing in the Fund and other funds. To do so, compare this 5% hypothetical example with the 5% hypothetical examples that appear in the shareholder reports of the other funds. A small balance maintenance fee of $12.00 that is charged once a year may apply for certain accounts with a value of less than $2,000. This fee is not included in the table below. If it was, the estimate of expenses you paid during the period would be higher, and your ending account value lower, by this amount. In addition, the Fund, as a shareholder in the underlying Fidelity Central Funds, will indirectly bear its pro-rata share of the fees and expenses incurred by the underlying Fidelity Central Funds. These fees and expenses are not included in the Fund's annualized expense ratio used to calculate the expense estimate in the table below.
Please note that the expenses shown in the table are meant to highlight your ongoing costs only and do not reflect any transaction costs. Therefore, the second line of the table is useful in comparing ongoing costs only, and will not help you determine the relative total costs of owning different funds.
| Annualized Expense Ratio-A | Beginning Account Value May 1, 2015 | Ending Account Value October 31, 2015 | Expenses Paid During Period-B May 1, 2015 to October 31, 2015 | |
| Disciplined Equity | .89% | |||
| Actual | $1,000.00 | $997.10 | $4.48 | |
| Hypothetical-C | $1,000.00 | $1,020.72 | $4.53 | |
| Class K | .79% | |||
| Actual | $1,000.00 | $997.70 | $3.98 | |
| Hypothetical-C | $1,000.00 | $1,021.22 | $4.02 |
A Annualized expense ratio reflects expenses net of applicable fee waivers.
B Expenses are equal to each Class' annualized expense ratio, multiplied by the average account value over the period, multiplied by 184/365 (to reflect the one-half year period).
C 5% return per year before expenses
Distributions (Unaudited)
The Board of Trustees of Fidelity Disciplined Equity Fund voted to pay on December 7, 2015, to shareholders of record at the opening of business on December 4, 2015, a distribution of $1.648 per share derived from capital gains realized from sales of portfolio securities and a dividend of $0.357 per share from net investment income.
The fund hereby designates as a capital gain dividend with respect to the taxable year ended October 31, 2015, $69,242,695, or, if subsequently determined to be different, the net capital gain of such year.
Disciplined Equity Fund designates 34% of the dividends distributed during the fiscal year as qualifying for the dividends–received deduction for corporate shareholders.
Disciplined Equity Fund designates 35% of the dividend distributed in December during the fiscal year as amounts which may be taken into account as a dividend for the purposes of the maximum rate under section 1(h)(11) of the Internal Revenue Code.
The fund will notify shareholders in January 2016 of amounts for use in preparing 2015 income tax returns.
Board Approval of Investment Advisory Contracts and Management Fees
Fidelity Disciplined Equity Fund
Each year, the Board of Trustees, including the Independent Trustees (together, the Board), votes on the renewal of the management contract with Fidelity Management & Research Company (FMR) and the sub-advisory agreements (together, the Advisory Contracts) for the fund. The Board, assisted by the advice of fund counsel and Independent Trustees' counsel, requests and considers a broad range of information relevant to the renewal of the Advisory Contracts throughout the year.
The Board meets regularly and, at each of its meetings, covers an extensive agenda of topics and materials and considers factors that are relevant to its annual consideration of the renewal of the fund's Advisory Contracts, including the services and support provided to the fund and its shareholders. The Board has established various standing committees (Committees), each composed of and chaired by Independent Trustees with varying backgrounds, to which the Board has assigned specific subject matter responsibilities in order to enhance effective decision-making by the Board. The Board, acting directly and through its Committees, requests and receives information concerning the annual consideration of the renewal of the fund's Advisory Contracts. The Board also meets as needed to consider matters specifically related to the Board's annual consideration of the renewal of the Advisory Contracts. Members of the Board may also meet with trustees of other Fidelity funds through ad hoc joint committees to discuss certain matters relevant to all of the Fidelity funds.
At its July 2015 meeting, the Board unanimously determined to renew the fund's Advisory Contracts. In reaching its determination, the Board considered all factors it believed relevant, including (i) the nature, extent, and quality of the services to be provided to the fund and its shareholders (including the investment performance of the fund); (ii) the competitiveness of the fund's management fee and total expense ratio relative to peer funds; (iii) the total costs of the services to be provided by and the profits to be realized by Fidelity from its relationship with the fund; and (iv) the extent to which (if any) economies of scale exist and would be realized as the fund grows, and whether any economies of scale are appropriately shared with fund shareholders.
In considering whether to renew the Advisory Contracts for the fund, the Board reached a determination, with the assistance of fund counsel and Independent Trustees' counsel and through the exercise of its business judgment, that the renewal of the Advisory Contracts was in the best interests of the fund and its shareholders and that the compensation payable under the Advisory Contracts was fair and reasonable. The Board's decision to renew the Advisory Contracts was not based on any single factor, but rather was based on a comprehensive consideration of all the information provided to the Board at its meetings throughout the year. The Board, in reaching its determination to renew the Advisory Contracts, was aware that shareholders of the fund have a broad range of investment choices available to them, including a wide choice among funds offered by Fidelity's competitors, and that the fund's shareholders, who have the opportunity to review and weigh the disclosure provided by the fund in its prospectus and other public disclosures, have chosen to invest in this fund, which is part of the Fidelity family of funds.
Nature, Extent, and Quality of Services Provided. The Board considered Fidelity's staffing as it relates to the fund, including the backgrounds of investment personnel of Fidelity, and also considered the fund's investment objective, strategies, and related investment philosophy. The Independent Trustees also had discussions with senior management of Fidelity's investment operations and investment groups. The Board considered the structure of the portfolio manager compensation program and whether this structure provides appropriate incentives to act in the best interests of the fund. Additionally, the Board considered the portfolio managers' investments, if any, in the funds that they manage.Resources Dedicated to Investment Management and Support Services. The Board and the Fund Oversight and Research Committees reviewed the general qualifications and capabilities of Fidelity's investment staff, including its size, education, experience, and resources, as well as Fidelity's approach to recruiting, training, managing, and compensating investment personnel. The Board noted that Fidelity has continued to increase the resources devoted to non-U.S. offices, including expansion of Fidelity's global investment organization. The Board also noted that Fidelity's analysts have extensive resources, tools and capabilities that allow them to conduct sophisticated quantitative and fundamental analysis, as well as credit analysis of issuers, counterparties and guarantors. Further, the Board considered that Fidelity's investment professionals have sufficient access to global information and data so as to provide competitive investment results over time, and that those professionals also have access to sophisticated tools that permit them to assess portfolio construction and risk and performance attribution characteristics continuously, as well as to transmit new information and research conclusions rapidly around the world. Additionally, in its deliberations, the Board considered Fidelity's trading, risk management, and compliance capabilities and resources, which are integral parts of the investment management process.Shareholder and Administrative Services. The Board considered (i) the nature, extent, quality, and cost of advisory, administrative, and shareholder services performed by FMR, the sub-advisers (together with FMR, the Investment Advisers), and their affiliates under the Advisory Contracts and under separate agreements covering transfer agency, pricing and bookkeeping, and securities lending services for the fund; (ii) the nature and extent of the supervision of third party service providers, principally custodians and subcustodians; and (iii) the resources devoted to, and the record of compliance with, the fund's compliance policies and procedures. The Board also reviewed the allocation of fund brokerage, including allocations to brokers affiliated with the Investment Advisers, the use of brokerage commissions to pay fund expenses, and the use of "soft" commission dollars to pay for research services.The Board noted that the growth of fund assets over time across the complex allows Fidelity to reinvest in the development of services designed to enhance the value or convenience of the Fidelity funds as investment vehicles. These services include 24-hour access to account information and market information through telephone representatives and over the Internet, investor education materials and asset allocation tools, and the expanded availability of Fidelity Investor Centers.In 2014, the Board formed an ad hoc Committee on Transfer Agency Fees to review the variety of transfer agency fee structures throughout the industry and Fidelity's competitive positioning with respect to industry participants.Investment in a Large Fund Family. The Board considered the benefits to shareholders of investing in a Fidelity fund, including the benefits of investing in a fund that is part of a large family of funds offering a variety of investment disciplines and providing a large variety of mutual fund investor services. The Board noted that Fidelity had taken, or had made recommendations that resulted in the Fidelity funds taking, a number of actions over the previous year that benefited particular funds, including (i) continuing to dedicate additional resources to investment research and to the support of the senior management team that oversees asset management; (ii) continuing efforts to enhance Fidelity's global research capabilities; (iii) launching new funds and making other enhancements to meet client needs; (iv) reducing management fees and total expenses for certain index funds and diversified international funds; (v) continuing to launch dedicated lower cost underlying funds to meet portfolio construction needs related to expanding underlying fund options for Fidelity funds of funds, specifically for the Freedom Fund product lines; (vi) rationalizing product lines and gaining increased efficiencies through fund mergers; (vii) launching active fixed-income exchange-traded funds; (viii) continuing to develop, acquire and implement systems and technology to improve services to the funds and information security and to increase efficiency; (ix) implementing investment enhancements to further strengthen Fidelity's target date product line to increase investors' probability of success in achieving their goals; (x) modifying the eligibility criteria for certain share classes to accommodate roll-over assets from employer-sponsored retirement plans; (xi) launching a new Class W of the Freedom Index Funds to attract and retain Fidelity record-kept retirement plan assets; and (xii) implementing changes to Fidelity's money market product line in response to recent money market regulatory reforms.Investment Performance. The Board considered whether the fund has operated in accordance with its investment objective, as well as its record of compliance with its investment restrictions and its performance history. The Board noted that there were portfolio management changes for the fund in January 2013 and January 2014.The Board took into account discussions with representatives of the Investment Advisers about fund investment performance that occur at Board meetings throughout the year. In this regard the Board noted that as part of regularly scheduled fund reviews and other reports to the Board on fund performance, the Board considers annualized return information for the fund, for different time periods, measured against a securities market index ("benchmark index") and a peer group of funds with similar objectives ("peer group"), if any. In its evaluation of fund investment performance, the Board gave particular attention to information indicating changes in performance of certain Fidelity funds for specific time periods and discussed with the Investment Advisers the reasons for any overperformance or underperformance.In addition to reviewing absolute and relative fund performance, the Independent Trustees periodically consider the appropriateness of fund performance metrics in evaluating the results achieved. In general, the Independent Trustees believe that fund performance should be evaluated based on net performance (after fees and expenses) of both the highest performing and lowest performing fund share classes, where applicable, compared to appropriate benchmark indices, over appropriate time periods that may include full market cycles, and compared to peer groups, as applicable, over the same periods, taking into account relevant factors including the following: general market conditions; issuer-specific information; and fund cash flows and other factors.The Independent Trustees recognize that shareholders evaluate performance on a net basis over their own holding periods, for which one-, three-, and five-year periods are often used as a proxy. For this reason, the performance information reviewed by the Board also included net cumulative calendar year total return information for the fund and an appropriate benchmark index and peer group for the most recent one-, three-, and five-year periods, as shown below. Returns are shown compared to the 25th percentile (top of box, 75% beaten) and 75th percentile (bottom of box, 25% beaten) of the peer universe.Fidelity Disciplined Equity Fund
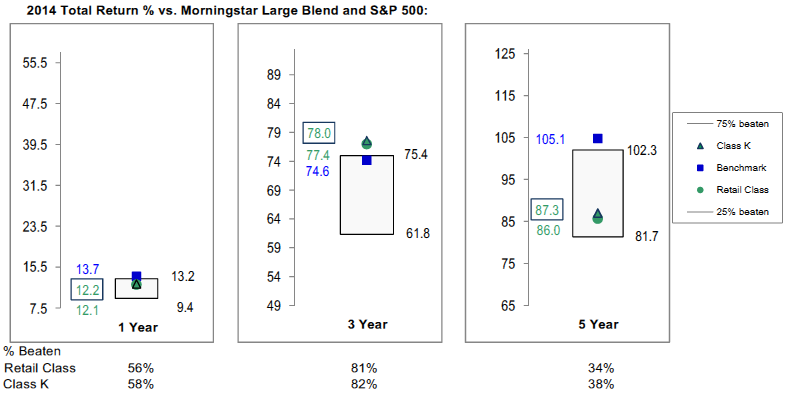
Fidelity Disciplined Equity Fund
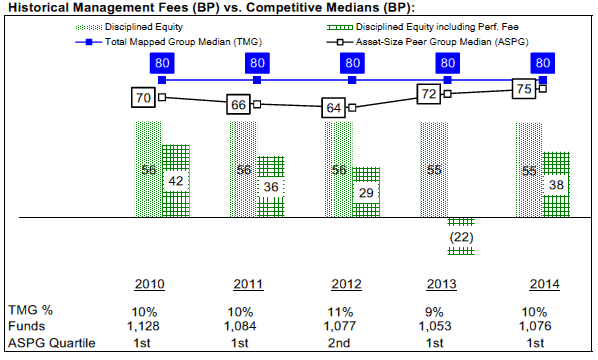
![]()
Corporate Headquarters
245 Summer St.
Boston, MA 02210
www.fidelity.com
FDE-ANN-1215
1.538372.118
Fidelity Advisor® Stock Selector Small Cap Fund Class A, Class T, Class B and Class C Annual Report October 31, 2015 Class A, Class T, Class B and Class C are classes of Fidelity® Stock Selector Small Cap Fund |
|
Contents
Board Approval of Investment Advisory Contracts and Management Fees |
To view a fund's proxy voting guidelines and proxy voting record for the 12-month period ended June 30, visit http://www.fidelity.com/proxyvotingresults or visit the Securities and Exchange Commission's (SEC) web site at http://www.sec.gov.
You may also call 1-877-208-0098 to request a free copy of the proxy voting guidelines.
Standard & Poor's, S&P and S&P 500 are registered service marks of The McGraw-Hill Companies, Inc. and have been licensed for use by Fidelity Distributors Corporation.
Other third-party marks appearing herein are the property of their respective owners.
All other marks appearing herein are registered or unregistered trademarks or service marks of FMR LLC or an affiliated company. © 2015 FMR LLC. All rights reserved.
This report and the financial statements contained herein are submitted for the general information of the shareholders of the Fund. This report is not authorized for distribution to prospective investors in the Fund unless preceded or accompanied by an effective prospectus.
A fund files its complete schedule of portfolio holdings with the SEC for the first and third quarters of each fiscal year on Form N-Q. Forms N-Q are available on the SEC’s web site at http://www.sec.gov. A fund's Forms N-Q may be reviewed and copied at the SEC’s Public Reference Room in Washington, DC. Information regarding the operation of the SEC's Public Reference Room may be obtained by calling 1-800-SEC-0330.
For a complete list of a fund's portfolio holdings, view the most recent holdings listing, semiannual report, or annual report on Fidelity's web site at http://www.fidelity.com, http://www.advisor.fidelity.com, or http://www.401k.com, as applicable.
NOT FDIC INSURED •MAY LOSE VALUE •NO BANK GUARANTEE
Neither the Fund nor Fidelity Distributors Corporation is a bank.
Performance: The Bottom Line
Average annual total return reflects the change in the value of an investment, assuming reinvestment of distributions from dividend income and capital gains (the profits earned upon the sale of securities that have grown in value, if any) and assuming a constant rate of performance each year.
The hypothetical investment and the average annual total returns do not reflect the deduction of taxes that a shareholder would pay on fund distributions or the redemption of fund shares.
During periods of reimbursement by Fidelity, a fund’s total return will be greater than it would be had the reimbursement not occurred.
How a fund did yesterday is no guarantee of how it will do tomorrow.
Returns reflect the conversion of Class B shares to Class A shares after a maximum of seven years.
Average Annual Total Returns
| For the periods ended October 31, 2015 | Past 1 year | Past 5 years | Past 10 years |
| Class A (incl. 5.75% sales charge) | (1.80)% | 10.53% | 5.69% |
| Class T (incl. 3.50% sales charge) | 0.27% | 10.71% | 5.68% |
| Class B (incl. contingent deferred sales charge) | (1.36)% | 10.70% | 5.75% |
| Class C (incl. contingent deferred sales charge) | 2.41% | 10.98% | 5.63% |
Class A shares bear a 0.25% 12b-1 fee. The initial offering of Class A shares took place on May 2, 2007. Returns prior to May 2, 2007, are those of Fidelity® Stock Selector Small Cap Fund, the original class of the fund, which has no 12b-1 fee. Had Class A's 12b-1 fee been reflected, returns prior to May 2, 2007, would have been lower.
Class T shares bear a 0.50% 12b-1 fee. The initial offering of Class T shares took place on May 2, 2007. Returns prior to May 2, 2007, are those of Fidelity® Stock Selector Small Cap Fund, the original class of the fund, which has no 12b-1 fee. Had Class T's 12b-1 fee been reflected, returns prior to May 2, 2007, would have been lower.
Class B shares bear a 1.00% 12b-1 fee. The initial offering of Class B shares took place on May 2, 2007. Returns prior to May 2, 2007, are those of Fidelity® Stock Selector Small Cap Fund, the original class of the fund, which has no 12b-1 fee. Had Class B's 12b-1 fee been reflected, returns prior to May 2, 2007, would have been lower.
Class B shares' contingent deferred sales charges included in the past one year, past five years and past ten years total return figures are 5%, 2% and 0%, respectively.
Class C shares bear a 1.00% 12b-1 fee. The initial offering of Class C shares took place on May 2, 2007. Returns prior to May 2, 2007, are those of Fidelity® Stock Selector Small Cap Fund, the original class of the fund, which has no 12b-1 fee. Had Class C's 12b-1 fee been reflected, returns prior to May 2, 2007, would have been lower.
Class C shares' contingent deferred sales charges included in the past one year, past five years and past ten years total return figures are 1%, 0% and 0%, respectively.
$10,000 Over 10 Years
Let's say hypothetically that $10,000 was invested in Fidelity Advisor® Stock Selector Small Cap Fund - Class A on October 31, 2005, and the current 5.75% sales charge was paid.
The chart shows how the value of your investment would have changed, and also shows how the Russell 2000® Index performed over the same period.
See previous page for additional information regarding the performance of Class A.
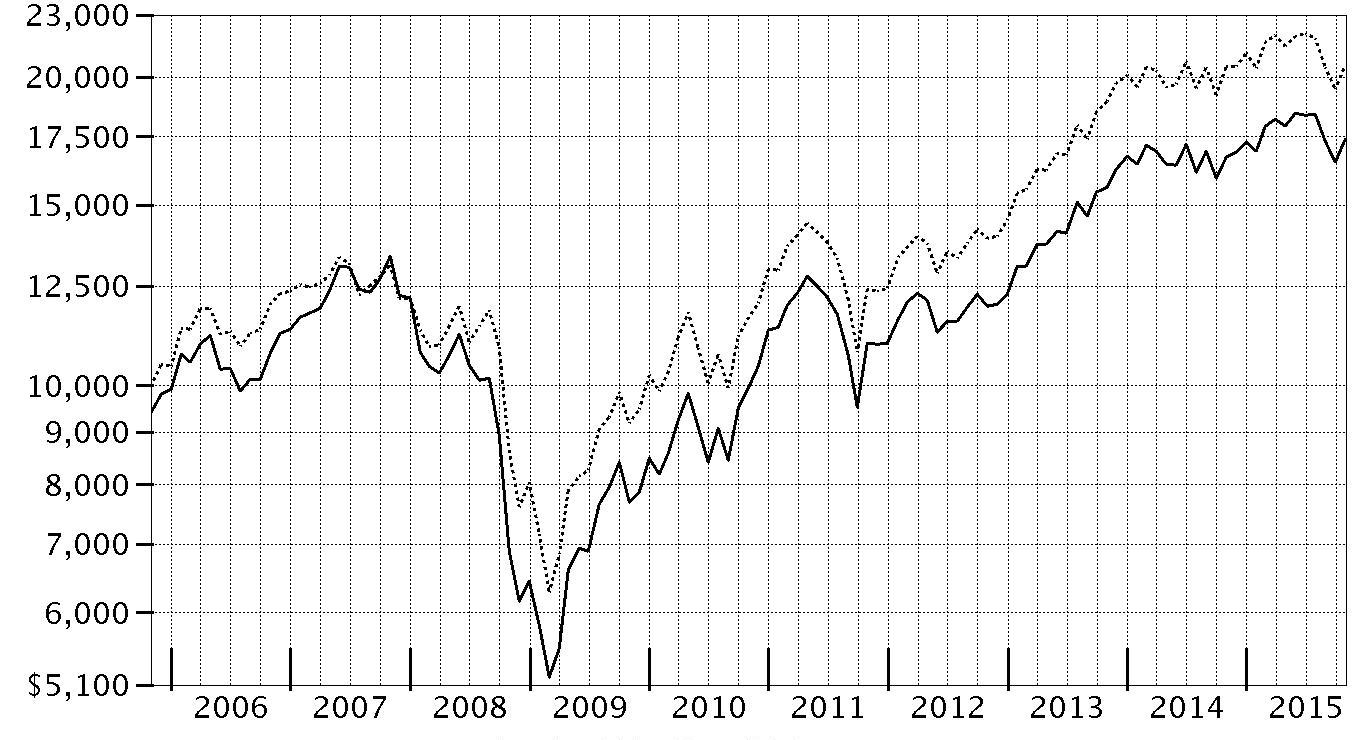
| Period Ending Values | ||
| $17,395 | Fidelity Advisor® Stock Selector Small Cap Fund - Class A | |
| $20,556 | Russell 2000® Index | |
Management's Discussion of Fund Performance
Market Recap: U.S. stocks gained moderately for the 12 months ending October 31, 2015, helped by a strong October that largely erased a steep decline in August and September on concern about slowing global economic growth emanating from China. Stocks benefited late in the period amid waning expectations for a near-term interest-rate hike by the U.S. Federal Reserve, additional economic stimulus in Europe and an interest-rate cut in China. The large-cap S&P 500® index advanced 5.20% for the period, with growth stocks in the index significantly outpacing value stocks, as investors continued to seek growth in a subpar economic environment. The growth-oriented Nasdaq Composite Index® also benefited, gaining 10.39%, while the small-cap Russell 2000® Index lost its edge, returning only 0.34%, as risk appetites waned. Among sectors in the widely followed S&P 500®, consumer discretionary (+21%) led the way, benefiting from a combination of rising personal income and still-benign inflation. Technology (+11%) and consumer staples (+9%) also outpaced the index. Conversely, energy (-19%) performed worst, in an environment of depressed commodity prices that also hit materials (-4%). At period end, investors remained focused on the potential global implications of a relatively stronger U.S. dollar and how China’s transition toward a consumption-led economy may affect corporate earnings.Comments from Lead Portfolio Manager Richard Thompson: For the year, the fund’s share classes (excluding sales charges, if applicable) strongly outpaced the roughly flat return of its benchmark Russell 2000® Index, with significant performance dispersion by sector. For example, energy was down 44%, while information technology advanced 10%. Amid this volatile environment, the fund’s stock selection was the primary driver of relative outperformance. An out-of-index stake in transaction processor Global Payments was the fund’s top individual contributor. The stock performed well, mainly due to the company’s stable business and investors’ perception of the stock as a defensive name. Pharmaceuticals, biotechnology & life sciences companies bluebird bio and Auspex Pharmaceuticals also helped. Auspex was sold by period end. Conversely, stock choices in materials, led by titanium dioxide producer Tronox, dragged on the fund’s return. Over the course of the past year, China’s economic slowdown derailed demand for titanium dioxide, which provides brightness to coatings, plastics and paper. We sold some of the fund’s stake in Tronox by period end. Several energy names also hampered performance, including our position in Stone Energy. Bristow Group, which provides helicopter services to offshore energy companies, also declined.The views expressed above reflect those of the portfolio manager(s) only through the end of the period as stated on the cover of this report and do not necessarily represent the views of Fidelity or any other person in the Fidelity organization. Any such views are subject to change at any time based upon market or other conditions and Fidelity disclaims any responsibility to update such views. These views may not be relied on as investment advice and, because investment decisions for a Fidelity fund are based on numerous factors, may not be relied on as an indication of trading intent on behalf of any Fidelity fund.
Investment Summary (Unaudited)
Top Ten Stocks as of October 31, 2015
| % of fund's net assets | % of fund's net assets 6 months ago | |
| Bank of the Ozarks, Inc. | 1.8 | 1.3 |
| PacWest Bancorp | 1.4 | 1.2 |
| Huntington Bancshares, Inc. | 1.4 | 1.2 |
| Global Payments, Inc. | 1.4 | 1.2 |
| Banner Corp. | 1.2 | 1.0 |
| MB Financial, Inc. | 1.2 | 0.9 |
| Associated Banc-Corp. | 1.2 | 1.2 |
| WSFS Financial Corp. | 1.2 | 0.9 |
| Mid-America Apartment Communities, Inc. | 1.1 | 1.0 |
| Allied World Assurance Co. Holdings AG | 1.1 | 1.0 |
| 13.0 |
Top Five Market Sectors as of October 31, 2015
| % of fund's net assets | % of fund's net assets 6 months ago | |
| Financials | 24.0 | 22.7 |
| Information Technology | 17.9 | 18.4 |
| Health Care | 14.6 | 15.1 |
| Consumer Discretionary | 12.8 | 13.5 |
| Industrials | 12.7 | 13.2 |
Asset Allocation (% of fund's net assets)
| As of October 31, 2015* | ||
| Stocks and Equity Futures | 96.3% | |
| Short-Term Investments and Net Other Assets (Liabilities) | 3.7% | |

* Foreign investments - 7.1%
| As of April 30, 2015 * | ||
| Stocks and Equity Futures | 98.2% | |
| Short-Term Investments and Net Other Assets (Liabilities) | 1.8% | |

* Foreign investments - 8.2%
Investments October 31, 2015
Showing Percentage of Net Assets
| Common Stocks - 95.5% | |||
| Shares | Value (000s) | ||
| CONSUMER DISCRETIONARY - 12.8% | |||
| Auto Components - 2.3% | |||
| Cooper Tire & Rubber Co. | 176,620 | $7,381 | |
| Standard Motor Products, Inc. | 121,402 | 5,372 | |
| Tenneco, Inc. (a) | 227,984 | 12,902 | |
| Visteon Corp. (a) | 67,200 | 7,330 | |
| 32,985 | |||
| Diversified Consumer Services - 0.7% | |||
| Service Corp. International | 333,000 | 9,411 | |
| Hotels, Restaurants & Leisure - 1.9% | |||
| Bloomin' Brands, Inc. | 370,084 | 6,280 | |
| Buffalo Wild Wings, Inc. (a) | 49,000 | 7,559 | |
| Domino's Pizza, Inc. | 41,800 | 4,459 | |
| Texas Roadhouse, Inc. Class A | 270,657 | 9,297 | |
| 27,595 | |||
| Household Durables - 1.6% | |||
| Ethan Allen Interiors, Inc. (b) | 357,179 | 9,719 | |
| Helen of Troy Ltd. (a) | 59,700 | 5,923 | |
| Jarden Corp. (a) | 168,877 | 7,566 | |
| 23,208 | |||
| Leisure Products - 1.3% | |||
| Brunswick Corp. | 193,900 | 10,434 | |
| Vista Outdoor, Inc. (a) | 168,566 | 7,538 | |
| 17,972 | |||
| Media - 0.8% | |||
| Nexstar Broadcasting Group, Inc. Class A (b) | 210,335 | 11,196 | |
| Multiline Retail - 0.5% | |||
| Dillard's, Inc. Class A | 82,256 | 7,360 | |
| Specialty Retail - 1.7% | |||
| Chico's FAS, Inc. | 355,627 | 4,915 | |
| Genesco, Inc. (a) | 104,675 | 6,558 | |
| GNC Holdings, Inc. | 206,900 | 6,155 | |
| Murphy U.S.A., Inc. (a) | 104,600 | 6,419 | |
| 24,047 | |||
| Textiles, Apparel & Luxury Goods - 2.0% | |||
| Deckers Outdoor Corp. (a) | 116,000 | 6,457 | |
| G-III Apparel Group Ltd. (a) | 201,810 | 11,118 | |
| Steven Madden Ltd. (a) | 340,959 | 11,882 | |
| 29,457 | |||
| TOTAL CONSUMER DISCRETIONARY | 183,231 | ||
| CONSUMER STAPLES - 3.0% | |||
| Beverages - 0.3% | |||
| Coca-Cola Bottling Co. Consolidated | 23,080 | 4,875 | |
| Food & Staples Retailing - 0.6% | |||
| Casey's General Stores, Inc. | 87,650 | 9,310 | |
| Food Products - 1.4% | |||
| Greencore Group PLC | 1,094,600 | 5,096 | |
| Ingredion, Inc. | 44,000 | 4,183 | |
| J&J Snack Foods Corp. | 56,050 | 6,882 | |
| Pinnacle Foods, Inc. | 74,100 | 3,266 | |
| 19,427 | |||
| Personal Products - 0.7% | |||
| Coty, Inc. Class A (b) | 144,500 | 4,183 | |
| Inter Parfums, Inc. | 189,000 | 5,220 | |
| 9,403 | |||
| TOTAL CONSUMER STAPLES | 43,015 | ||
| ENERGY - 3.1% | |||
| Energy Equipment & Services - 0.8% | |||
| Atwood Oceanics, Inc. | 119,474 | 1,977 | |
| Bristow Group, Inc. | 149,251 | 5,183 | |
| Total Energy Services, Inc. | 334,100 | 3,748 | |
| 10,908 | |||
| Oil, Gas & Consumable Fuels - 2.3% | |||
| Boardwalk Pipeline Partners, LP | 372,300 | 4,773 | |
| Diamondback Energy, Inc. | 85,807 | 6,336 | |
| Newfield Exploration Co. (a) | 165,488 | 6,651 | |
| PDC Energy, Inc. (a) | 107,700 | 6,499 | |
| Stone Energy Corp. (a)(b) | 443,267 | 2,478 | |
| Western Refining, Inc. | 158,988 | 6,617 | |
| 33,354 | |||
| TOTAL ENERGY | 44,262 | ||
| FINANCIALS - 24.0% | |||
| Banks - 11.1% | |||
| Associated Banc-Corp. | 872,023 | 16,865 | |
| BancFirst Corp. | 135,683 | 8,362 | |
| Bank of the Ozarks, Inc. | 514,336 | 25,723 | |
| Banner Corp. | 357,029 | 17,519 | |
| BBCN Bancorp, Inc. | 826,586 | 13,878 | |
| Community Bank System, Inc. | 139,363 | 5,680 | |
| Huntington Bancshares, Inc. | 1,812,600 | 19,884 | |
| Investors Bancorp, Inc. | 1,138,800 | 14,246 | |
| MB Financial, Inc. | 525,100 | 16,929 | |
| PacWest Bancorp | 444,775 | 20,033 | |
| 159,119 | |||
| Capital Markets - 2.1% | |||
| AURELIUS AG | 249,242 | 11,122 | |
| OM Asset Management Ltd. | 630,689 | 9,574 | |
| Raymond James Financial, Inc. | 180,700 | 9,958 | |
| 30,654 | |||
| Insurance - 3.1% | |||
| Allied World Assurance Co. Holdings AG | 444,887 | 16,176 | |
| Aspen Insurance Holdings Ltd. | 210,010 | 10,209 | |
| Primerica, Inc. | 229,069 | 10,911 | |
| StanCorp Financial Group, Inc. | 64,323 | 7,379 | |
| 44,675 | |||
| Real Estate Investment Trusts - 6.5% | |||
| Coresite Realty Corp. | 204,100 | 11,215 | |
| Cousins Properties, Inc. | 1,224,180 | 12,291 | |
| Equity Lifestyle Properties, Inc. | 221,000 | 13,366 | |
| Kite Realty Group Trust | 386,726 | 10,213 | |
| Mid-America Apartment Communities, Inc. | 193,800 | 16,510 | |
| National Retail Properties, Inc. (b) | 222,359 | 8,450 | |
| Ramco-Gershenson Properties Trust (SBI) | 729,850 | 12,261 | |
| Store Capital Corp. | 391,180 | 8,868 | |
| 93,174 | |||
| Thrifts & Mortgage Finance - 1.2% | |||
| WSFS Financial Corp. | 528,242 | 16,782 | |
| TOTAL FINANCIALS | 344,404 | ||
| HEALTH CARE - 14.6% | |||
| Biotechnology - 7.5% | |||
| ACADIA Pharmaceuticals, Inc. (a) | 173,352 | 6,036 | |
| Agios Pharmaceuticals, Inc. (a)(b) | 44,420 | 3,236 | |
| Anacor Pharmaceuticals, Inc. (a) | 66,600 | 7,487 | |
| BioMarin Pharmaceutical, Inc. (a) | 35,256 | 4,126 | |
| Biotie Therapies Corp. sponsored ADR | 171,200 | 2,244 | |
| bluebird bio, Inc. (a) | 30,800 | 2,376 | |
| Cellectis SA sponsored ADR | 117,600 | 3,111 | |
| Chimerix, Inc. (a) | 126,560 | 4,959 | |
| Coherus BioSciences, Inc. (b) | 155,500 | 4,331 | |
| Curis, Inc. (a) | 1,466,283 | 2,991 | |
| CytomX Therapeutics, Inc. | 27,627 | 259 | |
| CytomX Therapeutics, Inc. | 68,600 | 713 | |
| DBV Technologies SA sponsored ADR (a) | 900 | 31 | |
| Dyax Corp. (a) | 297,985 | 8,204 | |
| Genocea Biosciences, Inc. (a) | 238,158 | 1,141 | |
| Heron Therapeutics, Inc. (a)(b) | 144,200 | 3,954 | |
| Insmed, Inc. (a) | 192,672 | 3,823 | |
| Intercept Pharmaceuticals, Inc. (a) | 19,503 | 3,066 | |
| Isis Pharmaceuticals, Inc. (a) | 73,128 | 3,521 | |
| La Jolla Pharmaceutical Co. (a) | 140,800 | 3,519 | |
| Mirati Therapeutics, Inc. (a)(b) | 158,506 | 5,608 | |
| Neurocrine Biosciences, Inc. (a) | 165,160 | 8,108 | |
| Novavax, Inc. (a) | 579,638 | 3,913 | |
| ProNai Therapeutics, Inc. (a)(b) | 141,600 | 2,430 | |
| Spark Therapeutics, Inc. | 81,100 | 4,371 | |
| TESARO, Inc. (a) | 98,300 | 4,470 | |
| Ultragenyx Pharmaceutical, Inc. (a) | 70,300 | 6,984 | |
| Xencor, Inc. (a) | 235,800 | 2,554 | |
| 107,566 | |||
| Health Care Equipment & Supplies - 3.3% | |||
| CONMED Corp. | 77,859 | 3,158 | |
| Hologic, Inc. (a) | 159,900 | 6,214 | |
| Integra LifeSciences Holdings Corp. (a) | 113,106 | 6,738 | |
| NxStage Medical, Inc. (a) | 373,400 | 6,240 | |
| Sirona Dental Systems, Inc. (a) | 53,500 | 5,838 | |
| Steris Corp. | 53,400 | 4,002 | |
| Teleflex, Inc. | 62,000 | 8,246 | |
| Wright Medical Group NV (a) | 359,577 | 6,951 | |
| 47,387 | |||
| Health Care Providers & Services - 2.4% | |||
| AmSurg Corp. (a) | 102,500 | 7,184 | |
| Molina Healthcare, Inc. (a) | 112,400 | 6,969 | |
| Surgical Care Affiliates, Inc. (a) | 224,664 | 6,652 | |
| Team Health Holdings, Inc. (a) | 83,000 | 4,953 | |
| Wellcare Health Plans, Inc. (a) | 100,900 | 8,940 | |
| 34,698 | |||
| Health Care Technology - 0.1% | |||
| Press Ganey Holdings, Inc. | 34,318 | 1,076 | |
| Life Sciences Tools & Services - 0.4% | |||
| Bruker Corp. (a) | 314,234 | 5,772 | |
| Pharmaceuticals - 0.9% | |||
| Prestige Brands Holdings, Inc. (a) | 116,046 | 5,687 | |
| Theravance, Inc. (b) | 300,451 | 2,638 | |
| ZS Pharma, Inc. (a) | 79,900 | 5,194 | |
| 13,519 | |||
| TOTAL HEALTH CARE | 210,018 | ||
| INDUSTRIALS - 12.7% | |||
| Aerospace & Defense - 1.9% | |||
| Moog, Inc. Class A (a) | 120,105 | 7,418 | |
| Orbital ATK, Inc. | 100,559 | 8,610 | |
| Teledyne Technologies, Inc. (a) | 128,366 | 11,454 | |
| 27,482 | |||
| Air Freight & Logistics - 0.8% | |||
| Hub Group, Inc. Class A (a) | 296,020 | 11,835 | |
| Airlines - 0.6% | |||
| JetBlue Airways Corp. (a)(b) | 337,200 | 8,376 | |
| Commercial Services & Supplies - 2.2% | |||
| Deluxe Corp. | 186,300 | 11,094 | |
| Interface, Inc. | 258,000 | 5,044 | |
| Multi-Color Corp. | 100,300 | 7,807 | |
| West Corp. | 334,700 | 7,969 | |
| 31,914 | |||
| Construction & Engineering - 0.9% | |||
| EMCOR Group, Inc. | 259,100 | 12,509 | |
| Electrical Equipment - 0.4% | |||
| OSRAM Licht AG | 103,749 | 6,105 | |
| Machinery - 2.8% | |||
| AGCO Corp. (b) | 153,600 | 7,433 | |
| Kornit Digital Ltd. (a) | 357,100 | 4,264 | |
| KUKA AG (b) | 74,100 | 6,265 | |
| Terex Corp. | 102,400 | 2,054 | |
| TriMas Corp. (a) | 317,286 | 6,349 | |
| Valmont Industries, Inc. | 75,400 | 8,176 | |
| Wabtec Corp. | 67,116 | 5,562 | |
| 40,103 | |||
| Professional Services - 1.0% | |||
| Dun & Bradstreet Corp. | 75,294 | 8,574 | |
| Stantec, Inc. | 236,000 | 5,923 | |
| 14,497 | |||
| Trading Companies & Distributors - 2.1% | |||
| Kaman Corp.�� | 215,200 | 8,369 | |
| Titan Machinery, Inc. (a)(b) | 469,061 | 5,737 | |
| Watsco, Inc. | 93,900 | 11,553 | |
| WESCO International, Inc. (a) | 82,000 | 4,012 | |
| 29,671 | |||
| TOTAL INDUSTRIALS | 182,492 | ||
| INFORMATION TECHNOLOGY - 17.9% | |||
| Communications Equipment - 1.0% | |||
| F5 Networks, Inc. (a) | 38,300 | 4,221 | |
| Ixia (a) | 511,631 | 7,373 | |
| Radware Ltd. (a) | 140,296 | 2,092 | |
| 13,686 | |||
| Electronic Equipment & Components - 2.0% | |||
| CDW Corp. | 282,300 | 12,616 | |
| Fitbit, Inc. (b) | 100,700 | 4,082 | |
| Jabil Circuit, Inc. | 229,600 | 5,276 | |
| Trimble Navigation Ltd. (a) | 315,900 | 7,187 | |
| 29,161 | |||
| Internet Software & Services - 3.9% | |||
| Bankrate, Inc. (a) | 687,665 | 8,163 | |
| Constant Contact, Inc. (a) | 112,400 | 2,934 | |
| Gogo, Inc. (a)(b) | 102,800 | 1,453 | |
| HomeAway, Inc. (a) | 135,800 | 4,286 | |
| IAC/InterActiveCorp | 89,600 | 6,004 | |
| MINDBODY, Inc. (b) | 142,800 | 2,233 | |
| NIC, Inc. | 388,549 | 7,371 | |
| Pandora Media, Inc. (a) | 236,500 | 2,722 | |
| Rackspace Hosting, Inc. (a) | 275,383 | 7,119 | |
| Stamps.com, Inc. (a) | 80,598 | 6,094 | |
| Web.com Group, Inc. (a) | 317,795 | 7,459 | |
| 55,838 | |||
| IT Services - 4.0% | |||
| ExlService Holdings, Inc. (a) | 328,638 | 14,546 | |
| Global Payments, Inc. | 144,100 | 19,657 | |
| Maximus, Inc. | 234,700 | 16,007 | |
| WEX, Inc. (a) | 84,100 | 7,561 | |
| 57,771 | |||
| Semiconductors & Semiconductor Equipment - 1.9% | |||
| Cirrus Logic, Inc. (a) | 209,300 | 6,453 | |
| Intersil Corp. Class A | 473,200 | 6,412 | |
| Monolithic Power Systems, Inc. | 176,930 | 11,044 | |
| Qorvo, Inc. (a) | 65,850 | 2,893 | |
| 26,802 | |||
| Software - 3.5% | |||
| BroadSoft, Inc. (a) | 136,285 | 4,357 | |
| CommVault Systems, Inc. (a) | 186,723 | 7,566 | |
| Fair Isaac Corp. | 70,700 | 6,531 | |
| Fleetmatics Group PLC (a) | 47,700 | 2,655 | |
| HubSpot, Inc. | 6,851 | 355 | |
| Interactive Intelligence Group, Inc. (a) | 13,695 | 443 | |
| Pegasystems, Inc. | 157,000 | 4,379 | |
| Qlik Technologies, Inc. (a) | 106,800 | 3,350 | |
| RealPage, Inc. (a) | 152,700 | 2,581 | |
| RingCentral, Inc. (a) | 128,100 | 2,370 | |
| Rovi Corp. (a) | 128,341 | 1,174 | |
| SolarWinds, Inc. (a) | 133,100 | 7,724 | |
| Synchronoss Technologies, Inc. (a) | 215,086 | 7,567 | |
| 51,052 | |||
| Technology Hardware, Storage & Peripherals - 1.6% | |||
| Electronics for Imaging, Inc. (a) | 165,475 | 7,685 | |
| Nimble Storage, Inc. (a) | 202,100 | 4,567 | |
| Quantum Corp. (a) | 2,987,041 | 2,509 | |
| Silicon Graphics International Corp. (a)(b) | 666,557 | 2,913 | |
| Super Micro Computer, Inc. (a)(b) | 205,488 | 5,797 | |
| 23,471 | |||
| TOTAL INFORMATION TECHNOLOGY | 257,781 | ||
| MATERIALS - 3.6% | |||
| Chemicals - 1.5% | |||
| Axiall Corp. | 146,654 | 2,970 | |
| Innospec, Inc. | 64,199 | 3,546 | |
| PolyOne Corp. | 206,999 | 6,922 | |
| Sensient Technologies Corp. | 129,900 | 8,479 | |
| 21,917 | |||
| Containers & Packaging - 1.5% | |||
| Avery Dennison Corp. | 83,000 | 5,393 | |
| Berry Plastics Group, Inc. (a) | 316,040 | 10,587 | |
| Silgan Holdings, Inc. | 97,200 | 4,945 | |
| 20,925 | |||
| Metals & Mining - 0.6% | |||
| Compass Minerals International, Inc. | 80,700 | 6,556 | |
| Steel Dynamics, Inc. | 131,200 | 2,423 | |
| 8,979 | |||
| TOTAL MATERIALS | 51,821 | ||
| TELECOMMUNICATION SERVICES - 0.6% | |||
| Diversified Telecommunication Services - 0.6% | |||
| 8x8, Inc. (a) | 145,601 | 1,552 | |
| Cogent Communications Group, Inc. | 121,300 | 3,726 | |
| FairPoint Communications, Inc. (a) | 25,500 | 409 | |
| Lumos Networks Corp. | 37,100 | 481 | |
| Towerstream Corp. (a)(b) | 2,829,372 | 2,252 | |
| 8,420 | |||
| UTILITIES - 3.2% | |||
| Electric Utilities - 1.7% | |||
| El Paso Electric Co. | 142,720 | 5,519 | |
| Great Plains Energy, Inc. | 167,320 | 4,601 | |
| IDACORP, Inc. | 102,700 | 6,865 | |
| Portland General Electric Co. | 191,568 | 7,103 | |
| 24,088 | |||
| Gas Utilities - 1.5% | |||
| Atmos Energy Corp. | 110,138 | 6,939 | |
| Laclede Group, Inc. | 128,600 | 7,532 | |
| New Jersey Resources Corp. | 46,659 | 1,478 | |
| Southwest Gas Corp. | 105,300 | 6,472 | |
| 22,421 | |||
| TOTAL UTILITIES | 46,509 | ||
| TOTAL COMMON STOCKS | |||
| (Cost $1,205,620) | 1,371,953 | ||
| Principal Amount (000s) | Value (000s) | ||
| U.S. Treasury Obligations - 0.0% | |||
| U.S. Treasury Bills, yield at date of purchase 0.01% to 0.06% 12/3/15 to 12/17/15 (c) | |||
| (Cost $390) | 390 | 390 | |
| Shares | Value (000s) | ||
| Money Market Funds - 9.9% | |||
| Fidelity Cash Central Fund, 0.18% (d) | 85,833,387 | $85,833 | |
| Fidelity Securities Lending Cash Central Fund, 0.19% (d)(e) | 56,685,976 | 56,686 | |
| TOTAL MONEY MARKET FUNDS | |||
| (Cost $142,519) | 142,519 | ||
| TOTAL INVESTMENT PORTFOLIO - 105.4% | |||
| (Cost $1,348,529) | 1,514,862 | ||
| NET OTHER ASSETS (LIABILITIES) - (5.4)% | (77,512) | ||
| NET ASSETS - 100% | $1,437,350 |
| Futures Contracts | |||
| Expiration Date | Underlying Face Amount at Value (000s) | Unrealized Appreciation/(Depreciation) (000s) | |
| Purchased | |||
| Equity Index Contracts | |||
| 102 ICE Russell 2000 Index Contracts (United States) | Dec. 2015 | 11,815 | $583 |
The face value of futures purchased as a percentage of Net Assets is 0.8%
Legend
(a) Non-income producing
(b) Security or a portion of the security is on loan at period end.
(c) Security or a portion of the security was pledged to cover margin requirements for futures contracts. At period end, the value of securities pledged amounted to $390,000.
(d) Affiliated fund that is generally available only to investment companies and other accounts managed by Fidelity Investments. The rate quoted is the annualized seven-day yield of the fund at period end. A complete unaudited listing of the fund's holdings as of its most recent quarter end is available upon request. In addition, each Fidelity Central Fund's financial statements which are not covered by the Fund's Report of Independent Registered Public Accounting Firm are available on the SEC's website or upon request.
(e) Investment made with cash collateral received from securities on loan.
Affiliated Central Funds
Information regarding fiscal year to date income earned by the Fund from investments in Fidelity Central Funds is as follows:
| Fund | Income earned |
| (Amounts in thousands) | |
| Fidelity Cash Central Fund | $68 |
| Fidelity Securities Lending Cash Central Fund | 572 |
| Total | $640 |
Investment Valuation
The following is a summary of the inputs used, as of October 31, 2015, involving the Fund's assets and liabilities carried at fair value. The inputs or methodology used for valuing securities may not be an indication of the risk associated with investing in those securities. For more information on valuation inputs, and their aggregation into the levels used below, please refer to the Investment Valuation section in the accompanying Notes to Financial Statements.
| Valuation Inputs at Reporting Date: | ||||
| Description | Total | Level 1 | Level 2 | Level 3 |
| (Amounts in thousands) | ||||
| Investments in Securities: | ||||
| Equities: | ||||
| Consumer Discretionary | $183,231 | $183,231 | $-- | $-- |
| Consumer Staples | 43,015 | 43,015 | -- | -- |
| Energy | 44,262 | 44,262 | -- | -- |
| Financials | 344,404 | 344,404 | -- | -- |
| Health Care | 210,018 | 209,759 | 259 | -- |
| Industrials | 182,492 | 182,492 | -- | -- |
| Information Technology | 257,781 | 257,781 | -- | -- |
| Materials | 51,821 | 51,821 | -- | -- |
| Telecommunication Services | 8,420 | 8,420 | -- | -- |
| Utilities | 46,509 | 46,509 | -- | -- |
| U.S. Government and Government Agency Obligations | 390 | -- | 390 | -- |
| Money Market Funds | 142,519 | 142,519 | -- | -- |
| Total Investments in Securities: | $1,514,862 | $1,514,213 | $649 | $-- |
| Derivative Instruments: | ||||
| Assets | ||||
| Futures Contracts | $583 | $583 | $-- | $-- |
| Total Assets | $583 | $583 | $-- | $-- |
| Total Derivative Instruments: | $583 | $583 | $-- | $-- |
Value of Derivative Instruments
The following table is a summary of the Fund's value of derivative instruments by primary risk exposure as of October 31, 2015. For additional information on derivative instruments, please refer to the Derivative Instruments section in the accompanying Notes to Financial Statements.
| Primary Risk Exposure / Derivative Type | Value | |
| (Amounts in thousands) | Asset | Liability |
| Equity Risk | ||
| Futures Contracts(a) | $583 | $0 |
| Total Equity Risk | 583 | 0 |
| Total Value of Derivatives | $583 | $0 |
(a) Reflects gross cumulative appreciation (depreciation) on futures contracts as presented in the Schedule of Investments. Only the period end receivable or payable for daily variation margin and net unrealized appreciation (depreciation) are presented in the Statement of Assets and Liabilities.
See accompanying notes which are an integral part of the financial statements.
Financial Statements
Statement of Assets and Liabilities
| Amounts in thousands (except per-share amounts) | October 31, 2015 | |
| Assets | ||
| Investment in securities, at value (including securities loaned of $55,317) — See accompanying schedule: Unaffiliated issuers (cost $1,206,010) | $1,372,343 | |
| Fidelity Central Funds (cost $142,519) | 142,519 | |
| Total Investments (cost $1,348,529) | $1,514,862 | |
| Segregated cash with brokers for derivative instruments | 504 | |
| Cash | 342 | |
| Foreign currency held at value (cost $13) | 13 | |
| Receivable for investments sold | 4,859 | |
| Receivable for fund shares sold | 1,988 | |
| Dividends receivable | 471 | |
| Distributions receivable from Fidelity Central Funds | 93 | |
| Prepaid expenses | 4 | |
| Other receivables | 21 | |
| Total assets | 1,523,157 | |
| Liabilities | ||
| Payable for investments purchased | $22,228 | |
| Payable for fund shares redeemed | 5,766 | |
| Accrued management fee | 679 | |
| Distribution and service plan fees payable | 7 | |
| Payable for daily variation margin for derivative instruments | 47 | |
| Other affiliated payables | 343 | |
| Other payables and accrued expenses | 51 | |
| Collateral on securities loaned, at value | 56,686 | |
| Total liabilities | 85,807 | |
| Net Assets | $1,437,350 | |
| Net Assets consist of: | ||
| Paid in capital | $1,181,424 | |
| Undistributed net investment income | 4,607 | |
| Accumulated undistributed net realized gain (loss) on investments and foreign currency transactions | 84,404 | |
| Net unrealized appreciation (depreciation) on investments and assets and liabilities in foreign currencies | 166,915 | |
| Net Assets | $1,437,350 | |
| Calculation of Maximum Offering Price | ||
| Class A: | ||
| Net Asset Value and redemption price per share ($11,429.9 ÷ 466.83 shares) | $24.48 | |
| Maximum offering price per share (100/94.25 of $24.48) | $25.97 | |
| Class T: | ||
| Net Asset Value and redemption price per share ($2,842.8 ÷ 118.47 shares) | $24.00 | |
| Maximum offering price per share (100/96.50 of $24.00) | $24.87 | |
| Class B: | ||
| Net Asset Value and offering price per share ($168.1 ÷ 7.22 shares)(a) | $23.28 | |
| Class C: | ||
| Net Asset Value and offering price per share ($3,965.3 ÷ 171.24 shares)(a) | $23.16 | |
| Stock Selector Small Cap: | ||
| Net Asset Value, offering price and redemption price per share ($1,372,459.7 ÷ 55,132.21 shares) | $24.89 | |
| Class I: | ||
| Net Asset Value, offering price and redemption price per share ($46,483.6 ÷ 1,862.64 shares) | $24.96 |
(a) Redemption price per share is equal to net asset value less any applicable contingent deferred sales charge.
See accompanying notes which are an integral part of the financial statements.
Statement of Operations
| Amounts in thousands | Year ended October 31, 2015 | |
| Investment Income | ||
| Dividends | $17,604 | |
| Income from Fidelity Central Funds | 640 | |
| Total income | 18,244 | |
| Expenses | ||
| Management fee | ||
| Basic fee | $8,817 | |
| Performance adjustment | (1,653) | |
| Transfer agent fees | 3,505 | |
| Distribution and service plan fees | 86 | |
| Accounting and security lending fees | 472 | |
| Custodian fees and expenses | 55 | |
| Independent trustees' compensation | 6 | |
| Registration fees | 99 | |
| Audit | 57 | |
| Legal | 6 | |
| Interest | 1 | |
| Miscellaneous | 11 | |
| Total expenses before reductions | 11,462 | |
| Expense reductions | (142) | 11,320 |
| Net investment income (loss) | 6,924 | |
| Realized and Unrealized Gain (Loss) | ||
| Net realized gain (loss) on: | ||
| Investment securities: | ||
| Unaffiliated issuers | 97,594 | |
| Foreign currency transactions | (2) | |
| Futures contracts | 1,775 | |
| Total net realized gain (loss) | 99,367 | |
| Change in net unrealized appreciation (depreciation) on: Investment securities | (38,594) | |
| Assets and liabilities in foreign currencies | 2 | |
| Futures contracts | (254) | |
| Total change in net unrealized appreciation (depreciation) | (38,846) | |
| Net gain (loss) | 60,521 | |
| Net increase (decrease) in net assets resulting from operations | $67,445 |
See accompanying notes which are an integral part of the financial statements.
Statement of Changes in Net Assets
| Amounts in thousands | Year ended October 31, 2015 | Year ended October 31, 2014 |
| Increase (Decrease) in Net Assets | ||
| Operations | ||
| Net investment income (loss) | $6,924 | $4,913 |
| Net realized gain (loss) | 99,367 | 141,263 |
| Change in net unrealized appreciation (depreciation) | (38,846) | (39,201) |
| Net increase (decrease) in net assets resulting from operations | 67,445 | 106,975 |
| Distributions to shareholders from net investment income | (5,082) | (589) |
| Distributions to shareholders from net realized gain | (126,261) | (75,700) |
| Total distributions | (131,343) | (76,289) |
| Share transactions - net increase (decrease) | 26,734 | (112,902) |
| Redemption fees | 102 | 99 |
| Total increase (decrease) in net assets | (37,062) | (82,117) |
| Net Assets | ||
| Beginning of period | 1,474,412 | 1,556,529 |
| End of period (including undistributed net investment income of $4,607 and undistributed net investment income of $3,242, respectively) | $1,437,350 | $1,474,412 |
See accompanying notes which are an integral part of the financial statements.
Financial Highlights — Fidelity Stock Selector Small Cap Fund Class A
| Years ended October 31, | 2015 | 2014 | 2013 | 2012 | 2011 |
| Selected Per–Share Data | |||||
| Net asset value, beginning of period | $25.76 | $25.32 | $19.40 | $17.87 | $16.20 |
| Income from Investment Operations | |||||
| Net investment income (loss)A | .06 | .01 | (.02) | (.02) | –B,C |
| Net realized and unrealized gain (loss) | .96 | 1.68 | 5.98 | 1.55 | 1.73 |
| Total from investment operations | 1.02 | 1.69 | 5.96 | 1.53 | 1.73 |
| Distributions from net investment income | (.03) | –C | (.04) | – | (.07) |
| Distributions from net realized gain | (2.27) | (1.25) | (.01) | – | – |
| Total distributions | (2.30) | (1.25) | (.04)D | – | (.07) |
| Redemption fees added to paid in capitalA | –C | –C | –C | –C | .01 |
| Net asset value, end of period | $24.48 | $25.76 | $25.32 | $19.40 | $17.87 |
| Total ReturnE,F | 4.19% | 6.83% | 30.81% | 8.56% | 10.71% |
| Ratios to Average Net AssetsG,H | |||||
| Expenses before reductions | 1.01% | .99% | 1.22% | 1.37% | 1.15% |
| Expenses net of fee waivers, if any | 1.01% | .99% | 1.22% | 1.37% | 1.15% |
| Expenses net of all reductions | 1.00% | .99% | 1.20% | 1.36% | 1.14% |
| Net investment income (loss) | .24% | .06% | (.09)% | (.10)% | - %B,I |
| Supplemental Data | |||||
| Net assets, end of period (in millions) | $11 | $10 | $8 | $4 | $4 |
| Portfolio turnover rateJ | 48% | 73% | 79% | 61% | 73% |
A Calculated based on average shares outstanding during the period.
B Investment income per share reflects a large, non-recurring dividend which amounted to $.04 per share. Excluding this non-recurring dividend, the ratio of net investment income (loss) to average net assets would have been (.21) %.
C Amount represents less than $.005 per share.
D Total distributions of $.04 per share is comprised of distributions from net investment income of $.037 and distributions from net realized gain of $.007 per share.
E Total returns would have been lower if certain expenses had not been reduced during the applicable periods shown.
F Total returns do not include the effect of the sales charges.
G Fees and expenses of any underlying Fidelity Central Funds are not included in the Fund's expense ratio. The Fund indirectly bears its proportionate share of the expenses of any underlying Fidelity Central Funds.
H Expense ratios reflect operating expenses of the class. Expenses before reductions do not reflect amounts reimbursed by the investment adviser or reductions from brokerage service arrangements or reductions from other expense offset arrangements and do not represent the amount paid by the class during periods when reimbursements or reductions occur. Expenses net of fee waivers reflect expenses after reimbursement by the investment adviser but prior to reductions from brokerage service arrangements or other expense offset arrangements. Expenses net of all reductions represent the net expenses paid by the class.
I Amount represents less than .005%.
J Amount does not include the portfolio activity of any underlying Fidelity Central Funds.
See accompanying notes which are an integral part of the financial statements.
Financial Highlights — Fidelity Stock Selector Small Cap Fund Class T
| Years ended October 31, | 2015 | 2014 | 2013 | 2012 | 2011 |
| Selected Per–Share Data | |||||
| Net asset value, beginning of period | $25.30 | $24.97 | $19.15 | $17.68 | $16.07 |
| Income from Investment Operations | |||||
| Net investment income (loss)A | (.03) | (.07) | (.08) | (.07) | (.05)B |
| Net realized and unrealized gain (loss) | .97 | 1.65 | 5.90 | 1.54 | 1.70 |
| Total from investment operations | .94 | 1.58 | 5.82 | 1.47 | 1.65 |
| Distributions from net investment income | – | – | – | – | (.05) |
| Distributions from net realized gain | (2.24) | (1.25) | – | – | – |
| Total distributions | (2.24) | (1.25) | – | – | (.05) |
| Redemption fees added to paid in capitalA | –C | –C | –C | –C | .01 |
| Net asset value, end of period | $24.00 | $25.30 | $24.97 | $19.15 | $17.68 |
| Total ReturnD,E | 3.90% | 6.46% | 30.39% | 8.31% | 10.34% |
| Ratios to Average Net AssetsF,G | |||||
| Expenses before reductions | 1.35% | 1.32% | 1.51% | 1.64% | 1.42% |
| Expenses net of fee waivers, if any | 1.35% | 1.32% | 1.51% | 1.64% | 1.42% |
| Expenses net of all reductions | 1.34% | 1.31% | 1.49% | 1.63% | 1.41% |
| Net investment income (loss) | (.10)% | (.27)% | (.38)% | (.37)% | (.27)%B |
| Supplemental Data | |||||
| Net assets, end of period (000 omitted) | $2,843 | $2,668 | $1,880 | $1,073 | $1,539 |
| Portfolio turnover rateH | 48% | 73% | 79% | 61% | 73% |
A Calculated based on average shares outstanding during the period.
B Investment income per share reflects a large, non-recurring dividend which amounted to $.04 per share. Excluding this non-recurring dividend, the ratio of net investment income (loss) to average net assets would have been (.48) %.
C Amount represents less than $.005 per share.
D Total returns would have been lower if certain expenses had not been reduced during the applicable periods shown.
E Total returns do not include the effect of the sales charges.
F Fees and expenses of any underlying Fidelity Central Funds are not included in the Fund's expense ratio. The Fund indirectly bears its proportionate share of the expenses of any underlying Fidelity Central Funds.
G Expense ratios reflect operating expenses of the class. Expenses before reductions do not reflect amounts reimbursed by the investment adviser or reductions from brokerage service arrangements or reductions from other expense offset arrangements and do not represent the amount paid by the class during periods when reimbursements or reductions occur. Expenses net of fee waivers reflect expenses after reimbursement by the investment adviser but prior to reductions from brokerage service arrangements or other expense offset arrangements. Expenses net of all reductions represent the net expenses paid by the class.
H Amount does not include the portfolio activity of any underlying Fidelity Central Funds.
See accompanying notes which are an integral part of the financial statements.
Financial Highlights — Fidelity Stock Selector Small Cap Fund Class B
| Years ended October 31, | 2015 | 2014 | 2013 | 2012 | 2011 |
| Selected Per–Share Data | |||||
| Net asset value, beginning of period | $24.55 | $24.38 | $18.79 | $17.43 | $15.87 |
| Income from Investment Operations | |||||
| Net investment income (loss)A | (.14) | (.19) | (.19) | (.16) | (.14)B |
| Net realized and unrealized gain (loss) | .94 | 1.61 | 5.78 | 1.52 | 1.69 |
| Total from investment operations | .80 | 1.42 | 5.59 | 1.36 | 1.55 |
| Distributions from net realized gain | (2.07) | (1.25) | – | – | – |
| Redemption fees added to paid in capitalA | –C | –C | –C | –C | .01 |
| Net asset value, end of period | $23.28 | $24.55 | $24.38 | $18.79 | $17.43 |
| Total ReturnD,E | 3.39% | 5.94% | 29.75% | 7.80% | 9.83% |
| Ratios to Average Net AssetsF,G | |||||
| Expenses before reductions | 1.84% | 1.81% | 1.99% | 2.12% | 1.90% |
| Expenses net of fee waivers, if any | 1.84% | 1.81% | 1.99% | 2.12% | 1.90% |
| Expenses net of all reductions | 1.83% | 1.80% | 1.97% | 2.11% | 1.90% |
| Net investment income (loss) | (.60)% | (.76)% | (.86)% | (.85)% | (.76)%B |
| Supplemental Data | |||||
| Net assets, end of period (000 omitted) | $168 | $273 | $307 | $225 | $246 |
| Portfolio turnover rateH | 48% | 73% | 79% | 61% | 73% |
A Calculated based on average shares outstanding during the period.
B Investment income per share reflects a large, non-recurring dividend which amounted to $.04 per share. Excluding this non-recurring dividend, the ratio of net investment income (loss) to average net assets would have been (.96) %.
C Amount represents less than $.005 per share.
D Total returns would have been lower if certain expenses had not been reduced during the applicable periods shown.
E Total returns do not include the effect of the contingent deferred sales charge.
F Fees and expenses of any underlying Fidelity Central Funds are not included in the Fund's expense ratio. The Fund indirectly bears its proportionate share of the expenses of any underlying Fidelity Central Funds.
G Expense ratios reflect operating expenses of the class. Expenses before reductions do not reflect amounts reimbursed by the investment adviser or reductions from brokerage service arrangements or reductions from other expense offset arrangements and do not represent the amount paid by the class during periods when reimbursements or reductions occur. Expenses net of fee waivers reflect expenses after reimbursement by the investment adviser but prior to reductions from brokerage service arrangements or other expense offset arrangements. Expenses net of all reductions represent the net expenses paid by the class.
H Amount does not include the portfolio activity of any underlying Fidelity Central Funds.
See accompanying notes which are an integral part of the financial statements.
Financial Highlights — Fidelity Stock Selector Small Cap Fund Class C
| Years ended October 31, | 2015 | 2014 | 2013 | 2012 | 2011 |
| Selected Per–Share Data | |||||
| Net asset value, beginning of period | $24.49 | $24.32 | $18.73 | $17.38 | $15.82 |
| Income from Investment Operations | |||||
| Net investment income (loss)A | (.14) | (.18) | (.19) | (.16) | (.14)B |
| Net realized and unrealized gain (loss) | .93 | 1.60 | 5.78 | 1.51 | 1.69 |
| Total from investment operations | .79 | 1.42 | 5.59 | 1.35 | 1.55 |
| Distributions from net realized gain | (2.12) | (1.25) | – | – | – |
| Redemption fees added to paid in capitalA | –C | –C | –C | –C | .01 |
| Net asset value, end of period | $23.16 | $24.49 | $24.32 | $18.73 | $17.38 |
| Total ReturnD,E | 3.36% | 5.95% | 29.85% | 7.77% | 9.86% |
| Ratios to Average Net AssetsF,G | |||||
| Expenses before reductions | 1.84% | 1.79% | 1.98% | 2.12% | 1.90% |
| Expenses net of fee waivers, if any | 1.84% | 1.79% | 1.98% | 2.12% | 1.90% |
| Expenses net of all reductions | 1.83% | 1.79% | 1.96% | 2.11% | 1.89% |
| Net investment income (loss) | (.59)% | (.74)% | (.85)% | (.85)% | (.76)%B |
| Supplemental Data | |||||
| Net assets, end of period (000 omitted) | $3,965 | $3,946 | $3,252 | $1,504 | $1,370 |
| Portfolio turnover rateH | 48% | 73% | 79% | 61% | 73% |
A Calculated based on average shares outstanding during the period.
B Investment income per share reflects a large, non-recurring dividend which amounted to $.04 per share. Excluding this non-recurring dividend, the ratio of net investment income (loss) to average net assets would have been (.96) %.
C Amount represents less than $.005 per share.
D Total returns would have been lower if certain expenses had not been reduced during the applicable periods shown.
E Total returns do not include the effect of the contingent deferred sales charge.
F Fees and expenses of any underlying Fidelity Central Funds are not included in the Fund's expense ratio. The Fund indirectly bears its proportionate share of the expenses of any underlying Fidelity Central Funds.
G Expense ratios reflect operating expenses of the class. Expenses before reductions do not reflect amounts reimbursed by the investment adviser or reductions from brokerage service arrangements or reductions from other expense offset arrangements and do not represent the amount paid by the class during periods when reimbursements or reductions occur. Expenses net of fee waivers reflect expenses after reimbursement by the investment adviser but prior to reductions from brokerage service arrangements or other expense offset arrangements. Expenses net of all reductions represent the net expenses paid by the class.
H Amount does not include the portfolio activity of any underlying Fidelity Central Funds.
See accompanying notes which are an integral part of the financial statements.
Financial Highlights — Fidelity Stock Selector Small Cap Fund
| Years ended October 31, | 2015 | 2014 | 2013 | 2012 | 2011 |
| Selected Per–Share Data | |||||
| Net asset value, beginning of period | $26.15 | $25.64 | $19.65 | $18.05 | $16.35 |
| Income from Investment Operations | |||||
| Net investment income (loss)A | .12 | .08 | .04 | .04 | .05B |
| Net realized and unrealized gain (loss) | .98 | 1.70 | 6.06 | 1.56 | 1.74 |
| Total from investment operations | 1.10 | 1.78 | 6.10 | 1.60 | 1.79 |
| Distributions from net investment income | (.09) | (.01)C | (.10) | – | (.10) |
| Distributions from net realized gain | (2.27) | (1.26)C | (.01) | – | – |
| Total distributions | (2.36) | (1.27) | (.11) | – | (.10) |
| Redemption fees added to paid in capitalA | –D | –D | –D | –D | .01 |
| Net asset value, end of period | $24.89 | $26.15 | $25.64 | $19.65 | $18.05 |
| Total ReturnE | 4.46% | 7.08% | 31.20% | 8.86% | 11.03% |
| Ratios to Average Net AssetsF,G | |||||
| Expenses before reductions | .77% | .73% | .94% | 1.07% | .85% |
| Expenses net of fee waivers, if any | .77% | .73% | .93% | 1.07% | .85% |
| Expenses net of all reductions | .76% | .72% | .91% | 1.06% | .85% |
| Net investment income (loss) | .48% | .32% | .20% | .20% | .29%B |
| Supplemental Data | |||||
| Net assets, end of period (in millions) | $1,372 | $1,406 | $1,487 | $1,311 | $1,698 |
| Portfolio turnover rateH | 48% | 73% | 79% | 61% | 73% |
A Calculated based on average shares outstanding during the period.
B Investment income per share reflects a large, non-recurring dividend which amounted to $.04 per share. Excluding this non-recurring dividend, the ratio of net investment income (loss) to average net assets would have been .09%.
C The amounts shown reflect certain reclassifications related to book to tax differences that were made in the year shown.
D Amount represents less than $.005 per share.
E Total returns would have been lower if certain expenses had not been reduced during the applicable periods shown.
F Fees and expenses of any underlying Fidelity Central Funds are not included in the Fund's expense ratio. The Fund indirectly bears its proportionate share of the expenses of any underlying Fidelity Central Funds.
G Expense ratios reflect operating expenses of the class. Expenses before reductions do not reflect amounts reimbursed by the investment adviser or reductions from brokerage service arrangements or reductions from other expense offset arrangements and do not represent the amount paid by the class during periods when reimbursements or reductions occur. Expenses net of fee waivers reflect expenses after reimbursement by the investment adviser but prior to reductions from brokerage service arrangements or other expense offset arrangements. Expenses net of all reductions represent the net expenses paid by the class.
H Amount does not include the portfolio activity of any underlying Fidelity Central Funds.
See accompanying notes which are an integral part of the financial statements.
Financial Highlights — Fidelity Stock Selector Small Cap Fund Class I
| Years ended October 31, | 2015 | 2014 | 2013 | 2012 | 2011 |
| Selected Per–Share Data | |||||
| Net asset value, beginning of period | $26.21 | $25.69 | $19.72 | $18.07 | $16.39 |
| Income from Investment Operations | |||||
| Net investment income (loss)A | .13 | .09 | .05 | .04 | .05B |
| Net realized and unrealized gain (loss) | .99 | 1.70 | 6.06 | 1.61 | 1.74 |
| Total from investment operations | 1.12 | 1.79 | 6.11 | 1.65 | 1.79 |
| Distributions from net investment income | (.10) | (.01)C | (.14) | – | (.12) |
| Distributions from net realized gain | (2.27) | (1.26)C | (.01) | – | – |
| Total distributions | (2.37) | (1.27) | (.14)D | – | (.12) |
| Redemption fees added to paid in capitalA | –E | –E | –E | –E | .01 |
| Net asset value, end of period | $24.96 | $26.21 | $25.69 | $19.72 | $18.07 |
| Total ReturnF | 4.52% | 7.11% | 31.22% | 9.13% | 10.99% |
| Ratios to Average Net AssetsG,H | |||||
| Expenses before reductions | .74% | .70% | .91% | 1.06% | .86% |
| Expenses net of fee waivers, if any | .73% | .70% | .91% | 1.06% | .86% |
| Expenses net of all reductions | .73% | .70% | .89% | 1.05% | .85% |
| Net investment income (loss) | .51% | .35% | .22% | .21% | .29%B |
| Supplemental Data | |||||
| Net assets, end of period (000 omitted) | $46,484 | $50,988 | $55,860 | $39,592 | $10,038 |
| Portfolio turnover rateI | 48% | 73% | 79% | 61% | 73% |
A Calculated based on average shares outstanding during the period.
B Investment income per share reflects a large, non-recurring dividend which amounted to $.04 per share. Excluding this non-recurring dividend, the ratio of net investment income (loss) to average net assets would have been .08%.
C The amounts shown reflect certain reclassifications related to book to tax differences that were made in the year shown.
D Total distributions of $.14 per share is comprised of distributions from net investment income of $.136 and distributions from net realized gain of $.007 per share.
E Amount represents less than $.005 per share.
F Total returns would have been lower if certain expenses had not been reduced during the applicable periods shown.
G Fees and expenses of any underlying Fidelity Central Funds are not included in the Fund's expense ratio. The Fund indirectly bears its proportionate share of the expenses of any underlying Fidelity Central Funds.
H Expense ratios reflect operating expenses of the class. Expenses before reductions do not reflect amounts reimbursed by the investment adviser or reductions from brokerage service arrangements or reductions from other expense offset arrangements and do not represent the amount paid by the class during periods when reimbursements or reductions occur. Expenses net of fee waivers reflect expenses after reimbursement by the investment adviser but prior to reductions from brokerage service arrangements or other expense offset arrangements. Expenses net of all reductions represent the net expenses paid by the class.
I Amount does not include the portfolio activity of any underlying Fidelity Central Funds.
See accompanying notes which are an integral part of the financial statements.
Notes to Financial Statements
For the period ended October 31, 2015
(Amounts in thousands except percentages)
1. Organization.
Fidelity Stock Selector Small Cap Fund (the Fund) is a fund of Fidelity Capital Trust (the Trust) and is authorized to issue an unlimited number of shares. The Trust is registered under the Investment Company Act of 1940, as amended (the 1940 Act), as an open-end management investment company organized as a Massachusetts business trust. The Fund offers Class A, Class T, Class C, Stock Selector Small Cap and Class I shares(formerly Institutional Class) , each of which, along with Class B shares, has equal rights as to assets and voting privileges. Class B shares are closed to new accounts and additional purchases, except for exchanges and reinvestments. Each class has exclusive voting rights with respect to matters that affect that class. Class B shares will automatically convert to Class A shares after a holding period of seven years from the initial date of purchase.
2. Investments in Fidelity Central Funds.
The Fund invests in Fidelity Central Funds, which are open-end investment companies generally available only to other investment companies and accounts managed by the investment adviser and its affiliates. The Fund's Schedule of Investments lists each of the Fidelity Central Funds held as of period end, if any, as an investment of the Fund, but does not include the underlying holdings of each Fidelity Central Fund. As an Investing Fund, the Fund indirectly bears its proportionate share of the expenses of the underlying Fidelity Central Funds.
The Money Market Central Funds seek preservation of capital and current income and are managed by Fidelity Investments Money Management, Inc. (FIMM), an affiliate of the investment adviser. Annualized expenses of the Money Market Central Funds as of their most recent shareholder report date are less than .005%.
A complete unaudited list of holdings for each Fidelity Central Fund is available upon request or at the Securities and Exchange Commission (the SEC) website at www.sec.gov. In addition, the financial statements of the Fidelity Central Funds, which are not covered by the Fund's Report of Independent Registered Public Accounting Firm, are available on the SEC website or upon request.
3. Significant Accounting Policies.
The financial statements have been prepared in conformity with accounting principles generally accepted in the United States of America (GAAP), which require management to make certain estimates and assumptions at the date of the financial statements. Actual results could differ from those estimates. Subsequent events, if any, through the date that the financial statements were issued have been evaluated in the preparation of the financial statements. The following summarizes the significant accounting policies of the Fund:
Investment Valuation. Investments are valued as of 4:00 p.m. Eastern time on the last calendar day of the period. The Board of Trustees (the Board) has delegated the day to day responsibility for the valuation of the Fund's investments to the Fidelity Management & Research Company (FMR) Fair Value Committee (the Committee). In accordance with valuation policies and procedures approved by the Board, the Fund attempts to obtain prices from one or more third party pricing vendors or brokers to value its investments. When current market prices, quotations or currency exchange rates are not readily available or reliable, investments will be fair valued in good faith by the Committee, in accordance with procedures adopted by the Board. Factors used in determining fair value vary by investment type and may include market or investment specific events, changes in interest rates and credit quality. The frequency with which these procedures are used cannot be predicted and they may be utilized to a significant extent. The Committee oversees the Fund's valuation policies and procedures and reports to the Board on the Committee's activities and fair value determinations. The Board monitors the appropriateness of the procedures used in valuing the Fund's investments and ratifies the fair value determinations of the Committee.
The Fund categorizes the inputs to valuation techniques used to value its investments into a disclosure hierarchy consisting of three levels as shown below:
- Level 1 – quoted prices in active markets for identical investments
- Level 2 – other significant observable inputs (including quoted prices for similar investments, interest rates, prepayment speeds, etc.)
- Level 3 – unobservable inputs (including the Fund's own assumptions based on the best information available)
Valuation techniques used to value the Fund's investments by major category are as follows:
Equity securities, including restricted securities, for which market quotations are readily available, are valued at the last reported sale price or official closing price as reported by a third party pricing vendor on the primary market or exchange on which they are traded and are categorized as Level 1 in the hierarchy. In the event there were no sales during the day or closing prices are not available, securities are valued at the last quoted bid price or may be valued using the last available price and are generally categorized as Level 2 in the hierarchy. For foreign equity securities, when market or security specific events arise, comparisons to the valuation of American Depositary Receipts (ADRs), futures contracts, Exchange-Traded Funds (ETFs) and certain indexes as well as quoted prices for similar securities may be used and would be categorized as Level 2 in the hierarchy. Utilizing these techniques may result in transfers between Level 1 and Level 2. For equity securities, including restricted securities, where observable inputs are limited, assumptions about market activity and risk are used and these securities may be categorized as Level 3 in the hierarchy.
Debt securities, including restricted securities, are valued based on evaluated prices received from third party pricing vendors or from brokers who make markets in such securities. U.S. government and government agency obligations are valued by pricing vendors who utilize matrix pricing which considers yield or price of bonds of comparable quality, coupon, maturity and type or by broker-supplied prices. When independent prices are unavailable or unreliable, debt securities may be valued utilizing pricing methodologies which consider similar factors that would be used by third party pricing vendors. Debt securities are generally categorized as Level 2 in the hierarchy but may be Level 3 depending on the circumstances.
Futures contracts are valued at the settlement price established each day by the board of trade or exchange on which they are traded and are categorized as Level 1 in the hierarchy. Investments in open-end mutual funds ,including the Fidelity Central Funds, are valued at their closing net asset value (NAV) each business day and are categorized as Level 1 in the hierarchy.
Changes in valuation techniques may result in transfers in or out of an assigned level within the disclosure hierarchy. The aggregate value of investments by input level as of October 31, 2015 is included at the end of the Fund's Schedule of Investments.
Foreign Currency. The Fund may use foreign currency contracts to facilitate transactions in foreign-denominated securities. Gains and losses from these transactions may arise from changes in the value of the foreign currency or if the counterparties do not perform under the contracts' terms.
Foreign-denominated assets, including investment securities, and liabilities are translated into U.S. dollars at the exchange rates at period end. Purchases and sales of investment securities, income and dividends received and expenses denominated in foreign currencies are translated into U.S. dollars at the exchange rate in effect on the transaction date.
The effects of exchange rate fluctuations on investments are included with the net realized and unrealized gain (loss) on investment securities. Other foreign currency transactions resulting in realized and unrealized gain (loss) are disclosed separately.
Investment Transactions and Income. For financial reporting purposes, the Fund's investment holdings and NAV include trades executed through the end of the last business day of the period. The NAV per share for processing shareholder transactions is calculated as of the close of business of the New York Stock Exchange (NYSE), normally 4:00 p.m. Eastern time and includes trades executed through the end of the prior business day. Gains and losses on securities sold are determined on the basis of identified cost and may include proceeds received from litigation. Dividend income is recorded on the ex-dividend date, except for certain dividends from foreign securities where the ex-dividend date may have passed, which are recorded as soon as the Fund is informed of the ex-dividend date. Non-cash dividends included in dividend income, if any, are recorded at the fair market value of the securities received. Income and capital gain distributions from Fidelity Central Funds, if any, are recorded on the ex-dividend date. Distributions received on securities that represent a return of capital or capital gain are recorded as a reduction of cost of investments and/or as a realized gain. Subsequent to ex-dividend date the Fund determines the components of these distributions, based upon receipt of tax filings or other correspondence relating to the underlying investment. Interest income is accrued as earned and includes coupon interest and amortization of premium and accretion of discount on debt securities as applicable. Investment income is recorded net of foreign taxes withheld where recovery of such taxes is uncertain.
Class Allocations and Expenses. Investment income, realized and unrealized capital gains and losses, common expenses of the Fund, and certain fund-level expense reductions, if any, are allocated daily on a pro-rata basis to each class based on the relative net assets of each class to the total net assets of the Fund. Each class differs with respect to transfer agent and distribution and service plan fees incurred. Certain expense reductions may also differ by class. For the reporting period, the allocated portion of income and expenses to each class as a percent of its average net assets may vary due to the timing of recording these transactions in relation to fluctuating net assets of the classes. Expenses directly attributable to a fund are charged to that fund. Expenses attributable to more than one fund are allocated among the respective funds on the basis of relative net assets or other appropriate methods. Expense estimates are accrued in the period to which they relate and adjustments are made when actual amounts are known.
Income Tax Information and Distributions to Shareholders. Each year, the Fund intends to qualify as a regulated investment company under Subchapter M of the Internal Revenue Code, including distributing substantially all of its taxable income and realized gains. As a result, no provision for U.S. Federal income taxes is required. As of October 31, 2015, the Fund did not have any unrecognized tax benefits in the financial statements; nor is the Fund aware of any tax positions for which it is reasonably possible that the total amounts of unrecognized tax benefits will significantly change in the next twelve months. The Fund files a U.S. federal tax return, in addition to state and local tax returns as required. The Fund's federal income tax returns are subject to examination by the Internal Revenue Service (IRS) for a period of three fiscal years after they are filed. State and local tax returns may be subject to examination for an additional fiscal year depending on the jurisdiction. Foreign taxes are provided for based on the Fund's understanding of the tax rules and rates that exist in the foreign markets in which it invests.
Distributions are declared and recorded on the ex-dividend date. Income dividends and capital gain distributions are declared separately for each class. Income and capital gain distributions are determined in accordance with income tax regulations, which may differ from GAAP. These differences resulted in distribution reclassifications. In addition, the Fund claimed a portion of the payment made to redeeming shareholders as a distribution for income tax purposes.
Capital accounts within the financial statements are adjusted for permanent book-tax differences. These adjustments have no impact on net assets or the results of operations. Capital accounts are not adjusted for temporary book-tax differences which will reverse in a subsequent period.
Book-tax differences are primarily due to foreign currency transactions, partnerships, futures transactions, deferred trustees compensation, and losses deferred due to wash sales.
The federal tax cost of investment securities and unrealized appreciation (depreciation) as of period end were as follows:
| Gross unrealized appreciation | $275,396 |
| Gross unrealized depreciation | (112,027) |
| Net unrealized appreciation (depreciation) on securities | $163,369 |
| Tax Cost | $1,351,493 |
The tax-based components of distributable earnings as of period end were as follows:
| Undistributed ordinary income | $4,607 |
| Undistributed long-term capital gain | $87,951 |
| Net unrealized appreciation (depreciation) on securities and other investments | $163,368 |
The tax character of distributions paid was as follows:
| October 31, 2015 | October 31, 2014 | |
| Ordinary Income | $19,906 | $ 899 |
| Long-term Capital Gains | 111,437 | 75,390 |
| Total | $131,343 | $ 76,289 |
Short-Term Trading (Redemption) Fees. Shares held by investors in the Fund less than 90 days may have been subject to a redemption fee equal to 1.50% of the NAV of shares redeemed. All redemption fees, which reduce the proceeds of the shareholder redemption, are retained by the Fund and accounted for as an addition to paid in capital.
4. Derivative Instruments.
Risk Exposures and the Use of Derivative Instruments. The Fund's investment objective allows the Fund to enter into various types of derivative contracts, including futures contracts. Derivatives are investments whose value is primarily derived from underlying assets, indices or reference rates and may be transacted on an exchange or over-the-counter (OTC). Derivatives may involve a future commitment to buy or sell a specified asset based on specified terms, to exchange future cash flows at periodic intervals based on a notional principal amount, or for one party to make one or more payments upon the occurrence of specified events in exchange for periodic payments from the other party.
The Fund used derivatives to increase returns and to manage exposure to certain risks as defined below. The success of any strategy involving derivatives depends on analysis of numerous economic factors, and if the strategies for investment do not work as intended, the Fund may not achieve its objectives.
The Fund's use of derivatives increased or decreased its exposure to the following risk:
| Equity Risk | Equity risk relates to the fluctuations in the value of financial instruments as a result of changes in market prices (other than those arising from interest rate risk or foreign exchange risk), whether caused by factors specific to an individual investment, its issuer, or all factors affecting all instruments traded in a market or market segment. |
The Fund is also exposed to additional risks from investing in derivatives, such as liquidity risk and counterparty credit risk. Liquidity risk is the risk that the Fund will be unable to close out the derivative in the open market in a timely manner. Counterparty credit risk is the risk that the counterparty will not be able to fulfill its obligation to the Fund. Counterparty credit risk related to exchange-traded futures contracts may be mitigated by the protection provided by the exchange on which they trade.
Investing in derivatives may involve greater risks than investing in the underlying assets directly and, to varying degrees, may involve risk of loss in excess of any initial investment and collateral received and amounts recognized in the Statement of Assets and Liabilities. In addition, there may be the risk that the change in value of the derivative contract does not correspond to the change in value of the underlying instrument.
Futures Contracts. A futures contract is an agreement between two parties to buy or sell a specified underlying instrument for a fixed price at a specified future date. The Fund used futures contracts to manage its exposure to the stock market.
Upon entering into a futures contract, a fund is required to deposit either cash or securities (initial margin) with a clearing broker in an amount equal to a certain percentage of the face value of the contract. Futures contracts are marked-to-market daily and subsequent daily payments (variation margin) are made or received by a fund depending on the daily fluctuations in the value of the futures contracts and are recorded as unrealized appreciation or (depreciation). This receivable and/or payable, if any, is included in daily variation margin for derivative instruments in the Statement of Assets and Liabilities. Realized gain or (loss) is recorded upon the expiration or closing of a futures contract.
Any open futures contracts at period end are presented in the Schedule of Investments under the caption "Futures Contracts". The underlying face amount at value reflects each contract's exposure to the underlying instrument or index at period end and is representative of volume of activity during the period. Securities deposited to meet initial margin requirements are identified in the Schedule of Investments.
During the period the Fund recognized net realized gain (loss) of $1,775 and a change in net unrealized appreciation (depreciation) of $(254) related to its investment in futures contracts. These amounts are included in the Statement of Operations.
5. Purchases and Sales of Investments.
Purchases and sales of securities, other than short-term securities, aggregated $678,476 and $784,129, respectively.
6. Fees and Other Transactions with Affiliates.
Management Fee. Fidelity Management & Research Company (the investment adviser) and its affiliates provide the Fund with investment management related services for which the Fund pays a monthly management fee. The management fee is the sum of an individual fund fee rate that is based on an annual rate of .35% of the Fund's average net assets and an annualized group fee rate that averaged .25% during the period. The group fee rate is based upon the average net assets of all the mutual funds advised by the investment adviser, including any mutual funds previously advised by the investment adviser that are currently advised by Fidelity SelectCo, LLC, an affiliate of the investment adviser. The group fee rate decreases as assets under management increase and increases as assets under management decrease. In addition, the management fee is subject to a performance adjustment (up to a maximum of +/- .20% of the Fund's average net assets over a 36 month performance period). The upward or downward adjustment to the management fee is based on the relative investment performance of Stock Selector Small Cap as compared to its benchmark index, the Russell 2000 Index, over the same 36 month performance period. For the reporting period, the total annual management fee rate, including the performance adjustment, was .49% of the Fund's average net assets. The performance adjustment included in the management fee rate may be higher or lower than the maximum performance adjustment rate due to the difference between the average net assets for the reporting and performance periods.
Distribution and Service Plan Fees. In accordance with Rule 12b-1 of the 1940 Act, the Fund has adopted separate Distribution and Service Plans for each class of shares. Certain classes pay Fidelity Distributors Corporation (FDC), an affiliate of the investment adviser, separate Distribution and Service Fees, each of which is based on an annual percentage of each class' average net assets. In addition, FDC may pay financial intermediaries for selling shares of the Fund and providing shareholder support services. For the period, the Distribution and Service Fee rates, total fees and amounts retained by FDC were as follows:
| Distribution Fee | Service Fee | Total Fees | Retained by FDC | |
| Class A | -% | .25% | $28 | $2 |
| Class T | .25% | .25% | 15 | – |
| Class B | .75% | .25% | 2 | 2 |
| Class C | .75% | .25% | 41 | 9 |
| $86 | $13 |
Sales Load. FDC may receive a front-end sales charge of up to 5.75% for selling Class A shares and 3.50% for selling Class T shares, some of which is paid to financial intermediaries for selling shares of the Fund. Depending on the holding period, FDC may receive contingent deferred sales charges levied on Class A, Class T, Class B, and Class C redemptions. The deferred sales charges range from 5.00% to 1.00% for Class B shares, 1.00% for Class C shares, 1.00% for certain purchases of Class A shares and .25% for certain purchases of Class T shares.
For the period, sales charge amounts retained by FDC were as follows:
| Retained by FDC | |
| Class A | $6 |
| Class T | 2 |
| Class B(a) | -(b) |
| Class C(a) | 1 |
| $9 |
(a) When Class B and Class C shares are initially sold, FDC pays commissions from its own resources to financial intermediaries through which the sales are made.
(b) In the amount of less than five hundred dollars.
Transfer Agent Fees. Fidelity Investments Institutional Operations Company, Inc., (FIIOC), an affiliate of the investment adviser, is the transfer, dividend disbursing and shareholder servicing agent for each class of the Fund. FIIOC receives account fees and asset-based fees that vary according to the account size and type of account of the shareholders of the respective classes of the Fund. FIIOC pays for typesetting, printing and mailing of shareholder reports, except proxy statements.
For the period, transfer agent fees for each class were as follows:
| Amount | % of Class-Level Average Net Assets | |
| Class A | $25 | .22 |
| Class T | 9 | .31 |
| Class B | 1 | .30 |
| Class C | 13 | .30 |
| Stock Selector Small Cap | 3,357 | .24 |
| Class I | 100 | .20 |
| $3,505 |
Accounting and Security Lending Fees. Fidelity Service Company, Inc. (FSC), an affiliate of the investment adviser, maintains the Fund's accounting records. The accounting fee is based on the level of average net assets for each month. Under a separate contract, FSC administers the security lending program. The security lending fee is based on the number and duration of lending transactions.
Brokerage Commissions. The Fund placed a portion of its portfolio transactions with brokerage firms which are affiliates of the investment adviser. Brokerage commissions are included in net realized gain (loss) and change in net unrealized appreciation (depreciation) in the Statement of Operations. The commissions paid to these affiliated firms were $26 for the period.
Interfund Lending Program. Pursuant to an Exemptive Order issued by the SEC, the Fund, along with other registered investment companies having management contracts with FMR or other affiliated entities of FMR, may participate in an interfund lending program. This program provides an alternative credit facility allowing the funds to borrow from, or lend money to, other participating affiliated funds. The Fund's activity in this program during the period for which loans were outstanding was as follows:
| Borrower or Lender | Average Loan Balance | Weighted Average Interest Rate | Interest Expense |
| Borrower | $11,169 | .35% | $1 |
7. Committed Line of Credit.
The Fund participates with other funds managed by the investment adviser or an affiliate in a $4.25 billion credit facility (the "line of credit") to be utilized for temporary or emergency purposes to fund shareholder redemptions or for other short-term liquidity purposes. The Fund has agreed to pay commitment fees on its pro-rata portion of the line of credit, which amounted to $2 and is reflected in Miscellaneous expenses on the Statement of Operations. During the period, the Fund did not borrow on this line of credit.
8. Security Lending.
The Fund lends portfolio securities through a lending agent from time to time in order to earn additional income. For equity securities, a lending agent is used and may loan securities to certain qualified borrowers, including Fidelity Capital Markets (FCM), a broker-dealer affiliated with the Fund. On the settlement date of the loan, the Fund receives collateral (in the form of U.S. Treasury obligations, letters of credit and/or cash) against the loaned securities and maintains collateral in an amount not less than 100% of the market value of the loaned securities during the period of the loan. The market value of the loaned securities is determined at the close of business of the Fund and any additional required collateral is delivered to the Fund on the next business day. The Fund or borrower may terminate the loan at any time, and if the borrower defaults on its obligation to return the securities loaned because of insolvency or other reasons, the Fund may apply collateral received from the borrower against the obligation. The Fund may experience delays and costs in recovering the securities loaned. Any cash collateral received is invested in the Fidelity Securities Lending Cash Central Fund. The value of loaned securities and cash collateral at period end are disclosed on the Fund's Statement of Assets and Liabilities. The value of securities loaned to FCM at period end was $4,291. Security lending income represents the income earned on investing cash collateral, less rebates paid to borrowers and any lending agent fees associated with the loan, plus any premium payments received for lending certain types of securities. Security lending income is presented in the Statement of Operations as a component of income from Fidelity Central Funds. Total security lending income during the period amounted to $572 including $34 from securities loaned to FCM.
9. Expense Reductions.
Commissions paid to certain brokers with whom the investment adviser, or its affiliates, places trades on behalf of the Fund include an amount in addition to trade execution, which may be rebated back to the Fund to offset certain expenses. This amount totaled $101 for the period.
In addition, during the period the investment adviser reimbursed and/or waived a portion of fund-level operating expenses in the amount of $6 and a portion of class-level operating expenses as follows:
| Amount | |
| Class A | $-(a) |
| Class B | -(a) |
| Class C | -(a) |
| Class I | 1 |
| Stock Selector Small Cap | 34 |
| Class T | -(a) |
| $35 |
(a) In the amount of less than five hundred dollars.
10. Distributions to Shareholders.
Distributions to shareholders of each class were as follows:
| Years ended October 31, | 2015 | 2014 |
| From net investment income | ||
| Class A | $13 | $0 |
| Stock Selector Small Cap | 4,877 | 565 |
| Class I | 192 | 24 |
| Total | $5,082 | $589 |
| From net realized gain | ||
| Class A | $925 | $396 |
| Class T | 240 | 95 |
| Class B | 22 | 16 |
| Class C | 343 | 175 |
| Stock Selector Small Cap | 120,344 | 72,289 |
| Class I | 4,387 | 2,729 |
| Total | $126,261 | $75,700 |
11. Share Transactions.
Share transactions for each class were as follows and may contain automatic conversions between classes or exchanges between funds:
| Shares | Shares | Dollars | Dollars | |
| Years ended October 31, | 2015 | 2014 | 2015 | 2014 |
| Class A | ||||
| Shares sold | 100 | 152 | $2,535 | $3,885 |
| Reinvestment of distributions | 38 | 15 | 917 | 377 |
| Shares redeemed | (76) | (73) | (1,902) | (1,870) |
| Net increase (decrease) | 62 | 94 | $1,550 | $2,392 |
| Class T | ||||
| Shares sold | 25 | 50 | $620 | $1,259 |
| Reinvestment of distributions | 10 | 4 | 240 | 95 |
| Shares redeemed | (22) | (24) | (550) | (602) |
| Net increase (decrease) | 13 | 30 | $310 | $752 |
| Class B | ||||
| Shares sold | - | - | $5 | $5 |
| Reinvestment of distributions | 1 | - | 21 | 15 |
| Shares redeemed | (5) | (2) | (123) | (56) |
| Net increase (decrease) | (4) | (2) | $(97) | $(36) |
| Class C | ||||
| Shares sold | 64 | 66 | $1,523 | $1,636 |
| Reinvestment of distributions | 14 | 7 | 325 | 163 |
| Shares redeemed | (68) | (46) | (1,632) | (1,123) |
| Net increase (decrease) | 10 | 27 | $216 | $676 |
| Stock Selector Small Cap | ||||
| Shares sold | 8,425 | 5,956 | $213,955 | $154,419 |
| Reinvestment of distributions | 5,054 | 2,814 | 122,501 | 71,273 |
| Shares redeemed | (12,118) | (13,012) | (309,333) | (336,317) |
| Net increase (decrease) | 1,361 | (4,242) | $27,123 | $(110,625) |
| Class I | ||||
| Shares sold | 362 | 264 | $9,007 | $6,855 |
| Reinvestment of distributions | 186 | 87 | 4,521 | 2,217 |
| Shares redeemed | (631) | (580) | (15,896) | (15,133) |
| Net increase (decrease) | (83) | (229) | $(2,368) | $(6,061) |
12. Other.
The Fund's organizational documents provide former and current trustees and officers with a limited indemnification against liabilities arising in connection with the performance of their duties to the Fund. In the normal course of business, the Fund may also enter into contracts that provide general indemnifications. The Fund's maximum exposure under these arrangements is unknown as this would be dependent on future claims that may be made against the Fund. The risk of material loss from such claims is considered remote.
Report of Independent Registered Public Accounting Firm
To the Trustees of Fidelity Capital Trust and Shareholders of Fidelity® Stock Selector Small Cap Fund:
We have audited the accompanying statement of assets and liabilities of Fidelity® Stock Selector Small Cap Fund (the Fund), a fund of Fidelity Capital Trust, including the schedule of investments, as of October 31, 2015, and the related statement of operations for the year then ended, the statement of changes in net assets for each of the two years in the period then ended, and the financial highlights for each of the five years in the period then ended. These financial statements and financial highlights are the responsibility of the Fund's management. Our responsibility is to express an opinion on these financial statements and financial highlights based on our audits.
We conducted our audits in accordance with the standards of the Public Company Accounting Oversight Board (United States). Those standards require that we plan and perform the audit to obtain reasonable assurance about whether the financial statements and financial highlights are free of material misstatement. The Fund is not required to have, nor were we engaged to perform, an audit of its internal control over financial reporting. Our audits included consideration of internal control over financial reporting as a basis for designing audit procedures that are appropriate in the circumstances, but not for the purpose of expressing an opinion on the effectiveness of the Fund's internal control over financial reporting. Accordingly, we express no such opinion. An audit also includes examining, on a test basis, evidence supporting the amounts and disclosures in the financial statements, assessing the accounting principles used and significant estimates made by management, as well as evaluating the overall financial statement presentation. Our procedures included confirmation of securities owned as of October 31, 2015, by correspondence with the custodians and brokers; when replies were not received from brokers, we performed other auditing procedures. We believe that our audits provide a reasonable basis for our opinion.
In our opinion, such financial statements and financial highlights referred to above present fairly, in all material respects, the financial position of Fidelity® Stock Selector Small Cap Fund as of October 31, 2015, the results of its operations for the year then ended, the changes in its net assets for each of the two years in the period then ended, and the financial highlights for the each of the five years in the period then ended, in conformity with accounting principles generally accepted in the United States of America.
DELOITTE & TOUCHE LLP
Boston, Massachusetts
December 17, 2015
Trustees and Officers
The Trustees, Members of the Advisory Board (if any), and officers of the trust and fund, as applicable, are listed below. The Board of Trustees governs the fund and is responsible for protecting the interests of shareholders. The Trustees are experienced executives who meet periodically throughout the year to oversee the fund's activities, review contractual arrangements with companies that provide services to the fund, oversee management of the risks associated with such activities and contractual arrangements, and review the fund's performance. Each of the Trustees oversees 170 funds.
The Trustees hold office without limit in time except that (a) any Trustee may resign; (b) any Trustee may be removed by written instrument, signed by at least two-thirds of the number of Trustees prior to such removal; (c) any Trustee who requests to be retired or who has become incapacitated by illness or injury may be retired by written instrument signed by a majority of the other Trustees; and (d) any Trustee may be removed at any special meeting of shareholders by a two-thirds vote of the outstanding voting securities of the trust. Each Trustee who is not an interested person (as defined in the 1940 Act) of the trust and the fund is referred to herein as an Independent Trustee. Each Independent Trustee shall retire not later than the last day of the calendar year in which his or her 75th birthday occurs. The Independent Trustees may waive this mandatory retirement age policy with respect to individual Trustees. Officers and Advisory Board Members hold office without limit in time, except that any officer or Advisory Board Member may resign or may be removed by a vote of a majority of the Trustees at any regular meeting or any special meeting of the Trustees. Except as indicated, each individual has held the office shown or other offices in the same company for the past five years.
The fund’s Statement of Additional Information (SAI) includes more information about the Trustees. To request a free copy, call Fidelity at 1-877-208-0098.
Experience, Skills, Attributes, and Qualifications of the Trustees. The Governance and Nominating Committee has adopted a statement of policy that describes the experience, qualifications, attributes, and skills that are necessary and desirable for potential Independent Trustee candidates (Statement of Policy). The Board believes that each Trustee satisfied at the time he or she was initially elected or appointed a Trustee, and continues to satisfy, the standards contemplated by the Statement of Policy. The Governance and Nominating Committee also engages professional search firms to help identify potential Independent Trustee candidates who have the experience, qualifications, attributes, and skills consistent with the Statement of Policy. From time to time, additional criteria based on the composition and skills of the current Independent Trustees, as well as experience or skills that may be appropriate in light of future changes to board composition, business conditions, and regulatory or other developments, have also been considered by the professional search firms and the Governance and Nominating Committee. In addition, the Board takes into account the Trustees' commitment and participation in Board and committee meetings, as well as their leadership of standing and ad hoc committees throughout their tenure.
In determining that a particular Trustee was and continues to be qualified to serve as a Trustee, the Board has considered a variety of criteria, none of which, in isolation, was controlling. The Board believes that, collectively, the Trustees have balanced and diverse experience, qualifications, attributes, and skills, which allow the Board to operate effectively in governing the fund and protecting the interests of shareholders. Information about the specific experience, skills, attributes, and qualifications of each Trustee, which in each case led to the Board's conclusion that the Trustee should serve (or continue to serve) as a trustee of the fund, is provided below.
Board Structure and Oversight Function. James C. Curvey is an interested person and currently serves as Chairman. The Trustees have determined that an interested Chairman is appropriate and benefits shareholders because an interested Chairman has a personal and professional stake in the quality and continuity of services provided to the fund. Independent Trustees exercise their informed business judgment to appoint an individual of their choosing to serve as Chairman, regardless of whether the Trustee happens to be independent or a member of management. The Independent Trustees have determined that they can act independently and effectively without having an Independent Trustee serve as Chairman and that a key structural component for assuring that they are in a position to do so is for the Independent Trustees to constitute a substantial majority for the Board. The Independent Trustees also regularly meet in executive session. Ned C. Lautenbach serves as Chairman of the Independent Trustees and as such (i) acts as a liaison between the Independent Trustees and management with respect to matters important to the Independent Trustees and (ii) with management prepares agendas for Board meetings.
Fidelity® funds are overseen by different Boards of Trustees. The fund's Board oversees Fidelity's high income and certain equity funds, and other Boards oversee Fidelity's investment-grade bond, money market, asset allocation, and sector funds. The asset allocation funds may invest in Fidelity® funds overseen by the fund's Board. The use of separate Boards, each with its own committee structure, allows the Trustees of each group of Fidelity® funds to focus on the unique issues of the funds they oversee, including common research, investment, and operational issues. On occasion, the separate Boards establish joint committees to address issues of overlapping consequences for the Fidelity® funds overseen by each Board.
The Trustees operate using a system of committees to facilitate the timely and efficient consideration of all matters of importance to the Trustees, the fund, and fund shareholders and to facilitate compliance with legal and regulatory requirements and oversight of the fund's activities and associated risks. The Board, acting through its committees, has charged FMR and its affiliates with (i) identifying events or circumstances the occurrence of which could have demonstrably adverse effects on the fund's business and/or reputation; (ii) implementing processes and controls to lessen the possibility that such events or circumstances occur or to mitigate the effects of such events or circumstances if they do occur; and (iii) creating and maintaining a system designed to evaluate continuously business and market conditions in order to facilitate the identification and implementation processes described in (i) and (ii) above. Because the day-to-day operations and activities of the fund are carried out by or through FMR, its affiliates, and other service providers, the fund's exposure to risks is mitigated but not eliminated by the processes overseen by the Trustees. While each of the Board's committees has responsibility for overseeing different aspects of the fund's activities, oversight is exercised primarily through the Operations, Audit, and Compliance Committees. In addition, the Independent Trustees have worked with FMR to enhance the Board's oversight of investment and financial risks, legal and regulatory risks, technology risks, and operational risks, including the development of additional risk reporting to the Board. For example, a working group comprised of Independent Trustees and FMR has worked and continues to work to review the Fidelity® funds' valuation-related activities, reporting and risk management. Appropriate personnel, including but not limited to the fund's Chief Compliance Officer (CCO), FMR's internal auditor, the independent accountants, the fund's Treasurer and portfolio management personnel, make periodic reports to the Board's committees, as appropriate, including an annual review of Fidelity's risk management program for the Fidelity® funds. The responsibilities of each standing committee, including their oversight responsibilities, are described further under "Standing Committees of the Trustees."
Interested Trustees*:
Correspondence intended for a Trustee who is an interested person may be sent to Fidelity Investments, 245 Summer Street, Boston, Massachusetts 02210.
Name, Year of Birth; Principal Occupations and Other Relevant Experience+
James C. Curvey (1935)
Year of Election or Appointment: 2007
Trustee
Chairman of the Board of Trustees
Mr. Curvey also serves as Trustee of other Fidelity® funds. Mr. Curvey is a Director of Fidelity Research & Analysis Co. (investment adviser firm, 2009-present), and Vice Chairman (2007-present) and Director of FMR LLC (diversified financial services company). In addition, Mr. Curvey serves as an Overseer for the Boston Symphony Orchestra and a member of the board of Artis-Naples, Naples, Florida, and as a Trustee for Brewster Academy, Wolfeboro, New Hampshire. Previously, Mr. Curvey served as a Director of Fidelity Investments Money Management, Inc. (investment adviser firm, 2009-2014) and a Director of FMR and FMR Co., Inc. (investment adviser firms, 2007-2014).
Charles S. Morrison (1960)
Year of Election or Appointment: 2014
Trustee
Mr. Morrison also serves as Trustee of other funds. He serves as a Director of Fidelity Investments Money Management, Inc. (FIMM) (investment adviser firm, 2014-present), Director of Fidelity SelectCo, LLC (investment adviser firm, 2014-present), President, Asset Management (2014-present), and is an employee of Fidelity Investments. Previously, Mr. Morrison served as Vice President of Fidelity's Fixed Income and Asset Allocation Funds (2012-2014), President, Fixed Income (2011-2014), Vice President of Fidelity's Money Market Funds (2005-2009), President, Money Market Group Leader of FMR (investment adviser firm, 2009), and Senior Vice President, Money Market Group of FMR (2004-2009). Mr. Morrison also served as Vice President of Fidelity's Bond Funds (2002-2005), certain Balanced Funds (2002-2005), and certain Asset Allocation Funds (2002-2007), and as Senior Vice President (2002-2005) of Fidelity's Bond Division.
* Determined to be an “Interested Trustee” by virtue of, among other things, his or her affiliation with the trust or various entities under common control with FMR.
+ The information includes the Trustee's principal occupation during the last five years and other information relating to the experience, attributes, and skills relevant to the Trustee's qualifications to serve as a Trustee, which led to the conclusion that the Trustee should serve as a Trustee for the fund.
Independent Trustees:
Correspondence intended for an Independent Trustee may be sent to Fidelity Investments, P.O. Box 55235, Boston, Massachusetts 02205-5235.
Name, Year of Birth; Principal Occupations and Other Relevant Experience+
Dennis J. Dirks (1948)
Year of Election or Appointment: 2005
Trustee
Mr. Dirks also serves as Trustee of other Fidelity® funds. Prior to his retirement in May 2003, Mr. Dirks was Chief Operating Officer and a member of the Board of The Depository Trust & Clearing Corporation (DTCC). He also served as President, Chief Operating Officer, and Board member of The Depository Trust Company (DTC) and President and Board member of the National Securities Clearing Corporation (NSCC). In addition, Mr. Dirks served as Chief Executive Officer and Board member of the Government Securities Clearing Corporation, Chief Executive Officer and Board member of the Mortgage-Backed Securities Clearing Corporation, as a Trustee and a member of the Finance Committee of Manhattan College (2005-2008), as a Trustee and a member of the Finance Committee of AHRC of Nassau County (2006-2008), and as a member of the Independent Directors Council (IDC) Governing Council (2010-2015). Mr. Dirks is a member of the Board of Directors for The Brookville Center for Children's Services, Inc. (2009-present).
Alan J. Lacy (1953)
Year of Election or Appointment: 2008
Trustee
Mr. Lacy also serves as Trustee of other Fidelity® funds. Mr. Lacy serves as a member of the Board of Directors of Dave & Buster's Entertainment, Inc. (restaurant and entertainment complexes, 2010-present) and Bristol-Myers Squibb Company (global pharmaceuticals, 2008-present). In addition, Mr. Lacy served as Senior Adviser (2007-2014) of Oak Hill Capital Partners, L.P. (private equity) and also served as Chief Executive Officer (2000-2005) and Vice Chairman (2005-2006) of Sears Holdings Corporation and Sears, Roebuck and Co. (retail). Mr. Lacy is a member of the Board of Trustees of The National Parks Conservation Association (2006-present). Previously, Mr. Lacy served as Chairman of the Board of Trustees of the National Parks Conservation Association (2008-2011) and as a member of the Board of Directors for The Western Union Company (global money transfer, 2006-2011), The Hillman Companies, Inc. (hardware wholesalers, 2010-2014), and Earth Fare, Inc. (retail grocery, 2010-2014).
Ned C. Lautenbach (1944)
Year of Election or Appointment: 2000
Trustee
Chairman of the Independent Trustees
Mr. Lautenbach also serves as Trustee of other Fidelity® funds. Mr. Lautenbach currently serves as the Lead Director of the Eaton Corporation Board of Directors (diversified industrial, 1997-present). Mr. Lautenbach is Chairman of the Board of Directors of Artis-Naples in Naples, Florida (2012-present), a member of the Council on Foreign Relations (1994-present), and a member of the Board of Governors, State University System of Florida (2013-present). Previously, Mr. Lautenbach was a Partner/Advisory Partner at Clayton, Dubilier & Rice, LLC (private equity investment, 1998-2010), as well as a Director of Sony Corporation (2006-2007).
Joseph Mauriello (1944)
Year of Election or Appointment: 2008
Trustee
Mr. Mauriello also serves as Trustee of other Fidelity® funds. Prior to his retirement in January 2006, Mr. Mauriello served in numerous senior management positions including Deputy Chairman and Chief Operating Officer (2004-2005), and Vice Chairman of Financial Services (2002-2004) of KPMG LLP US (professional services, 1965-2005). Mr. Mauriello currently serves as a member of the Board of Directors of XL Group plc. (global insurance and re-insurance, 2006-present) and the Independent Directors Council (IDC) Governing Council (2015-present). Previously, Mr. Mauriello served as a Director of the Hamilton Funds of the Bank of New York (2006-2007) and of Arcadia Resources Inc. (health care services and products, 2007-2012).
Robert W. Selander (1950)
Year of Election or Appointment: 2011
Trustee
Mr. Selander also serves as Trustee of other Fidelity® funds. Mr. Selander serves as a Director of The Western Union Company (global money transfer, 2014-present). Previously, Mr. Selander served as a Member of the Advisory Board of other Fidelity® funds (2011), and Executive Vice Chairman (2010), Chief Executive Officer (2009-2010), and President and Chief Executive Officer (1997-2009) of Mastercard, Inc.
Cornelia M. Small (1944)
Year of Election or Appointment: 2005
Trustee
Ms. Small also serves as Trustee of other Fidelity® funds. Ms. Small is a member of the Board of Directors (2009-present) and Chair of the Investment Committee (2010-present) of the Teagle Foundation. Ms. Small also serves on the Investment Committee of the Berkshire Taconic Community Foundation (2008-present). Previously, Ms. Small served as Chairperson (2002-2008) and a member of the Investment Committee and Chairperson (2008-2012) and a member of the Board of Trustees of Smith College. In addition, Ms. Small served as Chief Investment Officer, Director of Global Equity Investments, and a member of the Board of Directors of Scudder, Stevens & Clark and Scudder Kemper Investments.
William S. Stavropoulos (1939)
Year of Election or Appointment: 2002
Trustee
Vice Chairman of the Independent Trustees
Mr. Stavropoulos also serves as Trustee of other Fidelity® funds. Mr. Stavropoulos serves as President and Founder of the Michigan Baseball Foundation, the Great Lakes Loons (2007-present). Mr. Stavropoulos is Chairman Emeritus of the Board of Directors of The Dow Chemical Company, where he previously served in numerous senior management positions, including President, CEO (1995-2000; 2002-2004), Chairman of the Executive Committee (2000-2006), and as a member of the Board of Directors (1990-2006). Currently, Mr. Stavropoulos is Chairman of the Board of Directors of Univar Inc. (global distributor of commodity and specialty chemicals), a Director of Teradata Corporation (data warehousing and technology solutions), and Maersk Inc. (industrial conglomerate), and a member of the Advisory Board for Metalmark Capital LLC (private equity investment, 2005-present). Mr. Stavropoulos is an operating advisor to Clayton, Dubilier & Rice, LLC (private equity investment). In addition, Mr. Stavropoulos is a member of the University of Notre Dame Advisory Council for the College of Science, a Trustee of the Rollin L. Gerstacker Foundation, and a Director of the Naples Philharmonic Center for the Arts. Previously, Mr. Stavropoulos served as a Director of Chemical Financial Corporation (bank holding company, 1993-2012) and Tyco International, Ltd. (multinational manufacturing and services, 2007-2012).
David M. Thomas (1949)
Year of Election or Appointment: 2008
Trustee
Mr. Thomas also serves as Trustee of other Fidelity® funds. Mr. Thomas serves as Non-Executive Chairman of the Board of Directors of Fortune Brands Home and Security (home and security products, 2011-present), as a member of the Board of Directors (2004-present) and Presiding Director (2013-present) of Interpublic Group of Companies, Inc. (marketing communication), and as a member of the Board of Trustees of the University of Florida (2013-present). Previously, Mr. Thomas served as Executive Chairman (2005-2006) and Chairman and Chief Executive Officer (2000-2005) of IMS Health, Inc. (pharmaceutical and healthcare information solutions), and a Director of Fortune Brands, Inc. (consumer products, 2000-2011).
+ The information includes the Trustee's principal occupation during the last five years and other information relating to the experience, attributes, and skills relevant to the Trustee's qualifications to serve as a Trustee, which led to the conclusion that the Trustee should serve as a Trustee for the fund.
Advisory Board Members and Officers:
Correspondence intended for an officer or Peter S. Lynch may be sent to Fidelity Investments, 245 Summer Street, Boston, Massachusetts 02210. Officers appear below in alphabetical order.
Name, Year of Birth; Principal Occupation
Peter S. Lynch (1944)
Year of Election or Appointment: 2003
Member of the Advisory Board
Mr. Lynch also serves as Member of the Advisory Board of other Fidelity® funds. Mr. Lynch is Vice Chairman and a Director of FMR (investment adviser firm) and FMR Co., Inc. (investment adviser firm). In addition, Mr. Lynch serves as a Trustee of Boston College and as the Chairman of the Inner-City Scholarship Fund. Previously, Mr. Lynch served on the Special Olympics International Board of Directors (1997-2006).
Elizabeth Paige Baumann (1968)
Year of Election or Appointment: 2012
Anti-Money Laundering (AML) Officer
Ms. Baumann also serves as AML Officer of other funds. She is Chief AML Officer of FMR LLC (diversified financial services company, 2012-present) and is an employee of Fidelity Investments. Previously, Ms. Baumann served as Vice President and Deputy Anti-Money Laundering Officer (2007-2012).
Marc R. Bryant (1966)
Year of Election or Appointment: 2015
Secretary and Chief Legal Officer (CLO)
Mr. Bryant also serves as Secretary and CLO of other funds. Mr. Bryant serves as CLO, Secretary, and Senior Vice President of Fidelity Management & Research Company (investment adviser firm, 2015-present) and FMR Co., Inc. (investment adviser firm, 2015-present); Secretary of Fidelity SelectCo, LLC (investment adviser firm, 2015-present) and Fidelity Investments Money Management, Inc. (investment adviser firm, 2015-present); and CLO of Fidelity Management & Research (Hong Kong) Limited (investment adviser firm, 2015-present). He is Senior Vice President and Deputy General Counsel of FMR LLC (diversified financial services company). Previously, Mr. Bryant served as Secretary and Chief Legal Officer of Fidelity Rutland Square Trust II (2010-2014) and Assistant Secretary of Fidelity's Fixed Income and Asset Allocation Funds (2013-2015). Prior to joining Fidelity Investments, Mr. Bryant served as a Senior Vice President and the Head of Global Retail Legal for AllianceBernstein L.P. (2006-2010), and as the General Counsel for ProFund Advisors LLC (2001-2006).
William C. Coffey (1969)
Year of Election or Appointment: 2009
Assistant Secretary
Mr. Coffey also serves as Assistant Secretary of other funds. He is Senior Vice President and Deputy General Counsel of FMR LLC (diversified financial services company, 2010-present), and is an employee of Fidelity Investments. Previously, Mr. Coffey served as Vice President and Associate General Counsel of FMR LLC (2005-2009).
Jonathan Davis (1968)
Year of Election or Appointment: 2010
Assistant Treasurer
Mr. Davis also serves as Assistant Treasurer of other funds, and is an employee of Fidelity Investments. Previously, Mr. Davis served as Vice President and Associate General Counsel of FMR LLC (diversified financial services company, 2003-2010).
Adrien E. Deberghes (1967)
Year of Election or Appointment: 2008
Deputy Treasurer
Mr. Deberghes also serves as an officer of other funds. He is an employee of Fidelity Investments (2008-present). Prior to joining Fidelity Investments, Mr. Deberghes was Senior Vice President of Mutual Fund Administration at State Street Corporation (2007-2008), Senior Director of Mutual Fund Administration at Investors Bank & Trust (2005-2007), and Director of Finance for Dunkin' Brands (2000-2005).
Stephanie J. Dorsey (1969)
Year of Election or Appointment: 2010
Assistant Treasurer
Ms. Dorsey also serves as an officer of other funds. She is an employee of Fidelity Investments (2008-present) and has served in other fund officer roles. Prior to joining Fidelity Investments, Ms. Dorsey served as Treasurer (2004-2008) of the JPMorgan Mutual Funds and Vice President (2004-2008) of JPMorgan Chase Bank.
Howard J. Galligan III (1966)
Year of Election or Appointment: 2014
Chief Financial Officer
Mr. Galligan also serves as Chief Financial Officer of other funds. Mr. Galligan serves as President of Fidelity Pricing and Cash Management Services (FPCMS) (2014-present) and as a Director of Strategic Advisers, Inc. (investment adviser firm, 2008-present). Previously, Mr. Galligan served as Chief Administrative Officer of Asset Management (2011-2014) and Chief Operating Officer and Senior Vice President of Investment Support for Strategic Advisers, Inc. (2003-2011).
Scott C. Goebel (1968)
Year of Election or Appointment: 2015
Vice President
Mr. Goebel serves as Vice President of other funds and is an employee of Fidelity Investments (2001-present). Previously, Mr. Goebel served as Secretary of Fidelity SelectCo, LLC (investment adviser firm, 2013-2015), Fidelity Investments Money Management, Inc. (FIMM) (investment adviser firm, 2010-2015), and Fidelity Research and Analysis Company (FRAC) (investment adviser firm, 2010-2015); General Counsel, Secretary, and Senior Vice President of Fidelity Management & Research Company (investment adviser firm, 2008-2015) and FMR Co., Inc. (investment adviser firm, 2008-2015); Assistant Secretary of Fidelity Management & Research (Japan) Limited (investment adviser firm, 2008-2015) and FMR Investment Management (U.K.) Limited (investment adviser firm, 2008-2015); Chief Legal Officer (CLO) of Fidelity Management & Research (Hong Kong) Limited (investment adviser firm, 2008-2015); Secretary and CLO of certain Fidelity® funds (2008-2015); Assistant Secretary of FIMM (2008-2010), FRAC (2008-2010), and certain funds (2007-2008); and as Vice President and Secretary of Fidelity Distributors Corporation (FDC) (2005-2007).
Thomas C. Hense (1964)
Year of Election or Appointment: 2008, 2010, or 2015
Vice President
Mr. Hense serves as Vice President of Fidelity Advisor® Multi-Asset Income Fund (2015) and other funds (High Income (2008), Small Cap (2008), and Value (2010) funds), and is an employee of Fidelity Investments (1993-present). Previously, Mr. Hense served as a portfolio manager for Fidelity's Institutional Money Management Group (Pyramis) (2003-2008).
Brian B. Hogan (1964)
Year of Election or Appointment: 2009
Vice President
Mr. Hogan also serves as Trustee or Vice President of other funds. Mr. Hogan serves as a Director of Fidelity SelectCo, LLC (investment adviser firm, 2014-present) and President of the Equity Division of FMR (investment adviser firm, 2009-present). Previously, Mr. Hogan served as Senior Vice President, Equity Research of FMR (2006-2009) and as a portfolio manager.
Chris Maher (1972)
Year of Election or Appointment: 2013
Assistant Treasurer
Mr. Maher serves as Assistant Treasurer of other funds. Mr. Maher is Vice President of Valuation Oversight and is an employee of Fidelity Investments. Previously, Mr. Maher served as Vice President of Asset Management Compliance (2013), Vice President of the Program Management Group of FMR (investment adviser firm, 2010-2013), and Vice President of Valuation Oversight (2008-2010).
Kenneth B. Robins (1969)
Year of Election or Appointment: 2008
President and Treasurer
Mr. Robins also serves as an officer of other funds. Mr. Robins serves as Executive Vice President of Fidelity Investments Money Management, Inc. (FIMM) (investment adviser firm, 2013-present) and is an employee of Fidelity Investments (2004-present). Previously, Mr. Robins served in other fund officer roles.
Stacie M. Smith (1974)
Year of Election or Appointment: 2013
Deputy Treasurer
Ms. Smith also serves as an officer of other funds. She is an employee of Fidelity Investments (2009-present) and has served in other fund officer roles. Prior to joining Fidelity Investments, Ms. Smith served as Senior Audit Manager of Ernst & Young LLP (1996-2009).
Renee Stagnone (1975)
Year of Election or Appointment: 2013
Deputy Treasurer
Ms. Stagnone also serves as Deputy Treasurer of other funds. Ms. Stagnone is an employee of Fidelity Investments (1997-present).
Linda J. Wondrack (1964)
Year of Election or Appointment: 2014
Chief Compliance Officer
Ms. Wondrack also serves as Chief Compliance Officer of other funds. Ms. Wondrack is Executive Vice President and head of the Ethics Office and Asset Management Compliance for Fidelity Investments (2012-present). Ms. Wondrack also serves as Chief Compliance Officer of Fidelity SelectCo, LLC (investment adviser firm, 2014-present); Chief Compliance Officer of Impresa Management LLC (2013-present); and Chief Compliance Officer of FMR Co., Inc. (investment adviser firm), Fidelity Investments Money Management, Inc. (investment adviser firm), Fidelity Management & Research (Japan) Limited (investment adviser firm), FMR Investment Management (U.K.) Limited (investment adviser firm), Fidelity Management & Research (Hong Kong) (investment adviser firm), Fidelity Management & Research Company (investment adviser firm), FIAM LLC (investment adviser firm), and Strategic Advisers, Inc. (investment adviser firm), Ballyrock Investment Advisors LLC, and Northern Neck Investors LLC (2012-present). Previously, Ms. Wondrack served as Senior Vice President and Chief Compliance Officer for Columbia Management Investment Advisers, LLC (2005-2012); Chief Compliance Officer for certain funds within the Columbia Family of Funds (2007-2012); and Senior Vice President of Compliance Risk Management at Bank of America (2005-2010).
Joseph F. Zambello (1957)
Year of Election or Appointment: 2011
Deputy Treasurer
Mr. Zambello also serves as Deputy Treasurer of other funds. Mr. Zambello is an employee of Fidelity Investments (1991-present). Previously, Mr. Zambello served as Vice President of the Program Management Group of FMR (investment adviser firm, 2009-2011) and Vice President of the Transfer Agent Oversight Group (2005-2009).
Shareholder Expense Example
As a shareholder of the Fund, you incur two types of costs: (1) transaction costs, including sales charges (loads) on purchase payments or redemption proceeds, redemption fees and (2) ongoing costs, including management fees, distribution and/or service (12b-1) fees and other Fund expenses. This Example is intended to help you understand your ongoing costs (in dollars) of investing in the Fund and to compare these costs with the ongoing costs of investing in other mutual funds.
The Example is based on an investment of $1,000 invested at the beginning of the period and held for the entire period (May 1, 2015 to October 31, 2015).
Actual Expenses
The first line of the accompanying table for each class of the Fund provides information about actual account values and actual expenses. You may use the information in this line, together with the amount you invested, to estimate the expenses that you paid over the period. Simply divide your account value by $1,000.00 (for example, an $8,600 account value divided by $1,000.00 = 8.6), then multiply the result by the number in the first line for a class of the Fund under the heading entitled "Expenses Paid During Period" to estimate the expenses you paid on your account during this period. A small balance maintenance fee of $12.00 that is charged once a year may apply for certain accounts with a value of less than $2,000. This fee is not included in the table below. If it was, the estimate of expenses you paid during the period would be higher, and your ending account value lower, by this amount. In addition, the Fund, as a shareholder in the underlying Fidelity Central Funds, will indirectly bear its pro-rata share of the fees and expenses incurred by the underlying Fidelity Central Funds. These fees and expenses are not included in the Fund's annualized expense ratio used to calculate the expense estimate in the table below.
Hypothetical Example for Comparison Purposes
The second line of the accompanying table for each class of the Fund provides information about hypothetical account values and hypothetical expenses based on a Class' actual expense ratio and an assumed rate of return of 5% per year before expenses, which is not the Class' actual return. The hypothetical account values and expenses may not be used to estimate the actual ending account balance or expenses you paid for the period. You may use this information to compare the ongoing costs of investing in the Fund and other funds. To do so, compare this 5% hypothetical example with the 5% hypothetical examples that appear in the shareholder reports of the other funds. A small balance maintenance fee of $12.00 that is charged once a year may apply for certain accounts with a value of less than $2,000. This fee is not included in the table below. If it was, the estimate of expenses you paid during the period would be higher, and your ending account value lower, by this amount. In addition, the Fund, as a shareholder in the underlying Fidelity Central Funds, will indirectly bear its pro-rata share of the fees and expenses incurred by the underlying Fidelity Central Funds. These fees and expenses are not included in the Fund's annualized expense ratio used to calculate the expense estimate in the table below.
Please note that the expenses shown in the table are meant to highlight your ongoing costs only and do not reflect any transaction costs. Therefore, the second line of the table is useful in comparing ongoing costs only, and will not help you determine the relative total costs of owning different funds. In addition, if these transactional costs were included, your costs would have been higher.
| Annualized Expense Ratio-A | Beginning Account Value May 1, 2015 | Ending Account Value October 31, 2015 | Expenses Paid During Period-B May 1, 2015 to October 31, 2015 | |
| Class A | 1.05% | |||
| Actual | $1,000.00 | $971.00 | $5.22 | |
| Hypothetical-C | $1,000.00 | $1,019.91 | $5.35 | |
| Class T | 1.40% | |||
| Actual | $1,000.00 | $969.70 | $6.95 | |
| Hypothetical-C | $1,000.00 | $1,018.15 | $7.12 | |
| Class B | 1.90% | |||
| Actual | $1,000.00 | $967.20 | $9.42 | |
| Hypothetical-C | $1,000.00 | $1,015.63 | $9.65 | |
| Class C | 1.89% | |||
| Actual | $1,000.00 | $967.00 | $9.37 | |
| Hypothetical-C | $1,000.00 | $1,015.68 | $9.60 | |
| Stock Selector Small Cap | .83% | |||
| Actual | $1,000.00 | $971.90 | $4.13 | |
| Hypothetical-C | $1,000.00 | $1,021.02 | $4.23 | |
| Class I | .78% | |||
| Actual | $1,000.00 | $972.70 | $3.88 | |
| Hypothetical-C | $1,000.00 | $1,021.27 | $3.97 |
A Annualized expense ratio reflects expenses net of applicable fee waivers.
B Expenses are equal to each Class' annualized expense ratio, multiplied by the average account value over the period, multiplied by 184/365 (to reflect the one-half year period).
C 5% return per year before expenses
Distributions (Unaudited)
The Board of Trustees of Fidelity Stock Selector Small Cap Fund voted to pay to shareholders of record at the opening of business on record date, the following distributions per share derived from capital gains realized from sales of portfolio securities, and dividends derived from net investment income:
| Pay Date | Record Date | Dividends | Capital Gains | |
| Class A | 12/07/15 | 12/04/15 | $0.054 | $1.520 |
| Class T | 12/07/15 | 12/04/15 | $0.000 | $1.520 |
| Class B | 12/07/15 | 12/04/15 | $0.000 | $1.520 |
| Class C | 12/07/15 | 12/04/15 | $0.000 | $1.520 |
The fund hereby designates as a capital gain dividend with respect to the taxable year ended October 31, 2015 $99,563,019, or, if subsequently determined to be different, the net capital gain of such year.
Class A designates 62%, Class T designates 79%, Class B designates 100%, and Class C designates 100% of the of each dividends distributed during the fiscal year as qualifying for the dividends-received deduction for corporate shareholders.
Class A designates 75%, Class T designates 95%, Class B designates 100%, and Class C designates 100% of the of each dividends distributed during the fiscal year as amounts which may be taken into account as a dividend for purposes of the maximum rate under section 1(h)(11) of the Internal Revenue Code.
The fund will notify shareholders in January 2016 of amounts for use in preparing 2015 income tax returns.
Board Approval of Investment Advisory Contracts and Management Fees
Fidelity Stock Selector Small Cap Fund
Each year, the Board of Trustees, including the Independent Trustees (together, the Board), votes on the renewal of the management contract with Fidelity Management & Research Company (FMR) and the sub-advisory agreements (together, the Advisory Contracts) for the fund. The Board, assisted by the advice of fund counsel and Independent Trustees' counsel, requests and considers a broad range of information relevant to the renewal of the Advisory Contracts throughout the year.
The Board meets regularly and, at each of its meetings, covers an extensive agenda of topics and materials and considers factors that are relevant to its annual consideration of the renewal of the fund's Advisory Contracts, including the services and support provided to the fund and its shareholders. The Board has established various standing committees (Committees), each composed of and chaired by Independent Trustees with varying backgrounds, to which the Board has assigned specific subject matter responsibilities in order to enhance effective decision-making by the Board. The Board, acting directly and through its Committees, requests and receives information concerning the annual consideration of the renewal of the fund's Advisory Contracts. The Board also meets as needed to consider matters specifically related to the Board's annual consideration of the renewal of the Advisory Contracts. Members of the Board may also meet with trustees of other Fidelity funds through ad hoc joint committees to discuss certain matters relevant to all of the Fidelity funds.
At its July 2015 meeting, the Board unanimously determined to renew the fund's Advisory Contracts. In reaching its determination, the Board considered all factors it believed relevant, including (i) the nature, extent, and quality of the services to be provided to the fund and its shareholders (including the investment performance of the fund); (ii) the competitiveness of the fund's management fee and total expense ratio relative to peer funds; (iii) the total costs of the services to be provided by and the profits to be realized by Fidelity from its relationship with the fund; and (iv) the extent to which (if any) economies of scale exist and would be realized as the fund grows, and whether any economies of scale are appropriately shared with fund shareholders.
In considering whether to renew the Advisory Contracts for the fund, the Board reached a determination, with the assistance of fund counsel and Independent Trustees' counsel and through the exercise of its business judgment, that the renewal of the Advisory Contracts was in the best interests of the fund and its shareholders and that the compensation payable under the Advisory Contracts was fair and reasonable. The Board's decision to renew the Advisory Contracts was not based on any single factor, but rather was based on a comprehensive consideration of all the information provided to the Board at its meetings throughout the year. The Board, in reaching its determination to renew the Advisory Contracts, was aware that shareholders of the fund have a broad range of investment choices available to them, including a wide choice among funds offered by Fidelity's competitors, and that the fund's shareholders, who have the opportunity to review and weigh the disclosure provided by the fund in its prospectus and other public disclosures, have chosen to invest in this fund, which is part of the Fidelity family of funds.
Nature, Extent, and Quality of Services Provided. The Board considered Fidelity's staffing as it relates to the fund, including the backgrounds of investment personnel of Fidelity, and also considered the fund's investment objective, strategies, and related investment philosophy. The Independent Trustees also had discussions with senior management of Fidelity's investment operations and investment groups. The Board considered the structure of the portfolio manager compensation program and whether this structure provides appropriate incentives to act in the best interests of the fund. Additionally, the Board considered the portfolio managers' investments, if any, in the funds that they manage.Resources Dedicated to Investment Management and Support Services. The Board and the Fund Oversight and Research Committees reviewed the general qualifications and capabilities of Fidelity's investment staff, including its size, education, experience, and resources, as well as Fidelity's approach to recruiting, training, managing, and compensating investment personnel. The Board noted that Fidelity has continued to increase the resources devoted to non-U.S. offices, including expansion of Fidelity's global investment organization. The Board also noted that Fidelity's analysts have extensive resources, tools and capabilities that allow them to conduct sophisticated quantitative and fundamental analysis, as well as credit analysis of issuers, counterparties and guarantors. Further, the Board considered that Fidelity's investment professionals have sufficient access to global information and data so as to provide competitive investment results over time, and that those professionals also have access to sophisticated tools that permit them to assess portfolio construction and risk and performance attribution characteristics continuously, as well as to transmit new information and research conclusions rapidly around the world. Additionally, in its deliberations, the Board considered Fidelity's trading, risk management, and compliance capabilities and resources, which are integral parts of the investment management process.Shareholder and Administrative Services. The Board considered (i) the nature, extent, quality, and cost of advisory, administrative, and shareholder services performed by FMR, the sub-advisers (together with FMR, the Investment Advisers), and their affiliates under the Advisory Contracts and under separate agreements covering transfer agency, pricing and bookkeeping, and securities lending services for the fund; (ii) the nature and extent of the supervision of third party service providers, principally custodians and subcustodians; and (iii) the resources devoted to, and the record of compliance with, the fund's compliance policies and procedures. The Board also reviewed the allocation of fund brokerage, including allocations to brokers affiliated with the Investment Advisers, the use of brokerage commissions to pay fund expenses, and the use of "soft" commission dollars to pay for research services.The Board noted that the growth of fund assets over time across the complex allows Fidelity to reinvest in the development of services designed to enhance the value or convenience of the Fidelity funds as investment vehicles. These services include 24-hour access to account information and market information through telephone representatives and over the Internet, investor education materials and asset allocation tools, and the expanded availability of Fidelity Investor Centers.In 2014, the Board formed an ad hoc Committee on Transfer Agency Fees to review the variety of transfer agency fee structures throughout the industry and Fidelity's competitive positioning with respect to industry participants.Investment in a Large Fund Family. The Board considered the benefits to shareholders of investing in a Fidelity fund, including the benefits of investing in a fund that is part of a large family of funds offering a variety of investment disciplines and providing a large variety of mutual fund investor services. The Board noted that Fidelity had taken, or had made recommendations that resulted in the Fidelity funds taking, a number of actions over the previous year that benefited particular funds, including (i) continuing to dedicate additional resources to investment research and to the support of the senior management team that oversees asset management; (ii) continuing efforts to enhance Fidelity's global research capabilities; (iii) launching new funds and making other enhancements to meet client needs; (iv) reducing management fees and total expenses for certain index funds and diversified international funds; (v) continuing to launch dedicated lower cost underlying funds to meet portfolio construction needs related to expanding underlying fund options for Fidelity funds of funds, specifically for the Freedom Fund product lines; (vi) rationalizing product lines and gaining increased efficiencies through fund mergers; (vii) launching active fixed-income exchange-traded funds; (viii) continuing to develop, acquire and implement systems and technology to improve services to the funds and information security and to increase efficiency; (ix) implementing investment enhancements to further strengthen Fidelity's target date product line to increase investors' probability of success in achieving their goals; (x) modifying the eligibility criteria for certain share classes to accommodate roll-over assets from employer-sponsored retirement plans; (xi) launching a new Class W of the Freedom Index Funds to attract and retain Fidelity record-kept retirement plan assets; and (xii) implementing changes to Fidelity's money market product line in response to recent money market regulatory reforms.Investment Performance. The Board considered whether the fund has operated in accordance with its investment objective, as well as its record of compliance with its investment restrictions and its performance history. The Board noted that there were portfolio management changes for the fund in January 2013, April 2013, October 2013, and September 2014.The Board took into account discussions with representatives of the Investment Advisers about fund investment performance that occur at Board meetings throughout the year. In this regard the Board noted that as part of regularly scheduled fund reviews and other reports to the Board on fund performance, the Board considers annualized return information for the fund, for different time periods, measured against a securities market index ("benchmark index") and a peer group of funds with similar objectives ("peer group"), if any. In its evaluation of fund investment performance, the Board gave particular attention to information indicating changes in performance of certain Fidelity funds for specific time periods and discussed with the Investment Advisers the reasons for any overperformance or underperformance.In addition to reviewing absolute and relative fund performance, the Independent Trustees periodically consider the appropriateness of fund performance metrics in evaluating the results achieved. In general, the Independent Trustees believe that fund performance should be evaluated based on net performance (after fees and expenses) of both the highest performing and lowest performing fund share classes, where applicable, compared to appropriate benchmark indices, over appropriate time periods that may include full market cycles, and compared to peer groups, as applicable, over the same periods, taking into account relevant factors including the following: general market conditions; issuer-specific information; and fund cash flows and other factors.The Independent Trustees recognize that shareholders evaluate performance on a net basis over their own holding periods, for which one-, three-, and five-year periods are often used as a proxy. For this reason, the performance information reviewed by the Board also included net cumulative calendar year total return information for the fund and an appropriate benchmark index and peer group for the most recent one-, three-, and five-year periods, as shown below. Returns are shown compared to the 25th percentile (top of box, 75% beaten) and 75th percentile (bottom of box, 25% beaten) of the peer universe.Fidelity Stock Selector Small Cap Fund
Fidelity Stock Selector Small Cap Fund
![]()
ASCS-ANN-1215
1.843151.108
Fidelity® Value Fund Class K Annual Report October 31, 2015 |
|
Contents
Board Approval of Investment Advisory Contracts and Management Fees |
To view a fund's proxy voting guidelines and proxy voting record for the 12-month period ended June 30, visit http://www.fidelity.com/proxyvotingresults or visit the Securities and Exchange Commission's (SEC) web site at http://www.sec.gov.
You may also call 1-800-835-5092 to request a free copy of the proxy voting guidelines.
Standard & Poor's, S&P and S&P 500 are registered service marks of The McGraw-Hill Companies, Inc. and have been licensed for use by Fidelity Distributors Corporation.
Other third-party marks appearing herein are the property of their respective owners.
All other marks appearing herein are registered or unregistered trademarks or service marks of FMR LLC or an affiliated company. © 2015 FMR LLC. All rights reserved.
This report and the financial statements contained herein are submitted for the general information of the shareholders of the Fund. This report is not authorized for distribution to prospective investors in the Fund unless preceded or accompanied by an effective prospectus.
A fund files its complete schedule of portfolio holdings with the SEC for the first and third quarters of each fiscal year on Form N-Q. Forms N-Q are available on the SEC’s web site at http://www.sec.gov. A fund's Forms N-Q may be reviewed and copied at the SEC’s Public Reference Room in Washington, DC. Information regarding the operation of the SEC's Public Reference Room may be obtained by calling 1-800-SEC-0330.
For a complete list of a fund's portfolio holdings, view the most recent holdings listing, semiannual report, or annual report on Fidelity's web site at http://www.fidelity.com, http://www.advisor.fidelity.com, or http://www.401k.com, as applicable.
NOT FDIC INSURED •MAY LOSE VALUE •NO BANK GUARANTEE
Neither the Fund nor Fidelity Distributors Corporation is a bank.
Performance: The Bottom Line
Average annual total return reflects the change in the value of an investment, assuming reinvestment of distributions from dividend income and capital gains (the profits earned upon the sale of securities that have grown in value, if any) and assuming a constant rate of performance each year.
The hypothetical investment and the average annual total returns do not reflect the deduction of taxes that a shareholder would pay on fund distributions or the redemption of fund shares.
During periods of reimbursement by Fidelity, a fund’s total return will be greater than it would be had the reimbursement not occurred.
How a fund did yesterday is no guarantee of how it will do tomorrow.
Average Annual Total Returns
| For the periods ended October 31, 2015 | Past 1 year | Past 5 years | Past 10 years |
| Class K | 0.24% | 13.23% | 7.47% |
The initial offering of Class K shares took place on May 9, 2008. Returns prior to May 9, 2008 are those of Fidelity® Value Fund, the original class of the fund.
$10,000 Over 10 Years
Let's say hypothetically that $10,000 was invested in Fidelity® Value Fund - Class K on October 31, 2005.
The chart shows how the value of your investment would have changed, and also shows how the Russell Midcap® Value Index performed over the same period.
See above for additional information regarding the performance of Class K.
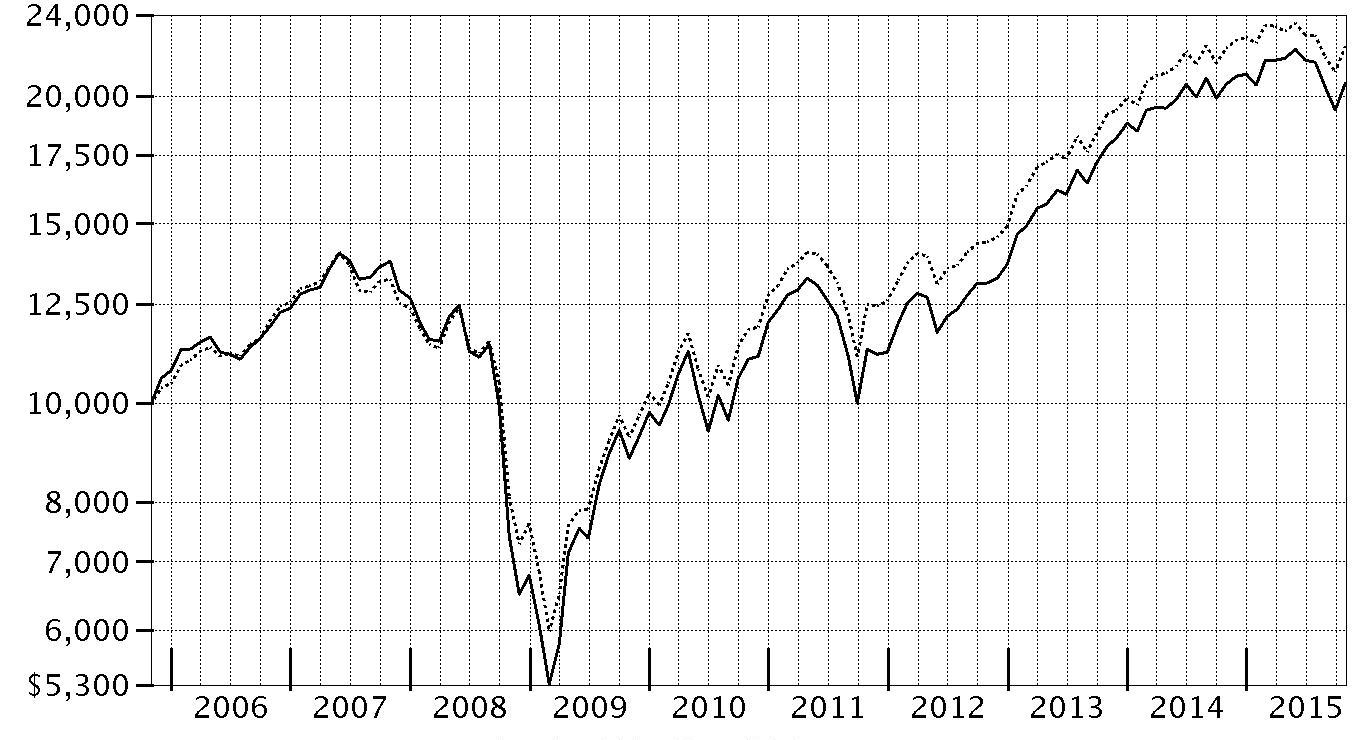
| Period Ending Values | ||
| $20,562 | Fidelity® Value Fund - Class K | |
| $22,388 | Russell Midcap® Value Index | |
Management's Discussion of Fund Performance
Market Recap: U.S. stocks gained moderately for the 12 months ending October 31, 2015, helped by a strong October that largely erased a steep decline in August and September on concern about slowing global economic growth emanating from China. Stocks benefited late in the period amid waning expectations for a near-term interest-rate hike by the U.S. Federal Reserve, additional economic stimulus in Europe and an interest-rate cut in China. The large-cap S&P 500® index advanced 5.20% for the period, with growth stocks in the index significantly outpacing value stocks, as investors continued to seek growth in a subpar economic environment. The growth-oriented Nasdaq Composite Index® also benefited, gaining 10.39%, while the small-cap Russell 2000® Index lost its edge, returning only 0.34%, as risk appetites waned. Among sectors in the widely followed S&P 500®, consumer discretionary (+21%) led the way, benefiting from a combination of rising personal income and still-benign inflation. Technology (+11%) and consumer staples (+9%) also outpaced the index. Conversely, energy (-19%) performed worst, in an environment of depressed commodity prices that also hit materials (-4%). At period end, investors remained focused on the potential global implications of a relatively stronger U.S. dollar and how China’s transition toward a consumption-led economy may affect corporate earnings.Comments from Co-Portfolio Manager Matthew Friedman: For the year, fund’s shares classes turned in modest gains, slightly underperforming the 0.47% result of the benchmark Russell Midcap® Value Index. Security selection contributed to performance versus the benchmark, but unsuccessful industry positioning partially offset that positive. In particular, weak picks among financials hurt, as did positioning in the equipment & services segment of the health care sector. Among individual stocks, the fund's non-index investment in SunCoke Energy hurt most. SunCoke is an independent producer of coke, which is used in the blast furnace production of steel. The stock underperformed due to customer concentration in other steel companies, such as AK Steel and U.S. Steel, which were hurt by lower steel prices in China – the world's largest producer. Turning to positives, the fund’s foreign investments helped despite the headwind of a rising dollar. Picks within tech and industrials were beneficial. From the tech sector, our investment in Freescale Semiconductor was the fund’s largest individual contributor. The stock popped in January after the maker of network processors and micro-controllers reported earnings that were much higher than expected, and then again in February on reports of a possible sale of the company. Shares ratcheted up yet again in early March after Netherlands-based NXP Semiconductors offered to purchase Freescale at a premium.The views expressed above reflect those of the portfolio manager(s) only through the end of the period as stated on the cover of this report and do not necessarily represent the views of Fidelity or any other person in the Fidelity organization. Any such views are subject to change at any time based upon market or other conditions and Fidelity disclaims any responsibility to update such views. These views may not be relied on as investment advice and, because investment decisions for a Fidelity fund are based on numerous factors, may not be relied on as an indication of trading intent on behalf of any Fidelity fund.
Investment Summary (Unaudited)
Top Ten Stocks as of October 31, 2015
| % of fund's net assets | % of fund's net assets 6 months ago | |
| Sempra Energy | 1.8 | 1.5 |
| Edison International | 1.7 | 1.4 |
| Berkshire Hathaway, Inc. Class B | 1.1 | 0.9 |
| ACE Ltd. | 1.1 | 0.5 |
| Capital One Financial Corp. | 1.1 | 1.1 |
| AECOM Technology Corp. | 1.0 | 1.2 |
| ITC Holdings Corp. | 1.0 | 0.9 |
| WestRock Co. | 1.0 | 1.0 |
| Symantec Corp. | 0.9 | 0.5 |
| U.S. Bancorp | 0.9 | 0.8 |
| 11.6 |
Top Five Market Sectors as of October 31, 2015
| % of fund's net assets | % of fund's net assets 6 months ago | |
| Financials | 30.0 | 29.6 |
| Industrials | 12.8 | 11.6 |
| Information Technology | 11.2 | 12.1 |
| Consumer Discretionary | 10.8 | 12.1 |
| Utilities | 9.3 | 9.5 |
Asset Allocation (% of fund's net assets)
| As of October 31, 2015 * | ||
| Stocks and Equity Futures | 98.4% | |
| Bonds | 0.1% | |
| Other Investments | 0.1% | |
| Short-Term Investments and Net Other Assets (Liabilities) | 1.4% | |

* Foreign investments - 18.1%
| As of April 30, 2015* | ||
| Stocks | 97.9% | |
| Bonds | 0.1% | |
| Other Investments | 0.1% | |
| Short-Term Investments and Net Other Assets (Liabilities) | 1.9% | |

* Foreign investments - 18.5%
Investments October 31, 2015
Showing Percentage of Net Assets
| Common Stocks - 98.2% | |||
| Shares | Value (000s) | ||
| CONSUMER DISCRETIONARY - 10.8% | |||
| Auto Components - 1.1% | |||
| Delphi Automotive PLC | 303,000 | $25,207 | |
| Tenneco, Inc. (a) | 433,400 | 24,526 | |
| The Goodyear Tire & Rubber Co. | 361,800 | 11,882 | |
| Visteon Corp. (a) | 304,510 | 33,213 | |
| 94,828 | |||
| Automobiles - 0.2% | |||
| Harley-Davidson, Inc. | 386,500 | 19,112 | |
| Distributors - 0.2% | |||
| Uni-Select, Inc. | 303,800 | 15,055 | |
| Diversified Consumer Services - 1.4% | |||
| H&R Block, Inc. | 958,559 | 35,716 | |
| Houghton Mifflin Harcourt Co. (a) | 3,488,206 | 68,334 | |
| Service Corp. International | 717,127 | 20,266 | |
| 124,316 | |||
| Hotels, Restaurants & Leisure - 1.0% | |||
| DineEquity, Inc. | 239,200 | 19,961 | |
| Extended Stay America, Inc. unit | 1,638,100 | 31,452 | |
| Wyndham Worldwide Corp. | 460,900 | 37,494 | |
| 88,907 | |||
| Household Durables - 0.7% | |||
| Jarden Corp. (a) | 430,250 | 19,275 | |
| Whirlpool Corp. | 255,200 | 40,868 | |
| 60,143 | |||
| Internet & Catalog Retail - 0.4% | |||
| Liberty Interactive Corp. QVC Group Series A (a) | 1,364,600 | 37,349 | |
| Leisure Products - 0.7% | |||
| Mattel, Inc. (b) | 1,939,600 | 47,675 | |
| Vista Outdoor, Inc. (a) | 256,500 | 11,471 | |
| 59,146 | |||
| Media - 2.6% | |||
| CBS Corp. Class B | 152,400 | 7,090 | |
| Liberty Broadband Corp. Class C (a) | 562,671 | 30,255 | |
| Live Nation Entertainment, Inc. (a) | 1,886,460 | 51,463 | |
| Omnicom Group, Inc. | 543,400 | 40,712 | |
| Sinclair Broadcast Group, Inc. Class A (b) | 778,656 | 23,367 | |
| Starz Series A (a) | 856,700 | 28,708 | |
| Twenty-First Century Fox, Inc. Class B | 946,900 | 29,240 | |
| Viacom, Inc. Class B (non-vtg.) | 498,300 | 24,571 | |
| 235,406 | |||
| Multiline Retail - 0.6% | |||
| Dillard's, Inc. Class A | 265,250 | 23,735 | |
| Kohl's Corp. | 671,817 | 30,984 | |
| 54,719 | |||
| Specialty Retail - 1.7% | |||
| Chico's FAS, Inc. | 1,287,657 | 17,795 | |
| GameStop Corp. Class A | 807,600 | 37,206 | |
| GNC Holdings, Inc. | 250,600 | 7,455 | |
| Sally Beauty Holdings, Inc. (a) | 277,200 | 6,517 | |
| Staples, Inc. | 3,404,600 | 44,226 | |
| The Men's Wearhouse, Inc. | 850,119 | 33,988 | |
| 147,187 | |||
| Textiles, Apparel & Luxury Goods - 0.2% | |||
| Gildan Activewear, Inc. | 801,400 | 23,038 | |
| TOTAL CONSUMER DISCRETIONARY | 959,206 | ||
| CONSUMER STAPLES - 3.3% | |||
| Beverages - 0.8% | |||
| C&C Group PLC | 6,044,168 | 24,127 | |
| Cott Corp. | 3,394,411 | 35,434 | |
| Molson Coors Brewing Co. Class B | 144,386 | 12,720 | |
| 72,281 | |||
| Food & Staples Retailing - 0.6% | |||
| Sysco Corp. | 687,200 | 28,347 | |
| Whole Foods Market, Inc. | 778,500 | 23,324 | |
| 51,671 | |||
| Food Products - 1.7% | |||
| Bunge Ltd. | 295,809 | 21,582 | |
| ConAgra Foods, Inc. | 677,600 | 27,477 | |
| Darling International, Inc. (a) | 3,387,500 | 34,282 | |
| Dean Foods Co. | 580,658 | 10,516 | |
| Greencore Group PLC | 4,475,459 | 20,836 | |
| Pinnacle Foods, Inc. | 150,400 | 6,630 | |
| The J.M. Smucker Co. | 251,831 | 29,562 | |
| 150,885 | |||
| Household Products - 0.2% | |||
| Svenska Cellulosa AB (SCA) (B Shares) | 581,200 | 17,119 | |
| TOTAL CONSUMER STAPLES | 291,956 | ||
| ENERGY - 7.4% | |||
| Energy Equipment & Services - 2.0% | |||
| Baker Hughes, Inc. | 962,300 | 50,694 | |
| BW Offshore Ltd. | 16,910,723 | 7,046 | |
| Dril-Quip, Inc. (a) | 505,600 | 31,125 | |
| FMC Technologies, Inc. (a) | 529,400 | 17,910 | |
| Halliburton Co. | 616,700 | 23,669 | |
| Odfjell Drilling A/S (a) | 2,881,782 | 1,865 | |
| SBM Offshore NV (a)(b) | 1,776,600 | 24,352 | |
| Schlumberger Ltd. | 257,900 | 20,157 | |
| 176,818 | |||
| Oil, Gas & Consumable Fuels - 5.4% | |||
| Anadarko Petroleum Corp. | 370,700 | 24,792 | |
| Apache Corp. | 509,100 | 23,994 | |
| Boardwalk Pipeline Partners, LP | 1,213,700 | 15,560 | |
| California Resources Corp. | 4,040,400 | 16,323 | |
| Diamondback Energy, Inc. | 468,200 | 34,572 | |
| Energen Corp. | 423,170 | 24,607 | |
| EQT Corp. | 672,800 | 44,452 | |
| Golar LNG Ltd. | 695,600 | 20,179 | |
| Hess Corp. | 492,300 | 27,672 | |
| Hoegh LNG Holdings Ltd. (b) | 1,256,411 | 15,083 | |
| Imperial Oil Ltd. | 859,900 | 28,613 | |
| Kinder Morgan, Inc. | 688,200 | 18,822 | |
| Lundin Petroleum AB (a) | 1,862,900 | 26,929 | |
| Marathon Oil Corp. | 1,500,900 | 27,587 | |
| Marathon Petroleum Corp. | 521,446 | 27,011 | |
| Newfield Exploration Co. (a) | 1,188,110 | 47,750 | |
| Northern Oil & Gas, Inc. (a) | 1,096,291 | 5,525 | |
| Scorpio Tankers, Inc. | 1,352,445 | 12,334 | |
| Stone Energy Corp. (a)(b) | 2,048,500 | 11,451 | |
| Whiting Petroleum Corp. (a) | 1,180,844 | 20,346 | |
| 473,602 | |||
| TOTAL ENERGY | 650,420 | ||
| FINANCIALS - 29.7% | |||
| Banks - 5.2% | |||
| Bank of Ireland (a) | 22,747,694 | 8,380 | |
| Barclays PLC sponsored ADR | 2,386,158 | 33,955 | |
| CIT Group, Inc. | 1,149,276 | 49,419 | |
| Citigroup, Inc. | 482,416 | 25,650 | |
| EFG Eurobank Ergasias SA (a) | 79,196,000 | 2,700 | |
| First Citizen Bancshares, Inc. | 131,801 | 33,760 | |
| First Citizen Bancshares, Inc. Class A (a) | 158,592 | 40,622 | |
| First Niagara Financial Group, Inc. | 1,857,800 | 19,228 | |
| Gree Electric Appliances, Inc. ELS (BNP Paribas Arbitrage Warrant Program) warrants 12/10/15 (c) | 2,768,400 | 7,557 | |
| Hilltop Holdings, Inc. (a) | 1,178,414 | 24,711 | |
| JPMorgan Chase & Co. | 582,217 | 37,407 | |
| Lloyds Banking Group PLC | 12,287,600 | 13,947 | |
| PNC Financial Services Group, Inc. | 298,544 | 26,947 | |
| Prosperity Bancshares, Inc. | 447,300 | 22,982 | |
| U.S. Bancorp | 1,972,415 | 83,196 | |
| Wells Fargo & Co. | 501,828 | 27,169 | |
| 457,630 | |||
| Capital Markets - 4.3% | |||
| American Capital Ltd. (a) | 772,300 | 9,878 | |
| Apollo Global Management LLC Class A | 1,287,232 | 23,518 | |
| Ares Capital Corp. (b) | 2,197,525 | 33,468 | |
| Artisan Partners Asset Management, Inc. | 546,300 | 20,896 | |
| E*TRADE Financial Corp. (a) | 1,008,946 | 28,765 | |
| Fortress Investment Group LLC | 4,146,428 | 23,261 | |
| Franklin Resources, Inc. | 763,900 | 31,137 | |
| Invesco Ltd. | 1,952,921 | 64,778 | |
| KKR & Co. LP | 2,340,968 | 40,148 | |
| NorthStar Asset Management Group, Inc. | 1,263,159 | 18,480 | |
| The Blackstone Group LP | 1,319,404 | 43,619 | |
| UBS Group AG | 926,270 | 18,536 | |
| Virtus Investment Partners, Inc. (b) | 217,100 | 25,409 | |
| Waddell & Reed Financial, Inc. Class A | 59,400 | 2,194 | |
| 384,087 | |||
| Consumer Finance - 2.9% | |||
| American Express Co. | 44,500 | 3,260 | |
| Capital One Financial Corp. | 1,198,791 | 94,585 | |
| Discover Financial Services | 1,346,000 | 75,672 | |
| Navient Corp. | 3,606,568 | 47,571 | |
| Springleaf Holdings, Inc. (a) | 796,438 | 37,361 | |
| 258,449 | |||
| Diversified Financial Services - 1.4% | |||
| Berkshire Hathaway, Inc. Class B (a) | 718,289 | 97,702 | |
| Leucadia National Corp. | 1,160,700 | 23,226 | |
| 120,928 | |||
| Insurance - 5.8% | |||
| ACE Ltd. | 835,348 | 94,845 | |
| AFLAC, Inc. | 571,746 | 36,449 | |
| Allstate Corp. | 554,585 | 34,318 | |
| AMBAC Financial Group, Inc. (a) | 2,040,459 | 32,953 | |
| Brown & Brown, Inc. | 1,105,300 | 35,668 | |
| First American Financial Corp. | 685,200 | 26,127 | |
| Greenlight Capital Re, Ltd. (a) | 737,943 | 16,205 | |
| Principal Financial Group, Inc. | 756,700 | 37,956 | |
| ProAssurance Corp. | 379,207 | 20,083 | |
| Progressive Corp. | 534,000 | 17,691 | |
| Prudential PLC | 1,099,903 | 25,690 | |
| Reinsurance Group of America, Inc. | 550,893 | 49,713 | |
| StanCorp Financial Group, Inc. | 356,828 | 40,935 | |
| Torchmark Corp. | 686,251 | 39,809 | |
| 508,442 | |||
| Real Estate Investment Trusts - 8.0% | |||
| American Capital Agency Corp. | 272,206 | 4,853 | |
| American Tower Corp. | 504,404 | 51,565 | |
| Annaly Capital Management, Inc. | 890,400 | 8,859 | |
| CBL & Associates Properties, Inc. | 2,094,500 | 30,538 | |
| Douglas Emmett, Inc. | 730,100 | 22,305 | |
| Equity Commonwealth (a) | 29,700 | 853 | |
| Equity Lifestyle Properties, Inc. | 1,254,815 | 75,891 | |
| Extra Space Storage, Inc. | 666,700 | 52,829 | |
| First Potomac Realty Trust | 593,700 | 7,000 | |
| General Growth Properties, Inc. | 153,400 | 4,441 | |
| Grivalia Properties REIC (d) | 5,147,502 | 46,812 | |
| iStar Financial, Inc. (a)(d) | 4,444,165 | 57,507 | |
| Lamar Advertising Co. Class A | 610,900 | 34,473 | |
| Liberty Property Trust (SBI) | 84,100 | 2,861 | |
| MFA Financial, Inc. | 2,463,790 | 17,049 | |
| NorthStar Realty Finance Corp. | 2,240,959 | 26,914 | |
| Outfront Media, Inc. | 1,830,100 | 43,209 | |
| Sun Communities, Inc. | 939,549 | 62,969 | |
| Taubman Centers, Inc. | 39,600 | 3,048 | |
| Ventas, Inc. | 1,135,800 | 61,015 | |
| VEREIT, Inc. | 6,025,200 | 49,768 | |
| WP Glimcher, Inc. | 3,922,500 | 45,579 | |
| 710,338 | |||
| Real Estate Management & Development - 1.8% | |||
| Brookfield Asset Management, Inc. Class A | 517,050 | 18,063 | |
| CBRE Group, Inc. (a) | 669,100 | 24,944 | |
| Forest City Enterprises, Inc. Class A (a) | 1,219,295 | 26,946 | |
| Kennedy Wilson Europe Real Estate PLC | 922,706 | 17,012 | |
| Kennedy-Wilson Holdings, Inc. | 1,335,414 | 32,744 | |
| Realogy Holdings Corp. (a) | 1,010,100 | 39,495 | |
| 159,204 | |||
| Thrifts & Mortgage Finance - 0.3% | |||
| TFS Financial Corp. | 1,315,300 | 23,097 | |
| TOTAL FINANCIALS | 2,622,175 | ||
| HEALTH CARE - 5.6% | |||
| Biotechnology - 0.6% | |||
| AMAG Pharmaceuticals, Inc. (a) | 317,700 | 12,708 | |
| United Therapeutics Corp. (a) | 284,600 | 41,731 | |
| 54,439 | |||
| Health Care Equipment & Supplies - 1.3% | |||
| Boston Scientific Corp. (a) | 617,600 | 11,290 | |
| St. Jude Medical, Inc. | 217,600 | 13,885 | |
| The Cooper Companies, Inc. | 81,900 | 12,478 | |
| Zimmer Biomet Holdings, Inc. | 708,200 | 74,056 | |
| 111,709 | |||
| Health Care Providers & Services - 1.1% | |||
| Accretive Health, Inc. (a) | 4,305,566 | 8,826 | |
| Brookdale Senior Living, Inc. (a) | 391,500 | 8,186 | |
| Community Health Systems, Inc. (a) | 378,517 | 10,614 | |
| Laboratory Corp. of America Holdings (a) | 435,100 | 53,404 | |
| Universal Health Services, Inc. Class B | 158,400 | 19,339 | |
| 100,369 | |||
| Health Care Technology - 0.4% | |||
| CompuGroup Medical AG | 1,090,604 | 32,141 | |
| Life Sciences Tools & Services - 0.2% | |||
| Agilent Technologies, Inc. | 517,373 | 19,536 | |
| Pharmaceuticals - 2.0% | |||
| Allergan PLC (a) | 53,500 | 16,503 | |
| Jazz Pharmaceuticals PLC (a) | 509,167 | 69,898 | |
| Mallinckrodt PLC (a) | 50,800 | 3,336 | |
| Perrigo Co. PLC | 152,100 | 23,992 | |
| Teva Pharmaceutical Industries Ltd. sponsored ADR | 734,417 | 43,470 | |
| The Medicines Company (a) | 210,500 | 7,208 | |
| Theravance, Inc. | 1,701,946 | 14,943 | |
| 179,350 | |||
| TOTAL HEALTH CARE | 497,544 | ||
| INDUSTRIALS - 12.8% | |||
| Aerospace & Defense - 4.1% | |||
| Aerojet Rocketdyne Holdings, Inc. (a) | 2,577,182 | 43,657 | |
| Curtiss-Wright Corp. | 678,185 | 47,175 | |
| Esterline Technologies Corp. (a) | 361,700 | 27,869 | |
| KLX, Inc. (a) | 1,323,180 | 51,750 | |
| L-3 Communications Holdings, Inc. | 612,790 | 77,457 | |
| Orbital ATK, Inc. | 526,500 | 45,079 | |
| Precision Castparts Corp. | 170,900 | 39,445 | |
| Rolls-Royce Group PLC | 2,071,300 | 21,903 | |
| Textron, Inc. | 280,300 | 11,820 | |
| 366,155 | |||
| Air Freight & Logistics - 0.3% | |||
| Hub Group, Inc. Class A (a) | 399,998 | 15,992 | |
| PostNL NV (a) | 2,321,354 | 9,588 | |
| 25,580 | |||
| Airlines - 0.3% | |||
| American Airlines Group, Inc. | 511,200 | 23,628 | |
| Building Products - 0.5% | |||
| Allegion PLC | 652,713 | 42,537 | |
| Commercial Services & Supplies - 1.2% | |||
| ADT Corp. (b) | 1,059,569 | 35,008 | |
| Progressive Waste Solution Ltd. (Canada) | 1,034,000 | 24,862 | |
| Regus PLC | 6,689,400 | 34,505 | |
| West Corp. | 501,800 | 11,948 | |
| 106,323 | |||
| Construction & Engineering - 1.4% | |||
| AECOM Technology Corp. (a) | 3,105,206 | 91,510 | |
| Astaldi SpA (b) | 1,698,041 | 13,668 | |
| Jacobs Engineering Group, Inc. (a) | 543,900 | 21,832 | |
| 127,010 | |||
| Electrical Equipment - 0.9% | |||
| Eaton Corp. PLC | 272,500 | 15,235 | |
| OSRAM Licht AG | 387,495 | 22,801 | |
| Regal Beloit Corp. | 572,000 | 36,488 | |
| 74,524 | |||
| Industrial Conglomerates - 0.1% | |||
| Danaher Corp. | 130,000 | 12,130 | |
| Machinery - 1.7% | |||
| AGCO Corp. (b) | 745,700 | 36,084 | |
| Deere & Co. | 69,878 | 5,450 | |
| Flowserve Corp. | 9,000 | 417 | |
| Manitowoc Co., Inc. (b) | 882,107 | 13,496 | |
| Melrose PLC | 4,888,000 | 20,059 | |
| Pentair PLC | 389,700 | 21,792 | |
| Stanley Black & Decker, Inc. | 75,500 | 8,001 | |
| Sulzer AG (Reg.) (b) | 192,310 | 19,436 | |
| TriMas Corp. (a) | 1,190,866 | 23,829 | |
| 148,564 | |||
| Marine - 0.0% | |||
| Ultrapetrol (Bahamas) Ltd. (a)(b) | 4,238,972 | 1,908 | |
| Road & Rail - 1.0% | |||
| CSX Corp. | 744,600 | 20,097 | |
| Hertz Global Holdings, Inc. (a) | 1,737,500 | 33,881 | |
| Swift Transporation Co. (a) | 2,111,900 | 33,009 | |
| 86,987 | |||
| Trading Companies & Distributors - 1.3% | |||
| AerCap Holdings NV (a) | 839,496 | 34,839 | |
| Ashtead Group PLC | 592,800 | 9,139 | |
| MRC Global, Inc. (a) | 1,284,040 | 15,280 | |
| Noble Group Ltd. | 31,040,500 | 11,145 | |
| Veritiv Corp. (a) | 300,344 | 12,614 | |
| WESCO International, Inc. (a) | 675,076 | 33,031 | |
| 116,048 | |||
| TOTAL INDUSTRIALS | 1,131,394 | ||
| INFORMATION TECHNOLOGY - 11.2% | |||
| Communications Equipment - 1.6% | |||
| CommScope Holding Co., Inc. (a) | 741,000 | 24,031 | |
| Harris Corp. | 496,800 | 39,312 | |
| QUALCOMM, Inc. | 1,261,554 | 74,962 | |
| 138,305 | |||
| Electronic Equipment & Components - 1.4% | |||
| Flextronics International Ltd. (a) | 1,176,500 | 13,400 | |
| Ingram Micro, Inc. Class A | 637,250 | 18,977 | |
| Jabil Circuit, Inc. | 1,490,603 | 34,254 | |
| TE Connectivity Ltd. | 280,766 | 18,093 | |
| Trimble Navigation Ltd. (a) | 1,009,800 | 22,973 | |
| TTM Technologies, Inc. (a) | 2,160,580 | 15,772 | |
| 123,469 | |||
| Internet Software & Services - 0.1% | |||
| Rackspace Hosting, Inc. (a) | 312,600 | 8,081 | |
| IT Services - 1.6% | |||
| Computer Sciences Corp. | 379,700 | 25,284 | |
| EVERTEC, Inc. | 1,825,898 | 33,304 | |
| Leidos Holdings, Inc. | 555,700 | 29,213 | |
| Science Applications International Corp. | 570,900 | 26,181 | |
| Unisys Corp. (a) | 2,163,466 | 28,990 | |
| 142,972 | |||
| Semiconductors & Semiconductor Equipment - 2.1% | |||
| Broadcom Corp. Class A | 477,601 | 24,549 | |
| Freescale Semiconductor, Inc. (a) | 368,100 | 12,328 | |
| Marvell Technology Group Ltd. | 6,796,600 | 55,800 | |
| Maxim Integrated Products, Inc. | 1,732,000 | 70,977 | |
| Semtech Corp. (a) | 1,467,456 | 25,680 | |
| 189,334 | |||
| Software - 1.9% | |||
| CommVault Systems, Inc. (a) | 593,973 | 24,068 | |
| Interactive Intelligence Group, Inc. (a) | 744,300 | 24,071 | |
| Oracle Corp. | 686,907 | 26,679 | |
| Symantec Corp. | 4,090,678 | 84,268 | |
| Synopsys, Inc. (a) | 217,400 | 10,866 | |
| 169,952 | |||
| Technology Hardware, Storage & Peripherals - 2.5% | |||
| HP, Inc. | 1,392,900 | 37,553 | |
| Lexmark International, Inc. Class A | 702,723 | 22,831 | |
| NCR Corp. (a) | 2,042,500 | 54,331 | |
| Samsung Electronics Co. Ltd. | 55,062 | 66,165 | |
| Western Digital Corp. | 530,800 | 35,468 | |
| 216,348 | |||
| TOTAL INFORMATION TECHNOLOGY | 988,461 | ||
| MATERIALS - 7.5% | |||
| Chemicals - 3.6% | |||
| Agrium, Inc. | 402,900 | 37,483 | |
| Albemarle Corp. U.S. | 289,500 | 15,494 | |
| Axalta Coating Systems | 823,300 | 22,748 | |
| CF Industries Holdings, Inc. | 1,062,600 | 53,948 | |
| Cytec Industries, Inc. | 201,000 | 14,958 | |
| Eastman Chemical Co. | 781,603 | 56,408 | |
| LyondellBasell Industries NV Class A | 225,180 | 20,921 | |
| Methanex Corp. | 1,276,966 | 50,948 | |
| Sociedad Quimica y Minera de Chile SA (PN-B) sponsored ADR | 1,420,000 | 27,520 | |
| Tronox Ltd. Class A | 3,232,680 | 20,075 | |
| 320,503 | |||
| Containers & Packaging - 2.4% | |||
| Avery Dennison Corp. | 458,400 | 29,782 | |
| Ball Corp. | 123,900 | 8,487 | |
| Berry Plastics Group, Inc. (a) | 845,600 | 28,328 | |
| Graphic Packaging Holding Co. | 1,289,300 | 18,256 | |
| Packaging Corp. of America | 218,000 | 14,922 | |
| Sonoco Products Co. | 650,778 | 27,782 | |
| WestRock Co. | 1,581,368 | 85,014 | |
| 212,571 | |||
| Metals & Mining - 1.5% | |||
| Compass Minerals International, Inc. | 916,500 | 74,456 | |
| Freeport-McMoRan, Inc. | 1,487,000 | 17,502 | |
| Steel Dynamics, Inc. | 1,240,200 | 22,906 | |
| SunCoke Energy, Inc. | 3,006,084 | 14,910 | |
| 129,774 | |||
| TOTAL MATERIALS | 662,848 | ||
| TELECOMMUNICATION SERVICES - 0.6% | |||
| Diversified Telecommunication Services - 0.6% | |||
| CenturyLink, Inc. | 1,201,091 | 33,883 | |
| Frontier Communications Corp. (b) | 3,436,604 | 17,664 | |
| 51,547 | |||
| UTILITIES - 9.3% | |||
| Electric Utilities - 5.4% | |||
| Edison International | 2,517,093 | 152,334 | |
| Exelon Corp. | 2,912,000 | 81,303 | |
| ITC Holdings Corp. | 2,668,466 | 87,312 | |
| NextEra Energy, Inc. | 450,918 | 46,291 | |
| OGE Energy Corp. | 2,789,000 | 79,514 | |
| Xcel Energy, Inc. | 750,900 | 26,755 | |
| 473,509 | |||
| Independent Power and Renewable Electricity Producers - 0.2% | |||
| Dynegy, Inc. (a) | 1,162,100 | 22,580 | |
| Multi-Utilities - 3.7% | |||
| CMS Energy Corp. | 1,660,700 | 59,901 | |
| DTE Energy Co. | 605,500 | 49,403 | |
| Public Service Enterprise Group, Inc. | 1,490,500 | 61,543 | |
| Sempra Energy | 1,547,697 | 158,509 | |
| 329,356 | |||
| TOTAL UTILITIES | 825,445 | ||
| TOTAL COMMON STOCKS | |||
| (Cost $8,581,199) | 8,680,996 | ||
| Nonconvertible Preferred Stocks - 0.1% | |||
| FINANCIALS - 0.1% | |||
| Banks - 0.1% | |||
| Itau Unibanco Holding SA sponsored ADR | 1,041,899 | 7,137 | |
| INDUSTRIALS - 0.0% | |||
| Aerospace & Defense - 0.0% | |||
| Rolls-Royce Group PLC | 192,009,510 | 296 | |
| TOTAL NONCONVERTIBLE PREFERRED STOCKS | |||
| (Cost $17,273) | 7,433 | ||
| Principal Amount (000s)(e) | Value (000s) | ||
| Nonconvertible Bonds - 0.1% | |||
| FINANCIALS - 0.1% | |||
| Banks - 0.1% | |||
| Bank of Ireland 10% 7/30/16 (Cost $13,472) | EUR | 10,286 | 11,878 |
| Preferred Securities - 0.1% | |||
| FINANCIALS - 0.1% | |||
| Diversified Financial Services - 0.1% | |||
| Baggot Securities Ltd. 10.24% (Cost $10,148)(c)(f) | EUR | 6,870 | 8,167 |
| Shares | Value (000s) | ||
| Money Market Funds - 3.2% | |||
| Fidelity Cash Central Fund, 0.18% (g) | 124,104,122 | 124,104 | |
| Fidelity Securities Lending Cash Central Fund, 0.19% (g)(h) | 157,452,939 | 157,453 | |
| TOTAL MONEY MARKET FUNDS | |||
| (Cost $281,557) | 281,557 | ||
| TOTAL INVESTMENT PORTFOLIO - 101.7% | |||
| (Cost $8,903,649) | 8,990,031 | ||
| NET OTHER ASSETS (LIABILITIES) - (1.7)% | (148,933) | ||
| NET ASSETS - 100% | $8,841,098 |
| Futures Contracts | |||
| Expiration Date | Underlying Face Amount at Value (000s) | Unrealized Appreciation/(Depreciation) (000s) | |
| Purchased | |||
| Equity Index Contracts | |||
| 81 CME E-mini S&P MidCap 400 Index Contracts (United States) | Dec. 2015 | 11,675 | $279 |
The face value of futures purchased as a percentage of Net Assets is 0.1%
Currency Abbreviations
EUR – European Monetary Unit
Legend
(a) Non-income producing
(b) Security or a portion of the security is on loan at period end.
(c) Security exempt from registration under Rule 144A of the Securities Act of 1933. These securities may be resold in transactions exempt from registration, normally to qualified institutional buyers. At the end of the period, the value of these securities amounted to $15,724,000 or 0.2% of net assets.
(d) Affiliated company
(e) Amount is stated in United States dollars unless otherwise noted.
(f) Security is perpetual in nature with no stated maturity date.
(g) Affiliated fund that is generally available only to investment companies and other accounts managed by Fidelity Investments. The rate quoted is the annualized seven-day yield of the fund at period end. A complete unaudited listing of the fund's holdings as of its most recent quarter end is available upon request. In addition, each Fidelity Central Fund's financial statements, which are not covered by the Fund's Report of Independent Registered Public Accounting Firm, are available on the SEC's website or upon request.
(h) Investment made with cash collateral received from securities on loan.
Affiliated Central Funds
Information regarding fiscal year to date income earned by the Fund from investments in Fidelity Central Funds is as follows:
| Fund | Income earned |
| (Amounts in thousands) | |
| Fidelity Cash Central Fund | $330 |
| Fidelity Securities Lending Cash Central Fund | 1,633 |
| Total | $1,963 |
Other Affiliated Issuers
An affiliated company is a company in which the Fund has ownership of at least 5% of the voting securities. Fiscal year to date transactions with companies which are or were affiliates are as follows:
| Affiliate (Amounts in thousands) | Value, beginning of period | Purchases | Sales Proceeds | Dividend Income | Value, end of period |
| BPZ Energy, Inc. | $8,916 | $-- | $1,472 | $-- | $-- |
| Cardiome Pharma Corp. | 9,170 | 547 | 12,051 | -- | -- |
| Grivalia Properties REIC (formerly Eurobank Properties Real Estate Investment Co.) | 57,043 | -- | 1,170 | 1,775 | 46,812 |
| iStar Financial, Inc. | 20,872 | 41,497 | 1,685 | -- | 57,507 |
| TTM Technologies, Inc. | 23,713 | 9,136 | 25,214 | -- | -- |
| Total | $119,714 | $51,180 | $41,592 | $1,775 | $104,319 |
Investment Valuation
The following is a summary of the inputs used, as of October 31, 2015, involving the Fund's assets and liabilities carried at fair value. The inputs or methodology used for valuing securities may not be an indication of the risk associated with investing in those securities. For more information on valuation inputs, and their aggregation into the levels used below, please refer to the Investment Valuation section in the accompanying Notes to Financial Statements.
| Valuation Inputs at Reporting Date: | ||||
| Description | Total | Level 1 | Level 2 | Level 3 |
| (Amounts in thousands) | ||||
| Investments in Securities: | ||||
| Equities: | ||||
| Consumer Discretionary | $959,206 | $959,206 | $-- | $-- |
| Consumer Staples | 291,956 | 274,837 | 17,119 | -- |
| Energy | 650,420 | 650,420 | -- | -- |
| Financials | 2,629,312 | 2,582,118 | 47,194 | -- |
| Health Care | 497,544 | 497,544 | -- | -- |
| Industrials | 1,131,690 | 1,098,642 | 33,048 | -- |
| Information Technology | 988,461 | 988,461 | -- | -- |
| Materials | 662,848 | 662,848 | -- | -- |
| Telecommunication Services | 51,547 | 51,547 | -- | -- |
| Utilities | 825,445 | 825,445 | -- | -- |
| Corporate Bonds | 11,878 | -- | 11,878 | -- |
| Preferred Securities | 8,167 | -- | 8,167 | -- |
| Money Market Funds | 281,557 | 281,557 | -- | -- |
| Total Investments in Securities: | $8,990,031 | $8,872,625 | $117,406 | $-- |
| Derivative Instruments: | ||||
| Assets | ||||
| Futures Contracts | $279 | $279 | $-- | $-- |
| Total Assets | $279 | $279 | $-- | $-- |
| Total Derivative Instruments: | $279 | $279 | $-- | $-- |
Value of Derivative Instruments
The following table is a summary of the Fund's value of derivative instruments by primary risk exposure as of October 31, 2015. For additional information on derivative instruments, please refer to the Derivative Instruments section in the accompanying Notes to Financial Statements.
| Primary Risk Exposure / Derivative Type | Value (000s) | |
| Asset | Liability | |
| Equity Risk | ||
| Futures Contracts(a) | $279 | $0 |
| Total Value of Derivatives | $279 | $0 |
(a) Reflects gross cumulative appreciation (depreciation) on futures contracts as presented in the Schedule of Investments. Only the period end receivable or payable for daily variation margin is presented in the Statement of Assets and Liabilities.
Other Information
Distribution of investments by country or territory of incorporation, as a percentage of Total Net Assets, is as follows (Unaudited):
| United States of America | 81.9% |
| Ireland | 3.0% |
| Canada | 2.6% |
| Bermuda | 2.6% |
| Switzerland | 1.7% |
| United Kingdom | 1.4% |
| Netherlands | 1.1% |
| Others (Individually Less Than 1%) | 5.7% |
| 100.0% |
See accompanying notes which are an integral part of the financial statements.
Financial Statements
Statement of Assets and Liabilities
| Amounts in thousands (except per-share amounts) | October 31, 2015 | |
| Assets | ||
| Investment in securities, at value (including securities loaned of $153,795) — See accompanying schedule: Unaffiliated issuers (cost $8,529,935) | $8,604,155 | |
| Fidelity Central Funds (cost $281,557) | 281,557 | |
| Other affiliated issuers (cost $92,157) | 104,319 | |
| Total Investments (cost $8,903,649) | $8,990,031 | |
| Segregated cash with brokers for derivative instruments | 543 | |
| Cash | 738 | |
| Receivable for investments sold | 109,137 | |
| Receivable for fund shares sold | 9,887 | |
| Dividends receivable | 4,541 | |
| Interest receivable | 294 | |
| Distributions receivable from Fidelity Central Funds | 88 | |
| Receivable for daily variation margin for derivative instruments | 2 | |
| Prepaid expenses | 25 | |
| Other receivables | 558 | |
| Total assets | 9,115,844 | |
| Liabilities | ||
| Payable for investments purchased | $99,968 | |
| Payable for fund shares redeemed | 11,498 | |
| Accrued management fee | 4,087 | |
| Other affiliated payables | 1,183 | |
| Other payables and accrued expenses | 557 | |
| Collateral on securities loaned, at value | 157,453 | |
| Total liabilities | 274,746 | |
| Net Assets | $8,841,098 | |
| Net Assets consist of: | ||
| Paid in capital | $8,011,869 | |
| Undistributed net investment income | 57,267 | |
| Accumulated undistributed net realized gain (loss) on investments and foreign currency transactions | 685,315 | |
| Net unrealized appreciation (depreciation) on investments and assets and liabilities in foreign currencies | 86,647 | |
| Net Assets | $8,841,098 | |
| Value: | ||
| Net Asset Value, offering price and redemption price per share ($7,436,720 ÷ 67,163 shares) | $110.73 | |
| Class K: | ||
| Net Asset Value, offering price and redemption price per share ($1,404,378 ÷ 12,662 shares) | $110.91 |
See accompanying notes which are an integral part of the financial statements.
Statement of Operations
| Amounts in thousands | Year ended October 31, 2015 | |
| Investment Income | ||
| Dividends (including $1,775 earned from other affiliated issuers) | $167,432 | |
| Interest | 1,223 | |
| Income from Fidelity Central Funds | 1,963 | |
| Total income | 170,618 | |
| Expenses | ||
| Management fee | ||
| Basic fee | $51,899 | |
| Performance adjustment | 5,964 | |
| Transfer agent fees | 13,466 | |
| Accounting and security lending fees | 1,299 | |
| Custodian fees and expenses | 294 | |
| Independent trustees' compensation | 41 | |
| Registration fees | 110 | |
| Audit | 93 | |
| Legal | 31 | |
| Miscellaneous | 66 | |
| Total expenses before reductions | 73,263 | |
| Expense reductions | (818) | 72,445 |
| Net investment income (loss) | 98,173 | |
| Realized and Unrealized Gain (Loss) | ||
| Net realized gain (loss) on: | ||
| Investment securities: | ||
| Unaffiliated issuers | 763,457 | |
| Other affiliated issuers | (12,116) | |
| Foreign currency transactions | (235) | |
| Futures contracts | 5,819 | |
| Total net realized gain (loss) | 756,925 | |
| Change in net unrealized appreciation (depreciation) on: Investment securities | (818,408) | |
| Assets and liabilities in foreign currencies | 37 | |
| Futures contracts | (1,553) | |
| Total change in net unrealized appreciation (depreciation) | (819,924) | |
| Net gain (loss) | (62,999) | |
| Net increase (decrease) in net assets resulting from operations | $35,174 |
See accompanying notes which are an integral part of the financial statements.
Statement of Changes in Net Assets
| Amounts in thousands | Year ended October 31, 2015 | Year ended October 31, 2014 |
| Increase (Decrease) in Net Assets | ||
| Operations | ||
| Net investment income (loss) | $98,173 | $88,411 |
| Net realized gain (loss) | 756,925 | 1,263,440 |
| Change in net unrealized appreciation (depreciation) | (819,924) | (130,972) |
| Net increase (decrease) in net assets resulting from operations | 35,174 | 1,220,879 |
| Distributions to shareholders from net investment income | (77,668) | (73,736) |
| Distributions to shareholders from net realized gain | (128,936) | (13,709) |
| Total distributions | (206,604) | (87,445) |
| Share transactions - net increase (decrease) | (510,694) | (24,445) |
| Total increase (decrease) in net assets | (682,124) | 1,108,989 |
| Net Assets | ||
| Beginning of period | 9,523,222 | 8,414,233 |
| End of period (including undistributed net investment income of $57,267 and undistributed net investment income of $52,222, respectively) | $8,841,098 | $9,523,222 |
See accompanying notes which are an integral part of the financial statements.
Financial Highlights — Fidelity Value Fund
| October 31, | |||||
| Years ended October 31, | 2015 | 2014 | 2013 | 2012 | 2011 |
| Selected Per–Share Data | |||||
| Net asset value, beginning of period | $113.00 | $99.54 | $74.14 | $64.53 | $64.09 |
| Income from Investment Operations | |||||
| Net investment income (loss)A | 1.17 | 1.02 | 1.13 | .74 | .59 |
| Net realized and unrealized gain (loss) | (.99)B | 13.47 | 25.28 | 9.48 | .75 |
| Total from investment operations | .18 | 14.49 | 26.41 | 10.22 | 1.34 |
| Distributions from net investment income | (.91) | (.86) | (1.01) | (.58) | (.88) |
| Distributions from net realized gain | (1.54) | (.16) | – | (.03) | (.02) |
| Total distributions | (2.45) | (1.03)C | (1.01) | (.61) | (.90) |
| Net asset value, end of period | $110.73 | $113.00 | $99.54 | $74.14 | $64.53 |
| Total ReturnD | .12%B | 14.68% | 36.07% | 15.99% | 2.05% |
| Ratios to Average Net AssetsE,F | |||||
| Expenses before reductions | .79% | .73% | .67% | .68% | .60% |
| Expenses net of fee waivers, if any | .79% | .73% | .67% | .68% | .60% |
| Expenses net of all reductions | .78% | .73% | .65% | .68% | .59% |
| Net investment income (loss) | 1.02% | .95% | 1.30% | 1.07% | .87% |
| Supplemental Data | |||||
| Net assets, end of period (in millions) | $7,437 | $8,024 | $7,153 | $5,571 | $6,006 |
| Portfolio turnover rateG | 80% | 81% | 99% | 77% | 95% |
A Calculated based on average shares outstanding during the period.
B Net realized and unrealized gain (loss) per share reflects proceeds received from litigation which amounted to $.13 per share. Excluding these litigation proceeds, the total return would have been .01%.
C Total distributions of $1.03 per share is comprised of distributions from net investment income of $.864 and distributions from net realized gain of $.164 per share.
D Total returns would have been lower if certain expenses had not been reduced during the applicable periods shown.
E Fees and expenses of any underlying Fidelity Central Funds are not included in the Fund's expense ratio. The Fund indirectly bears its proportionate share of the expenses of any underlying Fidelity Central Funds.
F Expense ratios reflect operating expenses of the class. Expenses before reductions do not reflect amounts reimbursed by the investment adviser or reductions from brokerage service arrangements or reductions from other expense offset arrangements and do not represent the amount paid by the class during periods when reimbursements or reductions occur. Expenses net of fee waivers reflect expenses after reimbursement by the investment adviser but prior to reductions from brokerage service arrangements or other expense offset arrangements. Expenses net of all reductions represent the net expenses paid by the class.
G Amount does not include the portfolio activity of any underlying Fidelity Central Funds.
See accompanying notes which are an integral part of the financial statements.
Financial Highlights — Fidelity Value Fund Class K
| October 31, | |||||
| Years ended October 31, | 2015 | 2014 | 2013 | 2012 | 2011 |
| Selected Per–Share Data | |||||
| Net asset value, beginning of period | $113.17 | $99.70 | $74.27 | $64.66 | $64.24 |
| Income from Investment Operations | |||||
| Net investment income (loss)A | 1.30 | 1.15 | 1.25 | .85 | .70 |
| Net realized and unrealized gain (loss) | (.99)B | 13.47 | 25.30 | 9.47 | .74 |
| Total from investment operations | .31 | 14.62 | 26.55 | 10.32 | 1.44 |
| Distributions from net investment income | (1.03) | (.98) | (1.12) | (.68) | (1.00) |
| Distributions from net realized gain | (1.54) | (.16) | – | (.03) | (.02) |
| Total distributions | (2.57) | (1.15)C | (1.12) | (.71) | (1.02) |
| Net asset value, end of period | $110.91 | $113.17 | $99.70 | $74.27 | $64.66 |
| Total ReturnD | .24%B | 14.81% | 36.26% | 16.16% | 2.20% |
| Ratios to Average Net AssetsE,F | |||||
| Expenses before reductions | .68% | .62% | .54% | .54% | .44% |
| Expenses net of fee waivers, if any | .68% | .62% | .54% | .54% | .44% |
| Expenses net of all reductions | .67% | .61% | .52% | .53% | .44% |
| Net investment income (loss) | 1.13% | 1.07% | 1.42% | 1.22% | 1.02% |
| Supplemental Data | |||||
| Net assets, end of period (in millions) | $1,404 | $1,499 | $1,261 | $765 | $639 |
| Portfolio turnover rateG | 80% | 81% | 99% | 77% | 95% |
A Calculated based on average shares outstanding during the period.
B Net realized and unrealized gain (loss) per share reflects proceeds received from litigation which amounted to $.13 per share. Excluding these litigation proceeds, the total return would have been .13%.
C Total distributions of $1.15 per share is comprised of distributions from net investment income of $.983 and distributions from net realized gain of $.164 per share.
D Total returns would have been lower if certain expenses had not been reduced during the applicable periods shown.
E Fees and expenses of any underlying Fidelity Central Funds are not included in the Fund's expense ratio. The Fund indirectly bears its proportionate share of the expenses of any underlying Fidelity Central Funds.
F Expense ratios reflect operating expenses of the class. Expenses before reductions do not reflect amounts reimbursed by the investment adviser or reductions from brokerage service arrangements or reductions from other expense offset arrangements and do not represent the amount paid by the class during periods when reimbursements or reductions occur. Expenses net of fee waivers reflect expenses after reimbursement by the investment adviser but prior to reductions from brokerage service arrangements or other expense offset arrangements. Expenses net of all reductions represent the net expenses paid by the class.
G Amount does not include the portfolio activity of any underlying Fidelity Central Funds.
See accompanying notes which are an integral part of the financial statements.
Notes to Financial Statements
For the period ended October 31, 2015
(Amounts in thousands except percentages)
1. Organization.
Fidelity Value Fund (the Fund) is a fund of Fidelity Capital Trust (the Trust) and is authorized to issue an unlimited number of shares. The Trust is registered under the Investment Company Act of 1940, as amended (the 1940 Act), as an open-end management investment company organized as a Massachusetts business trust. The Fund offers Value and Class K shares, each of which has equal rights as to assets and voting privileges. Each class has exclusive voting rights with respect to matters that affect that class.
2. Investments in Fidelity Central Funds.
The Fund invests in Fidelity Central Funds, which are open-end investment companies generally available only to other investment companies and accounts managed by the investment adviser and its affiliates. The Fund's Schedule of Investments lists each of the Fidelity Central Funds held as of period end, if any, as an investment of the Fund, but does not include the underlying holdings of each Fidelity Central Fund. As an Investing Fund, the Fund indirectly bears its proportionate share of the expenses of the underlying Fidelity Central Funds.
The Money Market Central Funds seek preservation of capital and current income and are managed by Fidelity Investments Money Management, Inc. (FIMM), an affiliate of the investment adviser. Annualized expenses of the Money Market Central Funds as of their most recent shareholder report date are less than .005%.
A complete unaudited list of holdings for each Fidelity Central Fund is available upon request or at the Securities and Exchange Commission (the SEC) website at www.sec.gov. In addition, the financial statements of the Fidelity Central Funds, which are not covered by the Fund's Report of Independent Registered Public Accounting Firm, are available on the SEC website or upon request.
3. Significant Accounting Policies.
The financial statements have been prepared in conformity with accounting principles generally accepted in the United States of America (GAAP), which require management to make certain estimates and assumptions at the date of the financial statements. Actual results could differ from those estimates. Subsequent events, if any, through the date that the financial statements were issued have been evaluated in the preparation of the financial statements. The following summarizes the significant accounting policies of the Fund:
Investment Valuation. Investments are valued as of 4:00 p.m. Eastern time on the last calendar day of the period. The Board of Trustees (the Board) has delegated the day to day responsibility for the valuation of the Fund's investments to the Fidelity Management & Research Company (FMR) Fair Value Committee (the Committee). In accordance with valuation policies and procedures approved by the Board, the Fund attempts to obtain prices from one or more third party pricing vendors or brokers to value its investments. When current market prices, quotations or currency exchange rates are not readily available or reliable, investments will be fair valued in good faith by the Committee, in accordance with procedures adopted by the Board. Factors used in determining fair value vary by investment type and may include market or investment specific events, changes in interest rates and credit quality. The frequency with which these procedures are used cannot be predicted and they may be utilized to a significant extent. The Committee oversees the Fund's valuation policies and procedures and reports to the Board on the Committee's activities and fair value determinations. The Board monitors the appropriateness of the procedures used in valuing the Fund's investments and ratifies the fair value determinations of the Committee.
The Fund categorizes the inputs to valuation techniques used to value its investments into a disclosure hierarchy consisting of three levels as shown below:
- Level 1 – quoted prices in active markets for identical investments
- Level 2 – other significant observable inputs (including quoted prices for similar investments, interest rates, prepayment speeds, etc.)
- Level 3 – unobservable inputs (including the Fund's own assumptions based on the best information available)
Valuation techniques used to value the Fund's investments by major category are as follows:
Equity securities, including restricted securities, for which market quotations are readily available, are valued at the last reported sale price or official closing price as reported by a third party pricing vendor on the primary market or exchange on which they are traded and are categorized as Level 1 in the hierarchy. In the event there were no sales during the day or closing prices are not available, securities are valued at the last quoted bid price or may be valued using the last available price and are generally categorized as Level 2 in the hierarchy. For foreign equity securities, when market or security specific events arise, comparisons to the valuation of American Depositary Receipts (ADRs), futures contracts, Exchange-Traded Funds (ETFs)and certain indexes as well as quoted prices for similar securities may be used and would be categorized as Level 2 in the hierarchy. Utilizing these techniques may result in transfers between Level 1 and Level 2. For equity securities, including restricted securities, where observable inputs are limited, assumptions about market activity and risk are used and these securities may be categorized as Level 3 in the hierarchy.
Debt securities, including restricted securities, are valued based on evaluated prices received from third party pricing vendors or from brokers who make markets in such securities. Corporate bonds and preferred securities are valued by pricing vendors who utilize matrix pricing which considers yield or price of bonds of comparable quality, coupon, maturity and type or by broker-supplied prices. When independent prices are unavailable or unreliable, debt securities may be valued utilizing pricing methodologies which consider similar factors that would be used by third party pricing vendors. Debt securities are generally categorized as Level 2 in the hierarchy but may be Level 3 depending on the circumstances.
Futures contracts are valued at the settlement price established each day by the board of trade or exchange on which they are traded and are categorized as Level 1 in the hierarchy. Investments in open-end mutual funds, including the Fidelity Central Funds, are valued at their closing net asset value (NAV) each business day and are categorized as Level 1 in the hierarchy.
Changes in valuation techniques may result in transfers in or out of an assigned level within the disclosure hierarchy. The aggregate value of investments by input level as of October 31, 2015 is included at the end of the Fund's Schedule of Investments.
Foreign Currency. The Fund may use foreign currency contracts to facilitate transactions in foreign-denominated securities. Gains and losses from these transactions may arise from changes in the value of the foreign currency or if the counterparties do not perform under the contracts' terms.
Foreign-denominated assets, including investment securities, and liabilities are translated into U.S. dollars at the exchange rates at period end. Purchases and sales of investment securities, income and dividends received and expenses denominated in foreign currencies are translated into U.S. dollars at the exchange rate in effect on the transaction date.
The effects of exchange rate fluctuations on investments are included with the net realized and unrealized gain (loss) on investment securities. Other foreign currency transactions resulting in realized and unrealized gain (loss) are disclosed separately.
Investment Transactions and Income. For financial reporting purposes, the Fund's investment holdings and NAV include trades executed through the end of the last business day of the period. The NAV per share for processing shareholder transactions is calculated as of the close of business of the New York Stock Exchange (NYSE), normally 4:00 p.m. Eastern time and includes trades executed through the end of the prior business day. Gains and losses on securities sold are determined on the basis of identified cost and may include proceeds received from litigation. Dividend income is recorded on the ex-dividend date, except for certain dividends from foreign securities where the ex-dividend date may have passed, which are recorded as soon as the Fund is informed of the ex-dividend date. Non-cash dividends included in dividend income, if any, are recorded at the fair market value of the securities received. Income and capital gain distributions from Fidelity Central Funds, if any, are recorded on the ex-dividend date. Distributions received on securities that represent a return of capital or capital gain are recorded as a reduction of cost of investments and/or as a realized gain. Subsequent to ex-dividend date the Fund determines the components of these distributions, based upon receipt of tax filings or other correspondence relating to the underlying investment. Interest income is accrued as earned and includes coupon interest and amortization of premium and accretion of discount on debt securities as applicable. Investment income is recorded net of foreign taxes withheld where recovery of such taxes is uncertain.
Class Allocations and Expenses. Investment income, realized and unrealized capital gains and losses, common expenses of the Fund, and certain fund-level expense reductions, if any, are allocated daily on a pro-rata basis to each class based on the relative net assets of each class to the total net assets of the Fund. Each class differs with respect to transfer agent fees incurred. Certain expense reductions may also differ by class. For the reporting period, the allocated portion of income and expenses to each class as a percent of its average net assets may vary due to the timing of recording these transactions in relation to fluctuating net assets of the classes. Expenses directly attributable to a fund are charged to that fund. Expenses attributable to more than one fund are allocated among the respective funds on the basis of relative net assets or other appropriate methods. Expense estimates are accrued in the period to which they relate and adjustments are made when actual amounts are known.
Deferred Trustee Compensation. Under a Deferred Compensation Plan (the Plan), independent Trustees may elect to defer receipt of a portion of their annual compensation. Deferred amounts are invested in a cross-section of Fidelity funds, are marked-to-market and remain in the Fund until distributed in accordance with the Plan. The investment of deferred amounts and the offsetting payable to the Trustees are included in the accompanying Statement of Assets and Liabilities.
Income Tax Information and Distributions to Shareholders. Each year, the Fund intends to qualify as a regulated investment company under Subchapter M of the Internal Revenue Code, including distributing substantially all of its taxable income and realized gains. As a result, no provision for U.S. Federal income taxes is required. As of October 31, 2015, the Fund did not have any unrecognized tax benefits in the financial statements; nor is the Fund aware of any tax positions for which it is reasonably possible that the total amounts of unrecognized tax benefits will significantly change in the next twelve months. The Fund files a U.S. federal tax return, in addition to state and local tax returns as required. The Fund's federal income tax returns are subject to examination by the Internal Revenue Service (IRS) for a period of three fiscal years after they are filed. State and local tax returns may be subject to examination for an additional fiscal year depending on the jurisdiction. Foreign taxes are provided for based on the Fund's understanding of the tax rules and rates that exist in the foreign markets in which it invests.
Distributions are declared and recorded on the ex-dividend date. Income dividends and capital gain distributions are declared separately for each class. Income and capital gain distributions are determined in accordance with income tax regulations, which may differ from GAAP. In addition, the Fund claimed a portion of the payment made to redeeming shareholders as a distribution for income tax purposes.
Capital accounts within the financial statements are adjusted for permanent book-tax differences. These adjustments have no impact on net assets or the results of operations. Capital accounts are not adjusted for temporary book-tax differences which will reverse in a subsequent period.
Book-tax differences are primarily due to futures contracts, foreign currency transactions, passive foreign investment companies (PFIC), market discount, partnerships, deferred trustees compensation and losses deferred due to wash sales.
The federal tax cost of investment securities and unrealized appreciation (depreciation) as of period end were as follows:
| Gross unrealized appreciation | $926,890 |
| Gross unrealized depreciation | (891,362) |
| Net unrealized appreciation (depreciation) on securities | $35,528 |
| Tax Cost | $8,954,503 |
The tax-based components of distributable earnings as of period end were as follows:
| Undistributed ordinary income | $198,307 |
| Undistributed long-term capital gain | $595,865 |
| Net unrealized appreciation (depreciation) on securities and other investments | $35,526 |
The tax character of distributions paid was as follows:
| October 31, 2015 | October 31, 2014 | |
| Ordinary Income | $77,668 | $ 87,445 |
| Long-term Capital Gains | 128,936 | – |
| Total | $206,604 | $ 87,445 |
Restricted Securities. The Fund may invest in securities that are subject to legal or contractual restrictions on resale. These securities generally may be resold in transactions exempt from registration or to the public if the securities are registered. Disposal of these securities may involve time-consuming negotiations and expense, and prompt sale at an acceptable price may be difficult. Information regarding restricted securities is included at the end of the Fund's Schedule of Investments.
4. Derivative Instruments.
Risk Exposures and the Use of Derivative Instruments. The Fund's investment objective allows the Fund to enter into various types of derivative contracts, including futures contracts. Derivatives are investments whose value is primarily derived from underlying assets, indices or reference rates and may be transacted on an exchange or over-the-counter (OTC). Derivatives may involve a future commitment to buy or sell a specified asset based on specified terms, to exchange future cash flows at periodic intervals based on a notional principal amount, or for one party to make one or more payments upon the occurrence of specified events in exchange for periodic payments from the other party.
The Fund used derivatives to increase returns and to manage exposure to certain risks as defined below. The success of any strategy involving derivatives depends on analysis of numerous economic factors, and if the strategies for investment do not work as intended, the Fund may not achieve its objectives.
The Fund's use of derivatives increased or decreased its exposure to the following risk:
| Equity Risk | Equity risk relates to the fluctuations in the value of financial instruments as a result of changes in market prices (other than those arising from interest rate risk or foreign exchange risk), whether caused by factors specific to an individual investment, its issuer, or all factors affecting all instruments traded in a market or market segment. |
The Fund is also exposed to additional risks from investing in derivatives, such as liquidity risk and counterparty credit risk. Liquidity risk is the risk that the Fund will be unable to close out the derivative in the open market in a timely manner. Counterparty credit risk is the risk that the counterparty will not be able to fulfill its obligation to the Fund. Counterparty credit risk related to exchange-traded futures contracts may be mitigated by the protection provided by the exchange on which they trade.
Investing in derivatives may involve greater risks than investing in the underlying assets directly and, to varying degrees, may involve risk of loss in excess of any initial investment and collateral received and amounts recognized in the Statement of Assets and Liabilities. In addition, there may be the risk that the change in value of the derivative contract does not correspond to the change in value of the underlying instrument.
Futures Contracts. A futures contract is an agreement between two parties to buy or sell a specified underlying instrument for a fixed price at a specified future date. The Fund used futures contracts to manage its exposure to the stock market.
Upon entering into a futures contract, a fund is required to deposit either cash or securities (initial margin) with a clearing broker in an amount equal to a certain percentage of the face value of the contract. Futures contracts are marked-to-market daily and subsequent daily payments (variation margin) are made or received by a fund depending on the daily fluctuations in the value of the futures contracts and are recorded as unrealized appreciation or (depreciation). This receivable and/or payable, if any, is included in daily variation margin for derivative instruments in the Statement of Assets and Liabilities. Realized gain or (loss) is recorded upon the expiration or closing of a futures contract.
Any open futures contracts at period end are presented in the Schedule of Investments under the caption "Futures Contracts". The underlying face amount at value reflects each contract's exposure to the underlying instrument or index at period end and is representative of volume of activity during the period. Cash deposited to meet initial margin requirements is presented as segregated cash with brokers for derivative instruments in the Statement of Assets and Liabilities.
During the period the Fund recognized net realized gain (loss) of $5,819 and a change in net unrealized appreciation (depreciation) of $(1,553) related to its investment in futures contracts. These amounts are included in the Statement of Operations.
5. Purchases and Sales of Investments.
Purchases and sales of securities, other than short-term securities, aggregated $7,311,581 and $7,814,719, respectively.
6. Fees and Other Transactions with Affiliates.
Management Fee. Fidelity Management & Research Company (the investment adviser) and its affiliates provide the Fund with investment management related services for which the Fund pays a monthly management fee. The management fee is the sum of an individual fund fee rate that is based on an annual rate of .30% of the Fund's average net assets and an annualized group fee rate that averaged .25% during the period. The group fee rate is based upon the average net assets of all the mutual funds advised by the investment adviser, including any mutual funds previously advised by the investment adviser that are currently advised by Fidelity SelectCo, LLC, an affiliate of the investment adviser. The group fee rate decreases as assets under management increase and increases as assets under management decrease. In addition, the management fee is subject to a performance adjustment (up to a maximum of +/- .20% of the Fund's average net assets over a 36 month performance period). The upward or downward adjustment to the management fee is based on the relative investment performance of Value as compared to its benchmark index, the Russell Midcap Value Index, over the same 36 month performance period. For the reporting period, the total annual management fee rate, including the performance adjustment, was .61% of the Fund's average net assets. The performance adjustment included in the management fee rate may be higher or lower than the maximum performance adjustment rate due to the difference between the average net assets for the reporting and performance periods.
Transfer Agent Fees. Fidelity Investments Institutional Operations Company, Inc., (FIIOC), an affiliate of the investment adviser, is the transfer, dividend disbursing and shareholder servicing agent for each class of the Fund. FIIOC receives account fees and asset-based fees that vary according to the account size and type of account of the shareholders of Value. FIIOC receives an asset-based fee of Class K's average net assets. FIIOC pays for typesetting, printing and mailing of shareholder reports, except proxy statements.
For the period, transfer agent fees for each class were as follows:
| Amount | % of Class-Level Average Net Assets | |
| Value | $12,750 | .16 |
| Class K | 716 | .05 |
| $ 13,466 |
Accounting and Security Lending Fees. Fidelity Service Company, Inc. (FSC), an affiliate of the investment adviser, maintains the Fund's accounting records. The accounting fee is based on the level of average net assets for each month. Under a separate contract, FSC administers the security lending program. The security lending fee is based on the number and duration of lending transactions.
Brokerage Commissions. The Fund placed a portion of its portfolio transactions with brokerage firms which are affiliates of the investment adviser. Brokerage commissions are included in net realized gain (loss) and change in net unrealized appreciation (depreciation) in the Statement of Operations. The commissions paid to these affiliated firms were $211 for the period.
Other. During the period, the investment adviser reimbursed the Fund for certain losses in the amount of $3.
7. Committed Line of Credit.
The Fund participates with other funds managed by the investment adviser or an affiliate in a $4.25 billion credit facility (the "line of credit") to be utilized for temporary or emergency purposes to fund shareholder redemptions or for other short-term liquidity purposes. The Fund has agreed to pay commitment fees on its pro-rata portion of the line of credit, which amounted to $14 and is reflected in Miscellaneous expenses on the Statement of Operations. During the period, the Fund did not borrow on this line of credit.
8. Security Lending.
The Fund lends portfolio securities through a lending agent from time to time in order to earn additional income. For equity securities, a lending agent is used and may loan securities to certain qualified borrowers, including Fidelity Capital Markets (FCM), a broker-dealer affiliated with the Fund. On the settlement date of the loan, the Fund receives collateral (in the form of U.S. Treasury obligations, letters of credit and/or cash) against the loaned securities and maintains collateral in an amount not less than 100% of the market value of the loaned securities during the period of the loan. The market value of the loaned securities is determined at the close of business of the Fund and any additional required collateral is delivered to the Fund on the next business day. The Fund or borrower may terminate the loan at any time, and if the borrower defaults on its obligation to return the securities loaned because of insolvency or other reasons, the Fund may apply collateral received from the borrower against the obligation. The Fund may experience delays and costs in recovering the securities loaned. Any cash collateral received is invested in the Fidelity Securities Lending Cash Central Fund. The value of loaned securities and cash collateral at period end are disclosed on the Fund's Statement of Assets and Liabilities. At period end, there were no security loans outstanding with FCM. Security lending income represents the income earned on investing cash collateral, less rebates paid to borrowers and any lending agent fees associated with the loan, plus any premium payments received for lending certain types of securities. Security lending income is presented in the Statement of Operations as a component of income from Fidelity Central Funds. Total security lending income during the period amounted to $1,633, including $21 from securities loaned to FCM.
9. Expense Reductions.
Commissions paid to certain brokers with whom the investment adviser, or its affiliates, places trades on behalf of the Fund include an amount in addition to trade execution, which may be rebated back to the Fund to offset certain expenses. This amount totaled $605 for the period.
In addition, during the period the investment adviser reimbursed and/or waived a portion of fund-level operating expenses in the amount of $39 and a portion of class-level operating expenses as follows:
| Amount | |
| Value | $174 |
10. Distributions to Shareholders.
Distributions to shareholders of each class were as follows:
| Years ended October 31, | 2015 | 2014 |
| From net investment income | ||
| Value | $63,932 | $61,240 |
| Class K | 13,736 | 12,496 |
| Total | $77,668 | $73,736 |
| From net realized gain | ||
| Value | $108,489 | $11,624 |
| Class K | 20,447 | 2,085 |
| Total | $128,936 | $13,709 |
11. Share Transactions.
Share transactions for each class were as follows and may contain automatic conversions between classes or exchanges between funds:
| Shares | Shares | Dollars | Dollars | |
| Years ended October 31, | 2015 | 2014 | 2015 | 2014 |
| Value | ||||
| Shares sold | 5,497 | 9,711 | $627,144 | $1,038,871 |
| Reinvestment of distributions | 1,454 | 693 | 164,069 | 69,558 |
| Shares redeemed | (10,799) | (11,257) | (1,231,193) | (1,196,902) |
| Net increase (decrease) | (3,848) | (853) | $(439,980) | $(88,473) |
| Class K | ||||
| Shares sold | 3,068 | 3,811 | $349,168 | $411,317 |
| Reinvestment of distributions | 303 | 145 | 34,183 | 14,580 |
| Shares redeemed | (3,955) | (3,357) | (454,065) | (361,869) |
| Net increase (decrease) | (584) | 599 | $(70,714) | $64,028 |
12. Other.
The Fund's organizational documents provide former and current trustees and officers with a limited indemnification against liabilities arising in connection with the performance of their duties to the Fund. In the normal course of business, the Fund may also enter into contracts that provide general indemnifications. The Fund's maximum exposure under these arrangements is unknown as this would be dependent on future claims that may be made against the Fund. The risk of material loss from such claims is considered remote.
Report of Independent Registered Public Accounting Firm
To the Trustees of Fidelity Capital Trust and Shareholders of Fidelity® Value Fund:
In our opinion, the accompanying statement of assets and liabilities, including the schedule of investments, and the related statements of operations and of changes in net assets and the financial highlights present fairly, in all material respects, the financial position of Fidelity® Value Fund (a fund of Fidelity Capital Trust) at October 31, 2015, the results of its operations for the year then ended, the changes in its net assets for each of the two years in the period then ended and the financial highlights for each of the {five years in the period then ended, in conformity with accounting principles generally accepted in the United States of America. These financial statements and financial highlights (hereafter referred to as “financial statements”) are the responsibility of the Fidelity® Value Fund’s management. Our responsibility is to express an opinion on these financial statements based on our audits. We conducted our audits of these financial statements in accordance with the standards of the Public Company Accounting Oversight Board (United States). Those standards require that we plan and perform the audit to obtain reasonable assurance about whether the financial statements are free of material misstatement. An audit includes examining, on a test basis, evidence supporting the amounts and disclosures in the financial statements, assessing the accounting principles used and significant estimates made by management, and evaluating the overall financial statement presentation. We believe that our audits, which included confirmation of securities at October 31, 2015 by correspondence with the custodian and brokers, provide a reasonable basis for our opinion.
PricewaterhouseCoopers LLP
Boston, Massachusetts
December 15, 2015
Trustees and Officers
The Trustees, Members of the Advisory Board (if any), and officers of the trust and fund, as applicable, are listed below. The Board of Trustees governs the fund and is responsible for protecting the interests of shareholders. The Trustees are experienced executives who meet periodically throughout the year to oversee the fund's activities, review contractual arrangements with companies that provide services to the fund, oversee management of the risks associated with such activities and contractual arrangements, and review the fund's performance. Each of the Trustees oversees 170 funds.
The Trustees hold office without limit in time except that (a) any Trustee may resign; (b) any Trustee may be removed by written instrument, signed by at least two-thirds of the number of Trustees prior to such removal; (c) any Trustee who requests to be retired or who has become incapacitated by illness or injury may be retired by written instrument signed by a majority of the other Trustees; and (d) any Trustee may be removed at any special meeting of shareholders by a two-thirds vote of the outstanding voting securities of the trust. Each Trustee who is not an interested person (as defined in the 1940 Act) of the trust and the fund is referred to herein as an Independent Trustee. Each Independent Trustee shall retire not later than the last day of the calendar year in which his or her 75th birthday occurs. The Independent Trustees may waive this mandatory retirement age policy with respect to individual Trustees. Officers and Advisory Board Members hold office without limit in time, except that any officer or Advisory Board Member may resign or may be removed by a vote of a majority of the Trustees at any regular meeting or any special meeting of the Trustees. Except as indicated, each individual has held the office shown or other offices in the same company for the past five years.
The fund’s Statement of Additional Information (SAI) includes more information about the Trustees. To request a free copy, call Fidelity at 1-800-835-5092.
Experience, Skills, Attributes, and Qualifications of the Trustees. The Governance and Nominating Committee has adopted a statement of policy that describes the experience, qualifications, attributes, and skills that are necessary and desirable for potential Independent Trustee candidates (Statement of Policy). The Board believes that each Trustee satisfied at the time he or she was initially elected or appointed a Trustee, and continues to satisfy, the standards contemplated by the Statement of Policy. The Governance and Nominating Committee also engages professional search firms to help identify potential Independent Trustee candidates who have the experience, qualifications, attributes, and skills consistent with the Statement of Policy. From time to time, additional criteria based on the composition and skills of the current Independent Trustees, as well as experience or skills that may be appropriate in light of future changes to board composition, business conditions, and regulatory or other developments, have also been considered by the professional search firms and the Governance and Nominating Committee. In addition, the Board takes into account the Trustees' commitment and participation in Board and committee meetings, as well as their leadership of standing and ad hoc committees throughout their tenure.
In determining that a particular Trustee was and continues to be qualified to serve as a Trustee, the Board has considered a variety of criteria, none of which, in isolation, was controlling. The Board believes that, collectively, the Trustees have balanced and diverse experience, qualifications, attributes, and skills, which allow the Board to operate effectively in governing the fund and protecting the interests of shareholders. Information about the specific experience, skills, attributes, and qualifications of each Trustee, which in each case led to the Board's conclusion that the Trustee should serve (or continue to serve) as a trustee of the fund, is provided below.
Board Structure and Oversight Function. James C. Curvey is an interested person and currently serves as Chairman. The Trustees have determined that an interested Chairman is appropriate and benefits shareholders because an interested Chairman has a personal and professional stake in the quality and continuity of services provided to the fund. Independent Trustees exercise their informed business judgment to appoint an individual of their choosing to serve as Chairman, regardless of whether the Trustee happens to be independent or a member of management. The Independent Trustees have determined that they can act independently and effectively without having an Independent Trustee serve as Chairman and that a key structural component for assuring that they are in a position to do so is for the Independent Trustees to constitute a substantial majority for the Board. The Independent Trustees also regularly meet in executive session. Ned C. Lautenbach serves as Chairman of the Independent Trustees and as such (i) acts as a liaison between the Independent Trustees and management with respect to matters important to the Independent Trustees and (ii) with management prepares agendas for Board meetings.
Fidelity® funds are overseen by different Boards of Trustees. The fund's Board oversees Fidelity's high income and certain equity funds, and other Boards oversee Fidelity's investment-grade bond, money market, asset allocation, and sector funds. The asset allocation funds may invest in Fidelity® funds overseen by the fund's Board. The use of separate Boards, each with its own committee structure, allows the Trustees of each group of Fidelity® funds to focus on the unique issues of the funds they oversee, including common research, investment, and operational issues. On occasion, the separate Boards establish joint committees to address issues of overlapping consequences for the Fidelity® funds overseen by each Board.
The Trustees operate using a system of committees to facilitate the timely and efficient consideration of all matters of importance to the Trustees, the fund, and fund shareholders and to facilitate compliance with legal and regulatory requirements and oversight of the fund's activities and associated risks. The Board, acting through its committees, has charged FMR and its affiliates with (i) identifying events or circumstances the occurrence of which could have demonstrably adverse effects on the fund's business and/or reputation; (ii) implementing processes and controls to lessen the possibility that such events or circumstances occur or to mitigate the effects of such events or circumstances if they do occur; and (iii) creating and maintaining a system designed to evaluate continuously business and market conditions in order to facilitate the identification and implementation processes described in (i) and (ii) above. Because the day-to-day operations and activities of the fund are carried out by or through FMR, its affiliates, and other service providers, the fund's exposure to risks is mitigated but not eliminated by the processes overseen by the Trustees. While each of the Board's committees has responsibility for overseeing different aspects of the fund's activities, oversight is exercised primarily through the Operations, Audit, and Compliance Committees. In addition, the Independent Trustees have worked with FMR to enhance the Board's oversight of investment and financial risks, legal and regulatory risks, technology risks, and operational risks, including the development of additional risk reporting to the Board. For example, a working group comprised of Independent Trustees and FMR has worked and continues to work to review the Fidelity® funds' valuation-related activities, reporting and risk management. Appropriate personnel, including but not limited to the fund's Chief Compliance Officer (CCO), FMR's internal auditor, the independent accountants, the fund's Treasurer and portfolio management personnel, make periodic reports to the Board's committees, as appropriate, including an annual review of Fidelity's risk management program for the Fidelity® funds. The responsibilities of each standing committee, including their oversight responsibilities, are described further under "Standing Committees of the Trustees."
Interested Trustees*:
Correspondence intended for a Trustee who is an interested person may be sent to Fidelity Investments, 245 Summer Street, Boston, Massachusetts 02210.
Name, Year of Birth; Principal Occupations and Other Relevant Experience+
James C. Curvey (1935)
Year of Election or Appointment: 2007
Trustee
Chairman of the Board of Trustees
Mr. Curvey also serves as Trustee of other Fidelity® funds. Mr. Curvey is a Director of Fidelity Research & Analysis Co. (investment adviser firm, 2009-present), and Vice Chairman (2007-present) and Director of FMR LLC (diversified financial services company). In addition, Mr. Curvey serves as an Overseer for the Boston Symphony Orchestra and a member of the board of Artis-Naples, Naples, Florida, and as a Trustee for Brewster Academy, Wolfeboro, New Hampshire. Previously, Mr. Curvey served as a Director of Fidelity Investments Money Management, Inc. (investment adviser firm, 2009-2014) and a Director of FMR and FMR Co., Inc. (investment adviser firms, 2007-2014).
Charles S. Morrison (1960)
Year of Election or Appointment: 2014
Trustee
Mr. Morrison also serves as Trustee of other funds. He serves as a Director of Fidelity Investments Money Management, Inc. (FIMM) (investment adviser firm, 2014-present), Director of Fidelity SelectCo, LLC (investment adviser firm, 2014-present), President, Asset Management (2014-present), and is an employee of Fidelity Investments. Previously, Mr. Morrison served as Vice President of Fidelity's Fixed Income and Asset Allocation Funds (2012-2014), President, Fixed Income (2011-2014), Vice President of Fidelity's Money Market Funds (2005-2009), President, Money Market Group Leader of FMR (investment adviser firm, 2009), and Senior Vice President, Money Market Group of FMR (2004-2009). Mr. Morrison also served as Vice President of Fidelity's Bond Funds (2002-2005), certain Balanced Funds (2002-2005), and certain Asset Allocation Funds (2002-2007), and as Senior Vice President (2002-2005) of Fidelity's Bond Division.
* Determined to be an “Interested Trustee” by virtue of, among other things, his or her affiliation with the trust or various entities under common control with FMR.
+ The information includes the Trustee's principal occupation during the last five years and other information relating to the experience, attributes, and skills relevant to the Trustee's qualifications to serve as a Trustee, which led to the conclusion that the Trustee should serve as a Trustee for the fund.
Independent Trustees:
Correspondence intended for an Independent Trustee may be sent to Fidelity Investments, P.O. Box 55235, Boston, Massachusetts 02205-5235.
Name, Year of Birth; Principal Occupations and Other Relevant Experience+
Dennis J. Dirks (1948)
Year of Election or Appointment: 2005
Trustee
Mr. Dirks also serves as Trustee of other Fidelity® funds. Prior to his retirement in May 2003, Mr. Dirks was Chief Operating Officer and a member of the Board of The Depository Trust & Clearing Corporation (DTCC). He also served as President, Chief Operating Officer, and Board member of The Depository Trust Company (DTC) and President and Board member of the National Securities Clearing Corporation (NSCC). In addition, Mr. Dirks served as Chief Executive Officer and Board member of the Government Securities Clearing Corporation, Chief Executive Officer and Board member of the Mortgage-Backed Securities Clearing Corporation, as a Trustee and a member of the Finance Committee of Manhattan College (2005-2008), as a Trustee and a member of the Finance Committee of AHRC of Nassau County (2006-2008), and as a member of the Independent Directors Council (IDC) Governing Council (2010-2015). Mr. Dirks is a member of the Board of Directors for The Brookville Center for Children's Services, Inc. (2009-present).
Alan J. Lacy (1953)
Year of Election or Appointment: 2008
Trustee
Mr. Lacy also serves as Trustee of other Fidelity® funds. Mr. Lacy serves as a member of the Board of Directors of Dave & Buster's Entertainment, Inc. (restaurant and entertainment complexes, 2010-present) and Bristol-Myers Squibb Company (global pharmaceuticals, 2008-present). In addition, Mr. Lacy served as Senior Adviser (2007-2014) of Oak Hill Capital Partners, L.P. (private equity) and also served as Chief Executive Officer (2000-2005) and Vice Chairman (2005-2006) of Sears Holdings Corporation and Sears, Roebuck and Co. (retail). Mr. Lacy is a member of the Board of Trustees of The National Parks Conservation Association (2006-present). Previously, Mr. Lacy served as Chairman of the Board of Trustees of the National Parks Conservation Association (2008-2011) and as a member of the Board of Directors for The Western Union Company (global money transfer, 2006-2011), The Hillman Companies, Inc. (hardware wholesalers, 2010-2014), and Earth Fare, Inc. (retail grocery, 2010-2014).
Ned C. Lautenbach (1944)
Year of Election or Appointment: 2000
Trustee
Chairman of the Independent Trustees
Mr. Lautenbach also serves as Trustee of other Fidelity® funds. Mr. Lautenbach currently serves as the Lead Director of the Eaton Corporation Board of Directors (diversified industrial, 1997-present). Mr. Lautenbach is Chairman of the Board of Directors of Artis-Naples in Naples, Florida (2012-present), a member of the Council on Foreign Relations (1994-present), and a member of the Board of Governors, State University System of Florida (2013-present). Previously, Mr. Lautenbach was a Partner/Advisory Partner at Clayton, Dubilier & Rice, LLC (private equity investment, 1998-2010), as well as a Director of Sony Corporation (2006-2007).
Joseph Mauriello (1944)
Year of Election or Appointment: 2008
Trustee
Mr. Mauriello also serves as Trustee of other Fidelity® funds. Prior to his retirement in January 2006, Mr. Mauriello served in numerous senior management positions including Deputy Chairman and Chief Operating Officer (2004-2005), and Vice Chairman of Financial Services (2002-2004) of KPMG LLP US (professional services, 1965-2005). Mr. Mauriello currently serves as a member of the Board of Directors of XL Group plc. (global insurance and re-insurance, 2006-present) and the Independent Directors Council (IDC) Governing Council (2015-present). Previously, Mr. Mauriello served as a Director of the Hamilton Funds of the Bank of New York (2006-2007) and of Arcadia Resources Inc. (health care services and products, 2007-2012).
Robert W. Selander (1950)
Year of Election or Appointment: 2011
Trustee
Mr. Selander also serves as Trustee of other Fidelity® funds. Mr. Selander serves as a Director of The Western Union Company (global money transfer, 2014-present). Previously, Mr. Selander served as a Member of the Advisory Board of other Fidelity® funds (2011), and Executive Vice Chairman (2010), Chief Executive Officer (2009-2010), and President and Chief Executive Officer (1997-2009) of Mastercard, Inc.
Cornelia M. Small (1944)
Year of Election or Appointment: 2005
Trustee
Ms. Small also serves as Trustee of other Fidelity® funds. Ms. Small is a member of the Board of Directors (2009-present) and Chair of the Investment Committee (2010-present) of the Teagle Foundation. Ms. Small also serves on the Investment Committee of the Berkshire Taconic Community Foundation (2008-present). Previously, Ms. Small served as Chairperson (2002-2008) and a member of the Investment Committee and Chairperson (2008-2012) and a member of the Board of Trustees of Smith College. In addition, Ms. Small served as Chief Investment Officer, Director of Global Equity Investments, and a member of the Board of Directors of Scudder, Stevens & Clark and Scudder Kemper Investments.
William S. Stavropoulos (1939)
Year of Election or Appointment: 2002
Trustee
Vice Chairman of the Independent Trustees
Mr. Stavropoulos also serves as Trustee of other Fidelity® funds. Mr. Stavropoulos serves as President and Founder of the Michigan Baseball Foundation, the Great Lakes Loons (2007-present). Mr. Stavropoulos is Chairman Emeritus of the Board of Directors of The Dow Chemical Company, where he previously served in numerous senior management positions, including President, CEO (1995-2000; 2002-2004), Chairman of the Executive Committee (2000-2006), and as a member of the Board of Directors (1990-2006). Currently, Mr. Stavropoulos is Chairman of the Board of Directors of Univar Inc. (global distributor of commodity and specialty chemicals), a Director of Teradata Corporation (data warehousing and technology solutions), and Maersk Inc. (industrial conglomerate), and a member of the Advisory Board for Metalmark Capital LLC (private equity investment, 2005-present). Mr. Stavropoulos is an operating advisor to Clayton, Dubilier & Rice, LLC (private equity investment). In addition, Mr. Stavropoulos is a member of the University of Notre Dame Advisory Council for the College of Science, a Trustee of the Rollin L. Gerstacker Foundation, and a Director of the Naples Philharmonic Center for the Arts. Previously, Mr. Stavropoulos served as a Director of Chemical Financial Corporation (bank holding company, 1993-2012) and Tyco International, Ltd. (multinational manufacturing and services, 2007-2012).
David M. Thomas (1949)
Year of Election or Appointment: 2008
Trustee
Mr. Thomas also serves as Trustee of other Fidelity® funds. Mr. Thomas serves as Non-Executive Chairman of the Board of Directors of Fortune Brands Home and Security (home and security products, 2011-present), as a member of the Board of Directors (2004-present) and Presiding Director (2013-present) of Interpublic Group of Companies, Inc. (marketing communication), and as a member of the Board of Trustees of the University of Florida (2013-present). Previously, Mr. Thomas served as Executive Chairman (2005-2006) and Chairman and Chief Executive Officer (2000-2005) of IMS Health, Inc. (pharmaceutical and healthcare information solutions), and a Director of Fortune Brands, Inc. (consumer products, 2000-2011).
+ The information includes the Trustee's principal occupation during the last five years and other information relating to the experience, attributes, and skills relevant to the Trustee's qualifications to serve as a Trustee, which led to the conclusion that the Trustee should serve as a Trustee for the fund.
Advisory Board Members and Officers:
Correspondence intended for an officer or Peter S. Lynch may be sent to Fidelity Investments, 245 Summer Street, Boston, Massachusetts 02210. Officers appear below in alphabetical order.
Name, Year of Birth; Principal Occupation
Peter S. Lynch (1944)
Year of Election or Appointment: 2003
Member of the Advisory Board
Mr. Lynch also serves as Member of the Advisory Board of other Fidelity® funds. Mr. Lynch is Vice Chairman and a Director of FMR (investment adviser firm) and FMR Co., Inc. (investment adviser firm). In addition, Mr. Lynch serves as a Trustee of Boston College and as the Chairman of the Inner-City Scholarship Fund. Previously, Mr. Lynch served on the Special Olympics International Board of Directors (1997-2006).
Elizabeth Paige Baumann (1968)
Year of Election or Appointment: 2012
Anti-Money Laundering (AML) Officer
Ms. Baumann also serves as AML Officer of other funds. She is Chief AML Officer of FMR LLC (diversified financial services company, 2012-present) and is an employee of Fidelity Investments. Previously, Ms. Baumann served as Vice President and Deputy Anti-Money Laundering Officer (2007-2012).
Marc R. Bryant (1966)
Year of Election or Appointment: 2015
Secretary and Chief Legal Officer (CLO)
Mr. Bryant also serves as Secretary and CLO of other funds. Mr. Bryant serves as CLO, Secretary, and Senior Vice President of Fidelity Management & Research Company (investment adviser firm, 2015-present) and FMR Co., Inc. (investment adviser firm, 2015-present); Secretary of Fidelity SelectCo, LLC (investment adviser firm, 2015-present) and Fidelity Investments Money Management, Inc. (investment adviser firm, 2015-present); and CLO of Fidelity Management & Research (Hong Kong) Limited (investment adviser firm, 2015-present). He is Senior Vice President and Deputy General Counsel of FMR LLC (diversified financial services company). Previously, Mr. Bryant served as Secretary and Chief Legal Officer of Fidelity Rutland Square Trust II (2010-2014) and Assistant Secretary of Fidelity's Fixed Income and Asset Allocation Funds (2013-2015). Prior to joining Fidelity Investments, Mr. Bryant served as a Senior Vice President and the Head of Global Retail Legal for AllianceBernstein L.P. (2006-2010), and as the General Counsel for ProFund Advisors LLC (2001-2006).
William C. Coffey (1969)
Year of Election or Appointment: 2009
Assistant Secretary
Mr. Coffey also serves as Assistant Secretary of other funds. He is Senior Vice President and Deputy General Counsel of FMR LLC (diversified financial services company, 2010-present), and is an employee of Fidelity Investments. Previously, Mr. Coffey served as Vice President and Associate General Counsel of FMR LLC (2005-2009).
Jonathan Davis (1968)
Year of Election or Appointment: 2010
Assistant Treasurer
Mr. Davis also serves as Assistant Treasurer of other funds, and is an employee of Fidelity Investments. Previously, Mr. Davis served as Vice President and Associate General Counsel of FMR LLC (diversified financial services company, 2003-2010).
Adrien E. Deberghes (1967)
Year of Election or Appointment: 2008
Deputy Treasurer
Mr. Deberghes also serves as an officer of other funds. He is an employee of Fidelity Investments (2008-present). Prior to joining Fidelity Investments, Mr. Deberghes was Senior Vice President of Mutual Fund Administration at State Street Corporation (2007-2008), Senior Director of Mutual Fund Administration at Investors Bank & Trust (2005-2007), and Director of Finance for Dunkin' Brands (2000-2005).
Stephanie J. Dorsey (1969)
Year of Election or Appointment: 2010
Assistant Treasurer
Ms. Dorsey also serves as an officer of other funds. She is an employee of Fidelity Investments (2008-present) and has served in other fund officer roles. Prior to joining Fidelity Investments, Ms. Dorsey served as Treasurer (2004-2008) of the JPMorgan Mutual Funds and Vice President (2004-2008) of JPMorgan Chase Bank.
Howard J. Galligan III (1966)
Year of Election or Appointment: 2014
Chief Financial Officer
Mr. Galligan also serves as Chief Financial Officer of other funds. Mr. Galligan serves as President of Fidelity Pricing and Cash Management Services (FPCMS) (2014-present) and as a Director of Strategic Advisers, Inc. (investment adviser firm, 2008-present). Previously, Mr. Galligan served as Chief Administrative Officer of Asset Management (2011-2014) and Chief Operating Officer and Senior Vice President of Investment Support for Strategic Advisers, Inc. (2003-2011).
Scott C. Goebel (1968)
Year of Election or Appointment: 2015
Vice President
Mr. Goebel serves as Vice President of other funds and is an employee of Fidelity Investments (2001-present). Previously, Mr. Goebel served as Secretary of Fidelity SelectCo, LLC (investment adviser firm, 2013-2015), Fidelity Investments Money Management, Inc. (FIMM) (investment adviser firm, 2010-2015), and Fidelity Research and Analysis Company (FRAC) (investment adviser firm, 2010-2015); General Counsel, Secretary, and Senior Vice President of Fidelity Management & Research Company (investment adviser firm, 2008-2015) and FMR Co., Inc. (investment adviser firm, 2008-2015); Assistant Secretary of Fidelity Management & Research (Japan) Limited (investment adviser firm, 2008-2015) and FMR Investment Management (U.K.) Limited (investment adviser firm, 2008-2015); Chief Legal Officer (CLO) of Fidelity Management & Research (Hong Kong) Limited (investment adviser firm, 2008-2015); Secretary and CLO of certain Fidelity® funds (2008-2015); Assistant Secretary of FIMM (2008-2010), FRAC (2008-2010), and certain funds (2007-2008); and as Vice President and Secretary of Fidelity Distributors Corporation (FDC) (2005-2007).
Thomas C. Hense (1964)
Year of Election or Appointment: 2008, 2010, or 2015
Vice President
Mr. Hense serves as Vice President of Fidelity Advisor® Multi-Asset Income Fund (2015) and other funds (High Income (2008), Small Cap (2008), and Value (2010) funds), and is an employee of Fidelity Investments (1993-present). Previously, Mr. Hense served as a portfolio manager for Fidelity's Institutional Money Management Group (Pyramis) (2003-2008).
Brian B. Hogan (1964)
Year of Election or Appointment: 2009
Vice President
Mr. Hogan also serves as Trustee or Vice President of other funds. Mr. Hogan serves as a Director of Fidelity SelectCo, LLC (investment adviser firm, 2014-present) and President of the Equity Division of FMR (investment adviser firm, 2009-present). Previously, Mr. Hogan served as Senior Vice President, Equity Research of FMR (2006-2009) and as a portfolio manager.
Chris Maher (1972)
Year of Election or Appointment: 2013
Assistant Treasurer
Mr. Maher serves as Assistant Treasurer of other funds. Mr. Maher is Vice President of Valuation Oversight and is an employee of Fidelity Investments. Previously, Mr. Maher served as Vice President of Asset Management Compliance (2013), Vice President of the Program Management Group of FMR (investment adviser firm, 2010-2013), and Vice President of Valuation Oversight (2008-2010).
Kenneth B. Robins (1969)
Year of Election or Appointment: 2008
President and Treasurer
Mr. Robins also serves as an officer of other funds. Mr. Robins serves as Executive Vice President of Fidelity Investments Money Management, Inc. (FIMM) (investment adviser firm, 2013-present) and is an employee of Fidelity Investments (2004-present). Previously, Mr. Robins served in other fund officer roles.
Stacie M. Smith (1974)
Year of Election or Appointment: 2013
Deputy Treasurer
Ms. Smith also serves as an officer of other funds. She is an employee of Fidelity Investments (2009-present) and has served in other fund officer roles. Prior to joining Fidelity Investments, Ms. Smith served as Senior Audit Manager of Ernst & Young LLP (1996-2009).
Renee Stagnone (1975)
Year of Election or Appointment: 2013
Deputy Treasurer
Ms. Stagnone also serves as Deputy Treasurer of other funds. Ms. Stagnone is an employee of Fidelity Investments (1997-present).
Linda J. Wondrack (1964)
Year of Election or Appointment: 2014
Chief Compliance Officer
Ms. Wondrack also serves as Chief Compliance Officer of other funds. Ms. Wondrack is Executive Vice President and head of the Ethics Office and Asset Management Compliance for Fidelity Investments (2012-present). Ms. Wondrack also serves as Chief Compliance Officer of Fidelity SelectCo, LLC (investment adviser firm, 2014-present); Chief Compliance Officer of Impresa Management LLC (2013-present); and Chief Compliance Officer of FMR Co., Inc. (investment adviser firm), Fidelity Investments Money Management, Inc. (investment adviser firm), Fidelity Management & Research (Japan) Limited (investment adviser firm), FMR Investment Management (U.K.) Limited (investment adviser firm), Fidelity Management & Research (Hong Kong) (investment adviser firm), Fidelity Management & Research Company (investment adviser firm), FIAM LLC (investment adviser firm), and Strategic Advisers, Inc. (investment adviser firm), Ballyrock Investment Advisors LLC, and Northern Neck Investors LLC (2012-present). Previously, Ms. Wondrack served as Senior Vice President and Chief Compliance Officer for Columbia Management Investment Advisers, LLC (2005-2012); Chief Compliance Officer for certain funds within the Columbia Family of Funds (2007-2012); and Senior Vice President of Compliance Risk Management at Bank of America (2005-2010).
Joseph F. Zambello (1957)
Year of Election or Appointment: 2011
Deputy Treasurer
Mr. Zambello also serves as Deputy Treasurer of other funds. Mr. Zambello is an employee of Fidelity Investments (1991-present). Previously, Mr. Zambello served as Vice President of the Program Management Group of FMR (investment adviser firm, 2009-2011) and Vice President of the Transfer Agent Oversight Group (2005-2009).
Shareholder Expense Example
As a shareholder of the Fund, you incur two types of costs: (1) transaction costs and (2) ongoing costs, including management fees and other Fund expenses. This Example is intended to help you understand your ongoing costs (in dollars) of investing in the Fund and to compare these costs with the ongoing costs of investing in other mutual funds.
The Example is based on an investment of $1,000 invested at the beginning of the period and held for the entire period (May 1, 2015 to October 31, 2015).
Actual Expenses
The first line of the accompanying table for each class of the Fund provides information about actual account values and actual expenses. You may use the information in this line, together with the amount you invested, to estimate the expenses that you paid over the period. Simply divide your account value by $1,000.00 (for example, an $8,600 account value divided by $1,000.00 = 8.6), then multiply the result by the number in the first line for a class of the Fund under the heading entitled "Expenses Paid During Period" to estimate the expenses you paid on your account during this period. A small balance maintenance fee of $12.00 that is charged once a year may apply for certain accounts with a value of less than $2,000. This fee is not included in the table below. If it was, the estimate of expenses you paid during the period would be higher, and your ending account value lower, by this amount. In addition, the Fund, as a shareholder in the underlying Fidelity Central Funds, will indirectly bear its pro-rata share of the fees and expenses incurred by the underlying Fidelity Central Funds. These fees and expenses are not included in the Fund's annualized expense ratio used to calculate the expense estimate in the table below.
Hypothetical Example for Comparison Purposes
The second line of the accompanying table for each class of the Fund provides information about hypothetical account values and hypothetical expenses based on a Class' actual expense ratio and an assumed rate of return of 5% per year before expenses, which is not the Class' actual return. The hypothetical account values and expenses may not be used to estimate the actual ending account balance or expenses you paid for the period. You may use this information to compare the ongoing costs of investing in the Fund and other funds. To do so, compare this 5% hypothetical example with the 5% hypothetical examples that appear in the shareholder reports of the other funds. A small balance maintenance fee of $12.00 that is charged once a year may apply for certain accounts with a value of less than $2,000. This fee is not included in the table below. If it was, the estimate of expenses you paid during the period would be higher, and your ending account value lower, by this amount. In addition, the Fund, as a shareholder in the underlying Fidelity Central Funds, will indirectly bear its pro-rata share of the fees and expenses incurred by the underlying Fidelity Central Funds. These fees and expenses are not included in the Fund's annualized expense ratio used to calculate the expense estimate in the table below.
Please note that the expenses shown in the table are meant to highlight your ongoing costs only and do not reflect any transaction costs. Therefore, the second line of the table is useful in comparing ongoing costs only, and will not help you determine the relative total costs of owning different funds.
| Annualized Expense Ratio-A | Beginning Account Value May 1, 2015 | Ending Account Value October 31, 2015 | Expenses Paid During Period-B May 1, 2015 to October 31, 2015 | |
| Value | .81% | |||
| Actual | $1,000.00 | $944.80 | $3.97 | |
| Hypothetical-C | $1,000.00 | $1,021.12 | $4.13 | |
| Class K | .70% | |||
| Actual | $1,000.00 | $945.40 | $3.43 | |
| Hypothetical-C | $1,000.00 | $1,021.68 | $3.57 |
A Annualized expense ratio reflects expenses net of applicable fee waivers.
B Expenses are equal to each Class' annualized expense ratio, multiplied by the average account value over the period, multiplied by 184/365 (to reflect the one-half year period).
C 5% return per year before expenses
Distributions (Unaudited)
The Board of Trustees of Fidelity Value Fund voted to pay on December 7, 2015, to shareholders of record at the opening of business on December 4, 2015, the following distributions per share derived from capital gains realized from sales of portfolio securities, and dividends derived from net investment income:
| Pay Date | Record Date | Dividends | Capital Gains | |
| K Class | 12/07/15 | 12/04/15 | $1.283 | $9.355 |
The fund hereby designates as a capital gain dividend with respect to the taxable year ended October 31, 2015, $596,996,371 or, if subsequently determined to be different, the net capital gain of such year.
K Class designates 86% of the dividends distributed in during the fiscal year as qualifying for the dividends–received deduction for corporate shareholders.
K Class designates 100% of the dividends distributed in during the fiscal year as amounts which may be taken into account as a dividend for the purposes of the maximum rate under section 1(h)(11) of the Internal Revenue Code.
The fund will notify shareholders in January 2016 of amounts for use in preparing 2015 income tax returns.
Board Approval of Investment Advisory Contracts and Management Fees
Fidelity Value Fund
Each year, the Board of Trustees, including the Independent Trustees (together, the Board), votes on the renewal of the management contract with Fidelity Management & Research Company (FMR) and the sub-advisory agreements (together, the Advisory Contracts) for the fund. The Board, assisted by the advice of fund counsel and Independent Trustees' counsel, requests and considers a broad range of information relevant to the renewal of the Advisory Contracts throughout the year.
The Board meets regularly and, at each of its meetings, covers an extensive agenda of topics and materials and considers factors that are relevant to its annual consideration of the renewal of the fund's Advisory Contracts, including the services and support provided to the fund and its shareholders. The Board has established various standing committees (Committees), each composed of and chaired by Independent Trustees with varying backgrounds, to which the Board has assigned specific subject matter responsibilities in order to enhance effective decision-making by the Board. The Board, acting directly and through its Committees, requests and receives information concerning the annual consideration of the renewal of the fund's Advisory Contracts. The Board also meets as needed to consider matters specifically related to the Board's annual consideration of the renewal of the Advisory Contracts. Members of the Board may also meet with trustees of other Fidelity funds through ad hoc joint committees to discuss certain matters relevant to all of the Fidelity funds.
At its July 2015 meeting, the Board unanimously determined to renew the fund's Advisory Contracts. In reaching its determination, the Board considered all factors it believed relevant, including (i) the nature, extent, and quality of the services to be provided to the fund and its shareholders (including the investment performance of the fund); (ii) the competitiveness of the fund's management fee and total expense ratio relative to peer funds; (iii) the total costs of the services to be provided by and the profits to be realized by Fidelity from its relationship with the fund; and (iv) the extent to which (if any) economies of scale exist and would be realized as the fund grows, and whether any economies of scale are appropriately shared with fund shareholders.
In considering whether to renew the Advisory Contracts for the fund, the Board reached a determination, with the assistance of fund counsel and Independent Trustees' counsel and through the exercise of its business judgment, that the renewal of the Advisory Contracts was in the best interests of the fund and its shareholders and that the compensation payable under the Advisory Contracts was fair and reasonable. The Board's decision to renew the Advisory Contracts was not based on any single factor, but rather was based on a comprehensive consideration of all the information provided to the Board at its meetings throughout the year. The Board, in reaching its determination to renew the Advisory Contracts, was aware that shareholders of the fund have a broad range of investment choices available to them, including a wide choice among funds offered by Fidelity's competitors, and that the fund's shareholders, who have the opportunity to review and weigh the disclosure provided by the fund in its prospectus and other public disclosures, have chosen to invest in this fund, which is part of the Fidelity family of funds.
Nature, Extent, and Quality of Services Provided. The Board considered Fidelity's staffing as it relates to the fund, including the backgrounds of investment personnel of Fidelity, and also considered the fund's investment objective, strategies, and related investment philosophy. The Independent Trustees also had discussions with senior management of Fidelity's investment operations and investment groups. The Board considered the structure of the portfolio manager compensation program and whether this structure provides appropriate incentives to act in the best interests of the fund. Additionally, the Board considered the portfolio managers' investments, if any, in the funds that they manage.Resources Dedicated to Investment Management and Support Services. The Board and the Fund Oversight and Research Committees reviewed the general qualifications and capabilities of Fidelity's investment staff, including its size, education, experience, and resources, as well as Fidelity's approach to recruiting, training, managing, and compensating investment personnel. The Board noted that Fidelity has continued to increase the resources devoted to non-U.S. offices, including expansion of Fidelity's global investment organization. The Board also noted that Fidelity's analysts have extensive resources, tools and capabilities that allow them to conduct sophisticated quantitative and fundamental analysis, as well as credit analysis of issuers, counterparties and guarantors. Further, the Board considered that Fidelity's investment professionals have sufficient access to global information and data so as to provide competitive investment results over time, and that those professionals also have access to sophisticated tools that permit them to assess portfolio construction and risk and performance attribution characteristics continuously, as well as to transmit new information and research conclusions rapidly around the world. Additionally, in its deliberations, the Board considered Fidelity's trading, risk management, and compliance capabilities and resources, which are integral parts of the investment management process.Shareholder and Administrative Services. The Board considered (i) the nature, extent, quality, and cost of advisory, administrative, and shareholder services performed by FMR, the sub-advisers (together with FMR, the Investment Advisers), and their affiliates under the Advisory Contracts and under separate agreements covering transfer agency, pricing and bookkeeping, and securities lending services for the fund; (ii) the nature and extent of the supervision of third party service providers, principally custodians and subcustodians; and (iii) the resources devoted to, and the record of compliance with, the fund's compliance policies and procedures. The Board also reviewed the allocation of fund brokerage, including allocations to brokers affiliated with the Investment Advisers, the use of brokerage commissions to pay fund expenses, and the use of "soft" commission dollars to pay for research services.The Board noted that the growth of fund assets over time across the complex allows Fidelity to reinvest in the development of services designed to enhance the value or convenience of the Fidelity funds as investment vehicles. These services include 24-hour access to account information and market information through telephone representatives and over the Internet, investor education materials and asset allocation tools, and the expanded availability of Fidelity Investor Centers.In 2014, the Board formed an ad hoc Committee on Transfer Agency Fees to review the variety of transfer agency fee structures throughout the industry and Fidelity's competitive positioning with respect to industry participants.Investment in a Large Fund Family. The Board considered the benefits to shareholders of investing in a Fidelity fund, including the benefits of investing in a fund that is part of a large family of funds offering a variety of investment disciplines and providing a large variety of mutual fund investor services. The Board noted that Fidelity had taken, or had made recommendations that resulted in the Fidelity funds taking, a number of actions over the previous year that benefited particular funds, including (i) continuing to dedicate additional resources to investment research and to the support of the senior management team that oversees asset management; (ii) continuing efforts to enhance Fidelity's global research capabilities; (iii) launching new funds and making other enhancements to meet client needs; (iv) reducing management fees and total expenses for certain index funds and diversified international funds; (v) continuing to launch dedicated lower cost underlying funds to meet portfolio construction needs related to expanding underlying fund options for Fidelity funds of funds, specifically for the Freedom Fund product lines; (vi) rationalizing product lines and gaining increased efficiencies through fund mergers; (vii) launching active fixed-income exchange-traded funds; (viii) continuing to develop, acquire and implement systems and technology to improve services to the funds and information security and to increase efficiency; (ix) implementing investment enhancements to further strengthen Fidelity's target date product line to increase investors' probability of success in achieving their goals; (x) modifying the eligibility criteria for certain share classes to accommodate roll-over assets from employer-sponsored retirement plans; (xi) launching a new Class W of the Freedom Index Funds to attract and retain Fidelity record-kept retirement plan assets; and (xii) implementing changes to Fidelity's money market product line in response to recent money market regulatory reforms.Investment Performance. The Board considered whether the fund has operated in accordance with its investment objective, as well as its record of compliance with its investment restrictions and its performance history. The Board noted that there was a portfolio management change for the fund in January 2014.The Board took into account discussions with representatives of the Investment Advisers about fund investment performance that occur at Board meetings throughout the year. In this regard the Board noted that as part of regularly scheduled fund reviews and other reports to the Board on fund performance, the Board considers annualized return information for the fund, for different time periods, measured against a securities market index ("benchmark index") and a peer group of funds with similar objectives ("peer group"), if any. In its evaluation of fund investment performance, the Board gave particular attention to information indicating changes in performance of certain Fidelity funds for specific time periods and discussed with the Investment Advisers the reasons for any overperformance or underperformance.In addition to reviewing absolute and relative fund performance, the Independent Trustees periodically consider the appropriateness of fund performance metrics in evaluating the results achieved. In general, the Independent Trustees believe that fund performance should be evaluated based on net performance (after fees and expenses) of both the highest performing and lowest performing fund share classes, where applicable, compared to appropriate benchmark indices, over appropriate time periods that may include full market cycles, and compared to peer groups, as applicable, over the same periods, taking into account relevant factors including the following: general market conditions; issuer-specific information; and fund cash flows and other factors.The Independent Trustees recognize that shareholders evaluate performance on a net basis over their own holding periods, for which one-, three-, and five-year periods are often used as a proxy. For this reason, the performance information reviewed by the Board also included net cumulative calendar year total return information for the fund and an appropriate benchmark index and peer group for the most recent one-, three-, and five-year periods, as shown below. Returns are shown compared to the 25th percentile (top of box, 75% beaten) and 75th percentile (bottom of box, 25% beaten) of the peer universe.Fidelity Value Fund
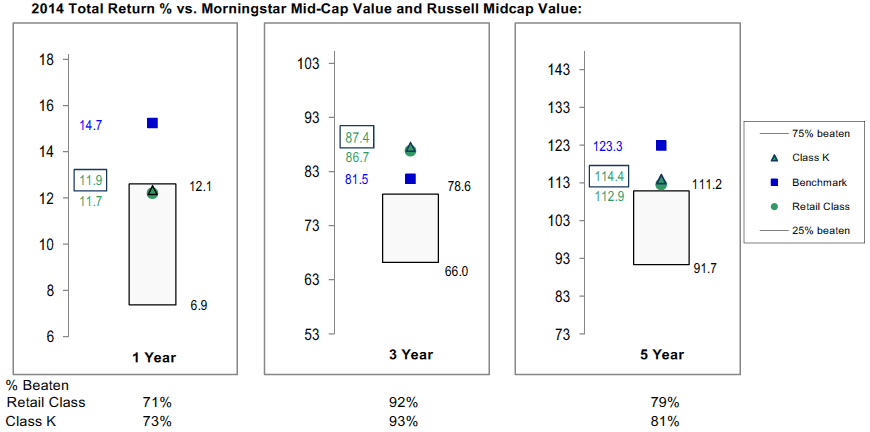
Fidelity Value Fund
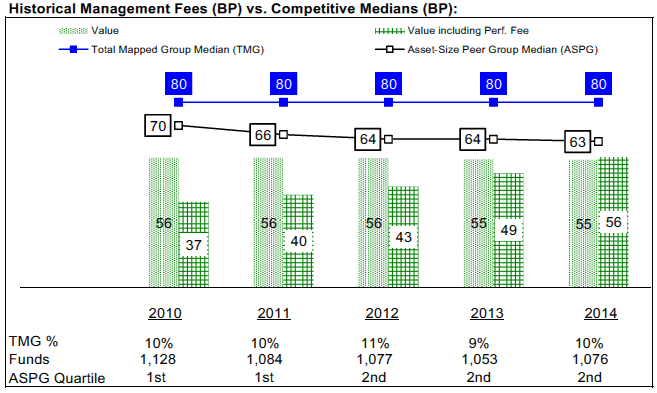
![]()
Corporate Headquarters
245 Summer St.
Boston, MA 02210
www.fidelity.com
VAL-K-ANN-1215
1.863247.107
Fidelity® Disciplined Equity Fund Class K Annual Report October 31, 2015 |
|
Contents
Board Approval of Investment Advisory Contracts and Management Fees |
To view a fund's proxy voting guidelines and proxy voting record for the 12-month period ended June 30, visit http://www.fidelity.com/proxyvotingresults or visit the Securities and Exchange Commission's (SEC) web site at http://www.sec.gov.
You may also call 1-800-835-5092 to request a free copy of the proxy voting guidelines.
Standard & Poor's, S&P and S&P 500 are registered service marks of The McGraw-Hill Companies, Inc. and have been licensed for use by Fidelity Distributors Corporation.
Other third-party marks appearing herein are the property of their respective owners.
All other marks appearing herein are registered or unregistered trademarks or service marks of FMR LLC or an affiliated company. © 2015 FMR LLC. All rights reserved.
This report and the financial statements contained herein are submitted for the general information of the shareholders of the Fund. This report is not authorized for distribution to prospective investors in the Fund unless preceded or accompanied by an effective prospectus.
A fund files its complete schedule of portfolio holdings with the SEC for the first and third quarters of each fiscal year on Form N-Q. Forms N-Q are available on the SEC’s web site at http://www.sec.gov. A fund's Forms N-Q may be reviewed and copied at the SEC’s Public Reference Room in Washington, DC. Information regarding the operation of the SEC's Public Reference Room may be obtained by calling 1-800-SEC-0330.
For a complete list of a fund's portfolio holdings, view the most recent holdings listing, semiannual report, or annual report on Fidelity's web site at http://www.fidelity.com, http://www.advisor.fidelity.com, or http://www.401k.com, as applicable.
NOT FDIC INSURED •MAY LOSE VALUE •NO BANK GUARANTEE
Neither the Fund nor Fidelity Distributors Corporation is a bank.
Performance: The Bottom Line
Average annual total return reflects the change in the value of an investment, assuming reinvestment of distributions from dividend income and capital gains (the profits earned upon the sale of securities that have grown in value, if any) and assuming a constant rate of performance each year.
The hypothetical investment and the average annual total returns do not reflect the deduction of taxes that a shareholder would pay on fund distributions or the redemption of fund shares.
During periods of reimbursement by Fidelity, a fund’s total return will be greater than it would be had the reimbursement not occurred.
How a fund did yesterday is no guarantee of how it will do tomorrow.
Average Annual Total Returns
| For the periods ended October 31, 2015 | Past 1 year | Past 5 years | Past 10 years |
| Class K | 4.78% | 13.04% | 6.36% |
The initial offering of Class K shares took place on May 9, 2008. Returns prior to May 9, 2008 are those of Fidelity® Disciplined Equity Fund, the original class of the fund.
$10,000 Over 10 Years
Let's say hypothetically that $10,000 was invested in Fidelity® Disciplined Equity Fund - Class K on October 31, 2005.
The chart shows how the value of your investment would have changed, and also shows how the S&P 500® Index performed over the same period.
See above for additional information regarding the performance of Class K.
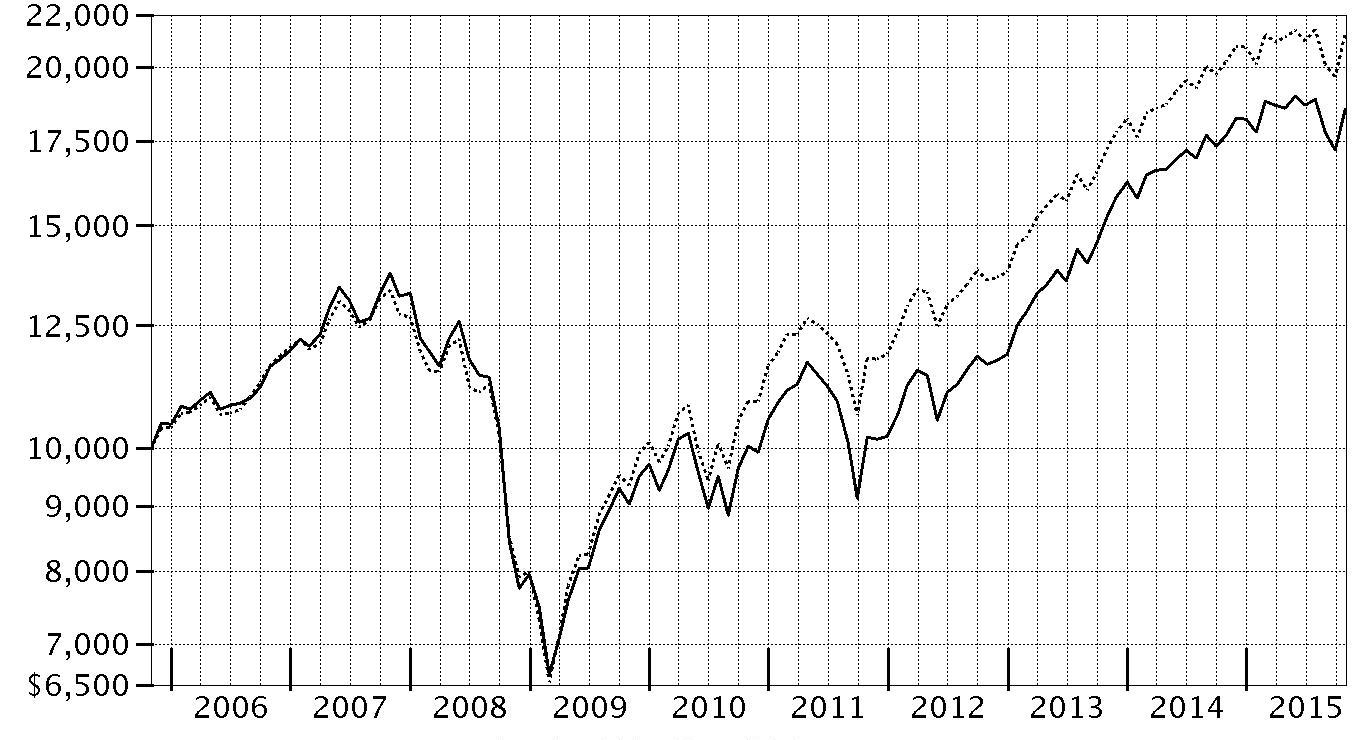
| Period Ending Values | ||
| $18,528 | Fidelity® Disciplined Equity Fund - Class K | |
| $21,289 | S&P 500® Index | |
Management's Discussion of Fund Performance
Market Recap: U.S. stocks gained moderately for the 12 months ending October 31, 2015, helped by a strong October that largely erased a steep decline in August and September on concern about slowing global economic growth emanating from China. Stocks benefited late in the period amid waning expectations for a near-term interest-rate hike by the U.S. Federal Reserve, additional economic stimulus in Europe and an interest-rate cut in China. The large-cap S&P 500® index advanced 5.20% for the period, with growth stocks in the index significantly outpacing value stocks, as investors continued to seek growth in a subpar economic environment. The growth-oriented Nasdaq Composite Index® also benefited, gaining 10.39%, while the small-cap Russell 2000® Index lost its edge, returning only 0.34%, as risk appetites waned. Among sectors in the widely followed S&P 500®, consumer discretionary (+21%) led the way, benefiting from a combination of rising personal income and still-benign inflation. Technology (+11%) and consumer staples (+9%) also outpaced the index. Conversely, energy (-19%) performed worst, in an environment of depressed commodity prices that also hit materials (-4%). At period end, investors remained focused on the potential global implications of a relatively stronger U.S. dollar and how China’s transition toward a consumption-led economy may affect corporate earnings.Comments from Portfolio Manager Alex Devereaux: For the year, the fund’s share classes returned solid mid-single-digit gains, modestly underperforming the benchmark S&P 500®. The fund was hurt by its exposure to higher-volatility and value-oriented investments that underperformed. Security selection was a positive, although picks among retailing and utilities names weighed on the fund’s relative results. An overweighting in Navient was the fund’s biggest detractor. Shares of the consumer finance company, which focuses on education loan servicing, declined. The firm suffered a number of hits, including canceled contracts and a possible lawsuit by the U.S. Consumer Financial Protection Bureau alleging mistreatment of its borrowers. We sold our Navient position by period end. Nabors Industries also hurt performance. It fell along with the rest of the energy sector as oil prices collapsed. We sold the position in January, but not soon enough to counter the significant loss. Conversely, stock picks within energy and industrials – particularly among airlines stocks – were a big plus. Supermarket and convenience store chain Kroger continued to be a core fund holding and was our top individual contributor. Investors were attracted to the firm’s expanding revenue and profits, which beat analyst estimates this period amid a slow-growth market.The views expressed above reflect those of the portfolio manager(s) only through the end of the period as stated on the cover of this report and do not necessarily represent the views of Fidelity or any other person in the Fidelity organization. Any such views are subject to change at any time based upon market or other conditions and Fidelity disclaims any responsibility to update such views. These views may not be relied on as investment advice and, because investment decisions for a Fidelity fund are based on numerous factors, may not be relied on as an indication of trading intent on behalf of any Fidelity fund.
Investment Summary (Unaudited)
Top Ten Stocks as of October 31, 2015
| % of fund's net assets | % of fund's net assets 6 months ago | |
| Apple, Inc. | 4.5 | 4.8 |
| General Electric Co. | 2.3 | 0.0 |
| Amazon.com, Inc. | 2.1 | 0.0 |
| Johnson & Johnson | 2.1 | 2.3 |
| Wells Fargo & Co. | 2.1 | 1.8 |
| JPMorgan Chase & Co. | 2.0 | 2.1 |
| Procter & Gamble Co. | 1.7 | 1.9 |
| Bank of America Corp. | 1.7 | 1.7 |
| Alphabet, Inc. Class A | 1.7 | 1.0 |
| AT&T, Inc. | 1.7 | 0.5 |
| 21.9 |
Top Five Market Sectors as of October 31, 2015
| % of fund's net assets | % of fund's net assets 6 months ago | |
| Information Technology | 21.3 | 21.5 |
| Health Care | 16.4 | 15.9 |
| Consumer Discretionary | 14.8 | 12.4 |
| Financials | 14.2 | 14.4 |
| Industrials | 8.5 | 8.4 |
Asset Allocation (% of fund's net assets)
| As of October 31, 2015 * | ||
| Stocks | 98.1% | |
| Short-Term Investments and Net Other Assets (Liabilities) | 1.9% | |

* Foreign investments - 7.6%
| As of April 30, 2015* | ||
| Stocks | 98.3% | |
| Short-Term Investments and Net Other Assets (Liabilities) | 1.7% | |

* Foreign investments - 6.7%
Investments October 31, 2015
Showing Percentage of Net Assets
| Common Stocks - 98.1% | |||
| Shares | Value (000s) | ||
| CONSUMER DISCRETIONARY - 14.8% | |||
| Diversified Consumer Services - 1.2% | |||
| H&R Block, Inc. | 189,040 | $7,044 | |
| ServiceMaster Global Holdings, Inc. (a) | 294,500 | 10,499 | |
| 17,543 | |||
| Hotels, Restaurants & Leisure - 1.7% | |||
| Las Vegas Sands Corp. | 254,438 | 12,597 | |
| Starbucks Corp. | 218,524 | 13,673 | |
| 26,270 | |||
| Household Durables - 0.7% | |||
| Whirlpool Corp. | 65,067 | 10,420 | |
| Internet & Catalog Retail - 2.9% | |||
| Amazon.com, Inc. (a) | 51,623 | 32,311 | |
| Netflix, Inc. (a) | 110,212 | 11,945 | |
| 44,256 | |||
| Media - 1.3% | |||
| Comcast Corp. Class A | 161,633 | 10,121 | |
| Gannett Co., Inc. | 566,645 | 8,964 | |
| 19,085 | |||
| Multiline Retail - 1.2% | |||
| Macy's, Inc. | 245,664 | 12,524 | |
| Target Corp. | 66,221 | 5,111 | |
| 17,635 | |||
| Specialty Retail - 4.3% | |||
| Best Buy Co., Inc. | 145,185 | 5,086 | |
| GameStop Corp. Class A (b) | 242,556 | 11,175 | |
| Home Depot, Inc. | 178,790 | 22,106 | |
| Michaels Companies, Inc. (a) | 376,066 | 8,792 | |
| Ross Stores, Inc. | 111,584 | 5,644 | |
| Staples, Inc. | 955,458 | 12,411 | |
| 65,214 | |||
| Textiles, Apparel & Luxury Goods - 1.5% | |||
| Michael Kors Holdings Ltd. (a) | 115,981 | 4,482 | |
| NIKE, Inc. Class B | 63,716 | 8,349 | |
| PVH Corp. | 115,927 | 10,544 | |
| 23,375 | |||
| TOTAL CONSUMER DISCRETIONARY | 223,798 | ||
| CONSUMER STAPLES - 8.2% | |||
| Beverages - 0.8% | |||
| PepsiCo, Inc. | 98,622 | 10,078 | |
| The Coca-Cola Co. | 51,607 | 2,186 | |
| 12,264 | |||
| Food & Staples Retailing - 2.2% | |||
| CVS Health Corp. | 198,650 | 19,623 | |
| Kroger Co. | 366,998 | 13,873 | |
| 33,496 | |||
| Food Products - 0.6% | |||
| Flowers Foods, Inc. | 47,587 | 1,285 | |
| Mead Johnson Nutrition Co. Class A | 24,374 | 1,999 | |
| The J.M. Smucker Co. | 49,591 | 5,821 | |
| 9,105 | |||
| Household Products - 1.7% | |||
| Procter & Gamble Co. | 346,843 | 26,492 | |
| Personal Products - 1.6% | |||
| Coty, Inc. Class A | 355,267 | 10,285 | |
| Herbalife Ltd. (a) | 183,350 | 10,275 | |
| Nu Skin Enterprises, Inc. Class A | 76,801 | 2,935 | |
| 23,495 | |||
| Tobacco - 1.3% | |||
| Altria Group, Inc. | 69,901 | 4,227 | |
| Reynolds American, Inc. | 304,282 | 14,703 | |
| 18,930 | |||
| TOTAL CONSUMER STAPLES | 123,782 | ||
| ENERGY - 6.3% | |||
| Energy Equipment & Services - 1.9% | |||
| Baker Hughes, Inc. | 233,528 | 12,302 | |
| Cameron International Corp. (a) | 169,651 | 11,538 | |
| Schlumberger Ltd. | 56,333 | 4,403 | |
| 28,243 | |||
| Oil, Gas & Consumable Fuels - 4.4% | |||
| Chevron Corp. | 199,328 | 18,115 | |
| Cimarex Energy Co. | 13,261 | 1,566 | |
| Exxon Mobil Corp. | 43,801 | 3,624 | |
| HollyFrontier Corp. | 218,846 | 10,717 | |
| PBF Energy, Inc. Class A | 352,327 | 11,979 | |
| Phillips 66 Co. | 113,541 | 10,111 | |
| World Fuel Services Corp. | 254,845 | 11,330 | |
| 67,442 | |||
| TOTAL ENERGY | 95,685 | ||
| FINANCIALS - 14.2% | |||
| Banks - 7.4% | |||
| Bank of America Corp. | 1,549,293 | 25,997 | |
| Citigroup, Inc. | 451,554 | 24,009 | |
| JPMorgan Chase & Co. | 472,341 | 30,348 | |
| Wells Fargo & Co. | 596,071 | 32,271 | |
| 112,625 | |||
| Capital Markets - 1.0% | |||
| Goldman Sachs Group, Inc. | 81,069 | 15,200 | |
| Consumer Finance - 1.7% | |||
| Ally Financial, Inc. (a) | 38,115 | 759 | |
| Capital One Financial Corp. | 192,832 | 15,214 | |
| Santander Consumer U.S.A. Holdings, Inc. (a) | 491,601 | 8,854 | |
| Synchrony Financial (a)(b) | 27,729 | 853 | |
| 25,680 | |||
| Diversified Financial Services - 0.8% | |||
| Berkshire Hathaway, Inc. Class B (a) | 90,728 | 12,341 | |
| Insurance - 1.1% | |||
| ACE Ltd. | 1,163 | 132 | |
| American International Group, Inc. | 36,276 | 2,288 | |
| Assured Guaranty Ltd. | 412,695 | 11,324 | |
| MetLife, Inc. | 15,762 | 794 | |
| Prudential Financial, Inc. | 16,521 | 1,363 | |
| 15,901 | |||
| Real Estate Investment Trusts - 0.7% | |||
| Annaly Capital Management, Inc. | 1,066,078 | 10,607 | |
| Real Estate Management & Development - 1.5% | |||
| CBRE Group, Inc. (a) | 311,905 | 11,628 | |
| Jones Lang LaSalle, Inc. | 66,521 | 11,090 | |
| 22,718 | |||
| TOTAL FINANCIALS | 215,072 | ||
| HEALTH CARE - 16.4% | |||
| Biotechnology - 5.0% | |||
| AbbVie, Inc. | 319,904 | 19,050 | |
| Amgen, Inc. | 120,550 | 19,069 | |
| Gilead Sciences, Inc. | 194,850 | 21,069 | |
| Incyte Corp. (a) | 70,480 | 8,284 | |
| Medivation, Inc. (a) | 194,573 | 8,184 | |
| 75,656 | |||
| Health Care Equipment & Supplies - 0.4% | |||
| Medtronic PLC | 74,786 | 5,528 | |
| Health Care Providers & Services - 5.3% | |||
| AmerisourceBergen Corp. | 134,261 | 12,958 | |
| Cardinal Health, Inc. | 164,342 | 13,509 | |
| Centene Corp. (a) | 158,428 | 9,423 | |
| Express Scripts Holding Co. (a) | 187,432 | 16,190 | |
| McKesson Corp. | 76,389 | 13,658 | |
| UnitedHealth Group, Inc. | 127,384 | 15,003 | |
| 80,741 | |||
| Life Sciences Tools & Services - 0.3% | |||
| Agilent Technologies, Inc. | 121,727 | 4,596 | |
| Pharmaceuticals - 5.4% | |||
| Eli Lilly & Co. | 218,888 | 17,855 | |
| Endo Health Solutions, Inc. (a) | 188,847 | 11,329 | |
| Johnson & Johnson | 319,605 | 32,290 | |
| Mylan N.V. | 143,100 | 6,309 | |
| Pfizer, Inc. | 413,638 | 13,989 | |
| 81,772 | |||
| TOTAL HEALTH CARE | 248,293 | ||
| INDUSTRIALS - 8.5% | |||
| Aerospace & Defense - 2.2% | |||
| Huntington Ingalls Industries, Inc. | 98,298 | 11,790 | |
| Raytheon Co. | 72,723 | 8,538 | |
| The Boeing Co. | 88,429 | 13,094 | |
| 33,422 | |||
| Air Freight & Logistics - 0.1% | |||
| C.H. Robinson Worldwide, Inc. | 19,384 | 1,345 | |
| Airlines - 2.9% | |||
| American Airlines Group, Inc. | 305,236 | 14,108 | |
| Southwest Airlines Co. | 324,973 | 15,043 | |
| United Continental Holdings, Inc. (a) | 230,668 | 13,912 | |
| 43,063 | |||
| Construction & Engineering - 0.3% | |||
| AECOM Technology Corp. (a) | 172,493 | 5,083 | |
| Industrial Conglomerates - 2.3% | |||
| General Electric Co. | 1,224,348 | 35,408 | |
| Machinery - 0.7% | |||
| AGCO Corp. | 202,253 | 9,787 | |
| SPX Flow, Inc. (a) | 28,500 | 966 | |
| 10,753 | |||
| TOTAL INDUSTRIALS | 129,074 | ||
| INFORMATION TECHNOLOGY - 21.3% | |||
| Communications Equipment - 0.9% | |||
| Brocade Communications Systems, Inc. | 62,597 | 652 | |
| Cisco Systems, Inc. | 268,102 | 7,735 | |
| CommScope Holding Co., Inc. (a) | 172,318 | 5,588 | |
| 13,975 | |||
| Internet Software & Services - 3.5% | |||
| Alphabet, Inc.: | |||
| Class A (a) | 34,864 | 25,708 | |
| Class C | 3,530 | 2,509 | |
| eBay, Inc. (a) | 540,292 | 15,074 | |
| Facebook, Inc. Class A (a) | 99,178 | 10,113 | |
| 53,404 | |||
| IT Services - 6.2% | |||
| Accenture PLC Class A | 73,645 | 7,895 | |
| Cognizant Technology Solutions Corp. Class A (a) | 216,449 | 14,742 | |
| Computer Sciences Corp. | 17,795 | 1,185 | |
| Fidelity National Information Services, Inc. | 67,993 | 4,958 | |
| Global Payments, Inc. | 63,043 | 8,600 | |
| IBM Corp. | 11,290 | 1,582 | |
| Leidos Holdings, Inc. | 223,236 | 11,736 | |
| PayPal Holdings, Inc. (a) | 427,684 | 15,401 | |
| Visa, Inc. Class A | 222,073 | 17,228 | |
| Xerox Corp. | 1,063,665 | 9,988 | |
| 93,315 | |||
| Semiconductors & Semiconductor Equipment - 3.0% | |||
| Avago Technologies Ltd. | 114,868 | 14,144 | |
| Broadcom Corp. Class A | 230,866 | 11,867 | |
| Freescale Semiconductor, Inc. (a) | 279,630 | 9,365 | |
| Marvell Technology Group Ltd. | 1,189,026 | 9,762 | |
| 45,138 | |||
| Software - 3.1% | |||
| Citrix Systems, Inc. (a) | 134,553 | 11,047 | |
| Electronic Arts, Inc. (a) | 91,449 | 6,591 | |
| King Digital Entertainment PLC (b) | 386,526 | 5,782 | |
| Microsoft Corp. | 314,628 | 16,562 | |
| Oracle Corp. | 23,746 | 922 | |
| Workday, Inc. Class A (a) | 81,081 | 6,403 | |
| 47,307 | |||
| Technology Hardware, Storage & Peripherals - 4.6% | |||
| Apple, Inc. | 568,897 | 67,980 | |
| HP, Inc. | 45,587 | 1,229 | |
| 69,209 | |||
| TOTAL INFORMATION TECHNOLOGY | 322,348 | ||
| MATERIALS - 4.3% | |||
| Chemicals - 2.4% | |||
| Eastman Chemical Co. | 148,607 | 10,725 | |
| LyondellBasell Industries NV Class A | 151,883 | 14,111 | |
| The Mosaic Co. | 359,739 | 12,156 | |
| 36,992 | |||
| Containers & Packaging - 1.2% | |||
| Sealed Air Corp. | 150,233 | 7,379 | |
| WestRock Co. | 187,184 | 10,063 | |
| 17,442 | |||
| Metals & Mining - 0.3% | |||
| Steel Dynamics, Inc. | 248,995 | 4,599 | |
| Paper & Forest Products - 0.4% | |||
| Domtar Corp. | 160,085 | 6,602 | |
| TOTAL MATERIALS | 65,635 | ||
| TELECOMMUNICATION SERVICES - 2.7% | |||
| Diversified Telecommunication Services - 2.2% | |||
| AT&T, Inc. | 761,137 | 25,506 | |
| Verizon Communications, Inc. | 157,047 | 7,362 | |
| 32,868 | |||
| Wireless Telecommunication Services - 0.5% | |||
| T-Mobile U.S., Inc. (a) | 216,716 | 8,211 | |
| TOTAL TELECOMMUNICATION SERVICES | 41,079 | ||
| UTILITIES - 1.4% | |||
| Electric Utilities - 0.8% | |||
| Exelon Corp. | 425,586 | 11,882 | |
| Independent Power and Renewable Electricity Producers - 0.6% | |||
| NRG Energy, Inc. | 763,604 | 9,843 | |
| TOTAL UTILITIES | 21,725 | ||
| TOTAL COMMON STOCKS | |||
| (Cost $1,396,535) | 1,486,491 | ||
| Money Market Funds - 3.1% | |||
| Fidelity Cash Central Fund, 0.18% (c) | 33,468,832 | 33,469 | |
| Fidelity Securities Lending Cash Central Fund, 0.19% (c)(d) | 12,757,700 | 12,758 | |
| TOTAL MONEY MARKET FUNDS | |||
| (Cost $46,227) | 46,227 | ||
| TOTAL INVESTMENT PORTFOLIO - 101.2% | |||
| (Cost $1,442,762) | 1,532,718 | ||
| NET OTHER ASSETS (LIABILITIES) - (1.2)% | (18,129) | ||
| NET ASSETS - 100% | $1,514,589 |
Legend
(a) Non-income producing
(b) Security or a portion of the security is on loan at period end.
(c) Affiliated fund that is generally available only to investment companies and other accounts managed by Fidelity Investments. The rate quoted is the annualized seven-day yield of the fund at period end. A complete unaudited listing of the fund's holdings as of its most recent quarter end is available upon request. In addition, each Fidelity Central Fund's financial statements, which are not covered by the Fund's Report of Independent Registered Public Accounting Firm, are available on the SEC's website or upon request.
(d) Investment made with cash collateral received from securities on loan.
Affiliated Central Funds
Information regarding fiscal year to date income earned by the Fund from investments in Fidelity Central Funds is as follows:
| Fund | Income earned |
| (Amounts in thousands) | |
| Fidelity Cash Central Fund | $44 |
| Fidelity Securities Lending Cash Central Fund | 342 |
| Total | $386 |
Investment Valuation
All investments are categorized as Level 1 under the Fair Value Hierarchy. The inputs or methodology used for valuing securities may not be an indication of the risk associated with investing in those securities. For more information on valuation inputs please refer to the Investment Valuation section in the accompanying Notes to Financial Statements.
See accompanying notes which are an integral part of the financial statements.
Financial Statements
Statement of Assets and Liabilities
| Amounts in thousands (except per-share amounts) | October 31, 2015 | |
| Assets | ||
| Investment in securities, at value (including securities loaned of $12,455) — See accompanying schedule: Unaffiliated issuers (cost $1,396,535) | $1,486,491 | |
| Fidelity Central Funds (cost $46,227) | 46,227 | |
| Total Investments (cost $1,442,762) | $1,532,718 | |
| Receivable for fund shares sold | 4,509 | |
| Dividends receivable | 1,330 | |
| Distributions receivable from Fidelity Central Funds | 42 | |
| Prepaid expenses | 4 | |
| Other receivables | 348 | |
| Total assets | 1,538,951 | |
| Liabilities | ||
| Payable for fund shares redeemed | $10,293 | |
| Accrued management fee | 709 | |
| Other affiliated payables | 200 | |
| Other payables and accrued expenses | 402 | |
| Collateral on securities loaned, at value | 12,758 | |
| Total liabilities | 24,362 | |
| Net Assets | $1,514,589 | |
| Net Assets consist of: | ||
| Paid in capital | $1,444,708 | |
| Undistributed net investment income | 12,073 | |
| Accumulated undistributed net realized gain (loss) on investments | (32,148) | |
| Net unrealized appreciation (depreciation) on investments | 89,956 | |
| Net Assets | $1,514,589 | |
| Disciplined Equity: | ||
| Net Asset Value, offering price and redemption price per share ($1,385,386 ÷ 40,524.9 shares) | $34.19 | |
| Class K: | ||
| Net Asset Value, offering price and redemption price per share ($129,203 ÷ 3,782.6 shares) | $34.16 |
See accompanying notes which are an integral part of the financial statements.
Statement of Operations
| Amounts in thousands | Year ended October 31, 2015 | |
| Investment Income | ||
| Dividends | $26,409 | |
| Income from Fidelity Central Funds | 386 | |
| Total income | 26,795 | |
| Expenses | ||
| Management fee | ||
| Basic fee | $7,717 | |
| Performance adjustment | 2,093 | |
| Transfer agent fees | 1,989 | |
| Accounting and security lending fees | 448 | |
| Custodian fees and expenses | 23 | |
| Independent trustees' compensation | 6 | |
| Registration fees | 45 | |
| Audit | 70 | |
| Legal | 6 | |
| Interest | 2 | |
| Miscellaneous | 3 | |
| Total expenses before reductions | 12,402 | |
| Expense reductions | (47) | 12,355 |
| Net investment income (loss) | 14,440 | |
| Realized and Unrealized Gain (Loss) | ||
| Net realized gain (loss) on: | ||
| Investment securities: | ||
| Unaffiliated issuers | 120,276 | |
| Futures contracts | 626 | |
| Total net realized gain (loss) | 120,902 | |
| Change in net unrealized appreciation (depreciation) on investment securities | (59,067) | |
| Net gain (loss) | 61,835 | |
| Net increase (decrease) in net assets resulting from operations | $76,275 |
See accompanying notes which are an integral part of the financial statements.
Statement of Changes in Net Assets
| Amounts in thousands | Year ended October 31, 2015 | Year ended October 31, 2014 |
| Increase (Decrease) in Net Assets | ||
| Operations | ||
| Net investment income (loss) | $14,440 | $17,308 |
| Net realized gain (loss) | 120,902 | 165,730 |
| Change in net unrealized appreciation (depreciation) | (59,067) | 19,428 |
| Net increase (decrease) in net assets resulting from operations | 76,275 | 202,466 |
| Distributions to shareholders from net investment income | (15,079) | (29,580) |
| Distributions to shareholders from net realized gain | (87,691) | (11,309) |
| Total distributions | (102,770) | (40,889) |
| Share transactions - net increase (decrease) | 144,601 | (74,028) |
| Total increase (decrease) in net assets | 118,106 | 87,549 |
| Net Assets | ||
| Beginning of period | 1,396,483 | 1,308,934 |
| End of period (including undistributed net investment income of $12,073 and undistributed net investment income of $12,653, respectively) | $1,514,589 | $1,396,483 |
See accompanying notes which are an integral part of the financial statements.
Financial Highlights — Fidelity Disciplined Equity Fund
| Years ended October 31, | 2015 | 2014 | 2013 | 2012 | 2011 |
| Selected Per–Share Data | |||||
| Net asset value, beginning of period | $35.18 | $31.30 | $24.47 | $21.79 | $21.67 |
| Income from Investment Operations | |||||
| Net investment income (loss)A | .35 | .41 | .53 | .40 | .28 |
| Net realized and unrealized gain (loss) | 1.26 | 4.43 | 6.85 | 2.59 | .05 |
| Total from investment operations | 1.61 | 4.84 | 7.38 | 2.99 | .33 |
| Distributions from net investment income | (.38) | (.69) | (.55) | (.31) | (.21) |
| Distributions from net realized gain | (2.22) | (.27) | – | – | – |
| Total distributions | (2.60) | (.96) | (.55) | (.31) | (.21) |
| Net asset value, end of period | $34.19 | $35.18 | $31.30 | $24.47 | $21.79 |
| Total ReturnB | 4.66% | 15.80% | 30.80% | 13.95% | 1.51% |
| Ratios to Average Net AssetsC,D | |||||
| Expenses before reductions | .89% | .50% | .07% | .54% | .59% |
| Expenses net of fee waivers, if any | .89% | .50% | .07% | .54% | .59% |
| Expenses net of all reductions | .89% | .50% | (.01)%E | .52% | .58% |
| Net investment income (loss) | 1.02% | 1.24% | 1.97% | 1.72% | 1.22% |
| Supplemental Data | |||||
| Net assets, end of period (in millions) | $1,385 | $1,238 | $1,156 | $3,948 | $7,233 |
| Portfolio turnover rateF | 187% | 184% | 156% | 147% | 153% |
A Calculated based on average shares outstanding during the period.
B Total returns would have been lower if certain expenses had not been reduced during the applicable periods shown.
C Fees and expenses of any underlying Fidelity Central Funds are not included in the Fund's expense ratio. The Fund indirectly bears its proportionate share of the expenses of any underlying Fidelity Central Funds.
D Expense ratios reflect operating expenses of the class. Expenses before reductions do not reflect amounts reimbursed by the investment adviser or reductions from brokerage service arrangements or reductions from other expense offset arrangements and do not represent the amount paid by the class during periods when reimbursements or reductions occur. Expenses net of fee waivers reflect expenses after reimbursement by the investment adviser but prior to reductions from brokerage service arrangements or other expense offset arrangements. Expenses net of all reductions represent the net expenses paid by the class.
E The ratio of expenses net of all reductions to average net assets includes non-recurring payments by certain of the fund's brokers for commissions recaptured during the period. Excluding these payments, the ratio would have been 0.05% and the total return would've been 30.74%.
F Amount does not include the portfolio activity of any underlying Fidelity Central Funds.
See accompanying notes which are an integral part of the financial statements.
Financial Highlights — Fidelity Disciplined Equity Fund Class K
| Years ended October 31, | 2015 | 2014 | 2013 | 2012 | 2011 |
| Selected Per–Share Data | |||||
| Net asset value, beginning of period | $35.15 | $31.29 | $24.49 | $21.81 | $21.69 |
| Income from Investment Operations | |||||
| Net investment income (loss)A | .38 | .45 | .61 | .43 | .31 |
| Net realized and unrealized gain (loss) | 1.27 | 4.41 | 6.79 | 2.60 | .06 |
| Total from investment operations | 1.65 | 4.86 | 7.40 | 3.03 | .37 |
| Distributions from net investment income | (.42) | (.73) | (.60) | (.35) | (.25) |
| Distributions from net realized gain | (2.22) | (.27) | – | – | – |
| Total distributions | (2.64) | (1.00) | (.60) | (.35) | (.25) |
| Net asset value, end of period | $34.16 | $35.15 | $31.29 | $24.49 | $21.81 |
| Total ReturnB | 4.78% | 15.89% | 30.96% | 14.14% | 1.68% |
| Ratios to Average Net AssetsC,D | |||||
| Expenses before reductions | .79% | .39% | (.18)%E | .39% | .43% |
| Expenses net of fee waivers, if any | .79% | .39% | (.18)%E | .39% | .43% |
| Expenses net of all reductions | .79% | .39% | (.26)%E,F | .37% | .42% |
| Net investment income (loss) | 1.12% | 1.35% | 2.22% | 1.87% | 1.38% |
| Supplemental Data | |||||
| Net assets, end of period (in millions) | $129 | $158 | $153 | $131 | $95 |
| Portfolio turnover rateG | 187% | 184% | 156% | 147% | 153% |
A Calculated based on average shares outstanding during the period.
B Total returns would have been lower if certain expenses had not been reduced during the applicable periods shown.
C Fees and expenses of any underlying Fidelity Central Funds are not included in the Fund's expense ratio. The Fund indirectly bears its proportionate share of the expenses of any underlying Fidelity Central Funds.
D Expense ratios reflect operating expenses of the class. Expenses before reductions do not reflect amounts reimbursed by the investment adviser or reductions from brokerage service arrangements or reductions from other expense offset arrangements and do not represent the amount paid by the class during periods when reimbursements or reductions occur. Expenses net of fee waivers reflect expenses after reimbursement by the investment adviser but prior to reductions from brokerage service arrangements or other expense offset arrangements. Expenses net of all reductions represent the net expenses paid by the class.
E Expense ratio is negative due to the timing of negative management fee performance adjustments in relation to fluctuating net assets of the class.
F The ratio of expenses net of all reductions to average net assets includes non-recurring payments by certain of the fund's brokers for commissions recaptured during the period. Excluding these payments, the ratio would have been (0.20)% and the total return would've been 30.90%.
G Amount does not include the portfolio activity of any underlying Fidelity Central Funds.
See accompanying notes which are an integral part of the financial statements.
Notes to Financial Statements
For the period ended October 31, 2015
(Amounts in thousands except percentages)
1. Organization.
Fidelity Disciplined Equity Fund (the Fund) is a fund of Fidelity Capital Trust (the Trust) and is authorized to issue an unlimited number of shares. The Trust is registered under the Investment Company Act of 1940, as amended (the 1940 Act), as an open-end management investment company organized as a Massachusetts business trust. The Fund offers Class K shares, each of which has equal rights as to assets and voting privileges. Each class has exclusive voting rights with respect to matters that affect that class.
2. Investments in Fidelity Central Funds.
The Fund invests in Fidelity Central Funds, which are open-end investment companies generally available only to other investment companies and accounts managed by the investment adviser and its affiliates. The Fund's Schedule of Investments lists each of the Fidelity Central Funds held as of period end, if any, as an investment of the Fund, but does not include the underlying holdings of each Fidelity Central Fund. As an Investing Fund, the Fund indirectly bears its proportionate share of the expenses of the underlying Fidelity Central Funds.
The Money Market Central Funds seek preservation of capital and current income and are managed by Fidelity Investments Money Management, Inc. (FIMM), an affiliate of the investment adviser. Annualized expenses of the Money Market Central Funds as of their most recent shareholder report date are less than .005%.
A complete unaudited list of holdings for each Fidelity Central Fund is available upon request or at the Securities and Exchange Commission (the SEC) website at www.sec.gov. In addition, the financial statements of the Fidelity Central Funds, which are not covered by the Fund's Report of Independent Registered Public Accounting Firm, are available on the SEC website or upon request.
3. Significant Accounting Policies.
The financial statements have been prepared in conformity with accounting principles generally accepted in the United States of America (GAAP), which require management to make certain estimates and assumptions at the date of the financial statements. Actual results could differ from those estimates. Subsequent events, if any, through the date that the financial statements were issued have been evaluated in the preparation of the financial statements. The following summarizes the significant accounting policies of the Fund:
Investment Valuation. Investments are valued as of 4:00 p.m. Eastern time on the last calendar day of the period. The Board of Trustees (the Board) has delegated the day to day responsibility for the valuation of the Fund's investments to the Fidelity Management & Research Company (FMR) Fair Value Committee (the Committee). In accordance with valuation policies and procedures approved by the Board, the Fund attempts to obtain prices from one or more third party pricing vendors or brokers to value its investments. When current market prices, quotations or currency exchange rates are not readily available or reliable, investments will be fair valued in good faith by the Committee, in accordance with procedures adopted by the Board. Factors used in determining fair value vary by investment type and may include market or investment specific events. The frequency with which these procedures are used cannot be predicted and they may be utilized to a significant extent. The Committee oversees the Fund's valuation policies and procedures and reports to the Board on the Committee's activities and fair value determinations. The Board monitors the appropriateness of the procedures used in valuing the Fund's investments and ratifies the fair value determinations of the Committee.
The Fund categorizes the inputs to valuation techniques used to value its investments into a disclosure hierarchy consisting of three levels as shown below:
- Level 1 – quoted prices in active markets for identical investments
- Level 2 – other significant observable inputs (including quoted prices for similar investments, interest rates, prepayment speeds, etc.)
- Level 3 – unobservable inputs (including the Fund's own assumptions based on the best information available)
Valuation techniques used to value the Fund's investments by major category are as follows:
Equity securities, including restricted securities, for which market quotations are readily available, are valued at the last reported sale price or official closing price as reported by a third party pricing vendor on the primary market or exchange on which they are traded and are categorized as Level 1 in the hierarchy. In the event there were no sales during the day or closing prices are not available, securities are valued at the last quoted bid price or may be valued using the last available price and are generally categorized as Level 2 in the hierarchy. For foreign equity securities, when market or security specific events arise, comparisons to the valuation of American Depositary Receipts (ADRs), futures contracts, Exchange-Traded Funds (ETFs) and certain indexes as well as quoted prices for similar securities may be used and would be categorized as Level 2 in the hierarchy. Utilizing these techniques may result in transfers between Level 1 and Level 2. For equity securities, including restricted securities, where observable inputs are limited, assumptions about market activity and risk are used and these securities may be categorized as Level 3 in the hierarchy.
Investments in open-end mutual funds, including the Fidelity Central Funds, are valued at their closing net asset value (NAV) each business day and are categorized as Level 1 in the hierarchy.
Changes in valuation techniques may result in transfers in or out of an assigned level within the disclosure hierarchy.
Investment Transactions and Income. For financial reporting purposes, the Fund's investment holdings and NAV include trades executed through the end of the last business day of the period. The NAV per share for processing shareholder transactions is calculated as of the close of business of the New York Stock Exchange (NYSE), normally 4:00 p.m. Eastern time and includes trades executed through the end of the prior business day. Gains and losses on securities sold are determined on the basis of identified cost and may include proceeds received from litigation. Dividend income is recorded on the ex-dividend date, except for certain dividends from foreign securities where the ex-dividend date may have passed, which are recorded as soon as the Fund is informed of the ex-dividend date. Non-cash dividends included in dividend income, if any, are recorded at the fair market value of the securities received. Income and capital gain distributions from Fidelity Central Funds, if any, are recorded on the ex-dividend date. Distributions received on securities that represent a return of capital or capital gain are recorded as a reduction of cost of investments and/or as a realized gain. Subsequent to ex-dividend date the Fund determines the components of these distributions, based upon receipt of tax filings or other correspondence relating to the underlying investment.
Class Allocations and Expenses. Investment income, realized and unrealized capital gains and losses, common expenses of the Fund, and certain fund-level expense reductions, if any, are allocated daily on a pro-rata basis to each class based on the relative net assets of each class to the total net assets of the Fund. Each class differs with respect to transfer agent fees incurred. Certain expense reductions may also differ by class. For the reporting period, the allocated portion of income and expenses to each class as a percent of its average net assets may vary due to the timing of recording these transactions in relation to fluctuating net assets of the classes. Expenses directly attributable to a fund are charged to that fund. Expenses attributable to more than one fund are allocated among the respective funds on the basis of relative net assets or other appropriate methods. Expense estimates are accrued in the period to which they relate and adjustments are made when actual amounts are known.
Deferred Trustee Compensation. Under a Deferred Compensation Plan (the Plan), independent Trustees may elect to defer receipt of a portion of their annual compensation. Deferred amounts are invested in a cross-section of Fidelity funds, are marked-to-market and remain in the Fund until distributed in accordance with the Plan. The investment of deferred amounts and the offsetting payable to the Trustees are included in the accompanying Statement of Assets and Liabilities.
Income Tax Information and Distributions to Shareholders. Each year, the Fund intends to qualify as a regulated investment company under Subchapter M of the Internal Revenue Code, including distributing substantially all of its taxable income and realized gains. As a result, no provision for U.S. Federal income taxes is required. As of October 31, 2015, the Fund did not have any unrecognized tax benefits in the financial statements; nor is the Fund aware of any tax positions for which it is reasonably possible that the total amounts of unrecognized tax benefits will significantly change in the next twelve months. The Fund files a U.S. federal tax return, in addition to state and local tax returns as required. The Fund's federal income tax returns are subject to examination by the Internal Revenue Service (IRS) for a period of three fiscal years after they are filed. State and local tax returns may be subject to examination for an additional fiscal year depending on the jurisdiction.
Distributions are declared and recorded on the ex-dividend date. Income dividends and capital gain distributions are declared separately for each class. Income and capital gain distributions are determined in accordance with income tax regulations, which may differ from GAAP.
Capital accounts within the financial statements are adjusted for permanent book-tax differences. These adjustments have no impact on net assets or the results of operations. Capital accounts are not adjusted for temporary book-tax differences which will reverse in a subsequent period.
Book-tax differences are primarily due to futures contracts, deferred trustees compensation, capital loss carryforwards and losses deferred due to wash sales.
The federal tax cost of investment securities and unrealized appreciation (depreciation) as of period end were as follows:
| Gross unrealized appreciation | $138,999 |
| Gross unrealized depreciation | (51,765) |
| Net unrealized appreciation (depreciation) on securities | $87,234 |
| Tax Cost | $1,445,484 |
The tax-based components of distributable earnings as of period end were as follows:
| Undistributed ordinary income | $16,454 |
| Undistributed long-term capital gain | $69,109 |
| Net unrealized appreciation (depreciation) on securities and other investments | $87,235 |
Capital loss carryforwards are only available to offset future capital gains of the Fund to the extent provided by regulations and may be limited. Under the Regulated Investment Company Modernization Act of 2010 (the Act), the Fund is permitted to carry forward capital losses incurred in taxable years beginning after December 22, 2010 for an unlimited period and such capital losses are required to be used prior to any losses that expire. The capital loss carryforward information presented below, including any applicable limitation, is estimated as of fiscal period end and is subject to adjustment.
| Fiscal year of expiration | |
| 2017 | $(102,570) |
Due to large redemptions in a prior period, $102,570 of capital losses that will be available to offset future capital gains of the Fund will be limited to approximately $47,725 per year.
The tax character of distributions paid was as follows:
| October 31, 2015 | October 31, 2014 | |
| Ordinary Income | $57,032 | $ 40,889 |
| Long-term Capital Gains | 45,738 | – |
| Total | $102,770 | $ 40,889 |
4. Derivative Instruments.
Risk Exposures and the Use of Derivative Instruments. The Fund's investment objective allows the Fund to enter into various types of derivative contracts, including futures contracts. Derivatives are investments whose value is primarily derived from underlying assets, indices or reference rates and may be transacted on an exchange or over-the-counter (OTC). Derivatives may involve a future commitment to buy or sell a specified asset based on specified terms, to exchange future cash flows at periodic intervals based on a notional principal amount, or for one party to make one or more payments upon the occurrence of specified events in exchange for periodic payments from the other party.
The Fund used derivatives to increase returns and to manage exposure to certain risks as defined below. The success of any strategy involving derivatives depends on analysis of numerous economic factors, and if the strategies for investment do not work as intended, the Fund may not achieve its objectives.
The Fund's use of derivatives increased or decreased its exposure to the following risk:
| Equity Risk | Equity risk relates to the fluctuations in the value of financial instruments as a result of changes in market prices (other than those arising from interest rate risk or foreign exchange risk), whether caused by factors specific to an individual investment, its issuer, or all factors affecting all instruments traded in a market or market segment. |
The Fund is also exposed to additional risks from investing in derivatives, such as liquidity risk and counterparty credit risk. Liquidity risk is the risk that the Fund will be unable to close out the derivative in the open market in a timely manner. Counterparty credit risk is the risk that the counterparty will not be able to fulfill its obligation to the Fund.
Investing in derivatives may involve greater risks than investing in the underlying assets directly and, to varying degrees, may involve risk of loss in excess of any initial investment and collateral received and amounts recognized in the Statement of Assets and Liabilities. In addition, there may be the risk that the change in value of the derivative contract does not correspond to the change in value of the underlying instrument.
Futures Contracts. A futures contract is an agreement between two parties to buy or sell a specified underlying instrument for a fixed price at a specified future date. The Fund used futures contracts to manage its exposure to the stock market.
Upon entering into a futures contract, a fund is required to deposit either cash or securities (initial margin) with a clearing broker in an amount equal to a certain percentage of the face value of the contract. Futures contracts are marked-to-market daily and subsequent daily payments are made or received by a fund depending on the daily fluctuations in the value of the futures contracts and are recorded as unrealized appreciation or (depreciation). This receivable and/or payable, if any, is included in daily variation margin for derivative instruments in the Statement of Assets and Liabilities. Realized gain or (loss) is recorded upon the expiration or closing of a futures contract.
Any open futures contracts at period end are presented in the Schedule of Investments under the caption "Futures Contracts". The underlying face amount at value reflects each contract's exposure to the underlying instrument or index at period end.
During the period the Fund recognized net realized gain of $626 related to its investment in futures contracts. This amount is included in the Statement of Operations.
5. Purchases and Sales of Investments.
Purchases and sales of securities other than short-term securities, aggregated $2,631,948 and $2,580,613, respectively.
6. Fees and Other Transactions with Affiliates.
Management Fee. Fidelity Management & Research Company (the investment adviser) and its affiliates provide the Fund with investment management related services for which the Fund pays a monthly management fee. The management fee is the sum of an individual fund fee rate that is based on an annual rate of .30% of the Fund's average net assets and an annualized group fee rate that averaged .25% during the period. The group fee rate is based upon the average net assets of all the mutual funds advised by the investment adviser, including any mutual funds previously advised by the investment adviser that are currently advised by Fidelity SelectCo, LLC, an affiliate of the investment adviser. The group fee rate decreases as assets under management increase and increases as assets under management decrease. In addition, the management fee is subject to a performance adjustment(up to a maximum of +/- .20% of the Fund's average net assets over a 36 month performance period). The upward or downward adjustment to the management fee is based on the relative investment performance of Disciplined Equity as compared to its benchmark index, the S&P 500 Index, over the same 36 month performance period. For the reporting period, the total annual management fee rate, including the performance adjustment, was .70% of the Fund's average net assets. The performance adjustment included in the management fee rate may be higher or lower than the maximum performance adjustment rate due to the difference between the average net assets for the reporting and performance periods.
Transfer Agent Fees. Fidelity Investments Institutional Operations Company, Inc., (FIIOC), an affiliate of the investment adviser, is the transfer, dividend disbursing and shareholder servicing agent for each class of the Fund. FIIOC receives account fees and asset-based fees that vary according to the account size and type of account of the shareholders of Disciplined Equity. FIIOC receives an asset-based fee of Class K's average net assets. FIIOC pays for typesetting, printing and mailing of shareholder reports, except proxy statements.
For the period, transfer agent fees for each class were as follows:
| Amount | % of Class-Level Average Net Assets | |
| Disciplined Equity | $1,917 | .15 |
| Class K | 72 | .05 |
| $ 1,989 |
Accounting and Security Lending Fees. Fidelity Service Company, Inc. (FSC), an affiliate of the investment adviser, maintains the Fund's accounting records. The accounting fee is based on the level of average net assets for each month. Under a separate contract, FSC administers the security lending program. The security lending fee is based on the number and duration of lending transactions.
Brokerage Commissions. The Fund placed a portion of its portfolio transactions with brokerage firms which are affiliates of the investment adviser. Brokerage commissions are included in net realized gain (loss) and change in net unrealized appreciation (depreciation) in the Statement of Operations. The commissions paid to these affiliated firms were $10 for the period.
Interfund Lending Program. Pursuant to an Exemptive Order issued by the SEC, the Fund, along with other registered investment companies having management contracts with FMR or other affiliated entities of FMR, may participate in an interfund lending program. This program provides an alternative credit facility allowing the funds to borrow from, or lend money to, other participating affiliated funds. At period end, there were no interfund loans outstanding. The Fund's activity in this program during the period for which loans were outstanding was as follows:
| Borrower or Lender | Average Loan Balance | Weighted Average Interest Rate | Interest Expense |
| Borrower | $57,625 | .39% | $2 |
7. Committed Line of Credit.
The Fund participates with other funds managed by the investment adviser or an affiliate in a $4.25 billion credit facility (the "line of credit") to be utilized for temporary or emergency purposes to fund shareholder redemptions or for other short-term liquidity purposes. The Fund has agreed to pay commitment fees on its pro-rata portion of the line of credit, which amounted to $2 and is reflected in Miscellaneous expenses on the Statement of Operations. During the period, the Fund did not borrow on this line of credit.
8. Security Lending.
The Fund lends portfolio securities through a lending agent from time to time in order to earn additional income. For equity securities, a lending agent is used and may loan securities to certain qualified borrowers, including Fidelity Capital Markets (FCM), a broker-dealer affiliated with the Fund. On the settlement date of the loan, the Fund receives collateral (in the form of U.S. Treasury obligations, letters of credit and/or cash) against the loaned securities and maintains collateral in an amount not less than 100% of the market value of the loaned securities during the period of the loan. The market value of the loaned securities is determined at the close of business of the Fund and any additional required collateral is delivered to the Fund on the next business day. The Fund or borrower may terminate the loan at any time, and if the borrower defaults on its obligation to return the securities loaned because of insolvency or other reasons, the Fund may apply collateral received from the borrower against the obligation. The Fund may experience delays and costs in recovering the securities loaned. Any cash collateral received is invested in the Fidelity Securities Lending Cash Central Fund. The value of loaned securities and cash collateral at period end are disclosed on the Fund's Statement of Assets and Liabilities. The value of securities loaned to FCM at period end was $748. Security lending income represents the income earned on investing cash collateral, less rebates paid to borrowers, plus any premium payments received for lending certain types of securities. Security lending income is presented in the Statement of Operations as a component of income from Fidelity Central Funds. Total security lending income during the period amounted to $342, including $32 from securities loaned to FCM.
9. Expense Reductions.
Commissions paid to certain brokers with whom the investment adviser, or its affiliates, places trades on behalf of the Fund include an amount in addition to trade execution, which may be rebated back to the Fund to offset certain expenses. This amount totaled $11 for the period.
In addition, during the period the investment adviser reimbursed and/or waived a portion of fund-level operating expenses in the amount of $6 and a portion of class-level operating expenses as follows:
| Amount | |
| Disciplined Equity | $30 |
10. Distributions to Shareholders.
Distributions to shareholders of each class were as follows:
| Years ended October 31, | 2015 | 2014 |
| From net investment income | ||
| Disciplined Equity | $13,214 | $25,989 |
| Class K | 1,865 | 3,591 |
| Total | $15,079 | $29,580 |
| From net realized gain | ||
| Disciplined Equity | $77,745 | $10,004 |
| Class K | 9,946 | 1,305 |
| Total | $87,691 | $11,309 |
11. Share Transactions.
Share transactions for each class were as follows and may contain automatic conversions between classes or exchanges between funds:
| Shares | Shares | Dollars | Dollars | |
| Years ended October 31, | 2015 | 2014 | 2015 | 2014 |
| Disciplined Equity | ||||
| Shares sold | 6,822 | 2,332 | $221,673 | $75,217 |
| Reinvestment of distributions | 2,529 | 1,075 | 85,602 | 33,942 |
| Shares redeemed | (4,031) | (5,131) | (137,608) | (170,025) |
| Net increase (decrease) | 5,320 | (1,724) | $169,667 | $(60,866) |
| Class K | ||||
| Shares sold | 584 | 734 | $19,748 | $24,242 |
| Reinvestment of distributions | 350 | 155 | 11,810 | 4,896 |
| Shares redeemed | (1,646) | (1,281) | (56,624) | (42,300) |
| Net increase (decrease) | (712) | (392) | $(25,066) | $(13,162) |
12. Other.
The Fund's organizational documents provide former and current trustees and officers with a limited indemnification against liabilities arising in connection with the performance of their duties to the Fund. In the normal course of business, the Fund may also enter into contracts that provide general indemnifications. The Fund's maximum exposure under these arrangements is unknown as this would be dependent on future claims that may be made against the Fund. The risk of material loss from such claims is considered remote.
Report of Independent Registered Public Accounting Firm
To the Trustees of Fidelity Capital Trust and Shareholders of Fidelity® Disciplined Equity Fund:
In our opinion, the accompanying statement of assets and liabilities, including the schedule of investments, and the related statements of operations and of changes in net assets and the financial highlights present fairly, in all material respects, the financial position of Fidelity® Disciplined Equity Fund (a fund of Fidelity Capital Trust) at October 31, 2015, the results of its operations for the year then ended, the changes in its net assets for each of the two years in the period then ended and the financial highlights for each of the five years in the period then ended, in conformity with accounting principles generally accepted in the United States of America. These financial statements and financial highlights (hereafter referred to as “financial statements”) are the responsibility of the Fidelity® Disciplined Equity Fund’s management. Our responsibility is to express an opinion on these financial statements based on our audits. We conducted our audits of these financial statements in accordance with the standards of the Public Company Accounting Oversight Board (United States). Those standards require that we plan and perform the audit to obtain reasonable assurance about whether the financial statements are free of material misstatement. An audit includes examining, on a test basis, evidence supporting the amounts and disclosures in the financial statements, assessing the accounting principles used and significant estimates made by management, and evaluating the overall financial statement presentation. We believe that our audits, which included confirmation of securities at October 31, 2015 by correspondence with the custodian and brokers, provide a reasonable basis for our opinion.
PricewaterhouseCoopers LLP
Boston, Massachusetts
December 16, 2015
Trustees and Officers
The Trustees, Members of the Advisory Board (if any), and officers of the trust and fund, as applicable, are listed below. The Board of Trustees governs the fund and is responsible for protecting the interests of shareholders. The Trustees are experienced executives who meet periodically throughout the year to oversee the fund's activities, review contractual arrangements with companies that provide services to the fund, oversee management of the risks associated with such activities and contractual arrangements, and review the fund's performance. Each of the Trustees oversees 170 funds.
The Trustees hold office without limit in time except that (a) any Trustee may resign; (b) any Trustee may be removed by written instrument, signed by at least two-thirds of the number of Trustees prior to such removal; (c) any Trustee who requests to be retired or who has become incapacitated by illness or injury may be retired by written instrument signed by a majority of the other Trustees; and (d) any Trustee may be removed at any special meeting of shareholders by a two-thirds vote of the outstanding voting securities of the trust. Each Trustee who is not an interested person (as defined in the 1940 Act) of the trust and the fund is referred to herein as an Independent Trustee. Each Independent Trustee shall retire not later than the last day of the calendar year in which his or her 75th birthday occurs. The Independent Trustees may waive this mandatory retirement age policy with respect to individual Trustees. Officers and Advisory Board Members hold office without limit in time, except that any officer or Advisory Board Member may resign or may be removed by a vote of a majority of the Trustees at any regular meeting or any special meeting of the Trustees. Except as indicated, each individual has held the office shown or other offices in the same company for the past five years.
The fund’s Statement of Additional Information (SAI) includes more information about the Trustees. To request a free copy, call Fidelity at 1-800-835-5092.
Experience, Skills, Attributes, and Qualifications of the Trustees. The Governance and Nominating Committee has adopted a statement of policy that describes the experience, qualifications, attributes, and skills that are necessary and desirable for potential Independent Trustee candidates (Statement of Policy). The Board believes that each Trustee satisfied at the time he or she was initially elected or appointed a Trustee, and continues to satisfy, the standards contemplated by the Statement of Policy. The Governance and Nominating Committee also engages professional search firms to help identify potential Independent Trustee candidates who have the experience, qualifications, attributes, and skills consistent with the Statement of Policy. From time to time, additional criteria based on the composition and skills of the current Independent Trustees, as well as experience or skills that may be appropriate in light of future changes to board composition, business conditions, and regulatory or other developments, have also been considered by the professional search firms and the Governance and Nominating Committee. In addition, the Board takes into account the Trustees' commitment and participation in Board and committee meetings, as well as their leadership of standing and ad hoc committees throughout their tenure.
In determining that a particular Trustee was and continues to be qualified to serve as a Trustee, the Board has considered a variety of criteria, none of which, in isolation, was controlling. The Board believes that, collectively, the Trustees have balanced and diverse experience, qualifications, attributes, and skills, which allow the Board to operate effectively in governing the fund and protecting the interests of shareholders. Information about the specific experience, skills, attributes, and qualifications of each Trustee, which in each case led to the Board's conclusion that the Trustee should serve (or continue to serve) as a trustee of the fund, is provided below.
Board Structure and Oversight Function. James C. Curvey is an interested person and currently serves as Chairman. The Trustees have determined that an interested Chairman is appropriate and benefits shareholders because an interested Chairman has a personal and professional stake in the quality and continuity of services provided to the fund. Independent Trustees exercise their informed business judgment to appoint an individual of their choosing to serve as Chairman, regardless of whether the Trustee happens to be independent or a member of management. The Independent Trustees have determined that they can act independently and effectively without having an Independent Trustee serve as Chairman and that a key structural component for assuring that they are in a position to do so is for the Independent Trustees to constitute a substantial majority for the Board. The Independent Trustees also regularly meet in executive session. Ned C. Lautenbach serves as Chairman of the Independent Trustees and as such (i) acts as a liaison between the Independent Trustees and management with respect to matters important to the Independent Trustees and (ii) with management prepares agendas for Board meetings.
Fidelity® funds are overseen by different Boards of Trustees. The fund's Board oversees Fidelity's high income and certain equity funds, and other Boards oversee Fidelity's investment-grade bond, money market, asset allocation, and sector funds. The asset allocation funds may invest in Fidelity® funds overseen by the fund's Board. The use of separate Boards, each with its own committee structure, allows the Trustees of each group of Fidelity® funds to focus on the unique issues of the funds they oversee, including common research, investment, and operational issues. On occasion, the separate Boards establish joint committees to address issues of overlapping consequences for the Fidelity® funds overseen by each Board.
The Trustees operate using a system of committees to facilitate the timely and efficient consideration of all matters of importance to the Trustees, the fund, and fund shareholders and to facilitate compliance with legal and regulatory requirements and oversight of the fund's activities and associated risks. The Board, acting through its committees, has charged FMR and its affiliates with (i) identifying events or circumstances the occurrence of which could have demonstrably adverse effects on the fund's business and/or reputation; (ii) implementing processes and controls to lessen the possibility that such events or circumstances occur or to mitigate the effects of such events or circumstances if they do occur; and (iii) creating and maintaining a system designed to evaluate continuously business and market conditions in order to facilitate the identification and implementation processes described in (i) and (ii) above. Because the day-to-day operations and activities of the fund are carried out by or through FMR, its affiliates, and other service providers, the fund's exposure to risks is mitigated but not eliminated by the processes overseen by the Trustees. While each of the Board's committees has responsibility for overseeing different aspects of the fund's activities, oversight is exercised primarily through the Operations, Audit, and Compliance Committees. In addition, the Independent Trustees have worked with FMR to enhance the Board's oversight of investment and financial risks, legal and regulatory risks, technology risks, and operational risks, including the development of additional risk reporting to the Board. For example, a working group comprised of Independent Trustees and FMR has worked and continues to work to review the Fidelity® funds' valuation-related activities, reporting and risk management. Appropriate personnel, including but not limited to the fund's Chief Compliance Officer (CCO), FMR's internal auditor, the independent accountants, the fund's Treasurer and portfolio management personnel, make periodic reports to the Board's committees, as appropriate, including an annual review of Fidelity's risk management program for the Fidelity® funds. The responsibilities of each standing committee, including their oversight responsibilities, are described further under "Standing Committees of the Trustees."
Interested Trustees*:
Correspondence intended for a Trustee who is an interested person may be sent to Fidelity Investments, 245 Summer Street, Boston, Massachusetts 02210.
Name, Year of Birth; Principal Occupations and Other Relevant Experience+
James C. Curvey (1935)
Year of Election or Appointment: 2007
Trustee
Chairman of the Board of Trustees
Mr. Curvey also serves as Trustee of other Fidelity® funds. Mr. Curvey is a Director of Fidelity Research & Analysis Co. (investment adviser firm, 2009-present), and Vice Chairman (2007-present) and Director of FMR LLC (diversified financial services company). In addition, Mr. Curvey serves as an Overseer for the Boston Symphony Orchestra and a member of the board of Artis-Naples, Naples, Florida, and as a Trustee for Brewster Academy, Wolfeboro, New Hampshire. Previously, Mr. Curvey served as a Director of Fidelity Investments Money Management, Inc. (investment adviser firm, 2009-2014) and a Director of FMR and FMR Co., Inc. (investment adviser firms, 2007-2014).
Charles S. Morrison (1960)
Year of Election or Appointment: 2014
Trustee
Mr. Morrison also serves as Trustee of other funds. He serves as a Director of Fidelity Investments Money Management, Inc. (FIMM) (investment adviser firm, 2014-present), Director of Fidelity SelectCo, LLC (investment adviser firm, 2014-present), President, Asset Management (2014-present), and is an employee of Fidelity Investments. Previously, Mr. Morrison served as Vice President of Fidelity's Fixed Income and Asset Allocation Funds (2012-2014), President, Fixed Income (2011-2014), Vice President of Fidelity's Money Market Funds (2005-2009), President, Money Market Group Leader of FMR (investment adviser firm, 2009), and Senior Vice President, Money Market Group of FMR (2004-2009). Mr. Morrison also served as Vice President of Fidelity's Bond Funds (2002-2005), certain Balanced Funds (2002-2005), and certain Asset Allocation Funds (2002-2007), and as Senior Vice President (2002-2005) of Fidelity's Bond Division.
* Determined to be an “Interested Trustee” by virtue of, among other things, his or her affiliation with the trust or various entities under common control with FMR.
+ The information includes the Trustee's principal occupation during the last five years and other information relating to the experience, attributes, and skills relevant to the Trustee's qualifications to serve as a Trustee, which led to the conclusion that the Trustee should serve as a Trustee for the fund.
Independent Trustees:
Correspondence intended for an Independent Trustee may be sent to Fidelity Investments, P.O. Box 55235, Boston, Massachusetts 02205-5235.
Name, Year of Birth; Principal Occupations and Other Relevant Experience+
Dennis J. Dirks (1948)
Year of Election or Appointment: 2005
Trustee
Mr. Dirks also serves as Trustee of other Fidelity® funds. Prior to his retirement in May 2003, Mr. Dirks was Chief Operating Officer and a member of the Board of The Depository Trust & Clearing Corporation (DTCC). He also served as President, Chief Operating Officer, and Board member of The Depository Trust Company (DTC) and President and Board member of the National Securities Clearing Corporation (NSCC). In addition, Mr. Dirks served as Chief Executive Officer and Board member of the Government Securities Clearing Corporation, Chief Executive Officer and Board member of the Mortgage-Backed Securities Clearing Corporation, as a Trustee and a member of the Finance Committee of Manhattan College (2005-2008), as a Trustee and a member of the Finance Committee of AHRC of Nassau County (2006-2008), and as a member of the Independent Directors Council (IDC) Governing Council (2010-2015). Mr. Dirks is a member of the Board of Directors for The Brookville Center for Children's Services, Inc. (2009-present).
Alan J. Lacy (1953)
Year of Election or Appointment: 2008
Trustee
Mr. Lacy also serves as Trustee of other Fidelity® funds. Mr. Lacy serves as a member of the Board of Directors of Dave & Buster's Entertainment, Inc. (restaurant and entertainment complexes, 2010-present) and Bristol-Myers Squibb Company (global pharmaceuticals, 2008-present). In addition, Mr. Lacy served as Senior Adviser (2007-2014) of Oak Hill Capital Partners, L.P. (private equity) and also served as Chief Executive Officer (2000-2005) and Vice Chairman (2005-2006) of Sears Holdings Corporation and Sears, Roebuck and Co. (retail). Mr. Lacy is a member of the Board of Trustees of The National Parks Conservation Association (2006-present). Previously, Mr. Lacy served as Chairman of the Board of Trustees of the National Parks Conservation Association (2008-2011) and as a member of the Board of Directors for The Western Union Company (global money transfer, 2006-2011), The Hillman Companies, Inc. (hardware wholesalers, 2010-2014), and Earth Fare, Inc. (retail grocery, 2010-2014).
Ned C. Lautenbach (1944)
Year of Election or Appointment: 2000
Trustee
Chairman of the Independent Trustees
Mr. Lautenbach also serves as Trustee of other Fidelity® funds. Mr. Lautenbach currently serves as the Lead Director of the Eaton Corporation Board of Directors (diversified industrial, 1997-present). Mr. Lautenbach is Chairman of the Board of Directors of Artis-Naples in Naples, Florida (2012-present), a member of the Council on Foreign Relations (1994-present), and a member of the Board of Governors, State University System of Florida (2013-present). Previously, Mr. Lautenbach was a Partner/Advisory Partner at Clayton, Dubilier & Rice, LLC (private equity investment, 1998-2010), as well as a Director of Sony Corporation (2006-2007).
Joseph Mauriello (1944)
Year of Election or Appointment: 2008
Trustee
Mr. Mauriello also serves as Trustee of other Fidelity® funds. Prior to his retirement in January 2006, Mr. Mauriello served in numerous senior management positions including Deputy Chairman and Chief Operating Officer (2004-2005), and Vice Chairman of Financial Services (2002-2004) of KPMG LLP US (professional services, 1965-2005). Mr. Mauriello currently serves as a member of the Board of Directors of XL Group plc. (global insurance and re-insurance, 2006-present) and the Independent Directors Council (IDC) Governing Council (2015-present). Previously, Mr. Mauriello served as a Director of the Hamilton Funds of the Bank of New York (2006-2007) and of Arcadia Resources Inc. (health care services and products, 2007-2012).
Robert W. Selander (1950)
Year of Election or Appointment: 2011
Trustee
Mr. Selander also serves as Trustee of other Fidelity® funds. Mr. Selander serves as a Director of The Western Union Company (global money transfer, 2014-present). Previously, Mr. Selander served as a Member of the Advisory Board of other Fidelity® funds (2011), and Executive Vice Chairman (2010), Chief Executive Officer (2009-2010), and President and Chief Executive Officer (1997-2009) of Mastercard, Inc.
Cornelia M. Small (1944)
Year of Election or Appointment: 2005
Trustee
Ms. Small also serves as Trustee of other Fidelity® funds. Ms. Small is a member of the Board of Directors (2009-present) and Chair of the Investment Committee (2010-present) of the Teagle Foundation. Ms. Small also serves on the Investment Committee of the Berkshire Taconic Community Foundation (2008-present). Previously, Ms. Small served as Chairperson (2002-2008) and a member of the Investment Committee and Chairperson (2008-2012) and a member of the Board of Trustees of Smith College. In addition, Ms. Small served as Chief Investment Officer, Director of Global Equity Investments, and a member of the Board of Directors of Scudder, Stevens & Clark and Scudder Kemper Investments.
William S. Stavropoulos (1939)
Year of Election or Appointment: 2002
Trustee
Vice Chairman of the Independent Trustees
Mr. Stavropoulos also serves as Trustee of other Fidelity® funds. Mr. Stavropoulos serves as President and Founder of the Michigan Baseball Foundation, the Great Lakes Loons (2007-present). Mr. Stavropoulos is Chairman Emeritus of the Board of Directors of The Dow Chemical Company, where he previously served in numerous senior management positions, including President, CEO (1995-2000; 2002-2004), Chairman of the Executive Committee (2000-2006), and as a member of the Board of Directors (1990-2006). Currently, Mr. Stavropoulos is Chairman of the Board of Directors of Univar Inc. (global distributor of commodity and specialty chemicals), a Director of Teradata Corporation (data warehousing and technology solutions), and Maersk Inc. (industrial conglomerate), and a member of the Advisory Board for Metalmark Capital LLC (private equity investment, 2005-present). Mr. Stavropoulos is an operating advisor to Clayton, Dubilier & Rice, LLC (private equity investment). In addition, Mr. Stavropoulos is a member of the University of Notre Dame Advisory Council for the College of Science, a Trustee of the Rollin L. Gerstacker Foundation, and a Director of the Naples Philharmonic Center for the Arts. Previously, Mr. Stavropoulos served as a Director of Chemical Financial Corporation (bank holding company, 1993-2012) and Tyco International, Ltd. (multinational manufacturing and services, 2007-2012).
David M. Thomas (1949)
Year of Election or Appointment: 2008
Trustee
Mr. Thomas also serves as Trustee of other Fidelity® funds. Mr. Thomas serves as Non-Executive Chairman of the Board of Directors of Fortune Brands Home and Security (home and security products, 2011-present), as a member of the Board of Directors (2004-present) and Presiding Director (2013-present) of Interpublic Group of Companies, Inc. (marketing communication), and as a member of the Board of Trustees of the University of Florida (2013-present). Previously, Mr. Thomas served as Executive Chairman (2005-2006) and Chairman and Chief Executive Officer (2000-2005) of IMS Health, Inc. (pharmaceutical and healthcare information solutions), and a Director of Fortune Brands, Inc. (consumer products, 2000-2011).
+ The information includes the Trustee's principal occupation during the last five years and other information relating to the experience, attributes, and skills relevant to the Trustee's qualifications to serve as a Trustee, which led to the conclusion that the Trustee should serve as a Trustee for the fund.
Advisory Board Members and Officers:
Correspondence intended for an officer or Peter S. Lynch may be sent to Fidelity Investments, 245 Summer Street, Boston, Massachusetts 02210. Officers appear below in alphabetical order.
Name, Year of Birth; Principal Occupation
Peter S. Lynch (1944)
Year of Election or Appointment: 2003
Member of the Advisory Board
Mr. Lynch also serves as Member of the Advisory Board of other Fidelity® funds. Mr. Lynch is Vice Chairman and a Director of FMR (investment adviser firm) and FMR Co., Inc. (investment adviser firm). In addition, Mr. Lynch serves as a Trustee of Boston College and as the Chairman of the Inner-City Scholarship Fund. Previously, Mr. Lynch served on the Special Olympics International Board of Directors (1997-2006).
Elizabeth Paige Baumann (1968)
Year of Election or Appointment: 2012
Anti-Money Laundering (AML) Officer
Ms. Baumann also serves as AML Officer of other funds. She is Chief AML Officer of FMR LLC (diversified financial services company, 2012-present) and is an employee of Fidelity Investments. Previously, Ms. Baumann served as Vice President and Deputy Anti-Money Laundering Officer (2007-2012).
Marc R. Bryant (1966)
Year of Election or Appointment: 2015
Secretary and Chief Legal Officer (CLO)
Mr. Bryant also serves as Secretary and CLO of other funds. Mr. Bryant serves as CLO, Secretary, and Senior Vice President of Fidelity Management & Research Company (investment adviser firm, 2015-present) and FMR Co., Inc. (investment adviser firm, 2015-present); Secretary of Fidelity SelectCo, LLC (investment adviser firm, 2015-present) and Fidelity Investments Money Management, Inc. (investment adviser firm, 2015-present); and CLO of Fidelity Management & Research (Hong Kong) Limited (investment adviser firm, 2015-present). He is Senior Vice President and Deputy General Counsel of FMR LLC (diversified financial services company). Previously, Mr. Bryant served as Secretary and Chief Legal Officer of Fidelity Rutland Square Trust II (2010-2014) and Assistant Secretary of Fidelity's Fixed Income and Asset Allocation Funds (2013-2015). Prior to joining Fidelity Investments, Mr. Bryant served as a Senior Vice President and the Head of Global Retail Legal for AllianceBernstein L.P. (2006-2010), and as the General Counsel for ProFund Advisors LLC (2001-2006).
William C. Coffey (1969)
Year of Election or Appointment: 2009
Assistant Secretary
Mr. Coffey also serves as Assistant Secretary of other funds. He is Senior Vice President and Deputy General Counsel of FMR LLC (diversified financial services company, 2010-present), and is an employee of Fidelity Investments. Previously, Mr. Coffey served as Vice President and Associate General Counsel of FMR LLC (2005-2009).
Jonathan Davis (1968)
Year of Election or Appointment: 2010
Assistant Treasurer
Mr. Davis also serves as Assistant Treasurer of other funds, and is an employee of Fidelity Investments. Previously, Mr. Davis served as Vice President and Associate General Counsel of FMR LLC (diversified financial services company, 2003-2010).
Adrien E. Deberghes (1967)
Year of Election or Appointment: 2008
Deputy Treasurer
Mr. Deberghes also serves as an officer of other funds. He is an employee of Fidelity Investments (2008-present). Prior to joining Fidelity Investments, Mr. Deberghes was Senior Vice President of Mutual Fund Administration at State Street Corporation (2007-2008), Senior Director of Mutual Fund Administration at Investors Bank & Trust (2005-2007), and Director of Finance for Dunkin' Brands (2000-2005).
Stephanie J. Dorsey (1969)
Year of Election or Appointment: 2010
Assistant Treasurer
Ms. Dorsey also serves as an officer of other funds. She is an employee of Fidelity Investments (2008-present) and has served in other fund officer roles. Prior to joining Fidelity Investments, Ms. Dorsey served as Treasurer (2004-2008) of the JPMorgan Mutual Funds and Vice President (2004-2008) of JPMorgan Chase Bank.
Howard J. Galligan III (1966)
Year of Election or Appointment: 2014
Chief Financial Officer
Mr. Galligan also serves as Chief Financial Officer of other funds. Mr. Galligan serves as President of Fidelity Pricing and Cash Management Services (FPCMS) (2014-present) and as a Director of Strategic Advisers, Inc. (investment adviser firm, 2008-present). Previously, Mr. Galligan served as Chief Administrative Officer of Asset Management (2011-2014) and Chief Operating Officer and Senior Vice President of Investment Support for Strategic Advisers, Inc. (2003-2011).
Scott C. Goebel (1968)
Year of Election or Appointment: 2015
Vice President
Mr. Goebel serves as Vice President of other funds and is an employee of Fidelity Investments (2001-present). Previously, Mr. Goebel served as Secretary of Fidelity SelectCo, LLC (investment adviser firm, 2013-2015), Fidelity Investments Money Management, Inc. (FIMM) (investment adviser firm, 2010-2015), and Fidelity Research and Analysis Company (FRAC) (investment adviser firm, 2010-2015); General Counsel, Secretary, and Senior Vice President of Fidelity Management & Research Company (investment adviser firm, 2008-2015) and FMR Co., Inc. (investment adviser firm, 2008-2015); Assistant Secretary of Fidelity Management & Research (Japan) Limited (investment adviser firm, 2008-2015) and FMR Investment Management (U.K.) Limited (investment adviser firm, 2008-2015); Chief Legal Officer (CLO) of Fidelity Management & Research (Hong Kong) Limited (investment adviser firm, 2008-2015); Secretary and CLO of certain Fidelity® funds (2008-2015); Assistant Secretary of FIMM (2008-2010), FRAC (2008-2010), and certain funds (2007-2008); and as Vice President and Secretary of Fidelity Distributors Corporation (FDC) (2005-2007).
Brian B. Hogan (1964)
Year of Election or Appointment: 2009
Vice President
Mr. Hogan also serves as Trustee or Vice President of other funds. Mr. Hogan serves as a Director of Fidelity SelectCo, LLC (investment adviser firm, 2014-present) and President of the Equity Division of FMR (investment adviser firm, 2009-present). Previously, Mr. Hogan served as Senior Vice President, Equity Research of FMR (2006-2009) and as a portfolio manager.
Chris Maher (1972)
Year of Election or Appointment: 2013
Assistant Treasurer
Mr. Maher serves as Assistant Treasurer of other funds. Mr. Maher is Vice President of Valuation Oversight and is an employee of Fidelity Investments. Previously, Mr. Maher served as Vice President of Asset Management Compliance (2013), Vice President of the Program Management Group of FMR (investment adviser firm, 2010-2013), and Vice President of Valuation Oversight (2008-2010).
Melissa M. Reilly (1971)
Year of Election or Appointment: 2014
Vice President of certain Equity Funds
Ms. Reilly also serves as Vice President of other funds. Ms. Reilly is an employee of Fidelity Investments (2004-present).
Kenneth B. Robins (1969)
Year of Election or Appointment: 2008
President and Treasurer
Mr. Robins also serves as an officer of other funds. Mr. Robins serves as Executive Vice President of Fidelity Investments Money Management, Inc. (FIMM) (investment adviser firm, 2013-present) and is an employee of Fidelity Investments (2004-present). Previously, Mr. Robins served in other fund officer roles.
Stacie M. Smith (1974)
Year of Election or Appointment: 2013
Deputy Treasurer
Ms. Smith also serves as an officer of other funds. She is an employee of Fidelity Investments (2009-present) and has served in other fund officer roles. Prior to joining Fidelity Investments, Ms. Smith served as Senior Audit Manager of Ernst & Young LLP (1996-2009).
Renee Stagnone (1975)
Year of Election or Appointment: 2013
Deputy Treasurer
Ms. Stagnone also serves as Deputy Treasurer of other funds. Ms. Stagnone is an employee of Fidelity Investments (1997-present).
Linda J. Wondrack (1964)
Year of Election or Appointment: 2014
Chief Compliance Officer
Ms. Wondrack also serves as Chief Compliance Officer of other funds. Ms. Wondrack is Executive Vice President and head of the Ethics Office and Asset Management Compliance for Fidelity Investments (2012-present). Ms. Wondrack also serves as Chief Compliance Officer of Fidelity SelectCo, LLC (investment adviser firm, 2014-present); Chief Compliance Officer of Impresa Management LLC (2013-present); and Chief Compliance Officer of FMR Co., Inc. (investment adviser firm), Fidelity Investments Money Management, Inc. (investment adviser firm), Fidelity Management & Research (Japan) Limited (investment adviser firm), FMR Investment Management (U.K.) Limited (investment adviser firm), Fidelity Management & Research (Hong Kong) (investment adviser firm), Fidelity Management & Research Company (investment adviser firm), FIAM LLC (investment adviser firm), and Strategic Advisers, Inc. (investment adviser firm), Ballyrock Investment Advisors LLC, and Northern Neck Investors LLC (2012-present). Previously, Ms. Wondrack served as Senior Vice President and Chief Compliance Officer for Columbia Management Investment Advisers, LLC (2005-2012); Chief Compliance Officer for certain funds within the Columbia Family of Funds (2007-2012); and Senior Vice President of Compliance Risk Management at Bank of America (2005-2010).
Joseph F. Zambello (1957)
Year of Election or Appointment: 2011
Deputy Treasurer
Mr. Zambello also serves as Deputy Treasurer of other funds. Mr. Zambello is an employee of Fidelity Investments (1991-present). Previously, Mr. Zambello served as Vice President of the Program Management Group of FMR (investment adviser firm, 2009-2011) and Vice President of the Transfer Agent Oversight Group (2005-2009).
Shareholder Expense Example
As a shareholder of the Fund, you incur two types of costs: (1) transaction costs and (2) ongoing costs, including management fees and other Fund expenses. This Example is intended to help you understand your ongoing costs (in dollars) of investing in the Fund and to compare these costs with the ongoing costs of investing in other mutual funds.
The Example is based on an investment of $1,000 invested at the beginning of the period and held for the entire period (May 1, 2015 to October 31, 2015).
Actual Expenses
The first line of the accompanying table for each class of the Fund provides information about actual account values and actual expenses. You may use the information in this line, together with the amount you invested, to estimate the expenses that you paid over the period. Simply divide your account value by $1,000.00 (for example, an $8,600 account value divided by $1,000.00 = 8.6), then multiply the result by the number in the first line for a class of the Fund under the heading entitled "Expenses Paid During Period" to estimate the expenses you paid on your account during this period. A small balance maintenance fee of $12.00 that is charged once a year may apply for certain accounts with a value of less than $2,000. This fee is not included in the table below. If it was, the estimate of expenses you paid during the period would be higher, and your ending account value lower, by this amount. In addition, the Fund, as a shareholder in the underlying Fidelity Central Funds, will indirectly bear its pro-rata share of the fees and expenses incurred by the underlying Fidelity Central Funds. These fees and expenses are not included in the Fund's annualized expense ratio used to calculate the expense estimate in the table below.
Hypothetical Example for Comparison Purposes
The second line of the accompanying table for each class of the Fund provides information about hypothetical account values and hypothetical expenses based on a Class' actual expense ratio and an assumed rate of return of 5% per year before expenses, which is not the Class' actual return. The hypothetical account values and expenses may not be used to estimate the actual ending account balance or expenses you paid for the period. You may use this information to compare the ongoing costs of investing in the Fund and other funds. To do so, compare this 5% hypothetical example with the 5% hypothetical examples that appear in the shareholder reports of the other funds. A small balance maintenance fee of $12.00 that is charged once a year may apply for certain accounts with a value of less than $2,000. This fee is not included in the table below. If it was, the estimate of expenses you paid during the period would be higher, and your ending account value lower, by this amount. In addition, the Fund, as a shareholder in the underlying Fidelity Central Funds, will indirectly bear its pro-rata share of the fees and expenses incurred by the underlying Fidelity Central Funds. These fees and expenses are not included in the Fund's annualized expense ratio used to calculate the expense estimate in the table below.
Please note that the expenses shown in the table are meant to highlight your ongoing costs only and do not reflect any transaction costs. Therefore, the second line of the table is useful in comparing ongoing costs only, and will not help you determine the relative total costs of owning different funds.
| Annualized Expense Ratio-A | Beginning Account Value May 1, 2015 | Ending Account Value October 31, 2015 | Expenses Paid During Period-B May 1, 2015 to October 31, 2015 | |
| Disciplined Equity | .89% | |||
| Actual | $1,000.00 | $997.10 | $4.48 | |
| Hypothetical-C | $1,000.00 | $1,020.72 | $4.53 | |
| Class K | .79% | |||
| Actual | $1,000.00 | $997.70 | $3.98 | |
| Hypothetical-C | $1,000.00 | $1,021.22 | $4.02 |
A Annualized expense ratio reflects expenses net of applicable fee waivers.
B Expenses are equal to each Class' annualized expense ratio, multiplied by the average account value over the period, multiplied by 184/365 (to reflect the one-half year period).
C 5% return per year before expenses
Distributions (Unaudited)
The Board of Trustees of Fidelity Disciplined Equity Fund voted to pay to shareholders of record at the opening of business on record date, the following distributions per share derived from capital gains realized from sales of portfolio securities, and dividends derived from net investment income:
| Pay Date | Record Date | Dividends | Capital Gains | |
| Class K | 12/07/15 | 12/04/15 | $0.390 | $1.648 |
The fund hereby designates as a capital gain dividend with respect to the taxable year ended October 31, 2015, $69,242,695, or, if subsequently determined to be different, the net capital gain of such year.
Class K designates 33% of the dividends distributed during the fiscal year as qualifying for the dividends–received deduction for corporate shareholders.
Class K designates 34% of the dividend distributed in December during the fiscal year as amounts which may be taken into account as a dividend for the purposes of the maximum rate under section 1(h)(11) of the Internal Revenue Code.
The fund will notify shareholders in January 2016 of amounts for use in preparing 2015 income tax returns.
Board Approval of Investment Advisory Contracts and Management Fees
Fidelity Disciplined Equity Fund
Each year, the Board of Trustees, including the Independent Trustees (together, the Board), votes on the renewal of the management contract with Fidelity Management & Research Company (FMR) and the sub-advisory agreements (together, the Advisory Contracts) for the fund. The Board, assisted by the advice of fund counsel and Independent Trustees' counsel, requests and considers a broad range of information relevant to the renewal of the Advisory Contracts throughout the year.
The Board meets regularly and, at each of its meetings, covers an extensive agenda of topics and materials and considers factors that are relevant to its annual consideration of the renewal of the fund's Advisory Contracts, including the services and support provided to the fund and its shareholders. The Board has established various standing committees (Committees), each composed of and chaired by Independent Trustees with varying backgrounds, to which the Board has assigned specific subject matter responsibilities in order to enhance effective decision-making by the Board. The Board, acting directly and through its Committees, requests and receives information concerning the annual consideration of the renewal of the fund's Advisory Contracts. The Board also meets as needed to consider matters specifically related to the Board's annual consideration of the renewal of the Advisory Contracts. Members of the Board may also meet with trustees of other Fidelity funds through ad hoc joint committees to discuss certain matters relevant to all of the Fidelity funds.
At its July 2015 meeting, the Board unanimously determined to renew the fund's Advisory Contracts. In reaching its determination, the Board considered all factors it believed relevant, including (i) the nature, extent, and quality of the services to be provided to the fund and its shareholders (including the investment performance of the fund); (ii) the competitiveness of the fund's management fee and total expense ratio relative to peer funds; (iii) the total costs of the services to be provided by and the profits to be realized by Fidelity from its relationship with the fund; and (iv) the extent to which (if any) economies of scale exist and would be realized as the fund grows, and whether any economies of scale are appropriately shared with fund shareholders.
In considering whether to renew the Advisory Contracts for the fund, the Board reached a determination, with the assistance of fund counsel and Independent Trustees' counsel and through the exercise of its business judgment, that the renewal of the Advisory Contracts was in the best interests of the fund and its shareholders and that the compensation payable under the Advisory Contracts was fair and reasonable. The Board's decision to renew the Advisory Contracts was not based on any single factor, but rather was based on a comprehensive consideration of all the information provided to the Board at its meetings throughout the year. The Board, in reaching its determination to renew the Advisory Contracts, was aware that shareholders of the fund have a broad range of investment choices available to them, including a wide choice among funds offered by Fidelity's competitors, and that the fund's shareholders, who have the opportunity to review and weigh the disclosure provided by the fund in its prospectus and other public disclosures, have chosen to invest in this fund, which is part of the Fidelity family of funds.
Nature, Extent, and Quality of Services Provided. The Board considered Fidelity's staffing as it relates to the fund, including the backgrounds of investment personnel of Fidelity, and also considered the fund's investment objective, strategies, and related investment philosophy. The Independent Trustees also had discussions with senior management of Fidelity's investment operations and investment groups. The Board considered the structure of the portfolio manager compensation program and whether this structure provides appropriate incentives to act in the best interests of the fund. Additionally, the Board considered the portfolio managers' investments, if any, in the funds that they manage.Resources Dedicated to Investment Management and Support Services. The Board and the Fund Oversight and Research Committees reviewed the general qualifications and capabilities of Fidelity's investment staff, including its size, education, experience, and resources, as well as Fidelity's approach to recruiting, training, managing, and compensating investment personnel. The Board noted that Fidelity has continued to increase the resources devoted to non-U.S. offices, including expansion of Fidelity's global investment organization. The Board also noted that Fidelity's analysts have extensive resources, tools and capabilities that allow them to conduct sophisticated quantitative and fundamental analysis, as well as credit analysis of issuers, counterparties and guarantors. Further, the Board considered that Fidelity's investment professionals have sufficient access to global information and data so as to provide competitive investment results over time, and that those professionals also have access to sophisticated tools that permit them to assess portfolio construction and risk and performance attribution characteristics continuously, as well as to transmit new information and research conclusions rapidly around the world. Additionally, in its deliberations, the Board considered Fidelity's trading, risk management, and compliance capabilities and resources, which are integral parts of the investment management process.Shareholder and Administrative Services. The Board considered (i) the nature, extent, quality, and cost of advisory, administrative, and shareholder services performed by FMR, the sub-advisers (together with FMR, the Investment Advisers), and their affiliates under the Advisory Contracts and under separate agreements covering transfer agency, pricing and bookkeeping, and securities lending services for the fund; (ii) the nature and extent of the supervision of third party service providers, principally custodians and subcustodians; and (iii) the resources devoted to, and the record of compliance with, the fund's compliance policies and procedures. The Board also reviewed the allocation of fund brokerage, including allocations to brokers affiliated with the Investment Advisers, the use of brokerage commissions to pay fund expenses, and the use of "soft" commission dollars to pay for research services.The Board noted that the growth of fund assets over time across the complex allows Fidelity to reinvest in the development of services designed to enhance the value or convenience of the Fidelity funds as investment vehicles. These services include 24-hour access to account information and market information through telephone representatives and over the Internet, investor education materials and asset allocation tools, and the expanded availability of Fidelity Investor Centers.In 2014, the Board formed an ad hoc Committee on Transfer Agency Fees to review the variety of transfer agency fee structures throughout the industry and Fidelity's competitive positioning with respect to industry participants.Investment in a Large Fund Family. The Board considered the benefits to shareholders of investing in a Fidelity fund, including the benefits of investing in a fund that is part of a large family of funds offering a variety of investment disciplines and providing a large variety of mutual fund investor services. The Board noted that Fidelity had taken, or had made recommendations that resulted in the Fidelity funds taking, a number of actions over the previous year that benefited particular funds, including (i) continuing to dedicate additional resources to investment research and to the support of the senior management team that oversees asset management; (ii) continuing efforts to enhance Fidelity's global research capabilities; (iii) launching new funds and making other enhancements to meet client needs; (iv) reducing management fees and total expenses for certain index funds and diversified international funds; (v) continuing to launch dedicated lower cost underlying funds to meet portfolio construction needs related to expanding underlying fund options for Fidelity funds of funds, specifically for the Freedom Fund product lines; (vi) rationalizing product lines and gaining increased efficiencies through fund mergers; (vii) launching active fixed-income exchange-traded funds; (viii) continuing to develop, acquire and implement systems and technology to improve services to the funds and information security and to increase efficiency; (ix) implementing investment enhancements to further strengthen Fidelity's target date product line to increase investors' probability of success in achieving their goals; (x) modifying the eligibility criteria for certain share classes to accommodate roll-over assets from employer-sponsored retirement plans; (xi) launching a new Class W of the Freedom Index Funds to attract and retain Fidelity record-kept retirement plan assets; and (xii) implementing changes to Fidelity's money market product line in response to recent money market regulatory reforms.Investment Performance. The Board considered whether the fund has operated in accordance with its investment objective, as well as its record of compliance with its investment restrictions and its performance history. The Board noted that there were portfolio management changes for the fund in January 2013 and January 2014.The Board took into account discussions with representatives of the Investment Advisers about fund investment performance that occur at Board meetings throughout the year. In this regard the Board noted that as part of regularly scheduled fund reviews and other reports to the Board on fund performance, the Board considers annualized return information for the fund, for different time periods, measured against a securities market index ("benchmark index") and a peer group of funds with similar objectives ("peer group"), if any. In its evaluation of fund investment performance, the Board gave particular attention to information indicating changes in performance of certain Fidelity funds for specific time periods and discussed with the Investment Advisers the reasons for any overperformance or underperformance.In addition to reviewing absolute and relative fund performance, the Independent Trustees periodically consider the appropriateness of fund performance metrics in evaluating the results achieved. In general, the Independent Trustees believe that fund performance should be evaluated based on net performance (after fees and expenses) of both the highest performing and lowest performing fund share classes, where applicable, compared to appropriate benchmark indices, over appropriate time periods that may include full market cycles, and compared to peer groups, as applicable, over the same periods, taking into account relevant factors including the following: general market conditions; issuer-specific information; and fund cash flows and other factors.The Independent Trustees recognize that shareholders evaluate performance on a net basis over their own holding periods, for which one-, three-, and five-year periods are often used as a proxy. For this reason, the performance information reviewed by the Board also included net cumulative calendar year total return information for the fund and an appropriate benchmark index and peer group for the most recent one-, three-, and five-year periods, as shown below. Returns are shown compared to the 25th percentile (top of box, 75% beaten) and 75th percentile (bottom of box, 25% beaten) of the peer universe.Fidelity Disciplined Equity Fund
Fidelity Disciplined Equity Fund
![]()
Corporate Headquarters
245 Summer St.
Boston, MA 02210
www.fidelity.com
FDE-K-ANN-1215
1.863075.107
Fidelity Advisor® Stock Selector Small Cap Fund Class I (formerly Institutional Class) Annual Report October 31, 2015 Class I is a class of Fidelity® Stock Selector Small Cap Fund |
|
Contents
Board Approval of Investment Advisory Contracts and Management Fees |
To view a fund's proxy voting guidelines and proxy voting record for the 12-month period ended June 30, visit http://www.fidelity.com/proxyvotingresults or visit the Securities and Exchange Commission's (SEC) web site at http://www.sec.gov.
You may also call 1-877-208-0098 to request a free copy of the proxy voting guidelines.
Standard & Poor's, S&P and S&P 500 are registered service marks of The McGraw-Hill Companies, Inc. and have been licensed for use by Fidelity Distributors Corporation.
Other third-party marks appearing herein are the property of their respective owners.
All other marks appearing herein are registered or unregistered trademarks or service marks of FMR LLC or an affiliated company. © 2015 FMR LLC. All rights reserved.
This report and the financial statements contained herein are submitted for the general information of the shareholders of the Fund. This report is not authorized for distribution to prospective investors in the Fund unless preceded or accompanied by an effective prospectus.
A fund files its complete schedule of portfolio holdings with the SEC for the first and third quarters of each fiscal year on Form N-Q. Forms N-Q are available on the SEC’s web site at http://www.sec.gov. A fund's Forms N-Q may be reviewed and copied at the SEC’s Public Reference Room in Washington, DC. Information regarding the operation of the SEC's Public Reference Room may be obtained by calling 1-800-SEC-0330.
For a complete list of a fund's portfolio holdings, view the most recent holdings listing, semiannual report, or annual report on Fidelity's web site at http://www.fidelity.com, http://www.advisor.fidelity.com, or http://www.401k.com, as applicable.
NOT FDIC INSURED •MAY LOSE VALUE •NO BANK GUARANTEE
Neither the Fund nor Fidelity Distributors Corporation is a bank.
Performance: The Bottom Line
Average annual total return reflects the change in the value of an investment, assuming reinvestment of distributions from dividend income and capital gains (the profits earned upon the sale of securities that have grown in value, if any) and assuming a constant rate of performance each year.
The hypothetical investment and the average annual total returns do not reflect the deduction of taxes that a shareholder would pay on fund distributions or the redemption of fund shares.
During periods of reimbursement by Fidelity, a fund’s total return will be greater than it would be had the reimbursement not occurred.
How a fund did yesterday is no guarantee of how it will do tomorrow.
Average Annual Total Returns
| For the periods ended October 31, 2015 | Past 1 year | Past 5 years | Past 10 years |
| Class I | 4.52% | 12.22% | 6.63% |
The initial offering of Class I shares took place on May 2, 2007. Returns prior to May 2, 2007 are those of Fidelity® Stock Selector Small Cap Fund, the original class of the fund.
$10,000 Over 10 Years
Let's say hypothetically that $10,000 was invested in Fidelity Advisor® Stock Selector Small Cap Fund - Class I on October 31, 2005.
The chart shows how the value of your investment would have changed, and also shows how the Russell 2000® Index performed over the same period.
See above for additional information regarding the performance of Class I.
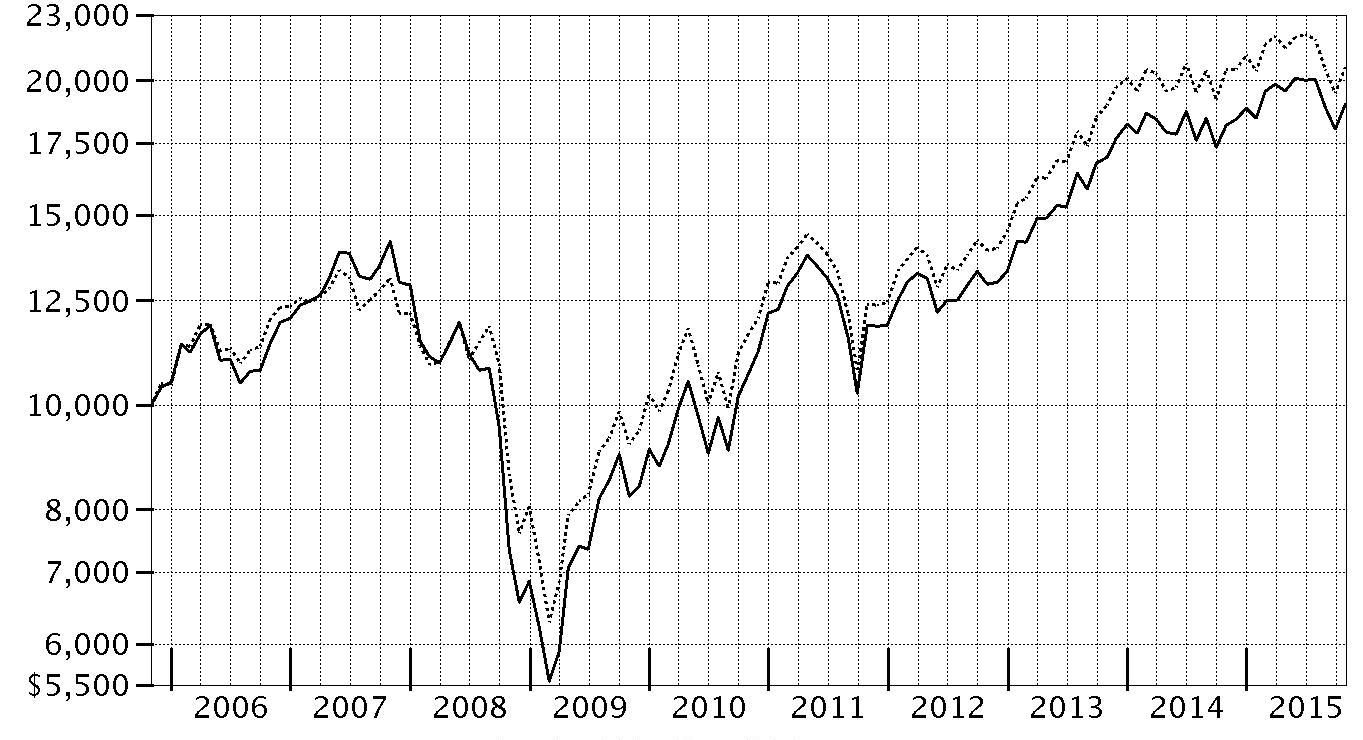
| Period Ending Values | ||
| $19,005 | Fidelity Advisor® Stock Selector Small Cap Fund - Class I | |
| $20,556 | Russell 2000® Index | |
Management's Discussion of Fund Performance
Market Recap: U.S. stocks gained moderately for the 12 months ending October 31, 2015, helped by a strong October that largely erased a steep decline in August and September on concern about slowing global economic growth emanating from China. Stocks benefited late in the period amid waning expectations for a near-term interest-rate hike by the U.S. Federal Reserve, additional economic stimulus in Europe and an interest-rate cut in China. The large-cap S&P 500® index advanced 5.20% for the period, with growth stocks in the index significantly outpacing value stocks, as investors continued to seek growth in a subpar economic environment. The growth-oriented Nasdaq Composite Index® also benefited, gaining 10.39%, while the small-cap Russell 2000® Index lost its edge, returning only 0.34%, as risk appetites waned. Among sectors in the widely followed S&P 500®, consumer discretionary (+21%) led the way, benefiting from a combination of rising personal income and still-benign inflation. Technology (+11%) and consumer staples (+9%) also outpaced the index. Conversely, energy (-19%) performed worst, in an environment of depressed commodity prices that also hit materials (-4%). At period end, investors remained focused on the potential global implications of a relatively stronger U.S. dollar and how China’s transition toward a consumption-led economy may affect corporate earnings.Comments from Lead Portfolio Manager Richard Thompson: For the year, the fund’s share classes (excluding sales charges, if applicable) strongly outpaced the roughly flat return of its benchmark Russell 2000® Index, with significant performance dispersion by sector. For example, energy was down 44%, while information technology advanced 10%. Amid this volatile environment, the fund’s stock selection was the primary driver of relative outperformance. An out-of-index stake in transaction processor Global Payments was the fund’s top individual contributor. The stock performed well, mainly due to the company’s stable business and investors’ perception of the stock as a defensive name. Pharmaceuticals, biotechnology & life sciences companies bluebird bio and Auspex Pharmaceuticals also helped. Auspex was sold by period end. Conversely, stock choices in materials, led by titanium dioxide producer Tronox, dragged on the fund’s return. Over the course of the past year, China’s economic slowdown derailed demand for titanium dioxide, which provides brightness to coatings, plastics and paper. We sold some of the fund’s stake in Tronox by period end. Several energy names also hampered performance, including our position in Stone Energy. Bristow Group, which provides helicopter services to offshore energy companies, also declined.The views expressed above reflect those of the portfolio manager(s) only through the end of the period as stated on the cover of this report and do not necessarily represent the views of Fidelity or any other person in the Fidelity organization. Any such views are subject to change at any time based upon market or other conditions and Fidelity disclaims any responsibility to update such views. These views may not be relied on as investment advice and, because investment decisions for a Fidelity fund are based on numerous factors, may not be relied on as an indication of trading intent on behalf of any Fidelity fund.
Investment Summary (Unaudited)
Top Ten Stocks as of October 31, 2015
| % of fund's net assets | % of fund's net assets 6 months ago | |
| Bank of the Ozarks, Inc. | 1.8 | 1.3 |
| PacWest Bancorp | 1.4 | 1.2 |
| Huntington Bancshares, Inc. | 1.4 | 1.2 |
| Global Payments, Inc. | 1.4 | 1.2 |
| Banner Corp. | 1.2 | 1.0 |
| MB Financial, Inc. | 1.2 | 0.9 |
| Associated Banc-Corp. | 1.2 | 1.2 |
| WSFS Financial Corp. | 1.2 | 0.9 |
| Mid-America Apartment Communities, Inc. | 1.1 | 1.0 |
| Allied World Assurance Co. Holdings AG | 1.1 | 1.0 |
| 13.0 |
Top Five Market Sectors as of October 31, 2015
| % of fund's net assets | % of fund's net assets 6 months ago | |
| Financials | 24.0 | 22.7 |
| Information Technology | 17.9 | 18.4 |
| Health Care | 14.6 | 15.1 |
| Consumer Discretionary | 12.8 | 13.5 |
| Industrials | 12.7 | 13.2 |
Asset Allocation (% of fund's net assets)
| As of October 31, 2015 * | ||
| Stocks and Equity Futures | 96.3% | |
| Short-Term Investments and Net Other Assets (Liabilities) | 3.7% | |

* Foreign investments - 7.1%
| As of April 30, 2015 * | ||
| Stocks and Equity Futures | 98.2% | |
| Short-Term Investments and Net Other Assets (Liabilities) | 1.8% | |

* Foreign investments - 8.2%
Investments October 31, 2015
Showing Percentage of Net Assets
| Common Stocks - 95.5% | |||
| Shares | Value (000s) | ||
| CONSUMER DISCRETIONARY - 12.8% | |||
| Auto Components - 2.3% | |||
| Cooper Tire & Rubber Co. | 176,620 | $7,381 | |
| Standard Motor Products, Inc. | 121,402 | 5,372 | |
| Tenneco, Inc. (a) | 227,984 | 12,902 | |
| Visteon Corp. (a) | 67,200 | 7,330 | |
| 32,985 | |||
| Diversified Consumer Services - 0.7% | |||
| Service Corp. International | 333,000 | 9,411 | |
| Hotels, Restaurants & Leisure - 1.9% | |||
| Bloomin' Brands, Inc. | 370,084 | 6,280 | |
| Buffalo Wild Wings, Inc. (a) | 49,000 | 7,559 | |
| Domino's Pizza, Inc. | 41,800 | 4,459 | |
| Texas Roadhouse, Inc. Class A | 270,657 | 9,297 | |
| 27,595 | |||
| Household Durables - 1.6% | |||
| Ethan Allen Interiors, Inc. (b) | 357,179 | 9,719 | |
| Helen of Troy Ltd. (a) | 59,700 | 5,923 | |
| Jarden Corp. (a) | 168,877 | 7,566 | |
| 23,208 | |||
| Leisure Products - 1.3% | |||
| Brunswick Corp. | 193,900 | 10,434 | |
| Vista Outdoor, Inc. (a) | 168,566 | 7,538 | |
| 17,972 | |||
| Media - 0.8% | |||
| Nexstar Broadcasting Group, Inc. Class A (b) | 210,335 | 11,196 | |
| Multiline Retail - 0.5% | |||
| Dillard's, Inc. Class A | 82,256 | 7,360 | |
| Specialty Retail - 1.7% | |||
| Chico's FAS, Inc. | 355,627 | 4,915 | |
| Genesco, Inc. (a) | 104,675 | 6,558 | |
| GNC Holdings, Inc. | 206,900 | 6,155 | |
| Murphy U.S.A., Inc. (a) | 104,600 | 6,419 | |
| 24,047 | |||
| Textiles, Apparel & Luxury Goods - 2.0% | |||
| Deckers Outdoor Corp. (a) | 116,000 | 6,457 | |
| G-III Apparel Group Ltd. (a) | 201,810 | 11,118 | |
| Steven Madden Ltd. (a) | 340,959 | 11,882 | |
| 29,457 | |||
| TOTAL CONSUMER DISCRETIONARY | 183,231 | ||
| CONSUMER STAPLES - 3.0% | |||
| Beverages - 0.3% | |||
| Coca-Cola Bottling Co. Consolidated | 23,080 | 4,875 | |
| Food & Staples Retailing - 0.6% | |||
| Casey's General Stores, Inc. | 87,650 | 9,310 | |
| Food Products - 1.4% | |||
| Greencore Group PLC | 1,094,600 | 5,096 | |
| Ingredion, Inc. | 44,000 | 4,183 | |
| J&J Snack Foods Corp. | 56,050 | 6,882 | |
| Pinnacle Foods, Inc. | 74,100 | 3,266 | |
| 19,427 | |||
| Personal Products - 0.7% | |||
| Coty, Inc. Class A (b) | 144,500 | 4,183 | |
| Inter Parfums, Inc. | 189,000 | 5,220 | |
| 9,403 | |||
| TOTAL CONSUMER STAPLES | 43,015 | ||
| ENERGY - 3.1% | |||
| Energy Equipment & Services - 0.8% | |||
| Atwood Oceanics, Inc. | 119,474 | 1,977 | |
| Bristow Group, Inc. | 149,251 | 5,183 | |
| Total Energy Services, Inc. | 334,100 | 3,748 | |
| 10,908 | |||
| Oil, Gas & Consumable Fuels - 2.3% | |||
| Boardwalk Pipeline Partners, LP | 372,300 | 4,773 | |
| Diamondback Energy, Inc. | 85,807 | 6,336 | |
| Newfield Exploration Co. (a) | 165,488 | 6,651 | |
| PDC Energy, Inc. (a) | 107,700 | 6,499 | |
| Stone Energy Corp. (a)(b) | 443,267 | 2,478 | |
| Western Refining, Inc. | 158,988 | 6,617 | |
| 33,354 | |||
| TOTAL ENERGY | 44,262 | ||
| FINANCIALS - 24.0% | |||
| Banks - 11.1% | |||
| Associated Banc-Corp. | 872,023 | 16,865 | |
| BancFirst Corp. | 135,683 | 8,362 | |
| Bank of the Ozarks, Inc. | 514,336 | 25,723 | |
| Banner Corp. | 357,029 | 17,519 | |
| BBCN Bancorp, Inc. | 826,586 | 13,878 | |
| Community Bank System, Inc. | 139,363 | 5,680 | |
| Huntington Bancshares, Inc. | 1,812,600 | 19,884 | |
| Investors Bancorp, Inc. | 1,138,800 | 14,246 | |
| MB Financial, Inc. | 525,100 | 16,929 | |
| PacWest Bancorp | 444,775 | 20,033 | |
| 159,119 | |||
| Capital Markets - 2.1% | |||
| AURELIUS AG | 249,242 | 11,122 | |
| OM Asset Management Ltd. | 630,689 | 9,574 | |
| Raymond James Financial, Inc. | 180,700 | 9,958 | |
| 30,654 | |||
| Insurance - 3.1% | |||
| Allied World Assurance Co. Holdings AG | 444,887 | 16,176 | |
| Aspen Insurance Holdings Ltd. | 210,010 | 10,209 | |
| Primerica, Inc. | 229,069 | 10,911 | |
| StanCorp Financial Group, Inc. | 64,323 | 7,379 | |
| 44,675 | |||
| Real Estate Investment Trusts - 6.5% | |||
| Coresite Realty Corp. | 204,100 | 11,215 | |
| Cousins Properties, Inc. | 1,224,180 | 12,291 | |
| Equity Lifestyle Properties, Inc. | 221,000 | 13,366 | |
| Kite Realty Group Trust | 386,726 | 10,213 | |
| Mid-America Apartment Communities, Inc. | 193,800 | 16,510 | |
| National Retail Properties, Inc. (b) | 222,359 | 8,450 | |
| Ramco-Gershenson Properties Trust (SBI) | 729,850 | 12,261 | |
| Store Capital Corp. | 391,180 | 8,868 | |
| 93,174 | |||
| Thrifts & Mortgage Finance - 1.2% | |||
| WSFS Financial Corp. | 528,242 | 16,782 | |
| TOTAL FINANCIALS | 344,404 | ||
| HEALTH CARE - 14.6% | |||
| Biotechnology - 7.5% | |||
| ACADIA Pharmaceuticals, Inc. (a) | 173,352 | 6,036 | |
| Agios Pharmaceuticals, Inc. (a)(b) | 44,420 | 3,236 | |
| Anacor Pharmaceuticals, Inc. (a) | 66,600 | 7,487 | |
| BioMarin Pharmaceutical, Inc. (a) | 35,256 | 4,126 | |
| Biotie Therapies Corp. sponsored ADR | 171,200 | 2,244 | |
| bluebird bio, Inc. (a) | 30,800 | 2,376 | |
| Cellectis SA sponsored ADR | 117,600 | 3,111 | |
| Chimerix, Inc. (a) | 126,560 | 4,959 | |
| Coherus BioSciences, Inc. (b) | 155,500 | 4,331 | |
| Curis, Inc. (a) | 1,466,283 | 2,991 | |
| CytomX Therapeutics, Inc. | 27,627 | 259 | |
| CytomX Therapeutics, Inc. | 68,600 | 713 | |
| DBV Technologies SA sponsored ADR (a) | 900 | 31 | |
| Dyax Corp. (a) | 297,985 | 8,204 | |
| Genocea Biosciences, Inc. (a) | 238,158 | 1,141 | |
| Heron Therapeutics, Inc. (a)(b) | 144,200 | 3,954 | |
| Insmed, Inc. (a) | 192,672 | 3,823 | |
| Intercept Pharmaceuticals, Inc. (a) | 19,503 | 3,066 | |
| Isis Pharmaceuticals, Inc. (a) | 73,128 | 3,521 | |
| La Jolla Pharmaceutical Co. (a) | 140,800 | 3,519 | |
| Mirati Therapeutics, Inc. (a)(b) | 158,506 | 5,608 | |
| Neurocrine Biosciences, Inc. (a) | 165,160 | 8,108 | |
| Novavax, Inc. (a) | 579,638 | 3,913 | |
| ProNai Therapeutics, Inc. (a)(b) | 141,600 | 2,430 | |
| Spark Therapeutics, Inc. | 81,100 | 4,371 | |
| TESARO, Inc. (a) | 98,300 | 4,470 | |
| Ultragenyx Pharmaceutical, Inc. (a) | 70,300 | 6,984 | |
| Xencor, Inc. (a) | 235,800 | 2,554 | |
| 107,566 | |||
| Health Care Equipment & Supplies - 3.3% | |||
| CONMED Corp. | 77,859 | 3,158 | |
| Hologic, Inc. (a) | 159,900 | 6,214 | |
| Integra LifeSciences Holdings Corp. (a) | 113,106 | 6,738 | |
| NxStage Medical, Inc. (a) | 373,400 | 6,240 | |
| Sirona Dental Systems, Inc. (a) | 53,500 | 5,838 | |
| Steris Corp. | 53,400 | 4,002 | |
| Teleflex, Inc. | 62,000 | 8,246 | |
| Wright Medical Group NV (a) | 359,577 | 6,951 | |
| 47,387 | |||
| Health Care Providers & Services - 2.4% | |||
| AmSurg Corp. (a) | 102,500 | 7,184 | |
| Molina Healthcare, Inc. (a) | 112,400 | 6,969 | |
| Surgical Care Affiliates, Inc. (a) | 224,664 | 6,652 | |
| Team Health Holdings, Inc. (a) | 83,000 | 4,953 | |
| Wellcare Health Plans, Inc. (a) | 100,900 | 8,940 | |
| 34,698 | |||
| Health Care Technology - 0.1% | |||
| Press Ganey Holdings, Inc. | 34,318 | 1,076 | |
| Life Sciences Tools & Services - 0.4% | |||
| Bruker Corp. (a) | 314,234 | 5,772 | |
| Pharmaceuticals - 0.9% | |||
| Prestige Brands Holdings, Inc. (a) | 116,046 | 5,687 | |
| Theravance, Inc. (b) | 300,451 | 2,638 | |
| ZS Pharma, Inc. (a) | 79,900 | 5,194 | |
| 13,519 | |||
| TOTAL HEALTH CARE | 210,018 | ||
| INDUSTRIALS - 12.7% | |||
| Aerospace & Defense - 1.9% | |||
| Moog, Inc. Class A (a) | 120,105 | 7,418 | |
| Orbital ATK, Inc. | 100,559 | 8,610 | |
| Teledyne Technologies, Inc. (a) | 128,366 | 11,454 | |
| 27,482 | |||
| Air Freight & Logistics - 0.8% | |||
| Hub Group, Inc. Class A (a) | 296,020 | 11,835 | |
| Airlines - 0.6% | |||
| JetBlue Airways Corp. (a)(b) | 337,200 | 8,376 | |
| Commercial Services & Supplies - 2.2% | |||
| Deluxe Corp. | 186,300 | 11,094 | |
| Interface, Inc. | 258,000 | 5,044 | |
| Multi-Color Corp. | 100,300 | 7,807 | |
| West Corp. | 334,700 | 7,969 | |
| 31,914 | |||
| Construction & Engineering - 0.9% | |||
| EMCOR Group, Inc. | 259,100 | 12,509 | |
| Electrical Equipment - 0.4% | |||
| OSRAM Licht AG | 103,749 | 6,105 | |
| Machinery - 2.8% | |||
| AGCO Corp. (b) | 153,600 | 7,433 | |
| Kornit Digital Ltd. (a) | 357,100 | 4,264 | |
| KUKA AG (b) | 74,100 | 6,265 | |
| Terex Corp. | 102,400 | 2,054 | |
| TriMas Corp. (a) | 317,286 | 6,349 | |
| Valmont Industries, Inc. | 75,400 | 8,176 | |
| Wabtec Corp. | 67,116 | 5,562 | |
| 40,103 | |||
| Professional Services - 1.0% | |||
| Dun & Bradstreet Corp. | 75,294 | 8,574 | |
| Stantec, Inc. | 236,000 | 5,923 | |
| 14,497 | |||
| Trading Companies & Distributors - 2.1% | |||
| Kaman Corp. | 215,200 | 8,369 | |
| Titan Machinery, Inc. (a)(b) | 469,061 | 5,737 | |
| Watsco, Inc. | 93,900 | 11,553 | |
| WESCO International, Inc. (a) | 82,000 | 4,012 | |
| 29,671 | |||
| TOTAL INDUSTRIALS | 182,492 | ||
| INFORMATION TECHNOLOGY - 17.9% | |||
| Communications Equipment - 1.0% | |||
| F5 Networks, Inc. (a) | 38,300 | 4,221 | |
| Ixia (a) | 511,631 | 7,373 | |
| Radware Ltd. (a) | 140,296 | 2,092 | |
| 13,686 | |||
| Electronic Equipment & Components - 2.0% | |||
| CDW Corp. | 282,300 | 12,616 | |
| Fitbit, Inc. (b) | 100,700 | 4,082 | |
| Jabil Circuit, Inc. | 229,600 | 5,276 | |
| Trimble Navigation Ltd. (a) | 315,900 | 7,187 | |
| 29,161 | |||
| Internet Software & Services - 3.9% | |||
| Bankrate, Inc. (a) | 687,665 | 8,163 | |
| Constant Contact, Inc. (a) | 112,400 | 2,934 | |
| Gogo, Inc. (a)(b) | 102,800 | 1,453 | |
| HomeAway, Inc. (a) | 135,800 | 4,286 | |
| IAC/InterActiveCorp | 89,600 | 6,004 | |
| MINDBODY, Inc. (b) | 142,800 | 2,233 | |
| NIC, Inc. | 388,549 | 7,371 | |
| Pandora Media, Inc. (a) | 236,500 | 2,722 | |
| Rackspace Hosting, Inc. (a) | 275,383 | 7,119 | |
| Stamps.com, Inc. (a) | 80,598 | 6,094 | |
| Web.com Group, Inc. (a) | 317,795 | 7,459 | |
| 55,838 | |||
| IT Services - 4.0% | |||
| ExlService Holdings, Inc. (a) | 328,638 | 14,546 | |
| Global Payments, Inc. | 144,100 | 19,657 | |
| Maximus, Inc. | 234,700 | 16,007 | |
| WEX, Inc. (a) | 84,100 | 7,561 | |
| 57,771 | |||
| Semiconductors & Semiconductor Equipment - 1.9% | |||
| Cirrus Logic, Inc. (a) | 209,300 | 6,453 | |
| Intersil Corp. Class A | 473,200 | 6,412 | |
| Monolithic Power Systems, Inc. | 176,930 | 11,044 | |
| Qorvo, Inc. (a) | 65,850 | 2,893 | |
| 26,802 | |||
| Software - 3.5% | |||
| BroadSoft, Inc. (a) | 136,285 | 4,357 | |
| CommVault Systems, Inc. (a) | 186,723 | 7,566 | |
| Fair Isaac Corp. | 70,700 | 6,531 | |
| Fleetmatics Group PLC (a) | 47,700 | 2,655 | |
| HubSpot, Inc. | 6,851 | 355 | |
| Interactive Intelligence Group, Inc. (a) | 13,695 | 443 | |
| Pegasystems, Inc. | 157,000 | 4,379 | |
| Qlik Technologies, Inc. (a) | 106,800 | 3,350 | |
| RealPage, Inc. (a) | 152,700 | 2,581 | |
| RingCentral, Inc. (a) | 128,100 | 2,370 | |
| Rovi Corp. (a) | 128,341 | 1,174 | |
| SolarWinds, Inc. (a) | 133,100 | 7,724 | |
| Synchronoss Technologies, Inc. (a) | 215,086 | 7,567 | |
| 51,052 | |||
| Technology Hardware, Storage & Peripherals - 1.6% | |||
| Electronics for Imaging, Inc. (a) | 165,475 | 7,685 | |
| Nimble Storage, Inc. (a) | 202,100 | 4,567 | |
| Quantum Corp. (a) | 2,987,041 | 2,509 | |
| Silicon Graphics International Corp. (a)(b) | 666,557 | 2,913 | |
| Super Micro Computer, Inc. (a)(b) | 205,488 | 5,797 | |
| 23,471 | |||
| TOTAL INFORMATION TECHNOLOGY | 257,781 | ||
| MATERIALS - 3.6% | |||
| Chemicals - 1.5% | |||
| Axiall Corp. | 146,654 | 2,970 | |
| Innospec, Inc. | 64,199 | 3,546 | |
| PolyOne Corp. | 206,999 | 6,922 | |
| Sensient Technologies Corp. | 129,900 | 8,479 | |
| 21,917 | |||
| Containers & Packaging - 1.5% | |||
| Avery Dennison Corp. | 83,000 | 5,393 | |
| Berry Plastics Group, Inc. (a) | 316,040 | 10,587 | |
| Silgan Holdings, Inc. | 97,200 | 4,945 | |
| 20,925 | |||
| Metals & Mining - 0.6% | |||
| Compass Minerals International, Inc. | 80,700 | 6,556 | |
| Steel Dynamics, Inc. | 131,200 | 2,423 | |
| 8,979 | |||
| TOTAL MATERIALS | 51,821 | ||
| TELECOMMUNICATION SERVICES - 0.6% | |||
| Diversified Telecommunication Services - 0.6% | |||
| 8x8, Inc. (a) | 145,601 | 1,552 | |
| Cogent Communications Group, Inc. | 121,300 | 3,726 | |
| FairPoint Communications, Inc. (a) | 25,500 | 409 | |
| Lumos Networks Corp. | 37,100 | 481 | |
| Towerstream Corp. (a)(b) | 2,829,372 | 2,252 | |
| 8,420 | |||
| UTILITIES - 3.2% | |||
| Electric Utilities - 1.7% | |||
| El Paso Electric Co. | 142,720 | 5,519 | |
| Great Plains Energy, Inc. | 167,320 | 4,601 | |
| IDACORP, Inc. | 102,700 | 6,865 | |
| Portland General Electric Co. | 191,568 | 7,103 | |
| 24,088 | |||
| Gas Utilities - 1.5% | |||
| Atmos Energy Corp. | 110,138 | 6,939 | |
| Laclede Group, Inc. | 128,600 | 7,532 | |
| New Jersey Resources Corp. | 46,659 | 1,478 | |
| Southwest Gas Corp. | 105,300 | 6,472 | |
| 22,421 | |||
| TOTAL UTILITIES | 46,509 | ||
| TOTAL COMMON STOCKS | |||
| (Cost $1,205,620) | 1,371,953 | ||
| Principal Amount (000s) | Value (000s) | ||
| U.S. Treasury Obligations - 0.0% | |||
| U.S. Treasury Bills, yield at date of purchase 0.01% to 0.06% 12/3/15 to 12/17/15 (c) | |||
| (Cost $390) | 390 | 390 | |
| Shares | Value (000s) | ||
| Money Market Funds - 9.9% | |||
| Fidelity Cash Central Fund, 0.18% (d) | 85,833,387 | $85,833 | |
| Fidelity Securities Lending Cash Central Fund, 0.19% (d)(e) | 56,685,976 | 56,686 | |
| TOTAL MONEY MARKET FUNDS | |||
| (Cost $142,519) | 142,519 | ||
| TOTAL INVESTMENT PORTFOLIO - 105.4% | |||
| (Cost $1,348,529) | 1,514,862 | ||
| NET OTHER ASSETS (LIABILITIES) - (5.4)% | (77,512) | ||
| NET ASSETS - 100% | $1,437,350 |
| Futures Contracts | |||
| Expiration Date | Underlying Face Amount at Value (000s) | Unrealized Appreciation/(Depreciation) (000s) | |
| Purchased | |||
| Equity Index Contracts | |||
| 102 ICE Russell 2000 Index Contracts (United States) | Dec. 2015 | 11,815 | $583 |
The face value of futures purchased as a percentage of Net Assets is 0.8%
Legend
(a) Non-income producing
(b) Security or a portion of the security is on loan at period end.
(c) Security or a portion of the security was pledged to cover margin requirements for futures contracts. At period end, the value of securities pledged amounted to $390,000.
(d) Affiliated fund that is generally available only to investment companies and other accounts managed by Fidelity Investments. The rate quoted is the annualized seven-day yield of the fund at period end. A complete unaudited listing of the fund's holdings as of its most recent quarter end is available upon request. In addition, each Fidelity Central Fund's financial statements which are not covered by the Fund's Report of Independent Registered Public Accounting Firm are available on the SEC's website or upon request.
(e) Investment made with cash collateral received from securities on loan.
Affiliated Central Funds
Information regarding fiscal year to date income earned by the Fund from investments in Fidelity Central Funds is as follows:
| Fund | Income earned |
| (Amounts in thousands) | |
| Fidelity Cash Central Fund | $68 |
| Fidelity Securities Lending Cash Central Fund | 572 |
| Total | $640 |
Investment Valuation
The following is a summary of the inputs used, as of October 31, 2015, involving the Fund's assets and liabilities carried at fair value. The inputs or methodology used for valuing securities may not be an indication of the risk associated with investing in those securities. For more information on valuation inputs, and their aggregation into the levels used below, please refer to the Investment Valuation section in the accompanying Notes to Financial Statements.
| Valuation Inputs at Reporting Date: | ||||
| Description | Total | Level 1 | Level 2 | Level 3 |
| (Amounts in thousands) | ||||
| Investments in Securities: | ||||
| Equities: | ||||
| Consumer Discretionary | $183,231 | $183,231 | $-- | $-- |
| Consumer Staples | 43,015 | 43,015 | -- | -- |
| Energy | 44,262 | 44,262 | -- | -- |
| Financials | 344,404 | 344,404 | -- | -- |
| Health Care | 210,018 | 209,759 | 259 | -- |
| Industrials | 182,492 | 182,492 | -- | -- |
| Information Technology | 257,781 | 257,781 | -- | -- |
| Materials | 51,821 | 51,821 | -- | -- |
| Telecommunication Services | 8,420 | 8,420 | -- | -- |
| Utilities | 46,509 | 46,509 | -- | -- |
| U.S. Government and Government Agency Obligations | 390 | -- | 390 | -- |
| Money Market Funds | 142,519 | 142,519 | -- | -- |
| Total Investments in Securities: | $1,514,862 | $1,514,213 | $649 | $-- |
| Derivative Instruments: | ||||
| Assets | ||||
| Futures Contracts | $583 | $583 | $-- | $-- |
| Total Assets | $583 | $583 | $-- | $-- |
| Total Derivative Instruments: | $583 | $583 | $-- | $-- |
Value of Derivative Instruments
The following table is a summary of the Fund's value of derivative instruments by primary risk exposure as of October 31, 2015. For additional information on derivative instruments, please refer to the Derivative Instruments section in the accompanying Notes to Financial Statements.
| Primary Risk Exposure / Derivative Type | Value | |
| (Amounts in thousands) | Asset | Liability |
| Equity Risk | ||
| Futures Contracts(a) | $583 | $0 |
| Total Equity Risk | 583 | 0 |
| Total Value of Derivatives | $583 | $0 |
(a) Reflects gross cumulative appreciation (depreciation) on futures contracts as presented in the Schedule of Investments. Only the period end receivable or payable for daily variation margin and net unrealized appreciation (depreciation) are presented in the Statement of Assets and Liabilities.
See accompanying notes which are an integral part of the financial statements.
Financial Statements
Statement of Assets and Liabilities
| Amounts in thousands (except per-share amounts) | October 31, 2015 | |
| Assets | ||
| Investment in securities, at value (including securities loaned of $55,317) — See accompanying schedule: Unaffiliated issuers (cost $1,206,010) | $1,372,343 | |
| Fidelity Central Funds (cost $142,519) | 142,519 | |
| Total Investments (cost $1,348,529) | $1,514,862 | |
| Segregated cash with brokers for derivative instruments | 504 | |
| Cash | 342 | |
| Foreign currency held at value (cost $13) | 13 | |
| Receivable for investments sold | 4,859 | |
| Receivable for fund shares sold | 1,988 | |
| Dividends receivable | 471 | |
| Distributions receivable from Fidelity Central Funds | 93 | |
| Prepaid expenses | 4 | |
| Other receivables | 21 | |
| Total assets | 1,523,157 | |
| Liabilities | ||
| Payable for investments purchased | $22,228 | |
| Payable for fund shares redeemed | 5,766 | |
| Accrued management fee | 679 | |
| Distribution and service plan fees payable | 7 | |
| Payable for daily variation margin for derivative instruments | 47 | |
| Other affiliated payables | 343 | |
| Other payables and accrued expenses | 51 | |
| Collateral on securities loaned, at value | 56,686 | |
| Total liabilities | 85,807 | |
| Net Assets | $1,437,350 | |
| Net Assets consist of: | ||
| Paid in capital | $1,181,424 | |
| Undistributed net investment income | 4,607 | |
| Accumulated undistributed net realized gain (loss) on investments and foreign currency transactions | 84,404 | |
| Net unrealized appreciation (depreciation) on investments and assets and liabilities in foreign currencies | 166,915 | |
| Net Assets | $1,437,350 | |
| Calculation of Maximum Offering Price | ||
| Class A: | ||
| Net Asset Value and redemption price per share ($11,429.9 ÷ 466.83 shares) | $24.48 | |
| Maximum offering price per share (100/94.25 of $24.48) | $25.97 | |
| Class T: | ||
| Net Asset Value and redemption price per share ($2,842.8 ÷ 118.47 shares) | $24.00 | |
| Maximum offering price per share (100/96.50 of $24.00) | $24.87 | |
| Class B: | ||
| Net Asset Value and offering price per share ($168.1 ÷ 7.22 shares)(a) | $23.28 | |
| Class C: | ||
| Net Asset Value and offering price per share ($3,965.3 ÷ 171.24 shares)(a) | $23.16 | |
| Stock Selector Small Cap: | ||
| Net Asset Value, offering price and redemption price per share ($1,372,459.7 ÷ 55,132.21 shares) | $24.89 | |
| Class I: | ||
| Net Asset Value, offering price and redemption price per share ($46,483.6 ÷ 1,862.64 shares) | $24.96 |
(a) Redemption price per share is equal to net asset value less any applicable contingent deferred sales charge.
See accompanying notes which are an integral part of the financial statements.
Statement of Operations
| Amounts in thousands | Year ended October 31, 2015 | |
| Investment Income | ||
| Dividends | $17,604 | |
| Income from Fidelity Central Funds | 640 | |
| Total income | 18,244 | |
| Expenses | ||
| Management fee | ||
| Basic fee | $8,817 | |
| Performance adjustment | (1,653) | |
| Transfer agent fees | 3,505 | |
| Distribution and service plan fees | 86 | |
| Accounting and security lending fees | 472 | |
| Custodian fees and expenses | 55 | |
| Independent trustees' compensation | 6 | |
| Registration fees | 99 | |
| Audit | 57 | |
| Legal | 6 | |
| Interest | 1 | |
| Miscellaneous | 11 | |
| Total expenses before reductions | 11,462 | |
| Expense reductions | (142) | 11,320 |
| Net investment income (loss) | 6,924 | |
| Realized and Unrealized Gain (Loss) | ||
| Net realized gain (loss) on: | ||
| Investment securities: | ||
| Unaffiliated issuers | 97,594 | |
| Foreign currency transactions | (2) | |
| Futures contracts | 1,775 | |
| Total net realized gain (loss) | 99,367 | |
| Change in net unrealized appreciation (depreciation) on: Investment securities | (38,594) | |
| Assets and liabilities in foreign currencies | 2 | |
| Futures contracts | (254) | |
| Total change in net unrealized appreciation (depreciation) | (38,846) | |
| Net gain (loss) | 60,521 | |
| Net increase (decrease) in net assets resulting from operations | $67,445 |
See accompanying notes which are an integral part of the financial statements.
Statement of Changes in Net Assets
| Amounts in thousands | Year ended October 31, 2015 | Year ended October 31, 2014 |
| Increase (Decrease) in Net Assets | ||
| Operations | ||
| Net investment income (loss) | $6,924 | $4,913 |
| Net realized gain (loss) | 99,367 | 141,263 |
| Change in net unrealized appreciation (depreciation) | (38,846) | (39,201) |
| Net increase (decrease) in net assets resulting from operations | 67,445 | 106,975 |
| Distributions to shareholders from net investment income | (5,082) | (589) |
| Distributions to shareholders from net realized gain | (126,261) | (75,700) |
| Total distributions | (131,343) | (76,289) |
| Share transactions - net increase (decrease) | 26,734 | (112,902) |
| Redemption fees | 102 | 99 |
| Total increase (decrease) in net assets | (37,062) | (82,117) |
| Net Assets | ||
| Beginning of period | 1,474,412 | 1,556,529 |
| End of period (including undistributed net investment income of $4,607 and undistributed net investment income of $3,242, respectively) | $1,437,350 | $1,474,412 |
See accompanying notes which are an integral part of the financial statements.
Financial Highlights — Fidelity Stock Selector Small Cap Fund Class A
| Years ended October 31, | 2015 | 2014 | 2013 | 2012 | 2011 |
| Selected Per–Share Data | |||||
| Net asset value, beginning of period | $25.76 | $25.32 | $19.40 | $17.87 | $16.20 |
| Income from Investment Operations | |||||
| Net investment income (loss)A | .06 | .01 | (.02) | (.02) | –B,C |
| Net realized and unrealized gain (loss) | .96 | 1.68 | 5.98 | 1.55 | 1.73 |
| Total from investment operations | 1.02 | 1.69 | 5.96 | 1.53 | 1.73 |
| Distributions from net investment income | (.03) | –C | (.04) | – | (.07) |
| Distributions from net realized gain | (2.27) | (1.25) | (.01) | – | – |
| Total distributions | (2.30) | (1.25) | (.04)D | – | (.07) |
| Redemption fees added to paid in capitalA | –C | –C | –C | –C | .01 |
| Net asset value, end of period | $24.48 | $25.76 | $25.32 | $19.40 | $17.87 |
| Total ReturnE,F | 4.19% | 6.83% | 30.81% | 8.56% | 10.71% |
| Ratios to Average Net AssetsG,H | |||||
| Expenses before reductions | 1.01% | .99% | 1.22% | 1.37% | 1.15% |
| Expenses net of fee waivers, if any | 1.01% | .99% | 1.22% | 1.37% | 1.15% |
| Expenses net of all reductions | 1.00% | .99% | 1.20% | 1.36% | 1.14% |
| Net investment income (loss) | .24% | .06% | (.09)% | (.10)% | - %B,I |
| Supplemental Data | |||||
| Net assets, end of period (in millions) | $11 | $10 | $8 | $4 | $4 |
| Portfolio turnover rateJ | 48% | 73% | 79% | 61% | 73% |
A Calculated based on average shares outstanding during the period.
B Investment income per share reflects a large, non-recurring dividend which amounted to $.04 per share. Excluding this non-recurring dividend, the ratio of net investment income (loss) to average net assets would have been (.21) %.
C Amount represents less than $.005 per share.
D Total distributions of $.04 per share is comprised of distributions from net investment income of $.037 and distributions from net realized gain of $.007 per share.
E Total returns would have been lower if certain expenses had not been reduced during the applicable periods shown.
F Total returns do not include the effect of the sales charges.
G Fees and expenses of any underlying Fidelity Central Funds are not included in the Fund's expense ratio. The Fund indirectly bears its proportionate share of the expenses of any underlying Fidelity Central Funds.
H Expense ratios reflect operating expenses of the class. Expenses before reductions do not reflect amounts reimbursed by the investment adviser or reductions from brokerage service arrangements or reductions from other expense offset arrangements and do not represent the amount paid by the class during periods when reimbursements or reductions occur. Expenses net of fee waivers reflect expenses after reimbursement by the investment adviser but prior to reductions from brokerage service arrangements or other expense offset arrangements. Expenses net of all reductions represent the net expenses paid by the class.
I Amount represents less than .005%.
J Amount does not include the portfolio activity of any underlying Fidelity Central Funds.
See accompanying notes which are an integral part of the financial statements.
Financial Highlights — Fidelity Stock Selector Small Cap Fund Class T
| Years ended October 31, | 2015 | 2014 | 2013 | 2012 | 2011 |
| Selected Per–Share Data | |||||
| Net asset value, beginning of period | $25.30 | $24.97 | $19.15 | $17.68 | $16.07 |
| Income from Investment Operations | |||||
| Net investment income (loss)A | (.03) | (.07) | (.08) | (.07) | (.05)B |
| Net realized and unrealized gain (loss) | .97 | 1.65 | 5.90 | 1.54 | 1.70 |
| Total from investment operations | .94 | 1.58 | 5.82 | 1.47 | 1.65 |
| Distributions from net investment income | – | – | – | – | (.05) |
| Distributions from net realized gain | (2.24) | (1.25) | – | – | – |
| Total distributions | (2.24) | (1.25) | – | – | (.05) |
| Redemption fees added to paid in capitalA | –C | –C | –C | –C | .01 |
| Net asset value, end of period | $24.00 | $25.30 | $24.97 | $19.15 | $17.68 |
| Total ReturnD,E | 3.90% | 6.46% | 30.39% | 8.31% | 10.34% |
| Ratios to Average Net AssetsF,G | |||||
| Expenses before reductions | 1.35% | 1.32% | 1.51% | 1.64% | 1.42% |
| Expenses net of fee waivers, if any | 1.35% | 1.32% | 1.51% | 1.64% | 1.42% |
| Expenses net of all reductions | 1.34% | 1.31% | 1.49% | 1.63% | 1.41% |
| Net investment income (loss) | (.10)% | (.27)% | (.38)% | (.37)% | (.27)%B |
| Supplemental Data | |||||
| Net assets, end of period (000 omitted) | $2,843 | $2,668 | $1,880 | $1,073 | $1,539 |
| Portfolio turnover rateH | 48% | 73% | 79% | 61% | 73% |
A Calculated based on average shares outstanding during the period.
B Investment income per share reflects a large, non-recurring dividend which amounted to $.04 per share. Excluding this non-recurring dividend, the ratio of net investment income (loss) to average net assets would have been (.48) %.
C Amount represents less than $.005 per share.
D Total returns would have been lower if certain expenses had not been reduced during the applicable periods shown.
E Total returns do not include the effect of the sales charges.
F Fees and expenses of any underlying Fidelity Central Funds are not included in the Fund's expense ratio. The Fund indirectly bears its proportionate share of the expenses of any underlying Fidelity Central Funds.
G Expense ratios reflect operating expenses of the class. Expenses before reductions do not reflect amounts reimbursed by the investment adviser or reductions from brokerage service arrangements or reductions from other expense offset arrangements and do not represent the amount paid by the class during periods when reimbursements or reductions occur. Expenses net of fee waivers reflect expenses after reimbursement by the investment adviser but prior to reductions from brokerage service arrangements or other expense offset arrangements. Expenses net of all reductions represent the net expenses paid by the class.
H Amount does not include the portfolio activity of any underlying Fidelity Central Funds.
See accompanying notes which are an integral part of the financial statements.
Financial Highlights — Fidelity Stock Selector Small Cap Fund Class B
| Years ended October 31, | 2015 | 2014 | 2013 | 2012 | 2011 |
| Selected Per–Share Data | |||||
| Net asset value, beginning of period | $24.55 | $24.38 | $18.79 | $17.43 | $15.87 |
| Income from Investment Operations | |||||
| Net investment income (loss)A | (.14) | (.19) | (.19) | (.16) | (.14)B |
| Net realized and unrealized gain (loss) | .94 | 1.61 | 5.78 | 1.52 | 1.69 |
| Total from investment operations | .80 | 1.42 | 5.59 | 1.36 | 1.55 |
| Distributions from net realized gain | (2.07) | (1.25) | – | – | – |
| Redemption fees added to paid in capitalA | –C | –C | –C | –C | .01 |
| Net asset value, end of period | $23.28 | $24.55 | $24.38 | $18.79 | $17.43 |
| Total ReturnD,E | 3.39% | 5.94% | 29.75% | 7.80% | 9.83% |
| Ratios to Average Net AssetsF,G | |||||
| Expenses before reductions | 1.84% | 1.81% | 1.99% | 2.12% | 1.90% |
| Expenses net of fee waivers, if any | 1.84% | 1.81% | 1.99% | 2.12% | 1.90% |
| Expenses net of all reductions | 1.83% | 1.80% | 1.97% | 2.11% | 1.90% |
| Net investment income (loss) | (.60)% | (.76)% | (.86)% | (.85)% | (.76)%B |
| Supplemental Data | |||||
| Net assets, end of period (000 omitted) | $168 | $273 | $307 | $225 | $246 |
| Portfolio turnover rateH | 48% | 73% | 79% | 61% | 73% |
A Calculated based on average shares outstanding during the period.
B Investment income per share reflects a large, non-recurring dividend which amounted to $.04 per share. Excluding this non-recurring dividend, the ratio of net investment income (loss) to average net assets would have been (.96) %.
C Amount represents less than $.005 per share.
D Total returns would have been lower if certain expenses had not been reduced during the applicable periods shown.
E Total returns do not include the effect of the contingent deferred sales charge.
F Fees and expenses of any underlying Fidelity Central Funds are not included in the Fund's expense ratio. The Fund indirectly bears its proportionate share of the expenses of any underlying Fidelity Central Funds.
G Expense ratios reflect operating expenses of the class. Expenses before reductions do not reflect amounts reimbursed by the investment adviser or reductions from brokerage service arrangements or reductions from other expense offset arrangements and do not represent the amount paid by the class during periods when reimbursements or reductions occur. Expenses net of fee waivers reflect expenses after reimbursement by the investment adviser but prior to reductions from brokerage service arrangements or other expense offset arrangements. Expenses net of all reductions represent the net expenses paid by the class.
H Amount does not include the portfolio activity of any underlying Fidelity Central Funds.
See accompanying notes which are an integral part of the financial statements.
Financial Highlights — Fidelity Stock Selector Small Cap Fund Class C
| Years ended October 31, | 2015 | 2014 | 2013 | 2012 | 2011 |
| Selected Per–Share Data | |||||
| Net asset value, beginning of period | $24.49 | $24.32 | $18.73 | $17.38 | $15.82 |
| Income from Investment Operations | |||||
| Net investment income (loss)A | (.14) | (.18) | (.19) | (.16) | (.14)B |
| Net realized and unrealized gain (loss) | .93 | 1.60 | 5.78 | 1.51 | 1.69 |
| Total from investment operations | .79 | 1.42 | 5.59 | 1.35 | 1.55 |
| Distributions from net realized gain | (2.12) | (1.25) | – | – | – |
| Redemption fees added to paid in capitalA | –C | –C | –C | –C | .01 |
| Net asset value, end of period | $23.16 | $24.49 | $24.32 | $18.73 | $17.38 |
| Total ReturnD,E | 3.36% | 5.95% | 29.85% | 7.77% | 9.86% |
| Ratios to Average Net AssetsF,G | |||||
| Expenses before reductions | 1.84% | 1.79% | 1.98% | 2.12% | 1.90% |
| Expenses net of fee waivers, if any | 1.84% | 1.79% | 1.98% | 2.12% | 1.90% |
| Expenses net of all reductions | 1.83% | 1.79% | 1.96% | 2.11% | 1.89% |
| Net investment income (loss) | (.59)% | (.74)% | (.85)% | (.85)% | (.76)%B |
| Supplemental Data | |||||
| Net assets, end of period (000 omitted) | $3,965 | $3,946 | $3,252 | $1,504 | $1,370 |
| Portfolio turnover rateH | 48% | 73% | 79% | 61% | 73% |
A Calculated based on average shares outstanding during the period.
B Investment income per share reflects a large, non-recurring dividend which amounted to $.04 per share. Excluding this non-recurring dividend, the ratio of net investment income (loss) to average net assets would have been (.96) %.
C Amount represents less than $.005 per share.
D Total returns would have been lower if certain expenses had not been reduced during the applicable periods shown.
E Total returns do not include the effect of the contingent deferred sales charge.
F Fees and expenses of any underlying Fidelity Central Funds are not included in the Fund's expense ratio. The Fund indirectly bears its proportionate share of the expenses of any underlying Fidelity Central Funds.
G Expense ratios reflect operating expenses of the class. Expenses before reductions do not reflect amounts reimbursed by the investment adviser or reductions from brokerage service arrangements or reductions from other expense offset arrangements and do not represent the amount paid by the class during periods when reimbursements or reductions occur. Expenses net of fee waivers reflect expenses after reimbursement by the investment adviser but prior to reductions from brokerage service arrangements or other expense offset arrangements. Expenses net of all reductions represent the net expenses paid by the class.
H Amount does not include the portfolio activity of any underlying Fidelity Central Funds.
See accompanying notes which are an integral part of the financial statements.
Financial Highlights — Fidelity Stock Selector Small Cap Fund
| Years ended October 31, | 2015 | 2014 | 2013 | 2012 | 2011 |
| Selected Per–Share Data | |||||
| Net asset value, beginning of period | $26.15 | $25.64 | $19.65 | $18.05 | $16.35 |
| Income from Investment Operations | |||||
| Net investment income (loss)A | .12 | .08 | .04 | .04 | .05B |
| Net realized and unrealized gain (loss) | .98 | 1.70 | 6.06 | 1.56 | 1.74 |
| Total from investment operations | 1.10 | 1.78 | 6.10 | 1.60 | 1.79 |
| Distributions from net investment income | (.09) | (.01)C | (.10) | – | (.10) |
| Distributions from net realized gain | (2.27) | (1.26)C | (.01) | – | – |
| Total distributions | (2.36) | (1.27) | (.11) | – | (.10) |
| Redemption fees added to paid in capitalA | –D | –D | –D | –D | .01 |
| Net asset value, end of period | $24.89 | $26.15 | $25.64 | $19.65 | $18.05 |
| Total ReturnE | 4.46% | 7.08% | 31.20% | 8.86% | 11.03% |
| Ratios to Average Net AssetsF,G | |||||
| Expenses before reductions | .77% | .73% | .94% | 1.07% | .85% |
| Expenses net of fee waivers, if any | .77% | .73% | .93% | 1.07% | .85% |
| Expenses net of all reductions | .76% | .72% | .91% | 1.06% | .85% |
| Net investment income (loss) | .48% | .32% | .20% | .20% | .29%B |
| Supplemental Data | |||||
| Net assets, end of period (in millions) | $1,372 | $1,406 | $1,487 | $1,311 | $1,698 |
| Portfolio turnover rateH | 48% | 73% | 79% | 61% | 73% |
A Calculated based on average shares outstanding during the period.
B Investment income per share reflects a large, non-recurring dividend which amounted to $.04 per share. Excluding this non-recurring dividend, the ratio of net investment income (loss) to average net assets would have been .09%.
C The amounts shown reflect certain reclassifications related to book to tax differences that were made in the year shown.
D Amount represents less than $.005 per share.
E Total returns would have been lower if certain expenses had not been reduced during the applicable periods shown.
F Fees and expenses of any underlying Fidelity Central Funds are not included in the Fund's expense ratio. The Fund indirectly bears its proportionate share of the expenses of any underlying Fidelity Central Funds.
G Expense ratios reflect operating expenses of the class. Expenses before reductions do not reflect amounts reimbursed by the investment adviser or reductions from brokerage service arrangements or reductions from other expense offset arrangements and do not represent the amount paid by the class during periods when reimbursements or reductions occur. Expenses net of fee waivers reflect expenses after reimbursement by the investment adviser but prior to reductions from brokerage service arrangements or other expense offset arrangements. Expenses net of all reductions represent the net expenses paid by the class.
H Amount does not include the portfolio activity of any underlying Fidelity Central Funds.
See accompanying notes which are an integral part of the financial statements.
Financial Highlights — Fidelity Stock Selector Small Cap Fund Class I
| Years ended October 31, | 2015 | 2014 | 2013 | 2012 | 2011 |
| Selected Per–Share Data | |||||
| Net asset value, beginning of period | $26.21 | $25.69 | $19.72 | $18.07 | $16.39 |
| Income from Investment Operations | |||||
| Net investment income (loss)A | .13 | .09 | .05 | .04 | .05B |
| Net realized and unrealized gain (loss) | .99 | 1.70 | 6.06 | 1.61 | 1.74 |
| Total from investment operations | 1.12 | 1.79 | 6.11 | 1.65 | 1.79 |
| Distributions from net investment income | (.10) | (.01)C | (.14) | – | (.12) |
| Distributions from net realized gain | (2.27) | (1.26)C | (.01) | – | – |
| Total distributions | (2.37) | (1.27) | (.14)D | – | (.12) |
| Redemption fees added to paid in capitalA | –E | –E | –E | –E | .01 |
| Net asset value, end of period | $24.96 | $26.21 | $25.69 | $19.72 | $18.07 |
| Total ReturnF | 4.52% | 7.11% | 31.22% | 9.13% | 10.99% |
| Ratios to Average Net AssetsG,H | |||||
| Expenses before reductions | .74% | .70% | .91% | 1.06% | .86% |
| Expenses net of fee waivers, if any | .73% | .70% | .91% | 1.06% | .86% |
| Expenses net of all reductions | .73% | .70% | .89% | 1.05% | .85% |
| Net investment income (loss) | .51% | .35% | .22% | .21% | .29%B |
| Supplemental Data | |||||
| Net assets, end of period (000 omitted) | $46,484 | $50,988 | $55,860 | $39,592 | $10,038 |
| Portfolio turnover rateI | 48% | 73% | 79% | 61% | 73% |
A Calculated based on average shares outstanding during the period.
B Investment income per share reflects a large, non-recurring dividend which amounted to $.04 per share. Excluding this non-recurring dividend, the ratio of net investment income (loss) to average net assets would have been .08%.
C The amounts shown reflect certain reclassifications related to book to tax differences that were made in the year shown.
D Total distributions of $.14 per share is comprised of distributions from net investment income of $.136 and distributions from net realized gain of $.007 per share.
E Amount represents less than $.005 per share.
F Total returns would have been lower if certain expenses had not been reduced during the applicable periods shown.
G Fees and expenses of any underlying Fidelity Central Funds are not included in the Fund's expense ratio. The Fund indirectly bears its proportionate share of the expenses of any underlying Fidelity Central Funds.
H Expense ratios reflect operating expenses of the class. Expenses before reductions do not reflect amounts reimbursed by the investment adviser or reductions from brokerage service arrangements or reductions from other expense offset arrangements and do not represent the amount paid by the class during periods when reimbursements or reductions occur. Expenses net of fee waivers reflect expenses after reimbursement by the investment adviser but prior to reductions from brokerage service arrangements or other expense offset arrangements. Expenses net of all reductions represent the net expenses paid by the class.
I Amount does not include the portfolio activity of any underlying Fidelity Central Funds.
See accompanying notes which are an integral part of the financial statements.
Notes to Financial Statements
For the period ended October 31, 2015
(Amounts in thousands except percentages)
1. Organization.
Fidelity Stock Selector Small Cap Fund (the Fund) is a fund of Fidelity Capital Trust (the Trust) and is authorized to issue an unlimited number of shares. The Trust is registered under the Investment Company Act of 1940, as amended (the 1940 Act), as an open-end management investment company organized as a Massachusetts business trust. The Fund offers Class A, Class T, Class C, Stock Selector Small Cap and Class I shares(formerly Institutional Class) , each of which, along with Class B shares, has equal rights as to assets and voting privileges. Class B shares are closed to new accounts and additional purchases, except for exchanges and reinvestments. Each class has exclusive voting rights with respect to matters that affect that class. Class B shares will automatically convert to Class A shares after a holding period of seven years from the initial date of purchase.
2. Investments in Fidelity Central Funds.
The Fund invests in Fidelity Central Funds, which are open-end investment companies generally available only to other investment companies and accounts managed by the investment adviser and its affiliates. The Fund's Schedule of Investments lists each of the Fidelity Central Funds held as of period end, if any, as an investment of the Fund, but does not include the underlying holdings of each Fidelity Central Fund. As an Investing Fund, the Fund indirectly bears its proportionate share of the expenses of the underlying Fidelity Central Funds.
The Money Market Central Funds seek preservation of capital and current income and are managed by Fidelity Investments Money Management, Inc. (FIMM), an affiliate of the investment adviser. Annualized expenses of the Money Market Central Funds as of their most recent shareholder report date are less than .005%.
A complete unaudited list of holdings for each Fidelity Central Fund is available upon request or at the Securities and Exchange Commission (the SEC) website at www.sec.gov. In addition, the financial statements of the Fidelity Central Funds, which are not covered by the Fund's Report of Independent Registered Public Accounting Firm, are available on the SEC website or upon request.
3. Significant Accounting Policies.
The financial statements have been prepared in conformity with accounting principles generally accepted in the United States of America (GAAP), which require management to make certain estimates and assumptions at the date of the financial statements. Actual results could differ from those estimates. Subsequent events, if any, through the date that the financial statements were issued have been evaluated in the preparation of the financial statements. The following summarizes the significant accounting policies of the Fund:
Investment Valuation. Investments are valued as of 4:00 p.m. Eastern time on the last calendar day of the period. The Board of Trustees (the Board) has delegated the day to day responsibility for the valuation of the Fund's investments to the Fidelity Management & Research Company (FMR) Fair Value Committee (the Committee). In accordance with valuation policies and procedures approved by the Board, the Fund attempts to obtain prices from one or more third party pricing vendors or brokers to value its investments. When current market prices, quotations or currency exchange rates are not readily available or reliable, investments will be fair valued in good faith by the Committee, in accordance with procedures adopted by the Board. Factors used in determining fair value vary by investment type and may include market or investment specific events, changes in interest rates and credit quality. The frequency with which these procedures are used cannot be predicted and they may be utilized to a significant extent. The Committee oversees the Fund's valuation policies and procedures and reports to the Board on the Committee's activities and fair value determinations. The Board monitors the appropriateness of the procedures used in valuing the Fund's investments and ratifies the fair value determinations of the Committee.
The Fund categorizes the inputs to valuation techniques used to value its investments into a disclosure hierarchy consisting of three levels as shown below:
- Level 1 – quoted prices in active markets for identical investments
- Level 2 – other significant observable inputs (including quoted prices for similar investments, interest rates, prepayment speeds, etc.)
- Level 3 – unobservable inputs (including the Fund's own assumptions based on the best information available)
Valuation techniques used to value the Fund's investments by major category are as follows:
Equity securities, including restricted securities, for which market quotations are readily available, are valued at the last reported sale price or official closing price as reported by a third party pricing vendor on the primary market or exchange on which they are traded and are categorized as Level 1 in the hierarchy. In the event there were no sales during the day or closing prices are not available, securities are valued at the last quoted bid price or may be valued using the last available price and are generally categorized as Level 2 in the hierarchy. For foreign equity securities, when market or security specific events arise, comparisons to the valuation of American Depositary Receipts (ADRs), futures contracts, Exchange-Traded Funds (ETFs) and certain indexes as well as quoted prices for similar securities may be used and would be categorized as Level 2 in the hierarchy. Utilizing these techniques may result in transfers between Level 1 and Level 2. For equity securities, including restricted securities, where observable inputs are limited, assumptions about market activity and risk are used and these securities may be categorized as Level 3 in the hierarchy.
Debt securities, including restricted securities, are valued based on evaluated prices received from third party pricing vendors or from brokers who make markets in such securities. U.S. government and government agency obligations are valued by pricing vendors who utilize matrix pricing which considers yield or price of bonds of comparable quality, coupon, maturity and type or by broker-supplied prices. When independent prices are unavailable or unreliable, debt securities may be valued utilizing pricing methodologies which consider similar factors that would be used by third party pricing vendors. Debt securities are generally categorized as Level 2 in the hierarchy but may be Level 3 depending on the circumstances.
Futures contracts are valued at the settlement price established each day by the board of trade or exchange on which they are traded and are categorized as Level 1 in the hierarchy. Investments in open-end mutual funds ,including the Fidelity Central Funds, are valued at their closing net asset value (NAV) each business day and are categorized as Level 1 in the hierarchy.
Changes in valuation techniques may result in transfers in or out of an assigned level within the disclosure hierarchy. The aggregate value of investments by input level as of October 31, 2015 is included at the end of the Fund's Schedule of Investments.
Foreign Currency. The Fund may use foreign currency contracts to facilitate transactions in foreign-denominated securities. Gains and losses from these transactions may arise from changes in the value of the foreign currency or if the counterparties do not perform under the contracts' terms.
Foreign-denominated assets, including investment securities, and liabilities are translated into U.S. dollars at the exchange rates at period end. Purchases and sales of investment securities, income and dividends received and expenses denominated in foreign currencies are translated into U.S. dollars at the exchange rate in effect on the transaction date.
The effects of exchange rate fluctuations on investments are included with the net realized and unrealized gain (loss) on investment securities. Other foreign currency transactions resulting in realized and unrealized gain (loss) are disclosed separately.
Investment Transactions and Income. For financial reporting purposes, the Fund's investment holdings and NAV include trades executed through the end of the last business day of the period. The NAV per share for processing shareholder transactions is calculated as of the close of business of the New York Stock Exchange (NYSE), normally 4:00 p.m. Eastern time and includes trades executed through the end of the prior business day. Gains and losses on securities sold are determined on the basis of identified cost and may include proceeds received from litigation. Dividend income is recorded on the ex-dividend date, except for certain dividends from foreign securities where the ex-dividend date may have passed, which are recorded as soon as the Fund is informed of the ex-dividend date. Non-cash dividends included in dividend income, if any, are recorded at the fair market value of the securities received. Income and capital gain distributions from Fidelity Central Funds, if any, are recorded on the ex-dividend date. Distributions received on securities that represent a return of capital or capital gain are recorded as a reduction of cost of investments and/or as a realized gain. Subsequent to ex-dividend date the Fund determines the components of these distributions, based upon receipt of tax filings or other correspondence relating to the underlying investment. Interest income is accrued as earned and includes coupon interest and amortization of premium and accretion of discount on debt securities as applicable. Investment income is recorded net of foreign taxes withheld where recovery of such taxes is uncertain.
Class Allocations and Expenses. Investment income, realized and unrealized capital gains and losses, common expenses of the Fund, and certain fund-level expense reductions, if any, are allocated daily on a pro-rata basis to each class based on the relative net assets of each class to the total net assets of the Fund. Each class differs with respect to transfer agent and distribution and service plan fees incurred. Certain expense reductions may also differ by class. For the reporting period, the allocated portion of income and expenses to each class as a percent of its average net assets may vary due to the timing of recording these transactions in relation to fluctuating net assets of the classes. Expenses directly attributable to a fund are charged to that fund. Expenses attributable to more than one fund are allocated among the respective funds on the basis of relative net assets or other appropriate methods. Expense estimates are accrued in the period to which they relate and adjustments are made when actual amounts are known.
Income Tax Information and Distributions to Shareholders. Each year, the Fund intends to qualify as a regulated investment company under Subchapter M of the Internal Revenue Code, including distributing substantially all of its taxable income and realized gains. As a result, no provision for U.S. Federal income taxes is required. As of October 31, 2015, the Fund did not have any unrecognized tax benefits in the financial statements; nor is the Fund aware of any tax positions for which it is reasonably possible that the total amounts of unrecognized tax benefits will significantly change in the next twelve months. The Fund files a U.S. federal tax return, in addition to state and local tax returns as required. The Fund's federal income tax returns are subject to examination by the Internal Revenue Service (IRS) for a period of three fiscal years after they are filed. State and local tax returns may be subject to examination for an additional fiscal year depending on the jurisdiction. Foreign taxes are provided for based on the Fund's understanding of the tax rules and rates that exist in the foreign markets in which it invests.
Distributions are declared and recorded on the ex-dividend date. Income dividends and capital gain distributions are declared separately for each class. Income and capital gain distributions are determined in accordance with income tax regulations, which may differ from GAAP. These differences resulted in distribution reclassifications. In addition, the Fund claimed a portion of the payment made to redeeming shareholders as a distribution for income tax purposes.
Capital accounts within the financial statements are adjusted for permanent book-tax differences. These adjustments have no impact on net assets or the results of operations. Capital accounts are not adjusted for temporary book-tax differences which will reverse in a subsequent period.
Book-tax differences are primarily due to foreign currency transactions, partnerships, futures transactions, deferred trustees compensation, and losses deferred due to wash sales.
The federal tax cost of investment securities and unrealized appreciation (depreciation) as of period end were as follows:
| Gross unrealized appreciation | $275,396 |
| Gross unrealized depreciation | (112,027) |
| Net unrealized appreciation (depreciation) on securities | $163,369 |
| Tax Cost | $1,351,493 |
The tax-based components of distributable earnings as of period end were as follows:
| Undistributed ordinary income | $4,607 |
| Undistributed long-term capital gain | $87,951 |
| Net unrealized appreciation (depreciation) on securities and other investments | $163,368 |
The tax character of distributions paid was as follows:
| October 31, 2015 | October 31, 2014 | |
| Ordinary Income | $19,906 | $ 899 |
| Long-term Capital Gains | 111,437 | 75,390 |
| Total | $131,343 | $ 76,289 |
Short-Term Trading (Redemption) Fees. Shares held by investors in the Fund less than 90 days may have been subject to a redemption fee equal to 1.50% of the NAV of shares redeemed. All redemption fees, which reduce the proceeds of the shareholder redemption, are retained by the Fund and accounted for as an addition to paid in capital.
4. Derivative Instruments.
Risk Exposures and the Use of Derivative Instruments. The Fund's investment objective allows the Fund to enter into various types of derivative contracts, including futures contracts. Derivatives are investments whose value is primarily derived from underlying assets, indices or reference rates and may be transacted on an exchange or over-the-counter (OTC). Derivatives may involve a future commitment to buy or sell a specified asset based on specified terms, to exchange future cash flows at periodic intervals based on a notional principal amount, or for one party to make one or more payments upon the occurrence of specified events in exchange for periodic payments from the other party.
The Fund used derivatives to increase returns and to manage exposure to certain risks as defined below. The success of any strategy involving derivatives depends on analysis of numerous economic factors, and if the strategies for investment do not work as intended, the Fund may not achieve its objectives.
The Fund's use of derivatives increased or decreased its exposure to the following risk:
| Equity Risk | Equity risk relates to the fluctuations in the value of financial instruments as a result of changes in market prices (other than those arising from interest rate risk or foreign exchange risk), whether caused by factors specific to an individual investment, its issuer, or all factors affecting all instruments traded in a market or market segment. |
The Fund is also exposed to additional risks from investing in derivatives, such as liquidity risk and counterparty credit risk. Liquidity risk is the risk that the Fund will be unable to close out the derivative in the open market in a timely manner. Counterparty credit risk is the risk that the counterparty will not be able to fulfill its obligation to the Fund. Counterparty credit risk related to exchange-traded futures contracts may be mitigated by the protection provided by the exchange on which they trade.
Investing in derivatives may involve greater risks than investing in the underlying assets directly and, to varying degrees, may involve risk of loss in excess of any initial investment and collateral received and amounts recognized in the Statement of Assets and Liabilities. In addition, there may be the risk that the change in value of the derivative contract does not correspond to the change in value of the underlying instrument.
Futures Contracts. A futures contract is an agreement between two parties to buy or sell a specified underlying instrument for a fixed price at a specified future date. The Fund used futures contracts to manage its exposure to the stock market.
Upon entering into a futures contract, a fund is required to deposit either cash or securities (initial margin) with a clearing broker in an amount equal to a certain percentage of the face value of the contract. Futures contracts are marked-to-market daily and subsequent daily payments (variation margin) are made or received by a fund depending on the daily fluctuations in the value of the futures contracts and are recorded as unrealized appreciation or (depreciation). This receivable and/or payable, if any, is included in daily variation margin for derivative instruments in the Statement of Assets and Liabilities. Realized gain or (loss) is recorded upon the expiration or closing of a futures contract.
Any open futures contracts at period end are presented in the Schedule of Investments under the caption "Futures Contracts". The underlying face amount at value reflects each contract's exposure to the underlying instrument or index at period end and is representative of volume of activity during the period. Securities deposited to meet initial margin requirements are identified in the Schedule of Investments.
During the period the Fund recognized net realized gain (loss) of $1,775 and a change in net unrealized appreciation (depreciation) of $(254) related to its investment in futures contracts. These amounts are included in the Statement of Operations.
5. Purchases and Sales of Investments.
Purchases and sales of securities, other than short-term securities, aggregated $678,476 and $784,129, respectively.
6. Fees and Other Transactions with Affiliates.
Management Fee. Fidelity Management & Research Company (the investment adviser) and its affiliates provide the Fund with investment management related services for which the Fund pays a monthly management fee. The management fee is the sum of an individual fund fee rate that is based on an annual rate of .35% of the Fund's average net assets and an annualized group fee rate that averaged .25% during the period. The group fee rate is based upon the average net assets of all the mutual funds advised by the investment adviser, including any mutual funds previously advised by the investment adviser that are currently advised by Fidelity SelectCo, LLC, an affiliate of the investment adviser. The group fee rate decreases as assets under management increase and increases as assets under management decrease. In addition, the management fee is subject to a performance adjustment (up to a maximum of +/- .20% of the Fund's average net assets over a 36 month performance period). The upward or downward adjustment to the management fee is based on the relative investment performance of Stock Selector Small Cap as compared to its benchmark index, the Russell 2000 Index, over the same 36 month performance period. For the reporting period, the total annual management fee rate, including the performance adjustment, was .49% of the Fund's average net assets. The performance adjustment included in the management fee rate may be higher or lower than the maximum performance adjustment rate due to the difference between the average net assets for the reporting and performance periods.
Distribution and Service Plan Fees. In accordance with Rule 12b-1 of the 1940 Act, the Fund has adopted separate Distribution and Service Plans for each class of shares. Certain classes pay Fidelity Distributors Corporation (FDC), an affiliate of the investment adviser, separate Distribution and Service Fees, each of which is based on an annual percentage of each class' average net assets. In addition, FDC may pay financial intermediaries for selling shares of the Fund and providing shareholder support services. For the period, the Distribution and Service Fee rates, total fees and amounts retained by FDC were as follows:
| Distribution Fee | Service Fee | Total Fees | Retained by FDC | |
| Class A | -% | .25% | $28 | $2 |
| Class T | .25% | .25% | 15 | – |
| Class B | .75% | .25% | 2 | 2 |
| Class C | .75% | .25% | 41 | 9 |
| $86 | $13 |
Sales Load. FDC may receive a front-end sales charge of up to 5.75% for selling Class A shares and 3.50% for selling Class T shares, some of which is paid to financial intermediaries for selling shares of the Fund. Depending on the holding period, FDC may receive contingent deferred sales charges levied on Class A, Class T, Class B, and Class C redemptions. The deferred sales charges range from 5.00% to 1.00% for Class B shares, 1.00% for Class C shares, 1.00% for certain purchases of Class A shares and .25% for certain purchases of Class T shares.
For the period, sales charge amounts retained by FDC were as follows:
| Retained by FDC | |
| Class A | $6 |
| Class T | 2 |
| Class B(a) | -(b) |
| Class C(a) | 1 |
| $9 |
(a) When Class B and Class C shares are initially sold, FDC pays commissions from its own resources to financial intermediaries through which the sales are made.
(b) In the amount of less than five hundred dollars.
Transfer Agent Fees. Fidelity Investments Institutional Operations Company, Inc., (FIIOC), an affiliate of the investment adviser, is the transfer, dividend disbursing and shareholder servicing agent for each class of the Fund. FIIOC receives account fees and asset-based fees that vary according to the account size and type of account of the shareholders of the respective classes of the Fund. FIIOC pays for typesetting, printing and mailing of shareholder reports, except proxy statements.
For the period, transfer agent fees for each class were as follows:
| Amount | % of Class-Level Average Net Assets | |
| Class A | $25 | .22 |
| Class T | 9 | .31 |
| Class B | 1 | .30 |
| Class C | 13 | .30 |
| Stock Selector Small Cap | 3,357 | .24 |
| Class I | 100 | .20 |
| $3,505 |
Accounting and Security Lending Fees. Fidelity Service Company, Inc. (FSC), an affiliate of the investment adviser, maintains the Fund's accounting records. The accounting fee is based on the level of average net assets for each month. Under a separate contract, FSC administers the security lending program. The security lending fee is based on the number and duration of lending transactions.
Brokerage Commissions. The Fund placed a portion of its portfolio transactions with brokerage firms which are affiliates of the investment adviser. Brokerage commissions are included in net realized gain (loss) and change in net unrealized appreciation (depreciation) in the Statement of Operations. The commissions paid to these affiliated firms were $26 for the period.
Interfund Lending Program. Pursuant to an Exemptive Order issued by the SEC, the Fund, along with other registered investment companies having management contracts with FMR or other affiliated entities of FMR, may participate in an interfund lending program. This program provides an alternative credit facility allowing the funds to borrow from, or lend money to, other participating affiliated funds. The Fund's activity in this program during the period for which loans were outstanding was as follows:
| Borrower or Lender | Average Loan Balance | Weighted Average Interest Rate | Interest Expense |
| Borrower | $11,169 | .35% | $1 |
7. Committed Line of Credit.
The Fund participates with other funds managed by the investment adviser or an affiliate in a $4.25 billion credit facility (the "line of credit") to be utilized for temporary or emergency purposes to fund shareholder redemptions or for other short-term liquidity purposes. The Fund has agreed to pay commitment fees on its pro-rata portion of the line of credit, which amounted to $2 and is reflected in Miscellaneous expenses on the Statement of Operations. During the period, the Fund did not borrow on this line of credit.
8. Security Lending.
The Fund lends portfolio securities through a lending agent from time to time in order to earn additional income. For equity securities, a lending agent is used and may loan securities to certain qualified borrowers, including Fidelity Capital Markets (FCM), a broker-dealer affiliated with the Fund. On the settlement date of the loan, the Fund receives collateral (in the form of U.S. Treasury obligations, letters of credit and/or cash) against the loaned securities and maintains collateral in an amount not less than 100% of the market value of the loaned securities during the period of the loan. The market value of the loaned securities is determined at the close of business of the Fund and any additional required collateral is delivered to the Fund on the next business day. The Fund or borrower may terminate the loan at any time, and if the borrower defaults on its obligation to return the securities loaned because of insolvency or other reasons, the Fund may apply collateral received from the borrower against the obligation. The Fund may experience delays and costs in recovering the securities loaned. Any cash collateral received is invested in the Fidelity Securities Lending Cash Central Fund. The value of loaned securities and cash collateral at period end are disclosed on the Fund's Statement of Assets and Liabilities. The value of securities loaned to FCM at period end was $4,291. Security lending income represents the income earned on investing cash collateral, less rebates paid to borrowers and any lending agent fees associated with the loan, plus any premium payments received for lending certain types of securities. Security lending income is presented in the Statement of Operations as a component of income from Fidelity Central Funds. Total security lending income during the period amounted to $572 including $34 from securities loaned to FCM.
9. Expense Reductions.
Commissions paid to certain brokers with whom the investment adviser, or its affiliates, places trades on behalf of the Fund include an amount in addition to trade execution, which may be rebated back to the Fund to offset certain expenses. This amount totaled $101 for the period.
In addition, during the period the investment adviser reimbursed and/or waived a portion of fund-level operating expenses in the amount of $6 and a portion of class-level operating expenses as follows:
| Amount | |
| Class A | $-(a) |
| Class B | -(a) |
| Class C | -(a) |
| Class I | 1 |
| Stock Selector Small Cap | 34 |
| Class T | -(a) |
| $35 |
(a) In the amount of less than five hundred dollars.
10. Distributions to Shareholders.
Distributions to shareholders of each class were as follows:
| Years ended October 31, | 2015 | 2014 |
| From net investment income | ||
| Class A | $13 | $0 |
| Stock Selector Small Cap | 4,877 | 565 |
| Class I | 192 | 24 |
| Total | $5,082 | $589 |
| From net realized gain | ||
| Class A | $925 | $396 |
| Class T | 240 | 95 |
| Class B | 22 | 16 |
| Class C | 343 | 175 |
| Stock Selector Small Cap | 120,344 | 72,289 |
| Class I | 4,387 | 2,729 |
| Total | $126,261 | $75,700 |
11. Share Transactions.
Share transactions for each class were as follows and may contain automatic conversions between classes or exchanges between funds:
| Shares | Shares | Dollars | Dollars | |
| Years ended October 31, | 2015 | 2014 | 2015 | 2014 |
| Class A | ||||
| Shares sold | 100 | 152 | $2,535 | $3,885 |
| Reinvestment of distributions | 38 | 15 | 917 | 377 |
| Shares redeemed | (76) | (73) | (1,902) | (1,870) |
| Net increase (decrease) | 62 | 94 | $1,550 | $2,392 |
| Class T | ||||
| Shares sold | 25 | 50 | $620 | $1,259 |
| Reinvestment of distributions | 10 | 4 | 240 | 95 |
| Shares redeemed | (22) | (24) | (550) | (602) |
| Net increase (decrease) | 13 | 30 | $310 | $752 |
| Class B | ||||
| Shares sold | - | - | $5 | $5 |
| Reinvestment of distributions | 1 | - | 21 | 15 |
| Shares redeemed | (5) | (2) | (123) | (56) |
| Net increase (decrease) | (4) | (2) | $(97) | $(36) |
| Class C | ||||
| Shares sold | 64 | 66 | $1,523 | $1,636 |
| Reinvestment of distributions | 14 | 7 | 325 | 163 |
| Shares redeemed | (68) | (46) | (1,632) | (1,123) |
| Net increase (decrease) | 10 | 27 | $216 | $676 |
| Stock Selector Small Cap | ||||
| Shares sold | 8,425 | 5,956 | $213,955 | $154,419 |
| Reinvestment of distributions | 5,054 | 2,814 | 122,501 | 71,273 |
| Shares redeemed | (12,118) | (13,012) | (309,333) | (336,317) |
| Net increase (decrease) | 1,361 | (4,242) | $27,123 | $(110,625) |
| Class I | ||||
| Shares sold | 362 | 264 | $9,007 | $6,855 |
| Reinvestment of distributions | 186 | 87 | 4,521 | 2,217 |
| Shares redeemed | (631) | (580) | (15,896) | (15,133) |
| Net increase (decrease) | (83) | (229) | $(2,368) | $(6,061) |
12. Other.
The Fund's organizational documents provide former and current trustees and officers with a limited indemnification against liabilities arising in connection with the performance of their duties to the Fund. In the normal course of business, the Fund may also enter into contracts that provide general indemnifications. The Fund's maximum exposure under these arrangements is unknown as this would be dependent on future claims that may be made against the Fund. The risk of material loss from such claims is considered remote.
Report of Independent Registered Public Accounting Firm
To the Trustees of Fidelity Capital Trust and Shareholders of Fidelity® Stock Selector Small Cap Fund:
We have audited the accompanying statement of assets and liabilities of Fidelity® Stock Selector Small Cap Fund (the Fund), a fund of Fidelity Capital Trust, including the schedule of investments, as of October 31, 2015, and the related statement of operations for the year then ended, the statement of changes in net assets for each of the two years in the period then ended, and the financial highlights for each of the five years in the period then ended. These financial statements and financial highlights are the responsibility of the Fund's management. Our responsibility is to express an opinion on these financial statements and financial highlights based on our audits.
We conducted our audits in accordance with the standards of the Public Company Accounting Oversight Board (United States). Those standards require that we plan and perform the audit to obtain reasonable assurance about whether the financial statements and financial highlights are free of material misstatement. The Fund is not required to have, nor were we engaged to perform, an audit of its internal control over financial reporting. Our audits included consideration of internal control over financial reporting as a basis for designing audit procedures that are appropriate in the circumstances, but not for the purpose of expressing an opinion on the effectiveness of the Fund's internal control over financial reporting. Accordingly, we express no such opinion. An audit also includes examining, on a test basis, evidence supporting the amounts and disclosures in the financial statements, assessing the accounting principles used and significant estimates made by management, as well as evaluating the overall financial statement presentation. Our procedures included confirmation of securities owned as of October 31, 2015, by correspondence with the custodians and brokers; when replies were not received from brokers, we performed other auditing procedures. We believe that our audits provide a reasonable basis for our opinion.
In our opinion, such financial statements and financial highlights referred to above present fairly, in all material respects, the financial position of Fidelity® Stock Selector Small Cap Fund as of October 31, 2015, the results of its operations for the year then ended, the changes in its net assets for each of the two years in the period then ended, and the financial highlights for the each of the five years in the period then ended, in conformity with accounting principles generally accepted in the United States of America.
DELOITTE & TOUCHE LLP
Boston, Massachusetts
December 17, 2015
Trustees and Officers
The Trustees, Members of the Advisory Board (if any), and officers of the trust and fund, as applicable, are listed below. The Board of Trustees governs the fund and is responsible for protecting the interests of shareholders. The Trustees are experienced executives who meet periodically throughout the year to oversee the fund's activities, review contractual arrangements with companies that provide services to the fund, oversee management of the risks associated with such activities and contractual arrangements, and review the fund's performance. Each of the Trustees oversees 170 funds.
The Trustees hold office without limit in time except that (a) any Trustee may resign; (b) any Trustee may be removed by written instrument, signed by at least two-thirds of the number of Trustees prior to such removal; (c) any Trustee who requests to be retired or who has become incapacitated by illness or injury may be retired by written instrument signed by a majority of the other Trustees; and (d) any Trustee may be removed at any special meeting of shareholders by a two-thirds vote of the outstanding voting securities of the trust. Each Trustee who is not an interested person (as defined in the 1940 Act) of the trust and the fund is referred to herein as an Independent Trustee. Each Independent Trustee shall retire not later than the last day of the calendar year in which his or her 75th birthday occurs. The Independent Trustees may waive this mandatory retirement age policy with respect to individual Trustees. Officers and Advisory Board Members hold office without limit in time, except that any officer or Advisory Board Member may resign or may be removed by a vote of a majority of the Trustees at any regular meeting or any special meeting of the Trustees. Except as indicated, each individual has held the office shown or other offices in the same company for the past five years.
The fund’s Statement of Additional Information (SAI) includes more information about the Trustees. To request a free copy, call Fidelity at 1-877-208-0098.
Experience, Skills, Attributes, and Qualifications of the Trustees. The Governance and Nominating Committee has adopted a statement of policy that describes the experience, qualifications, attributes, and skills that are necessary and desirable for potential Independent Trustee candidates (Statement of Policy). The Board believes that each Trustee satisfied at the time he or she was initially elected or appointed a Trustee, and continues to satisfy, the standards contemplated by the Statement of Policy. The Governance and Nominating Committee also engages professional search firms to help identify potential Independent Trustee candidates who have the experience, qualifications, attributes, and skills consistent with the Statement of Policy. From time to time, additional criteria based on the composition and skills of the current Independent Trustees, as well as experience or skills that may be appropriate in light of future changes to board composition, business conditions, and regulatory or other developments, have also been considered by the professional search firms and the Governance and Nominating Committee. In addition, the Board takes into account the Trustees' commitment and participation in Board and committee meetings, as well as their leadership of standing and ad hoc committees throughout their tenure.
In determining that a particular Trustee was and continues to be qualified to serve as a Trustee, the Board has considered a variety of criteria, none of which, in isolation, was controlling. The Board believes that, collectively, the Trustees have balanced and diverse experience, qualifications, attributes, and skills, which allow the Board to operate effectively in governing the fund and protecting the interests of shareholders. Information about the specific experience, skills, attributes, and qualifications of each Trustee, which in each case led to the Board's conclusion that the Trustee should serve (or continue to serve) as a trustee of the fund, is provided below.
Board Structure and Oversight Function. James C. Curvey is an interested person and currently serves as Chairman. The Trustees have determined that an interested Chairman is appropriate and benefits shareholders because an interested Chairman has a personal and professional stake in the quality and continuity of services provided to the fund. Independent Trustees exercise their informed business judgment to appoint an individual of their choosing to serve as Chairman, regardless of whether the Trustee happens to be independent or a member of management. The Independent Trustees have determined that they can act independently and effectively without having an Independent Trustee serve as Chairman and that a key structural component for assuring that they are in a position to do so is for the Independent Trustees to constitute a substantial majority for the Board. The Independent Trustees also regularly meet in executive session. Ned C. Lautenbach serves as Chairman of the Independent Trustees and as such (i) acts as a liaison between the Independent Trustees and management with respect to matters important to the Independent Trustees and (ii) with management prepares agendas for Board meetings.
Fidelity® funds are overseen by different Boards of Trustees. The fund's Board oversees Fidelity's high income and certain equity funds, and other Boards oversee Fidelity's investment-grade bond, money market, asset allocation, and sector funds. The asset allocation funds may invest in Fidelity® funds overseen by the fund's Board. The use of separate Boards, each with its own committee structure, allows the Trustees of each group of Fidelity® funds to focus on the unique issues of the funds they oversee, including common research, investment, and operational issues. On occasion, the separate Boards establish joint committees to address issues of overlapping consequences for the Fidelity® funds overseen by each Board.
The Trustees operate using a system of committees to facilitate the timely and efficient consideration of all matters of importance to the Trustees, the fund, and fund shareholders and to facilitate compliance with legal and regulatory requirements and oversight of the fund's activities and associated risks. The Board, acting through its committees, has charged FMR and its affiliates with (i) identifying events or circumstances the occurrence of which could have demonstrably adverse effects on the fund's business and/or reputation; (ii) implementing processes and controls to lessen the possibility that such events or circumstances occur or to mitigate the effects of such events or circumstances if they do occur; and (iii) creating and maintaining a system designed to evaluate continuously business and market conditions in order to facilitate the identification and implementation processes described in (i) and (ii) above. Because the day-to-day operations and activities of the fund are carried out by or through FMR, its affiliates, and other service providers, the fund's exposure to risks is mitigated but not eliminated by the processes overseen by the Trustees. While each of the Board's committees has responsibility for overseeing different aspects of the fund's activities, oversight is exercised primarily through the Operations, Audit, and Compliance Committees. In addition, the Independent Trustees have worked with FMR to enhance the Board's oversight of investment and financial risks, legal and regulatory risks, technology risks, and operational risks, including the development of additional risk reporting to the Board. For example, a working group comprised of Independent Trustees and FMR has worked and continues to work to review the Fidelity® funds' valuation-related activities, reporting and risk management. Appropriate personnel, including but not limited to the fund's Chief Compliance Officer (CCO), FMR's internal auditor, the independent accountants, the fund's Treasurer and portfolio management personnel, make periodic reports to the Board's committees, as appropriate, including an annual review of Fidelity's risk management program for the Fidelity® funds. The responsibilities of each standing committee, including their oversight responsibilities, are described further under "Standing Committees of the Trustees."
Interested Trustees*:
Correspondence intended for a Trustee who is an interested person may be sent to Fidelity Investments, 245 Summer Street, Boston, Massachusetts 02210.
Name, Year of Birth; Principal Occupations and Other Relevant Experience+
James C. Curvey (1935)
Year of Election or Appointment: 2007
Trustee
Chairman of the Board of Trustees
Mr. Curvey also serves as Trustee of other Fidelity® funds. Mr. Curvey is a Director of Fidelity Research & Analysis Co. (investment adviser firm, 2009-present), and Vice Chairman (2007-present) and Director of FMR LLC (diversified financial services company). In addition, Mr. Curvey serves as an Overseer for the Boston Symphony Orchestra and a member of the board of Artis-Naples, Naples, Florida, and as a Trustee for Brewster Academy, Wolfeboro, New Hampshire. Previously, Mr. Curvey served as a Director of Fidelity Investments Money Management, Inc. (investment adviser firm, 2009-2014) and a Director of FMR and FMR Co., Inc. (investment adviser firms, 2007-2014).
Charles S. Morrison (1960)
Year of Election or Appointment: 2014
Trustee
Mr. Morrison also serves as Trustee of other funds. He serves as a Director of Fidelity Investments Money Management, Inc. (FIMM) (investment adviser firm, 2014-present), Director of Fidelity SelectCo, LLC (investment adviser firm, 2014-present), President, Asset Management (2014-present), and is an employee of Fidelity Investments. Previously, Mr. Morrison served as Vice President of Fidelity's Fixed Income and Asset Allocation Funds (2012-2014), President, Fixed Income (2011-2014), Vice President of Fidelity's Money Market Funds (2005-2009), President, Money Market Group Leader of FMR (investment adviser firm, 2009), and Senior Vice President, Money Market Group of FMR (2004-2009). Mr. Morrison also served as Vice President of Fidelity's Bond Funds (2002-2005), certain Balanced Funds (2002-2005), and certain Asset Allocation Funds (2002-2007), and as Senior Vice President (2002-2005) of Fidelity's Bond Division.
* Determined to be an “Interested Trustee” by virtue of, among other things, his or her affiliation with the trust or various entities under common control with FMR.
+ The information includes the Trustee's principal occupation during the last five years and other information relating to the experience, attributes, and skills relevant to the Trustee's qualifications to serve as a Trustee, which led to the conclusion that the Trustee should serve as a Trustee for the fund.
Independent Trustees:
Correspondence intended for an Independent Trustee may be sent to Fidelity Investments, P.O. Box 55235, Boston, Massachusetts 02205-5235.
Name, Year of Birth; Principal Occupations and Other Relevant Experience+
Dennis J. Dirks (1948)
Year of Election or Appointment: 2005
Trustee
Mr. Dirks also serves as Trustee of other Fidelity® funds. Prior to his retirement in May 2003, Mr. Dirks was Chief Operating Officer and a member of the Board of The Depository Trust & Clearing Corporation (DTCC). He also served as President, Chief Operating Officer, and Board member of The Depository Trust Company (DTC) and President and Board member of the National Securities Clearing Corporation (NSCC). In addition, Mr. Dirks served as Chief Executive Officer and Board member of the Government Securities Clearing Corporation, Chief Executive Officer and Board member of the Mortgage-Backed Securities Clearing Corporation, as a Trustee and a member of the Finance Committee of Manhattan College (2005-2008), as a Trustee and a member of the Finance Committee of AHRC of Nassau County (2006-2008), and as a member of the Independent Directors Council (IDC) Governing Council (2010-2015). Mr. Dirks is a member of the Board of Directors for The Brookville Center for Children's Services, Inc. (2009-present).
Alan J. Lacy (1953)
Year of Election or Appointment: 2008
Trustee
Mr. Lacy also serves as Trustee of other Fidelity® funds. Mr. Lacy serves as a member of the Board of Directors of Dave & Buster's Entertainment, Inc. (restaurant and entertainment complexes, 2010-present) and Bristol-Myers Squibb Company (global pharmaceuticals, 2008-present). In addition, Mr. Lacy served as Senior Adviser (2007-2014) of Oak Hill Capital Partners, L.P. (private equity) and also served as Chief Executive Officer (2000-2005) and Vice Chairman (2005-2006) of Sears Holdings Corporation and Sears, Roebuck and Co. (retail). Mr. Lacy is a member of the Board of Trustees of The National Parks Conservation Association (2006-present). Previously, Mr. Lacy served as Chairman of the Board of Trustees of the National Parks Conservation Association (2008-2011) and as a member of the Board of Directors for The Western Union Company (global money transfer, 2006-2011), The Hillman Companies, Inc. (hardware wholesalers, 2010-2014), and Earth Fare, Inc. (retail grocery, 2010-2014).
Ned C. Lautenbach (1944)
Year of Election or Appointment: 2000
Trustee
Chairman of the Independent Trustees
Mr. Lautenbach also serves as Trustee of other Fidelity® funds. Mr. Lautenbach currently serves as the Lead Director of the Eaton Corporation Board of Directors (diversified industrial, 1997-present). Mr. Lautenbach is Chairman of the Board of Directors of Artis-Naples in Naples, Florida (2012-present), a member of the Council on Foreign Relations (1994-present), and a member of the Board of Governors, State University System of Florida (2013-present). Previously, Mr. Lautenbach was a Partner/Advisory Partner at Clayton, Dubilier & Rice, LLC (private equity investment, 1998-2010), as well as a Director of Sony Corporation (2006-2007).
Joseph Mauriello (1944)
Year of Election or Appointment: 2008
Trustee
Mr. Mauriello also serves as Trustee of other Fidelity® funds. Prior to his retirement in January 2006, Mr. Mauriello served in numerous senior management positions including Deputy Chairman and Chief Operating Officer (2004-2005), and Vice Chairman of Financial Services (2002-2004) of KPMG LLP US (professional services, 1965-2005). Mr. Mauriello currently serves as a member of the Board of Directors of XL Group plc. (global insurance and re-insurance, 2006-present) and the Independent Directors Council (IDC) Governing Council (2015-present). Previously, Mr. Mauriello served as a Director of the Hamilton Funds of the Bank of New York (2006-2007) and of Arcadia Resources Inc. (health care services and products, 2007-2012).
Robert W. Selander (1950)
Year of Election or Appointment: 2011
Trustee
Mr. Selander also serves as Trustee of other Fidelity® funds. Mr. Selander serves as a Director of The Western Union Company (global money transfer, 2014-present). Previously, Mr. Selander served as a Member of the Advisory Board of other Fidelity® funds (2011), and Executive Vice Chairman (2010), Chief Executive Officer (2009-2010), and President and Chief Executive Officer (1997-2009) of Mastercard, Inc.
Cornelia M. Small (1944)
Year of Election or Appointment: 2005
Trustee
Ms. Small also serves as Trustee of other Fidelity® funds. Ms. Small is a member of the Board of Directors (2009-present) and Chair of the Investment Committee (2010-present) of the Teagle Foundation. Ms. Small also serves on the Investment Committee of the Berkshire Taconic Community Foundation (2008-present). Previously, Ms. Small served as Chairperson (2002-2008) and a member of the Investment Committee and Chairperson (2008-2012) and a member of the Board of Trustees of Smith College. In addition, Ms. Small served as Chief Investment Officer, Director of Global Equity Investments, and a member of the Board of Directors of Scudder, Stevens & Clark and Scudder Kemper Investments.
William S. Stavropoulos (1939)
Year of Election or Appointment: 2002
Trustee
Vice Chairman of the Independent Trustees
Mr. Stavropoulos also serves as Trustee of other Fidelity® funds. Mr. Stavropoulos serves as President and Founder of the Michigan Baseball Foundation, the Great Lakes Loons (2007-present). Mr. Stavropoulos is Chairman Emeritus of the Board of Directors of The Dow Chemical Company, where he previously served in numerous senior management positions, including President, CEO (1995-2000; 2002-2004), Chairman of the Executive Committee (2000-2006), and as a member of the Board of Directors (1990-2006). Currently, Mr. Stavropoulos is Chairman of the Board of Directors of Univar Inc. (global distributor of commodity and specialty chemicals), a Director of Teradata Corporation (data warehousing and technology solutions), and Maersk Inc. (industrial conglomerate), and a member of the Advisory Board for Metalmark Capital LLC (private equity investment, 2005-present). Mr. Stavropoulos is an operating advisor to Clayton, Dubilier & Rice, LLC (private equity investment). In addition, Mr. Stavropoulos is a member of the University of Notre Dame Advisory Council for the College of Science, a Trustee of the Rollin L. Gerstacker Foundation, and a Director of the Naples Philharmonic Center for the Arts. Previously, Mr. Stavropoulos served as a Director of Chemical Financial Corporation (bank holding company, 1993-2012) and Tyco International, Ltd. (multinational manufacturing and services, 2007-2012).
David M. Thomas (1949)
Year of Election or Appointment: 2008
Trustee
Mr. Thomas also serves as Trustee of other Fidelity® funds. Mr. Thomas serves as Non-Executive Chairman of the Board of Directors of Fortune Brands Home and Security (home and security products, 2011-present), as a member of the Board of Directors (2004-present) and Presiding Director (2013-present) of Interpublic Group of Companies, Inc. (marketing communication), and as a member of the Board of Trustees of the University of Florida (2013-present). Previously, Mr. Thomas served as Executive Chairman (2005-2006) and Chairman and Chief Executive Officer (2000-2005) of IMS Health, Inc. (pharmaceutical and healthcare information solutions), and a Director of Fortune Brands, Inc. (consumer products, 2000-2011).
+ The information includes the Trustee's principal occupation during the last five years and other information relating to the experience, attributes, and skills relevant to the Trustee's qualifications to serve as a Trustee, which led to the conclusion that the Trustee should serve as a Trustee for the fund.
Advisory Board Members and Officers:
Correspondence intended for an officer or Peter S. Lynch may be sent to Fidelity Investments, 245 Summer Street, Boston, Massachusetts 02210. Officers appear below in alphabetical order.
Name, Year of Birth; Principal Occupation
Peter S. Lynch (1944)
Year of Election or Appointment: 2003
Member of the Advisory Board
Mr. Lynch also serves as Member of the Advisory Board of other Fidelity® funds. Mr. Lynch is Vice Chairman and a Director of FMR (investment adviser firm) and FMR Co., Inc. (investment adviser firm). In addition, Mr. Lynch serves as a Trustee of Boston College and as the Chairman of the Inner-City Scholarship Fund. Previously, Mr. Lynch served on the Special Olympics International Board of Directors (1997-2006).
Elizabeth Paige Baumann (1968)
Year of Election or Appointment: 2012
Anti-Money Laundering (AML) Officer
Ms. Baumann also serves as AML Officer of other funds. She is Chief AML Officer of FMR LLC (diversified financial services company, 2012-present) and is an employee of Fidelity Investments. Previously, Ms. Baumann served as Vice President and Deputy Anti-Money Laundering Officer (2007-2012).
Marc R. Bryant (1966)
Year of Election or Appointment: 2015
Secretary and Chief Legal Officer (CLO)
Mr. Bryant also serves as Secretary and CLO of other funds. Mr. Bryant serves as CLO, Secretary, and Senior Vice President of Fidelity Management & Research Company (investment adviser firm, 2015-present) and FMR Co., Inc. (investment adviser firm, 2015-present); Secretary of Fidelity SelectCo, LLC (investment adviser firm, 2015-present) and Fidelity Investments Money Management, Inc. (investment adviser firm, 2015-present); and CLO of Fidelity Management & Research (Hong Kong) Limited (investment adviser firm, 2015-present). He is Senior Vice President and Deputy General Counsel of FMR LLC (diversified financial services company). Previously, Mr. Bryant served as Secretary and Chief Legal Officer of Fidelity Rutland Square Trust II (2010-2014) and Assistant Secretary of Fidelity's Fixed Income and Asset Allocation Funds (2013-2015). Prior to joining Fidelity Investments, Mr. Bryant served as a Senior Vice President and the Head of Global Retail Legal for AllianceBernstein L.P. (2006-2010), and as the General Counsel for ProFund Advisors LLC (2001-2006).
William C. Coffey (1969)
Year of Election or Appointment: 2009
Assistant Secretary
Mr. Coffey also serves as Assistant Secretary of other funds. He is Senior Vice President and Deputy General Counsel of FMR LLC (diversified financial services company, 2010-present), and is an employee of Fidelity Investments. Previously, Mr. Coffey served as Vice President and Associate General Counsel of FMR LLC (2005-2009).
Jonathan Davis (1968)
Year of Election or Appointment: 2010
Assistant Treasurer
Mr. Davis also serves as Assistant Treasurer of other funds, and is an employee of Fidelity Investments. Previously, Mr. Davis served as Vice President and Associate General Counsel of FMR LLC (diversified financial services company, 2003-2010).
Adrien E. Deberghes (1967)
Year of Election or Appointment: 2008
Deputy Treasurer
Mr. Deberghes also serves as an officer of other funds. He is an employee of Fidelity Investments (2008-present). Prior to joining Fidelity Investments, Mr. Deberghes was Senior Vice President of Mutual Fund Administration at State Street Corporation (2007-2008), Senior Director of Mutual Fund Administration at Investors Bank & Trust (2005-2007), and Director of Finance for Dunkin' Brands (2000-2005).
Stephanie J. Dorsey (1969)
Year of Election or Appointment: 2010
Assistant Treasurer
Ms. Dorsey also serves as an officer of other funds. She is an employee of Fidelity Investments (2008-present) and has served in other fund officer roles. Prior to joining Fidelity Investments, Ms. Dorsey served as Treasurer (2004-2008) of the JPMorgan Mutual Funds and Vice President (2004-2008) of JPMorgan Chase Bank.
Howard J. Galligan III (1966)
Year of Election or Appointment: 2014
Chief Financial Officer
Mr. Galligan also serves as Chief Financial Officer of other funds. Mr. Galligan serves as President of Fidelity Pricing and Cash Management Services (FPCMS) (2014-present) and as a Director of Strategic Advisers, Inc. (investment adviser firm, 2008-present). Previously, Mr. Galligan served as Chief Administrative Officer of Asset Management (2011-2014) and Chief Operating Officer and Senior Vice President of Investment Support for Strategic Advisers, Inc. (2003-2011).
Scott C. Goebel (1968)
Year of Election or Appointment: 2015
Vice President
Mr. Goebel serves as Vice President of other funds and is an employee of Fidelity Investments (2001-present). Previously, Mr. Goebel served as Secretary of Fidelity SelectCo, LLC (investment adviser firm, 2013-2015), Fidelity Investments Money Management, Inc. (FIMM) (investment adviser firm, 2010-2015), and Fidelity Research and Analysis Company (FRAC) (investment adviser firm, 2010-2015); General Counsel, Secretary, and Senior Vice President of Fidelity Management & Research Company (investment adviser firm, 2008-2015) and FMR Co., Inc. (investment adviser firm, 2008-2015); Assistant Secretary of Fidelity Management & Research (Japan) Limited (investment adviser firm, 2008-2015) and FMR Investment Management (U.K.) Limited (investment adviser firm, 2008-2015); Chief Legal Officer (CLO) of Fidelity Management & Research (Hong Kong) Limited (investment adviser firm, 2008-2015); Secretary and CLO of certain Fidelity® funds (2008-2015); Assistant Secretary of FIMM (2008-2010), FRAC (2008-2010), and certain funds (2007-2008); and as Vice President and Secretary of Fidelity Distributors Corporation (FDC) (2005-2007).
Thomas C. Hense (1964)
Year of Election or Appointment: 2008, 2010, or 2015
Vice President
Mr. Hense serves as Vice President of Fidelity Advisor® Multi-Asset Income Fund (2015) and other funds (High Income (2008), Small Cap (2008), and Value (2010) funds), and is an employee of Fidelity Investments (1993-present). Previously, Mr. Hense served as a portfolio manager for Fidelity's Institutional Money Management Group (Pyramis) (2003-2008).
Brian B. Hogan (1964)
Year of Election or Appointment: 2009
Vice President
Mr. Hogan also serves as Trustee or Vice President of other funds. Mr. Hogan serves as a Director of Fidelity SelectCo, LLC (investment adviser firm, 2014-present) and President of the Equity Division of FMR (investment adviser firm, 2009-present). Previously, Mr. Hogan served as Senior Vice President, Equity Research of FMR (2006-2009) and as a portfolio manager.
Chris Maher (1972)
Year of Election or Appointment: 2013
Assistant Treasurer
Mr. Maher serves as Assistant Treasurer of other funds. Mr. Maher is Vice President of Valuation Oversight and is an employee of Fidelity Investments. Previously, Mr. Maher served as Vice President of Asset Management Compliance (2013), Vice President of the Program Management Group of FMR (investment adviser firm, 2010-2013), and Vice President of Valuation Oversight (2008-2010).
Kenneth B. Robins (1969)
Year of Election or Appointment: 2008
President and Treasurer
Mr. Robins also serves as an officer of other funds. Mr. Robins serves as Executive Vice President of Fidelity Investments Money Management, Inc. (FIMM) (investment adviser firm, 2013-present) and is an employee of Fidelity Investments (2004-present). Previously, Mr. Robins served in other fund officer roles.
Stacie M. Smith (1974)
Year of Election or Appointment: 2013
Deputy Treasurer
Ms. Smith also serves as an officer of other funds. She is an employee of Fidelity Investments (2009-present) and has served in other fund officer roles. Prior to joining Fidelity Investments, Ms. Smith served as Senior Audit Manager of Ernst & Young LLP (1996-2009).
Renee Stagnone (1975)
Year of Election or Appointment: 2013
Deputy Treasurer
Ms. Stagnone also serves as Deputy Treasurer of other funds. Ms. Stagnone is an employee of Fidelity Investments (1997-present).
Linda J. Wondrack (1964)
Year of Election or Appointment: 2014
Chief Compliance Officer
Ms. Wondrack also serves as Chief Compliance Officer of other funds. Ms. Wondrack is Executive Vice President and head of the Ethics Office and Asset Management Compliance for Fidelity Investments (2012-present). Ms. Wondrack also serves as Chief Compliance Officer of Fidelity SelectCo, LLC (investment adviser firm, 2014-present); Chief Compliance Officer of Impresa Management LLC (2013-present); and Chief Compliance Officer of FMR Co., Inc. (investment adviser firm), Fidelity Investments Money Management, Inc. (investment adviser firm), Fidelity Management & Research (Japan) Limited (investment adviser firm), FMR Investment Management (U.K.) Limited (investment adviser firm), Fidelity Management & Research (Hong Kong) (investment adviser firm), Fidelity Management & Research Company (investment adviser firm), FIAM LLC (investment adviser firm), and Strategic Advisers, Inc. (investment adviser firm), Ballyrock Investment Advisors LLC, and Northern Neck Investors LLC (2012-present). Previously, Ms. Wondrack served as Senior Vice President and Chief Compliance Officer for Columbia Management Investment Advisers, LLC (2005-2012); Chief Compliance Officer for certain funds within the Columbia Family of Funds (2007-2012); and Senior Vice President of Compliance Risk Management at Bank of America (2005-2010).
Joseph F. Zambello (1957)
Year of Election or Appointment: 2011
Deputy Treasurer
Mr. Zambello also serves as Deputy Treasurer of other funds. Mr. Zambello is an employee of Fidelity Investments (1991-present). Previously, Mr. Zambello served as Vice President of the Program Management Group of FMR (investment adviser firm, 2009-2011) and Vice President of the Transfer Agent Oversight Group (2005-2009).
Shareholder Expense Example
As a shareholder of the Fund, you incur two types of costs: (1) transaction costs, including sales charges (loads) on purchase payments or redemption proceeds, redemption fees and (2) ongoing costs, including management fees, distribution and/or service (12b-1) fees and other Fund expenses. This Example is intended to help you understand your ongoing costs (in dollars) of investing in the Fund and to compare these costs with the ongoing costs of investing in other mutual funds.
The Example is based on an investment of $1,000 invested at the beginning of the period and held for the entire period (May 1, 2015 to October 31, 2015).
Actual Expenses
The first line of the accompanying table for each class of the Fund provides information about actual account values and actual expenses. You may use the information in this line, together with the amount you invested, to estimate the expenses that you paid over the period. Simply divide your account value by $1,000.00 (for example, an $8,600 account value divided by $1,000.00 = 8.6), then multiply the result by the number in the first line for a class of the Fund under the heading entitled "Expenses Paid During Period" to estimate the expenses you paid on your account during this period. A small balance maintenance fee of $12.00 that is charged once a year may apply for certain accounts with a value of less than $2,000. This fee is not included in the table below. If it was, the estimate of expenses you paid during the period would be higher, and your ending account value lower, by this amount. In addition, the Fund, as a shareholder in the underlying Fidelity Central Funds, will indirectly bear its pro-rata share of the fees and expenses incurred by the underlying Fidelity Central Funds. These fees and expenses are not included in the Fund's annualized expense ratio used to calculate the expense estimate in the table below.
Hypothetical Example for Comparison Purposes
The second line of the accompanying table for each class of the Fund provides information about hypothetical account values and hypothetical expenses based on a Class' actual expense ratio and an assumed rate of return of 5% per year before expenses, which is not the Class' actual return. The hypothetical account values and expenses may not be used to estimate the actual ending account balance or expenses you paid for the period. You may use this information to compare the ongoing costs of investing in the Fund and other funds. To do so, compare this 5% hypothetical example with the 5% hypothetical examples that appear in the shareholder reports of the other funds. A small balance maintenance fee of $12.00 that is charged once a year may apply for certain accounts with a value of less than $2,000. This fee is not included in the table below. If it was, the estimate of expenses you paid during the period would be higher, and your ending account value lower, by this amount. In addition, the Fund, as a shareholder in the underlying Fidelity Central Funds, will indirectly bear its pro-rata share of the fees and expenses incurred by the underlying Fidelity Central Funds. These fees and expenses are not included in the Fund's annualized expense ratio used to calculate the expense estimate in the table below.
Please note that the expenses shown in the table are meant to highlight your ongoing costs only and do not reflect any transaction costs. Therefore, the second line of the table is useful in comparing ongoing costs only, and will not help you determine the relative total costs of owning different funds. In addition, if these transactional costs were included, your costs would have been higher.
| Annualized Expense Ratio-A | Beginning Account Value May 1, 2015 | Ending Account Value October 31, 2015 | Expenses Paid During Period-B May 1, 2015 to October 31, 2015 | |
| Class A | 1.05% | |||
| Actual | $1,000.00 | $971.00 | $5.22 | |
| Hypothetical-C | $1,000.00 | $1,019.91 | $5.35 | |
| Class T | 1.40% | |||
| Actual | $1,000.00 | $969.70 | $6.95 | |
| Hypothetical-C | $1,000.00 | $1,018.15 | $7.12 | |
| Class B | 1.90% | |||
| Actual | $1,000.00 | $967.20 | $9.42 | |
| Hypothetical-C | $1,000.00 | $1,015.63 | $9.65 | |
| Class C | 1.89% | |||
| Actual | $1,000.00 | $967.00 | $9.37 | |
| Hypothetical-C | $1,000.00 | $1,015.68 | $9.60 | |
| Stock Selector Small Cap | .83% | |||
| Actual | $1,000.00 | $971.90 | $4.13 | |
| Hypothetical-C | $1,000.00 | $1,021.02 | $4.23 | |
| Class I | .78% | |||
| Actual | $1,000.00 | $972.70 | $3.88 | |
| Hypothetical-C | $1,000.00 | $1,021.27 | $3.97 |
A Annualized expense ratio reflects expenses net of applicable fee waivers.
B Expenses are equal to each Class' annualized expense ratio, multiplied by the average account value over the period, multiplied by 184/365 (to reflect the one-half year period).
C 5% return per year before expenses
Distributions (Unaudited)
The Board of Trustees of Fidelity Stock Selector Small Cap Fund voted to pay to shareholders of record at the opening of business on record date, the following distributions per share derived from capital gains realized from sales of portfolio securities, and dividends derived from net investment income:
| Pay Date | Record Date | Dividends | Capital Gains | |
| Class I | 12/07/15 | 12/04/15 | $0.115 | $1.520 |
The fund hereby designates as a capital gain dividend with respect to the taxable year ended October 31, 2015 $99,563,019, or, if subsequently determined to be different, the net capital gain of such year.
Class I designates 51% of each dividends distributed during the fiscal year as qualifying for the dividends-received deduction for corporate shareholders.
Class I designates 61% of each dividends distributed during the fiscal year as amounts which may be taken into account as a dividend for purposes of the maximum rate under section 1(h)(11) of the Internal Revenue Code.
The fund will notify shareholders in January 2016 of amounts for use in preparing 2015 income tax returns.
Board Approval of Investment Advisory Contracts and Management Fees
Fidelity Stock Selector Small Cap Fund
Each year, the Board of Trustees, including the Independent Trustees (together, the Board), votes on the renewal of the management contract with Fidelity Management & Research Company (FMR) and the sub-advisory agreements (together, the Advisory Contracts) for the fund. The Board, assisted by the advice of fund counsel and Independent Trustees' counsel, requests and considers a broad range of information relevant to the renewal of the Advisory Contracts throughout the year.
The Board meets regularly and, at each of its meetings, covers an extensive agenda of topics and materials and considers factors that are relevant to its annual consideration of the renewal of the fund's Advisory Contracts, including the services and support provided to the fund and its shareholders. The Board has established various standing committees (Committees), each composed of and chaired by Independent Trustees with varying backgrounds, to which the Board has assigned specific subject matter responsibilities in order to enhance effective decision-making by the Board. The Board, acting directly and through its Committees, requests and receives information concerning the annual consideration of the renewal of the fund's Advisory Contracts. The Board also meets as needed to consider matters specifically related to the Board's annual consideration of the renewal of the Advisory Contracts. Members of the Board may also meet with trustees of other Fidelity funds through ad hoc joint committees to discuss certain matters relevant to all of the Fidelity funds.
At its July 2015 meeting, the Board unanimously determined to renew the fund's Advisory Contracts. In reaching its determination, the Board considered all factors it believed relevant, including (i) the nature, extent, and quality of the services to be provided to the fund and its shareholders (including the investment performance of the fund); (ii) the competitiveness of the fund's management fee and total expense ratio relative to peer funds; (iii) the total costs of the services to be provided by and the profits to be realized by Fidelity from its relationship with the fund; and (iv) the extent to which (if any) economies of scale exist and would be realized as the fund grows, and whether any economies of scale are appropriately shared with fund shareholders.
In considering whether to renew the Advisory Contracts for the fund, the Board reached a determination, with the assistance of fund counsel and Independent Trustees' counsel and through the exercise of its business judgment, that the renewal of the Advisory Contracts was in the best interests of the fund and its shareholders and that the compensation payable under the Advisory Contracts was fair and reasonable. The Board's decision to renew the Advisory Contracts was not based on any single factor, but rather was based on a comprehensive consideration of all the information provided to the Board at its meetings throughout the year. The Board, in reaching its determination to renew the Advisory Contracts, was aware that shareholders of the fund have a broad range of investment choices available to them, including a wide choice among funds offered by Fidelity's competitors, and that the fund's shareholders, who have the opportunity to review and weigh the disclosure provided by the fund in its prospectus and other public disclosures, have chosen to invest in this fund, which is part of the Fidelity family of funds.
Nature, Extent, and Quality of Services Provided. The Board considered Fidelity's staffing as it relates to the fund, including the backgrounds of investment personnel of Fidelity, and also considered the fund's investment objective, strategies, and related investment philosophy. The Independent Trustees also had discussions with senior management of Fidelity's investment operations and investment groups. The Board considered the structure of the portfolio manager compensation program and whether this structure provides appropriate incentives to act in the best interests of the fund. Additionally, the Board considered the portfolio managers' investments, if any, in the funds that they manage.Resources Dedicated to Investment Management and Support Services. The Board and the Fund Oversight and Research Committees reviewed the general qualifications and capabilities of Fidelity's investment staff, including its size, education, experience, and resources, as well as Fidelity's approach to recruiting, training, managing, and compensating investment personnel. The Board noted that Fidelity has continued to increase the resources devoted to non-U.S. offices, including expansion of Fidelity's global investment organization. The Board also noted that Fidelity's analysts have extensive resources, tools and capabilities that allow them to conduct sophisticated quantitative and fundamental analysis, as well as credit analysis of issuers, counterparties and guarantors. Further, the Board considered that Fidelity's investment professionals have sufficient access to global information and data so as to provide competitive investment results over time, and that those professionals also have access to sophisticated tools that permit them to assess portfolio construction and risk and performance attribution characteristics continuously, as well as to transmit new information and research conclusions rapidly around the world. Additionally, in its deliberations, the Board considered Fidelity's trading, risk management, and compliance capabilities and resources, which are integral parts of the investment management process.Shareholder and Administrative Services. The Board considered (i) the nature, extent, quality, and cost of advisory, administrative, and shareholder services performed by FMR, the sub-advisers (together with FMR, the Investment Advisers), and their affiliates under the Advisory Contracts and under separate agreements covering transfer agency, pricing and bookkeeping, and securities lending services for the fund; (ii) the nature and extent of the supervision of third party service providers, principally custodians and subcustodians; and (iii) the resources devoted to, and the record of compliance with, the fund's compliance policies and procedures. The Board also reviewed the allocation of fund brokerage, including allocations to brokers affiliated with the Investment Advisers, the use of brokerage commissions to pay fund expenses, and the use of "soft" commission dollars to pay for research services.The Board noted that the growth of fund assets over time across the complex allows Fidelity to reinvest in the development of services designed to enhance the value or convenience of the Fidelity funds as investment vehicles. These services include 24-hour access to account information and market information through telephone representatives and over the Internet, investor education materials and asset allocation tools, and the expanded availability of Fidelity Investor Centers.In 2014, the Board formed an ad hoc Committee on Transfer Agency Fees to review the variety of transfer agency fee structures throughout the industry and Fidelity's competitive positioning with respect to industry participants.Investment in a Large Fund Family. The Board considered the benefits to shareholders of investing in a Fidelity fund, including the benefits of investing in a fund that is part of a large family of funds offering a variety of investment disciplines and providing a large variety of mutual fund investor services. The Board noted that Fidelity had taken, or had made recommendations that resulted in the Fidelity funds taking, a number of actions over the previous year that benefited particular funds, including (i) continuing to dedicate additional resources to investment research and to the support of the senior management team that oversees asset management; (ii) continuing efforts to enhance Fidelity's global research capabilities; (iii) launching new funds and making other enhancements to meet client needs; (iv) reducing management fees and total expenses for certain index funds and diversified international funds; (v) continuing to launch dedicated lower cost underlying funds to meet portfolio construction needs related to expanding underlying fund options for Fidelity funds of funds, specifically for the Freedom Fund product lines; (vi) rationalizing product lines and gaining increased efficiencies through fund mergers; (vii) launching active fixed-income exchange-traded funds; (viii) continuing to develop, acquire and implement systems and technology to improve services to the funds and information security and to increase efficiency; (ix) implementing investment enhancements to further strengthen Fidelity's target date product line to increase investors' probability of success in achieving their goals; (x) modifying the eligibility criteria for certain share classes to accommodate roll-over assets from employer-sponsored retirement plans; (xi) launching a new Class W of the Freedom Index Funds to attract and retain Fidelity record-kept retirement plan assets; and (xii) implementing changes to Fidelity's money market product line in response to recent money market regulatory reforms.Investment Performance. The Board considered whether the fund has operated in accordance with its investment objective, as well as its record of compliance with its investment restrictions and its performance history. The Board noted that there were portfolio management changes for the fund in January 2013, April 2013, October 2013, and September 2014.The Board took into account discussions with representatives of the Investment Advisers about fund investment performance that occur at Board meetings throughout the year. In this regard the Board noted that as part of regularly scheduled fund reviews and other reports to the Board on fund performance, the Board considers annualized return information for the fund, for different time periods, measured against a securities market index ("benchmark index") and a peer group of funds with similar objectives ("peer group"), if any. In its evaluation of fund investment performance, the Board gave particular attention to information indicating changes in performance of certain Fidelity funds for specific time periods and discussed with the Investment Advisers the reasons for any overperformance or underperformance.In addition to reviewing absolute and relative fund performance, the Independent Trustees periodically consider the appropriateness of fund performance metrics in evaluating the results achieved. In general, the Independent Trustees believe that fund performance should be evaluated based on net performance (after fees and expenses) of both the highest performing and lowest performing fund share classes, where applicable, compared to appropriate benchmark indices, over appropriate time periods that may include full market cycles, and compared to peer groups, as applicable, over the same periods, taking into account relevant factors including the following: general market conditions; issuer-specific information; and fund cash flows and other factors.The Independent Trustees recognize that shareholders evaluate performance on a net basis over their own holding periods, for which one-, three-, and five-year periods are often used as a proxy. For this reason, the performance information reviewed by the Board also included net cumulative calendar year total return information for the fund and an appropriate benchmark index and peer group for the most recent one-, three-, and five-year periods, as shown below. Returns are shown compared to the 25th percentile (top of box, 75% beaten) and 75th percentile (bottom of box, 25% beaten) of the peer universe.Fidelity Stock Selector Small Cap Fund
Fidelity Stock Selector Small Cap Fund
![]()
ASCSI-ANN-1215
1.843144.108
Fidelity® Focused Stock Fund Annual Report October 31, 2015 |
|
Contents
Board Approval of Investment Advisory Contracts and Management Fees |
To view a fund's proxy voting guidelines and proxy voting record for the 12-month period ended June 30, visit http://www.fidelity.com/proxyvotingresults or visit the Securities and Exchange Commission's (SEC) web site at http://www.sec.gov.
You may also call 1-800-544-8544 to request a free copy of the proxy voting guidelines.
Standard & Poor's, S&P and S&P 500 are registered service marks of The McGraw-Hill Companies, Inc. and have been licensed for use by Fidelity Distributors Corporation.
Other third-party marks appearing herein are the property of their respective owners.
All other marks appearing herein are registered or unregistered trademarks or service marks of FMR LLC or an affiliated company. © 2015 FMR LLC. All rights reserved.
This report and the financial statements contained herein are submitted for the general information of the shareholders of the Fund. This report is not authorized for distribution to prospective investors in the Fund unless preceded or accompanied by an effective prospectus.
A fund files its complete schedule of portfolio holdings with the SEC for the first and third quarters of each fiscal year on Form N-Q. Forms N-Q are available on the SEC’s web site at http://www.sec.gov. A fund's Forms N-Q may be reviewed and copied at the SEC’s Public Reference Room in Washington, DC. Information regarding the operation of the SEC's Public Reference Room may be obtained by calling 1-800-SEC-0330.
For a complete list of a fund's portfolio holdings, view the most recent holdings listing, semiannual report, or annual report on Fidelity's web site at http://www.fidelity.com, http://www.advisor.fidelity.com, or http://www.401k.com, as applicable.
NOT FDIC INSURED •MAY LOSE VALUE •NO BANK GUARANTEE
Neither the Fund nor Fidelity Distributors Corporation is a bank.
Performance: The Bottom Line
Average annual total return reflects the change in the value of an investment, assuming reinvestment of distributions from dividend income and capital gains (the profits earned upon the sale of securities that have grown in value, if any) and assuming a constant rate of performance each year.
The hypothetical investment and the average annual total returns do not reflect the deduction of taxes that a shareholder would pay on fund distributions or the redemption of fund shares.
During periods of reimbursement by Fidelity, a fund’s total return will be greater than it would be had the reimbursement not occurred.
How a fund did yesterday is no guarantee of how it will do tomorrow.
Average Annual Total Returns
| For the periods ended October 31, 2015 | Past 1 year | Past 5 years | Past 10 years |
| Fidelity® Focused Stock Fund | 1.33% | 13.68% | 8.76% |
$10,000 Over 10 Years
Let's say hypothetically that $10,000 was invested in Fidelity® Focused Stock Fund on October 31, 2005.
The chart shows how the value of your investment would have changed, and also shows how the S&P 500® Index performed over the same period.
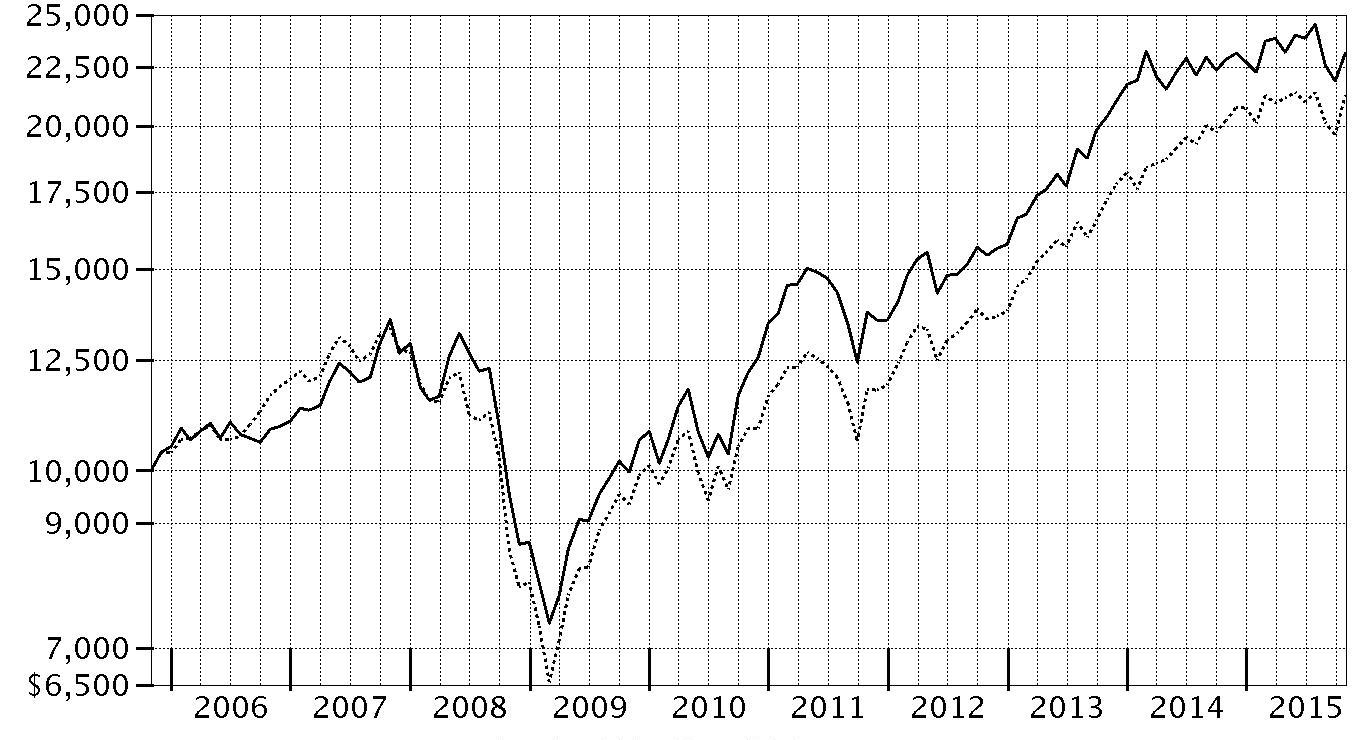
| Period Ending Values | ||
| $23,162 | Fidelity® Focused Stock Fund | |
| $21,289 | S&P 500® Index | |
Management's Discussion of Fund Performance
Market Recap: U.S. stocks gained moderately for the 12 months ending October 31, 2015, helped by a strong October that largely erased a steep decline in August and September on concern about slowing global economic growth emanating from China. Stocks benefited late in the period amid waning expectations for a near-term interest-rate hike by the U.S. Federal Reserve, additional economic stimulus in Europe and an interest-rate cut in China. The large-cap S&P 500® index advanced 5.20% for the period, with growth stocks in the index significantly outpacing value stocks, as investors continued to seek growth in a subpar economic environment. The growth-oriented Nasdaq Composite Index® also benefited, gaining 10.39%, while the small-cap Russell 2000® Index lost its edge, returning only 0.34%, as risk appetites waned. Among sectors in the widely followed S&P 500®, consumer discretionary (+21%) led the way, benefiting from a combination of rising personal income and still-benign inflation. Technology (+11%) and consumer staples (+9%) also outpaced the index. Conversely, energy (-19%) performed worst, in an environment of depressed commodity prices that also hit materials (-4%). At period end, investors remained focused on the potential global implications of a relatively stronger U.S. dollar and how China’s transition toward a consumption-led economy may affect corporate earnings.Comments from Portfolio Manager Stephen DuFour: For the year, the fund posted a modest gain, lagging the benchmark S&P 500® index. Our focus on stocks of 40 to 60 companies with above-average earnings-growth potential and reasonable prices included some top-performing benchmark components, but the fund didn’t have enough exposure to these "winners" to keep pace with the S&P 500®. Security selection in health care and industrials were the biggest disappointments, with positioning in utilities also detracting. In health care, the biggest detractor was a non-benchmark stake in Intercept Pharmaceuticals, which suffered along with the other biotechnology stocks amid late-summer talk of curbing excessive drug prices. In industrials, a non-benchmark position in Spirit Airlines hurt, returning about -50%. By contrast, positioning in information technology gave the biggest boost, largely due to a sizable overweighting in the strong-performing software & services group. Standouts included creative software company and top holding Adobe Systems, which rallied because its new cloud-based subscription model and general growth in Internet advertising and marketing helped to drive strong gains in revenue and earnings. Other contributors included a non-benchmark investment in biotech firm Pharmacyclics, which benefited from expanded U.S. approval for its sole marketed product. Pharmacyclics was not in the portfolio at period end.The views expressed above reflect those of the portfolio manager(s) only through the end of the period as stated on the cover of this report and do not necessarily represent the views of Fidelity or any other person in the Fidelity organization. Any such views are subject to change at any time based upon market or other conditions and Fidelity disclaims any responsibility to update such views. These views may not be relied on as investment advice and, because investment decisions for a Fidelity fund are based on numerous factors, may not be relied on as an indication of trading intent on behalf of any Fidelity fund.
Investment Summary (Unaudited)
Top Ten Stocks as of October 31, 2015
| % of fund's net assets | % of fund's net assets 6 months ago | |
| Alphabet, Inc. Class A | 5.4 | 1.2 |
| Adobe Systems, Inc. | 5.3 | 5.1 |
| Facebook, Inc. Class A | 3.7 | 2.9 |
| MasterCard, Inc. Class A | 3.5 | 2.1 |
| Visa, Inc. Class A | 3.5 | 2.2 |
| Exxon Mobil Corp. | 3.2 | 0.0 |
| American Tower Corp. | 3.2 | 0.3 |
| Amazon.com, Inc. | 3.1 | 1.8 |
| PayPal Holdings, Inc. | 3.0 | 0.0 |
| Prestige Brands Holdings, Inc. | 2.9 | 2.1 |
| 36.8 |
Top Five Market Sectors as of October 31, 2015
| % of fund's net assets | % of fund's net assets 6 months ago | |
| Information Technology | 35.7 | 24.2 |
| Health Care | 12.9 | 23.1 |
| Financials | 12.8 | 16.6 |
| Consumer Discretionary | 11.0 | 6.6 |
| Energy | 8.1 | 7.7 |
Asset Allocation (% of fund's net assets)
| As of October 31, 2015 * | ||
| Stocks | 99.1% | |
| Short-Term Investments and Net Other Assets (Liabilities) | 0.9% | |

* Foreign investments - 8.2%
| As of April 30, 2015 * | ||
| Stocks | 96.0% | |
| Short-Term Investments and Net Other Assets (Liabilities) | 4.0% | |

* Foreign investments - 10.1%
Percentages shown as 0.0% may reflect amounts less than 0.05%.
Investments October 31, 2015
Showing Percentage of Net Assets
| Common Stocks - 99.1% | |||
| Shares | Value | ||
| CONSUMER DISCRETIONARY - 11.0% | |||
| Hotels, Restaurants & Leisure - 1.2% | |||
| Las Vegas Sands Corp. | 441,000 | $21,833,910 | |
| Internet & Catalog Retail - 3.4% | |||
| Amazon.com, Inc. (a) | 95,300 | 59,648,270 | |
| Netflix, Inc. (a) | 48,000 | 5,202,240 | |
| 64,850,510 | |||
| Media - 1.0% | |||
| The Walt Disney Co. | 167,000 | 18,994,580 | |
| Specialty Retail - 4.0% | |||
| AutoZone, Inc. (a) | 70,100 | 54,987,141 | |
| Home Depot, Inc. | 90,000 | 11,127,600 | |
| TJX Companies, Inc. | 131,000 | 9,587,890 | |
| 75,702,631 | |||
| Textiles, Apparel & Luxury Goods - 1.4% | |||
| NIKE, Inc. Class B | 207,000 | 27,123,210 | |
| TOTAL CONSUMER DISCRETIONARY | 208,504,841 | ||
| CONSUMER STAPLES - 6.9% | |||
| Beverages - 0.6% | |||
| Constellation Brands, Inc. Class A (sub. vtg.) | 90,000 | 12,132,000 | |
| Food & Staples Retailing - 1.2% | |||
| CVS Health Corp. | 221,000 | 21,830,380 | |
| Food Products - 1.5% | |||
| Post Holdings, Inc. (a) | 450,400 | 28,947,208 | |
| Personal Products - 1.9% | |||
| Estee Lauder Companies, Inc. Class A | 452,000 | 36,367,920 | |
| Tobacco - 1.7% | |||
| Reynolds American, Inc. | 663,000 | 32,036,160 | |
| TOTAL CONSUMER STAPLES | 131,313,668 | ||
| ENERGY - 8.1% | |||
| Oil, Gas & Consumable Fuels - 8.1% | |||
| Chevron Corp. | 510,000 | 46,348,800 | |
| Exxon Mobil Corp. | 732,000 | 60,565,680 | |
| Total SA | 970,100 | 46,912,910 | |
| 153,827,390 | |||
| FINANCIALS - 12.8% | |||
| Banks - 4.0% | |||
| JPMorgan Chase & Co. | 662,000 | 42,533,500 | |
| Wells Fargo & Co. | 627,000 | 33,945,780 | |
| 76,479,280 | |||
| Capital Markets - 1.0% | |||
| E*TRADE Financial Corp. (a) | 667,000 | 19,016,170 | |
| Consumer Finance - 2.6% | |||
| Capital One Financial Corp. | 314,000 | 24,774,600 | |
| Discover Financial Services | 429,000 | 24,118,380 | |
| 48,892,980 | |||
| Diversified Financial Services - 1.2% | |||
| McGraw Hill Financial, Inc. | 237,094 | 21,964,388 | |
| Insurance - 0.8% | |||
| ACE Ltd. | 135,000 | 15,327,900 | |
| Real Estate Investment Trusts - 3.2% | |||
| American Tower Corp. | 590,000 | 60,315,700 | |
| TOTAL FINANCIALS | 241,996,418 | ||
| HEALTH CARE - 12.9% | |||
| Biotechnology - 3.5% | |||
| Intercept Pharmaceuticals, Inc. (a)(b) | 146,179 | 22,979,339 | |
| Medivation, Inc. (a) | 1,025,000 | 43,111,500 | |
| 66,090,839 | |||
| Health Care Equipment & Supplies - 2.3% | |||
| The Cooper Companies, Inc. | 283,427 | 43,182,938 | |
| Health Care Providers & Services - 2.4% | |||
| UnitedHealth Group, Inc. | 384,000 | 45,227,520 | |
| Life Sciences Tools & Services - 0.3% | |||
| Illumina, Inc. (a) | 46,200 | 6,619,536 | |
| Pharmaceuticals - 4.4% | |||
| Bristol-Myers Squibb Co. | 425,900 | 28,088,105 | |
| Prestige Brands Holdings, Inc. (a) | 1,129,500 | 55,356,795�� | |
| 83,444,900 | |||
| TOTAL HEALTH CARE | 244,565,733 | ||
| INDUSTRIALS - 7.0% | |||
| Airlines - 2.7% | |||
| Alaska Air Group, Inc. | 447,081 | 34,089,926 | |
| Spirit Airlines, Inc. (a) | 458,723 | 17,027,798 | |
| 51,117,724 | |||
| Road & Rail - 4.3% | |||
| Canadian Pacific Railway Ltd. | 129,715 | 18,228,152 | |
| Norfolk Southern Corp. | 251,000 | 20,087,530 | |
| Union Pacific Corp. | 494,000 | 44,138,900 | |
| 82,454,582 | |||
| TOTAL INDUSTRIALS | 133,572,306 | ||
| INFORMATION TECHNOLOGY - 35.7% | |||
| Electronic Equipment & Components - 2.9% | |||
| Zebra Technologies Corp. Class A (a) | 718,900 | 55,283,410 | |
| Internet Software & Services - 10.2% | |||
| Alibaba Group Holding Ltd. sponsored ADR (a) | 255,000 | 21,376,650 | |
| Alphabet, Inc. Class A (a) | 139,600 | 102,939,643 | |
| Facebook, Inc. Class A (a) | 678,700 | 69,207,039 | |
| 193,523,332 | |||
| IT Services - 11.9% | |||
| Cognizant Technology Solutions Corp. Class A (a) | 521,000 | 35,485,310 | |
| MasterCard, Inc. Class A | 682,000 | 67,511,180 | |
| PayPal Holdings, Inc. (a) | 1,566,000 | 56,391,660 | |
| Visa, Inc. Class A | 852,000 | 66,098,160 | |
| 225,486,310 | |||
| Software - 8.2% | |||
| Adobe Systems, Inc. (a) | 1,122,626 | 99,532,021 | |
| ANSYS, Inc. (a) | 181,000 | 17,251,110 | |
| Microsoft Corp. | 719,000 | 37,848,160 | |
| 154,631,291 | |||
| Technology Hardware, Storage & Peripherals - 2.5% | |||
| Apple, Inc. | 396,900 | 47,429,550 | |
| TOTAL INFORMATION TECHNOLOGY | 676,353,893 | ||
| MATERIALS - 2.8% | |||
| Chemicals - 2.8% | |||
| LyondellBasell Industries NV Class A | 571,000 | 53,051,610 | |
| TELECOMMUNICATION SERVICES - 0.5% | |||
| Diversified Telecommunication Services - 0.5% | |||
| Level 3 Communications, Inc. (a) | 202,000 | 10,291,900 | |
| UTILITIES - 1.4% | |||
| Independent Power and Renewable Electricity Producers - 1.4% | |||
| Dynegy, Inc. (a) | 1,403,175 | 27,263,690 | |
| TOTAL COMMON STOCKS | |||
| (Cost $1,720,253,491) | 1,880,741,449 | ||
| Money Market Funds - 3.3% | |||
| Fidelity Cash Central Fund, 0.18% (c) | 56,730,009 | 56,730,009 | |
| Fidelity Securities Lending Cash Central Fund, 0.19% (c)(d) | 5,569,075 | 5,569,075 | |
| TOTAL MONEY MARKET FUNDS | |||
| (Cost $62,299,084) | 62,299,084 | ||
| TOTAL INVESTMENT PORTFOLIO - 102.4% | |||
| (Cost $1,782,552,575) | 1,943,040,533 | ||
| NET OTHER ASSETS (LIABILITIES) - (2.4)% | (46,287,625) | ||
| NET ASSETS - 100% | $1,896,752,908 |
Legend
(a) Non-income producing
(b) Security or a portion of the security is on loan at period end.
(c) Affiliated fund that is generally available only to investment companies and other accounts managed by Fidelity Investments. The rate quoted is the annualized seven-day yield of the fund at period end. A complete unaudited listing of the fund's holdings as of its most recent quarter end is available upon request. In addition, each Fidelity Central Fund's financial statements, which are not covered by the Fund's Report of Independent Registered Public Accounting Firm, are available on the SEC's website or upon request.
(d) Investment made with cash collateral received from securities on loan.
Affiliated Central Funds
Information regarding fiscal year to date income earned by the Fund from investments in Fidelity Central Funds is as follows:
| Fund | Income earned |
| Fidelity Cash Central Fund | $42,168 |
| Fidelity Securities Lending Cash Central Fund | 53,574 |
| Total | $95,742 |
Investment Valuation
The following is a summary of the inputs used, as of October 31, 2015, involving the Fund's assets and liabilities carried at fair value. The inputs or methodology used for valuing securities may not be an indication of the risk associated with investing in those securities. For more information on valuation inputs, and their aggregation into the levels used below, please refer to the Investment Valuation section in the accompanying Notes to Financial Statements.
| Valuation Inputs at Reporting Date: | ||||
| Description | Total | Level 1 | Level 2 | Level 3 |
| Investments in Securities: | ||||
| Equities: | ||||
| Consumer Discretionary | $208,504,841 | $208,504,841 | $-- | $-- |
| Consumer Staples | 131,313,668 | 131,313,668 | -- | -- |
| Energy | 153,827,390 | 106,914,480 | 46,912,910 | -- |
| Financials | 241,996,418 | 241,996,418 | -- | -- |
| Health Care | 244,565,733 | 244,565,733 | -- | -- |
| Industrials | 133,572,306 | 133,572,306 | -- | -- |
| Information Technology | 676,353,893 | 676,353,893 | -- | -- |
| Materials | 53,051,610 | 53,051,610 | -- | -- |
| Telecommunication Services | 10,291,900 | 10,291,900 | -- | -- |
| Utilities | 27,263,690 | 27,263,690 | -- | -- |
| Money Market Funds | 62,299,084 | 62,299,084 | -- | -- |
| Total Investments in Securities: | $1,943,040,533 | $1,896,127,623 | $46,912,910 | $-- |
See accompanying notes which are an integral part of the financial statements.
Financial Statements
Statement of Assets and Liabilities
| October 31, 2015 | ||
| Assets | ||
| Investment in securities, at value (including securities loaned of $5,203,320) — See accompanying schedule: Unaffiliated issuers (cost $1,720,253,491) | $1,880,741,449 | |
| Fidelity Central Funds (cost $62,299,084) | 62,299,084 | |
| Total Investments (cost $1,782,552,575) | $1,943,040,533 | |
| Cash | 94 | |
| Receivable for investments sold | 79,152,587 | |
| Receivable for fund shares sold | 346,238 | |
| Dividends receivable | 840,373 | |
| Distributions receivable from Fidelity Central Funds | 15,513 | |
| Prepaid expenses | 4,152 | |
| Other receivables | 21,109 | |
| Total assets | 2,023,420,599 | |
| Liabilities | ||
| Payable for investments purchased | $117,323,955 | |
| Payable for fund shares redeemed | 2,603,591 | |
| Accrued management fee | 719,351 | |
| Other affiliated payables | 396,887 | |
| Other payables and accrued expenses | 54,832 | |
| Collateral on securities loaned, at value | 5,569,075 | |
| Total liabilities | 126,667,691 | |
| Net Assets | $1,896,752,908 | |
| Net Assets consist of: | ||
| Paid in capital | $1,644,329,858 | |
| Undistributed net investment income | 1,553,120 | |
| Accumulated undistributed net realized gain (loss) on investments and foreign currency transactions | 90,382,838 | |
| Net unrealized appreciation (depreciation) on investments and assets and liabilities in foreign currencies | 160,487,092 | |
| Net Assets, for 99,414,571 shares outstanding | $1,896,752,908 | |
| Net Asset Value, offering price and redemption price per share ($1,896,752,908 ÷ 99,414,571 shares) | $19.08 |
See accompanying notes which are an integral part of the financial statements.
Statement of Operations
| Year ended October 31, 2015 | ||
| Investment Income | ||
| Dividends | $14,701,307 | |
| Interest | 296 | |
| Income from Fidelity Central Funds | 95,742 | |
| Total income | 14,797,345 | |
| Expenses | ||
| Management fee | ||
| Basic fee | $8,992,301 | |
| Performance adjustment | (853,951) | |
| Transfer agent fees | 3,054,233 | |
| Accounting and security lending fees | 510,712 | |
| Custodian fees and expenses | 51,672 | |
| Independent trustees' compensation | 7,516 | |
| Registration fees | 67,072 | |
| Audit | 48,378 | |
| Legal | 6,868 | |
| Interest | 651 | |
| Miscellaneous | 21,477 | |
| Total expenses before reductions | 11,906,929 | |
| Expense reductions | (135,931) | 11,770,998 |
| Net investment income (loss) | 3,026,347 | |
| Realized and Unrealized Gain (Loss) | ||
| Net realized gain (loss) on: | ||
| Investment securities: | ||
| Unaffiliated issuers | 120,735,944 | |
| Foreign currency transactions | 168,693 | |
| Total net realized gain (loss) | 120,904,637 | |
| Change in net unrealized appreciation (depreciation) on: Investment securities | (137,278,863) | |
| Assets and liabilities in foreign currencies | (866) | |
| Total change in net unrealized appreciation (depreciation) | (137,279,729) | |
| Net gain (loss) | (16,375,092) | |
| Net increase (decrease) in net assets resulting from operations | $(13,348,745) |
See accompanying notes which are an integral part of the financial statements.
Statement of Changes in Net Assets
| Year ended October 31, 2015 | Year ended October 31, 2014 | |
| Increase (Decrease) in Net Assets | ||
| Operations | ||
| Net investment income (loss) | $3,026,347 | $(729,756) |
| Net realized gain (loss) | 120,904,637 | 200,034,651 |
| Change in net unrealized appreciation (depreciation) | (137,279,729) | (13,738,163) |
| Net increase (decrease) in net assets resulting from operations | (13,348,745) | 185,566,732 |
| Distributions to shareholders from net investment income | (1,432,488) | – |
| Distributions to shareholders from net realized gain | (162,039,389) | (92,568,181) |
| Total distributions | (163,471,877) | (92,568,181) |
| Share transactions | ||
| Proceeds from sales of shares | 144,792,274 | 859,928,309 |
| Net asset value of shares issued in exchange for the net assets of Fidelity Fifty Fund (note 10) | 718,222,341 | – |
| Reinvestment of distributions | 154,203,244 | 86,770,401 |
| Cost of shares redeemed | (792,366,831) | (762,859,196) |
| Net increase (decrease) in net assets resulting from share transactions | 224,851,028 | 183,839,514 |
| Total increase (decrease) in net assets | 48,030,406 | 276,838,065 |
| Net Assets | ||
| Beginning of period | 1,848,722,502 | 1,571,884,437 |
| End of period (including undistributed net investment income of $1,553,120 and undistributed net investment income of $0, respectively) | $1,896,752,908 | $1,848,722,502 |
| Other Information Shares | ||
| Sold | 7,441,651 | 42,485,626 |
| Issued in exchange for the shares of Fidelity Fifty Fund (note 10) | 35,696,935 | – |
| Issued in reinvestment of distributions | 8,065,023 | 4,574,085 |
| Redeemed | (40,934,543) | (38,107,588) |
| Net increase (decrease) | 10,269,066 | 8,952,123 |
See accompanying notes which are an integral part of the financial statements.
Financial Highlights — Fidelity Focused Stock Fund
| Years ended October 31, | 2015 | 2014 | 2013 | 2012 | 2011 |
| Selected Per–Share Data | |||||
| Net asset value, beginning of period | $20.74 | $19.60 | $15.63 | $13.97 | $12.39 |
| Income from Investment Operations | |||||
| Net investment income (loss)A | .04 | (.01) | (.02) | .04 | –B |
| Net realized and unrealized gain (loss) | .24C | 2.28 | 4.81 | 1.64 | 1.58 |
| Total from investment operations | .28 | 2.27 | 4.79 | 1.68 | 1.58 |
| Distributions from net investment income | (.02) | – | (.03) | (.02) | – |
| Distributions from net realized gain | (1.92) | (1.13) | (.79) | – | – |
| Total distributions | (1.94) | (1.13) | (.82) | (.02) | – |
| Net asset value, end of period | $19.08 | $20.74 | $19.60 | $15.63 | $13.97 |
| Total ReturnD | 1.33% | 12.14% | 32.25% | 12.03% | 12.75% |
| Ratios to Average Net AssetsE,F | |||||
| Expenses before reductions | .73% | .78% | .91% | .93% | .93% |
| Expenses net of fee waivers, if any | .72% | .78% | .91% | .93% | .93% |
| Expenses net of all reductions | .72% | .78% | .89% | .92% | .92% |
| Net investment income (loss) | .18% | (.04)% | (.09)% | .26% | .03% |
| Supplemental Data | |||||
| Net assets, end of period (000 omitted) | $1,896,753 | $1,848,723 | $1,571,884 | $547,984 | $617,725 |
| Portfolio turnover rateG | 189%H | 223% | 200% | 279% | 277% |
A Calculated based on average shares outstanding during the period.
B Amount represents less than $.005 per share.
C The amount shown for a share outstanding does not correspond with the aggregate net gain (loss) on investments for the period due to the timing of sales and repurchases of shares in relation to fluctuating market values of the investments of the Fund.
D Total returns would have been lower if certain expenses had not been reduced during the applicable periods shown.
E Fees and expenses of any underlying Fidelity Central Funds are not included in the Fund's expense ratio. The Fund indirectly bears its proportionate share of the expenses of any underlying Fidelity Central Funds.
F Expense ratios reflect operating expenses of the Fund. Expenses before reductions do not reflect amounts reimbursed by the investment adviser or reductions from brokerage service arrangements or reductions from other expense offset arrangements and do not represent the amount paid by the Fund during periods when reimbursements or reductions occur. Expenses net of fee waivers reflect expenses after reimbursement by the investment adviser but prior to reductions from brokerage service arrangements or other expense offset arrangements. Expenses net of all reductions represent the net expenses paid by the Fund.
G Amount does not include the portfolio activity of any underlying Fidelity Central Funds.
H The portfolio turnover rate does not include the assets acquired in the merger.
See accompanying notes which are an integral part of the financial statements.
Notes to Financial Statements
For the period ended October 31, 2015
1. Organization.
Fidelity Focused Stock Fund (the Fund) is a fund of Fidelity Capital Trust (the Trust) and is authorized to issue an unlimited number of shares. Share transactions on the Statement of Changes in Net Assets may contain exchanges between funds. The Trust is registered under the Investment Company Act of 1940, as amended (the 1940 Act), as an open-end management investment company organized as a Massachusetts business trust.
2. Investments in Fidelity Central Funds.
The Fund invests in Fidelity Central Funds, which are open-end investment companies generally available only to other investment companies and accounts managed by the investment adviser and its affiliates. The Fund's Schedule of Investments lists each of the Fidelity Central Funds held as of period end, if any, as an investment of the Fund, but does not include the underlying holdings of each Fidelity Central Fund. As an Investing Fund, the Fund indirectly bears its proportionate share of the expenses of the underlying Fidelity Central Funds.
The Money Market Central Funds seek preservation of capital and current income and are managed by Fidelity Investments Money Management, Inc. (FIMM), an affiliate of the investment adviser. Annualized expenses of the Money Market Central Funds as of their most recent shareholder report date are less than .005%.
A complete unaudited list of holdings for each Fidelity Central Fund is available upon request or at the Securities and Exchange Commission (the SEC) website at www.sec.gov. In addition, the financial statements of the Fidelity Central Funds, which are not covered by the Fund's Report of Independent Registered Public Accounting Firm, are available on the SEC website or upon request.
3. Significant Accounting Policies.
The financial statements have been prepared in conformity with accounting principles generally accepted in the United States of America (GAAP), which require management to make certain estimates and assumptions at the date of the financial statements. Actual results could differ from those estimates. Subsequent events, if any, through the date that the financial statements were issued have been evaluated in the preparation of the financial statements. The following summarizes the significant accounting policies of the Fund:
Investment Valuation. Investments are valued as of 4:00 p.m. Eastern time on the last calendar day of the period. The Board of Trustees (the Board) has delegated the day to day responsibility for the valuation of the Fund's investments to the Fidelity Management & Research Company (FMR) Fair Value Committee (the Committee). In accordance with valuation policies and procedures approved by the Board, the Fund attempts to obtain prices from one or more third party pricing vendors or brokers to value its investments. When current market prices, quotations or currency exchange rates are not readily available or reliable, investments will be fair valued in good faith by the Committee, in accordance with procedures adopted by the Board. Factors used in determining fair value vary by investment type and may include market or investment specific events. The frequency with which these procedures are used cannot be predicted and they may be utilized to a significant extent. The Committee oversees the Fund's valuation policies and procedures and reports to the Board on the Committee's activities and fair value determinations. The Board monitors the appropriateness of the procedures used in valuing the Fund's investments and ratifies the fair value determinations of the Committee.
The Fund categorizes the inputs to valuation techniques used to value its investments into a disclosure hierarchy consisting of three levels as shown below:
- Level 1 – quoted prices in active markets for identical investments
- Level 2 – other significant observable inputs (including quoted prices for similar investments, interest rates, prepayment speeds, etc.)
- Level 3 – unobservable inputs (including the Fund's own assumptions based on the best information available)
Valuation techniques used to value the Fund's investments by major category are as follows:
Equity securities, including restricted securities, for which market quotations are readily available, are valued at the last reported sale price or official closing price as reported by a third party pricing vendor on the primary market or exchange on which they are traded and are categorized as Level 1 in the hierarchy. In the event there were no sales during the day or closing prices are not available, securities are valued at the last quoted bid price or may be valued using the last available price and are generally categorized as Level 2 in the hierarchy. For foreign equity securities, when market or security specific events arise, comparisons to the valuation of American Depositary Receipts (ADRs), futures contracts, Exchange-Traded Funds (ETFs) and certain indexes as well as quoted prices for similar securities may be used and would be categorized as Level 2 in the hierarchy. Utilizing these techniques may result in transfers between Level 1 and Level 2. For equity securities, including restricted securities, where observable inputs are limited, assumptions about market activity and risk are used and these securities may be categorized as Level 3 in the hierarchy.
Investments in open-end mutual funds, including the Fidelity Central Funds, are valued at their closing net asset value (NAV) each business day and are categorized as Level 1 in the hierarchy.
Changes in valuation techniques may result in transfers in or out of an assigned level within the disclosure hierarchy.
Foreign Currency. The Fund may use foreign currency contracts to facilitate transactions in foreign-denominated securities. Gains and losses from these transactions may arise from changes in the value of the foreign currency or if the counterparties do not perform under the contracts' terms.
Foreign-denominated assets, including investment securities, and liabilities are translated into U.S. dollars at the exchange rates at period end. Purchases and sales of investment securities, income and dividends received and expenses denominated in foreign currencies are translated into U.S. dollars at the exchange rate in effect on the transaction date.
The effects of exchange rate fluctuations on investments are included with the net realized and unrealized gain (loss) on investment securities. Other foreign currency transactions resulting in realized and unrealized gain (loss) are disclosed separately.
Investment Transactions and Income. For financial reporting purposes, the Fund's investment holdings and NAV include trades executed through the end of the last business day of the period. The NAV per share for processing shareholder transactions is calculated as of the close of business of the New York Stock Exchange (NYSE), normally 4:00 p.m. Eastern time and includes trades executed through the end of the prior business day. Gains and losses on securities sold are determined on the basis of identified cost and may include proceeds received from litigation. Dividend income is recorded on the ex-dividend date, except for certain dividends from foreign securities where the ex-dividend date may have passed, which are recorded as soon as the Fund is informed of the ex-dividend date. Non-cash dividends included in dividend income, if any, are recorded at the fair market value of the securities received. Income and capital gain distributions from Fidelity Central Funds, if any, are recorded on the ex-dividend date. Distributions received on securities that represent a return of capital or capital gain are recorded as a reduction of cost of investments and/or as a realized gain. Subsequent to ex-dividend date the Fund determines the components of these distributions, based upon receipt of tax filings or other correspondence relating to the underlying investment. Interest income is accrued as earned and includes coupon interest and amortization of premium and accretion of discount on debt securities as applicable. Investment income is recorded net of foreign taxes withheld where recovery of such taxes is uncertain.
Expenses. Expenses directly attributable to a fund are charged to that fund. Expenses attributable to more than one fund are allocated among the respective funds on the basis of relative net assets or other appropriate methods. Expense estimates are accrued in the period to which they relate and adjustments are made when actual amounts are known.
Income Tax Information and Distributions to Shareholders. Each year, the Fund intends to qualify as a regulated investment company under Subchapter M of the Internal Revenue Code, including distributing substantially all of its taxable income and realized gains. As a result, no provision for U.S. Federal income taxes is required. As of October 31, 2015, the Fund did not have any unrecognized tax benefits in the financial statements; nor is the Fund aware of any tax positions for which it is reasonably possible that the total amounts of unrecognized tax benefits will significantly change in the next twelve months. The Fund files a U.S. federal tax return, in addition to state and local tax returns as required. The Fund's federal income tax returns are subject to examination by the Internal Revenue Service (IRS) for a period of three fiscal years after they are filed. State and local tax returns may be subject to examination for an additional fiscal year depending on the jurisdiction. Foreign taxes are provided for based on the Fund's understanding of the tax rules and rates that exist in the foreign markets in which it invests.
Distributions are declared and recorded on the ex-dividend date. Income and capital gain distributions are determined in accordance with income tax regulations, which may differ from GAAP. In addition, the Fund claimed a portion of the payment made to redeeming shareholders as a distribution for income tax purposes.
Capital accounts within the financial statements are adjusted for permanent book-tax differences. These adjustments have no impact on net assets or the results of operations. Capital accounts are not adjusted for temporary book-tax differences which will reverse in a subsequent period.
Book-tax differences are primarily due to foreign currency transactions, capital loss carryforwards and losses deferred due to wash sales.
The federal tax cost of investment securities and unrealized appreciation (depreciation) as of period end were as follows:
| Gross unrealized appreciation | $228,671,272 |
| Gross unrealized depreciation | (76,238,413) |
| Net unrealized appreciation (depreciation) on securities | $152,432,859 |
| Tax Cost | $1,790,607,674 |
The tax-based components of distributable earnings as of period end were as follows:
| Undistributed ordinary income | $1,575,319 |
| Undistributed long-term capital gain | $98,437,938 |
| Net unrealized appreciation (depreciation) on securities and other investments | $152,409,793 |
The tax character of distributions paid was as follows:
| October 31, 2015 | October 31, 2014 | |||
| Ordinary Income | $63,703,475 | $50,202,321 | ||
| Long-term Capital Gains | 99,768,402 | 42,365,860 | ||
| Total | $163,471,877 | $92,568,181 |
4. Purchases and Sales of Investments.
Purchases and sales of securities, other than short-term securities and securities acquired in the merger, aggregated $2,992,000,268 and $3,641,104,229, respectively.
5. Fees and Other Transactions with Affiliates.
Management Fee. Fidelity Management & Research Company (the investment adviser) and its affiliates provide the Fund with investment management related services for which the Fund pays a monthly management fee. The management fee is the sum of an individual fund fee rate that is based on an annual rate of .30% of the Fund's average net assets and an annualized group fee rate that averaged .25% during the period. The group fee rate is based upon the average net assets of all the mutual funds advised by the investment adviser, including any mutual funds previously advised by the investment adviser that are currently advised by Fidelity SelectCo, LLC, an affiliate of the investment adviser. The group fee rate decreases as assets under management increase and increases as assets under management decrease. In addition, the management fee is subject to a performance adjustment (up to a maximum of +/- .20% of the Fund's average net assets over a 36 month performance period). The upward or downward adjustment to the management fee is based on the Fund's relative investment performance as compared to its benchmark index, the S&P 500 Index, over the same 36 month performance period. For the reporting period, the total annual management fee rate, including the performance adjustment, was .50% of the Fund's average net assets. The performance adjustment included in the management fee rate may be higher or lower than the maximum performance adjustment rate due to the difference between the average net assets for the reporting and performance periods.
Transfer Agent Fees. Fidelity Investments Institutional Operations Company, Inc. (FIIOC), an affiliate of the investment adviser, is the Fund's transfer, dividend disbursing and shareholder servicing agent. FIIOC receives account fees and asset-based fees that vary according to account size and type of account. FIIOC pays for typesetting, printing and mailing of shareholder reports, except proxy statements. For the period, the transfer agent fees were equivalent to an annual rate of .19% of average net assets.
Accounting and Security Lending Fees. Fidelity Service Company, Inc. (FSC), an affiliate of the investment adviser, maintains the Fund's accounting records. The accounting fee is based on the level of average net assets for each month. Under a separate contract, FSC administers the security lending program. The security lending fee is based on the number and duration of lending transactions.
Brokerage Commissions. The Fund placed a portion of its portfolio transactions with brokerage firms which are affiliates of the investment adviser. Brokerage commissions are included in net realized gain (loss) and change in net unrealized appreciation (depreciation) in the Statement of Operations. The commissions paid to these affiliated firms were $34,047 for the period.
Interfund Lending Program. Pursuant to an Exemptive Order issued by the SEC, the Fund, along with other registered investment companies having management contracts with Fidelity Management & Research Company (FMR) or other affiliated entities of FMR, may participate in an interfund lending program. This program provides an alternative credit facility allowing the funds to borrow from, or lend money to, other participating affiliated funds. At period end, there were no interfund loans outstanding. The Fund's activity in this program during the period for which loans were outstanding was as follows:
| Borrower or Lender | Average Loan Balance | Weighted Average Interest Rate | Interest Expense |
| Borrower | $8,294,875 | .35% | $651 |
6. Committed Line of Credit.
The Fund participates with other funds managed by the investment adviser or an affiliate in a $4.25 billion credit facility (the "line of credit") to be utilized for temporary or emergency purposes to fund shareholder redemptions or for other short-term liquidity purposes. The Fund has agreed to pay commitment fees on its pro-rata portion of the line of credit, which amounted to $2,593 and is reflected in Miscellaneous expenses on the Statement of Operations. During the period, the Fund did not borrow on this line of credit.
7. Security Lending.
The Fund lends portfolio securities through a lending agent from time to time in order to earn additional income. For equity securities, a lending agent is used and may loan securities to certain qualified borrowers, including Fidelity Capital Markets (FCM), a broker-dealer affiliated with the Fund. On the settlement date of the loan, the Fund receives collateral (in the form of U.S. Treasury obligations, letters of credit and/or cash) against the loaned securities and maintains collateral in an amount not less than 100% of the market value of the loaned securities during the period of the loan. The market value of the loaned securities is determined at the close of business of the Fund and any additional required collateral is delivered to the Fund on the next business day. The Fund or borrower may terminate the loan at any time, and if the borrower defaults on its obligation to return the securities loaned because of insolvency or other reasons, the Fund may apply collateral received from the borrower against the obligation. The Fund may experience delays and costs in recovering the securities loaned. Any cash collateral received is invested in the Fidelity Securities Lending Cash Central Fund. The value of loaned securities and cash collateral at period end are disclosed on the Fund's Statement of Assets and Liabilities. Security lending income represents the income earned on investing cash collateral, less rebates paid to borrowers and any lending agent fees associated with the loan, plus any premium payments received for lending certain types of securities. Security lending income is presented in the Statement of Operations as a component of income from Fidelity Central Funds. Total security lending income during the period amounted to $53,574. During the period, there were no securities loaned to FCM.
8. Expense Reductions.
Commissions paid to certain brokers with whom the investment adviser, or its affiliates, places trades on behalf of the Fund include an amount in addition to trade execution, which may be rebated back to the Fund to offset certain expenses. This amount totaled $93,188 for the period. In addition, through arrangements with the Fund's custodian, credits realized as a result of certain uninvested cash balances were used to reduce the Fund's expenses. During the period, these credits reduced the Fund's custody expenses by $129.
In addition, during the period the investment adviser reimbursed and/or waived a portion of operating expenses in the amount of $42,614.
9. Other.
The Fund's organizational documents provide former and current trustees and officers with a limited indemnification against liabilities arising in connection with the performance of their duties to the Fund. In the normal course of business, the Fund may also enter into contracts that provide general indemnifications. The Fund's maximum exposure under these arrangements is unknown as this would be dependent on future claims that may be made against the Fund. The risk of material loss from such claims is considered remote.
10. Merger.
On July 24, 2015, the Fund acquired all of the assets and assumed all of the liabilities of Fidelity Fifty Fund ("Target Fund") pursuant to an Agreement and Plan of Reorganization approved by the Board of Trustees ("The Board"). The acquisition was accomplished by an exchange of shares of the Fund for corresponding shares then outstanding of the Target Fund at its net asset value on the acquisition date. The reorganization provides shareholders of the Target Fund access to a larger portfolio with a similar investment objective. The reorganization qualified as a tax-free reorganization for federal income tax purposes with no gain or loss recognized to the funds or their shareholders. The Target Fund's net assets of $718,222,341, including securities of $719,256,448 and unrealized appreciation of $88,071,281, were combined with the Fund's net assets of $1,371,722,533 for total net assets after the acquisition of $2,089,944,874.
Pro forma results of operations of the combined entity for the entire period ended October 31, 2015, as though the acquisition had occurred as of the beginning of the year (rather than on the actual acquisition date), are as follows:
| Net Investment income (loss) | $4,003,226 |
| Total net realized gain (loss) | 135,476,498 |
| Total change in net unrealized appreciation (depreciation) | (108,442,345) |
| Net increase (decrease) in net assets resulting from operations | $31,037,379 |
Because the combined investment portfolios have been managed as a single portfolio since the acquisition was completed, it is not practicable to separate the amounts of revenue and earnings of the acquired fund that have been included in the Fund's accompanying Statement of Operations since July 24, 2015.
Report of Independent Registered Public Accounting Firm
To the Trustees of Fidelity Capital Trust and Shareholders of Fidelity® Focused Stock Fund:
In our opinion, the accompanying statement of assets and liabilities, including the schedule of investments, and the related statements of operations and of changes in net assets and the financial highlights present fairly, in all material respects, the financial position of Fidelity® Focused Stock Fund (a fund of Fidelity Capital Trust) at October 31, 2015, the results of its operations for the year then ended, the changes in its net assets for each of the two years in the period then ended and the financial highlights for each of the five years in the period then ended, in conformity with accounting principles generally accepted in the United States of America. These financial statements and financial highlights (hereafter referred to as “financial statements”) are the responsibility of the Fidelity® Focused Stock Fund’s management. Our responsibility is to express an opinion on these financial statements based on our audits. We conducted our audits of these financial statements in accordance with the standards of the Public Company Accounting Oversight Board (United States). Those standards require that we plan and perform the audit to obtain reasonable assurance about whether the financial statements are free of material misstatement. An audit includes examining, on a test basis, evidence supporting the amounts and disclosures in the financial statements, assessing the accounting principles used and significant estimates made by management, and evaluating the overall financial statement presentation. We believe that our audits, which included confirmation of securities at October 31, 2015 by correspondence with the custodian and brokers, provide a reasonable basis for out opinion.
PricewaterhouseCoopers LLP
Boston, Massachusetts
December 17, 2015
Trustees and Officers
The Trustees, Members of the Advisory Board (if any), and officers of the trust and fund, as applicable, are listed below. The Board of Trustees governs the fund and is responsible for protecting the interests of shareholders. The Trustees are experienced executives who meet periodically throughout the year to oversee the fund's activities, review contractual arrangements with companies that provide services to the fund, oversee management of the risks associated with such activities and contractual arrangements, and review the fund's performance. Each of the Trustees oversees 170 funds.
The Trustees hold office without limit in time except that (a) any Trustee may resign; (b) any Trustee may be removed by written instrument, signed by at least two-thirds of the number of Trustees prior to such removal; (c) any Trustee who requests to be retired or who has become incapacitated by illness or injury may be retired by written instrument signed by a majority of the other Trustees; and (d) any Trustee may be removed at any special meeting of shareholders by a two-thirds vote of the outstanding voting securities of the trust. Each Trustee who is not an interested person (as defined in the 1940 Act) of the trust and the fund is referred to herein as an Independent Trustee. Each Independent Trustee shall retire not later than the last day of the calendar year in which his or her 75th birthday occurs. The Independent Trustees may waive this mandatory retirement age policy with respect to individual Trustees. Officers and Advisory Board Members hold office without limit in time, except that any officer or Advisory Board Member may resign or may be removed by a vote of a majority of the Trustees at any regular meeting or any special meeting of the Trustees. Except as indicated, each individual has held the office shown or other offices in the same company for the past five years.
The fund’s Statement of Additional Information (SAI) includes more information about the Trustees. To request a free copy, call Fidelity at 1-800-544-8544.
Experience, Skills, Attributes, and Qualifications of the Trustees. The Governance and Nominating Committee has adopted a statement of policy that describes the experience, qualifications, attributes, and skills that are necessary and desirable for potential Independent Trustee candidates (Statement of Policy). The Board believes that each Trustee satisfied at the time he or she was initially elected or appointed a Trustee, and continues to satisfy, the standards contemplated by the Statement of Policy. The Governance and Nominating Committee also engages professional search firms to help identify potential Independent Trustee candidates who have the experience, qualifications, attributes, and skills consistent with the Statement of Policy. From time to time, additional criteria based on the composition and skills of the current Independent Trustees, as well as experience or skills that may be appropriate in light of future changes to board composition, business conditions, and regulatory or other developments, have also been considered by the professional search firms and the Governance and Nominating Committee. In addition, the Board takes into account the Trustees' commitment and participation in Board and committee meetings, as well as their leadership of standing and ad hoc committees throughout their tenure.
In determining that a particular Trustee was and continues to be qualified to serve as a Trustee, the Board has considered a variety of criteria, none of which, in isolation, was controlling. The Board believes that, collectively, the Trustees have balanced and diverse experience, qualifications, attributes, and skills, which allow the Board to operate effectively in governing the fund and protecting the interests of shareholders. Information about the specific experience, skills, attributes, and qualifications of each Trustee, which in each case led to the Board's conclusion that the Trustee should serve (or continue to serve) as a trustee of the fund, is provided below.
Board Structure and Oversight Function. James C. Curvey is an interested person and currently serves as Chairman. The Trustees have determined that an interested Chairman is appropriate and benefits shareholders because an interested Chairman has a personal and professional stake in the quality and continuity of services provided to the fund. Independent Trustees exercise their informed business judgment to appoint an individual of their choosing to serve as Chairman, regardless of whether the Trustee happens to be independent or a member of management. The Independent Trustees have determined that they can act independently and effectively without having an Independent Trustee serve as Chairman and that a key structural component for assuring that they are in a position to do so is for the Independent Trustees to constitute a substantial majority for the Board. The Independent Trustees also regularly meet in executive session. Ned C. Lautenbach serves as Chairman of the Independent Trustees and as such (i) acts as a liaison between the Independent Trustees and management with respect to matters important to the Independent Trustees and (ii) with management prepares agendas for Board meetings.
Fidelity® funds are overseen by different Boards of Trustees. The fund's Board oversees Fidelity's high income and certain equity funds, and other Boards oversee Fidelity's investment-grade bond, money market, asset allocation, and sector funds. The asset allocation funds may invest in Fidelity® funds overseen by the fund's Board. The use of separate Boards, each with its own committee structure, allows the Trustees of each group of Fidelity® funds to focus on the unique issues of the funds they oversee, including common research, investment, and operational issues. On occasion, the separate Boards establish joint committees to address issues of overlapping consequences for the Fidelity® funds overseen by each Board.
The Trustees operate using a system of committees to facilitate the timely and efficient consideration of all matters of importance to the Trustees, the fund, and fund shareholders and to facilitate compliance with legal and regulatory requirements and oversight of the fund's activities and associated risks. The Board, acting through its committees, has charged FMR and its affiliates with (i) identifying events or circumstances the occurrence of which could have demonstrably adverse effects on the fund's business and/or reputation; (ii) implementing processes and controls to lessen the possibility that such events or circumstances occur or to mitigate the effects of such events or circumstances if they do occur; and (iii) creating and maintaining a system designed to evaluate continuously business and market conditions in order to facilitate the identification and implementation processes described in (i) and (ii) above. Because the day-to-day operations and activities of the fund are carried out by or through FMR, its affiliates, and other service providers, the fund's exposure to risks is mitigated but not eliminated by the processes overseen by the Trustees. While each of the Board's committees has responsibility for overseeing different aspects of the fund's activities, oversight is exercised primarily through the Operations, Audit, and Compliance Committees. In addition, the Independent Trustees have worked with FMR to enhance the Board's oversight of investment and financial risks, legal and regulatory risks, technology risks, and operational risks, including the development of additional risk reporting to the Board. For example, a working group comprised of Independent Trustees and FMR has worked and continues to work to review the Fidelity® funds' valuation-related activities, reporting and risk management. Appropriate personnel, including but not limited to the fund's Chief Compliance Officer (CCO), FMR's internal auditor, the independent accountants, the fund's Treasurer and portfolio management personnel, make periodic reports to the Board's committees, as appropriate, including an annual review of Fidelity's risk management program for the Fidelity® funds. The responsibilities of each standing committee, including their oversight responsibilities, are described further under "Standing Committees of the Trustees."
Interested Trustees*:
Correspondence intended for a Trustee who is an interested person may be sent to Fidelity Investments, 245 Summer Street, Boston, Massachusetts 02210.
Name, Year of Birth; Principal Occupations and Other Relevant Experience+
James C. Curvey (1935)
Year of Election or Appointment: 2007
Trustee
Chairman of the Board of Trustees
Mr. Curvey also serves as Trustee of other Fidelity® funds. Mr. Curvey is a Director of Fidelity Research & Analysis Co. (investment adviser firm, 2009-present), and Vice Chairman (2007-present) and Director of FMR LLC (diversified financial services company). In addition, Mr. Curvey serves as an Overseer for the Boston Symphony Orchestra and a member of the board of Artis-Naples, Naples, Florida, and as a Trustee for Brewster Academy, Wolfeboro, New Hampshire. Previously, Mr. Curvey served as a Director of Fidelity Investments Money Management, Inc. (investment adviser firm, 2009-2014) and a Director of FMR and FMR Co., Inc. (investment adviser firms, 2007-2014).
Charles S. Morrison (1960)
Year of Election or Appointment: 2014
Trustee
Mr. Morrison also serves as Trustee of other funds. He serves as a Director of Fidelity Investments Money Management, Inc. (FIMM) (investment adviser firm, 2014-present), Director of Fidelity SelectCo, LLC (investment adviser firm, 2014-present), President, Asset Management (2014-present), and is an employee of Fidelity Investments. Previously, Mr. Morrison served as Vice President of Fidelity's Fixed Income and Asset Allocation Funds (2012-2014), President, Fixed Income (2011-2014), Vice President of Fidelity's Money Market Funds (2005-2009), President, Money Market Group Leader of FMR (investment adviser firm, 2009), and Senior Vice President, Money Market Group of FMR (2004-2009). Mr. Morrison also served as Vice President of Fidelity's Bond Funds (2002-2005), certain Balanced Funds (2002-2005), and certain Asset Allocation Funds (2002-2007), and as Senior Vice President (2002-2005) of Fidelity's Bond Division.
* Determined to be an “Interested Trustee” by virtue of, among other things, his or her affiliation with the trust or various entities under common control with FMR.
+ The information includes the Trustee's principal occupation during the last five years and other information relating to the experience, attributes, and skills relevant to the Trustee's qualifications to serve as a Trustee, which led to the conclusion that the Trustee should serve as a Trustee for the fund.
Independent Trustees:
Correspondence intended for an Independent Trustee may be sent to Fidelity Investments, P.O. Box 55235, Boston, Massachusetts 02205-5235.
Name, Year of Birth; Principal Occupations and Other Relevant Experience+
Dennis J. Dirks (1948)
Year of Election or Appointment: 2005
Trustee
Mr. Dirks also serves as Trustee of other Fidelity® funds. Prior to his retirement in May 2003, Mr. Dirks was Chief Operating Officer and a member of the Board of The Depository Trust & Clearing Corporation (DTCC). He also served as President, Chief Operating Officer, and Board member of The Depository Trust Company (DTC) and President and Board member of the National Securities Clearing Corporation (NSCC). In addition, Mr. Dirks served as Chief Executive Officer and Board member of the Government Securities Clearing Corporation, Chief Executive Officer and Board member of the Mortgage-Backed Securities Clearing Corporation, as a Trustee and a member of the Finance Committee of Manhattan College (2005-2008), as a Trustee and a member of the Finance Committee of AHRC of Nassau County (2006-2008), and as a member of the Independent Directors Council (IDC) Governing Council (2010-2015). Mr. Dirks is a member of the Board of Directors for The Brookville Center for Children's Services, Inc. (2009-present).
Alan J. Lacy (1953)
Year of Election or Appointment: 2008
Trustee
Mr. Lacy also serves as Trustee of other Fidelity® funds. Mr. Lacy serves as a member of the Board of Directors of Dave & Buster's Entertainment, Inc. (restaurant and entertainment complexes, 2010-present) and Bristol-Myers Squibb Company (global pharmaceuticals, 2008-present). In addition, Mr. Lacy served as Senior Adviser (2007-2014) of Oak Hill Capital Partners, L.P. (private equity) and also served as Chief Executive Officer (2000-2005) and Vice Chairman (2005-2006) of Sears Holdings Corporation and Sears, Roebuck and Co. (retail). Mr. Lacy is a member of the Board of Trustees of The National Parks Conservation Association (2006-present). Previously, Mr. Lacy served as Chairman of the Board of Trustees of the National Parks Conservation Association (2008-2011) and as a member of the Board of Directors for The Western Union Company (global money transfer, 2006-2011), The Hillman Companies, Inc. (hardware wholesalers, 2010-2014), and Earth Fare, Inc. (retail grocery, 2010-2014).
Ned C. Lautenbach (1944)
Year of Election or Appointment: 2000
Trustee
Chairman of the Independent Trustees
Mr. Lautenbach also serves as Trustee of other Fidelity® funds. Mr. Lautenbach currently serves as the Lead Director of the Eaton Corporation Board of Directors (diversified industrial, 1997-present). Mr. Lautenbach is Chairman of the Board of Directors of Artis-Naples in Naples, Florida (2012-present), a member of the Council on Foreign Relations (1994-present), and a member of the Board of Governors, State University System of Florida (2013-present). Previously, Mr. Lautenbach was a Partner/Advisory Partner at Clayton, Dubilier & Rice, LLC (private equity investment, 1998-2010), as well as a Director of Sony Corporation (2006-2007).
Joseph Mauriello (1944)
Year of Election or Appointment: 2008
Trustee
Mr. Mauriello also serves as Trustee of other Fidelity® funds. Prior to his retirement in January 2006, Mr. Mauriello served in numerous senior management positions including Deputy Chairman and Chief Operating Officer (2004-2005), and Vice Chairman of Financial Services (2002-2004) of KPMG LLP US (professional services, 1965-2005). Mr. Mauriello currently serves as a member of the Board of Directors of XL Group plc. (global insurance and re-insurance, 2006-present) and the Independent Directors Council (IDC) Governing Council (2015-present). Previously, Mr. Mauriello served as a Director of the Hamilton Funds of the Bank of New York (2006-2007) and of Arcadia Resources Inc. (health care services and products, 2007-2012).
Robert W. Selander (1950)
Year of Election or Appointment: 2011
Trustee
Mr. Selander also serves as Trustee of other Fidelity® funds. Mr. Selander serves as a Director of The Western Union Company (global money transfer, 2014-present). Previously, Mr. Selander served as a Member of the Advisory Board of other Fidelity® funds (2011), and Executive Vice Chairman (2010), Chief Executive Officer (2009-2010), and President and Chief Executive Officer (1997-2009) of Mastercard, Inc.
Cornelia M. Small (1944)
Year of Election or Appointment: 2005
Trustee
Ms. Small also serves as Trustee of other Fidelity® funds. Ms. Small is a member of the Board of Directors (2009-present) and Chair of the Investment Committee (2010-present) of the Teagle Foundation. Ms. Small also serves on the Investment Committee of the Berkshire Taconic Community Foundation (2008-present). Previously, Ms. Small served as Chairperson (2002-2008) and a member of the Investment Committee and Chairperson (2008-2012) and a member of the Board of Trustees of Smith College. In addition, Ms. Small served as Chief Investment Officer, Director of Global Equity Investments, and a member of the Board of Directors of Scudder, Stevens & Clark and Scudder Kemper Investments.
William S. Stavropoulos (1939)
Year of Election or Appointment: 2002
Trustee
Vice Chairman of the Independent Trustees
Mr. Stavropoulos also serves as Trustee of other Fidelity® funds. Mr. Stavropoulos serves as President and Founder of the Michigan Baseball Foundation, the Great Lakes Loons (2007-present). Mr. Stavropoulos is Chairman Emeritus of the Board of Directors of The Dow Chemical Company, where he previously served in numerous senior management positions, including President, CEO (1995-2000; 2002-2004), Chairman of the Executive Committee (2000-2006), and as a member of the Board of Directors (1990-2006). Currently, Mr. Stavropoulos is Chairman of the Board of Directors of Univar Inc. (global distributor of commodity and specialty chemicals), a Director of Teradata Corporation (data warehousing and technology solutions), and Maersk Inc. (industrial conglomerate), and a member of the Advisory Board for Metalmark Capital LLC (private equity investment, 2005-present). Mr. Stavropoulos is an operating advisor to Clayton, Dubilier & Rice, LLC (private equity investment). In addition, Mr. Stavropoulos is a member of the University of Notre Dame Advisory Council for the College of Science, a Trustee of the Rollin L. Gerstacker Foundation, and a Director of the Naples Philharmonic Center for the Arts. Previously, Mr. Stavropoulos served as a Director of Chemical Financial Corporation (bank holding company, 1993-2012) and Tyco International, Ltd. (multinational manufacturing and services, 2007-2012).
David M. Thomas (1949)
Year of Election or Appointment: 2008
Trustee
Mr. Thomas also serves as Trustee of other Fidelity® funds. Mr. Thomas serves as Non-Executive Chairman of the Board of Directors of Fortune Brands Home and Security (home and security products, 2011-present), as a member of the Board of Directors (2004-present) and Presiding Director (2013-present) of Interpublic Group of Companies, Inc. (marketing communication), and as a member of the Board of Trustees of the University of Florida (2013-present). Previously, Mr. Thomas served as Executive Chairman (2005-2006) and Chairman and Chief Executive Officer (2000-2005) of IMS Health, Inc. (pharmaceutical and healthcare information solutions), and a Director of Fortune Brands, Inc. (consumer products, 2000-2011).
+ The information includes the Trustee's principal occupation during the last five years and other information relating to the experience, attributes, and skills relevant to the Trustee's qualifications to serve as a Trustee, which led to the conclusion that the Trustee should serve as a Trustee for the fund.
Advisory Board Members and Officers:
Correspondence intended for an officer or Peter S. Lynch may be sent to Fidelity Investments, 245 Summer Street, Boston, Massachusetts 02210. Officers appear below in alphabetical order.
Name, Year of Birth; Principal Occupation
Peter S. Lynch (1944)
Year of Election or Appointment: 2003
Member of the Advisory Board
Mr. Lynch also serves as Member of the Advisory Board of other Fidelity® funds. Mr. Lynch is Vice Chairman and a Director of FMR (investment adviser firm) and FMR Co., Inc. (investment adviser firm). In addition, Mr. Lynch serves as a Trustee of Boston College and as the Chairman of the Inner-City Scholarship Fund. Previously, Mr. Lynch served on the Special Olympics International Board of Directors (1997-2006).
Elizabeth Paige Baumann (1968)
Year of Election or Appointment: 2012
Anti-Money Laundering (AML) Officer
Ms. Baumann also serves as AML Officer of other funds. She is Chief AML Officer of FMR LLC (diversified financial services company, 2012-present) and is an employee of Fidelity Investments. Previously, Ms. Baumann served as Vice President and Deputy Anti-Money Laundering Officer (2007-2012).
Marc R. Bryant (1966)
Year of Election or Appointment: 2015
Secretary and Chief Legal Officer (CLO)
Mr. Bryant also serves as Secretary and CLO of other funds. Mr. Bryant serves as CLO, Secretary, and Senior Vice President of Fidelity Management & Research Company (investment adviser firm, 2015-present) and FMR Co., Inc. (investment adviser firm, 2015-present); Secretary of Fidelity SelectCo, LLC (investment adviser firm, 2015-present) and Fidelity Investments Money Management, Inc. (investment adviser firm, 2015-present); and CLO of Fidelity Management & Research (Hong Kong) Limited (investment adviser firm, 2015-present). He is Senior Vice President and Deputy General Counsel of FMR LLC (diversified financial services company). Previously, Mr. Bryant served as Secretary and Chief Legal Officer of Fidelity Rutland Square Trust II (2010-2014) and Assistant Secretary of Fidelity's Fixed Income and Asset Allocation Funds (2013-2015). Prior to joining Fidelity Investments, Mr. Bryant served as a Senior Vice President and the Head of Global Retail Legal for AllianceBernstein L.P. (2006-2010), and as the General Counsel for ProFund Advisors LLC (2001-2006).
William C. Coffey (1969)
Year of Election or Appointment: 2009
Assistant Secretary
Mr. Coffey also serves as Assistant Secretary of other funds. He is Senior Vice President and Deputy General Counsel of FMR LLC (diversified financial services company, 2010-present), and is an employee of Fidelity Investments. Previously, Mr. Coffey served as Vice President and Associate General Counsel of FMR LLC (2005-2009).
Jonathan Davis (1968)
Year of Election or Appointment: 2010
Assistant Treasurer
Mr. Davis also serves as Assistant Treasurer of other funds, and is an employee of Fidelity Investments. Previously, Mr. Davis served as Vice President and Associate General Counsel of FMR LLC (diversified financial services company, 2003-2010).
Adrien E. Deberghes (1967)
Year of Election or Appointment: 2008
Deputy Treasurer
Mr. Deberghes also serves as an officer of other funds. He is an employee of Fidelity Investments (2008-present). Prior to joining Fidelity Investments, Mr. Deberghes was Senior Vice President of Mutual Fund Administration at State Street Corporation (2007-2008), Senior Director of Mutual Fund Administration at Investors Bank & Trust (2005-2007), and Director of Finance for Dunkin' Brands (2000-2005).
Stephanie J. Dorsey (1969)
Year of Election or Appointment: 2010
Assistant Treasurer
Ms. Dorsey also serves as an officer of other funds. She is an employee of Fidelity Investments (2008-present) and has served in other fund officer roles. Prior to joining Fidelity Investments, Ms. Dorsey served as Treasurer (2004-2008) of the JPMorgan Mutual Funds and Vice President (2004-2008) of JPMorgan Chase Bank.
Howard J. Galligan III (1966)
Year of Election or Appointment: 2014
Chief Financial Officer
Mr. Galligan also serves as Chief Financial Officer of other funds. Mr. Galligan serves as President of Fidelity Pricing and Cash Management Services (FPCMS) (2014-present) and as a Director of Strategic Advisers, Inc. (investment adviser firm, 2008-present). Previously, Mr. Galligan served as Chief Administrative Officer of Asset Management (2011-2014) and Chief Operating Officer and Senior Vice President of Investment Support for Strategic Advisers, Inc. (2003-2011).
Scott C. Goebel (1968)
Year of Election or Appointment: 2015
Vice President
Mr. Goebel serves as Vice President of other funds and is an employee of Fidelity Investments (2001-present). Previously, Mr. Goebel served as Secretary of Fidelity SelectCo, LLC (investment adviser firm, 2013-2015), Fidelity Investments Money Management, Inc. (FIMM) (investment adviser firm, 2010-2015), and Fidelity Research and Analysis Company (FRAC) (investment adviser firm, 2010-2015); General Counsel, Secretary, and Senior Vice President of Fidelity Management & Research Company (investment adviser firm, 2008-2015) and FMR Co., Inc. (investment adviser firm, 2008-2015); Assistant Secretary of Fidelity Management & Research (Japan) Limited (investment adviser firm, 2008-2015) and FMR Investment Management (U.K.) Limited (investment adviser firm, 2008-2015); Chief Legal Officer (CLO) of Fidelity Management & Research (Hong Kong) Limited (investment adviser firm, 2008-2015); Secretary and CLO of certain Fidelity® funds (2008-2015); Assistant Secretary of FIMM (2008-2010), FRAC (2008-2010), and certain funds (2007-2008); and as Vice President and Secretary of Fidelity Distributors Corporation (FDC) (2005-2007).
Brian B. Hogan (1964)
Year of Election or Appointment: 2009
Vice President
Mr. Hogan also serves as Trustee or Vice President of other funds. Mr. Hogan serves as a Director of Fidelity SelectCo, LLC (investment adviser firm, 2014-present) and President of the Equity Division of FMR (investment adviser firm, 2009-present). Previously, Mr. Hogan served as Senior Vice President, Equity Research of FMR (2006-2009) and as a portfolio manager.
Chris Maher (1972)
Year of Election or Appointment: 2013
Assistant Treasurer
Mr. Maher serves as Assistant Treasurer of other funds. Mr. Maher is Vice President of Valuation Oversight and is an employee of Fidelity Investments. Previously, Mr. Maher served as Vice President of Asset Management Compliance (2013), Vice President of the Program Management Group of FMR (investment adviser firm, 2010-2013), and Vice President of Valuation Oversight (2008-2010).
Melissa M. Reilly (1971)
Year of Election or Appointment: 2014
Vice President of certain Equity Funds
Ms. Reilly also serves as Vice President of other funds. Ms. Reilly is an employee of Fidelity Investments (2004-present).
Kenneth B. Robins (1969)
Year of Election or Appointment: 2008
President and Treasurer
Mr. Robins also serves as an officer of other funds. Mr. Robins serves as Executive Vice President of Fidelity Investments Money Management, Inc. (FIMM) (investment adviser firm, 2013-present) and is an employee of Fidelity Investments (2004-present). Previously, Mr. Robins served in other fund officer roles.
Stacie M. Smith (1974)
Year of Election or Appointment: 2013
Deputy Treasurer
Ms. Smith also serves as an officer of other funds. She is an employee of Fidelity Investments (2009-present) and has served in other fund officer roles. Prior to joining Fidelity Investments, Ms. Smith served as Senior Audit Manager of Ernst & Young LLP (1996-2009).
Renee Stagnone (1975)
Year of Election or Appointment: 2013
Deputy Treasurer
Ms. Stagnone also serves as Deputy Treasurer of other funds. Ms. Stagnone is an employee of Fidelity Investments (1997-present).
Linda J. Wondrack (1964)
Year of Election or Appointment: 2014
Chief Compliance Officer
Ms. Wondrack also serves as Chief Compliance Officer of other funds. Ms. Wondrack is Executive Vice President and head of the Ethics Office and Asset Management Compliance for Fidelity Investments (2012-present). Ms. Wondrack also serves as Chief Compliance Officer of Fidelity SelectCo, LLC (investment adviser firm, 2014-present); Chief Compliance Officer of Impresa Management LLC (2013-present); and Chief Compliance Officer of FMR Co., Inc. (investment adviser firm), Fidelity Investments Money Management, Inc. (investment adviser firm), Fidelity Management & Research (Japan) Limited (investment adviser firm), FMR Investment Management (U.K.) Limited (investment adviser firm), Fidelity Management & Research (Hong Kong) (investment adviser firm), Fidelity Management & Research Company (investment adviser firm), FIAM LLC (investment adviser firm), and Strategic Advisers, Inc. (investment adviser firm), Ballyrock Investment Advisors LLC, and Northern Neck Investors LLC (2012-present). Previously, Ms. Wondrack served as Senior Vice President and Chief Compliance Officer for Columbia Management Investment Advisers, LLC (2005-2012); Chief Compliance Officer for certain funds within the Columbia Family of Funds (2007-2012); and Senior Vice President of Compliance Risk Management at Bank of America (2005-2010).
Joseph F. Zambello (1957)
Year of Election or Appointment: 2011
Deputy Treasurer
Mr. Zambello also serves as Deputy Treasurer of other funds. Mr. Zambello is an employee of Fidelity Investments (1991-present). Previously, Mr. Zambello served as Vice President of the Program Management Group of FMR (investment adviser firm, 2009-2011) and Vice President of the Transfer Agent Oversight Group (2005-2009).
Shareholder Expense Example
As a shareholder of the Fund, you incur two types of costs: (1) transaction costs, and (2) ongoing costs, including management fees and other Fund expenses. This Example is intended to help you understand your ongoing costs (in dollars) of investing in the Fund and to compare these costs with the ongoing costs of investing in other mutual funds.
The Example is based on an investment of $1,000 invested at the beginning of the period and held for the entire period (May 1, 2015 to October 31, 2015).
Actual Expenses
The first line of the accompanying table provides information about actual account values and actual expenses. You may use the information in this line, together with the amount you invested, to estimate the expenses that you paid over the period. Simply divide your account value by $1,000.00 (for example, an $8,600 account value divided by $1,000.00 = 8.6), then multiply the result by the number in the first line under the heading entitled "Expenses Paid During Period" to estimate the expenses you paid on your account during this period. A small balance maintenance fee of $12.00 that is charged once a year may apply for certain accounts with a value of less than $2,000. This fee is not included in the table below. If it was, the estimate of expenses you paid during the period would be higher, and your ending account value lower, by this amount. In addition, the Fund, as a shareholder in the underlying Fidelity Central Funds, will indirectly bear its pro-rata share of the fees and expenses incurred by the underlying Fidelity Central Funds. These fees and expenses are not included in the Fund's annualized expense ratio used to calculate the expense estimate in the table below.
Hypothetical Example for Comparison Purposes
The second line of the accompanying table provides information about hypothetical account values and hypothetical expenses based on the Fund's actual expense ratio and an assumed rate of return of 5% per year before expenses, which is not the Fund's actual return. The hypothetical account values and expenses may not be used to estimate the actual ending account balance or expenses you paid for the period. You may use this information to compare the ongoing costs of investing in the Fund and other funds. To do so, compare this 5% hypothetical example with the 5% hypothetical examples that appear in the shareholder reports of the other funds. A small balance maintenance fee of $12.00 that is charged once a year may apply for certain accounts with a value of less than $2,000. This fee is not included in the table below. If it was, the estimate of expenses you paid during the period would be higher, and your ending account value lower, by this amount. In addition, the Fund, as a shareholder in the underlying Fidelity Central Funds, will indirectly bear its pro-rata share of the fees and expenses incurred by the underlying Fidelity Central Funds. These fees and expenses are not included in the Fund's annualized expense ratio used to calculate the expense estimate in the table below.
Please note that the expenses shown in the table are meant to highlight your ongoing costs only and do not reflect any transaction costs. Therefore, the second line of the table is useful in comparing ongoing costs only, and will not help you determine the relative total costs of owning different funds.
| Annualized Expense Ratio-A | Beginning Account Value May 1, 2015 | Ending Account Value October 31, 2015 | Expenses Paid During Period-B May 1, 2015 to October 31, 2015 | |
| Actual | .75% | $1,000.00 | $997.90 | $3.78 |
| Hypothetical-C | $1,000.00 | $1,021.42 | $3.82 |
A Annualized expense ratio reflects expenses net of applicable fee waivers.
B Expenses are equal to the Fund's annualized expense ratio, multiplied by the average account value over the period, multiplied by 184/365 (to reflect the one-half year period).
C 5% return per year before expenses
Distributions (Unaudited)
The Board of Trustees of Fidelity Focused Stock Fund voted to pay on December 7, 2015, to shareholders of record at the opening of business on December 4, 2015, a distribution of $1.017 per share derived from capital gains realized from sales of portfolio securities and a dividend of $.045 per share from net investment income.
The fund hereby designates as a capital gain dividend with respect to the taxable year ended October 31, 2015, $111,924,101, or, if subsequently determined to be different, the net capital gain of such year.
The fund designates 22% of the dividend distributed during the fiscal year as qualifying for the dividends–received deduction for corporate shareholders.
The fund designates 23% of the dividends distributed in December during the fiscal year as amounts which may be taken into account as a dividend for the purposes of the maximum rate under section 1(h)(11) of the Internal Revenue Code.
The fund will notify shareholders in January 2016 of amounts for use in preparing 2015 income tax returns.
Board Approval of Investment Advisory Contracts and Management Fees
Fidelity Focused Stock Fund
Each year, the Board of Trustees, including the Independent Trustees (together, the Board), votes on the renewal of the management contract with Fidelity Management & Research Company (FMR) and the sub-advisory agreements (together, the Advisory Contracts) for the fund. The Board, assisted by the advice of fund counsel and Independent Trustees' counsel, requests and considers a broad range of information relevant to the renewal of the Advisory Contracts throughout the year.
The Board meets regularly and, at each of its meetings, covers an extensive agenda of topics and materials and considers factors that are relevant to its annual consideration of the renewal of the fund's Advisory Contracts, including the services and support provided to the fund and its shareholders. The Board has established various standing committees (Committees), each composed of and chaired by Independent Trustees with varying backgrounds, to which the Board has assigned specific subject matter responsibilities in order to enhance effective decision-making by the Board. The Board, acting directly and through its Committees, requests and receives information concerning the annual consideration of the renewal of the fund's Advisory Contracts. The Board also meets as needed to consider matters specifically related to the Board's annual consideration of the renewal of the Advisory Contracts. Members of the Board may also meet with trustees of other Fidelity funds through ad hoc joint committees to discuss certain matters relevant to all of the Fidelity funds.
At its July 2015 meeting, the Board unanimously determined to renew the fund's Advisory Contracts. In reaching its determination, the Board considered all factors it believed relevant, including (i) the nature, extent, and quality of the services to be provided to the fund and its shareholders (including the investment performance of the fund); (ii) the competitiveness of the fund's management fee and total expense ratio relative to peer funds; (iii) the total costs of the services to be provided by and the profits to be realized by Fidelity from its relationship with the fund; and (iv) the extent to which (if any) economies of scale exist and would be realized as the fund grows, and whether any economies of scale are appropriately shared with fund shareholders.
In considering whether to renew the Advisory Contracts for the fund, the Board reached a determination, with the assistance of fund counsel and Independent Trustees' counsel and through the exercise of its business judgment, that the renewal of the Advisory Contracts was in the best interests of the fund and its shareholders and that the compensation payable under the Advisory Contracts was fair and reasonable. The Board's decision to renew the Advisory Contracts was not based on any single factor, but rather was based on a comprehensive consideration of all the information provided to the Board at its meetings throughout the year. The Board, in reaching its determination to renew the Advisory Contracts, was aware that shareholders of the fund have a broad range of investment choices available to them, including a wide choice among funds offered by Fidelity's competitors, and that the fund's shareholders, who have the opportunity to review and weigh the disclosure provided by the fund in its prospectus and other public disclosures, have chosen to invest in this fund, which is part of the Fidelity family of funds.
Nature, Extent, and Quality of Services Provided. The Board considered Fidelity's staffing as it relates to the fund, including the backgrounds of investment personnel of Fidelity, and also considered the fund's investment objective, strategies, and related investment philosophy. The Independent Trustees also had discussions with senior management of Fidelity's investment operations and investment groups. The Board considered the structure of the portfolio manager compensation program and whether this structure provides appropriate incentives to act in the best interests of the fund. Additionally, the Board considered the portfolio managers' investments, if any, in the funds that they manage.Resources Dedicated to Investment Management and Support Services. The Board and the Fund Oversight and Research Committees reviewed the general qualifications and capabilities of Fidelity's investment staff, including its size, education, experience, and resources, as well as Fidelity's approach to recruiting, training, managing, and compensating investment personnel. The Board noted that Fidelity has continued to increase the resources devoted to non-U.S. offices, including expansion of Fidelity's global investment organization. The Board also noted that Fidelity's analysts have extensive resources, tools and capabilities that allow them to conduct sophisticated quantitative and fundamental analysis, as well as credit analysis of issuers, counterparties and guarantors. Further, the Board considered that Fidelity's investment professionals have sufficient access to global information and data so as to provide competitive investment results over time, and that those professionals also have access to sophisticated tools that permit them to assess portfolio construction and risk and performance attribution characteristics continuously, as well as to transmit new information and research conclusions rapidly around the world. Additionally, in its deliberations, the Board considered Fidelity's trading, risk management, and compliance capabilities and resources, which are integral parts of the investment management process.Shareholder and Administrative Services. The Board considered (i) the nature, extent, quality, and cost of advisory, administrative, and shareholder services performed by FMR, the sub-advisers (together with FMR, the Investment Advisers), and their affiliates under the Advisory Contracts and under separate agreements covering transfer agency, pricing and bookkeeping, and securities lending services for the fund; (ii) the nature and extent of the supervision of third party service providers, principally custodians and subcustodians; and (iii) the resources devoted to, and the record of compliance with, the fund's compliance policies and procedures. The Board also reviewed the allocation of fund brokerage, including allocations to brokers affiliated with the Investment Advisers, the use of brokerage commissions to pay fund expenses, and the use of "soft" commission dollars to pay for research services.The Board noted that the growth of fund assets over time across the complex allows Fidelity to reinvest in the development of services designed to enhance the value or convenience of the Fidelity funds as investment vehicles. These services include 24-hour access to account information and market information through telephone representatives and over the Internet, investor education materials and asset allocation tools, and the expanded availability of Fidelity Investor Centers.In 2014, the Board formed an ad hoc Committee on Transfer Agency Fees to review the variety of transfer agency fee structures throughout the industry and Fidelity's competitive positioning with respect to industry participants.Investment in a Large Fund Family. The Board considered the benefits to shareholders of investing in a Fidelity fund, including the benefits of investing in a fund that is part of a large family of funds offering a variety of investment disciplines and providing a large variety of mutual fund investor services. The Board noted that Fidelity had taken, or had made recommendations that resulted in the Fidelity funds taking, a number of actions over the previous year that benefited particular funds, including (i) continuing to dedicate additional resources to investment research and to the support of the senior management team that oversees asset management; (ii) continuing efforts to enhance Fidelity's global research capabilities; (iii) launching new funds and making other enhancements to meet client needs; (iv) reducing management fees and total expenses for certain index funds and diversified international funds; (v) continuing to launch dedicated lower cost underlying funds to meet portfolio construction needs related to expanding underlying fund options for Fidelity funds of funds, specifically for the Freedom Fund product lines; (vi) rationalizing product lines and gaining increased efficiencies through fund mergers; (vii) launching active fixed-income exchange-traded funds; (viii) continuing to develop, acquire and implement systems and technology to improve services to the funds and information security and to increase efficiency; (ix) implementing investment enhancements to further strengthen Fidelity's target date product line to increase investors' probability of success in achieving their goals; (x) modifying the eligibility criteria for certain share classes to accommodate roll-over assets from employer-sponsored retirement plans; (xi) launching a new Class W of the Freedom Index Funds to attract and retain Fidelity record-kept retirement plan assets; and (xii) implementing changes to Fidelity's money market product line in response to recent money market regulatory reforms.Investment Performance. The Board considered whether the fund has operated in accordance with its investment objective, as well as its record of compliance with its investment restrictions and its performance history.The Board took into account discussions with representatives of the Investment Advisers about fund investment performance that occur at Board meetings throughout the year. In this regard the Board noted that as part of regularly scheduled fund reviews and other reports to the Board on fund performance, the Board considers annualized return information for the fund, for different time periods, measured against a securities market index ("benchmark index") and a peer group of funds with similar objectives ("peer group"), if any. In its evaluation of fund investment performance, the Board gave particular attention to information indicating changes in performance of certain Fidelity funds for specific time periods and discussed with the Investment Advisers the reasons for any overperformance or underperformance.In addition to reviewing absolute and relative fund performance, the Independent Trustees periodically consider the appropriateness of fund performance metrics in evaluating the results achieved. In general, the Independent Trustees believe that fund performance should be evaluated based on net performance (after fees and expenses) of both the highest performing and lowest performing fund share classes, where applicable, compared to appropriate benchmark indices, over appropriate time periods that may include full market cycles, and compared to peer groups, as applicable, over the same periods, taking into account relevant factors including the following: general market conditions; issuer-specific information; and fund cash flows and other factors.The Independent Trustees recognize that shareholders evaluate performance on a net basis over their own holding periods, for which one-, three-, and five-year periods are often used as a proxy. For this reason, the performance information reviewed by the Board also included net cumulative calendar year total return information for the fund and an appropriate benchmark index and peer group for the most recent one-, three-, and five-year periods, as shown below. Returns are shown compared to the 25th percentile (top of box, 75% beaten) and 75th percentile (bottom of box, 25% beaten) of the peer universe.Fidelity Focused Stock Fund
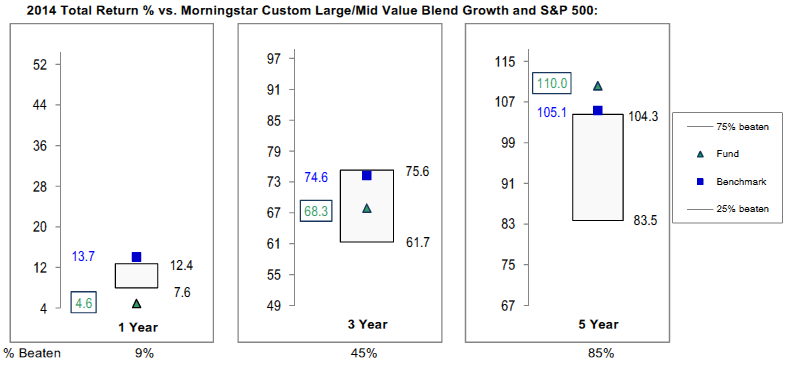
Fidelity Focused Stock Fund
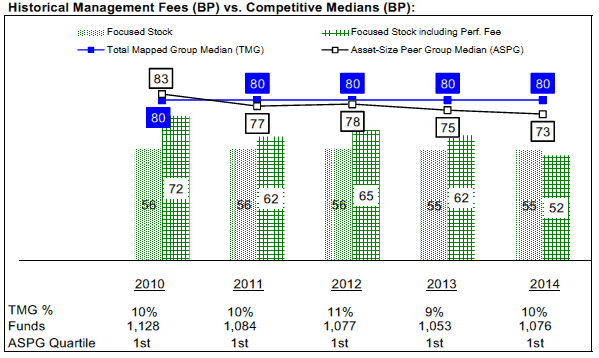
![]()
Corporate Headquarters
245 Summer St.
Boston, MA 02210
www.fidelity.com
TQG-ANN-1215
1.538682.118
Fidelity® Value Fund Annual Report October 31, 2015 |
|
Contents
Board Approval of Investment Advisory Contracts and Management Fees |
To view a fund's proxy voting guidelines and proxy voting record for the 12-month period ended June 30, visit http://www.fidelity.com/proxyvotingresults or visit the Securities and Exchange Commission's (SEC) web site at http://www.sec.gov.
You may also call 1-800-544-8544 to request a free copy of the proxy voting guidelines.
Standard & Poor's, S&P and S&P 500 are registered service marks of The McGraw-Hill Companies, Inc. and have been licensed for use by Fidelity Distributors Corporation.
Other third-party marks appearing herein are the property of their respective owners.
All other marks appearing herein are registered or unregistered trademarks or service marks of FMR LLC or an affiliated company. © 2015 FMR LLC. All rights reserved.
This report and the financial statements contained herein are submitted for the general information of the shareholders of the Fund. This report is not authorized for distribution to prospective investors in the Fund unless preceded or accompanied by an effective prospectus.
A fund files its complete schedule of portfolio holdings with the SEC for the first and third quarters of each fiscal year on Form N-Q. Forms N-Q are available on the SEC’s web site at http://www.sec.gov. A fund's Forms N-Q may be reviewed and copied at the SEC’s Public Reference Room in Washington, DC. Information regarding the operation of the SEC's Public Reference Room may be obtained by calling 1-800-SEC-0330.
For a complete list of a fund's portfolio holdings, view the most recent holdings listing, semiannual report, or annual report on Fidelity's web site at http://www.fidelity.com, http://www.advisor.fidelity.com, or http://www.401k.com, as applicable.
NOT FDIC INSURED •MAY LOSE VALUE •NO BANK GUARANTEE
Neither the Fund nor Fidelity Distributors Corporation is a bank.
Performance: The Bottom Line
Average annual total return reflects the change in the value of an investment, assuming reinvestment of distributions from dividend income and capital gains (the profits earned upon the sale of securities that have grown in value, if any) and assuming a constant rate of performance each year.
The hypothetical investment and the average annual total returns do not reflect the deduction of taxes that a shareholder would pay on fund distributions or the redemption of fund shares.
During periods of reimbursement by Fidelity, a fund’s total return will be greater than it would be had the reimbursement not occurred.
How a fund did yesterday is no guarantee of how it will do tomorrow.
Average Annual Total Returns
| For the periods ended October 31, 2015 | Past 1 year | Past 5 years | Past 10 years |
| Fidelity® Value Fund | 0.12% | 13.08% | 7.35% |
$10,000 Over 10 Years
Let's say hypothetically that $10,000 was invested in Fidelity® Value Fund, a class of the fund, on October 31, 2005.
The chart shows how the value of your investment would have changed, and also shows how the Russell Midcap® Value Index performed over the same period.
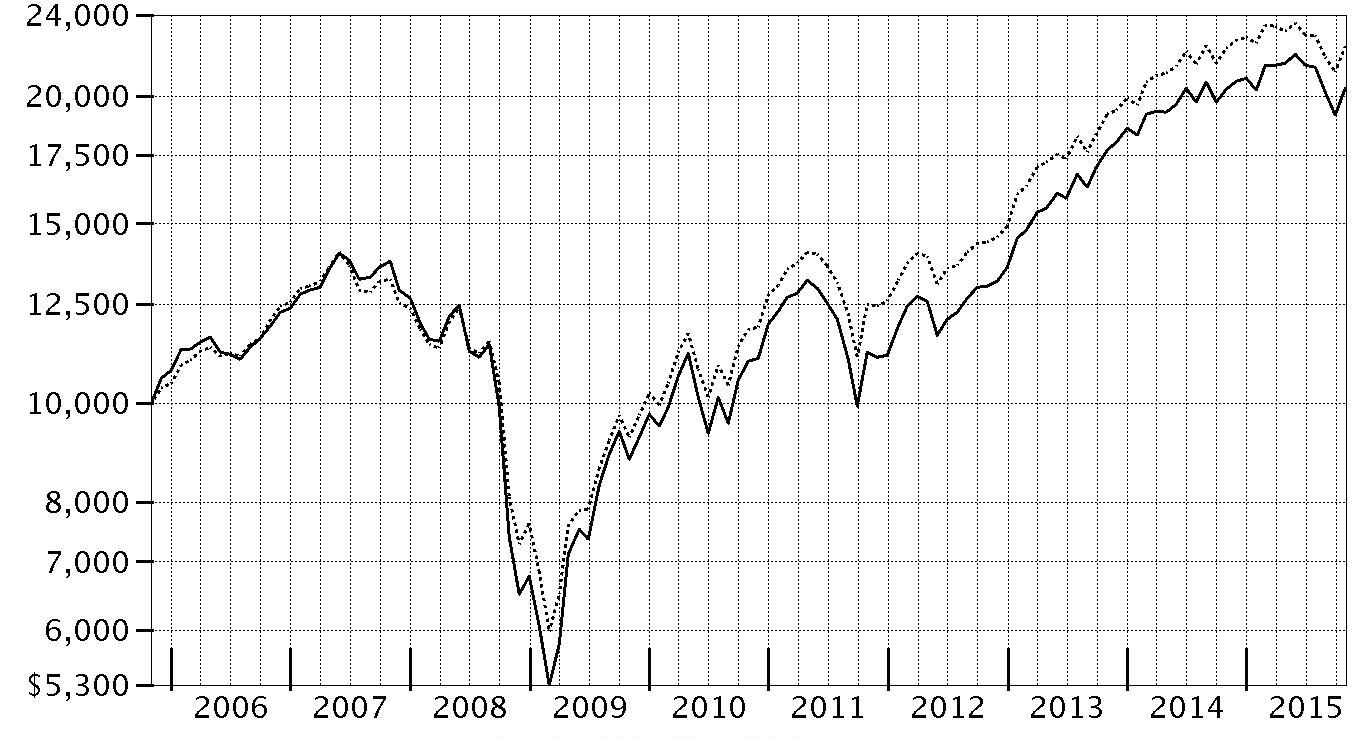
| Period Ending Values | ||
| $20,328 | Fidelity® Value Fund | |
| $22,388 | Russell Midcap® Value Index | |
Management's Discussion of Fund Performance
Market Recap: U.S. stocks gained moderately for the 12 months ending October 31, 2015, helped by a strong October that largely erased a steep decline in August and September on concern about slowing global economic growth emanating from China. Stocks benefited late in the period amid waning expectations for a near-term interest-rate hike by the U.S. Federal Reserve, additional economic stimulus in Europe and an interest-rate cut in China. The large-cap S&P 500® index advanced 5.20% for the period, with growth stocks in the index significantly outpacing value stocks, as investors continued to seek growth in a subpar economic environment. The growth-oriented Nasdaq Composite Index® also benefited, gaining 10.39%, while the small-cap Russell 2000® Index lost its edge, returning only 0.34%, as risk appetites waned. Among sectors in the widely followed S&P 500®, consumer discretionary (+21%) led the way, benefiting from a combination of rising personal income and still-benign inflation. Technology (+11%) and consumer staples (+9%) also outpaced the index. Conversely, energy (-19%) performed worst, in an environment of depressed commodity prices that also hit materials (-4%). At period end, investors remained focused on the potential global implications of a relatively stronger U.S. dollar and how China’s transition toward a consumption-led economy may affect corporate earnings.Comments from Co-Portfolio Manager Matthew Friedman: For the year, fund’s shares classes turned in modest gains, slightly underperforming the 0.47% result of the benchmark Russell Midcap® Value Index. Security selection contributed to performance versus the benchmark, but unsuccessful industry positioning partially offset that positive. In particular, weak picks among financials hurt, as did positioning in the equipment & services segment of the health care sector. Among individual stocks, the fund's non-index investment in SunCoke Energy hurt most. SunCoke is an independent producer of coke, which is used in the blast furnace production of steel. The stock underperformed due to customer concentration in other steel companies, such as AK Steel and U.S. Steel, which were hurt by lower steel prices in China – the world's largest producer. Turning to positives, the fund’s foreign investments helped despite the headwind of a rising dollar. Picks within tech and industrials were beneficial. From the tech sector, our investment in Freescale Semiconductor was the fund’s largest individual contributor. The stock popped in January after the maker of network processors and micro-controllers reported earnings that were much higher than expected, and then again in February on reports of a possible sale of the company. Shares ratcheted up yet again in early March after Netherlands-based NXP Semiconductors offered to purchase Freescale at a premium.The views expressed above reflect those of the portfolio manager(s) only through the end of the period as stated on the cover of this report and do not necessarily represent the views of Fidelity or any other person in the Fidelity organization. Any such views are subject to change at any time based upon market or other conditions and Fidelity disclaims any responsibility to update such views. These views may not be relied on as investment advice and, because investment decisions for a Fidelity fund are based on numerous factors, may not be relied on as an indication of trading intent on behalf of any Fidelity fund.
Investment Summary (Unaudited)
Top Ten Stocks as of October 31, 2015
| % of fund's net assets | % of fund's net assets 6 months ago | |
| Sempra Energy | 1.8 | 1.5 |
| Edison International | 1.7 | 1.4 |
| Berkshire Hathaway, Inc. Class B | 1.1 | 0.9 |
| ACE Ltd. | 1.1 | 0.5 |
| Capital One Financial Corp. | 1.1 | 1.1 |
| AECOM Technology Corp. | 1.0 | 1.2 |
| ITC Holdings Corp. | 1.0 | 0.9 |
| WestRock Co. | 1.0 | 1.0 |
| Symantec Corp. | 0.9 | 0.5 |
| U.S. Bancorp | 0.9 | 0.8 |
| 11.6 |
Top Five Market Sectors as of October 31, 2015
| % of fund's net assets | % of fund's net assets 6 months ago | |
| Financials | 30.0 | 29.6 |
| Industrials | 12.8 | 11.6 |
| Information Technology | 11.2 | 12.1 |
| Consumer Discretionary | 10.8 | 12.1 |
| Utilities | 9.3 | 9.5 |
Asset Allocation (% of fund's net assets)
| As of October 31, 2015* | ||
| Stocks and Equity Futures | 98.4% | |
| Bonds | 0.1% | |
| Other Investments | 0.1% | |
| Short-Term Investments and Net Other Assets (Liabilities) | 1.4% | |

* Foreign investments - 18.1%
| As of April 30, 2015 * | ||
| Stocks | 97.9% | |
| Bonds | 0.1% | |
| Other Investments | 0.1% | |
| Short-Term Investments and Net Other Assets (Liabilities) | 1.9% | |

* Foreign investments - 18.5%
Investments October 31, 2015
Showing Percentage of Net Assets
| Common Stocks - 98.2% | |||
| Shares | Value (000s) | ||
| CONSUMER DISCRETIONARY - 10.8% | |||
| Auto Components - 1.1% | |||
| Delphi Automotive PLC | 303,000 | $25,207 | |
| Tenneco, Inc. (a) | 433,400 | 24,526 | |
| The Goodyear Tire & Rubber Co. | 361,800 | 11,882 | |
| Visteon Corp. (a) | 304,510 | 33,213 | |
| 94,828 | |||
| Automobiles - 0.2% | |||
| Harley-Davidson, Inc. | 386,500 | 19,112 | |
| Distributors - 0.2% | |||
| Uni-Select, Inc. | 303,800 | 15,055 | |
| Diversified Consumer Services - 1.4% | |||
| H&R Block, Inc. | 958,559 | 35,716 | |
| Houghton Mifflin Harcourt Co. (a) | 3,488,206 | 68,334 | |
| Service Corp. International | 717,127 | 20,266 | |
| 124,316 | |||
| Hotels, Restaurants & Leisure - 1.0% | |||
| DineEquity, Inc. | 239,200 | 19,961 | |
| Extended Stay America, Inc. unit | 1,638,100 | 31,452 | |
| Wyndham Worldwide Corp. | 460,900 | 37,494 | |
| 88,907 | |||
| Household Durables - 0.7% | |||
| Jarden Corp. (a) | 430,250 | 19,275 | |
| Whirlpool Corp. | 255,200 | 40,868 | |
| 60,143 | |||
| Internet & Catalog Retail - 0.4% | |||
| Liberty Interactive Corp. QVC Group Series A (a) | 1,364,600 | 37,349 | |
| Leisure Products - 0.7% | |||
| Mattel, Inc. (b) | 1,939,600 | 47,675 | |
| Vista Outdoor, Inc. (a) | 256,500 | 11,471 | |
| 59,146 | |||
| Media - 2.6% | |||
| CBS Corp. Class B | 152,400 | 7,090 | |
| Liberty Broadband Corp. Class C (a) | 562,671 | 30,255 | |
| Live Nation Entertainment, Inc. (a) | 1,886,460 | 51,463 | |
| Omnicom Group, Inc. | 543,400 | 40,712 | |
| Sinclair Broadcast Group, Inc. Class A (b) | 778,656 | 23,367 | |
| Starz Series A (a) | 856,700 | 28,708 | |
| Twenty-First Century Fox, Inc. Class B | 946,900 | 29,240 | |
| Viacom, Inc. Class B (non-vtg.) | 498,300 | 24,571 | |
| 235,406 | |||
| Multiline Retail - 0.6% | |||
| Dillard's, Inc. Class A | 265,250 | 23,735 | |
| Kohl's Corp. | 671,817 | 30,984 | |
| 54,719 | |||
| Specialty Retail - 1.7% | |||
| Chico's FAS, Inc. | 1,287,657 | 17,795 | |
| GameStop Corp. Class A | 807,600 | 37,206 | |
| GNC Holdings, Inc. | 250,600 | 7,455 | |
| Sally Beauty Holdings, Inc. (a) | 277,200 | 6,517 | |
| Staples, Inc. | 3,404,600 | 44,226 | |
| The Men's Wearhouse, Inc. | 850,119 | 33,988 | |
| 147,187 | |||
| Textiles, Apparel & Luxury Goods - 0.2% | |||
| Gildan Activewear, Inc. | 801,400 | 23,038 | |
| TOTAL CONSUMER DISCRETIONARY | 959,206 | ||
| CONSUMER STAPLES - 3.3% | |||
| Beverages - 0.8% | |||
| C&C Group PLC | 6,044,168 | 24,127 | |
| Cott Corp. | 3,394,411 | 35,434 | |
| Molson Coors Brewing Co. Class B | 144,386 | 12,720 | |
| 72,281 | |||
| Food & Staples Retailing - 0.6% | |||
| Sysco Corp. | 687,200 | 28,347 | |
| Whole Foods Market, Inc. | 778,500 | 23,324 | |
| 51,671 | |||
| Food Products - 1.7% | |||
| Bunge Ltd. | 295,809 | 21,582 | |
| ConAgra Foods, Inc. | 677,600 | 27,477 | |
| Darling International, Inc. (a) | 3,387,500 | 34,282 | |
| Dean Foods Co. | 580,658 | 10,516 | |
| Greencore Group PLC | 4,475,459 | 20,836 | |
| Pinnacle Foods, Inc. | 150,400 | 6,630 | |
| The J.M. Smucker Co. | 251,831 | 29,562 | |
| 150,885 | |||
| Household Products - 0.2% | |||
| Svenska Cellulosa AB (SCA) (B Shares) | 581,200 | 17,119 | |
| TOTAL CONSUMER STAPLES | 291,956 | ||
| ENERGY - 7.4% | |||
| Energy Equipment & Services - 2.0% | |||
| Baker Hughes, Inc. | 962,300 | 50,694 | |
| BW Offshore Ltd. | 16,910,723 | 7,046 | |
| Dril-Quip, Inc. (a) | 505,600 | 31,125 | |
| FMC Technologies, Inc. (a) | 529,400 | 17,910 | |
| Halliburton Co. | 616,700 | 23,669 | |
| Odfjell Drilling A/S (a) | 2,881,782 | 1,865 | |
| SBM Offshore NV (a)(b) | 1,776,600 | 24,352 | |
| Schlumberger Ltd. | 257,900 | 20,157 | |
| 176,818 | |||
| Oil, Gas & Consumable Fuels - 5.4% | |||
| Anadarko Petroleum Corp. | 370,700 | 24,792 | |
| Apache Corp. | 509,100 | 23,994 | |
| Boardwalk Pipeline Partners, LP | 1,213,700 | 15,560 | |
| California Resources Corp. | 4,040,400 | 16,323 | |
| Diamondback Energy, Inc. | 468,200 | 34,572 | |
| Energen Corp. | 423,170 | 24,607 | |
| EQT Corp. | 672,800 | 44,452 | |
| Golar LNG Ltd. | 695,600 | 20,179 | |
| Hess Corp. | 492,300 | 27,672 | |
| Hoegh LNG Holdings Ltd. (b) | 1,256,411 | 15,083 | |
| Imperial Oil Ltd. | 859,900 | 28,613 | |
| Kinder Morgan, Inc. | 688,200 | 18,822 | |
| Lundin Petroleum AB (a) | 1,862,900 | 26,929 | |
| Marathon Oil Corp. | 1,500,900 | 27,587 | |
| Marathon Petroleum Corp. | 521,446 | 27,011 | |
| Newfield Exploration Co. (a) | 1,188,110 | 47,750 | |
| Northern Oil & Gas, Inc. (a) | 1,096,291 | 5,525 | |
| Scorpio Tankers, Inc. | 1,352,445 | 12,334 | |
| Stone Energy Corp. (a)(b) | 2,048,500 | 11,451 | |
| Whiting Petroleum Corp. (a) | 1,180,844 | 20,346 | |
| 473,602 | |||
| TOTAL ENERGY | 650,420 | ||
| FINANCIALS - 29.7% | |||
| Banks - 5.2% | |||
| Bank of Ireland (a) | 22,747,694 | 8,380 | |
| Barclays PLC sponsored ADR | 2,386,158 | 33,955 | |
| CIT Group, Inc. | 1,149,276 | 49,419 | |
| Citigroup, Inc. | 482,416 | 25,650 | |
| EFG Eurobank Ergasias SA (a) | 79,196,000 | 2,700 | |
| First Citizen Bancshares, Inc. | 131,801 | 33,760 | |
| First Citizen Bancshares, Inc. Class A (a) | 158,592 | 40,622 | |
| First Niagara Financial Group, Inc. | 1,857,800 | 19,228 | |
| Gree Electric Appliances, Inc. ELS (BNP Paribas Arbitrage Warrant Program) warrants 12/10/15 (c) | 2,768,400 | 7,557 | |
| Hilltop Holdings, Inc. (a) | 1,178,414 | 24,711 | |
| JPMorgan Chase & Co. | 582,217 | 37,407 | |
| Lloyds Banking Group PLC | 12,287,600 | 13,947 | |
| PNC Financial Services Group, Inc. | 298,544 | 26,947 | |
| Prosperity Bancshares, Inc. | 447,300 | 22,982 | |
| U.S. Bancorp | 1,972,415 | 83,196 | |
| Wells Fargo & Co. | 501,828 | 27,169 | |
| 457,630 | |||
| Capital Markets - 4.3% | |||
| American Capital Ltd. (a) | 772,300 | 9,878 | |
| Apollo Global Management LLC Class A | 1,287,232 | 23,518 | |
| Ares Capital Corp. (b) | 2,197,525 | 33,468 | |
| Artisan Partners Asset Management, Inc. | 546,300 | 20,896 | |
| E*TRADE Financial Corp. (a) | 1,008,946 | 28,765 | |
| Fortress Investment Group LLC | 4,146,428 | 23,261 | |
| Franklin Resources, Inc. | 763,900 | 31,137 | |
| Invesco Ltd. | 1,952,921 | 64,778 | |
| KKR & Co. LP | 2,340,968 | 40,148 | |
| NorthStar Asset Management Group, Inc. | 1,263,159 | 18,480 | |
| The Blackstone Group LP | 1,319,404 | 43,619 | |
| UBS Group AG | 926,270 | 18,536 | |
| Virtus Investment Partners, Inc. (b) | 217,100 | 25,409 | |
| Waddell & Reed Financial, Inc. Class A | 59,400 | 2,194 | |
| 384,087 | |||
| Consumer Finance - 2.9% | |||
| American Express Co. | 44,500 | 3,260 | |
| Capital One Financial Corp. | 1,198,791 | 94,585 | |
| Discover Financial Services | 1,346,000 | 75,672 | |
| Navient Corp. | 3,606,568 | 47,571 | |
| Springleaf Holdings, Inc. (a) | 796,438 | 37,361 | |
| 258,449 | |||
| Diversified Financial Services - 1.4% | |||
| Berkshire Hathaway, Inc. Class B (a) | 718,289 | 97,702 | |
| Leucadia National Corp. | 1,160,700 | 23,226 | |
| 120,928 | |||
| Insurance - 5.8% | |||
| ACE Ltd. | 835,348 | 94,845 | |
| AFLAC, Inc. | 571,746 | 36,449 | |
| Allstate Corp. | 554,585 | 34,318 | |
| AMBAC Financial Group, Inc. (a) | 2,040,459 | 32,953 | |
| Brown & Brown, Inc. | 1,105,300 | 35,668 | |
| First American Financial Corp. | 685,200 | 26,127 | |
| Greenlight Capital Re, Ltd. (a) | 737,943 | 16,205 | |
| Principal Financial Group, Inc. | 756,700 | 37,956 | |
| ProAssurance Corp. | 379,207 | 20,083 | |
| Progressive Corp. | 534,000 | 17,691 | |
| Prudential PLC | 1,099,903 | 25,690 | |
| Reinsurance Group of America, Inc. | 550,893 | 49,713 | |
| StanCorp Financial Group, Inc. | 356,828 | 40,935 | |
| Torchmark Corp. | 686,251 | 39,809 | |
| 508,442 | |||
| Real Estate Investment Trusts - 8.0% | |||
| American Capital Agency Corp. | 272,206 | 4,853 | |
| American Tower Corp. | 504,404 | 51,565 | |
| Annaly Capital Management, Inc. | 890,400 | 8,859 | |
| CBL & Associates Properties, Inc. | 2,094,500 | 30,538 | |
| Douglas Emmett, Inc. | 730,100 | 22,305 | |
| Equity Commonwealth (a) | 29,700 | 853 | |
| Equity Lifestyle Properties, Inc. | 1,254,815 | 75,891 | |
| Extra Space Storage, Inc. | 666,700 | 52,829 | |
| First Potomac Realty Trust | 593,700 | 7,000 | |
| General Growth Properties, Inc. | 153,400 | 4,441 | |
| Grivalia Properties REIC (d) | 5,147,502 | 46,812 | |
| iStar Financial, Inc. (a)(d) | 4,444,165 | 57,507 | |
| Lamar Advertising Co. Class A | 610,900 | 34,473 | |
| Liberty Property Trust (SBI) | 84,100 | 2,861 | |
| MFA Financial, Inc. | 2,463,790 | 17,049 | |
| NorthStar Realty Finance Corp. | 2,240,959 | 26,914 | |
| Outfront Media, Inc. | 1,830,100 | 43,209 | |
| Sun Communities, Inc. | 939,549 | 62,969 | |
| Taubman Centers, Inc. | 39,600 | 3,048 | |
| Ventas, Inc. | 1,135,800 | 61,015 | |
| VEREIT, Inc. | 6,025,200 | 49,768 | |
| WP Glimcher, Inc. | 3,922,500 | 45,579 | |
| 710,338 | |||
| Real Estate Management & Development - 1.8% | |||
| Brookfield Asset Management, Inc. Class A | 517,050 | 18,063 | |
| CBRE Group, Inc. (a) | 669,100 | 24,944 | |
| Forest City Enterprises, Inc. Class A (a) | 1,219,295 | 26,946 | |
| Kennedy Wilson Europe Real Estate PLC | 922,706 | 17,012 | |
| Kennedy-Wilson Holdings, Inc. | 1,335,414 | 32,744 | |
| Realogy Holdings Corp. (a) | 1,010,100 | 39,495 | |
| 159,204 | |||
| Thrifts & Mortgage Finance - 0.3% | |||
| TFS Financial Corp. | 1,315,300 | 23,097 | |
| TOTAL FINANCIALS | 2,622,175 | ||
| HEALTH CARE - 5.6% | |||
| Biotechnology - 0.6% | |||
| AMAG Pharmaceuticals, Inc. (a) | 317,700 | 12,708 | |
| United Therapeutics Corp. (a) | 284,600 | 41,731 | |
| 54,439 | |||
| Health Care Equipment & Supplies - 1.3% | |||
| Boston Scientific Corp. (a) | 617,600 | 11,290 | |
| St. Jude Medical, Inc. | 217,600 | 13,885 | |
| The Cooper Companies, Inc. | 81,900 | 12,478 | |
| Zimmer Biomet Holdings, Inc. | 708,200 | 74,056 | |
| 111,709 | |||
| Health Care Providers & Services - 1.1% | |||
| Accretive Health, Inc. (a) | 4,305,566 | 8,826 | |
| Brookdale Senior Living, Inc. (a) | 391,500 | 8,186 | |
| Community Health Systems, Inc. (a) | 378,517 | 10,614 | |
| Laboratory Corp. of America Holdings (a) | 435,100 | 53,404 | |
| Universal Health Services, Inc. Class B | 158,400 | 19,339 | |
| 100,369 | |||
| Health Care Technology - 0.4% | |||
| CompuGroup Medical AG | 1,090,604 | 32,141 | |
| Life Sciences Tools & Services - 0.2% | |||
| Agilent Technologies, Inc. | 517,373 | 19,536 | |
| Pharmaceuticals - 2.0% | |||
| Allergan PLC (a) | 53,500 | 16,503 | |
| Jazz Pharmaceuticals PLC (a) | 509,167 | 69,898 | |
| Mallinckrodt PLC (a) | 50,800 | 3,336 | |
| Perrigo Co. PLC | 152,100 | 23,992 | |
| Teva Pharmaceutical Industries Ltd. sponsored ADR | 734,417 | 43,470 | |
| The Medicines Company (a) | 210,500 | 7,208 | |
| Theravance, Inc. | 1,701,946 | 14,943 | |
| 179,350 | |||
| TOTAL HEALTH CARE | 497,544 | ||
| INDUSTRIALS - 12.8% | |||
| Aerospace & Defense - 4.1% | |||
| Aerojet Rocketdyne Holdings, Inc. (a) | 2,577,182 | 43,657 | |
| Curtiss-Wright Corp. | 678,185 | 47,175 | |
| Esterline Technologies Corp. (a) | 361,700 | 27,869 | |
| KLX, Inc. (a) | 1,323,180 | 51,750 | |
| L-3 Communications Holdings, Inc. | 612,790 | 77,457 | |
| Orbital ATK, Inc. | 526,500 | 45,079 | |
| Precision Castparts Corp. | 170,900 | 39,445 | |
| Rolls-Royce Group PLC | 2,071,300 | 21,903 | |
| Textron, Inc. | 280,300 | 11,820 | |
| 366,155 | |||
| Air Freight & Logistics - 0.3% | |||
| Hub Group, Inc. Class A (a) | 399,998 | 15,992 | |
| PostNL NV (a) | 2,321,354 | 9,588 | |
| 25,580 | |||
| Airlines - 0.3% | |||
| American Airlines Group, Inc. | 511,200 | 23,628 | |
| Building Products - 0.5% | |||
| Allegion PLC | 652,713 | 42,537 | |
| Commercial Services & Supplies - 1.2% | |||
| ADT Corp. (b) | 1,059,569 | 35,008 | |
| Progressive Waste Solution Ltd. (Canada) | 1,034,000 | 24,862 | |
| Regus PLC | 6,689,400 | 34,505 | |
| West Corp. | 501,800 | 11,948 | |
| 106,323 | |||
| Construction & Engineering - 1.4% | |||
| AECOM Technology Corp. (a) | 3,105,206 | 91,510 | |
| Astaldi SpA (b) | 1,698,041 | 13,668 | |
| Jacobs Engineering Group, Inc. (a) | 543,900 | 21,832 | |
| 127,010 | |||
| Electrical Equipment - 0.9% | |||
| Eaton Corp. PLC | 272,500 | 15,235 | |
| OSRAM Licht AG | 387,495 | 22,801 | |
| Regal Beloit Corp. | 572,000 | 36,488 | |
| 74,524 | |||
| Industrial Conglomerates - 0.1% | |||
| Danaher Corp. | 130,000 | 12,130 | |
| Machinery - 1.7% | |||
| AGCO Corp. (b) | 745,700 | 36,084 | |
| Deere & Co. | 69,878 | 5,450 | |
| Flowserve Corp. | 9,000 | 417 | |
| Manitowoc Co., Inc. (b) | 882,107 | 13,496 | |
| Melrose PLC | 4,888,000 | 20,059 | |
| Pentair PLC | 389,700 | 21,792 | |
| Stanley Black & Decker, Inc. | 75,500 | 8,001 | |
| Sulzer AG (Reg.) (b) | 192,310 | 19,436 | |
| TriMas Corp. (a) | 1,190,866 | 23,829 | |
| 148,564 | |||
| Marine - 0.0% | |||
| Ultrapetrol (Bahamas) Ltd. (a)(b) | 4,238,972 | 1,908 | |
| Road & Rail - 1.0% | |||
| CSX Corp. | 744,600 | 20,097 | |
| Hertz Global Holdings, Inc. (a) | 1,737,500 | 33,881 | |
| Swift Transporation Co. (a) | 2,111,900 | 33,009 | |
| 86,987 | |||
| Trading Companies & Distributors - 1.3% | |||
| AerCap Holdings NV (a) | 839,496 | 34,839 | |
| Ashtead Group PLC | 592,800 | 9,139 | |
| MRC Global, Inc. (a) | 1,284,040 | 15,280 | |
| Noble Group Ltd. | 31,040,500 | 11,145 | |
| Veritiv Corp. (a) | 300,344 | 12,614 | |
| WESCO International, Inc. (a) | 675,076 | 33,031 | |
| 116,048 | |||
| TOTAL INDUSTRIALS | 1,131,394 | ||
| INFORMATION TECHNOLOGY - 11.2% | |||
| Communications Equipment - 1.6% | |||
| CommScope Holding Co., Inc. (a) | 741,000 | 24,031 | |
| Harris Corp. | 496,800 | 39,312 | |
| QUALCOMM, Inc. | 1,261,554 | 74,962 | |
| 138,305 | |||
| Electronic Equipment & Components - 1.4% | |||
| Flextronics International Ltd. (a) | 1,176,500 | 13,400 | |
| Ingram Micro, Inc. Class A | 637,250 | 18,977 | |
| Jabil Circuit, Inc. | 1,490,603 | 34,254 | |
| TE Connectivity Ltd. | 280,766 | 18,093 | |
| Trimble Navigation Ltd. (a) | 1,009,800 | 22,973 | |
| TTM Technologies, Inc. (a) | 2,160,580 | 15,772 | |
| 123,469 | |||
| Internet Software & Services - 0.1% | |||
| Rackspace Hosting, Inc. (a) | 312,600 | 8,081 | |
| IT Services - 1.6% | |||
| Computer Sciences Corp. | 379,700 | 25,284 | |
| EVERTEC, Inc. | 1,825,898 | 33,304 | |
| Leidos Holdings, Inc. | 555,700 | 29,213 | |
| Science Applications International Corp. | 570,900 | 26,181 | |
| Unisys Corp. (a) | 2,163,466 | 28,990 | |
| 142,972 | |||
| Semiconductors & Semiconductor Equipment - 2.1% | |||
| Broadcom Corp. Class A | 477,601 | 24,549 | |
| Freescale Semiconductor, Inc. (a) | 368,100 | 12,328 | |
| Marvell Technology Group Ltd. | 6,796,600 | 55,800 | |
| Maxim Integrated Products, Inc. | 1,732,000 | 70,977 | |
| Semtech Corp. (a) | 1,467,456 | 25,680 | |
| 189,334 | |||
| Software - 1.9% | |||
| CommVault Systems, Inc. (a) | 593,973 | 24,068 | |
| Interactive Intelligence Group, Inc. (a) | 744,300 | 24,071 | |
| Oracle Corp. | 686,907 | 26,679 | |
| Symantec Corp. | 4,090,678 | 84,268 | |
| Synopsys, Inc. (a) | 217,400 | 10,866 | |
| 169,952 | |||
| Technology Hardware, Storage & Peripherals - 2.5% | |||
| HP, Inc. | 1,392,900 | 37,553 | |
| Lexmark International, Inc. Class A | 702,723 | 22,831 | |
| NCR Corp. (a) | 2,042,500 | 54,331 | |
| Samsung Electronics Co. Ltd. | 55,062 | 66,165 | |
| Western Digital Corp. | 530,800 | 35,468 | |
| 216,348 | |||
| TOTAL INFORMATION TECHNOLOGY | 988,461 | ||
| MATERIALS - 7.5% | |||
| Chemicals - 3.6% | |||
| Agrium, Inc. | 402,900 | 37,483 | |
| Albemarle Corp. U.S. | 289,500 | 15,494 | |
| Axalta Coating Systems | 823,300 | 22,748 | |
| CF Industries Holdings, Inc. | 1,062,600 | 53,948 | |
| Cytec Industries, Inc. | 201,000 | 14,958 | |
| Eastman Chemical Co. | 781,603 | 56,408 | |
| LyondellBasell Industries NV Class A | 225,180 | 20,921 | |
| Methanex Corp. | 1,276,966 | 50,948 | |
| Sociedad Quimica y Minera de Chile SA (PN-B) sponsored ADR | 1,420,000 | 27,520 | |
| Tronox Ltd. Class A | 3,232,680 | 20,075 | |
| 320,503 | |||
| Containers & Packaging - 2.4% | |||
| Avery Dennison Corp. | 458,400 | 29,782 | |
| Ball Corp. | 123,900 | 8,487 | |
| Berry Plastics Group, Inc. (a) | 845,600 | 28,328 | |
| Graphic Packaging Holding Co. | 1,289,300 | 18,256 | |
| Packaging Corp. of America | 218,000 | 14,922 | |
| Sonoco Products Co. | 650,778 | 27,782 | |
| WestRock Co. | 1,581,368 | 85,014 | |
| 212,571 | |||
| Metals & Mining - 1.5% | |||
| Compass Minerals International, Inc. | 916,500 | 74,456 | |
| Freeport-McMoRan, Inc. | 1,487,000 | 17,502 | |
| Steel Dynamics, Inc. | 1,240,200 | 22,906 | |
| SunCoke Energy, Inc. | 3,006,084 | 14,910 | |
| 129,774 | |||
| TOTAL MATERIALS | 662,848 | ||
| TELECOMMUNICATION SERVICES - 0.6% | |||
| Diversified Telecommunication Services - 0.6% | |||
| CenturyLink, Inc. | 1,201,091 | 33,883 | |
| Frontier Communications Corp. (b) | 3,436,604 | 17,664 | |
| 51,547 | |||
| UTILITIES - 9.3% | |||
| Electric Utilities - 5.4% | |||
| Edison International | 2,517,093 | 152,334 | |
| Exelon Corp. | 2,912,000 | 81,303 | |
| ITC Holdings Corp. | 2,668,466 | 87,312 | |
| NextEra Energy, Inc. | 450,918 | 46,291 | |
| OGE Energy Corp. | 2,789,000 | 79,514 | |
| Xcel Energy, Inc. | 750,900 | 26,755 | |
| 473,509 | |||
| Independent Power and Renewable Electricity Producers - 0.2% | |||
| Dynegy, Inc. (a) | 1,162,100 | 22,580 | |
| Multi-Utilities - 3.7% | |||
| CMS Energy Corp. | 1,660,700 | 59,901 | |
| DTE Energy Co. | 605,500 | 49,403 | |
| Public Service Enterprise Group, Inc. | 1,490,500 | 61,543 | |
| Sempra Energy | 1,547,697 | 158,509 | |
| 329,356 | |||
| TOTAL UTILITIES | 825,445 | ||
| TOTAL COMMON STOCKS | |||
| (Cost $8,581,199) | 8,680,996 | ||
| Nonconvertible Preferred Stocks - 0.1% | |||
| FINANCIALS - 0.1% | |||
| Banks - 0.1% | |||
| Itau Unibanco Holding SA sponsored ADR | 1,041,899 | 7,137 | |
| INDUSTRIALS - 0.0% | |||
| Aerospace & Defense - 0.0% | |||
| Rolls-Royce Group PLC | 192,009,510 | 296 | |
| TOTAL NONCONVERTIBLE PREFERRED STOCKS | |||
| (Cost $17,273) | 7,433 | ||
| Principal Amount (000s)(e) | Value (000s) | ||
| Nonconvertible Bonds - 0.1% | |||
| FINANCIALS - 0.1% | |||
| Banks - 0.1% | |||
| Bank of Ireland 10% 7/30/16 (Cost $13,472) | EUR | 10,286 | 11,878 |
| Preferred Securities - 0.1% | |||
| FINANCIALS - 0.1% | |||
| Diversified Financial Services - 0.1% | |||
| Baggot Securities Ltd. 10.24% (Cost $10,148)(c)(f) | EUR | 6,870 | 8,167 |
| Shares | Value (000s) | ||
| Money Market Funds - 3.2% | |||
| Fidelity Cash Central Fund, 0.18% (g) | 124,104,122 | 124,104 | |
| Fidelity Securities Lending Cash Central Fund, 0.19% (g)(h) | 157,452,939 | 157,453 | |
| TOTAL MONEY MARKET FUNDS | |||
| (Cost $281,557) | 281,557 | ||
| TOTAL INVESTMENT PORTFOLIO - 101.7% | |||
| (Cost $8,903,649) | 8,990,031 | ||
| NET OTHER ASSETS (LIABILITIES) - (1.7)% | (148,933) | ||
| NET ASSETS - 100% | $8,841,098 |
| Futures Contracts | |||
| Expiration Date | Underlying Face Amount at Value (000s) | Unrealized Appreciation/(Depreciation) (000s) | |
| Purchased | |||
| Equity Index Contracts | |||
| 81 CME E-mini S&P MidCap 400 Index Contracts (United States) | Dec. 2015 | 11,675 | $279 |
The face value of futures purchased as a percentage of Net Assets is 0.1%
Currency Abbreviations
EUR – European Monetary Unit
Legend
(a) Non-income producing
(b) Security or a portion of the security is on loan at period end.
(c) Security exempt from registration under Rule 144A of the Securities Act of 1933. These securities may be resold in transactions exempt from registration, normally to qualified institutional buyers. At the end of the period, the value of these securities amounted to $15,724,000 or 0.2% of net assets.
(d) Affiliated company
(e) Amount is stated in United States dollars unless otherwise noted.
(f) Security is perpetual in nature with no stated maturity date.
(g) Affiliated fund that is generally available only to investment companies and other accounts managed by Fidelity Investments. The rate quoted is the annualized seven-day yield of the fund at period end. A complete unaudited listing of the fund's holdings as of its most recent quarter end is available upon request. In addition, each Fidelity Central Fund's financial statements, which are not covered by the Fund's Report of Independent Registered Public Accounting Firm, are available on the SEC's website or upon request.
(h) Investment made with cash collateral received from securities on loan.
Affiliated Central Funds
Information regarding fiscal year to date income earned by the Fund from investments in Fidelity Central Funds is as follows:
| Fund | Income earned |
| (Amounts in thousands) | |
| Fidelity Cash Central Fund | $330 |
| Fidelity Securities Lending Cash Central Fund | 1,633 |
| Total | $1,963 |
Other Affiliated Issuers
An affiliated company is a company in which the Fund has ownership of at least 5% of the voting securities. Fiscal year to date transactions with companies which are or were affiliates are as follows:
| Affiliate (Amounts in thousands) | Value, beginning of period | Purchases | Sales Proceeds | Dividend Income | Value, end of period |
| BPZ Energy, Inc. | $8,916 | $-- | $1,472 | $-- | $-- |
| Cardiome Pharma Corp. | 9,170 | 547 | 12,051 | -- | -- |
| Grivalia Properties REIC (formerly Eurobank Properties Real Estate Investment Co.) | 57,043 | -- | 1,170 | 1,775 | 46,812 |
| iStar Financial, Inc. | 20,872 | 41,497 | 1,685 | -- | 57,507 |
| TTM Technologies, Inc. | 23,713 | 9,136 | 25,214 | -- | -- |
| Total | $119,714 | $51,180 | $41,592 | $1,775 | $104,319 |
Investment Valuation
The following is a summary of the inputs used, as of October 31, 2015, involving the Fund's assets and liabilities carried at fair value. The inputs or methodology used for valuing securities may not be an indication of the risk associated with investing in those securities. For more information on valuation inputs, and their aggregation into the levels used below, please refer to the Investment Valuation section in the accompanying Notes to Financial Statements.
| Valuation Inputs at Reporting Date: | ||||
| Description | Total | Level 1 | Level 2 | Level 3 |
| (Amounts in thousands) | ||||
| Investments in Securities: | ||||
| Equities: | ||||
| Consumer Discretionary | $959,206 | $959,206 | $-- | $-- |
| Consumer Staples | 291,956 | 274,837 | 17,119 | -- |
| Energy | 650,420 | 650,420 | -- | -- |
| Financials | 2,629,312 | 2,582,118 | 47,194 | -- |
| Health Care | 497,544 | 497,544 | -- | -- |
| Industrials | 1,131,690 | 1,098,642 | 33,048 | -- |
| Information Technology | 988,461 | 988,461 | -- | -- |
| Materials | 662,848 | 662,848 | -- | -- |
| Telecommunication Services | 51,547 | 51,547 | -- | -- |
| Utilities | 825,445 | 825,445 | -- | -- |
| Corporate Bonds | 11,878 | -- | 11,878 | -- |
| Preferred Securities | 8,167 | -- | 8,167 | -- |
| Money Market Funds | 281,557 | 281,557 | -- | -- |
| Total Investments in Securities: | $8,990,031 | $8,872,625 | $117,406 | $-- |
| Derivative Instruments: | ||||
| Assets | ||||
| Futures Contracts | $279 | $279 | $-- | $-- |
| Total Assets | $279 | $279 | $-- | $-- |
| Total Derivative Instruments: | $279 | $279 | $-- | $-- |
Value of Derivative Instruments
The following table is a summary of the Fund's value of derivative instruments by primary risk exposure as of October 31, 2015. For additional information on derivative instruments, please refer to the Derivative Instruments section in the accompanying Notes to Financial Statements.
| Primary Risk Exposure / Derivative Type | Value (000s) | |
| Asset | Liability | |
| Equity Risk | ||
| Futures Contracts(a) | $279 | $0 |
| Total Value of Derivatives | $279 | $0 |
(a) Reflects gross cumulative appreciation (depreciation) on futures contracts as presented in the Schedule of Investments. Only the period end receivable or payable for daily variation margin is presented in the Statement of Assets and Liabilities.
Other Information
Distribution of investments by country or territory of incorporation, as a percentage of Total Net Assets, is as follows (Unaudited):
| United States of America | 81.9% |
| Ireland | 3.0% |
| Canada | 2.6% |
| Bermuda | 2.6% |
| Switzerland | 1.7% |
| United Kingdom | 1.4% |
| Netherlands | 1.1% |
| Others (Individually Less Than 1%) | 5.7% |
| 100.0% |
See accompanying notes which are an integral part of the financial statements.
Financial Statements
Statement of Assets and Liabilities
| Amounts in thousands (except per-share amounts) | October 31, 2015 | |
| Assets | ||
| Investment in securities, at value (including securities loaned of $153,795) — See accompanying schedule: Unaffiliated issuers (cost $8,529,935) | $8,604,155 | |
| Fidelity Central Funds (cost $281,557) | 281,557 | |
| Other affiliated issuers (cost $92,157) | 104,319 | |
| Total Investments (cost $8,903,649) | $8,990,031 | |
| Segregated cash with brokers for derivative instruments | 543 | |
| Cash | 738 | |
| Receivable for investments sold | 109,137 | |
| Receivable for fund shares sold | 9,887 | |
| Dividends receivable | 4,541 | |
| Interest receivable | 294 | |
| Distributions receivable from Fidelity Central Funds | 88 | |
| Receivable for daily variation margin for derivative instruments | 2 | |
| Prepaid expenses | 25 | |
| Other receivables | 558 | |
| Total assets | 9,115,844 | |
| Liabilities | ||
| Payable for investments purchased | $99,968 | |
| Payable for fund shares redeemed | 11,498 | |
| Accrued management fee | 4,087 | |
| Other affiliated payables | 1,183 | |
| Other payables and accrued expenses | 557 | |
| Collateral on securities loaned, at value | 157,453 | |
| Total liabilities | 274,746 | |
| Net Assets | $8,841,098 | |
| Net Assets consist of: | ||
| Paid in capital | $8,011,869 | |
| Undistributed net investment income | 57,267 | |
| Accumulated undistributed net realized gain (loss) on investments and foreign currency transactions | 685,315 | |
| Net unrealized appreciation (depreciation) on investments and assets and liabilities in foreign currencies | 86,647 | |
| Net Assets | $8,841,098 | |
| Value: | ||
| Net Asset Value, offering price and redemption price per share ($7,436,720 ÷ 67,163 shares) | $110.73 | |
| Class K: | ||
| Net Asset Value, offering price and redemption price per share ($1,404,378 ÷ 12,662 shares) | $110.91 |
See accompanying notes which are an integral part of the financial statements.
Statement of Operations
| Amounts in thousands | Year ended October 31, 2015 | |
| Investment Income | ||
| Dividends (including $1,775 earned from other affiliated issuers) | $167,432 | |
| Interest | 1,223 | |
| Income from Fidelity Central Funds | 1,963 | |
| Total income | 170,618 | |
| Expenses | ||
| Management fee | ||
| Basic fee | $51,899 | |
| Performance adjustment | 5,964 | |
| Transfer agent fees | 13,466 | |
| Accounting and security lending fees | 1,299 | |
| Custodian fees and expenses | 294 | |
| Independent trustees' compensation | 41 | |
| Registration fees | 110 | |
| Audit | 93 | |
| Legal | 31 | |
| Miscellaneous | 66 | |
| Total expenses before reductions | 73,263 | |
| Expense reductions | (818) | 72,445 |
| Net investment income (loss) | 98,173 | |
| Realized and Unrealized Gain (Loss) | ||
| Net realized gain (loss) on: | ||
| Investment securities: | ||
| Unaffiliated issuers | 763,457 | |
| Other affiliated issuers | (12,116) | |
| Foreign currency transactions | (235) | |
| Futures contracts | 5,819 | |
| Total net realized gain (loss) | 756,925 | |
| Change in net unrealized appreciation (depreciation) on: Investment securities | (818,408) | |
| Assets and liabilities in foreign currencies | 37 | |
| Futures contracts | (1,553) | |
| Total change in net unrealized appreciation (depreciation) | (819,924) | |
| Net gain (loss) | (62,999) | |
| Net increase (decrease) in net assets resulting from operations | $35,174 |
See accompanying notes which are an integral part of the financial statements.
Statement of Changes in Net Assets
| Amounts in thousands | Year ended October 31, 2015 | Year ended October 31, 2014 |
| Increase (Decrease) in Net Assets | ||
| Operations | ||
| Net investment income (loss) | $98,173 | $88,411 |
| Net realized gain (loss) | 756,925 | 1,263,440 |
| Change in net unrealized appreciation (depreciation) | (819,924) | (130,972) |
| Net increase (decrease) in net assets resulting from operations | 35,174 | 1,220,879 |
| Distributions to shareholders from net investment income | (77,668) | (73,736) |
| Distributions to shareholders from net realized gain | (128,936) | (13,709) |
| Total distributions | (206,604) | (87,445) |
| Share transactions - net increase (decrease) | (510,694) | (24,445) |
| Total increase (decrease) in net assets | (682,124) | 1,108,989 |
| Net Assets | ||
| Beginning of period | 9,523,222 | 8,414,233 |
| End of period (including undistributed net investment income of $57,267 and undistributed net investment income of $52,222, respectively) | $8,841,098 | $9,523,222 |
See accompanying notes which are an integral part of the financial statements.
Financial Highlights — Fidelity Value Fund
| October 31, | |||||
| Years ended October 31, | 2015 | 2014 | 2013 | 2012 | 2011 |
| Selected Per–Share Data | |||||
| Net asset value, beginning of period | $113.00 | $99.54 | $74.14 | $64.53 | $64.09 |
| Income from Investment Operations | |||||
| Net investment income (loss)A | 1.17 | 1.02 | 1.13 | .74 | .59 |
| Net realized and unrealized gain (loss) | (.99)B | 13.47 | 25.28 | 9.48 | .75 |
| Total from investment operations | .18 | 14.49 | 26.41 | 10.22 | 1.34 |
| Distributions from net investment income | (.91) | (.86) | (1.01) | (.58) | (.88) |
| Distributions from net realized gain | (1.54) | (.16) | – | (.03) | (.02) |
| Total distributions | (2.45) | (1.03)C | (1.01) | (.61) | (.90) |
| Net asset value, end of period | $110.73 | $113.00 | $99.54 | $74.14 | $64.53 |
| Total ReturnD | .12%B | 14.68% | 36.07% | 15.99% | 2.05% |
| Ratios to Average Net AssetsE,F | |||||
| Expenses before reductions | .79% | .73% | .67% | .68% | .60% |
| Expenses net of fee waivers, if any | .79% | .73% | .67% | .68% | .60% |
| Expenses net of all reductions | .78% | .73% | .65% | .68% | .59% |
| Net investment income (loss) | 1.02% | .95% | 1.30% | 1.07% | .87% |
| Supplemental Data | |||||
| Net assets, end of period (in millions) | $7,437 | $8,024 | $7,153 | $5,571 | $6,006 |
| Portfolio turnover rateG | 80% | 81% | 99% | 77% | 95% |
A Calculated based on average shares outstanding during the period.
B Net realized and unrealized gain (loss) per share reflects proceeds received from litigation which amounted to $.13 per share. Excluding these litigation proceeds, the total return would have been .01%.
C Total distributions of $1.03 per share is comprised of distributions from net investment income of $.864 and distributions from net realized gain of $.164 per share.
D Total returns would have been lower if certain expenses had not been reduced during the applicable periods shown.
E Fees and expenses of any underlying Fidelity Central Funds are not included in the Fund's expense ratio. The Fund indirectly bears its proportionate share of the expenses of any underlying Fidelity Central Funds.
F Expense ratios reflect operating expenses of the class. Expenses before reductions do not reflect amounts reimbursed by the investment adviser or reductions from brokerage service arrangements or reductions from other expense offset arrangements and do not represent the amount paid by the class during periods when reimbursements or reductions occur. Expenses net of fee waivers reflect expenses after reimbursement by the investment adviser but prior to reductions from brokerage service arrangements or other expense offset arrangements. Expenses net of all reductions represent the net expenses paid by the class.
G Amount does not include the portfolio activity of any underlying Fidelity Central Funds.
See accompanying notes which are an integral part of the financial statements.
Financial Highlights — Fidelity Value Fund Class K
| October 31, | |||||
| Years ended October 31, | 2015 | 2014 | 2013 | 2012 | 2011 |
| Selected Per–Share Data | |||||
| Net asset value, beginning of period | $113.17 | $99.70 | $74.27 | $64.66 | $64.24 |
| Income from Investment Operations | |||||
| Net investment income (loss)A | 1.30 | 1.15 | 1.25 | .85 | .70 |
| Net realized and unrealized gain (loss) | (.99)B | 13.47 | 25.30 | 9.47 | .74 |
| Total from investment operations | .31 | 14.62 | 26.55 | 10.32 | 1.44 |
| Distributions from net investment income | (1.03) | (.98) | (1.12) | (.68) | (1.00) |
| Distributions from net realized gain | (1.54) | (.16) | – | (.03) | (.02) |
| Total distributions | (2.57) | (1.15)C | (1.12) | (.71) | (1.02) |
| Net asset value, end of period | $110.91 | $113.17 | $99.70 | $74.27 | $64.66 |
| Total ReturnD | .24%B | 14.81% | 36.26% | 16.16% | 2.20% |
| Ratios to Average Net AssetsE,F | |||||
| Expenses before reductions | .68% | .62% | .54% | .54% | .44% |
| Expenses net of fee waivers, if any | .68% | .62% | .54% | .54% | .44% |
| Expenses net of all reductions | .67% | .61% | .52% | .53% | .44% |
| Net investment income (loss) | 1.13% | 1.07% | 1.42% | 1.22% | 1.02% |
| Supplemental Data | |||||
| Net assets, end of period (in millions) | $1,404 | $1,499 | $1,261 | $765 | $639 |
| Portfolio turnover rateG | 80% | 81% | 99% | 77% | 95% |
A Calculated based on average shares outstanding during the period.
B Net realized and unrealized gain (loss) per share reflects proceeds received from litigation which amounted to $.13 per share. Excluding these litigation proceeds, the total return would have been .13%.
C Total distributions of $1.15 per share is comprised of distributions from net investment income of $.983 and distributions from net realized gain of $.164 per share.
D Total returns would have been lower if certain expenses had not been reduced during the applicable periods shown.
E Fees and expenses of any underlying Fidelity Central Funds are not included in the Fund's expense ratio. The Fund indirectly bears its proportionate share of the expenses of any underlying Fidelity Central Funds.
F Expense ratios reflect operating expenses of the class. Expenses before reductions do not reflect amounts reimbursed by the investment adviser or reductions from brokerage service arrangements or reductions from other expense offset arrangements and do not represent the amount paid by the class during periods when reimbursements or reductions occur. Expenses net of fee waivers reflect expenses after reimbursement by the investment adviser but prior to reductions from brokerage service arrangements or other expense offset arrangements. Expenses net of all reductions represent the net expenses paid by the class.
G Amount does not include the portfolio activity of any underlying Fidelity Central Funds.
See accompanying notes which are an integral part of the financial statements.
Notes to Financial Statements
For the period ended October 31, 2015
(Amounts in thousands except percentages)
1. Organization.
Fidelity Value Fund (the Fund) is a fund of Fidelity Capital Trust (the Trust) and is authorized to issue an unlimited number of shares. The Trust is registered under the Investment Company Act of 1940, as amended (the 1940 Act), as an open-end management investment company organized as a Massachusetts business trust. The Fund offers Value and Class K shares, each of which has equal rights as to assets and voting privileges. Each class has exclusive voting rights with respect to matters that affect that class.
2. Investments in Fidelity Central Funds.
The Fund invests in Fidelity Central Funds, which are open-end investment companies generally available only to other investment companies and accounts managed by the investment adviser and its affiliates. The Fund's Schedule of Investments lists each of the Fidelity Central Funds held as of period end, if any, as an investment of the Fund, but does not include the underlying holdings of each Fidelity Central Fund. As an Investing Fund, the Fund indirectly bears its proportionate share of the expenses of the underlying Fidelity Central Funds.
The Money Market Central Funds seek preservation of capital and current income and are managed by Fidelity Investments Money Management, Inc. (FIMM), an affiliate of the investment adviser. Annualized expenses of the Money Market Central Funds as of their most recent shareholder report date are less than .005%.
A complete unaudited list of holdings for each Fidelity Central Fund is available upon request or at the Securities and Exchange Commission (the SEC) website at www.sec.gov. In addition, the financial statements of the Fidelity Central Funds, which are not covered by the Fund's Report of Independent Registered Public Accounting Firm, are available on the SEC website or upon request.
3. Significant Accounting Policies.
The financial statements have been prepared in conformity with accounting principles generally accepted in the United States of America (GAAP), which require management to make certain estimates and assumptions at the date of the financial statements. Actual results could differ from those estimates. Subsequent events, if any, through the date that the financial statements were issued have been evaluated in the preparation of the financial statements. The following summarizes the significant accounting policies of the Fund:
Investment Valuation. Investments are valued as of 4:00 p.m. Eastern time on the last calendar day of the period. The Board of Trustees (the Board) has delegated the day to day responsibility for the valuation of the Fund's investments to the Fidelity Management & Research Company (FMR) Fair Value Committee (the Committee). In accordance with valuation policies and procedures approved by the Board, the Fund attempts to obtain prices from one or more third party pricing vendors or brokers to value its investments. When current market prices, quotations or currency exchange rates are not readily available or reliable, investments will be fair valued in good faith by the Committee, in accordance with procedures adopted by the Board. Factors used in determining fair value vary by investment type and may include market or investment specific events, changes in interest rates and credit quality. The frequency with which these procedures are used cannot be predicted and they may be utilized to a significant extent. The Committee oversees the Fund's valuation policies and procedures and reports to the Board on the Committee's activities and fair value determinations. The Board monitors the appropriateness of the procedures used in valuing the Fund's investments and ratifies the fair value determinations of the Committee.
The Fund categorizes the inputs to valuation techniques used to value its investments into a disclosure hierarchy consisting of three levels as shown below:
- Level 1 – quoted prices in active markets for identical investments
- Level 2 – other significant observable inputs (including quoted prices for similar investments, interest rates, prepayment speeds, etc.)
- Level 3 – unobservable inputs (including the Fund's own assumptions based on the best information available)
Valuation techniques used to value the Fund's investments by major category are as follows:
Equity securities, including restricted securities, for which market quotations are readily available, are valued at the last reported sale price or official closing price as reported by a third party pricing vendor on the primary market or exchange on which they are traded and are categorized as Level 1 in the hierarchy. In the event there were no sales during the day or closing prices are not available, securities are valued at the last quoted bid price or may be valued using the last available price and are generally categorized as Level 2 in the hierarchy. For foreign equity securities, when market or security specific events arise, comparisons to the valuation of American Depositary Receipts (ADRs), futures contracts, Exchange-Traded Funds (ETFs)and certain indexes as well as quoted prices for similar securities may be used and would be categorized as Level 2 in the hierarchy. Utilizing these techniques may result in transfers between Level 1 and Level 2. For equity securities, including restricted securities, where observable inputs are limited, assumptions about market activity and risk are used and these securities may be categorized as Level 3 in the hierarchy.
Debt securities, including restricted securities, are valued based on evaluated prices received from third party pricing vendors or from brokers who make markets in such securities. Corporate bonds and preferred securities are valued by pricing vendors who utilize matrix pricing which considers yield or price of bonds of comparable quality, coupon, maturity and type or by broker-supplied prices. When independent prices are unavailable or unreliable, debt securities may be valued utilizing pricing methodologies which consider similar factors that would be used by third party pricing vendors. Debt securities are generally categorized as Level 2 in the hierarchy but may be Level 3 depending on the circumstances.
Futures contracts are valued at the settlement price established each day by the board of trade or exchange on which they are traded and are categorized as Level 1 in the hierarchy. Investments in open-end mutual funds, including the Fidelity Central Funds, are valued at their closing net asset value (NAV) each business day and are categorized as Level 1 in the hierarchy.
Changes in valuation techniques may result in transfers in or out of an assigned level within the disclosure hierarchy. The aggregate value of investments by input level as of October 31, 2015 is included at the end of the Fund's Schedule of Investments.
Foreign Currency. The Fund may use foreign currency contracts to facilitate transactions in foreign-denominated securities. Gains and losses from these transactions may arise from changes in the value of the foreign currency or if the counterparties do not perform under the contracts' terms.
Foreign-denominated assets, including investment securities, and liabilities are translated into U.S. dollars at the exchange rates at period end. Purchases and sales of investment securities, income and dividends received and expenses denominated in foreign currencies are translated into U.S. dollars at the exchange rate in effect on the transaction date.
The effects of exchange rate fluctuations on investments are included with the net realized and unrealized gain (loss) on investment securities. Other foreign currency transactions resulting in realized and unrealized gain (loss) are disclosed separately.
Investment Transactions and Income. For financial reporting purposes, the Fund's investment holdings and NAV include trades executed through the end of the last business day of the period. The NAV per share for processing shareholder transactions is calculated as of the close of business of the New York Stock Exchange (NYSE), normally 4:00 p.m. Eastern time and includes trades executed through the end of the prior business day. Gains and losses on securities sold are determined on the basis of identified cost and may include proceeds received from litigation. Dividend income is recorded on the ex-dividend date, except for certain dividends from foreign securities where the ex-dividend date may have passed, which are recorded as soon as the Fund is informed of the ex-dividend date. Non-cash dividends included in dividend income, if any, are recorded at the fair market value of the securities received. Income and capital gain distributions from Fidelity Central Funds, if any, are recorded on the ex-dividend date. Distributions received on securities that represent a return of capital or capital gain are recorded as a reduction of cost of investments and/or as a realized gain. Subsequent to ex-dividend date the Fund determines the components of these distributions, based upon receipt of tax filings or other correspondence relating to the underlying investment. Interest income is accrued as earned and includes coupon interest and amortization of premium and accretion of discount on debt securities as applicable. Investment income is recorded net of foreign taxes withheld where recovery of such taxes is uncertain.
Class Allocations and Expenses. Investment income, realized and unrealized capital gains and losses, common expenses of the Fund, and certain fund-level expense reductions, if any, are allocated daily on a pro-rata basis to each class based on the relative net assets of each class to the total net assets of the Fund. Each class differs with respect to transfer agent fees incurred. Certain expense reductions may also differ by class. For the reporting period, the allocated portion of income and expenses to each class as a percent of its average net assets may vary due to the timing of recording these transactions in relation to fluctuating net assets of the classes. Expenses directly attributable to a fund are charged to that fund. Expenses attributable to more than one fund are allocated among the respective funds on the basis of relative net assets or other appropriate methods. Expense estimates are accrued in the period to which they relate and adjustments are made when actual amounts are known.
Deferred Trustee Compensation. Under a Deferred Compensation Plan (the Plan), independent Trustees may elect to defer receipt of a portion of their annual compensation. Deferred amounts are invested in a cross-section of Fidelity funds, are marked-to-market and remain in the Fund until distributed in accordance with the Plan. The investment of deferred amounts and the offsetting payable to the Trustees are included in the accompanying Statement of Assets and Liabilities.
Income Tax Information and Distributions to Shareholders. Each year, the Fund intends to qualify as a regulated investment company under Subchapter M of the Internal Revenue Code, including distributing substantially all of its taxable income and realized gains. As a result, no provision for U.S. Federal income taxes is required. As of October 31, 2015, the Fund did not have any unrecognized tax benefits in the financial statements; nor is the Fund aware of any tax positions for which it is reasonably possible that the total amounts of unrecognized tax benefits will significantly change in the next twelve months. The Fund files a U.S. federal tax return, in addition to state and local tax returns as required. The Fund's federal income tax returns are subject to examination by the Internal Revenue Service (IRS) for a period of three fiscal years after they are filed. State and local tax returns may be subject to examination for an additional fiscal year depending on the jurisdiction. Foreign taxes are provided for based on the Fund's understanding of the tax rules and rates that exist in the foreign markets in which it invests.
Distributions are declared and recorded on the ex-dividend date. Income dividends and capital gain distributions are declared separately for each class. Income and capital gain distributions are determined in accordance with income tax regulations, which may differ from GAAP. In addition, the Fund claimed a portion of the payment made to redeeming shareholders as a distribution for income tax purposes.
Capital accounts within the financial statements are adjusted for permanent book-tax differences. These adjustments have no impact on net assets or the results of operations. Capital accounts are not adjusted for temporary book-tax differences which will reverse in a subsequent period.
Book-tax differences are primarily due to futures contracts, foreign currency transactions, passive foreign investment companies (PFIC), market discount, partnerships, deferred trustees compensation and losses deferred due to wash sales.
The federal tax cost of investment securities and unrealized appreciation (depreciation) as of period end were as follows:
| Gross unrealized appreciation | $926,890 |
| Gross unrealized depreciation | (891,362) |
| Net unrealized appreciation (depreciation) on securities | $35,528 |
| Tax Cost | $8,954,503 |
The tax-based components of distributable earnings as of period end were as follows:
| Undistributed ordinary income | $198,307 |
| Undistributed long-term capital gain | $595,865 |
| Net unrealized appreciation (depreciation) on securities and other investments | $35,526 |
The tax character of distributions paid was as follows:
| October 31, 2015 | October 31, 2014 | |
| Ordinary Income | $77,668 | $ 87,445 |
| Long-term Capital Gains | 128,936 | – |
| Total | $206,604 | $ 87,445 |
Restricted Securities. The Fund may invest in securities that are subject to legal or contractual restrictions on resale. These securities generally may be resold in transactions exempt from registration or to the public if the securities are registered. Disposal of these securities may involve time-consuming negotiations and expense, and prompt sale at an acceptable price may be difficult. Information regarding restricted securities is included at the end of the Fund's Schedule of Investments.
4. Derivative Instruments.
Risk Exposures and the Use of Derivative Instruments. The Fund's investment objective allows the Fund to enter into various types of derivative contracts, including futures contracts. Derivatives are investments whose value is primarily derived from underlying assets, indices or reference rates and may be transacted on an exchange or over-the-counter (OTC). Derivatives may involve a future commitment to buy or sell a specified asset based on specified terms, to exchange future cash flows at periodic intervals based on a notional principal amount, or for one party to make one or more payments upon the occurrence of specified events in exchange for periodic payments from the other party.
The Fund used derivatives to increase returns and to manage exposure to certain risks as defined below. The success of any strategy involving derivatives depends on analysis of numerous economic factors, and if the strategies for investment do not work as intended, the Fund may not achieve its objectives.
The Fund's use of derivatives increased or decreased its exposure to the following risk:
| Equity Risk | Equity risk relates to the fluctuations in the value of financial instruments as a result of changes in market prices (other than those arising from interest rate risk or foreign exchange risk), whether caused by factors specific to an individual investment, its issuer, or all factors affecting all instruments traded in a market or market segment. |
The Fund is also exposed to additional risks from investing in derivatives, such as liquidity risk and counterparty credit risk. Liquidity risk is the risk that the Fund will be unable to close out the derivative in the open market in a timely manner. Counterparty credit risk is the risk that the counterparty will not be able to fulfill its obligation to the Fund. Counterparty credit risk related to exchange-traded futures contracts may be mitigated by the protection provided by the exchange on which they trade.
Investing in derivatives may involve greater risks than investing in the underlying assets directly and, to varying degrees, may involve risk of loss in excess of any initial investment and collateral received and amounts recognized in the Statement of Assets and Liabilities. In addition, there may be the risk that the change in value of the derivative contract does not correspond to the change in value of the underlying instrument.
Futures Contracts. A futures contract is an agreement between two parties to buy or sell a specified underlying instrument for a fixed price at a specified future date. The Fund used futures contracts to manage its exposure to the stock market.
Upon entering into a futures contract, a fund is required to deposit either cash or securities (initial margin) with a clearing broker in an amount equal to a certain percentage of the face value of the contract. Futures contracts are marked-to-market daily and subsequent daily payments (variation margin) are made or received by a fund depending on the daily fluctuations in the value of the futures contracts and are recorded as unrealized appreciation or (depreciation). This receivable and/or payable, if any, is included in daily variation margin for derivative instruments in the Statement of Assets and Liabilities. Realized gain or (loss) is recorded upon the expiration or closing of a futures contract.
Any open futures contracts at period end are presented in the Schedule of Investments under the caption "Futures Contracts". The underlying face amount at value reflects each contract's exposure to the underlying instrument or index at period end and is representative of volume of activity during the period. Cash deposited to meet initial margin requirements is presented as segregated cash with brokers for derivative instruments in the Statement of Assets and Liabilities.
During the period the Fund recognized net realized gain (loss) of $5,819 and a change in net unrealized appreciation (depreciation) of $(1,553) related to its investment in futures contracts. These amounts are included in the Statement of Operations.
5. Purchases and Sales of Investments.
Purchases and sales of securities, other than short-term securities, aggregated $7,311,581 and $7,814,719, respectively.
6. Fees and Other Transactions with Affiliates.
Management Fee. Fidelity Management & Research Company (the investment adviser) and its affiliates provide the Fund with investment management related services for which the Fund pays a monthly management fee. The management fee is the sum of an individual fund fee rate that is based on an annual rate of .30% of the Fund's average net assets and an annualized group fee rate that averaged .25% during the period. The group fee rate is based upon the average net assets of all the mutual funds advised by the investment adviser, including any mutual funds previously advised by the investment adviser that are currently advised by Fidelity SelectCo, LLC, an affiliate of the investment adviser. The group fee rate decreases as assets under management increase and increases as assets under management decrease. In addition, the management fee is subject to a performance adjustment (up to a maximum of +/- .20% of the Fund's average net assets over a 36 month performance period). The upward or downward adjustment to the management fee is based on the relative investment performance of Value as compared to its benchmark index, the Russell Midcap Value Index, over the same 36 month performance period. For the reporting period, the total annual management fee rate, including the performance adjustment, was .61% of the Fund's average net assets. The performance adjustment included in the management fee rate may be higher or lower than the maximum performance adjustment rate due to the difference between the average net assets for the reporting and performance periods.
Transfer Agent Fees. Fidelity Investments Institutional Operations Company, Inc., (FIIOC), an affiliate of the investment adviser, is the transfer, dividend disbursing and shareholder servicing agent for each class of the Fund. FIIOC receives account fees and asset-based fees that vary according to the account size and type of account of the shareholders of Value. FIIOC receives an asset-based fee of Class K's average net assets. FIIOC pays for typesetting, printing and mailing of shareholder reports, except proxy statements.
For the period, transfer agent fees for each class were as follows:
| Amount | % of Class-Level Average Net Assets | |
| Value | $12,750 | .16 |
| Class K | 716 | .05 |
| $ 13,466 |
Accounting and Security Lending Fees. Fidelity Service Company, Inc. (FSC), an affiliate of the investment adviser, maintains the Fund's accounting records. The accounting fee is based on the level of average net assets for each month. Under a separate contract, FSC administers the security lending program. The security lending fee is based on the number and duration of lending transactions.
Brokerage Commissions. The Fund placed a portion of its portfolio transactions with brokerage firms which are affiliates of the investment adviser. Brokerage commissions are included in net realized gain (loss) and change in net unrealized appreciation (depreciation) in the Statement of Operations. The commissions paid to these affiliated firms were $211 for the period.
Other. During the period, the investment adviser reimbursed the Fund for certain losses in the amount of $3.
7. Committed Line of Credit.
The Fund participates with other funds managed by the investment adviser or an affiliate in a $4.25 billion credit facility (the "line of credit") to be utilized for temporary or emergency purposes to fund shareholder redemptions or for other short-term liquidity purposes. The Fund has agreed to pay commitment fees on its pro-rata portion of the line of credit, which amounted to $14 and is reflected in Miscellaneous expenses on the Statement of Operations. During the period, the Fund did not borrow on this line of credit.
8. Security Lending.
The Fund lends portfolio securities through a lending agent from time to time in order to earn additional income. For equity securities, a lending agent is used and may loan securities to certain qualified borrowers, including Fidelity Capital Markets (FCM), a broker-dealer affiliated with the Fund. On the settlement date of the loan, the Fund receives collateral (in the form of U.S. Treasury obligations, letters of credit and/or cash) against the loaned securities and maintains collateral in an amount not less than 100% of the market value of the loaned securities during the period of the loan. The market value of the loaned securities is determined at the close of business of the Fund and any additional required collateral is delivered to the Fund on the next business day. The Fund or borrower may terminate the loan at any time, and if the borrower defaults on its obligation to return the securities loaned because of insolvency or other reasons, the Fund may apply collateral received from the borrower against the obligation. The Fund may experience delays and costs in recovering the securities loaned. Any cash collateral received is invested in the Fidelity Securities Lending Cash Central Fund. The value of loaned securities and cash collateral at period end are disclosed on the Fund's Statement of Assets and Liabilities. At period end, there were no security loans outstanding with FCM. Security lending income represents the income earned on investing cash collateral, less rebates paid to borrowers and any lending agent fees associated with the loan, plus any premium payments received for lending certain types of securities. Security lending income is presented in the Statement of Operations as a component of income from Fidelity Central Funds. Total security lending income during the period amounted to $1,633, including $21 from securities loaned to FCM.
9. Expense Reductions.
Commissions paid to certain brokers with whom the investment adviser, or its affiliates, places trades on behalf of the Fund include an amount in addition to trade execution, which may be rebated back to the Fund to offset certain expenses. This amount totaled $605 for the period.
In addition, during the period the investment adviser reimbursed and/or waived a portion of fund-level operating expenses in the amount of $39 and a portion of class-level operating expenses as follows:
| Amount | |
| Value | $174 |
10. Distributions to Shareholders.
Distributions to shareholders of each class were as follows:
| Years ended October 31, | 2015 | 2014 |
| From net investment income | ||
| Value | $63,932 | $61,240 |
| Class K | 13,736 | 12,496 |
| Total | $77,668 | $73,736 |
| From net realized gain | ||
| Value | $108,489 | $11,624 |
| Class K | 20,447 | 2,085 |
| Total | $128,936 | $13,709 |
11. Share Transactions.
Share transactions for each class were as follows and may contain automatic conversions between classes or exchanges between funds:
| Shares | Shares | Dollars | Dollars | |
| Years ended October 31, | 2015 | 2014 | 2015 | 2014 |
| Value | ||||
| Shares sold | 5,497 | 9,711 | $627,144 | $1,038,871 |
| Reinvestment of distributions | 1,454 | 693 | 164,069 | 69,558 |
| Shares redeemed | (10,799) | (11,257) | (1,231,193) | (1,196,902) |
| Net increase (decrease) | (3,848) | (853) | $(439,980) | $(88,473) |
| Class K | ||||
| Shares sold | 3,068 | 3,811 | $349,168 | $411,317 |
| Reinvestment of distributions | 303 | 145 | 34,183 | 14,580 |
| Shares redeemed | (3,955) | (3,357) | (454,065) | (361,869) |
| Net increase (decrease) | (584) | 599 | $(70,714) | $64,028 |
12. Other.
The Fund's organizational documents provide former and current trustees and officers with a limited indemnification against liabilities arising in connection with the performance of their duties to the Fund. In the normal course of business, the Fund may also enter into contracts that provide general indemnifications. The Fund's maximum exposure under these arrangements is unknown as this would be dependent on future claims that may be made against the Fund. The risk of material loss from such claims is considered remote.
Report of Independent Registered Public Accounting Firm
To the Trustees of Fidelity Capital Trust and Shareholders of Fidelity® Value Fund:
In our opinion, the accompanying statement of assets and liabilities, including the schedule of investments, and the related statements of operations and of changes in net assets and the financial highlights present fairly, in all material respects, the financial position of Fidelity® Value Fund (a fund of Fidelity Capital Trust) at October 31, 2015, the results of its operations for the year then ended, the changes in its net assets for each of the two years in the period then ended and the financial highlights for each of the five years in the period then ended, in conformity with accounting principles generally accepted in the United States of America. These financial statements and financial highlights (hereafter referred to as “financial statements”) are the responsibility of the Fidelity® Value Fund’s management. Our responsibility is to express an opinion on these financial statements based on our audits. We conducted our audits of these financial statements in accordance with the standards of the Public Company Accounting Oversight Board (United States). Those standards require that we plan and perform the audit to obtain reasonable assurance about whether the financial statements are free of material misstatement. An audit includes examining, on a test basis, evidence supporting the amounts and disclosures in the financial statements, assessing the accounting principles used and significant estimates made by management, and evaluating the overall financial statement presentation. We believe that our audits, which included confirmation of securities at October 31, 2015 by correspondence with the custodian and brokers, provide a reasonable basis for our opinion.
PricewaterhouseCoopers LLP
Boston, Massachusetts
December 15, 2015
Trustees and Officers
The Trustees, Members of the Advisory Board (if any), and officers of the trust and fund, as applicable, are listed below. The Board of Trustees governs the fund and is responsible for protecting the interests of shareholders. The Trustees are experienced executives who meet periodically throughout the year to oversee the fund's activities, review contractual arrangements with companies that provide services to the fund, oversee management of the risks associated with such activities and contractual arrangements, and review the fund's performance. Each of the Trustees oversees 170 funds.
The Trustees hold office without limit in time except that (a) any Trustee may resign; (b) any Trustee may be removed by written instrument, signed by at least two-thirds of the number of Trustees prior to such removal; (c) any Trustee who requests to be retired or who has become incapacitated by illness or injury may be retired by written instrument signed by a majority of the other Trustees; and (d) any Trustee may be removed at any special meeting of shareholders by a two-thirds vote of the outstanding voting securities of the trust. Each Trustee who is not an interested person (as defined in the 1940 Act) of the trust and the fund is referred to herein as an Independent Trustee. Each Independent Trustee shall retire not later than the last day of the calendar year in which his or her 75th birthday occurs. The Independent Trustees may waive this mandatory retirement age policy with respect to individual Trustees. Officers and Advisory Board Members hold office without limit in time, except that any officer or Advisory Board Member may resign or may be removed by a vote of a majority of the Trustees at any regular meeting or any special meeting of the Trustees. Except as indicated, each individual has held the office shown or other offices in the same company for the past five years.
The fund’s Statement of Additional Information (SAI) includes more information about the Trustees. To request a free copy, call Fidelity at 1-800-544-8544.
Experience, Skills, Attributes, and Qualifications of the Trustees. The Governance and Nominating Committee has adopted a statement of policy that describes the experience, qualifications, attributes, and skills that are necessary and desirable for potential Independent Trustee candidates (Statement of Policy). The Board believes that each Trustee satisfied at the time he or she was initially elected or appointed a Trustee, and continues to satisfy, the standards contemplated by the Statement of Policy. The Governance and Nominating Committee also engages professional search firms to help identify potential Independent Trustee candidates who have the experience, qualifications, attributes, and skills consistent with the Statement of Policy. From time to time, additional criteria based on the composition and skills of the current Independent Trustees, as well as experience or skills that may be appropriate in light of future changes to board composition, business conditions, and regulatory or other developments, have also been considered by the professional search firms and the Governance and Nominating Committee. In addition, the Board takes into account the Trustees' commitment and participation in Board and committee meetings, as well as their leadership of standing and ad hoc committees throughout their tenure.
In determining that a particular Trustee was and continues to be qualified to serve as a Trustee, the Board has considered a variety of criteria, none of which, in isolation, was controlling. The Board believes that, collectively, the Trustees have balanced and diverse experience, qualifications, attributes, and skills, which allow the Board to operate effectively in governing the fund and protecting the interests of shareholders. Information about the specific experience, skills, attributes, and qualifications of each Trustee, which in each case led to the Board's conclusion that the Trustee should serve (or continue to serve) as a trustee of the fund, is provided below.
Board Structure and Oversight Function. James C. Curvey is an interested person and currently serves as Chairman. The Trustees have determined that an interested Chairman is appropriate and benefits shareholders because an interested Chairman has a personal and professional stake in the quality and continuity of services provided to the fund. Independent Trustees exercise their informed business judgment to appoint an individual of their choosing to serve as Chairman, regardless of whether the Trustee happens to be independent or a member of management. The Independent Trustees have determined that they can act independently and effectively without having an Independent Trustee serve as Chairman and that a key structural component for assuring that they are in a position to do so is for the Independent Trustees to constitute a substantial majority for the Board. The Independent Trustees also regularly meet in executive session. Ned C. Lautenbach serves as Chairman of the Independent Trustees and as such (i) acts as a liaison between the Independent Trustees and management with respect to matters important to the Independent Trustees and (ii) with management prepares agendas for Board meetings.
Fidelity® funds are overseen by different Boards of Trustees. The fund's Board oversees Fidelity's high income and certain equity funds, and other Boards oversee Fidelity's investment-grade bond, money market, asset allocation, and sector funds. The asset allocation funds may invest in Fidelity® funds overseen by the fund's Board. The use of separate Boards, each with its own committee structure, allows the Trustees of each group of Fidelity® funds to focus on the unique issues of the funds they oversee, including common research, investment, and operational issues. On occasion, the separate Boards establish joint committees to address issues of overlapping consequences for the Fidelity® funds overseen by each Board.
The Trustees operate using a system of committees to facilitate the timely and efficient consideration of all matters of importance to the Trustees, the fund, and fund shareholders and to facilitate compliance with legal and regulatory requirements and oversight of the fund's activities and associated risks. The Board, acting through its committees, has charged FMR and its affiliates with (i) identifying events or circumstances the occurrence of which could have demonstrably adverse effects on the fund's business and/or reputation; (ii) implementing processes and controls to lessen the possibility that such events or circumstances occur or to mitigate the effects of such events or circumstances if they do occur; and (iii) creating and maintaining a system designed to evaluate continuously business and market conditions in order to facilitate the identification and implementation processes described in (i) and (ii) above. Because the day-to-day operations and activities of the fund are carried out by or through FMR, its affiliates, and other service providers, the fund's exposure to risks is mitigated but not eliminated by the processes overseen by the Trustees. While each of the Board's committees has responsibility for overseeing different aspects of the fund's activities, oversight is exercised primarily through the Operations, Audit, and Compliance Committees. In addition, the Independent Trustees have worked with FMR to enhance the Board's oversight of investment and financial risks, legal and regulatory risks, technology risks, and operational risks, including the development of additional risk reporting to the Board. For example, a working group comprised of Independent Trustees and FMR has worked and continues to work to review the Fidelity® funds' valuation-related activities, reporting and risk management. Appropriate personnel, including but not limited to the fund's Chief Compliance Officer (CCO), FMR's internal auditor, the independent accountants, the fund's Treasurer and portfolio management personnel, make periodic reports to the Board's committees, as appropriate, including an annual review of Fidelity's risk management program for the Fidelity® funds. The responsibilities of each standing committee, including their oversight responsibilities, are described further under "Standing Committees of the Trustees."
Interested Trustees*:
Correspondence intended for a Trustee who is an interested person may be sent to Fidelity Investments, 245 Summer Street, Boston, Massachusetts 02210.
Name, Year of Birth; Principal Occupations and Other Relevant Experience+
James C. Curvey (1935)
Year of Election or Appointment: 2007
Trustee
Chairman of the Board of Trustees
Mr. Curvey also serves as Trustee of other Fidelity® funds. Mr. Curvey is a Director of Fidelity Research & Analysis Co. (investment adviser firm, 2009-present), and Vice Chairman (2007-present) and Director of FMR LLC (diversified financial services company). In addition, Mr. Curvey serves as an Overseer for the Boston Symphony Orchestra and a member of the board of Artis-Naples, Naples, Florida, and as a Trustee for Brewster Academy, Wolfeboro, New Hampshire. Previously, Mr. Curvey served as a Director of Fidelity Investments Money Management, Inc. (investment adviser firm, 2009-2014) and a Director of FMR and FMR Co., Inc. (investment adviser firms, 2007-2014).
Charles S. Morrison (1960)
Year of Election or Appointment: 2014
Trustee
Mr. Morrison also serves as Trustee of other funds. He serves as a Director of Fidelity Investments Money Management, Inc. (FIMM) (investment adviser firm, 2014-present), Director of Fidelity SelectCo, LLC (investment adviser firm, 2014-present), President, Asset Management (2014-present), and is an employee of Fidelity Investments. Previously, Mr. Morrison served as Vice President of Fidelity's Fixed Income and Asset Allocation Funds (2012-2014), President, Fixed Income (2011-2014), Vice President of Fidelity's Money Market Funds (2005-2009), President, Money Market Group Leader of FMR (investment adviser firm, 2009), and Senior Vice President, Money Market Group of FMR (2004-2009). Mr. Morrison also served as Vice President of Fidelity's Bond Funds (2002-2005), certain Balanced Funds (2002-2005), and certain Asset Allocation Funds (2002-2007), and as Senior Vice President (2002-2005) of Fidelity's Bond Division.
* Determined to be an “Interested Trustee” by virtue of, among other things, his or her affiliation with the trust or various entities under common control with FMR.
+ The information includes the Trustee's principal occupation during the last five years and other information relating to the experience, attributes, and skills relevant to the Trustee's qualifications to serve as a Trustee, which led to the conclusion that the Trustee should serve as a Trustee for the fund.
Independent Trustees:
Correspondence intended for an Independent Trustee may be sent to Fidelity Investments, P.O. Box 55235, Boston, Massachusetts 02205-5235.
Name, Year of Birth; Principal Occupations and Other Relevant Experience+
Dennis J. Dirks (1948)
Year of Election or Appointment: 2005
Trustee
Mr. Dirks also serves as Trustee of other Fidelity® funds. Prior to his retirement in May 2003, Mr. Dirks was Chief Operating Officer and a member of the Board of The Depository Trust & Clearing Corporation (DTCC). He also served as President, Chief Operating Officer, and Board member of The Depository Trust Company (DTC) and President and Board member of the National Securities Clearing Corporation (NSCC). In addition, Mr. Dirks served as Chief Executive Officer and Board member of the Government Securities Clearing Corporation, Chief Executive Officer and Board member of the Mortgage-Backed Securities Clearing Corporation, as a Trustee and a member of the Finance Committee of Manhattan College (2005-2008), as a Trustee and a member of the Finance Committee of AHRC of Nassau County (2006-2008), and as a member of the Independent Directors Council (IDC) Governing Council (2010-2015). Mr. Dirks is a member of the Board of Directors for The Brookville Center for Children's Services, Inc. (2009-present).
Alan J. Lacy (1953)
Year of Election or Appointment: 2008
Trustee
Mr. Lacy also serves as Trustee of other Fidelity® funds. Mr. Lacy serves as a member of the Board of Directors of Dave & Buster's Entertainment, Inc. (restaurant and entertainment complexes, 2010-present) and Bristol-Myers Squibb Company (global pharmaceuticals, 2008-present). In addition, Mr. Lacy served as Senior Adviser (2007-2014) of Oak Hill Capital Partners, L.P. (private equity) and also served as Chief Executive Officer (2000-2005) and Vice Chairman (2005-2006) of Sears Holdings Corporation and Sears, Roebuck and Co. (retail). Mr. Lacy is a member of the Board of Trustees of The National Parks Conservation Association (2006-present). Previously, Mr. Lacy served as Chairman of the Board of Trustees of the National Parks Conservation Association (2008-2011) and as a member of the Board of Directors for The Western Union Company (global money transfer, 2006-2011), The Hillman Companies, Inc. (hardware wholesalers, 2010-2014), and Earth Fare, Inc. (retail grocery, 2010-2014).
Ned C. Lautenbach (1944)
Year of Election or Appointment: 2000
Trustee
Chairman of the Independent Trustees
Mr. Lautenbach also serves as Trustee of other Fidelity® funds. Mr. Lautenbach currently serves as the Lead Director of the Eaton Corporation Board of Directors (diversified industrial, 1997-present). Mr. Lautenbach is Chairman of the Board of Directors of Artis-Naples in Naples, Florida (2012-present), a member of the Council on Foreign Relations (1994-present), and a member of the Board of Governors, State University System of Florida (2013-present). Previously, Mr. Lautenbach was a Partner/Advisory Partner at Clayton, Dubilier & Rice, LLC (private equity investment, 1998-2010), as well as a Director of Sony Corporation (2006-2007).
Joseph Mauriello (1944)
Year of Election or Appointment: 2008
Trustee
Mr. Mauriello also serves as Trustee of other Fidelity® funds. Prior to his retirement in January 2006, Mr. Mauriello served in numerous senior management positions including Deputy Chairman and Chief Operating Officer (2004-2005), and Vice Chairman of Financial Services (2002-2004) of KPMG LLP US (professional services, 1965-2005). Mr. Mauriello currently serves as a member of the Board of Directors of XL Group plc. (global insurance and re-insurance, 2006-present) and the Independent Directors Council (IDC) Governing Council (2015-present). Previously, Mr. Mauriello served as a Director of the Hamilton Funds of the Bank of New York (2006-2007) and of Arcadia Resources Inc. (health care services and products, 2007-2012).
Robert W. Selander (1950)
Year of Election or Appointment: 2011
Trustee
Mr. Selander also serves as Trustee of other Fidelity® funds. Mr. Selander serves as a Director of The Western Union Company (global money transfer, 2014-present). Previously, Mr. Selander served as a Member of the Advisory Board of other Fidelity® funds (2011), and Executive Vice Chairman (2010), Chief Executive Officer (2009-2010), and President and Chief Executive Officer (1997-2009) of Mastercard, Inc.
Cornelia M. Small (1944)
Year of Election or Appointment: 2005
Trustee
Ms. Small also serves as Trustee of other Fidelity® funds. Ms. Small is a member of the Board of Directors (2009-present) and Chair of the Investment Committee (2010-present) of the Teagle Foundation. Ms. Small also serves on the Investment Committee of the Berkshire Taconic Community Foundation (2008-present). Previously, Ms. Small served as Chairperson (2002-2008) and a member of the Investment Committee and Chairperson (2008-2012) and a member of the Board of Trustees of Smith College. In addition, Ms. Small served as Chief Investment Officer, Director of Global Equity Investments, and a member of the Board of Directors of Scudder, Stevens & Clark and Scudder Kemper Investments.
William S. Stavropoulos (1939)
Year of Election or Appointment: 2002
Trustee
Vice Chairman of the Independent Trustees
Mr. Stavropoulos also serves as Trustee of other Fidelity® funds. Mr. Stavropoulos serves as President and Founder of the Michigan Baseball Foundation, the Great Lakes Loons (2007-present). Mr. Stavropoulos is Chairman Emeritus of the Board of Directors of The Dow Chemical Company, where he previously served in numerous senior management positions, including President, CEO (1995-2000; 2002-2004), Chairman of the Executive Committee (2000-2006), and as a member of the Board of Directors (1990-2006). Currently, Mr. Stavropoulos is Chairman of the Board of Directors of Univar Inc. (global distributor of commodity and specialty chemicals), a Director of Teradata Corporation (data warehousing and technology solutions), and Maersk Inc. (industrial conglomerate), and a member of the Advisory Board for Metalmark Capital LLC (private equity investment, 2005-present). Mr. Stavropoulos is an operating advisor to Clayton, Dubilier & Rice, LLC (private equity investment). In addition, Mr. Stavropoulos is a member of the University of Notre Dame Advisory Council for the College of Science, a Trustee of the Rollin L. Gerstacker Foundation, and a Director of the Naples Philharmonic Center for the Arts. Previously, Mr. Stavropoulos served as a Director of Chemical Financial Corporation (bank holding company, 1993-2012) and Tyco International, Ltd. (multinational manufacturing and services, 2007-2012).
David M. Thomas (1949)
Year of Election or Appointment: 2008
Trustee
Mr. Thomas also serves as Trustee of other Fidelity® funds. Mr. Thomas serves as Non-Executive Chairman of the Board of Directors of Fortune Brands Home and Security (home and security products, 2011-present), as a member of the Board of Directors (2004-present) and Presiding Director (2013-present) of Interpublic Group of Companies, Inc. (marketing communication), and as a member of the Board of Trustees of the University of Florida (2013-present). Previously, Mr. Thomas served as Executive Chairman (2005-2006) and Chairman and Chief Executive Officer (2000-2005) of IMS Health, Inc. (pharmaceutical and healthcare information solutions), and a Director of Fortune Brands, Inc. (consumer products, 2000-2011).
+ The information includes the Trustee's principal occupation during the last five years and other information relating to the experience, attributes, and skills relevant to the Trustee's qualifications to serve as a Trustee, which led to the conclusion that the Trustee should serve as a Trustee for the fund.
Advisory Board Members and Officers:
Correspondence intended for an officer or Peter S. Lynch may be sent to Fidelity Investments, 245 Summer Street, Boston, Massachusetts 02210. Officers appear below in alphabetical order.
Name, Year of Birth; Principal Occupation
Peter S. Lynch (1944)
Year of Election or Appointment: 2003
Member of the Advisory Board
Mr. Lynch also serves as Member of the Advisory Board of other Fidelity® funds. Mr. Lynch is Vice Chairman and a Director of FMR (investment adviser firm) and FMR Co., Inc. (investment adviser firm). In addition, Mr. Lynch serves as a Trustee of Boston College and as the Chairman of the Inner-City Scholarship Fund. Previously, Mr. Lynch served on the Special Olympics International Board of Directors (1997-2006).
Elizabeth Paige Baumann (1968)
Year of Election or Appointment: 2012
Anti-Money Laundering (AML) Officer
Ms. Baumann also serves as AML Officer of other funds. She is Chief AML Officer of FMR LLC (diversified financial services company, 2012-present) and is an employee of Fidelity Investments. Previously, Ms. Baumann served as Vice President and Deputy Anti-Money Laundering Officer (2007-2012).
Marc R. Bryant (1966)
Year of Election or Appointment: 2015
Secretary and Chief Legal Officer (CLO)
Mr. Bryant also serves as Secretary and CLO of other funds. Mr. Bryant serves as CLO, Secretary, and Senior Vice President of Fidelity Management & Research Company (investment adviser firm, 2015-present) and FMR Co., Inc. (investment adviser firm, 2015-present); Secretary of Fidelity SelectCo, LLC (investment adviser firm, 2015-present) and Fidelity Investments Money Management, Inc. (investment adviser firm, 2015-present); and CLO of Fidelity Management & Research (Hong Kong) Limited (investment adviser firm, 2015-present). He is Senior Vice President and Deputy General Counsel of FMR LLC (diversified financial services company). Previously, Mr. Bryant served as Secretary and Chief Legal Officer of Fidelity Rutland Square Trust II (2010-2014) and Assistant Secretary of Fidelity's Fixed Income and Asset Allocation Funds (2013-2015). Prior to joining Fidelity Investments, Mr. Bryant served as a Senior Vice President and the Head of Global Retail Legal for AllianceBernstein L.P. (2006-2010), and as the General Counsel for ProFund Advisors LLC (2001-2006).
William C. Coffey (1969)
Year of Election or Appointment: 2009
Assistant Secretary
Mr. Coffey also serves as Assistant Secretary of other funds. He is Senior Vice President and Deputy General Counsel of FMR LLC (diversified financial services company, 2010-present), and is an employee of Fidelity Investments. Previously, Mr. Coffey served as Vice President and Associate General Counsel of FMR LLC (2005-2009).
Jonathan Davis (1968)
Year of Election or Appointment: 2010
Assistant Treasurer
Mr. Davis also serves as Assistant Treasurer of other funds, and is an employee of Fidelity Investments. Previously, Mr. Davis served as Vice President and Associate General Counsel of FMR LLC (diversified financial services company, 2003-2010).
Adrien E. Deberghes (1967)
Year of Election or Appointment: 2008
Deputy Treasurer
Mr. Deberghes also serves as an officer of other funds. He is an employee of Fidelity Investments (2008-present). Prior to joining Fidelity Investments, Mr. Deberghes was Senior Vice President of Mutual Fund Administration at State Street Corporation (2007-2008), Senior Director of Mutual Fund Administration at Investors Bank & Trust (2005-2007), and Director of Finance for Dunkin' Brands (2000-2005).
Stephanie J. Dorsey (1969)
Year of Election or Appointment: 2010
Assistant Treasurer
Ms. Dorsey also serves as an officer of other funds. She is an employee of Fidelity Investments (2008-present) and has served in other fund officer roles. Prior to joining Fidelity Investments, Ms. Dorsey served as Treasurer (2004-2008) of the JPMorgan Mutual Funds and Vice President (2004-2008) of JPMorgan Chase Bank.
Howard J. Galligan III (1966)
Year of Election or Appointment: 2014
Chief Financial Officer
Mr. Galligan also serves as Chief Financial Officer of other funds. Mr. Galligan serves as President of Fidelity Pricing and Cash Management Services (FPCMS) (2014-present) and as a Director of Strategic Advisers, Inc. (investment adviser firm, 2008-present). Previously, Mr. Galligan served as Chief Administrative Officer of Asset Management (2011-2014) and Chief Operating Officer and Senior Vice President of Investment Support for Strategic Advisers, Inc. (2003-2011).
Scott C. Goebel (1968)
Year of Election or Appointment: 2015
Vice President
Mr. Goebel serves as Vice President of other funds and is an employee of Fidelity Investments (2001-present). Previously, Mr. Goebel served as Secretary of Fidelity SelectCo, LLC (investment adviser firm, 2013-2015), Fidelity Investments Money Management, Inc. (FIMM) (investment adviser firm, 2010-2015), and Fidelity Research and Analysis Company (FRAC) (investment adviser firm, 2010-2015); General Counsel, Secretary, and Senior Vice President of Fidelity Management & Research Company (investment adviser firm, 2008-2015) and FMR Co., Inc. (investment adviser firm, 2008-2015); Assistant Secretary of Fidelity Management & Research (Japan) Limited (investment adviser firm, 2008-2015) and FMR Investment Management (U.K.) Limited (investment adviser firm, 2008-2015); Chief Legal Officer (CLO) of Fidelity Management & Research (Hong Kong) Limited (investment adviser firm, 2008-2015); Secretary and CLO of certain Fidelity® funds (2008-2015); Assistant Secretary of FIMM (2008-2010), FRAC (2008-2010), and certain funds (2007-2008); and as Vice President and Secretary of Fidelity Distributors Corporation (FDC) (2005-2007).
Thomas C. Hense (1964)
Year of Election or Appointment: 2008, 2010, or 2015
Vice President
Mr. Hense serves as Vice President of Fidelity Advisor® Multi-Asset Income Fund (2015) and other funds (High Income (2008), Small Cap (2008), and Value (2010) funds), and is an employee of Fidelity Investments (1993-present). Previously, Mr. Hense served as a portfolio manager for Fidelity's Institutional Money Management Group (Pyramis) (2003-2008).
Brian B. Hogan (1964)
Year of Election or Appointment: 2009
Vice President
Mr. Hogan also serves as Trustee or Vice President of other funds. Mr. Hogan serves as a Director of Fidelity SelectCo, LLC (investment adviser firm, 2014-present) and President of the Equity Division of FMR (investment adviser firm, 2009-present). Previously, Mr. Hogan served as Senior Vice President, Equity Research of FMR (2006-2009) and as a portfolio manager.
Chris Maher (1972)
Year of Election or Appointment: 2013
Assistant Treasurer
Mr. Maher serves as Assistant Treasurer of other funds. Mr. Maher is Vice President of Valuation Oversight and is an employee of Fidelity Investments. Previously, Mr. Maher served as Vice President of Asset Management Compliance (2013), Vice President of the Program Management Group of FMR (investment adviser firm, 2010-2013), and Vice President of Valuation Oversight (2008-2010).
Kenneth B. Robins (1969)
Year of Election or Appointment: 2008
President and Treasurer
Mr. Robins also serves as an officer of other funds. Mr. Robins serves as Executive Vice President of Fidelity Investments Money Management, Inc. (FIMM) (investment adviser firm, 2013-present) and is an employee of Fidelity Investments (2004-present). Previously, Mr. Robins served in other fund officer roles.
Stacie M. Smith (1974)
Year of Election or Appointment: 2013
Deputy Treasurer
Ms. Smith also serves as an officer of other funds. She is an employee of Fidelity Investments (2009-present) and has served in other fund officer roles. Prior to joining Fidelity Investments, Ms. Smith served as Senior Audit Manager of Ernst & Young LLP (1996-2009).
Renee Stagnone (1975)
Year of Election or Appointment: 2013
Deputy Treasurer
Ms. Stagnone also serves as Deputy Treasurer of other funds. Ms. Stagnone is an employee of Fidelity Investments (1997-present).
Linda J. Wondrack (1964)
Year of Election or Appointment: 2014
Chief Compliance Officer
Ms. Wondrack also serves as Chief Compliance Officer of other funds. Ms. Wondrack is Executive Vice President and head of the Ethics Office and Asset Management Compliance for Fidelity Investments (2012-present). Ms. Wondrack also serves as Chief Compliance Officer of Fidelity SelectCo, LLC (investment adviser firm, 2014-present); Chief Compliance Officer of Impresa Management LLC (2013-present); and Chief Compliance Officer of FMR Co., Inc. (investment adviser firm), Fidelity Investments Money Management, Inc. (investment adviser firm), Fidelity Management & Research (Japan) Limited (investment adviser firm), FMR Investment Management (U.K.) Limited (investment adviser firm), Fidelity Management & Research (Hong Kong) (investment adviser firm), Fidelity Management & Research Company (investment adviser firm), FIAM LLC (investment adviser firm), and Strategic Advisers, Inc. (investment adviser firm), Ballyrock Investment Advisors LLC, and Northern Neck Investors LLC (2012-present). Previously, Ms. Wondrack served as Senior Vice President and Chief Compliance Officer for Columbia Management Investment Advisers, LLC (2005-2012); Chief Compliance Officer for certain funds within the Columbia Family of Funds (2007-2012); and Senior Vice President of Compliance Risk Management at Bank of America (2005-2010).
Joseph F. Zambello (1957)
Year of Election or Appointment: 2011
Deputy Treasurer
Mr. Zambello also serves as Deputy Treasurer of other funds. Mr. Zambello is an employee of Fidelity Investments (1991-present). Previously, Mr. Zambello served as Vice President of the Program Management Group of FMR (investment adviser firm, 2009-2011) and Vice President of the Transfer Agent Oversight Group (2005-2009).
Shareholder Expense Example
As a shareholder of the Fund, you incur two types of costs: (1) transaction costs and (2) ongoing costs, including management fees and other Fund expenses. This Example is intended to help you understand your ongoing costs (in dollars) of investing in the Fund and to compare these costs with the ongoing costs of investing in other mutual funds.
The Example is based on an investment of $1,000 invested at the beginning of the period and held for the entire period (May 1, 2015 to October 31, 2015).
Actual Expenses
The first line of the accompanying table for each class of the Fund provides information about actual account values and actual expenses. You may use the information in this line, together with the amount you invested, to estimate the expenses that you paid over the period. Simply divide your account value by $1,000.00 (for example, an $8,600 account value divided by $1,000.00 = 8.6), then multiply the result by the number in the first line for a class of the Fund under the heading entitled "Expenses Paid During Period" to estimate the expenses you paid on your account during this period. A small balance maintenance fee of $12.00 that is charged once a year may apply for certain accounts with a value of less than $2,000. This fee is not included in the table below. If it was, the estimate of expenses you paid during the period would be higher, and your ending account value lower, by this amount. In addition, the Fund, as a shareholder in the underlying Fidelity Central Funds, will indirectly bear its pro-rata share of the fees and expenses incurred by the underlying Fidelity Central Funds. These fees and expenses are not included in the Fund's annualized expense ratio used to calculate the expense estimate in the table below.
Hypothetical Example for Comparison Purposes
The second line of the accompanying table for each class of the Fund provides information about hypothetical account values and hypothetical expenses based on a Class' actual expense ratio and an assumed rate of return of 5% per year before expenses, which is not the Class' actual return. The hypothetical account values and expenses may not be used to estimate the actual ending account balance or expenses you paid for the period. You may use this information to compare the ongoing costs of investing in the Fund and other funds. To do so, compare this 5% hypothetical example with the 5% hypothetical examples that appear in the shareholder reports of the other funds. A small balance maintenance fee of $12.00 that is charged once a year may apply for certain accounts with a value of less than $2,000. This fee is not included in the table below. If it was, the estimate of expenses you paid during the period would be higher, and your ending account value lower, by this amount. In addition, the Fund, as a shareholder in the underlying Fidelity Central Funds, will indirectly bear its pro-rata share of the fees and expenses incurred by the underlying Fidelity Central Funds. These fees and expenses are not included in the Fund's annualized expense ratio used to calculate the expense estimate in the table below.
Please note that the expenses shown in the table are meant to highlight your ongoing costs only and do not reflect any transaction costs. Therefore, the second line of the table is useful in comparing ongoing costs only, and will not help you determine the relative total costs of owning different funds.
| Annualized Expense Ratio-A | Beginning Account Value May 1, 2015 | Ending Account Value October 31, 2015 | Expenses Paid During Period-B May 1, 2015 to October 31, 2015 | |
| Value | .81% | |||
| Actual | $1,000.00 | $944.80 | $3.97 | |
| Hypothetical-C | $1,000.00 | $1,021.12 | $4.13 | |
| Class K | .70% | |||
| Actual | $1,000.00 | $945.40 | $3.43 | |
| Hypothetical-C | $1,000.00 | $1,021.68 | $3.57 |
A Annualized expense ratio reflects expenses net of applicable fee waivers.
B Expenses are equal to each Class' annualized expense ratio, multiplied by the average account value over the period, multiplied by 184/365 (to reflect the one-half year period).
C 5% return per year before expenses
Distributions (Unaudited)
The Board of Trustees of Fidelity Value Fund voted to pay on December 7, 2015, to shareholders of record at the opening of business on December 4, 2015, a distribution of $9.355 per share derived from capital gains realized from sales of portfolio securities and a dividend of $1.150 per share from net investment income.
The fund hereby designates as a capital gain dividend with respect to the taxable year ended October 31, 2015, $596,996,371 or, if subsequently determined to be different, the net capital gain of such year.
The fund designates 98% and 86% of the dividends distributed on December 5, 2014 and December 26, 2014, respectively as qualifying for the dividends–received deduction for corporate shareholders.
The fund designates 100% of the dividends distributed in during the fiscal year as amounts which may be taken into account as a dividend for the purposes of the maximum rate under section 1(h)(11) of the Internal Revenue Code.
The fund will notify shareholders in January 2016 of amounts for use in preparing 2015 income tax returns.
Board Approval of Investment Advisory Contracts and Management Fees
Fidelity Value Fund
Each year, the Board of Trustees, including the Independent Trustees (together, the Board), votes on the renewal of the management contract with Fidelity Management & Research Company (FMR) and the sub-advisory agreements (together, the Advisory Contracts) for the fund. The Board, assisted by the advice of fund counsel and Independent Trustees' counsel, requests and considers a broad range of information relevant to the renewal of the Advisory Contracts throughout the year.
The Board meets regularly and, at each of its meetings, covers an extensive agenda of topics and materials and considers factors that are relevant to its annual consideration of the renewal of the fund's Advisory Contracts, including the services and support provided to the fund and its shareholders. The Board has established various standing committees (Committees), each composed of and chaired by Independent Trustees with varying backgrounds, to which the Board has assigned specific subject matter responsibilities in order to enhance effective decision-making by the Board. The Board, acting directly and through its Committees, requests and receives information concerning the annual consideration of the renewal of the fund's Advisory Contracts. The Board also meets as needed to consider matters specifically related to the Board's annual consideration of the renewal of the Advisory Contracts. Members of the Board may also meet with trustees of other Fidelity funds through ad hoc joint committees to discuss certain matters relevant to all of the Fidelity funds.
At its July 2015 meeting, the Board unanimously determined to renew the fund's Advisory Contracts. In reaching its determination, the Board considered all factors it believed relevant, including (i) the nature, extent, and quality of the services to be provided to the fund and its shareholders (including the investment performance of the fund); (ii) the competitiveness of the fund's management fee and total expense ratio relative to peer funds; (iii) the total costs of the services to be provided by and the profits to be realized by Fidelity from its relationship with the fund; and (iv) the extent to which (if any) economies of scale exist and would be realized as the fund grows, and whether any economies of scale are appropriately shared with fund shareholders.
In considering whether to renew the Advisory Contracts for the fund, the Board reached a determination, with the assistance of fund counsel and Independent Trustees' counsel and through the exercise of its business judgment, that the renewal of the Advisory Contracts was in the best interests of the fund and its shareholders and that the compensation payable under the Advisory Contracts was fair and reasonable. The Board's decision to renew the Advisory Contracts was not based on any single factor, but rather was based on a comprehensive consideration of all the information provided to the Board at its meetings throughout the year. The Board, in reaching its determination to renew the Advisory Contracts, was aware that shareholders of the fund have a broad range of investment choices available to them, including a wide choice among funds offered by Fidelity's competitors, and that the fund's shareholders, who have the opportunity to review and weigh the disclosure provided by the fund in its prospectus and other public disclosures, have chosen to invest in this fund, which is part of the Fidelity family of funds.
Nature, Extent, and Quality of Services Provided. The Board considered Fidelity's staffing as it relates to the fund, including the backgrounds of investment personnel of Fidelity, and also considered the fund's investment objective, strategies, and related investment philosophy. The Independent Trustees also had discussions with senior management of Fidelity's investment operations and investment groups. The Board considered the structure of the portfolio manager compensation program and whether this structure provides appropriate incentives to act in the best interests of the fund. Additionally, the Board considered the portfolio managers' investments, if any, in the funds that they manage.Resources Dedicated to Investment Management and Support Services. The Board and the Fund Oversight and Research Committees reviewed the general qualifications and capabilities of Fidelity's investment staff, including its size, education, experience, and resources, as well as Fidelity's approach to recruiting, training, managing, and compensating investment personnel. The Board noted that Fidelity has continued to increase the resources devoted to non-U.S. offices, including expansion of Fidelity's global investment organization. The Board also noted that Fidelity's analysts have extensive resources, tools and capabilities that allow them to conduct sophisticated quantitative and fundamental analysis, as well as credit analysis of issuers, counterparties and guarantors. Further, the Board considered that Fidelity's investment professionals have sufficient access to global information and data so as to provide competitive investment results over time, and that those professionals also have access to sophisticated tools that permit them to assess portfolio construction and risk and performance attribution characteristics continuously, as well as to transmit new information and research conclusions rapidly around the world. Additionally, in its deliberations, the Board considered Fidelity's trading, risk management, and compliance capabilities and resources, which are integral parts of the investment management process.Shareholder and Administrative Services. The Board considered (i) the nature, extent, quality, and cost of advisory, administrative, and shareholder services performed by FMR, the sub-advisers (together with FMR, the Investment Advisers), and their affiliates under the Advisory Contracts and under separate agreements covering transfer agency, pricing and bookkeeping, and securities lending services for the fund; (ii) the nature and extent of the supervision of third party service providers, principally custodians and subcustodians; and (iii) the resources devoted to, and the record of compliance with, the fund's compliance policies and procedures. The Board also reviewed the allocation of fund brokerage, including allocations to brokers affiliated with the Investment Advisers, the use of brokerage commissions to pay fund expenses, and the use of "soft" commission dollars to pay for research services.The Board noted that the growth of fund assets over time across the complex allows Fidelity to reinvest in the development of services designed to enhance the value or convenience of the Fidelity funds as investment vehicles. These services include 24-hour access to account information and market information through telephone representatives and over the Internet, investor education materials and asset allocation tools, and the expanded availability of Fidelity Investor Centers.In 2014, the Board formed an ad hoc Committee on Transfer Agency Fees to review the variety of transfer agency fee structures throughout the industry and Fidelity's competitive positioning with respect to industry participants.Investment in a Large Fund Family. The Board considered the benefits to shareholders of investing in a Fidelity fund, including the benefits of investing in a fund that is part of a large family of funds offering a variety of investment disciplines and providing a large variety of mutual fund investor services. The Board noted that Fidelity had taken, or had made recommendations that resulted in the Fidelity funds taking, a number of actions over the previous year that benefited particular funds, including (i) continuing to dedicate additional resources to investment research and to the support of the senior management team that oversees asset management; (ii) continuing efforts to enhance Fidelity's global research capabilities; (iii) launching new funds and making other enhancements to meet client needs; (iv) reducing management fees and total expenses for certain index funds and diversified international funds; (v) continuing to launch dedicated lower cost underlying funds to meet portfolio construction needs related to expanding underlying fund options for Fidelity funds of funds, specifically for the Freedom Fund product lines; (vi) rationalizing product lines and gaining increased efficiencies through fund mergers; (vii) launching active fixed-income exchange-traded funds; (viii) continuing to develop, acquire and implement systems and technology to improve services to the funds and information security and to increase efficiency; (ix) implementing investment enhancements to further strengthen Fidelity's target date product line to increase investors' probability of success in achieving their goals; (x) modifying the eligibility criteria for certain share classes to accommodate roll-over assets from employer-sponsored retirement plans; (xi) launching a new Class W of the Freedom Index Funds to attract and retain Fidelity record-kept retirement plan assets; and (xii) implementing changes to Fidelity's money market product line in response to recent money market regulatory reforms.Investment Performance. The Board considered whether the fund has operated in accordance with its investment objective, as well as its record of compliance with its investment restrictions and its performance history. The Board noted that there was a portfolio management change for the fund in January 2014.The Board took into account discussions with representatives of the Investment Advisers about fund investment performance that occur at Board meetings throughout the year. In this regard the Board noted that as part of regularly scheduled fund reviews and other reports to the Board on fund performance, the Board considers annualized return information for the fund, for different time periods, measured against a securities market index ("benchmark index") and a peer group of funds with similar objectives ("peer group"), if any. In its evaluation of fund investment performance, the Board gave particular attention to information indicating changes in performance of certain Fidelity funds for specific time periods and discussed with the Investment Advisers the reasons for any overperformance or underperformance.In addition to reviewing absolute and relative fund performance, the Independent Trustees periodically consider the appropriateness of fund performance metrics in evaluating the results achieved. In general, the Independent Trustees believe that fund performance should be evaluated based on net performance (after fees and expenses) of both the highest performing and lowest performing fund share classes, where applicable, compared to appropriate benchmark indices, over appropriate time periods that may include full market cycles, and compared to peer groups, as applicable, over the same periods, taking into account relevant factors including the following: general market conditions; issuer-specific information; and fund cash flows and other factors.The Independent Trustees recognize that shareholders evaluate performance on a net basis over their own holding periods, for which one-, three-, and five-year periods are often used as a proxy. For this reason, the performance information reviewed by the Board also included net cumulative calendar year total return information for the fund and an appropriate benchmark index and peer group for the most recent one-, three-, and five-year periods, as shown below. Returns are shown compared to the 25th percentile (top of box, 75% beaten) and 75th percentile (bottom of box, 25% beaten) of the peer universe.Fidelity Value Fund
Fidelity Value Fund
![]()
Corporate Headquarters
245 Summer St.
Boston, MA 02210
www.fidelity.com
VAL-ANN-1215
1.538531.118
Item 2.
Code of Ethics
As of the end of the period, October 31, 2015, Fidelity Capital Trust (the trust) has adopted a code of ethics, as defined in Item 2 of Form N-CSR, that applies to its President and Treasurer and its Chief Financial Officer. A copy of the code of ethics is filed as an exhibit to this Form N-CSR.
Item 3.
Audit Committee Financial Expert
The Board of Trustees of the trust has determined that Joseph Mauriello is an audit committee financial expert, as defined in Item 3 of Form N-CSR. Mr. Mauriello is independent for purposes of Item 3 of Form N-CSR.
Item 4.
Principal Accountant Fees and Services
Fees and Services
The following table presents fees billed by Deloitte & Touche LLP, the member firms of Deloitte Touche Tohmatsu, and their respective affiliates (collectively, “Deloitte Entities”) in each of the last two fiscal years for services rendered to Fidelity Stock Selector Small Cap Fund (the “Fund”):
Services Billed by Deloitte Entities
October 31, 2015 FeesA
| Audit Fees | Audit-Related Fees | Tax Fees | All Other Fees |
Fidelity Stock Selector Small Cap Fund | $45,000 | $- | $5,000 | $900 |
October 31, 2014 FeesA
| Audit Fees | Audit-Related Fees | Tax Fees | All Other Fees |
Fidelity Stock Selector Small Cap Fund | $43,000 | $- | $4,800 | $900 |
A Amounts may reflect rounding.
The following table presents fees billed by PricewaterhouseCoopers LLP (“PwC”) in each of the last two fiscal years for services rendered to Fidelity Capital Appreciation Fund, Fidelity Disciplined Equity Fund, Fidelity Focused Stock Fund, and Fidelity Value Fund (the “Funds”):
Services Billed by PwC
October 31, 2015 FeesA
| Audit Fees | Audit-Related Fees | Tax Fees | All Other Fees |
Fidelity Capital Appreciation Fund | $63,000 | $- | $3,300 | $4,900 |
Fidelity Disciplined Equity Fund | $61,000 | $- | $7,000 | $2,200 |
Fidelity Focused Stock Fund | $48,000 | $- | $4,900 | $2,300 |
Fidelity Value Fund | $71,000 | $- | $9,200 | $5,100 |
October 31, 2014 FeesA
| Audit Fees | Audit-Related Fees | Tax Fees | All Other Fees |
Fidelity Capital Appreciation Fund | $61,000 | $- | $3,800 | $4,500 |
Fidelity Disciplined Equity Fund | $58,000 | $- | $4,400 | $2,100 |
Fidelity Focused Stock Fund | $37,000 | $- | $3,600 | $2,300 |
Fidelity Value Fund | $68,000 | $- | $5,100 | $4,700 |
A Amounts may reflect rounding.
The following table presents fees billed by PwC and Deloitte Entities that were required to be approved by the Audit Committee for services that relate directly to the operations and financial reporting of the Funds and that are rendered on behalf of Fidelity Management & Research Company (“FMR”) and entities controlling, controlled by, or under common control with FMR (not including any sub-adviser whose role is primarily portfolio management and is subcontracted with or overseen by another investment adviser) that provide ongoing services to the Funds (“Fund Service Providers”):
Services Billed by Deloitte Entities
| October 31, 2015A | October 31, 2014A |
Audit-Related Fees | $- | $150,000 |
Tax Fees | $10,000 | $- |
All Other Fees | $60,000 | $590,000 |
A Amounts may reflect rounding.
Services Billed by PwC
| October 31, 2015A | October 31, 2014A |
Audit-Related Fees | $3,465,000 | $4,430,000 |
Tax Fees | $- | $- |
All Other Fees | $- | $- |
A Amounts may reflect rounding.
“Audit-Related Fees” represent fees billed for assurance and related services that are reasonably related to the performance of the fund audit or the review of the fund's financial statements and that are not reported under Audit Fees.
“Tax Fees” represent fees billed for tax compliance, tax advice or tax planning that relate directly to the operations and financial reporting of the fund.
“All Other Fees” represent fees billed for services provided to the fund or Fund Service Provider, a significant portion of which are assurance related, that relate directly to the operations and financial reporting of the fund, excluding those services that are reported under Audit Fees, Audit-Related Fees or Tax Fees.
Assurance services must be performed by an independent public accountant.
* * *
The aggregate non-audit fees billed by PwC and Deloitte Entities for services rendered to the Funds, FMR (not including any sub-adviser whose role is primarily portfolio management and is subcontracted with or overseen by another investment adviser), and any Fund Service Provider for each of the last two fiscal years of the Funds are as follows:
Billed By | October 31, 2015 A | October 31, 2014 A |
PwC | $4,805,000 | $5,670,000 |
Deloitte Entities | $175,000 | $1,830,000 |
A Amounts may reflect rounding.
The trust's Audit Committee has considered non-audit services that were not pre-approved that were provided by PwC and Deloitte Entities to Fund Service Providers to be compatible with maintaining the independence of PwC and Deloitte Entities in their audits of the Funds, taking into account representations from PwC and Deloitte Entities, in accordance with Public Company Accounting Oversight Board rules, regarding their independence from the Funds and their related entities and FMR’s review of the appropriateness and permissibility under applicable law of such non-audit services prior to their provision to the Fund Service Providers.
Audit Committee Pre-Approval Policies and Procedures
The trust’s Audit Committee must pre-approve all audit and non-audit services provided by a fund’s independent registered public accounting firm relating to the operations or financial reporting of the fund. Prior to the commencement of any audit or non-audit services to a fund, the Audit Committee reviews the services to determine whether they are appropriate and permissible under applicable law.
The Audit Committee has adopted policies and procedures to, among other purposes, provide a framework for the Committee’s consideration of non-audit services by the audit firms that audit the Fidelity funds. The policies and procedures require that any non-audit service provided by a fund audit firm to a Fidelity fund and any non-audit service provided by a fund auditor to a Fund Service Provider that relates directly to the operations and financial reporting of a Fidelity fund (“Covered Service”) are subject to approval by the Audit Committee before such service is provided.
All Covered Services must be approved in advance of provision of the service either: (i) by formal resolution of the Audit Committee, or (ii) by oral or written approval of the service by the Chair of the Audit Committee (or if the Chair is unavailable, such other member of the Audit Committee as may be designated by the Chair to act in the Chair’s absence). The approval contemplated by (ii) above is permitted where the Treasurer determines that action on such an engagement is necessary before the next meeting of the Audit Committee.
Non-audit services provided by a fund audit firm to a Fund Service Provider that do not relate directly to the operations and financial reporting of a Fidelity fund are reported to the Audit Committee on a periodic basis.
Non-Audit Services Approved Pursuant to Rule 2-01(c)(7)(i)(C) and (ii) of Regulation S-X (“De Minimis Exception”)
There were no non-audit services approved or required to be approved by the Audit Committee pursuant to the De Minimis Exception during the Funds’ last two fiscal years relating to services provided to (i) the Funds or (ii) any Fund Service Provider that relate directly to the operations and financial reporting of the Funds.
Item 5.
Audit Committee of Listed Registrants
Not applicable.
Item 6.
Investments
(a)
Not applicable.
(b)
Not applicable
Item 7.
Disclosure of Proxy Voting Policies and Procedures for Closed-End Management Investment Companies
Not applicable.
Item 8.
Portfolio Managers of Closed-End Management Investment Companies
Not applicable.
Item 9.
Purchase of Equity Securities by Closed-End Management Investment Company and Affiliated Purchasers
Not applicable.
Item 10.
Submission of Matters to a Vote of Security Holders
There were no material changes to the procedures by which shareholders may recommend nominees to the trust’s Board of Trustees.
Item 11.
Controls and Procedures
(a)(i) The President and Treasurer and the Chief Financial Officer have concluded that the trust’s disclosure controls and procedures (as defined in Rule 30a-3(c) under the Investment Company Act) provide reasonable assurances that material information relating to the trust is made known to them by the appropriate persons, based on their evaluation of these controls and procedures as of a date within 90 days of the filing date of this report.
(a)(ii) There was no change in the trust’s internal control over financial reporting (as defined in Rule 30a-3(d) under the Investment Company Act) that occurred during the second fiscal quarter of the period covered by this report that has materially affected, or is reasonably likely to materially affect, the trust’s internal control over financial reporting.
Item 12.
Exhibits
(a) | (1) | Code of Ethics pursuant to Item 2 of Form N-CSR is filed and attached hereto as EX-99.CODE ETH. |
(a) | (2) | Certification pursuant to Rule 30a-2(a) under the Investment Company Act of 1940 (17 CFR 270.30a-2(a)) is filed and attached hereto as Exhibit 99.CERT. |
(a) | (3) | Not applicable. |
(b) |
| Certification pursuant to Rule 30a-2(b) under the Investment Company Act of 1940 (17 CFR 270.30a-2(b)) is furnished and attached hereto as Exhibit 99.906CERT. |
SIGNATURES
Pursuant to the requirements of the Securities Exchange Act of 1934 and the Investment Company Act of 1940, the registrant has duly caused this report to be signed on its behalf by the undersigned, thereunto duly authorized.
Fidelity Capital Trust
By: | /s/Kenneth B. Robins |
| Kenneth B. Robins |
| President and Treasurer |
|
|
Date: | December 28, 2015 |
Pursuant to the requirements of the Securities Exchange Act of 1934 and the Investment Company Act of 1940, this report has been signed below by the following persons on behalf of the registrant and in the capacities and on the dates indicated.
By: | /s/Kenneth B. Robins |
| Kenneth B. Robins |
| President and Treasurer |
|
|
Date: | December 28, 2015 |
By: | /s/Howard J. Galligan III |
| Howard J. Galligan III |
| Chief Financial Officer |
|
|
Date: | December 28, 2015 |