UNITED STATES
SECURITIES AND EXCHANGE COMMISSION
WASHINGTON, D.C. 20549
FORM N-CSR
CERTIFIED SHAREHOLDER REPORT OF REGISTERED MANAGEMENT
INVESTMENT COMPANIES
Investment Company Act file number 811-2183
| | Barings Corporate Investors | |
| | (Exact name of registrant as specified in charter) | |
| | | |
| | 300 South Tryon Street, Suite 2500, Charlotte, NC 28202 | |
| | (Address of principal executive offices) (Zip code) | |
| | | |
| | Corporation Service Company (CSC) 251 Little Falls Drive, Wilmington, DE 19808 | |
| | (Name and address of agent for service) | |
Registrant's telephone number, including area code: 413-226-1000
Date of fiscal year end: 12/31
Date of reporting period: 12/31/21
Form N-CSR is to be used by management investment companies to file reports with the Commission not later than 10 days after the transmission to stockholders of any report that is required to be transmitted to stockholders under Rule 30e-1 under the Investment Company Act of 1940 (17 CFR 270.30e-1). The Commission may use the information provided on Form N-CSR in its regulatory, disclosure review, inspection and policymaking roles.
A registrant is required to disclose the information specified by Form N-CSR, and the Commission will make this information public. A registrant is not required to respond to the collection of information contained in Form N-CSR unless the Form displays a currently valid Office of Management and Budget ("OMB") control number. Please direct comments concerning the accuracy of the information collection burden estimate and any suggestions for reducing the burden to Secretary, Securities and Exchange Commission, 100 F Street NE, Washington, DC 20549. The OMB has reviewed this collection of information under the clearance requirements of 44 U.S.C. ss. 3507.
Corporation Service Company (CSC) 251 Little Falls Drive, Wilmington, DE 19808
ITEM 1. REPORT TO STOCKHOLDERS.
Attached hereto is the annual shareholder report transmitted to shareholders pursuant to Rule 30e-1 of the Investment Company Act of 1940, as amended.
| | |
|
| | 2021 |
| | | |
| | Barings CORPORATE INVESTORS 2021 Annual Report |  |
| | | |
| | | |
| | | |
BARINGS CORPORATE INVESTORS
Barings Corporate Investors (the “Trust”) is a closed-end management investment company, first offered to the public in 1971, whose shares are traded on the New York Stock Exchange under the trading symbol “MCI”. The Trust’s share price can be found in the financial section of newspapers under either the New York Stock Exchange listings or Closed-End Fund Listings.
INVESTMENT OBJECTIVE & STRATEGIES
The Trust’s investment objective is to maintain a portfolio of securities providing a current yield and, when available, an opportunity for capital gains. The Trust’s principal investments are privately placed, below-investment grade, long-term debt obligations including bank loans and mezzanine debt instruments. Such private placement securities may, in some cases, be accompanied by equity features such as common stock, preferred stock, warrants, conversion rights, or other equity features. The Trust typically purchases these investments, which are not publicly tradable, directly from their issuers in private placement transactions. These investments are typically made to small or middle market companies. In addition, the Trust may invest, subject to certain limitations, in marketable debt securities (including high yield and/or investment grade securities) and marketable common stock. Below- investment grade or high yield securities have predominantly speculative characteristics with respect to the capacity of the issuer to pay interest and repay capital.
The Trust distributes substantially all of its net income to shareholders each year. Accordingly, the Trust pays dividends to shareholders four times a year in January, May, August, and November. The Trust pays dividends to its shareholders in cash, unless the shareholder elects to participate in the Dividend Reinvestment and Share Purchase Plan.
In this report, you will find a complete listing of the Trust’s holdings. We encourage you to read this section carefully for a better understanding of the Trust. We cordially invite all shareholders to attend the Trust’s Annual Meeting of Shareholders, which will be held on May 19, 2022 at 8:00 A.M. (Eastern Time) in Charlotte, North Carolina, and virtually at the following website https://www.viewproxy.com/barings/broadridgevsm/.
PROXY VOTING POLICIES & PROCEDURES; PROXY VOTING RECORD
The Trustees of the Trust have delegated proxy voting responsibilities relating to the voting of securities held by the Trust to Barings LLC (“Barings”). A description of Barings’ proxy voting policies and procedures is available (1) without charge, upon request, by calling, toll-free 1-866-399-1516; (2) on the Trust’s website at http://www.barings.com/mci; and (3) on the U.S. Securities and Exchange Commission’s (“SEC”) website at http://www.sec.gov. Information regarding how the Trust voted proxies relating to portfolio securities during the most recent 12-month period ended June 30, 2021 is available (1) on the Trust’s website at http://www.barings.com/mci; and (2) on the SEC’s website at http://www.sec.gov.
FORM N-PORT
The Trust files its complete schedule of portfolio holdings with the SEC for the first and third quarters of each fiscal year on part F of Form N-PORT. This information is available (i) on the SEC’s website at http://www.sec.gov; and (ii) at the SEC’s Public Reference Room in Washington, DC (which information on their operation may be obtained by calling 1-800-SEC-0330). A complete schedule of portfolio holdings as of each quarter-end is available on the Trust’s website at http://www.barings.com/mci or upon request by calling, toll-free, 1-866-399-1516.
LEGAL MATTERS
The Trust has entered into contractual arrangements with an investment adviser, transfer agent and custodian (collectively “service providers”) who each provide services to the Trust. Shareholders are not parties to, or intended beneficiaries of, these contractual arrangements, and these contractual arrangements are not intended to create any shareholder right to enforce them against the service providers or to seek any remedy under them against the service providers, either directly or on behalf of the Trust.
Under the Trust’s Bylaws, any claims asserted against or on behalf of the Trust, including claims against Trustees and officers must be brought in courts located within the Commonwealth of Massachusetts.
The Trust’s registration statement and this shareholder report are not contracts between the Trust and its shareholders and do not give rise to any contractual rights or obligations or any shareholder rights other than any rights conferred explicitly by federal or state securities laws that may not be waived.
BARINGS CORPORATE INVESTORS c / o Barings LLC 300 South Tryon St., Suite 2500 Charlotte, NC 28202 1-866-399-1516 http://www.barings.com/mci ADVISER Barings LLC 300 South Tryon St., Suite 2500 Charlotte, NC 28202 INDEPENDENT REGISTERED PUBLIC ACCOUNTING FIRM KPMG LLP Boston, Massachusetts 02110 | | COUNSEL TO THE TRUST Ropes & Gray LLP Boston, Massachusetts 02111 CUSTODIAN State Street Bank and Trust Company Boston, MA 02110 TRANSFER AGENT & REGISTRAR DST Systems, Inc. P.O. Box 219086 Kansas City, MO 64121-9086 1-800-647-7374 
|
2021 Annual Report
PORTFOLIO COMPOSITION AS OF 12/31/2021*
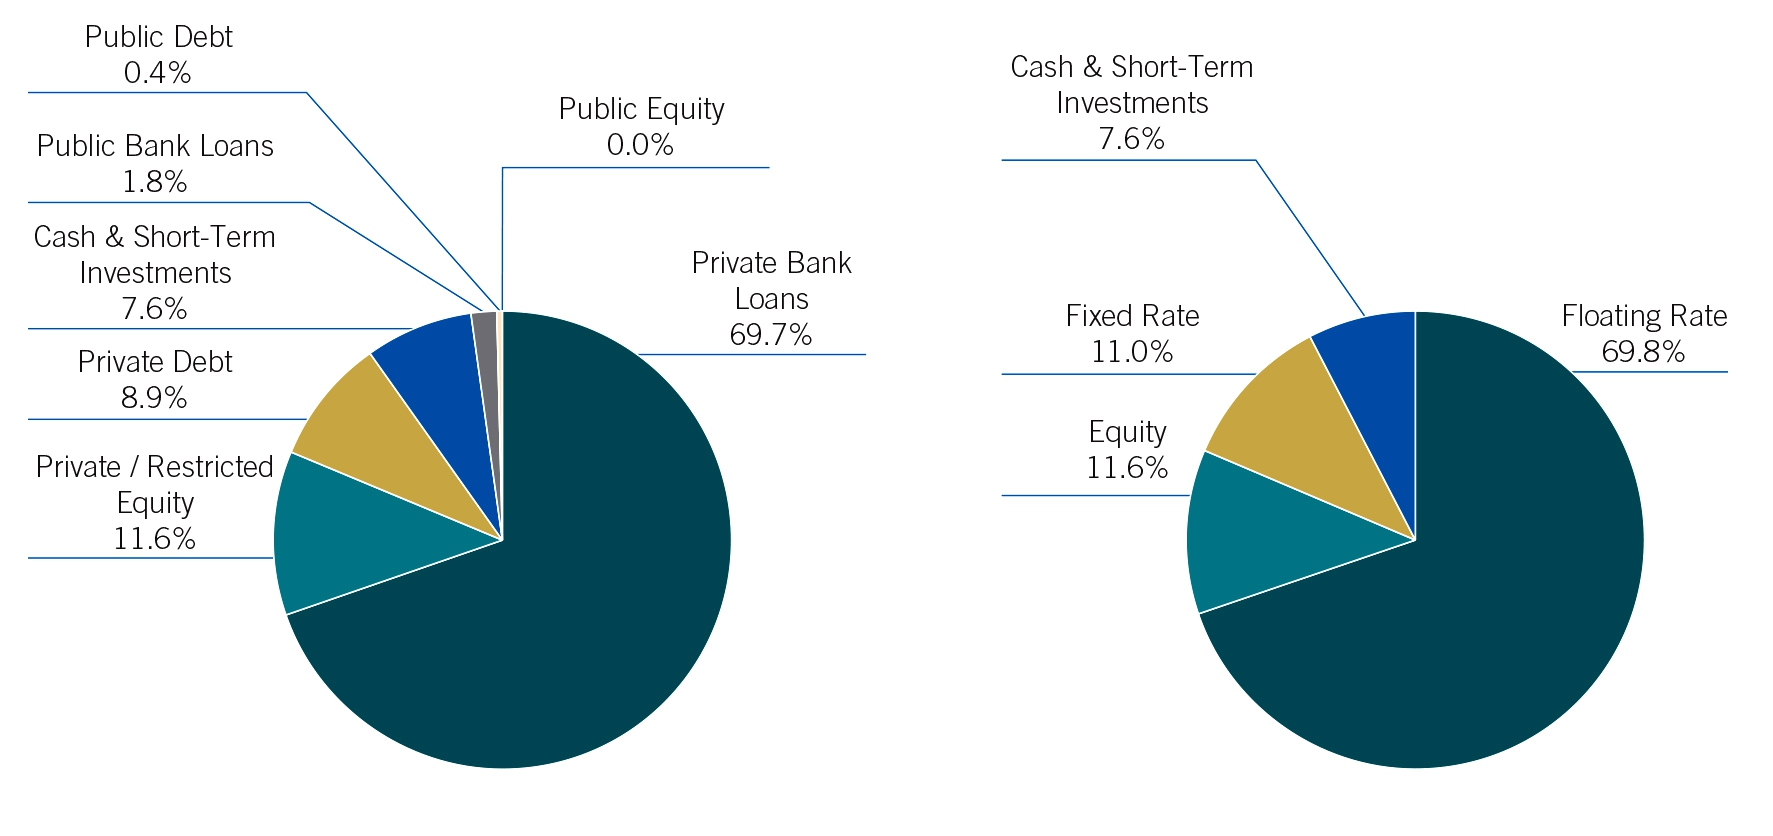
PORTFOLIO COMPOSITION AS OF 12/31/2020*

| * | Based on market value of total investments |
In July 2017, the head of the U.K. Financial Conduct Authority (the “FCA”), announced that the FCA will no longer persuade or compel banks to submit rates for the calculation of LIBOR after 2021. In March 2021, the FCA confirmed that all LIBOR settings will either cease to be provided by any administrator or no longer be representative: (a) immediately after December 31, 2021, in the case of sterling, euro, Swiss franc, and Japanese yen, and the one week and two month U.S. dollar settings; and (b) immediately after June 30, 2023, in the case of the remaining U.S. dollar settings. In addition, as a result of supervisory guidance from U.S. regulators, some U.S. regulated entities will cease to enter into new LIBOR contracts after January 1, 2022. At this time, no consensus exists as to what rate or rates will become accepted alternatives to LIBOR, although the Alternative Reference Rates Committee, a steering committee convened by the Board of Governors of the Federal Reserve System and the Federal Reserve Bank of New York and comprised of large U.S. financial institutions, has recommended the use of the Secured Overnight Financing Rate, SOFR. There are many uncertainties regarding a transition from LIBOR to SOFR or any other alternative benchmark rate that may be established, including, but not limited to, the timing of any such transition, the need to amend all contracts with LIBOR as the referenced rate and, given the inherent differences between LIBOR and SOFR or any other alternative benchmark rate, how any transition may impact the cost and performance of impacted securities, variable rate debt and derivative financial instruments. In addition, SOFR or another alternative benchmark rate may fail to gain market acceptance, which could adversely affect the return on, value of and market for securities, variable rate debt and derivative financial instruments linked to such rates. The effects of a transition from LIBOR to SOFR or any other alternative benchmark rate on the Trust’s cost of capital and net investment income cannot yet be determined definitively. All of the Trust’s loan agreements with
1
Barings Corporate Investors
the Trust’s portfolio companies include fallback language in the event that LIBOR becomes unavailable. This language generally either includes a clearly defined alternative reference rate after LIBOR’s discontinuation or provides that the administrative agent may identify a replacement reference rate, typically with the consent of (or prior consultation with) the borrower. In certain cases, the administrative agent will be required to obtain the consent of either a majority of the lenders under the facility, or the consent of each lender, prior to identifying a replacement reference rate. In addition, any further changes or reforms to the determination or supervision of LIBOR may result in a sudden or prolonged increase or decrease in reported LIBOR, which could have an adverse impact on the market value for or value of any LIBOR-linked securities, loans, and other financial obligations or extensions of credit held by or due to the Trust and could have a material adverse effect on the Trust’s business, financial condition and results of operations.
TOTAL ANNUAL RETURN (AS OF 12/31 EACH YEAR)*
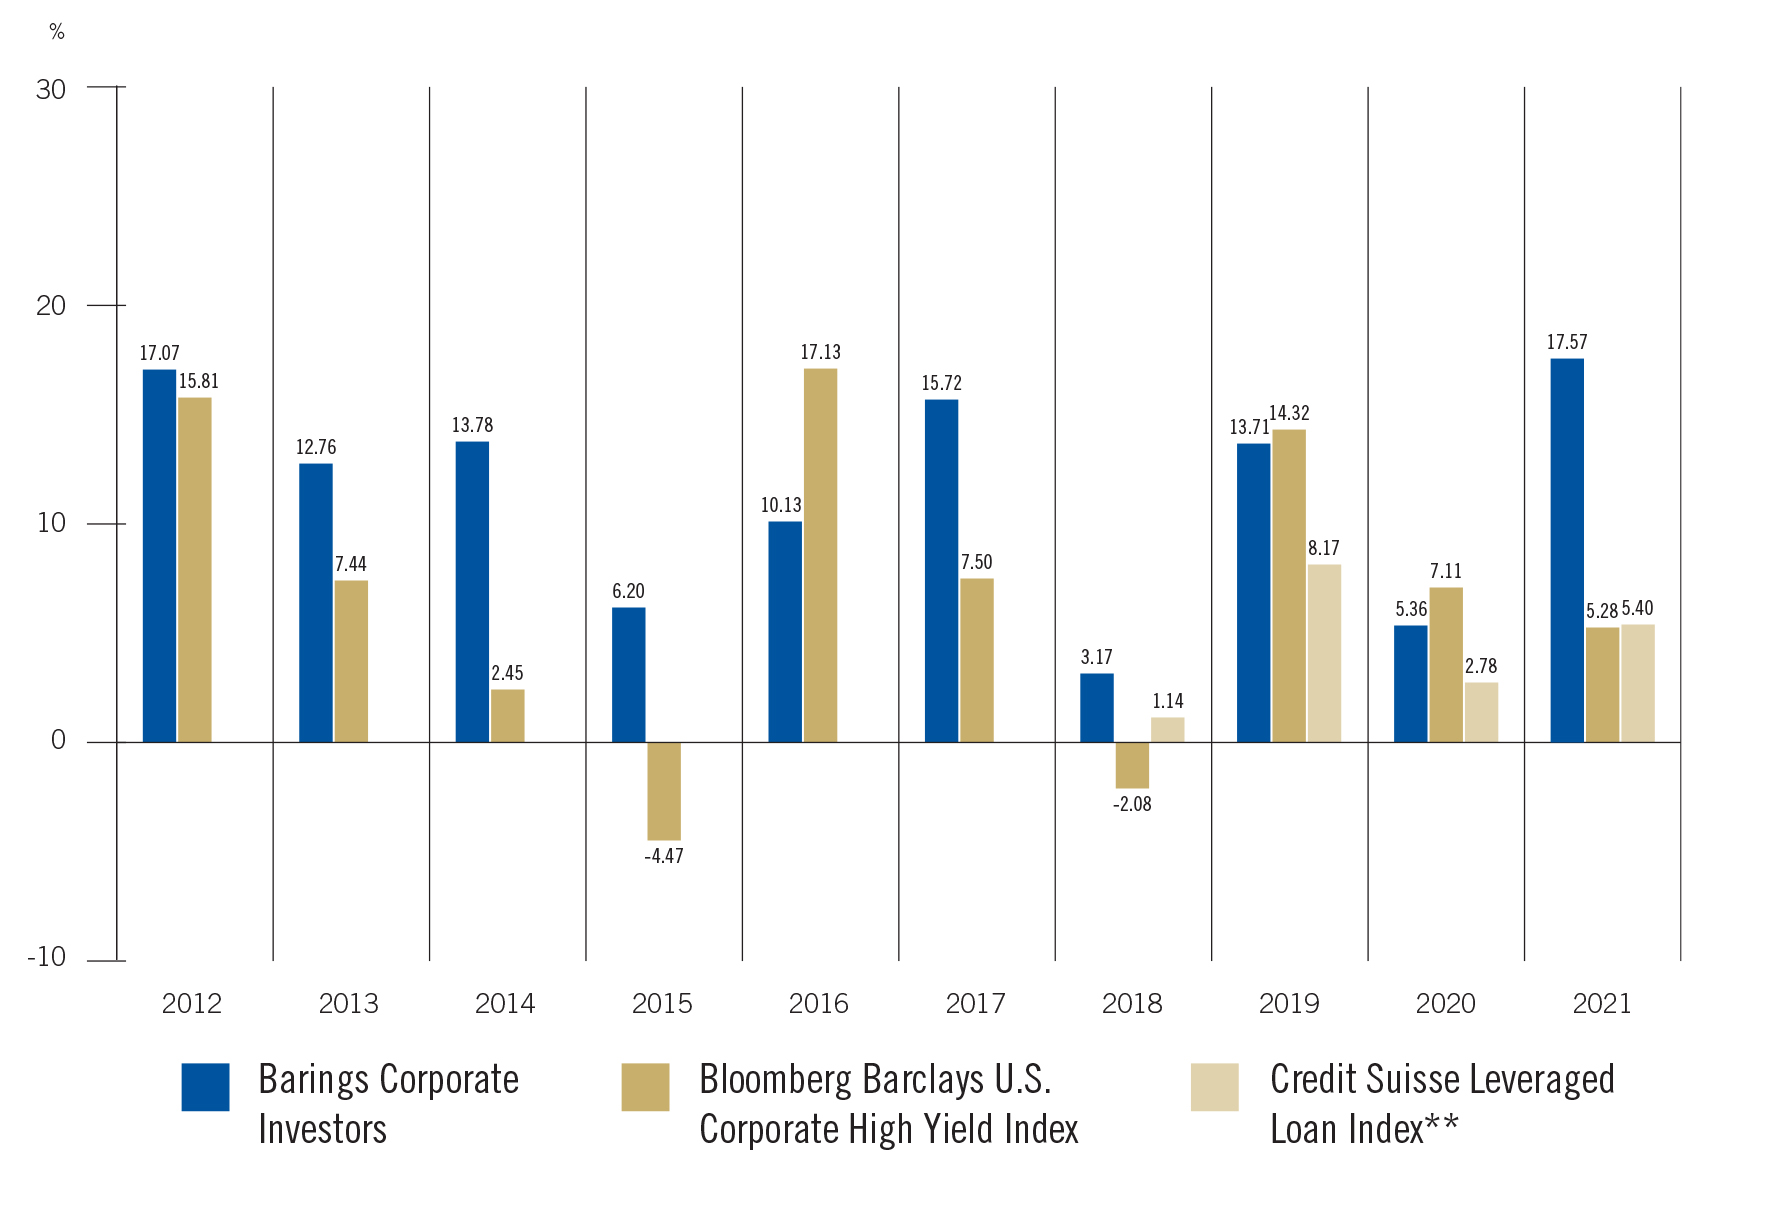
| * | Data for Barings Corporate Investors (the “Trust”) represents returns based on the change in the Trust’s net asset value assuming the reinvestment of all dividends and distributions. These returns differ from the total investment return based on market value of the Trust’s shares due to the difference between the Trust’s net asset value of its shares outstanding (See page 12 for total investment return based on market value). Past performance is no guarantee of future results. |
| ** | The Credit Suisse Leveraged Loan Index was added in 2018 to represent the Trust’s portfolio composition which now includes a material amount of floating rate securities. |
2
2021 Annual Report
TO OUR SHAREHOLDERS
I am pleased to share with you the Trust’s Annual Report for the year ended December 31, 2021.
PORTFOLIO PERFORMANCE
The Trust’s net total portfolio rate of return for 2021 was 17.57%, as measured by the change in net asset value assuming the reinvestment of all dividends and distributions. The Trust’s total net assets were $338,041,104 or $16.68 per share, as of December 31, 2021. This compares to $304,684,324 or $15.04 per share, as of December 31, 2020. The Trust paid a quarterly dividend of $0.24 per share for each of the four quarters of 2021, for a total annual dividend of $0.96 per share. In 2020, the Trust paid four quarterly dividends of $0.24 per share, for a total annual dividend of $0.96 per share. Net taxable investment income for 2021 was $0.96 per share, including approximately $0.14 per share of non-recurring income, compared to 2020 net taxable investment income of $1.20 per share, which included approximately $0.33 per share of non-recurring income.
The Trust’s stock price increased 21.2% during 2021, from $13.18 as of December 31, 2020 to $15.98 as of December 31, 2021. The Trust’s stock price of $15.98 as of December 31, 2021 equates to a 4.2% discount to the December 31, 2021 net asset value per share of $16.68. The Trust’s average quarter-end premium/discount for the 3-, 5-, 10- and 25-year periods ended December 31, 2021 was -4.6%, -2.5%, 5.5%, and 7.3%, respectively.
The table below lists the average annual net returns of the Trust’s portfolio, based on the change in net assets and assuming the reinvestment of all dividends and distributions. Average annual returns of the Bloomberg Barclays U.S. Corporate High Yield Index for the 1-, 3-, 5-, 10- and 25-year periods ended December 31, 2021 and the Credit Suisse Leveraged Loan Index for the 1- and 3-year periods ended December 31, 2021 are provided for comparison purposes only.
| | The Trust | Bloomberg Barclays US
Corporate HY Index | Credit Suisse
Leveraged
Loan Index |
| | | | |
| 1 Year | 17.57% | 5.28% | 5.40% |
| | | | |
| 3 Years | 12.09% | 8.83% | 5.43% |
| | | | |
| 5 Years | 10.95% | 6.30% | |
| | | | |
| 10 Years | 11.44% | 6.83% | |
| | | | |
| 25 Years | 12.18% | 6.87% | |
Past performance is no guarantee of future results
PORTFOLIO ACTIVITY
The Trust had an active fourth quarter, closing on 26 new private placement investments totaling $60.5 million and 19 add-on investments in existing portfolio companies totaling $10.7 million. For the year, the Trust closed 49 new private placement investments, and 46 add-on investments in existing portfolio companies. A brief description of these investments can be found in the Consolidated Schedule of Investments. The total amount invested by the Trust in private placement investments in 2021 was $149.1 million, which was significantly higher than the $64.6 million of private placement investments made by the Trust in 2020.
3
Barings Corporate Investors
New deal activity in 2021 occurred throughout the year with steady investment in the first three quarters ending the year with an exceptionally strong fourth quarter. The Trust was well-positioned to invest in 2021 due to the continuation of increased origination flow into 1st lien senior secured middle market assets, expansion of the private debt platform of Barings (the Trust’s investment adviser), and overall activity within the private debt market. These favorable items were partially offset by the continuance of hyper-competitive and aggressive market conditions. Competition for new investment opportunities remained intense due to the amount of fresh capital that flowed into the private debt and private equity markets. As a result, companies continued to be pursued aggressively by both buyers and lenders alike, leading to the continued prevalence of high purchase multiples and leverage levels in the market. We have strengthened our liquidity position by entering into a $30.0 million committed revolving credit facility with MassMutual (See Note 4). We drew $8.0 million on the facility at the end of the fourth quarter to fund new investments.
The Trust’s portfolio experienced an increased level of economic stress due to COVID-19 in early 2020. During the course of 2020 and 2021, in addition to working on new investment activity, we continued to maintain our focus on managing and maintaining the quality of the portfolio. Towards the end of the third quarter 2020, the credit quality of the Trust’s existing portfolio stabilized and began a trend of improvement that continued through the end of 2021. In our view, the number of companies on our watch list or in default has remained at acceptable levels.
We had 35 companies exit from the Trust’s portfolio during 2021. This level of exit activity in the Trust’s portfolio was above recent years as realization levels have ranged from 18-32 exits annually since 2014. In 33 of these exits, the Trust realized a positive return on its investment. This level of realization activity in recent years is yet another indicator of how active and aggressive the middle market M&A and debt markets have been, and continue to be.
During 2021, the Trust had 4 portfolio companies fully or partially pre-pay their debt obligations. These transactions, in which the debt instruments held by the Trust were fully or partially prepaid, are generally driven by performing companies seeking to take advantage of lower interest rates and the abundance of debt capital. Unless replaced by new private debt investments, these prepayments reduce net investment income. The level of refinancing activity the portfolio has experienced has remained relatively stable since 2016. Two portfolio companies paid dividends to the Trust on its equity holdings in those companies.
OUTLOOK FOR 2022
With demand for products and services continuing to increase, one key question in 2022 is whether supply chains can keep up with the renewed demand and whether we will see material increases in prices as a result of supply-chain bottlenecks, rising raw material and energy costs and labor shortages. Across the world, and particularly in regions with large manufacturing sectors which depend on international trade, these risks may be key. However, it is important to note that such issues do not affect every geography and sector the same. When constructing portfolios, we focus on investing in high-quality businesses which are leaders in their space and offer defensive characteristics which will allow them to perform through the cycle. Therefore, while segments of the broader economy may be affected by potential supply chain issues, increasing raw material and energy costs and labor shortages, we remain confident in the current diversified portfolio to perform through the cycle.
As we enter 2022, default rates remain at relatively low levels, there appears to be plenty of both private equity and private debt capacity, which should continue to drive middle market M&A activity, and our pipeline of investment opportunities remains relatively
4
2021 Annual Report
stable and healthy. However, as mentioned above, the dynamics within that market have been, and are expected to remain, aggressive. Rest assured that regardless of market conditions, we will continue to employ on behalf of the Trust the same investment philosophy that has served it well since its inception: investing in companies that we believe have a strong business proposition, solid cash flow and experienced, ethical management. We believe this philosophy, along with Barings’ seasoned investment-management team, positions the Trust well to meet its long-term investment objectives.
The Trust maintained its quarterly dividend of $0.24 per share in 2021 for a total annual dividend of $0.96 per share. As has been mentioned in prior reports, recurring investment income alone has generally not been sufficient to fully fund the current dividend rate, which has required supplementation from non-recurring income and earnings carry forwards. While recurring investment income remains stable, it may not be sufficient to fully fund the current dividend rate in the future. Net investment income has generally been below the dividend rate since 2013 due principally to the considerable reduction in the number of higher yielding junior debt investment opportunities resulting from prepayments and realizations in the portfolio, combined with generally lower investment returns available due to market and competitive dynamics in recent years. Floating interest rates continue to be low by historic standards, and should such rates rise, the Trust’s income would likely also rise. The percentage of the portfolio in floating rate debt securities, which are often secured and generally of higher credit quality than higher-yielding junior debt, increased to 70% as of December 31, 2021, compared to 59% as of December 31, 2020. All of the above said, the level of recurring investment income expected to be generated by the Trust in 2022, combined with the availability of earnings carry forwards and other non-recurring income, is currently expected to be sufficient to maintain the current dividend rate over the next several quarters. Over time, however, the Trust’s dividend paying ability tends to be correlated with its recurring earnings capacity. We and the Board of Trustees will continue to evaluate the current and future earnings capacity of the Trust and formulate a dividend strategy that is consistent with the Trust’s recurring earnings.
As always, I would like to thank you for your continued interest in and support of Barings Corporate Investors. I look forward to seeing you at the Trust’s annual shareholder meeting on Thursday May 19, 2022.
Sincerely,

Christina Emery
President
5
Barings Corporate Investors
| | | | | | |
2021
Dividends | Record Date | Total Paid | Ordinary Income | Short-Term Gains | Long-Term Gains |
| Regular | 5/3/2021 | 0.2400 | 0.2400 | - | - |
| Regular | 8/2/2021 | 0.2400 | 0.2400 | - | - |
| Regular | 11/8/2021 | 0.2400 | 0.2400 | - | - |
| Regular | 12/30/2021 | 0.2400 | 0.2400 | - | - |
| | | 0.9600 | 0.9600 | 0.0000 | 0.0000 |
The following table summarizes the tax effects of the relation of capital gains for 2021:
| | Amount per Share | Form 2439 |
| 2021 Gains Retained | 0.4199 | Line 1a |
| Long-Term Gains Retained | 0.4199 | |
| Taxes Paid | 0.0882 | Line 2* |
| Basis Adjustment | 0.3317 | ** |
| * | If you are not subject to federal capital gains tax (e.g. charitable organizations, IRAs and Keogh Plans) you may be able to claim a refund by filing Form 990-T. |
| ** | For federal income tax purposes, you may increase the adjusted cost basis of your shares by this amount (the excess of Line 1a over Line 2). |
| | | | | | | |
Annual Dividend | Qualified for Dividend Received Deduction*** | Qualified Dividends**** | Interest Earned on U.S. Gov’t. Obligations |
Amount per Share | Percent | Amount per Share | Percent | Amount per Share | Percent | Amount per Share |
| $0.96 | 0.4482% | 0.0043 | 0.4482% | 0.0043 | 0% | 0.0000 |
| *** | Not available to individual shareholders |
| **** | Qualified dividends are reported in Box 1b on IRS Form 1099-Div for 2021 |
6
| |
| | |
| BARINGS CORPORATE INVESTORS | |
| | |
| | |
| | |
| | |
| Financial Report | |
| | |
| Consolidated Statement of Assets and Liabilities | 8 |
| | |
| Consolidated Statement of Operations | 9 |
| | |
| Consolidated Statement of Cash Flows | 10 |
| | |
| Consolidated Statements of Changes in Net Assets | 11 |
| | |
| Consolidated Selected Financial Highlights | 12 |
| | |
| Consolidated Schedule of Investments | 13-41 |
| | |
| Notes to Consolidated Financial Statements | 42-52 |
| | |
| Report of Independent Registered Public Accounting Firm | 53 |
| | |
| Interested Trustees | 54-55 |
| | |
| Independent Trustees | 56-57 |
| | |
| Officers of the Trust | 58-60 |
| |
| |
| |
| |
7
Barings Corporate Investors
CONSOLIDATED STATEMENT OF ASSETS AND LIABILITIES
December 31, 2021
| | | | |
| Assets: | | | |
| Investments | | | |
| (See Consolidated Schedule of Investments) | | | | |
| Corporate restricted securities - private placement investments at fair value | | | | |
| (Cost - $315,776,594) | | $ | 330,680,099 | |
| Corporate restricted securities - rule 144A securities at fair value | | | | |
| (Cost - $13,278,819) | | | 14,415,659 | |
| Corporate public securities at fair value | | | | |
| (Cost - $8,502,088) | | | 8,498,057 | |
| Short-term securities at fair value | | | | |
| (Cost - $7,999,129) | | | 7,999,129 | |
| | | | | |
| Total investments (Cost - $345,556,630) | | | 361,592,945 | |
| | | | | |
| Cash | | | 21,135,142 | |
| Foreign currencies (Cost - $14,921) | | | 14,935 | |
| Dividend and interest receivable | | | 3,007,972 | |
| Receivable for investments sold | | | 911,356 | |
| Deferred financing fees | | | 69,353 | |
| Other assets | | | 371,243 | |
| | | | | |
| Total assets | | | 387,102,946 | |
| | | | | |
| Liabilities: | | | | |
| Note payable | | | 30,000,000 | |
| Credit facility | | | 8,000,000 | |
| Dividend payable | | | 4,862,813 | |
| Tax payable | | | 2,628,902 | |
| Payable for investments purchased | | | 1,816,897 | |
| Investment advisory fee payable | | | 1,086,534 | |
| Deferred tax liability | | | 406,603 | |
| Interest payable | | | 141,336 | |
| Accrued expenses | | | 118,757 | |
| | | | | |
| Total liabilities | | | 49,061,842 | |
| | | | | |
| Commitments and Contingencies (See Note 7) | | | | |
| | | | | |
| Total net assets | | $ | 338,041,104 | |
| | | | | |
| Net Assets: | | | | |
| Common shares, par value $1.00 per share | | $ | 20,261,719 | |
| Additional paid-in capital | | | 278,673,148 | |
| Total distributable earnings | | | 39,106,237 | |
| | | | | |
| Total net assets | | $ | 338,041,104 | |
| | | | | |
| Common shares issued and outstanding (28,054,782 authorized) | | | 20,261,719 | |
| | | | | |
| Net asset value per share | | $ | 16.68 | |
See Notes to Consolidated Financial Statements
8
2021 Annual Report
CONSOLIDATED STATEMENT OF OPERATIONS
For the year ended December 31, 2021
| | | | |
| Investment Income: | | | | |
| Interest | | $ | 24,334,971 | |
| Dividends | | | 685,872 | |
| Other | | | 737,140 | |
| | | | | |
| Total investment income | | | 25,757,983 | |
| | | | | |
| Expenses: | | | | |
| Investment advisory fees | | | 4,166,351 | |
| Interest and other financing fees | | | 1,071,813 | |
| Trustees’ fees and expenses | | | 421,148 | |
| Professional fees | | | 311,206 | |
| Reports to shareholders | | | 160,400 | |
| Custodian fees | | | 33,600 | |
| Other | | | 126,340 | |
| | | | | |
| Total expenses | | | 6,290,858 | |
| | | | | |
| Investment income - net | | | 19,467,125 | |
| | | | | |
| Income tax, including excise tax expense | | | 585,248 | |
| Net Investment income after taxes | | | 18,881,877 | |
| | | | | |
| Net realized and unrealized gain on investments and foreign currency: | | | | |
| Net realized gain on investments before taxes | | | 12,454,954 | |
| Net realized gain on foreign currency transactions before taxes | | | 367 | |
| Income tax expense | | | (2,130,306 | ) |
| | | | | |
| Net realized gain on investments and foreign currency transactions after taxes | | | 10,325,015 | |
| | | | | |
| Net increase in unrealized appreciation of investments before taxes | | | 24,007,727 | |
| Net increase in unrealized appreciation of foreign currency translation before taxes | | | 14 | |
| Net increase in deferred income tax expense | | | (406,603 | ) |
| | | | | |
| Net increase in unrealized appreciation of investments and foreign currency transactions after taxes | | | 23,601,138 | |
| | | | | |
| Net gain on investments and foreign currency | | | 33,926,153 | |
| | | | | |
| Net increase in net assets resulting from operations | | $ | 52,808,030 | |
See Notes to Consolidated Financial Statements
9
Barings Corporate Investors
CONSOLIDATED STATEMENT OF CASH FLOWS
For the year ended December 31, 2021
| | | | |
| Net decrease in cash & foreign currencies: | | | | |
| | | | | |
| Cash flows from operating activities: | | | | |
| Purchases/Proceeds/Maturities from short-term portfolio securities, net | | $ | (2,980,203 | ) |
| Purchases of portfolio securities | | | (157,927,571 | ) |
| Proceeds from disposition of portfolio securities | | | 144,118,259 | |
| Interest, dividends and other income received | | | 26,222,309 | |
| Interest expense paid | | | (1,059,001 | ) |
| Operating expenses paid | | | (5,031,513 | ) |
| Income taxes paid | | | (516,431 | ) |
| | | | | |
| Net cash provided by operating activities | | | 2,825,849 | |
| | | | | |
| Cash flows from financing activities: | | | | |
| Borrowings under credit facility | | | 8,000,000 | |
| Cash dividends paid from net investment income | | | (19,451,250 | ) |
| Financing fees paid | | | (76,146 | ) |
| | | | | |
| Net cash used for financing activities | | | (11,527,396 | ) |
| | | | | |
| Net decrease in cash & foreign currencies | | | (8,701,547 | ) |
| | | | | |
| Cash & foreign currencies - beginning of period | | | 29,851,624 | |
| | | | | |
| Cash & foreign currencies - end of period | | $ | 21,150,077 | |
| | | | | |
Reconciliation of net increase in net assets to net
cash provided by operating activities: | | | | |
| | | | | |
| Net increase in net assets resulting from operations | | $ | 52,808,030 | |
| | | | | |
| Increase in investments | | | (52,245,064 | ) |
| Increase in interest receivable | | | (579,747 | ) |
| Increase in receivable for investments sold | | | (864,565 | ) |
| Decrease in other assets | | | 1,985,830 | |
| Increase in tax payable | | | 2,199,123 | |
| Increase in deferred tax liability | | | 406,603 | |
| Decrease in payable for investments purchased | | | (1,084,705 | ) |
| Increase in investment advisory fee payable | | | 135,427 | |
| Increase in interest payable | | | 6,019 | |
| Increase in accrued expenses | | | 58,898 | |
| | | | | |
| Total adjustments to net assets from operations | | | (49,982,181 | ) |
| | | | | |
| Net cash provided by operating activities | | $ | 2,825,849 | |
See Notes to Consolidated Financial Statements
10
2021 Annual Report
CONSOLIDATED STATEMENTS OF CHANGES IN NET ASSETS
| | | | | | | |
| | | For the
year ended
12/31/2021 | | | For the
year ended
12/31/2020 | |
| Increase / (decrease) in net assets: | | | | | | | | |
| | | | | | | | | |
| Operations: | | | | | | | | |
| Investment income - net | | $ | 18,881,877 | | | $ | 24,386,956 | |
| Net realized gain on investments and foreign currency after taxes | | | 10,325,015 | | | | 2,244,872 | |
| Net change in unrealized appreciation / (depreciation) of investments and foreign currency after taxes | | | 23,601,138 | | | | (11,297,903 | ) |
| | | | | | | | | |
| Net increase in net assets resulting from operations | | | 52,808,030 | | | | 15,333,925 | |
| | | | | | | | | |
| Increase from common shares issued on reinvestment of dividends | | | | | | | | |
| Common shares issued (2021 - nil; 2020 -35,674) | | | — | | | | 552,229 | |
| | | | | | | | | |
| Dividends to shareholders from: | | | | | | | | |
| Distributable earnings to Common Stock Shareholders (2021 - $0.96 per share; 2020 - $0.96 per share) | | | (19,451,250 | ) | | | (19,451,250 | ) |
| | | | | | | | | |
| Total increase / (decrease) in net assets | | | 33,356,780 | | | | (3,565,096 | ) |
| | | | | | | | | |
| Net assets, beginning of year | | | 304,684,324 | | | | 308,249,420 | |
| | | | | | | | | |
| Net assets, end of year | | $ | 338,041,104 | | | $ | 304,684,324 | |
See Notes to Consolidated Financial Statements
11
Barings Corporate Investors
CONSOLIDATED SELECTED FINANCIAL HIGHLIGHTS
Selected data for each share of beneficial interest outstanding:
| | | For the years ended December 31, | |
| | | 2021 | | | 2020 | | | 2019 | | | 2018 | | | 2017 | |
| Net asset value: | | | | | | | | | | | | | | | |
| Beginning of year | | $ | 15.04 | | | $ | 15.24 | | | $ | 14.50 | | | $ | 15.22 | | | $ | 14.23 | |
| | | | | | | | | | | | | | | | | | | | | |
| Net investment income (a) | | | 0.93 | | | | 1.20 | | | | 1.11 | | | | 1.21 | | | | 1.27 | |
| Net realized and unrealized gain/(loss) on investments | | | 1.67 | | | | (0.44 | ) | | | 0.82 | | | | (0.73 | ) | | | 0.92 | |
| | | | | | | | | | | | | | | | | | | | | |
| Total from investment operations | | | 2.60 | | | | 0.76 | | | | 1.93 | | | | 0.48 | | | | 2.19 | |
| | | | | | | | | | | | | | | | | | | | | |
| Dividends from net investment income to common shareholders | | | (0.96 | ) | | | (0.96 | ) | | | (1.20 | ) | | | (1.20 | ) | | | (1.20 | ) |
| Increase from dividends reinvested | | | — | | | | 0.00 | | | | 0.01 | | | | 0.00 | | | | 0.00 | |
| | | | | | | | | | | | | | | | | | | | | |
| Total dividends | | | (0.96 | ) | | | (0.96 | ) | | | (1.19 | ) | | | (1.20 | ) | | | (1.20 | ) |
| | | | | | | | | | | | | | | | | | | | | |
| Net asset value: End of year | | $ | 16.68 | | | $ | 15.04 | | | $ | 15.24 | | | $ | 14.50 | | | $ | 15.22 | |
| | | | | | | | | | | | | | | | | | | | | |
| Per share market value: End of year | | $ | 15.98 | | | $ | 13.18 | | | $ | 16.86 | | | $ | 14.70 | | | $ | 15.26 | |
| | | | | | | | | | | | | | | | | | | | | |
| Total investment return | | | | | | | | | | | | | | | | | | | | |
| Net asset value (b) | | | 17.57% | | | | 5.36% | | | | 13.71% | | | | 3.17% | | | | 15.72% | |
| Market value (b) | | | 29.13% | | | | (15.95% | ) | | | 23.77% | | | | 4.54% | | | | 6.86% | |
| | | | | | | | | | | | | | | | | | | | | |
| Net assets (in millions): | | | | | | | | | | | | | | | | | | | | |
| End of year | | $ | 338.04 | | | $ | 304.68 | | | $ | 308.25 | | | $ | 291.24 | | | $ | 303.53 | |
| Ratio of total expenses to average net assets (c) | | | 2.78% | | | | 1.53% | | | | 2.33% | | | | 2.87% | | | | 3.63% | |
| Ratio of operating expenses to average net assets | | | 1.61% | | | | 1.54% | | | | 1.57% | | | | 1.71% | | | | 1.59% | |
| Ratio of interest expense to average net assets | | | 0.33% | | | | 0.35% | | | | 0.35% | | | | 0.35% | | | | 0.51% | |
| Ratio of income tax expense to average net assets | | | 0.84% | | | | (0.36% | ) | | | 0.42% | | | | 0.81% | | | | 1.53% | |
| Ratio of net investment income to average net assets | | | 5.84% | | | | 8.17% | | | | 7.41% | | | | 8.00% | | | | 8.49% | |
| Portfolio turnover | | | 45% | | | | 33% | | | | 21% | | | | 48% | | | | 25% | |
| (a) | | Calculated using average shares. |
| (b) | | Net asset value return represents portfolio returns based on change in the Trust’s net asset value assuming the reinvestment of all dividends and distributions which differs from the total investment return based on the Trust’s market value due to the difference between the Trust’s net asset value and the market value of its shares outstanding; past performance is no guarantee of future results. |
| (c) | | Total expenses include income tax expense. |
| Senior borrowings: | | | | | | | | | | | | | | | | | | | | |
| | | | | | | | | | | | | | | | | | | | | |
| Total principal amount (in millions) | | $ | 38 | | | $ | 30 | | | $ | 30 | | | $ | 30 | | | $ | 30 | |
| | | | | | | | | | | | | | | | | | | | | |
| Asset coverage per $1,000 of indebtedness | | $ | 9,896 | | | $ | 11,156 | | | $ | 11,275 | | | $ | 10,708 | | | $ | 11,118 | |
See Notes to Consolidated Financial Statements
12
2021 Annual Report
CONSOLIDATED SCHEDULE OF INVESTMENTS
December 31, 2021
| Corporate Restricted Securities - 102.09%: (A) | | Principal Amount,
Shares, Units or
Ownership Percentage | | | Acquisition
Date | | Cost | | | Fair Value | |
| |
| Private Placement Investments - 97.82%: (C) |
| |
| 1WorldSync, Inc. |
| A product information sharing platform that connects manufacturers/suppliers and key retailers via the Global Data Synchronization Network. |
6.25% Term Loan due 06/24/2025
(LIBOR + 5.250%) | | $ | 4,937,158 | | | * | | $ | 4,873,795 | | | $ | 4,937,158 | |
| * 07/01/19 and 12/09/20. | | | | | | | | | | | | | | |
Accelerate Learning |
| A provider of standards-based, digital science education content of K-12 schools. |
6.00% Term Loan due 12/31/2024
(LIBOR + 5.000%) | | $ | 2,028,215 | | | 12/19/18 | | | 2,008,155 | | | | 1,991,056 | |
6.00% Term Loan due 12/20/2024
(LIBOR + 5.000%) | | $ | 1,471,785 | | | 09/30/21 | | | 1,444,652 | | | | 1,444,821 | |
| | | | | | | | | | 3,452,807 | | | | 3,435,877 | |
| |
Advanced Manufacturing Enterprises LLC |
| A designer and manufacturer of large, custom gearing products for a number of critical customer applications. |
| Limited Liability Company Unit (B) | | | 4,669 uts. | | | * | | | 498,983 | | | | — | |
| * 12/07/12, 07/11/13 and 06/30/15. | | | | | | | | | | | | | | |
|
Advantage Software |
|
| A provider of enterprise resource planning (ERP) software built for advertising and marketing agencies. |
| Limited Liability Company Unit Class A (F) | | | 1,556 uts. | | | 10/01/21 | | | 50,720 | | | | 50,720 | |
| Limited Liability Company Unit Class A (F) | | | 401 uts. | | | 10/01/21 | | | 13,103 | | | | 13,103 | |
| Limited Liability Company Unit Class B (F) | | | 1,556 uts. | | | 10/01/21 | | | 1,630 | | | | 1,630 | |
| Limited Liability Company Unit Class B (F) | | | 401 uts. | | | 10/01/21 | | | 420 | | | | 420 | |
| | | | | | | | | | 65,873 | | | | 65,873 | |
|
| |
| Aftermath, Inc. |
| A provider of crime scene cleanup and biohazard remediation services. |
6.00% Term Loan due 04/10/2025
(LIBOR + 5.000%) | | $ | 3,496,262 | | | * | | | 3,449,361 | | | | 3,449,319 | |
| * 04/09/19 and 04/23/21. | | | | | | | | | | | | | | |
|
AIT Worldwide Logistics, Inc. |
| A provider of domestic and international third-party logistics services. |
8.50% Second Lien Term Loan due 03/31/2029
(LIBOR + 7.750%) | | $ | 3,387,097 | | | 04/06/21 | | | 3,317,944 | | | | 3,387,097 | |
See Notes to Consolidated Financial Statements
13
Barings Corporate Investors
CONSOLIDATED SCHEDULE OF INVESTMENTS (CONTINUED)
December 31, 2021
Corporate Restricted Securities: (A)
(Continued) | | Principal Amount,
Shares, Units or
Ownership Percentage | | | Acquisition
Date | | Cost | | | Fair Value | |
| | | | | | | | | | | | |
| Limited Liability Company Unit (B) | | | 113 uts. | | | 04/06/21 | | $ | 112,903 | | | $ | 223,066 | |
| | | | | | | | | | 3,430,847 | | | | 3,610,163 | |
|
| |
AMS Holding LLC |
| A leading multi-channel direct marketer of high-value collectible coins and proprietary-branded jewelry and watches. |
Limited Liability Company Unit Class A
Preferred (B) (F) | | | 273 uts. | | | 10/04/12 | | | 272,727 | | | | 572,670 | |
|
Amtech Software |
|
| A provider of enterprise resource planning software and technology solutions for packaging manufacturers. |
6.25%First Lien Term Loan due 11/02/2027
(LIBOR + 5.500%) (G) | | $ | 2,000,000 | | | 11/02/21 | | | 1,052,004 | | | | 1,050,910 | |
|
ASC Holdings, Inc. |
|
| A manufacturer of capital equipment used by corrugated box manufacturers. |
13% (1% PIK) Senior Subordinated Note due
12/31/2024 | | $ | 1,530,352 | | | 11/19/15 | | | 1,530,343 | | | | 1,530,352 | |
| Limited Liability Company Unit (B) | | | 225,300 uts. | | | 11/18/15 | | | 225,300 | | | | 30,416 | |
| | | | | | | | | | 1,755,643 | | | | 1,560,768 | |
|
| |
| ASPEQ Holdings |
|
| A manufacturer of highly-engineered electric heating parts and equipment for a range of industrial, commercial, transportation and marine applications. |
6.25% Term Loan due 10/31/2025
(LIBOR + 5.250%) | | $ | 2,361,498 | | | 11/08/19 | | | 2,338,761 | | | | 2,361,498 | |
|
Audio Precision |
|
| A provider of high-end audio test and measurement sensing instrumentation software and accessories. |
7.00% Term Loan due 10/31/2024
(LIBOR + 6.000%) | | $ | 3,686,000 | | | 10/30/18 | | | 3,651,225 | | | | 3,686,000 | |
|
Aurora Parts & Accessories LLC |
| A distributor of aftermarket over-the-road semi-trailer parts and accessories sold to customers across North America. |
| Preferred Stock (B) | | | 425 shs. | | | 08/17/15 | | | 424,875 | | | | 424,875 | |
| Common Stock (B) | | | 425 shs. | | | 08/17/15 | | | 425 | | | | 281,546 | |
| | | | | | | | | | 425,300 | | | | 706,421 | |
| | | | | | | | | | | | | | | |
See Notes to Consolidated Financial Statements
14
2021 Annual Report
CONSOLIDATED SCHEDULE OF INVESTMENTS (CONTINUED)
December 31, 2021
Corporate Restricted Securities: (A)
(Continued) | | Principal Amount,
Shares, Units or
Ownership Percentage | | | Acquisition
Date | | Cost | | | Fair Value | |
| |
| BDP International, Inc. |
| A provider of transportation and related services to the chemical and life sciences industries. |
6.25% Term Loan due 12/14/2024
(LIBOR + 5.250%) | | $ | 4,850,000 | | | 12/18/18 | | $ | 4,802,187 | | | $ | 4,777,250 | |
6.25% Term Loan due 12/19/2024
(LIBOR + 5.250%) | | $ | 86,625 | | | 12/07/20 | | | 85,351 | | | | 85,326 | |
6.25% Term Loan due 12/21/2024
(LIBOR + 5.250%) | | $ | 12,406 | | | 03/30/21 | | | 12,208 | | | | 12,220 | |
| | | | | | | | | | 4,899,746 | | | | 4,874,796 | |
|
| |
| Best Lawyers (Azalea Investment Holdings, LLC) |
| A global digital media company that provides ranking and marketing services to the legal community. |
6.25%First Lien Term Loan due 11/19/2027
(LIBOR + 5.250%) (G) | | $ | 2,822,436 | | | 11/30/21 | | | 2,093,739 | | | | 2,092,911 | |
| 12% HoldCo PIK Note due 5/19/2028 | | $ | 587,821 | | | 11/30/21 | | | 576,223 | | | | 576,064 | |
| Limited Liability Company Unit | | | 89,744 uts. | | | 11/30/21 | | | 89,744 | | | | 89,744 | |
| | | | | | | | | | 2,759,706 | | | | 2,758,719 | |
|
| |
| Blue Wave Products, Inc. |
| A distributor of pool supplies. | | | | | | | | | | | | | | |
| Common Stock (B) | | | 114,894 shs. | | | 10/12/12 | | | 114,894 | | | | 253,891 | |
Warrant, exercisable until 2022, to purchase
common stock at $.01 per share (B) | | | 45,486 shs. | | | 10/12/12 | | | 45,486 | | | | 100,514 | |
| | | | | | | | | | 160,380 | | | | 354,405 | |
|
| |
| BrightSign |
| A provider of digital signage hardware and software solutions, serving a variety of end markets, including retail, restaurants, government, sports, and entertainment. |
6.75% Term Loan due 10/14/2027
(LIBOR + 5.750%) (G) | | $ | 2,971,048 | | | 10/14/21 | | | 2,663,102 | | | | 2,662,097 | |
| Limited Liability Company Unit (F) | | | 232,701 uts. | | | 10/14/21 | | | 232,701 | | | | 238,519 | |
| | | | | | | | | | 2,895,803 | | | | 2,900,616 | |
|
| |
| Brown Machine LLC |
| A designer and manufacturer of thermoforming equipment used in the production of plastic packaging containers within the food and beverage industry. |
6.25% Term Loan due 10/04/2024
(LIBOR + 5.250%) | | $ | 1,777,889 | | | 10/03/18 | | | 1,766,220 | | | | 1,777,889 | |
See Notes to Consolidated Financial Statements
15
Barings Corporate Investors
CONSOLIDATED SCHEDULE OF INVESTMENTS (CONTINUED)
December 31, 2021
Corporate Restricted Securities: (A)
(Continued) | | Principal Amount,
Shares, Units or
Ownership Percentage | | | Acquisition
Date | | Cost | | | Fair Value | |
| |
| Cadence, Inc. |
| A full-service contract manufacturer (“CMO”) and supplier of advanced products, technologies, and services to medical device, life science, and industrial companies. |
6.00% First Lien Term Loan due 04/30/2025
(LIBOR + 5.000%) | | $ | 2,206,562 | | | 05/14/18 | | $ | 2,185,147 | | | $ | 2,144,778 | |
|
Cadent, LLC |
|
| A provider of advertising solutions driven by data and technology. |
6.00% Term Loan due 09/07/2023
(LIBOR + 5.000%) | | $ | 1,852,753 | | | 09/04/18 | | | 1,846,462 | | | | 1,852,753 | |
|
CAi Software |
|
| A vendor of mission-critical, production-oriented software to niche manufacturing and distribution sectors. |
7.25% Term Loan due 12/10/2028
(LIBOR + 6.250%) (G) | | $ | 5,000,000 | | | 12/13/21 | | | 4,429,251 | | | | 4,428,507 | |
|
Cash Flow Management |
|
| A software provider that integrates core banking systems with branch technology and creates modern retail banking experiences for financial institutions |
6.75% Term Loan due 12/27/2027
(LIBOR + 5.750%) (G) | | $ | 1,973,933 | | | 12/28/21 | | | 1,785,272 | | | | 1,785,201 | |
|
Claritas Holdings, Inc. |
|
| A market research company that provides market segmentation insights to customers engaged in direct-to-consumer and business-to-business marketing activities. |
6.75% Term Loan due 12/31/2023
(LIBOR + 5.750%) | | $ | 3,212,010 | | | 12/20/18 | | | 3,180,391 | | | | 3,212,010 | |
|
CloudWave |
|
| A provider of managed cloud hosting and IT services for hospitals. |
7.00% Term Loan due 01/04/2027
(LIBOR + 6.000%) | | $ | 3,361,694 | | | 01/29/21 | | | 3,297,824 | | | | 3,309,308 | |
| Limited Liability Company Unit (B) (F) | | | 112,903 uts. | | | 01/29/21 | | | 112,903 | | | | 78,468 | |
| | | | | | | | | | 3,410,727 | | | | 3,387,776 | |
See Notes to Consolidated Financial Statements
16
2021 Annual Report
CONSOLIDATED SCHEDULE OF INVESTMENTS (CONTINUED)
December 31, 2021
Corporate Restricted Securities: (A)
(Continued) | | Principal Amount,
Shares, Units or
Ownership Percentage | | | Acquisition
Date | | Cost | | | Fair Value | |
| |
| Command Alkon |
| A vertical-market software and technology provider to the heavy building materials industry delivering purpose-built, mission critical products that serve as the core operating & production systems for ready-mix concrete producers, asphalt producers, and aggregate suppliers. |
9.25% Term Loan due 04/17/2027
(LIBOR + 8.250%) (G) | | $ | 4,990,525 | | | * | | $ | 4,065,862 | | | $ | 4,162,081 | |
| Limited Liability Company Unit | | | 37 uts. | | | 04/23/20 | | | 36,535 | | | | 40,810 | |
| Limited Liability Company Unit B | | | 13,449 uts. | | | 04/23/20 | | | — | | | | 75,007 | |
| * 04/23/20, 10/30/20 and 11/18/20. | | | | | | | | | 4,102,397 | | | | 4,277,898 | |
|
| |
Concept Machine Tool Sales, LLC |
|
| A full-service distributor of high-end machine tools and metrology equipment, exclusively representing a variety of global manufacturers in the Upper Midwest. |
6.00% Term Loan due 01/31/2025
(LIBOR + 5.000%) | | $ | 1,215,188 | | | 01/30/20 | | | 1,200,209 | | | | 1,172,656 | |
| Limited Liability Company Unit (F) | | | 2,575 uts. | | | * | | | 103,121 | | | | 66,667 | |
| * 01/30/2020 and 03/05/21 | | | | | | | | | 1,303,330 | | | | 1,239,323 | |
|
| |
CTS Engines |
| A provider of maintenance, repair and overhaul services within the aerospace & defense market. |
6.50% Term Loan due 12/22/2026
(LIBOR + 5.500%) | | $ | 2,889,881 | | | 12/22/20 | | | 2,841,954 | | | | 2,791,625 | |
|
Dart Buyer, Inc. |
| A manufacturer of helicopter aftermarket equipment and OEM Replacement parts for rotorcraft operators, providers and OEMs. |
6.25% Term Loan due 04/01/2025
(LIBOR + 5.250%) (G) | | $ | 3,438,129 | | | 04/01/19 | | | 2,830,424 | | | | 2,754,170 | |
|
Decks Direct |
| An eCommerce direct-to-consumer seller of specialty residential decking products in the United States. |
7.00% Term Loan due 12/28/2026
(LIBOR + 6.000%) (G) | | $ | 3,309,091 | | | 12/29/21 | | | 2,479,381 | | | | 2,479,272 | |
| Common Stock | | | 4,483 shs. | | | 12/29/21 | | | 190,909 | | | | 190,922 | |
| | | | | | | | | | 2,670,290 | | | | 2,670,194 | |
See Notes to Consolidated Financial Statements
17
Barings Corporate Investors
CONSOLIDATED SCHEDULE OF INVESTMENTS (CONTINUED)
December 31, 2021
Corporate Restricted Securities: (A)
(Continued) | | Principal Amount,
Shares, Units or
Ownership Percentage | | | Acquisition
Date | | Cost | | | Fair Value | |
| |
| Del Real LLC |
| A manufacturer and distributor of fully-prepared fresh refrigerated Hispanic entrees as well as side dishes that are typically sold on a heat-and-serve basis at retail grocers. |
| 11% Senior Subordinated Note due 04/06/2023 (D) | | $ | 2,882,353 | | | 10/07/16 | | $ | 2,848,206 | | | $ | 2,738,235 | |
| Limited Liability Company Unit (B) (F) | | | 748,287 uts. | | | * | | | 748,548 | | | | 169,480 | |
| * 10/07/16, 07/25/18, 03/13/19 and 06/17/19. | | | | | | | | | 3,596,754 | | | | 2,907,715 | |
|
| |
DistroKid (IVP XII DKCo-Invest,LP) |
| A subscription-based music distribution platform that allows artists to easily distribute, promote, and monetize their music across digital service providers, such as Spotify and Apple Music. |
7.00% Term Loan due 09/30/2027
(LIBOR + 6.000%) | | $ | 3,351,064 | | | 10/01/21 | | | 3,286,858 | | | | 3,284,043 | |
| Limited Liability Company Unit (F) | | | 148,791 uts. | | | 10/01/21 | | | 148,936 | | | | 148,791 | |
| | | | | | | | | | 3,435,794 | | | | 3,432,834 | |
| |
| Dunn Paper |
| A provider of specialty paper for niche product applications. |
| 10.25% Second Lien Term Loan due 08/31/2023 (LIBOR + 9.250%) | | $ | 3,500,000 | | | 09/28/16 | | | 3,478,053 | | | | 3,069,500 | |
|
Dwyer Instruments, Inc. |
| A designer and manufacturer of precision measurement and control products for use with solids, liquids and gases. |
6.25% First Lien Term Loan due 07/01/2027
(LIBOR + 5.500%) (G) | | $ | 2,000,000 | | | 07/20/21 | | | 1,699,836 | | | | 1,718,843 | |
| | | | | | | | | | | | | | | |
| Echo Logistics | | | | | | | | | | | | | | |
| A provider of tech-enabled freight brokerage across various modes including Truckload, Less-than-Truckload, Parcel, and Intermodal, as well as managed (contracted) transportation services. |
7.50% Second Lien Term Loan due 11/05/2029
(LIBOR + 7.250%) | | $ | 3,407,080 | | | 11/22/21 | | | 3,348,277 | | | | 3,347,456 | |
| Limited Liability Company Unit | | | 93 uts. | | | 11/22/21 | | | 92,920 | | | | 92,920 | |
| | | | | | | | | | 3,441,197 | | | | 3,440,376 | |
| | | | | | | | | | | | | | | |
| EFI Productivity Software | | | | | | | | | | | | | | |
|
| A provider of ERP software solutions purpose-built for the print and packaging industry. |
6.50% Term Loan due 12/30/2027
(LIBOR + 6.00%) (G) | | $ | 2,000,000 | | | 12/30/21 | | | 1,813,977 | | | | 1,813,977 | |
See Notes to Consolidated Financial Statements
18
2021 Annual Report
CONSOLIDATED SCHEDULE OF INVESTMENTS (CONTINUED)
December 31, 2021
Corporate Restricted Securities: (A)
(Continued) | | Principal Amount,
Shares, Units or
Ownership Percentage | | | Acquisition
Date | | Cost | | | Fair Value | |
| | | | | | | | | | | | |
| Electric Power Systems International, Inc. | | | | | | | | | | | |
| A provider of electrical testing services for apparatus equipment and protection & controls infrastructure. |
6.75% Term Loan due 04/19/2028
(LIBOR + 5.750%) (G) | | $ | 2,601,518 | | | 04/19/21 | | $ | 2,317,677 | | | $ | 2,324,589 | |
| | | | | | | | | | | | | | | |
| Elite Sportswear Holding, LLC | | | | | | | | | | | | | | |
| A designer and manufacturer of gymnastics, competitive cheerleading and swimwear apparel in the U.S. and internationally. |
| Limited Liability Company Unit (B) (F) | | | 2,471,843 uts. | | | 10/14/16 | | | 324,074 | | | | — | |
| | | | | | | | | | | | | | | |
| Ellkay | | | | | | | | | | | | | | |
| A provider of data interoperability solutions for labs, hospitals and healthcare providers. |
6.75% Term Loan due 09/14/2027
(LIBOR + 5.750%) | | $ | 1,468,316 | | | 09/14/21 | | | 1,440,295 | | | | 1,441,858 | |
| | | | | | | | | | | | | | | |
| English Color & Supply LLC | | | | | | | | | | | | | | |
|
| A distributor of aftermarket automotive paint and related products to collision repair shops, auto dealerships and fleet customers through a network of stores in the Southern U.S. |
11.5% (0.5% PIK) Senior Subordinated Note due
12/31/2023 | | $ | 2,754,327 | | | 06/30/17 | | | 2,735,944 | | | | 2,745,113 | |
| Limited Liability Company Unit (B) (F) | | | 806,916 uts. | | | 06/30/17 | | | 806,916 | | | | 1,666,714 | |
| | | | | | | | | | 3,542,860 | | | | 4,411,827 | |
| | | | | | | | | | | | | | | |
| ENTACT Environmental Services, Inc. | | | | | | | | | | | | | | |
|
| A provider of environmental remediation and geotechnical services for blue-chip companies with regulatory-driven liability enforcement needs. |
6.75% Term Loan due 12/15/2025
(LIBOR + 4.750%) | | $ | 2,112,434 | | | 02/09/21 | | | 2,095,200 | | | | 2,084,972 | |
| | | | | | | | | | | | | | | |
| eShipping | | | | | | | | | | | | | | |
|
| An asset-life third party logistics Company that serves a broad variety of end markets and offers service across all major transportation modes. |
6.75% Term Loan due 11/05/2027
(LIBOR + 5.750%) (G) | | $ | 3,500,000 | | | 11/05/21 | | | 2,549,884 | | | | 2,548,064 | |
See Notes to Consolidated Financial Statements
19
Barings Corporate Investors
CONSOLIDATED SCHEDULE OF INVESTMENTS (CONTINUED)
December 31, 2021
Corporate Restricted Securities: (A)
(Continued) | | Principal Amount,
Shares, Units or
Ownership Percentage | | | Acquisition
Date | | Cost | | | Fair Value | |
| | | | | | | | | | | | |
| E.S.P. Associates, P.A. | | | | | | | | | | | |
| A professional services firm providing engineering, surveying and planning services to infrastructure projects. | |
| Limited Liability Company Unit (B) | | | 684 uts. | | | * | | $ | 741,480 | | | $ | 684,856 | |
| * 06/29/18 and 12/29/20. | | | | | | | | | | | | | | |
| | | | | | | | | | | | | | | |
| F G I Equity LLC | | | | | | | | | | | | | | |
| A manufacturer of a broad range of filters and related products that are used in commercial, light industrial, healthcare, gas turbine, nuclear, laboratory, clean room, hotel, educational system, and food processing settings. |
| Limited Liability Company Unit Class B-1 (B) | | | 296,053 uts. | | | 12/15/10 | | | 254,058 | | | | 4,346,054 | |
| | | | | | | | | | | | | | | |
| Follett School Solutions | | | | | | | | | | | | | | |
| A provider of software for K-12 school libraries. | | | | | | | | | | | | | | |
6.50% First Lien Term Loan due 07/09/2028
(LIBOR + 5.750%) | | $ | 3,469,376 | | | 08/31/21 | | | 3,401,905 | | | | 3,407,698 | |
| LP Units (B) (F) | | | 1,787 uts. | | | 08/30/21 | | | 17,865 | | | | 46,162 | |
| LP Interest (B) (F) | | | 406 uts. | | | 08/30/21 | | | 4,063 | | | | 10,499 | |
| | | | | | | | | | 3,423,833 | | | | 3,464,359 | |
| | | | | | | | | | | | | | | |
| FragilePAK | | | | | | | | | | | | | | |
| A provider of third-party logistics services focused on the full delivery life-cycle for big and bulky products. |
5.85% Term Loan due 05/24/2027
(LIBOR + 5.750%) (G) | | $ | 3,275,781 | | | 05/21/21 | | | 2,100,927 | | | | 2,109,715 | |
| Limited Liability Company Unit (B) (F) | | | 219 uts. | | | 05/21/21 | | | 218,750 | | | | 216,042 | |
| | | | | | | | | | 2,319,677 | | | | 2,325,757 | |
| | | | | | | | | | | | | | | |
| GD Dental Services LLC | | | | | | | | | | | | | | |
| A provider of convenient “onestop” general, specialty, and cosmetic dental services with offices located throughout Florida and Georgia. |
| Limited Liability Company Unit Preferred (B) | | | 182 uts. | | | 10/05/12 | | | 182,209 | | | | 133,402 | |
| Limited Liability Company Unit Common (B) | | | 1,840 uts. | | | 10/05/12 | | | 1,840 | | | | — | |
| | | | | | | | | | 184,049 | | | | 133,402 | |
See Notes to Consolidated Financial Statements
20
2021 Annual Report
CONSOLIDATED SCHEDULE OF INVESTMENTS (CONTINUED)
December 31, 2021
Corporate Restricted Securities: (A)
(Continued) | | Principal Amount,
Shares, Units or
Ownership Percentage | | | Acquisition
Date | | Cost | | | Fair Value | |
| | | | | | | | | | | | |
| gloProfessional Holdings, Inc. | | | | | | | | | | | |
| A marketer and distributor of premium mineral-based cosmetics, cosmeceuticals and professional hair care products to the professional spa and physician’s office channels. |
| Preferred Stock (B) | | | 1,559 shs. | | | 03/29/19 | | $ | 1,559,055 | | | $ | 1,933,451 | |
| Common Stock (B) | | | 2,835 shs. | | | 03/27/13 | | | 283,465 | | | | 66,395 | |
| | | | | | | | | | 1,842,520 | | | | 1,999,846 | |
| | | | | | | | | | | | | | | |
| GraphPad Software, Inc. | | | | | | | | | | | | | | |
| A provider of data analysis, statistics and graphing software solution for scientific research applications, with a focus on the life sciences and academic end-markets. | |
7.00% Term Loan due 04/27/2027
(LIBOR + 6.000%) | | $ | 4,849,313 | | | * | | | 4,817,498 | | | | 4,873,559 | |
6.50% Term Loan due 04/27/2027
(PRIME + 5.500%) | | $ | 99,955 | | | 04/27/21 | | | 98,183 | | | | 100,454 | |
| Preferred Stock (B) (F) | | | 7,474 shs. | | | 04/27/21 | | | 206,294 | | | | 225,429 | |
| * 12/19/17 and 04/16/19. | | | | | | | | | 5,121,975 | | | | 5,199,442 | |
| | | | | | | | | | | | | | | |
| | | | | | | | | | | | | | | |
| Handi Quilter Holding Company (Premier Needle Arts) | | | | | | | | | | | | | | |
| A designer and manufacturer of long-arm quilting machines and related components for the consumer quilting market. |
| Limited Liability Company Unit Preferred (B) | | | 754 uts. | | | * | | | 754,062 | | | | 1,237,503 | |
Limited Liability Company Unit Common
Class A (B) | | | 7,292 uts. | | | 12/19/14 | | | — | | | | 42,495 | |
| * 12/19/14 and 04/29/16. | | | | | | | | | 754,062 | | | | 1,279,998 | |
| | | | | | | | | | | | | | | |
| | | | | | | | | | | | | | | |
| Heartland Veterinary Partners | | | | | | | | | | | | | | |
| A veterinary support organization that provides a comprehensive set of general veterinary services as well as ancillary services such as boarding and grooming. | |
| 11.00% Opco PIK Note due 11/09/2028 (G) | | $ | 3,500,000 | | | 11/17/21 | | | 3,184,128 | | | | 3,182,500 | |
| | | | | | | | | | | | | | | |
| HHI Group, LLC | | | | | | | | | | | | | | |
| A developer, marketer, and distributor of hobby-grade radio control products. | |
| Limited Liability Company Unit (B) (F) | | | 203 uts. | | | 01/17/14 | | | 203,125 | | | | 995,146 | |
| | | | | | | | | | | | | | | |
| Home Care Assistance, LLC | | | | | | | | | | | | | | |
| A provider of private pay non-medical home care assistance services. | |
5.75% Term Loan due 03/30/2027
(LIBOR + 4.750%) (G) | | $ | 1,774,521 | | | 03/26/21 | | | 1,743,518 | | | | 1,739,031 | |
See Notes to Consolidated Financial Statements
21
Barings Corporate Investors
CONSOLIDATED SCHEDULE OF INVESTMENTS (CONTINUED)
December 31, 2021
Corporate Restricted Securities: (A)
(Continued) | | Principal Amount,
Shares, Units or
Ownership Percentage | | | Acquisition
Date | | Cost | | | Fair Value | |
| | | | | | | | | | | | |
| HOP Entertainment LLC | | | | | | | | | | | |
| A provider of post production equipment and services to producers of television shows and motion pictures. |
| Limited Liability Company Unit Class F (B) (F) | | 89 uts. | | | 10/14/11 | | — | | | — | |
| Limited Liability Company Unit Class G (B) (F) | | 215 uts. | | | 10/14/11 | | — | | | — | |
| Limited Liability Company Unit Class H (B) (F) | | 89 uts. | | | 10/14/11 | | — | | | — | |
| Limited Liability Company Unit Class I (B) (F) | | 89 uts. | | | 10/14/11 | | — | | | — | |
| | | | | | | | — | | | — | |
| IGL Holdings III Corp. | | | | | | | | | | | |
| A specialty label and flexible packaging converter. |
5.92% Term Loan due 10/23/2026 (LIBOR +
5.750%) (G) | | $ | 3,473,713 | | | 11/02/20 | | $ | 3,047,014 | | | $ | 3,068,213 | |
| | | | | | | | | | | | | | | |
| IM Analytics Holdings, LLC | | | | | | | | | | | | | | |
| A provider of test and measurement equipment used for vibration, noise, and shock testing. |
8.00% Term Loan due 11/22/2023 (LIBOR +
7.000%) | | $ | 2,179,001 | | | 11/21/19 | | | 2,168,665 | | | | 1,770,438 | |
| Warrant, exercisable until 2026, to purchase | | | | | | | | | | | | | | |
| common stock at $.01 per share (B) | | | 18,488 shs. | | | 11/25/19 | | | — | | | | — | |
| | | | | | | | | | 2,168,665 | | | | 1,770,438 | |
| | | | | | | | | | | | | | | |
| Industrial Service Solutions | | | | | | | | | | | | | | |
|
| A provider of maintenance, repair and overhaul services for process equipment within the industrial, energy and power end-markets. |
6.50% Term Loan due 01/31/2026 (LIBOR +
5.500%) | | $ | 1,847,804 | | | 02/05/20 | | | 1,822,582 | | | | 1,757,261 | |
| | | | | | | | | | | | | | | |
| JF Petroleum Group | | | | | | | | | | | | | | |
|
| A provider of repair, maintenance, installation and projection management servicese to the US fueling infrastructure industry. |
6.50% Term Loan due 07/31/2024 (LIBOR +
5.500%) | | $ | 1,421,441 | | | 05/04/21 | | | 1,384,449 | | | | 1,364,583 | |
| | | | | | | | | | | | | | | |
| Kano Laboratories LLC | | | | | | | | | | | | | | |
| A producer of industrial strength penetrating oils and lubricants. |
6.00% Term Loan due 09/30/2026 (LIBOR +
5.000%) (G) | | $ | 2,590,753 | | | 11/18/20 | | | 1,726,626 | | | | 1,716,757 | |
6.00% First Lien Term Loan due 10/31/2027
(LIBOR + 5.000%) (G) | | $ | 853,319 | | | 11/18/21 | | | 507,867 | | | | 507,445 | |
| Limited Liability Company Unit Class | | | 41 uts. | | | 11/19/20 | | | 41,109 | | | | 41,485 | |
| | | | | | | | | | 2,275,602 | | | | 2,265,687 | |
See Notes to Consolidated Financial Statements
22
2021 Annual Report
CONSOLIDATED SCHEDULE OF INVESTMENTS (CONTINUED)
December 31, 2021
Corporate Restricted Securities: (A)
(Continued) | | Principal Amount,
Shares, Units or
Ownership Percentage | | | Acquisition
Date | | Cost | | | Fair Value | |
| | | | | | | | | | | | |
| LYNX Franchising | | | | | | | | | | | |
| A global franchisor of B2B services including commercial janitorial services, shared office space solutions, and textile and electronics restoration services. |
7.25% Term Loan due 12/18/2026 (LIBOR +
6.250%) | | $ | 4,991,250 | | | * | | $ | 4,905,103 | | | $ | 4,891,425 | |
| * 12/22/2020 and 09/09/2021 | | | | | | | | | | | | | | |
| | | | | | | | | | | | | | | |
| Manhattan Beachwear Holding Company | | | | | | | | | | | | | | |
| A designer and distributor of women’s swimwear. |
12.5% Senior Subordinated Note due
05/30/2022 (D) | | $ | 1,259,914 | | | 01/15/10 | | | 1,212,363 | | | | — | |
15% (2.5% PIK) Senior Subordinated Note due
05/30/2022 (D) | | $ | 345,759 | | | 10/05/10 | | | 343,820 | | | | — | |
| Common Stock (B) | | | 106 shs. | | | 10/05/10 | | | 106,200 | | | | — | |
| Common Stock Class B (B) | | | 353 shs. | | | 01/15/10 | | | 352,941 | | | | — | |
Warrant, exercisable until 2023, to purchase
common stock at $.01 per share (B) | | | 312 shs. | | | 10/05/10 | | | 283,738 | | | | — | |
| | | | | | | | | | 2,299,062 | | | | — | |
| | | | | | | | | | | | | | | |
| Master Cutlery LLC | | | | | | | | | | | | | | |
| A designer and marketer of a wide assortment of knives and swords. |
13% Senior Subordinated Note due
07/20/2022 (D) | | $ | 1,736,205 | | | 04/17/15 | | | 1,735,060 | | | | 173,621 | |
| Limited Liability Company Unit | | | 9 uts. | | | 04/17/15 | | | 1,356,658 | | | | — | |
| | | | | | | | | | 3,091,718 | | | | 173,621 | |
| | | | | | | | | | | | | | | |
| Media Recovery, Inc. | | | | | | | | | | | | | | |
| A global manufacturer and developer of shock, temperature, vibration, and other condition indicators and monitors for in-transit and storage applications. |
7.00% First Out Term Loan due 11/22/2025
(LIBOR + 6.000%) | | $ | 1,016,615 | | | 11/25/19 | | | 1,003,185 | | | | 1,016,615 | |
| | | | | | | | | | | | | | | |
| MES Partners, Inc. | | | | | | | | | | | | | | |
| An industrial service business offering an array of cleaning and environmental services to the Gulf Coast region of the U.S. |
| Preferred Stock Series A (B) | | | 62,748 shs. | | | 07/25/19 | | | 25,184 | | | | 39,777 | |
| Preferred Stock Series C (B) | | | 2,587 shs. | | | 09/22/20 | | | 927,966 | | | | — | |
| Common Stock Class B (B) | | | 526,019 shs. | | | * | | | 495,405 | | | | — | |
Warrant, exercisable until 2030, to purchase
common stock at $.01 per share (B) | | | 713,980 shs. | | | 09/22/20 | | | — | | | | — | |
| * 09/30/14 and 02/28/18. | | | | | | | | | 1,448,555 | | | | 39,777 | |
See Notes to Consolidated Financial Statements
23
Barings Corporate Investors
CONSOLIDATED SCHEDULE OF INVESTMENTS (CONTINUED)
December 31, 2021
Corporate Restricted Securities: (A)
(Continued) | | Principal Amount,
Shares, Units or
Ownership Percentage | | | Acquisition
Date | | Cost | | | Fair Value | |
| | | | | | | | | | | | |
| MeTEOR Education LLC | | | | | | | | | | | |
| A leading provider of classroom and common area design services, furnishings, equipment and instructional support to K-12 schools. |
| 12% Senior Subordinated Note due 06/20/2023 | | $ | 2,297,872 | | | 03/09/18 | | $ | 2,284,138 | | | $ | 2,297,872 | |
| Limited Liability Company Unit (B) (F) | | | 456 uts. | | | 03/09/18 | | | 459,574 | | | | 364,937 | |
| | | | | | | | | | 2,743,712 | | | | 2,662,809 | |
| | | | | | | | | | | | | | | |
| MNS Engineers, Inc. | | | | | | | | | | | | | | |
| A consulting firm that provides civil engineering, construction management and land surveying services. |
6.50% First Lien Term Loan due 07/30/2027
(LIBOR + 5.500%) | | $ | 2,394,000 | | | 08/09/21 | | | 2,349,221 | | | | 2,352,239 | |
| Limited Liability Company Unit (B) | | | 200,000 uts. | | | 08/09/21 | | | 200,000 | | | | 204,000 | |
| | | | | | | | | | 2,549,221 | | | | 2,556,239 | |
| | | | | | | | | | | | | | | |
| Motion Controls Holdings | | | | | | | | | | | | | | |
|
| A manufacturer of high performance mechanical motion control and linkage products. |
| Limited Liability Company Unit Class B-1 (B) (F) | | | 225,000 uts. | | | 11/30/10 | | | — | | | | 40,500 | |
| Limited Liability Company Unit Class B-2 (B) (F) | | | 20,403 uts. | | | 11/30/10 | | | — | | | | 3,673 | |
| | | | | | | | | | — | | | | 44,173 | |
| | | | | | | | | | | | | | | |
| Music Reports, Inc. | | | | | | | | | | | | | | |
|
| An administrator of comprehensive offering of rights and royalties solutions for music and cue sheet copyrights to music and entertainment customers. |
7.25% Term Loan due 08/21/2026 (LIBOR +
6.250%) | | $ | 1,707,266 | | | 11/05/21 | | | 1,674,233 | | | | 1,673,121 | |
7.00% Term Loan due 08/21/2026 (LIBOR +
6.000%) | | $ | 1,243,465 | | | 08/25/20 | | | 1,219,376 | | | | 1,218,596 | |
| | | | | | | | | | 2,893,609 | | | | 2,891,717 | |
| | | | | | | | | | | | | | | |
| Narda-MITEQ (JFL-Narda Partners, LLC) | | | | | | | | | | | | | | |
|
| A manufacturer of radio frequency and microwave components and assemblies. |
6.25% Incremental Term Loan due 12/06/2027
(LIBOR + 5.250%) (G) | | $ | 1,739,315 | | | 12/28/21 | | | 1,708,933 | | | | 1,708,877 | |
6.25% First Lien Term Loan due 11/30/2027
(LIBOR + 5.250%) (G) | | $ | 1,581,360 | | | 12/06/21 | | | 1,129,011 | | | | 1,128,709 | |
Limited Liability Company Unit Class A
Preferred | | | 1,614 uts. | | | 12/06/21 | | | 161,392 | | | | 161,392 | |
Limited Liability Company Unit Class B
Common | | | 179 uts. | | | 12/06/21 | | | 17,932 | | | | 17,933 | |
| | | | | | | | | | 3,017,268 | | | | 3,016,911 | |
See Notes to Consolidated Financial Statements
24
2021 Annual Report
CONSOLIDATED SCHEDULE OF INVESTMENTS (CONTINUED)
December 31, 2021
Corporate Restricted Securities: (A)
(Continued) | | Principal Amount,
Shares, Units or
Ownership Percentage | | | Acquisition
Date | | Cost | | | Fair Value | |
| | | | | | | | | | | | |
| National Auto Care | | | | | | | | | | | |
| A provider of professional finance and insurance products and consulting services to auto, RV, and powersports dealerships. |
6.25% First Lien Term Loan due 09/28/2024
(LIBOR + 5.250%) (G) | | $ | 1,997,415 | | | 12/20/21 | | $ | 992,350 | | | $ | 992,055 | |
| | | | | | | | | | | | | | | |
| Navia Benefit Solutions, Inc. | | | | | | | | | | | | | | |
| A third-party administrator of employee-directed healthcare benefits. |
6.25%Term Loan due 02/01/2027 (LIBOR +
5.250%) (G) | | $ | 3,489,500 | | | 02/10/21 | | | 2,334,264 | | | | 2,365,363 | |
| | | | | | | | | | | | | | | |
| Northstar Recycling | | | | | | | | | | | | | | |
|
| A managed service provider for waste and recycling services, primarily targeting food and beverage end markets. |
5.75% Term Loan due 09/30/2027 (LIBOR +
4.750%) | | $ | 1,559,129 | | | 10/01/21 | | | 1,529,256 | | | | 1,527,946 | |
| | | | | | | | | | | | | | | |
| Office Ally (OA TOPCO, LP) | | | | | | | | | | | | | | |
| A provider of medical claims clearinghouse software to office-based physician providers and healthcare insurance payers. |
6.75% Term Loan due 12/10/2028 (LIBOR +
6.000%) (G) | | $ | 1,966,351 | | | 12/20/21 | | | 1,660,961 | | | | 1,660,775 | |
| Limited Liability Company Unit | | | 42,184 uts. | | | 09/29/17 | | | 42,184 | | | | 42,184 | |
| | | | | | | | | | 1,703,145 | | | | 1,702,959 | |
| | | | | | | | | | | | | | | |
| Omni Logistics, LLC | | | | | | | | | | | | | | |
| A specialty freight forwarding business specifically targeting the semiconductor, media, technology and healthcare end markets. |
6.00% Term Loan due 12/30/2026 (LIBOR +
5.000%) | | $ | 3,482,500 | | | 12/30/20 | | | 3,395,526 | | | | 3,412,850 | |
| | | | | | | | | | | | | | | |
| Options Technology Ltd | | | | | | | | | | | | | | |
| A provider of vertically focused financial technology managed services and IT infrastructure products for the financial services industry. |
5.50% Term Loan due 12/18/2025 (LIBOR +
4.500%) (G) | | $ | 3,302,114 | | | 12/23/19 | | | 3,258,256 | | | | 3,236,071 | |
See Notes to Consolidated Financial Statements
25
Barings Corporate Investors
CONSOLIDATED SCHEDULE OF INVESTMENTS (CONTINUED)
December 31, 2021
Corporate Restricted Securities: (A)
(Continued) | | Principal Amount,
Shares, Units or
Ownership Percentage | | | Acquisition
Date | | Cost | | | Fair Value | |
| | | | | | | | | | | | |
| PANOS Brands LLC | | | | | | | | | | | |
| A marketer and distributor of branded consumer foods in the specialty, natural, better-for-you,“free from” healthy and gluten-free categories. |
12% (1% PIK) Senior Subordinated Note due
12/29/2023 | | $ | 3,602,879 | | | 02/17/17 | | $ | 3,593,122 | | | $ | 3,602,879 | |
| Common Stock Class B (B) | | | 772,121 shs. | | | * | | | 772,121 | | | | 727,292 | |
| * 01/29/16 and 02/17/17. | | | | | | | | | 4,365,243 | | | | 4,330,171 | |
| | | | | | | | | | | | | | | |
| PB Holdings LLC | | | | | | | | | | | | | | |
| A designer, manufacturer and installer of maintenance and repair parts and equipment for industrial customers. |
5.47% Term Loan due 02/28/2024 (LIBOR +
5.250%) | | $ | 1,629,751 | | | 03/06/19 | | | 1,612,502 | | | | 1,569,451 | |
| | | | | | | | | | | | | | | |
| Pearl Holding Group | | | | | | | | | | | | | | |
| A managing general agent that originates, underwrites, and administers non-standard auto insurance policies for carries in Florida. |
9.00% First Lien Term Loan due 12/16/2026
(LIBOR + 6.000%) (G) | | $ | 3,500,000 | | | 12/20/21 | | | 2,919,301 | | | | 2,918,564 | |
Warrant – Class A, to purchase common stock
at $.01 per share | | | 1,874 uts. | | | 12/22/21 | | | — | | | | — | |
Warrant – Class B, to purchase common stock
at $.01 per share | | | 633 uts. | | | 12/22/21 | | | — | | | | — | |
Warrant – Class CC, to purchase common
stock at $.01 per share | | | 65 uts. | | | 12/22/21 | | | — | | | | — | |
Warrant – Class D, to purchase common
stock at $.01 per share | | | 167 uts. | | | 12/22/21 | | | — | | | | — | |
| | | | | | | | | | 2,919,301 | | | | 2,918,564 | |
| | | | | | | | | | | | | | | |
| Pegasus Transtech Corporation | | | | | | | | | | | | | | |
| A provider of end-to-end document, driver and logistics management solutions, which enable its customers (carriers, brokers, and drivers) to operate more efficiently, reduce manual overhead, enhance compliance, and shorten cash conversion cycles. |
7.75% Term Loan due 08/31/2026 (LIBOR +
6.750%) | | $ | 778,429 | | | 09/29/20 | | | 756,948 | | | | 778,429 | |
7.75% Term Loan due 11/17/2024 (LIBOR +
6.500%) | | $ | 3,842,523 | | | 11/14/17 | | | 3,803,016 | | | | 3,842,523 | |
| | | | | | | | | | 4,559,964 | | | | 4,620,952 | |
| | | | | | | | | | | | | | | |
| Petroplex Inv Holdings LLC | | | | | | | | | | | | | | |
| A leading provider of acidizing services to E&P customers in the Permian Basin. | |
| Limited Liability Company Unit | | | 1.51% int. | | | * | | | 419,207 | | | | 23,899 | |
| * 11/29/12 and 12/20/16. | | | | | | | | | | | | | | |
See Notes to Consolidated Financial Statements
26
2021 Annual Report
CONSOLIDATED SCHEDULE OF INVESTMENTS (CONTINUED)
December 31, 2021
Corporate Restricted Securities: (A)
(Continued) | | Principal Amount,
Shares, Units or
Ownership Percentage | | | Acquisition
Date | | Cost | | | Fair Value | |
| | | | | | | | | | | | |
| Polara (VSC Polara LLC) | | | | | | | | | | | |
| A manufacturer of pedestrian traffic management and safety systems, including accessible pedestrian signals, “push to walk” buttons, and related “traffic” control units. |
5.75% First Lien Term Loan due 12/03/2027
(LIBOR + 4.750%) (G) | | $ | 1,915,148 | | | 12/03/21 | | $ | 1,659,258 | | | $ | 1,658,750 | |
| Limited Liability Company Unit (F) | | | 1,528 uts. | | | 12/03/21 | | | 152,817 | | | | 152,817 | |
| | | | | | | | | | 1,812,075 | | | | 1,811,567 | |
| | | | | | | | | | | | | | | |
| Polytex Holdings LLC | | | | | | | | | | | | | | |
| A manufacturer of water based inks and related products serving primarily the wall covering market. |
13.9% (5.5% PIK) Senior Subordinated Note due
12/31/2024 (D) | | $ | 2,170,983 | | | 07/31/14 | | | 2,159,212 | | | | 2,062,434 | |
| Limited Liability Company Unit | | | 300,485 uts. | | | 07/31/14 | | | 300,485 | | | | 68,871 | |
| Limited Liability Company Unit Class F | | | 75,022 uts. | | | * | | | 50,322 | | | | 49,591 | |
| * 09/28/17 and 02/15/18. | | | | | | | | | 2,510,019 | | | | 2,180,896 | |
| | | | | | | | | | | | | | | |
| | | | | | | | | | | | | | | |
| Portfolio Group | | | | | | | | | | | | | | |
| A provider of professional finance and insurance products to automobile dealerships, delivering a suite of offerings that supplement earnings derived from vehicle transactions. |
6.16% First Lien Term Loan due 12/02/2025
(LIBOR + 6.000%) (G) | | $ | 2,450,000 | | | 11/15/21 | | | 1,919,558 | | | | 1,918,000 | |
| | | | | | | | | | | | | | | |
| PPC Event Services | | | | | | | | | | | | | | |
| A special event equipment rental business. | | | | | | |
| Preferred Stock Series P-1 (B) | | | 144 shs. | | | 07/21/20 | | | 144,094 | | | | 428,668 | |
| Common Stock (B) | | | 346,824 shs. | | | 07/21/20 | | | — | | | | — | |
| 16.00% Term Loan due 05/28/2023 (D) | | $ | 2,072,826 | | | 07/21/20 | | | 1,717,458 | | | | 1,849,058 | |
| 8.00% Term Loan due 05/28/2023 (D) | | $ | 1,554,062 | | | 07/21/20 | | | 1,251,704 | | | | 1,398,656 | |
| Limited Liability Company Unit (B) | | | 7,000 uts. | | | 11/20/14 | | | 350,000 | | | | — | |
| Limited Liability Company Unit Series A-1 (B) | | | 689 uts. | | | 03/16/16 | | | 86,067 | | | | — | |
| | | | | | | | | | 3,549,323 | | | | 3,676,382 | |
| | | | | | | | | | | | | | | |
| Recovery Point Systems, Inc. | | | | | | | | | | | | | | |
| A provider of IT infrastructure, colocation and cloud based resiliency services. |
7.50% Term Loan due 07/31/2026 (LIBOR +
6.500%) | | $ | 2,787,279 | | | 08/12/20 | | | 2,744,433 | | | | 2,787,279 | |
| Limited Liability Company Unit (F) | | | 44,803 uts. | | | 03/05/21 | | | 44,803 | | | | 35,842 | |
| | | | | | | | | | 2,789,236 | | | | 2,823,121 | |
See Notes to Consolidated Financial Statements
27
Barings Corporate Investors
CONSOLIDATED SCHEDULE OF INVESTMENTS (CONTINUED)
December 31, 2021
Corporate Restricted Securities: (A)
(Continued) | | Principal Amount,
Shares, Units or
Ownership Percentage | | | Acquisition
Date | | Cost | | | Fair Value | |
| | | | | | | | | | | | |
| RedSail Technologies | | | | | | | | | | | |
| A provider of pharmacy management software solutions for independent pharmacies and long-term care facilities. |
6.25% Term Loan due 12/11/2027 (LIBOR +
5.500%) | | $ | 3,334,545 | | | 12/09/20 | | $ | 3,266,176 | | | $ | 3,334,545 | |
| | | | | | | | | | | | | | | |
| ReelCraft Industries, Inc. | | | | | | | | | | | | | | |
| A designer and manufacturer of heavy-duty reels for diversified industrial, mobile equipment OEM, auto aftermarket, government/military and other end markets. |
| Limited Liability Company Unit Class B | | | 595,745 uts. | | | 11/13/17 | | | 374,731 | | | | 1,692,538 | |
| | | | | | | | | | | | | | | |
|
| Renovation Brands |
|
| A portfolio of seven proprietary brands that sell various home improvement products primarily through the e-Commerce channel. |
6.50% Term Loan due 08/16/2027 (LIBOR +
5.500%) | | $ | 1,941,748 | | | 11/15/21 | | | 1,894,290 | | | | 1,893,204 | |
| Limited Liability Company Unit | | | 78,947 uts. | | | 11/15/21 | | | 78,947 | | | | 81,316 | |
| | | | | | | | | | 1,973,237 | | | | 1,974,520 | |
| | | | | | | | | | | | | | | |
| Resonetics, LLC | | | | | | | | | | | | | | |
|
| A provider of laser micro-machining manufacturing services for medical device and diagnostic companies. |
7.75% Second Lien Term Loan due 04/28/2029
(LIBOR + 7.000%) | | $ | 3,500,000 | | | 04/28/21 | | | 3,435,941 | | | | 3,430,000 | |
7.16% Second Lien Term Loan due 04/28/2029
(LIBOR + 7.000%) | | $ | 1,120,000 | | | 11/15/21 | | | 1,097,987 | | | | 1,097,600 | |
| | | | | | | | | | 4,533,928 | | | | 4,527,600 | |
| | | | | | | | | | | | | | | |
| REVSpring, Inc. | | | | | | | | | | | | | | |
|
| A provider of accounts receivable management and revenue cycle management services to customers in the healthcare, financial and utility industries. |
| 9.25% Second Lien Term Loan due 10/11/2026 | | | | | | | | | | | | | | |
| (LIBOR + 8.250%) | | $ | 3,500,000 | | | 10/11/18 | | | 3,437,331 | | | | 3,500,000 | |
| | | | | | | | | | | | | | | |
| Rock-it Cargo | | | | | | | | | | | | | | |
|
| A provider of specialized international logistics solutions to the music touring, performing arts, live events, fine art and specialty industries. |
| 6.00% Term Loan due 06/22/2024 | | | | | | | | | | | | | | |
| (LIBOR + 5.000%) | | $ | 4,966,392 | | | 07/30/18 | | | 4,914,136 | | | | 4,002,912 | |
See Notes to Consolidated Financial Statements
28
2021 Annual Report
CONSOLIDATED SCHEDULE OF INVESTMENTS (CONTINUED)
December 31, 2021
Corporate Restricted Securities: (A)
(Continued) | | Principal Amount,
Shares, Units or
Ownership Percentage | | | Acquisition
Date | | Cost | | | Fair Value | |
| | | | | | | | | | | | |
| ROI Solutions | | | | | | | | | | | |
| Call center outsourcing and end user engagement services provider. |
| 6.00% Term Loan due 07/31/2024 | | | | | | | | | | | | | | |
| (LIBOR + 5.000%) (G) | | $ | 3,702,981 | | | 07/31/18 | | $ | 2,428,297 | | | $ | 2,460,158 | |
| | | | | | | | | | | | | | | |
| RPX Corp | | | | | | | | | | | | | | |
| A provider of subscription services that help member companies mitigate the risk of patent disputes and reduce the cost of patent litigation. |
7.00% Term Loan due 10/23/2025 (LIBOR +
6.000%) | | $ | 4,977,859 | | | * | | | 4,885,680 | | | | 4,875,505 | |
| * 10/22/20 and 09/28/21. | | | | | | | | | | | | | | |
| | | | | | | | | | | | | | | |
| Ruffalo Noel Levitz | | | | | | | | | | | | | | |
| A provider of enrollment management, student retention and career services, and fundraising management for colleges and universities. |
7.00% Term Loan due 05/29/2022 (LIBOR +
5.500%) | | $ | 2,557,611 | | | 01/08/19 | | | 2,553,021 | | | | 2,557,611 | |
| | | | | | | | | | | | | | | |
| Safety Products Holdings, Inc. | | | | | | | | | | | | | | |
|
| A manufacturer of highly engineered safety cutting tools. |
7.00% Term Loan due 12/15/2026 (LIBOR +
6.000%) (G) | | $ | 3,393,093 | | | 12/15/20 | | | 3,330,030 | | | | 3,316,748 | |
| Common Stock (B) | | | 59 shs. | | | 12/16/20 | | | 59,372 | | | | 81,348 | |
| | | | | | | | | | 3,389,402 | | | | 3,398,096 | |
| | | | | | | | | | | | | | | |
| Sandvine Corporation | | | | | | | | | | | | | | |
|
| A provider of active network intelligence solutions. |
| 8.09% Second Lien Term Loan due 11/02/2026 | | | | | | | | | | | | | | |
| (LIBOR + 8.000%) | | $ | 3,500,000 | | | 11/01/18 | | | 3,447,117 | | | | 3,500,000 | |
| | | | | | | | | | | | | | | |
| Sara Lee Frozen Foods | | | | | | | | | | | | | | |
|
| A provider of frozen bakery products, desserts and sweet baked goods. |
| 5.50% First Lien Term Loan due 07/30/2025 | | | | | | | | | | | | | | |
| (LIBOR + 4.500%) | | $ | 3,741,361 | | | 07/27/18 | | | 3,698,366 | | | | 3,445,794 | |
See Notes to Consolidated Financial Statements
29
Barings Corporate Investors
CONSOLIDATED SCHEDULE OF INVESTMENTS (CONTINUED)
December 31, 2021
Corporate Restricted Securities: (A)
(Continued) | | Principal Amount,
Shares, Units or
Ownership Percentage | | | Acquisition
Date | | Cost | | | Fair Value | |
| | | | | | | | | | | | |
| Scaled Agile, Inc. | | | | | | | | | | | |
| A provider of training and certifications for IT professionals focused on software development. |
6.50% Term Loan due 12/15/2027 (LIBOR +
5.500%) (G) | | $ | 3,500,000 | | | 12/16/21 | | $ | 2,377,869 | | | $ | 2,377,187 | |
| | | | | | | | | | | | | | | |
| SEKO Worldwide, LLC | | | | | | | | | | | | | | |
|
| A third-party logistics provider of ground, ocean, air and home delivery forwarding services. |
6.00% Term Loan due 12/30/2026 (LIBOR +
5.000%) (G) | | $ | 3,470,091 | | | 12/30/20 | | | 2,887,280 | | | | 2,908,949 | |
| | | | | | | | | | | | | | | |
| Smart Bear | | | | | | | | | | | | | | |
|
| A provider of web-based tools for software development, testing and monitoring. |
| 8.00% Second Lien Term Loan due 03/03/2029 | | | | | | | | | | | | | | |
| (LIBOR + 7.500%) | | $ | 3,500,000 | | | 03/02/21 | | | 3,412,897 | | | | 3,500,000 | |
| | | | | | | | | | | | | | | |
| Smartling, Inc. | | | | | | | | | | | | | | |
| A provider in SaaS-based translation management systems and related translation services. |
6.75% Term Loan due 10/26/2027 (LIBOR +
5.750%) (G) | | $ | 3,500,000 | | | 11/03/21 | | | 2,814,088 | | | | 2,812,353 | |
| | | | | | | | | | | | | | | |
| Specified Air Solutions (dba Madison Indoor Air Solutions) | | | | | | | | | | | | | | |
|
| A manufacturer and distributor of heating, dehumidification and other air quality solutions. |
| Limited Liability Company Unit (B) | | | 1,474,759 uts. | | | 02/20/19 | | | 4,663,774 | | | | 22,947,248 | |
| | | | | | | | | | | | | | | |
| Springbrook Software | | | | | | | | | | | | | | |
| A provider of vertical-market enterprise resource planning software and payments platforms focused on the local government end-market. |
6.50% Term Loan due 12/20/2026 (LIBOR +
5.500%) | | $ | 3,398,842 | | | 12/23/19 | | | 2,722,533 | | | | 2,764,799 | |
| | | | | | | | | | | | | | | |
| Stackline | | | | | | | | | | | | | | |
|
| An e-commerce data company that tracks products sold through online retailers. |
8.75% Term Loan due 07/30/2028 (LIBOR +
7.750%) | | $ | 3,414,634 | | | 07/29/21 | | | 3,350,481 | | | | 3,355,827 | |
| Common Stock (B) | | | 2,720 shs. | | | 07/30/21 | | | 85,374 | | | | 111,112 | |
| | | | | | | | | | 3,435,855 | | | | 3,466,939 | |
See Notes to Consolidated Financial Statements
30
2021 Annual Report
CONSOLIDATED SCHEDULE OF INVESTMENTS (CONTINUED)
December 31, 2021
Corporate Restricted Securities: (A)
(Continued) | | Principal Amount,
Shares, Units or
Ownership Percentage | | | Acquisition
Date | | Cost | | | Fair Value | |
| | | | | | | | | | | | |
| Standard Elevator Systems | | | | | | | | | | | |
| A scaled manufacturer of elevator components combining four elevator companies, Standard Elevator Systems, EMI Porta, Texacone, and ZZIPCO. |
6.50% First Lien Term Loan due 12/02/2027
(LIBOR + 5.750%) (G) | | $ | 3,500,000 | | | 12/02/21 | | $ | 1,888,586 | | | $ | 1,887,627 | |
| | | | | | | | | | | | | | | |
| Strahman Holdings Inc. | | | | | | | | | | | | | | |
|
| A manufacturer of industrial valves and wash down equipment for a variety of industries, including chemical, petrochemical, polymer, pharmaceutical, food processing, beverage and mining. |
| Preferred Stock Series A (B) | | | 317,935 shs. | | | 12/13/13 | | | 317,935 | | | | 467,711 | |
| Preferred Stock Series A-2 (B) | | | 53,086 shs. | | | 09/10/15 | | | 59,987 | | | | 78,094 | |
| | | | | | | | | | 377,922 | | | | 545,805 | |
| | | | | | | | | | | | | | | |
| Stratus Unlimited | | | | | | | | | | | | | | |
| A nationwide provide of brand implementation services, including exterior and interior signage, refresh and remodel, and facility maintenance and repair. |
6.50% Term Loan due 06/08/2027 (LIBOR +
5.500%) | | $ | 1,897,321 | | | 07/02/21 | | | 1,516,126 | | | | 1,539,829 | |
| Limited Liability Company Unit (B) | | | 149 uts. | | | 06/30/21 | | | 149,332 | | | | 152,222 | |
| | | | | | | | | | 1,665,458 | | | | 1,692,051 | |
| | | | | | | | | | | | | | | |
| Sunvair Aerospace Group Inc. | | | | | | | | | | | | | | |
| An aerospace maintenance, repair, and overhaul provider servicing landing gears on narrow body aircraft. |
12% (1-1.5% PIK) Senior Subordinated Note
due 08/01/2024 | | $ | 4,070,891 | | | * | | | 4,010,400 | | | | 4,050,871 | |
| Preferred Stock Series A (B) | | | 58 shs. | | | 12/21/20 | | | 144,411 | | | | 183,006 | |
| Common Stock (B) | | | 139 shs. | | | ** | | | 213,007 | | | | 441,055 | |
| * 07/31/15 and 12/21/20. | | | | | | | | | 4,367,818 | | | | 4,674,932 | |
| ** 07/31/15 and 11/08/17. | | | | | | | | | | | | | | |
| | | | | | | | | | | | | | | |
| Syntax Systems Ltd | | | | | | | | | | | | | | |
|
| A cloud management service provider. |
6.25% Term Loan due 10/14/2028 (LIBOR +
5.500%) (G) | | $ | 2,000,000 | | | 10/28/21 | | | 1,480,120 | | | | 1,479,591 | |
| | | | | | | | | | | | | | | |
| Tencarva Machinery Company | | | | | | | | | | | | | | |
| A distributor of mission critical, engineered equipment, replacement parts and services in the industrial and municipal end-markets. |
6.50% Term Loan due 12/20/2027 (LIBOR +
5.500%) (G) | | $ | 4,114,175 | | | 12/20/21 | | | 2,937,510 | | | | 2,937,116 | |
See Notes to Consolidated Financial Statements
31
Barings Corporate Investors
CONSOLIDATED SCHEDULE OF INVESTMENTS (CONTINUED)
December 31, 2021
Corporate Restricted Securities: (A)
(Continued) | | Principal Amount,
Shares, Units or
Ownership Percentage | | | Acquisition
Date | | Cost | | | Fair Value | |
| |
| The Caprock Group (aka TA/TCG Holdings, LLC) |
| A wealth manager focused on ultra-high-net-worth individuals, who have $25-30 million of investable assets on average. |
| 8.75% Holdco PIK Note due 10/21/2028 | | $ | 2,333,333 | | | 10/28/21 | | $ | 2,287,838 | | | $ | 2,286,667 | |
1.21% Term Loan due 12/15/2027 (LIBOR +
4.250%) (G) | | $ | 1,166,667 | | | 12/21/21 | | | 198,195 | | | | 198,093 | |
| | | | | | | | | | 2,486,033 | | | | 2,484,760 | |
| | | | | | | | | | | | | | | |
| The Hilb Group, LLC | | | | | | | | | | | | | | |
|
| An insurance brokerage platform that offers insurance and benefits programs to middle-market companies throughout the Eastern seaboard. |
6.75% Term Loan due 12/02/2026 (LIBOR +
5.750%) (G) | | $ | 3,461,906 | | | * | | | 3,400,064 | | | | 3,392,667 | |
| * 12/02/19 and 12/10/20. | | | | | | | | | | | | | | |
| | | | | | | | | | | | | | | |
| Therma-Stor Holdings LLC | | | | | | | | | | | | | | |
| A designer and manufacturer of dehumidifiers and water damage restoration equipment for residential and commercial applications. |
| Limited Liability Company Unit (B) | | | 39,963 uts. | | | 11/30/17 | | | — | | | | 21,705 | |
| | | | | | | | | | | | | | | |
| Transit Technologies LLC | | | | | | | | | | | | | | |
| A software platform for the transportation market that offers end-to-end software solutions focused on operations, fleet management and telematics services. |
4.91% Term Loan due 02/10/2025 (LIBOR +
4.750%) (G) | | $ | 2,123,205 | | | 02/13/20 | | | 1,600,486 | | | | 1,572,670 | |
| | | | | | | | | | | | | | | |
| Trident Maritime Systems | | | | | | | | | | | | | | |
|
| A leading provider of turnkey marine vessel systems and solutions for government and commercial new ship construction as well as repair, refurbishment, and retrofit markets worldwide. |
6.50% Unitranche Term Loan due 02/26/2027
(LIBOR + 5.500%) | | $ | 3,473,750 | | | 02/25/21 | | | 3,423,286 | | | | 3,473,750 | |
| | | | | | | | | | | | | | | |
| Tristar Global Energy Solutions, Inc. | | | | | | | | | | | | | | |
|
| A hydrocarbon and decontamination services provider serving refineries worldwide. |
12.5% (1.5% PIK) Senior Subordinated Note due
03/31/2022 (D) | | $ | 2,444,733 | | | 01/23/15 | | | 2,442,764 | | | | 611,183 | |
See Notes to Consolidated Financial Statements
32
2021 Annual Report
CONSOLIDATED SCHEDULE OF INVESTMENTS (CONTINUED)
December 31, 2021
Corporate Restricted Securities: (A)
(Continued) | | Principal Amount,
Shares, Units or
Ownership Percentage | | | Acquisition
Date | | Cost | | | Fair Value | |
| | | | | | | | | | | | |
| Truck-Lite | | | | | | | | | | | |
| A leading provider of harsh environment LED safety lighting, electronics, filtration systems, and telematics for a wide range of commercial vehicles, specialty vehicles, final mile delivery vehicles, off-road/off-highway, marine, and other adjacent harsh environment markets. |
7.25% Term Loan due 12/02/2026 (LIBOR +
6.250%) (G) | | $ | 4,483,482 | | | * | | | 3,831,260 | | | | 3,810,647 | |
6.47% First Lien Term Loan due 04/28/2029
(LIBOR + 6.250%) | | $ | 516,518 | | | 11/15/21 | | $ | 506,400 | | | $ | 506,188 | |
| * 12/13/2019 and 11/15/2021. | | | | | | | | | 4,337,660 | | | | 4,316,835 | |
| | | | | | | | | | | | | | | |
| Trystar, Inc. | | | | | | | | | | | | | | |
| A niche manufacturer of temporary power distribution products for the power rental, industrial, commercial utility and back-up emergency markets. |
6.25% Term Loan due 10/01/2023 (LIBOR +
5.250%) | | $ | 4,607,696 | | | 09/28/18 | | | 4,576,257 | | | | 4,527,061 | |
5.90% Term Loan due 09/28/2023 (LIBOR +
5.750%) | | $ | 374,660 | | | 10/27/21 | | | 368,582 | | | | 368,103 | |
| Limited Liability Company Unit (B) (F) | | | 115 uts. | | | 09/28/18 | | | 124,682 | | | | 107,817 | |
| | | | | | | | | | 5,069,521 | | | | 5,002,981 | |
| | | | | | | | | | | | | | | |
| Turnberry Solutions, Inc. | | | | | | | | | | | | | | |
|
| A provider of technology consulting services. |
7.00% Term Loan due 07/30/2026 (LIBOR +
6.000%) | | $ | 3,389,494 | | | 07/29/21 | | | 3,327,458 | | | | 3,331,120 | |
| | | | | | | | | | | | | | | |
| U.S. Legal Support, Inc. | | | | | | | | | | | | | | |
|
| A provider of court reporting, record retrieval and other legal supplemental services. |
6.75% Term Loan due 11/12/2024 (LIBOR +
5.750%) | | $ | 4,347,430 | | | * | | | 4,305,185 | | | | 4,347,430 | |
| * 11/29/18 and 03/25/19. | | | | | | | | | | | | | | |
| | | | | | | | | | | | | | | |
| UroGPO, LLC | | | | | | | | | | | | | | |
| A group purchasing organization that connects pharmaceutical companies with urology practices to facilitate the purchase of pharmaceutical drugs for discounted prices. |
6.75% Term Loan due 12/15/2026 (LIBOR +
5.750%) | | $ | 4,633,333 | | | 12/14/20 | | | 4,556,823 | | | | 4,633,333 | |
See Notes to Consolidated Financial Statements
33
Barings Corporate Investors
CONSOLIDATED SCHEDULE OF INVESTMENTS (CONTINUED)
December 31, 2021
Corporate Restricted Securities: (A)
(Continued) | | Principal Amount,
Shares, Units or
Ownership Percentage | | | Acquisition
Date | | Cost | | | Fair Value | |
| | | | | | | | | | | | |
| VitalSource | | | | | | | | | | | |
| A provider of digital fulfillment software for the higher education sector. |
6.17% Term Loan due 06/01/2028 (LIBOR +
6.000%) | | $ | 3,437,500 | | | 06/01/21 | | $ | 3,374,504 | | | $ | 3,382,118 | |
| Limited Liability Company Unit (B) (F) | | | 3,837 uts. | | | 06/01/21 | | | 38,367 | | | | 39,883 | |
| | | | | | | | | | 3,412,871 | | | | 3,422,001 | |
| | | | | | | | | | | | | | | |
| VP Holding Company | | | | | | | | | | | | | | |
|
| A provider of school transportation services for special-needs and homeless children in Massachusetts and Connecticut. |
6.50% First Lien Term Loan due 05/22/2024
(LIBOR + 5.500%) | | $ | 4,860,686 | | | 05/17/18 | | | 4,822,024 | | | | 4,782,380 | |
| | | | | | | | | | | | | | | |
| Westminster Acquisition LLC | | | | | | | | | | | | | | |
| A manufacturer of premium, all-natural oyster cracker products sold under the Westminster and Olde Cape Cod brands. |
| Limited Liability Company Unit (B) (F) | | | 751,212 uts. | | | 08/03/15 | | | 751,212 | | | | 25,317 | |
| | | | | | | | | | | | | | | |
| Wolf-Gordon, Inc. | | | | | | | | | | | | | | |
|
| A designer and specialty distributor of wallcoverings and related building products, including textiles, paint, and writeable surfaces. |
| Common Stock (B) | | | 318 shs. | | | 01/22/16 | | | 126,157 | | | | 534,399 | |
| | | | | | | | | | | | | | | |
| Woodland Foods, Inc. | | | | | | | | | | | | | | |
| A provider of specialty dry ingredients such as herbs & spices, rice & grains, mushrooms & truffles, chilies, and other ingredients to customers within the industrial, foodservice, and retail end-markets. |
6.50% Term Loan due 11/30/2027 (LIBOR +
5.500%) (G) | | $ | 2,508,721 | | | 12/01/21 | | | 2,081,723 | | | | 2,081,012 | |
| Limited Liability Company Unit (F) | | | 303.379 uts. | | | 12/01/21 | | | 303,379 | | | | 303,379 | |
| | | | | | | | | | 2,385,102 | | | | 2,384,391 | |
| | | | | | | | | | | | | | | |
| World 50, Inc. | | | | | | | | | | | | | | |
|
| A provider of exclusive peer-to-peer networks for C-suite executives at leading corporations. |
6.25% Term Loan due 01/10/2026 (LIBOR +
5.250%) | | $ | 784,851 | | | 09/21/20 | | | 766,973 | | | | 784,850 | |
5.50% Term Loan due 12/31/2025 (LIBOR +
4.500%) | | $ | 2,510,123 | | | 01/09/20 | | | 2,468,021 | | | | 2,472,472 | |
| | | | | | | | | | 3,234,994 | | | | 3,257,322 | |
| | | | | | | | | | | | | | | |
| | | | | | | | | | | | | | | |
| Total Private Placement Investments (E) | | | | | | | | $ | 315,776,594 | | | $ | 330,680,099 | |
See Notes to Consolidated Financial Statements
34
2021 Annual Report
CONSOLIDATED SCHEDULE OF INVESTMENTS (CONTINUED)
December 31, 2021
Corporate Restricted Securities: (A)
(Continued) | | Interest
Rate | | | Maturity
Date | | Principal
Amount | | | Cost | | | Market Value | |
| | | | | | | | | | | | | | | |
| Rule 144A Securities - 4.26%: (H) | | | | | | | | | | | | | | | | | | |
| | | | | | | | | | | | | | | | | | | |
| Bonds - 4.26% | | | | | | | | | | | | | | | | | | |
| American Airlines Inc. | | | 11.750 | % | | 07/15/25 | | $ | 1,000,000 | | | $ | 992,453 | | | $ | 1,233,750 | |
| BWAY Holding Company | | | 7.250 | | | 04/15/25 | | | 1,500,000 | | | | 1,416,434 | | | | 1,503,803 | |
| CommScope Finance LLC | | | 8.250 | | | 03/01/27 | | | 1,000,000 | | | | 960,598 | | | | 1,027,690 | |
| Coronado Finance Pty Ltd. | | | 10.750 | | | 05/15/26 | | | 492,000 | | | | 483,682 | | | | 530,337 | |
| CVR Energy Inc. | | | 5.750 | | | 02/15/28 | | | 1,000,000 | | | | 919,662 | | | | 960,000 | |
| Diebold Nixdorf | | | 9.375 | | | 07/15/25 | | | 550,000 | | | | 577,998 | | | | 592,207 | |
| Houghton Mifflin Harcourt | | | 9.000 | | | 02/15/25 | | | 1,000,000 | | | | 987,061 | | | | 1,045,000 | |
| Neptune Energy Bondco PLC | | | 6.625 | | | 05/15/25 | | | 1,000,000 | | | | 989,860 | | | | 1,021,250 | |
| Picou Holdings LLC | | | 10.000 | | | 12/31/24 | | | 1,000,000 | | | | 910,107 | | | | 1,025,000 | |
| Prime Security Services, LLC | | | 6.250 | | | 01/15/28 | | | 1,200,000 | | | | 1,078,816 | | | | 1,251,000 | |
| Terrier Media Buyer, Inc. | | | 8.875 | | | 12/15/27 | | | 1,020,000 | | | | 982,192 | | | | 1,102,385 | |
| The Manitowoc Company, Inc. | | | 9.000 | | | 04/01/26 | | | 1,000,000 | | | | 985,018 | | | | 1,052,500 | |
| Trident TPI Holdings Inc | | | 9.250 | | | 08/01/24 | | | 1,000,000 | | | | 981,858 | | | | 1,045,000 | |
| Verscend Holding Corp. | | | 9.750 | | | 08/15/26 | | | 965,000 | | | | 1,013,080 | | | | 1,025,737 | |
| | | | | | | | | | | | | | | | | | | |
| Total Bonds | | | | | | | | | | | | | 13,278,819 | | | | 14,415,659 | |
| | | | | | | | | | | | | | | | | | | |
| Common Stock - 0.00% | | | | | | | | | | | | | | | | | | |
| TherOX, Inc. (B) | | | | | | | | | 103 | | | | — | | | | — | |
| Touchstone Health Partnership (B) | | | | | | | | | 1,168 | | | | — | | | | — | |
| | | | | | | | | | | | | | | | | | | |
| Total Common Stock | | | | | | | | | | | | | — | | | | — | |
| | | | | | | | | | | | | | | | | | | |
| Total Rule 144A Securities | | | | | | | | | | | | | 13,278,819 | | | | 14,415,659 | |
| | | | | | | | | | | | | | | | | | | |
| Total Corporate Restricted Securities | | | | | | | | | | | | $ | 329,055,413 | | | $ | 345,095,758 | |
See Notes to Consolidated Financial Statements
35
Barings Corporate Investors
CONSOLIDATED SCHEDULE OF INVESTMENTS (CONTINUED)
December 31, 2021
Corporate Public Securities -
2.51%: (A) | | LIBOR
Spread | | | Interest
Rate | | | Maturity
Date | | Principal
Amount | | | Cost | | | Market Value | |
| | | | | | | | | | | | | | | | | | |
| Bank Loans - 1.99% | | | | | | | | | | | | | | | | | | | | | | |
| Almonde, Inc. | | | 7.250 | % | | | 8.250 | % | | 06/13/25 | | $ | 940,734 | | | $ | 948,885 | | | $ | 938,062 | |
| Alpine US Bidco LLC | | | 9.000 | | | | 9.750 | | | 04/28/29 | | | 1,270,956 | | | | 1,235,835 | | | | 1,258,246 | |
| Edelman Financial Services | | | 6.750 | | | | 6.854 | | | 06/08/26 | | | 258,914 | | | | 258,176 | | | | 259,346 | |
| Front Line Power Construction LLC | | | 2.500 | | | | 13.500 | | | 11/01/28 | | | 450,000 | | | | 435,357 | | | | 436,500 | |
| Kenan Advantage Group Inc | | | 7.250 | | | | 8.000 | | | 08/17/27 | | | 528,634 | | | | 518,609 | | | | 525,991 | |
| Magenta Buyer LLC | | | 8.250 | | | | 9.000 | | | 05/03/29 | | | 1,006,667 | | | | 996,358 | | | | 997,547 | |
| STS Operating, Inc. | | | 8.000 | | | | 9.000 | | | 04/25/26 | | | 1,000,000 | | | | 1,010,000 | | | | 972,500 | |
| Syncsort Incorporated | | | 7.250 | | | | 8.000 | | | 04/23/29 | | | 444,444 | | | | 441,291 | | | | 443,058 | |
| Wastequip, LLC | | | 7.750 | | | | 8.750 | | | 02/27/26 | | | 1,000,000 | | | | 989,437 | | | | 911,250 | |
| | | | | | | | | | | | | | | | | | | | | | | |
| Total Bank Loans | | | | | | | | | | | | | | | | | 6,833,948 | | | | 6,742,500 | |
| | | | | | | | | | | | | | | | | | | | | | | |
| Bonds - 0.49% | | | | | | | | | | | | | | | | | | | | | | |
| Genesis Energy, L.P. | | | | | | | 6.500 | | | 10/01/25 | | | 675,000 | | | | 648,536 | | | | 666,563 | |
| Triumph Group, Inc. | | | | | | | 7.750 | | | 08/15/25 | | | 1,000,000 | | | | 1,004,961 | | | | 992,500 | |
| | | | | | | | | | | | | | | | | | | | | | | |
| Total Bonds | | | | | | | | | | | | | | | | | 1,653,497 | | | | 1,659,063 | |
| | | | | | | | | | | | | | | | | | | | | | | |
| Common Stock - 0.03% | | | | | | | | | | | | | | | | | | | | | | |
| Chase Packaging Corporation (B) | | | | | | | | | | | | | 9,541 | | | | — | | | | 1,937 | |
| Front Line Power Construction LLC | | | | | | | | | | | | | 5,720 | | | | 14,643 | | | | 12,527 | |
| Tourmaline Oil Corp | | | | | | | | | | | | | 103,618 | | | | — | | | | 82,031 | |
| | | | | | | | | | | | | | | | | | | | | | | |
| Total Common Stock | | | | | | | | | | | | | | | | | 14,643 | | | | 96,495 | |
| | | | | | | | | | | | | | | | | | | | | | | |
| Total Corporate Public Securities | | | | | | | | | | | | | | | | $ | 8,502,088 | | | $ | 8,498,058 | |
See Notes to Consolidated Financial Statements
36
2021 Annual Report
CONSOLIDATED SCHEDULE OF INVESTMENTS (CONTINUED)
December 31, 2021
| Short-Term Securities: | | Interest
Rate/Yield^ | | | Maturity
Date | | Principal
Amount | | | Cost | | | Market Value | |
| | | | | | | | | | | | | | | |
| Commercial Paper - 2.36% | | | | | | | | | | | | | | | | | | |
| Amcor Flexibles North America, Inc. | | | 0.300 | % | | 01/07/22 | | $ | 2,000,000 | | | $ | 1,999,900 | | | $ | 1,999,900 | |
| CenterPoint Energy, Inc. | | | 0.440 | | | 01/11/22 | | | 2,000,000 | | | | 1,999,756 | | | | 1,999,756 | |
| Enbridge (U.S.) Inc. | | | 0.350 | | | 01/18/22 | | | 2,000,000 | | | | 1,999,669 | | | | 1,999,669 | |
| Evergy Kansas | | | 0.320 | | | 01/12/22 | | | 2,000,000 | | | | 1,999,804 | | | | 1,999,804 | |
| | | | | | | | | | | | | | | | | | | |
| Total Short-Term Securities | | | | | | | | | | | | $ | 7,999,129 | | | $ | 7,999,129 | |
| | | | | | | | | | | | | | | | | | | |
| Total Investments | | | 106.97 | % | | | | | | | | $ | 345,556,630 | | | $ | 361,592,945 | |
| | | | | | | | | | | | | | | | | | | |
| Other Assets | | | 7.55 | | | | | | | | | | | | | | 25,510,001 | |
| Liabilities | | | (14.52 | ) | | | | | | | | | | | | | (49,061,842 | ) |
| | | | | | | | | | | | | | | | | | | |
| Total Net Assets | | | 100.00 | % | | | | | | | | | | | | $ | 338,041,104 | |
| (A) | In each of the convertible note, warrant, convertible preferred and common stock investments, the issuer has agreed to provide certain registration rights. |
| (B) | Non-income producing security. |
| (C) | Security valued at fair value using methods determined in good faith by or under the direction of the Board of Trustees. |
| (D) | Defaulted security; interest not accrued. |
| (E) | Illiquid securities. As of December 31, 2021 the value of these securities amounted to $330,680,099 or 97.82% of net assets. |
| (F) | Held in CI Subsidiary Trust. |
| (G) | A portion of these securities contain unfunded commitments. As of December 31, 2021, total unfunded commitments amounted to $22,259,623.88 and had unrealized appreciation of $3,284 or 0.00% of net assets. See Note 7. |
| (H) | Security exempt from registration under Rule 144a of the Securities Act of 1933. These securities may only be resold in transactions exempt from registration, normally to qualified institutional buyers. |
| ^ | | Effective yield at purchase |
See Notes to Consolidated Financial Statements
37
Barings Corporate Investors
CONSOLIDATED SCHEDULE OF INVESTMENTS (CONTINUED)
December 31, 2021
| Industry Classification: | | Fair Value/
Market Value | |
| |
| AEROSPACE & DEFENSE - 5.55% |
| CTS Engines | | $ | 2,791,625 | |
| Dart Buyer, Inc. | | | 2,754,170 | |
| Narda-MITEQ (JFL-Narda Partners, LLC) | | | 3,016,911 | |
| Sunvair Aerospace Group Inc. | | | 4,674,932 | |
| Trident Maritime Systems | | | 3,473,750 | |
| Trident TPI Holdings Inc | | | 1,045,000 | |
| Triumph Group, Inc. | | | 992,500 | |
| | | | 18,748,888 | |
| AIRLINES - 1.38% |
| American Airlines Inc. | | | 1,233,750 | |
| Echo Logistics | | | 3,440,376 | |
| | | | 4,674,126 | |
|
| AUTOMOTIVE - 3.20% |
| Aurora Parts & Accessories LLC | | | 706,421 | |
| English Color & Supply LLC | | | 4,411,827 | |
| JF Petroleum Group | | | 1,364,583 | |
| Truck-Lite | | | 4,316,835 | |
| | | | 10,799,666 | |
|
BROKERAGE, ASSET MANAGERS &
EXCHANGES - 1.74% |
| The Caprock Group | | | 2,484,760 | |
| The Hilb Group, LLC | | | 3,392,667 | |
| | | | 5,877,427 | |
| BUILDING MATERIALS - 0.95% | | | | |
| Decks Direct, LLC | | | 2,670,194 | |
| Wolf-Gordon, Inc. | | | 534,399 | |
| | | | 3,204,593 | |
| CHEMICALS - 1.32% | | | | |
| Kano Laboratories LLC | | | 2,265,687 | |
| Polytex Holdings LLC | | | 2,180,896 | |
| | | | 4,446,583 | |
|
| | Fair Value/
Market Value | |
| |
| CONSUMER CYCLICAL SERVICES - 6.42% |
| Accelerate Learning | | $ | 3,435,877 | |
| LYNX Franchising | | | 4,891,425 | |
| MeTEOR Education LLC | | | 2,662,809 | |
| PPC Event Services | | | 3,676,382 | |
| Prime Security Services, LLC | | | 1,251,000 | |
| ROI Solutions | | | 2,460,158 | |
| Turnberry Solutions, Inc. | | | 3,331,120 | |
| | | | 21,708,771 | |
| CONSUMER PRODUCTS - 2.17% | | | | |
| AMS Holding LLC | | | 572,670 | |
| Blue Wave Products, Inc. | | | 354,405 | |
| Elite Sportswear Holding, LLC | | | — | |
| gloProfessional Holdings, Inc. | | | 1,999,846 | |
| Handi Quilter Holding Company (Premier Needle Arts) | | | 1,279,998 | |
| HHI Group, LLC | | | 995,146 | |
| Manhattan Beachwear Holding Company | | | — | |
| Master Cutlery LLC | | | 173,621 | |
| Renovation Brands | | | 1,974,520 | |
| | | | 7,350,206 | |
| DIVERSIFIED MANUFACTURING - 7.42% |
| Advanced Manufacturing Enterprises LLC | | | — | |
| F G I Equity LLC | | | 4,346,054 | |
| MNS Engineers, Inc. | | | 2,556,239 | |
| Motion Controls Holdings | | | 44,173 | |
| Reelcraft Industries, Inc. | | | 1,692,538 | |
| Resonetics, LLC | | | 4,527,600 | |
| Safety Products Holdings, Inc. | | | 3,398,096 | |
| Standard Elevator Systems | | | 1,887,627 | |
| Strahman Holdings Inc. | | | 545,805 | |
| The Manitowoc Company, Inc. | | | 1,052,500 | |
| Therma-Stor Holdings LLC | | | 21,705 | |
See Notes to Consolidated Financial Statements
38
2021 Annual Report
CONSOLIDATED SCHEDULE OF INVESTMENTS (CONTINUED)
December 31, 2021
| Industry Classification: (Continued) | | Fair Value/
Market Value | |
| | | | |
| Trystar, Inc. | | $ | 5,002,981 | |
| | | | 25,075,318 | |
| ELECTRIC - 2.32% | | | | |
| CenterPoint Energy, Inc. | | | 1,999,756 | |
| Dwyer Instruments, Inc. | | | 1,718,843 | |
| Electric Power Systems International, Inc. | | | 2,324,589 | |
| Evergy Kansas | | | 1,999,804 | |
| | | | 8,042,992 | |
| ENVIRONMENTAL - 1.07% | | | | |
| ENTACT Environmental Services, Inc. | | | 2,084,972 | |
| Northstar Recycling | | | 1,527,946 | |
| | | | 3,612,918 | |
| FINANCIAL COMPANIES - 0.57% | | | | |
| Portfolio Group | | | 1,918,000 | |
| | | | | |
| FINANCIAL OTHER - 0.37% | | | | |
| Edelman Financial Services | | | 259,346 | |
| National Auto Care | | | 992,055 | |
| | | | 1,251,401 | |
| FOOD & BEVERAGE - 4.25% | | | | |
| Alpine US Bidco LLC | | | 1,258,246 | |
| Del Real LLC | | | 2,907,715 | |
| PANOS Brands LLC | | | 4,330,171 | |
| Sara Lee Frozen Foods | | | 3,445,794 | |
| Westminster Acquisition LLC | | | 25,317 | |
| Woodland Foods, Inc. | | | 2,384,391 | |
| | | | 14,351,634 | |
| HEALTHCARE - 6.42% | | | |
| Cadence, Inc. | | | 2,144,778 | |
| Ellkay | | | 1,441,858 | |
| GD Dental Services LLC | | | 133,402 | |
| Heartland Veterinary Partners | | | 3,182,500 | |
| | | Fair Value/
Market Value | |
| | | | | |
| Home Care Assistance, LLC | | $ | 1,739,031 | |
| Navia Benefit Solutions, Inc. | | | 2,365,363 | |
| RedSail Technologies | | | 3,334,545 | |
| Office Ally (OA TOPCO, LP) | | | 1,702,959 | |
| TherOX, Inc. | | | — | |
| Touchstone Health Partnership | | | — | |
| UroGPO, LLC | | | 4,633,333 | |
| Verscend Holding Corp. | | | 1,025,737 | |
| | | | 21,703,506 | |
| INDEPENDENT - 0.30% | | | | |
| Neptune Energy Bondco PLC | | | 1,021,250 | |
| | | | | |
| INDUSTRIAL OTHER - 15.35% | | | | |
| Aftermath, Inc. | | | 3,449,319 | |
| ASPEQ Holdings | | | 2,361,498 | |
| Concept Machine Tool Sales, LLC | | | 1,239,323 | |
| E.S.P. Associates, P.A. | | | 684,856 | |
| Front Line Power Construction LLC | | | 449,027 | |
| IGL Holdings III Corp. | | | 3,068,213 | |
| IM Analytics Holdings, LLC | | | 1,770,438 | |
| Industrial Service Solutions | | | 1,757,261 | |
| Media Recovery, Inc. | | | 1,016,615 | |
| PB Holdings LLC | | | 1,569,451 | |
| Polara | | | 1,811,567 | |
| Specified Air Solutions (dba Madison Indoor Air Solutions) | | | 22,947,248 | |
| Stratus Unlimited | | | 1,692,051 | |
| STS Operating, Inc. | | | 972,500 | |
| Tencarva Machinery Company | | | 2,937,116 | |
| Wastequip, LLC | | | 911,250 | |
| World 50, Inc. | | | 3,257,322 | |
| | | | 51,895,055 | |
| MEDIA & ENTERTAINMENT - 3.93% | | | | |
| Advantage Software | | | 65,873 | |
| BrightSign | | | 2,900,616 | |
| Cadent, LLC | | | 1,852,753 | |
| DistroKid | | | 3,432,834 | |
| HOP Entertainment LLC | | | — | |
See Notes to Consolidated Financial Statements
39
Barings Corporate Investors
CONSOLIDATED SCHEDULE OF INVESTMENTS (CONTINUED)
December 31, 2021
| Industry Classification: (Continued) | | Fair Value/
Market Value | |
| | | | | |
| Houghton Mifflin Harcourt | | $ | 1,045,000 | |
| Music Reports, Inc. | | | 2,891,717 | |
| Terrier Media Buyer, Inc. | | | 1,102,385 | |
| | | | 13,291,178 | |
| METALS & MINING - 0.46% | | | | |
| Coronado Finance Pty Ltd. | | | 530,337 | |
| Picou Holdings LLC | | | 1,025,000 | |
| | | | 1,555,337 | |
| MIDSTREAM - 0.79% | | | | |
| Enbridge (U.S.) Inc. | | | 1,999,669 | |
| Genesis Energy, L.P. | | | 666,563 | |
| | | | 2,666,232 | |
| OIL FIELD SERVICES - 0.03% | | | | |
| Petroplex Inv Holdings LLC | | | 23,899 | |
| Tourmaline Oil Corp | | | 82,031 | |
| | | | 105,930 | |
| PACKAGING - 2.02% | | | | |
| Amcor Flexibles North America, Inc. | | | 1,999,900 | |
| ASC Holdings, Inc. | | | 1,560,768 | |
| Brown Machine LLC | | | 1,777,889 | |
| BWAY Holding Company | | | 1,503,803 | |
| Chase Packaging Corporation | | | 1,937 | |
| | | | 6,844,297 | |
| PAPER - 0.91% | | | | |
| Dunn Paper | | | 3,069,500 | |
| | | | | |
| PROPERTY AND CASUALTY - 0.87% | | | | |
| Pearl Holding Group | | | 2,918,564 | |
| | | | | |
| REFINING - 0.48% | | | | |
| CVR Energy Inc. | | | 960,000 | |
| MES Partners, Inc. | | | 39,777 | |
| Tristar Global Energy Solutions, Inc. | | | 611,183 | |
| | | | 1,610,960 | |
| TECHNOLOGY - 26.69% | | | | |
|
| 1WorldSync, Inc. | | | 4,937,158 | |
| Almonde, Inc. | | | 938,062 | |
| | | Fair Value/
Market Value | |
| | | | |
| Amtech Software | | $ | 1,050,910 | |
| Audio Precision | | | 3,686,000 | |
| Best Lawyers (Azalea Investment Holdings, LLC) | | | 2,758,719 | |
| CAi Software | | | 4,428,507 | |
| Cash Flow Management | | | 1,785,201 | |
| Claritas Holdings, Inc. | | | 3,212,010 | |
| CloudWave | | | 3,387,776 | |
| Command Alkon | | | 4,277,898 | |
| CommScope Finance LLC | | | 1,027,690 | |
| Diebold Nixdorf | | | 592,207 | |
| EFI Productivity Software | | | 1,813,977 | |
| Follett School Solutions | | | 3,464,359 | |
| GraphPad Software, Inc. | | | 5,199,442 | |
| Magenta Buyer LLC | | | 997,547 | |
| Options Technology Ltd | | | 3,236,071 | |
| Recovery Point Systems, Inc. | | | 2,823,121 | |
| REVSpring, Inc. | | | 3,500,000 | |
| RPX Corp | | | 4,875,505 | |
| Ruffalo Noel Levitz | | | 2,557,611 | |
| Sandvine Corporation | | | 3,500,000 | |
| Scaled Agile, Inc. | | | 2,377,187 | |
| Smart Bear | | | 3,500,000 | |
| Smartling, Inc. | | | 2,812,353 | |
| Springbrook Software | | | 2,764,799 | |
| Stackline | | | 3,466,939 | |
| Syncsort Incorporated | | | 443,058 | |
| Syntax Systems Ltd | | | 1,479,591 | |
| Transit Technologies LLC | | | 1,572,670 | |
| U.S. Legal Support, Inc. | | | 4,347,430 | |
| VitalSource | | | 3,422,001 | |
| | | | 90,235,799 | |
| TRANSPORTATION SERVICES - 9.94% |
| AIT Worldwide Logistics, Inc. | | | 3,610,163 | |
| BDP International, Inc. | | | 4,874,796 | |
| eShipping | | | 2,548,064 | |
| FragilePAK | | | 2,325,757 | |
See Notes to Consolidated Financial Statements
40
2021 Annual Report
CONSOLIDATED SCHEDULE OF INVESTMENTS (CONTINUED)
December 31, 2021
| Industry Classification: (Continued) | | Fair Value/
Market Value | |
| | | | |
| Kenan Advantage Group Inc | | $ | 525,991 | |
| Omni Logistics, LLC | | | 3,412,850 | |
| Pegasus Transtech Corporation | | | 4,620,952 | |
| Rock-it Cargo | | | 4,002,912 | |
| SEKO Worldwide, LLC | | | 2,908,949 | |
| VP Holding Company | | | 4,782,380 | |
| | | | 33,612,814 | |
| | | | | |
Total Investments - 106.97%
(Cost - $345,556,630) | | $ | 361,592,945 | |
See Notes to Consolidated Financial Statements
41
Barings Corporate Investors
NOTES TO CONSOLIDATED FINANCIAL STATEMENTS
Barings Corporate Investors (the “Trust”) commenced operations in 1971 as a Delaware corporation. Pursuant to an Agreement and Plan of Reorganization dated November 14, 1985, approved by shareholders, the Trust was reorganized as a Massachusetts business trust under the laws of the Commonwealth of Massachusetts, effective November 28, 1985.
The Trust is a diversified closed-end management investment company. Barings LLC (“Barings”), a wholly-owned indirect subsidiary of Massachusetts Mutual Life Insurance Company (“MassMutual”), acts as its investment adviser. The Trust’s investment objective is to maintain a portfolio of securities providing a current yield and, when available, an opportunity for capital gains. The Trust’s principal investments are privately placed, below-investment grade, long-term debt obligations including bank loans and mezzanine debt instruments. Such direct placement securities may, in some cases, be accompanied by equity features such as common stock, preferred stock, warrants, conversion rights, or other equity features. The Trust typically purchases these investments, which are not publicly tradable, directly from their issuers in private placement transactions. These investments are typically made to small or middle market companies. In addition, the Trust may invest, subject to certain limitations, in marketable debt securities (including high yield and/or investment grade securities) and marketable common stocks. Below-investment grade or high yield securities have predominantly speculative characteristics with respect to the capacity of the issuer to pay interest and repay capital.
In 1998, the Board of Trustees authorized the formation of a wholly-owned subsidiary of the Trust (“CI Subsidiary Trust”) for the purpose of holding certain investments. The results of CI Subsidiary Trust are consolidated in the accompanying financial statements. Footnote 2.D below discusses the Federal tax consequences of the CI Subsidiary Trust.
| 2. | Significant Accounting Policies |
The following is a summary of significant accounting policies followed consistently by the Trust in the preparation of its consolidated financial statements in conformity with accounting principles generally accepted in the United States of America (“U.S. GAAP”).
The Trustees have determined that the Trust is an investment company in accordance with Accounting Standards Codification (“ASC”) 946, Financial Services – Investment Companies, for the purpose of financial reporting.
A. Fair Value Measurements:
Under U.S. GAAP, fair value represents the price that should be received to sell an asset (exit price) in an orderly transaction between willing market participants at the measurement date.
Determination of Fair Value
The determination of the fair value of the Trust’s investments is the responsibility of the Trust’s Board of Trustees (the “Trustees”). The Trustees have adopted procedures for the valuation of the Trust’s securities and have delegated responsibility for applying those procedures to Barings. Barings has established a Pricing Committee which is responsible for setting the guidelines used in following the procedures adopted by the Trustees and ensuring that those guidelines are being followed. Barings considers all relevant factors that are reasonably available, through either public information or information directly available to Barings, when determining the fair value of a security. The Trustees meet at least once each quarter to approve the value of the Trust’s portfolio securities as of the close of business on the last business day of the preceding quarter. This valuation requires the approval of a majority of the Trustees of the Trust, including a majority of the Trustees who are not interested persons of the Trust or of Barings. In approving valuations, the Trustees will consider reports by Barings analyzing each portfolio security in accordance with the procedures and guidelines referred to above, which include the relevant factors referred to below. Barings has agreed to provide such reports to the Trust at least quarterly. The consolidated financial statements include private placement restricted securities valued at $330,680,099 (97.82% of net assets) as of December 31, 2021 the values of which have been estimated by the Trustees based on the process described above in the absence of readily ascertainable market values. Due to the inherent uncertainty of valuation, those estimated values may differ significantly from the values that would have been used had a ready market for the securities existed, and the differences could be material.
Independent Valuation Process
The fair value of bank loans and equity investments that are unsyndicated or for which market quotations are not readily available, including middle-market bank loans, will be submitted to an independent provider to perform an independent valuation on those bank loans and equity investments as of the end of each quarter. Such bank loans and equity investments will be held at cost until such time as they are sent to the valuation provider for an initial valuation subject to override by the Adviser should it
42
2021 Annual Report
NOTES TO CONSOLIDATED FINANCIAL STATEMENTS (CONTINUED)
determine that there have been material changes in interest rates and/or the credit quality of the issuer. The independent valuation provider applies various methods (synthetic rating analysis, discounting cash flows, and re-underwriting analysis) to establish the rate of return a market participant would require (the “discount rate”) as of the valuation date, given market conditions, prevailing lending standards and the perceived credit quality of the issuer. Future expected cash flows for each investment are discounted back to present value using these discount rates in the discounted cash flow analysis. A range of value will be provided by the valuation provider and the Adviser will determine the point within that range that it will use in making valuation recommendations to the Trustees, and will report to the Trustees on its rationale for each such determination. The Adviser will continue to use its internal valuation model as a comparison point to validate the price range provided by the valuation provider and, where applicable, in determining the point within that range that it will use in making valuation recommendations to the Trustees. If the Advisers’ Pricing Committee disagrees with the price range provided, it may make a fair value recommendation to the Trustees that is outside of the range provided by the independent valuation provider, and will notify the Trustees of any such override and the reasons therefore. In certain instances, the Trust may determine that it is not cost-effective, and as a result is not in the shareholders’ best interests, to request the independent valuation firm to perform the Procedures on certain investments. Such instances include, but are not limited to, situations where the fair value of the investment in the portfolio company is determined to be insignificant relative to the total investment portfolio. Finally, the Trustees determined in good faith that the Trust’s investments were valued at fair value in accordance with the Trust’s valuation policies and procedures and the 1940 Act based on, among other things, the input of Barings, the Trust’s Audit Committee and the independent valuation firm.
Following is a description of valuation methodologies used for assets recorded at fair value:
Corporate Public Securities at Fair Value – Bank Loans, Corporate Bonds, Preferred Stocks and Common Stocks
The Trust uses external independent third-party pricing services to determine the fair values of its Corporate Public Securities. At December 31, 2021, 100% of the carrying value of these investments was from external pricing services. In the event that the primary pricing service does not provide a price, the Trust utilizes the pricing provided by a secondary pricing service.
Public debt securities generally trade in the over-the-counter market rather than on a securities exchange. The Trust’s pricing services use multiple valuation techniques to determine fair value. In instances where significant market activity exists, the pricing services may utilize a market based approach through which quotes from market makers are used to determine fair value. In instances where significant market activity may not exist or is limited, the pricing services also utilize proprietary valuation models which may consider market characteristics such as benchmark yield curves, option adjusted spreads, credit spreads, estimated default rates, coupon rates, anticipated timing of principal underlying prepayments, collateral, and other unique security features in order to estimate the relevant cash flows, which are then discounted to calculate the fair value.
The Trust’s investments in bank loans are normally valued at the bid quotation obtained from dealers in loans by an independent pricing service in accordance with the Trust’s valuation policies and procedures approved by the Trustees.
Public equity securities listed on an exchange or on the NASDAQ National Market System are valued at the last quoted sales price of that day.
At least annually, Barings conducts reviews of the primary pricing vendors to validate that the inputs used in that vendors’ pricing process are deemed to be market observable as defined in the standard. While Barings is not provided access to proprietary models of the vendors, the reviews have included on-site walk-throughs of the pricing process, methodologies and control procedures for each asset class and level for which prices are provided. The reviews also include an examination of the underlying inputs and assumptions for a sample of individual securities across asset classes, credit rating levels and various durations. In addition, the pricing vendors have an established challenge process in place for all security valuations, which facilitates identification and resolution of prices that fall outside expected ranges. Barings believes that the prices received from the pricing vendors are representative of prices that would be received to sell the assets at the measurement date (exit prices) and are classified appropriately in the hierarchy.
Corporate Restricted Securities at Fair Value – Bank Loans, Corporate Bonds
The fair value of certain notes is generally determined using an internal model that discounts the anticipated cash flows of those notes using a specific discount rate. Changes to that discount rate are driven by
43
Barings Corporate Investors
NOTES TO CONSOLIDATED FINANCIAL STATEMENTS (CONTINUED)
changes in general interest rates, probabilities of default and credit adjustments. The discount rate used within the models to discount the future anticipated cash flows is considered a significant unobservable input. Increases/(decreases) in the discount rate would result in a (decrease)/increase to the notes’ fair value.
The fair value of certain distressed notes is based on an enterprise waterfall methodology which is discussed in the equity security valuation section below.
Corporate Restricted Securities at Fair Value – Common Stock, Preferred Stock and Partnerships & LLC’s
The fair value of equity securities is generally determined using an enterprise waterfall methodology. Under this methodology, the enterprise value of the company is first estimated and that value is then allocated to the company’s outstanding debt and equity securities based on the documented priority of each class of securities in the capital structure. Generally, the waterfall proceeds from senior debt, to senior and junior subordinated debt, to preferred stock, then finally common stock.
To estimate a company’s enterprise value, the company’s trailing twelve months earnings before interest, taxes, depreciation and amortization (“EBITDA”) is multiplied by a valuation multiple.
Both the company’s EBITDA and valuation multiple are considered significant unobservable inputs. Increases/ (decreases) to the company’s EBITDA and/or valuation multiple would result in increases/ (decreases) to the equity value.
Short-Term Securities
Short-term securities with more than sixty days to maturity are valued at fair value, using external independent third-party services. Short-term securities, of sufficient credit quality, having a maturity of sixty days or less are valued at amortized cost, which approximates fair value.
New Accounting Pronouncement
In March 2020, the Financial Accounting Standards Board issued Accounting Standards Update 2020-04 (“ASU 2020-04”) “Reference Rate Reform (Topic 848): Facilitation of the Effects of Reference Rate Reform on Financial Reporting.” This guidance provides optional expedients and exceptions for applying generally accepted accounting principles to contract modifications and hedging relationships, subject to meeting certain criteria, that reference LIBOR or another reference rate expected to be discontinued. ASU 2020-04 is effective for all entities as of March 12, 2020 through December 31, 2022. The Trust is still evaluating the impact of this accounting standard.
Fair Value Hierarchy
The Trust categorizes its investments measured at fair value in three levels, based on the inputs and assumptions used to determine fair value. These levels are as follows:
Level 1 – quoted prices in active markets for identical securities
Level 2 – other significant observable inputs (including quoted prices for similar securities, interest rates, prepayment speeds, credit risk, etc.)
Level 3 – significant unobservable inputs (including the Trust’s own assumptions in determining the fair value of investments)
44
2021 Annual Report
NOTES TO CONSOLIDATED FINANCIAL STATEMENTS (CONTINUED)
The following table summarizes the levels in the fair value hierarchy into which the Trust’s financial instruments are categorized as of December 31, 2021.
The fair values of the Trust’s investments disaggregated into the three levels of the fair value hierarchy based upon the lowest level of significant input used in the valuation as of December 31, 2021 are as follows:
| Assets: | | Total | | | Level 1 | | | Level 2 | | | Level 3 | |
| Restricted Securities | | | | | | | | | | | | | | | | |
| Corporate Bonds | | $ | 34,228,220 | | | $ | — | | | $ | 14,415,659 | | | $ | 19,812,561 | |
| Bank Loans | | | 266,448,199 | | | | — | | | | — | | | | 266,448,199 | |
| Common Stock - U.S. | | | 2,597,553 | | | | — | | | | — | | | | 2,597,553 | |
| Preferred Stock | | | 3,555,582 | | | | — | | | | — | | | | 3,555,582 | |
| Partnerships and LLCs | | | 38,266,204 | | | | — | | | | — | | | | 38,266,204 | |
| Public Securities | | | | | | | | | | | | | | | | |
| Bank Loans | | | 6,742,500 | | | | — | | | | 4,521,763 | | | | 2,220,737 | |
| Corporate Bonds | | | 1,659,063 | | | | — | | | | 1,659,063 | | | | — | |
| Common Stock - U.S. | | | 96,495 | | | | 14,464 | | | | — | | | | 82,031 | |
| Short-term Securities | | | 7,999,129 | | | | 7,999,129 | | | | — | | | | — | |
| Total | | $ | 361,592,945 | | | $ | 8,013,593 | | | $ | 20,596,485 | | | $ | 332,982,867 | |
See information disaggregated by security type and industry classification in the Consolidated Schedule of Investments.
Quantitative Information about Level 3 Fair Value Measurements
The following table represents quantitative information about Level 3 fair value measurements as of December 31, 2021.
| | Fair Value | Valuation Technique | Unobservable
Inputs | Range | Weighted* |
| Bank Loans | $191,490,421 | Income Approach | Implied Spread | 8.1% - 8.7% | 8.4% |
| | | | | | |
| Corporate Bonds | $19,812,560 | Income Approach | Implied Spread | 10.6% - 21.5% | 13.6% |
| | | | | | |
| Equity Securities** | $43,153,382 | Enterprise Value Waterfall Approach | Valuation Multiple | 5.0x to 54.0x | 13.9x |
Certain of the Trust’s Level 3 securities investments may be valued using unadjusted inputs that have not been internally developed by the Trust, including recently purchased securities held at cost. As a result, fair value of assets of $78,526,504 have been excluded from the preceding table.
| * | The weighted averages disclosed in the table above were weighted by relative fair value |
| ** | Including partnerships and LLC’s |
45
Barings Corporate Investors
NOTES TO CONSOLIDATED FINANCIAL STATEMENTS (CONTINUED)
Following is a reconciliation of Level 3 assets for which significant unobservable inputs were used to determine fair value:
| Assets: | | Beginning
balance
at 12/31/2020 | | | Included in
earnings | | | Purchases | | | Sales | | | Prepayments | | | Transfers
into
Level 3 | | | Transfers
out
of Level 3 | | | Ending
balance at
12/31/2021 | |
| Restricted Securities | | | | | | | | | | | | | | | | | | | | | | | | | | | | | | | | |
| Corporate Bonds | | $ | 38,180,960 | | | $ | (1,409,077 | ) | | $ | 4,216,241 | | | $ | (13,219,731 | ) | | $ | (7,955,832 | ) | | $ | — | | | $ | — | | | $ | 19,812,561 | |
| Bank Loans | | | 188,700,349 | | | | 5,550,169 | | | | 140,566,702 | | | | — | | | | (74,684,930 | ) | | | 6,315,909 | | | | — | | | | 266,448,199 | |
| Common Stock - U.S. | | | 5,547,481 | | | | 2,443,358 | | | | 85,374 | | | | (5,538,030 | ) | | | — | | | | 59,370 | | | | — | | | | 2,597,553 | |
| Preferred Stock | | | 4,827,740 | | | | 212,352 | | | | 850,395 | | | | (2,334,905 | ) | | | — | | | | — | | | | — | | | | 3,555,582 | |
| Partnerships and LLCs | | | 19,437,397 | | | | 25,818,348 | | | | 6,411,023 | | | | (13,400,564 | ) | | | — | | | | — | | | | — | | | | 38,266,204 | |
| Public Securities | | | | | | | | | | | | | | | | | | | | | | | | | | | | | | | | |
| Bank Loans | | | 2,290,718 | | | | 213,221 | | | | 3,182,062 | | | | — | | | | (3,283,960 | ) | | | 824,104 | | | | (1,005,408 | ) | | | 2,220,737 | |
| Preferred Stock | | | | | | | | | | | | | | | | | | | | | | | | | | | | | | | | |
| Corporate Bonds | | | — | | | | — | | | | — | | | | — | | | | — | | | | — | | | | — | | | | — | |
| Common Stock | | | 324,352 | | | | 99,263 | | | | — | | | | (341,584 | ) | | | — | | | | — | | | | — | | | | 82,031 | |
| Short-term Securities | | | — | | | | — | | | | — | | | | — | | | | — | | | | — | | | | — | | | | — | |
| Total | | $ | 259,308,997 | | | $ | 32,927,634 | | | $ | 155,311,797 | | | $ | (34,834,814 | ) | | $ | (85,924,722 | ) | | $ | 7,199,383 | | | $ | (1,005,408 | ) | | $ | 332,982,867 | |
| * | For the year ended December 31, 2021, transfers into and out of Level 3 were the result of changes in the observability of significant inputs for certain portfolio companies. |
Income, Gains and Losses on Level 3 assets included in Net Increase in Net Assets resulting from Operations for the year are presented in the following accounts on the Statement of Operations:
| | | | | | | |
| | | Net Increase
in Net Assets
Resulting from
Operations | | | Change in Unrealized
Appreciation in
Net Assets from
assets still held | |
| | | | | | | |
| Interest Income (OID amortization) | | $ | 878,005 | | | $ | — | |
| | | | | | | | | |
| Net realized gain on investments before taxes | | | 10,826,519 | | | | — | |
| | | | | | | | | |
| Net change in unrealized appreciation of investments before taxes | | | 21,223,110 | | | | 24,199,751 | |
B. Accounting for Investments:
Investment Income
Investment transactions are accounted for on the trade date. Interest income, including the amortization of premiums and accretion of discounts on bonds held using the yield- to-maturity method, is recorded on the accrual basis to the extent that such amounts are expected to be collected. Generally, when interest and/or principal payments on a loan become past due, or if the Trust otherwise does not expect the borrower to be able to service its debt and other obligations, the Trust will place the investment on nonaccrual status and will cease recognizing interest income on that investment for financial reporting purposes until all principal and interest have been brought current through payment or due to a restructuring such that the interest income is deemed to be collectible. The Trust writes off any previously accrued and uncollected interest when it is determined that interest is no longer considered
collectible. As of December 31, 2021, the fair value of the Trust’s nonaccrual assets was $8,833,187, or 2.4% of the total fair value of the Trust’s portfolio, and the cost of the Trust’s nonaccrual assets was $13,710,586, or 4.0% of the total cost of the Trust’s portfolio.
Payment-in-Kind Interest
The Trust currently holds, and expects to hold in the future, some investments in its portfolio that contain Payment-in-Kind (“PIK”) interest provisions. The PIK interest, computed at the contractual rate specified in each loan agreement, is added to the principal balance of the investment, rather than being paid to the Trust in cash, and is recorded as interest income. Thus, the actual collection of PIK interest may be deferred until the time of debt principal repayment. PIK interest, which is a non-cash source of income at the time of recognition, is included in the Trust’s taxable income and therefore affects the amount the Trust is required to distribute to its stockholders to
46
2021 Annual Report
NOTES TO CONSOLIDATED FINANCIAL STATEMENTS (CONTINUED)
maintain its qualification as a “regulated investment company” for federal income tax purposes, even though the Trust has not yet collected the cash. Generally, when current cash interest and/or principal payments on an investment become past due, or if the Trust otherwise does not expect the borrower to be able to service its debt and other obligations, the Trust will place the investment on PIK non-accrual status and will cease recognizing PIK interest income on that investment for financial reporting purposes until all principal and interest have been brought current through payment or due to a restructuring such that the interest income is deemed to be collectible. The Trust writes off any accrued and uncollected PIK interest when it is determined that the PIK interest is no longer collectible. As of December 31, 2021, the Trust held no PIK non-accrual assets.
Realized Gain or Loss and Unrealized Appreciation or Depreciation of Portfolio Investments
Realized gains and losses on investment transactions and unrealized appreciation and depreciation of investments are reported for financial statement and Federal income tax purposes on the identified cost method.
C. Use of Estimates:
The preparation of financial statements in conformity with U.S. GAAP requires management to make estimates and assumptions that affect the reported amounts of assets and liabilities and disclosure of contingent assets and liabilities at the date of the financial statements and the reported amounts of revenues and expenses during the reporting period. Actual results could differ from those estimates and the differences could be material.
D. Federal Income Taxes:
The Trust has elected to be taxed as a “regulated investment company” under the Internal Revenue Code, and intends to maintain this qualification and to distribute substantially all of its net taxable income to its shareholders. In any year when net long-term capital gains are realized by the Trust, management, after evaluating the prevailing economic conditions, will recommend that the Trustees either designate the net realized long-term gains as undistributed and pay the Federal capital gains taxes thereon or distribute all or a portion of such net gains. In 2021, the Trust incurred $1,750,000 of tax as a result of retained capital gains.
The Trust is taxed as a regulated investment company and is therefore limited as to the amount of non-qualified income that it may receive as the result of operating a trade or business, e.g. the Trust’s pro rata share of income allocable to the Trust by a partnership operating company. The Trust’s violation of this limitation could result in the loss of its status as a
regulated investment company, thereby subjecting all of its net income and capital gains to corporate taxes prior to distribution to its shareholders. The Trust, from time-to-time, identifies investment opportunities in the securities of entities that could cause such trade or business income to be allocable to the Trust. The CI Subsidiary Trust (described in Footnote 1 above) was formed in order to allow investment in such securities without adversely affecting the Trust’s status as a regulated investment company.
Net investment income and net realized gains or losses of the Trust as presented under U.S. GAAP may differ from distributable taxable earnings due to earnings from the CI Subsidiary Trust as well as certain permanent and temporary differences in the recognition of income and realized gains or losses on certain investments. In accordance with U.S. GAAP, the Trust has made reclassifications among its capital accounts. These reclassifications are intended to adjust the components of net assets to reflect the tax character of permanent book/tax differences and have no impact on the net assets or net asset value of the Trust. As of December 31, 2021, the Trust made reclassifications to increase or (decrease) the components of net assets detailed below:
Paid-In
Capital | | Total Distributable
Earnings | | Retained
Capital Gains |
| 6,172,118 | | 1,319,670 | | (7,491,788) |
The Trusts’ current income tax expense as shown on the Statement of Operations included excise tax expense of $585,248 and income tax expense related to realized gains on investments of 2,130,306. The 2,130,306 of income tax expense on realized gains on investments included income tax expense related to the CI Subsidiary Trust as described in the table below of $378,902 and $1,404 of 2020 tax return payments.
The CI Subsidiary Trust is not taxed as a regulated investment company. Accordingly, prior to the Trust receiving any distributions from the CI Subsidiary Trust, all of the CI Subsidiary Trust’s taxable income and realized gains, including non-qualified income and realized gains, is subject to taxation at prevailing corporate tax rates. The CI Subsidiary Trust had $1,942,168 of taxable income as of December 31, 2021.
On March 27, 2020 President Trump signed into law H.R. 748, the CARES Act. Included in the CARES Act is a provision allowing for a five year carryback of net operating losses generated in tax years beginning after December 31, 2017 and beginning before January 1, 2021. As a result of the application of the CARES Act, the CI Subsidiary Trust carried back $368,258 of net operating losses generated in tax year 2020 resulting in a $125,208 refund from taxes paid in tax year 2015.
47
Barings Corporate Investors
NOTES TO CONSOLIDATED FINANCIAL STATEMENTS (CONTINUED)
The components of income taxes included in the CI Subsidiary Trust were as follows:
Income tax expense (benefit)
| Current: | | | | |
| Federal | | $ | 257,061 | |
| State | | | 121,842 | |
| Total current | | $ | 378,902 | |
| Deferred: | | | | |
| Federal | | $ | 277,173 | |
| State | | | 129,430 | |
| Total deferred | | | 406,603 | |
Total income tax expense from continuing operations | | $ | 785,505 | |
Deferred tax assets and liabilities are recognized for the future tax consequences attributable to differences between the financial statement carrying amounts of the existing assets and liabilities and their respective tax basis. As of December 31, 2021, the CI Subsidiary Trust had $406,603 of net deferred tax liability.
The tax effects of temporary differences that give rise to significant portions of the deferred tax assets and liabilities as of December 31, 2021 were as follows:
Deferred tax assets/(liabilities):
| Net operating loss carryover | | $ | 139,456 | |
| General business credit carryforward | | | 538 | |
| Total deferred tax assets | | | 139,994 | |
| Less valuation allowance | | | — | |
| Net deferred tax asset | | | 139,994 | |
| Unrealized gain on investments | | | (546,597 | ) |
| Total deferred tax liabilities | | | (546,597 | ) |
| Net deferred tax liability | | $ | (406,603 | ) |
The CI Subsidiary Trust has valuation allowances of $0 and $290,276 as of December 31, 2021 and 2020, respectively. The 2020 valuation allowance was released during 2021 as management believes it is more likely than not that the deferred taxes will be realized.
The Trust recognizes a tax benefit from an uncertain position only if it is more likely than not that the position is sustainable, based solely on its technical merits and consideration of the relevant taxing authority’s widely understood administrative practices and precedents. If this threshold is met, the Trust measures the tax benefit as the largest amount of benefit that is greater than fifty percent likely of being realized upon ultimate settlement. Tax positions not
deemed to meet the “more-likely-than-not” threshold are reserved and recorded as a tax benefit or expense in the current year. All penalties and interest associated with income taxes are included in income tax expense. The Trust has evaluated and determined that the tax positions did not have a material effect on the Trust’s financial position and results of operations for the year ended December 31, 2021.
A reconciliation of the differences between the Trust’s income tax expense and the amount computed by applying the prevailing U.S. Federal tax rate to pretax income for the year ended December 31, 2021 is as follows:
| | | Amount | | | Percentage | |
Provision for income taxes at the U.S. federal rate | | $ | 747,419 | | | | 21.00% | |
| State tax, net of federal effect | | | 176,093 | | | | 4.95% | |
| Change in valuation allowance | | | (290,276 | ) | | | (8.16)% | |
| True-up | | | 200,143 | | | | 5.62% | |
| Federal tax carryback | | | (47,874 | ) | | | (1.35)% | |
| Income tax expense | | $ | 785,505 | | | | 22.06% | |
Each of the Trust’s and the CI Subsidiary Trust’s Federal tax returns for the prior three fiscal years remains subject to examination by the Internal Revenue Service. The Trust and CI Subsidiary Trust file in various states and generally the prior four years remain subject to examination by each state’s respective taxing authority.
E. Distributions to Shareholders:
The Trust records distributions to shareholders from distributable earnings, if any, on the ex-dividend date. The Trust’s dividend is declared four times per year, in April, July, October, and December. The Trust’s net realized capital gain distribution, if any, is declared in December.
The tax basis components of distributable earnings at December 31, 2021 are as follows:
| Undistributed Ordinary Income | | $ | 13,935,311 | |
| Undistributed Realized Gains | | | 1,798,848 | |
| Net Unrealized Appreciation | | | 10,764,696 | |
| Other Temporary Differences/Subsidiary Trust | | | 12,607,382 | |
The differences between book-basis and tax-basis unrealized appreciation/(depreciation) are primarily due to partnership investments.
48
2021 Annual Report
NOTES TO CONSOLIDATED FINANCIAL STATEMENTS (CONTINUED)
The following information is provided on a tax basis as of December 31, 2021:
| Tax Cost | | $ | 350,828,262 | |
| Tax Unrealized Appreciation | | | 26,134,202 | |
| Tax Unrealized Depreciation | | | (15,369,520 | ) |
| Net Unrealized Appreciation | | | 10,764,682 | |
The tax character of distributions declared during the years ended December 31, 2021 and 2020 was as follows:
| Distributions paid from: | | 2021 | | | 2020 | |
| | | | | | | | | |
| Ordinary Income | | $ | 19,451,250 | | | $ | 19,451,250 | |
| 3. | Investment Services Contract |
A. Services:
Under an Investment Services Contract (the “Contract”) with the Trust, Barings agrees to use its best efforts to present to the Trust a continuing and suitable investment program consistent with the investment objectives and policies of the Trust. Barings represents the Trust in any negotiations with issuers, investment banking firms, securities brokers or dealers and other institutions or investors relating to the Trust’s investments. Under the Contract, Barings also provides administration of the day-to-day operations of the Trust and provides the Trust with office space and office equipment, accounting and bookkeeping services, and necessary executive, clerical and secretarial personnel for the performance of the foregoing services.
B. Fee:
For its services under the Contract, Barings is paid a quarterly investment advisory fee of 0.3125% of the net asset value of the Trust as of the last business day of each fiscal quarter, which is approximately equal to 1.25% annually. A majority of the Trustees, including a majority of the Trustees who are not interested persons of the Trust or of Barings, approve the valuation of the Trust’s net assets as of such day.
Senior Secured Indebtedness
MassMutual holds the Trust’s $30,000,000 Senior Fixed Rate Convertible Note (the “Note”) issued by the Trust on November 15, 2017. The Note is due November 15, 2027 and accrues interest at 3.53% per annum. MassMutual, at its option, can convert the principal amount of the Note into common shares. The dollar amount of principal would be converted into an equivalent dollar amount of common shares based upon the average price of the common shares for ten business days prior to the notice of conversion. For the year ended December 31, 2021, the Trust incurred total interest expense on the Note of $1,059,000.
The Trust may redeem the Note, in whole or in part, at the principal amount proposed to be redeemed together with the accrued and unpaid interest thereon through the redemption date plus a Make Whole Premium. The Make Whole Premium equals the excess of (i) the present value of the scheduled payments of principal and interest which the Trust would have paid but for the proposed redemption, discounted at the rate of interest of U.S. Treasury obligations whose maturity approximates that of the Note plus 0.50% over (ii) the principal of the Note proposed to be redeemed.
Management estimates that the fair value of the Note was $31,830,120 as of December 31, 2021. The fair value measurement of the Note would be categorized as a Level 3 under ASC 820.
Credit Facility
On July 22, 2021 (the “Effective Date”), MassMutual provided to the Trust, a five-year $30,000,000 committed revolving credit facility. Borrowings under the revolving credit facility bear interest, at the rate of LIBOR plus 2.25%. The Trust will also be responsible for paying a commitment fee of 0.50% on the unused amount. For purposes of calculating the commitment fee for the period from the Effective Date to the earlier to occur of (x) the date that is 270 days after the Effective Date and (y) the first date on which the aggregate outstanding borrowings is greater than $15,000,000, the unused amount shall be deemed to be in an amount equal to $15,000,000. As of December 31, 2021, the Trust had $8,000,000 of outstanding borrowings on the revolving credit facility. Management estimates that the fair value of the Credit Facility was $8,000,000 as of December 31, 2021. The fair value measurement of the Credit Facility would be categorized as a Level 3 under ASC 820.
| 5. | Purchases and Sales of Investments |
| | | For the year ended
12/31/2021 | |
| | | Cost of
Investments
Acquired | | | Proceeds
from Sales or
Maturities | |
| Corporate restricted securities | | $ | 151,201,497 | | | $ | 128,897,955 | |
| | | | | | | | | |
| Corporate public securities | | | 5,641,383 | | | | 16,084,869 | |
Investment Risks
In the normal course of its business, the Trust trades various financial instruments and enters into certain
49
Barings Corporate Investors
NOTES TO CONSOLIDATED FINANCIAL STATEMENTS (CONTINUED)
investment activities with investment risks. These risks include: market risk; volatility risk; credit, counterparty and liquidity risk; loan risk; prepayment and extension risk; duration risk; below investment grade (high yield/junk bond) instruments risk; borrowing and leverage risk; and management risk. It is the Trust’s policy to identify, measure and monitor risk through various mechanisms including risk management strategies and credit policies. These include monitoring risk guidelines and diversifying exposures across a variety of instruments, markets and counterparties. There can be no assurance that the Trust will be able to implement its credit guidelines or that its risk monitoring strategies will be successful.
Impacts of COVID-19
The pandemic related to the global spread of novel coronavirus disease (COVID-19), which was first detected in December 2019, has resulted in significant disruptions to global business activity and the global economy, as well as the economies of individual countries, the financial performance of individual companies and sectors, and the securities and commodities markets in general. This pandemic, the full effects of which are still unknown, has resulted in substantial market volatility and may continue to adversely impact the prices and liquidity of the Trust’s investments and the Trust’s performance.
LIBOR
The United Kingdom’s Financial Conduct Authority (“FCA”), which regulates LIBOR, announced a desire to phase out the use of LIBOR by the end of 2021. LIBOR has historically been a common benchmark interest rate index used to make adjustments to variable-rate loans. It is used throughout global banking and financial industries to determine interest rates for a variety of financial instruments and borrowing arrangements. The transition process might lead to increased volatility and illiquidity in markets that currently rely on LIBOR to determine interest rates. It could also lead to a reduction in the value of some LIBOR-based investments held by a fund and reduce the effectiveness of new hedges placed against existing LIBOR-based investments. While some LIBOR-based instruments contemplate a scenario where LIBOR is no longer available by providing for an alternative rate-setting methodology, not all have such provisions and there may be significant uncertainty regarding the effectiveness of any such alternative methodologies.
| 7. | Commitments and Contingencies |
During the normal course of business, the Trust may enter into contracts and agreements that contain a variety of representations and warranties. The exposure, if any, to the Trust under these arrangements is unknown as this would involve future claims that
may or may not be made against the Trust and which have not yet occurred. The Trust has no history of prior claims related to such contracts and agreements.
At December 31, 2021, the Trust had the following unfunded commitments:
Delayed Draw Term Loans:
Investment | | Unfunded
Amount | | | Unfunded
Value | |
| Amtech Software | | $ | 727,273 | | | $ | 726,874 | |
| Best Lawyers | | | 448,718 | | | | 448,586 | |
| Command Alkon | | | 812,200 | | | | 811,888 | |
| Dart Buyer, Inc | | | 570,500 | | | | 532,186 | |
| Dwyer Instruments, Inc. | | | 263,158 | | | | 265,659 | |
| Electric Power Systems International Inc | | | 237,040 | | | | 237,670 | |
| eShipping | | | 594,564 | | | | 594,255 | |
| FragilePAK | | | 1,093,750 | | | | 1,096,684 | |
| Heartland Veterinary Partners | | | 230,000 | | | | 229,696 | |
| IGL Holdings III Corp. | | | 370,763 | | | | 377,088 | |
| Kano Laboratories LLC | | | 1,150,988 | | | | 1,147,694 | |
| National Auto Care | | | 784,314 | | | | 784,198 | |
| Navia Benefit Solutions Inc | | | 1,103,200 | | | | 1,115,677 | |
| Pearl Holding Group | | | 460,526 | | | | 460,333 | |
| Portfolio Group | | | 483,000 | | | | 482,332 | |
| ROI Solutions, LLC | | | 1,242,823 | | | | 1,262,056 | |
| Scaled Agile, Inc | | | 582,664 | | | | 582,408 | |
| SEKO Worldwide, LLC | | | 509,091 | | | | 512,270 | |
| Smartling, Inc. | | | 411,765 | | | | 411,561 | |
| Standard Elevator Systems | | | 1,245,763 | | | | 1,245,360 | |
| Stratus Unlimited | | | 344,212 | | | | 353,349 | |
| Syntax Systems Ltd | | | 386,615 | | | | 386,517 | |
| Tencarva Machinery Company | | | 485,968 | | | | 485,921 | |
| The Caprock Group | | | 731,294 | | | | 731,227 | |
| Transit Technologies LLC | | | 499,578 | | | | 493,033 | |
| Truck-Lite Co., LLC | | | 583,165 | | | | 582,925 | |
| | | $ | 16,352,932 | | | $ | 16,357,446 |
|
50
2021 Annual Report
NOTES TO CONSOLIDATED FINANCIAL STATEMENTS (CONTINUED)
Revolvers:
| Investment | | Unfunded
Amount | | | Unfunded
Value | |
| Amtech Software | | $ | 181,818 | | | $ | 181,719 | |
| Best Lawyers | | | 224,359 | | | | 224,293 | |
| BrightSign | | | 279,241 | | | | 279,147 | |
| CAi Software | | | 471,493 | | | | 471,423 | |
| Cash Flow Management | | | 149,254 | | | | 149,248 | |
| Decks Direct | | | 763,636 | | | | 763,611 | |
| EFI Productivity Software | | | 146,023 | | | | 146,023 | |
| eShipping | | | 287,373 | | | | 287,192 | |
| Narda-MITEQ | | | 424,977 | | | | 424,917 | |
| National Auto Care | | | 196,078 | | | | 196,049 | |
| Office Ally | | | 266,249 | | | | 266,224 | |
| Polara | | | 218,094 | | | | 218,036 | |
| Scaled Agile, Inc | | | 470,149 | | | | 470,081 | |
| Smartling, Inc. | | | 205,882 | | | | 205,780 | |
| Standard Elevator Systems | | | 296,610 | | | | 296,529 | |
| Syntax Systems Ltd | | | 113,793 | | | | 113,721 | |
| Tencarva Machinery Company | | | 619,093 | | | | 619,034 | |
| The Caprock Group | | | 215,035 | | | | 215,017 | |
| Woodland Foods, Inc. | | | 377,534 | | | | 377,418 | |
| | | $ | 5,906,692 | | | $ | 5,905,462 | |
Total Unfunded Commitments | | $ | 22,259,624 | | | $ | 22,262,907 | |
As of December 31, 2021 unfunded commitments had unrealized appreciation of $3,234 or 0.00% of net assets.
| 8. | Aggregate Remuneration Paid to Officers, Trustees and Their Affiliated Persons |
For the year ended December 31, 2021, the Trust paid its Trustees aggregate remuneration of $408,701, including compensation to Mr. Joyal (who retired as a Trustee effective April 23, 2021). During the year, the Trust did not pay any compensation to Mr. Noreen or to Mr. Lloyd (who was elected a Trustee effective April 23, 2021). Each of Messrs. Joyal, Noreen and Lloyd is an “interested person” (as defined by the 1940 Act) of the Trust.
All of the Trust’s officers are employees of Barings or MassMutual. Pursuant to the Contract, the Trust does
not compensate its officers who are employees of Barings or MassMutual (except for the Chief Compliance Officer of the Trust unless assumed by Barings). For the year ended December 31, 2021, Barings paid the compensation of the Chief Compliance Officer of the Trust.
Mr. Noreen is an “affiliated person” (as defined by the 1940 Act) of MassMutual and Barings. Mr. Lloyd is an “affiliated person” (as defined by the 1940 Act) of Barings.
| 9. | Certifications (Unaudited) |
As required under New York Stock Exchange (“NYSE”) Corporate Governance Rules, the Trust’s principal executive officer has certified to the NYSE that she was not aware, as of the certification date, of any violation by the Trust of the NYSE’s Corporate Governance listing standards. In addition, as required by Section 302 of the Sarbanes-Oxley Act of 2002 and related SEC rules, the Trust’s principal executive and principal financial officers have made quarterly certifications, included in filings with the SEC on Forms N-CSR and N-PORT, relating to, among other things, the Trust’s disclosure controls and procedures and internal control over financial reporting, as applicable.
| 10. | Quarterly Results of Investment Operations (Unaudited) |
| | | March 31, 2021 | |
| | | Amount | | | Per Share | |
| Investment income | | $ | 5,795,551 | | | | | |
| Net investment income | | | 4,301,183 | | | $ | 0.21 | |
Net realized and unrealized gain on investments (net of taxes) | | | 8,819,638 | | | | 0.44 | |
| | | June 30, 2021 | |
| | | Amount | | | Per Share | |
| Investment income | | $ | 5,864,164 | | | | | |
| Net investment income | | | 4,347,464 | | | $ | 0.21 | |
Net realized and unrealized loss on investments (net of taxes) | | | 8,585,199 | | | | 0.42 | |
| | | September 30, 2021 | |
| | | Amount | | | Per Share | |
| Investment income | | $ | 5,764,922 | | | | | |
| Net investment income | | | 4,179,137 | | | $ | 0.21 | |
Net realized and unrealized gain on investments (net of taxes) | | | 16,670,189 | | | | 0.82 | |
51
Barings Corporate Investors
NOTES TO CONSOLIDATED FINANCIAL STATEMENTS (CONTINUED)
| | | December 31, 2021 | |
| | | Amount | | | Per Share | |
| Investment income | | $ | 8,333,346 | | | | | |
Net investment income (net of taxes) | | | 6,054,093 | | | $ | 0.30 | |
Net realized and unrealized loss on investments (net of taxes) | | | (148,873 | ) | | | (0.01 | ) |
The Trust has evaluated the possibility of subsequent events after the balance sheet date of December 31, 2021, through the date that the financial statements are issued. The Trust has determined that there are no material events that would require recognition or disclosure in this report through this date.
52
2021 Annual Report

REPORT OF INDEPENDENT REGISTERED PUBLIC ACCOUNTING FIRM
To the Shareholders and Board of Trustees of Barings Corporate Investors:
Opinion on the Financial Statements
We have audited the accompanying consolidated statement of assets and liabilities of Barings Corporate Investors and subsidiary (collectively, the ”Trust”), including the consolidated schedule of investments, as of December 31, 2021, the related consolidated statements of operations and cash flows for the year then ended, the consolidated statements of changes in net assets for each of the years in the two-year period then ended, and the related notes (collectively, the “consolidated financial statements”) and the consolidated selected financial highlights (the “consolidated financial highlights”) for each of the years in the five-year period then ended. In our opinion, the consolidated financial statements and consolidated financial highlights present fairly, in all material respects, the financial position of the Trust as of December 31, 2021, the results of its operations and its cash flows for the year then ended, the changes in its net assets for each of the years in the two-year period then ended, and the financial highlights for each of the years in the five-year period then ended, in conformity with U.S. generally accepted accounting principles.
Basis for Opinion
These consolidated financial statements and consolidated financial highlights are the responsibility of the Trust’s management. Our responsibility is to express an opinion on these consolidated financial statements and consolidated financial highlights based on our audits. We are a public accounting firm registered with the Public Company Accounting Oversight Board (United States) (PCAOB) and are required to be independent with respect to the Trust in accordance with the U.S. federal securities laws and the applicable rules and regulations of the Securities and Exchange Commission and the PCAOB.
We conducted our audits in accordance with the standards of the PCAOB. Those standards require that we plan and perform the audit to obtain reasonable assurance about whether the consolidated financial statements and consolidated financial highlights are free of material misstatement, whether due to error or fraud. Our audits included performing procedures to assess the risks of material misstatement of the consolidated financial statements and consolidated financial highlights, whether due to error or fraud, and performing procedures that respond to those risks. Such procedures included examining, on a test basis, evidence regarding the amounts and disclosures in the consolidated financial statements and consolidated financial highlights. Such procedures also included confirmation of securities owned as of December 31, 2021, by correspondence with custodians and agent banks, or by other appropriate auditing procedures when replies from agent banks were not received. Our audits also included evaluating the accounting principles used and significant estimates made by management, as well as evaluating the overall presentation of the consolidated financial statements and consolidated financial highlights. We believe that our audits provide a reasonable basis for our opinion.

We have served as the auditor of the Trust since 2004.
New York, New York
March 1, 2022
53
Barings Corporate Investors
INTERESTED TRUSTEES
| | | | | | |
| Name (Age), Address | Position(s) With
The Trust(s) | Office Term and Length
of Time Served | Principal Occupations
During Past 5 Years | Portfolios Overseen
in Fund Complex | Other Directorships
Held by Director |
| | | | | | |
| | | | | | |
Clifford M. Noreen* (64) 300 South Tryon Street Suite 2500 Charlotte, NC 28202 | Trustee, Chairman | Term expires 2024; Trustee since 2009 | Head of Global Investment Strategy (since 2019), Deputy Chief Investment Officer and Managing Director (2016-2018), MassMutual; President (2008-2016), Vice Chairman (2007-2008), Member of the Board of Managers (2006-2016), Managing Director (2000-2016), Barings; President (2005-2009), Vice President (1993-2005) of the Trusts. | 111 | Chairman and Trustee (since 2009), President (2005-2009), Vice President (1993-2005), Barings Participation Investors; Chairman (since 2009), Trustee (since 2005), President (2005-2009), CI Subsidiary Trust and PI Subsidiary Trust; Trustee (since 2021), MassMutual Select Funds (open-end investment company advised by MassMutual); Trustee (since 2021), MML Series Investment Funds (open-end investment company advised by MassMutual); Trustee (since 2021) MML Series Investment Funds II (open-end investment company advised by MassMutual); Trustee (since 2021), MassMutual Premier Funds (open-end investment company advised by MassMutual); Member of the Board of Managers (since 2008), Jefferies Finance LLC (finance company); Member of the Investment Committee (since 2005), Baystate Health Systems; Member of the Investment Committee (since 1999), Diocese of Springfield; Member of the Board of Managers (2011-2016), Wood Creek Capital Management, LLC (investment advisory firm); President (2009-2015), Senior Vice President (1996-2009), HYP Management LLC (LLC Manager); Director (2005-2013), MassMutual Corporate Value Limited (investment company); and Director (2005-2013), MassMutual Corporate Value Partners Limited (investment company). |
| | | | | | |
| * | Mr. Noreen is classified as an “interested person” of the Trust and Barings (as defined by the 1940 Act), because of his position as an Officer of the Trust and his former position as President of Barings. |
54
2021 Annual Report
INTERESTED TRUSTEES
| | | | | | |
| Name (Age), Address | Position(s) With
The Trust(s) | Office Term and Length
of Time Served | Principal Occupations
During Past 5 Years | Portfolios Overseen
in Fund Complex | Other Directorships
Held by Director |
| | | | | | |
| | | | | | |
Eric J. Lloyd* (53) 300 South Tryon Street Suite 2500 Charlotte, NC 28202 | Trustee | Term expires 2022; Trustee since 2021 | President (since 2021), Global Head of Private Assets (2013-2021), Barings. | 5 | Trustee (since 2021), Barings Participation Investors; Chief Executive Officer and Director (since 2018), Barings BDC, Inc. (business development company advised by Barings); Director (since 2020), Barings Capital Investment Corporation (business development company advised by Barings); and Director (since 2021), Barings Private Credit Corporation (business development company advised by Barings). |
| | | | | | |
| * | Mr. Lloyd is classified as an “interested person” of the Trust and Barings (as defined by the 1940 Act), because of his current position at Barings. |
55
Barings Corporate Investors
INDEPENDENT TRUSTEES
| Name (Age), Address | Position(s) With
The Trust(s) | Office Term and Length
of Time Served | Principal Occupations
During Past 5 Years | Portfolios Overseen
in Fund Complex | Other Directorships
Held by Director |
| | | | | | |
| | | | | | |
Michael H. Brown (64) 300 South Tryon Street Suite 2500 Charlotte, NC 28202 | Trustee | Term expires 2023; Trustee since 2005 | Private Investor (since 2005); Managing Director (1994-2005), Morgan Stanley. | 2 | Trustee (since 2005), Barings Participation Investors; Independent Director (2006-2014), Invicta Holdings LLC and its subsidiaries (derivative trading company owned indirectly by MassMutual). |
| | | | | |
Barbara M. Ginader (65) 300 South Tryon Street Suite 2500 Charlotte, NC 28202 | Trustee | Term expires 2023; Trustee since 2013 | Retired (since 2018); General Partner (1993-2018), Boston Ventures Management (private equity firm). | 2 | Trustee (since 2013), Barings Participation Investors; Member of the Board of Overseers (2013-2014), MSPCA-Angell Memorial Hospital; Member of the Grants Committee (2012-2017), IECA Foundation; Managing Director (1993-2018), Boston Ventures IV, L.P., Boston Ventures V, L.P. and Boston Ventures VI, L.P. (private equity funds). |
| | | | | |
Edward P. Grace III (71) 300 South Tryon Street Suite 2500 Charlotte, NC 28202 | Trustee | Term expires 2024; Trustee since 2012 | President (since 1997), Phelps Grace International, Inc. (investment management); Managing Director (1998-2018), Grace Venture Partners LP (venture capital fund); Senior Advisor (2011-2017), Angelo Gordon & Co. (investment adviser). | 2 | Trustee (since 2012), Barings Participation Investors; Director (since 2012), Benihana, Inc. (restaurant chain); Director (2011-2018), Firebirds Wood Fired Holding Corporation (restaurant chain); Director (2010-2017), Larkburger, Inc. (restaurant chain); Director (since 1998), Shawmut Design and Construction (construction management and general contracting firm). |
| | | | | |
Susan B. Sweeney (69) 300 South Tryon Street Suite 2500 Charlotte, NC 28202 | Trustee/ Nominee | Term expires 2022; Trustee since 2012 | Retired (since 2014); Senior Vice President and Chief Investment Officer (2010-2014), Selective Insurance Company of America; Senior Managing Director (2008-2010), Ironwood Capital. | 111 | Trustee (since 2012), Barings Participation Investors; Trustee (since 2009), MassMutual Select Funds (open-end investment company advised by MassMutual); Trustee (since 2009), MML Series Investment Funds (open-end investment company advised by MassMutual); Trustee (since 2012) MML Series Investment Funds II (open-end investment company advised by MassMutual); Trustee (since 2012), MassMutual Premier Funds (open-end investment company advised by MassMutual). |
| | | | | | |
| | | | | | |
56
2021 Annual Report
INDEPENDENT TRUSTEES
| Name (Age), Address | Position(s) With
The Trust(s) | Office Term and Length
of Time Served | Principal Occupations
During Past 5 Years | Portfolios Overseen
in Fund Complex | Other Directorships
Held by Director |
| | | | | | |
| | | | | | |
Maleyne M. Syracuse (65) 300 South Tryon Street Suite 2500 Charlotte, NC 28202 | Trustee | Term expires 2023; Trustee since 2007 | Private Investor (since 2007); Managing Director (2000-2007), JP Morgan Securities, Inc. (investment banking); Managing Director (1999-2000), Deutsche Bank Securities (investment banking); Managing Director (1981-1999), Bankers Trust/BT Securities (investment banking). | 2 | Trustee (since 2007), Barings Participation Investors; Member of the Board of Directors (since 1998) and President of the Board (since 2002), Peters Valley School of Craft (non-profit arts organization); Member of the Board of Directors (since 2014) and Treasurer (since 2017), Charles Lawrence Keith & Clara Miller Foundation (non-profit philanthropic foundation); Member of the Board of Directors (since 2015) and Treasurer of the Board (since 2016), Greater Pike Community Foundation (non-profit philanthropic foundation); Member of the Board of Directors and Treasurer (since 2021) Textile Society of America (nonprofit arts organization). |
| | | | | | |
57
Barings Corporate Investors
OFFICERS
| Name (Age), Address | Position(s) With
The Trust(s) | Time Served | Principal Occupation(s)
During the Past 5 Years |
| | | | |
| | | | |
Christina Emery (48) 300 South Tryon Street Suite 2500 Charlotte, NC 28202 | President | Since 2020 | Managing Director (since 2011), Director (2005-2011), Barings; President (since 2020), Vice President (2018-2020), Barings Participation Investors; Trustee (since 2020), President (since 2020), CI Subsidiary Trust and PI Subsidiary Trust; Member of the Investment Committee (since 2018), Tower Square Capital Partners II/III/IV; and Member of the Investment Committee and Principal (since 2020), Barings Small Business Fund. |
| | | |
Jonathan Bock (40) 300 South Tryon Street Suite 2500 Charlotte, NC 28202 | Chief Financial Officer | Since 2020 | Managing Director (since 2018), Barings; Chief Financial Officer (since 2020) Barings Participation Investors, Trustee (since 2020), Treasurer (since 2020), CI Subsidiary Trust and PI Subsidiary Trust; Chief Financial Officer (since 2018), Barings BDC, Inc. (business development company advised by Barings); Chief Financial Officer (since 2020), Barings Capital Investment Corporation (business development company advised by Barings); President & Co-Chief Executive Officer (since 2021), Barings Private Credit Corporation (business development company advised by Barings); and Managing Director (2011-2018), Wells Fargo. |
| | | |
Jill Dinerman (45) 300 South Tryon Street Suite 2500 Charlotte, NC 28202 | Chief Legal Officer | Since 2020 | Global Head of Legal and General Counsel (since 2020), Managing Director (since 2016), Associate General Counsel and Corporate Secretary (2018-2020), Senior Counsel (2016-2018), Counsel and Director (2011-2016), Barings; Chief Legal Officer (since 2020), Assistant Secretary (2019-2020), Barings Participation Investors; Vice President (since 2020), CI Subsidiary Trust and PI Subsidiary Trust; Vice President and Chief Legal Officer (since 2020), Secretary (2020-2021), Assistant Secretary (2019-2020), Barings Global Short Duration High Yield Fund (closed-end investment company advised by Barings); Chief Legal Officer (since 2020), Assistant Secretary (2019-2020), Barings BDC, Inc. (business development company advised by Barings); Chief Legal Officer (since 2020), Barings Capital Investment Corporation (business development company advised by Barings); Chief Legal Officer (since 2021), Barings Private Credit Corporation (business development company advised by Barings); Secretary (since 2018), Barings Securities LLC; Chief Legal Officer (since 2020), Barings BDC Finance I LLC; Chief Legal Officer (since 2020), Barings BDC Senior Fund I LLC; Non-Executive Director (since 2018), Baring International Investments Limited; Non-Executive Director (since 2021), Baring Asset Management Limited); Non-Executive Director (since 2021), Baring Investment Services Limited; Non-Executive Director (since 2021), Barings (U.K.) Limited; Non-Executive Director (since 2021), Barings Europe Limited; and Vice President, Secretary and Chief Legal Officer (2020-2021), Assistant Secretary (2019-2020), Barings Funds Trust (open-end Investment company advised by Barings). |
| | | | |
58
2021 Annual Report
OFFICERS
Name (Age), Address | Position(s) With
The Trust(s) | Time Served | Principal Occupation(s)
During the Past 5 Years |
| | | | |
| | | | |
Michael Cowart (39) 300 South Tryon Street Suite 2500 Charlotte, NC 28202 | Chief Compliance Officer | Since 2020 | Managing Director (since 2021), Director (2018-2021), Barings; Chief Compliance Officer (since 2020), Barings Participation Investors; Chief Compliance Officer (since 2020), Barings Global Short Duration High Yield Fund (closed-end investment company advised by Barings); Chief Compliance Officer (since 2020), Barings BDC, Inc. (business development company advised by Barings); Chief Compliance Officer (since 2020), Barings Capital Investment Corporation (business development company advised by Barings); Chief Compliance Officer (since 2021), Barings Private Credit Corporation (business development company advised by Barings); Chief Compliance Officer (since 2019), Barings Securities LLC; Chief Compliance Officer (2020-2021), Barings Funds Trust (open-end investment company advised by Barings); and Assistant General Counsel (2016-2018), LPL Financial (independent broker-dealer). |
| | | |
Elizabeth Murray (44) 300 South Tryon Street Suite 2500 Charlotte, NC 28202 | Principal Accounting Officer | Since 2020 | Managing Director (since 2020), Director (2018-2020), Barings; Principal Accounting Officer (since 2020), Barings Participation Investors; Controller (since 2020), CI Subsidiary Trust and PI Subsidiary Trust; Treasurer (since 2020), Barings Global Short Duration High Yield Fund (closed-end investment company advised by Barings); Principal Accounting Officer (since 2020), Director of External Reporting (2018-2020), Barings BDC, Inc. (business development company advised by Barings); Principal Accounting Officer (since 2020), Barings Capital Investment Corporation (business development company advised by Barings); Principal Accounting Officer (since 2021), Barings Private Credit Corporation (business development company advised by Barings); Treasurer (2020-2021), Barings Funds Trust (open-end investment company advised by Barings); and Vice President of Financial Reporting (2012-2018), Barings BDC, Inc. (f/k/a Triangle Capital Corporation). |
| | | |
Christopher Hanscom (39) 300 South Tryon Street Suite 2500 Charlotte, NC 28202 | Treasurer | Since 2017 | Director (since 2018), Associate Director (2015-2018), Analyst (2005-2015), Barings; Treasurer (since 2017), Barings Participation Investors; Assistant Controller (since 2020), CI Subsidiary Trust and PI Subsidiary Trust; and Treasurer (since 2021), Barings Global Short Duration High Yield Fund (closed-end investment company advised by Barings). |
| | | |
Ashlee Steinnerd (40) 300 South Tryon Street Suite 2500 Charlotte, NC 28202 | Secretary | Since 2020 | Head of Regulatory and Registered Funds (since 2021), Director (since 2019), Barings; Secretary (since 2020) Barings Participation Investors; Secretary (since 2020), CI Subsidiary Trust and PI Subsidiary Trust; Secretary (since 2020), Barings BDC, Inc. (business development company advised by Barings); Secretary (since 2020), Barings Capital Investment Corporation (business development company advised by Barings); Secretary (since 2021), Barings Private Credit Corporation (business development company advised by Barings); Secretary (since 2021), Barings Global Short Duration High Yield Fund (closed-end investment company advised by Barings); and Senior Counsel (2011-2019), Securities and Exchange Commission. |
59
Barings Corporate Investors
OFFICERS
| Name (Age), Address | Position(s) With
The Trust(s) | Time Served | Principal Occupation(s)
During the Past 5 Years |
| | | | |
| | | | |
Alexandra Pacini (29) 300 South Tryon Street Suite 2500 Charlotte, NC 28202 | Assistant Secretary | Since 2020 | Associate Director (since 2021), Analyst (2017-2021), Barings; Assistant Secretary (since 2020), Barings Participation Investors; Assistant Secretary (since 2020), CI Subsidiary Trust and PI Subsidiary Trust; Assistant Secretary (since 2020), Barings Global Short Duration High Yield Fund (closed-end investment company advised by Barings); Assistant Secretary (since 2020), Barings BDC, Inc. (business development company advised by Barings); Assistant Secretary (since 2021), Barings Capital Investment Corporation (business development company advised by Barings); Assistant Secretary (since 2021), Barings Private Credit Corporation (business development company advised by Barings); and Assistant Secretary (2020-2021), Barings Funds Trust (open-end investment company advised by Barings). |
| | | |
Sean Feeley (54) 300 South Tryon Street Suite 2500 Charlotte, NC 28202 | Vice President | Since 2011 | Managing Director (since 2003), Barings; Vice President (since 2011), Barings Participation Investors; Vice President (since 2011), CI Subsidiary Trust and PI Subsidiary Trust; President (since 2017), Vice President (2012-2017), Barings Global Short Duration High Yield Fund (closed-end investment company advised by Barings). |
| | | |
Jonathan Landsberg (37) 300 South Tryon Street Suite 2500 Charlotte, NC 28202 | Vice President | Since 2020 | Director (since 2018), Barings; Vice President (since 2020), Barings Participation Investors; Vice President (since 2020), CI Subsidiary Trust and PI Subsidiary Trust; Treasurer (since 2021), Head of Investor Relations (since 2020), Director of Finance (2020-2021), Assistant Director of Finance (2018-2020), Barings BDC, Inc. (business development company advised by Barings); Treasurer (since 2021), Head of Investor Relations (since 2020), Director of Finance (2020-2021), Barings Capital Investment Corporation (business development company advised by Barings); Treasurer and Chief Financial Officer (since 2021), Barings Private Credit Corporation (business development company advised by Barings); Principal (since 2019), Jocassee Partners LLC; Board Member (since 2020), Thompson Rivers LLC; Board Member (since 2021), Banff Partners LP; Board Member (since 2021), Waccamaw River LLC; and Research Analyst (2014-2018), Wells Fargo Securities. |
| | | | |
| * | Officers hold their position with the Trusts until a successor has been duly elected and qualified. Officers are generally elected annually by the Board of each Trust. The officers were last elected on October 27, 2021. |
60
Barings Corporate Investors
DIVIDEND REINVESTMENT AND SHARE PURCHASE PLAN
Barings Corporate Investors (the “Trust”) offers a Dividend Reinvestment and Share Purchase Plan (the “Plan”). The Plan provides a simple way for shareholders to add to their holdings in the Trust through the receipt of dividend shares issued by the Trust or through the investment of cash dividends in Trust shares purchased in the open market. A shareholder may join the Plan by filling out and mailing an authorization card to DST Systems, Inc., the Transfer Agent.
Participating shareholders will continue to participate until they notify the Transfer Agent, in writing, of their desire to terminate participation. Unless a shareholder elects to participate in the Plan, he or she will, in effect, have elected to receive dividends and distributions in cash. Participating shareholders may also make additional contributions to the Plan from their own funds. Such contributions may be made by personal check or other means in an amount not less than $10 nor more than $5,000 per quarter. Cash contributions must be received by the Transfer Agent at least five days (but no more then 30 days) before the payment date of a dividend or distribution.
Whenever the Trust declares a dividend payable in cash or shares, the Transfer Agent, acting on behalf of each participating shareholder, will take the dividend in shares only if the net asset value is lower than the market price plus an estimated brokerage commission as of the close of business on the valuation day. The valuation day is the last day preceding the day of dividend payment.
When the dividend is to be taken in shares, the number of shares to be received is determined by dividing the cash dividend by the net asset value as of the close of business on the valuation date or, if greater than net asset value, 95% of the closing share price. If the net asset value of the shares is higher than the market value plus an estimated commission, the Transfer Agent, consistent with obtaining the best price and execution, will buy shares on the open market at current prices promptly after the dividend payment date.
The reinvestment of dividends does not, in any way, relieve participating shareholders of any federal, state or local tax. For federal income tax purposes, the amount reportable in respect of a dividend received in newly-issued shares of the Trust will be the fair market value of the shares received, which will be reportable as ordinary income and/or capital gains.
As compensation for its services, the Transfer Agent receives a fee of 5% of any dividend and cash contribution (in no event in excess of $2.50 per distribution per shareholder.)
Any questions regarding the Plan should be addressed to DST Systems, Inc., Agent for Barings Corporate Investors’ Dividend Reinvestment and Share Purchase Plan, P.O. Box 219086, Kansas City, MO 64121-9086.
| | | |
| Members of the Board of Trustees |
Michael H. Brown* Private Investor | Barbara M. Ginader* Retired Managing Director and General Partner Boston Ventures Management | Edward P. Grace* President Phelps Grace International, Inc |
Eric J. Lloyd President, Barings | Clifford M. Noreen Head of Global Investment Strategy Massachusetts Mutual Life Insurance Company | Susan B. Sweeney* Private Investor |
Maleyne M. Syracuse* Private Investor | | |
| |
| Officers |
Clifford M. Noreen Chairman | Christina Emery President | Jonathan Bock Chief Financial Officer |
Jill Dinerman Chief Legal Officer | Michael Cowart Chief Compliance Officer | Elizabeth Murray Principal Accounting Officer |
Christopher Hanscom Treasurer | Ashlee Steinnerd Secretary | Alexandra Pacini Assistant Secretary |
Sean Feeley Vice President | Jonathan Landsberg Vice President | |
* Member of the Audit Committee
| | | |
| | | |
| | Barings CORPORATE INVESTORS 2021 Annual Report | |
| | | |
| |
CI6369
| |
ITEM 2. CODE OF ETHICS.
The Registrant adopted a Code of Ethics for Senior Financials Officers (the "Code") on October 17, 2003, which is available on the Registrant's website at www.barings.com/mci. During the period covered by this Form N-CSR, there were no amendments to, or waivers from, the Code.
ITEM 3. AUDIT COMMITTEE FINANCIAL EXPERT.
The Registrant's Board of Trustees has determined that Ms. Barbara M. Ginader, a Trustee of the Registrant and a member of its Audit Committee, is an audit committee financial expert. Ms. Ginader is "independent" for purposes of this Item 3 as required by applicable regulation.
ITEM 4. PRINCIPAL ACCOUNTANT FEES AND SERVICES.
The Registrant has engaged its principal accountant, KPMG LLP, to perform audit services, audit-related services, tax services and other services during the past two fiscal years. The following table details the aggregate fees billed or expected to be billed for each of the last two fiscal years by KPMG LLP.
Fees Billed to the Registrant:
| | | KPMG LLP Year Ended December 31, 2021 | | | KPMG LLP Year Ended December 31, 2020 | |
| Audit Fees | | $ | 150,000 | | | $ | 144,722 | |
| Audit-Related Fees | | | 0 | | | | 0 | |
| Tax Fees | | | 61,000 | | | | 51,665 | |
| All Other Fees | | | 0 | | | | 0 | |
| Total Fees | | $ | 211,000 | | | $ | 196,387 | |
Non-Audit Fees Billed to Barings and MassMutual:
| | | KPMG LLP Year Ended December 31, 2021 | | | KPMG LLP Year Ended December 31, 2020 | |
| Audit-Related Fees | | $ | 2,051,000 | | | $ | 2,701,000 | |
| Tax Fees | | | 13,440,000 | | | | 7,354,000 | |
| All Other Fees | | | 213,000 | | | | 84,000 | |
| Total Fees | | $ | 15,704,000 | | | $ | 10,139,000 | |
The category "Audit Fees" refers to performing an audit of the Registrant's annual financial statements or services that are normally provided by the principal accountant in connection with statutory and regulatory filings or engagements for those fiscal years. The category "Audit-Related Fees" reflects fees billed by KPMG LLP for various non-audit and non-tax services rendered to the Registrant, Barings and MassMutual, such as a SOC - 1 review, consulting and agreed upon procedures reports. Preparation of Federal, state and local income tax and tax compliance work are representative of the fees reported in the "Tax Fees" category. The category "All Other Fees" represents fees billed by KPMG LLP for consulting rendered to the Registrant, Barings and MassMutual.
The Sarbanes-Oxley Act of 2002 and its implementing regulations allow the Registrant's Audit Committee to establish a pre-approval policy for certain services rendered by the Registrant's principal accountant. During 2021, the Registrant's Audit Committee approved all of the services rendered to the Registrant by KPMG LLP and did not rely on such a pre-approval policy for any such services.
The Audit Committee has also reviewed the aggregate fees billed for professional services rendered by KPMG LLP for 2020 and 2021 for the Registrant and for the non-audit services provided to Barings, and Barings' parent, MassMutual. As part of this review, the Audit Committee considered whether the provision of such non-audit services was compatible with maintaining the principal accountant's independence.
The 2020 fees billed represent final 2020 amounts, which may differ from the preliminary figures available as of the filing date of the Registrant's 2021 Annual Form N-CSR and includes, among other things, fees for services that may not have been billed as of the filing date of the Registrant's 2021 Annual Form N-CSR, but are now properly included in the 2021 fees billed to the Registrant, Barings and MassMutual.
ITEM 5. AUDIT COMMITTEE OF LISTED REGISTRANTS.
The Registrant maintains an Audit Committee composed exclusively of Trustees of the Registrant who qualify as "independent" Trustees under the current listing standards of the New York Stock Exchange and the rules of the U.S. Securities and Exchange Commission. The Audit Committee operates pursuant to a written Audit Committee Charter, which is available (1) on the Registrant's website, www.barings.com/mci; and (2) without charge, upon request, by calling, toll-free 866-399-1516. The current members of the Audit Committee are Michael H. Brown, Barbara M. Ginader, Edward P. Grace, III, Susan B. Sweeney and Maleyne M. Syracuse.
ITEM 6. SCHEDULE OF INVESTMENTS
A schedule of investments for the Registrant is included as part of this report to shareholders under Item 1 of this Form N-CSR.
ITEM 7. DISCLOSURE OF PROXY VOTING POLICIES AND PROCEDURES FOR CLOSED-END MANAGEMENT INVESTMENT COMPANIES.
Summary of Barings’ Global Proxy Voting Policy:
Barings understands that the voting of proxies is an integral part of its investment management responsibilities and believes, as a general principle, that proxies should be acted upon (voted or abstained) solely in the best interest of its clients (i.e. in a manner believed by Barings to best pursue a client’s investment objectives). To implement this general principle, Barings engages a proxy service provider (“Service Provider”) that is responsible for processing and maintaining records of proxy votes. In addition, the Service Provider, a recognized authority on proxy voting and corporate governance, provides research and recommendations (including environmental, social and governance topics) on proxies to Barings as its research provider (the “Research Provider”). It is Barings’ Global Proxy Voting Policy to generally vote all Client proxies for which it has proxy voting discretion in accordance with the recommendations of the Research Provider or with the Research Provider’s proxy voting guidelines (“Guidelines”), in absence of a recommendation. In circumstances where the Research Provider has not provided a recommendation or has not contemplated an issue within its Guidelines, the proxy will be analyzed on a case-by-case basis.
Barings recognizes that there are times when it is in the best interest of clients to vote proxies (i) against the Research Provider’s recommendations or (ii) in instances where the Research Provider has not provided a recommendation vote against the Guidelines. Barings can vote, in whole or in part, against the Research Provider’s recommendations or Guidelines, as it deems appropriate. The procedures set forth in the Global Proxy Voting Policy are designed to ensure that votes against the Research Provider’s recommendations or Guidelines are made in the best interests of clients and are not the result of any material conflict of interest (“Material Conflict”). For purposes of the Global Proxy Voting Policy, a Material Conflict is defined as any position, relationship or interest, financial or otherwise, of Barings or a Barings associate that could reasonably be expected to affect the independence or judgment concerning proxy voting.
Summary of Barings’ Proxy Voting Procedures:
Typically, Barings will vote all client proxies for which it has proxy voting discretion, where no Material Conflict exists, in accordance with the Research Provider’s recommendations or Guidelines, unless (i) Barings is unable or determines not to vote a proxy in accordance with the Global Proxy Voting Policy or (ii) an authorized investment person or designee (a “Proxy Analyst”) determines that it is in the client’s best interests to vote against the Research Provider’s recommendations or Guidelines. In such cases where a Proxy Analyst believes a proxy should be voted against the Research Provider’s recommendations or Guidelines, the Proxy Team will vote the proxy in accordance with the Proxy Analyst’s recommendation as long as (i) no other Proxy Analyst disagrees with such recommendation; and (ii) no known Material Conflict is identified by the Proxy Analyst(s) or the Proxy Team. If a Material Conflict is identified by a Proxy Analyst or the proxy administrator, the proxy will be submitted to the Trading Practices Committee to determine how the proxy is to be voted in order to achieve that client’s best interests.
No associate, officer, director or board of managers/directors of Barings or its affiliates (other than those assigned such responsibilities under the Global Proxy Voting Policy) can influence how Barings votes client proxies, unless such person has been requested to provide assistance by a Proxy Analyst or Trading Practices Committee member and has disclosed any known Material Conflict. Pre-vote communications with proxy solicitors are prohibited. In the event that pre-vote communications occur, it should be reported to the Trading Practices Committee or Barings’ Chief Compliance Officer prior to voting. Any questions or concerns regarding proxy-solicitor arrangements should be addressed to Barings’ Chief Compliance Officer.
Investment management agreements generally delegate the authority to vote proxies to Barings in accordance with Barings’ Global Proxy Voting Policy. In the event an investment management agreement is silent on proxy voting, Barings should obtain written instructions from the client as to their voting preference. However, when the client does not provide written instructions as to their voting preferences, Barings will assume proxy voting responsibilities. In the event that a client makes a written request regarding voting, Barings will vote as instructed.
Obtaining a Copy of the Proxy Voting Policy
Clients can obtain a copy of Barings’ Proxy Voting Policy and information about how Barings voted proxies related to their securities, free of charge, by contacting the Chief Compliance Officer, Barings LLC, 300 South Tryon, Charlotte, NC 28202, or calling toll-free, 1-877-766-0014.
ITEM 8. PORTFOLIO MANAGERS OF CLOSED-END MANAGEMENT INVESTMENT COMPANIES.
The following disclosure item is made as of the date of this Form N-CSR unless otherwise indicated.
PORTFOLIO MANAGER. Christina Emery serves as the President of the Registrant (since January 2020) and as one of its Portfolio Managers. Ms. Emery began her service to the Registrant in 2017 as a Vice President. With over 18 years of industry experience, Ms. Emery is a senior member of Barings’ Global Private Finance Group. She is responsible for originating, executing and monitoring North American private finance investments with management responsibilities. Prior to joining Barings in 2005, she held a position in investment banking at Legg Mason and had various operations roles at Abbott Laboratories. Ms. Emery holds a B.S. from the University of Virginia and an M.B.A. from the Darden Graduate School of Business Administration at the University of Virginia. Ms. Emery also serves as President of Barings Participation Investors, another closed-end management investment company advised by Barings.
PORTFOLIO MANAGEMENT TEAM. Ms. Emery has primary responsibility for overseeing the investment of the Registrant’s portfolio, with the day-to-day investment management responsibility of the Registrant’s portfolio being shared with the following Barings’ investment professional (together with the Portfolio Manager, the “Portfolio Team”).
Sean Feeley is responsible for the day-to-day management of the Registrant’s public high yield and investment grade fixed income portfolio. Mr. Feeley has been a Vice President of the Registrant since 2011. He is a portfolio manager for Barings’ U.S. High Yield Investments Group. He is also a member of the firm’s U.S. High Yield Investment Committee and the Global High Yield Allocation Committee. Mr. Feeley is responsible for the portfolio management of various high yield bond total return strategies. Mr. Feeley has worked in the industry since 1996 and his experience has encompassed the credit market across a variety of industries. Prior to joining Barings in 2003, he worked at Cigna Investment Management in project finance and at Credit Suisse, where he worked in the leveraged finance group. Mr. Feeley holds a B.S. in Accounting from Canisius College (magna cum laude) and an M.B.A. from Cornell University. He is a Certified Public Accountant (inactive) and member of the CFA Institute. Mr. Feeley also serves as Vice President of Barings Participation Investors and President of Barings Global Short Duration High Yield Fund, both closed-end management investment companies advised by Barings.
OTHER ACCOUNTS MANAGED BY THE PORTFOLIO TEAM. The members of the Registrant's Portfolio Team also have primary responsibility for the day-to-day management of other Barings advisory accounts, including, among others, closed-end and open-end investment companies, private investment funds, MassMutual-affiliated accounts, as well as separate accounts for institutional clients. These advisory accounts are identified below.
| | | | | | | | | | NUMBER OF | | | |
| | | | | | | | | | ACCOUNTS | | | APPROXIMATE |
| | | | | TOTAL | | | | | WITH | | | ASSET SIZE OF |
| | | | | NUMBER | | | APPROXIMATE | | PERFORMANCE- | | | PERFORMANCE- |
| PORTFOLIO | | ACCOUNT | | OF | | | TOTAL ASSET | | BASED | | | BASED ADVISORY |
| TEAM | | CATEGORY | | ACCOUNTS | | | SIZE1,2 | | ADVISORY FEE | | | FEE ACCOUNTS1, 2 |
| | | | | | | | | | | | | |
| Christina | | Registered | | | 1 | | | $177 | | | 0 | | | $0 |
| Emery | | Investment | | | | | | | | | | | | |
| | | Companies | | | | | | | | | | | | |
| | | | | | | | | | | | | | | |
| | | Other Pooled | | | 6 | | | $243 | | | 0 | | | $0 |
| | | Investment | | | | | | | | | | | | |
| | | Vehicles | | | | | | | | | | | | |
| | | | | | | | | | | | | | | |
| | | Other | | | 12 | | | $1,240 | | | 0 | | | $0 |
| | | Accounts | | | | | | | | | | | | |
| | | | | | | | | | | | | | | |
| | | | | | | | | | | | | | | |
| Sean | | Registered | | | 5 | | | $1,312 | | | 0 | | | $0 |
| Feeley | | Investment | | | | | | | | | | | | |
| | | Companies | | | | | | | | | | | | |
| | | | | | | | | | | | | | | |
| | | Other Pooled | | | 9 | | | $3,932 | | | 0 | | | $0 |
| | | Investment | | | | | | | | | | | | |
| | | Vehicles | | | | | | | | | | | | |
| | | | | | | | | | | | | | | |
| | | Other | | | 26 | | | $4,658 | | | 0 | | | $0 |
| | | Accounts | | | | | | | | | | | | |
| 1 | Account assets have been calculated as of December 31, 2021. |
| 2 | Account size in millions. |
MATERIAL CONFLICTS OF INTEREST. The potential for material conflicts of interest may exist as the members of the Portfolio Management Team have responsibilities for the day-to-day management of multiple advisory accounts. These conflicts may be heightened to the extent the individual, Barings and/or an affiliate has an investment in one or more of such accounts. Barings has identified (and summarized below) areas where material conflicts of interest are most likely to arise, and has adopted policies and procedures that it believes are reasonable to address such conflicts.
Transactions with Affiliates: From time to time, Barings or its affiliates, including MassMutual and its affiliates acts as principal, buys securities or other investments for itself from or sells securities or other investments it owns to its advisory clients. Likewise, Barings can either directly or on behalf of MassMutual, purchase and/or hold securities or other investments that are subsequently sold or transferred to advisory clients. Barings has a conflict of interest in connection with a transaction where it or an affiliate is acting as principal since it has an incentive to favor itself or its affiliates over its advisory clients in connection with the transaction. To address the conflicts of interest, Barings has adopted a Global Principal Transactions, Cross Trades and Other Affiliated Transactions Policy, which ensures any such transaction is consistent with Barings’ fiduciary obligations to act in the best interests of its clients, including its ability to obtain best execution in connection with the transaction, and is in compliance with applicable legal and regulatory requirements.
Cross Trades: For some of its advisory clients, Barings can effect cross-trades whereby one advisory client buys securities or other investments from or sells securities or other investments to another advisory client. Barings can also effect cross-trades involving advisory accounts or funds in which it or its affiliates, including MassMutual, and their respective employees, have an ownership interest or for which Barings is entitled to earn a performance fee. When Barings effects cross-trades there is an inherent conflict of interest since Barings has an incentive to favor the advisory client or fund in which it or its affiliate has an ownership or economic interest and/or is entitled to a performance fee. In order to address this conflict of interest, cross trades involving advisory client accounts are required to comply with Barings Global Principal Transactions, Cross Trades and Other Affiliated Transactions Policy, which ensures any affiliated transaction is consistent with all applicable regulatory requirements governing such transactions and with Barings’ fiduciary obligations to the clients involved in any such transactions.
Loan Origination Transactions: While Barings or its affiliates generally do not act as an underwriter or member of a syndicate in connection with a securities offering, Barings or its affiliates (or an unaffiliated entity in which Barings or its affiliates have an ownership interest) can act as an underwriter, originator, agent, or member of a syndicate in connection with the origination of senior secured loans or other lending arrangements with borrowers, where such loans are purchased by Barings advisory clients during or after the original syndication. Barings advisory clients purchase such loans directly from Barings or its affiliates (or an unaffiliated entity in which Barings or its affiliates have an ownership interest) or from other members of the lending syndicate. In connection with such loan originations, Barings or its affiliates, either directly or indirectly, receive underwriting, origination, or agent fees. As a result, Barings has a conflict of interest in connection with such loan origination transactions since it has an incentive to base its investment recommendation to its advisory clients on the amount of compensation, underwriting, origination or agent fees it would receive rather than on its advisory clients’ best interests. To address the conflict of interest, Barings has adopted a Global Principal Transactions, Cross Trades and Other Affiliated Transactions Policy, which ensures any such transaction is consistent with Barings’ fiduciary obligations to act in the best interests of its clients, including its ability to obtain best execution in connection with the transaction, and is in compliance with applicable legal and regulatory requirements.
Investments by Advisory Clients: Barings has the ability to invest client assets in securities or other investments that are also held by (i) Barings or its affiliates, including MassMutual, (ii) other Barings advisory accounts, (iii) funds or accounts in which Barings or its affiliates or their respective employees have an ownership or economic interest or (iv) employees of Barings or its affiliates. Barings also has the ability, on behalf of its advisory clients, to invest in the same or different securities or instruments of issuers in which (a) Barings or its affiliates, including MassMutual, (b) other Barings advisory accounts, (c) funds or accounts in which Barings, its affiliates, or their respective employees have an ownership or economic interest or (d) employees of Barings or its affiliates, have an ownership interest as a holder of the debt, equity or other instruments of the issuer. Barings has a conflict of interest in connection with any such transaction since investments by its advisory clients can directly or indirectly benefit Barings and/or its affiliates and employees by potentially increasing the value of the securities or instruments it holds in the issuer. Any investment by Barings on behalf of its advisory clients will be consistent with its fiduciary obligations to act in the best interests of its advisory clients, and otherwise be consistent with such clients’ investment objectives and restrictions.
Barings or its affiliates can recommend that clients invest in registered or unregistered investment companies, including private investment funds such as hedge funds, private equity funds or structured funds (i) advised by Barings or an affiliate, (ii) in which Barings, an affiliate or their respective employees has an ownership or economic interest or (iii) with respect to which Barings or an affiliate has an interest in the entity entitled to receive the fees paid by such funds. Barings has a conflict of interest in connection with any such recommendation since it has an incentive to base its recommendation to invest in such investment companies or private funds on the fees that Barings or its affiliates would earn as a result of the investment by its advisory clients in the investment companies or private funds. Any recommendation to invest in a Barings advised fund or other investment company will be consistent with Barings’ fiduciary obligations to act in the best interests of its advisory clients, consistent with such clients’ investment objectives and restrictions. In certain limited circumstances, Barings offers to clients that invest in private investment funds that it advises an equity interest in entities that receive advisory fees and carried profits interest from such funds.
Employee Co-Investment: Barings permits certain of its portfolio managers and other eligible employees to invest in certain private investment funds advised by Barings or its affiliates and/or share in the performance fees received by Barings from such funds. If the portfolio manager or other eligible employee was responsible for both the portfolio management of the private fund and other Barings advisory accounts, such person would have a conflict of interest in connection with investment decisions since the person has an incentive to direct the best investment ideas, or to allocate trades, in favor of the fund in which he or she is invested or otherwise entitled to share in the performance fees received from such fund. To address the conflicts of interest, Barings has adopted a Side by Side Management of Private Investment Funds and Other Advisory Accounts Policy which requires, among others things, that Barings treat each of its advisory clients in a manner consistent with its fiduciary obligations and prohibits Barings from favoring any particular advisory account as a result of the ownership or economic interests of Barings, its affiliates or employees, in such advisory account. Any investment by a Barings employee in one of its private funds is also governed by Barings’ Global Employee Co-Investment Policy, which ensures that any co-investment by a Barings employee is consistent with Barings’ Global Code of Ethics Policy, as summarized above.
Management of Multiple Accounts: As noted above, Barings’ portfolio managers are often responsible for the day-to-day management of multiple accounts, including, among others, separate accounts for institutional clients, closed-end and open-end registered investment companies, and/or private investment funds (such as hedge funds, private equity funds and structured funds), as well as for proprietary accounts of Barings and its affiliates, including MassMutual and its affiliates. The potential for material conflicts of interest exist whenever a portfolio manager has responsibility for the day-to-day management of multiple advisory accounts. These conflicts are heightened to the extent a portfolio manager is responsible for managing a proprietary account for Barings or its affiliates or where the portfolio manager, Barings and/or an affiliate has an investment in one or more of such accounts or an interest in the performance of one or more of such accounts (e.g., through the receipt of a performance fee).
Investment Allocation: Such potential conflicts include those relating to allocation of investment opportunities. For example, it is possible that an investment opportunity is suitable for more than one account managed by Barings, but is not available in sufficient quantities for all accounts to participate fully. Similarly, there can be limited opportunity to sell an investment held by multiple accounts. A conflict arises where the portfolio manager has an incentive to treat an account preferentially because the account pays Barings or its affiliates a performance-based fee or the portfolio manager, Barings or an affiliate has an ownership or other economic interest in the account. As noted above, Barings also acts as an investment manager for certain of its affiliates, including MassMutual. These affiliate accounts sometimes co-invest jointly and concurrently with Barings’ other advisory clients and therefore share in the allocation of such investment opportunities. To address the conflicts of interest associated with the allocation of trading and investment opportunities, Barings has adopted a Global Investment Allocation Policy and trade allocation procedures that govern the allocation of portfolio transactions and investment opportunities across multiple advisory accounts, including affiliated accounts, which are summarized below under Item 12 – Brokerage Practices, Global Investment Allocation Policy. In addition, as noted above, to address the conflicts, Barings has adopted a Side by Side Management of Private Investment Funds and Other Advisory Accounts Policy which requires, among others things, that Barings treat each of its advisory clients in a manner consistent with its fiduciary obligations and prohibits Barings from favoring any particular advisory account as a result/ of the ownership or economic interests of Barings, its affiliates or employees, in such advisory accounts. Any investment by a Barings employee in one of its private funds is also governed by Barings’ Global Employee Co-Investment Policy, which ensures that any co-investment by a Barings employee is consistent with Barings’ Global Code of Ethics Policy, as summarized above.
Personal Securities Transactions; Short Sales: Potential material conflicts of interest also arise related to the knowledge and timing of an account’s trades, investment opportunities and broker or dealer selection. Barings and its portfolio managers have information about the size, timing and possible market impact of the trades of each account they manage. It is possible that portfolio managers could use this information for their personal advantage and/or to the advantage or disadvantage of various accounts which they manage. For example, a portfolio manager could cause a favored account to “front run” an account’s trade or sell short a security for an account immediately prior to another account’s sale of that security. To address these conflicts, Barings has adopted policies and procedures, including a Global Short Sale Policy, which ensures that the use of short sales by Barings is consistent with Barings’ fiduciary obligations to its clients, a Side by Side Management of Private Investment Funds and Other Advisory Accounts Policy, which requires, among other things, that Barings treat each of its advisory clients in a manner consistent with its fiduciary obligations and prohibits Barings from favoring any particular account as a result of the ownership or economic interest of Barings, its affiliates or employees and a Global Code of Ethics Policy, as summarized above.
Trade Errors: Potential material conflicts of interest also arise if a trade error occurs in a client account. A trade error is deemed to occur if there is a deviation by Barings from the applicable standard of care in connection with the placement, execution or settlement of a trade for an advisory account that results in (1) Barings purchasing assets not permitted or authorized by a client’s investment advisory agreement or otherwise failing to follow a client’s specific investment directives; (2) Barings purchasing or selling the wrong security or the wrong amount of securities on behalf of a client’s account; or (3) Barings purchasing or selling assets for, or allocating assets to, the wrong client account. When correcting these errors, conflicts of interest between Barings and its advisory accounts arise as decisions are made on whether to cancel, reverse or reallocate the erroneous trades. In order to address the conflicts, Barings has adopted a Global Client Account Errors Policy governing the resolution of trading errors, and will follow the Global Client Account Errors Policy in order to ensure that trade errors are handled promptly and appropriately and that any action taken to remedy an error places the interest of a client ahead of Barings’ interest.
Best Execution; Directed or Restricted Brokerage: With respect to securities and other transactions (including, but not limited to, derivatives transactions) for most of the accounts it manages, Barings determines which broker, dealer or other counterparty to use to execute each order, consistent with its fiduciary duty to seek best execution of the transaction. Barings manages certain accounts, however, for clients who limit its discretion with respect to the selection of counterparties or direct it to execute such client’s transactions through a particular counterparty. In these cases, trades for such an account in a particular security or other transaction can be placed separately from, rather than aggregated with, those in the same security or transaction for other accounts. Placing separate transaction orders for a security or transaction can temporarily affect the market price of the security or transaction or otherwise affect the execution of the transaction to the possible detriment of one or more of the other account(s) involved. Barings has adopted a Global Best Execution Policy and a Global Directed or Restricted Brokerage Policy which are summarized below under Item 12 –Brokerage Practices, Counterparty Selection/Recommendations and Directed/Restricted Brokerage.
As discussed above, Barings employees have the ability to trade in securities that are purchased, held and sold by or on behalf of Barings’ advisory clients, subject to a number of limitations. See above for a discussion of restrictions on employee personal securities transactions contained in Barings’ Global Code of Ethics.
Barings and its portfolio managers or employees have other actual or potential conflicts of interest in managing an advisory account, and the list above is not a complete description of every conflict of interest that could be deemed to exist.
COMPENSATION. Compensation packages at Barings are structured such that key professionals have a vested interest in the continuing success of the firm. Portfolio managers’ compensation is comprised of base salary and a discretionarily allocated incentive bonus, which includes a performance-driven annual bonus, and may include a deferred long-term incentive bonus and also may contain a performance fee award. As part of the firm’s continuing effort to monitor retention, Barings participates in annual compensation surveys of investment management firms to ensure that Barings’ compensation is competitive with industry norms.
Base Salary
The base salary component is generally positioned at mid-market. Increases are tied to market, individual performance evaluations and budget constraints.
Annual Bonus - Short Term Incentive (STI)
The annual bonus pool applies to all associates in the firm. Factors impacting the potential bonuses include but are not limited to: (i) investment performance of funds/accounts managed by a portfolio manager, (ii) financial performance of Barings, (iii) client satisfaction and (iv) teamwork. STI is typically paid in February/March following the performance year for which the award is based.
Long-Term Incentives (LTI)
Barings’ long-term incentives are designed to share the long-term success of the firm and take the form of deferred cash awards, which may include an award that resembles phantom restricted stock; linking the value of the award to a formula including Barings’ overall earnings. A voluntary separation of service will generally result in a forfeiture of unvested LTI awards.
BENEFICIAL OWNERSHIP: As of December 31, 2021, members of the Portfolio Management Team, beneficially owned the following dollar range of equity securities in the Registrant:
| Portfolio Management Team: | | Dollar Range of Beneficially Owned* Equity Securities of the Registrant: |
| | | |
| Christina Emery | | $10,001-50,000 |
| Sean Feeley | | $0 |
* Beneficial ownership has been determined in accordance with Rule 16(a)-1(a)(2) under the Securities Exchange Act of 1934, as amended. (Shares "beneficially owned" include the number of shares of the Registrant represented by the value of a Registrant-related investment option under Barings' non-qualified deferred compensation plan for certain officers of Barings (the "Plan"). The Plan has an investment option that derives its value from the market value of the Registrant's shares. However, neither the Plan nor the participant in the Plan has an actual ownership interest in the Registrant's shares.)
ITEM 9. PURCHASES OF EQUITY SECURITIES BY CLOSED-END MANAGEMENT INVESTMENT COMPANY AND AFFILIATED PURCHASERS.
Not applicable for this filing.
ITEM 10. SUBMISSION OF MATTERS TO A VOTE OF SECURITY HOLDERS.
Not applicable for this filing.
ITEM 11. CONTROLS AND PROCEDURES.
| | (a) | Assessment of the Registrant’s Control Environment |
The Registrant’s disclosure controls and procedures are designed to ensure that information required to be disclosed in the reports that the Registrant files or submits under the Securities Exchange Act of 1934, as amended (the “Exchange Act”), and the Investment Company Act of 1940, as amended, is recorded, processed, summarized and reported within the time periods specified in the rules and forms of the Securities and Exchange Commission. Disclosure controls and procedures include, without limitation, controls and procedures designed to ensure that such information is accumulated and communicated to the Registrant’s management (“Management”), including its principal executive officer and principal financial officer, as appropriate, to allow timely decisions regarding required disclosure. Management, including the principal executive officer and principal financial officer, recognizes that any set of controls and procedures, no matter how well designed and operated, can provide only reasonable assurance of achieving the desired control objectives.
Within 90 days prior to the filing date of the Shareholder Report on Form N-CSR, Management carried out an evaluation of the effectiveness of the design and operation of the Registrant’s disclosure controls and procedures. Based on such evaluation, the principal executive officer and principal financial officer concluded that certain of the Registrant’s disclosure controls and procedures were not effective due to a material weakness. Specifically, a material weakness existed in the design and operation of controls to address the accuracy of particular inputs used in the determination of the fair value of certain private equity investments in accordance with U.S. GAAP; controls were not designed or maintained to review the accuracy of the selected EBITDA input for certain private equity investments within the portfolio in which the equity issuer is a subcomponent of the reporting entity (consolidated parent). A material weakness (as defined in Rule 12b-2 under the Exchange Act) is a deficiency, or a combination of deficiencies, in internal control over financial reporting such that there is a reasonable possibility that a material misstatement of the Registrant’s annual or interim financial statements will not be prevented or detected on a timely basis. This material weakness did not result in a misstatement of previously issued financial statements. This material weakness resulted in audit adjustments, which adjustments are reflected in the financial statements included herein, to decrease investments in unaffiliated securities at value and net change in unrealized appreciation (depreciation) on investments in unaffiliated securities for the year ended December 31, 2021.
Management’s Remediation Plan
Management has implemented enhancements to the Registrant’s disclosure controls and procedures to remediate the material weakness described above. Management has enhanced its review control by designing additional controls for equity investments managed by the private finance team, to include separate reviews of equity valuations and financial inputs as well as additional internal sign offs throughout the process.
The material weakness will not be considered fully remediated until the applicable controls operate for a sufficient period of time and Management has concluded, through testing, that these enhanced controls are designed and operating effectively.
| (b) | Changes in Internal Controls |
There were no significant changes in the registrant’s internal control over financial reporting (as defined in Rule 30a-3(d) under the Investment Company Act of 1940, as amended) that occurred during the period covered by this report that has materially affected, or is reasonably likely to materially affect, the registrant’s internal control over financial reporting.
ITEM 12. DISCLOSURE OF SECURITIES LENDING ACTIVITIES FOR CLOSED-END MANAGEMENT INVESTMENT COMPANIES.
ITEM 13. EXHIBITS.
| | (a)(1) | ANY CODE OF ETHICS, OR AMENDMENTS THERETO, THAT IS THE SUBJECT OF DISCLOSURE REQUIRED BY ITEM 2, TO THE EXTENT THAT THE REGISTRANT INTENDS TO SATISFY THE ITEM 2 REQUIREMENTS THROUGH THE FILING OF AN EXHIBIT. |
Not applicable for this filing.
| | (a)(2) | A SEPARATE CERTIFICATION FOR EACH PRINCIPAL EXECUTIVE OFFICER AND PRINCIPAL FINANCIAL OFFICER OF THE REGISTRANT AS REQUIRED BY RULE 30a-2 UNDER THE ACT. |
Attached hereto as EX-99.31.1
Attached hereto as EX-99.31.2
| | (a)(3) | ANY WRITTEN SOLICITATION TO PURCHASE SECURITIES UNDER RULE 23c-1 UNDER THE ACT (17 CFR 270.23c-1) SENT OR GIVEN DURING THE PERIOD COVERED BY THE REPORT BY OR ON BEHALF OF THE REGISTRANT TO 10 OR MORE PERSONS. |
Not applicable for this filing.
| | (b) | CERTIFICATIONS PURSUANT TO RULE 30a-2(b) UNDER THE ACT. |
Attached hereto as EX-99.32
SIGNATURES
Pursuant to the requirements of the Securities Exchange Act of 1934 and the Investment Company Act of 1940, the Registrant has duly caused this report to be signed on its behalf by the undersigned, thereunto duly authorized.
| (Registrant): | Barings Corporate Investors | |
| | | |
| | | |
| By: | /s/ Christina Emery | |
| | Christina Emery, President | |
| | | |
| Date: | March 10, 2022 | |
| | | |
Pursuant to the requirements of the Securities Exchange Act of 1934 and the Investment Company Act of 1940, this report has been signed below by the following persons on behalf of the Registrant and in the capacities and on the dates indicated.
| By: | /s/ Christina Emery | |
| | Christina Emery, President |
| | | |
| Date: | March 10, 2022 | |
| | | |
| | | |
| By: | /s/ Jonathan Bock | |
| | Jonathan Bock Chief Financial Officer | |
| | | |
| Date: | March 10, 2022 | |